the implications for health, depression, and life satisfaction from a permanent increase in income...
TRANSCRIPT

This article was downloaded by: [Queen Margaret University]On: 02 February 2015, At: 03:05Publisher: RoutledgeInforma Ltd Registered in England and Wales Registered Number: 1072954Registered office: Mortimer House, 37-41 Mortimer Street, London W1T 3JH,UK
Click for updates
Review of Social EconomyPublication details, including instructions for authorsand subscription information:http://www.tandfonline.com/loi/rrse20
The Implications for Health,Depression, and Life Satisfactionfrom a Permanent Increase inIncome for the DisadvantagedElderly: Evidence from TaiwanFu-Min Tsenga & Dennis James Petrieb
a Institution for International Health and Development,Queen Margaret University, Edinburgh EH21 6UU, UKb Centre for Health Policy, Programs and Economics,University of Melbourne, Melbourne 3010, AustraliaPublished online: 19 Jun 2014.
To cite this article: Fu-Min Tseng & Dennis James Petrie (2014) The Implications forHealth, Depression, and Life Satisfaction from a Permanent Increase in Income for theDisadvantaged Elderly: Evidence from Taiwan, Review of Social Economy, 72:3, 311-336,DOI: 10.1080/00346764.2014.927725
To link to this article: http://dx.doi.org/10.1080/00346764.2014.927725
PLEASE SCROLL DOWN FOR ARTICLE
Taylor & Francis makes every effort to ensure the accuracy of all theinformation (the “Content”) contained in the publications on our platform.However, Taylor & Francis, our agents, and our licensors make norepresentations or warranties whatsoever as to the accuracy, completeness, orsuitability for any purpose of the Content. Any opinions and views expressedin this publication are the opinions and views of the authors, and are not theviews of or endorsed by Taylor & Francis. The accuracy of the Content shouldnot be relied upon and should be independently verified with primary sourcesof information. Taylor and Francis shall not be liable for any losses, actions,claims, proceedings, demands, costs, expenses, damages, and other liabilities

whatsoever or howsoever caused arising directly or indirectly in connectionwith, in relation to or arising out of the use of the Content.
This article may be used for research, teaching, and private study purposes.Any substantial or systematic reproduction, redistribution, reselling, loan, sub-licensing, systematic supply, or distribution in any form to anyone is expresslyforbidden. Terms & Conditions of access and use can be found at http://www.tandfonline.com/page/terms-and-conditions
Dow
nloa
ded
by [
Que
en M
arga
ret U
nive
rsity
] at
03:
05 0
2 Fe
brua
ry 2
015
The Implications for Health, Depression, andLife Satisfaction from a Permanent Increase in
Income for the Disadvantaged Elderly:Evidence from Taiwan
Fu-Min Tseng1 and Dennis James Petrie21Institution for International Health and Development, QueenMargaret University, Edinburgh EH21 6UU, UK; 2Centre for
Health Policy, Programs and Economics, University of Melbourne,Melbourne, 3010 Australia
Abstract This paper uses an exogenous increase in income for a specific subgroup
to explore the extent to which higher income leads to higher levels of health and
well-being. In 1995, the Taiwanese government implemented the Senior Farmer
Welfare Benefit Interim Regulation (SFWBIR) that was a pure cash injection to
senior farmers. A difference-in-differences (DiD) approach is used on survey data
from the Taiwanese Health and Living Status of Elderly in 1989 and 1996 to evaluate
the short-term effect of the SFWBIR on self-assessed health, depression, and life
satisfaction (LS). Senior manufacturing workers are employed as a comparison
group for senior farmers in the natural experiment. This paper provides evidence that
the increase in income caused by this pension reform significantly improved the
mental health of senior farmers by reducing 1.697 points of the depression scale in
DiD and 2.178 points in the robust estimation; however, it had no significant short-
term impact on self-assessed health or LS.
Keywords: social welfare benefit, natural experiment, mental health, difference-in-
differences, life satisfaction
1. INTRODUCTION
This paper seeks to identify the effect of a permanent increase in income on health
and life satisfaction (LS) for older disadvantaged individuals. Income can be
crucial for health, whether viewed in physical or psychological terms. From the
q 2014 The Association for Social Economics
Review of Social Economy, 2014
Vol. 72, No. 3, 311–336, http://dx.doi.org/10.1080/00346764.2014.927725
Dow
nloa
ded
by [
Que
en M
arga
ret U
nive
rsity
] at
03:
05 0
2 Fe
brua
ry 2
015

physical perspective, a higher income increases investments in health-enhancing
goods, such as nutritious food and better quality medical treatments and from a
psychological perspective higher income reduces the stress associated with a
relatively low income leading to disease (Cohen et al. 1991, 1997; Gerdtham and
Johannesson, 2004). However, income increases for some in society may also
have negative impacts on those others who do not benefit through a sense of
relative deprivation (Wilkinson 1996).
This study investigates to what extent a permanent cash injection to senior
farmers in Taiwan through the Senior Farmer Welfare Benefit Interim Regulation
(SFWBIR) improved their health status and LS. In June 1995, the Taiwanese
government implemented SFWBIR as a compensation for the absence of a
retirement pension in the Farmer Health Insurance (FHI). Before 1995, the FHI
was the only occupational insurance that did not contain a retirement pension.
Senior farmers were unable to receive any pension to secure their later life
income, whereas other workers claimed their retirement pension from their
particular occupational insurance scheme. In 1996, with SFWBIR, those senior
citizens who were 65 years old or older and had been members of FHI for at least 6
months were eligible to claim the benefit until death (NT$ 3,000 which
approximated to US$ 110 or £70 per month). Though SFWBIR is a social welfare
benefit, it can also be regarded as a type of retirement pension for senior farmers.
The attention on senior farmers raises the issue of how the pension system
works for disadvantaged groups in an aging society. In general, Taiwanese
farmers are a relatively disadvantaged group in terms of socio-economic status
with lower income and education. This senior population is also more vulnerable
compared to younger populations in terms of their health status. In 2003, health
expenditure on senior population accounted approximately 28.73% of annual
health expenditure although the senior population only accounted 9.56% of whole
population.1 However, pension systems are also expensive and therefore it is
important to quantify their benefits. This study provides an insight into the effect
of a pension for senior farmers group, who accounted for one-third of senior
citizens in Taiwan. The SWBIR policy is expected to have a positive effect on the
well-being of this group by either preventing financial stress or reducing their
sense of relative deprivation.
A difference-in-differences (DiD) approach is used to estimate the casual
impact of income on health outcomes. Senior agricultural labourers (farmers) are
compared with senior skilled (excluding high skilled), semi-skilled and unskilled
labourers who mostly comprise of manufacturing workers. The manufacturing
workers are considered the closest possible control group for the farmers
1 Annual Health Statistic Report 2003. National Health Insurance Administration, Ministry of Health and Welfare.
REVIEW OF SOCIAL ECONOMY
312
Dow
nloa
ded
by [
Que
en M
arga
ret U
nive
rsity
] at
03:
05 0
2 Fe
brua
ry 2
015
according to the Taiwanese socio-economic class categories (Hsiao 2008; Wu
1997). These two groups have low income with the majority of their consumption
being on necessary goods. In the DiD estimations, the health status and happiness
of the senior groups (65- to75-year-olds) from these two occupational groups are
compared before and after the policy implementation. In addition, difference-in-
differences-in-difference (DiDiD) estimations are used to explore the robustness
of the results. In particular, two more comparison groups, non-senior farmers (60–
64 years old) and non-senior manufacturing workers (60–64 years old), are
considered to explore whether there were different trends in health and happiness
across workers from these different sectors.
This study is organized as follows. Section 2 provides a brief review of the
literature of the impact of income on health and LS. Section 3 introduces the social
insurance schemes and welfare benefits in Taiwan and how these changed in the
1990s. Section 4 explains the data used from the Survey of Health and Living
Status of the Elderly in 1989 and 1996. Section 5 explains the empirical strategies
employed to estimate the impact of SFWBIR on health and happiness outcomes.
Section 6 presents the empirical results and Section 7 discusses the conclusions.
2. LITERATURE REVIEW
The existing literature has inconsistent conclusions in terms of how income
influences health. Wilkinson (1996) claims that “income per se does not affect
health” but it affects health through several pathways, for instance, income
comparison, the sense of relative deprivation and income inequality (Deaton and
Lubotsky 2003; Jones andWildman 2008; Subramanian and Kawachi 2004) while
others (Ettner 1996; Gardner and Oswald 2007; Leon-Gonzalez and Tseng 2011;
Pritchett and Summers 1997) argue that the direct impact of income on health, in
terms of what income can buy, is the major mechanism through which income
impacts on health. The latter arguments maintain that money has a positive effect
on population well-being, whereas the former arguments claim the effect on well-
being at the population level can be mixed because while the effect of income may
be positive for those who gain income, it may have a negative impact on those
who do not gain because it increases their sense of relative deprivation.
Several theories have attempted to explain how income affects subject well-
being (Clark and Oswald 1996; Dixon 1997; Easterlin 2001; Frank 1997; Ng
1997; Oswald 1997). Easterlin (2001) finds a paradoxical relationship between
subject well-being and income over the life cycle, which may be explained by
changing material aspirations. Ferrer-i-Carbonell (2005) and Clark and Senik
(2010) claim that the income of an individual’s comparison reference group is one
determinant of subjective well-being and find that comparisons are mostly
THE IMPLICATIONS FOR HEALTH, DEPRESSION, AND LIFE SATISFACTION
313
Dow
nloa
ded
by [
Que
en M
arga
ret U
nive
rsity
] at
03:
05 0
2 Fe
brua
ry 2
015
upwards and comparison intensity decreases with income with low income
individuals attaching more weight to income comparison. Knight et al. (2009)
found that two-thirds of survey respondents of Chinese households reported that
they mainly compare themselves with individuals in their own village.
Many studies have investigated the empirical relationship between health and
income based on the assumption of a single causal direction, from income to
health (Blakely et al. 2001; Deaton and Lubotsky 2003; Gravelle et al. 2002).
However, while a strong social gradient in health may exist, from this alone one
cannot disentangle the extent to which lower income causes poor health or poor
health causes lower income. To investigate the causal relationships between
income (or wealth) and health, both cross-sectional (Case 2004; Ettner 1996;
Thomas and Strauss 1997;) and longitudinal data (Adams et al. 2003; Adda et al.
2003; Contoyannis et al. 2004; Frijters et al. 2004; Frijters et al. 2005; Gardner
and Oswald 2007; Lindahl 2005; Meer et al. 2003;) have been used.
Using cross-sectional data, Ettner (1996) investigates the effect of income on
self-assessed health and chronic health limitations using a two-stage least squares
(2SLS) method in which the respondent’s wage rate and non-earnings income
instrument for family income, as these are less likely to be impacted by health
shocks. Thomas and Strauss (1997) and Chin (2010) also employ 2SLS using
commodity price indices and non-labour income as instruments in urban Brazil
and rural Malawi, respectively.
With longitudinal data, some have used the sequencing of changes in income
and health to identify the causal impact. For example, Adams et al. (2003) use
innovations in health conditions and wealth to implement tests for the direct
causal links from socio-economic status to health and from health conditions to
wealth in the elderly American population. Adda et al. (2003) replicate this
approach for the UK and Sweden while Contoyannis et al. (2004) employ a
dynamic panel ordered probit approach to investigate the determinants of self-
assessed health, in particular the effect of income and educational attainment.
Other longitudinal studies use instruments for income and wealth that are less
likely to be associated with health, such as Meer et al. (2003) who use inheritance,
Lindahl (2005) and Gardner and Oswald (2007) who use lottery wins and Frijters
et al. (2004) who use a change in the political regime. Most of these empirical
studies rely on exogenous income shocks to identify the impact of income on
health, but the impact of a permanent increase in income may have a very different
impact on health and LS than an income shock of a similar size.
The above studies investigate the effects of a variety of factors such as income,
wealth, income inequality, and socio-economic status on alternative measures of
outcomes, for example, mortality, nutritional status, self-reported health status,
psychological health, and LS. Some studies find the income increases improve
REVIEW OF SOCIAL ECONOMY
314
Dow
nloa
ded
by [
Que
en M
arga
ret U
nive
rsity
] at
03:
05 0
2 Fe
brua
ry 2
015

physical health, mental health, mortality, and LS (Case 2004; Ettner 1996; Frijters
et al. 2004; Gardner and Oswald 2007; Lindahl 2005; Leon-Gonzalez and Tseng
2011). Case (2004) also finds that the increasing income in the form of an old age
pension improves the health status of the beneficiaries and their householdmembers
as long as the household pools income. Some studies find evidence that income
inequality or relative deprivation harms population health (Deaton and Lubotsky
2003; Jones and Wildman 2008; Subramanian and Kawachi 2004). These findings
imply that people not only care about the amount of income they have but also care
about their position in the income distribution in a society. However, some studies
find limited evidence of the relationship between income inequality and health
(Adams et al. 2003; Gravelle et al. 2002; Meer et al. 2003). Meer et al. (2003) find
that the connection between wealth and health is not observed in the short run when
considering inheritances. Adams et al. (2003) do not find a causal link from socio-
economic status to some health outcomes (mortality plus acute and sudden-onset of
diseases), whereas this link is found for the incidence of mental problems. For
chronic and degenerative diseases, the evidence is mixed.
In this study, we explore the impact of an increase in permanent income, caused
by a pension reform on the health and LS of a lower socio-economic group, senior
farmers. Peoplewith lower socio-economic status are likely to benefit themost from
pension systems. Pensions provide a type of insurance policy that protects
individuals against loss of future income potential from ill-health and from living
longer than expected (Sinn 2004). Jensen and Richter (2003) find that among the
elderly with a great dependency on the pension system, the loss of the pension
causes reduced intake of calories and protein, reduced use of health services and
medications, with those affected pensioners being 5% more likely to die in
following two years. Apart from physical health, pensions may also influence
mental health through the pathway of improving one’s ability to cope with stressful
life events and relieving financial strain (Adler et al. 1994; Angel et al. 2003). Kahn
and Pearlin (2006) find that long-term financial hardship is reflected in a range of
health outcomes at late life, and Duflo (2003) and Case (2004) show that not only
pensioners but also their household members benefit from the pensions.
3. SOCIAL INSURANCE SCHEMES AND BENEFITS IN TAIWAN
Social insurance schemes are a crucial component of the social security system
in Taiwan. Such schemes can secure the economic well-being of senior citizens and
lighten the burden on the younger generation in the family (Gratton 1996). Before
1990, the occupational social schemes implemented in Taiwan included the Labour
Insurance (LI), the Government Employee Insurance, the Private School Employee
Insurance, the FHI and the Military Insurance (MI). These occupational social
THE IMPLICATIONS FOR HEALTH, DEPRESSION, AND LIFE SATISFACTION
315
Dow
nloa
ded
by [
Que
en M
arga
ret U
nive
rsity
] at
03:
05 0
2 Fe
brua
ry 2
015

schemeswere compulsory and specific to particular occupations and, apart from the
FHI and MI, they comprised three main components—pension, coverage of health
expenses and payment for vital events such as births, disability and funerals. FHI
managed the coverage of health expenses and payment for vital events but did not
include a pension, and MI included the payment of a pension and payment for vital
events but did not cover health expenses.
In March 1995, the National Health Insurance (NHI) was implemented. NHI is
a pure health insurance scheme which merged the coverage of health expenses
from the above social insurances and expanded the coverage of health insurance to
low income families, government employee’s families, private school employee’s
families, and retired government employees and their families. A few studies have
investigated the impact of the increased coverage due to the NHI on precautionary
savings and health outcomes (Chen et al. 2007; Chou et al. 2003; Keng and Sheu
2012). These studies demonstrate that for those who were insured as a result of
NHI reforms compared to those who were already covered by other social
insurance schemes pre-NHI, it reduced their savings, increased their utilization of
health services and decreased their mortality.
In the same year, the government implemented SFWBIR to care for senior
farmers because they were a relatively disadvantaged group in Taiwan. The
amount in 1996 was NT$3,000 approximate US$110 or £70 per month. The
reported minimum required living expense per month in Taiwan province, Taipei
city, and Kaohsiung city at the time was considered to be NT$5,400, NT$6,640,
and NT$5,400, respectively.2 Thus, the SFWBIR benefit approximated to half of
the minimum required living expenses.
Though NHI and SFWBIR were implemented in the same year, the impact of
NHI is likely to be negligible in our analyses. This is because for farmers and
manufacturing workers, the NHI implementation simply integrated the authorities
managing their health expense payments rather than changing their insurance or
access. Studies evaluating the impact of NHI grouped farmers and manufacturing
workers together because both were covered by social insurances pre-NHI (Chen
et al. 2007; Chou et al. 2003; Keng and Sheu 2012).
4. SURVEY OF HEALTH AND LIVING STATUS OF THE ELDERLY
The analysis uses data from the Survey of Health and Living Status of the Elderly
(SHLSE). This longitudinal survey measures the changes in health and living
status of the elderly in Taiwan and includes six waves conducted in 1989, 1993,
2 Source: Directorate-General of Budget, Accounting and Statistics, Executive Yuan National Statistics, Taiwan
(1996).
REVIEW OF SOCIAL ECONOMY
316
Dow
nloa
ded
by [
Que
en M
arga
ret U
nive
rsity
] at
03:
05 0
2 Fe
brua
ry 2
015
1996, 1999, 2003 and 2007. The first wave, cohort I, comprises 4,049 respondents
(one respondent per household) who were aged 60 years and older. Given the age
group, there are high attrition levels, thus a new cohort of 50- to 66-year-olds was
added both in 1996, cohort II, and 2003, cohort III.3 Therefore, some individuals
have multiple data points over different years while others only have one.
SHLSE comprises questions on demographics, health, occupation, residence,
and economic/financial well-being. It contains the current and historical
information with respect to marital status, employment and retirement, and
living arrangement/residence. Health information includes self-assessed general
health status and a measure of depression, Centre for Epidemiologic Studies
Depression Scale (CES-D). The CES-D measures how often in the past week a
respondent experienced symptoms associated with depression, such as restless
sleep, poor appetite and feeling lonely, which is on cognitive and affective
components of depression rather than the physical manifestations of depression
(Hann et al. 1999; Radloff 1977). Anxiety and stress may be perceived as part of
the symptoms of depression. The questions for LS are also included in the survey
but were absent in 1993. A section devoted to the financial well-being of the
respondents comprises of the sources of income, asset structure, and management
of finances. However, accurate income information is scant. Income is a
categorical variable and available in all waves but the categories in the first two
waves are inconsistent with the following four waves.4
Information on the actual SFWBIR benefit claimed is unavailable, so we
presume that all eligible individuals claimed the SFWBIR benefit. The criterion
for claiming the SFWBIR benefit in 1996 is senior citizens who have participated
for at least 6 months in the FHI and do not claim any pension from other social
schemes or the government. Non-farmer retired citizens can participate in FHI as
long as they meet the criteria of FHI whether they could claim a pension from their
previous job social schemes or not.5 However, if they claim the SFWBIR benefit,
they need to give up their other pension, which is unlikely to happen because the
pension from other schemes was greater than the SFWBIR benefit. Even if the
existent of SFWBIR, in the short run this would only impact younger farmers in
terms of changing occupation from farmers to manufacturing workers because
3 The sample size of the new cohort in 1996 was 2,462 and the sample size of the new cohort in 2003 was 1,599.
4 In the first wave, the income is respondent’s monthly income and the categories are NT$0–3,000, NT$3,000–
4,999, NT$5,000–9,999, NT$10,000–14,999, NT$15,000–19,999, NT$20,000–49,999, and more than NT
$49,999. However, in the third wave, the income is respondent and spouses’ annual income and the categories
are NT$0–100,000, NT$100,000–299,999, NT$300,000–599,999, NT$600,000–999,999, NT$1,000,000–
1,999,999, NT$2,000,000–4,999,999, and more than NT$4,999,999.
5 We use “retired” citizens instead of “senior” citizens here because the people covered by Labour Insurance (LI)
can retire and claim a retired pension before 65 years old as long as they match one of three conditions. Those
conditions are described in the same paragraph. The age of 65 years is the forced retirement age.
THE IMPLICATIONS FOR HEALTH, DEPRESSION, AND LIFE SATISFACTION
317
Dow
nloa
ded
by [
Que
en M
arga
ret U
nive
rsity
] at
03:
05 0
2 Fe
brua
ry 2
015

older farmers close to retirement would have had little to gain from swapping to
become manufacturing workers prior to the pension. This is because
manufacturing workers are forced to retire at 65 years old.
5. METHODS
In a natural experiment, a treatment or shock occurs to some individuals but not to
others. In this study, the implementation of SFWBIR is considered a treatment to
senior farmers, and manufacturing workers are selected as a comparison group
because they have the most comparable socio-economic backgrounds. Using
SFWBIR as an instrument for income changes is advantageous because it is easy
to use the SFWBIR criteria to partition the sample into the treatment or control
group and the SFWBIR covered approximately one-fifth of senior citizens in 1995
and 1996.6
The sample inclusion criteria are farmers or manufacturing workers aged
between 60 and 75 years old. The number from cohort I in 1989 is 1,095, however,
only 208 remained in 1996 due to being either out of the age range (60–75), lost to
attrition or dead and the youngest individuals were 67 years old. Thus, cohort II
was added to replenish the sample in 1996. The sample size of cohort II in 1996
fitting our selection criteria is 725 (of these, 63 are between 65 and 67 years old
and 662 are between 60 and 65 years old). Finally, the sample sizes in 1989 and
1996 are 1,095 and 933, respectively. Although the survey is longitudinal, we
implement the estimations as repeated cross-sections due to the attrition of cohort
I in 1996.7 DiD implemented with repeated cross-sectional data compares the
average outcomes of treatment and control groups where each group may have
different samples at different time points. This assumes that the same group, even
with different samples, should have the same average outcomes at difference time
points after excluding changes in macro-effects over time and the treatment effect.
Repeated cross-sectional data have been widely used in DiD design (Chou et al.
2003; Stewart 2004).
The farmers and manufacturing workers are each partitioned into subgroups by
age (under 65s are defined as non-senior and 65s and older are defined as senior).
The senior farmer subgroup is the treatment group and the other three groups,
senior manufacturing workers, non-senior farmers and non-senior manufacturing
workers, are considered as possible control groups.
6 Source: Department of Statistics, Ministry of Interior.
7 We also only use cohort I samples in 1989 and 1996 to estimate the policy impact and the results are similar to the
results shown in Table 2.
REVIEW OF SOCIAL ECONOMY
318
Dow
nloa
ded
by [
Que
en M
arga
ret U
nive
rsity
] at
03:
05 0
2 Fe
brua
ry 2
015
Given that the SFWBIR policy occurred in 1995, the data in 1989 and 1993
represent pre-policy data and the data in 1996 represent post-policy data.
However, the data in 1993 are excluded for two reasons: (1) some questions on LS
were not asked in 1993 and (2) the sample under 65 years old in 1993 was too
small to use for comparison purposes.8 The data after 1996 are also excluded
because the qualification criteria and amount of SFWBIR benefit increased in the
following years.
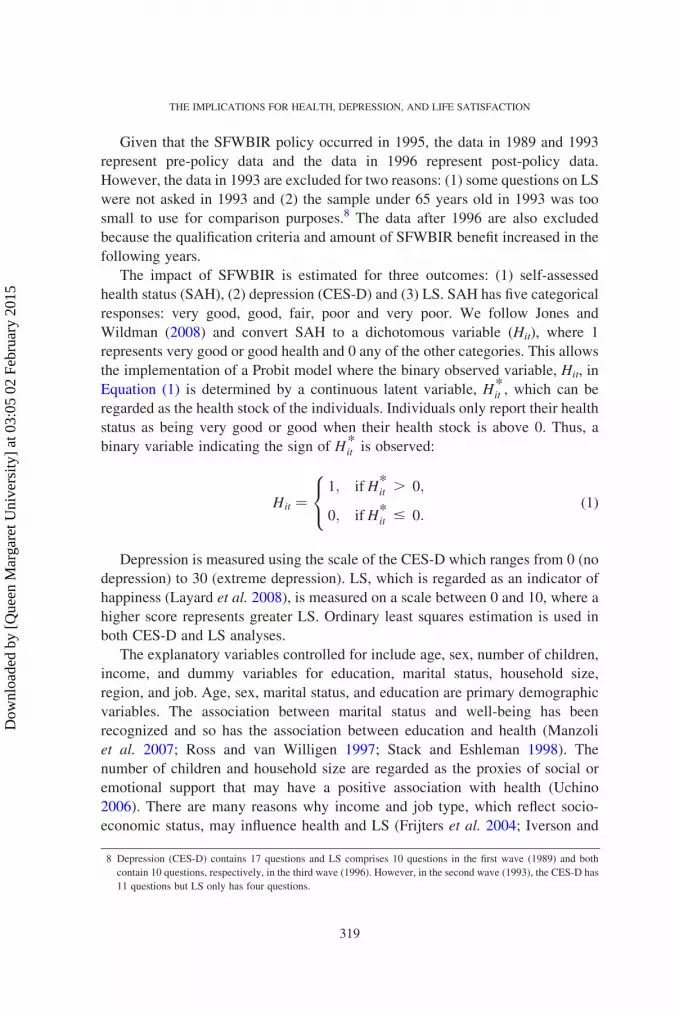
The impact of SFWBIR is estimated for three outcomes: (1) self-assessed
health status (SAH), (2) depression (CES-D) and (3) LS. SAH has five categorical
responses: very good, good, fair, poor and very poor. We follow Jones and
Wildman (2008) and convert SAH to a dichotomous variable (Hit), where 1
represents very good or good health and 0 any of the other categories. This allows
the implementation of a Probit model where the binary observed variable, Hit, in
Equation (1) is determined by a continuous latent variable, H*it , which can be
regarded as the health stock of the individuals. Individuals only report their health
status as being very good or good when their health stock is above 0. Thus, a
binary variable indicating the sign of H*it is observed:
Hit ¼1; if H*
it . 0;
0; if H*it # 0:
8<: ð1Þ
Depression is measured using the scale of the CES-D which ranges from 0 (no
depression) to 30 (extreme depression). LS, which is regarded as an indicator of
happiness (Layard et al. 2008), is measured on a scale between 0 and 10, where a
higher score represents greater LS. Ordinary least squares estimation is used in
both CES-D and LS analyses.
The explanatory variables controlled for include age, sex, number of children,
income, and dummy variables for education, marital status, household size,
region, and job. Age, sex, marital status, and education are primary demographic
variables. The association between marital status and well-being has been
recognized and so has the association between education and health (Manzoli
et al. 2007; Ross and van Willigen 1997; Stack and Eshleman 1998). The
number of children and household size are regarded as the proxies of social or
emotional support that may have a positive association with health (Uchino
2006). There are many reasons why income and job type, which reflect socio-
economic status, may influence health and LS (Frijters et al. 2004; Iverson and
8 Depression (CES-D) contains 17 questions and LS comprises 10 questions in the first wave (1989) and both
contain 10 questions, respectively, in the third wave (1996). However, in the second wave (1993), the CES-D has
11 questions but LS only has four questions.
THE IMPLICATIONS FOR HEALTH, DEPRESSION, AND LIFE SATISFACTION
319
Dow
nloa
ded
by [
Que
en M
arga
ret U
nive
rsity
] at
03:
05 0
2 Fe
brua
ry 2
015
Maguire, 2000; Strully 2009; Tsutsumi et al. 2001) however, the empirical
evidence is mixed. Regional dummy variables control for differences in
treatment access and health hazards that vary across geographical locations. To
control for income differences, the initial income, defined as the income in 1989,
is used so as to avoid the possible endogeneity problem where final income may
be influenced by the SFWBIR payment. The initial income predicted by an
interval regression is employed as the income variable in the estimations. For
cohort I, the predicted initial income is obtained by implementing the interval
regression using the categorical income in 1989 as the dependent variable and
1989s individual characteristics, such as sex, age, education, marital status
(married, divorce, and widow), region (north, middle, and south), working status,
number of children in the family and income source (from children, from
pension, and from invested gain) as independent variables. However, the income
information in 1989 is unavailable for cohort II. Thus, we use the coefficients
obtained from the interval regression of cohort I with income categories in 1989
and individual characteristics in 1996 and the individual characteristics of cohort
II to predict cohort II’s initial income.
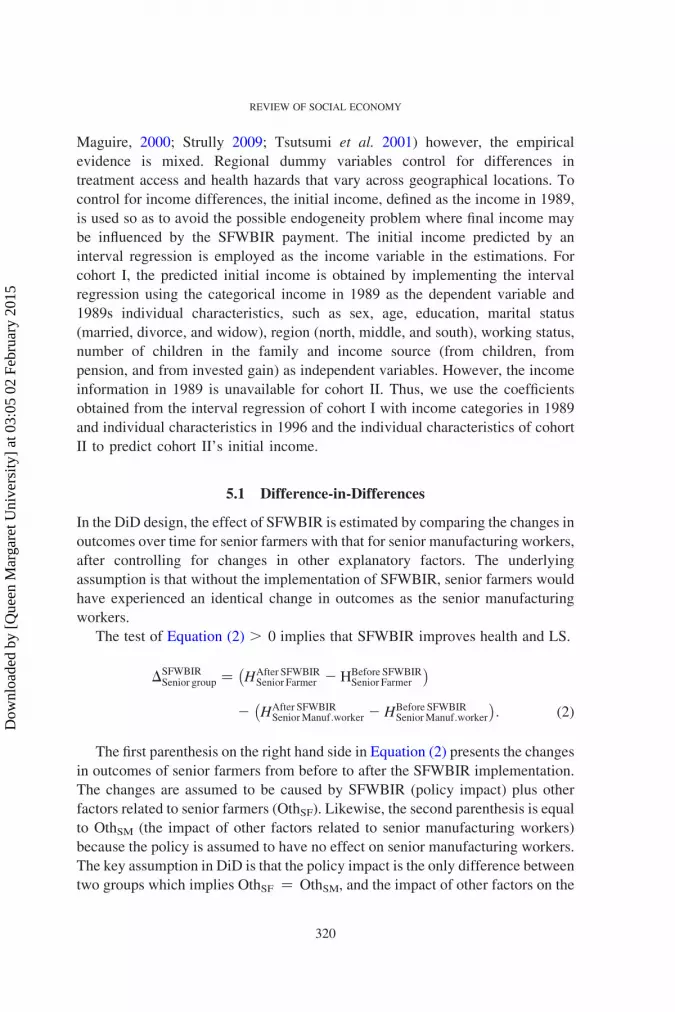
5.1 Difference-in-Differences
In the DiD design, the effect of SFWBIR is estimated by comparing the changes in
outcomes over time for senior farmers with that for senior manufacturing workers,
after controlling for changes in other explanatory factors. The underlying
assumption is that without the implementation of SFWBIR, senior farmers would
have experienced an identical change in outcomes as the senior manufacturing
workers.
The test of Equation (2) . 0 implies that SFWBIR improves health and LS.
DSFWBIRSenior group ¼ HAfter SFWBIR
Senior Farmer 2 HBefore SFWBIRSenior Farmer
� �
2 HAfter SFWBIRSeniorManuf:worker 2 HBefore SFWBIR
SeniorManuf:worker
� �: ð2Þ
The first parenthesis on the right hand side in Equation (2) presents the changes
in outcomes of senior farmers from before to after the SFWBIR implementation.
The changes are assumed to be caused by SFWBIR (policy impact) plus other
factors related to senior farmers (OthSF). Likewise, the second parenthesis is equal
to OthSM (the impact of other factors related to senior manufacturing workers)
because the policy is assumed to have no effect on senior manufacturing workers.
The key assumption in DiD is that the policy impact is the only difference between
two groups which implies OthSF ¼ OthSM, and the impact of other factors on the
REVIEW OF SOCIAL ECONOMY
320
Dow
nloa
ded
by [
Que
en M
arga
ret U
nive
rsity
] at
03:
05 0
2 Fe
brua
ry 2
015
changes of senior farmers’ outcomes is identical to that on the changes in senior
manufacturing workers’ outcomes. Thus, DSFWBIRSenior group ¼ (P þ OthSF) 2
(OthSM) ¼ P.
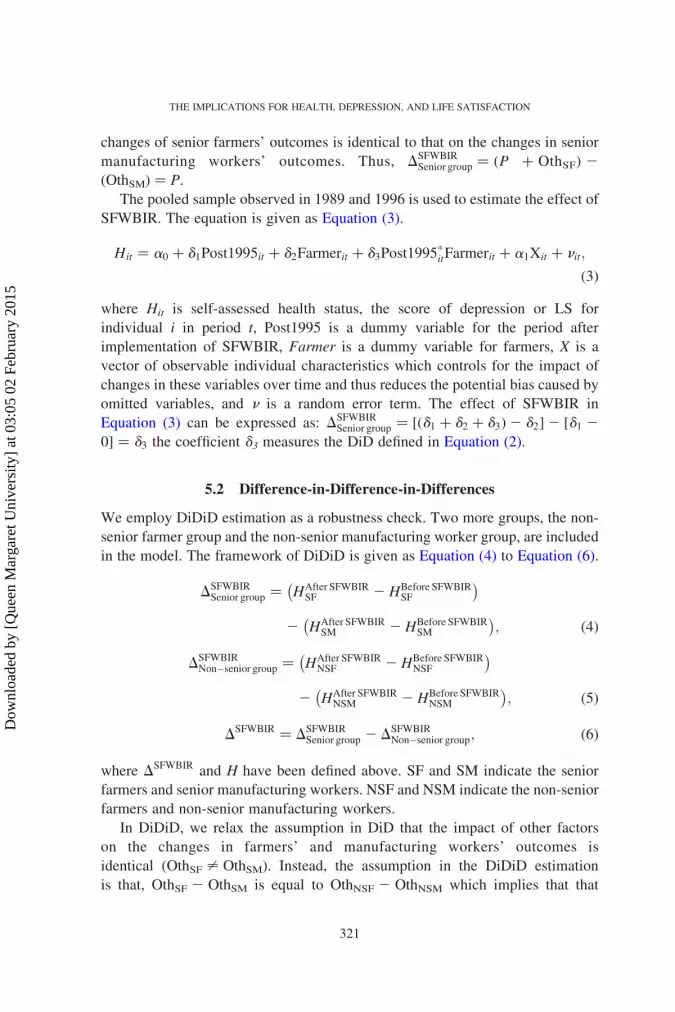
The pooled sample observed in 1989 and 1996 is used to estimate the effect of
SFWBIR. The equation is given as Equation (3).
Hit ¼ a0 þ d1Post1995it þ d2Farmerit þ d3Post1995*itFarmerit þ a1Xit þ nit;
ð3Þwhere Hit is self-assessed health status, the score of depression or LS for
individual i in period t, Post1995 is a dummy variable for the period after
implementation of SFWBIR, Farmer is a dummy variable for farmers, X is a
vector of observable individual characteristics which controls for the impact of
changes in these variables over time and thus reduces the potential bias caused by
omitted variables, and n is a random error term. The effect of SFWBIR in
Equation (3) can be expressed as: DSFWBIRSenior group ¼ ½ðd1 þ d2 þ d3Þ2 d2�2 ½d1 2
0� ¼ d3 the coefficient d3 measures the DiD defined in Equation (2).
5.2 Difference-in-Difference-in-Differences
We employ DiDiD estimation as a robustness check. Two more groups, the non-
senior farmer group and the non-senior manufacturing worker group, are included
in the model. The framework of DiDiD is given as Equation (4) to Equation (6).
DSFWBIRSenior group ¼ HAfter SFWBIR
SF 2 HBefore SFWBIRSF
� �
2 HAfter SFWBIRSM 2 HBefore SFWBIR
SM
� �; ð4Þ
DSFWBIRNon–senior group ¼ HAfter SFWBIR
NSF 2 HBefore SFWBIRNSF
� �
2 HAfter SFWBIRNSM 2 HBefore SFWBIR
NSM
� �; ð5Þ
DSFWBIR ¼ DSFWBIRSenior group 2 DSFWBIR
Non–senior group; ð6Þ
where DSFWBIR and H have been defined above. SF and SM indicate the senior
farmers and senior manufacturing workers. NSF and NSM indicate the non-senior
farmers and non-senior manufacturing workers.
In DiDiD, we relax the assumption in DiD that the impact of other factors
on the changes in farmers’ and manufacturing workers’ outcomes is
identical (OthSF – OthSM). Instead, the assumption in the DiDiD estimation
is that, OthSF 2 OthSM is equal to OthNSF 2 OthNSM which implies that that
THE IMPLICATIONS FOR HEALTH, DEPRESSION, AND LIFE SATISFACTION
321
Dow
nloa
ded
by [
Que
en M
arga
ret U
nive
rsity
] at
03:
05 0
2 Fe
brua
ry 2
015
any occupational difference from before to after the policy implementation
is the same across our two age groups. Thus, DSFWBIR is equal to the policy impact.
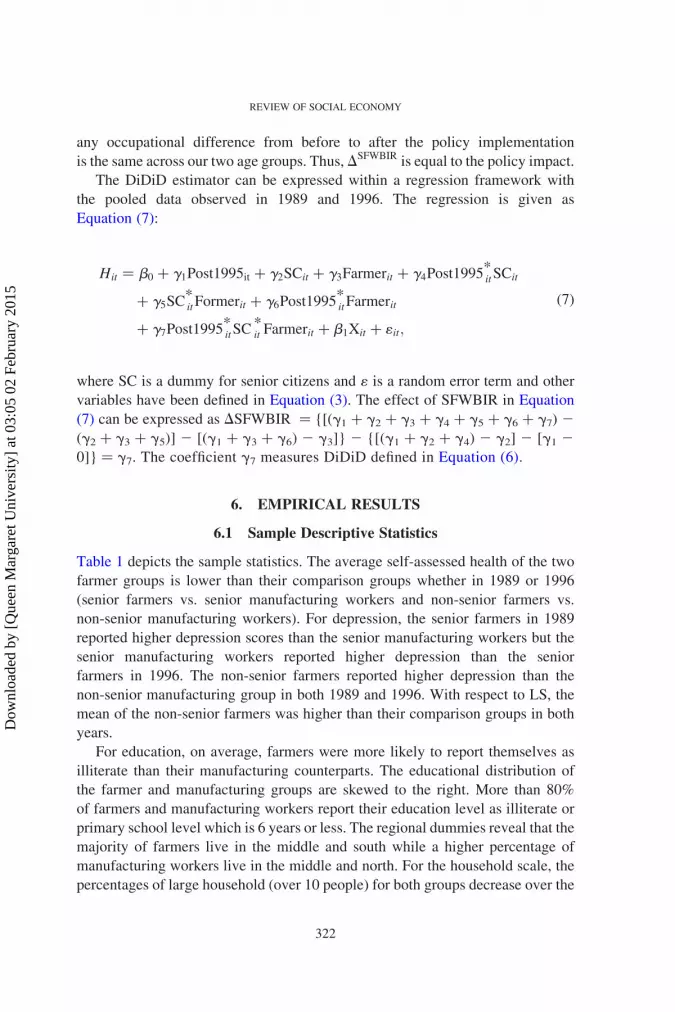
The DiDiD estimator can be expressed within a regression framework with
the pooled data observed in 1989 and 1996. The regression is given as
Equation (7):
Hit ¼ b0 þ g1Post1995it þ g2SCit þ g3Farmerit þ g4Post1995*itSCit
þ g5SC*itFormerit þ g6Post1995
*itFarmerit
þ g7Post1995*itSC
*it Farmerit þ b1Xit þ 1it;
ð7Þ
where SC is a dummy for senior citizens and 1 is a random error term and other
variables have been defined in Equation (3). The effect of SFWBIR in Equation
(7) can be expressed as DSFWBIR ¼ {[(g1 þ g2 þ g3 þ g4 þ g5 þ g6 þ g7) 2
(g2 þ g3 þ g5)] 2 [(g1 þ g3 þ g6) 2 g3]} 2 {[(g1 þ g2 þ g4) 2 g2] 2 [g1 2
0]} ¼ g7. The coefficient g7 measures DiDiD defined in Equation (6).
6. EMPIRICAL RESULTS
6.1 Sample Descriptive Statistics
Table 1 depicts the sample statistics. The average self-assessed health of the two
farmer groups is lower than their comparison groups whether in 1989 or 1996
(senior farmers vs. senior manufacturing workers and non-senior farmers vs.
non-senior manufacturing workers). For depression, the senior farmers in 1989
reported higher depression scores than the senior manufacturing workers but the
senior manufacturing workers reported higher depression than the senior
farmers in 1996. The non-senior farmers reported higher depression than the
non-senior manufacturing group in both 1989 and 1996. With respect to LS, the
mean of the non-senior farmers was higher than their comparison groups in both
years.
For education, on average, farmers were more likely to report themselves as
illiterate than their manufacturing counterparts. The educational distribution of
the farmer and manufacturing groups are skewed to the right. More than 80%
of farmers and manufacturing workers report their education level as illiterate or
primary school level which is 6 years or less. The regional dummies reveal that the
majority of farmers live in the middle and south while a higher percentage of
manufacturing workers live in the middle and north. For the household scale, the
percentages of large household (over 10 people) for both groups decrease over the
REVIEW OF SOCIAL ECONOMY
322
Dow
nloa
ded
by [
Que
en M
arga
ret U
nive
rsity
] at
03:
05 0
2 Fe
brua
ry 2
015

Table 1: Sample Statistics: (a) 1989 and (b) 1996
Farmer group Manufacturing worker group
Senior group
Non-senior
group Senior group
Non-senior
group
Mean (SD) Mean (SD) Mean (SD) Mean (SD)
(a) 1989
Health indicators
SAH 0.351 (0.478) 0.402 (0.491) 0.370 (0.484) 0.488 (0.501)
CES-D 5.646 (4.192) 5.537 (4.130) 4.856 (4.056) 5.200 (4.193)
LS 6.277 (2.404) 6.543 (2.413) 6.013 (2.243) 5.975 (2.519)
Educational dummy
Illiterate 0.524 (0.500) 0.398 (0.490) 0.380 (0.487) 0.241 (0.429)
Primary S. 0.430 (0.496) 0.560 (0.501) 0.462 (0.500) 0.632 (0.484)
Junior H.S. 0.029 (0.169) 0.032 (0.175) 0.101 (0.303) 0.098 (0.298)
Senior H.S. 0.013 (0.111) 0.007 (0.084) 0.044 (0.206) 0.017 (0.131)
University 0.002 (0.046) 0.004 (0.059) 0.013 (0.112) 0.011 (0.107)
Marital status dummy
Married 0.689 (0.463) 0.820 (0.385) 0.595 (0.492) 0.724 (0.448)
Divorce 0.019 (0.136) 0.000 (0.000) 0.070 (0.255) 0.075 (0.264)
Widow 0.282 (0.450) 0.173 (0.379) 0.272 (0.446) 0.132 (0.340)
Single 0.006 (0.079) 0.007 (0.084) 0.063 (0.244) 0.069 (0.254)
Age 69.57 (3.169) 62.19 (1.294) 68.97 (2.932) 62.02 (1.368)
Male 0.668 (0.471) 0.694 (0.462) 0.677 (0.469) 0.782 (0.414)
Household scale dummy
1–4 people 0.390 (0.488) 0.444 (0.498) 0.481 (0.501) 0.477 (0.501)
5–10 people 0.532 (0.499) 0.475 (0.500) 0.481 (0.501) 0.454 (0.499)
Over 10 people 0.077 (0.267) 0.081 (0.273) 0.038 (0.192) 0.069 (0.254)
Regional dummy
North 0.113 (0.317) 0.092 (0.289) 0.399 (0.491) 0.425 (0.496)
Middle 0.413 (0.493) 0.461 (0.499) 0.316 (0.467) 0.264 (0.442)
South 0.363 (0.481) 0.363 (0.482) 0.241 (0.429) 0.241 (0.429)
East 0.111 (0.314) 0.085 (0.279) 0.044 (0.206) 0.069 (0.254)
(continued)
THE IMPLICATIONS FOR HEALTH, DEPRESSION, AND LIFE SATISFACTION
323
Dow
nloa
ded
by [
Que
en M
arga
ret U
nive
rsity
] at
03:
05 0
2 Fe
brua
ry 2
015

Table 1: (Continued)
Farmer group Manufacturing worker group
Senior group
Non-senior
group Senior group
Non-senior
group
Mean (SD) Mean (SD) Mean (SD) Mean (SD)
Job type dummy
Self-employed 0.313 (0.464) 0.493 (0.501) 0.032 (0.176) 0.057 (0.233)
Family business 0.002 (0.046) 0.011 (0.103) 0.000 (0.000) 0.029 (0.168)
Employee 0.040 (0.195) 0.082 (0.274) 0.196 (0.398) 0.494 (0.501)
Retired 0.008 (0.091) 0.011 (0.103) 0.152 (0.360) 0.138 (0.346)
Others 0.637 (0.481) 0.404 (0.492) 0.620 (0.487) 0.282 (0.451)
No. of children 5.561 (2.190) 5.145 (1.744) 4.550 (2.170) 4.042 (2.124)
Predicted 1989 income
(NT$1,000)
5.298 (12.338) 5.838 (5.814) 6.708 (6.547) 8.460 (6.587)
Sample size 479 284 158 174
(b) 1996
Health indicators
SAH 0.371 (0.484) 0.401 (0.491) 0.423 (0.499) 0.525 (0.500)
CES-D 6.756 (4.476) 7.346 (4.757) 7.481 (4.889) 6.319 (3.500)
LS 6.500 (2.488) 6.558 (2.372) 6.180 (2.561) 6.296 (2.375)
Educational dummy
Illiterate 0.384 (0.488) 0.353 (0.479) 0.327 (0.474) 0.172 (0.378)
Primary S. 0.551 (0.499) 0.583 (0.494) 0.491 (0.505) 0.658 (0.475)
Junior H.S. 0.051 (0.220) 0.035 (0.184) 0.164 (0.373) 0.085 (0.279)
Senior H.S. 0.005 (0.068) 0.026 (0.160) 0.000 (0.000) 0.066 (0.248)
University 0.009 (0.096) 0.003 (0.054) 0.018 (0.135) 0.019 (0.136)
Marital status dummy
Married 0.810 (0.393) 0.857 (0.350) 0.709 (0.458) 0.890 (0.313)
Divorce 0.023 (0.151) 0.015 (0.120) 0.018 (0.135) 0.034 (0.183)
Widow 0.162 (0.369) 0.114 (0.318) 0.218 (0.419) 0.047 (0.212)
Single 0.005 (0.068) 0.015 (0.120) 0.055 (0.229) 0.028 (0.166)
Age 69.20 (2.819) 58.13 (3.872) 68.96 (2.236) 55.20 (3.736)
Male 0.75 (0.434) 0.569 (0.496) 0.655 (0.480) 0.734 (0.443)
(continued)
REVIEW OF SOCIAL ECONOMY
324
Dow
nloa
ded
by [
Que
en M
arga
ret U
nive
rsity
] at
03:
05 0
2 Fe
brua
ry 2
015
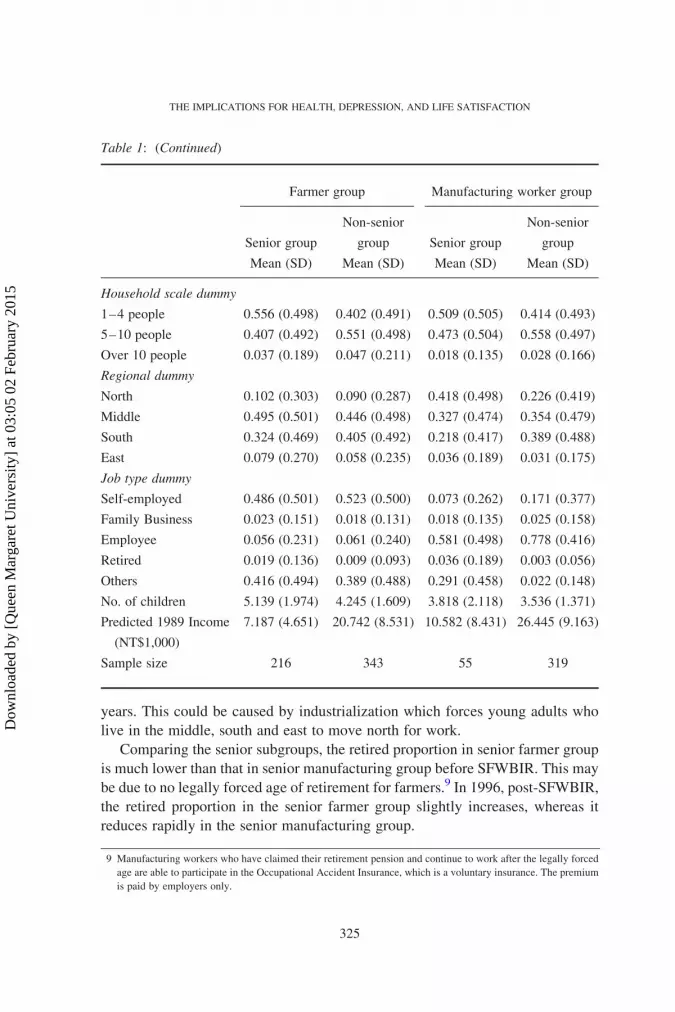
years. This could be caused by industrialization which forces young adults who
live in the middle, south and east to move north for work.
Comparing the senior subgroups, the retired proportion in senior farmer group
is much lower than that in senior manufacturing group before SFWBIR. This may
be due to no legally forced age of retirement for farmers.9 In 1996, post-SFWBIR,
the retired proportion in the senior farmer group slightly increases, whereas it
reduces rapidly in the senior manufacturing group.
Table 1: (Continued)
Farmer group Manufacturing worker group
Senior group
Non-senior
group Senior group
Non-senior
group
Mean (SD) Mean (SD) Mean (SD) Mean (SD)
Household scale dummy
1–4 people 0.556 (0.498) 0.402 (0.491) 0.509 (0.505) 0.414 (0.493)
5–10 people 0.407 (0.492) 0.551 (0.498) 0.473 (0.504) 0.558 (0.497)
Over 10 people 0.037 (0.189) 0.047 (0.211) 0.018 (0.135) 0.028 (0.166)
Regional dummy
North 0.102 (0.303) 0.090 (0.287) 0.418 (0.498) 0.226 (0.419)
Middle 0.495 (0.501) 0.446 (0.498) 0.327 (0.474) 0.354 (0.479)
South 0.324 (0.469) 0.405 (0.492) 0.218 (0.417) 0.389 (0.488)
East 0.079 (0.270) 0.058 (0.235) 0.036 (0.189) 0.031 (0.175)
Job type dummy
Self-employed 0.486 (0.501) 0.523 (0.500) 0.073 (0.262) 0.171 (0.377)
Family Business 0.023 (0.151) 0.018 (0.131) 0.018 (0.135) 0.025 (0.158)
Employee 0.056 (0.231) 0.061 (0.240) 0.581 (0.498) 0.778 (0.416)
Retired 0.019 (0.136) 0.009 (0.093) 0.036 (0.189) 0.003 (0.056)
Others 0.416 (0.494) 0.389 (0.488) 0.291 (0.458) 0.022 (0.148)
No. of children 5.139 (1.974) 4.245 (1.609) 3.818 (2.118) 3.536 (1.371)
Predicted 1989 Income
(NT$1,000)
7.187 (4.651) 20.742 (8.531) 10.582 (8.431) 26.445 (9.163)
Sample size 216 343 55 319
9 Manufacturing workers who have claimed their retirement pension and continue to work after the legally forced
age are able to participate in the Occupational Accident Insurance, which is a voluntary insurance. The premium
is paid by employers only.
THE IMPLICATIONS FOR HEALTH, DEPRESSION, AND LIFE SATISFACTION
325
Dow
nloa
ded
by [
Que
en M
arga
ret U
nive
rsity
] at
03:
05 0
2 Fe
brua
ry 2
015

The gap of predicted initial income for senior groups and non-senior groups in
1989 was 26.61% and 44.91%, respectively. However, in 1996, the gap of
predicted initial income among senior groups broadened to 47.24% but the gap of
predicted initial income among non-senior groups narrowed down to 27.49%.
This implies that some initial income predictors, such as age, working status and
major income source, in 1996 differ from those in 1989.
Although there are still some differences in characteristics between the senior
farmers and senior manufacturing workers, the difference are small compared
with other occupational groups.10
Figure 1 presents the trends of CES-D and LS for the senior farmer group and
the senior manufacturing worker group before and after the policy intervention.
Figure 1: Trends of depression (CES-D) and life satisfaction (LS) for both groups before
and after 1995. Note: 1. The score of depression ranges from 0 to 30 and it ranges from 0 to
4 in LS. 2. A high score in depression means more depression and the high score in LS is
more satisfaction.
10 Such difference between treatment and control groups also exists in other similar studies, including Chou et al.
(2003).
REVIEW OF SOCIAL ECONOMY
326
Dow
nloa
ded
by [
Que
en M
arga
ret U
nive
rsity
] at
03:
05 0
2 Fe
brua
ry 2
015

The non-senior groups are not included in the figure due to lack of data of the non-
senior farmers and manufacturing workers in 1993. Note that due to the limited
number of LS questions asked in 1993, the scales shown in the figure are only
based on the questions common to all three years. Overall, senior farmers have
higher depression than senior manufacturing workers and follow a consistent
pattern before the policy, whereas this reverses after the pension implementation.
For LS, the changes for both groups follow a similar patter before the policy
change with senior farmers being more satisfied but the difference between the
two groups narrows in 1996.
6.2 DiD Estimation
In Table 2, the column of SAH for the basic specification suggests that SFWBIR
had no statistically significant effect on senior farmers’ self-assessed health when
other factors are left uncontrolled. In the bottom rows, the other control variables
identified in Equation (2) are included. In the full specification model of SAH, the
coefficient of SFWBIR on the senior farmers is negative but not statistically
significant at the 10% level. Education, but only the junior high school and
university levels, contribute to self-assessed health significantly at the 5%
and 10% levels, respectively. People whose education level at junior high school
and university levels have a higher probability of reporting good self-assessed
health compared with illiterate subjects, holding other characteristics constant.
The dummies of marital status do not have significant effects on self-assessed
health. Age has a non-significant positive effect on self-assessed health status.
However, males report better self-assessed health than females at the 5% level.
With respect to regional dummies, the north has positive and significant effects
on self-assessed health compared with the east at the 5% level. Self-employed,
employed and retired people have a significantly higher probability of reporting
good self-assessed health than those who are defined as the category of others with
a significant level of 1% and 5%, respectively.11
The column of CES-D suggests that SFWBIR reduces depression of senior
farmers in the basic specification model but this is only significant at the 10% level.
In the full specification, the effect of SFWBIRon senior farmers continues to reduce
depression but it becomes significant at the 5% level. It is estimated that the
SFWBIR decreases the depression scale of senior farmers by 1.697 points. As for
other control variables, people in the median household (5–10 people) and large
household (over 10 people) report significantly (0.565 points) lower depression at
the 5% level compared with those in a small household (1–4 people).
11 The result estimated with five levels of SHA is consistent with Table 2.
THE IMPLICATIONS FOR HEALTH, DEPRESSION, AND LIFE SATISFACTION
327
Dow
nloa
ded
by [
Que
en M
arga
ret U
nive
rsity
] at
03:
05 0
2 Fe
brua
ry 2
015

Table 2: DiD Empirical Results
SAH CES-D LS
Coeff. (SE) Coeff. (SE) Coeff. (SE)
Basic specification
Post 1995 0.137 (0.203) 2.625*** (0.687) 0.167 (0.393)
Farmer 20.052 (0.123) 0.791** (0.399) 0.277 (0.227)
Farmer*Post1995 2 0.082 (0.229) 2 1.515* (0.775) 0.057 (0.445)
Full specification
Post1995 20.048 (0.232) 3.074*** (0.735) 0.007 (0.413)
Farmer 0.065 (0.148) 0.727 (0.465) 20.013 (0.261)
Farmer*post1995 2 0.055 (0.255) 2 1.697** (0.810) 0.102 (0.458)
Primary school 0.020 (0.106) 20.267 (0.340) 0.214 (0.192)
Junior high school 0.494** (0.217) 20.646 (0.704) 0.558 (0.399)
Senior high school 0.096 (0.357) 0.195 (1.181) 0.511 (0.680)
University 1.077* (0.614) 21.754 (1.805) 20.358 (1.002)
Marital status: married 20.048 (0.665) 2.707 (1.991) 0.113 (1.107)
Marital status: divorce 0.054 (0.708) 2.563 (2.142) 21.611 (1.190)
Marital status: widow 20.086 (0.669) 3.419* (2.004) 20.608 (1.114)
Age 0.529 (0.747) 1.119 (2.373) 0.534 (1.332)
Square of age 20.004 (0.005) 20.008 (0.017) 20.004 (0.010)
Male 0.298** (0.118) 20.334 (0.370) 0.091 (0.211)
Household scale
5–10 people 0.020 (0.097) 20.770** (0.309) 0.116 (0.175)
Over 10 people 20.038 (0.208) 21.425** (0.659) 0.717 (0.367)
Region-north 0.471** (0.201) 20.564 (0.626) 0.069 (0.357)
Region-middle 0.246 (0.177) 20.297 (0.541) 0.327 (0.308)
Region-south 0.286 (0.182) 0.221 (0.554) 0.375 (0.316)
Job type
Self-employed 0.536*** (0.117) 20.693* (0.369) 0.572*** (0.210)
Family business 0.435 (0.485) 20.672 (1.623) 20.309 (0.971)
Employed 0.366** (0.172) 20.783 (0.553) 0.113 (0.309)
Retired 0.534** (0.252) 20.361 (0.817) 0.941** (0.460)
No. of children 0.019 (0.022) 20.060 (0.071) 0.044 (0.040)
Predicted 1989 Income 0.0003 (0.004) 20.026* (0.015) 0.012 (0.008)
Sample size 850 844 811†
R 2 0.068 (pseudo) 0.078 0.070
***, **, and * present statistically significant at the 1%, 5% and 10% levels, respectively.
† The sample size in the estimates of LS is smaller than that in the estimates of SAH and CES-D
because more missing values exist in the questions of LS.
REVIEW OF SOCIAL ECONOMY
328
Dow
nloa
ded
by [
Que
en M
arga
ret U
nive
rsity
] at
03:
05 0
2 Fe
brua
ry 2
015

The column of LS presents the effect of SFWBIR on senior farmers as positive
but not significant at the 10% level in the basic specification. In the full
specification, it remains positive and not significant. With respect to other
covariates, self-employed and retired people report significantly higher LS at the
1% level and 5% level, respectively. The R 2s presented in the three regressions
are low, which means that there are still many unexplained or unknown factors
explaining the variation in health and happiness.12
6.3 ROBUSTNESS TESTS
6.3.1 DiDiD estimation. The columns of SAH and LS in Table 3 show that the
effects of SFWBIR on self-assessed health and LS of senior farmers are positive
but not significant at the 10% level. The column of CES-D again show that
SFWBIR reduces the depression of senior farmers by 2.178 points but it is only
significant at the 10% level.
6.3.2 Robustness test of retirement effect. The age for senior farmers to
claim the SFWBIR benefit is at 65 years that is the legal age of retirement in other
industries. Though this legal age is not applicable to farmers because farmers can
retire at any age, we exam the retirement effect in the farmer group. We compare
senior farmers with non-senior farmers only using the 1996 data and the model is
shown in Equation (8)
DRetiredFarmer group ¼ HRetired
SC 2 HNon-retiredSC
� �2 HRetired
Non-SC 2 HNon-retiredNon–SC :
� � ð8Þ
The senior farmer group in 1996 was the group that claimed the SFWBIR benefit.
This comparison identifies the retired effect in farmer group. Table 4 shows that
the retirement does not have a significant impact on depression in farmers. This
result provides a robust evidence of the SFWBIR effect on depression.
7. CONCLUSION
This paper uses a natural experiment to identify the effect of the SFWBIR on self-
assessed health, depression, and LS for senior farmers in Taiwan. SFWBIR
appeared to significantly reduce the depression of senior farmers and this result
was robust to different specifications. In summary, the pure permanent cash
injection had no significant short-term effect on self-assessed health and LS but
had a significant short-term effect on relief of depression. This provides evidence
12 The R 2s in other studies are also low, for example, Li and Zhu (2006) and Gardner and Oswald (2007).
THE IMPLICATIONS FOR HEALTH, DEPRESSION, AND LIFE SATISFACTION
329
Dow
nloa
ded
by [
Que
en M
arga
ret U
nive
rsity
] at
03:
05 0
2 Fe
brua
ry 2
015
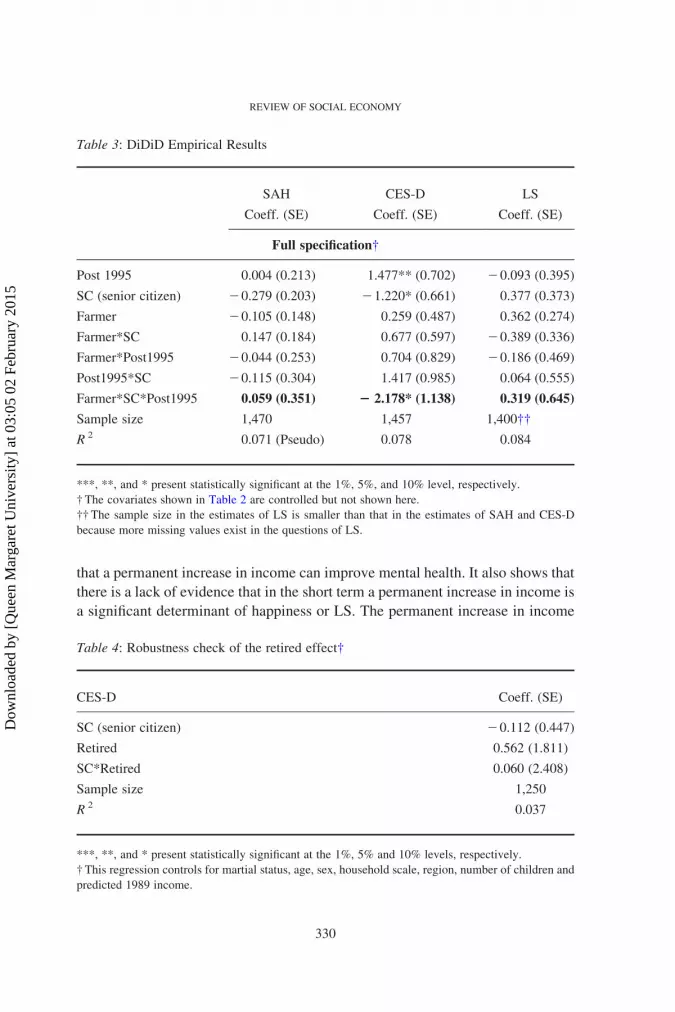
that a permanent increase in income can improve mental health. It also shows that
there is a lack of evidence that in the short term a permanent increase in income is
a significant determinant of happiness or LS. The permanent increase in income
Table 3: DiDiD Empirical Results
SAH CES-D LS
Coeff. (SE) Coeff. (SE) Coeff. (SE)
Full specification†
Post 1995 0.004 (0.213) 1.477** (0.702) 20.093 (0.395)
SC (senior citizen) 20.279 (0.203) 21.220* (0.661) 0.377 (0.373)
Farmer 20.105 (0.148) 0.259 (0.487) 0.362 (0.274)
Farmer*SC 0.147 (0.184) 0.677 (0.597) 20.389 (0.336)
Farmer*Post1995 20.044 (0.253) 0.704 (0.829) 20.186 (0.469)
Post1995*SC 20.115 (0.304) 1.417 (0.985) 0.064 (0.555)
Farmer*SC*Post1995 0.059 (0.351) 2 2.178* (1.138) 0.319 (0.645)
Sample size 1,470 1,457 1,400††
R 2 0.071 (Pseudo) 0.078 0.084
***, **, and * present statistically significant at the 1%, 5%, and 10% level, respectively.
† The covariates shown in Table 2 are controlled but not shown here.
†† The sample size in the estimates of LS is smaller than that in the estimates of SAH and CES-D
because more missing values exist in the questions of LS.
Table 4: Robustness check of the retired effect†
CES-D Coeff. (SE)
SC (senior citizen) 20.112 (0.447)
Retired 0.562 (1.811)
SC*Retired 0.060 (2.408)
Sample size 1,250
R 2 0.037
***, **, and * present statistically significant at the 1%, 5% and 10% levels, respectively.
† This regression controls for martial status, age, sex, household scale, region, number of children and
predicted 1989 income.
REVIEW OF SOCIAL ECONOMY
330
Dow
nloa
ded
by [
Que
en M
arga
ret U
nive
rsity
] at
03:
05 0
2 Fe
brua
ry 2
015

might improve mental health through direct mechanisms, for example, achieving
minimum standards of living and alleviating financial pressure but may also work
through indirect mechanisms such as changes in relative incomes across peer
groups. In particular, when senior farmers’ income increase and manufacturing
workers’ income retains the same, senior farmers may perceive themselves better
off when comparing themselves with manufacturing workers (and manufacturing
workers may see themselves as worse off now in comparison to senior farmers).
The policy effect on depression appears quicker than what is observed in the
work of Gardner and Oswald (2007) where they observe the impact of a lottery
win on mental health after two years of the lottery win. Two reasons might explain
this difference. First, the instruments of income innovation are different. The
policy intervention here is permanent and anticipated, whereas lottery wins are a
short-term and unanticipated shocks. Second, the population concerned in this
paper is senior farmers whose socio-economic status is relatively low. For
farmers, financial embarrassment may cause depression. The anticipated effect
after policy announcement might start to reduce stress and the income injection
can immediately relieve stress after the policy is implemented.
The income injection shows the impact on mental health but not on self-
assessed health and LS. The following reasons may explain this. First, income
might have lagged effects on both indicators. Income may have a lagged effect on
self-assessed health as health investments may take time to translate into health.
With respect to LS, for the population of low social strata, reducing financial
embarrassment will relieve living stress first and potentially raise LS afterwards.
However, this paper cannot reveal any information about long-term effects of two
years or longer. Only the first year after policy implement can be detected in the
current study due to changes in the magnitude of the SFWBIR payment post 1996.
Second, the questions of CES-D focus on current mental status, whereas the
questions of LS focus on current status, the comparison of current status with the
past, the evaluation of the whole life and the expectation of future. It is an
evaluation of a longer time span; thus, the policy effect on LS might be ambiguous
or be observed to move more slowly than that on depression.
Finally, the NHI was also implemented in 1995. Due to this reason, the policy
effect identified above might be treated with scepticism. However, this scepticism
can be excluded because of two reasons. First, NHI was unlikely to significantly
influence the individuals who had been previously covered by the occupational
social schemes (both farmers and manufacturing workers). Second, NHI covers
major populations including farmers and manufacturing workers and therefore it
may be expected that any impact would be experienced equally by both groups
and therefore would not show up in our estimated effect. Another scepticism is
due to the retired effect in the farmer group. However, the retired effect in the
THE IMPLICATIONS FOR HEALTH, DEPRESSION, AND LIFE SATISFACTION
331
Dow
nloa
ded
by [
Que
en M
arga
ret U
nive
rsity
] at
03:
05 0
2 Fe
brua
ry 2
015

farmer group does not show a significant impact on depression, which provides
robust evidence for the SFWBIR effect on depression.
Hauck and Rice (2004) show that the more disadvantaged groups suffer poorer
mental health and experience more periods of ill health and the appreciate
prevention policies targeting mental illness within different risk groups are needed.
Our result provides evidence that long-term social benefits (pensions) somewhat
relieve the depression experienced by senior farmers in the short-term which is
consistent with the results reported by Case (2004). However, we are unable to
reveal the long-term impact of this social benefit in this study and it is possible that
the impact in long term may slowly disappear due to hedonic adaptation, whereby
individuals grow accustomed to their new income level (Frederick and
Loewenstein 1999). Further research is needed to examine the long-term effect
of SFWBIR; however, the benefit of the SFWBIR increases over time, which
makes any such analysis more complicated. These answers can provide a direction
for policymakers to make relevant pension policies for the future.
While this study examines the impact of a pension reform implemented over
15 years ago, the results from this study are still relevant to current policy debates.
First other countries are currently deciding on whether and when to implement
universal pensions systems which cover the poorest in system and Taiwan itself is
still progressing towards a universal pension coverage system. Much of the current
debate in Taiwan is focused on how to fill the coverage gap to achieve universal
coverage. International organizations such as theWorldBank, International Labour
Organisation (ILO) and United Nations Development Programme and advocacy
groups suggest using non-contributory or social pensions as a way to address the
coverage gap (Palacios and Sluchynsky 2006). In Taiwan, there are some non-
contributory social pension schemes for the elderly population and disadvantaged
groups apart from public and private occupational and contributory pension
schemes. In 2008, the Taiwanese government implemented the National Pension
Scheme, which is a contributory pension scheme. It aims to provide a more
comprehensive safety net and integrate the fragmented old-age allowance systems
step by step. This study provides information about the possible benefit filling the
coverage gap with social pension schemes.
REFERENCES
Adams, P., Hurd, M. D., McFadden, D., Merrill, A. and Ribeiro, T. (2003) “Healthy,
Wealthy, and Wise? Tests for Direct Causal Paths Between Health and Socioeconomic
Status,” Journal of Econometrics 112: 3–56.
Adda, J., Chandola, T. and Marmot, M. (2003) “Socio-economic Status and Health:
Causality and Pathways,” Journal of Econometrics 112: 57–63.
REVIEW OF SOCIAL ECONOMY
332
Dow
nloa
ded
by [
Que
en M
arga
ret U
nive
rsity
] at
03:
05 0
2 Fe
brua
ry 2
015
Adler, N. E., Boyce, T., Chesney, M. A., Cohen, S., Folkman, S., Kahn, R. L. and Syme, S.
L. (1994) “Socioeconomic Status and Health: The Challenge of the Gradient,” American
Psychologist 49: 15–24.
Angel, R. J., Frisco, M., Angel, J. L. and Chiriboga, D. A. (2003) “Financial Strain and
Health Among Elderly Mexican-Origin Individuals,” Journal of Health and Social
Behavior 44: 536–551.
Blakely, T. A., Kennedy, B. P. and Kawachi, I. (2001) “Socioeconomic Inequality in
Voting Participation and Self-rated Health,” American Journal of Public Health 91(1):
99–104.
Case, A. (2004) “Does Money Protect Health Status? Evidence from South African
Pensions,” in D. A. Wise (ed) Perspectives on the Economics of Aging, Chicago:
University of Chicago Press, pp. 287–311.
Chen, L., Yip, W., Chang, M. C., Lin, H. S., Lee, S. D., Chiu, Y. L. and Lin, Y. H. (2007)
“The Effects of Taiwan’s National Health Insurance on Access and Health Status of the
Elderly,” Health Economics 16(3): 223–242.
Chin, B. (2010) “Income, Health, and Well-Being in Rural Malawi,” Demographic
Research 23(Article 35): 997–1030.
Chou, S. Y., Liu, J. T. and Hammitt, J. K. (2003) “National Health Insurance and
Precautionary Saving: Evidence from Taiwan,” Journal of Public Economics 87:
1873–1894.
Clark, A. E. and Oswald, A. J. (1996) “Satisfaction and Comparison Income,” Journal of
Public Economics 61: 359–381.
Clark, A. E. and Senik, C. (2010) “Who Compares to Whom? The Anatomy of Income
Comparisons in Europe,” Economic Journal 120: 573–594.
Cohen, S., Line, S., Manuck, S., Rabin, B., Heise, E. and Kaplan, J. (1997) “Chronic Social
Stress, Social Status, and Susceptibility to Upper Respiratory Infections in Nonhuman
Primates,” Psychosomatic Medicine 59: 213–221.
Cohen, S., Tyrrell, D. and Smith, A. (1991) “Psychological Stress and Susceptibility to the
Common Cold,” New England Journal of Medicine 325: 606–612.
Contoyannis, P., Jones, A. and Rice, N. (2004) “The Dynamics of Health in the British
Household Panel Study,” Journal of Applied Econometrics 19: 473–503.
Deaton, A. and Lubotsky, D. (2003) “Mortality, Inequality and Race in American Cities
and States,” Social Science & Medicine 56(6): 1139–1153.
Dixon, H. D. (1997) “Controversy: Economics and Happiness,” Economic Journal 107:
1812–1814.
Duflo, E. (2003) “Grandmothers and Granddaughters: Old-age Pensions and Intrahouse-
hold Allocation in South Africa,” World Bank Economic Review 17: 1–25.
Easterlin, R. (2001) “Income and Happiness: Towards a Unified Theory,” Economic
Journal 111: 465–484.
Ettner, S. L. (1996) “New Evidence on the Relationship Between Income and Health,”
Journal of Health Economics 15(1): 67–86.
Ferrer-i-Carbonell, A. (2005) “Income and Well-Being an Empirical Analysis of the
Comparison Income Effect,” Journal of Public Economics 89: 997–1019.
Frank, R. H. (1997) “The Frame of Reference as a Public Good,” Economic Journal 107:
1832–1847.
THE IMPLICATIONS FOR HEALTH, DEPRESSION, AND LIFE SATISFACTION
333
Dow
nloa
ded
by [
Que
en M
arga
ret U
nive
rsity
] at
03:
05 0
2 Fe
brua
ry 2
015
Frederick, S. and Loewenstein, G. (1999) “Hedonic Adaptation,” in D. Kahneman, E.
Diener and N. Schwarz (eds) Well–Being: The Foundations of Hedonic Psychology,
New York: Russell Sage Foundation, pp. 302–329.
Frijters, P., Haisken-DeNew, J. P. and Shields, M. A. (2004) “Money does Matter!
Evidence from Increasing Real Income and Life Satisfaction in East Germany Following
Reunification,” American Economic Review 94: 730–740.
Frijters, P., Haisken-DeNew, J. P. and Shields, M. A. (2005) “The Causal Effect of Income
on Health: Evidence from German Reunification,” Journal of Health Economics 24:
997–1017.
Gardner, J. and Oswald, A. J. (2007) “Money and Mental Wellbeing: A Longitudinal Study
of Medium-Sized Lottery Wins,” Journal of Health Economics 26: 49–60.
Gerdtham, U. and Johannesson, M. (2004) “Absolution Income, Relative Income, Income
Inequality, and Mortality,” Journal of Human Resources XXXIX: 228–247.
Gratton, B. (1996) “The Poverty of Impoverishment Theory: The Economic Well-Being of
the Elderly, 1890–1950,” Journal of Economic History 56: 39–61.
Gravelle, H., Wildman, M. and Sutton, M. (2002) “Income, Income Inequality and Health:
What Can We Learn from Aggregate Data,” Social Science & Medicine 54: 577–589.
Hann, D., Winter, K. and Jacobsen, P. (1999) “Measurement of Depressive Symptoms in
Cancer Patients: Evaluation of the Centre for Epidemiological Studies Depression Scale
(CES-D),” Journal of Psychosomatic Research 46: 437–443.
Hauck, K. and Rice, N. (2004) “A Longitudinal Analysis of Mental Health Mobility in
Britain,” Health Economics 13: 981–1001.
Hsiao, F. F. (2008) Consumer Behavior, Taipei: Best-Wise.
Iverson, R. D. and Maguire, C. (2000) “The Relationship Between Job and Life
Satisfaction: Evidence from a Remote Mining Community,” Human Relations 53:
807–839.
Jensen, R. T. and Richter, K. (2003) “The Health Implications of Social Security Failure:
Evidence from the Russian Pension Crisis,” Journal of Public Economics 88: 209–236.
Jones, A. M. and Wildman, J. (2008) “Health, Income and Relative Deprivation: Evidence
from the BHPS,” Journal of health Economics 27(2): 308–324.
Kahn, J. R. and Pearlin, L. I. (2006) “Financial Strain over the Life Course and Health
Among Older Adults,” Journal of Health and Social Behavior 47: 17–31.
Keng, S. H. and Sheu, S. J. (2012) “The Effect of National Health Insurance on Mortality
and the SES-Health Gradient: Evidence from the Elderly in Taiwan,”Health Economics.
DOI:10.1002/hec.1815
Knight, J., Song, L. and Gunatilaka, R. (2009) “Subjective Well-Being and Its
Determinants in Rural China,” China Economic Review 20: 635–649.
Layard, R., Mayraz, G. and Nickell, S. (2008) “The Marginal Utility of Income,” Journal of
Public Economics 92: 1846–1857.
Leon-Gonzalez, R. and Tseng, F. M. (2011) “Socioeconomic Determinants of Mortality in
Taiwan: Combining Individual and Aggregate Data,” Health Policy 99(1): 23–36.
Li, H. and Zhu, Y. (2006) “Income, Income Inequality, and Health: Evidence from China,”
Journal of Comparative Economics 34: 668–693.
REVIEW OF SOCIAL ECONOMY
334
Dow
nloa
ded
by [
Que
en M
arga
ret U
nive
rsity
] at
03:
05 0
2 Fe
brua
ry 2
015
Lindahl, M. (2005) “Estimating the Effect of Income on Health and Mortality using Lottery
Prizes as an Exogenous Source of Variation in Income,” Journal of Human Resources
40(1): 144–168.
Manzoli, L., Villari, P., Pirone, G. M. and Boccia, A. (2007) “Marital Status and Mortality
in the Elderly: A Systematic Review and Meta-Analysis,” Social Science & Medicine
64: 77–94.
Meer, J., Miller, D. L. and Rosen, H. S. (2003) “Exploring the Health–Wealth Nexus,”
Journal of Health Economics 22: 713–730.
Ng, Y. K. (1997) “A Case for Happiness, Cardinalism, and Interpersonal Comparability,”
Economic Journal 107: 1848–1858.
Oswald, A. J. (1997) “Happiness and Economic Performance,” Economic Journal 107:
1815–1831.
Palacios, R. and Sluchynsky, O. (2006) Social Pensions Part I: Their Role in the Overall
Pension System. SP Discussion Paper No. 0601, Washington, DC: The World Bank.
Pritchett, L. and Summers, L. H. (1997) “Wealthier is Healthier,” Journal of Human
Resources 31: 841–868.
Radloff, L. S. (1977) “The CES-D Scale: A Self-Report Depression Scale for Research in
the General Population,” Applied Psychological Measurement 1: 385–401.
Ross, C. E. and van Willigen, M. (1997) “Education and the Subjective Quality of Life,”
Journal of Health and Social Behavior 38(3): 275–297.
Sinn, H. W. (2004) “The Pay-as-You-Go Pension System as Fertility Insurance and an
Enforcement Device,” Journal of Public Economics 88: 1335–1357.
Stack, S. and Eshleman, J. R. (1998) “Marital Status and Happiness: A 17-Nation Study,”
Journal of Marriage and Family 60(2): 527–536.
Stewart, M. B. (2004) “The Employment Effects of the National Minimum Wage,”
Economic Journal 114: C110–C116.
Strully, K. W. (2009) “Job Loss and Health in the US Labor Market,” Demography 46:
221–246.
Subramanian, S. V. and Kawachi, I. (2004) “Income Inequality and Health: What Have We
Learned so Far?” Epidemiological Reviews 26: 78–91.
Thomas, D. and Strauss, J. (1997) “Health and Wages: Evidence on Men and Women in
Urban Brazil,” Journal of Econometrics 77(1): 159–185.
Tsutsumi, A., Kazunori, K., Theorell, T. and Siegrist, J. (2001) “Association Between Job
Stress and Depression Among Japanese Employees Threatened by Job Loss in a
Comparison Between Two Complementary Job-Stress Models,” Scandinavian Journal
of Work Environment and Health 27: 146–153.
Uchino, B. N. (2006) “Social Support and Health: A Review of Physiological Processes
Potentially Underlying Links to Disease Outcomes,” Journal of Behavioral Medicine
29: 377–387.
Wilkinson, R. G. (1996) Unhealthy Societies: The Afflictions of Inequality, London:
Routledge.
Wu, N. T. (1997) “The Ethnic Difference of Upward Social Mobility in Taiwan,” Taiwan:
A Radical Quarterly in Social Studies 1: 137–167.
THE IMPLICATIONS FOR HEALTH, DEPRESSION, AND LIFE SATISFACTION
335
Dow
nloa
ded
by [
Que
en M
arga
ret U
nive
rsity
] at
03:
05 0
2 Fe
brua
ry 2
015

NOTES ON CONTRIBUTORS
Fu-Min Tseng was appointed as a Research Fellow in Health Economics at the
IIHD in June 2013. He has previously worked as a Research Fellow at the
University of Dundee and a Research Assistant at the China Medical University,
Taiwan. Fu-Min’s research interests are Health Economics, Happiness Economics
and Policy Evaluation. He worked on exploring the socio-economic cost of
bereavement in Scotland and used NHS administrative data to explore the cost-
effectiveness of drug and alcohol treatment programmes when he was in Dundee.
Currently, he is working on exploring the impact of health system on household
financing in the countries that ever had conflict in the past decades. He is a
member of the ReBuild project.
Dennis James Petrie was appointed as a Senior Research Fellow in the Centre for
Health Policy, Programs and Economics (CHPPE) at the University of Melbourne
in 2012. For the 5 previous years, he was a Lecturer in Health Economics at the
University of Dundee, Scotland. He is also an Honorary Research Fellow at the
Health Economics Research Unit (HERU), University of Aberdeen. He has a dual
degree, B.Econ (Hons) majoring in Econometrics and a B.Sc. majoring in
Mathematics plus a Ph.D. in Health Economics from the University of Queensland
(UQ), Australia. He has worked on the economics of illicit drugs and alcohol, the
longitudinal measurement and evaluation of health inequalities, the economics of
bereavement, the impact of adherence and has been involved in a number of
economic evaluations of healthcare interventions. He has extensive experience in
analysing large and complex data-sets and is currently working on developing a
Type I diabetes model and modelling the impact of health insurance on those with
Type II diabetes.
REVIEW OF SOCIAL ECONOMY
336
Dow
nloa
ded
by [
Que
en M
arga
ret U
nive
rsity
] at
03:
05 0
2 Fe
brua
ry 2
015