the impacts of bank mergers on small firms
TRANSCRIPT
Working Paper Research
Staying, dropping, or switching : the impacts of bank mergers on small firms
by Hans Degryse, Nancy Masschelein and Janet Mitchell
October 2009 No 179

NBB WORKING PAPER No. 179 - OCTOBER 2009
Editorial Director
Jan Smets, Member of the Board of Directors of the National Bank of Belgium Statement of purpose:
The purpose of these working papers is to promote the circulation of research results (Research Series) and analytical studies (Documents Series) made within the National Bank of Belgium or presented by external economists in seminars, conferences and conventions organised by the Bank. The aim is therefore to provide a platform for discussion. The opinions expressed are strictly those of the authors and do not necessarily reflect the views of the National Bank of Belgium. Orders
For orders and information on subscriptions and reductions: National Bank of Belgium, Documentation - Publications service, boulevard de Berlaimont 14, 1000 Brussels. Tel +32 2 221 20 33 - Fax +32 2 21 30 42 The Working Papers are available on the website of the Bank: http://www.nbb.be. © National Bank of Belgium, Brussels All rights reserved. Reproduction for educational and non-commercial purposes is permitted provided that the source is acknowledged. ISSN: 1375-680X (print) ISSN: 1784-2476 (online)
NBB WORKING PAPER No. 179 - OCTOBER 2009
Abstract
Assessing the impacts of bank mergers on small firms requires separating borrowers with single versus multiple banking relationships and distinguishing the three alternatives of "staying," "dropping," and "switching" of relationship. Single-relationship borrowers who "switch" to another bank following a merger will be less harmed than those whose relationship is "dropped" and not replaced. Using Belgian data, we find that single-relationship borrowers of target banks are more likely than other borrowers to be dropped. We track post-merger performance and show that many dropped target-bank borrowers are harmed by the merger. Multiple-relationship borrowers are less harmed, as they can better hedge against relationship discontinuations. Key Words: Bank mergers, bank lending relationships, SME loans.
JEL Classification: G21, G28, G34.
Corresponding authors: Hans Degryse, CentER, EBC, TILEC, Tilburg University, e-mail: [email protected]. Nancy Masschelein, Financial Department, National Bank of Belgium and Financial Architects, e-mail:
[email protected]. Janet Mitchell, Financial Department, National Bank of Belgium and CEPR, e-mail:
[email protected]. We thank, for their comments, Allen Berger, Elena Carletti, Xiaoqiang Cheng, Astrid Dick, Steven Drucker, Ralf Elsas, Stijn Ferrari, Thierry Foucault, Paolo Fulghieri (the Editor), Vivek Ghosal, Reint Gropp, Ulrich Hege, Jan-Pieter Krahnen, Randall McFadden, Bertrand Melenberg, Steven Ongena, Evren Örs, Fabio Panetta, Manju Puri, Tony Saunders, Thierry Timmermans, Otto Toivanen, and two anonymous referees, as well as seminar participants at the Universities of Frankfurt, Granada, Köln, HEC-Paris, Maastricht, Tilburg, Vienna, and Wisconsin-Madison, the 41st Chicago Bank Structure Conference, the 2005 DIW Berlin-JFI-Philadelphia Fed Conference on “Bank Relationships, Credit Extension and the Macroeconomy”, the 2005 CEPR-CFS-NBB conference on “Competition, Stability and Integration in European Banking”, the First ProBanker Symposium in Maastricht, the 2005 CESifo Applied Micro workshop, the 2004 National Bank of Belgium conference on "Efficiency and Stability in an Evolving Financial System", and the 2004 CEPR European Summer Symposium in Financial Markets. Hans Degryse is also a CESIfo fellow and holds the TILEC-AFM Chair on Financial Market Regulation. Send correspondence to Hans Degryse, CentER-Tilburg University, Department of Finance, PO Box 90153, 5000 LE Tilburg, The Netherlands. Tel +31 13 4663188 ; Fax +31 13 4662875; e-mail: [email protected]. The views expressed in this paper are those of the authors and do not necessarily reflect the views of the National Bank of Belgium or those of the Institutions to which they are affiliated.

NBB WORKING PAPER - No. 179 - OCTOBER 2009
TABLE OF CONTENTS
1. Introduction.................................................................................................................................. 1
2. Banking environment and data sources ................................................................................... 4
2.1. Banking environment and bank-firm lending relationships ...................................................... 4
2.2. Data sources and summary statistics ...................................................................................... 5
3. Mergers and relationships: discontinuations versus drops and switches ........................... 7
3.1. Discontinuations versus continuations ..................................................................................... 7
3.2. Staying, dropping and switching ............................................................................................ 13
3.3. Multiple relationships, relationship intensity at the merging banks and overlap borrowers ... 16
4. The impact of "dropping", "switching" and "staying" on single-relationship borrower performance ............................................................................................................................... 17
4.1. Dropping versus switching versus staying ............................................................................. 18
4.2. The impact of bank mergers on small firms: Are "merger-induced" target drops harmful? ... 19
5. Conclusion ................................................................................................................................. 21
References ...................................................................................................................................... 23
Tables .............................................................................................................................................. 25
National Bank of Belgium - Working papers series .................................................................... 35
1
1. Introduction
Do bank mergers harm small firms? Do bank mergers result in lower credit availability for small firms? Although many papers have dealt with these questions, relatively few have made use of micro data on bank-firm lending relationships. Those that have done so have either not been able to provide definitive answers, or have faced data or methodological limitations that may call into question some of the insights established.
In this paper we introduce three important innovations that permit us to more accurately measure the impact of bank mergers on small firms. First, we distinguish between borrowers with single and with multiple bank lending relationships. For single-relationship borrowers it is also necessary to distinguish between the three alternatives of "staying," "switching," or "dropping" of bank-firm relationships following bank mergers. This contrasts with the two alternatives of relationship "continuation" or "discontinuation" that previous studies have considered.1 Second, we track firm performance during a three-year period following a drop, switch or stay for single-relationship borrowers. This allows us to measure the differing impacts of "staying", "dropping", and "switching" on small firms. Third, a potential concern in the analysis of the impacts of bank mergers is that target banks have become targets because they were failing to get rid of non-creditworthy borrowers. We therefore develop an econometric methodology to identify those relationship drops following a merger that are “merger-induced”; i.e., that would not have been predicted to drop if they were borrowing from a nonmerging bank. This allows us to further refine our evaluation of the impact of bank mergers on small firms.
We argue that our distinction between staying, dropping, and switching for single-relationship borrowers is necessary for gauging the effects of mergers on small and medium sized enterprises (SMEs), as it seems intuitive that SMEs with single bank lending relationships that discontinue the relationship with the merged bank but "switch" to another bank will be less harmed than similar firms that "drop" the relationship; i.e., that discontinue but cannot replace the lost relationship with a new one. The difference between dropping and switching is less important for multiple-relationship borrowers, as discontinuation of the relationship with the merged bank may simply indicate that the borrower is able to transfer its loan demand from the merged bank to another of its current lenders.
To estimate the effects of bank mergers on SME borrowers, we use detailed data on loan contracts to Belgian firms. Belgium, which experienced a significant wave of bank mergers in the period 1997-2003 and which also has a high proportion of SMEs with single relationships, offers an ideal setting for conducting our analysis.2 In addition, while it has been shown that in the US new, small bank entrants tend to fill the vacuum created after bank mergers (see e.g. Berger et al. 2004), small bank entry in Europe is much less prevalent. This further suggests that studying single-
1See e.g. Sapienza (2000) for an analysis of small firms, and Karceski, Ongena and Smith (2005) for an analysis of publicly listed firms. 2 The only other country for which firm-level data has been used to directly analyze the effects of bank mergers on SME borrowers is Italy. See Bonaccorsi di Patti and Gobbi (2007); Chionsini, Foglia and Marullo-Reedtz (2004) ; Sapienza (2002) ; and Panetta, Schivardi and Shum (2009). Papers that have considered the impact of bank mergers on firms in other countries are e.g. Berger et al. (1998), Berger, Demsetz and Strahan (1999), Berger et al. (2004), Drucker (2005), Erel (2009), Focarelli, Panetta and Saleo (2002), Scott and Dunkelberg (2003), and Strahan and Weston (1998).
2
relationship firms’ behavior is important for understanding the consequences of bank mergers on small firms.
Yet, distinguishing between single and multiple-relationship borrowers and drops versus switches is not sufficient for accurately measuring the impacts of mergers on SMEs. For example, we find that the single-relationship borrowers of the target bank in a merger are more likely to experience a drop of their relationship than are similar single-relationship borrowers of the acquiring bank or of nonmerging banks. This finding, however, does not prove that the borrowers dropped from the target bank suffer more than borrowers who switch from the bank or who stay on with the bank, nor does it demonstrate that the drops of borrowers from the target bank are socially inefficient. The drops may actually be related to adverse selection, in two potentially different ways. First, the single-relationship borrowers that drop their relationship with the merged bank may simply be firms which value bank debt less than the firms that do not drop; they may prefer to rely on other sources of finance following the merger. A second possibility is that the dropped target bank borrowers are actually non-creditworthy and should have been dropped earlier. Indeed, one of the motives for a merger may be that the target bank was lending to non-creditworthy borrowers and that the merger accomplishes a "cleansing" of the target bank's balance sheet. We need to rule out each of these possibilities in order to conclude that the borrowers of target banks are harmed by the merger.
In order to address the first possibility we track firm performance for three years following a drop, switch, or stay of single-relationship borrowers, and we compare the performance of the target-bank droppers following a merger with those that stay with or switch from the target bank. We perform a similar comparison for borrowers of acquiring banks and of nonmerging banks. We find that "droppers" from each type of bank are much more likely to enter bankruptcy than are the "switchers" or "stayers". In addition, in each group the median dropper that does not file for bankruptcy has a more negative change in its ratio of debt to assets, lower growth in total assets, and a more negative change in profitability than does the median stayer or switcher. These results suggest that droppers indeed fare worse than stayers or switchers. The borrowers that are dropped from the target bank following the merger do not appear to be dropping voluntarily or to value bank debt less than other firms.
In order to test the hypothesis of target bank cleansing, we compare the performance of the borrowers dropped from target banks with those dropped from acquiring or nonmerging banks. If the hypothesis of merger-related balance sheet cleansing is correct, the borrowers dropped from target banks should perform no better and perhaps worse in the three years following the drop than the borrowers dropped from other banks. We also refine the test by decomposing target droppers into two groups: "merger-induced" target droppers and "other" target droppers, where the firms in the former group would not have been predicted to drop in the absence of their affiliation with the target bank. We find that as a group, target bank droppers perform better on all of our measures than the droppers of other banks. In the refined test, we observe that the "other target droppers" exhibit similar performance as the nonmerging bank droppers, but the performance of the "merger-induced target droppers" is significantly better than for droppers from nonmerging or acquiring banks. These results allow us to conclude that at least some of the firms that are dropped from target banks following the merger, in particular those firms whose observable characteristics would not have implied a high probability of a drop, appear to have been harmed by the merger.
3
Our results suggest that previous authors may not have fully captured the impact on SMEs of merger-related relationship terminations. For example, Bonaccorsi di Patti and Gobbi (2007), which is the only other paper to have evaluated borrower performance following bank mergers, employs Italian credit register data and finds that relationship termination after bank mergers has only a very limited negative effect on credit availability in the short run, and no effect in the longer run. These authors do not find stronger impacts of termination on firms that are small or on firms that have relationships with fewer banks.
We argue that the analysis in Bonaccorsi di Patti and Gobbi (2007) is potentially incomplete, for two reasons. First, the number of lending relationships in Italy is considerably higher than in many other countries.3 An important implication is that in Italy the shock from the termination of a lending relationship will be unusually small, since most firms will borrow only a small proportion of their total loans from a merging bank. This implies that terminations in the Italian setting are almost identical to switches. More importantly, the effect of termination for firms that are borrowing a considerable part or even all of their total loans from a merging bank and therefore for which termination would be a significant shock is not well identified. This is precisely where our paper comes in.
A second aspect of the analysis of Bonaccorsi di Patti and Gobbi (2007) is that firms are only in their dataset when the firms are included in the credit register. While it is probably less of an issue for firms with multiple bank relationships, firms with only one relationship that face a termination may not always switch to another bank and may therefore disappear from the credit register dataset. This outcome is not taken into account, as effects of relationship terminations are measured for "surviving" firms only. This survivorship bias may help to explain why Bonaccorsi di Patti and Gobbi (2007) fail to find larger merger effects for firms that are small and depend on fewer banks. Our tracking of firm performance includes firms that have exited the credit register dataset. Our results highlight the importance of including "non-surviving" firms when estimating the effects of bank mergers.4 Our analysis also introduces some innovations with respect to multiple-relationship borrowers. In particular, we take account of the intensity of the relationship with a given lender (measured as the proportion of the firm's total loans borrowed from that bank), which can reflect the degree of information exchange between the borrower and the lender and which is likely to be an important determinant of the likelihood of relationship continuation. We also distinguish borrowers with lending relationships with both merging banks ("overlap" borrowers) from borrowers of only one of the merging banks. We argue that the overlap borrowers are less likely to be negatively affected by a merger.
3 Belgium is not exceptional in having a significant proportion of firms with single bank relationships. In fact, many countries report relatively high percentages of small firms with single bank relationships. For example, statistics for France indicate that about 60% of firms having sales of less than 2.5 million € have only one bank lending relationship (Dietsch and Golitin-Boubakari 2002). In Portugal, about 57% of firms has a unique relationship (Farinha and Santos 2000). In Spain, around 50% of firms has a single bank relationship (Montoriol-Garriga 2006). For the US, Detragiache, Garella and Guiso (2000) report that 44% of small firms had a single bank relationship in 1988. 4 Karceski, Ongena and Smith (2005) study the impacts of bank mergers on Norwegian publicly listed firms. Although these firms typically have few bank relationships, they have access to public funds; therefore, the impact of relationship terminations would be expected to be lower than for nonlisted firms.

4
We find that, among multiple-relationship borrowers, the target bank borrowers have a higher discontinuation rate than do nonmerging bank borrowers, whereas the acquiring bank borrowers have a lower discontinuation rate than nonmerging bank borrowers.5 Overlap borrowers have the lowest discontinuation rates of all groups. Relationship intensity also plays a role in the effects of mergers. Whereas a higher relationship intensity with a bank generally translates into a lower discontinuation rate, borrowers with high relationship intensities with the target bank are more strongly affected by mergers. In addition, among overlap borrowers, discontinuation rates are higher for those with very high intensity with the target bank and, by implication, low intensity with the acquiring bank. The remainder of the paper is organized as follows. Section 1 describes the Belgian banking environment and discusses data sources. Section 2 presents results concerning relationship discontinuations, as well as drops and switches. To avoid repetition, we discuss hypotheses, regression specifications and results concurrently. Section 3 examines the relative performance of single-relationship stayers, switchers, and droppers. Section 4 concludes. 2. Banking environment and data sources In this section we provide information about the Belgian banking environment during the period covered by our analysis (1997-2003) and about our data sources. 2.1. Banking environment and bank-firm lending relationships Banks accounting for 61% of total banking assets were involved in mergers between 1997 and 2003, and concentration in the Belgian banking sector steadily increased during this period, to a very high level. On the basis of data from the Belgian credit registry, the Herfindahl index increased from 0.12 to 0.22 over the period. Similarly, the market share of the four largest banks (C4) increased from 58% to 88%.6 We have also computed C4 for the three size categories corresponding to the definitions of the Basel II framework: retail SMEs; corporate SMEs; and corporates.7 Between 1997 and 2003 the C4 for "retail SMEs" increased from 78% to 91%; for "corporate SMEs", from 71% to 91%; and for "corporates" from 50% to 78%. These statistics indicate that large banks were active in lending to SMEs prior to and following the merger wave.
5 Our finding that target bank borrowers have higher discontinuation rates than acquiring bank borrowers is in line with results reported by Sapienza (2002), Karceski, Ongena and Smith (2005), and Carow, Kane and Narayanan (2006). 6 Cetorelli and Gambera (2001) report the three-bank concentration ratios in different countries over the period 1989-1996. They find that the three largest banks account for 49 percent of total assets in Belgium, 15 percent in the US, 24 percent in Italy, 27 percent in Germany, and 50 percent in the United Kingdom. Of course, in countries like the US or Italy, banks concentrate their activities in specific geographic areas, implying that some local markets are also highly concentrated in these countries. Nevertheless, the evidence by Cetorelli and Gambera (2001) illustrates that the Belgian market was already quite concentrated before the starting date of our sample. 7 Corporates are defined in the Basel II framework as firms with greater than 50 million € in annual sales; SMEs have sales below 50 million €. Retail SMEs are those SMEs for which the total exposure of any single banking group to the firm is less than 1 million €.
5
Belgian firms maintain relatively few bank lending relationships.8 The mean number dropped steadily over time from 1.3 in 1997 to 1.21 in 2003. The number increases in firm size: in 2003 the mean number of relationships was 1.17, 1.72 and 2.3 for retail SMEs, corporate SMEs and corporates respectively.9 At the end of 2003, 83 percent of the firms in the credit register had single bank relationships. 2.2. Data sources and summary statistics We rely on three sources of data for our regression analysis:
(1) Data from the Belgian credit register, which contains information on loans to Belgian firms granted by banks operating in Belgium.10 Our data cover the period 1997-2003 and contain both authorized and utilized volumes by bank. The banks represented in the data include all domestic banks and foreign banks having a subsidiary or physical branch in Belgium, which had either authorized or outstanding loans during the period to Belgian non-financial firms. Loans to Belgian firms that were extended by foreign banks that are located outside of Belgium are not included in the data set. The credit register contains no data on interest rates or collateral. Banks obtain aggregate information from the credit register about their own borrowers or loan applicants.
(2) Firm balance sheets. These data come from firms' annual balance sheet filings during the period 1994-2006.11
(3) Bank balance sheets. These contain annual balance sheet data, which banks are required to report under the Supervisory Reporting Scheme. These data are available from 1992-2003.
Because the credit register data include only banks operating on Belgian territory and thus exclude loans to Belgian firms from foreign banks operating outside of Belgium, it is possible that the number of bank relationships for large firms is understated. This suggests restricting our attention to small and medium-sized firms. In all of the analysis that follows, we have excluded all firms meeting the Basel II classification of "corporate" (i.e., with sales exceeding 50 million €), as well as all firms with assets exceeding 500 million €.
8 A relationship exists when firms are “currently” borrowing from a bank. This relationship measure may be narrower than the ones used in other, survey-based studies looking at the number of relationships in Belgium, where also “past” lending or other services may be taken into account (see e.g. Ongena and Smith 2000; or de Bodt, Lobez and Statnik 2005). 9 Data also confirm the steady decline in the average number of lending relationships across all size categories of firms. For example, the average number of lending relationships for all firms in each of the years 1997-2002, respectively, are: 1.28; 1.26; 1.25; 1,23; 1,22. In previous work (see Degryse, Masschelein and Mitchell 2004), we have investigated the determinants of the number of firm-bank relationships for the years 1997 and 2002. The determinants were quite stable over time, suggesting that other structural changes in the financial sector may explain the drop in the number of relationships. 10 Banks must report to the Belgian credit register information relating to total exposures to individual firms above 25,000 €. As a point of comparison, the reporting requirement for the Italian credit register is about 75,000 €. Around 45% of firms in our sample have total exposures < 75,000€. 11 Small and medium-size firms in Belgium are allowed to file a short balance sheet form, which is less complete than the long form required for large firms. Hence, certain data such as sales and number of employees (for which reporting is voluntary on the short form) are not available for all firms. As a result, we rely on the book value of assets as a measure of firm size.
6
We construct a panel consisting of observations of firm-bank lending relationships in December of each of the years 1997-2003. Like Sapienza (2002), we focus on "continuing" firms that is, firms that had at least one bank lending relationship at the beginning of the panel; i.e., in December, 1997. These firms are included for every year of the panel, unless the relation is terminated, in which case the observation disappears. Because we are interested in observing the effects of mergers on firms that were borrowing from merging banks prior to the merger (and comparing them with firms borrowing from nonmerging banks prior to the merger), it would bias our results to include newly entering firms into the panel during the year of a merger.
TABLE 1 HERE
Panel A of Table 1 presents summary statistics for the firms in our panel. This panel shows that the median firm has an age of about 12 years (AGEF) ; total assets of 501,000 € in 2002 € (ASSETF); a return on assets of about 5.4% (ROAF); and leverage – defined as the book value of debt over assets – of 75 % (LEVERAGE). Panel A of Table 1 also reports summary statistics for different groups of firm-bank relationships: firms borrowing from an acquiring bank in a merger (but no other bank involved in the merger); firms borrowing from a target bank in a merger (but no other bank involved in the merger); firms borrowing from both the acquiring and a target bank in a merger ("overlap" borrowers). This panel indicates relatively few differences in the characteristics across groups. Firms borrowing from target banks are somewhat younger and have slightly higher leverage than other firms. Target and acquiring bank borrowers are equally as profitable as non-merging bank borrowers. Overlap borrowers are older and considerably larger than other firms; however, their profitability and leverage are similar to the values for firms in other groups. Our analysis focuses on all mergers that occurred during the 1997-2003 window. We include all mergers where acquirer and target are reporting to the credit registry, which amounts to eight mergers, all of which were "in-market" mergers. We take the date of the merger as that on which the merged bank began providing unified credit statistics to the credit register, which is the date of the legal merger. Our classification of whether a bank is an acquirer or target is based on the classification provided by the Belgian Banking and Finance Commission (CBFA) in their annual reports. By far, the three most important mergers are those related to the creation of KBC, Fortis and Dexia. Each of these three mergers eventually resulted in a reduction in the number of branches of the consolidated bank by almost one half, mainly due to geographical overlap of branches. Interviews with representatives of the merging banks indicated that, although no specific closure policy relating to acquiring versus target bank – was pursued, it was often more likely that, due to the larger size of the acquiring bank: (1) the branch of the acquiring bank was kept on, as the space in that branch was large enough to physically accommodate the activities of the consolidated branches; and (2) the branch head often came from the acquiring bank, because this person had experience in overseeing a larger group of relationship managers. The interviewees revealed no explicit merger motives. Panel B of Table 1 reports bank characteristics for all banks in our panel and for the acquiring and target banks at the time of the merger. We observe that acquiring banks, and to a lesser extent target banks, are larger than other banks in the sample (ASSETB). Both acquiring and target banks have higher returns on assets (ROAB), higher ratios of liquid assets to total assets (LIQB), and lower operating cost ratios than do nonmerging banks (OPCOSTB). These statistics suggest that the
7
mergers we analyze were not motivated by underperformance of the target banks, an issue we will investigate in more detail in subsection 3.2.12
3. Mergers and relationships: discontinuations versus drops and switches In this section we investigate borrower continuations (i.e., "stays") versus discontinuations (Subsection 2.1), as well as stays versus drops versus switches (Subsection 2.2). Subsection 2.3 investigates the impact of relationship intensity for multiple-relationship borrowers of merging banks and of overlap borrowers. We perform panel regression analysis to investigate merger effects. This allows us to identify "combined" effects for all mergers, to control for time effects, and to differentiate short-term from longer-term merger effects.
In our empirical work, we consider single-relationship borrowers (single rel.) and multiple-relationship borrowers (multiple rels.) separately, as well as all borrowers together (All).13 Borrowers with multiple relationships may be better able to hedge against a negative change in lending policy of the merged bank by simply transferring their loan demand to their other current bank lenders.14 Furthermore, one might argue that if firms can anticipate that shocks to banks (for example bank mergers) may have more important negative effects for single-relationship borrowers, then "weaker" firms might choose to go for multiple banking relationships whereas "stronger" firms might go for single relationships. This would suggest that the choice between single and multiple bank relationships might be endogenous.
At the same time, firms may want to establish multiple relationships but not be able to do so because they are informationally held up (see e.g. Rajan 1992). In our empirical work, we therefore also investigate whether the choice of single versus multiple bank relationships is endogenous. As reported below, we perform the Rivers-Vuong test as described in Wooldridge (2002) and find that we cannot reject the hypothesis of exogeneity of the single-relationship dummy variable. 3.1. Discontinuations versus continuations
Regression specification. We first distinguish, as in previous literature, between firms
discontinuing a bank lending relationship and firms continuing with their bank. We estimate the following logit specification (similar to Sapienza 2002):
12 As is suggested by panel B of Table 1, some mergers involved two target banks, which each time had a very similar size. This makes it impossible to do any tests for within-merger differences in impact of differently sized target banks. 13 The reader may notice that our sample splits (single relationships and multiple relationships) allow firms to move from one sample to another sample due to merger related effects. If a firm was borrowing from only two banks, both of which were involved in a merger, then the firm automatically has a single relationship after the merger (if its lending relationship is not severed). We control for this effect by classifying firms according to the number of lending relationships prior to the merger. 14 In the context of banks facing liquidity shocks, Khwaja and Mian (2008) find that only firms with multiple banking relationships are able to fully compensate for the liquidity shock by borrowing from more liquid banks.
8
,)()()1(1
)1(ln
1-kt171615
143210
iktitiktiktikt
iktiktiktiktikt
ikt
lsbankcontrolsfirmcontroCONCACQTARGTARG
ACQACQTARGTARGACQEDISCONTINUp
EDISCONTINUp
(1) where each observation represents a firm-bank relationship and where iktEDISCONTINU equals
one if during the twelve months following time t, the relationship between firm i and bank k was discontinued. Previous studies report that borrowers at target banks relative to acquiring banks are more likely to see their relationship negatively affected by a merger (e.g. Sapienza 2000; Karceski, Ongena and Smith 2005). Borrowers of target banks are more likely to see their relationship discontinued when: (1) prior to the merger the target bank was granting below-cost loans; or (2) the merged bank adopts the strategic focus and the organizational structure of the acquiring bank (Peek and Rosengren 1996; Houston, James and Ryngaert 2001). Also, soft information available at the target bank may be lost if key employees leave, or move within the merging bank (see Petersen 2004, on soft information).
We therefore introduce several dummy variables capturing borrowing from acquiring and target banks. iktACQ is a dummy variable which equals one if firm i was borrowing at time t from
acquiring bank k which was involved in a merger in the twelve months following time t, and if firm i was not borrowing from any of the other banks involved in that merger. iktTARG is defined in a similar way. iktACQTARG is a dummy variable equal to one if firm i borrowed from bank k
involved in a merger in the following twelve months and firm i was an overlap borrower; that is, the firm was borrowing from, in addition to bank k, at least one of the other banks involved in that merger. These three variables allow us to distinguish the effects of mergers for firms borrowing from an acquiring bank, a target bank, or both acquiring and target banks, respectively. Because all of the mergers occurred roughly in the middle of a year, using observations in December in each year for the panel allows us to measure the "short-term" merger effects as those occurring in a twelve-month period around the merger, including six months following the merger. That is, if a merger occurred in June, 1998, the value of iktACQ (together with DISCONTINUE)
for t = December, 1997 indicates whether the firm was borrowing from an acquiring bank (but no other bank involved in the merger) and lost its relationship or not with the merged bank in the period which covers six months following the merger. To investigate "longer-term" effects of mergers, we introduce the dummy variables
1iktACQ , 1iktTARG and 1iktACQTARG , which are defined similarly to the short run merger
variables but which equal one when firm i was borrowing from the respective merging bank(s) at time t-1 (and when the merger occurred between time t-1 and t), respectively.15 These dummy variables capture the effects of mergers during the period of six to eighteen months following the merger, which we call from now on longer-term effects. Because the short-term dummy variables cover a very short period following the merger, we expect the longer-term dummy variables to provide a "cleaner" measure of the merger effects. The short duration of our panel, combined with
15 For the example of the June, 1998 merger the variable ACQikt-1 would equal one for the observation t = Dec., 1998 for firms that had been borrowing from the acquiring bank in Dec., 1997 and no other bank involved in the merger.
9
the large proportion of banking assets involved in mergers, prevents us from estimating merger effects over a longer period. We include firm and bank control variables in all regressions, as well as industry and year dummies. As firm controls we include measures of firm age, size, profitability, leverage, and year of most recent filing of balance sheet. The motivation for these control variables comes from the previous banking and bank merger literature (see e.g. Farinha and Santos 2002; Detragiache, Garella and Guiso 2000; Ongena and Smith 2000), as well as our own estimates with Belgian data. Bank controls include measures of size, profitability, cost efficiency, bad loans, and liquidity. For example, Detragiache, Garella and Guiso (2000) argue that bank liquidity is important for the continuation of firm-bank relationships. Berger et al. (2005) find that large U.S. banks tend to have shorter relationships. Year and industry dummies are introduced to control for business cycle effects and industry effects, respectively, and should also control for changes in the competitive environment over time.
Empirical results. Panel A of Table 2 presents the results of the logit regressions for the different samples. All reported coefficients are the marginal effects on the probability of discontinuing the lending relationship.16
TABLE 2 HERE
The average discontinuation rate in our sample is 11.1 percent for the "All" sample, 10.8 percent for the single-relationship sample and 11.4 percent for the multiple-relationship sample.17
We concentrate our discussion on the "All" sample, where we first treat the number of relationships as exogenous. Potential endogeneity of the number of relationships is dealt with in Panel B of Table 2. Results for the single and multiple-relationship samples for this logit specification are similar. We start our discussion of the results by the firm and bank controls. This allows us to "benchmark" the economic relevancy of our merger effects to the economic importance of the firm and bank control variables. Firm controls. All of the firm control variables with the exception of firm age (ln(AGEF)) are statistically significant, and they are also economically relevant. The discontinuation rate decreases with firm size (ln(ASSETF)), firm profitability (ROAF), and leverage (LEVERAGE). An increase in the log of firm assets by one standard deviation from its mean causes the probability of losing a lending relationship to decrease by 3.1 percentage points (computed as the product of the marginal probability and the standard deviation of the variable, and reported in the column "impact of "). This result contrasts with results obtained by Sapienza (2002), who finds a positive relationship between firm size and discontinuation rate, but the result is in line with Karceski, Ongena and Smith
16 The marginal effects are calculated holding all other variables at their average values. 17 In line with this rate, Degryse and Van Cayseele (2000) and Degryse and Ongena (2005) report a mean duration of the lending relationship for Belgian firms of 7.87 years. A 11.1 percent drop translates into a median duration of the lending relationship in between 5 to 6 years, when assuming constant duration dependence. For comparison, the drop rate in Karceski, Ongena and Smith (2005) is 6.9 percent and only 3 percent in Sapienza (2002). Our much higher drop rate than the rates in these two studies is explained by the small size of firms in our sample, due to the low threshold loan volumes for inclusion of borrowers in the credit register. When we restrict our sample to firms whose loan values would qualify them for inclusion in the Italian credit register, we have a discontinuation rate of only 5.6%.
10
(2005). Smaller firms in our sample tend to have less stable relationships with their banks than do large firms.18 As expected, higher firm profitability (ROAF) reduces the discontinuation rate. An increase of ROAF by one standard deviation from its mean lowers the discontinuation rate by 0.7 percentage points. Firms with higher LEVERAGE have lower discontinuation rates; however, firms that are too highly levered (those with negative equity; NEGEQ=1) have higher discontinuation rates. Firms that have not yet filed a full-year balance sheet (YOUNG=1) and firms which have halted filing balance sheets (RECBALANCE=0) are also more likely to have their relationship discontinued. In sum, these results clearly indicate that firm variables are important in explaining discontinuation of lending relationships. Bank controls. All bank controls are statistically significant, although not all of these variables are economically important. Panel A of Table 2 shows that borrowers of larger banks tend to have a lower discontinuation rate (ln(ASSETB)): a one standard deviation increase in bank size from its mean lowers the discontinuation rate by 2.3 percentage points. This result contrasts with the findings of Berger et al. (2005), who report that in the U.S., larger banks tend to have shorter relationships with borrowers than do smaller banks. How can these different findings be reconciled? Berger et al. (2005) interpret their findings as evidence that small banks are better able to handle soft information. This type of information binds a borrower to its bank over time and leads to longer relationships and lower discontinuation rates. Since borrowers of large banks in our sample appear to have lower rates of discontinuation, our evidence suggests that large banks in Belgium may also deal with soft information. This is consistent with our earlier observation that large Belgian banks are important in lending to SMEs.
Firms borrowing from more liquid banks (LIQB) and banks with fewer bad loans (BADLOANSB) exhibit lower discontinuation rates. The return on assets of banks (ROAB) has a (counterintuitive) positive coefficient, but its economic impact is negligible. Finally, the operating cost ratio of banks (OPCOSTB) appears in the different regressions with different signs and also is not economically relevant.
Merger effects. We focus on the longer-term merger effects, as we believe these effects to be more robust measures than the short-term effects of the impacts of mergers. The observed short-term merger effects are nevertheless broadly consistent with the longer-term effects, with only a few exceptions. Panel A of Table 2 reveals that firms borrowing from an acquiring bank (ACQt-1) have a lower probability (-2.2 percentage points) of losing their relationship during the six to eighteen months following a merger than do borrowers of nonmerging banks. In contrast, firms borrowing from a target bank (TARGt-1) have a higher longer-term discontinuation rate (+8.5 percentage points) than otherwise identical nonmerging bank borrowers. Finally, overlap borrowers (ACQTARGt-1) have a noticeably lower discontinuation rate ( 6.7 percentage points) than firms borrowing from nonmerging banks. These effects are considerable compared to the other explanatory variables. The merger results from Panel A of Table 2 provide support for the idea that relationships are more likely to be discontinued for target bank borrowers than for acquiring bank borrowers, and they are consistent with the findings of Sapienza (2002) and Karceski, Ongena and Smith (2005), who
18 This result reflects in part the fact that very small firms are included in the Belgian credit register. For example, when we restrict our sample to those firms satisfying the requirement for inclusion in the Italian credit register, the relationship between size and discontinuation rate becomes positive.
11
report that following a merger, borrowers from target banks in Italy and Norway, respectively, are more likely than other borrowers to lose their relationship. However, neither of these studies finds the rate of termination of bank lending relationships for acquiring bank borrowers to be much different from the rate for borrowers of nonmerging banks. We observe lower discontinuation rates for borrowers of acquiring banks than for nonmerging bank borrowers, in addition to the heterogeneous effects between acquiring and target banks. We also investigate the impact of “overlap” borrowers. We expect a lower likelihood of relationship discontinuation for several reasons. First, as the number of firm-bank relationships "mechanically" decreases with a merger, overlap borrowers have incentives to increase this number again (see e.g. Carletti 2004; Detragiache, Garella and Guiso 2000) on the optimal number of relationships). Second, by combining information from all of the merging banks, mergers may also improve the merged bank’s information about borrowers.19 Our results in panel A of Table 2 show that overlap borrowers (ACQTARG) have a lower discontinuation rate than firms borrowing from a single merging bank. Neither Sapienza (2002) nor Karceski, Ongena and Smith (2005) treats overlap borrowers separately from other merging bank borrowers. Relationship Intensity. The "intensity" of the relationship, CONC, as measured by the proportion of firm i’s utilized loans accounted for by bank k, is also likely to play a role for multiple-relationship borrowers. We expect firms with higher relationship intensity to be less likely to discontinue this relationship. Panel A of Table 2 provides support for this conjecture. For the multiple relationship firms in our panel, the variable CONC has a mean of 0.44 and standard deviation equal to 0.33. (CONC is equal to 1, by definition, for single-relationship firms.) A one-standard deviation increase in CONC above the mean causes the discontinuation rate to fall by 5.9 percentage points. This is about twice the impact of firm size.
Interestingly, the "All" regression in Panel A of Table 2 also provides some evidence in support of our claim that single-relationship banks should be treated separately from multiple-relationship banks. Despite the fact that single-relationship borrowers have, by construction, a value of CONC equal to one, the single-relationship dummy in the "All" sample is significantly positive (the coefficient equals +6%). This suggests that the relationship of a single-relationship borrower with its bank is qualitatively different from a very highly concentrated lending relationship between a multiple-relationship borrower and one of its banks, at least in terms of the impact on the probability of discontinuation.
Endogenous choice of number of relationships. As discussed above, it is possible that the number of relationships is endogenous because firms consider the costs and benefits of single versus multiple bank-firm relationships when choosing their number of relationships. Panel B of Table 2 investigates this issue. The standard two-stage least squares method is not appropriate for taking account of the potential endogeneity, since the dependent variable "DISCONTINUE" is binary. We therefore implement the procedure for discrete binary variables with an endogenous explanatory variable as explained in Wooldridge (2002), p. 474-478 (his procedure 15.1), implementing the 19 Panetta, Schivardi and Shum (2009) argue that the consolidated bank should be able to better tailor interest rates of firms borrowing from several merging banks to the firm's riskiness, either as a result of improved informational abilities in distinguishing borrower quality or the pooling of information by the merging banks. Finally, an opposite force is that outside banks bidding for borrowers having loans with two of the merging banks now face an increased winner’s-curse effect, which yields the consolidated bank additional market power (see e.g. Hauswald and Marquez 2003; or von Thadden 2004).
12
Rivers-Vuong test. Wooldridge develops this procedure for continuous endogenous explanatory variables but mentions that the test for exogeneity can be employed very broadly, even if the potentially endogenous explanatory variable is binary. This is precisely our case, since we have a dummy variable "Single rel dummy" which equals one when the firm maintains only one relationship and zero when it maintains multiple relationships. We need to turn to a probit model for "DISCONTINUE" as this procedure is developed for probit only. In particular, Wooldridge’s procedure 15.1 suggests to run in a first step an ordinary least squares regression with the single relationship dummy as the dependent variable and save the residuals. In a second step a probit "DISCONTINUE" is run on the exogenous variables, the single rel dummy, and the saved residuals from the first-step regression to get consistent estimates. Technically, we estimate the following equations
iktiktikt controlsdummyrelSingle 111 , (by OLS) (2)
and iktiktiktiktikt vdummyrelSinglecontrolsFEDISCONTINUP 1121211 , (3)
where F (.) is the standard normal distribution, leading to our probit specification. As controls in the probit, we employ all the variables already discussed above, except for the age
of the firm (lnAGEF) which turned out not to be significant for the "All" sample (as was also the case in Sapienza (2002)). We employ age of the firm as well as the proportion of bank debt/ total debt (PROPBANKDEBT) as exclusion variables, i.e. they are only in the Single rel. dummy equation. From Ongena and Smith (2000), for example, we expect that older firms hold more relationships. Furthermore, firms with more bank debt would be willing to choose more relationships when they place more weight on having several bank-firm relationships. For the Single relationship dummy equation, the same firm and bank controls have been shown to be relevant. The second column in Panel B reveals that older (ln(AGEF) and larger (ln(ASSETF)) firms indeed maintain fewer relationships. Also firms borrowing from larger banks (ln(ASSETB), banks with more bad loans (BADLOANSB) or less liquidity (LIQB) maintain fewer relationships. The variable PROPBANKDEBT turns out to be insignificant. The results of our probit regression (first column of Panel B) have a comparable economic and statistical effect as the findings we reported with our logit specification. More importantly, our probit regression allows us to perform the Rivers-Vuong test. That is, we test the null hypothesis that the single relationship dummy is exogenous in the DISCONTINUE decision. We test this by adding the residual of the Single rel. equation, 1̂v , in the DISCONTINUE regression and testing whether 1̂v is statistically significant or not in our probit
specification. It turns out that we cannot reject the null hypothesis that the Single rel. dummy is exogenous in our model, since the coefficient on 1v is not significant (p-value of 0.786).20 In the
remainder of the paper, we treat the choice of the number of relationships as exogenous, and only focus on the results for the subsamples of single and multiple relationships.
Firm Size and Mergers. The size-effect of lending suggests that small borrowers might be more affected than large borrowers by bank mergers. (see e.g. Stein 2002). Mergers increase bank size, and larger banks typically have a more hierarchical organization than small banks. Large banks 20 We also implemented the following: (1) employed PROPBANKDEBT as the only exclusion variable; (2) experimented with a standard Durban-Wu-Hausman test in the framework of a linear probability model; and (3) took the number of relationships as variable (in stead of the Single rel. dummy), but all results suggest that Single rel. dummy is exogenous for our purposes.
13
therefore may concentrate on larger firms, and raise the cost of lending to small businesses (see e.g. Strahan and Weston 1998; Peek and Rosengren 1996; or Berger et al. 2005). We address this by interacting firm size (ln(ASSETF) with the merger variables.21 Table 3 displays the results for the All, single-relationship, and multiple-relationship samples. We focus our discussion on the longer-term merger effects. For the multiple-relationship sample, the negative sign on the interaction term ACQt-1*ln(ASSETF) indicates that large, multiple-relationship acquiring borrowers are less likely to discontinue their relationships than are small acquiring borrowers. This difference does not appear to hold for the single-relationship acquiring borrowers. Thus, large, multiple-relationship acquiring borrowers benefit more from the lower discontinuation rate after a merger than do their smaller counterparts. This is consistent with the idea that mergers give banks a greater comparative advantage in lending to large firms. It is also consistent with results reported by previous studies.
TABLE 3 HERE
The results for target-bank borrowers, however, paint a different picture. Whereas large, multiple-relationship target borrowers have lower discontinuation rates than do their smaller counterparts, large, single-relationship target borrowers have a higher discontinuation rate. Switching costs could potentially explain this divergence: large, single-relationship target borrowers may switch banks more often than do smaller single-relationship target borrowers. We will test this conjecture using a multinomial logistic framework, an issue to which we turn in Subsection 2.2. 3.2. Staying, dropping and switching Regression specification and motivation. The impact of a relationship discontinuation hinges on whether discontinued borrowers can switch banks or are dropped. Karceski et al (2005) point to the importance of switching costs in determining the differential impacts of a merger on borrowers. (See also Kim, Kliger and Vale 2003 and Klemperer 1995.) Switching costs determine how advantageous it is for firms to switch banks versus being locked-in.22 Indeed, ceteris paribus, borrowers that switch following a relationship discontinuation have lower switching costs than those who drop, and potentially those who stay. On the other hand, if the merged bank applies different post-merger interest rates to different borrowers (e.g., target borrowers face higher interest rates than acquiring bank borrowers), then it will not automatically be the case that switching borrowers are harmed less than borrowers who stay. Nevertheless, borrowers that drop will suffer the greatest negative impact on returns due to the merger (see our working paper version for a stylized model illustrating this result).
In brief, we expect that relationship "drops" are likely to be more harmful than "switches" for single-relationship borrowers. This is the motivation for our second regression specification, which is a multinomial logistic model where the response variable iktY takes on the following values :
21 We have also run similar regression interacting the merger variables with firm profitability; however, we obtained no significant results. 22 Firms face different kinds of switching costs. “Informational” switching costs stem from the fact that an inside bank possesses an informational advantage vis-à-vis outside banks. Firms willing to switch banks might be perceived of lower quality and therefore pay a higher loan rate. “Transactional” switching costs refer to higher costs that are incurred in visiting another bank. Examples of the latter are differences in geographical convenience, paperwork, different standards at banks etc.
14
0 if firm i STAYED with (i.e., continued borrowing from) bank k in the twelve months following time t, 1 if the relationship between firm i and bank k was discontinued but the firm SWITCHED to another bank in the twelve months following time t, and 2 if firm i DROPPED, i.e. the relationship with bank k was discontinued and the firm did not substitute a new bank relationship for the discontinued one. Formally, we have
,)()()0()(ln
1-kt171615
143210
iktitiktktikt
iktiktiktiktikt
ikt
lsbankcontrolsfirmcontroCONCACQTARGiTARG
ACQACQTARGTARGACQYp
mYp (4)
for m = 1, 2. STAYED is thus the base case in our multinomial logit regression. Empirical results. The results of our multinomial logit regressions are reported in Table 4. The coefficients (coef.) are to be interpreted as the marginal probabilities compared to the base case of a relationship continuation ("STAYED"). For all variables, we report again the impact of a one standard deviation change (impact of ) in the respective variable computed as the product of the marginal and the standard deviation, where for the dummies we report a change in the variable from zero to one. Results are reported separately for single-relationship and multiple-relationship borrowers.
TABLE 4 HERE
We limit our discussion to the merger variables of interest, since the bank and firm control variables have similar signs and magnitudes as in the regressions of Table 2. As before, we focus on the longer-term merger effects. We are particularly interested in the results for single-relationship target borrowers: do those that discontinue their relationship "switch" or "drop"? Our results provide a clear answer to this question: single-relationship target borrowers are much more likely to drop (by 9.8 percentage points in the longer run) than are otherwise similar borrowers of nonmerging banks. Single-relationship target borrowers, however, are only slightly more likely to switch than are similar borrowers of nonmerging banks; i.e., by 0.3% in the longer run. The single-relationship acquiring bank borrowers exhibit very different behavior. Acquiring bank borrowers are less likely to drop or to switch than are nonmerging borrowers, and the magnitude of the difference in drops is only slightly stronger than for switches (-1.1% versus -0.6%). The results of Table 4 offer some initial support for the conjecture that single-relationship target borrowers are more harmed by mergers than are single-relationship acquiring borrowers. Moreover, the impact of mergers on single-relationship target borrowers appears to be particularly strong, as these borrowers are much more likely to drop than to switch. Similar results hold for multiple-relationship borrowers; however, as discussed earlier, the implication of dropping versus switching is much less clear than for single-relationship borrowers. In fact, the observation from Table 2 that multiple-relationship target borrowers have a significantly greater likelihood of relationship discontinuation (be it through a drop or a switch) than do multiple-relationship acquiring borrowers already suggests that these target borrowers are more harmed by mergers than are the acquiring borrowers.
15
Finally, Table 4 indicates that overlap borrowers are considerably less likely to drop (–3.6% in the longer run) than are similar multiple-relationship borrowers of nonmerging banks. Overlap borrowers are neither more nor less likely to switch than nonmerging bank borrowers. On average, overlap borrowers thus appear to be the least harmed by mergers. There nevertheless remains a question as to whether overlap borrowers might be more inclined than other borrowers to add a new relationship, in order to make up for the artificial "fall" in their number of relationships due to the merger. We find (in unreported descriptive statistics) that overlap borrowers are somewhat more inclined to add a relationship: 9% of overlap borrowers add a new relationship in the 18 months following the merger, compared to 4% of multiple-relationship nonmerging bank borrowers. Firm size and Mergers. Table 5 presents the results of the multinomial logit regression with the merger dummies interacted with ln(ASSETF), for the single-relationship and multiple-relationship samples. The results for single-relationship borrowers indeed appear to confirm our hypotheses. Large, single-relationship target borrowers are more likely to switch (coefficient 0.002**) and less likely to drop (coefficient of -0.013***) than are the small target borrowers. Hence, large, single-relationship target borrowers appear to be less harmed by mergers than are small, single-relationship target borrowers. For the multiple-relationship sample, large target borrowers are no more or less likely to switch in the longer run than are smaller target borrowers; however, the large target borrowers are significantly less likely to drop (coefficient of -0.022***) than are their smaller counterparts. Hence, as already suggested by the discontinuation results, large multiple-relationship target borrowers also appear to be harmed less by mergers than small borrowers. With respect to borrowers of acquiring banks, large single-relationship acquiring borrowers are no more likely to switch than are smaller acquiring borrowers; however, large acquiring borrowers are less likely to drop. Similar results also hold for the multiple-relationship acquiring borrowers. These results indicate that large acquiring borrowers are less harmed by, or benefit more from, mergers than small acquiring borrowers.
TABLE 5 HERE
The results from Table 5 thus provide additional evidence in support of the general conjecture that large borrowers (of both acquiring and target banks) are less harmed by mergers than are small borrowers. Taken together, the results from Table 5 demonstrate the importance of distinguishing between drops and switches for single-relationship borrowers. Drawing conclusions about the effects of mergers particularly on single-relationship borrowers solely on the basis of information about discontinuations can be misleading. Whereas our results based on the logit-discontinuation regressions could have been interpreted as suggesting (counterintuitively) that large, single-relationship target borrowers are more harmed by mergers than are their smaller counterparts, the results from the multinomial logit regressions relating to drops and switches indicate just the opposite, that the large, single-relationship target borrowers are less harmed because the large borrowers are able to switch more often. For acquiring borrowers, whereas the logit-discontinuation regressions indicated no difference in discontinuation rates between large and small single-relationship borrowers, the multinomial logit regressions indicate a significantly lower drop rate for large single-relationship borrowers.
16
3.3. Multiple relationships, relationship intensity at the merging banks and overlap borrowers Does relationship intensity play a role in determining the magnitude of acquiring and target borrower effects? Table 2 shows that, in general, higher CONC lowers the discontinuation rate with a bank. Of interest in relation to mergers is whether multiple-relationship target borrowers with high CONC are less harmed by mergers than target borrowers with low CONC. Also, are acquiring bank borrowers with high CONC even more protected from mergers than those with low CONC? In order to address these questions, we construct four dummy variables, corresponding to the four quartiles of the distribution of the CONC variable (labelled as CONC1, CONC2, CONC3, CONC4, where CONC1 represents the lowest quartile). We then interact these dummy variables with our merger dummies and include them in the discontinuation logit regression. Since we include interactions of the merger dummies with all four intervals of the CONC dummies, we exclude the individual merger dummies from this regression. Thus, the interaction terms capture all of the effects of the mergers. The results are reported in Table 6. The discontinuation rate for target borrowers is significantly higher than that for nonmerging borrowers for all four intervals of the concentration variable (TARGCONCi, i=1,...,4), and the impact increases as concentration increases. (i.e., the marginal probabilities associated with target borrowers increase in CONC.) Thus, the effect of the merger on target borrowers appears to be strongest for the borrowers who would otherwise have been the most likely to stay on with the bank. Because of their high relationship intensity with the target bank, these borrowers may be less likely to be able to hedge against a negative change in credit availability by the merged bank than if their relationships with the target bank were less intense. For acquiring borrowers the discontinuation rate is significantly lower than that for nonmerging borrowers for three of the four intervals of CONC and is negative and significant at the 10% level for the final category. No particular pattern appears in the marginal probabilities across concentration levels.
TABLE 6 HERE
With respect to overlap borrowers, we can ask whether the relative concentration of bank funding with the target or acquiring bank is important in explaining the merger effect. We therefore run a regression only on overlap borrowers, with right-hand side variables including firm characteristics and the dummy variables TARGCONC2, TARGCONC3, and TARGCONC4, representing the overlap borrower's concentration with the target bank. The dependent variable equals 1 if the overlap borrower's relationship with the merged bank is discontinued. The results of this regression appear in Table 7, and show that overlap borrowers with very high target bank concentration (TARGCONC4) and, by definition, low acquiring bank concentration have a higher discontinuation rate than similar overlap borrowers with lower target-bank concentrations. Thus, it is not only whether a firm is an overlap borrower that appears to be important, but also the degree of concentration of this relationship with the target versus the acquiring bank.
TABLE 7 HERE
In summary, our results demonstrate that borrowers of target banks are more likely to face a relationship discontinuation after a bank merger, and single-relationship borrowers from target banks
17
are much more likely to be dropped than are nonmerging bank borrowers. This suggests that target borrowers are hurt by mergers, and considerably more than if they were to switch following the merger. In the following section we provide evidence for this claim by analyzing data on borrower performance in the three years following the event of staying, dropping or switching a bank-firm relationship. 23 4. The impact of "dropping", "switching" and "staying" on single-relationship borrower performance
Confirming that target borrowers are hurt by mergers requires us to proceed in two steps. We first need to show that drops are more harmful than switches for single-relationship borrowers. In fact, the distinction between dropping and switching should only be important when firms' non-bank finance alternatives are inexistent or are more costly than bank finance. We consider a number of performance indicators in Section 3.1 and we find that for every indicator, droppers perform worse than switchers or stayers. This holds for target bank droppers, as well as for droppers from acquiring and nonmerging banks.
However, while the results from Section 3.1 (combined with the higher drop rate of target borrowers) offer some support for the hypothesis that target borrowers are hurt by mergers, these results alone do not provide fully convincing evidence. It is possible that the borrowers of target banks who are dropped following the merger are of low credit quality and "should" have been dropped. In other words, the target banks may have become targets for mergers precisely because they were failing to get rid of non-creditworthy borrowers. Indeed, descriptive statistics for the borrowers dropped from the target bank suggest that the median borrower dropped from the target bank has higher leverage, a higher ratio of bank debt to total debt, and a lower return on assets than the median borrowers dropped from acquiring and nonmerging banks.
If this is the case, the target bank dummy in our regressions from Section 2 may actually be picking up some unobservable (to the econometrician), negative quality attribute, such as low future profitability. Furthermore, to the extent that target bank borrowers are actually of low quality, the "extra" merger-induced drops may actually be socially desirable. We address this question in the
23 We have also undertaken several robustness checks. First, our definition of a lending relationship is based on utilized exposures, and our credit register data includes some observations where the bank reports a zero utilized exposure for a firm. For these observations one may question whether there is actually a "relationship" between the firm and the bank. For the regressions reported above, we have excluded observations with values of utilized loans reported as zero, but we also have re-run our regressions with these observations included. The results remain very similar and are therefore not reported. Second, we have re-run the regressions by creating "consolidated" bank control variables for the entire 1997-2003 period (as in Focarelli, Panetta and Salleo 2002). In other words, we treat the pre-merging banks as if they have already merged. While some of the bank control variables turn insignificant, the results for our merger variables of interest remain unaffected. We have also run regressions with merging bank fixed effects, as well as regressions excluding bank control variables, and our merger results remain robust to these changes in regression specification. Third, banks and firms actually choose their relationship intensity, implying that CONC may be endogenous, and as such might influence the coefficients of the other variables. However, our results indicate that this is not an important issue, as (1) excluding the CONC variable does not affect the coefficients of the other variables, and (2) running regressions separately for firms in each concentration bucket leaves the coefficients of the other variables unaffected. Finally, to test our results relating to overlap borrowers, we have rerun the merger regressions including in the sample only firms of similar size to overlap borrowers. Our merger results continue to hold in these regressions.
18
second step of our analysis, reported in Section 3.2. We first note that if the borrowers dropped from target banks are indeed of low quality (perhaps needing to have been dropped even prior to the merger), then the performance of these firms following the drop would be expected to be no better and arguably should be worse than the performance of the borrowers that were dropped from nonmerging banks. We test this hypothesis in Section 3.2, and we are able to reject it. Target borrowers as a group are more likely to survive three years out from the drop, and they perform significantly better than nonmerging bank droppers on our other performance indicators.
In order to further tighten our argument, we decompose target droppers into two groups: merger-induced target droppers and other target droppers. The latter group consists of firms whose observed characteristics would have led to the prediction of a drop, independently of their association with the target bank. The firms in the former group would not have been predicted to drop in the absence of their affiliation with the target bank. When we examine the performance of these two groups relative to firms that were dropped from nonmerging banks, we find that the "other target droppers" exhibit similar performance as the nonmerging bank droppers. In contrast, however, the performance of the "merger-induced target droppers" is significantly better than firms dropped from nonmerging banks. These results allow us to conclude that at least some of the firms that are dropped from target banks, in particular those whose observable characteristics would not have implied a high probability of a drop, appear to have been harmed by the merger. 4.1. Dropping versus switching versus staying
Table 8 reports various indicators of borrower performance after one year and three years following the event of staying, dropping or switching a bank-firm relationship. The indicators include entry into bankruptcy, growth in total assets, change in total debt, and growth in profitability (as measured by return on assets). For each performance measure, we report the results for the three categories of borrowers i.e. stayers, switchers and droppers where each category is further broken down into nonmerging bank borrowers, target bank borrowers, and acquiring bank borrowers. This allows us to perform a sort of "difference-in-difference" analysis by investigating whether dropping negatively affects firm performance compared to staying or switching. Table 8 reveals that droppers perform worse than switchers for all performance measures, and this holds for all types of bank borrowers, including target droppers relative to target switchers.
TABLE 8 HERE
We start our discussion by focusing on the first column in Table 8, which reports the proportion of firms filing for bankruptcy. A considerably higher percentage of firms enters bankruptcy after the bank relationship is dropped compared to switching or staying. Moreover, the effect of dropping and entering bankruptcy is immediate, as it already shows up after one year, and the effect is still strong after three years. For example, in three years (cumulative) following dropping, about 12% of the firms will have entered bankruptcy, compared to around 4% after switching and 3% after staying.
Columns (2), (3) and (4) in Table 8 provide results only for firms that continue to file balance sheets for three years following the event of a stay, switch, or drop. For the dropping borrowers it is particularly important to keep in mind that these tables provide results only for those firms that have continued to file balance sheets following the drop. Examination of our data reveals that around 45%
19
of dropping borrowers stopped filing balance sheets within three years following a drop, as compared with 15% or less for switchers and stayers.
Column (2) displays the growth in assets after one year and three years for the median firm. We find that droppers exhibit a negative growth in assets of about -3 percent whereas stayers and switchers display a positive growth in assets over three years of about 4 and 14 percent respectively. These differences are both statistically significant and economically relevant. Target switchers exhibit a larger growth in assets after three years than do target stayers or droppers.
The growth in total debt after one year and three years is shown in column (3). Whereas the median dropper sees a negative growth in total debt after three years of about -3%, stayers and switchers observe a positive growth of 4 and 15% respectively. These differences are again economically relevant and statistically significant. Target droppers once again perform worse than target stayers or switchers.
Column (4) presents results relating to firm profitability, where profitability in year n is measured as profit in year n divided by assets in year 0, both in basis points (bps) and in %. Computing profitability in this way helps to control for the differing changes in total assets across the three types of borrowers. Column (4) reveals that median profitability for droppers increases somewhat in the first year but generally declines over the three-year period. This contrasts with the profitability of stayers and with switchers.
In sum, our four performance measures indicate that droppers are more harmed than switchers or stayers, demonstrating that our distinction between the three options of "dropping", "staying" and "switching" is economically meaningful. Furthermore, target droppers are more negatively affected than target switchers or stayers. These results confirm that separating relationship discontinuations into switches and drops is crucial for understanding the impact of bank mergers on borrowers with single bank relationships.24 We now turn to the question of whether merging banks are only cleaning out the balance sheet or whether merger-induced target drops are inefficient, in that some of the target droppers should not have been dropped.
4.2. The impact of bank mergers on small firms: Are “merger-induced” target drops harmful? The question of whether the merger-related drops of target borrowers are efficient or not leads to a simple hypothesis. If merger-related drops are efficient, then we should expect to observe
24 In unreported exercises, we also examined the impact of mergers on credit availability for borrowers staying with the merged bank. Our sample consists of the continuing firms used in our previous panel regressions, but now excluding firms which switch banks, add or drop a relationship. We run a logit regression, where the dependent variable takes on a value of 1 if the firm's total loan volume increases between period t and t+j, (with j=1, 2), and 0 otherwise. When INCREASE equals 1, we can infer that bank(s) and the firm have been interacting with each other, since loan volume has increased. We find that single-relationship firms borrowing from target banks and who stay on with the merged bank have a lower probability of experiencing an increase in their loan volume ( 1.3 percentage points in the short term below the sample average of 28% and 0.7 percentage points in the longer term below the sample average of 32%) than do other single-relationship borrowers that stay on with their bank. Acquiring bank borrowers who stay on with the merged bank have a higher probability than nonmerging bank borrowers of experiencing an increase in their loan volumes in the short run following a merger and the same probability in the longer term. We have also run tobit regressions on firms' loan volumes, and the results are similar.
20
performance of target droppers following the drop that is no better, and probably worse, than the performance of nonmerging droppers. We undertake a first test of this hypothesis by comparing the performance of target droppers and other droppers in the three years following the drop. We employ regression analysis for this test, so that we can control for other factors that drive relationship drops. Panel A of Table 9 reports the results of OLS regressions for our performance indicators of growth in assets, growth in debt, and growth in profitability (as defined in Subsection 3.1). In addition, this table reports the results of a probit regression on a "survival" dummy, which equals 1 if the dropped borrower is still filing a balance sheet 3 years after the drop and 0 otherwise. We believe that this variable provides a sharper indicator of survivability than entry into bankruptcy, since firms that file for bankruptcy often first stop filing a balance sheet, then only later (sometimes after several years) file for bankruptcy. As we noted in Section 3.1, whereas around 12% of borrowers that drop file for bankruptcy within three years of the drop, almost 45% of droppers have stopped filing balance sheets during this period.25
TABLE 9 HERE
Column (1) of Panel A in Table 9 reports the results of the probit regression on the survival dummy. Independent variables in this regression are the firm and bank controls at time 0, and the acquiring (ACQ) and target (TARG) merger dummies. While all firm characteristics are significant with the expected sign, for the sake of brevity we do not discuss them further. The bank characteristics are included as additional controls but only two of them are significant. More importantly, we find that target droppers (TARG) are significantly more likely to survive (7.2 percentage points) than otherwise similar firms, whereas acquiring firm droppers (ACQ) are less likely to survive (5.8 percentage points). Columns (2), (3) and (4) of Panel A in Table 9 presents the results of the OLS regressions on the other performance indicators. Control variables are again the firm and bank characteristics at time zero. Firm controls have the expected signs and bank controls in general are not significant. Target borrowers (TARG) exhibit greater growth in assets and debt than otherwise similar borrowers and a similar growth in profitability. Acquiring bank borrowers (ACQ) exhibit a higher growth in profitability. In sum, the results of panel A in Table 9 indicate that target droppers on average perform better than otherwise similar droppers. We now take the analysis one step further, by decomposing target droppers into merger-induced target droppers and other target droppers and rerunning the above regressions with these two groups. We construct the two groups in the following way. We first compute a predicted drop probability for all droppers based upon the coefficients from the drop-stay regressions for single relationship borrowers in Table 4. We retain all droppers with a predicted drop probability greater than 50%.26 We further separate the retained target droppers into the groups of merger-induced target droppers and other target droppers as follows. For each retained target dropper, we compute
25 The 45% figure includes the firms that have entered bankruptcy. 26 We choose the 50% cutoff because we would like to compare the performance of target droppers that one could clearly argue "should" have been dropped on the basis of their observed characteristics with those whose observed characteristics would not have put them in that category. A predicted drop probability of 50% would appear to be a reasonable rule. Roughly half of the acquiring and nonmerging droppers are retained with this rule, and almost 60% of the target droppers are retained.
21
two predicted drop probabilities, again based upon the drop-stay regressions from Table 4. The first predicted probability is one where the target dummies equal one and the second is one where the target dummies are assumed equal to zero. We label “merger-induced target droppers” as those target droppers that have a drop probability of less than 50% when the target dummies are "turned off" (equal to zero) but greater than 50% with the target dummies equal to one. That is, the merger-induced target droppers are those target droppers that would not have been predicted to drop (by our 50% probability rule) when borrowing from a nonmerging bank, but that are predicted to drop given that they were borrowing from the target bank. Those droppers that are not "merger-induced" are classified as “other target droppers”. Over fourty percent of the retained target droppers are “merger-induced”. If "merger-induced" target droppers were observed to have better performance than nonmerging droppers while "other" target droppers have similar performance to nonmerging droppers, this would offer rather compelling evidence that the merger-induced target droppers are not being dropped for efficiency reasons. Rather, it would be consistent with the conjecture that the merger-induced drops are inefficient and that these borrowers should not have been dropped in the first place. Moreover, as droppers fare worse than stayers or switchers, this would be consistent with the conjecture that the merger-induced target droppers are harmed by the merger. Panel B of Table 9 displays the results for the four performance regressions for firms retained by our "50% estimated drop probability rule". The target dummy from Panel A has now been replaced with two target dummies: “merger-induced target” and “other target”, as explained above. The results in Panel B reveal that the “merger-induced target” droppers exhibit better performance than otherwise similar firms: they are more likely to survive, and they also have higher growth in assets, debt and profitability. The “other target” droppers exhibit performance that is similar to that of nonmerging droppers. On the one hand, these results would suggest that merger-induced target droppers are less hurt by the drop than are other target droppers. On the other hand, the merger-induced target droppers should not have been dropped in the first place, and they appear to have been dropped for reasons other than credit-worthiness. These merger-induced target droppers are hurt by the bank merger, since they fare worse than staying or switching borrowers. 5. Conclusion In this paper we have used detailed data on firm-bank loan contracts to analyze the effects of bank mergers on SMEs' bank lending relationships. We have shown that in order to accurately gauge the heterogeneous effects of mergers on borrowers, it is necessary to treat borrowers with single bank relationships separately from borrowers with multiple bank relationships. For single-relationship borrowers it is also necessary to distinguish between the three alternatives of "stay", "drop", and "switch", versus the two alternatives of "continue" and "discontinue" that previous merger studies have analyzed. We find that single-relationship borrowers of target banks in a merger are more likely to face relationship discontinuations than other borrowers, and these discontinuations are much more likely to result in drops than switches. In order to determine whether the borrowers dropped from the target bank are hurt by the merger, we proceed in two steps. We first follow single-relationship borrowers
22
for three years following a drop or switch. We find that firms that drop exhibit worse performance and higher bankruptcy frequency than firms that switch or that stay. This demonstrates that our distinction between staying, dropping and switching is economically meaningful. Second, we consider the hypothesis that the greater frequency of dropped borrowers from target banks may correspond to a socially efficient "cleansing" of the target bank. A comparison of the post-merger performance of the single-relationship borrowers dropped from the target bank with borrowers dropped from other banks reveals that the dropped target borrowers as a group perform better than the dropped borrowers from other banks during the three-year period following the drop. We then refine our test by decomposing target droppers into two groups: "merger-induced target droppers" and "other target droppers", where the firms in the former group would not have been predicted to drop in the absence of their affiliation with the target bank. We find that whereas the "other target droppers" have similar performance as nonmerging bank droppers, the merger-induced target droppers exhibit significantly better performance than nonmerging bank droppers. These results allow us to reject the hypothesis that the higher frequency of drops of borrowers from the target bank reflects desirable balance sheet cleansing. We thus conclude that single-relationship borrowers of target banks at least those borrowers that are dropped and whose observed characteristics would not have implied a high probability of being dropped are especially harmed by mergers. This result is new to the literature on bank mergers and has important policy implications, since single-relationship borrowers who lose their relationship without adding a new one also lose their access to bank credit. With respect to multiple-relationship borrowers, the overlap borrowers, i.e., firms borrowing from both the acquiring and target banks, are less harmed by mergers than are firms borrowing from only one of the merging banks. The intensity of the relationship also plays a significant role for multiple-relationship borrowers. For target bank borrowers, the relative impact of mergers on relationship discontinuations grows stronger as the intensity of the borrower's relationship with the target bank increases. Even for overlap borrowers, the intensity of the relationship with the target bank makes a difference: overlap borrowers with high relationship intensity with the target bank and, by definition, low intensity with the acquiring bank are more likely to see their relationship discontinued following a merger. Thus, a strong association with the target bank overrides both the positive effect of relationship intensity on relationship continuation and the positive effect of being an overlap borrower. Our findings concerning the greater harm inflicted by mergers on single-relationship than multiple-relationship borrowers confirm the intuition that multiple-relationship borrowers are better able to hedge against a fall in credit availability following a merger. These findings suggest that policy makers may have good reason to be concerned about the impacts of mergers on SMEs, given that in most countries a significant proportion of the SME population consists of single-relationship borrowers.
23
REFERENCES
Berger, A., R. Demsetz, and P. Strahan. 1999. The Consolidation of the Financial Services Industry: Causes, Consequences, and Implications for the Future. Journal of Banking and Finance 23: 135-194.
Berger, A., S. Bonime, L. Goldberg, and L. White. 2004. The Dynamics of Market Entry: The Effects of Mergers and Acquisitions on Entry in the Banking Industry. Journal of Business 77: 797-834.
Berger, A., N. Miller, M. Petersen, R. Rajan, and J. Stein. 2005. Does Function Follow Organizational Form? Evidence from the Lending Practices of Large and Small Banks. Journal of Financial Economics 76: 237-269.
Berger, A., A. Saunders, J. Scalise, and G. Udell. 1998. The Effects of Bank Mergers and Acquisitions on Small Business Lending. Journal of Financial Economics 50: 187-230.
Berger, A., and G. Udell. 1996. Universal Banking and the Future of Small Business Lending, in A. Saunders and I. Walter, (eds) Financial System Design: The case for Universal Banking (Irwin Publishing, Homewood, IL)
Black, S., and P. Strahan. 2002. Entrepreneurship and Bank Credit Availability. Journal of Finance 57: 2807-2833.
Bonaccorsi di Patti, E. and G. Gobbi. 2007. Winners or Losers? The Effects of Banking Consolidation on Corporate Borrowers. Journal of Finance 62: 669-696.
Carow, K.A., E. Kane, and R.Nayaranan. 2006. How Have Borrowers Fared in Banking Mega-mergers?. Journal of Money, Credit and Banking 38: 821-836.
Carletti, E. 2004. The Structure of Bank Relationships, Endogenous Monitoring and Loan Rates. Journal of Financial Intermediation 13: 58-86.
Cetorelli, N. and M. Gambera. 2001. Banking Market Structure, Financial Dependence, and Growth: International Evidence from Industry Data. Journal of Finance 56: 617-648.
Chionsini, G., A. Foglia, and P. Marullo-Reedtz. 2004. Bank Mergers, Diversification and Risk, mimeo, Bank of Italy.
de Bodt, E., F. Lobez, and J. C. Statnik. 2005. Credit Rationing, Customer Relationship, and the Number of Banks: An Empirical Analysis. European Financial Management 11: 195-228.
Degryse, H., N. Masschelein, and J. Mitchell. 2004. Belgian Firms, Bank Finance, and Determinants of Bank Lending Relationships. Financial Stability Review, National Bank of Belgium, June.
Degryse, H., and S. Ongena. 2005. Distance, Lending Relationships and Competition, Journal of Finance 60: 231-266.
Degryse, H., and P. Van Cayseele. 2000. Relationship lending within a Bank-based System: Evidence from European Small Business Data. Journal of Financial Intermediation 9: 90-109.
Detragiache, E., P. Garella, and L. Guiso. 2000. Multiple versus Single Banking Relationships: Theory and Evidence. Journal of Finance 55: 1133-1161.
Dietsch, M., and V. Golitin-Boubakari. 2002. L'évolution des Relations Banques-entreprises dans les Années 1990, Bulletin de la Commission Bancaire 27: 74-107.
Drucker, S. 2005. Information Asymmetries, Cross-Product Banking Mergers, and the Effects of Corporate Borrowers. mimeo, Columbia Business School.
Elsas, R. 2005. Empirical Determinants of Relationship Lending. Journal of Financial Intermediation 14: 32-57.
Erel, I. 2009. The Effect of Bank Mergers on Loan Prices: Evidence from the U.S. forthcoming in Review of Financial Studies.
24
Farinha, L.A., and J. Santos. 2002. Switching from Single to Multiple Bank Lending Relationships: Determinants and Implications. Journal of Financial Intermediation 11: 124-151.
Focarelli, D., F. Panetta, and C. Salleo. 2002. Why do banks merge?. Journal of Money, Credit and Banking 34: 1047-1066.
Hauswald, R., and R. Marquez.. 2003. Information Technology and Financial Services Competition. Review of Financial Studies 16: 921-948.
Houston, J.F., C.M. James, and D. Ryngaert. 2001. Where do Merger Gains come from? Bank Mergers from the Perspective of Insiders and Outsiders. Journal of Financial Economics 60: 285-331.
Karceski, J., S. Ongena, and D. Smith. 2005. The Impact of Bank Consolidation on Commercial Borrower Welfare. Journal of Finance 60: 2043-2082.
Khwaja, A., and A. Mian. 2008. Tracing the Impact of Liquidity Shocks: Evidence from an Emerging Market. forthcoming in American Economic Review.
Kim, M., D. Kliger, and B. Vale. 2003. Estimating Switching Costs: the Case of Banking. Journal of Financial Intermediation 12: 25-56.
Klemperer, P. 1995. Competition when Consumers have Switching Costs: An Overview with Applications to Industrial Organization, Macroeconomics and International Trade. Review of Economic Studies 62: 515-539.
Mian, A. and J. Liberti. 2008. Estimating the Effect of Hierarchies on Information Use. forthcoming in Review of Financial Studies.
Montoriol-Garriga, J. 2006. Relationship Lending in Spain: An Empirical Examination of Cost of Capital, Bank Credit Availability, and Credit Rationing. Manuscript University Pompeu Fabra.
Ongena, S., and D. Smith. 2000. What Determines the Number of Bank Relationships? Cross-country Evidence Journal of Financial Intermediation 9: 26-56.
Panetta, F., P. Schivardi, and M. Shum. 2009. Do Mergers Improve Information? Evidence from the Loan Market. Journal of Money, Credit and Banking 41: 673-709.
Peek, J., and E.S. Rosengren. 1996. Small Business Credit Availability: How Important is Size of Lender?, in A. Saunders and I. Walters (eds) Financial System Design: The case for Universal Banking, Homewood, IL: Irwin Publishing.
Petersen, M.A. 2004. Information: Hard and Soft, working paper, Kellogg School of Management, Northwestern University.
Petersen, M.A., and R.G. Rajan. 1994. The Benefits from Lending Relationships: Evidence from Small Business Data. Journal of Finance 49: 3-37.
Petersen, M.A., and R.G. Rajan. 1995. The Effect of Credit Market Competition on Lending Relationships. Quarterly Journal of Economics 110: 406-443.
Sapienza, P. 2002. The Effects of Banking Mergers on Loan Contracts. Journal of Finance 57: 329-367.
Scott, J., and W.C. Dunkelberg. 2003. Bank Mergers and Small Firm Financing. Journal of Money, Credit and Banking 6: 999-1018.
Stein, J. 2002. Information Production and Capital Allocation: Decentralized versus Hierarchical Firms, Journal of Finance 57: 1891-1921.
Strahan, P.E., and J.P. Weston. 1998. Small Business Lending and the Changing Structure of the Banking Industry. Journal of Banking and Finance 22: 821-845.
Von Thadden, E. 2004. Asymmetric Information, Bank Lending and Implicit Contracts: The Winner's Curse. Finance Research Letters 1: 11-23.
Tab
le 1
: Sum
mar
y St
atis
tics
N°
obs
Mea
n M
edia
n St
d. d
ev.
Pane
l A: P
anel
sum
mar
y st
atis
tics:
firm
char
acte
rist
ics
All
firm
s A
GEF
A
ge o
f the
firm
in y
ears
45
6,71
7 14
.62
11.7
6 10
.32
ASS
ETF
Tota
l boo
k va
lue
of a
sset
s of t
he fi
rm, e
xpre
ssed
in th
ousa
nds o
f 200
2 €
456,
717
1,85
0 50
1 97
5 R
OA
F a
EBIT
ove
r ass
ets
456,
717
6.06
%
5.40
%
10.7
8%
LEV
ERA
GE
b B
ook
valu
e of
deb
t ove
r ass
ets
456,
717
75.2
4%
75.0
0%
38.0
5%
NEG
EQ
Dum
my
that
take
s val
ue 1
if fi
rm h
as n
egat
ive
equi
ty
4567
17
12
.34%
0
31.3
4%
REC
BA
LAN
CE
Dum
my
that
take
s val
ue 1
for f
irms w
ith b
alan
ce sh
eet a
vaila
ble
in a
t lea
st o
ne o
f the
two
year
s prio
r to
year
in w
hich
cre
dit w
as g
rant
ed
456,
717
93.5
4%
1 33
.94%
Y
OU
NG
D
umm
y th
at ta
kes v
alue
1 fo
r firm
s you
nger
than
3 y
ears
and
who
se b
alan
ce sh
eet c
over
s les
s tha
n 12
mon
ths o
f dat
a 45
6,71
7 5.
02%
0
22.4
3%
PR
OPB
AN
KD
EBT
Prop
ortio
n of
ban
k de
bt /
tota
l deb
t 45
6,71
7 57
%
56.3
3%
22.3
4%
Firm
s bor
row
ing
from
acq
uiri
ng b
ank
in ye
ar p
rior t
o m
erge
r A
GEF
A
ge o
f the
firm
in y
ears
45
,266
13
.12
10.1
9 9.
84
ASS
ETF
Tota
l boo
k va
lue
of a
sset
s of t
he fi
rm, e
xpre
ssed
in th
ousa
nds o
f 200
2 €
45,2
66
1,47
7 47
3 7,
454
RO
AF
a EB
IT o
ver a
sset
s 45
,266
5.
95%
5.
40%
10
.77%
L
EVER
AG
E b
Boo
k va
lue
of d
ebt o
ver a
sset
s 45
,266
75
.01%
75
.30%
36
.76%
N
EGEQ
D
umm
y th
at ta
kes v
alue
1 if
firm
has
neg
ativ
e eq
uity
45
,266
12
.00%
0
31.3
2%
REC
BA
LAN
CE
Dum
my
that
take
s val
ue 1
for f
irms w
ith b
alan
ce sh
eet a
vaila
ble
in a
t lea
st o
ne o
f the
two
year
s prio
r to
year
in w
hich
cre
dit w
as g
rant
ed
45,2
66
94.4
5%
1 32
.34%
Y
OU
NG
D
umm
y th
at ta
kes v
alue
1 fo
r firm
s you
nger
than
3 y
ears
and
who
se b
alan
ce sh
eet c
over
s les
s tha
n 12
mon
ths o
f dat
a 45
,266
4.
93%
0
21.1
5%
PR
OPB
AN
KD
EBT
Prop
ortio
n of
ban
k de
bt /
tota
l deb
t 45
,266
55
%
57.3
4%
16.4
4%
Firm
s bor
row
ing
from
targ
et b
ank
in y
ear p
rior t
o m
erge
r A
GEF
A
ge o
f the
firm
in y
ears
13
,210
11
.78
9.06
9.
88
ASS
ETF
Tota
l boo
k va
lue
of a
sset
s of t
he fi
rm, e
xpre
ssed
in th
ousa
nds o
f 200
2 €
13,2
10
1,72
9 35
6 10
,600
R
OA
F a
EBIT
ove
r ass
ets
13,2
10
5.76
%
5.40
%
11.2
7%
LEV
ERA
GE
b B
ook
valu
e of
deb
t ove
r ass
ets
13,2
10
78.0
%
77.8
0%
38.9
%
NEG
EQ
Dum
my
that
take
s val
ue 1
if fi
rm h
as n
egat
ive
equi
ty
13,2
10
12.5
7%
0 31
.31%
R
ECB
ALA
NC
E D
umm
y th
at ta
kes v
alue
1 fo
r firm
s with
bal
ance
shee
t ava
ilabl
e in
at l
east
one
of t
he tw
o ye
ars p
rior t
o ye
ar in
whi
ch c
redi
t was
gra
nted
13
,210
93
.00%
1
33.7
6%
YO
UN
G
Dum
my
that
take
s val
ue 1
for f
irms y
oung
er th
an 3
yea
rs a
nd w
hose
bal
ance
shee
t cov
ers l
ess t
han
12 m
onth
s of d
ata
13,2
10
5.11
%
0 22
.25%
P
RO
PBA
NK
DEB
T Pr
opor
tion
of b
ank
debt
/ to
tal d
ebt
13,2
10
60%
59
.43%
32
.33
Ove
rlap
firm
s (AC
QTA
RG
) (bo
rrow
ing
from
bot
h ta
rget
and
acq
uiri
ng b
anks
) in
year
prio
r to
mer
ger
AG
EF
Age
of t
he fi
rm in
yea
rs
1,55
1 17
.63
13.6
8 13
.34
ASS
ETF
Tota
l boo
k va
lue
of a
sset
s of t
he fi
rm, e
xpre
ssed
in th
ousa
nds o
f 200
2 €
1,55
1 5,
458
1,23
9 21
,100
R
OA
F a
EBIT
ove
r ass
ets
1,55
1 5.
94%
5.
20%
7.
89%
L
EVER
AG
E b
Boo
k va
lue
of d
ebt o
ver a
sset
s 1,
551
72.8
2%
74.4
0%
25.0
2%
NEG
EQ
Dum
my
that
take
s val
ue 1
if fi
rm h
as n
egat
ive
equi
ty
1,55
1 12
.44%
0
31.5
4%
REC
BA
LAN
CE
Dum
my
that
take
s val
ue 1
for f
irms w
ith b
alan
ce sh
eet a
vaila
ble
in a
t lea
st o
ne o
f the
two
year
s prio
r to
year
in w
hich
cre
dit w
as g
rant
ed
1,55
1 94
.21%
1
32.5
6.%
Y
OU
NG
D
umm
y th
at ta
kes v
alue
1 fo
r firm
s you
nger
than
3 y
ears
and
who
se b
alan
ce sh
eet c
over
s les
s tha
n 12
mon
ths o
f dat
a 1,
551
5.13
%
0 22
.11%
P
RO
PBA
NK
DEB
T Pr
opor
tion
of b
ank
debt
/ to
tal d
ebt
1,55
1 5
4%
53.4
4 34
.33%

Pane
l B: S
umm
ary
stat
istic
s for
ban
ks
All
bank
s A
SSET
B
Tota
l ass
ets o
f the
ban
k, e
xpre
ssed
in th
ousa
nds o
f 200
2€
479
11,1
13,0
52
15,5
43,4
56
35,0
72,2
30
RO
AB
To
tal r
etur
n on
ass
ets
479
0.22
%
0.32
%
1.34
%
BA
DLO
AN
SB
Non
-per
form
ing
loan
s ove
r tot
al lo
ans
479
2.02
%
1.68
%
3.40
%
OPC
OST
B
Ope
ratin
g co
sts o
ver t
otal
ass
ets
479
8.50
%
7.45
%
6.21
%
LIQ
B
(Cas
h +
net p
ositi
on in
the
inte
rban
k m
arke
t + sh
ort t
erm
secu
ritie
s' po
rtfol
io +
gov
ernm
ent b
onds
) ove
r ass
ets
479
11.3
6%
12.3
4%
39.3
7%
Acq
uirin
g ba
nks (
at ti
me
of m
erge
r)
ASS
ETB
To
tal a
sset
s of t
he b
ank,
exp
ress
ed in
thou
sand
s of 2
002€
8
43,8
01,5
40
45,3
45,4
54
49,9
91,3
70
RO
AB
To
tal r
etur
n on
ass
ets
8 0.
37%
0.
45%
0.
38%
B
AD
LOA
NSB
N
on-p
erfo
rmin
g lo
ans o
ver t
otal
loan
s 8
1.80
%
1.97
%
1.65
%
OPC
OST
B
Ope
ratin
g co
sts o
ver t
otal
ass
ets
8 7.
49%
6.
94%
7.
83%
L
IQB
(C
ash
+ ne
t pos
ition
in th
e in
terb
ank
mar
ket +
shor
t ter
m se
curit
ies'
portf
olio
+ g
over
nmen
t bon
ds) o
ver a
sset
s 8
14.7
7%
16.4
3%
20.4
9%
Targ
et b
anks
(at t
ime
of m
erge
r)
ASS
ETB
To
tal a
sset
s of t
he b
ank,
exp
ress
ed in
thou
sand
s of 2
002€
12
14
,868
,690
14
,344
,444
23
,531
,640
R
OA
B
Tota
l ret
urn
on a
sset
s 12
0.
38%
0.
43%
0.
26%
B
AD
LOA
NSB
N
on-p
erfo
rmin
g lo
ans o
ver t
otal
loan
s 12
1.
28%
1.
45%
1.
03%
O
PCO
STB
O
pera
ting
cost
s ove
r tot
al a
sset
s 12
7.
44%
8.
34%
6.
53%
L
IQB
(C
ash
+ ne
t pos
ition
in th
e in
terb
ank
mar
ket +
shor
t ter
m se
curit
ies'
portf
olio
+ g
over
nmen
t bon
ds) o
ver a
sset
s 12
18
.11%
20
.21%
28
.02%
Pa
nel C
: Sum
mar
y st
atis
tics o
n ot
her
vari
able
s C
ON
C
Prop
ortio
n of
mul
tiple
-rel
atio
nshi
p fir
m i'
s util
ized
loan
s acc
ount
ed fo
r by
bank
k
91,3
40
0.44
0.
48
0.33
S
ingl
e re
l dum
my
Dum
my
that
take
s val
ue 1
if fi
rm h
as a
sing
le le
ndin
g re
latio
nshi
p 45
6,71
7 0.
80
1 0.
44
Pane
l A p
rovi
des
info
rmat
ion
on th
e fir
m c
hara
cter
istic
s. Su
mm
ary
stat
istic
s ar
e ba
sed
upon
all
firm
-yea
r ob
serv
atio
ns in
clud
ed in
the
pane
l dat
a an
alys
is, w
hich
con
sists
of
year
ly o
bser
vatio
ns f
rom
Dec
., 19
97-D
ec.,
2003
. (a F
irms w
ith R
OA
> 9
9 %
and
< -
99%
are
exc
lude
d; b
Firm
s with
Deb
t/Equ
ity >
1,0
00 %
are
exc
lude
d). P
anel
B g
ives
info
rmat
ion
on th
e ba
nk c
hara
cter
istic
s, ba
sed
upon
all
bank
-yea
r obs
erva
tions
incl
uded
in th
e pa
nel.
Pane
l C p
rovi
des i
nfor
mat
ion
on th
e ot
her v
aria
bles
.
Tab
le 2
: Dis
cont
inua
tion
regr
essi
ons:
targ
et v
ersu
s acq
uiri
ng b
anks
Pane
l A: L
ogit
Pane
l B: O
LS/P
robi
t
Sam
ple
All
Sam
ple
A
ll Si
ngle
rel.
Mul
tiple
rels.
Pr
obit-
DIS
CO
NTI
NU
E O
LS-S
ingl
e re
l. du
mm
y
Mar
g. E
ff.
Impa
ct o
f
Mar
g. E
ff.
Impa
ct o
f
Mar
g. E
ff.
Impa
ct o
f
Mar
g. E
ff.
Coe
f. Fi
rm c
ontr
ols
ln(A
GEF
) -0
.001
-0
.001
0.
004*
**
0.00
3 -0
.008
***
-0.0
05
- -0
.081
***
ln(A
SSET
F)
-0.0
24**
* -0
.031
-0
.028
***
-0.0
32
-0.0
19**
* -0
.025
-0
.024
***
-0.1
39**
* R
OA
F -0
.067
***
-0.0
07
-0.0
63**
* -0
.007
-0
.074
***
-0.0
06
-0.0
66**
* -0
.042
***
LEV
ERA
GE
-0.0
68**
* -0
.024
-0
.074
***
-0.0
30
-0.0
56**
* -0
.016
-0
.064
***
-0.2
55**
* LE
VER
AG
E*N
EGEQ
0.
059*
**
0,02
7 0.
062*
**
0,03
2 0.
052*
**
0,01
7 0.
044*
**
0.16
4***
R
ECB
ALA
NC
E -0
.037
***
-0,0
37
-0.0
40**
* -0
.040
-0
.030
***
-0.0
30
-0.0
33**
* -0
.050
***
YO
UN
G
0.01
4***
0.
014
0.02
0***
0.
020
0.00
1 0.
001
0.01
4***
0.
002
PRO
PBA
NK
DEB
T -
- -
-
-
-0.0
00
Ban
k co
ntro
ls
ln(A
SSET
B)
-0.0
15**
* -0
.023
-0
.010
***
-0.0
14
-0.0
19**
* -0
.032
-0
.022
***
0.02
9***
R
OA
B
0.11
9***
0.
000
0.14
8***
0.
000
0.68
2***
0.
002
0.13
9***
-0
.072
B
AD
LOA
NSB
0.
943*
**
0.02
9 0.
953*
**
0.02
8 0.
825*
**
0.02
6 0.
845*
**
2.22
0***
O
PCO
STB
0.
011
0.00
1 0.
095*
**
0.00
6 -0
.042
* -0
.002
0.
011
-0.2
31
LIQ
B
-0.0
46**
* -0
.011
-0
.015
***
-0.0
03
-0.0
54**
* -0
.013
-0
.043
***
-0.0
44**
* M
erge
r va
riab
les
AC
Qt
0.00
0 0.
000
0.01
0***
0.
010
-0.0
13*
-0.0
13
-0.0
01
0.01
0 TA
RG
t 0.
016*
**
0.01
6 0.
020*
**
0.02
0 0.
016*
* 0.
016
0.01
5***
0.
078
AC
QTA
RG
t -0
.113
***
-0.1
13
- -
-0.1
15**
* -0
.115
-0
.114
***
-0.4
45**
* A
CQ
t-1
-0.0
22**
* -0
.022
-0
.022
***
-0.0
22
-0.0
20**
* -0
.020
-0
.022
***
-0.0
21
TAR
Gt-1
0.
085*
**
0.08
5 0.
080*
**
0.08
0 0.
095*
**
0.09
5 0.
082*
**
0.06
0 A
CQ
TAR
Gt-1
-0
.067
***
-0.0
67
- -
-0.0
58**
* -0
.058
-0
.065
***
-0.0
11
Oth
er v
aria
bles
C
ON
C
-0.1
80**
* -0
.059
-
- -0
.179
***
-0.0
59
-0.1
90**
* 0.
920*
**
Sing
le re
l dum
my
0.06
0***
0.
060
- -
- -
0.08
2***
-
Sing
le re
l Dum
my
resi
dual
(v1)
- -
- -
- -
-0.4
51
- D
ISC
ON
TIN
UE
= 1
62,4
89
37,5
89
24,9
00
62,4
89
D
ISC
ON
TIN
UE
= 0
502,
590
309,
633
192,
957
502,
590
Si
ngle
rel d
umm
y =
1
34
7,22
2 Si
ngle
rel d
umm
y =
0
21
7,85
7 Ps
eudo
R²
5.29
%
3.38
%
8.10
%
3.53
%
22.6
0%
Chi
-Squ
are
0.00
01
0.00
01
0.00
01
0.00
01
0.00
01
Pane
l A
pre
sent
s lo
git
regr
essi
ons
whe
re t
he d
epen
dent
var
iabl
e in
eac
h re
gres
sion
equ
als
one
if du
ring
the
follo
win
g ye
ar f
irm i
dis
cont
inue
s its
rel
atio
nshi
p w
ith b
ank
k. T
he r
epor
ted
coef
ficie
nts
are
logi
t est
imat
es o
f a m
argi
nal c
hang
e in
the
inde
pend
ent v
aria
ble
on th
e pr
obab
ility
of d
isco
ntin
uing
the
lend
ing
rela
tions
hip
(Mar
g. E
ff.).
"Im
pact
of
" gi
ves
the
impa
ct o
f a
chan
ge in
one
sta
ndar
d de
viat
ion
of th
e re
spec
tive
varia
ble
(for a
dum
my
varia
ble
we
repo
rt th
e ch
ange
of o
ne).
Pane
l B p
rese
nts
the
resu
lts o
f the
pro
cedu
re to
inve
stig
ate
endo
gene
ity o
f the
nu
mbe
r of r
elat
ions
hips
. The
firs
t equ
atio
n is
an
OLS
regr
essi
on o
f the
sing
le re
l. du
mm
y (r
epor
ted
in th
e se
cond
col
umn
of P
anel
B).
The
seco
nd is
a p
robi
t reg
ress
ion
with
the
resi
dual
s of
the
OLS
-sin
gle
rel d
umm
y re
gres
sion
(v 1
) ar
e in
clud
ed a
s re
gres
sor
(firs
t col
umn
of P
anel
B).
All
regr
essi
ons
incl
ude
a co
nsta
nt te
rm, f
irm in
dust
ry d
umm
ies,
and
year
dum
mie
s (n
ot r
epor
ted)
. D
efin
ition
s of t
he v
aria
bles
are
in T
able
1. *
, **,
***
den
otes
sign
ifica
nce
at th
e 10
, 5, a
nd 1
%-le
vel,
resp
ectiv
ely
(bas
ed o
n he
tero
sked
astic
-rob
ust s
tand
ard
erro
rs).
28
Table 3: Logit-discontinuation regressions: interaction with firm size for acquiring and target banks
Sample All Single rel. Multiple rels Firm controls yes yes yes Bank controls yes yes yes ACQt 0.113*** 0.083*** 0.058* TARGt -0.158*** -0.217*** -0.159*** ACQTARGt -0.371** - -0.312** ACQt-1 0.073*** 0.024 0.145*** TARGt-1 0.052** -0.078*** 0.261*** ACQTARGt-1 -0.354** - -0.395* ACQt * ln(ASSETF) -0.009*** -0.006*** -0.005* TARGt * ln(ASSETF) 0.013*** 0.019*** 0.013**** ACQTARGt *ln(ASSETF) 0.016 - 0.011 ACQt-1 * ln(ASSETF) -0.007*** -0.004 -0.012*** TARGt-1 * ln(ASSETF) 0.003 0.012*** -0.012*** ACQTARGt-1*ln(ASSETF) 0.020** - 0.022
The dependent variable in each regression equals one if during the following year firm i discontinues its relationship with bank k. The reported coefficients are logit estimates of a marginal change in the independent variable on the probability of discontinuing the lending relationship. All regressions include a constant term, firm industry dummies, and year dummies (not reported). Definitions of the variables are in Table 1. *, **, *** denotes significance at the 10, 5, and 1%-level, respectively (based on heteroskedastic-robust standard errors).
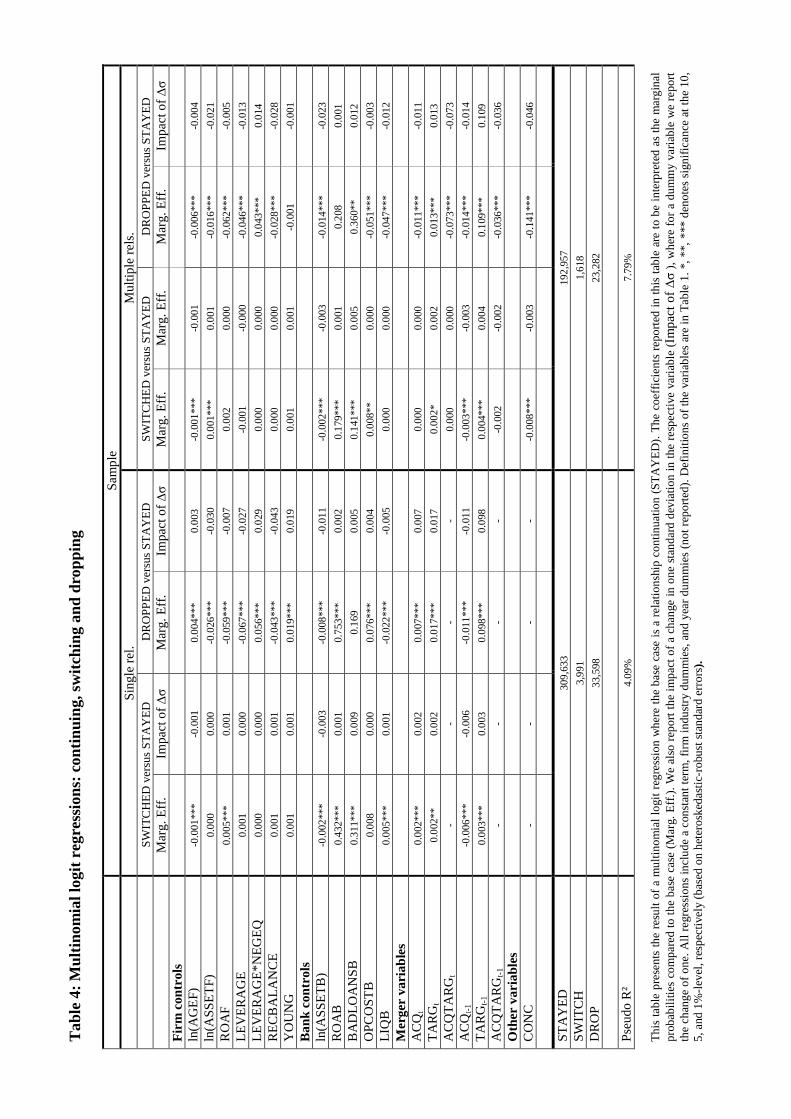
Tab
le 4
: Mul
tinom
ial l
ogit
regr
essi
ons:
con
tinui
ng, s
witc
hing
and
dro
ppin
g
Sam
ple
Si
ngle
rel.
Mul
tiple
rels
.
SWIT
CH
ED v
ersu
s STA
YED
D
RO
PPED
ver
sus S
TAY
ED
SWIT
CH
ED v
ersu
s STA
YED
D
RO
PPED
ver
sus S
TAY
ED
M
arg.
Eff.
Im
pact
of
M
arg.
Eff.
Im
pact
of
M
arg.
Eff.
M
arg.
Eff.
M
arg.
Eff.
Im
pact
of
Fi
rm c
ontr
ols
ln(A
GEF
) -0
.001
***
-0.0
01
0.00
4***
0.
003
-0.0
01**
* -0
.001
-0
.006
***
-0.0
04
ln(A
SSET
F)
0.00
0 0.
000
-0.0
26**
* -0
.030
0.
001*
**
0.00
1 -0
.016
***
-0.0
21
RO
AF
0.00
5***
0.
001
-0.0
59**
* -0
.007
0.
002
0.00
0 -0
.062
***
-0.0
05
LEV
ERA
GE
0.00
1 0.
000
-0.0
67**
* -0
.027
-0
.001
-0
.000
-0
.046
***
-0.0
13
LEV
ERA
GE*
NEG
EQ
0.00
0 0.
000
0.05
6***
0.
029
0.00
0 0.
000
0.04
3***
0.
014
REC
BA
LAN
CE
0.00
1 0.
001
-0.0
43**
* -0
.043
0.
000
0.00
0 -0
.028
***
-0.0
28
YO
UN
G
0.00
1 0.
001
0.01
9***
0.
019
0.00
1 0.
001
-0.0
01
-0.0
01
Ban
k co
ntro
ls
ln(A
SSET
B)
-0.0
02**
* -0
.003
-0
.008
***
-0.0
11
-0.0
02**
* -0
.003
-0
.014
***
-0.0
23
RO
AB
0.
432*
**
0.00
1 0.
753*
**
0.00
2 0.
179*
**
0.00
1 0.
208
0.00
1 B
AD
LOA
NSB
0.
311*
**
0.00
9 0.
169
0.00
5 0.
141*
**
0.00
5 0.
360*
* 0.
012
OPC
OST
B
0.00
8 0.
000
0.07
6***
0.
004
0.00
8**
0.00
0 -0
.051
***
-0.0
03
LIQ
B
0.00
5***
0.
001
-0.0
22**
* -0
.005
0.
000
0.00
0 -0
.047
***
-0.0
12
Mer
ger
vari
able
s
AC
Qt
0.00
2***
0.
002
0.00
7***
0.
007
0.00
0 0.
000
-0.0
11**
* -0
.011
TA
RG
t 0.
002*
* 0.
002
0.01
7***
0.
017
0.00
2*
0.00
2 0.
013*
**
0.01
3 A
CQ
TAR
Gt
- -
- -
0.00
0 0.
000
-0.0
73**
* -0
.073
A
CQ
t-1
-0.0
06**
* -0
.006
-0
.011
***
-0.0
11
-0.0
03**
* -0
.003
-0
.014
***
-0.0
14
TAR
Gt-1
0.
003*
**
0.00
3 0.
098*
**
0.09
8 0.
004*
**
0.00
4 0.
109*
**
0.10
9 A
CQ
TAR
Gt-1
-
- -
- -0
.002
-0
.002
-0
.036
***
-0.0
36
Oth
er v
aria
bles
C
ON
C
- -
- -
-0.0
08**
* -0
.003
-0
.141
***
-0.0
46
STA
YED
30
9,63
3 19
2,95
7 SW
ITCH
3,
991
1,61
8 D
RO
P 33
,598
23
,282
Pseu
do R
² 4.
09%
7.
79%
Th
is ta
ble
pres
ents
the
resu
lt of
a m
ultin
omia
l log
it re
gres
sion
whe
re th
e ba
se c
ase
is a
rela
tions
hip
cont
inua
tion
(STA
YED
). Th
e co
effic
ient
s re
porte
d in
this
tabl
e ar
e to
be
inte
rpre
ted
as th
e m
argi
nal
prob
abili
ties
com
pare
d to
the
base
cas
e (M
arg.
Eff.
). W
e al
so re
port
the
impa
ct o
f a c
hang
e in
one
stan
dard
dev
iatio
n in
the
resp
ectiv
e va
riabl
e (I
mpa
ct o
f ),
whe
re fo
r a d
umm
y va
riabl
e w
e re
port
the
chan
ge o
f one
. All
regr
essi
ons
incl
ude
a co
nsta
nt te
rm, f
irm in
dust
ry d
umm
ies,
and
year
dum
mie
s (n
ot re
porte
d). D
efin
ition
s of
the
varia
bles
are
in T
able
1. *
, **,
***
den
otes
sign
ifica
nce
at th
e 10
, 5,
and
1%
-leve
l, re
spec
tivel
y (b
ased
on
hete
rosk
edas
tic-r
obus
t sta
ndar
d er
rors
).
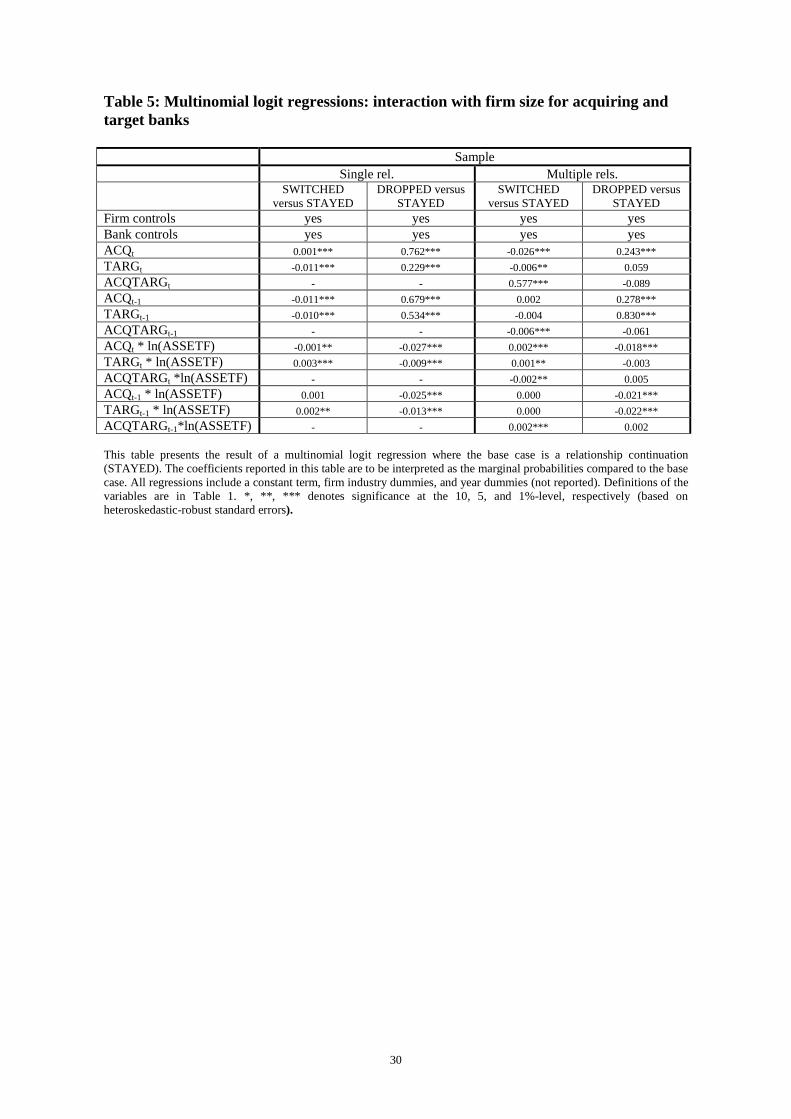
30
Table 5: Multinomial logit regressions: interaction with firm size for acquiring and target banks Sample Single rel. Multiple rels. SWITCHED
versus STAYED DROPPED versus
STAYED SWITCHED
versus STAYED DROPPED versus
STAYED Firm controls yes yes yes yes Bank controls yes yes yes yes ACQt 0.001*** 0.762*** -0.026*** 0.243*** TARGt -0.011*** 0.229*** -0.006** 0.059 ACQTARGt - - 0.577*** -0.089 ACQt-1 -0.011*** 0.679*** 0.002 0.278*** TARGt-1 -0.010*** 0.534*** -0.004 0.830*** ACQTARGt-1 - - -0.006*** -0.061 ACQt * ln(ASSETF) -0.001** -0.027*** 0.002*** -0.018*** TARGt * ln(ASSETF) 0.003*** -0.009*** 0.001** -0.003 ACQTARGt *ln(ASSETF) - - -0.002** 0.005 ACQt-1 * ln(ASSETF) 0.001 -0.025*** 0.000 -0.021*** TARGt-1 * ln(ASSETF) 0.002** -0.013*** 0.000 -0.022*** ACQTARGt-1*ln(ASSETF) - - 0.002*** 0.002 This table presents the result of a multinomial logit regression where the base case is a relationship continuation (STAYED). The coefficients reported in this table are to be interpreted as the marginal probabilities compared to the base case. All regressions include a constant term, firm industry dummies, and year dummies (not reported). Definitions of the variables are in Table 1. *, **, *** denotes significance at the 10, 5, and 1%-level, respectively (based on heteroskedastic-robust standard errors).

31
Table 6: Mergers and relationship intensity
Multiple rels Firm controls yes Bank controls yes CONC2 -0.072*** CONC3 -0.129*** CONC4 -0.147*** ACQt -0.013* TARGt 0.016** ACQTARGt -0.114*** ACQt-1*CONC1 -0.026*** ACQt-1*CONC2 -0.009* ACQt-1*CONC3 -0.019*** ACQt-1*CONC4 -0.032*** TARGt-1*CONC1 0.072*** TARGt-1*CONC2 0.082*** TARGt-1*CONC3 0.112*** TARGt-1*CONC4 0.121*** ACQTARGt-1 -0.055***
The dependent variable in the regression equals one if during the following year firm i discontinues its relationship with bank k. The reported coefficients are logit estimates of a marginal change in the independent variable on the probability of discontinuation of the lending relationship. All regressions include a constant term, firm industry dummies, and year dummies (not reported). Definitions of the variables are in Table 1. *, **, *** denotes significance at the 10, 5, and 1%-level, respectively (based on heteroskedastic-robust standard errors).
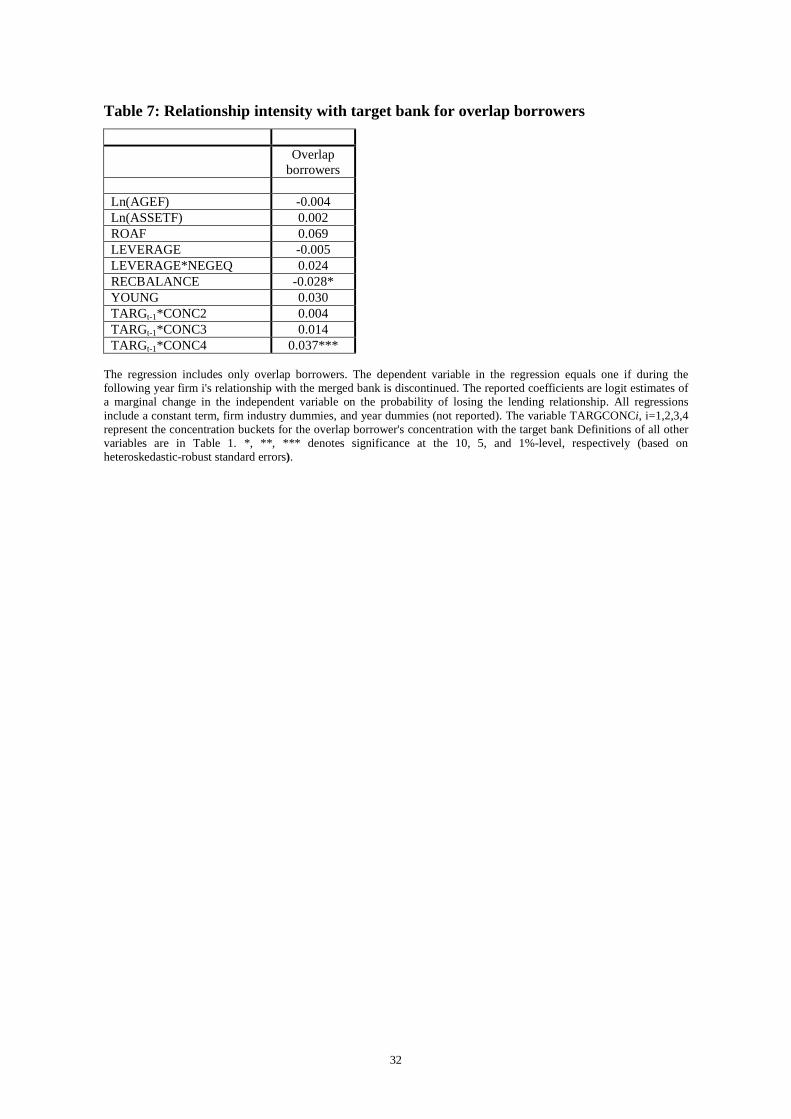
32
Table 7: Relationship intensity with target bank for overlap borrowers Overlap
borrowers Ln(AGEF) -0.004 Ln(ASSETF) 0.002 ROAF 0.069 LEVERAGE -0.005 LEVERAGE*NEGEQ 0.024 RECBALANCE -0.028* YOUNG 0.030 TARGt-1*CONC2 0.004 TARGt-1*CONC3 0.014 TARGt-1*CONC4 0.037***
The regression includes only overlap borrowers. The dependent variable in the regression equals one if during the following year firm i's relationship with the merged bank is discontinued. The reported coefficients are logit estimates of a marginal change in the independent variable on the probability of losing the lending relationship. All regressions include a constant term, firm industry dummies, and year dummies (not reported). The variable TARGCONCi, i=1,2,3,4 represent the concentration buckets for the overlap borrower's concentration with the target bank Definitions of all other variables are in Table 1. *, **, *** denotes significance at the 10, 5, and 1%-level, respectively (based on heteroskedastic-robust standard errors).
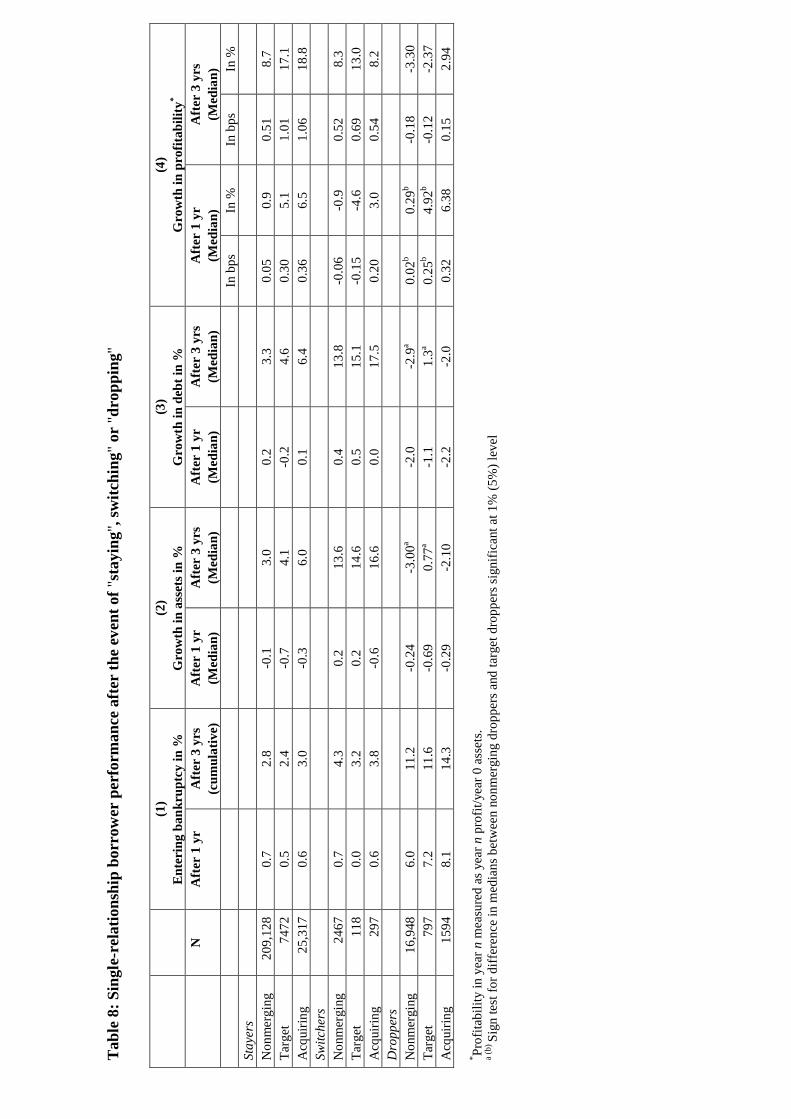
Tab
le 8
: Sin
gle-
rela
tions
hip
borr
ower
per
form
ance
aft
er th
e ev
ent o
f "st
ayin
g", s
witc
hing
" or
"dro
ppin
g"
(1)
Ent
erin
g ba
nkru
ptcy
in %
(2
) G
row
th in
ass
ets i
n %
(3
) G
row
th in
deb
t in
%
(4)
Gro
wth
in p
rofit
abili
ty*
N
A
fter
1 y
r A
fter
3 y
rs
(cum
ulat
ive)
A
fter
1 y
r (M
edia
n)
Aft
er 3
yrs
(M
edia
n)
Aft
er 1
yr
(Med
ian)
A
fter
3 y
rs
(Med
ian)
A
fter
1 y
r (M
edia
n)
Aft
er 3
yrs
(M
edia
n)
In b
ps
In %
In
bps
In
%
Stay
ers
N
onm
ergi
ng
209,
128
0.7
2.8
-0.1
3.
0 0.
2 3.
3 0.
05
0.9
0.51
8.
7 Ta
rget
74
72
0.5
2.4
-0.7
4.
1 -0
.2
4.6
0.30
5.
1 1.
01
17.1
A
cqui
ring
25
,317
0.
6 3.
0 -0
.3
6.0
0.1
6.4
0.36
6.
5 1.
06
18.8
Sw
itche
rs
N
onm
ergi
ng
2467
0.
7 4.
3 0.
2 13
.6
0.4
13.8
-0
.06
-0.9
0.
52
8.3
Targ
et
118
0.0
3.2
0.2
14.6
0.
5 15
.1
-0.1
5 -4
.6
0.69
13
.0
Acq
uirin
g
297
0.6
3.8
-0.6
16
.6
0.0
17.5
0.
20
3.0
0.54
8.
2 D
ropp
ers
N
onm
ergi
ng
16,9
48
6.0
11.2
-0
.24
-3.0
0a -2
.0
-2.9
a 0.
02b
0.29
b -0
.18
-3.3
0 Ta
rget
79
7 7.
2 11
.6
-0.6
9 0.
77a
-1.1
1.
3a 0.
25b
4.92
b -0
.12
-2.3
7 A
cqui
ring
15
94
8.1
14.3
-0
.29
-2.1
0 -2
.2
-2.0
0.
32
6.38
0.
15
2.94
* Pr
ofita
bilit
y in
yea
r n m
easu
red
as y
ear n
pro
fit/y
ear 0
ass
ets.
a (b
) Sign
test
for d
iffer
ence
in m
edia
ns b
etw
een
nonm
ergi
ng d
ropp
ers a
nd ta
rget
dro
pper
s sig
nific
ant a
t 1%
(5%
) lev
el
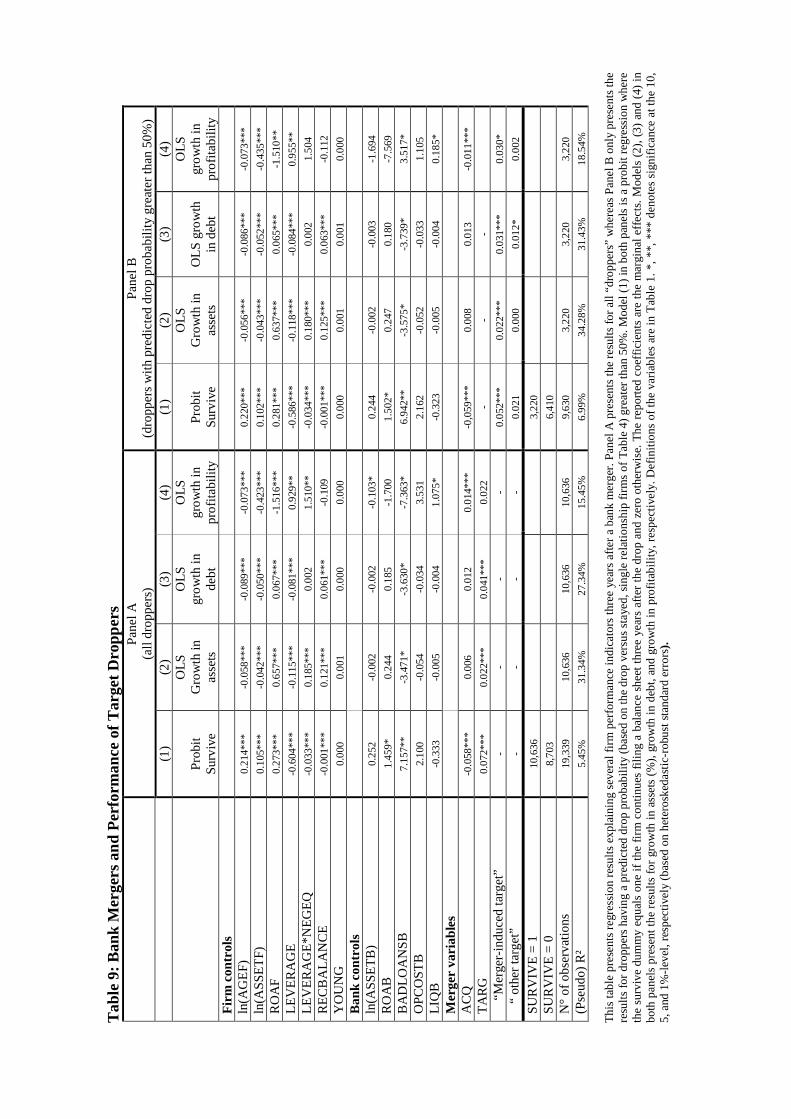
Tab
le 9
: Ban
k M
erge
rs a
nd P
erfo
rman
ce o
f Tar
get D
ropp
ers
Pa
nel A
(a
ll dr
oppe
rs)
Pane
l B
(dro
pper
s with
pre
dict
ed d
rop
prob
abili
ty g
reat
er th
an 5
0%)
(1
) (2
) (3
) (4
) (1
) (2
) (3
) (4
)
Prob
it Su
rviv
e
OLS
G
row
th in
as
sets
OLS
gr
owth
in
debt
OLS
gr
owth
in
prof
itabi
lity
Prob
it Su
rviv
e
OLS
G
row
th in
as
sets
O
LS g
row
th
in d
ebt
OLS
gr
owth
in
prof
itabi
lity
Firm
con
trol
s
ln
(AG
EF)
0.21
4***
-0
.058
***
-0.0
89**
* -0
.073
***
0.22
0***
-0
.056
***
-0.0
86**
* -0
.073
***
ln(A
SSET
F)
0.10
5***
-0
.042
***
-0.0
50**
* -0
.423
***
0.10
2***
-0
.043
***
-0.0
52**
* -0
.435
***
RO
AF
0.27
3***
0.
657*
**
0.06
7***
-1
.516
***
0.28
1***
0.
637*
**
0.06
5***
-1
.510
**
LEV
ERA
GE
-0.6
04**
* -0
.115
***
-0.0
81**
* 0.
929*
* -0
.586
***
-0.1
18**
* -0
.084
***
0.95
5**
LEV
ERA
GE*
NEG
EQ
-0.0
33**
* 0.
185*
**
0.00
2 1.
510*
* -0
.034
***
0.18
0***
0.
002
1.50
4 R
ECB
ALA
NC
E -0
.001
***
0.12
1***
0.
061*
**
-0.1
09
-0.0
01**
* 0.
125*
**
0.06
3***
-0
.112
Y
OU
NG
0.
000
0.00
1 0.
000
0.00
0 0.
000
0.00
1 0.
001
0.00
0 B
ank
cont
rols
ln(A
SSET
B)
0.25
2 -0
.002
-0
.002
-0
.103
* 0.
244
-0.0
02
-0.0
03
-1.6
94
RO
AB
1.
459*
0.
244
0.18
5 -1
.700
1.
502*
0.
247
0.18
0 -7
.569
B
AD
LOA
NSB
7.
157*
* -3
.471
* -3
.630
* -7
.363
* 6.
942*
* -3
.575
* -3
.739
* 3.
517*
O
PCO
STB
2.
100
-0.0
54
-0.0
34
3.53
1 2.
162
-0.0
52
-0.0
33
1.10
5 LI
QB
-0
.333
-0
.005
-0
.004
1.
075*
-0
.323
-0
.005
-0
.004
0.
185*
M
erge
r va
riab
les
ACQ
-0
.058
***
0.00
6 0.
012
0.01
4***
-0
,059
***
0.00
8 0.
013
-0.0
11**
* TA
RG
0.
072*
**
0.02
2***
0.
041*
**
0.02
2 -
- -
“M
erge
r-in
duce
d ta
rget
” -
- -
- 0.
052*
**
0.02
2***
0.
031*
**
0.03
0*
“
othe
r tar
get”
-
- -
- 0.
021
0.00
0 0.
012*
0.
002
SUR
VIV
E =
1 10
,636
3,22
0
SUR
VIV
E =
0 8,
703
6,
410
N
° of
obs
erva
tions
19
,339
10
,636
10
,636
10
,636
9,
630
3,22
0 3,
220
3,22
0 (P
seud
o) R
² 5.
45%
31
.34%
27
.34%
15
.45%
6.
99%
34
.28%
31
.43%
18
.54%
Th
is ta
ble
pres
ents
regr
essi
on re
sults
exp
lain
ing
seve
ral f
irm p
erfo
rman
ce in
dica
tors
thre
e ye
ars a
fter a
ban
k m
erge
r. Pa
nel A
pre
sent
s the
resu
lts fo
r all
“dro
pper
s” w
here
as P
anel
B o
nly
pres
ents
the
resu
lts fo
r dro
pper
s hav
ing
a pr
edic
ted
drop
pro
babi
lity
(bas
ed o
n th
e dr
op v
ersu
s sta
yed,
sing
le re
latio
nshi
p fir
ms o
f Tab
le 4
) gre
ater
than
50%
. Mod
el (1
) in
both
pan
els i
s a p
robi
t reg
ress
ion
whe
re
the
surv
ive
dum
my
equa
ls o
ne if
the
firm
con
tinue
s fil
ing
a ba
lanc
e sh
eet t
hree
yea
rs a
fter t
he d
rop
and
zero
oth
erw
ise.
The
repo
rted
coef
ficie
nts
are
the
mar
gina
l effe
cts.
Mod
els
(2),
(3) a
nd (4
) in
both
pan
els p
rese
nt th
e re
sults
for g
row
th in
ass
ets
(%),
grow
th in
deb
t, an
d gr
owth
in p
rofit
abili
ty, r
espe
ctiv
ely.
Def
initi
ons
of th
e va
riabl
es a
re in
Tab
le 1
. *, *
*, *
** d
enot
es si
gnifi
canc
e at
the
10,
5, a
nd 1
%-le
vel,
resp
ectiv
ely
(bas
ed o
n he
tero
sked
astic
-rob
ust s
tand
ard
erro
rs).

NBB WORKING PAPER No. 179 - OCTOBER 2009 35
NATIONAL BANK OF BELGIUM - WORKING PAPERS SERIES 1. "Model-based inflation forecasts and monetary policy rules" by M. Dombrecht and R. Wouters, Research
Series, February 2000. 2. "The use of robust estimators as measures of core inflation" by L. Aucremanne, Research Series,
February 2000. 3. "Performances économiques des Etats-Unis dans les années nonante" by A. Nyssens, P. Butzen,
P. Bisciari, Document Series, March 2000. 4. "A model with explicit expectations for Belgium" by P. Jeanfils, Research Series, March 2000. 5. "Growth in an open economy: some recent developments" by S. Turnovsky, Research Series, May 2000. 6. "Knowledge, technology and economic growth: an OECD perspective" by I. Visco, A. Bassanini,
S. Scarpetta, Research Series, May 2000. 7. "Fiscal policy and growth in the context of European integration" by P. Masson, Research Series, May
2000. 8. "Economic growth and the labour market: Europe's challenge" by C. Wyplosz, Research Series, May
2000. 9. "The role of the exchange rate in economic growth: a euro-zone perspective" by R. MacDonald,
Research Series, May 2000. 10. "Monetary union and economic growth" by J. Vickers, Research Series, May 2000. 11. "Politique monétaire et prix des actifs: le cas des Etats-Unis" by Q. Wibaut, Document Series, August
2000. 12. "The Belgian industrial confidence indicator: leading indicator of economic activity in the euro area?" by
J.-J. Vanhaelen, L. Dresse, J. De Mulder, Document Series, November 2000. 13. "Le financement des entreprises par capital-risque" by C. Rigo, Document Series, February 2001. 14. "La nouvelle économie" by P. Bisciari, Document Series, March 2001. 15. "De kostprijs van bankkredieten" by A. Bruggeman and R. Wouters, Document Series, April 2001. 16. "A guided tour of the world of rational expectations models and optimal policies" by Ph. Jeanfils,
Research Series, May 2001. 17. "Attractive Prices and Euro - Rounding effects on inflation" by L. Aucremanne and D. Cornille,
Documents Series, November 2001. 18. "The interest rate and credit channels in Belgium: an investigation with micro-level firm data" by
P. Butzen, C. Fuss and Ph. Vermeulen, Research series, December 2001. 19. "Openness, imperfect exchange rate pass-through and monetary policy" by F. Smets and R. Wouters,
Research series, March 2002. 20. "Inflation, relative prices and nominal rigidities" by L. Aucremanne, G. Brys, M. Hubert, P. J. Rousseeuw
and A. Struyf, Research series, April 2002. 21. "Lifting the burden: fundamental tax reform and economic growth" by D. Jorgenson, Research series,
May 2002. 22. "What do we know about investment under uncertainty?" by L. Trigeorgis, Research series, May 2002. 23. "Investment, uncertainty and irreversibility: evidence from Belgian accounting data" by D. Cassimon,
P.-J. Engelen, H. Meersman, M. Van Wouwe, Research series, May 2002. 24. "The impact of uncertainty on investment plans" by P. Butzen, C. Fuss, Ph. Vermeulen, Research series,
May 2002. 25. "Investment, protection, ownership, and the cost of capital" by Ch. P. Himmelberg, R. G. Hubbard,
I. Love, Research series, May 2002. 26. "Finance, uncertainty and investment: assessing the gains and losses of a generalised non-linear
structural approach using Belgian panel data", by M. Gérard, F. Verschueren, Research series, May 2002.
27. "Capital structure, firm liquidity and growth" by R. Anderson, Research series, May 2002. 28. "Structural modelling of investment and financial constraints: where do we stand?" by J.- B. Chatelain,
Research series, May 2002. 29. "Financing and investment interdependencies in unquoted Belgian companies: the role of venture
capital" by S. Manigart, K. Baeyens, I. Verschueren, Research series, May 2002. 30. "Development path and capital structure of Belgian biotechnology firms" by V. Bastin, A. Corhay,
G. Hübner, P.-A. Michel, Research series, May 2002. 31. "Governance as a source of managerial discipline" by J. Franks, Research series, May 2002.

NBB WORKING PAPER No. 179 - OCTOBER 2009 36
32. "Financing constraints, fixed capital and R&D investment decisions of Belgian firms" by M. Cincera, Research series, May 2002.
33. "Investment, R&D and liquidity constraints: a corporate governance approach to the Belgian evidence" by P. Van Cayseele, Research series, May 2002.
34. "On the Origins of the Franco-German EMU Controversies" by I. Maes, Research series, July 2002. 35. "An estimated dynamic stochastic general equilibrium model of the Euro Area", by F. Smets and
R. Wouters, Research series, October 2002. 36. "The labour market and fiscal impact of labour tax reductions: The case of reduction of employers' social
security contributions under a wage norm regime with automatic price indexing of wages", by K. Burggraeve and Ph. Du Caju, Research series, March 2003.
37. "Scope of asymmetries in the Euro Area", by S. Ide and Ph. Moës, Document series, March 2003. 38. "De autonijverheid in België: Het belang van het toeleveringsnetwerk rond de assemblage van
personenauto's", by F. Coppens and G. van Gastel, Document series, June 2003. 39. "La consommation privée en Belgique", by B. Eugène, Ph. Jeanfils and B. Robert, Document series,
June 2003. 40. "The process of European monetary integration: a comparison of the Belgian and Italian approaches", by
I. Maes and L. Quaglia, Research series, August 2003. 41. "Stock market valuation in the United States", by P. Bisciari, A. Durré and A. Nyssens, Document series,
November 2003. 42. "Modeling the Term Structure of Interest Rates: Where Do We Stand?, by K. Maes, Research series,
February 2004. 43. "Interbank Exposures: An Empirical Examination of System Risk in the Belgian Banking System", by
H. Degryse and G. Nguyen, Research series, March 2004. 44. "How Frequently do Prices change? Evidence Based on the Micro Data Underlying the Belgian CPI", by
L. Aucremanne and E. Dhyne, Research series, April 2004. 45. "Firms' investment decisions in response to demand and price uncertainty", by C. Fuss and
Ph. Vermeulen, Research series, April 2004. 46. "SMEs and Bank Lending Relationships: the Impact of Mergers", by H. Degryse, N. Masschelein and
J. Mitchell, Research series, May 2004. 47. "The Determinants of Pass-Through of Market Conditions to Bank Retail Interest Rates in Belgium", by
F. De Graeve, O. De Jonghe and R. Vander Vennet, Research series, May 2004. 48. "Sectoral vs. country diversification benefits and downside risk", by M. Emiris, Research series,
May 2004. 49. "How does liquidity react to stress periods in a limit order market?", by H. Beltran, A. Durré and P. Giot,
Research series, May 2004. 50. "Financial consolidation and liquidity: prudential regulation and/or competition policy?", by
P. Van Cayseele, Research series, May 2004. 51. "Basel II and Operational Risk: Implications for risk measurement and management in the financial
sector", by A. Chapelle, Y. Crama, G. Hübner and J.-P. Peters, Research series, May 2004. 52. "The Efficiency and Stability of Banks and Markets", by F. Allen, Research series, May 2004. 53. "Does Financial Liberalization Spur Growth?" by G. Bekaert, C.R. Harvey and C. Lundblad, Research
series, May 2004. 54. "Regulating Financial Conglomerates", by X. Freixas, G. Lóránth, A.D. Morrison and H.S. Shin, Research
series, May 2004. 55. "Liquidity and Financial Market Stability", by M. O'Hara, Research series, May 2004. 56. "Economisch belang van de Vlaamse zeehavens: verslag 2002", by F. Lagneaux, Document series,
June 2004. 57. "Determinants of Euro Term Structure of Credit Spreads", by A. Van Landschoot, Research series,
July 2004. 58. "Macroeconomic and Monetary Policy-Making at the European Commission, from the Rome Treaties to
the Hague Summit", by I. Maes, Research series, July 2004. 59. "Liberalisation of Network Industries: Is Electricity an Exception to the Rule?", by F. Coppens and
D. Vivet, Document series, September 2004. 60. "Forecasting with a Bayesian DSGE model: an application to the euro area", by F. Smets and
R. Wouters, Research series, September 2004. 61. "Comparing shocks and frictions in US and Euro Area Business Cycle: a Bayesian DSGE approach", by
F. Smets and R. Wouters, Research series, October 2004.

NBB WORKING PAPER No. 179 - OCTOBER 2009 37
62. "Voting on Pensions: A Survey", by G. de Walque, Research series, October 2004. 63. "Asymmetric Growth and Inflation Developments in the Acceding Countries: A New Assessment", by
S. Ide and P. Moës, Research series, October 2004. 64. "Importance économique du Port Autonome de Liège: rapport 2002", by F. Lagneaux, Document series,
November 2004. 65. "Price-setting behaviour in Belgium: what can be learned from an ad hoc survey", by L. Aucremanne and
M. Druant, Research series, March 2005. 66. "Time-dependent versus State-dependent Pricing: A Panel Data Approach to the Determinants of
Belgian Consumer Price Changes", by L. Aucremanne and E. Dhyne, Research series, April 2005. 67. "Indirect effects – A formal definition and degrees of dependency as an alternative to technical
coefficients", by F. Coppens, Research series, May 2005. 68. "Noname – A new quarterly model for Belgium", by Ph. Jeanfils and K. Burggraeve, Research series,
May 2005. 69. "Economic importance of the Flemish maritime ports: report 2003", F. Lagneaux, Document series, May
2005. 70. "Measuring inflation persistence: a structural time series approach", M. Dossche and G. Everaert,
Research series, June 2005. 71. "Financial intermediation theory and implications for the sources of value in structured finance markets",
J. Mitchell, Document series, July 2005. 72. "Liquidity risk in securities settlement", J. Devriese and J. Mitchell, Research series, July 2005. 73. "An international analysis of earnings, stock prices and bond yields", A. Durré and P. Giot, Research
series, September 2005. 74. "Price setting in the euro area: Some stylized facts from Individual Consumer Price Data", E. Dhyne,
L. J. Álvarez, H. Le Bihan, G. Veronese, D. Dias, J. Hoffmann, N. Jonker, P. Lünnemann, F. Rumler and J. Vilmunen, Research series, September 2005.
75. "Importance économique du Port Autonome de Liège: rapport 2003", by F. Lagneaux, Document series, October 2005.
76. "The pricing behaviour of firms in the euro area: new survey evidence, by S. Fabiani, M. Druant, I. Hernando, C. Kwapil, B. Landau, C. Loupias, F. Martins, T. Mathä, R. Sabbatini, H. Stahl and A. Stokman, Research series, November 2005.
77. "Income uncertainty and aggregate consumption, by L. Pozzi, Research series, November 2005. 78. "Crédits aux particuliers - Analyse des données de la Centrale des Crédits aux Particuliers", by
H. De Doncker, Document series, January 2006. 79. "Is there a difference between solicited and unsolicited bank ratings and, if so, why?" by P. Van Roy,
Research series, February 2006. 80. "A generalised dynamic factor model for the Belgian economy - Useful business cycle indicators and
GDP growth forecasts", by Ch. Van Nieuwenhuyze, Research series, February 2006. 81. "Réduction linéaire de cotisations patronales à la sécurité sociale et financement alternatif" by
Ph. Jeanfils, L. Van Meensel, Ph. Du Caju, Y. Saks, K. Buysse and K. Van Cauter, Document series, March 2006.
82. "The patterns and determinants of price setting in the Belgian industry" by D. Cornille and M. Dossche, Research series, May 2006.
83. "A multi-factor model for the valuation and risk management of demand deposits" by H. Dewachter, M. Lyrio and K. Maes, Research series, May 2006.
84. "The single European electricity market: A long road to convergence", by F. Coppens and D. Vivet, Document series, May 2006.
85. "Firm-specific production factors in a DSGE model with Taylor price setting", by G. de Walque, F. Smets and R. Wouters, Research series, June 2006.
86. "Economic importance of the Belgian ports: Flemish maritime ports and Liège port complex - report 2004", by F. Lagneaux, Document series, June 2006.
87. "The response of firms' investment and financing to adverse cash flow shocks: the role of bank relationships", by C. Fuss and Ph. Vermeulen, Research series, July 2006.
88. "The term structure of interest rates in a DSGE model", by M. Emiris, Research series, July 2006. 89. "The production function approach to the Belgian output gap, Estimation of a Multivariate Structural Time
Series Model", by Ph. Moës, Research series, September 2006. 90. "Industry Wage Differentials, Unobserved Ability, and Rent-Sharing: Evidence from Matched Worker-
Firm Data, 1995-2002", by R. Plasman, F. Rycx and I. Tojerow, Research series, October 2006.

NBB WORKING PAPER No. 179 - OCTOBER 2009 38
91. "The dynamics of trade and competition", by N. Chen, J. Imbs and A. Scott, Research series, October 2006.
92. "A New Keynesian Model with Unemployment", by O. Blanchard and J. Gali, Research series, October 2006.
93. "Price and Wage Setting in an Integrating Europe: Firm Level Evidence", by F. Abraham, J. Konings and S. Vanormelingen, Research series, October 2006.
94. "Simulation, estimation and welfare implications of monetary policies in a 3-country NOEM model", by J. Plasmans, T. Michalak and J. Fornero, Research series, October 2006.
95. "Inflation persistence and price-setting behaviour in the euro area: a summary of the Inflation Persistence Network evidence ", by F. Altissimo, M. Ehrmann and F. Smets, Research series, October 2006.
96. "How Wages Change: Micro Evidence from the International Wage Flexibility Project", by W.T. Dickens, L. Goette, E.L. Groshen, S. Holden, J. Messina, M.E. Schweitzer, J. Turunen and M. Ward, Research series, October 2006.
97. "Nominal wage rigidities in a new Keynesian model with frictional unemployment", by V. Bodart, G. de Walque, O. Pierrard, H.R. Sneessens and R. Wouters, Research series, October 2006.
98. "Dynamics on monetary policy in a fair wage model of the business cycle", by D. De la Croix, G. de Walque and R. Wouters, Research series, October 2006.
99. "The kinked demand curve and price rigidity: evidence from scanner data", by M. Dossche, F. Heylen and D. Van den Poel, Research series, October 2006.
100. "Lumpy price adjustments: a microeconometric analysis", by E. Dhyne, C. Fuss, H. Peseran and P. Sevestre, Research series, October 2006.
101. "Reasons for wage rigidity in Germany", by W. Franz and F. Pfeiffer, Research series, October 2006. 102. "Fiscal sustainability indicators and policy design in the face of ageing", by G. Langenus, Research
series, October 2006. 103. "Macroeconomic fluctuations and firm entry: theory and evidence", by V. Lewis, Research series,
October 2006. 104. "Exploring the CDS-Bond Basis" by J. De Wit, Research series, November 2006. 105. "Sector Concentration in Loan Portfolios and Economic Capital", by K. Düllmann and N. Masschelein,
Research series, November 2006. 106. "R&D in the Belgian Pharmaceutical Sector", by H. De Doncker, Document series, December 2006. 107. "Importance et évolution des investissements directs en Belgique", by Ch. Piette, Document series,
January 2007. 108. "Investment-Specific Technology Shocks and Labor Market Frictions", by R. De Bock, Research series,
February 2007. 109. "Shocks and frictions in US Business cycles: a Bayesian DSGE Approach", by F. Smets and R. Wouters,
Research series, February 2007. 110. "Economic impact of port activity: a disaggregate analysis. The case of Antwerp", by F. Coppens,
F. Lagneaux, H. Meersman, N. Sellekaerts, E. Van de Voorde, G. van Gastel, Th. Vanelslander, A. Verhetsel, Document series, February 2007.
111. "Price setting in the euro area: some stylised facts from individual producer price data", by Ph. Vermeulen, D. Dias, M. Dossche, E. Gautier, I. Hernando, R. Sabbatini, H. Stahl, Research series, March 2007.
112. "Assessing the Gap between Observed and Perceived Inflation in the Euro Area: Is the Credibility of the HICP at Stake?", by L. Aucremanne, M. Collin, Th. Stragier, Research series, April 2007.
113. "The spread of Keynesian economics: a comparison of the Belgian and Italian experiences", by I. Maes, Research series, April 2007.
114. "Imports and Exports at the Level of the Firm: Evidence from Belgium", by M. Muûls and M. Pisu, Research series, May 2007.
115. "Economic importance of the Belgian ports: Flemish maritime ports and Liège port complex - report 2005", by F. Lagneaux, Document series, May 2007.
116. "Temporal Distribution of Price Changes: Staggering in the Large and Synchronization in the Small", by E. Dhyne and J. Konieczny, Research series, June 2007.
117. "Can excess liquidity signal an asset price boom?", by A. Bruggeman, Research series, August 2007. 118. "The performance of credit rating systems in the assessment of collateral used in Eurosystem monetary
policy operations", by F. Coppens, F. González and G. Winkler, Research series, September 2007. 119. "The determinants of stock and bond return comovements", by L. Baele, G. Bekaert and K. Inghelbrecht,
Research series, October 2007.

NBB WORKING PAPER No. 179 - OCTOBER 2009 39
120. "Monitoring pro-cyclicality under the capital requirements directive: preliminary concepts for developing a framework", by N. Masschelein, Document series, October 2007.
121. "Dynamic order submission strategies with competition between a dealer market and a crossing network", by H. Degryse, M. Van Achter and G. Wuyts, Research series, November 2007.
122. "The gas chain: influence of its specificities on the liberalisation process", by C. Swartenbroekx, Document series, November 2007.
123. "Failure prediction models: performance, disagreements, and internal rating systems", by J. Mitchell and P. Van Roy, Research series, December 2007.
124. "Downward wage rigidity for different workers and firms: an evaluation for Belgium using the IWFP procedure", by Ph. Du Caju, C. Fuss and L. Wintr, Research series, December 2007.
125. "Economic importance of Belgian transport logistics", by F. Lagneaux, Document series, January 2008. 126. "Some evidence on late bidding in eBay auctions", by L. Wintr, Research series, January 2008. 127. "How do firms adjust their wage bill in Belgium? A decomposition along the intensive and extensive
margins", by C. Fuss, Research series, January 2008. 128. "Exports and productivity – comparable evidence for 14 countries", by The International Study Group on
Exports and Productivity, Research series, February 2008. 129. "Estimation of monetary policy preferences in a forward-looking model: a Bayesian approach", by
P. Ilbas, Research series, March 2008. 130. "Job creation, job destruction and firms' international trade involvement", by M. Pisu, Research series,
March 2008. 131. "Do survey indicators let us see the business cycle? A frequency decomposition", by L. Dresse and
Ch. Van Nieuwenhuyze, Research series, March 2008. 132. "Searching for additional sources of inflation persistence: the micro-price panel data approach", by
R. Raciborski, Research series, April 2008. 133. "Short-term forecasting of GDP using large monthly datasets - A pseudo real-time forecast evaluation
exercise", by K. Barhoumi, S. Benk, R. Cristadoro, A. Den Reijer, A. Jakaitiene, P. Jelonek, A. Rua, G. Rünstler, K. Ruth and Ch. Van Nieuwenhuyze, Research series, June 2008.
134. "Economic importance of the Belgian ports: Flemish maritime ports, Liège port complex and the port of Brussels - report 2006" by S. Vennix, Document series, June 2008.
135. "Imperfect exchange rate pass-through: the role of distribution services and variable demand elasticity", by Ph. Jeanfils, Research series, August 2008.
136. "Multivariate structural time series models with dual cycles: Implications for measurement of output gap and potential growth", by Ph. Moës, Research series, August 2008.
137. "Agency problems in structured finance - a case study of European CLOs", by J. Keller, Document series, August 2008.
138. "The efficiency frontier as a method for gauging the performance of public expenditure: a Belgian case study", by B. Eugène, Research series, September 2008.
139. "Exporters and credit constraints. A firm-level approach", by M. Muûls, Research series, September 2008.
140. "Export destinations and learning-by-exporting: Evidence from Belgium", by M. Pisu, Research series, September 2008.
141. "Monetary aggregates and liquidity in a neo-Wicksellian framework", by M. Canzoneri, R. Cumby, B. Diba and D. López-Salido, Research series, October 2008.
142 "Liquidity, inflation and asset prices in a time-varying framework for the euro area, by Ch. Baumeister, E. Durinck and G. Peersman, Research series, October 2008.
143. "The bond premium in a DSGE model with long-run real and nominal risks", by Glenn D. Rudebusch and Eric T. Swanson, Research series, October 2008.
144. "Imperfect information, macroeconomic dynamics and the yield curve: an encompassing macro-finance model", by H. Dewachter, Research series, October 2008.
145. "Housing market spillovers: evidence from an estimated DSGE model", by M. Iacoviello and S. Neri, Research series, October 2008.
146. "Credit frictions and optimal monetary policy", by V. Cúrdia and M. Woodford, Research series, October 2008.
147. "Central Bank misperceptions and the role of money in interest rate rules", by G. Beck and V. Wieland, Research series, October 2008.
148. "Financial (in)stability, supervision and liquidity injections: a dynamic general equilibrium approach", by G. de Walque, O. Pierrard and A. Rouabah, Research series, October 2008.

NBB WORKING PAPER No. 179 - OCTOBER 2009 40
149. "Monetary policy, asset prices and macroeconomic conditions: a panel-VAR study", by K. Assenmacher-Wesche and S. Gerlach, Research series, October 2008.
150. "Risk premiums and macroeconomic dynamics in a heterogeneous agent model", by F. De Graeve, M. Dossche, M. Emiris, H. Sneessens and R. Wouters, Research series, October 2008.
151. "Financial factors in economic fluctuations", by L. J. Christiano, R. Motto and M. Rotagno, Research series, to be published.
152. "Rent-sharing under different bargaining regimes: Evidence from linked employer-employee data", by M. Rusinek and F. Rycx, Research series, December 2008.
153. "Forecast with judgment and models", by F. Monti, Research series, December 2008. 154. "Institutional features of wage bargaining in 23 European countries, the US and Japan", by Ph. Du Caju,
E. Gautier, D. Momferatou and M. Ward-Warmedinger, Research series, December 2008. 155. "Fiscal sustainability and policy implications for the euro area", by F. Balassone, J. Cunha, G. Langenus,
B. Manzke, J Pavot, D. Prammer and P. Tommasino, Research series, January 2009. 156. "Understanding sectoral differences in downward real wage rigidity: workforce composition, institutions,
technology and competition", by Ph. Du Caju, C. Fuss and L. Wintr, Research series, February 2009. 157. "Sequential bargaining in a New Keynesian model with frictional unemployment and staggered wage
negotiation", by G. de Walque, O. Pierrard, H. Sneessens and R. Wouters, Research series, February 2009.
158. "Economic Importance of Air Transport and Airport Activities in Belgium", by F. Kupfer and F. Lagneaux, Document series, March 2009.
159. "Rigid labour compensation and flexible employment? Firm-Level evidence with regard to productivity for Belgium", by C. Fuss and L. Wintr, Research series, March 2009.
160. "The Belgian Iron and Steel Industry in the International Context", by F. Lagneaux and D. Vivet, Document series, March 2009.
161. "Trade, wages and productivity", by K. Behrens, G. Mion, Y. Murata and J. Südekum, Research series, March 2009.
162. "Labour flows in Belgium", by P. Heuse and Y. Saks, Research series, April 2009. 163. "The young Lamfalussy: an empirical and policy-oriented growth theorist", by I. Maes, Research series,
April 2009. 164. "Inflation dynamics with labour market matching: assessing alternative specifications", by K. Christoffel,
J. Costain, G. de Walque, K. Kuester, T. Linzert, S. Millard and O. Pierrard, Research series, May 2009. 165. "Understanding inflation dynamics: Where do we stand?", by M. Dossche, Research series, June 2009. 166. "Input-output connections between sectors and optimal monetary policy", by E. Kara, Research series,
June 2009. 167. "Back to the basics in banking? A micro-analysis of banking system stability", by O. De Jonghe,
Research series, June 2009. 168. "Model misspecification, learning and the exchange rate disconnect puzzle", by V. Lewis and
A. Markiewicz, Research series, July 2009. 169. "The use of fixed-term contracts and the labour adjustment in Belgium", by E. Dhyne and B. Mahy,
Research series, July 2009. 170. "Analysis of business demography using markov chains – An application to Belgian data”, by F. Coppens
and F. Verduyn, Research series, July 2009. 171. "A global assessment of the degree of price stickiness - results from the NBB business survey", by
E. Dhyne, Research series, July 2009. 172. "Economic importance of the Belgian ports: Flemish maritime ports, Liège port complex and the port of
Brussels - report 2007" by C. Mathys, Document series, July 2009. 173. "Evaluating a monetary business cycle model with unemployment for the euro area", by N. Groshenny,
Research series, July 2009. 174. "How are firms' wages and prices linked: survey evidence in Europe", by M. Druant, S. Fabiani, G. Kezdi,
A. Lamo, F. Martins and R. Sabbatini, Research series, August 2009. 175. "Micro-data on nominal rigidity, inflation persistence and optimal monetary policy", by E. Kara, Research
series, September 2009. 176. "On the origins of the BIS macro-prudential approach to financial stability: Alexandre Lamfalussy and
financial fragility", by I. Maes, Research series, October 2009. 177. "Incentives and tranche retention in securitisation: a screening model", by I. Fender and J. Mitchell,
Research series, October 2009. 178. "Optimal monetary policy and firm entry", by V. Lewis, Research series, October 2009.

NBB WORKING PAPER No. 179 - OCTOBER 2009 41
179. "Staying, dropping, or switching: the impacts of bank mergers on small firms", by H. Degryse, N. Masschelein and J. Mitchell, Research series, October 2009.