the glass mosaics tesserae of “villa del casale” (piazza armerina, italy): a multi-technique...
TRANSCRIPT

1 23
Archaeological and AnthropologicalSciences ISSN 1866-9557 Archaeol Anthropol SciDOI 10.1007/s12520-013-0172-1
The glass mosaics tesserae of “Villa delCasale” (Piazza Armerina, Italy): a multi-technique archaeometric study
Marcella Di Bella, Simona Quartieri,Giuseppe Sabatino, Francesco Santalucia& Maurizio Triscari

1 23
Your article is protected by copyright and
all rights are held exclusively by Springer-
Verlag Berlin Heidelberg. This e-offprint is
for personal use only and shall not be self-
archived in electronic repositories. If you wish
to self-archive your article, please use the
accepted manuscript version for posting on
your own website. You may further deposit
the accepted manuscript version in any
repository, provided it is only made publicly
available 12 months after official publication
or later and provided acknowledgement is
given to the original source of publication
and a link is inserted to the published article
on Springer's website. The link must be
accompanied by the following text: "The final
publication is available at link.springer.com”.

ORIGINAL PAPER
The glass mosaics tesserae of “Villa del Casale”(Piazza Armerina, Italy): a multi-technique archaeometricstudy
Marcella Di Bella & Simona Quartieri &Giuseppe Sabatino & Francesco Santalucia &
Maurizio Triscari
Received: 8 October 2013 /Accepted: 22 November 2013# Springer-Verlag Berlin Heidelberg 2013
Abstract Awide selection of glass tesserae from mosaics ofthe Roman “Villa del Casale” (Piazza Armerina, Enna, Italy)were characterized from a chemical and textural perspective,with the aim of providing archaeometric information about theraw materials and manufacturing techniques utilized at thisarchaeological site of utmost importance. The studied samplesare vitreous colored tesserae, both opaque and transparent.The textures and chemical compositions of the coloring andopacifying agents were determined through a multi-techniqueapproach based on scanning electron microscopy, X-ray dif-fraction, electronmicroprobe analyses for major elements, andinductively coupled plasma mass spectrometry for trace ele-ments. On the basis of major element contents, the samplescan be classified as natron-based silica–lime glasses. Asregards the opacifiers/coloring materials, a substantial use ofPb and Ca antimonates, and metallic copper was observed. Aslight enrichment of heavy rare earth elements (REE) relative tolight REE, and a number of positive correlations between highfield-strength elements suggest that the raw materials used forthe production of the Piazza Armerina tesserae included amature sand, enriched in quartz and heavy mineral phases.
Keywords Glass tesserae . Romanmosaics . PiazzaArmerina .Opacifiers .Chromophores .SEM-EDX .EMPA .
LA–ICP–MS
Introduction
The archaeological site of “Villa del Casale” near PiazzaArmerina (Enna, Sicily) represents one of the most importantexamples of Romanmosaic art in theMediterranean area and isincluded in UNESCO’s World Heritage List (Fig. 1). The Villais located on the road connecting the cities of Catania andAgrigento and was built in late third century to early fourthcentury AD by order of an eminent member of the RomanSenatorial aristocracy. Based on stratigraphic and historicaldata, and literary sources, the dating of the Villa is fixed asnot later than 340AD (Pensabene and Gallocchio 2011).
“Villa del Casale” has more than 3,500 m2 of polychromaticfloor mosaics (Gentili 1954) in opus tessellatum and opussectile, considered to be among the most important mosaicdecorations in Italy. The majority of panels are polychromaticand represent a wide range of subjects including mythologicalscenes from daily life, and special occasions like a great hunt,circus games, festival days honoring the gods, and a grapeharvest, alternating with geometric decorations incorporatingmedallions stars and key patterns in a wonderful array of colors.
Notwithstanding their archaeological and artistic impor-tance, these famous and beautiful mosaics—made using col-ored vitreous tesserae—have only recently been studied froman archaeometric point of view (Sabatino 2007; Triscari et al.2007; Croveri et al. 2010), and a systematic investigation(in particular regarding their minor and trace elementcontents) is, to our knowledge, still lacking.
The most recent study of the glass materials used for theproduction of the “Villa del Casale” mosaics (Croveri et al.2010) contributed to a project to safeguard the archaeologicalsite, providing information on the porosity of glass pastes andthe presence of crystalline areas or alteration layers on thesurface of the glass paste itself. Moreover, several
Maurizio Triscari is a retired professor at Università di Messina.
M. Di Bella : S. Quartieri :G. Sabatino (*) :M. TriscariDipartimento di Fisica e Scienze della Terra, Università di Messina,Viale F. Stagno d’Alcontres 31, 98166 Messina S. Agata, Italye-mail: [email protected]
F. SantaluciaMuseo Interdisciplinare Regionale “Giuseppe Alessi”, PiazzaMazzini 8, 94100 Enna, Italy
Archaeol Anthropol SciDOI 10.1007/s12520-013-0172-1
Author's personal copy

chromophore ions (Cu2+, Cu0, Fe2, Co2+) and opacifiers(PbxSb2−z(O,OH,H2O)6, CaSb2O6, Ca2Sb2O7) were identifiedin the ten samples studied in the same work. No furtherinformation is available for minor and trace elementdistributions.
This work extends archaeometric knowledge of the glassmosaic tesserae of “Villa del Casale”, investigating the chem-ical composition and the nature of the glass matrix, colorants,decolorants, and opacifying agents across a very wide set ofmosaic tesserae, with chemical investigations also extended totrace elements. Specifically, the investigation involved
1. the morphological and geochemical analysis of a large setof selected glass tesserae, performed using a multi-technique approach based on scanning electron micros-copy (SEM-EDS), electron microprobe analysis (EMPA),and laser ablation inductively coupled plasma mass spec-trometry (LA–ICP–MS). Some trace elements—includ-ing rare earth elements (REE), high field strength ele-ments (HFSE), and transition metals—were used to ob-tain information on the possible composition of the rawmaterials;
2. the identification of colorants and opacifying agents, bymeans of SEM-EDS and X-ray powder diffraction(XRPD);
3. the comparison of the present compositional data withthose of glass materials of the same age found at otherarchaeological sites, with the aim of obtaining informa-tion on the origin of the raw glass and/or possible glass
trading. This, in turn, can shed light on the economic andcultural connections between Sicily and the other regionsof the Roman Empire.
Materials and experimental methods
The glass tesserae from Piazza Armerina (hereafter PA) wereprovided by the Soprintendenza BB.CC. of Enna. Figure 2reports images of selected samples, representative of the var-ious colors present in the glassy tesserae of “Villa del Casale”mosaics. Two series of samples, for a total of 47 tesserae, werecollected. The first suite (PAM series; Fig. 2), includes fivesamples directly taken from a mosaic located in a room of theVillae (identified by a red dot in Fig. 1): yellow PAM1, greenPAM2, white PAM3, turquoise PAM4, and blue PAM5. Theother series, referred in the following generically as “erratic”,is composed by tesserae belonging to Piazza Armerina Villaearchaeological site, but coming from not perfectly preservedmosaics. These samples have been used in this study not tocause further damages to themosaics still in situ. Among theselast materials, 42 tesserae of the most representative colorswere selected: 12 yellow (PAG5-1, PAG5-2, PAG5-3, PAG5-8, PAG5-10, PAG8-1, PAG8-2, PAG8-3, PAG2-4, PAG8-5,PAG8-6, PAG9-7), 14 blue (PAG1-2, PAG1-4, PAG2-1,PAG2-8, PAG2-9, PAG3-1, PAG3-2, PAG3-4, PAG7-2,PAG7-9, PAG7-10, PAG7-13, PAG7-14, PAG7-15), 3 red(PAG6-1, PAG6-2, PAG6-3), 4 white (PAG11-1, PAG11-2,
Fig. 1 Schematic map of thePiazza Armerina Villa del Casaleand representative images of themosaics. The red dot indicates theroom hosting the mosaic fromwhich PAM tesserae weresampled
Archaeol Anthropol Sci
Author's personal copy
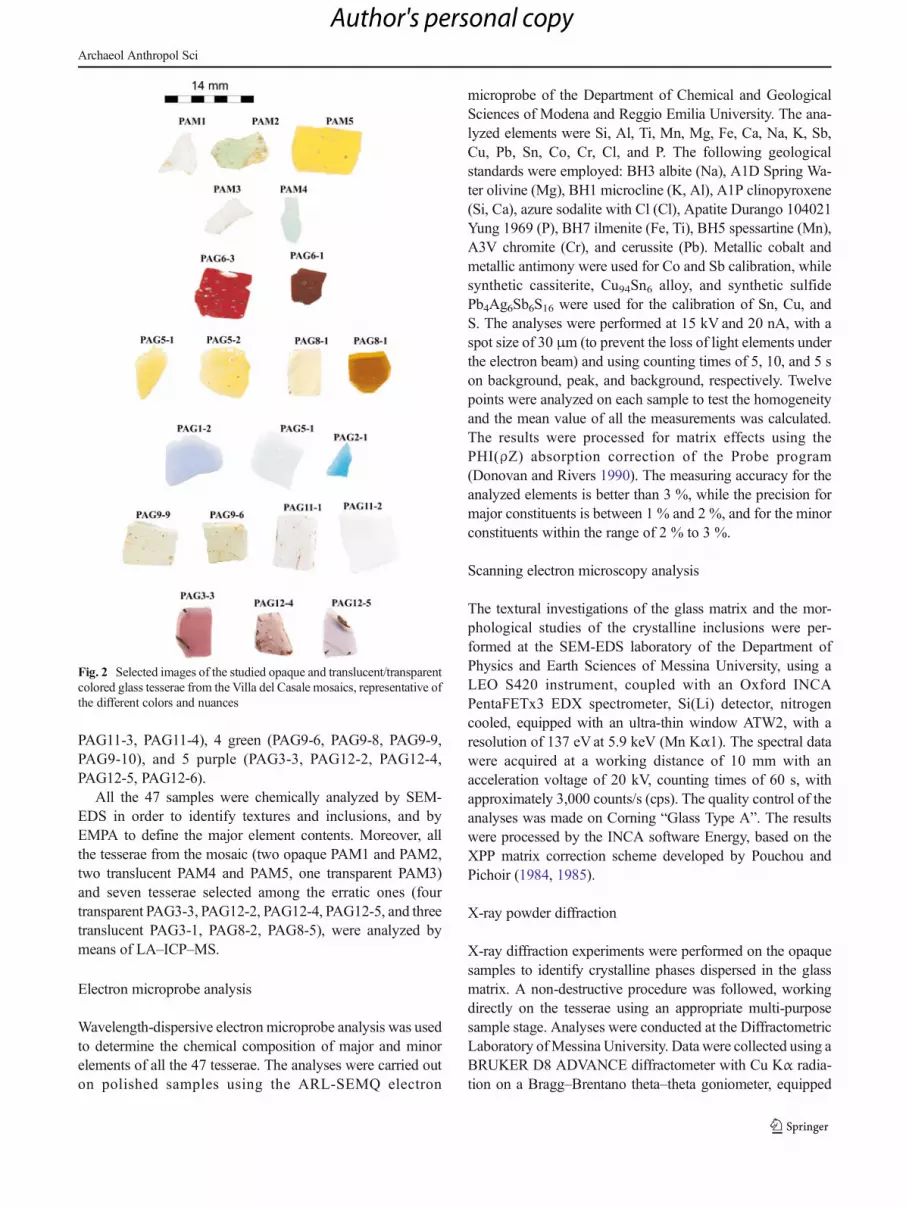
PAG11-3, PAG11-4), 4 green (PAG9-6, PAG9-8, PAG9-9,PAG9-10), and 5 purple (PAG3-3, PAG12-2, PAG12-4,PAG12-5, PAG12-6).
All the 47 samples were chemically analyzed by SEM-EDS in order to identify textures and inclusions, and byEMPA to define the major element contents. Moreover, allthe tesserae from the mosaic (two opaque PAM1 and PAM2,two translucent PAM4 and PAM5, one transparent PAM3)and seven tesserae selected among the erratic ones (fourtransparent PAG3-3, PAG12-2, PAG12-4, PAG12-5, and threetranslucent PAG3-1, PAG8-2, PAG8-5), were analyzed bymeans of LA–ICP–MS.
Electron microprobe analysis
Wavelength-dispersive electron microprobe analysis was usedto determine the chemical composition of major and minorelements of all the 47 tesserae. The analyses were carried outon polished samples using the ARL-SEMQ electron
microprobe of the Department of Chemical and GeologicalSciences of Modena and Reggio Emilia University. The ana-lyzed elements were Si, Al, Ti, Mn, Mg, Fe, Ca, Na, K, Sb,Cu, Pb, Sn, Co, Cr, Cl, and P. The following geologicalstandards were employed: BH3 albite (Na), A1D Spring Wa-ter olivine (Mg), BH1 microcline (K, Al), A1P clinopyroxene(Si, Ca), azure sodalite with Cl (Cl), Apatite Durango 104021Yung 1969 (P), BH7 ilmenite (Fe, Ti), BH5 spessartine (Mn),A3V chromite (Cr), and cerussite (Pb). Metallic cobalt andmetallic antimony were used for Co and Sb calibration, whilesynthetic cassiterite, Cu94Sn6 alloy, and synthetic sulfidePb4Ag6Sb6S16 were used for the calibration of Sn, Cu, andS. The analyses were performed at 15 kV and 20 nA, with aspot size of 30 μm (to prevent the loss of light elements underthe electron beam) and using counting times of 5, 10, and 5 son background, peak, and background, respectively. Twelvepoints were analyzed on each sample to test the homogeneityand the mean value of all the measurements was calculated.The results were processed for matrix effects using thePHI(ρZ) absorption correction of the Probe program(Donovan and Rivers 1990). The measuring accuracy for theanalyzed elements is better than 3 %, while the precision formajor constituents is between 1 % and 2 %, and for the minorconstituents within the range of 2 % to 3 %.
Scanning electron microscopy analysis
The textural investigations of the glass matrix and the mor-phological studies of the crystalline inclusions were per-formed at the SEM-EDS laboratory of the Department ofPhysics and Earth Sciences of Messina University, using aLEO S420 instrument, coupled with an Oxford INCAPentaFETx3 EDX spectrometer, Si(Li) detector, nitrogencooled, equipped with an ultra-thin window ATW2, with aresolution of 137 eVat 5.9 keV (Mn Kα1). The spectral datawere acquired at a working distance of 10 mm with anacceleration voltage of 20 kV, counting times of 60 s, withapproximately 3,000 counts/s (cps). The quality control of theanalyses was made on Corning “Glass Type A”. The resultswere processed by the INCA software Energy, based on theXPP matrix correction scheme developed by Pouchou andPichoir (1984, 1985).
X-ray powder diffraction
X-ray diffraction experiments were performed on the opaquesamples to identify crystalline phases dispersed in the glassmatrix. A non-destructive procedure was followed, workingdirectly on the tesserae using an appropriate multi-purposesample stage. Analyses were conducted at the DiffractometricLaboratory ofMessina University. Data were collected using aBRUKER D8 ADVANCE diffractometer with Cu Kα radia-tion on a Bragg–Brentano theta–theta goniometer, equipped
Fig. 2 Selected images of the studied opaque and translucent/transparentcolored glass tesserae from the Villa del Casale mosaics, representative ofthe different colors and nuances
Archaeol Anthropol Sci
Author's personal copy

with a SiLi solid-state detector, Sol-X. The patterns werecollected from 2 to 80 −2 theta degrees, with a step size of0.02° and a count time of 1 s. Observed peak positions werematched against the ICDD–JCPDS database.
Laser ablation inductively coupled plasma mass spectrometry
The trace element analyses were performed at the Departmentof Earth Science of Perugia University, with a Thermo Elec-tron X7 quadrupole based ICP–MS coupled with a frequencyquintupled (l =213 nm) Nd: YAG laser. The laser repetitionrate and laser energy density on the sample surface were fixedat 10 Hz and ~10 J cm−2, respectively. The analyses wereperformed using a laser spot diameter of 70 μm on the samepolished samples used for EMPA analyses. Calibration wasperformed utilizing the NIST SRM 612 glass as externalstandard. 29Si, previously determined by EMPA, was used asinternal standard, following the method proposed byLongerich et al. (1996) and the analytical protocol describedin Petrelli et al. (2008). The reference material USGS BCR2Gwas analyzed to test the analysis quality. Precision and accu-racy were better than 7 % and 8 %, respectively (Petrelli et al.2008).
Results and discussion
Major elements and glass classification
The EMPA results for the 47 PA tesserae are reported inTable 1. The major components of the raw glass vary in thefollowing ranges: SiO2 from 62 % to 70 %, Na2O from 14 %to 19%, CaO from 4% to 10%, and Al2O3 from 1.8% to 4%.The samples are characterized by low contents of potash(K2O, 0.5–1.30 %) and magnesia (MgO, 0.3–1.4 %); hence,the rawmaterial can be classified as natron-based silica–soda–lime glass (see the K2O vs. MgO classification diagram ofFig. 3a). These data are in agreement with those reported inCroveri et al. (2010) for other PA tesserae. This type of rawglass is a peculiar feature of Roman and Byzantine glass findsfrom the Western Mediterranean area, produced with sili-ceous–calcareous sands (e.g., Turner 1956; Sayre and Smith1974; Henderson 1985; Verità 1995; Freestone et al. 2002a, b;Sabatino 2007; Arletti 2005; Arletti et al. 2005, 2010) andcharacterized by lowMgO and K2O contents (less than 1.5 %)and high Na2O content, which usually ranges from 14 % to19 %. In Europe, natron-like glass was widely used in glassproduction from the sixth and seventh centuries BC up to theend of the first millennium AD, when it was substituted byplant ash (Lilyquist and Brill 1995). Moreover, the CaO vs.Al2O3 diagram (Fig. 3b), which is largely used for discrimi-nating the silica source (Sayre and Smith 1961; Lilyquist andBrill 1995; Freestone et al. 2002b), shows that the PA tesserae
mainly fall in the ranges 5–8 % and 1.7–2.7 % for lime andalumina, respectively. Among the few exceptions, PAG3-2and PAG2-9 are characterized by higher lime contents,PAG12-4 by a lower lime content, and PAG9-9 by a higheralumina content. The samples that show very different ratiosof the two components could be produced with a differentstarting raw material.
The contents of chlorine and sulfur in the analyzed tesseraeare derived by the presence of halite (NaCl) and thenardite(Na2SO4) in various proportions in the natron composition(Abd-Allah 2007, 2010; Henderson 1985; Shortland et al.2007; Silvestri et al. 2008). Manganese (MnO, 0.03–0.8 %)was present as minor component in the original sands orintentionally added to change the glass color. In particular, insome purple tesseraeMnwas intentionally added to obtain thedesired color nuances. On the contrary, TiO2 never exceeds0.3 %, and hence it is ascribable to impurities of heavyminerals in the raw sands. As regards antimony oxide, largelyused as decolorizing and opacifying agent, it is particularlyabundant in the opaque blue and in the white tesserae. Leadoxide contents are very high in the opaque yellow tesserae andrelatively high in the green and red ones.
Textural features, colorants, and opacifiers
Opaque red tesserae
Under SEM observation, the red tesserae (PAG6-1, PAG6-2,PAG6-3) exhibit various textures (Fig. 4a, b), depending onthe different distributions of the sub-micrometer clusters ofmetallic copper, widely dispersed in the glass matrix. Theseclusters are clearly visible in Fig. 4b and, as confirmed bynumerous previous investigations (see for example Weyl1959, Brill and Cahill 1988, Nakai et al. 1999, Shugar 2000,Arletti et al. 2006a, b, and references herein cited; Sabatino2007, Santagostino Barbone et al. 2008), are the origin of bothopacity and the red color. Sample PAG6-1 is chemically andtexturally inhomogeneous (Table 2), with alternating dark andlight zoned bands (Fig. 4a), whereas PAG6-2 and PAG6-3 arerelatively homogeneous from a chemical and textural point ofview. SEM-EDS data relative to the chemically differentbands, reported in Table 2, evidenced that the compositionof dark zoned bands is Pb-free, while the light zoned bands arericher in Pb (PbO 15.6 %).
The small size of the Cu clusters made impossible toaccurately avoid the effects of the surrounding glass compo-sition on the chemical analyses reported in Table 2. SEMback-scattered electron images (BSE) revealed cluster dimen-sions ranging from less than 1 nm to 200–300 nm (Fig. 4b).Moreover, a detailed observation of the clusters revealed thetypical rounded morphology of metallic copper clusters, un-like the dendritic morphology of cuprite (Arletti et al. 2006a,b). The nature of the clusters was also confirmed by the
Archaeol Anthropol Sci
Author's personal copy

Tab
le1
EMPA
analyses
ofthePiazza
Arm
erinatesserae
here
studied(oneach
sample,12
spotshave
been
analyzed;the
standard
deviations
areidentifiedwith
std)
SiO
2Al 2O3
TiO
2MnO
MgO
FeO
CaO
Na 2O
K2O
PbO
Sb2O3
Cu 2O
CoO
SnO2
SO3
Cl
Cr 2O3
P2O5
Total
Sam
ples
from
mosaic
PAM1opaque
yello
w65.04
2.60
0.12
0.31
0.53
0.64
6.10
18.06
0.77
0.71
0.77
3.83
0.10
0.02
0.34
0.99
0.02
0.07
101.00
std
0.31
0.19
0.02
0.02
0.05
0.23
0.16
0.29
0.03
0.16
0.02
0.65
0.04
0.06
0.06
0.05
0.02
0.03
PAM2opaque
palegreen
66.79
2.23
0.14
0.40
0.55
0.65
5.17
19.13
0.69
0.56
1.55
1.86
0.06
0.01
0.32
1.07
0.03
0.10
101.32
std
0.46
0.04
0.05
0.02
0.01
0.04
0.08
0.07
0.03
0.05
0.05
0.11
0.02
0.06
0.05
0.06
0.02
0.06
PAM3transparentw
hite
66.55
2.63
0.14
0.68
0.63
0.63
6.08
18.23
0.72
3.55
0.05
0.09
0.02
0.03
0.45
0.70
0.01
0.09
101.26
std
0.67
0.08
0.02
0.02
0.01
0.03
0.40
0.12
0.05
0.06
0.02
0.07
0.02
0.03
0.03
0.05
0.01
0.02
PAM4translucentturquoise
65.76
2.19
0.09
0.06
0.53
0.59
6.71
18.68
0.63
1.90
2.19
0.14
0.15
nd0.52
0.87
nd0.04
101.06
std
0.94
0.15
0.02
0.03
0.02
0.04
0.24
0.99
0.05
0.06
0.09
0.29
0.02
0.05
0.09
0.03
PAM5translucentb
lue
67.66
2.69
0.08
0.79
0.58
0.60
7.88
17.27
0.64
1.09
0.16
0.22
0.02
0.03
0.28
0.84
0.01
0.16
101.00
std
0.82
0.18
0.01
0.17
0.04
0.17
0.32
0.27
0.04
0.71
0.03
0.22
0.02
0.02
0.09
0.06
0.01
0.07
Other
tesserae
yello
w
PAG5-1opaque
paleyello
w65.36
1.89
0.09
0.18
0.44
0.39
5.44
18.23
0.52
0.72
0.01
4.57
0.08
0.02
0.31
0.91
0.02
0.02
99.20
std
0.27
0.02
0.06
0.03
0.03
0.02
0.09
0.16
0.01
0.05
0.02
0.20
0.06
0.04
0.06
0.10
0.02
0.02
PAG5-2opaque
paleyello
w65.48
2.45
0.10
0.29
0.47
0.44
5.89
17.88
0.76
0.67
0.01
5.20
0.04
0.02
0.29
1.01
0.01
0.06
101.07
std
1.36
0.09
0.02
0.06
0.06
0.30
0.54
0.94
0.05
0.07
0.03
1.24
0.01
0.02
0.03
0.04
0.01
0.05
PAG5-3opaque
paleyello
w64.39
2.50
0.12
0.21
0.55
0.70
4.91
18.25
0.67
0.69
0.02
4.70
0.01
0.01
0.35
1.11
0.02
0.04
99.25
std
0.84
0.09
0.03
0.06
0.03
0.13
0.31
0.50
0.04
0.15
0.04
0.48
0.02
0.03
0.05
0.06
0.01
0.04
PAG5-8opaque
paleyello
w66.05
2.20
0.07
0.23
0.35
0.41
5.30
17.90
0.55
0.79
0.08
3.93
0.06
0.03
0.40
1.21
0.01
0.06
99.63
std
0.64
0.04
0.03
0.02
0.03
0.15
0.20
0.20
0.04
0.04
0.04
0.07
0.02
0.02
0.02
0.10
0.02
0.02
PAG5-10
opaque
paleyello
w65.44
2.38
0.10
0.24
0.46
0.52
5.37
18.01
0.66
0.72
0.02
4.71
0.04
0.02
0.35
1.11
0.01
0.05
100.20
std
0.64
0.08
0.02
0.02
0.03
0.03
0.27
0.29
0.03
0.22
0.07
0.05
0.02
0.02
0.04
0.08
0.03
0.03
PAG8-1translucentd
arkyello
w71.19
2.35
0.07
0.42
0.54
0.34
6.91
17.06
0.85
0.01
0.01
0.01
0.01
0.01
0.18
0.81
0.03
0.17
100.97
std
0.97
0.06
0.01
0.02
0.04
0.03
0.25
0.30
0.08
0.01
0.01
0.02
0.01
0.02
0.03
0.08
0.01
0.01
PAG8-2translucentd
arkyello
w69.73
4.37
0.09
0.19
0.40
0.30
5.62
18.74
1.05
0.04
nd0.03
ndnd
0.07
1.09
0.02
0.15
101.89
std
0.30
1.67
0.01
0.04
0.08
0.05
2.14
0.91
0.32
0.03
0.00
0.04
0.00
0.00
0.04
0.13
0.02
0.05
PAG8-3translucentlight
yello
w69.59
2.46
0.06
0.24
0.53
0.34
8.56
17.78
0.67
0.07
0.01
0.11
nd0.01
0.14
1.00
0.01
0.20
101.78
std
0.55
0.06
0.03
0.02
0.03
0.02
0.48
0.12
0.01
0.06
0.02
0.10
0.01
0.01
0.01
0.07
0.03
0.03
PAG8-4translucentlight
yello
w69.16
2.42
0.08
0.26
0.48
0.36
7.86
17.69
0.70
0.04
nd0.13
0.03
0.03
0.13
1.00
nd0.08
100.45
std
0.78
0.04
0.02
0.02
0.02
0.02
0.15
0.02
0.04
0.05
0.03
0.02
0.01
0.04
0.01
0.08
0.02
PAG8-5translucentlight
yello
w70.40
2.55
0.06
0.28
0.48
0.28
7.81
16.97
0.70
0.04
0.02
0.11
0.02
0.01
0.13
0.99
0.01
0.12
100.98
std
0.80
0.03
0.03
0.03
0.02
0.04
0.27
0.07
0.01
0.04
0.02
0.10
0.01
0.01
0.03
0.04
0.03
0.02
PAG8-6translucentd
arkyello
w69.30
2.56
0.07
0.48
0.55
0.32
8.35
17.15
0.82
0.05
nd0.02
ndnd
0.07
1.03
nd0.15
100.92
std
0.78
0.04
0.02
0.02
0.02
0.02
0.15
0.25
0.04
0.05
0.02
0.01
0.08
0.02
Archaeol Anthropol Sci
Author's personal copy

Tab
le1
(contin
ued)
SiO
2Al 2O3
TiO
2MnO
MgO
FeO
CaO
Na 2O
K2O
PbO
Sb2O3
Cu 2O
CoO
SnO2
SO3
Cl
Cr 2O3
P2O5
Total
PAG9-7opaque
yello
w67.68
2.23
0.10
0.07
0.56
0.61
6.09
18.84
0.55
0.78
0.60
1.92
0.03
nd0.33
0.91
0.02
0.03
101.35
0.60
0.03
0.10
0.02
0.10
0.93
0.07
0.65
0.11
0.08
0.13
0.21
0.05
0.05
0.35
0.01
0.07
Blue
PAG1-2opaque
heavenly
68.47
2.60
0.06
0.53
0.54
0.38
7.34
15.35
0.71
1.88
1.66
0.08
0.14
nd0.45
0.64
0.01
0.09
100.93
PAG1-4opaque
heavenly
std
0.61
0.02
0.08
0.03
0.09
0.01
0.16
0.10
0.01
0.22
0.02
0.08
0.05
0.02
0.11
0.09
0.04
68.99
2.35
0.06
0.48
0.48
0.36
7.50
15.01
0.71
1.79
1.60
0.01
0.16
0.02
0.40
0.59
nd0.14
100.65
std
0.83
0.12
0.01
0.02
0.01
0.05
0.28
0.14
0.05
0.39
0.08
0.02
0.01
0.03
0.04
0.05
0.05
0.03
PAG2-1opaque
azure
65.09
2.10
0.11
0.02
0.53
0.54
4.84
18.89
0.56
1.19
4.14
0.08
0.22
0.02
0.32
1.07
0.01
0.01
99.74
std
1.15
0.06
0.01
0.02
0.02
0.04
0.15
0.30
0.01
0.60
0.10
0.06
0.04
0.03
0.06
0.08
0.01
0.02
PAG2-8opaque
turquoise
66.29
2.54
0.08
0.03
0.46
0.41
5.29
18.20
0.53
2.26
3.36
nd0.20
nd0.53
0.75
0.02
0.02
100.97
std
0.45
0.11
0.02
0.03
0.02
0.05
0.38
0.69
0.02
0.19
0.10
0.01
0.06
0.11
0.02
0.03
PAG2-9translucentturquoise
69.72
2.94
0.10
0.04
0.62
0.42
9.56
14.24
0.93
0.01
1.23
0.19
0.13
0.01
0.05
0.82
0.01
0.26
101.28
std
0.51
0.05
0.01
0.01
0.02
0.05
0.21
0.22
0.04
0.03
0.09
0.05
0.03
0.02
0.04
0.05
0.01
0.07
PAG3-1translucenth
eavenly
66.78
2.33
0.11
0.04
0.65
1.74
7.91
18.64
0.65
0.59
0.42
0.01
0.06
0.03
0.36
0.82
0.03
0.10
101.27
std
0.39
0.17
0.02
0.04
0.04
0.02
0.21
0.43
0.05
0.05
0.07
0.01
0.01
0.02
0.04
0.09
0.02
0.02
PAG3-2translucentb
lue
65.23
2.60
0.15
1.20
0.92
1.28
9.31
18.87
0.76
0.03
0.11
0.28
0.01
0.10
0.37
0.66
nd0.07
101.95
std
0.44
0.10
0.02
0.04
0.02
0.09
0.44
0.25
0.03
0.03
0.01
0.03
0.01
0.01
0.04
0.03
0.01
Archaeol Anthropol Sci
Author's personal copy

diffraction patterns, which displayed the reflections ofmetalliccopper (Fig. 5a). In addition to the high copper content, the redtesserae are also characterized by high concentrations of iron,lead, tin, and phosphorus (Table 1). FeO content, in particular,is the highest among the studied samples (from 1.72% in PAG6-2 to 2.27% in PAG6-3), suggesting the deliberate addition of Fe-bearing materials to the melt, with the aim of preventing copperoxidation (Arletti et al. 2006a, b, 2011; Croveri et al. 2010). Therelatively high concentration of PbO (about 2–3 %) suggests the
addition of lead as a melting agent and to improve the brillianceand chromatic aspect of the tesserae.
Furthermore, among the studied tesserae, the red opaqueones show rather high values of Sn (PAG6-1=0.21 %; PAG6-2=0.23 %; PAG6-3=0.16 %), which could be correlated tothe use of tin–bronze as colorant. As regards the high contentof P, it could be due to the addition of some hydroxylapatite asopacifying agent (Silvestri et al. 2012).
The overall Cu2O content (ranging from 0.82 % to 1.44 %)does not appear to be, in itself, correlated with the colorintensity and nuance of the red tesserae. However, SEMobservations revealed a link between sample color and clustersize. Sample PAG6-3 (dark red in color) contains large clus-ters, characterized by well-defined rims. In contrast, the clear-er samples PAG6-1 and PAG6-2 contain smaller clusters, withrims that blurred into the groundmass. These findings are inagreement with those reported by several authors (see e.g.Freestone 1987; Brill and Cahill 1988). In particular, theyagree with the results of Arletti et al. (2006a, b), who studiedred tesserae dated between the first and third century AD fromtwo Sicilian sites (Tusa and Lipari, Italy) and from Pompeii,
Fig. 3 a K2O vs. MgO, and b CaO vs. Al2O3 diagrams for the studiedVilla del Casale tesserae.Open circles, transparent tesserae; filled circles ,opaque tesserae
Table 2 SEM-EDS analyses related to dark zone, light zone, Cu cluster,and surrounding glass of the red tessera PAG6-1
Oxide % Dark zone Light zone Cu cluster Surrounding glass
Na2O 11.3 11.1 9.2 9.8
MgO – 1.2 0.7 1.1
Al2O3 2.7 1.9 1.2 2.2
SiO2 73.5 55.8 41.7 69.5
Cl 0.5 1.3 0.4 0.6
K2O 1.4 0.5 0.6 1.3
CaO 6.8 8.3 3.1 7.5
MnO 1.0 0.7 0.3 1.0
FeO 1.2 1.4 1.5 2.8
CuO 1.3 1.7 40.1 1.5
PbO – 15.6 1.2 2.2
Total 99.7 99.4 99.9 99.6
Fig. 4 SEM-BSE representativeimages of red tessera PAG6-2 andits inclusions. a Texture andrelative details; b sub-micrometerclusters of metallic copper
Archaeol Anthropol Sci
Author's personal copy

and with Van der Werf et al. (2009), who investigated redtesserae of the first century AD from Herculaneum (Italy).
Opaque yellow tesserae
The most common textures observed in selected opaque yel-low tesserae (PAM1, PAG5-1, PAG9-7) are displayed inFig. 6a. Typically, they show textures with alternating layersdue to the stratification of fine particles (<2 μm), indistin-guishable under optical microscopy. The layers are variablydistributed and organized, producing from sub-parallel toconvolute (Fig. 6a) textures. This last feature can beinterpreted as derived from attempts to homogenize the meltglass during the mechanical addition of the pigment (Arlettiet al. 2006a, b). Furthermore, all the analyzed yellow tesseraeexhibit abundant, variably deformed bubbles, which are inter-calated in the laminar structures (Fig. 6a, b). SEM-EDS anal-yses of the dark and light zones of PAM1 tessera are reportedin Table 3. The data evidenced that the composition of thedark zone is particularly enriched in SiO2, CaO, FeO, Al2O3,Na2O, and K2O and contains low PbO (0.5 %) with respect tothe composition of the light zones, which are enriched in PbO,SnO2, and MnO. The analyses of two grains of the opacifierare also reported in Table 3, showing variable contents in PbO,Sb2O5, and SnO2.
The nature of the yellow opacifier was established on thebasis of both chemical and diffractometric data. As also shownin Table 1, yellow tesserae are characterized by relatively highlevels of Pb and notable levels of Sb. XRDP patterns (Fig. 5b)show, above the typical high background due to the glassmatrix, the peaks of the crystalline phase pyroantimonate(Pb2Sb2O7), corresponding to the mineral phase bindheimite.Bindheimite is one of the most widely used yellow pigment inthe technological history of glass production (Shortland 2002,2005; Shortland and Eremin 2006; Sabatino et al. 2003; Galliet al. 2004; Sabatino 2007; Spadaro et al. 2007; Van der Werfet al. 2009) and has been already found by Croveri et al.(2010) in mosaic tesserae from PA and by Triscari et al.(2007) in glass tesserae from a number of other Sicilianarchaeological sites (Tusa, Lipari, and Taormina).
In general, the EDS and morphological studies of theyellow tesserae highlighted characteristic compositional fea-tures, which include the presence of (1) two types of glass—one Pb-rich and another one Pb-free (both Sb-free)—in thegroundmass; (2) Sb only within the opacifier crystals, whichare immersed in the Pb-rich glass matrix; (3) opacifier crystalswith both main corroded and subordinate euhedral habitus;and (4) Sn in some rare opacifier grains. All these findings, in
�Fig. 5 XRPD patterns of representative analyzed samples, chosen fromamong the opaque colored mosaic tesserae here studied: a red, b yellowand green, c–d blue and turquoise, e white
2-Theta - Scale
0
10
20
30
40
50
60
70
80
90
100
110
10 20 30 40 50 60 70 80 90 100
Cu
Cu
Cu
PDF number 00-004-0836:Copper, syn - Cu
Lin
(cou
nts)
0
40
80
120
160
200
240
280
10 20 30 40 50 60 70 80 90
Bin
Bin
Bin
Bin
Bin
Lin
(cou
nts)
100
PDF number 00-042-1355:Pb Sb O - Bindheimite2 2 7
Red Tesserae a
Yellow and Green tesserae b
0
10
20
30
40
50
60
70
10 20 30 40 50 60 70 80 90 100
CA
O-H
CA
O-H
CAO-H
CA
O-H
CA
O-H
CA
O-H
CA
O-H
CAO-H
CA
O-O
Lin
(cou
nts)
CAO-H :
CAO-O :
PDF number 00-046-1496:CaSb O - Hexagonal
PDF number 00-026-0293:Ca Sb O - Orthorhombic
2 6
2 2 7
White Tesserae e
0
10
20
30
40
50
60
70
80
10 20 30 40 50 60 70 80 90 100
CA
O-O
CA
O-O
CA
O-O
CA
O-O
CA
O-O
CA
O-O
CA
O-O
Lin
(cou
nts)
CAO-O : PDF number 00-026-0293:Ca Sb O - Orthorhombic2 2 7
0
20
40
60
80
100
120
140
160
10 20 30 40 50 60 70 80 90 100
CA
O-H
CA
O-H
CA
O-H
CA
O-H
CA
O-H CA
O-H
CA
O- H
CA
O-H
CAO-H
CA
O-H
CA
O-H
CA
O-H
CA
O-H
CA
O-H
CA
O-O
Lin
(cou
nts)
CAO-H :
CAO-O :
PDF number 00-046-1496:CaSb O - Hexagonal
PDF number 00-026-0293:Ca Sb O - Orthorhombic
2 6
2 2 7
Blue Tesserae c
Blue-Turquoise Tesserae d
Archaeol Anthropol Sci
Author's personal copy
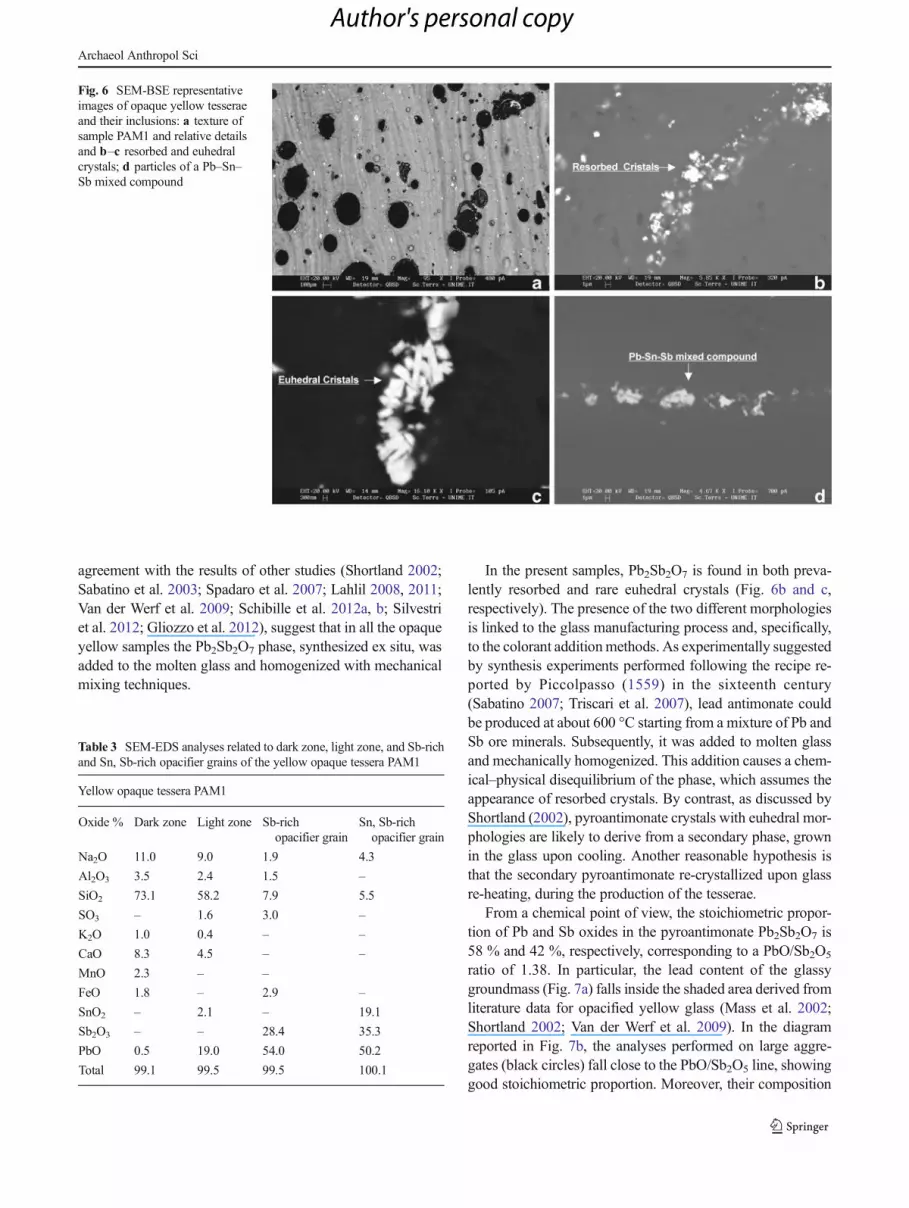
agreement with the results of other studies (Shortland 2002;Sabatino et al. 2003; Spadaro et al. 2007; Lahlil 2008, 2011;Van der Werf et al. 2009; Schibille et al. 2012a, b; Silvestriet al. 2012; Gliozzo et al. 2012), suggest that in all the opaqueyellow samples the Pb2Sb2O7 phase, synthesized ex situ, wasadded to the molten glass and homogenized with mechanicalmixing techniques.
In the present samples, Pb2Sb2O7 is found in both preva-lently resorbed and rare euhedral crystals (Fig. 6b and c,respectively). The presence of the two different morphologiesis linked to the glass manufacturing process and, specifically,to the colorant additionmethods. As experimentally suggestedby synthesis experiments performed following the recipe re-ported by Piccolpasso (1559) in the sixteenth century(Sabatino 2007; Triscari et al. 2007), lead antimonate couldbe produced at about 600 °C starting from a mixture of Pb andSb ore minerals. Subsequently, it was added to molten glassand mechanically homogenized. This addition causes a chem-ical–physical disequilibrium of the phase, which assumes theappearance of resorbed crystals. By contrast, as discussed byShortland (2002), pyroantimonate crystals with euhedral mor-phologies are likely to derive from a secondary phase, grownin the glass upon cooling. Another reasonable hypothesis isthat the secondary pyroantimonate re-crystallized upon glassre-heating, during the production of the tesserae.
From a chemical point of view, the stoichiometric propor-tion of Pb and Sb oxides in the pyroantimonate Pb2Sb2O7 is58 % and 42 %, respectively, corresponding to a PbO/Sb2O5
ratio of 1.38. In particular, the lead content of the glassygroundmass (Fig. 7a) falls inside the shaded area derived fromliterature data for opacified yellow glass (Mass et al. 2002;Shortland 2002; Van der Werf et al. 2009). In the diagramreported in Fig. 7b, the analyses performed on large aggre-gates (black circles) fall close to the PbO/Sb2O5 line, showinggood stoichiometric proportion. Moreover, their composition
Fig. 6 SEM-BSE representativeimages of opaque yellow tesseraeand their inclusions: a texture ofsample PAM1 and relative detailsand b–c resorbed and euhedralcrystals; d particles of a Pb–Sn–Sb mixed compound
Table 3 SEM-EDS analyses related to dark zone, light zone, and Sb-richand Sn, Sb-rich opacifier grains of the yellow opaque tessera PAM1
Yellow opaque tessera PAM1
Oxide % Dark zone Light zone Sb-richopacifier grain
Sn, Sb-richopacifier grain
Na2O 11.0 9.0 1.9 4.3
Al2O3 3.5 2.4 1.5 –
SiO2 73.1 58.2 7.9 5.5
SO3 – 1.6 3.0 –
K2O 1.0 0.4 – –
CaO 8.3 4.5 – –
MnO 2.3 – –
FeO 1.8 – 2.9 –
SnO2 – 2.1 – 19.1
Sb2O3 – – 28.4 35.3
PbO 0.5 19.0 54.0 50.2
Total 99.1 99.5 99.5 100.1
Archaeol Anthropol Sci
Author's personal copy

is intermediate between those of the opacified yellow glassstudied by Shortland (2002), Mass et al. (2002), and Van derWerf et al. (2009), and that of a natural bindheimite fromPeloritani Mountains (star).
SEM-EDS analyses on lead antimonate particles revealedthe presence of iron oxide impurities (0.5–2 Fe2O3%) and Sn-bearing phases. These findings are also reported by Lahlilet al. (2011) in a study performed on yellow tesserae fromRoman mosaics (2 BC–5 AD). These authors suggest that ironoxide was probably introduced with the lead- or antimony-bearing opacifier raw materials. Moreover, they highlight thepresence of Sn-rich zones inside the Pb antimonate crystals,contrary to that found in Egyptian glass, which contain Znimpurities. Lahlil et al. (2011) also suggest that tin oxide mayact as a nucleus for the crystallization of Pb antimonates andthat its presencemight be related to the preparation of a yellowpigment called “anime”, made from raw sands containing Pb,Sb, and Sn (Sandalinas et al. 2006; Van der Werf et al. 2009).This latter feature is perfectly in agreement with the presentresults on PA tesserae, as shown by the Fe2O3 versus SnO2
binary plot and by the PbO–SnO2–Sb2O5 ternary diagram
reported in Fig. 8a and b. The presence of Sn-bearing Pbantimonate was also reported by Sabatino (2007) for similaryellow mosaic tesserae (from 1 BC to 4–5 AD) from severalarcheological sites of Messina province (Tusa, Lipari, andTaormina) and from the Pompeii archeological site. It is alsoknown from literature (see for a review Arletti et al. 2011, andreferences cited herein) that, while antimony-based opacifiers(specifically, yellow lead antimonate) were used from theearliest days of glass production (in the Near East and Egyptaround 1,500 BC, and through Roman times), during thefourth century AD tin-based opacifiers started systematicallyto replace the antimony-based ones (Tite et al. 2008), spread-ing from the Eastern Mediterranean to Northern Europe.
Opaque green tesserae
The texture of the green studied tesserae (PAM2, PAG9-6,PAG9-8, PAG9-9, PAG9-10) is quite homogeneous, with thepresence of diffused deformed bubbles and of Pb, Sb-richgrains (Fig. 9a). Both SEM-EDS (Fig. 9b; Table 4) and XRPD
Fig. 7 Sb2O5 vs. PbO diagrams relative to a the glass matrix and b thePb-antimonate crystals. The gray areas indicate similar compositionsreported in literature by Shortland (2002), Mass et al. (2002), and Vander Werf et al. (2009); the star represents the mineral bindheimite fromthe Peloritani Mountains
Fig. 8 Fe2O3 vs. SnO2 binary and PbO–SnO2–Sb2O5 ternary diagrams.The dashed areas regard the data reported by Lahlil et al. (2011)
Archaeol Anthropol Sci
Author's personal copy

data (Fig. 5b) reveal the presence of pyroantimonate crystals.Furthermore, from Table 1 it is evident that the green samplesshow different, and in some case rather high, copper values(from 0.55 % in PAG9-10 to 3.01 % in PAG9-6), related tovariable amounts of lead (from 0.29% in PAG9-8 to 3.83% ofPAM1) and tin (from 0.06 % in PAG9-10 to 0.35 % in PAG9-6). Tin was found to occur in Pb-antimonate crystals in someopaque green Roman tesserae studied by Lahlil et al. (2008).Its presence was ascribed to the addition of bronze as carrier ofcopper. Regarding the high Cu content in PA green tesserae, itis known by X-ray absorption spectroscopy studies (see e.g.Arletti et. al. 2005 and references herein cited; Gliozzo et al.2010) that Cu2+ cations dispersed in the vitreous matrix confera blue nuance to glass. This chromatic effect, combined withthe yellow color of the pyroantimonate Pb2Sb2O7, gives rise tothe green opaque nuance of PA samples.
Turquoise and blue tesserae
These samples are either translucent (PAM4, PAM5, PAG2-9,PAG3-1, PAG3-2, PAG3-4, PAG7-13, PAG7-15) or opaque(PAG1-2, PAG1-4, PAG2-1, PAG2-8, PAG7-2, PAG7-9,PAG7-10, PAG7-14). The nuances vary from azure to tur-quoise to pale blue to blue. As suggested by Arletti et al.(2006a, b) in a spectroscopic study of Roman mosaic tesserae,
these different nuances can be ascribed to the presence of highcopper contents, occurring in the form of Cu2+ cations, and/orof few hundred ppm of cobalt dispersed in the glass matrix. Inparticular, the unique azure PAG2-1 sample contains thehighest value of CuO (4.14 %), with respect to the turquoiseand pale blue samples, while the nuances of the blue tesseraeis conferred by cobalt, which is particularly abundant inPAG3-2 (CoO=0.10 %) (Table 1).
In addition to copper and/or cobalt, significant amounts ofantimony were found in the opaque blue and turquoise sam-ples (Table 1), in agreement with the observations of otherauthors on similar tesserae (Shortland 2002; Shortland andEremin 2006; Arletti et al. 2011). This data, together with thepresence in the glass matrix of minute (3–4 μm) frequentlyaggregated euhedral Sb, Ca-rich crystals (Fig. 10b and c andTable 5), demonstrates that the opaque effect of these tesseraecan be ascribed to the presence of Ca antimonate, a well-known white opacifier widely used in ancient times(Shortland 2002; Shortland and Eremin 2006). Ca-antimonate crystals are perfectly euhedral, suggesting that inthese PA tesserae the white opacifier was produced in situ byadding Sb-containing raw materials to the melt. DetailedXRPD analyses of the samples allowed precise identificationof the Ca-antimonate phase. In the blue and pale blue tesserae,only orthorhombic Ca2Sb2O7 was detected (Fig. 5c). By con-trast, in the turquoise tesserae the hexagonal CaSb2O6 phasewas mainly identified (Fig. 5d), with a subordinate presence oforthorhombic Ca2Sb2O7. These results are in a close agree-ment with those of Lahlil et al. (2008, 2010) and Brun et al.(1989). In particular, Lahlil et al. (2008, 2010) found a linkbetween the Ca-antimonate phase (hexagonal or orthorhom-bic) present in opaque glass and the duration of the heattreatment. They demonstrated that Ca2Sb2O6 is the kineticallyfavored phase, while Ca2Sb2O7 is the thermodynamicallystable one. In particular, Ca2Sb2O7 starts to crystallize afterapproximately 1 day of heating and becomes the predominantphase after 2 days. On the basis of these results, it can beconcluded that the opaque blue and pale blue tesserae of thepresent study (containing only the orthorhombic Ca2Sb2O7)underwent relatively brief heat treatments, while the turquoise
Fig. 9 SEM-BSE representativeimages of opaque green tesseraeand of their inclusions. a Textureof sample PAG9-6 and relativedetails; b resorbed Pb antimonateand Pb–Sb mixed compoundaggregates
Table 4 SEM-EDSanalyses of Pb, Sb-richgrains contained in thegreen tessera PAG9-6
Green tessera PAG9-6
Oxide % Pb, Sb-rich grains
Na2O 2.7 3.7
Al2O3 3.4 –
SiO2 26.1 30.7
CaO – 4.0
FeO 2.8 1.2
CuO – 1.3
Sb2O3 20.6 23.8
PbO 43.7 34.7
Total 99.1 99.3
Archaeol Anthropol Sci
Author's personal copy

tesserae (mainly containing the hexagonal CaSb2O6 phase)were heated for at least 2 days.
Opaque white tesserae
The white tesserae include the transparent sample PAM3,directly coming from the mosaic, and four opaque samples(PAG11-1, PAG11-2, PAG11-3, PAG11-4). Similarly to theopaque blue and turquoise tesserae, the opaque white onescontain minute Ca-antimonate particles (Table 6), homoge-neously dispersed in the glass matrix, which play the dual roleof colorant and opacifier. The formation of variable amountsof Ca antimonate is related to the different contents of Sb2O5
(from 0.97 % in PAG11-4 to 4.95 % in PAG11-1), as can beobserved in Table 1.
From a textural point of view, the glass matrices of most ofthe samples are homogeneous. Moreover, morphologicalSEM investigations indicate that Ca antimonate crystallizeddirectly from the melt glass mass since it appears as euhedralhexagonal and orthorhombic crystals, with dimensions rarely
larger than 5 μm. XRPD pattern (Fig. 5e) evidences thedominant presence of the hexagonal Ca2Sb2O6 phase, sug-gesting (as for the blue and pale blue tesserae) a rapid heattreatment during the production process. SEM-EDS analysesof the white tesserae also show the presence of some Sncrystals (Table 6).
Translucent yellow and transparent purple tesserae
The translucent yellow (PAG8-1, PAG8-2, PAG8-3, PAG8-4,PAG8-5, PAG8-6) and the transparent purple (PAG3-3,PAG12-2, PAG12-4, PAG12-5, PAG 12-6) tesserae have veryhomogeneous textures, without inclusions. The only poten-tially coloring ions present in these samples are Fe and Mn. Inparticular, the transparent purple tesserae contain very high
Fig. 10 SEM-BSE representativeimages of opaque blue tesseraeand of their inclusions. a Textureof sample PAM4 and relativedetails; b , c orthorhombic andhexagonal Ca-antimonate crystals
Table 6 SEM-EDSanalyses of Sn crystalsand Ca antimonatecontained in the whitetessera PAG11-1
White tessera PAG11-1
Oxide % Sn crystal Ca antimonite
Na2O 3.7 –
Al2O3 1.3 –
SiO2 13.1 2.8
CaO 1.1 14.6
Sb2O3 – 82.7
MnO – –
CuO 0.7 –
SnO2 79.6 –
Total 99.6 100.1
Table 5 SEM-EDSanalyses of Caantimonate contained inthe blue tessera PAG1-2
Blue tessera PAG1-2
Oxide % Ca-antimonate crystals
SiO2 – 1.27
CaO 15.4 15.41
Sb2O3 83.6 84.31
Total 99.0 100.99
Archaeol Anthropol Sci
Author's personal copy

percentages of MnO, ranging from 1.46 % to 2.41 %, inten-tionally added to obtain the purple nuance typical of Mn3+.The translucent yellow color of the other tesserae can beinterpreted as the result of the presence of iron in its oxidizedstate 3+, as largely reported in literature (see for instanceMirtiet al. 2001, Quartieri et al. 2002; Van der Werf et al. 2009;Silvestri et al. 2012; Gliozzo et al. 2013).
It is worth noting from Tables 1 and 7 that the purplesamples have the highest contents of both manganese andbarium. This feature suggests the probable use ofpsilomelane-type minerals [(Ba, H2O)2 Mn5O10] as carriersof manganese. This hypothesis, already proposed by Fosterand Kaczmarczyk (1982) and Shortland et al. (2007), was alsodiscussed in Silvestri (2008) and Arletti et al. (2010), and re-proposed byGuilherme et al. (2011, 2012) in a study on recent(sixteenth to eighteenth centuries) polychrome glaze ceramics.It should be noted that important deposits of this mineral arelocated in the western side of the Sinai Peninsula, about 20 kminland, to the east of the Suez Gulf and in proximity to theAbou Zenima Port.
LA–ICP–MS trace elements analyses
Twelve samples were analyzed for determining trace elementcomposition. They include all the tesserae belonging to thePAM series (representing most of the colors of the tesseraeused in PA mosaics) and seven transparent/translucent PAGsamples lacking of any colorant/opacifier inclusions.
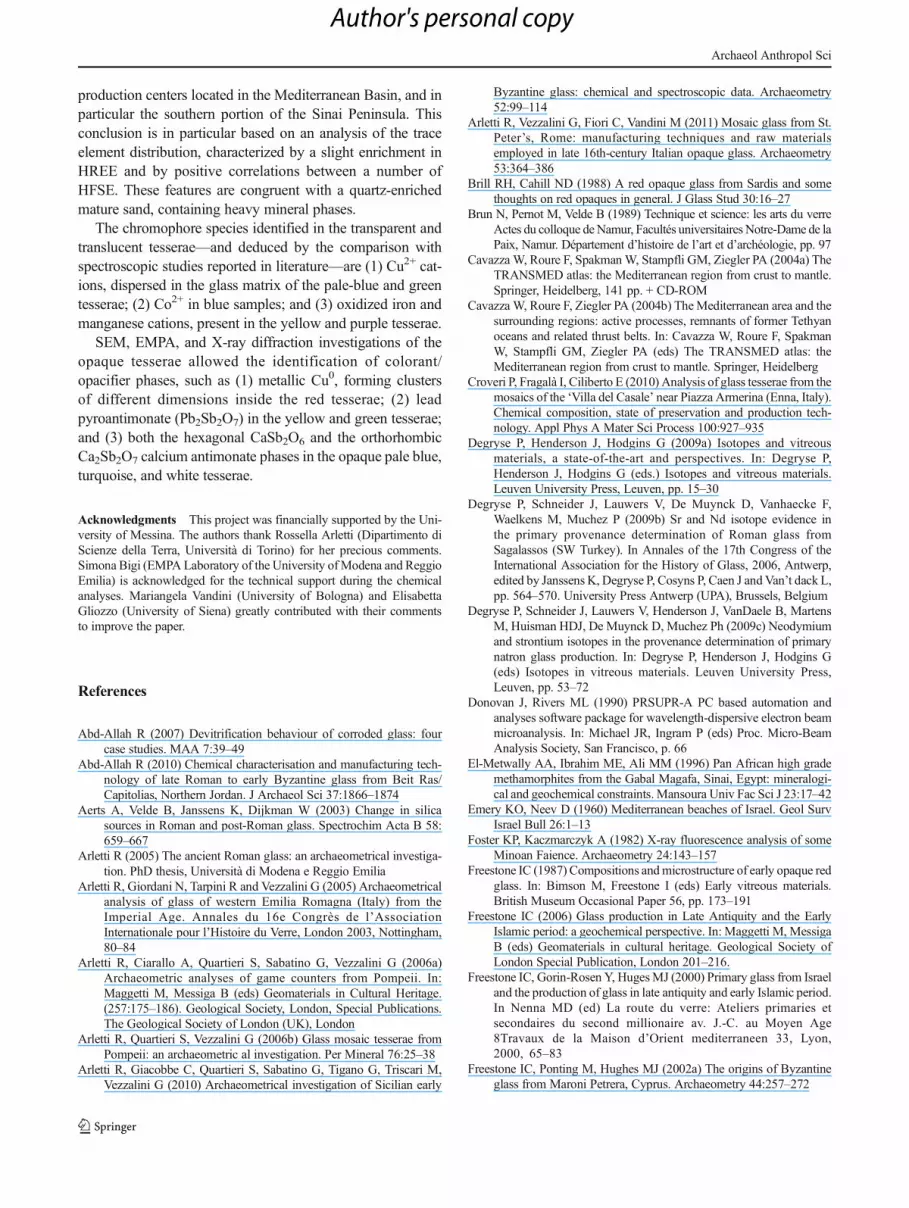
Table 7 reports the LA–ICP–MS chemical data for heavyrare earth elements (HREE), light rare earth elements (LREE),and other incompatible trace elements, like high field strengthelements and large ion lithophile elements (LILE). The distri-bution of REE and of the other incompatible trace elementswas verified by means of spider diagrams, normalizing thedata to the continental crust (Wedepohl 1995). REE distribu-tion (Fig. 11a) shows a slight enrichment in the HREE (Gd,Tb, Dy, Ho, Er, Tm, Yb, Lu) relative to LREE (La, Ce, Pr, Nd,Sm, Eu). The spider diagram of Fig. 11b provides a clearerdefinition of the variability pattern of the other trace elements,like LILE (Rb, Sr, Ba, Cs), HFSE (Ti, Zr, Hf, Nb, Ta, Th), andtransition elements (Sc, V, Cr, Zn, Ga). Concerning the LILE,very high abundances of Sr and relatively high of Ba, and verylow amounts of Rb are evident (Table 7). Sr readily substitutesfor calcium in minerals, such as aragonite, calcite, plagioclase,and apatite. Concerning barium, its high contents can beascribed to the presence of barite mineral in the used lime-stone. Concerning the HFSE elements, their concentrationsare rather similar to each other across the analyzed samples,with particularly low values of Zr (Table 7). Among thetransition elements, V, Cr, and Zn show variable abundances.
Several studies have shown that trace element distributioncan provide information on the origin of raw materials usedfor glass production since these elements may be indicators of
specific geological environments (e.g., Henderson 2010;Henderson et al. 2010; Degryse et al. 2009a, b, c; Ganioet al. 2012). In particular, specific patterns are discussed inliterature for REE (Freestone et al. 2002b), Zr–Ti (Aerts et al.2003), Zr–Ti–Cr–La (Shortland et al. 2007), and Zr–Ba(Silvestri et al. 2008), with the aim of distinguishing betweenvarious sand raw materials.
HFSE matrix plots were used with the aim of estimating theheavy mineral contents in the raw materials used for the pro-duction of the present samples, as reported in Fig. 12 with thecorrelation index r2. The occurrence of correlations betweenpairs of elements can in principle suggest which mineral phaseswere contained in the raw materials. The r2 value of 0.99calculated for the Zr versus Hf plot suggests the presence ofthe mineral phase zircon, whereas the correlations found for Tiversus Ta, and Ti versus Nb, with r2 values of 0.80 and 0.89,respectively, could imply contributions of ilmenite, rutile, andsphene (Rollinson 1995). Contributions from other minerals,such as pyroxenes, garnets, amphiboles, and magnetite, are alsopossible. Since element distribution in the mineral phases de-pends on the composition of the parental rocks (Rollinson1995), we can conclude that the raw materials used to producethe PA tesserae glass was representative of a mature sand,enriched in Si-rich phases and heavy minerals.
Furthermore, tesserae with compositions low in strontiumand high in zirconium suggest the use of an inland sand source(Table 7; Freestone et al. 2000). Conversely, tesserae contain-ing high strontium and barium and low zirconium amounts,such those here studied, suggest the use of a coastal, shell-containing sand (Freestone et al. 2000).
Freestone (2006) suggests the inland Egypt and the Levan-tine coast, respectively, as possible sources for the “inland”and “coastal” types. Since the analyzed tesserae show affinitywith the coastal type, characterized by high Sr and low Zrcontent, we propose that the PA glass was obtained using theSyro-Palestinian or Levantine coastal sands. As previouslydiscussed, PA glass is characterized by relatively high abun-dance of HREE (positive anomalies in Gd and Yb) comparedto LREE (with the particular negative anomaly of Ce). Thepattern reported in Fig. 11a is very similar to that recentlyreported by Wedepohl et al. (2011) for similar soda lime glasssamples. These authors plotted the REE abundances, normal-ized to REE abundance to the Earth’s continental crust(Wedepohl 1995), relative to wood ash glass, soda lime glass,and soda ash glass. They argued that different partial meltingprocesses of crustal and mantle source rocks produced threedifferent types of quartz sands, used for the production of threeglass types respectively, resulting in different distributions ofREE concentrations. Therefore, on the basis of the overallresults of the present study on the trace elements, a possibleprovenance region for this raw material, originated fromLREE-depleted crust, could be the Syro-Palestinian area,which presents geological characteristics that closely match
Archaeol Anthropol Sci
Author's personal copy

Tab
le7
LA–ICP–M
Sanalyses
oftraceelem
ents(ppm
)for12
selected
PiazzaArm
erinatesserae
PAM1
PAM2
PAM3
PAM4
PAM5
PAG3-1
PAG3-3
PAG8-5
PAG8-2
PAG12-4
PAG12-2
PAG12-5
Opaque
yello
wOpaquepale
green
Transparent
white
Translucent
turquoise
Translucent
blue
Translucent
heavenly
Transparent
light
purple
Translucent
light
yello
wTranslucent
dark
yello
wTransparent
purple
Transparent
purple
Transparent
dark
purple
Sc5.62
5.20
5.34
4.77
4.79
5.46
5.00
5.16
4.43
6.95
5.06
5.37
Ti
589.35
759.48
829.50
580.05
475.25
784.29
764.43
400.38
642.24
1,606.89
517.11
591.66
V14.82
17.84
19.72
9.77
19.48
10.45
41.91
9.60
6.70
90.04
18.99
78.12
Cr
10.35
12.93
15.18
10.27
11.90
11.51
9.62
12.46
38.09
17.84
7.18
11.01
Zn
22.90
96.77
29.70
241.94
32.27
78.73
45.98
13.02
10.69
40.77
71.53
39.68
Ga
2.61
2.44
3.19
2.09
3.55
5.13
2.65
2.22
3.58
3.24
2.37
2.42
Rb
13.85
12.53
10.73
11.75
7.79
5.55
4.95
6.10
20.74
4.84
9.26
5.12
Sr398.79
391.55
411.05
390.61
413.95
668.70
895.11
438.62
218.48
448.47
644.59
595.28
Y7.01
6.21
7.39
5.89
6.30
7.33
7.00
6.66
6.98
8.66
8.11
6.12
Zr
56.52
64.78
75.26
50.04
40.00
67.70
69.11
36.64
56.12
145.77
47.21
44.40
Nb
2.62
2.41
2.62
1.87
1.58
2.62
2.53
1.34
2.42
4.37
1.78
1.66
Cs
0.67
0.41
0.26
0.35
0.17
0.06
0.08
0.09
0.18
0.07
0.17
0.09
Ba
194.49
185.89
236.16
145.92
233.53
171.77
422.12
239.87
282.49
1,123.71
398.85
450.76
Hf
1.41
1.62
1.83
1.32
1.03
1.79
1.82
0.92
1.51
3.51
1.20
1.17
Ta0.18
0.16
0.19
0.13
0.12
0.19
0.18
0.09
0.21
0.30
0.12
0.13
Th
1.89
1.68
1.58
1.57
0.99
1.35
1.35
0.81
1.72
1.86
1.14
0.91
U1.19
1.02
1.10
1.05
0.95
1.01
1.26
0.72
0.97
1.18
0.85
0.94
La
7.75
6.90
7.52
6.26
6.01
7.80
7.45
6.16
6.35
8.44
8.19
6.18
Ce
12.87
12.66
12.41
10.83
10.15
13.36
12.41
10.88
11.59
14.46
11.78
9.83
Pr1.65
1.57
1.63
1.42
1.35
1.82
1.69
1.50
1.33
1.88
1.82
1.40
Nd
6.78
6.21
6.81
5.72
5.69
7.39
6.90
6.30
5.41
7.90
7.61
5.85
Sm1.31
1.26
1.34
1.16
1.18
1.55
1.40
1.24
1.06
1.60
1.65
1.19
Eu
0.32
0.30
0.34
0.29
0.30
0.38
0.34
0.37
0.27
0.38
0.38
0.31
Gd
1.24
1.13
1.25
1.10
1.14
1.38
1.29
1.17
1.00
1.58
1.53
1.07
Tb
0.18
0.16
0.18
0.16
0.16
0.21
0.18
0.17
0.16
0.25
0.22
0.16
Dy
1.18
1.03
1.30
0.98
1.04
1.36
1.23
1.10
1.13
1.59
1.29
1.11
Ho
0.24
0.22
0.26
0.20
0.22
0.26
0.25
0.22
0.25
0.32
0.28
0.22
Er
0.67
0.58
0.73
0.58
0.59
0.71
0.71
0.66
0.75
1.00
0.78
0.63
Tm
0.09
0.09
0.11
0.08
0.09
0.11
0.11
0.09
0.11
0.15
0.12
0.09
Yb
0.65
0.60
0.73
0.53
0.56
0.75
0.80
0.64
0.83
1.13
0.72
0.62
Lu
0.10
0.09
0.11
0.08
0.08
0.11
0.10
0.08
0.11
0.17
0.12
0.08
Archaeol Anthropol Sci
Author's personal copy
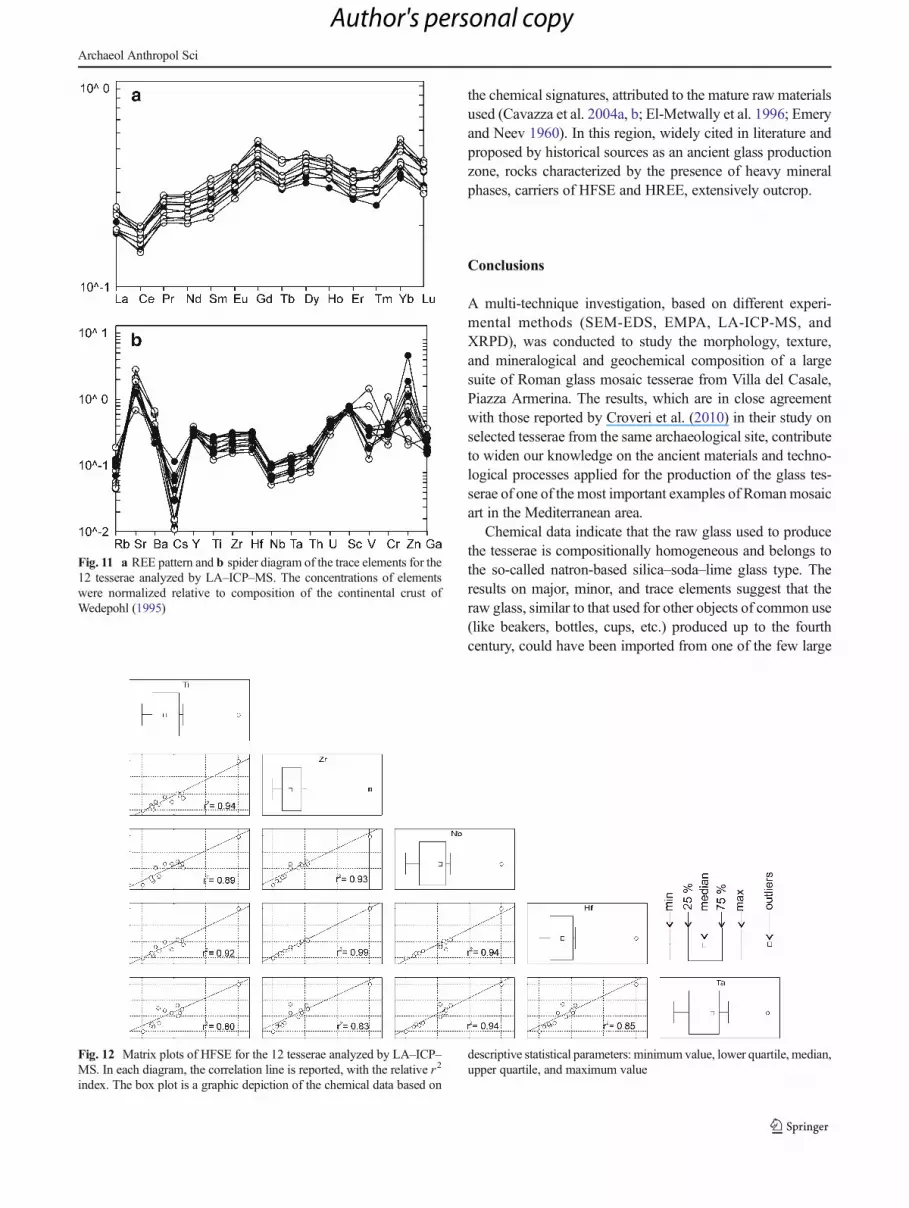
the chemical signatures, attributed to the mature raw materialsused (Cavazza et al. 2004a, b; El-Metwally et al. 1996; Emeryand Neev 1960). In this region, widely cited in literature andproposed by historical sources as an ancient glass productionzone, rocks characterized by the presence of heavy mineralphases, carriers of HFSE and HREE, extensively outcrop.
Conclusions
A multi-technique investigation, based on different experi-mental methods (SEM-EDS, EMPA, LA-ICP-MS, andXRPD), was conducted to study the morphology, texture,and mineralogical and geochemical composition of a largesuite of Roman glass mosaic tesserae from Villa del Casale,Piazza Armerina. The results, which are in close agreementwith those reported by Croveri et al. (2010) in their study onselected tesserae from the same archaeological site, contributeto widen our knowledge on the ancient materials and techno-logical processes applied for the production of the glass tes-serae of one of the most important examples of Romanmosaicart in the Mediterranean area.
Chemical data indicate that the raw glass used to producethe tesserae is compositionally homogeneous and belongs tothe so-called natron-based silica–soda–lime glass type. Theresults on major, minor, and trace elements suggest that theraw glass, similar to that used for other objects of common use(like beakers, bottles, cups, etc.) produced up to the fourthcentury, could have been imported from one of the few large
Fig. 11 a REE pattern and b spider diagram of the trace elements for the12 tesserae analyzed by LA–ICP–MS. The concentrations of elementswere normalized relative to composition of the continental crust ofWedepohl (1995)
Fig. 12 Matrix plots of HFSE for the 12 tesserae analyzed by LA–ICP–MS. In each diagram, the correlation line is reported, with the relative r2
index. The box plot is a graphic depiction of the chemical data based on
descriptive statistical parameters: minimum value, lower quartile, median,upper quartile, and maximum value
Archaeol Anthropol Sci
Author's personal copy
production centers located in the Mediterranean Basin, and inparticular the southern portion of the Sinai Peninsula. Thisconclusion is in particular based on an analysis of the traceelement distribution, characterized by a slight enrichment inHREE and by positive correlations between a number ofHFSE. These features are congruent with a quartz-enrichedmature sand, containing heavy mineral phases.
The chromophore species identified in the transparent andtranslucent tesserae—and deduced by the comparison withspectroscopic studies reported in literature—are (1) Cu2+ cat-ions, dispersed in the glass matrix of the pale-blue and greentesserae; (2) Co2+ in blue samples; and (3) oxidized iron andmanganese cations, present in the yellow and purple tesserae.
SEM, EMPA, and X-ray diffraction investigations of theopaque tesserae allowed the identification of colorant/opacifier phases, such as (1) metallic Cu0, forming clustersof different dimensions inside the red tesserae; (2) leadpyroantimonate (Pb2Sb2O7) in the yellow and green tesserae;and (3) both the hexagonal CaSb2O6 and the orthorhombicCa2Sb2O7 calcium antimonate phases in the opaque pale blue,turquoise, and white tesserae.
Acknowledgments This project was financially supported by the Uni-versity of Messina. The authors thank Rossella Arletti (Dipartimento diScienze della Terra, Università di Torino) for her precious comments.Simona Bigi (EMPA Laboratory of the University ofModena and ReggioEmilia) is acknowledged for the technical support during the chemicalanalyses. Mariangela Vandini (University of Bologna) and ElisabettaGliozzo (University of Siena) greatly contributed with their commentsto improve the paper.
References
Abd-Allah R (2007) Devitrification behaviour of corroded glass: fourcase studies. MAA 7:39–49
Abd-Allah R (2010) Chemical characterisation and manufacturing tech-nology of late Roman to early Byzantine glass from Beit Ras/Capitolias, Northern Jordan. J Archaeol Sci 37:1866–1874
Aerts A, Velde B, Janssens K, Dijkman W (2003) Change in silicasources in Roman and post-Roman glass. Spectrochim Acta B 58:659–667
Arletti R (2005) The ancient Roman glass: an archaeometrical investiga-tion. PhD thesis, Università di Modena e Reggio Emilia
Arletti R, Giordani N, Tarpini R and Vezzalini G (2005) Archaeometricalanalysis of glass of western Emilia Romagna (Italy) from theImperial Age. Annales du 16e Congrès de l’AssociationInternationale pour l’Histoire du Verre, London 2003, Nottingham,80–84
Arletti R, Ciarallo A, Quartieri S, Sabatino G, Vezzalini G (2006a)Archaeometric analyses of game counters from Pompeii. In:Maggetti M, Messiga B (eds) Geomaterials in Cultural Heritage.(257:175–186). Geological Society, London, Special Publications.The Geological Society of London (UK), London
Arletti R, Quartieri S, Vezzalini G (2006b) Glass mosaic tesserae fromPompeii: an archaeometric al investigation. Per Mineral 76:25–38
Arletti R, Giacobbe C, Quartieri S, Sabatino G, Tigano G, Triscari M,Vezzalini G (2010) Archaeometrical investigation of Sicilian early
Byzantine glass: chemical and spectroscopic data. Archaeometry52:99–114
Arletti R, Vezzalini G, Fiori C, Vandini M (2011) Mosaic glass from St.Peter’s, Rome: manufacturing techniques and raw materialsemployed in late 16th-century Italian opaque glass. Archaeometry53:364–386
Brill RH, Cahill ND (1988) A red opaque glass from Sardis and somethoughts on red opaques in general. J Glass Stud 30:16–27
Brun N, Pernot M, Velde B (1989) Technique et science: les arts du verreActes du colloque deNamur, Facultés universitairesNotre-Dame de laPaix, Namur. Département d’histoire de l’art et d’archéologie, pp. 97
Cavazza W, Roure F, SpakmanW, Stampfli GM, Ziegler PA (2004a) TheTRANSMED atlas: the Mediterranean region from crust to mantle.Springer, Heidelberg, 141 pp. + CD-ROM
Cavazza W, Roure F, Ziegler PA (2004b) TheMediterranean area and thesurrounding regions: active processes, remnants of former Tethyanoceans and related thrust belts. In: Cavazza W, Roure F, SpakmanW, Stampfli GM, Ziegler PA (eds) The TRANSMED atlas: theMediterranean region from crust to mantle. Springer, Heidelberg
Croveri P, Fragalà I, Ciliberto E (2010) Analysis of glass tesserae from themosaics of the ‘Villa del Casale’ near Piazza Armerina (Enna, Italy).Chemical composition, state of preservation and production tech-nology. Appl Phys A Mater Sci Process 100:927–935
Degryse P, Henderson J, Hodgins G (2009a) Isotopes and vitreousmaterials, a state-of-the-art and perspectives. In: Degryse P,Henderson J, Hodgins G (eds.) Isotopes and vitreous materials.Leuven University Press, Leuven, pp. 15–30
Degryse P, Schneider J, Lauwers V, De Muynck D, Vanhaecke F,Waelkens M, Muchez P (2009b) Sr and Nd isotope evidence inthe primary provenance determination of Roman glass fromSagalassos (SW Turkey). In Annales of the 17th Congress of theInternational Association for the History of Glass, 2006, Antwerp,edited by Janssens K, Degryse P, Cosyns P, Caen J andVan’t dack L,pp. 564–570. University Press Antwerp (UPA), Brussels, Belgium
Degryse P, Schneider J, Lauwers V, Henderson J, VanDaele B, MartensM, Huisman HDJ, De Muynck D, Muchez Ph (2009c) Neodymiumand strontium isotopes in the provenance determination of primarynatron glass production. In: Degryse P, Henderson J, Hodgins G(eds) Isotopes in vitreous materials. Leuven University Press,Leuven, pp. 53–72
Donovan J, Rivers ML (1990) PRSUPR-A PC based automation andanalyses software package for wavelength-dispersive electron beammicroanalysis. In: Michael JR, Ingram P (eds) Proc. Micro-BeamAnalysis Society, San Francisco, p. 66
El-Metwally AA, Ibrahim ME, Ali MM (1996) Pan African high grademethamorphites from the Gabal Magafa, Sinai, Egypt: mineralogi-cal and geochemical constraints. Mansoura Univ Fac Sci J 23:17–42
Emery KO, Neev D (1960) Mediterranean beaches of Israel. Geol SurvIsrael Bull 26:1–13
Foster KP, Kaczmarczyk A (1982) X-ray fluorescence analysis of someMinoan Faience. Archaeometry 24:143–157
Freestone IC (1987) Compositions andmicrostructure of early opaque redglass. In: Bimson M, Freestone I (eds) Early vitreous materials.British Museum Occasional Paper 56, pp. 173–191
Freestone IC (2006) Glass production in Late Antiquity and the EarlyIslamic period: a geochemical perspective. In: Maggetti M, MessigaB (eds) Geomaterials in cultural heritage. Geological Society ofLondon Special Publication, London 201–216.
Freestone IC, Gorin-Rosen Y, HugesMJ (2000) Primary glass from Israeland the production of glass in late antiquity and early Islamic period.In Nenna MD (ed) La route du verre: Ateliers primaries etsecondaires du second millionaire av. J.-C. au Moyen Age8Travaux de la Maison d’Orient mediterraneen 33, Lyon,2000, 65–83
Freestone IC, Ponting M, Hughes MJ (2002a) The origins of Byzantineglass from Maroni Petrera, Cyprus. Archaeometry 44:257–272
Archaeol Anthropol Sci
Author's personal copy

Freestone IC, Greenwood R, Gorin RY (2002b) Byzantine and EarlyIslamic glassmaking in the Eastern Mediterranean: production anddistribution of primary glass. In: 1st International Conference:Hyalos, vitrum, glass; history, technology and conservation of glassand vitreous materials in the Hellenic world. Athens, pp. 167–174
Galli S, Mastelloni M, Ponterio R, Sabatino G, Triscari M (2004) Ramanand scanning electron microscopy and energy-dispersive X-raytechniques for the characterization of coloring and opaqueningagents in Roman mosaic glass tesserae. J Raman Spectrosc 35:622–627
Ganio M, Boyen S, Fenn T, Scott R, Vanhoutte S, Gimeno D, Degryse P(2012) Roman glass across the Empire: an elemental and isotopiccharacterization. J Anal At Spectrom 27:743–753
Gentili GV (1954) La Villa Imperiale di Piazza Armerina. Ed. Istitutopoligrafico dello Stato, Libreria dello Stato, pp. 1–91
Gliozzo E, Santagostino Barbone A, D’Acapito F, TurchianoM, TurbantiMemmi I, Volpe G (2010) The sectilia panels of Faragola (AscoliSatriano, southern Italy): a multi-analytical study of the green,marbled (green and yellow), blue and blackish glass slabs.Archaeometry 52:389–415
Gliozzo E, Santagostino Barbone A, Turchiano M, Memmi I, Volpe G(2012) The coloured tesserae decorating the vaults of the FaragolaBalneum (Ascoli Satriano, Foggia, southern Italy). Archaeometry54:311–331
Gliozzo E, Santagostino Barbone A, D’Acapito F (2013) Waste glass,vessels and window-panes from Thamusida (Morocco): groupingnatron-based blue-green and colourless Roman glasses.Archaeometry 55:609–639
Guilherme A, Coroado J, Dos Santos JMF, Luhl L, Wolff T, Kanngießer B,Carvalho ML (2011) X-ray fluorescence (conventional and 3D) andscanning electron microscopy for the investigation of Portuguesepolychrome glazed ceramics: advances in the knowledge of themanufacturing techniques. Spectrochim Acta B 66:297–307
Guilherme A, Buzanich G, Radtke M, Reinholz U, Coroado J, DosSantose JMF (2012) Synchrotron micro-XRF with CompoundRefractive Lenses (CRLs) for tracing key elements on Portugueseglazed ceramics. J Anal At Spectrom 27:966–974
Henderson J (1985) The raw materials of early glass production. OJA 4:267–291
Henderson J (2010) Glass provenance: some new approaches to anintriguing problem. In: Proceedings of the Italian ArchaeometryConference, Riflessioni e trasparenze diagnosi e conservazione diopera e manufatti vetrosi, pp. 25–47
Henderson J, Evans J, Nikita K (2010) Isotopic evidence for the primaryproduction, provenance and trade of Late Bronze Age glass, in theMediterranean. Archaeol Archaeometry 10(1):1–24
Lahlil S, Biron I, Galoisy L, Morin G (2008) Rediscovering ancient glasstechnologies through the examination of opacifier crystals. ApplPhys A 92:109–116
Lahlil S, Biron I, Cotte M, Susini J (2010) New insight on the situcrystallization of calcium antimonate opacified glass during theRoman period. Appl Phys A 100:683–692
Lahlil S, Cotte M, Biron I, Szlachetko J, Menguy N, Susini J (2011)Synthesizing lead antimonate in ancient and modern opaque glass. JAnal At Spectrom 26:1040–1050
Lilyquist C, Brill RH (1995) Studies in ancient Egyptian glass.Metropolitan Museum of Art, New York
Longerich HP, Jackson SE, Gunther D (1996) Laser ablation inductivelycoupled plasmamass spectrometry transient signal data acquisition andanalyte concentration calculation. J Anal At Spectrom 11:899–904
Mass JL, WypyskyMT, Stone RE (2002) Malkata and Lisht glassmakingtechnologies: toward a specific link between second millennium BCmetallurgist and glassmaker. Archaeometry 44:67–82
Mirti P, Davit P, Gulmini M, Saguì L (2001) Glass fragments from theCrypta Balbi in Rome: the composition of eighth-century fragments.Archaeometry 43:491–502
Nakai I, Numako C, Hosono H, Yamasaky K (1999) Origin of the redcolour of Satsuma copper–ruby glass as determined by EXAFS andoptical absorption spectroscopy. J Am Ceram Soc 82:689–784
Pensabene P, Gallocchio E (2011) The Villa del Casale of PiazzaArmerina. Expedition 53:29–37
Petrelli M, Perugini D, Alagna KE, Poli G, Peccerillo A (2008) Spatiallyresolved and bulk trace element analysis by laser ablation–induc-tively coupled plasma–mass spectrometry (LA–ICP–MS). PerMineral 77:3–21
Piccolpasso Cipriano (1559) Li tre libri dell’arte del vasaioPouchou JL, Pichoir F (1984) A new model for quantitative analysis. I.
Application to the analysis of homogeneous samples. La RéchercheAerosp 3:13–38
Pouchou JL, Pichoir F (1985) PAP” (Z) procedure for improved quanti-tative microanalysis. In: Armstrong JT (ed) Microbeam Analysis1985. San Francisco Press, San Francisco, pp. 104–106
Quartieri S, Triscari M, Sabatino G, Boscherini F, Sani A (2002) Fe andMn K-edge Xanes study of ancient Roman glasses. Eur J Mineral14:749–756
Rollinson HR (1995) Using geochemical data: evaluation, presentation,interpretation, Longman Geochemistry Series. Longman, Essex, p 344
Sabatino G (2007) Vetri archeologici di età romana (dal II sec. a.C. al VIsec. d.C.) in Sicilia: attribuzione di provenienza e caratterizzazionedelle tecniche costruttive. PhD thesis, Università di Messina
Sabatino G, Quartieri S, Triscari M (2003) Origine e significatotecnologico dell'antimoniato di piombo nel giallo di paste vitree dietà romana. I° Giornata scientifica del Gruppo Naz. Georisorse,Ambiente e Beni Culturali, Dip. Scienze della Terra, Univ. Napoli,5/12/2003, 9
Sandalinas C, Ruiz-Moreno S, Lopez-Gil A, Miralles J (2006)Experimental confirmation by Raman spectroscopy of a Pb–Sn–Sbtriple oxide yellow pigment in sixteenth-century Italian pottery. JRaman Spectrosc 37:1146–1153
Santagostino Barbone A, Gliozzo E, Turchiano M, D’Acapito F, MemmiTurbanti I, Volpe G (2008) The Sectilia panels of Faragola (AscoliSatriano, southern Italy): a multi-analytical study of the red, orangeand yellow glass slab. Archaeometry 50:451–473
Sayre EV, Smith RW (1961) Compositional categories of ancient glass.Sciences 133:1824–1826
Sayre EV, Smith RW (1974) Analytical studies of ancient Egyptian glass.In: Recent advanced in science and technology of materials, Cairo.Solid state conference, 2. Plenum, New York, pp. 40–70
Schibille N, Degryse P, O’Hea M, Izmer A, Vanhaecke F, McKenzie J(2012a) Late Roman glass from the ‘Great temple’ at Petra andKhirbet Et-Tannur, Jordan—technology and provenance.Archaeometry. doi:10.1111/j.1475-4754.2012.00660.x
Schibille N, Degryse P, Corremans M, Specht CG (2012b) Chemicalcharacterisation of glass mosaic tesserae from sixth-century Saga-lassos (South-West Turkey): chronology and production techniques.J Archaeol Sci 39:1480–1492
Shortland AJ (2002) The use and origin of antimonate colorants in EarlyEgyptian Glass. Archaeometry 44:517–531
Shortland AJ (2005) The raw materials of early glasses: the implicationsof new LA–ICP–MS analyses. In: Cool H (ed.) Proceedings ofthe16th International Congress of the Association Internationalepour l’Histoire du Verre, London, 2003, pp. 1–5
Shortland AJ, Eremin K (2006) The analysis of second millennium glassfrom Egypt and Mesopotamia, part 1: new WDS analyses.Archaeometry 48:581–603
Shortland AJ, Rogers N, Eremin K (2007) Trace element discriminantsbetween Egyptian and Mesopotamian late Bronze Age glasses. JArchaeol Sci 34:781–789
Shugar AN (2000) Byzantine opaque red glass tesserae from Belt Shean,Israel. Archaeometry 42:375–384
Silvestri A (2008) The coloured glass of Iulia Felix. J Archaeol Sci 35:1489–1501
Archaeol Anthropol Sci
Author's personal copy

Silvestri A, Molin G, Salviulo G (2008) The colourless glass of IuliaFelix. J Archaeol Sci 35:331–341
Silvestri A, Tonietto S, Molin G, Guerriero G (2012) The palaeo-Christian glass mosaic of St. Prosdocimus (Padova, Italy):archaeometric characterisation of tesserae with antimony- orphosphorus-based opacifiers. J Archaeol Sci 39:2177–2190
Spadaro D, Sabatino G, Triscari M (2007) L’antimoniato di piombo:approccio sperimentale per la realizzazione di tessere musive.Dissertation. A.I.Ar., “Colore ed arte: storia e tecnologia del colorenei secoli”, Firenze
Tite M, Pradell T, Shortland A (2008) Discovery, production and use oftin-based opacifiers in glasses, enamels and glazes from the late IronAge onwards: a reassessment. Archaeometry 50:67–84
Triscari M, Quartieri S, Sabatino G, Vezzalini G, Mastelloni MA, SantaluciaF (2007) Caratterizzazione chimica e spettroscopica di tessere musivein pasta vitrea da siti archeologici siciliani. Atti delWorkshop “Tecnichedi analisi non distruttive di materiali lapidei naturali e artificiali nei BeniCulturali”, Palermo, 22/2/2007, pp. 110–114
Turner WES (1956) Studies in ancient glasses and glassmaking process-es. Part IV: the chemical composition of ancient glasses. J Soc GlassTechnol 40:162–186
Van derWerf I,MangoneA,Giannossa LC, Traini A, Laviano R, CoraliniA, Sabbatini L (2009) Archaeometric investigations of Romantesserae from Herculaneum (Italy), by the combined use of comple-mentary micro-destructive analytical techniques. J Archaeol Sci 36:2625–2634
Verità M (1995) Le analisi dei vetri. In: Foy D (ed) ‘Le Verre del’Antiquite Tardive et du Haut Moyen Age’. Musee ArcheologiqueDepartemental du Val d’Oise, 291–300
Wedepohl KH (1995) The composition of the continental crust. GeochimCosmochim Acta 59:1217–1232
Wedepohl K, SimonK, Kronz A (2011)Data on 61 chemical elements forthe characterization of three major glass compositions in late antiq-uity and the Middle Ages. Archaeometry 53:81–102
Weyl WA (1959) Coloured glasses. 2nd ed. Dawson’s of Pall Mall,London 1959
Archaeol Anthropol Sci
Author's personal copy