the evaluation of social welfare for payment methods
TRANSCRIPT
2009 Oxford Business & Economics Conference Program ISBN : 978-0-9742114-1-1
The Evaluation of Social Welfare for Payment Methods
2009 Oxford Business & Economics ConferenceJune 24-26, 2009
Allan Shampinea
ABSTRACT
There is a substantial literature evaluating the costs of different
payment methods (cash, checks, credit and debit), but only recently
has research attempted to look at social welfare by including
nonpecuniary benefits and costs into such calculations. This paper
discusses the strengths and weaknesses of different approaches that
may be used to evaluate costs, benefits, and social welfare derived
from payment methods. The paper surveys the approaches and results in
the existing literature, explains the wide variations in results
observed, and uses existing data on usage and costs to provide
illustrative estimations of welfare surplus. The paper concludes by
discussing the appropriate usage of such complex and sensitive
analyses for policy purposes.
a . Vice-President, Compass Lexecon. 312-322-0294. Thanks to Dzmitry Asinski for able research assistance, and to my colleagues at Compass Lexecon for helpful discussions. All errors are, of course, my own.
June 24-26, 2009St. Hugh’s College, Oxford University, Oxford, UK
1
2009 Oxford Business & Economics Conference Program ISBN : 978-0-9742114-1-1
INTRODUCTION
Although the economic literature has historically focused on the
costs of payment methods to particular parties, there have been recent
attempts to look at the overall social welfare effects of payment
choices. This paper examines the difficulties of such attempts, both
old and new, and argues that there are good reasons why the literature
has focused on costs, not social welfare.b
There are three primary difficulties with examining the effects
of payment choices on social welfare. First, there is no demand curve
for a payment method as such. Rather, consumers choose a payment
method in order to purchase various goods and services. Thus, there
is a derived demand for payment methods, with the relative demand for
each payment method depending upon the characteristics of both the
payment method and the purchase being made. Second, there are
significant externalities involved in payment methods. In particular,
the consumer chooses the payment method (from the menu of choices
presented by the retailer) but many of the costs of a payment method
are born by other participants, such as merchants and banks. There
has been extensive discussion about how (or whether) to internalize
such externalities, but there is as yet no consensus in the literature
on the matter. Third, there are some claimed social benefits to
payment methods that can be difficult to quantify or assign to b . A new study by McAndrews and Wang at the Federal Reserve Bank of Kansas
City, for example, calculates welfare effects assuming that the monetary characteristics of payment methods are their only benefits, pointing out thatwelfare calculation under any other assumption is problematic. McAndrews andWang (2008).
June 24-26, 2009St. Hugh’s College, Oxford University, Oxford, UK
2
2009 Oxford Business & Economics Conference Program ISBN : 978-0-9742114-1-1
particular participants. There are many participants in the
production and consumption of payment methods, including consumers,
merchants, commercial banks, central banks and network operators.
Payment methods allow transactions, and as the cost of transacting
falls, new venues may appear. How does one measure this benefit and
to whom does it accrue?
This paper will first review the literature on payment method
costs and benefits, then walk through an example of the estimation of
consumer and producer surpluses to illustrate the difficulties
involved.
LITERATURE REVIEW
The existing literature has focused on three areas: 1) total
social welfare, generally measured strictly as the sum of costs
incurred by various parties;c 2) consumer preferences for various
payment methods, generally focused on why consumers choose the payment
methods they do; and 3) merchant costs in isolation. Recently there
has been some effort to incorporate nonpecuniary effects into social
welfare analyses.
Social Point of View - Pecuniary
There have been a variety of studies looking at the social costs
of payment methods in various countries. In this section, I summarize
the methodologies and results and provide a few illustrative examples.c . The terminology in the literature is confusing. The literature
typically uses “social welfare” to refer to the sum of costs incurred by various parties without ever discussing consumer or producer surplus.
June 24-26, 2009St. Hugh’s College, Oxford University, Oxford, UK
3
2009 Oxford Business & Economics Conference Program ISBN : 978-0-9742114-1-1
This summary is not intended to be exhaustive but rather to illustrate
the approaches that have been taken and the types of results that have
been reported.
Generally, these studies have attempted to estimate the costs to
each of the participants in the payment systems, net out fees between
participants, and calculate total fixed and variable costs. Examples
include:
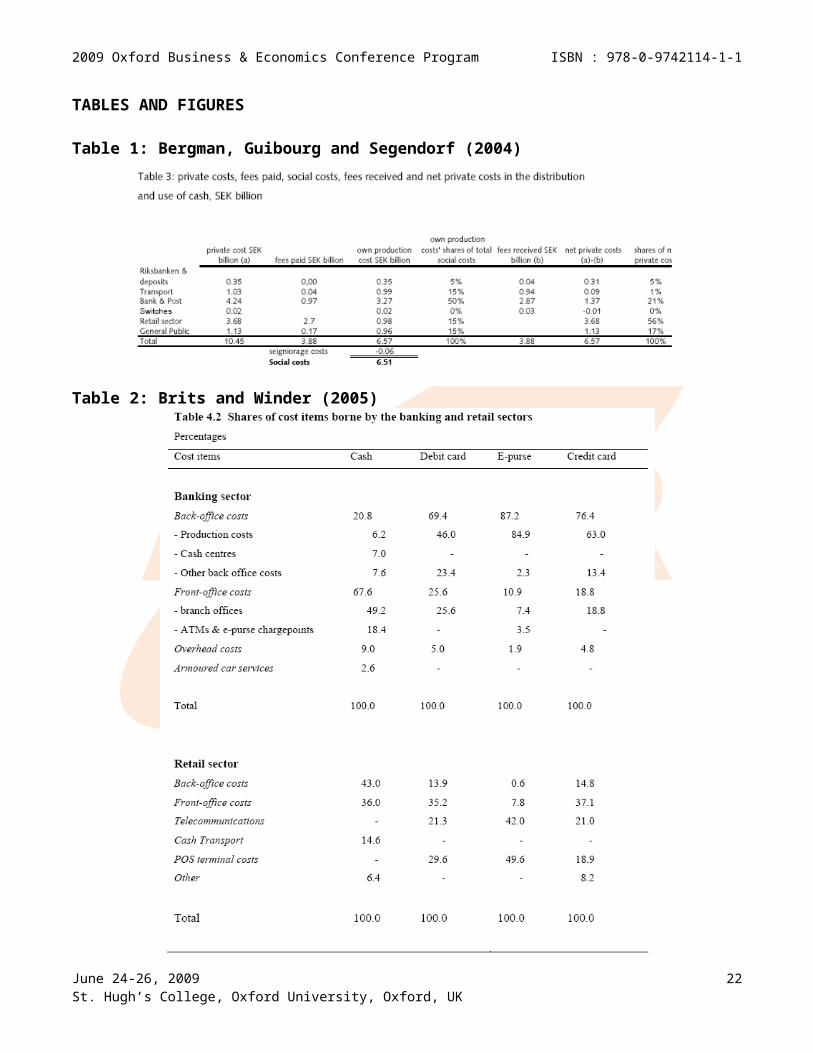
Sweden - Bergman, Guibourg and Segendorf (2007)
The authors estimate the social and private costs of cash, debit
and credit cards in Sweden. They report that in 2002, cash accounted
for 70% of transactions and 39% of the value of transactions at the
point of sale. The authors attempted to estimate the costs to each of
the participants in the payments systems for each payment instrument
and then aggregate them into private and social costs. Those costs
include fees paid, own production costs, fees received, and
seigniorage costs. The social cost is estimated as the own production
cost (i.e., the private cost less fees paid). A summary table of
their approach is included here as Table 1.d Overall unit social
costs were estimated at 4.7 Swedish Kronor (SEK) for cash, 3.1 SEK for
debit cards and 4.5 SEK for credit cards.
The authors estimate that because of different fixed / variable
cost ratios, cash is more efficient than other payment methods for
smaller transactions. However, the private benefits of credit are
estimated as being higher for consumers than the social benefits, d . All tables are included at the end of this paper. June 24-26, 2009St. Hugh’s College, Oxford University, Oxford, UK
4
2009 Oxford Business & Economics Conference Program ISBN : 978-0-9742114-1-1
resulting in excessive use of credit cards for small transactions.
The misalignment for merchants is reported as being even greater.
That is, banks benefited significantly from credit cards at the
expense of merchants.
Netherlands - Brits and Winder (2005) & De Heij and Kippers (2004)
The authors use data from a survey in the Netherlands to estimate
the social costs of different payment methods. The data covered the
costs of the banking industry, the retail sector and the central bank.
Social costs were defined as the sum of internal costs of carrying out
a transaction by all participants of the “payment chain.” A summary
table of their approach is included here as Table 2. Transfers such
as seigniorage or fees between participants were not counted.
The authors estimated that e-purses had the lowest variable costs
at any transaction level. Credit card transactions had the highest
variable costs at any transaction level. For cash and debit, cash had
lower variable costs for small transaction amounts, while debit had
lower variable costs for larger transaction amounts. The incidence of
these costs varies, however, with cash processing costs largely borne
by the retail sector, and electronic processing costs largely borne by
the banking sector. The authors argue that credit cards are socially
inefficient relative to other payment methods.
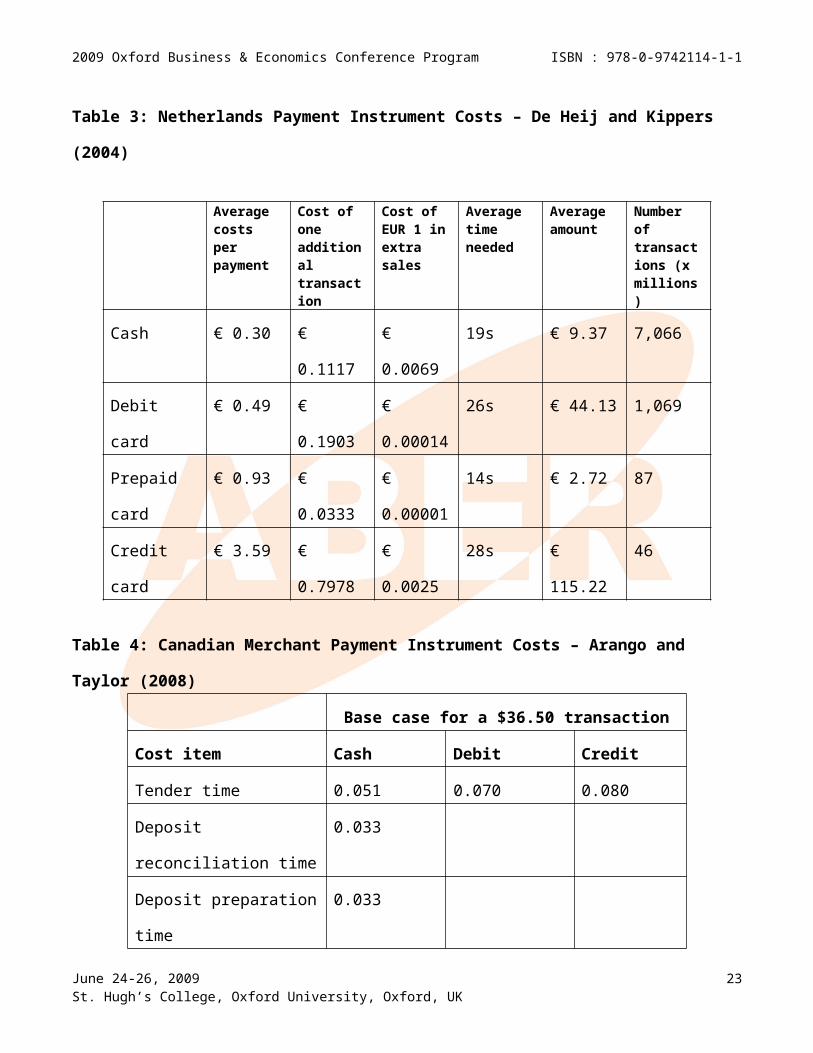
De Heij and Kippers report on a similar study made under the
auspices of the Dutch National Forum on Payment Systems, which found
payment costs as reported in Table 3. Again, the general approach was
June 24-26, 2009St. Hugh’s College, Oxford University, Oxford, UK
5
2009 Oxford Business & Economics Conference Program ISBN : 978-0-9742114-1-1
to sum up costs across participants. The authors discounted
nonpecuniary considerations, noting that “In the end, all efficiency
theories can be reflected in the total costs of the cash payments.”
United States – Humphrey and Berger (1990)
The authors argue that consumers do not pay for the costs of
float, resulting in a significant market failure in the U.S. The
authors estimate unit social costs for cash of $0.04, checks $0.79,
credit cards $0.88, ACH $0.29, and debit $0.47. They estimate that
consumers obtain float benefits of $0.83 for checks, $0.44 for credit
cards, and pay a float cost of $0.05 for cash. Checks and credit are
thus made cheaper to the users than their social costs, resulting in
overuse of those payment methods.
Australia – Simes, Lancy and Harper (2006)
The authors estimate net marginal social costs using Australian
data. They estimate that costs for checks ($1.77), four party credit
($0.99), three party credit ($1.02) and PIN debit ($0.80) are roughly
invariant to the transaction size (in Australian dollars). The social
costs of cash are estimated to vary from $0.93 for a $10 transaction
to $2.50 for a $100 transaction.
Consumer Point of View
There are a wide range of articles studying consumer preferences
for payment methods, including, for example, Benton, Krista, Marianne
and Schuh (2007); Borzekowski and Kiser (2006); and Jonker (2005).
June 24-26, 2009St. Hugh’s College, Oxford University, Oxford, UK
6
2009 Oxford Business & Economics Conference Program ISBN : 978-0-9742114-1-1
The types of effects reported as significant, both as benefits and
costs to consumers, generally follow the typology laid out by Jonker –
safety, speed, cost and ease of use. More specifically, consumers are
reported to care about identity theft, robbery, ease of obtaining
additional payment access, record keeping, fiscal discipline (i.e., a
debit card prevents the user from spending more than they have
available by not extending credit), access to credit, etc.
Some of these elements are readily quantifiable, such as fees for
use. Others are very difficult to quantify, such as the value of
privacy or the perceived risk of identity theft or robbery. The
literature on consumer preferences sometimes attempts to estimate the
degree to which consumers will trade off different payment methods,
but has not attempted to determine willingness to pay or consumer
surplus associated with different features. One exception is
Humphrey, Kim and Vale (2001), who use survey data from Norwegian
banks to estimate the own-price elasticities of four types of
transactions: point of sale; bill payment; payroll; and interbusiness.
One advantage of their approach is that any non-pecuniary benefits or
costs are incorporated into the elasticities. The authors’ results
are discussed further in the next section.
Merchant Point of View
Many studies have examined the costs of payment methods to
merchants. A recent study by Arango and Taylor (2008) illustrates the
June 24-26, 2009St. Hugh’s College, Oxford University, Oxford, UK
7
2009 Oxford Business & Economics Conference Program ISBN : 978-0-9742114-1-1
typical approach taken. Arango and Taylor use data from a merchant
survey in Canada to estimate the costs involved in accepting payments
from a merchant perspective. Arango and Taylor report that fixed
payment processing fees averaged around $45 to $53 per month. Those
fixed fees were not allocated between payment instruments in the
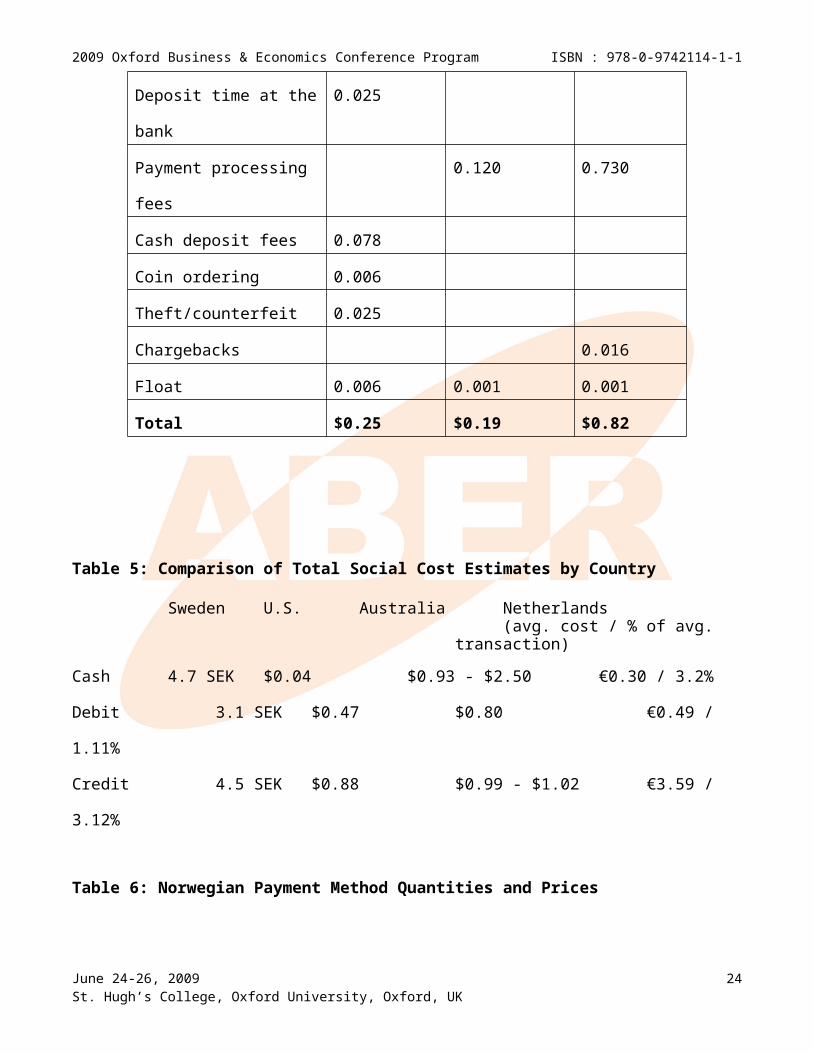
survey. However, variable costs were reported as given in Table 4.
These costs are broken down by type of cost, such as tender time,
deposit reconciliation time, etc. This sort of detailed accounting
measurement of costs is typical of the literature.
A similar study using Dutch data which obtained different results
is Raa and Shestalova (2004). The authors use data for Dutch
retailers to estimate transaction costs. They conclude that
incremental currency transactions have fixed costs of around 2
eurocents and variable costs of a quarter eurocent per euro; while an
incremental debit transaction has a fixed cost of around 6 eurocents
and variable costs of a tenth of a eurocent per euro.
These studies, like the ones discussed above, attempt to deal
with complex economic and accounting issues. It can be difficult to
make distinctions such as whether costs are variable or fixed. For
example, a store clerk may need to do deposit reconciliation
regardless of the amount of cash received. The amount of time spent
may vary to a small degree with the amount of cash received that day,
but simply dividing that clerk’s hourly salary by the amount of cash
June 24-26, 2009St. Hugh’s College, Oxford University, Oxford, UK
8
2009 Oxford Business & Economics Conference Program ISBN : 978-0-9742114-1-1
is likely to yield a poor estimate of the truly variable component of
the cost.
Social Point of View – Nonpecuniary Benefits.
In 2006, Garcia-Swartz, Hahn and Layne-Farrar (2006a, 2006b) took
a different approach, using data from various sources including Visa
and the Food Marketing Institute to estimate the costs and benefits of
different payment methods using grocery stores as the retailers, but
attempting to include estimates of the value of nonpecuniary benefits
and costs such as the value of privacy and the degree to which
consumers value rewards programs. Despite their stated intent to
calculate such benefits, they did not explicitly examine consumer or
producer surplus. Furthermore, Shampine (2007) demonstrated that
their results were highly sensitive to their assumptions. The authors
agreed in their reply to Shampine’s comment that the results were
sensitive to assumptions and should be used in policy analyses only
with great caution.
Shampine’s criticisms apply generally to any of the studies which
attempt to sum up costs across many different participants, but doubly
so when nonpecuniary effects are being considered.
Estimation of Welfare Effects
Data limitations
June 24-26, 2009St. Hugh’s College, Oxford University, Oxford, UK
9
2009 Oxford Business & Economics Conference Program ISBN : 978-0-9742114-1-1
A general difficulty which applies to the estimation of welfare
effects as well as the estimation of costs is that the available data
are limited. Quantification usually requires a long series of
assumptions, any of which can reasonably be challenged. As a result,
two different authors approaching the same problem with the same data
will often come up with very different results. To illustrate this
difficulty, look at how Humphrey and Berger (1989) estimate the
production and processing costs of cash.
Payee costs of accepting cash for retail sales include point-of-sale and accounting costs, the costs of theft and loss of cash, safekeeping and security costs, along with deposit costs and fees paid to financial institutions (Curtin 1983). These costs, expressed as a percentage of the average cash retail transaction amount, were 2% (and 2.5% for check). Studies have suggested that the share of retail sales paid for by cash is around 30%. Applying this 30% share and the 2% cost percentage to all retail sales in 1987 of $1505 billion yields a total payee cost of cash of $9030 million (0.03 x 0.30 x $1505 billion). This payee cost estimate covers payee bank cash costs as well. Payor costs of using cash cannot be reliably estimated but would include the cost of lost cash and theft along with the cost of obtaining cash from a bank. The bank costs of giving cash over the counter when checks are cashed are estimated to be $1674 million. This estimate is derived primarily from the 1986 Functional Cost Analysis (FCA) data for the 76 bankswith over $200 million in deposits. The smaller banks were discarded to offset the bias toward smaller banks in the FCAsample, although the difference would be negligible. The per-transaction cost of giving cash is estimated to be $0.314. The number of checks cashed per personal account was estimated by taking the total on-us plus transit checks cashed by the average bank last year and dividing by the average number of personal accounts per bank (for those banks reporting a separate breakout by type of account), giving 48.55 cashings per account per year. The aggregate number of personal accounts was estimated to be 109.8 million (from Avery et al. 1987, special unpublished computer run). Total check cashing costs were therefore estimated to be $0.314 x 48.55 x 109.8 million = $1674
June 24-26, 2009St. Hugh’s College, Oxford University, Oxford, UK
10
2009 Oxford Business & Economics Conference Program ISBN : 978-0-9742114-1-1million. Federal Reserve costs in transporting and processing currency and coin, including the cost of retiringold and counterfeit currency, was $154 million (Board of Governors of the Federal Reserve System 1987b). Thus, the payee ($9030 million), payor and bank ($1674 million), and Federal Reserve ($154 million) processing cost of cash is $10,858 million.
This footnote contains a mind-numbing series of assumptions, all of
which are perfectly understandable, but which are all also open to
debate. For example, the portion of retail sales paid for by cash is
not known with any precision. Each of the studies cited are
themselves based on incomplete and potentially biased survey data
which may or may not apply more generally. Finally, this entire
footnote covers only one element of the total set of cash costs.
The result is that estimates vary widely. Some of these
differences were illustrated in the previous section. Compare, for
example, the merchant estimates of Arango and Taylor (2008) for Canada
with those of Raa and Shestalova (2004) for the Netherlands. The two
studies have substantially different estimates for cash, for instance.
With respect to total social costs, Table 5 summarizes the results of
the studies discussed earlier. Although these results are for
different countries, it is unlikely that the relative costs of payment
methods vary greatly from country to country. The estimates, however,
show significant differences in the rankings, relative magnitudes, and
absolute size.
Welfare framework
Before discussing how to estimate social welfare, it is useful to
think about why one would want to do so, since the question of why
helps to inform the how. At a theoretical level, the role of payment June 24-26, 2009St. Hugh’s College, Oxford University, Oxford, UK
11
2009 Oxford Business & Economics Conference Program ISBN : 978-0-9742114-1-1
methods is to enable transactions at the lowest possible cost.
However, payment methods often involve reallocation of resources
between different parties. For example, credit card providers charge
merchants a substantial “interchange fee” and use those revenues to
provide rewards programs to their cardholders and dividend payments to
their stockholders. These transfer payments pose a variety of
problems with respect to calculating welfare. As discussed above,
there are many parties involved in the provision and consumption of
payment methods. The reallocation of resources may have profound
policy implications even though the total social welfare effects may
be small. This is particularly important when the “benefits” are not
related to the payment method’s core functionality. For example, the
credit function of credit cards can be considered separately from its
payment method function, and the payment methods literature often
examines credit cards strictly on their payment function. Similarly,
credit cards do not need rewards programs to function. However, the
functions are bundled and separating the welfare effects of the
different elements is difficult. One reason to estimate social
welfare is to therefore to try and determine the winners and losers
from reallocation.
A second reason is that the literature on consumer and merchant
perceptions indicates that there are nonpecuniary factors involved in
payment choices. A general equilibrium approach would wish to take
these factors into account. However, there are good arguments for not
doing so as well. For example, the social planner may wish to keep
June 24-26, 2009St. Hugh’s College, Oxford University, Oxford, UK
12
2009 Oxford Business & Economics Conference Program ISBN : 978-0-9742114-1-1
its role narrowly focused on providing low-cost, efficient payment
methods. To the extent that consumers value nonpecuniary aspects of
those payment methods, many such aspects can be internalized. That
is, banks can (and do) charge for providing statements and records for
checking, debit and credit cards. Other nonpecuniary aspects may be
undesirable to a social planner (although they are, by definition,
desirable to some parties or they would not persist). For example,
some studies have suggested that cash in Iceland has persisted in
large part due to demand by the black market for an anonymous payment
method. Of course, such aspects are not necessarily limited to
nonpecuniary benefits. Banks, for example, may possess market power
over some payment methods and so obtain producer surplus from those
methods. A social planner may not wish to take such “benefits” into
account.
There are two approaches to calculating social welfare. The
first, as done by Garcia-Swartz, Hahn and Layne-Farrar (2006a; 2006b),
is to look at all participants in a payment method, trace the
transfers and costs, and attempt to estimate the average value
attached for various “benefits.” This approach, as demonstrated by
Shampine (2007) and discussed further here, is problematic.
Attempting to trace every participant and every transfer or cost is
very difficult. The complexity of the task makes it almost inevitable
that one will miss externalities, benefits and costs. Furthermore,
estimating the value of any one of the dozens of such transfers, costs
or benefits is difficult, and the final results, as shown by Shampine
June 24-26, 2009St. Hugh’s College, Oxford University, Oxford, UK
13
2009 Oxford Business & Economics Conference Program ISBN : 978-0-9742114-1-1
(2007), are very sensitive to the assumptions. A modest change in any
one of the dozens of estimates can reverse the rank ordering of the
payment methods with respect to net costs.
An alternative approach is to attempt to calculate the supply and
demand curves for the participants and estimate consumer and producer
surplus in the traditional fashion. This approach is complicated by
the derived nature of the demand and the presence of significant
externalities, but has the benefit of not needing to analyze
transfers, costs and benefits individually. It does, however, suffer
from its own difficulties.
Calculation of consumer surplus
One difficulty with estimating consumer surplus directly is the
fact that the demand for payment methods is derived from the demand
for goods and services. The difficulty of derived demand in welfare
calculations is not simply theoretical. For example, Humphrey, Pulley
and Vesala (1996), used cross-country data from 1987-1993 from the
Bank for International Settlements to examine whether differences in
payment method use are driven primarily by standard demand
considerations (i.e., price) or by other factors. The authors found
that price effects are “fragile” and had little impact on the use of
payment instruments. Rather, most differences in use were driven by
payment instrument availability, past patterns of payment and
institutional differences. This result is consistent with payment
methods being a derived demand. It also calls into question whether
June 24-26, 2009St. Hugh’s College, Oxford University, Oxford, UK
14
2009 Oxford Business & Economics Conference Program ISBN : 978-0-9742114-1-1
or how standard consumer surplus calculations can be applied to
payment methods.
In order to implement this approach, one needs estimates of the
supply and demand curves for the various participants. Such estimates
are not generally available, nor are the data to come up with
estimates generally available, particularly for producers. For
example, data on the fraction of merchants and networks accepting
different payment methods are not generally available, nor are pricing
data between banks, merchants and networks. Thus, estimates of
producer surplus are not readily available. One may, however, attempt
to estimate consumer surplus.
Using the Humphreys, Kim and Vale (2001) elasticity calculations,
one can estimate the consumer surplus associated with ATM, check and
EFTPOS usage in Norway. Using the elasticities at the sample means
(-.5014 for ATM; -1.0746 for checks; and -.2918 for EFTPOS), and
assuming linear demand, the consumer surplus (measured in Norwegian
kroner) for EFTPOS usage is kr 111.7 million; for checks, kr 163.4
million; and for ATM usage, kr 310.5 million.
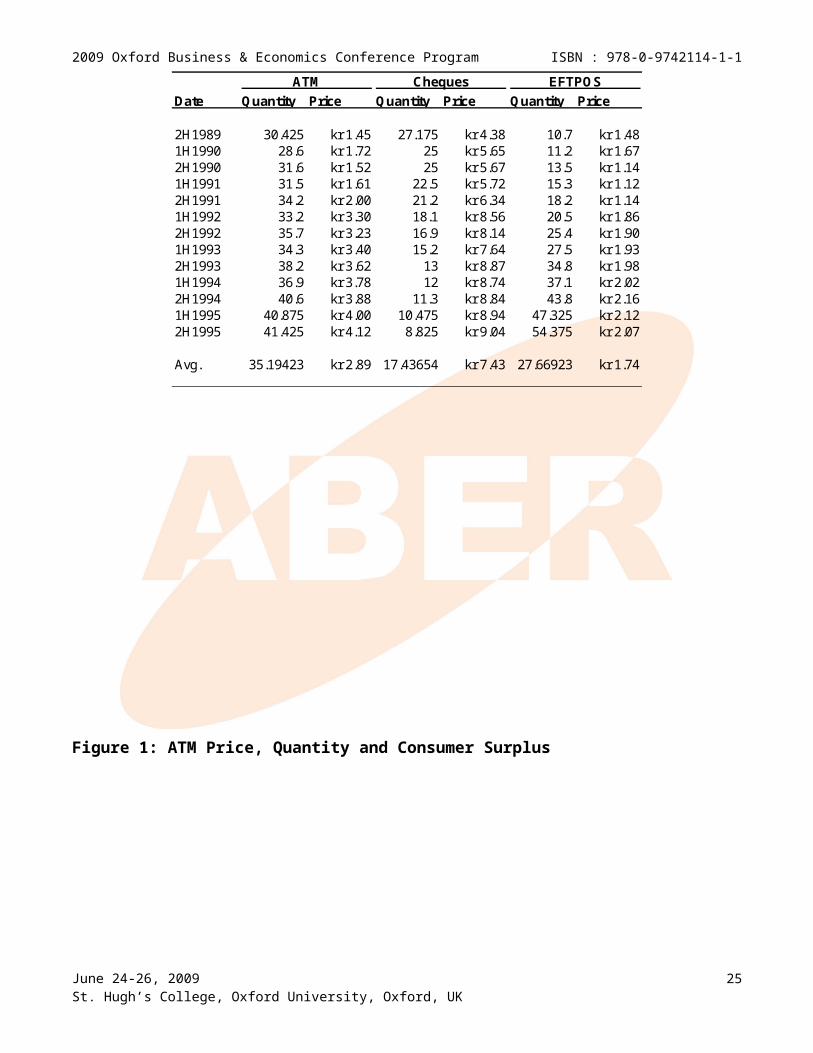
Figure 1 and Table 6 show the prices and quantities for the
different payment methods. The data make it clear that it is the
interaction between the payment methods that provides most of the
information. That is, prices for all three payment methods rose. The
price of ATM service quadrupled, but its usage rose. The price of
EFTPOS service rose by roughly a third, while its usage also rose.
The price of cheques roughly doubled while its usage fell sharply.
June 24-26, 2009St. Hugh’s College, Oxford University, Oxford, UK
15
2009 Oxford Business & Economics Conference Program ISBN : 978-0-9742114-1-1
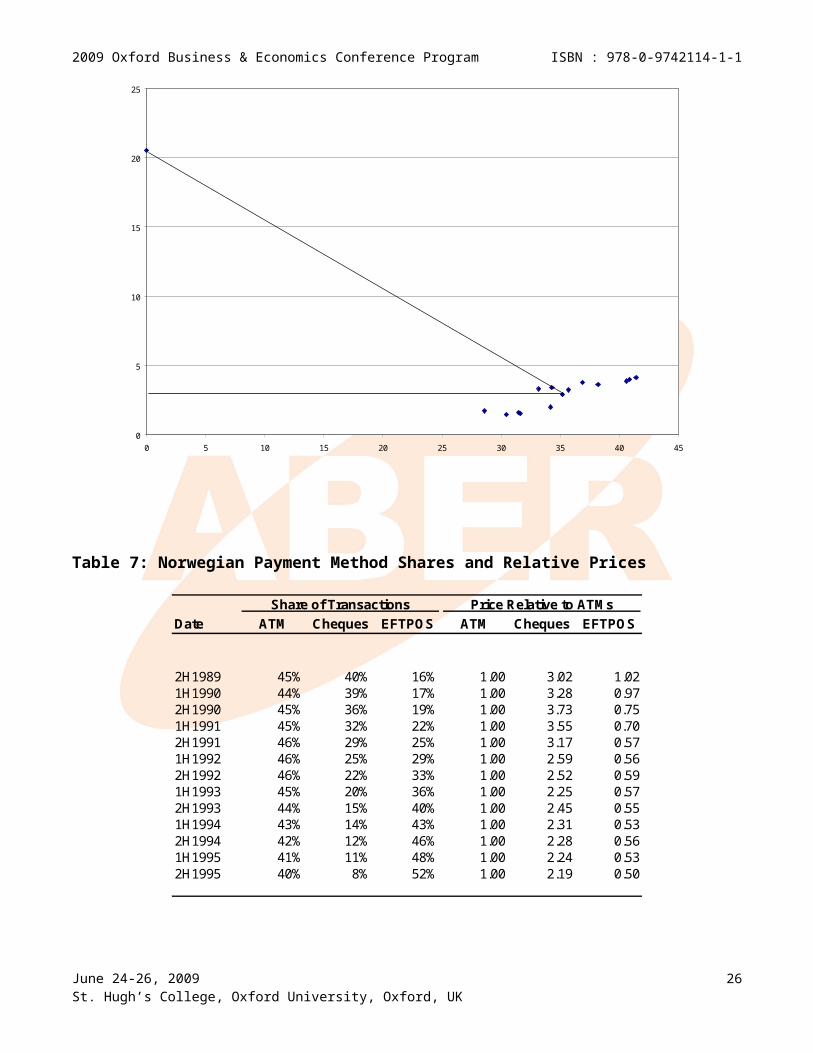
Figure 1 also makes it clear that estimating the demand curve for
calculation of the consumer surplus involves projecting far out of the
data range. An assumption of linear demand, particularly so far out
of sample, may significantly bias the results.
Since the payment methods use a derived demand, it is often more
useful to look at the fraction of transactions accounted for by each
payment method. Table 7 gives the relative usage levels and the
prices for each payment method relative to ATMs.
Table 7 shows that demand for cheques is fairly elastic. The
price of cheques has fallen relative to ATM and risen somewhat
relative to EFTPOS, but the usage of cheques has fallen by 80%!
EFTPOS is also relatively elastic also. ATM, by contrast, is fairly
inelastic.
One can determine the rough magnitudes of the consumer surplus
simply by examining the volume and the elasticity. If a payment
method shows little change in volume as relative prices change, it is
relatively inelastic, suggesting high consumer surplus. A payment
method that is showing large changes in volume, either increases or
decreases, is relatively elastic, suggesting lower consumer surplus.
Similarly, the larger the volume, the higher the consumer surplus.
With respect to Norway, cheques have highly elastic demand and
have the smallest volume, leading to the lowest consumer surplus.
EFTPOS has a high volume but has elastic demand, while ATM has high
volume and inelastic demand, so ATM has the highest consumer surplus.
June 24-26, 2009St. Hugh’s College, Oxford University, Oxford, UK
16
2009 Oxford Business & Economics Conference Program ISBN : 978-0-9742114-1-1
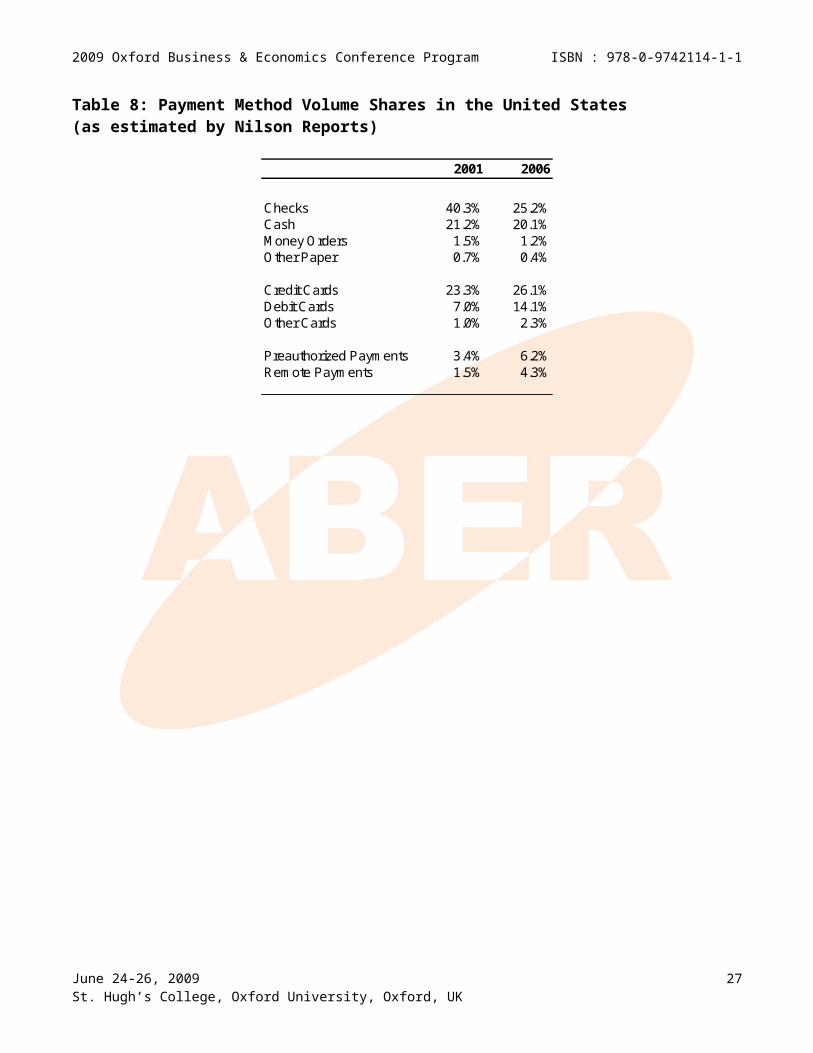
The same rules of thumb may be applied to other countries and
payment methods. Table 8 gives volume shares of different payment
methods in the United States for 2001 and 2006.
In the United States, checks show a significant decrease in usage
while debit cards show a significant increase. Cash and credit are
relatively stable and have relatively large shares. It is difficult
to evaluate the relative elasticities without some information on the
relative prices, however. For example, the price of cash to consumers
in the United States has likely increased between 2001 and 2006 as
bank fees, including ATM fees of various types, have increased. By
contrast, the price of credit cards to consumers has likely decreased
as rewards programs became more prevalent and annual fees declined or
disappeared. The relatively stable shares are suggestive of inelastic
demand, but should be used with caution because of the lack of price
data. However, it seems likely that the consumer surplus associated
with credit cards is greater than for debit cards, both because of the
more stable share for credit cards and the larger total share.
In Europe, debit and electronic purse transactions are far more
common than in the United States. Credit card usage remains modest,
limiting the possible consumer surplus. Cash usage also remains
relatively high, despite active efforts by regulators and central
banks to move their economies towards electronic payments.
These sorts of rules of thumb highlight both the benefits and
problems of this method. On the one hand, one can observe that
consumers attach significant value to elements such as privacy and
June 24-26, 2009St. Hugh’s College, Oxford University, Oxford, UK
17
2009 Oxford Business & Economics Conference Program ISBN : 978-0-9742114-1-1
credit card rewards. On the other hand, focusing only on the consumer
neglects the negative effects of reallocation (e.g., credit card
rewards are paid for by merchants and other consumers through price
increases) and presents only a limited part of the picture. There are
many other participants whose welfare is not considered.
SUMMARY
Estimating the costs of payment methods is an extremely difficult
exercise under the best of circumstances. Attempting to include
nonpecuniary costs and benefits, or to estimate consumer and producer
surplus, may be impractical given existing data. Even the simpler
estimates of costs alone display a wide, and disturbing, variance. If
studies cannot consistently determine whether cash or electronic
payment methods are more efficient, it is difficult for economists to
advise policy makers.
Generally, it is useful to compare study results with real world
behavior. For example, any study which concludes that cash is
undesirable must explain why cash usage is so persistent. Consumers
clearly value cash and find its use efficient under many
circumstances.
Given the difficulties of estimating the costs of payment methods with
any precision, policy makers may be well advised to focus on the
efficient running of the markets. In particular, efforts to allow
efficient price signals and for parties to internalize any
externalities may be the best use of policy makers efforts. That is,
June 24-26, 2009St. Hugh’s College, Oxford University, Oxford, UK
18
2009 Oxford Business & Economics Conference Program ISBN : 978-0-9742114-1-1
a social planner could largely avoid the complications of estimation
by encouraging banks and merchants to charge consumers directly for
use of the payment method, thus internalizing the various
externalities in the system. Such an approach would be imperfect, but
would allow the social planner to focus on ensuring the availability
of low-cost, efficient payment methods. To the extent that consumers
valued other aspects of the payment method, consumers could then pay
for those aspects.
June 24-26, 2009St. Hugh’s College, Oxford University, Oxford, UK
19
2009 Oxford Business & Economics Conference Program ISBN : 978-0-9742114-1-1
REFERENCES
Arango, C. & Taylor, V. Merchant acceptance, costs, and perceptions of retail payments: a Canadian survey. Bank of Canada, Discussion Paper 2008-12.
Benton, M., Krista, B. & Schuh, S. (2007). The Boston Fed study of consumer behavior and payment choice: a survey of Federal Reserve System employees.
Bergman, M., Guibourg, G. & Segendorf, B. (2007). The costs of paying– private and social costs of cash and card payments.
Borzekowski, R. & Kiser, E. (2006). The choice at the checkout: quantifying demand across payment instruments. Finance and Economics Discussion Series, Divisions of Research & Statistics and Monetary Affairs, Federal Reserve Board, Washington, D.C.
Brits, H. & Winder, C. (2005). Payments are no free lunch. De Nederlandsche Bank, Occasional Studies (vol. 3, no. 2).
De Heij, H. & Kippers, J. (2004) Efficient cash payments with euro coins and banknotes in the Netherlands, De Nederlandsche Bank, background material to the presentation held by Henny van der Wielen at the Banknote Printers Conference, Dresden, 6-9 September 2004.
Garcia-Swartz, D., Hahn, R. & Layne-Farrar, A. (2006a). The move towards a cashless society: a closer look at payment instrument economics. Review of Network Economics, 5: 175-198.
Garcia-Swartz, D., Hahn, R. & Layne-Farrar, A. (2006b). The move toward a cashless society: calculating the costs and benefits. Review of Network Economics, 5: 199-228.
Garcia-Swartz, D., Hahn, R. & Layne-Farrar, A. (2007). Further thoughts on the cashless society: a reply to Dr. Shampine. Review of Network Economics, 6: 509-524.
Humphrey, D. & Berger, A. (1989). Market failure and resource use: economic incentives to use different payment instruments. The U.S. Payment System: Efficiency Risk and the Role of the Federal Reserve, Proceedings of a Symposium at the Federal Reserve Bank of Richmond.
June 24-26, 2009St. Hugh’s College, Oxford University, Oxford, UK
20
2009 Oxford Business & Economics Conference Program ISBN : 978-0-9742114-1-1Humphrey, D., Kim, M. & Vale, B. (2001). Realizing the gains from electronic payments: costs, pricing, and payment choice. Journal of Money, Credit, and Banking, 33: 216-234.
Humphrey, D., Pulley, L. & Vesala, J. (1996). Cash, paper, and electronic payments: a cross-country analysis. Journal of Money, Credit and Banking, 28.
Jonker, N. (2005). Payment instruments as perceived by consumers – a public survey. De Nederlandsche Bank, DNB Working Paper No. 53.
McAndrews, J. & Wang, Z. (2008). The economics of two-sided payment markets: pricing, adoption & usage. Federal Reserve Bank of Kansas City, RWP08-12.
Raa, T. & Shestalova, V. (2004). Empirical evidence on payment media costs and switch points. Journal of Banking & Finance, 28: 203-213.
Shampine, A. (2007). Another look at payment instrument economics. Review of Network Economics, 6: 495-507.
June 24-26, 2009St. Hugh’s College, Oxford University, Oxford, UK
21
2009 Oxford Business & Economics Conference Program ISBN : 978-0-9742114-1-1
TABLES AND FIGURES
Table 1: Bergman, Guibourg and Segendorf (2004)
Table 2: Brits and Winder (2005)
June 24-26, 2009St. Hugh’s College, Oxford University, Oxford, UK
22
2009 Oxford Business & Economics Conference Program ISBN : 978-0-9742114-1-1
Table 3: Netherlands Payment Instrument Costs – De Heij and Kippers
(2004)
Average costs per payment
Cost of one additional transaction
Cost of EUR 1 inextra sales
Average time needed
Average amount
Number of transactions (x millions)
Cash € 0.30 €
0.1117
€
0.0069
19s € 9.37 7,066
Debit
card
€ 0.49 €
0.1903
€
0.00014
26s € 44.13 1,069
Prepaid
card
€ 0.93 €
0.0333
€
0.00001
14s € 2.72 87
Credit
card
€ 3.59 €
0.7978
€
0.0025
28s €
115.22
46
Table 4: Canadian Merchant Payment Instrument Costs – Arango and
Taylor (2008)
Base case for a $36.50 transaction
Cost item Cash Debit Credit
Tender time 0.051 0.070 0.080
Deposit
reconciliation time
0.033
Deposit preparation
time
0.033
June 24-26, 2009St. Hugh’s College, Oxford University, Oxford, UK
23
2009 Oxford Business & Economics Conference Program ISBN : 978-0-9742114-1-1
Deposit time at the
bank
0.025
Payment processing
fees
0.120 0.730
Cash deposit fees 0.078
Coin ordering 0.006
Theft/counterfeit 0.025
Chargebacks 0.016
Float 0.006 0.001 0.001
Total $0.25 $0.19 $0.82
Table 5: Comparison of Total Social Cost Estimates by Country
Sweden U.S. Australia Netherlands (avg. cost / % of avg.
transaction)
Cash 4.7 SEK $0.04 $0.93 - $2.50 €0.30 / 3.2%
Debit 3.1 SEK $0.47 $0.80 €0.49 /
1.11%
Credit 4.5 SEK $0.88 $0.99 - $1.02 €3.59 /
3.12%
Table 6: Norwegian Payment Method Quantities and Prices
June 24-26, 2009St. Hugh’s College, Oxford University, Oxford, UK
24
2009 Oxford Business & Economics Conference Program ISBN : 978-0-9742114-1-1ATM Cheques EFTPOS
Date Quantity Price Quantity Price Quantity Price
2H1989 30.425 kr 1.45 27.175 kr 4.38 10.7 kr 1.481H1990 28.6 kr 1.72 25 kr 5.65 11.2 kr 1.672H1990 31.6 kr 1.52 25 kr 5.67 13.5 kr 1.141H1991 31.5 kr 1.61 22.5 kr 5.72 15.3 kr 1.122H1991 34.2 kr 2.00 21.2 kr 6.34 18.2 kr 1.141H1992 33.2 kr 3.30 18.1 kr 8.56 20.5 kr 1.862H1992 35.7 kr 3.23 16.9 kr 8.14 25.4 kr 1.901H1993 34.3 kr 3.40 15.2 kr 7.64 27.5 kr 1.932H1993 38.2 kr 3.62 13 kr 8.87 34.8 kr 1.981H1994 36.9 kr 3.78 12 kr 8.74 37.1 kr 2.022H1994 40.6 kr 3.88 11.3 kr 8.84 43.8 kr 2.161H1995 40.875 kr 4.00 10.475 kr 8.94 47.325 kr 2.122H1995 41.425 kr 4.12 8.825 kr 9.04 54.375 kr 2.07
Avg. 35.19423 kr 2.89 17.43654 kr 7.43 27.66923 kr 1.74
Figure 1: ATM Price, Quantity and Consumer Surplus
June 24-26, 2009St. Hugh’s College, Oxford University, Oxford, UK
25
2009 Oxford Business & Economics Conference Program ISBN : 978-0-9742114-1-1
0
5
10
15
20
25
0 5 10 15 20 25 30 35 40 45
Table 7: Norwegian Payment Method Shares and Relative Prices
Share of Transactions Price Relative to ATM sDate ATM Cheques EFTPOS ATM Cheques EFTPOS
2H1989 45% 40% 16% 1.00 3.02 1.021H1990 44% 39% 17% 1.00 3.28 0.972H1990 45% 36% 19% 1.00 3.73 0.751H1991 45% 32% 22% 1.00 3.55 0.702H1991 46% 29% 25% 1.00 3.17 0.571H1992 46% 25% 29% 1.00 2.59 0.562H1992 46% 22% 33% 1.00 2.52 0.591H1993 45% 20% 36% 1.00 2.25 0.572H1993 44% 15% 40% 1.00 2.45 0.551H1994 43% 14% 43% 1.00 2.31 0.532H1994 42% 12% 46% 1.00 2.28 0.561H1995 41% 11% 48% 1.00 2.24 0.532H1995 40% 8% 52% 1.00 2.19 0.50
June 24-26, 2009St. Hugh’s College, Oxford University, Oxford, UK
26
2009 Oxford Business & Economics Conference Program ISBN : 978-0-9742114-1-1
Table 8: Payment Method Volume Shares in the United States(as estimated by Nilson Reports)
2001 2006
Checks 40.3% 25.2%Cash 21.2% 20.1%M oney Orders 1.5% 1.2%Other Paper 0.7% 0.4%
Credit Cards 23.3% 26.1%Debit Cards 7.0% 14.1%Other Cards 1.0% 2.3%
Preauthorized Paym ents 3.4% 6.2%Rem ote Paym ents 1.5% 4.3%
June 24-26, 2009St. Hugh’s College, Oxford University, Oxford, UK
27