the endangered bank cormorant phalacrocorax neglectus
TRANSCRIPT

Univers
ity of
Cap
e Tow
n
The endangered bank cormorant Phalacrocorax neglectus: the heat is on
Understanding the effect of climate change and associated environmental variable changes on the
breeding biology and population dynamics of the bank cormorant in the Western Cape, South Africa
Corlia Meyer
MYRCOR004
Thesis presented for the Degree of Master of Science in Zoology,
Department of Biological Sciences, Faculty of Science, University of Cape Town, South Africa
April 2014
Supervisors: Prof. L.G. Underhill, Prof. P.G. Ryan, Dr R.B. Sherley and Dr T. Cook

The copyright of this thesis vests in the author. No quotation from it or information derived from it is to be published without full acknowledgement of the source. The thesis is to be used for private study or non-commercial research purposes only.
Published by the University of Cape Town (UCT) in terms of the non-exclusive license granted to UCT by the author.
Univers
ity of
Cap
e Tow
n


i
Plagiarism declaration
I know the meaning of plagiarism and declare that all of the work in this thesis, saved for that which is
properly acknowledged, is my own.
Signature:________________________
Date:_____________________________

ii

iii
For the birds

iv
v
Abstract
The bank cormorant Phalacrocorax neglectus was listed as ‘Endangered’ in 2004, following a
decrease of more than 60% in the total population from 1975–2011. It ranges from central Namibia to
the Western Cape, South Africa, with most of the population occurring on offshore islands in
Namibia.
The main reason for this study was to determine if climate change could be identified as a factor
which has influenced the decreasing numbers of bank cormorants. This involved research on the heat
stress behaviour, breeding success and population trends of the bank cormorant in the Western Cape,
South Africa.
High environmental temperatures resulting in heat stress and storms with associated extreme
environmental variables was predicted to cause breeding failures, decreasing breeding success. As a
result, climate change can also affect long-term trends in the adult population of the bank cormorant,
and this was examined using the population data of nine bank cormorant colonies in the Western
Cape, South Africa.
A link existed between ambient and operative temperature, and the latter was used for statistical
analysis. Mean operative temperatures of over 30°C were experienced. Temperatures were highest at
the bank cormorant colony at Robben Island when three colonies were compared (Robben Island,
Jutten Island and Stony Point). Increased environmental temperatures resulted in the average bank
cormorant increasing its time spent employing thermoregulatory behaviour. Bank cormorants were
shown to start gular fluttering at 21°C on average and spend all their time gular fluttering when they
experienced an operative temperature of 34.2°C or higher. The birds also started employing this
thermoregulatory behaviour at a lower temperature when on eggs or small chicks.
During the study period, the breeding success of the bank cormorant was not impacted by high
temperatures at the three bank cormorant colonies studied. Wave and wind action, associated with
storms, resulted in a lowered reproductive output during the breeding seasons of 2012 and 2013. Both
incubation success and chick rearing success did not differ significantly between 2012 and 2013 for
the three bank cormorant colonies at Robben Island, Jutten Island and Stony Point.
The study of long-term trends in colony sizes of nine bank cormorant colonies in the Western Cape,
South Africa revealed a decrease in the bank cormorants breeding population. The decrease could not
be directly associated with climate change in the region. An increase in the mean maximum
temperatures and a decrease in the annual rainfall did not affect the bank cormorant numbers, but
rather the fecundity. This resulted in a lagged effect of climate change on the bank cormorant
population. Climate change and extreme weather events can cause massive breeding failures.

vi
vii
Acknowledgements
I would first and fore mostly like to thank Philna Botha for being my co-researcher and always being
there to lean on. Thank you to all my supervisors at the University of Cape Town (UCT). Prof. Les
Underhill, Prof. Peter Ryan, Dr Richard Sherley and Dr Timothy Cook, I am grateful for your
guidance and encouragement throughout the study. Les, you truly are an amazing person, and I am
honoured to have worked with you, you never offered anything but encouragement. Thank you
everyone that helped in the field of statistics. Sue Kuyper, thank you for being kind and generous and
that I could always rely on you to lend a helping hand. I would’ve been lost without you. Also,
many thanks go out to everyone else at the Animal Demography Unit (ADU) at UCT; the positive
atmosphere there is greatly appreciated.
Thank you Cape Nature, SANParks, the Department of Environmental Affairs, Robben Island
Museum and the Stony Point Penguin Colony for permitting us to do research at our chosen study
sites and the staff of these institutions for always being willing to help out. Thank you to the National
Research Foundation (NRF), the Marine Research Institute (MA-RE) and the Tygerberg Bird Club for
providing funding for the project and covering other expenses. Many thanks go out to the South
African Weather Services (SAWS) for providing all the climate data used in this study, and the
Council for Scientific and Industrial Research (CSIR) for providing sea state data. Many thanks go
out to Brian Hodgson for transporting us safely to and from Jutten Island, Saldanha Bay. This was
never an easy task and you did it with great grace and enthusiasm. Thank you, Dr Quintin Martins for
forwarding my CV to Les, way back in 2011. I will always be grateful for this act of kindness.
Finally, I express special gratitude to my parents, Wilhelm and Esté Meyer and my sisters, Tina-Mari
and Adri Meyer. Thank you for you love and support, it did not go unnoticed. Thank you also to the
rest of my family and friends for always supporting me and offering words of encouragement when
most needed. And lastly, but certainly not least, thank you, Peter Nilson; thank you for listening,
encouraging and being there when I most needed it.
You have all motivated me in so many ways, that words cannot express.
Thank you.

viii
ix
Table of contents
Plagiarism declaration i
Dedication iii
Abstract v
Acknowledgements vii
Table of contents ix
Chapter 1 Introduction: an overview of the bank cormorant
1
Chapter 2
The influence of increasing environmental temperatures on the thermoregulatory behaviour of the breeding bank cormorant Phalacrocorax neglectus
11
Chapter 3
The influence of environmental variables on the breeding productivity of the ‘Endangered’ bank cormorant Phalacrocorax neglectus in the Western Cape, South Africa 33
Chapter 4 Trends in the bank cormorant Phalacrocorax neglectus population of the Western Cape, South Africa: the impact of climate change 53
Summary and conclusions 73
References 75

x
1
Chapter 1
Introduction: an overview of the bank cormorant
1.1 Global climate change and seabirds
Global climate change due to anthropogenic impacts is now widely accepted (Clark 2008) and has
been recognised as one of mankind’s most dangerous threats to biodiversity (Simmons et al. 2004,
Gregory et al. 2009), placing substantial stress on marine as well as terrestrial ecosystems (Grémillet
and Boulinier 2009). The 2007 Climate Change Synthesis Report stated that the warming of the
global atmosphere since the 1850s has been at a more rapid rate than at any other time in the past
millennium (IPCC 2007). The temperature of the Earth’s atmosphere is also predicted to become
warmer in the next few decades than at any time in the past 40 million years (IPCC 2007).
The Intergovernmental Panel on Climate Change (IPCC) stated that global average surface
temperatures have already increased as a result of anthropogenic production of greenhouse gases,
especially carbon dioxide (CO2) (IPCC 2007). Greenhouse gases trap solar energy within the Earth’s
atmosphere and their increase has resulted in the Earth’s mean temperature warming. Warming has
increased with more than 0.6°C in the last century with at least c. 0.2°C per decade in the 30 years
before the early 2000s (Simmons et al. 2004, Hansen et al. 2006), with considerable acceleration in
the past 50 years leading up to 2009 (Grémillet and Boulinier 2009). Other impacts of global climate
change and global warming include a rising sea level because of thermal expansion and melting ice
caps, changes in precipitation patterns, increased variability in global climate and increased intensity
and frequency of extreme weather events (Clark 2008, Boersma and Rebstock 2014). The frequency
of such extreme warm and precipitation events have increased dramatically in the past half a century
after the 1960s (IPCC 2013).
The rise in temperature has created concerns for the biological and ecological processes that affect
species’ ranges and distributions; phenology and physiology of species; cycles, composition and
interactions of communities; and the structure and dynamics of ecosystems (Croxall et al. 2002).
Recent monitoring of certain key environmental parameters in South Africa confirms the occurrence
of environmental changes; these physical changes in the atmosphere and ocean are predicted to have
important consequences for marine ecosystems (Clark 2008). Understanding how these ecosystems
respond to current climate change is important in helping predict their response to future climate
change (Bolger et al. 2005).
Various reviews on the potential effects of global warming and climate change on biodiversity have
identified Africa as the most vulnerable of the continents (IPCC 2001, Simmons et al. 2004). During
the 1990s it became apparent that long-term climate change might influence some seabird species in
2
the Southern Ocean (Crawford and Cooper 2003, Weimerskirch et al. 2003). The impacts of climate
change on animals or birds can be divided into indirect impacts (i.e. influencing food resources) or
direct physiological effects, such as thermoregulation (Oswald and Arnold 2012). Most studies on the
effects of climatic change on species populations have focused on the indirect consequences – habitat
availability and quality, changes in biological processes and food resource availability and quality – as
drivers of species’ distribution, population changes and behavioural changes (Oswald and Arnold
2012).
Studies have determined that South Africa is undergoing general warming (Kruger and Sekele 2013),
and to understand the potential effects of climate change on African birds, we need first to understand
the predicted effects of climate change in Africa. The IPCC have predicted five major effects (IPCC
2001): 1) increased mean seasonal temperatures, 2) decreased rainfall in most areas, 3) increased
frequency of El Niño Southern Oscillation effects in southern Africa, 4) increased frequency of severe
weather anomalies and 5) increased frequency of fires due to higher temperatures and decreased
rainfall. Of these, the dominant consequence is increased air temperature at the ocean and land
surface (Oswald and Arnold 2012). Increased temperatures influence biotic responses (processes)
across various taxa, which include phenology, demography, distribution and individual behaviour
(Oswald and Arnold 2012). However, predictions of the impacts of global warming on endotherms
(especially mammals and birds) have generally been assumed to occur through ecosystem changes,
rather than direct heat stress (Gaston et al. 2009).
Anthropogenic activities and resulting environmental changes affect all components of marine food
webs, including seabirds that act as top predators in the marine food chain (Grémillet and Boulinier
2009). Various threats, including climate change, overfishing and other modifications to marine
ecosystems may cause seabird populations to either modify their foraging ecology and therefore still
survive and reproduce in the same distribution, change their range and distribution or eventually go
extinct (Grémillet and Boulinier 2009, Lewison et al. 2012).
Oswald and Arnold (2012) indicated that seabirds can be used as bio-indicators for changes in the
climatic environment and because seabirds are top marine predators and climate change that alters the
marine ecosystem at lower levels will also influence seabird populations (Crawford and Altwegg
2009). The influence of climate change on seabirds has been especially noticeable at high latitudes
(Crawford and Altwegg 2009) and available evidence suggests that predicted climatic warming might
raise environmental temperatures beyond that tolerable to seabirds (Oswald and Arnold 2012).
Kruger and Sekele (2013) have indicated increasing trends in maximum daily temperature in South
Africa, especially in the western half of the country.
Therefore, climate change has the potential to affect species fitness severely (Boyles et al. 2011). The
IPCC Fifth Assessment Report (IPCC 2013) stated that each of the past three decades leading up to
3
the 2010s, have been warmer than any other decade in recorded history, with the first decade of the
21st century being the warmest. Southern hemisphere seabirds are amongst the most threatened bird
groups, with their populations continuously declining (Boersma and Redstock 2014). The purpose of
this study is to determine the direct impact of high temperatures and other extreme weather events on
the breeding success and behaviour of breeding bank cormorants Phalacrocorax neglectus. The study
also establishes the long-term effects of climate change on the species’ population trends as on-going
environmental change and anthropogenic impacts, possibly linked to global climate change will have
long-term effects and often-catastrophic effects on seabird populations (Lewison et al. 2012).
1.2 High temperatures, heat stress and storms
The capacity of a seabird to cope with a change in its thermoregulatory needs will depend on its
morphology, physiology and behaviour (Oswald and Arnold 2012). Adult seabirds cope with extreme
weather events far better than eggs or chicks. Eggs and chicks can be lost during storms, rains or
wind linked to extreme weather conditions (Mallory et al. 2009a). Breeding adult seabirds also
respond with active evaporative cooling to heat stress caused by high temperatures. This can lead to
adults abandoning nests to avoid dehydration from the evaporative cooling (Gaston et al. 2002).
Rapidly changing environmental temperatures might change the selective pressures acting on all
animals, because temperature is one of the most important factors impacting energy and water
balance. Rising environmental and atmospheric temperatures as a result of climate change may
challenge the thermoregulatory abilities of both ectotherms and endotherms (Boyles et al. 2011). The
ability of endotherms to maintain body temperature different to that of the environment is facilitated
by heat produced through metabolic processes, an insulation layer, and thermoregulatory behaviour
that initiates heat loss or heat production in response to environmental temperature change
(Wilson and Grémillet 1996, Boyles et al. 2011); this is especially true if the temperatures exceed a
species’ thermal limits (Oswald and Arnold 2012). Although endotherms are more capable of
maintaining internal thermal homeostasis under extreme environmental conditions than ectotherms,
there are also limits to their capacity to cope with variations in the thermal environment (Oswald and
Arnold 2012).
There are examples of seabird breeding failure and mortality in response to extreme weather events in
the South Atlantic Ocean, for example, Boersma and Redstock (2014) found that intense storms could
increase adult mortality and cause a decline in reproductive success in seabirds. Storms and extreme
heat waves affect Magellanic penguins Spheniscus magellanicus, breeding at Punta Tombo, South
America (Boersma and Redstock 2014). High environmental temperatures have also been found to
cause breeding failures in Brünnich’s guillemots that breed in the Arctic (Gaston et al. 2002).
Therefore, I hypothesised that climate change, through increasing atmospheric temperatures and the
increased frequency of severe weather events during the breeding season, have influenced the long-
4
term population size and demography of the endangered bank cormorant, by negatively affecting
adult mortality and its reproductive success.
Since the mid-1900s, many studies have been conducted on the thermoregulatory mechanisms of
seabirds (Oswald and Arnold 2012). Seabirds regularly encounter ambient environmental
temperatures that exceed their upper critical temperature limit (Oswald and Arnold 2012) and high
temperatures can have direct effects on the survival and reproduction of some seabird species
(Gaston et al. 2009).
Breeding utilizes a substantial portion of an adult bird’s time and energy budget (Oswald and Arnold
2012). In many cases the energy and/or time that is supposed to be invested in reproduction and care
of their young, might have to be used for active thermoregulation and heat stress behaviour or the
individual bird could risk death from hyperthermia (Oswald and Arnold 2012). Heat stress because of
high temperatures has been recorded as an important element in the breeding ecology of many
seabirds (Gaston et al. 2009), potentially leading to a decreased reproductive rate (Oswald and Arnold
2012).
Heat stress can cause breeding failures during unusually warm breeding events (Gaston et al. 2002,
Mallory et al. 2009a). The risk of breeding failure is increased when seabirds, such as the bank
cormorant, have thermally exposed breeding sites and thus have little opportunity to avoid direct solar
radiation (Oswald and Arnold 2012). Open nest sites leaves them exposed to the elements and
extreme environmental heat gain (Oswald and Arnold 2012), and therefore, many cormorant species
are subject to overheating at the nest (Lasiewski and Snyder 1969). Overheating is further aggravated
by their dark plumage (Lasiewski and Snyder 1969). I predicted that the bank cormorant increases its
thermoregulatory activity during periods of high heat loads. Breeding attempts might also be
abandoned if extreme ambient temperatures challenge the ability of adults to maintain suitable
incubating and brooding schedules during the breeding season (Oswald and Arnold 2012).
Behavioural modifications can reduce thermal stress, such as postural adjustments to minimize dark
plumage exposure to the sun; evaporative heat loss through gular fluttering and panting; and
ptilomotion, the raising of scapular feathers, or wing drooping to increase convective heat loss
(Oswald and Arnold 2012). Gular fluttering causes evaporative cooling of the bird due to the
movement of air through the respiratory tract (Bartholomew et al. 1968). Under severe heat loads,
birds utilize all these behaviours (Bartholomew and Dawson 1979). Older nestling and adult
cormorants compensate for the excessive heat load through these behavioural adjustments and gular
fluttering, which has a low energy cost, but a high rate of water loss (Lasiewski and Snyder 1969).
Orientation towards the sun may not be very effective in the case of the bank cormorant, because the
entire plumage is dark, increasing the heat load from solar radiation (Oswald and Arnold 2012).
5
Postural adjustments, such as wing drooping, can however be effective as they are related to wind
direction; for example, certain gull species react with postural adjustments that conform to
meteorological conditions (Bartholomew and Dawson 1979). Postural adjustment is also important
when shielding chicks from the sun, and this postural brooding behaviour of Suliformes is important
for the survival of the young (Lasiewski and Snyder 1969). However, the possible suite of postural
adjustments may be limited during incubation (Oswald and Arnold 2012), when movement is limited.
The most effective way to lose excess heat is through evaporative heat loss mechanisms; however this
can lead to osmotic stress if birds cannot not leave the nest during long incubation or brooding shifts
(Oswald and Arnold 2012) when they need to protect their eggs and chicks from the physical
environment and predators (Bartholomew and Dawson 1979). Certain cormorant species elevate their
body temperature during high heat loads to reduce water loss during hyperthermia (Lasiewski and
Snyder 1969). This is a general avian response to heat stress (Lasiewski and Snyder 1969). I
therefore predicted that the bank cormorant will increase their thermoregulatory behaviour to cool
down during times of high heat loads so as to avoid risking their own survival.
The study species, the bank cormorant, is classified ‘Endangered’ and is endemic to the Benguela
upwelling system off south-western Africa (Crawford et al. 2008a, BirdLife International 2013). The
species was listed as ‘Endangered’ in 2004 following a decline in the general population from c. 9 000
breeding pairs between 1975 and 1981 (Cooper 1981) to approximately 5 000 breeding pairs in 1995
to 1997 (Crawford et al. 1999), a maximum of 3 600 breeding pairs in 2007 (Crawford et al. 2008a,
Sherley et al. 2012), and c. 3 000 breeding pairs in 2011 (Crawford et al. 2012). This presents a
decline of 46% in 17 years ending in 2002 and a decrease of 66% in the 40 years leading up to 2011
(over three generations) (du Toit et al. 2002).
The bank cormorants’ current breeding distribution ranges from Swakopmund (22 68 °S, 14.53 °E),
central Namibia to Quoin Rock (34°46' S, 19°40' E) (the most eastern colony), Western Cape, South
Africa (du Toit et al. 2002). This is similar to its breeding distribution during the 1980s (Cooper
1981). The non-breeding range of the bank cormorant ranges from Hoanibimond, northern Namibia
(19°27' S; 12°43' E), to Die Walle, Western Cape, South Africa (34°46' S; 19°54' E) (du Toit et
al. 2002). This distribution roughly reflects that of beds of kelp bamboo Ecklonia maxima (Crawford
et al. 2008a). The coast length of the bank cormorant’s range is c. 1 500 km (Cooper 1981).
1.3 The Benguela upwelling system
The cool, eastern boundary Benguela Current and associated upwelling system stretches along the
west coast of southern African (Abrams and Griffiths 1981, Shelton et al. 1985) and is one of the four
major upwelling regions of the world (Shannon and Jarre-Teichman 1999). It can be sub-divided into
the northern and southern systems that split at the upwelling cell at Lüderitz, Namibia
6
(Ludynia 2007). Water rises from an approximate depth of between 100 m and 300 m. The
upwelling process draws cold, nutrient-rich bottom water into the photic zone, fuelling primary
production in the ocean (Arntz et al. 2004). Coastal upwelling along the west coast of southern Africa
happens seasonally, mainly from October to April, with a peak in intensity during the first four
months of the year (Roy et al. 2001).
The Benguela upwelling system maintains an average water temperature of 13.4°C while air
temperatures over coastal areas may reach over 35˚C (Wilson and Grémillet et al. 1996). However,
temperature, salinity and productivity in the water mass fluctuate seasonally with upwelling (Cury and
Shannon 2004) and the average air temperature ranges between 10–27°C (Abrams and Griffiths
1981).
The coastal waters of the Benguela region are characterized by kelp beds (mostly Ecklonia maxima
and Laminaria pallida) which dominate where the cold Benguela water exerts influence through
upwelling (Velimirov et al. 1977). The system is highly productive and historically supported
abundant populations of pelagic fish (Crawford 2007) and seabirds. Seabird communities are most
diverse during the austral winter when migratory species arrive in their non-breeding period (Abrams
and Griffiths 1981, Adams et al. 1992). Water temperature, distance from shore, salinity, depth and
air temperature affect the seabird distribution to a lesser extent than the upwelling along the coastal
region (Abrams and Griffiths 1981).
Marine and coastal ecosystems are under constant threat of degradation and disruption by human
activities (David et al. 2003). Bank cormorants are sensitive to disturbance (Cooper 1981). The
human disturbance at breeding sites has been one of the main factors restricting the distribution of
seabird breeding colonies along the southern African coast (Bartlett et al. 2003). Bank cormorants are
especially sensitive to human disturbance during their breeding season (Crawford et al. 2008a).
Human interference at breeding sites can cause adults to abandon their nests, leaving eggs and small
chicks vulnerable to kelp gull Larus dominicanus predation (Cooper 1981).
However, the Benguela upwelling system is currently undergoing various changes, affecting the
marine environment, due to over-fishing and climate change (Braby et al. 2012). Global warming is
affecting upwelling activities in the system, resulting in a gradual increase in Sea Surface
Temperature (SST) (Cury and Shannon 2004) and reduced upwelling intensity (Ludynia 2007).
Research is beginning to identify seabird relationships with physical habitat features and the
environment (Ribic and Ainley 1997).
Fifteen seabird species, including the bank cormorant, breed in the Benguela upwelling system, of
which seven of these are endemic to southern Africa (Kemper et al. 2007). This abundance of
seabirds results from enhanced productivity associated with nutrient upwelling in this region during
7
the spring and summer, increasing primary production and therefore prey availability during the
winter (Abrams and Griffiths 1981, Adams et al. 1992). Local bird assemblages can usually be found
in these areas of upwelling and mixing (Hunt and Schneider 1987).
1.4 The bank cormorant
Cormorants belong to the family Phalacrocoracidae in the order Suliformes. Cormorants’ general
form and shape resemble that of divers and their feathers are less water repellent than those of most
other water birds (Grémillet et al. 2005). This partial wettability of their feathers may limit their
seaward dispersal (Hunt and Schneider 1987). Cormorants are long-lived birds and their life
expectancy is about five to seven years, but some live to be more than 15 years old (Kemper et al.
2007). In southern Africa, five cormorant species occur: the Cape cormorant P. capensis, white-
breasted cormorant P. carbo lucidus, reed cormorant P. africanus, crowned cormorant P. coronatus
and bank cormorant.
Male and female bank cormorants are similar in appearance, but the male is notably larger (Cooper
1985a). This heavily built bird’s weight ranges from approximately 1700–2100 g – little has been
published about the other measurements of the bank cormorant (Cooper 1985a). Adults appear
entirely black, but in sunlight the wings, upper mantle and scapular have a glossy, brown-bronze
appearance. During the pre-breeding period, they also display white filoplumes on the side of their
head and neck and a white patch on their rump, which is lost during the incubation period because of
constant preening of the feathers (Cooper 1985a). The iris of the adult’s eye divides into two colours:
orange-brown above the pupil and blue-green below (Cooper 1985a).
During a 10-year period from 1971–1980, 44 breeding colonies were found to occur with c. 9 000
breeding pairs (Cooper 1981). Most colonies consisted of between 20–100 nests (Cooper 1986), with
the exception of two large Namibian colonies at Ichaboe and Mercury Islands. By 2002, 52 breeding
localities had been described between Hollamsbird Island, Namibia, and Quoin Rock (du Toit et al.
2002). Currently, the two colonies on Mercury and Ichaboe Islands, in the southern Namibian part of
the bank cormorant’s range, support between 70–80% of the breeding population, while smaller
colonies in South Africa and Namibia support the remainder (Ludynia et al. 2010).
The most drastic decrease in the bank cormorant’s population occurred in Namibia with 7 166 pairs in
1978–1980 compared to c. 2 500 breeding pairs in 2007 (Crawford et al. 2008a). Bank cormorants
breeding at Mercury Island experienced a large decrease in the 1980s and 1990s. During the 1970s,
Mercury Island supported c. 46% of the total bank cormorant population and approximately 71% of
the total population occurred in Namibia on Ichaboe and Mercury Islands (Cooper 1981, Crawford et
al. 1999). In 2006, Mercury Island supported about 55% of the total bank cormorant breeding
population (Sherley et al. 2012). Crawford et al. (1999) stated that the decreases from 1995–1997 at
8
various Namibian colonies did not occur at the same time; this suggests that different factors might
have influenced the overall decline in the number of bank cormorants. The remarkable decline in the
overall bank cormorant population provided the motivation for this research.
In South Africa, bank cormorants breed during the austral winter, whereas in Namibia they breed
during summer (Sherley et al. 2012). Colonies are mostly restricted to islands and offshore rocks, but
where this species has colonized mainland breeding locations, they are usually on rocky cliffs, inshore
rocks or high boulders and inaccessible from terrestrial predators (du Toit et al. 2002). They also
breed on man-made (artificial) structures such as breakwaters (‘dolosse’) or old jetties (du Toit et al.
2002, Bartlett et al. 2003). These sites can be in the sea or near to the water’s edge (Cooper 1986).
Kelp beds usually occur adjacent to breeding sites (Cooper 1985b). This species is sensitive to
disturbance, particularly during the breeding season and when humans come too close to a breeding
colony, adults frequently move away from their nests, leaving the eggs and/or chicks exposed to
predation by kelp gulls (Cooper 1981).
Bank cormorants construct large, heavy nests, engineered mainly from seaweed. The nesting material
is gathered during short trips in the day by diving in inshore shallow kelp beds, but material can also
be stolen from other nests in the absence of nest owners (Cooper 1986). Cooper (1986) found after
examining two nests that less than 4% of a nest consisted of other materials, including feathers, sticks
and artificial material. Building and working on the nest continues throughout the breeding season
(Cooper 1986). Nest construction starts when a male bank cormorant places nesting material at a
suitable nest site (Cooper 1986). Nesting material is collected almost exclusively by male birds prior
to incubation (Cooper 1986).
A bank cormorant reaches sexual maturity at three years of age (Cooper 1985a) and adult and non-
adult birds do not occur in the same foraging areas (Cooper 1985b). The species seldom moves
beyond its foraging range, as determined by the kelp beds (Cooper 1985b). They lay a mean of 2.02
eggs per clutch, with three eggs being the largest recorded clutch size (Cooper 1987). Both the male
and female share incubation duties equally (Cooper 1987). The eggs are incubated on the bare,
webbed feet. This may be to isolate the eggs from the damp nest and to warm the eggs on the heavily
vascularized feet (Cooper 1987). Eggs are incubated for a period of roughly 30 days (Cooper 1986)
and chicks are reared for approximately 55 days (Cooper 1978). Bank cormorants are primarily
sedentary, with some post-breeding dispersal of fledglings (du Toit et al. 2003).
1.5 Thesis outline
This thesis identifies the impact of climate change and associated temperature increases and storm
events on the population and breeding biology of the endangered bank cormorant. It includes three
chapters describing the research done over a two-year study period, including the heat stress

9
behaviour during the breeding period, breeding success of the bank cormorant and long-term
population decline associated with long-term climate change.
Breeding bank cormorants were observed to determine their thermoregulatory behaviour at the nest
during incubation and chick rearing. The breeding success of the cormorant was related to a number
of environmental variables to determine which variables affect the incubation success and the chick
rearing success of the species, resulting in a decrease in their breeding success. Climate change was
also tested against the decrease of the bank cormorant population, to determine if climate change has
an impact on bank cormorant breeding numbers.

10

11
Chapter 2
The influence of environmental temperatures on the thermoregulatory behaviour of the
breeding bank cormorants Phalacrocorax neglectus
2.1 Introduction
Temperature is a vital factor in affecting the water balance and energy of terrestrial animals; therefore,
changing environmental temperatures may influence fitness (Boyles et al. 2011) and have direct
effects on the survival of some seabird species (Gaston et al. 2001). Rising environmental and
atmospheric temperatures may challenge the thermoregulatory abilities of birds. Thermal stress is a
key element in the breeding ecology of many seabirds (Gaston et al. 2001), thus the implementation
of a thermal defence strategy by breeding adult seabirds is of great importance (Salzman 1982).
The bank cormorant Phalacrocorax neglectus, an endemic seabird occurring off the west coast of
southern Africa (Cooper 1981), is an endothermic species. Endotherms maintains their body
temperature in a narrow range, mainly through metabolic processes in response to environmental
temperature fluctuations (Boyles et al. 2011). High environmental temperatures may lead to the
employment of behavioural and physiological adjustments by birds to prevent overheating (Downs
and Ward 1997). These adjustments include: postural adjustments to minimize exposure to the sun;
evaporative heat loss through gular fluttering and panting; raising of scapular feathers and wing
drooping to increase convective heat loss (Bartholomew et al. 1968, Oswald and Arnold 2012).
When environmental temperatures exceed a species’ thermal limits, adult cormorants must
compensate for excessive heat gain through these adjustments (Lasiewski and Snyder 1969,
Downs and Ward 1997, Boyles et al. 2011). Under severe heat loads, birds may utilize all these
behaviours (Bartholomew and Dawson 1979).
Many open-nesting seabirds are threatened by high environmental temperatures (Salzman 1982),
because this leaves them exposed to the elements and extreme environmental heat gain (Oswald and
Arnold 2012). Adult nesting bank cormorants are often subject to overheating at their exposed nests
sites (Cooper 1986), further aggravated by their dark plumage (Lasiewski and Snyder 1969).
Breeding adults, incubating eggs or brooding small chicks, have little flexibility when responding to
environmental fluctuations (Durant 2004).
However, certain behavioural modifications are more effective than others are. Orientation towards
the sun may not be very effective in the case of the bank cormorant as the entire plumage is dark,
increasing the heat load from solar radiation (Oswald and Arnold 2012). Posture adaptations can
however be effective as they is may be related, like wing drooping, to wind direction and speed.
Other seabird species, such as the masked booby Sula dactylatra, have been found to droop their
12
wings to facilitate air circulation and thus increase passive heat loss at ambient temperatures below
body temperatures (Bartholomew 1966). However, postural adjustments can be limited during the
incubation period (Oswald and Arnold 2012). Postural adjustment is also important when shielding
chicks from the sun, and this brooding behaviour of Suliformes is important for the survival of the
young (Lasiewski and Snyder 1969).
The most effective way for birds to get rid of excess heat is through evaporative heat loss
mechanisms; in the case of cormorants this is achieved through gular fluttering. However this can
lead to osmotic stress because some adults do not leave the nest when incubation or brooding period
(Oswald and Arnold 2012), due to the need to protect their eggs and chicks from potential predators
and the physical environment (Bartholomew and Dawson 1979). Like many other birds, some
cormorants elevate their body temperature slightly when experiencing high heat loads to conserve
energy and reduce water loss (Lasiewski and Snyder 1969).
The breeding period utilizes a substantial portion of an adult bird’s energy and time budget (Oswald
and Arnold 2012). Increasing energy expenditure on active thermoregulation decreases the time and
energy available for reproduction and care of their young; alternatively the bird risks death from
hyperthermia (Oswald and Arnold 2012). Potentially, the effect of high temperatures on breeding
activity leads to a decreased reproduction rate (Oswald and Arnold 2012), because heat stress can
cause breeding failures (Gaston et al. 2002) during unusually warm breeding events (Mallory et al.
2009a).
The goal of this chapter was to determine the relationship between environmental temperature and the
nesting behaviour of the bank cormorant using operative temperature as a measurement. Operative
temperature, rather than ambient temperature, was expected to better fit models of thermoregulation,
as they reflect the temperature an animal experiences (Bakken et al. 1985). It was expected that
thermoregulatory behaviour would increase with higher environmental temperatures, risking the
survival of the breeding adult (Durant et al. 2004). It was also expected that gular fluttering would be
the main method of cooling for the bank cormorant, as seen in previous studies (e.g. Bartholomew
1966, Bartholomew et al. 1968).
2.2 Materials and Methods
2.2.1 Study sites
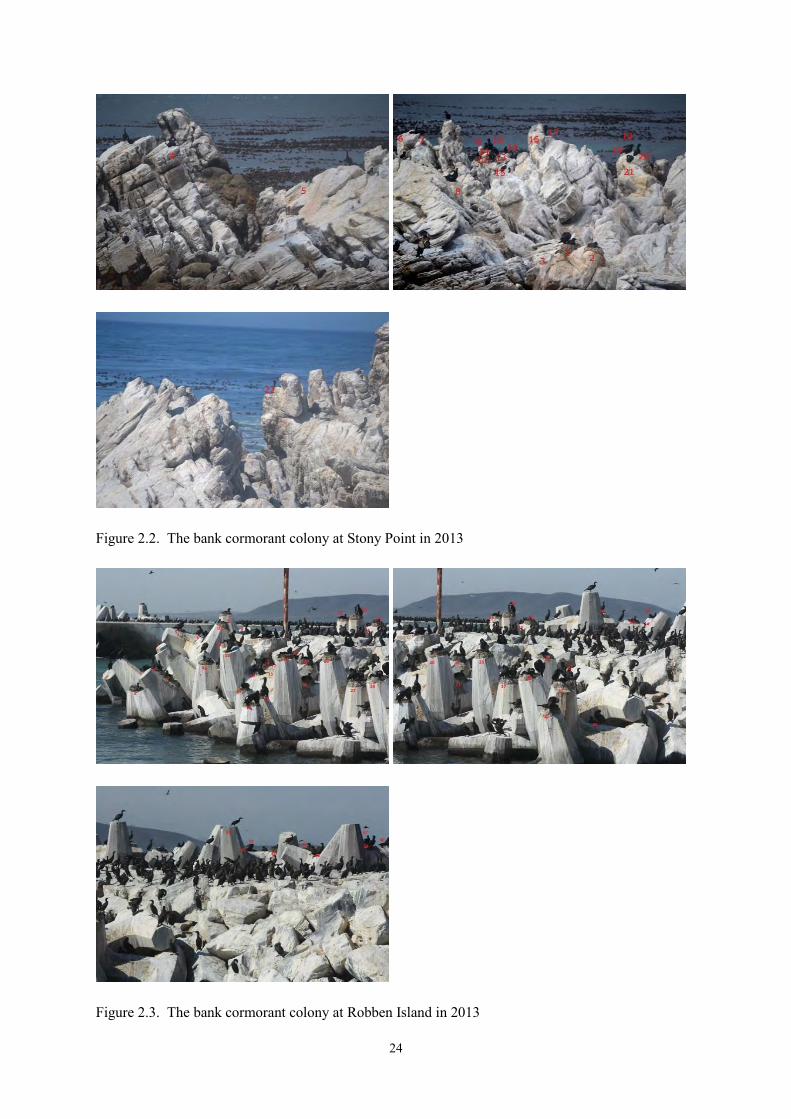
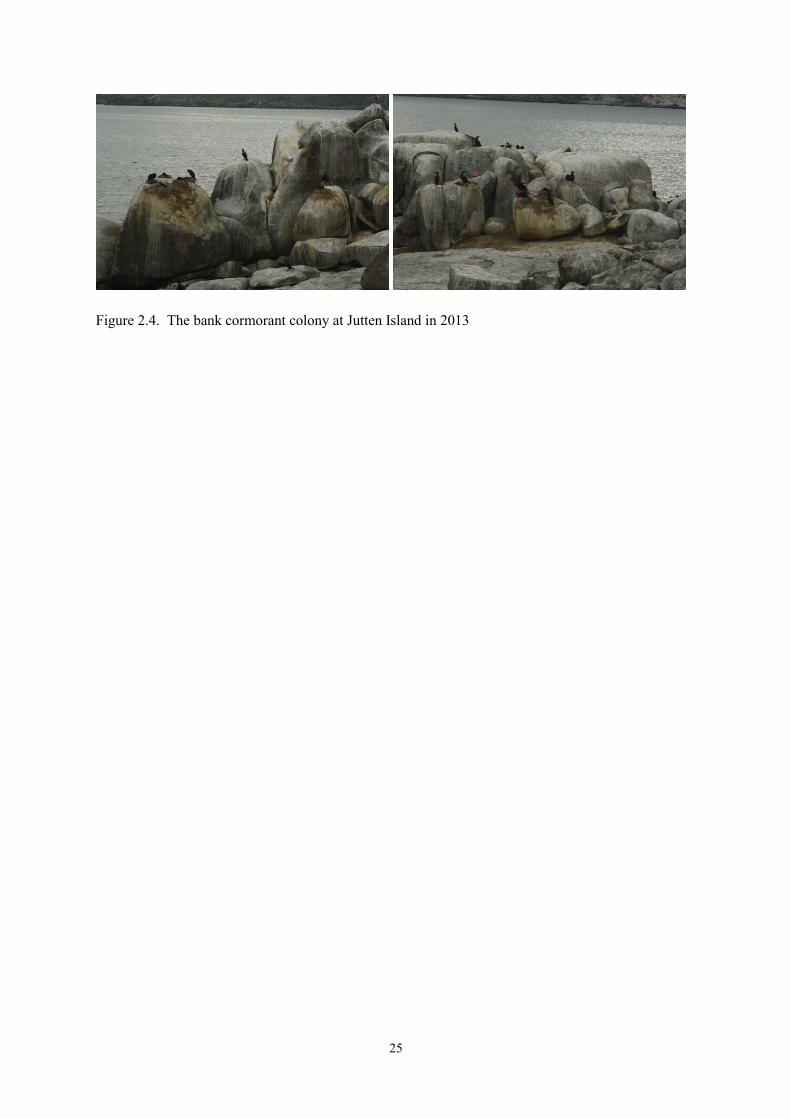
The study was undertaken at three bank cormorant colonies in the Benguela upwelling system: Stony
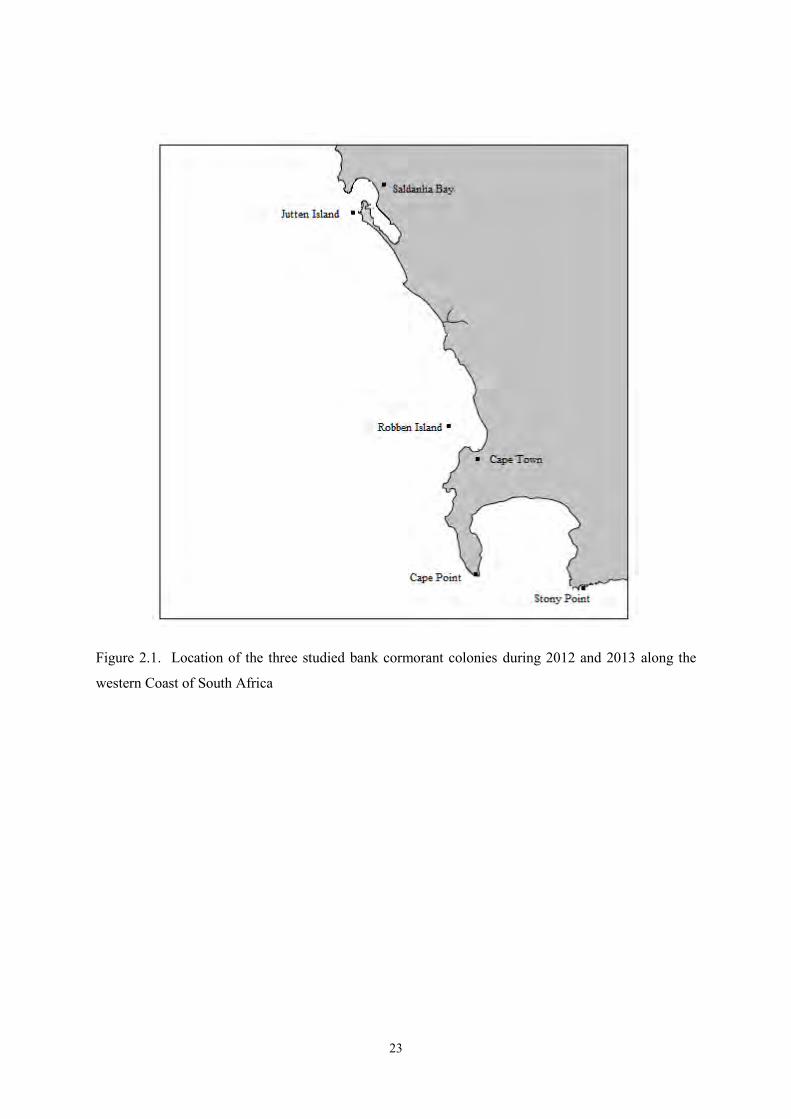
Point (34°22' S, 18°53' E), Robben Island (33°48' S, 18 22' °E) and Jutten Island (33°04' S, 17°57' E),
in the Western Cape, South Africa (Figure 2.1). Robben Island is situated 13 km north of Cape
Town, in Table Bay. The Stony Point colony is located at Betty’s Bay and Jutten Island is in the
mouth of Saldanha Bay. At Stony Point and Jutten Island the bank cormorants nest on large, naturally
13
occurring rocks near the water’s edge, whereas at Robben Island the birds breed on the man-made
‘dollos’ structures, comprising the island’s harbour wall (Figures 2.2, 2.3 and 2.4).
2.2.2 Temperature data collection
Operative temperature (Te) measurements can be used to determine the thermal environment of the
studied animal as it is related to the temperature of the environment (Bakken et al. 1985). Te can be
measured with the help of a suitable model or taxidermic mount with low heat capacitation (Bakken et
al. 1985) that mimics the thermal properties of the studied species. The Te can be described as the
equilibrium temperature an organism would reach in the absence of metabolic heat production or
evaporative water loss (Downs and Wards 1997)
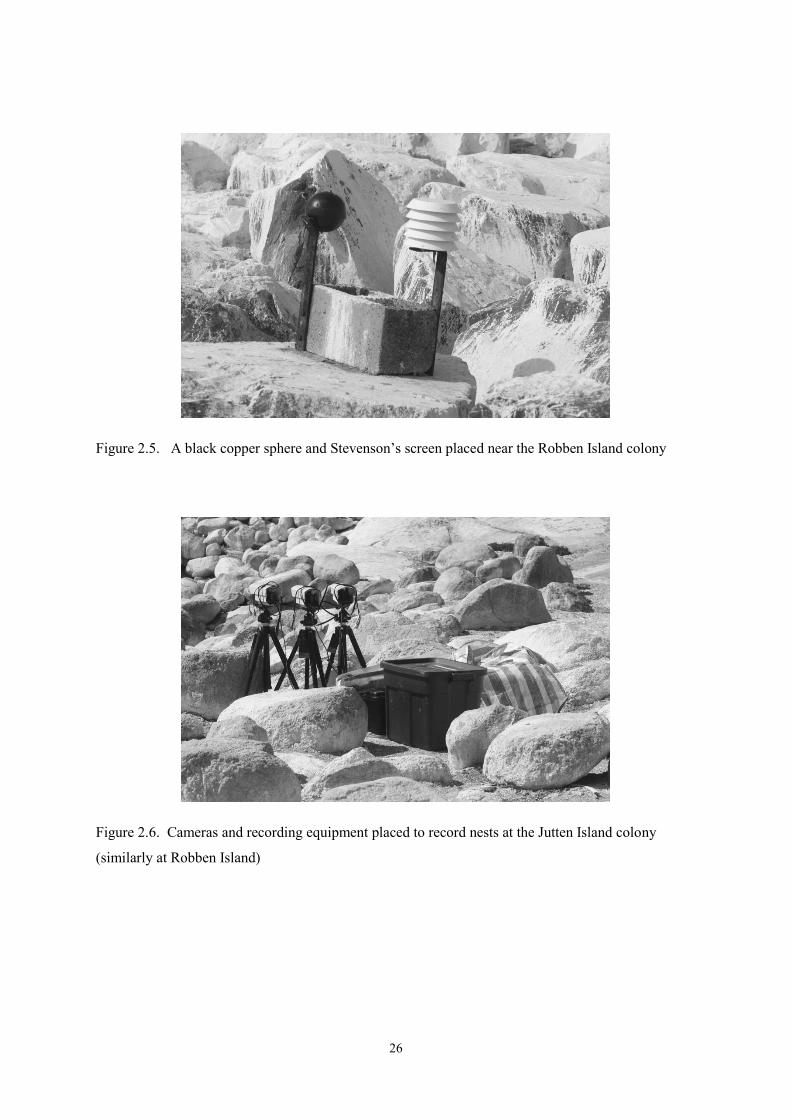
In this study, hollow copper spheres, spray-painted matt-black were used to measure Te. These had
the same diameter as a bank cormorant’s body (115 mm), determined by measuring the chest
circumference of a dead bank cormorant specimen. These mounts, rather than taxidermic mounts,
were used as they provide a suitable model for measuring Te (Bakken et al. 1985, Walsberg and Wolf
1996), are generally more durable in harsh environmental conditions (Bakken 1992) than taxidermic
mounts, and are easier to construct and use, especially given the endangered status of the bank
cormorant which prevents collection of skins for taxidermic mounts. Using a hollow copper body can
result in faster time responses to changes in thermal conditions (Bakken 1992). The walls of each
sphere were 0.9 mm thick and each sphere was 11.5 cm in diameter. Copper was used as it has high
thermal conductivity (Downs and Ward 1997). Maxim ibuttons™ (accurate to 0.0625°C for a range
of –40 to 85°C) were placed in the spheres to measure Te, without touching the sides of the sphere.
Two ibuttons (in custom-made ibutton readers) were placed in each sphere for redundancy. Each
sphere consisted of two hemispheres which were attached with glue and Tesa Tape and bolted
together. These spheres were then mounted 10–20 cm above the ground to replicate the position of a
bird on its nest. Mounts were attached to metal rods that were in turn attached to the end of a cement
brick and insulating rubber was used to prevent the different metals from the sphere and rod touching
and oxidising (Figure 2.5).
Ambient temperature (Ta) was also measured. Ta can be defined as the temperature of the air in
shaded and sheltered conditions and this is used to describe the environmental temperatures of the
studied bank cormorant. For the Ta measurements, two ibuttons were placed into a white Stevenson’s
radiation screen (Figure 2.5). These screens were similarly placed onto metal bars (5 x 3.5 x 40 mm)
and attached to the same cement brick on the other end. This entire setup was then placed near to
each colony, without disturbing the nesting birds, to ensure that recorded conditions were similar to
those experienced by nesting birds.
14
All ibuttons were programmed to take temperature readings at 10 minute intervals for the duration of
fieldwork. ColdChain Thermodynamics software was used for programming and the extraction of the
data. Data were extracted every one to three weeks and the ibuttons were also re-programmed at this
interval. Data were stored as CSV files.
2.2.3 Behavioural data collection
Data for behavioural analysis were collected with the help of filming equipment during both the 2012
and 2013 breeding seasons (Figure 2.6). Using digital recorders result in minimum disturbance of the
site and can produce good quality images (Pierce and Pobprasert 2007). Behavioural responses were
studied while keeping a record of the microclimate. Two to four Sony video cameras were mounted
on tripods approximately 30 m from the nearest nest in each colony. During the 2012 breeding season
all data were recorded using the cameras and a Digital Video Recorder (DVR). The system was
upgraded in 2013 to store data directly onto 32 GB memory cards. Data were then transferred onto an
external hard drive. The video cameras were placed in CCTV camera housings to protect them from
weather, water and bird damage. The cameras were focussed on the nests with the help of an external
LCD screen that connected directly to the camera.
The Robben Island system was run through the island’s main 220 V AC electricity supply. Due to a
lack of electricity source at the Stony Point and Jutten Island colonies, portable systems were used.
These consisted of two car batteries and an inverter to convert the 12V DC from the batteries to the
220V AC needed to run the DVR and the cameras. The batteries were recharged overnight using a
generator.
During the 2012 fieldwork season, cameras only focused on one nest and only full days were filmed
(07h00 to 18h00). During analysis of the videos, it was found that the videos could be analysed with
two to three nests in one shot. This ensured that more data could be collected during one day’s
filming during 2013. In addition, the filming protocol was modified to only a few hours a day, as
high temperatures (e.g. during midday) were needed for thermoregulatory behaviour to take place,
and the light quality in the morning and afternoon was too bad to allow behavioural analysis.
Videos were watched to analyse heat stress behaviour of the nesting birds. A list of all possible
nesting behaviours was made (Table 2.1). A software package, JWatcher v. 0.9 (Blumstein et al.
2000) was used for the quantitative analysis of behaviour, and the behaviours were programmed with
key codes onto this programme. JWatcher was then used to record the nesting bird’s behaviours in
real time, while videos were watched (Figure 2.7). Mutually exclusive behaviours were programmed
to stop when another started (i.e. gular fluttering had to stop when the beak was closed).

15
To determine the relationship between temperatures and nesting heat stress behaviour from the 2012
and 2013 data, 30 randomly selected hours was watched for each year, resulting in 360 observed 10–
minute periods. Only hours between 09h00 and 17h00 were selected, as light quality on the videos
was poor before and after those times. If the lighting quality was too poor for behavioural analysis in
a randomly selected hour, another hour was selected randomly to replace it. During the 60 h of
observations, eggs and chicks were never left alone by an adult.
Each hour was divided in to six 10–minute periods and analysed separately. When the film started,
JWatcher was set to start and behaviour recordings started with a key press. As the programme and
the video could not be started at exactly the same time, the starting time of the video and the starting
time of a behaviour was manually adjusted and edited before data were saved. The JWatcher data
capture session was set to automatically end after 10 minutes. This activity was repeated for the six
10–minute sessions to ensure data capture for the entire hour.
The observations and recordings of behavioural and temperature data allowed me to describe the
various types of thermoregulatory behaviour associated with the nesting behaviour of bank
cormorants and to correlate specific patterns of behaviour with environmental and operative
temperatures as experienced by the birds at a colony.
2.2.4 Statistical analysis
The Underhill-Zucchini Moult Model (Underhill and Zucchini 1988) was used to describe the
relationship between thermoregulatory behaviour and operative temperature. This model was
originally designed to estimate the parameters involved with the timing of primary moult in birds. In
summary, birds are observed in three categories and each bird has a date associated with the record:
birds with old primary feathers which have not yet started moult and will do so at some unknown time
in the future; birds in moult, when the extent of primary feather replacement can be measured; and
birds which have completed moult, and have done so at some unknown point time in the past. The
Underhill-Zucchini Moult Model uses data from the categories to estimate three parameters: the mean
date of start of moult, the duration of moult and the standard deviation of the start date. It involves the
assumption that the start dates of moult have a normal distribution with the mean and standard
deviation described above. This includes the start time and the duration as parameters and a measure
of variation within a population. The date of completion of moult is estimated as the date of start of
moult plus the duration. The model parameters are estimated by the method of maximum likelihood.
Erni et al. (2013) developed software for the implementation of this moult model in R (R
Development Core Team 2009). This particular implementation incorporates the flexibility to model
the three parameters as linear functions of explanatory variables, and to undertake model selection in
a standard statistical framework. Prior to the Underhill-Zucchini Moult Model, linear regression had
been used to estimate the parameters of moult, but this was incorrect because it violated the

16
underlying assumptions of linear regression; details of this are discussed by Underhill and Zucchini
(1988).
This model can be used in the context of estimating the parameters of gular fluttering. I observed
birds in three analogous categories: birds at low temperatures which had not yet started gular
fluttering and would do so when some unknown, but higher, threshold temperature for that bird was
reached; birds which were gular fluttering, and in which the extent of gular fluttering could be
measured, and for which the temperature could be measured; and birds which were gular fluttering
continuously, and had done so since some unknown, but lower, threshold temperature for that bird
had been reached. Thus the Underhill-Zucchini Moult Model is appropriate for estimating the
parameters of gular fluttering: the average temperature at which gular fluttering commences (the
threshold temperature), the temperature range in which gular fluttering goes from 0% to 100%, and
the standard deviation of the threshold temperature in the population. The moult model can be used
with data which is censored or simplified in various ways (Underhill and Zucchini 1988); in this case
the model with Data Type 2 was appropriate because all the birds were available for observation at all
temperatures. Underpinning the model is the assumption that the distribution of mean starting dates
for the birds in the population has a normal distribution, and the mean and standard deviation of this
normal distribution are parameters which are estimated.
I exploited the flexibility of the Erni et al. (2013) implementation to include explanatory variables
into the model. I investigated whether there were differences between the three colonies and the
breeding state of the bird at the nest. Breeding state was categorised into three levels: Incubation
(adult sits on eggs), small to medium woollies (adult sits on chicks) and large woollies (chicks can
thermoregulate and the adult stands next to nest). Model selection was based on the Akaike
Information Criterion (AIC).
2.3 Results
2.3.1 Ambient and operative temperatures
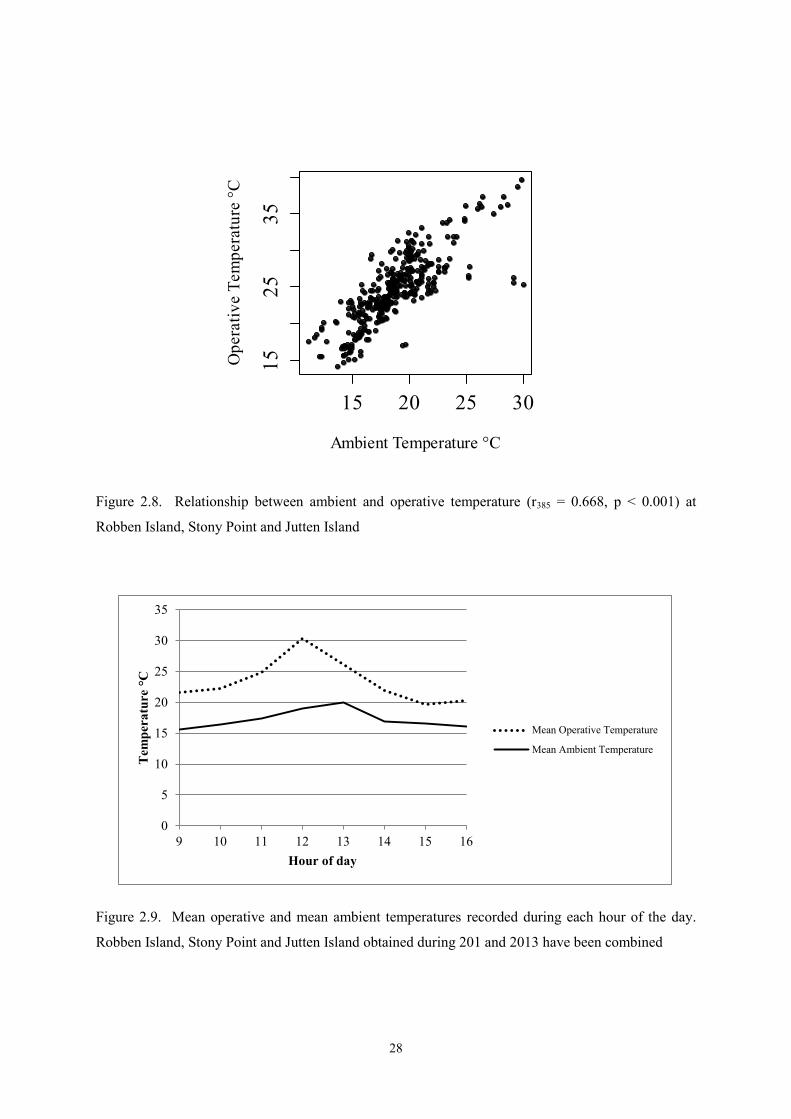
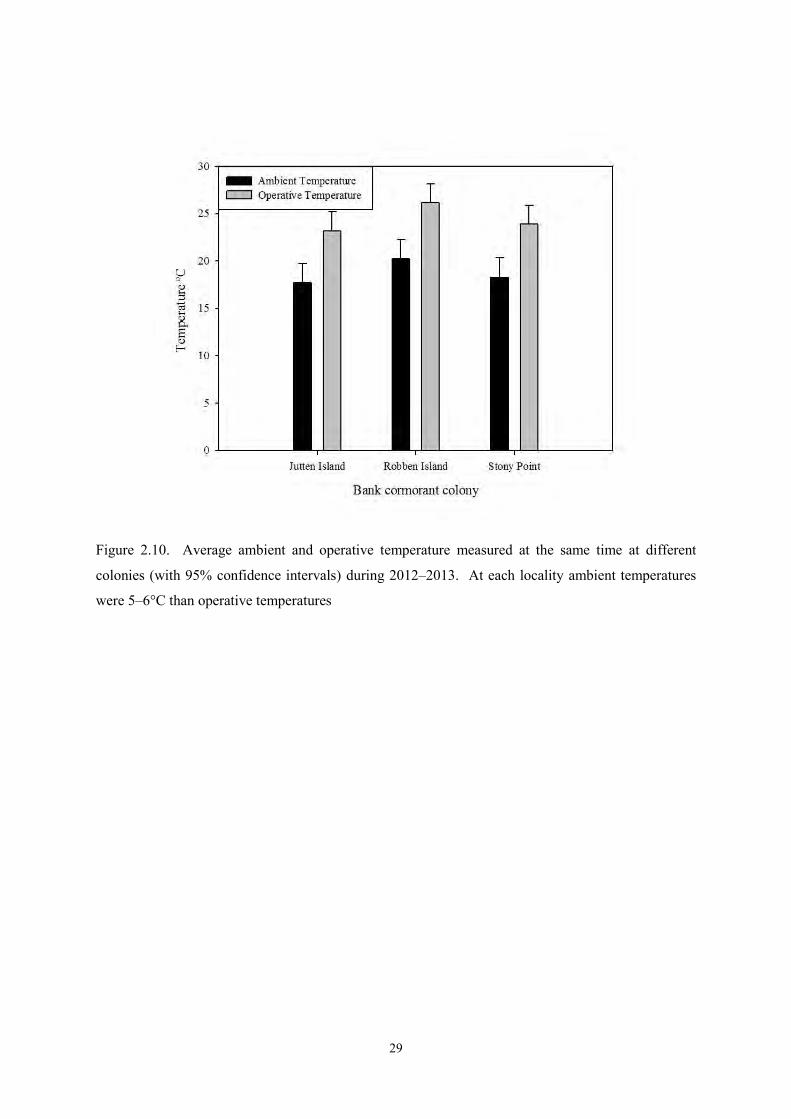
Operative temperatures were higher than ambient temperatures during the day (t358 = 16.98,
p < 0.001). The two measures were strongly correlated (r355 = 0.67, p < 0.05) (Figures 2.8 and 2.9).
Ambient temperatures during the analysed hours reached a maximum of 29.9°C, whereas operative
temperatures regularly exceeded 35°C, with a maximum of 39.7 ˚C (Figure 2.5). The largest
difference between Ta and Te was 12.8°C (at Te 29.4 and Ta 16.7°C). The hourly mean temperatures
indicate that the warmest part of the day for Te was at noon (30.4°C) and for Ta at 13h00 (19.0°C)
(Figure 2.9).
17
Robben Island’s operative and ambient temperature were significantly higher than those of Stony
Point (Ta: t = –3.9, p < 0.001, Te: t = –6.5, p < 0.001) and Jutten Island (Ta: t = –5.1, p < 0.01, Te: t = –
5, p < 0.001), but there was no significant difference between temperatures at Stony Point and Jutten
Island (Ta: t = 1.2, p > 0.1, Te: t = –1.4, p > 0.05). For all three colonies, the average difference
between Te and Ta was 5–6 °C (Figure 2.10).
2.3.2 Correlated behaviours
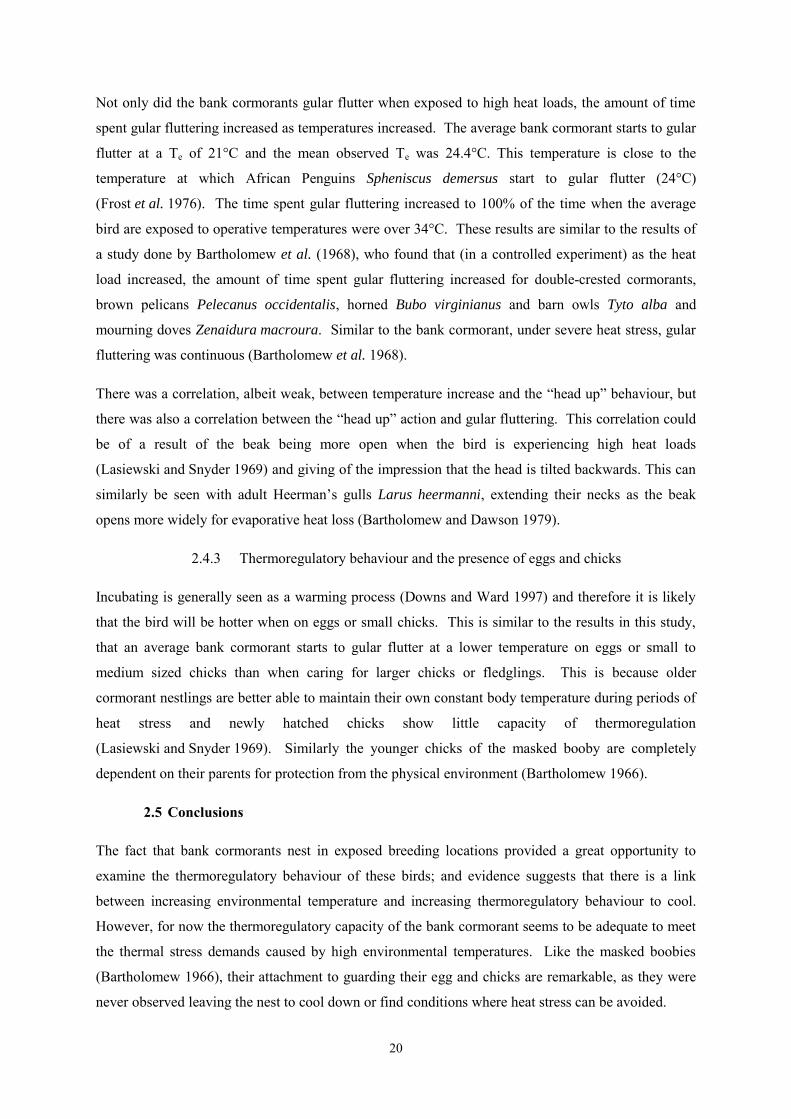
Certain thermoregulatory behaviours of bank cormorants were positively correlated (r > 0.2) (Table
2.2). Strong positive relationships existed between gular fluttering and head up (r364 = 0.66, p < 0.01);
and head down and beak closed (r363 = 0.55, p < 0.01). Weaker positive correlations existed between
wings propped and crouching (r362 =0.25, p < 0.01); beak closed and standing (r364 = 0.23, p < 0.01);
wings closed and standing (r364 = 0.26, p < 0.01); wings propped and gular fluttering (r362 = 0.23, p <
0.01); and wing closed and beak closed (r364 = 0.23, p < 0.01). No correlation existed when the
correlation coefficient equalled –1, because this indicated exclusive behaviours that could not occur at
the same time.
Mutually exclusive strong negative correlations with evidence for significance (p < 0.05) (Table 2.2)
exist between head up and beak closed (r364 = –0.66); and head down and gular fluttering (r363 = –
0.55) Weaker significant negative correlations (–0.20 < r363 < –0.26, p < 0.05) exist between head
down and sitting, wing closed and sitting, standing and gular fluttering, head up and standing, wings
closed and standing and wings propped and gular fluttering.
2.3.3 Temperature and behaviour correlation
Observations on the behaviour of bank cormorants indicate that they did experience heat stress, but
Spearman’s correlations test yielded only one behaviour which was strongly positively correlated with
Te: gular fluttering (r184 = 0.67, p < 0.01). The head up behaviour and Te were also correlated, but
weak (r184 = 0.34, p < 0.01). Ambient temperature and gular fluttering were also positively correlated
(r178 = 0.53, p < 0.01), but not as strongly as operative temperature and gular fluttering.
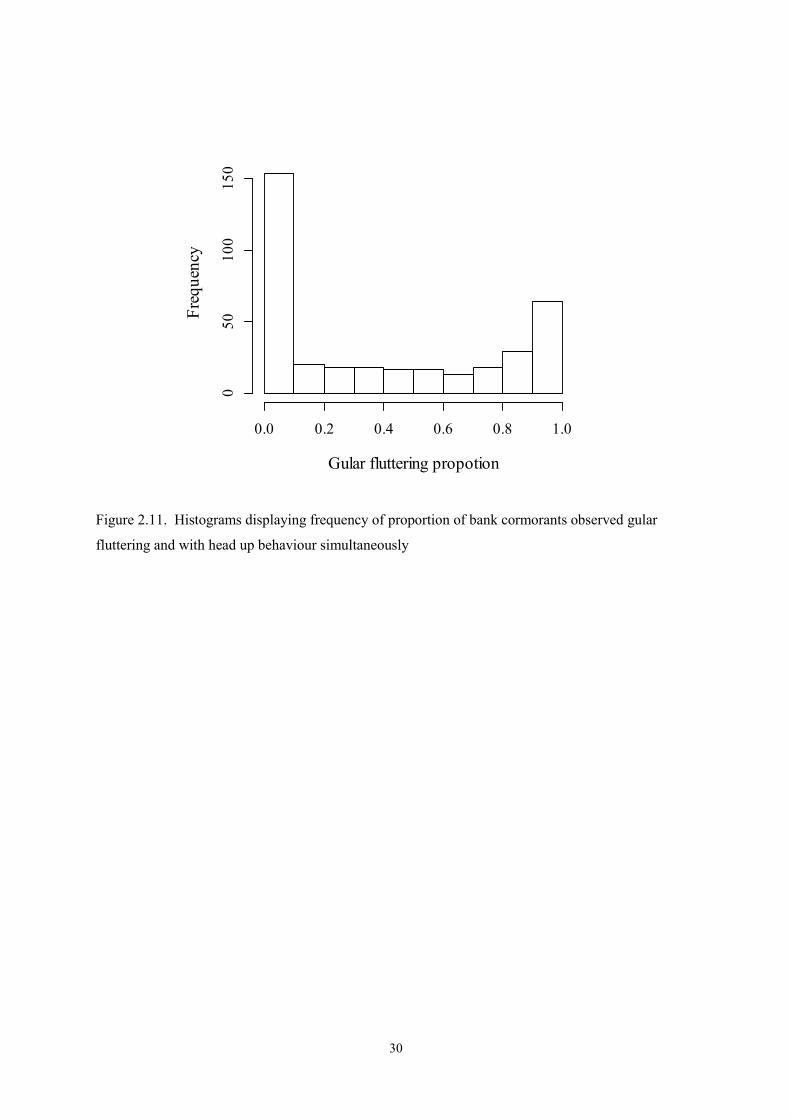
Selecting the model was based on AIC scores and the biological value of the behaviour that best
described the results. Type 2 moult models (Erni et al. 2013) were used as the proportion of time
spent gular fluttering and head up included both zeroes and ones (Figure 2.11).
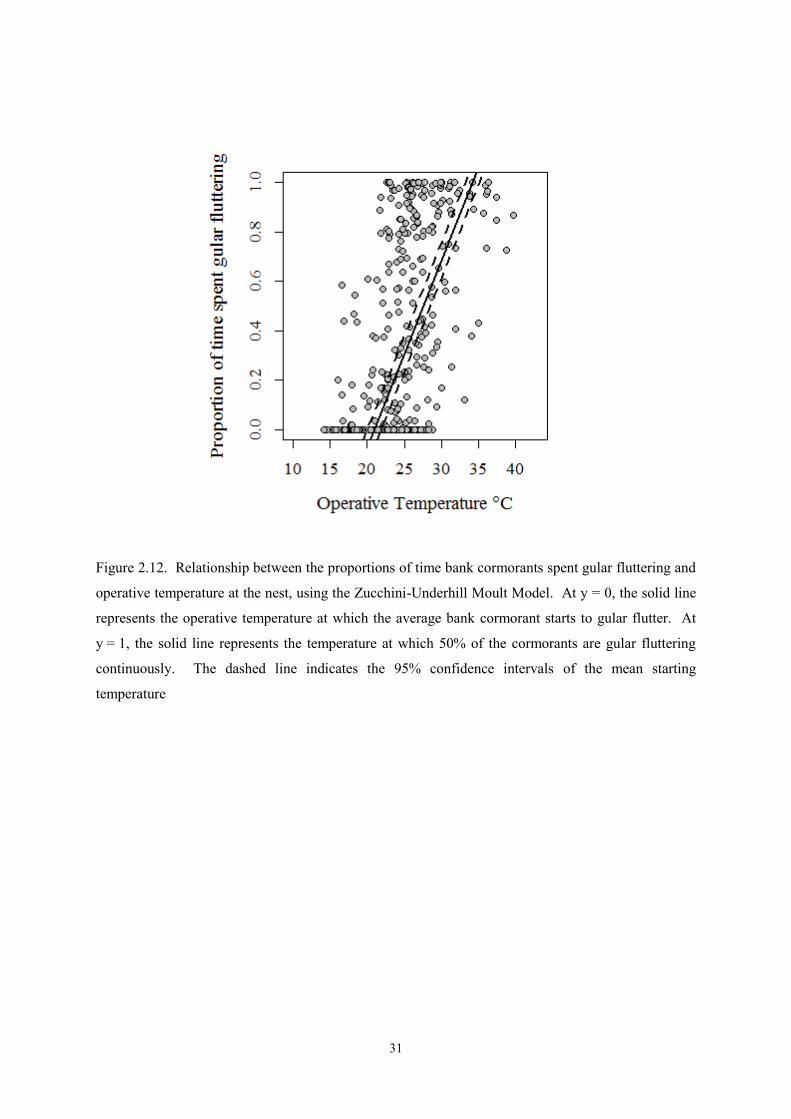
2.3.4 Operative temperature and gular fluttering
The total number of observations included in the Underhill-Zucchini Moult Model was 366, of which
129 had no gular fluttering, 16 were gular fluttering continuously, and 221 had measured values of the
percentage of time spent gular fluttering which were greater than 0% and less than 100% (Figure
18
2.12). Applying the model to these data, without any explanatory variables included, showed that the
mean operative temperature at which gular fluttering was initiated was 21.0°C (SE 0.5°C), and that
the standard deviation of the normal distribution describing the variability of the starting temperature
of gular fluttering was 6.2°C (SE 1.8°C). The “duration” parameter was 13.2°C (SE 1.1°C). This
indicated that the average bird gular fluttered continuously at temperatures above 34.2°C (calculated
as 21.0+13.2). Expressed differently, for each 1°C increase in operative temperature between 21.0°C
and 34.2°C, the estimated increase in the proportion of time spent gular fluttering was 0.076
(calculated as 1/13.2). Expressed as a percentage, there is an estimated 7.6% increase in time spent
gular fluttering for each 1°C increase in operative temperate.
Once explanatory variables were introduced into the model (colony and breeding state, each with
three levels), the model with the smallest AIC included both variables, but only for the starting
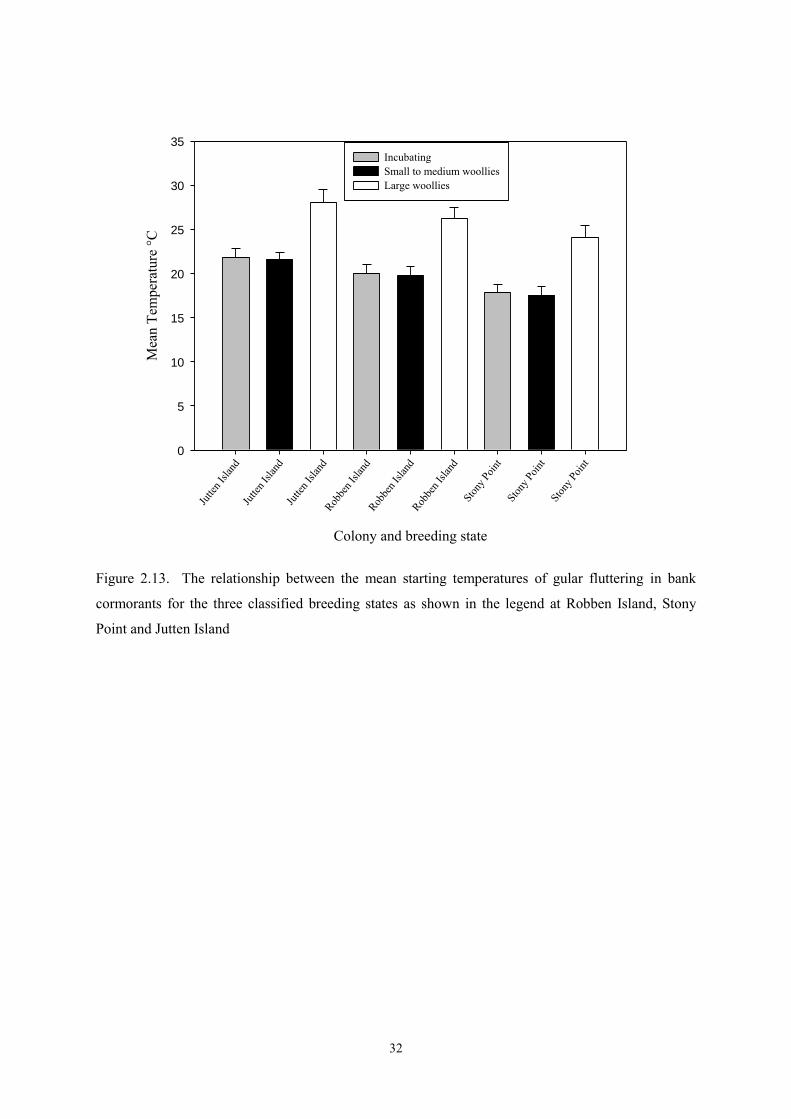
temperature of gular fluttering (Figure 2.13). In this model, the “duration” parameter was 14.8°C (SE
1.4°C) and the standard deviation of starting temperature was estimated to be 6.5°C (SE 2.0°C). The
most striking result was that once chicks were large woollies, the onset of gular fluttering was 6.2°C
(SE 1.6) higher than it was during the incubation stage. This is a statistically significant difference
(t = 3.9, p < 0.001). In contrast, the onset of gular fluttering with small to medium woollies was 0.3°C
(SE 0.8°C) lower than it was during the incubation stage, a non-significant difference (t = 0.33, n.s.).
There were differences between colonies; with Jutten Island as baseline, the start of gular fluttering at
Robben Island was 1.9°C (SE 1.1°C) lower and at Stony Point was 4.0°C (SE 1.0°C) lower (Figure
2.13).
2.4 Discussion
This chapter provided two important results. Firstly, environmental temperature does affect the
breeding behaviour of bank cormorants, increasing their thermoregulatory behaviours to cool down
when heat stressed. Secondly, the main method of heat loss of the bank cormorant was gular
fluttering, with the time spent gular fluttering increasing as their heat load increased.
2.4.1 Ambient and operative temperatures
Using black copper mounts, I observed, as predicted, that there was a correlation between the
measured ambient temperature and the operative temperature at the nest site, both corresponding with
the temperature of the environment (Bakken et al. 1985). This also explains that even with lower Ta
the birds experienced a high Te resulting in increased heat loads on the breeding bird. The
temperatures also varied with the time of day, with higher temperatures being recorded for both Te
and Ta between 11h00 and 14h00.
19
Operative readings were better correlated to the behaviour of the bank cormorant than the ambient
temperature, and this supports the decision to use operative temperature rather than ambient
temperature in the study of thermoregulation of the bank cormorant. This means that operative
temperature can be used to explain the relationship between thermal stress and environmental
temperatures. This is similar to findings by Bakken et al. (1985) that operative temperature can be
used with reliable accuracy.
2.4.2 Thermoregulatory behaviour and increasing temperatures
Thermoregulatory behaviours of the bank cormorants demonstrate that they do experience
temperatures that stress them and as expected they reacted to this heat stress with certain behavioural
responses. Similarly, Kentish plovers Charadrius alexandrinus exhibit behaviours to promote heat
loss at exposed nesting sites (Amat and Masero 2004). The bank cormorant’s dark plumage also
causes them to acquire a larger heat load than a lighter coloured bird species might (Hochscheid et al.
2002).
Gular fluttering (evaporative cooling) was the main thermoregulatory behaviour employed to reduce
heat stress experienced by the bird while nesting; this was similar to many seabird species that employ
evaporative heat loss through gular fluttering (Oswald and Arnold 2012). Gular fluttering promotes
evaporative cooling from surfaces that would not normally be exposed to air flow, and this increases
heat loss (Lasiewski and Snyder 1969). These results are similar to findings by Lasiewski and Snyder
(1969) who found that even when double-crested cormorants P. auritus are exposed to low heat loads,
they open their mouths and commence gular fluttering. A study on masked boobies (Bartholomew
1966) also found that gular fluttering was the most obvious action for heat loss while the birds were
raising their young, employing it continuously while there was direct sunlight on the birds.
It is not clear why there were intercolony differences in the mean operative temperature at which
gular fluttering started, with Stony Point having a 4°C lower threshold than the other two colonies. It
is possible that at Stony Point, which is more sheltered from the prevailing winds during the breeding
season, the effect of wind chill was less than at the other colonies on the West Coast.
This is the first application of the statistical model, custom-built by Underhill and Zucchini (1988) to
estimate the parameters of primary moult, to another context (L.G. Underhill, pers. comm.). The
statistical challenge is the same in both cases. There are observations made prior to the onset of
moult/gular fluttering and observations after moult is complete/gular fluttering is continuous, and
there is a third category of observations in which the response is continuous, i.e. a measure of the
proportion of the way through moult/proportion of the time spent gular fluttering. Thus the
application of the Underhill-Zucchini Moult Model is appropriate in this context.
20
Not only did the bank cormorants gular flutter when exposed to high heat loads, the amount of time
spent gular fluttering increased as temperatures increased. The average bank cormorant starts to gular
flutter at a Te of 21°C and the mean observed Te was 24.4°C. This temperature is close to the
temperature at which African Penguins Spheniscus demersus start to gular flutter (24°C)
(Frost et al. 1976). The time spent gular fluttering increased to 100% of the time when the average
bird are exposed to operative temperatures were over 34°C. These results are similar to the results of
a study done by Bartholomew et al. (1968), who found that (in a controlled experiment) as the heat
load increased, the amount of time spent gular fluttering increased for double-crested cormorants,
brown pelicans Pelecanus occidentalis, horned Bubo virginianus and barn owls Tyto alba and
mourning doves Zenaidura macroura. Similar to the bank cormorant, under severe heat stress, gular
fluttering was continuous (Bartholomew et al. 1968).
There was a correlation, albeit weak, between temperature increase and the “head up” behaviour, but
there was also a correlation between the “head up” action and gular fluttering. This correlation could
be of a result of the beak being more open when the bird is experiencing high heat loads
(Lasiewski and Snyder 1969) and giving of the impression that the head is tilted backwards. This can
similarly be seen with adult Heerman’s gulls Larus heermanni, extending their necks as the beak
opens more widely for evaporative heat loss (Bartholomew and Dawson 1979).
2.4.3 Thermoregulatory behaviour and the presence of eggs and chicks
Incubating is generally seen as a warming process (Downs and Ward 1997) and therefore it is likely
that the bird will be hotter when on eggs or small chicks. This is similar to the results in this study,
that an average bank cormorant starts to gular flutter at a lower temperature on eggs or small to
medium sized chicks than when caring for larger chicks or fledglings. This is because older
cormorant nestlings are better able to maintain their own constant body temperature during periods of
heat stress and newly hatched chicks show little capacity of thermoregulation
(Lasiewski and Snyder 1969). Similarly the younger chicks of the masked booby are completely
dependent on their parents for protection from the physical environment (Bartholomew 1966).
2.5 Conclusions
The fact that bank cormorants nest in exposed breeding locations provided a great opportunity to
examine the thermoregulatory behaviour of these birds; and evidence suggests that there is a link
between increasing environmental temperature and increasing thermoregulatory behaviour to cool.
However, for now the thermoregulatory capacity of the bank cormorant seems to be adequate to meet
the thermal stress demands caused by high environmental temperatures. Like the masked boobies
(Bartholomew 1966), their attachment to guarding their egg and chicks are remarkable, as they were
never observed leaving the nest to cool down or find conditions where heat stress can be avoided.
21
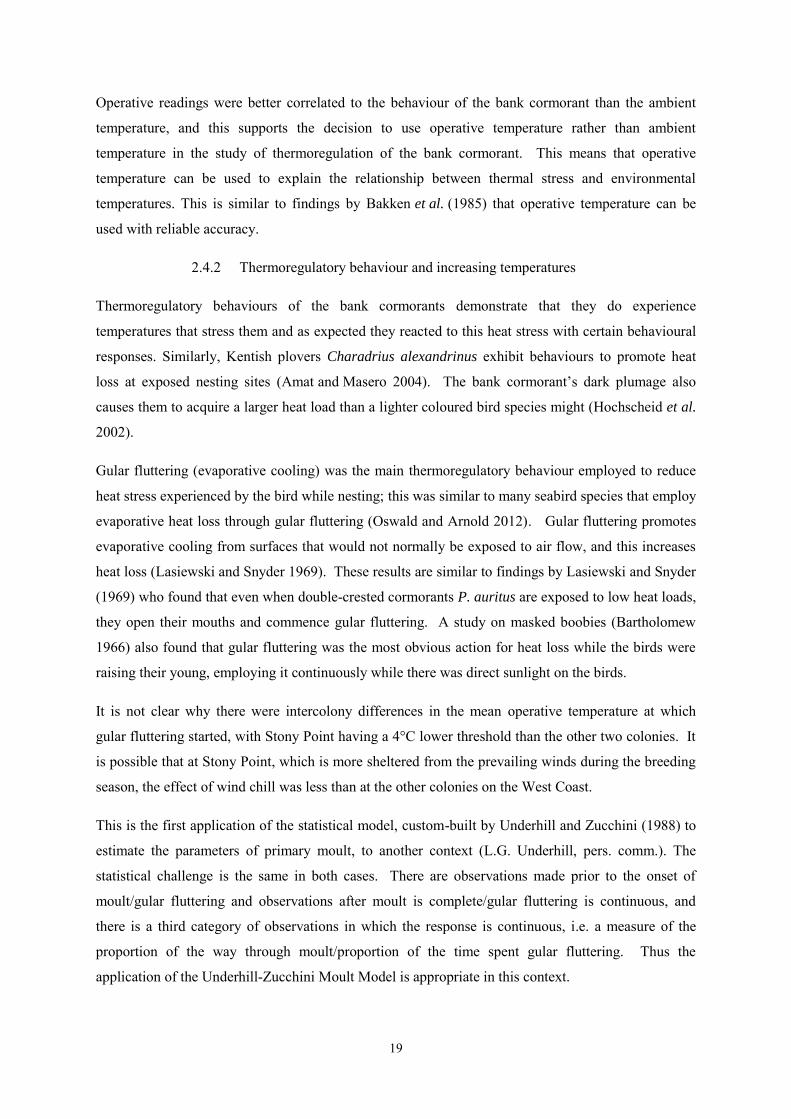
Table 2.1. Observed behaviour of nesting bank cormorants at Robben Island, Jutten Island and Stony
Point in 2012 and 2013
Code Behaviour Description
S Sitting Bird sits firmly on nest
C Crouching Bird raises body from egg(s) or chick(s)
ST Standing Bird is standing next to egg(s) or chick(s) and they are fully exposed
GF Gular fluttering Bird’s mouth is open and air flow is experienced over the gular
BC Beak closed Bird’s beak is closed
HD Head down Bird’s head is held at a normal straight position
HT Head tucked Bird’s head is tucked under its wing
HU Head up Bird’s head is tilted up and backwards
WC Wings closed Bird’s wings are closed and resting tightly on body
WP Wings propped Bird’s wings are lifted from body and dropped to the side of the body
22
Table 2.2. Behaviour of nesting bank cormorants’ correlation matrix. Values printed in italics
indicate significant and meaningful positive correlations (r > 0.2, p < 0.05). The abbreviations for the
observed behaviours are in Table 2.1. The correlation for gular fluttering (GF) and beak closed (BC)
is –1, because those two activities cannot be done simultaneously. This also applies to wings propped
(WP) and wings closed (WC)
S
C –0.49 C
ST –0.76 –0.20 ST
GF 0.15 0.08 -0.23 GF
BC –0.14 –0.9 0.23 –1 BC
HD –0.22 0.10 0.18 –0.55 0.55 HD
HT 0.05 –0.14 0.05 –0.29 0.29 –0.14 HT
HU 0.18 –0.01 –0.20 0.66 –0.66 –0.84 –0.41 HU
WC –0.06 –0.25 0.26 –0.23 0.23 0.09 0.16 –0.17 WC
WP 0.06 0.25 –0.26 0.23 –0.23 –0.09 –0.16 0.17 –1
23
Figure 2.1. Location of the three studied bank cormorant colonies during 2012 and 2013 along the
western Coast of South Africa
24
Figure 2.2. The bank cormorant colony at Stony Point in 2013
Figure 2.3. The bank cormorant colony at Robben Island in 2013
25
Figure 2.4. The bank cormorant colony at Jutten Island in 2013
26
Figure 2.5. A black copper sphere and Stevenson’s screen placed near the Robben Island colony
Figure 2.6. Cameras and recording equipment placed to record nests at the Jutten Island colony
(similarly at Robben Island)

27
Figure 2.7. Example from video footage of nesting bank cormorant (bird on the left) displaying
thermoregulatory behaviours: gular fluttering (GF), head up (HU), wings propped (WP), and
crouching (C)
28
Figure 2.8. Relationship between ambient and operative temperature (r385 = 0.668, p < 0.001) at
Robben Island, Stony Point and Jutten Island
Figure 2.9. Mean operative and mean ambient temperatures recorded during each hour of the day.
Robben Island, Stony Point and Jutten Island obtained during 201 and 2013 have been combined
15 20 25 30
1525
35
Ambient Temperature °C
Ope
rativ
e Te
mpe
ratu
re °C
0
5
10
15
20
25
30
35
9 10 11 12 13 14 15 16
Tem
pera
ture
°C
Hour of day
Mean Operative Temperature
Mean Ambient Temperature
29
Figure 2.10. Average ambient and operative temperature measured at the same time at different
colonies (with 95% confidence intervals) during 2012–2013. At each locality ambient temperatures
were 5–6°C than operative temperatures
30
Figure 2.11. Histograms displaying frequency of proportion of bank cormorants observed gular
fluttering and with head up behaviour simultaneously
Gular fluttering propotion
Freq
uenc
y
0.0 0.2 0.4 0.6 0.8 1.0
050
100
150
31
Figure 2.12. Relationship between the proportions of time bank cormorants spent gular fluttering and
operative temperature at the nest, using the Zucchini-Underhill Moult Model. At y = 0, the solid line
represents the operative temperature at which the average bank cormorant starts to gular flutter. At
y = 1, the solid line represents the temperature at which 50% of the cormorants are gular fluttering
continuously. The dashed line indicates the 95% confidence intervals of the mean starting
temperature
32
Colony and breeding state
Jutte
n Isla
ndJu
tten I
sland
Jutte
n Isla
ndRob
ben I
sland
Robbe
n Isla
ndRob
ben I
sland
Stony
Point
Stony
Point
Stony
Point
Mea
n Te
mpe
ratu
re °C
0
5
10
15
20
25
30
35
IncubatingSmall to medium woolliesLarge woollies
Figure 2.13. The relationship between the mean starting temperatures of gular fluttering in bank
cormorants for the three classified breeding states as shown in the legend at Robben Island, Stony
Point and Jutten Island

33
Chapter 3
The influence of possible environmental variables on the breeding productivity of the
‘Endangered’ bank cormorant Phalacrocorax neglectus in the Western Cape, South Africa
3.1 Introduction
Breeding success of certain seabirds is affected by the physical environment (Mallory et al. 2009b).
Extreme weather conditions, such as high temperatures and storm activity, have the potential to
decrease the breeding productivity of a bank cormorant colony, because the breeding performance of
seabirds is impacted by weather conditions (Chastel et al. 1993). This topic has now received
considerable attention in the field of climate change research (Ramos et al. 2002). Extreme
environmental conditions, such as these mentioned above, may have stronger effects on population
dynamics than average climate (Moreno and Møller 2011). In addition it has been suggested that the
increased frequency of storms and extreme heat also lowers the reproduction output of seabirds,
through hypothermia, hyperthermia and even starvation and predation in chicks (Boersma and
Rebstock 2014).
The bank cormorant Phalacrocorax neglectus is classified as ‘Endangered,’ following a decline in its
overall breeding population from c. 9000 breeding pairs between 1975 and 1981 to c. 3000 pairs in
2011 (Crawford et al. 2008a, 2012, BirdLife International 2013). This represents a decline of over
60% in the 40 years leading up to 2011. The bank cormorant is endemic to the Benguela upwelling
system off the coast of south-western Africa (Crawford et al. 2008a) and at the start of the 21st century
its breeding distribution ranged from Swakopmund (22˚41' S, 14˚32' E), central Namibia, in the north,
to Quoin Rock, in the east (34˚47' S, 19˚40' E), Western Cape, South Africa (du Toit et al. 2003).
Many breeding seabirds along the African coastline are threatened by disturbance and terrestrial
predators; choice of breeding location is further limited by the availability of food resources close by
(Berruti et al. 1995, Randall 1995, du Toit et al. 2002, Bartlett et al. 2003). The study species, bank
cormorant, is particularly sensitive to anthropogenic disturbance during the breeding season (Cooper
1981). Therefore, breeding colonies occur mostly on offshore islands, high offshore rocks and
boulders and man-made breakwater structures (du Toit et al. 2002, Bartlett et al. 2003). Colonial
seabirds, such as the bank cormorant, tend to make excellent study subjects for determining the
relationship between environmental conditions and breeding success; because nests are concentrated
at the colonies and usually the environmental variables are easy to measure (Nettleship 1972).
Bank cormorants construct large, heavy nests, engineered mainly from wet seaweed, on rocky
surfaces near the water’s edge (Cooper 1986). This leaves them exposed to weather and sea
conditions, and it has been found that whole nests and all their content can be lost during storms
34
(Crawford and Cooper 2005, Sherley et al. 2012). It has been shown that the quality and location of
a breeding site can influence the breeding success of a seabird species (Chastel et al. 1993). Durant et
al. (2004) also found that many seabird populations in the North Atlantic Ocean were affected by
weather conditions, especially storms, through egg and/or chick mortality, affecting their breeding
success. Understanding the variability in breeding success of the bank cormorant is important for
managing the declining population, because weather variables can greatly influence reproduction of
animal populations (Ramos et al. 2002)
Building on previous observations by Sherley et al. (2012), this chapter presents a study on the effects
of weather variability and changes in sea state on the nesting survival of breeding bank cormorants,
and seeks to determine the factors influencing the survival of eggs and chicks (Ramos et al. 2002).
The effects of these environmental parameters were tested on the breeding success at three breeding
colonies along the coast of the Western Cape, South Africa: Robben Island, Jutten Island and Stony
Point.
3.2 Materials and methods
3.2.1 Study sites
During the austral winters of 2012 and 2013 I studied the breeding success of three bank cormorant
colonies in the Western Cape, South Africa (Figure 3.1). The study was undertaken at Robben Island
(33°48' S, 18°22' E), Stony Point (34°22' S, 18°43' E) and Jutten Island (33°05' S, 17°57' E). Robben
Island is situated in Table Bay, Cape Town, whereas Jutten Island is located c. 90 km north-west of
Cape Town, just outside the mouth of Saldanha Bay on the West Coast. Stony Point is a mainland
colony on a rocky point at Betty’s Bay.
3.2.2 Data collection
At the three breeding colonies unmarked breeding bank cormorants were studied during 2012 and
2013 (Table 3.1). Colonies at Stony Point and Robben Island were visited weekly in 2012, or as often
as sea and weather conditions permitted. During 2013, the aim was to visit Stony Point and Robben
Island every two weeks, alternating between Jutten Island trips. The Jutten Island colony was visited
every three weeks in 2012 and every two weeks in 2013. During 2012 nest checks at Robben Island
started on 11 April and finished on 13 August. In 2013 nest checks started on 25 March and ended on
5 September. At Stony Point nest checks were made from 9 May 2012 to 7 September 2012 and 12
March 2013 to 2 September 2013. Jutten Island was monitored from 23 May to12 September in 2012
and 15 April to 26 August during 2013. This coincided with the main breeding season (May–
October) of the bank cormorant in the Western Cape (Crawford et al. 2008).

35
During each visit to a colony, information was collected. Observations were made 30–60 m from the
colonies with the use of binoculars and telescopes, to avoid disturbance of breeding birds. Nests were
manually identified and numbered on photographs taken at fixed locations, at the start of the season;
this enabled individual nests to be identified with certainty on subsequent visits (Sherley 2010) (See
Chapter 2, Figures 2.2, 2.3 and 2.4). When new nests appeared they were numbered accordingly and
added to new photographs from the same fixed locations. Nests observed only one visit were
excluded from the analysis. To my knowledge, no birds were disturbed during observations.
On each visit, the state of the nest and the stage of the breeding attempt of bank cormorant nests were
recorded, in these categories: building/guarding nest (potential nesting position), incubating eggs or
rearing of chicks. On these visits, the number of eggs and/or chicks were recorded for each nest as
well as the size of the chick. Chick sizes were divided into five categories (Sherley et al. 2012):
hatchling – less than six days old and no down (B1), small downy – less than half the adult’s size and
sheltering under the adult (B2); medium downy – larger than half the adult’s size but less than three-
quarters and covered in down (B3); large downy – larger than three-quarters of the adult’s size and
still covered in down (B4); and woolly necks – fully grown to the size of the adult with down on the
neck and head, but flight feathers on the body (B5). For each nest the number of eggs hatched and the
number of chicks fledged was calculated. A chick was regarded as fledged when it was seen to have
lost all of its down.
Nest checking started at the start of the breeding season (when active nests were identified) and ended
when all monitored juveniles had fledged. Clutch size proved difficult to determine both because
many nests were too deep to see the eggs (from the observation distance) and because eggs were not
always visible due to incubating adults. I continued monitoring nests both after successful and failed
breeding attempts, in order assess wether the birds returned for a second breeding attempt.
These data along with climate and sea state data, were used to determine a relationship between
nesting success of bank cormorants and environmental parameters. These data were used to
determine the breeding success of the bank cormorant over this two year period and compared with
the breeding success results obtained by Sherley et al. (2012). Climate data (temperature (°C), wind
(km/h) and rainfall data (mm)) were supplied by the South African Weather Services (SAWS). These
data included hourly and daily measurements for weather stations at Cape Town (33°58' S, 18°36' E),
used for Robben Island, Hermanus (34°25' S, 19°13' E), used for Stony Point, and Langebaan
(32°58' S, 18°09' E), used for Jutten Island.
Sea state data were obtained from the Council for Scientific and Industrial Research (CSIR),
Stellenbosch, and collected on behalf of the Transnet National Port Authority (TNPA). The data used
were captured in three hourly intervals, starting from 00h00 to 21h00 daily. Data captured were
significant wave height (m), spectral peak wave period (sec) and peak wave direction (degrees). The

36
Cape Point station (CP01) (34°12' S, 18°16' E) was used to provide data for Robben Island and Stony
Point and the Saldanha Bay station (SB01) (33°02' S, 17°58' E) was used to provide data for Jutten
Island.
3.2.3 Statistical analysis
Incubation and chick rearing success
To account for possible bias introduced by not monitoring all nests from the start of incubation, nest
success was determined using a combination of the Mayfield (1961, 1975) method and parametric
survival analysis (Sherley et al. 2012). Nesting success for the incubation and chick rearing
(brooding) period was determined using the Mayfield (1961, 1975) method. All breeding attempts
reaching a conclusion (fledged or failed) were considered in determining nesting success at the
colonies. Incubation success was determined using hatching success. Because clutch size could not
be determined, the nest content was considered to have survived the incubation period if at least one
chick hatched and the chick rearing period if at least one hatched chick fledged (partial failure were
ignored by models). Nest days (number of days on eggs or chicks) were calculated using the method
of taking the mid-point between visiting days (Mayfield 1961).
The survival models were implemented in the modelling software package R v.3.0.3 (R
Development Core Team 2009). The ‘survreg’ function was used to determine the daily failure rate
of a nest and the survival probability of a nest and its contents during the incubation or chick rearing
period. Following Sherley et al. (2012) the maximum likelihood estimate of risk of failure (F) per
sampling interval, for nests with eggs or chicks, was defined as:
where and (intercept and slope) were the estimated parameters from the calculated regression.
Using this formula, nest survival (S) was defined as:
Where, again, and (intercept and slope) were the estimated parameters from the calculated
regression and was the value of any continuous explanatory variable (fixed at for factorial
variables for a model with one explanatory variable) at any time (days). To make these result
comparable to those of Sherley et al. (2012), the incubation period was taken as 30 days and the
chick rearing period as 55 days (Cooper 1987).
Using the colony and year as explanatory variables (e.g. Robben 2013) in the model, nest success
values were then compared between the three studied colonies and older data for breeding success at
Robben Island and Mercury Island (Sherley et al. 2012)

37
Relationship between climate and sea-state variable and nest success
Nest failure events for the incubation and brooding period at Robben Island, Jutten Island and Stony
Point were related to weather and sea state data using generalised linear models with a binomial error
distribution and a logit link function. Environmental parameters that were found to be correlated with
the probability of nest failure were included in models. Models were run in R and the best fitting
model was selected using AIC scores (Burnham and Anderson 2002). The response variable was the
proportion of failed nests during a visit interval and the explanatory variables were the mean, total,
maximum or minimum of climate and sea state variables. Number of days in the visiting interval,
year, and colony were included in the candidate model set.
3.3 Results
Natural year-to-year variation in survival of the bank cormorant will be observed. Particularly
pronounced variation in the survival of the bank cormorant might be explained by environmental
parameters affecting the survival of the species. The relationship between survival and environmental
parameters was explored separately for the two phases of breeding: incubation and chick rearing
(brooding and past brooding). A total of 162 bank cormorant pairs were studied during 2012 and
2013 (Table 3.1). There was interannual andt intercolony variation in the properties of nests at which
at least one chick fledged (Table 3.2) and reproductive failure occurred at all colonies during both
study years. The percentage of nests with one successful fledgling was highest at Robben Island
during 2012 and lowest at Stony Point in 2012 (Table 3.2). The larger number of nests monitored in
2013 at Robben and Jutten Islands, was not due to more nests at the colonies, but rather due to more
nests being visible and increased experience of the observer.
3.3.1 Incubation success
The daily failure rate for bank cormorant nests at Robben Island during the study (2012 and 2013
combined) for the incubation period was 0.004 (0.0013 SD). Jutten Island had a higher daily failure
rate during incubation of 0.006 (0.0017 SD) and Stony Point displayed a daily failure rate of 0.005
(0.0027 SD).
The probabilities of a bank cormorant nest surviving (from laying to fledging) during 2012 and 2013
for Robben Island, Jutten Island and Stony Point did not differ greatly (Table 3.3 and Figure 3.2).
The lowest observed value for survival probability was on Robben Island in 2009 and was 0.54 (95%
CI: 0.41–0.7), after a steady decline in the success of breeding bank cormorants since 2007 (0.68,
95% CI: 0.55–0.85). The 2009 value was significantly different from the survival probability of 2011,
2012 and 2013 for Robben Island (2011: 0.86, CI: 0.7–1) (p < 0.05).
38
3.3.2 Chick rearing success
The daily bank cormorant failure rates for 2012 and 2013 combined during chick rearing for Robben
Island, Jutten Island and Stony Point were 0.0045 (0.0011 SD), 0.0046 (0.002 SD) and 0.0074 (0.002
SD) respectively. Stony Point’s daily failure rate was the highest and Robben Island was the lowest.
In contrast to incubation success, Stony Point displayed the lowest survival probability for the years
2012 of 0.64, (95% CI: 0.46–0.89) and 2013 of 0.68, ( 95% CI: 0.51–0.91) when compared with
Robben Island and Jutten Island (Table 3.4 and Figure 3.3). Robben Island seemed relatively stable
with the exception of a low survival probability in 2009 (0.51, CI: 0.3–0.87) – the lowest of all the
observed survival probabilities. Jutten Island’s survival decreased from 2012 (81.93%) to 2013
(73.46%), though not significantly.
3.3.3 Environmental variables: weather and sea state data
Although temperatures reached a high of over 37 °C (Table 3.5), similar to that of the body
temperature range of bank cormorants, 37.4–40.0°C (Wilson and Grémillet 1996), it did not seems to
have an effect on the reproductive success of the bank cormorant. The daily minimum temperatures
ranged between 1.4°C and 14.1°C (Table 3.5). The maximum total rainfall occurring during a visiting
period was over 100 mm and some periods experienced no rainfall at all; the mean total rainfall was
21.5 mm during a visiting interval (Table 3.5).
3.3.4 Incubation success and environmental variables
The probability of failure (PF) of an incubating nest (failed nests/active nests in a period) was found
to be correlated with some of the tested environmental factors. PF was positively correlated with days
during visiting intervals (r55 = 0.2, p > 0.5), maximum rain (r55 = 0.25, p > 0.5), maximum wave
height (r55 = 0.23, p > 0.5). It was negatively correlated (r55 = –0.21, p > 0.5) with the mean
maximum temperature. PF was also positively correlated with the total rainfall (r55 = 0.33, p = 0.01)
and the maximum wind gust (r55 = 0.39 p = 0.002). No difference was found between the three
colonies and therefore colonies as a variable was excluded from the model.
When significant factors were included in the generalised linear models (Table 3.6), the best model to
describe the probability of nest failure for bank cormorants during the incubation period included both
days and the maximum wind gust as explanatory variables (Figure 3.7). This model explained 21.1%
of the total deviance in nest survival during incubation.
Figure 3.7 shows the model visually, as the maximum wind gust increased, then the probability of
failing during incubation would have increased. It also shows that the longer the visiting interval, the
higher the risk of the nest not being present on the next nest check. When a nest is checked after 30
39
days during the incubation period and the wind gust is at maximum speed, there is a 0.6 probability
(60%) of the nest not being there; this probability lowers as the visiting interval and wind gust speed
decreases (Figure 3.4).
3.3.5 Chick rearing success and environmental variables
The environmental parameters that showed significant correlation (r > 0.20 and p < 0.05) with the
probability of failure during bank cormorant chick rearing were mean maximum temperature °C (r50 =
–0.34); maximum daily rainfall mm (r50 = 0.29); mean daily rainfall mm (r50 = 0.28); total rainfall mm
(r50 = 0.30) and maximum wind gust km/h (r50 = 0.41). Maximum daily temperature °C and
maximum wave height m were also positively correlated with the probability of failure, but with p-
values larger than 0.05. The interval interval visits to the nest sites was not correlated to probability
of failure and was excluded from the models. Likewise, the colony had no influence, and this variable
was also excluded.
The generalised model selection was based on models that returned the smallest AIC scores. These
were two separate linear models with the explanatory environmental parameters, maximum wind gust
speed (km/h) (AIC = 68.8) and maximum wave height (m) (AIC = 70.15) (Figure 3.5). Both these
variables showed that an increase in the variable caused an increase in the risk of nest failure during
the chick rearing period.
When the maximum wind gust increased to over 24 km/h, a nest with chicks had a 9% chance of
failing. The same happens when the maximum wave height reaches over 6 m in height. A bank
cormorant nest with chick(s) then had an almost 9% risk of chicks dying and the nest failing.
3.4 Discussion
Breeding success of bank cormorants are reduced through the loss of eggs or chicks during the
breeding period (Weimerskirch et al. 2000). As predicted, there is no significant difference in overall
nest success between the three studied colonies during the contrasted seasons in 2012 and 2013.
However, it is well-recognised that marine bird reproductive performance can vary inter-annually
(Sydeman et al. 2001) as a result of cyclic variations in oceanographic parameters (Weimerskirch et
al. 2000). Stony Point had the lowest success during the chick rearing period, but was significantly
different from the colonies. Robben Island had the highest reproductive success during the incubation
period and Jutten Island showed a decrease in success from 2012 to 2013. This lack of statistical
significance could be because the colonies show no significant short-term variation in environmental
parameters (Suryan and Irons 2001) and the reproductive success may be correlated with the breeding
population size of the researched years, a component that lacks in this study (Nur and Sydeman 1999).
Small variability in breeding success has been reported numerous times for seabird studies, and this

40
variability can be influence by a range of factors: parasites and disease, human interference and
disturbance and changes in prey abundance and/or quality (Sherley et al. 2012). Chastel et al. (1993)
also explained that weather conditions can be responsible for variability in breeding success (e.g.
snowfall influences the breeding success of snow petrels).
When these differences in breeding success for the incubation and chick rearing period were tested
against environmental parameters, there was no difference between the colonies, but consistent with
our predictions, some environmental factors may be responsible for reproductive failure at the three
studied nest locations. This is consistent with previous findings that weather conditions may affect
seabird breeding conditions (e.g. Jouventin and Weimerskirch 1991, Chastel et al. 1993). However
unlike what I expected, high temperatures did not seem to affect reproductive success during
incubation or brooding as shown in the findings of Sherley et al. (2012). This lack of high
temperatures influencing the bank cormorant’s breeding success suggest that the bird is capable of
incubating and rearing a chick successfully in spite of high environmental temperatures. Rather,
strong wind and wave action seemed to be the main factors causing nest failures during the breeding
of the bank cormorant.
Weather might not always affect adults, but still can influence fledgling success (Baird 1990, Durant
et al. 2004), by causing egg or chick mortality (Sherley et al. 2012). The low breeding success during
2009 at Robben Island was as a result of two major storm events during the peak breeding season
(Sherley et al. 2012). This provides evidence that environmental variables do influence the nest
success of the bank cormorant.
During incubation, strong wind gusts was the only variable responsible for nest failure, and during
chick rearing, it was the wind factor and the action of waves (significant wave height) at the colony
that affected survival of chicks. Wind accompanied with other weather such as rainfall or increased
wave action might be responsible for eggs being lost during the bad weather (Mallor et al. 2009).
Chick loss related to wind is consistent with findings by Frederiksen et al. (2008) and Aebischer
(1999) who suggested that gale winds and associated heavy rainfall during the breeding season could
cause mortality amongst shag chicks, presumably through hypothermia. These affects are most
pronounced when nests are exposed to these elements, as seen at bank cormorant breeding sites.
Wind storms in the Arctic have also been shown to increase nest failure for northern fulmars breeding
in the Arctic (Mallory et al. 2009a).
Sherley et al. (2012) showed that nest failures were related to the height of waves. This is consistent
with my findings, that the maximum significant wave height decreased the survival probability of
nests at three colonies. This is most likely because bank cormorants nest close to the water (Cooper
1986). Stony Point, the mainland colony, showed lower success during brooding, suggesting that nest
failure happens mostly during the chick rearing period rather than during incubation. Most likely this
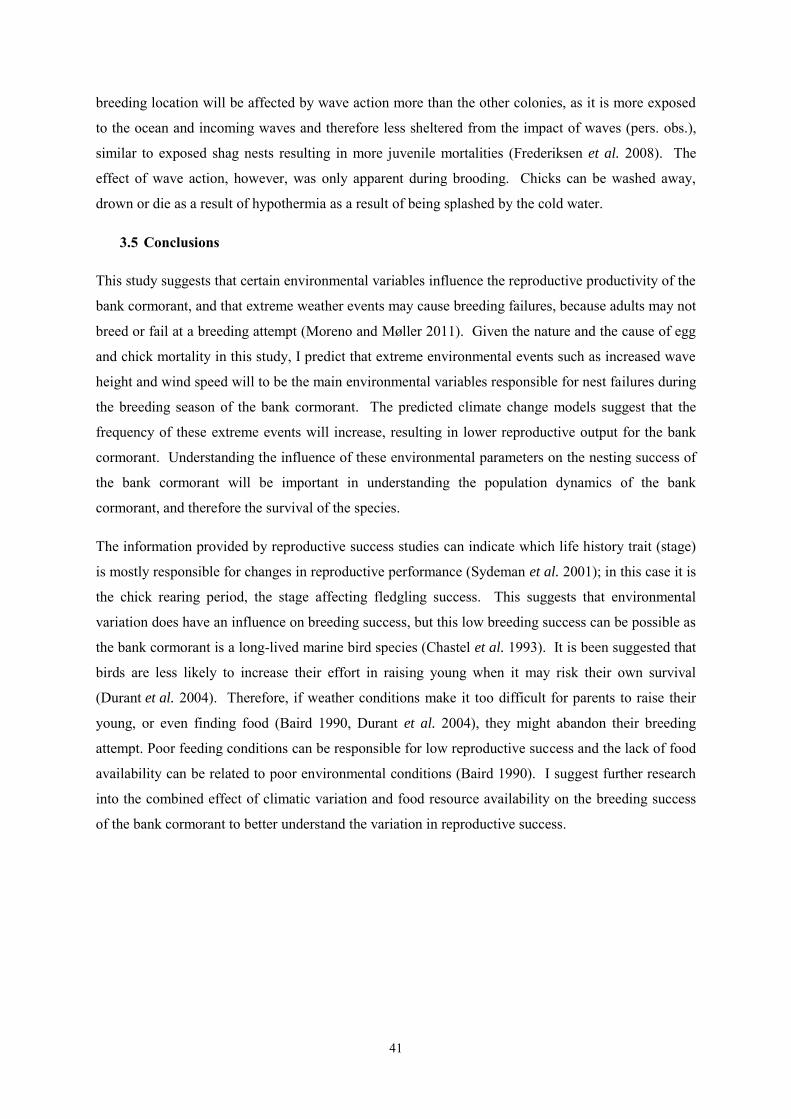
41
breeding location will be affected by wave action more than the other colonies, as it is more exposed
to the ocean and incoming waves and therefore less sheltered from the impact of waves (pers. obs.),
similar to exposed shag nests resulting in more juvenile mortalities (Frederiksen et al. 2008). The
effect of wave action, however, was only apparent during brooding. Chicks can be washed away,
drown or die as a result of hypothermia as a result of being splashed by the cold water.
3.5 Conclusions
This study suggests that certain environmental variables influence the reproductive productivity of the
bank cormorant, and that extreme weather events may cause breeding failures, because adults may not
breed or fail at a breeding attempt (Moreno and Møller 2011). Given the nature and the cause of egg
and chick mortality in this study, I predict that extreme environmental events such as increased wave
height and wind speed will to be the main environmental variables responsible for nest failures during
the breeding season of the bank cormorant. The predicted climate change models suggest that the
frequency of these extreme events will increase, resulting in lower reproductive output for the bank
cormorant. Understanding the influence of these environmental parameters on the nesting success of
the bank cormorant will be important in understanding the population dynamics of the bank
cormorant, and therefore the survival of the species.
The information provided by reproductive success studies can indicate which life history trait (stage)
is mostly responsible for changes in reproductive performance (Sydeman et al. 2001); in this case it is
the chick rearing period, the stage affecting fledgling success. This suggests that environmental
variation does have an influence on breeding success, but this low breeding success can be possible as
the bank cormorant is a long-lived marine bird species (Chastel et al. 1993). It is been suggested that
birds are less likely to increase their effort in raising young when it may risk their own survival
(Durant et al. 2004). Therefore, if weather conditions make it too difficult for parents to raise their
young, or even finding food (Baird 1990, Durant et al. 2004), they might abandon their breeding
attempt. Poor feeding conditions can be responsible for low reproductive success and the lack of food
availability can be related to poor environmental conditions (Baird 1990). I suggest further research
into the combined effect of climatic variation and food resource availability on the breeding success
of the bank cormorant to better understand the variation in reproductive success.

42
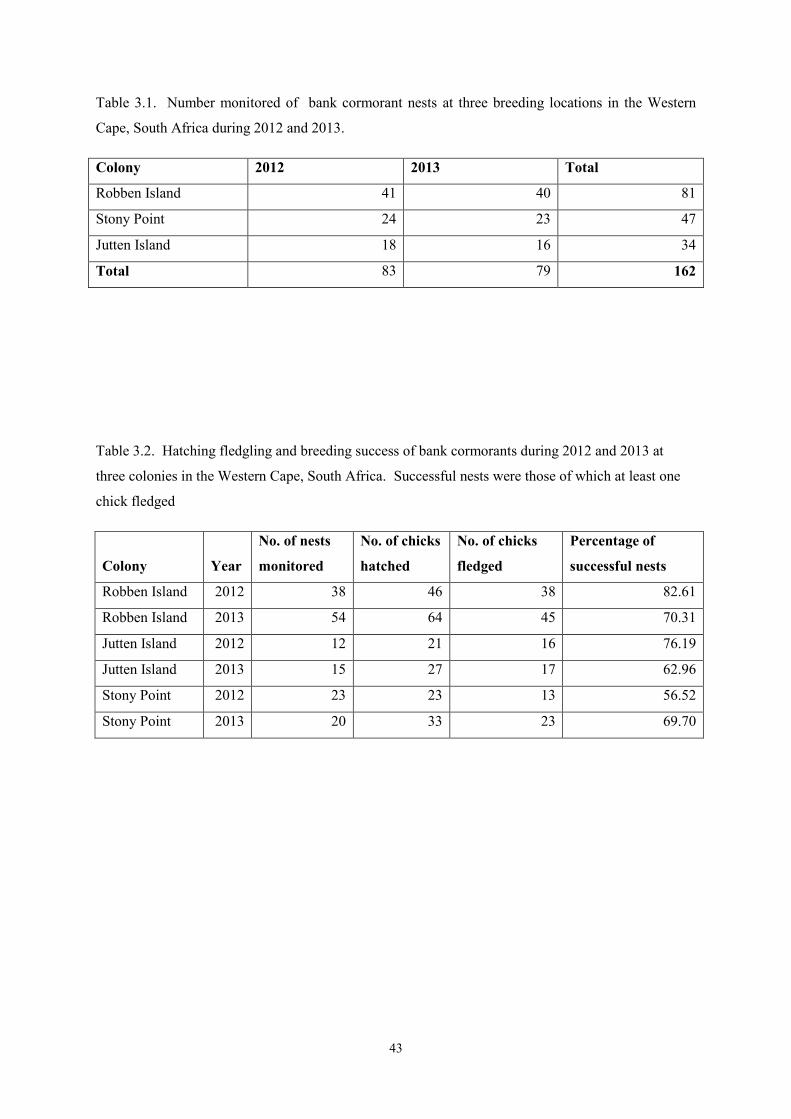
43
Table 3.1. Number monitored of bank cormorant nests at three breeding locations in the Western
Cape, South Africa during 2012 and 2013.
Colony 2012 2013 Total
Robben Island 41 40 81
Stony Point 24 23 47
Jutten Island 18 16 34
Total 83 79 162
Table 3.2. Hatching fledgling and breeding success of bank cormorants during 2012 and 2013 at
three colonies in the Western Cape, South Africa. Successful nests were those of which at least one
chick fledged
Colony Year
No. of nests
monitored
No. of chicks
hatched
No. of chicks
fledged
Percentage of
successful nests
Robben Island 2012 38 46 38 82.61
Robben Island 2013 54 64 45 70.31
Jutten Island 2012 12 21 16 76.19
Jutten Island 2013 15 27 17 62.96
Stony Point 2012 23 23 13 56.52
Stony Point 2013 20 33 23 69.70

44
Table 3.3. Survival probabilities with 95% confidence intervals for four bank cormorant colonies
during the incubation period, in southern Africa, during various breeding seasons: 2005, 2007–2013
Colony and Year Survival Probability Upper 95 % CI Lower 95% CI
Mercury Island '05 0.713 0.811 0.626
Mercury Island '08 0.730 0.856 0.622
Mercury Island '10 0.839 0.912 0.772
Robben Island '07 0.680 0.846 0.547
Robben Island '08 0.568 0.743 0.433
Robben Island '09 0.536 0.695 0.413
Robben Island '11 0.860 1 0.699
Robben Island '12 0.890 0.986 0.806
Robben Island '13 0.899 0.998 0.809
Jutten Island '12 0.861 1 0.699
Jutten Island '13 0.810 1 0.638
Stony Pont '12 0.817 0.996 0.671
Stony Point '13 0.899 1 0.798
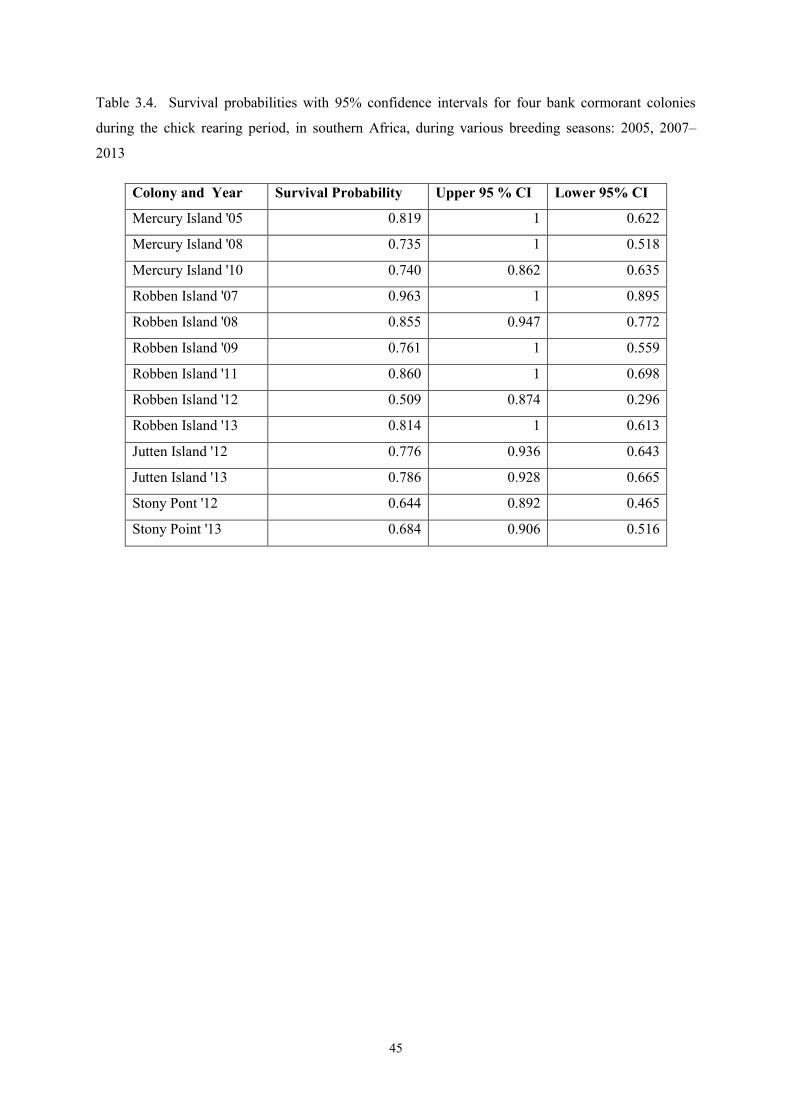
45
Table 3.4. Survival probabilities with 95% confidence intervals for four bank cormorant colonies
during the chick rearing period, in southern Africa, during various breeding seasons: 2005, 2007–
2013
Colony and Year Survival Probability Upper 95 % CI Lower 95% CI
Mercury Island '05 0.819 1 0.622
Mercury Island '08 0.735 1 0.518
Mercury Island '10 0.740 0.862 0.635
Robben Island '07 0.963 1 0.895
Robben Island '08 0.855 0.947 0.772
Robben Island '09 0.761 1 0.559
Robben Island '11 0.860 1 0.698
Robben Island '12 0.509 0.874 0.296
Robben Island '13 0.814 1 0.613
Jutten Island '12 0.776 0.936 0.643
Jutten Island '13 0.786 0.928 0.665
Stony Pont '12 0.644 0.892 0.465
Stony Point '13 0.684 0.906 0.516
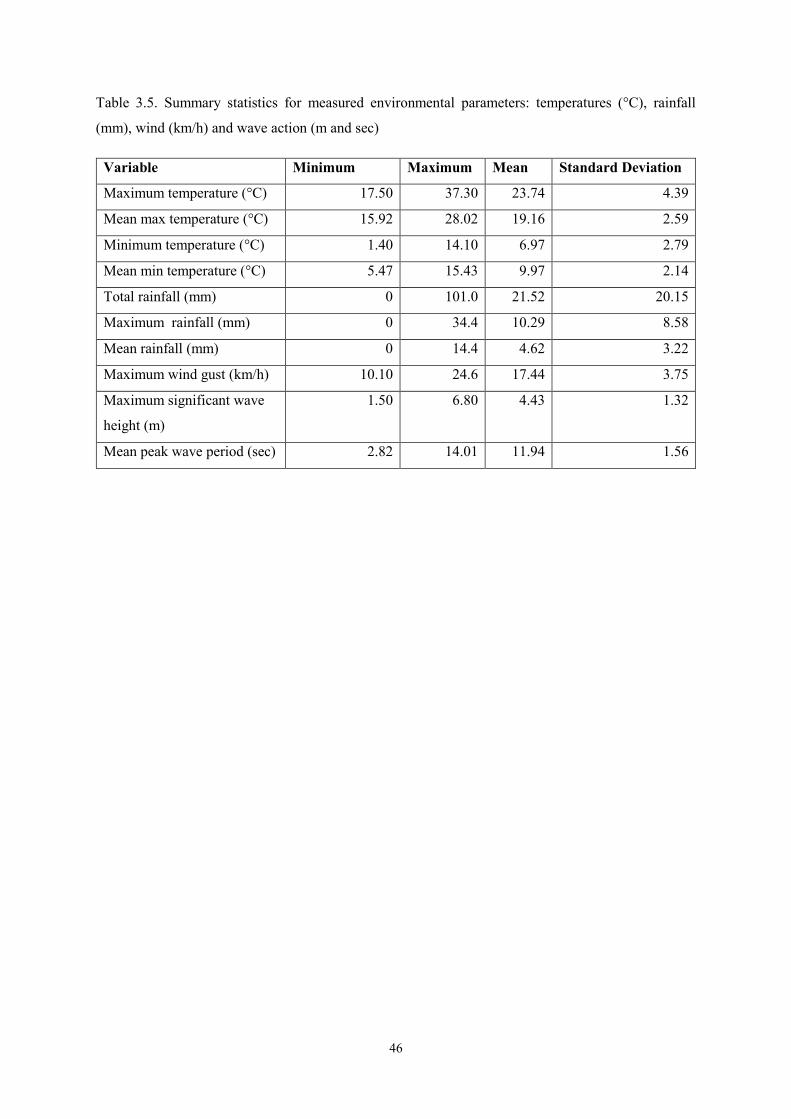
46
Table 3.5. Summary statistics for measured environmental parameters: temperatures (°C), rainfall
(mm), wind (km/h) and wave action (m and sec)
Variable Minimum Maximum Mean Standard Deviation
Maximum temperature (°C) 17.50 37.30 23.74 4.39
Mean max temperature (°C) 15.92 28.02 19.16 2.59
Minimum temperature (°C) 1.40 14.10 6.97 2.79
Mean min temperature (°C) 5.47 15.43 9.97 2.14
Total rainfall (mm) 0 101.0 21.52 20.15
Maximum rainfall (mm) 0 34.4 10.29 8.58
Mean rainfall (mm) 0 14.4 4.62 3.22
Maximum wind gust (km/h) 10.10 24.6 17.44 3.75
Maximum significant wave
height (m)
1.50 6.80 4.43 1.32
Mean peak wave period (sec) 2.82 14.01 11.94 1.56

47
Table 3.6. Candidate models of probability of failure of bank cormorant nests during incubation with
various environmental parameters for incubation success
Environmental parameters AIC score
Visiting days 112.4
Days and maximum wind 107.4**
Days and total rain 107.6
All parameters 109.1
Days, minimum temperature, mean minimum
temperature
111.9
Maximum wind 113.3
Days and minimum temperature 114.1
Days and mean minimum temperature 109.9
Total rain 112.4
**Chosen model with smallest AIC score
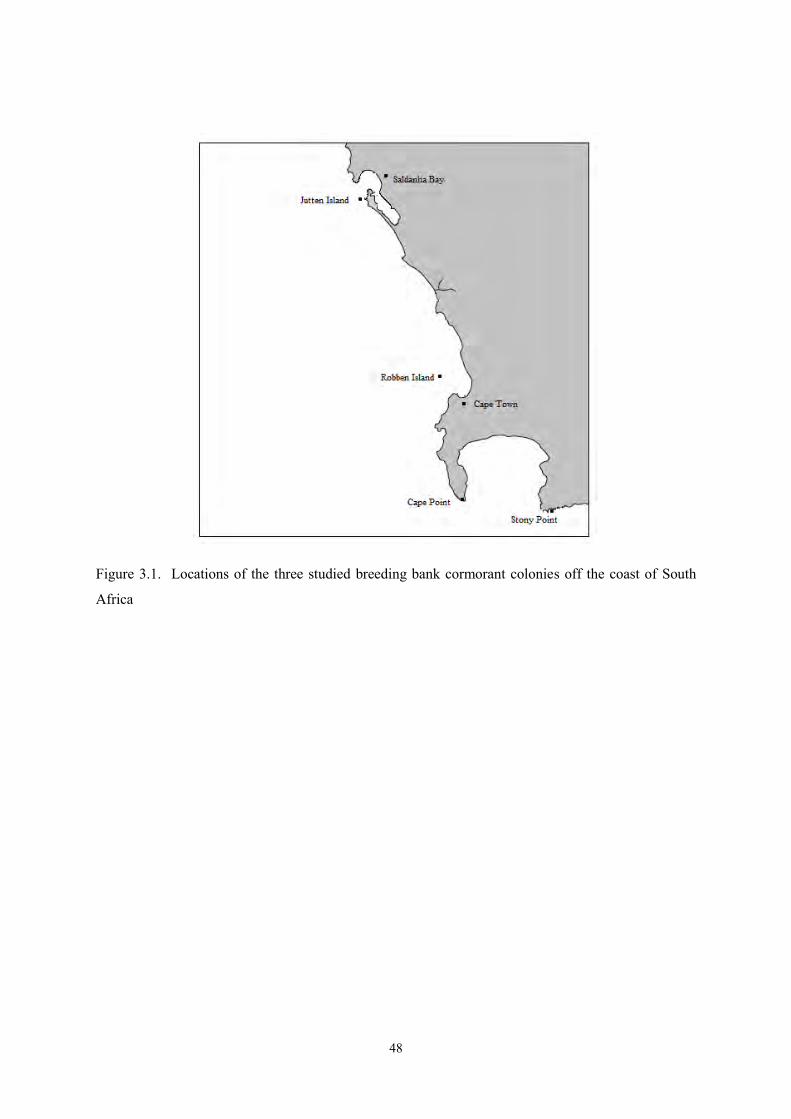
48
Figure 3.1. Locations of the three studied breeding bank cormorant colonies off the coast of South
Africa
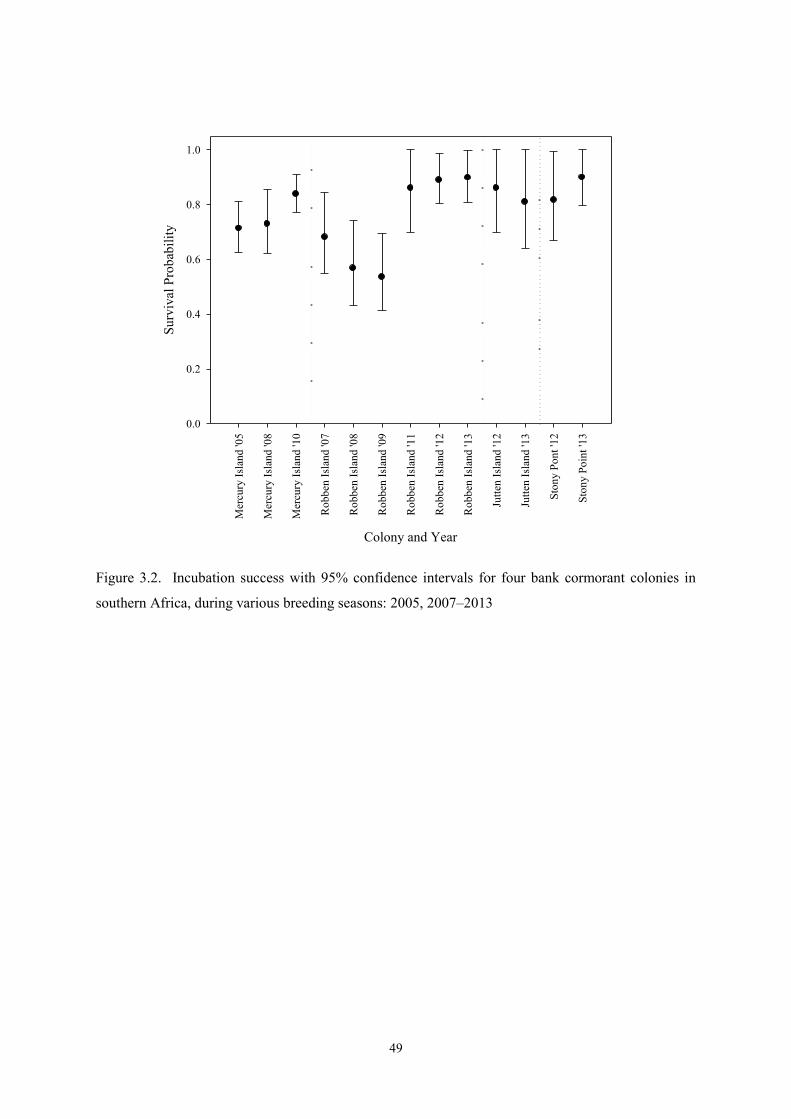
49
Colony and Year
Mer
cury
Isla
nd '0
5
Mer
cury
Isla
nd '0
8
Mer
cury
Isla
nd '1
0
Rob
ben
Isla
nd '0
7
Rob
ben
Isla
nd '0
8
Rob
ben
Isla
nd '0
9
Rob
ben
Isla
nd '1
1
Rob
ben
Isla
nd '1
2
Rob
ben
Isla
nd '1
3
Jutte
n Is
land
'12
Jutte
n Is
land
'13
Ston
y Po
nt '1
2
Ston
y Po
int '
13
Surv
ival
Pro
babi
lity
0.0
0.2
0.4
0.6
0.8
1.0
Figure 3.2. Incubation success with 95% confidence intervals for four bank cormorant colonies in
southern Africa, during various breeding seasons: 2005, 2007–2013
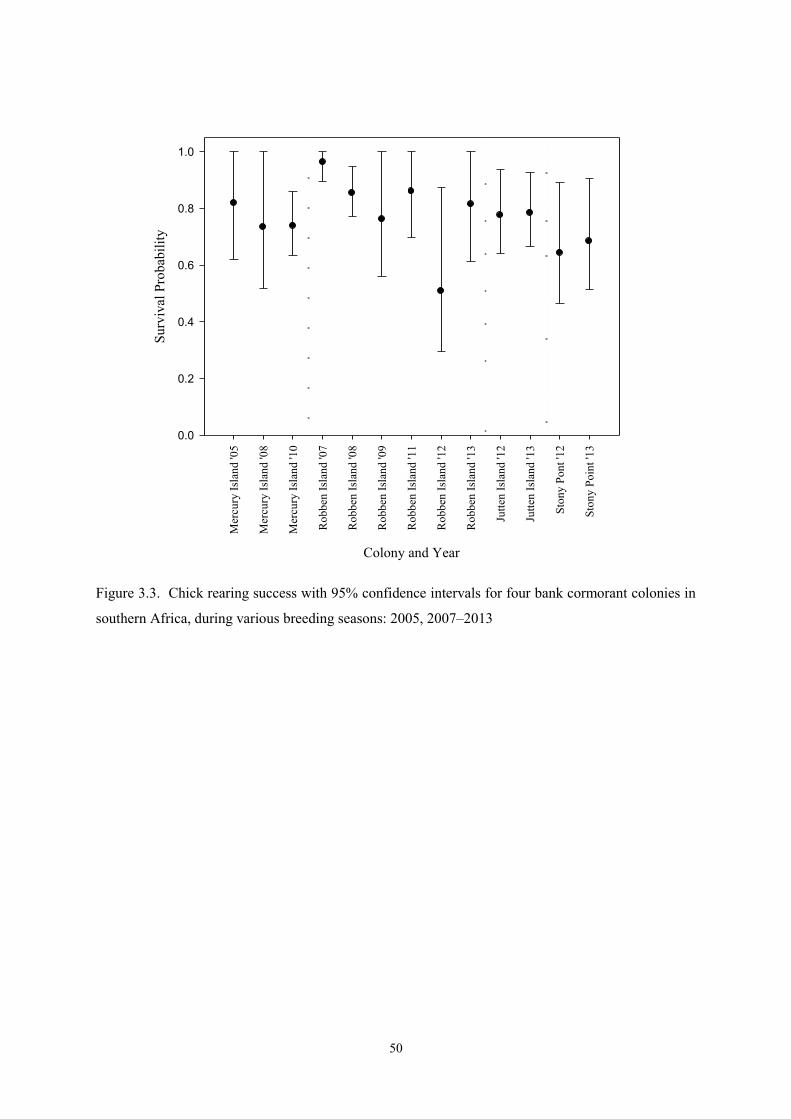
50
Colony and Year
Mer
cury
Isla
nd '0
5
Mer
cury
Isla
nd '0
8
Mer
cury
Isla
nd '1
0
Rob
ben
Isla
nd '0
7
Rob
ben
Isla
nd '0
8
Rob
ben
Isla
nd '0
9
Rob
ben
Isla
nd '1
1
Rob
ben
Isla
nd '1
2
Rob
ben
Isla
nd '1
3
Jutte
n Is
land
'12
Jutte
n Is
land
'13
Ston
y Po
nt '1
2
Ston
y Po
int '
13
Surv
ival
Pro
babi
lity
0.0
0.2
0.4
0.6
0.8
1.0
Figure 3.3. Chick rearing success with 95% confidence intervals for four bank cormorant colonies in
southern Africa, during various breeding seasons: 2005, 2007–2013
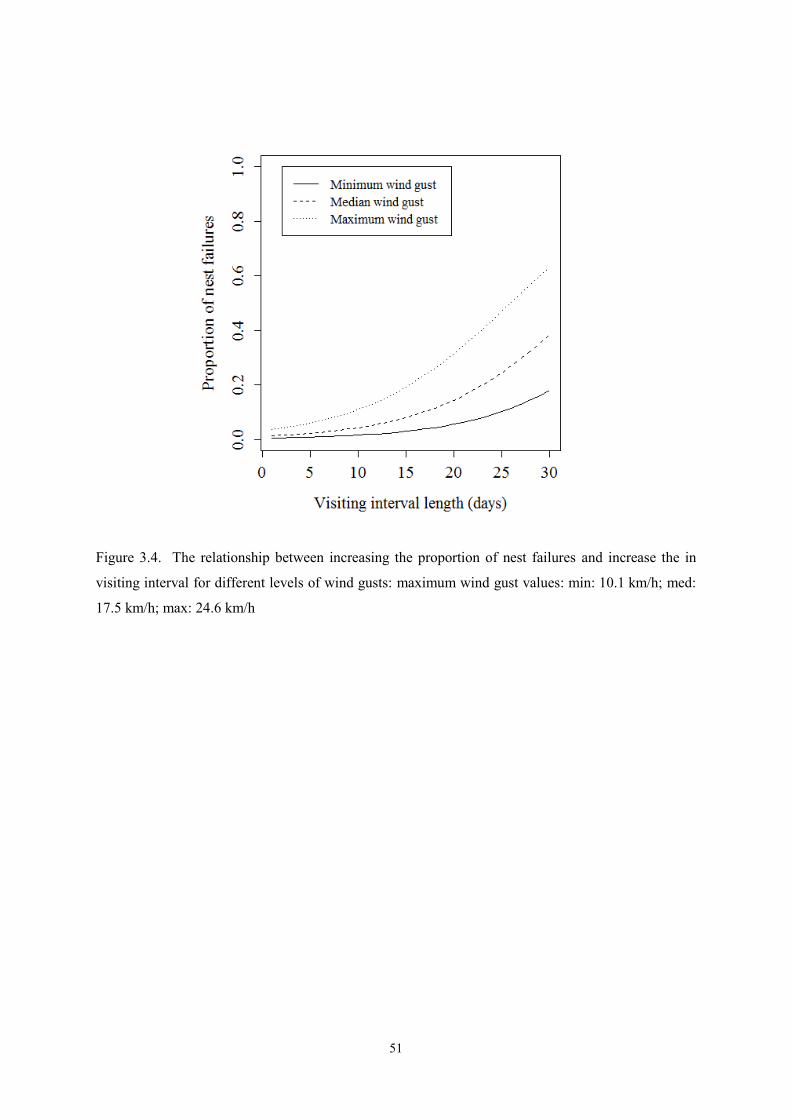
51
Figure 3.4. The relationship between increasing the proportion of nest failures and increase the in
visiting interval for different levels of wind gusts: maximum wind gust values: min: 10.1 km/h; med:
17.5 km/h; max: 24.6 km/h
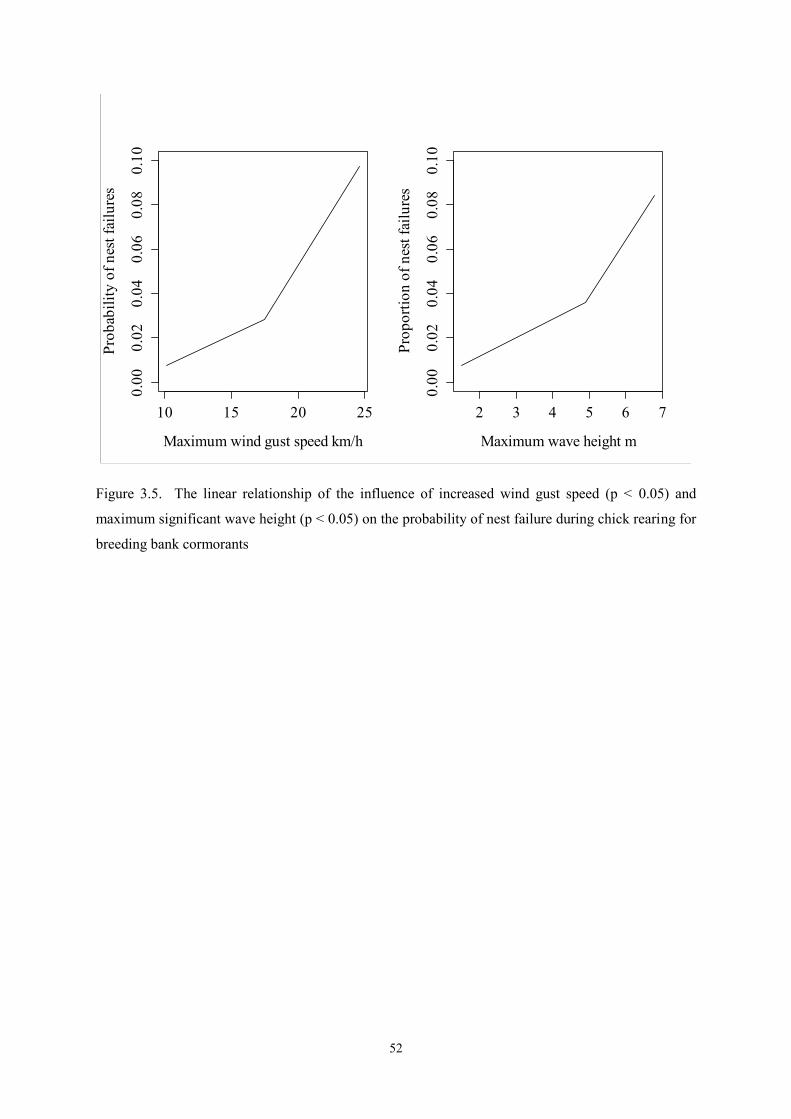
52
Figure 3.5. The linear relationship of the influence of increased wind gust speed (p < 0.05) and
maximum significant wave height (p < 0.05) on the probability of nest failure during chick rearing for
breeding bank cormorants
10 15 20 25
0.00
0.02
0.04
0.06
0.08
0.10
Maximum wind gust speed km/h
Prob
abili
ty o
f nes
t fai
lure
s
2 3 4 5 6 70.
000.
020.
040.
060.
080.
10Maximum wave height m
Prop
ortio
n of
nes
t fai
lure
s

53
Chapter 4
Trends in the bank cormorant Phalacrocorax neglectus population of the Western Cape, South
Africa: the impact of climate change
4.1 Introduction
Climate monitoring and long-term climate reconstruction over the past decades indicate that the earth
is warming (IPCC 2007). Ecologists face the challenge of predicting its impacts on species and
communities (Hughes 2000). Wide spread climatic variation over inter-annual and longer periods has
been shown to affect seabird populations (Bunce et al. 2002). Climate can affect seabird populations
directly through changes in physiology or indirectly, by influencing the availability of a species’ prey
(Durant et al. 2004). Documented impacts of climate change on seabirds include changes in species
demography and ranges, species abundance, phenology, breeding proportion, breeding success and
adult survival (Crick 2004, Lemoine 2005, Sandvik et al. 2012). This has been documented across
various seabird species and populations, but the extent of the effects may vary between different taxa
(Sandvik et al. 2012). This knowledge of species demography and environmental change is important
to understand fluctuations in bird populations (Sæther et al. 2000).
Of the predicted effects of climate change, the dominant consequence is increased air temperature at
the ocean and land surface (Oswald and Arnold 2012). Other variables of climate change that affect
bird populations are: increases in the mean annual temperature, the mean annual minimum and
maximum temperatures, with the annual minimum temperature exerting a larger influence, changes in
the land surface precipitation and an increased frequency of extreme weather events (Lemoine 2005).
Extreme weather events, such as storms and the increased frequency of these events, have a
devastating effect on bird populations (Crick 2004). The causes underlying population trends can be
determined by comparing population trends and the external variables can be used to help indicate the
cause (Green 1999). It is important to distinguish between short-term and long-term trends that result
from climate change, because marine ecosystems are dynamic and in a constant state of change
(Crawford and Altwegg 2009). In this study I examined the bank cormorant population over a 56-
year period.
The bank cormorant is an endemic, ‘endangered’ marine bird species that occur along the western
coast of southern Africa. The bird has suffered a serious decline in its overall population, declining
from c. 9000 breeding pairs between 1975 and 1981 (Cooper 1981) to approximately 3000 breeding
pairs in 2011 (Crawford et al. 2012).
Crawford et al. (2008) considered that climate change had influenced the observed range shifts and
population decreases of the bank cormorant, through the impact of climate change on the bank
54
cormorant’s main prey species. The northern most bank cormorant colony in the Western Cape at
Lambert’s Bay, became extinct in 1999, which coincides with large decreases at the Dassen and
Malgas Island colonies during the 1990s. Available evidence suggested that predicted climatic
warming can raise environmental temperatures beyond that tolerable to seabirds (Oswald and Arnold
2012).
Many aspects of the life-histories of seabirds respond to climatic conditions (Sandvik et al. 2005), and
it has been shown that climate variables can effect population dynamics through traits such as
productivity (reproductive ability) and adult survival (Jenouvrier et al. 2005b). Population dynamics
is a function of all life-history traits, and this may result in climate change operating at different time
lags on a bird’s population (Jenouvrier et al. 2005a, Sandvik et al. 2012). The impact of time lags in
the life history of seabird populations may be important in explaining the fluctuations in population
dynamics (Jenouvrier et al. 2005). It is important to understand whether the environmental influences
the population growth via adult survival or a delayed reaction via offspring reproduction and
recruitment (Sandvik et al. 2012). Recruitment, a demographic parameter is expected to have a
delayed effect on population size and adult survival is expected to have an immediate effect
(Jenouvrier et al. 2005a). Due to age of maturity (seabirds are long-lived), the effect of climate
variation at one time may only be observed several years later (Durant et al. 2004). Bank cormorants
generally reach maturity after three years and are then recruited into the adult population (Crawford et
al. 2001). The detection of the negative effect of climate change on seabirds, is expected to be more
likely when time lags of this length are included in the analysis.
Understanding how seabird populations respond to past climate change can help us comprehend their
response to predicted future climate change (Bolger et al. 2005) and estimation of demography
changes for bird populations is important in determining the conservation goal for that population
(Green 1999). It is important to understand this response of seabird to climate change as seabirds may
be used as early indicators of climate change. Furthermore, the conservation status of birds can be
altered by climate change, resulting in changes in the conservation management of a community or
species (Crawford and Altwegg 2009).
The aim of this chapter was to determine the long term, direct effects of climate change on an
endangered species’ demography, the bank cormorant. Long-term studies provide insight into how
changes in the physical environment may affect seabird populations (Jenouvrier et al. 2003). The
population of the bank cormorant has decreased to approximately 3 000 breeding pairs in 2011
(Crawford et al. 2012). Restricted range species, such as the bank cormorant which breed mainly on
offshore islands, are more likely to be threatened by extinction than other species (Simmons et al.
2004). It wass predicted that the decrease in the bank cormorant population is a consequence of a
rise in atmospheric temperature, a decrease in rainfall and an increase in storms. Evidence shows that
55
the bank cormorant population has changed with fewer birds colonising fewer locations today,
compared its historical population (Crawford et al. 2008).
4.2 Material and Methods
4.2.1 Study sites
The population data (1956–2012) analysed in this chapter were collected as part of a long-term bank
cormorant population monitoring programme by the South African Government (Branch Oceans and
Coasts, Department of Environmental Affairs) (Makhado et al. 2013). The colonies at which data
were collected ranged from Lambert’s Bay (Bird Island; 32°05' S, 18°18' E), the northern most
colony, to Dyer Island (34°34' S, 19°21' E), in the south-east (Figure 4.1).
Bank cormorants nests were counted visually during the breeding season, with the highest count in a
year taken to represent the number breeding at a colony (Crawford et al. 1999). The census of
breeding bank cormorants started in 1956 for Lambert’s Bay, Malgas Island (33°02' S, 17°55' E),
Marcus Island (33°14' S, 17°58' E), Jutten Island (33°04' S, 17°57' E ), Vondeling Island (39°09' S,
17°58' E) and Dyer Island. The first counts Robben Island (33°48' S, 18°21' E) and Dassen Island
(33°25' S, 18°04' E) were in 1978. Counts were made infrequently until 1990 and then more regularly
(Green 1999). Breeding bank cormorants were first observed at Stony Point in 1987 (Cooper 1988).
Stony Point (34°22' S, 18°53' E) counts were provided by Bruce Dyer (Branch Oceans and Coasts,
Department of Environmental Affairs 2013) and began in 1996.
4.2.2 Climate variables
Two climate variables, mean maximum temperature (°C) and total rainfall (mm) were used to
determine the potential impact of climate change on the bank cormorant population in the Western
Cape. Climate data used in this study were provided by the South African Weather Service (SAWS).
Weather stations located at Cape Town (33°58' S, 18°36' E), Hermanus (34°25' S, 19°34' E) and
Langebaan (32°58' S, 18°09' E) were chosen. Calculated yearly mean maximum temperature and
yearly total rainfall were compared to long-term bank cormorant population data. The Lambert’s
Bay colony was not compared to weather data because the colony went extinct in 1999. The weather
stations were chosen because they were closest to the above mentioned monitored colonies.
4.2.3 Statistical analyses
Not all colonies were counted every year. Missing observations were imputed, so that the total
population sizes for each year, including those years with a few missing observations, could be
estimated. The method devised by Underhill and Prys-Jones (1994) was used. They stated that
imputing the missing values could be done providing there was a suitable statistical model. This is the
same model used by Underhill and Prys-Jones (1994) for waders in the United Kingdom. The

56
imputed values should be a small part of the total number of counts (Underhill and Prys-Jones 1994).
Imputation was done using Fotran (Fortran Working Group). Imputed data provided a complete data
set for the bank cormorant population at each colony.
Linear regression models and correlation statistics were used to determine if relationships existed
between the population dynamics and climate variables. Statistical modelling of the relationship
between climatic parameters and species populations is now a widely accepted method for studying
climate-species interactions (Kearny 2011). Time lag analysis, important in determining population
dynamics (Jenouvrier et al. 2005a, Thompson and Ollason 2001), was also applied. Bank cormorants
only become part of a breeding population at three years of age. The same climate variables were
analysed with the population index with a time lag of three years using the software package R v.3.0.3
(R Development Core Team 2009). This way fecundity (reproductive effort) as a life-history trait is
analysed in relation to climate change.
4.3 Results
4.3.1 Population size
The overall pattern for the number of bank cormorants breeding at nine well-monitored localities in
the Western Cape in the six-decade study period from the late 1950s to the early 1910s was
decreasing, although there were large fluctuations (Table 4.1 and Figure 4.2). The populations at the
individual colonies showed strong year to year variation (Table 4.1). Bank cormorant populations at
Vondeling, Juttten, Dyer and Malgas Islands decreased from the late 1990s to the early 2000s.
Lambert’s Bay’s population decreased from the early 1990s to complete abandonment in 1999.
Marcus Island’s colony was relatively stable in size and the Robben Island population showed a slow
increase since monitoring began. At Stony Point, a colony was initiated in 1987, and subsequently,
increased.
To determine the population index of the bank cormorant, imputed values were used (Table 4.1). I set
the population size index to 100% in 1956, when the estimated population size for the nine breeding
bank cormorant colonies used in this study was 763 breeding pairs. This resulted in 35 imputed
values. In relation to this baseline the population size index for the bank cormorant population in
2012 was 34.45% (Figure 4.2). This showed a decrease of 65.5% in the 56 years leading up to 2012.
The total population of all the colonies in 2012 was the lowest it’s been since 1956.
The Lambert’s Bay bank cormorant colony (Figure 4.3a) decreased to local extinction in 1999. By
2012 this colony had not re-established itself. Like Lambert’s Bay, Malgas Island (Figure 4.3b)
showed a decrease in the bank cormorant colony, to only nine breeding pairs in 2012. This
represented a decline of 91.2% since 1956. From 1990 to 1995, the population declined by 71.1%
from 194 to 56 breeding pairs.
57
Marcus Island on the West Coast was relatively stable during the study period, with only small annual
fluctuations (Figure 4.3c). However, the colony showed a small increase of 10.7% from 1985–2012.
The bank cormorant colony at Vondeling Island (Figure 4.3d) decreased from 1956–1986 and
increased again up until 1994. From 1994 to 2012 the breeding colony decreased from 65 to 3
breeding pairs, representing a decline of 95.4%. The total population decline from 1956–2012 is c.
90%. The Jutten Island colony (Figure 4.3e) also showed an overall decrease from 1956–2012, but
with clear annual fluctuations. The colony decreased from 40 breeding pairs in 1956 to 19 pairs in
2012 (52.5% decrease).
Although there has been a total decrease of 73.56% since 1956, Dassen Island (Figure 4.3f) is one of
the few bank cormorant colonies that showed an increase in breeding pairs from 1995–2012. The
colony has increased from 25 pairs to 70 pairs between 1997 and 2012. That is an increase of more
than 100% for that time period. The bank cormorant colony at Robben Island (Figure 4.3g) has been
relatively stable in the 56 study years (1956–2012), with some annual fluctuations and an increase of
just over 20% until 2011.
For the Stony Point data set (Figure 4.3h), the newest of the bank cormorant colonies in the Western
Cape, counts started in 1987 with two breeding bank cormorant pairs (Table 4.1). This increased to
32 breeding pairs in 2012.
The bank cormorant colony at Dyer Island (Figure 4.3i) decreased by 94% from 1956 to 2012. A
period of decrease for this colony occurred between 1997 and 2012, during which breeding pairs
decreased by almost 90%.
4.3.2 Population fluctuations and climate change
The Robben Island bank cormorant population, which presented an increase in population growth
(Figure 4.3g) showed no significant correlation with changes in average maximum daily temperature
(r26 = 0.047, p > 0.05) or total rainfall (r26 = –0.12, p > 0.05) over time, for the Cape Town weather
station. However, the average maximum temperature in this region has shown an increase of 0.4 °C
(0.02%) in the 35 years leading up to 2012 (Figure 4.4) (p = 0.0027). Time lag analysis, with a period
of three years (the time it takes for a bank cormorant to reach sexual maturity), did not reveal an effect
of temperature (r23 = –0.022, p > 0.05) or rainfall (r23 = –0.089, p > 0.05) on the population dynamics
of the bank cormorant.
The average maximum daily temperature per year for Hermanus showed no significant increase and
the total rainfall per year showed only annual fluctuation. Temperature and rainfall were not
correlated (r17 = 0.25, p = > 0.05). The increase in population growth at Stony Point (average
maximum daily temperature: r18 = 0.10, p > 0.05; total rainfall: r17 = 0.0076, p > 0.05) was not related
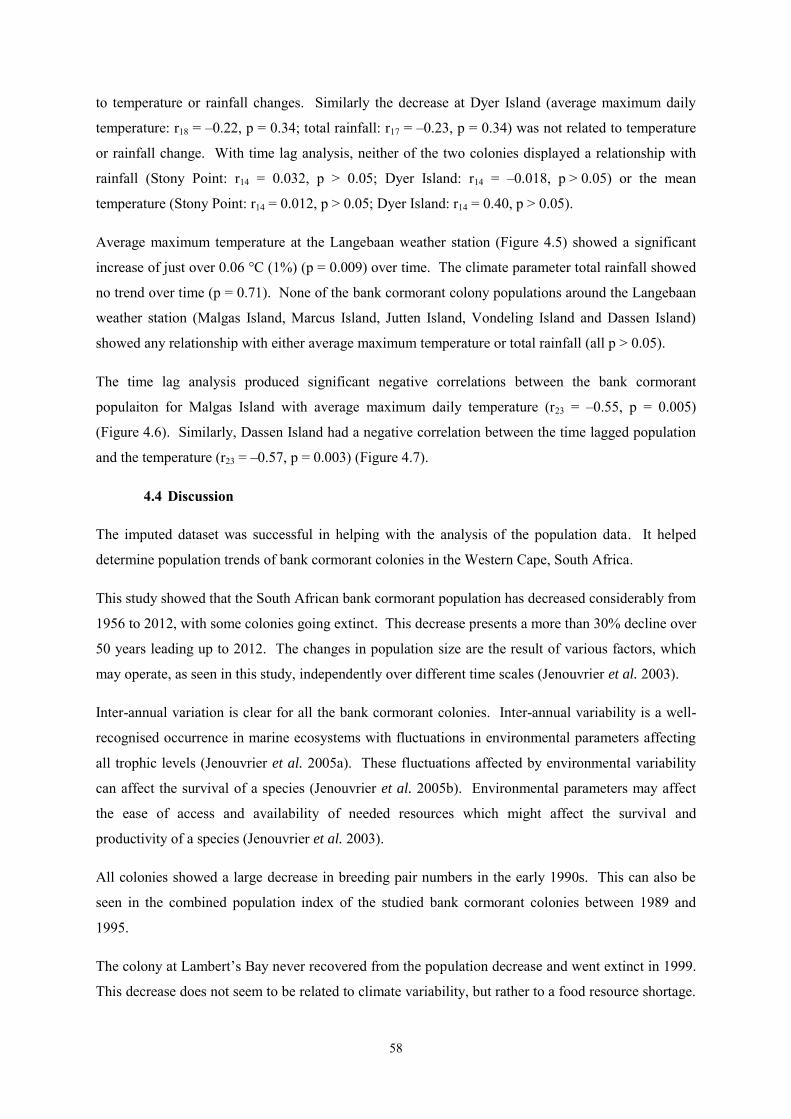
58
to temperature or rainfall changes. Similarly the decrease at Dyer Island (average maximum daily
temperature: r18 = –0.22, p = 0.34; total rainfall: r17 = –0.23, p = 0.34) was not related to temperature
or rainfall change. With time lag analysis, neither of the two colonies displayed a relationship with
rainfall (Stony Point: r14 = 0.032, p > 0.05; Dyer Island: r14 = –0.018, p > 0.05) or the mean
temperature (Stony Point: r14 = 0.012, p > 0.05; Dyer Island: r14 = 0.40, p > 0.05).
Average maximum temperature at the Langebaan weather station (Figure 4.5) showed a significant
increase of just over 0.06 °C (1%) (p = 0.009) over time. The climate parameter total rainfall showed
no trend over time (p = 0.71). None of the bank cormorant colony populations around the Langebaan
weather station (Malgas Island, Marcus Island, Jutten Island, Vondeling Island and Dassen Island)
showed any relationship with either average maximum temperature or total rainfall (all p > 0.05).
The time lag analysis produced significant negative correlations between the bank cormorant
populaiton for Malgas Island with average maximum daily temperature (r23 = –0.55, p = 0.005)
(Figure 4.6). Similarly, Dassen Island had a negative correlation between the time lagged population
and the temperature (r23 = –0.57, p = 0.003) (Figure 4.7).
4.4 Discussion
The imputed dataset was successful in helping with the analysis of the population data. It helped
determine population trends of bank cormorant colonies in the Western Cape, South Africa.
This study showed that the South African bank cormorant population has decreased considerably from
1956 to 2012, with some colonies going extinct. This decrease presents a more than 30% decline over
50 years leading up to 2012. The changes in population size are the result of various factors, which
may operate, as seen in this study, independently over different time scales (Jenouvrier et al. 2003).
Inter-annual variation is clear for all the bank cormorant colonies. Inter-annual variability is a well-
recognised occurrence in marine ecosystems with fluctuations in environmental parameters affecting
all trophic levels (Jenouvrier et al. 2005a). These fluctuations affected by environmental variability
can affect the survival of a species (Jenouvrier et al. 2005b). Environmental parameters may affect
the ease of access and availability of needed resources which might affect the survival and
productivity of a species (Jenouvrier et al. 2003).
All colonies showed a large decrease in breeding pair numbers in the early 1990s. This can also be
seen in the combined population index of the studied bank cormorant colonies between 1989 and
1995.
The colony at Lambert’s Bay never recovered from the population decrease and went extinct in 1999.
This decrease does not seem to be related to climate variability, but rather to a food resource shortage.
59
Crawford et al. (2008) stated that the bank cormorant numbers breeding at Lambert’s bay were
significantly related to rock lobster Jasus lalandii landings in fishing zones near the colony. The
extinction of the colony can also partly be attributed to the displacement of birds from their breeding
location by Cape fur seals Arctocephalus pusillus pusillus (Crawford et al. 1999).
The bank cormorant colonies at Malgas, Vondeling and Jutten Islands all showed large decreases in
the early 1990s. Since the mid-1990s, Malgas Island’s population decrease slowed down, but both the
colonies at Vondeling and Jutten Islands still showed a decrease in 2012. The decreases in the sizes
of the colonies on Maglas, Vondeling and Jutten Islands did not show any relationship with an
increase in mean annual temperature or a decrease in total annual rainfall. However, the size of the
colony at Malgas Island showed a negative correlation between the lagged effects of temperature
increase and the population trend.
This suggests that increased temperatures could affect the reproductive success of the bank cormorant
colony, leading to a decrease in the population due to less adults being recruited into the breeding
population. Sherley et al. (2012) showed that extreme temperature events killed bank cormorant
chicks in nests at Mercury Island, Namibia. Crawford et al. (1991) stated that the adult survival of
bank cormorants is expected to be about 80%. This further suggests poor recruitment to be the reason
for the population decline at Malgas Island (Crawford et al. 2008). Jenouvrier et al. (2005a) also
suggested that environmental factors influencing the recruitment of seabirds into the breeding
population may affect the population size.
The decrease in the sizes of the colonies at Jutten Island and Vondeling Island could be attributed to
the large reduction in the growth rate of rock lobster Jasus lalandii from 1985 to 1991 (Cruywagen
1997). The smaller size of rock lobsters may not be able to offer enough food resources to support
large colonies on these islands (Crawford et al. 2008a). The populations at both these islands seems
to fluctuate quite regularly. An increase in population will most likely be due to immigration by first-
time breeders (Crawford et al. 2008a) but this seems to always be followed by an even larger decrease
resulting in an overall population decrease since the late 1980 and early 1990s.
Like the rest of the West Coast colonies, the colony at Marcus Island showed a decrease in the
breeding population in the early 1990s. However, the number of breeding pairs was relatively stable
from 2003 to 2012, even displaying a slight increase after 2008 until 2012. Marcus Island therefore
seems not to be currently affected by climate change or a lack of food resources. With these results,
Crawford et al. (2008)’s conclusion is further supported, that it appears that bank cormorant offshore
islands in the Saldanha Bay on the West Coast, seem to be able to support small bank cormorant
breeding populations, even when this study suggests evidence for increased mean daily temperatures.
60
The colony at Dassen Island had a large decline in its breeding population from 1989 to1990 with a
smaller decline up until 1994, but increased again from 1994–2012. Dassen Island’s bank cormorant
colony did not show any correlation with changes in mean annual temperature or total annual rainfall
with the population numbers. The Dassen Island population did however show a negative correlation
with the lagged effect of an increase mean annual temperature on reproductive success, suggesting
that temperature change might be responsible for changes in the Dassen Island colony. However,
Crawford et al. (2008) also explained that the decrease in bank cormorant colony in the early 1990s
was related to a decline in the rock lobster population.
The breeding bank cormorant population at Robben Island showed large annual fluctuations. Overall
the colony increased since 1978 when 64 breeding pairs increased to a maximum of 148 breeding
pairs in 2011. The colony has steadily increased since 2002, with the exception of 2012. No
relationship exists between colony numbers and changes in annual temperature and rainfall (not for
direct effect or time lag analysis), suggesting that a different environmental parameter is responsible
for the increase in the cormorant population at Robben Island. The waters around Robben Island were
declared a rock lobster reserve in 1960 (Pollock 1997), resulting in no legal commercial fisheries
extracting the bank cormorant’s food resource around the island.
Breeding bank cormorant numbers at Stony Point have increased since the foundation of the colony in
1987 (Cooper 1988). Data show that the Stony Point colony has increase by more than 350% from
1996–2102. Bank cormorant population growth here was not correlated with an increase in annual
mean temperature or annual rainfall for adult survival or reproduction productivity. The bank
cormorant population here is likely not limited by food resources (Crawford et al. 2008a) and is
permanently protected from disturbance by humans and most predators (Cooper 1988), therefore an
exponential increase is not surprising. Stony Point has been colonised in spite of higher temperatures
and lower rainfall.
Dyer Island’s bank cormorant population showed an overall decline of 94% from 1956 to 2012, with
the largest decline occurring between the late 1990s and 2012. Results indicate that this decrease in
breeding numbers is not connected to a change temperature or a rainfall, but the relationship between
the population size is correlated with time lagged analysis of the climate parameters. This again
suggests that climatic events impact the breeding populations rather through an influence on fecundity
than directly on the adult survival of the species.
Overall the direct impact of climate change on adult survival of the bank cormorant showed no
significance in the bank cormorant population at either one of the colonies. Neither increased annual
mean temperature nor decreased total rainfall had a direct effect on a population count of a similar
year, even though there was a definite increase in mean annual temperature in Cape Town (Robben
Island) and all the West Coast colonies.

61
If the climate effect is most pronounced at a time lag effect of three years, it can be that offspring
production is the fitness component that responds most to climatic variability, as found by Sandvik et
al. (2012). However, unlike this study, Sandvik et al. (2012) found that both adult survival and
offspring reproduction are affected by climate change, but the effect is more pronounced for offspring
reproduction and recruitment.
When a time lag of three years was implemented (to include the delayed effect of recruitment), the
colonies that seemed to produce evidence for a relationship with an increase in temperature were the
colonies at Malgas and Dassen Islands. Both these colonies have suffered a significant decrease in
their populations since 1956. Malgas Island which supported more than 150 breeding pairs in the
1990s, had only nine breeding pairs left in 2012. Delord et al. (2004) suggested that the breeding
success of a species in one year may affect the number of breeders in years to come. This provides
evidence that if these colonies are affected by climate change, but only with a time lag of three years,
the climate changes might affect the reproductive output of that year, and therefore the size of the
population three years later. On a study of northern fulmars Fulmarus glacialis, it was similarly
found that among long-lived species, like the bank cormorant, environmental variability influences
reproductive success, and therefore climate change effects are likely to be lagged, influencing
population numbers at later years when new birds are recruited into the breeding population
(Thompson and Ollason 2001).
The colony at Dassen Island displays an overall decrease in breeding population of almost 74% from
1956 to 2012, but has shown an increase in the last 15 years of that period, in spite of a temperature
increase. This goes against the assumption that the decrease in the population at Dassen Island is
related to an increase in mean annual temperature.
4.5 Conclusions
This study provides evidence that there is a decrease in the bank cormorant population in the Western
Cape. However, this decrease is less related to climate change in this region, than previously stated in
the hypothesis, eventhough the IPCC (2013) reports that the 2000s is the warmest decade yet. The
effects of climate change on the decreasing population through adult survival was non-existent and
the lagged effects of climate change on breeding numbers was apparent for some colonies, but not for
others.
According to the life-history theory, adult survival is the most important variable life-history
parameter for long-lived seabird, and is therefore expected to be the life-history trait that will be least
affected by climate variability and change (Jenouvrier et al. 2005a). A decrease in adult survival
should have an immediate effect on a breeding population, but a decrease in fecundity will only have
a delayed effect as displayed by the lagged effect (Jenouvrier et al. 2005a). The unwillingness of

62
seabirds to risk their own survival might explain why population size changes act through seabird
recruitment rather than adult survival (Jenouvrier et al. 2005a) and why time lag analysis produce
better results than analysis of the effect of climate change directly on the adult population.
However, given the length of time series to date, we cannot exclude some of these changes with
certainty as not related to anthropogenic global warming. As none of the life-history traits of seabirds
can be excluded in determining the cause of population decline, I conclude that fluctuations in the
breeding population reflect interactions between the climate variability and the trade-off between
adult survival and reproductive effort, affected by various environmental parameters. To further
investigate this, I suggest determining long-term trends in breeding success of the bank cormorant in
relation to climate change.
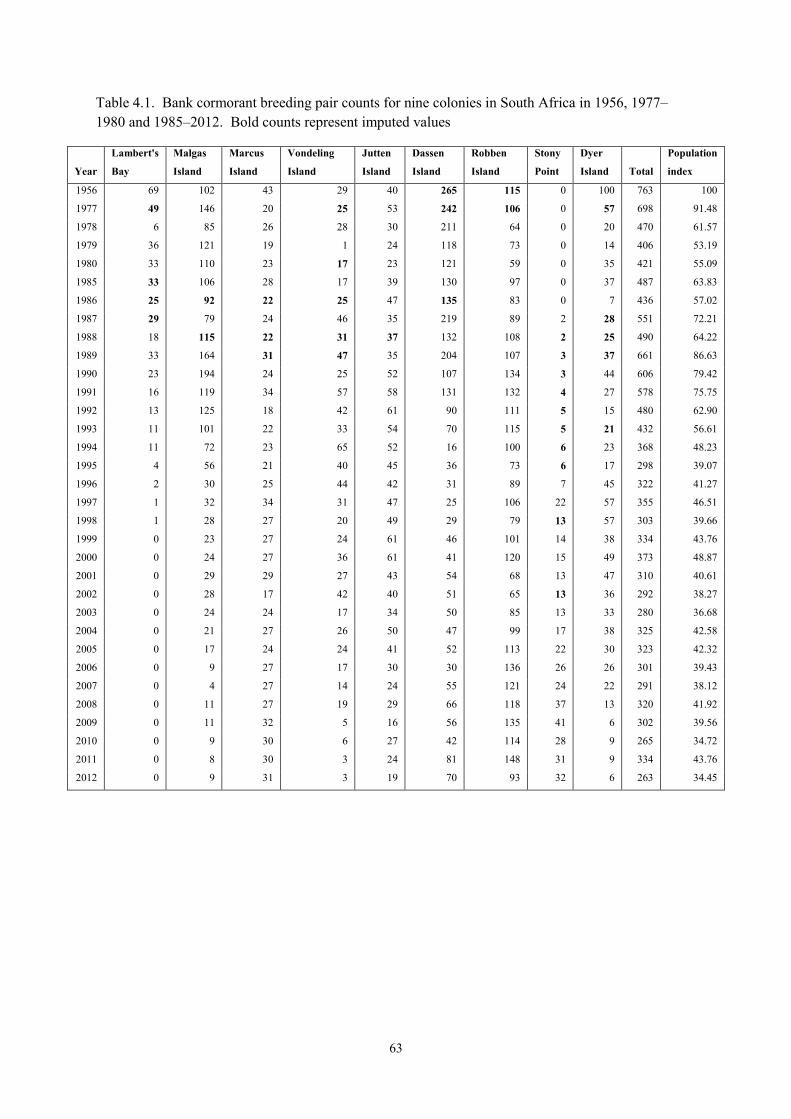
63
Table 4.1. Bank cormorant breeding pair counts for nine colonies in South Africa in 1956, 1977–1980 and 1985–2012. Bold counts represent imputed values
Year
Lambert's
Bay
Malgas
Island
Marcus
Island
Vondeling
Island
Jutten
Island
Dassen
Island
Robben
Island
Stony
Point
Dyer
Island Total
Population
index
1956 69 102 43 29 40 265 115 0 100 763 100
1977 49 146 20 25 53 242 106 0 57 698 91.48
1978 6 85 26 28 30 211 64 0 20 470 61.57
1979 36 121 19 1 24 118 73 0 14 406 53.19
1980 33 110 23 17 23 121 59 0 35 421 55.09
1985 33 106 28 17 39 130 97 0 37 487 63.83
1986 25 92 22 25 47 135 83 0 7 436 57.02
1987 29 79 24 46 35 219 89 2 28 551 72.21
1988 18 115 22 31 37 132 108 2 25 490 64.22
1989 33 164 31 47 35 204 107 3 37 661 86.63
1990 23 194 24 25 52 107 134 3 44 606 79.42
1991 16 119 34 57 58 131 132 4 27 578 75.75
1992 13 125 18 42 61 90 111 5 15 480 62.90
1993 11 101 22 33 54 70 115 5 21 432 56.61
1994 11 72 23 65 52 16 100 6 23 368 48.23
1995 4 56 21 40 45 36 73 6 17 298 39.07
1996 2 30 25 44 42 31 89 7 45 322 41.27
1997 1 32 34 31 47 25 106 22 57 355 46.51
1998 1 28 27 20 49 29 79 13 57 303 39.66
1999 0 23 27 24 61 46 101 14 38 334 43.76
2000 0 24 27 36 61 41 120 15 49 373 48.87
2001 0 29 29 27 43 54 68 13 47 310 40.61
2002 0 28 17 42 40 51 65 13 36 292 38.27
2003 0 24 24 17 34 50 85 13 33 280 36.68
2004 0 21 27 26 50 47 99 17 38 325 42.58
2005 0 17 24 24 41 52 113 22 30 323 42.32
2006 0 9 27 17 30 30 136 26 26 301 39.43
2007 0 4 27 14 24 55 121 24 22 291 38.12
2008 0 11 27 19 29 66 118 37 13 320 41.92
2009 0 11 32 5 16 56 135 41 6 302 39.56
2010 0 9 30 6 27 42 114 28 9 265 34.72
2011 0 8 30 3 24 81 148 31 9 334 43.76
2012 0 9 31 3 19 70 93 32 6 263 34.45
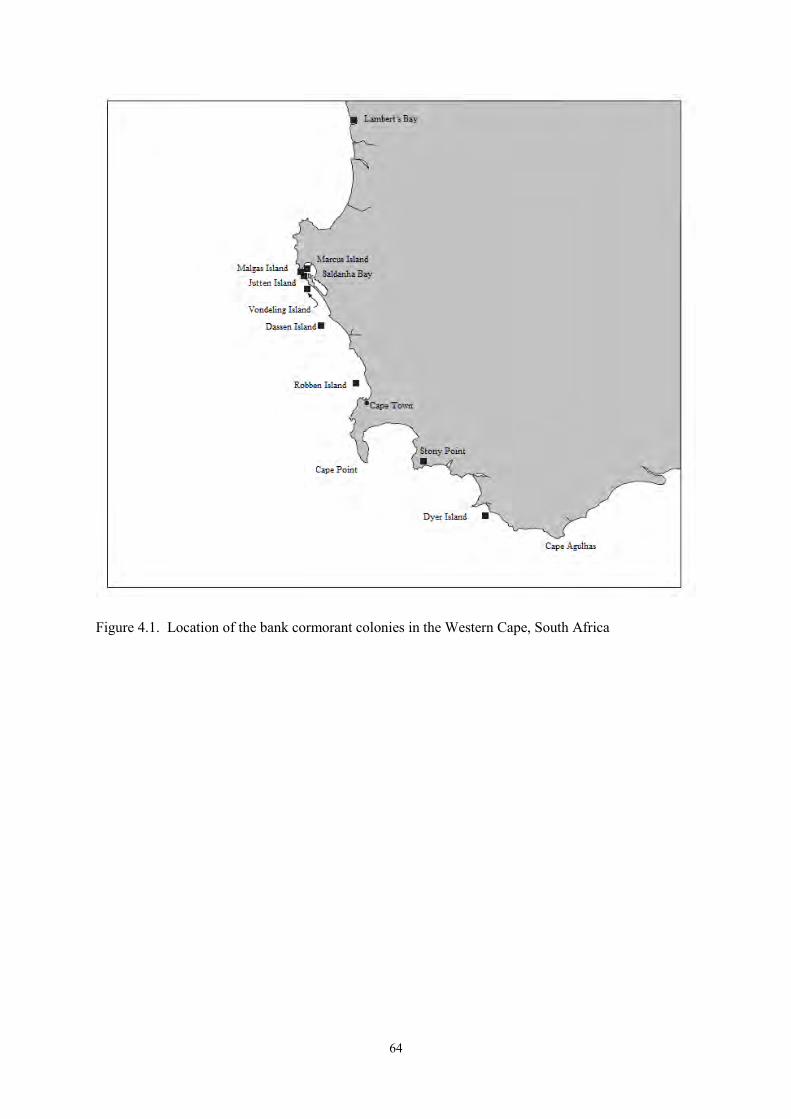
64
Figure 4.1. Location of the bank cormorant colonies in the Western Cape, South Africa
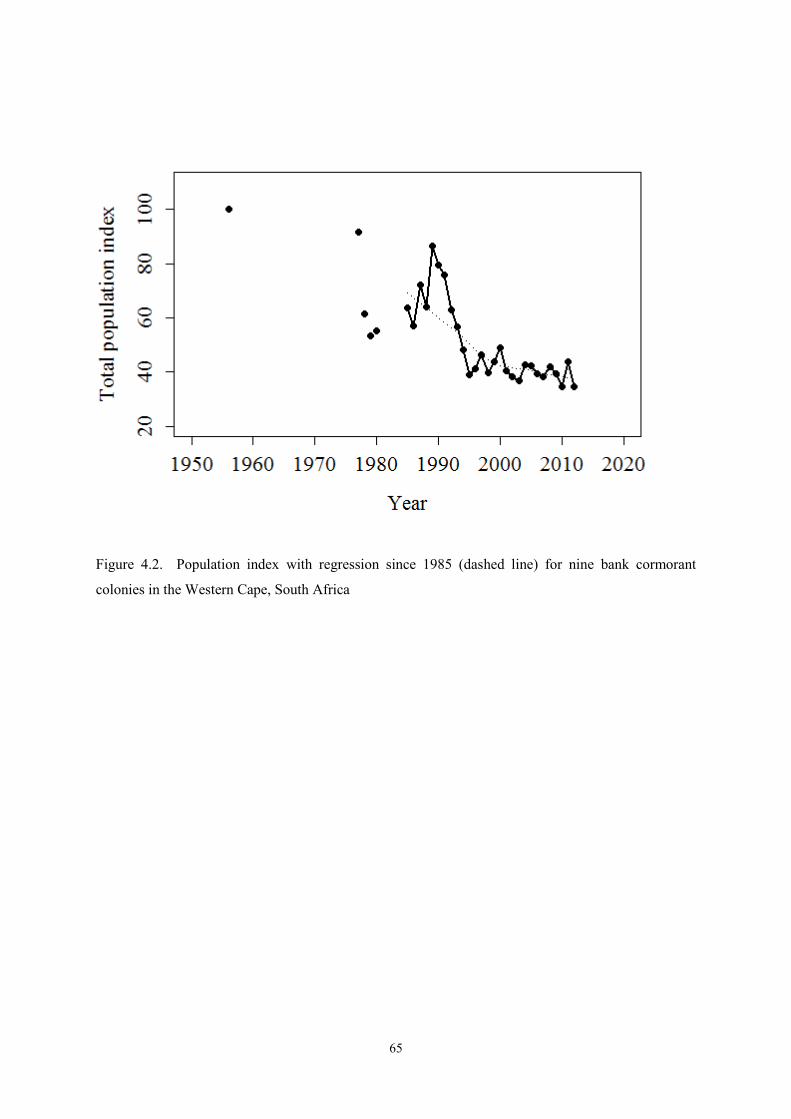
65
Figure 4.2. Population index with regression since 1985 (dashed line) for nine bank cormorant
colonies in the Western Cape, South Africa
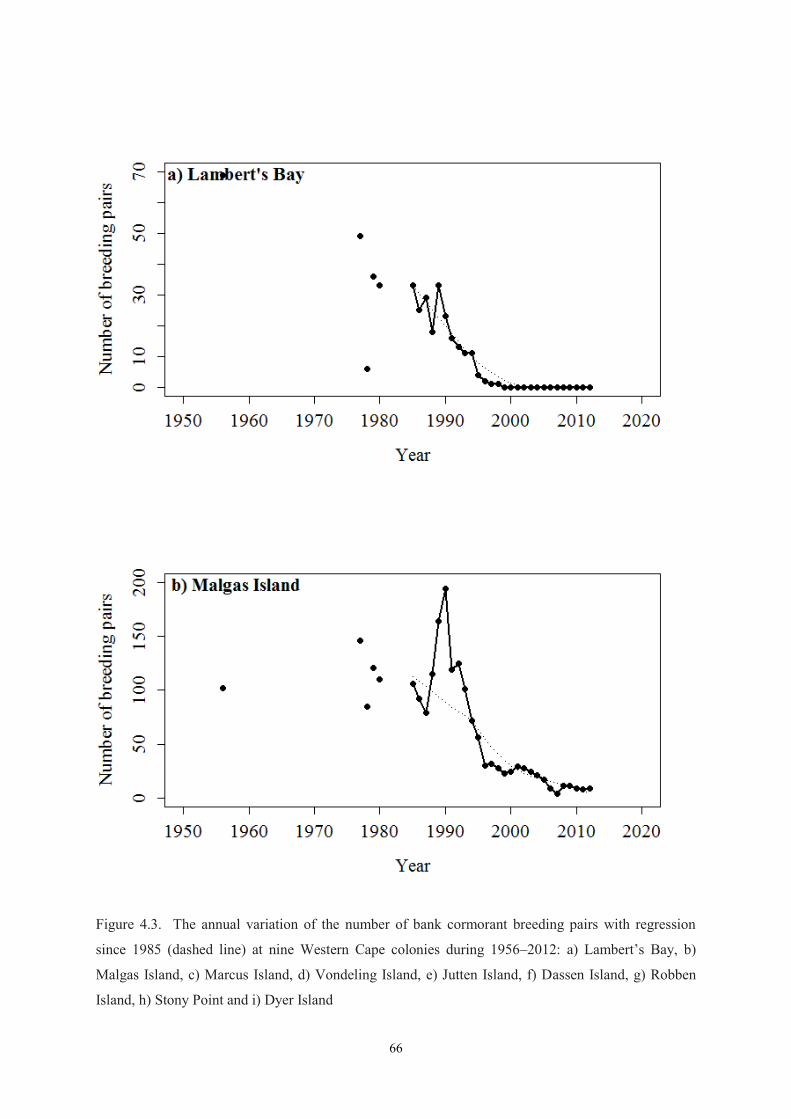
66
Figure 4.3. The annual variation of the number of bank cormorant breeding pairs with regression
since 1985 (dashed line) at nine Western Cape colonies during 1956–2012: a) Lambert’s Bay, b)
Malgas Island, c) Marcus Island, d) Vondeling Island, e) Jutten Island, f) Dassen Island, g) Robben
Island, h) Stony Point and i) Dyer Island
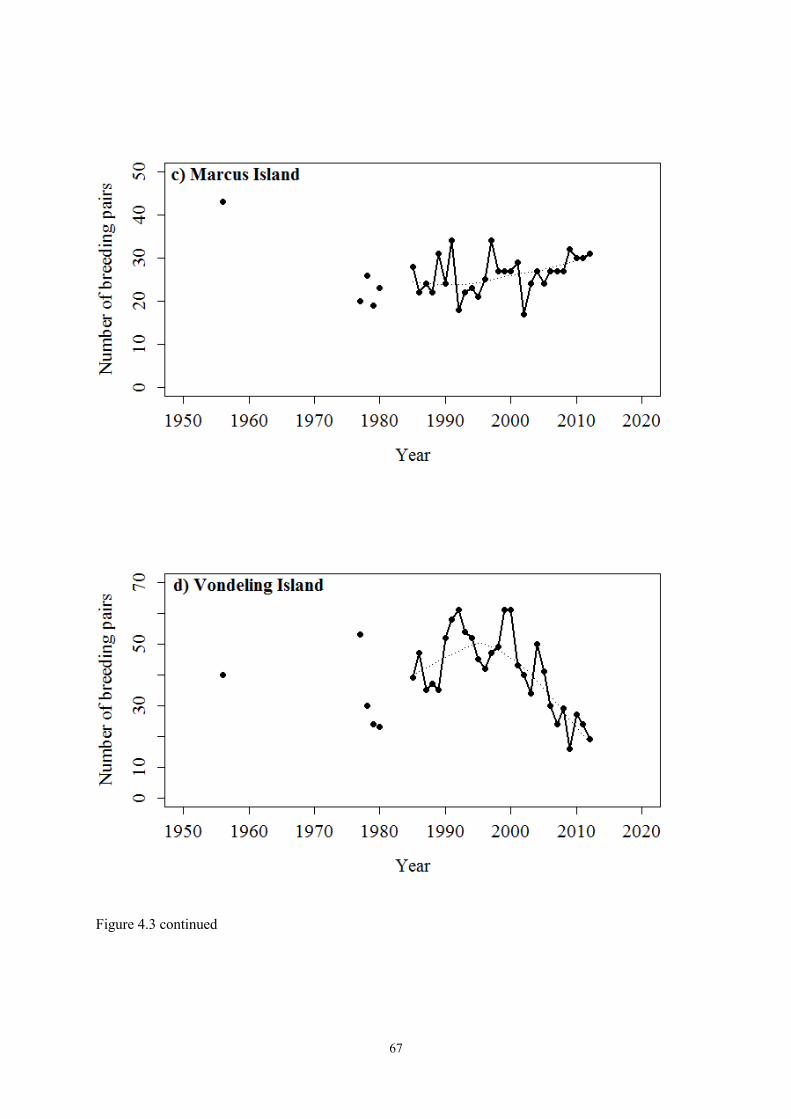
67
Figure 4.3 continued
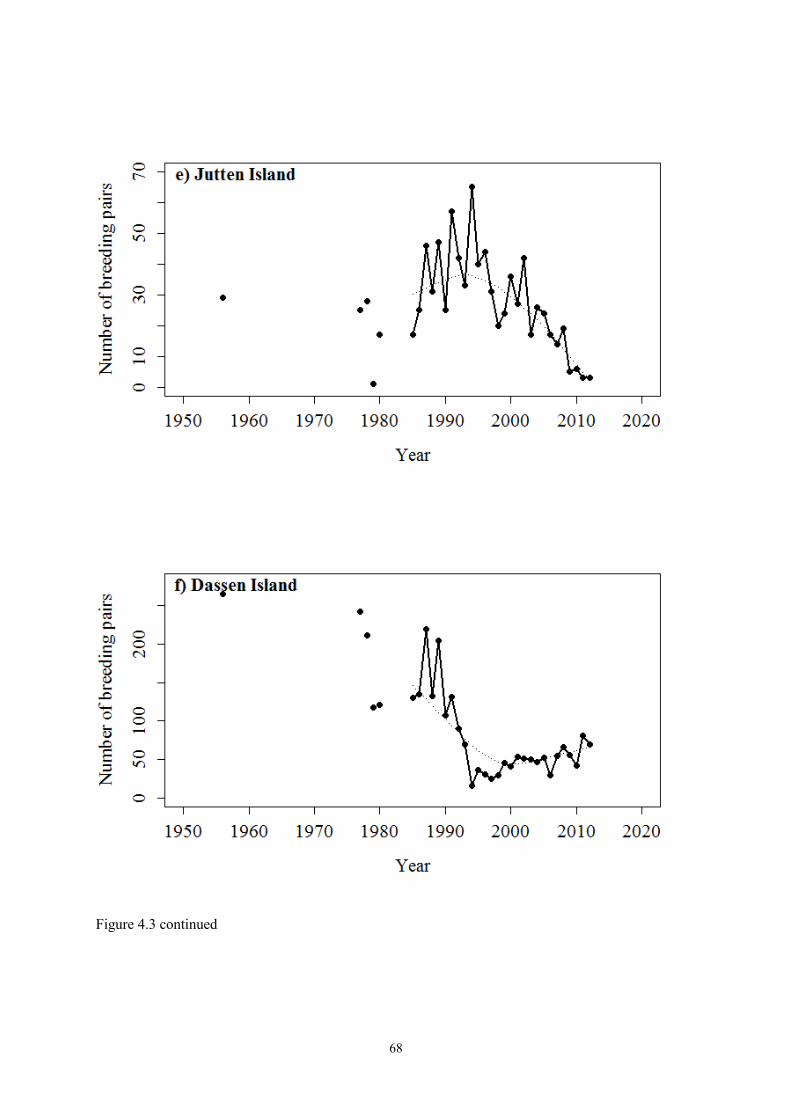
68
Figure 4.3 continued
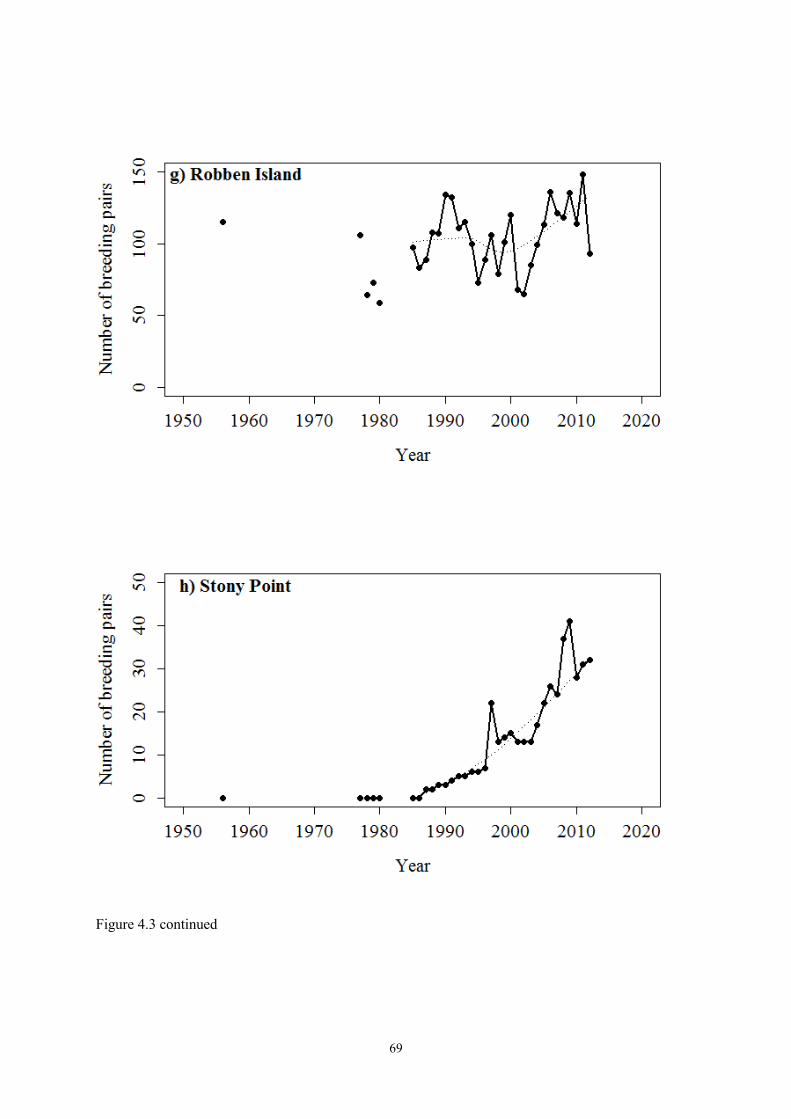
69
Figure 4.3 continued

70
Figure 4.3 continued
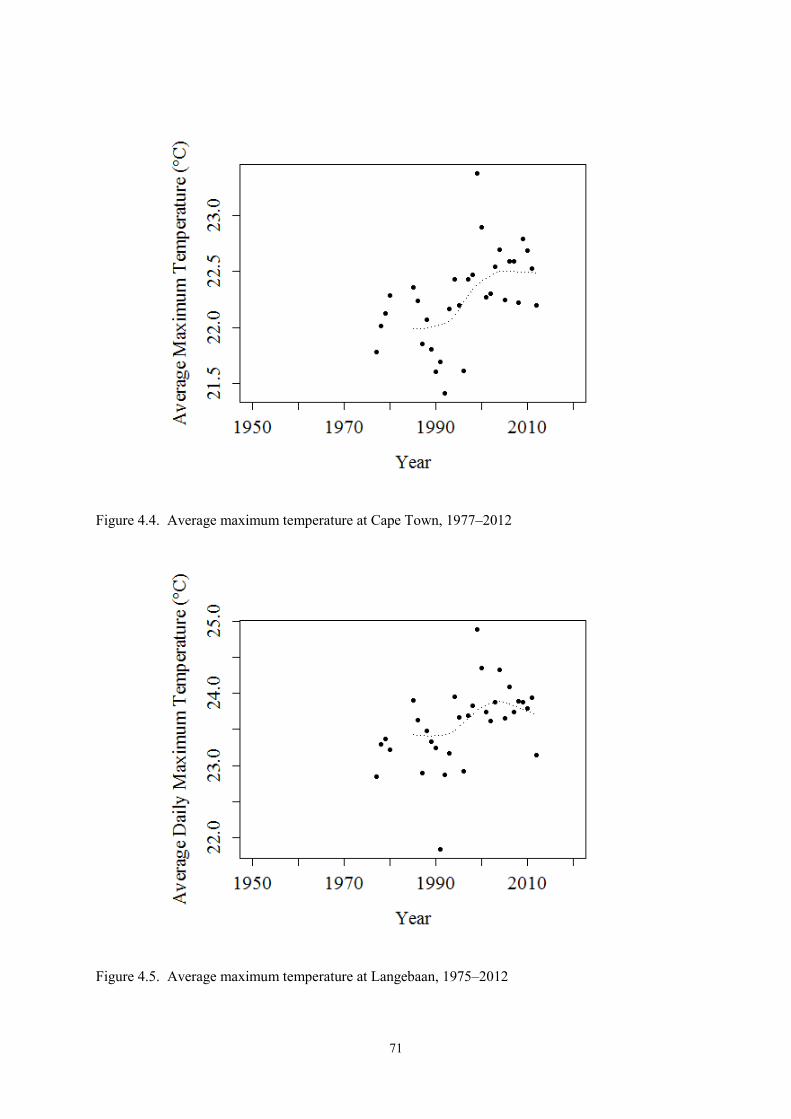
71
Figure 4.4. Average maximum temperature at Cape Town, 1977–2012
Figure 4.5. Average maximum temperature at Langebaan, 1975–2012
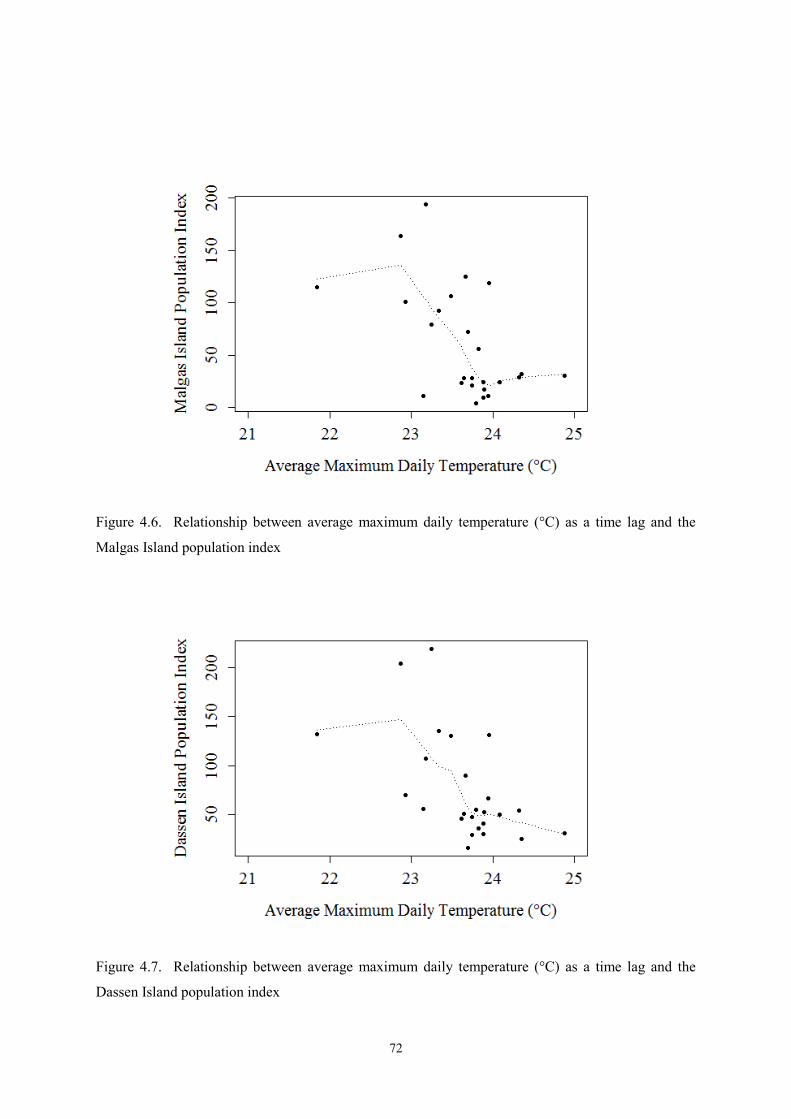
72
Figure 4.6. Relationship between average maximum daily temperature (°C) as a time lag and the
Malgas Island population index
Figure 4.7. Relationship between average maximum daily temperature (°C) as a time lag and the
Dassen Island population index
73
Summary and conclusions
It is clear that the bank cormorant’s population is declining, and that many bank cormorant colonies in
the Western Cape are under threat of extinction. The colony at Lambert’s Bay (Bird Island) has
locally extinct since1999. Populations at Dyer, Vondeling, Malgas and Jutten Islands were still
declining at the end of this study in 2013, while the populations at Robben, Dassen and Marcus
Islands and Stony Point seem to be increasing in numbers. In South Africa, not all smaller bank
cormorant colonies are in protected areas and human access can be easily gained (du Toit et al. 2002).
Therefore it is of great importance for conservation management to realize that the larger portion of
the bank cormorant population is concentrated at only a few colonies and to prevent further decline of
the population by securing these colonies.
Most previous studies focused on the indirect effect of climate change on seabird populations, rather
than the direct effects (Oswald and Arnold 2012). There are clear indications that climate change is
occurring and will continue to accelerate in the future, and that it has direct and indirect effects on
seabirds (IPCC 2007). Climate change in itself can be difficult to model and predict and even more
difficult to manage (Young et al. 2012). This research aimed to identify the impact of direct climatic
variability on the population and breeding parameters of the bank cormorant. To summarise, the
research found evidence that the population dynamics of bank cormorants is affected by climatic
variability on nest survival, but likely not through direct impacts of climate change on adult mortality,
resulting in direct population decline. The patterns we observed can lead to several predictions on
how climate change might affect the population of the bank cormorant in the future.
Under the current climatic conditions, the breeding bank cormorant seems to be able to adequately
thermoregulate during periods of high or extreme temperatures. During the filming analysis, no birds
actively sitting on a nest were observed leaving the nest when experiencing high heat loads. These
current observations are further supported by the result that failures during the breeding period did not
seem to be affected by increasing mean maximum temperatures.
The relationship between bank cormorant breeding success and environmental variables has been
documented in this study and it does suggest that there are certain climatic variables that influence the
breeding success of the bank cormorant. Understanding this relationship is vital for the survival of
this species. These include increased wind speeds and increased wave heights and both seem to be
related to storm events. The relationship between increased wind speed and bigger wave action and
breeding success suggest that the frequency of these events could have detrimental effects on the
future reproductive output of this species. Extreme events, like storms, are predicted to become more
frequent with future climate changes and this increased climatic variability is expected to affect not
only the bank cormorant’s breeding success, but most marine ecosystems (Frederiksen et al. 2008).
74
Climate change impacts processes related to fecundity and survival (Watkinson et al. 2004). It is
assumed that, where breeding habitats of seabirds are not disturbed by anthropogenic activities or
environmental variability, bird populations will remain relatively stable over a long period
(Micol and Jouventin 2001). Bank cormorants, however, are very susceptible to human disturbance.
At colonies where anthropogenic activity is high, the breeding site might be confined to a small space,
more exposed to weather elements and restricted to lower lying areas closer to the water.
Management efforts should therefore focus on limiting human disturbance and development at
breeding locations (du Toit et al. 2002) and expanding breeding locations with artificial structures
because the bank cormorant colony, at Robben Island, breeding on manmade breakwaters is relatively
stable (Sherley et al. 2012).
However, where changes in nesting success and mortality occur during the breeding season, it can be
difficult to distinguish if they result from the impact of climate or the impact of fishing
(Duffy and Schneider 1994). This is a shortcoming in this study, and I suggest further research in
combining the impact of these two variables on the breeding success of the cormorant. Researchers
need to understand the effect of both changes in the physical environment and food resources at
different stages of a seabird’s lifecycle in order to predict long-term consequences of this change
(Croxall et al. 2002). Oswald and Arnold (2012) suggest that detailed studies of the breeding success
and adult survival that examine the importance of thermal stress on a species should also incorporate
the indirect climate effects. This integration of effects will enhance our abilities to pinpoint all the
variables responsible for the decline of the bank cormorant and help us understand the changes of
other seabird populations as a result of variable climate.
Climate change will most likely make weather variables an increasingly important factor in the
reproduction effort of seabirds (Boersma and Rebstock 2014) and to conclude, it seems like a long-
term monitoring programme is needed to better understand the impact of environmental variables on
the population dynamics and breeding success of the bank cormorant population in the Western Cape,
South Africa.
75
References
Abrams, R.W. and Griffiths, A.M. 1981. Ecological structure of the pelagic seabird community in the
Benguela Current region. Marine Ecology Progress Series 5: 269–277
Adams, N.J., Seddon, P.J. and van Heezik, Y.M. 1992. Monitoring of seabirds in the Benguela
Upwelling System: can seabirds be used as indicators and predictors of change in the marine
environment? South African Journal of Marine Science 2: 959–974
Aebischer, N.J. 1999. Immediate and delayed effects of a gale in late spring on the breeding of the
shag Phalacrocorax aristotelis. Ibis 135: 225–232
Amat, J.A. and Masero, J.A. 2004. How Kentish plovers, Charadrius alexandrinus, cope with heat
stress during incubation. Behavioural Ecology and Sociobiology 56: 26–33
Arntz, W.E., Gallardo, V.A., Gutiérrez, D., Isla, E., Levin, L.A., Mendo, J., Neira, C., Rowe, G.T.,
Tarazona, J. and Wolff, M. 2006. El Niño and similar perturbation effects on the benthos of the
Humboldt, California, and Benguela Current upwelling system. Advances in
Geosciences 6: 243–265
Baird, P.H. 1990. Influence of abiotic factors and prey distribution on diet and reproductive success of
three seabird species in Alaska. Ornis Scandinavica 21: 225–235
Bakken, G.S. 1992. Measurement and application of operative and standard operative temperatures in
ecology. American Zoology 32: 194–216
Bakken G.S., Santee, W.R. and Erskine, D.J. 1985. Operative and standard operative temperature:
tools for thermal energetics studies. American Zoology 25: 933–943
Bartlett, P.A., Roux, J., Jones, R and Kemper, J. 2003. A new mainland breeding locality for African
penguins, bank and crowned cormorants on the Namib Desert coast. Ostrich 74: 222–225
Bartholomew, G.A. 1966. The role of behaviour in the temperature regulation of the masked booby.
Condor 68: 523–535
Bartholomew, G.A. and Dawson, W.R. 1979. Thermoregulatory behaviour during incubation in
Heermann’s gulls. Physiological Zoology 52: 422–437
Bartholomew, G.A., Lasiewski, R.C. and Crawford, E.C. 1968. Patterns of panting and gular flutter in
cormorants, pelicans, owls and doves. Condor 70:31–34
Berruti, A. 1995. Resident seabirds. In: Payne, A.I.L. and Crawford, R.J.M. (Eds). Oceans of life of
southern Africa. 2nd Edition. Vlaeberg, Cape Town, South Africa
76
BirdLife International. 2013. IUCN Red List of Threatened Species. Version 2013.1. IUCN.
Downloaded: 8 June 2013. http://www.iucnredlist.org
Blumstein, D.T., Evans, C.S. and Daniels, J.C. 2000. JWatcher. Animal Behaviour Laboratory, v. 0.9.
Macqueri University, Sydney, Australia
Boersma, P.D. and Rebstock G.A. 2014. Climate change increases reproductive failure in magellanic
penguins. PLoS ONE 9: e85602
Bolger, D.T., Patten, M.A. and Bostock, D.C. 2005. Avian reproductive failure in response to an
extreme climatic event. Oecologia 142: 398–406
Boyles, J.G., Seebacher, F., Smit, B. and McKechnie, A.E. 2011. Adaptive thermoregulation in
endotherms may alter responses to climate change (Symposium). Integrative and Comparative
Biology 51: 676–690
Braby, J., Braby, S.J., Braby, R.J. and Altwegg, R. 2012. Annual survival and breeding dispersal of a
seabird adapted to a stable environment: implications for conservation. Journal of
Ornithology 153: 809–816
Bunce, A., Norman, F.I., Brothers, N. and Gales, R. 2002. Long-term trends in the Australasian
gannet (Morus serrator) population in Australia: the effect of climate change and commercial
fisheries. Marine Biology 141: 263–269
Chastel O., Weimerskirch, H. and Jouventin, P. 1993. High annual variability in reproductive success
and survival of an Antarctic seabird, the snow petrel Pagodroma nivea. A 27-year study.
Oecologia 94: 278–285
Clark, B.M. 2008. Climate change: a looming challenge for fisheries management in southern Africa.
Marine Policy 30: 84–95
Crawford, R.J.M. 2007. Food, fishing and seabirds in the Benguela upwelling system. Journal of
Ornithology 48: S253–S260
Crawford, R.J.M. and Altwegg, R. 2009. Seabirds and climate change in southern Africa – some
considerations. In: Harebottle, D.M., Craig, A.F.J.K., Anderson, M.D., Rakotomanana, H. and
Muchai, M. (Eds). Proceedings of the 12th Pan-African Ornithological Congress, 2008. Animal
Demography Unit, Cape Town, South Africa
77
Crawford, R.J.M., Cockcroft, A.C., Dyer, B.M. and Upfold, L. 2008a. Divergent trends in bank
cormorants Phalacrocorax neglectus breeding in South Africa’s Western Cape consistent with
a distributional shift of rock lobsters Jasus lalandii. African Journal of Marine
Science 30: 151–155
Crawford, R.J.M. and Cooper, J. 2003. Conserving surface-nesting seabirds at the Prince Edward
Islands: the roles of research, monitoring and legislation. African Journal of Marine
Science 25: 415–426
Crawford, R.J.M and Cooper J. 2005. Bank cormorant Phalacrocorax neglectus. In: Hockey, P.A.R.,
Dean, W.R.J. and Ryan P.G. (Eds). Roberts: Birds of Southern Africa. Trusteess of the John
Voelcker Bird Book Fund. Cape Town, South Africa
Crawford, R.J.M., Dyer, B.M., Cordes, I. and Williams, A.J. 1999. Seasonal pattern of breeding,
population trend and conservation status of bank cormorants Phalacrocorax neglectus off south
western Africa. Biological Conservation 87: 49–58
Crawford, R.J.M., Dyer, B.M., Kotze, P.G.H., McCue, S., Meÿer, M.A., Upfold, L. and Makhado,
A.B. 2012. Status of seabirds breeding in South Africa in 2011. Branch Oceans & Coasts,
Department of Environmental Affairs, Cape Town, South Africa
Crawford, R.J.M, Dyer, B.M., Upfold, L. and Ward, V.L. 2001. Age at first breeding of bank
cormorants Phalacrocorax neglectus, and Cape cormorants, P. capensis. Ostrich 7: 145–148
Crawford R.J.M., Sabarros, P.S., Fairweather, T., Underhill, L.G. and Wolfaardt, A.C. 2008b.
Implications for seabirds of South Africa of a long-term change in the distribution of sardine.
African Journal of Marine Science 30: 177–184
Croxall, J.P., Trathan, P.N. and Murohy, E.J. 2002. Environmental change and Antarctic seabird
populations. Science 297: 1510–1514
Cooper, J. 1981. Biology of the bank cormorant, part 1: distribution, population size, movements and
conservation. Ostrich 52: 208–215
Cooper, J. 1985a. Biology of the bank cormorant, part 2: morphometrics, plumage, bare parts and
moult. Ostrich 56: 79–85
Cooper, J. 1985b. Biology of the bank cormorant, part 3: foraging behaviour. Ostrich 56: 86–95
Cooper, J. 1986. Biology of the bank cormorant, part 4: nest construction and characteristics.
Ostrich 57: 170–179
78
Cooper, J. 1987. Biology cormorant of the bank, part 5: clutch size, eggs and incubation.
Ostrich 58: 1–8
Crick, H.Q.P. 2004. The impact of climate change on birds. Ibis 146: 48–56
Cruywagen G.C. 1997. The use of generalized linear modelling to determine inter-annual and inter-
area variation of growth rates: The Cape rock lobster as an example. Fisheries
Research 29: 119–131
Cury, P. and Shannon, L. 2004. Regime shifts in upwelling ecosystems: observed changes and
possible mechanisms in the northern and southern Benguela. Progress in
Oceanography 60: 223–243
David, J.M., Cury, P., Crawford, R.J.M., Randall, R.M., Underhill, L.G. and Meÿer, M.A. 2003.
Assessing conservation priorities in the Benguela ecosystem, South Africa: analysing predation
by seals on threatened seabirds. Biological Conservation 114: 289–292
Delord, K., Barbraud, C. and Weimerskirch, H. 2004. Long-term trends in the populations size of the
king penguin at Crozet archipelago: environmental variability and density dependence? Polar
Biology 27: 793–800
Downs, C.T. and Ward, D. 1997. Does shading behaviour of incubation shorebirds in hot
environments cool the eggs or the adults? Auk 14: 717–724
Duffy, D.C. and Schneider, D.C. 1994. Seabird-fishery interactions: a manager’s guide. BirdLife
Conservation Series 1: 26–38
Durant, J.M., Stenseth, N.C., Anker-Nilssen, T., Harris, M.P., Thompson, P.M. and Wanless, S. 2004.
Marine birds and climate fluctuation in the North Atlantic. In: Stenseth, N.C., Otterson, G.,
Hurrel, J.W. and Belgrano, A. (Eds). Marine ecosystems and climate variation. Oxford
University Press, Oxford, UK
du Toit, M., Boere, G.C., Cooper, J., de Villiers, M.S., Kemper, J., Lenten. B., Simmons, R.E.,
Underhill, L.G. and Whittington, P.A. (Eds). 2002. Conservation assessment and management
plan for southern African coastal seabirds. Avian Demography and Conservation Breeding
Specialist Group. Cape Town and Apple Valley
Erni, B., Bonnevie, B.T., Oschadleus, H., Altwegg, R. And Underhill, L.G. 2013. Moult: an R
pacakage to analyze moult in birds. Jounral of Statistical Software 52: 1–23
Fortran Working Group. 2003. The new features of Fotran 2003. Downloaded: 5 April 2014.
ftp://ftp.nag.co.uk/sc22wg5/N1551-N1600/N1579.pdf
79
Frederiksen, M., Daunt, F., Harris, M.P. and Wanless, S. 2008. The demographic impact of extreme
events: stochastic weather drives survival and population dynamics in a long-lived seabird.
Journal of Animal Ecology 77: 1020–1029
Frost, P.G.H., Siegfried, W.R. and Burger, A.E. 1976. Behavioural adaptations of the Jackass
penguin, Spheniscus demersus to a hot, arid environment. Journal of Zoology 179: 165–187
Gaston, A.J., Bertram, D.F., Boyne, A.W., Chardine, G.D., Diamond, A., Hedd, A.P., Montevecchi,
W.A., Hipfner, J.M., Lemon, M.J.F., Mallory, M.L., Rail, J. and Robertson, G.J. 2009. Changes
in Canadian seabird populations since 1970 in relation to changes in oceanography and food
webs. Environmental Reviews 17: 267–286
Green, R.E. 1999. Applications of large-scale studies of demographic rates to bird conservation. Bird
Study 46: 279–288
Gregory, R.D., Willies, S.G., Jiquet, F., Voříšek, P., Klvaňová, A., van Strien, A., Huntley, B.,
Collingham, Y.C., Couvet, D. and Green, R.E. 2009. An indicator of the impact of climatic
change on European seabird populations. PLoS ONE 4: e4678
Grémillet, D. and Boulinier, T. 2009. Spatial ecology and conservation of seabirds facing global
climate change: a review. Marine Ecology Progress Series 391: 121–137
Grémillet, D., Chauvin, C., Wilson, R.P., le Maho, Y. and Wanless, S. 2005. Unusual feather structure
allows partial plumage wettability in diving great cormorants Phalacrocorax carbo. Journal of
Avian Biology 36: 57–63
Hansen, J., Sato, M., Ruedy, R., Lo, K., Lea, D.W. and Martin-Elizade, M. 2006. Global temperature
change. Proceedings for the National Academy of Science 103: 14288–14293
Hochscheid, S., Grémillet, D., Wanless, S. and du Plessis, M.A. 2002. Black and white under the
South African sun: are juvenile Cape gannets heat stressed? Journal of Thermal
Biology 27: 325–332
Hughes, L. 2000. Biological consequences of global warming: is the signal ready. Trends in Ecology
and Evolution 15: 56–61
Hunt Jr, G.L., and Schneider, D.C. 1987. Scale-dependant processes in the physical and biological
environment of marine birds. In: Croxall, JP. (Eds.). Seabirds feeding ecology and role in
marine environment. Cambridge University Press, Cambridge, UK
80
Intergovernmental Panel on Climate Change (IPCC). 2001. Climate Change 2001: Impacts,
Adaptation and Vulnerability of Working Group II to the Third Assessment Report of the
Intergovernmental Panel on Climate Change. McCarthy, J.J., Canziani, O.F., Leary, N.A.,
Dokken, D.J., White, K.S. (Eds). IPCC, Cambridge University Press, Cambridge, UK
Intergovernmental Panel on Climate Change (IPCC). 2007. Climate Change 2007: Synthesis Report.
Contribution of Working Groups I, II and III to the Fourth Assessment Report of the
Intergovernmental Panel on Climate Change. Pachauri, R.K. and Reisinger, A. (Eds). IPCC,
Geneva, SwitzerlandIntergovernmental Panel on Climate Change (IPCC). 2013. Working
Group I Contribution to the IPCC Fifth Assessment Report. Climate Change 2013: The
Physical Science Basis. Stocker, T.F., Qin, D., Plattner, G., Tignor, M.M.B., Allen, S.K.,
Boschung, J., Nauels, A., Xia, Y., Bex, V. and Midgley, P.M. (Eds). Cambridge University
Press, Cambridge, UK
Jenouvrier, S., Barbraud, C., Cazelles, B. and Weimerskirch, H. 2005a. Modelling population
dynamics of seabirds: importance of climatic fluctuations on breeding proportions.
Oikos 108: 511–522
Jenouvrier, S., Barbraud, C., and Weimerskirch, H. 2003. Effect of climate variability on the temporal
population dynamics of southern fulmars. Journal of Animal Ecology 72: 576–587
Jenouvrier, S., Barbraud, C. and Weimerskirch, H. 2005b. Long-term contrasted responses to climate
of two Antarctic seabird species. Ecology 86: 2889–2903
Jouventin, P. and Weimerskirch H. 1991. Changes in the population size and demography of southern
seabirds: management implcations. In: Perrins, C.M., Lebreton, J.D. and Hirons, G.J.M. (Eds).
Bird population studies, relevance to conservation and management (Oxford Ornithology
Series). Oxford University Press, Oxford, UK
Kearny, M.R. 2011. Prizing open a black box to understand climatic constraints on seabirds. Journal
of Biogeography 38: 417–418
Kemper, J., Underhill, L.G., Crawford, R.J.M. and Kirkman, S.P. 2007. Revision of the conservation
status of seabirds and seals breeding in the Benguela Ecosystem. In: Kirkman, S.P. (Ed). Final
report of the BCLME (Benguela Current Large Marine Ecosystem) project on top predators as
biological indicators of ecosystem change in the BCLME. Avian Demography Unit, Cape
Town, South Africa
Kruger, A.C. and Sekele, S.S. 2013. Trends in extreme temperature indices in South Africa: 1962–
2009. International Journal of Climatology 33: 661-676
81
Lasiewski, R.C. and Snyder, G.K. 1969. Responses to high temperature in nestling double-crested and
pelagic cormorants. Auk 86: 529–540
Lemoine, N. 2005. Influence of habitat and climate change on European bird communties. PhD
dissertation. Johannes Gutenberg University of Mainz, Mainz
Lewison, R., Oro, D., Godley, B.J., Underhill, L.G., Bearshop, S., Wilson, R.P., Ainley, D., Arcos,
J.M., Boersma, P.D., Borboroglu, P.G., Boulinier, T., Frederiksen, M., Genovart, M.,
González-Solíz, J., Green, J.A., Grémillet, D., Hamer, K.C., Hilton, G.M., Hyrenbach, K.D.,
Martínes-Abraín, A., Montevecchi, W.A., Phillips, R.A., Ryan, P.G., Sagar, P., Sydeman, W.J.,
Wanless, S., Watanuki, Y., Weimerskirch, H. and Yorio, P. 2012. Research priorities for
seabirds: improving conservation and management in the 21st century. Endangered Species
Research 17: 93–121
Ludynia, K. 2007. Identification and characterisation of foraging areas of seabirds in upwelling
systems: biological and hydrographic implications for foraging at sea. PhD dissertation.
Forschungs- u. Technologiezentrum Westküste der Christian-Albrecht-Universität, Germany
Ludynia, K., Jones, R., Kempet, J., Garthe, S. and Underhill, L.G. 2010. Foraging behaviour of the
bank cormorants in Namibia: implications for conservation. Endangered Species Research 12:
31–40
Makhado, A.B., Crawford, R.J.M. and Underhill, L.G. 2006. Impact of predation of Cape fur seals
Arctocephalus pusillus pusillus on Cape gannets Morus capensis at Malgas Island, Western
Cape, South Africa. African Journal of Marine Science 28: 681–687
Makhado A.B., Dyer, B.M., Fox, R., Geldenhuys, D., Pichegru, L., Randall, R.M., Sherley, R.B.,
Upfold, L., Visagie, J., Waller, L.J., Whittington, P.A. and Crawford, R.J.M. 2013. Estimates of
numbers of twelve seabird breeding in South Africa, updated to include 2012. Branch Oceans
and Coasts. Department of Environmental Affairs. Cape Town. South Africa
Mallory, M.L., Gaston, A.J., Forbes, M.R. and Gilchrist, G. 2009a. Influence of weather on
reproductive success on northern fulmars in the Canadian high Arctic. Polar Biology 32: 529–
538
Mallory, M.L., Gaston, A.J. and Gilchrist, G. 2009b. Source of breeding season mortality in Canadian
Arctic seabirds. Arctic 62: 333–341
Mayfield, H. 1961. Nest success calculated from nest exposure. Wilson Bulletin 73: 255–261
Mayfield, H. 1975. Suggestions for calculating nest success. Wilson Bulletin 87: 456–466
82
Moreno, J. and Møller, A.P. 2011. Extreme climatic events in relation to global change and their
impacts on life histories. Current Zoology 57: 375–389
Nettleship, D.N. 1972. Breeding success of the common puffin (Fratercula arctica L.) on different
habitat at Great Island, Newfoundland. Ecological Monographs 42: 239–268
Nur, N. and Sydeman, W.J. 1991. Survival, breeding probability and reproductive success in relation
to population dynamics of Brandt’s cormorants Phalacrocoracs penicillatus. Bird Study 46:
92–103
Oswald S.A. and Arnold, J.M. 2012. Direct impacts of climatic warming on heat stress in endothermic
species: seabirds as bioindicators of changing thermoregulatory constraints. Integrative
Zoology 7: 121–136
Pierce, A.J. and Pobprasert, K. 2007. A portable system for continuous monitoring of bird nest using
digital video recorders. Journal of Field of Ornithology 78: 322–328
Pollock, D.E. 1987 Simulation models of öock-lobster populations from areas of widely divergent
yields on the Cape west coast. South African Journal of Marine Science 5: 531–545
R Development Core Team. 2009. R: a language and environment for statistical computing. R
Foundation for Statistical Computing, Vienna
Ramos, J.A., Maul, A.M., Ayrton, V., Bullock, I., Hunter, J., Bowler, J., Castle, G., Mileot, R. and
Pacheco, C. 2002. Influence of local and large-scale weather events and timing of breeding on
tropical roseate tern reproductive parameters. Marine Ecology Progress Series 243: 271–279
Randall, R.M. 1995. Jackass Penguins. In: Payne, A.I.L. and Crawford, R.J.M. (Eds). Oceans of life
off Southern Africa. 2nd Edition. Vlaeberg, Cape Town, South Africa.
Ribic, C.A. and Ainley, D.G. 1997. The relationship of seabird assemblages to physical habitat
features in Pacific equatorial waters during spring 1984–1991. ICES Journal of Marine
Science 54: 593–599
Rönkä, M.T.H., Saari, C.L.V., Lahikoinen, E.A. Suomela, J. and Häkkilä, K. 2005. Environmental
changes and population trends of breeding waterfowl in northern Baltic Sea. Annales Zoologici
Finnici 42: 587–602
Roy, C., Weeks, S., Rouault, M., Nelson, G., Barlow, R. and van der Lingen, C. 2001. Extreme
oceanographic events recorded in the Southern Benguela during the 1999–2000 summer
seasons. South African Journal of Science 97: 465–471
83
Salzman, A.G.. 1982. The selective importance of heat stress in gull nest location. Ecology 63: 742–
751
Sandvik, H., Erikstad, K.E., Barrett, R.T. and Yoccoz, N.G. 2005. The effect of climate on adult
survival of North Atlantic seabirds. Journal of Animal Ecology 74: 817–831
Sandvik, H., Erikstad, K.E. and Sæther, B. 2012. Climate affects seabird population dynamics both
via reproduction and adult survival. Marine Ecology Progress Series 454: 273–284
Sæther, B., Tufto, J., Engen, S.M., Jerstad, K., Røstad, O.W. and Skåtan, J.E. 2000. Population
dynamical consequences of climate change for a small temperate songbird. Science 287: 854–
856
Shannon, L.J. and Jarre-Taichmann, A. 1999. A model of trophic flows in the northern Benguela
Upwelling System during the 1980s. South African Journal of Marine Science 21: 349–366
Shelton, P., Boyd, A.J. and Armstrong, M.J. 1985. The influence of large-scale environmental
processes on netric fish populations in the Benguela current system. California Cooperative
Oceanic Fisheries Investigations 26: 72–92
Sherley, R.B. 2010. Factors influencing the demography of endangered seabirds at Robben Island,
South Africa: implications and approaches for management and conservation. PhD dissertation.
University of Bristol, Bristol, UK
Sherley, R.B., Ludynia, K., Underhill, L.G., Jones, R. and Kemper, J. 2012. Storms and heat limit the
nest success of bank cormorants: impactions of future climate change for a surface-nesting
seabird in southern Africa. Journal of Ornithology 153: 441–455
Simmons, R.E., Barnard, P., Dean, W.R.J., Midgley, G.F., Thuiller, W. and Hughes, G. 2004. Climate
change and birds: perspectives and prospects from southern Africa. Ostrich 75: 295–308
Suryan, R.M. and Irons, D.B. 2001. Colony and population dynamics of black-legged kittiwakes in a
heterogenous environment. Auk 118: 636–649
Sydeman, W.J., Hester, M.M., Thayer, J.A., Gress, F., Martin, P. and Buffa, J. 2001. Climate change,
reproductive performance and diet compostition of marine birds in the southern California
Current system, 1969-1997. Progress in Oceanography 309–329
Thompson, P.M. and Ollason, J.C. 2001. Lagged effects of ocean climate change on fulmar
population dynamics. Nature 413: 417–420

84
Underhill, L.G. and Prys-Jones, R.P. 1994. Index numbers for waterbird populations. I. Review and
methodology. Journal of Applied Ecology 31: 463–480
Underhill, L.G. and Zucchini, W. 1988. A model for avian primary moult. Ibis 130: 358–372
Velimirov, B., Field, J.G., Griffiths, C.L. and Zoutendyk, P. 1977. Helgoländer wissenschaftliche
Meeresunters 30: 495–518
Walsberg, G.E. and Wolf, B.O. 1996. An appraisal of operative temperature mounts as tools for
studies of ecological energetic. Physiological Zoology 69: 658–681
Weimerskirch, H., Inchausti, P., Guinet, C. and Barbraud, C. 2003. Trends in bird and seal
populations as indicators of a system shift in the Southern Ocean. Antarctic Science 15: 249–
256
Weimerskirch, H., Zimmerman, L. and Prince, P.A. 2000. Influence of environmental variability on
breeding effort in a long-lived seabirds, the yellow-nosed albatross. Behavioural Ecology 12:
22–30
Wilson, R.P. and Grémillet, D. 1996. Body temperatures of free-living African penguins (Spheniscus
demersus) and bank cormorants (Phalacrocorax neglectus). Journal of Experimental Biology
199: 2215–2223
Young, L., Suryan, R.M., Duffy, D. and Sydeman, W.J. 2012. Climate change and seabirds aof the
California Current and Pacific Island ecosystems: observed and potential impacts and
management applications. Final report to the US Fish and Wildlife Service, Region 1. USA

85

86