metapopulation structure and dynamics of an endangered butterfly
TRANSCRIPT
Please cite this article in press as: Guiney, M. S., et al. Metapopulation structure and dynamics of an endangered butterfly. Basic andApplied Ecology (2010), doi:10.1016/j.baae.2009.09.006
ARTICLE IN PRESSBAAE-50405; No. of Pages 9
Basic and Applied Ecology xxx (2010) xxx–xxx
Metapopulation structure and dynamics of an endangered butterfly
Margaret S. Guineya,∗, David A. Andowb, Timothy T. Wilderc
aDepartment of Conservation Biology, 200 Hodson Hall, University of Minnesota, St. Paul, MN 55108, USAbDepartment of Entomology, 219 Hodson Hall, University of Minnesota, St. Paul, MN 55108, USAcFt. McCoy, United States Army Base, 110 E. Headquarters Road, Ft. McCoy, WI 54656, USA
Received 16 January 2008; accepted 5 September 2009
Abstract
Recovery plans for endangered invertebrates will improve with a better understanding of population dynamics and structure.Some spatially distributed structures beyond the classic metapopulation, including highly integrated patchy populations andcore-satellite, maybe better suited for the recovery of endangered populations. In this study we examined the population dynamicsof the Karner blue butterfly, Lycaeides melissa samuelis (Nabokov) [Lepidoptera: Lycaenidae], which is federally endangeredin the USA, at eleven sites at Fort McCoy, Wisconsin. Adult L. m. samuelis butterflies were surveyed approximately weekly ateach site using a straight line transect method. We used autocorrelation and partial autocorrelation function to look for patternsin the population dynamic, and tested for density-dependent growth and weather factors as potential explanatory factors of theyearly variation. We found non-declining or stable Karner blue populations at all eleven sites at Fort McCoy, a long-term trendand an alternating generational cycle. The trend occurred at seven of the eleven sites and was synchronous, suggesting thatKarner blue butterflies were not functioning as a classic metapopulation and maybe functioning as a patchy metapopulation.We also found density-dependent growth and a positive relationship between early summer precipitation and population growthfrom the spring to summer generation. We suggest that aiming to recover patchy metapopulations will reduce monitoring costs,simplify reserve design, and create more robust populations, which are more likely to persist into the future.
Zusammenfassung
Regenerationsprogramme für gefährdete Wirbellose werden sich durch ein tieferes Verständnis der Populationsdynamik undstruktur verbessern. Einige räumlich verteilte Strukturen jenseits der klassischen Metapopulation, darunter hoch-integriertefleckenhafte Populationen und Kern-Satellit-Konzepte, könnten besser für die Wiederherstellung von gefährdeten Populationengeeignet sein.
Wir untersuchten die Populationsdynamik des Karner-Bläulings, Lycaeides melissa samuelis (Nabokov) [Lepidoptera:Lycaenidae], der in den USA bundesweit gefährdet ist, auf elf Arealen von Fort McCoy, Wisconsin. Die adulten L. m. samueliswurden ungefähr wöchentlich auf jedem Areal mit der Transektlinien-Methode untersucht. Wir setzten Autokorrelation undpartielle Autokorrelation ein, um nach Mustern in der Populationsdynamik zu suchen, und testeten dichteabhängiges Wachstumund Witterungsfaktoren als potentielle erklärende Steuergrößen für die jährliche Variation.
Wir fanden nicht-abnehmende bzw. stabile Populationen des Karner-Bläulings auf allen elf Arealen auf Fort McCoy, einenlangfristigen Trend und alternierende Generationszyklen. Der Trend zeigte sich auf sieben der elf Areale und war synchron,was nahelegt, dass die Karner-Bläulinge nicht als klassische Metapopulation funktionieren, und dass sie als fleckenhafte
∗Corresponding author. Tel.: +1 612 721 5373; fax: +1 612 625 5299.E-mail address: [email protected] (M.S. Guiney).
1439-1791/$ – see front matter © 2010 Gesellschaft für Ökologie. Published by Elsevier GmbH. All rights reserved.doi:10.1016/j.baae.2009.09.006

Report Documentation Page Form ApprovedOMB No. 0704-0188
Public reporting burden for the collection of information is estimated to average 1 hour per response, including the time for reviewing instructions, searching existing data sources, gathering andmaintaining the data needed, and completing and reviewing the collection of information. Send comments regarding this burden estimate or any other aspect of this collection of information,including suggestions for reducing this burden, to Washington Headquarters Services, Directorate for Information Operations and Reports, 1215 Jefferson Davis Highway, Suite 1204, ArlingtonVA 22202-4302. Respondents should be aware that notwithstanding any other provision of law, no person shall be subject to a penalty for failing to comply with a collection of information if itdoes not display a currently valid OMB control number.
1. REPORT DATE 05 SEP 2009 2. REPORT TYPE
3. DATES COVERED 00-00-2009 to 00-00-2009
4. TITLE AND SUBTITLE Metapopulation structure and dynamics of an endangered butterfly
5a. CONTRACT NUMBER
5b. GRANT NUMBER
5c. PROGRAM ELEMENT NUMBER
6. AUTHOR(S) 5d. PROJECT NUMBER
5e. TASK NUMBER
5f. WORK UNIT NUMBER
7. PERFORMING ORGANIZATION NAME(S) AND ADDRESS(ES) Department of Conservation Biology,200 Hodson Hall, University ofMinnesota,St. Paul,MN,55108
8. PERFORMING ORGANIZATIONREPORT NUMBER
9. SPONSORING/MONITORING AGENCY NAME(S) AND ADDRESS(ES) 10. SPONSOR/MONITOR’S ACRONYM(S)
11. SPONSOR/MONITOR’S REPORT NUMBER(S)
12. DISTRIBUTION/AVAILABILITY STATEMENT Approved for public release; distribution unlimited
13. SUPPLEMENTARY NOTES
14. ABSTRACT
15. SUBJECT TERMS
16. SECURITY CLASSIFICATION OF: 17. LIMITATION OF ABSTRACT Same as
Report (SAR)
18. NUMBEROF PAGES
9
19a. NAME OFRESPONSIBLE PERSON
a. REPORT unclassified
b. ABSTRACT unclassified
c. THIS PAGE unclassified
Standard Form 298 (Rev. 8-98) Prescribed by ANSI Std Z39-18
Please cite this article in press as: Guiney, M. S., et al. Metapopulation structure and dynamics of an endangered butterfly. Basic andApplied Ecology (2010), doi:10.1016/j.baae.2009.09.006
ARTICLE IN PRESSBAAE-50405; No. of Pages 9
2 M.S. Guiney et al. / Basic and Applied Ecology xxx (2010) xxx–xxx
Metapopulation funktionieren könnten. Wir fanden außerdem dichteabhängiges Wachstum und einen positiven Zusammenhangzwischen dem Niederschlag im Frühsommer und dem Populationswachstum von der Frühjahrs-zur Sommergeneration.
Wir meinen, dass die Regeneration von fleckenaften Metapopulationen die Monitoring-Kosten senken, das Schutzgebietsde-sign vereinfachen und stabilere Populationen hervorbringen wird, die mit nöherer Wahrscheinlichkeit langfristig persistierenkönnen.© 2010 Gesellschaft für Ökologie. Published by Elsevier GmbH. All rights reserved.
Keywords: Population dynamics; Karner blue butterfly; Lycaeides melissa samuelis; Conservation
Introduction
Metapopulation theory has been remarkably instructivefor understanding and managing rare or endangered speciesincluding amphibians (Marsh & Trenham 2001), birds(Opdam 1991), fish (Lafferty, Swift, & Ambrose 1999),insects (Hanski, Moilanen, Pakkala, & Kuusaari 1996), mam-mals (Lawes, Mealin, & Piper 2000), and plants (Husband &Barrett 1996). The classic metapopulation, also known asthe Levins metapopulation, is a population structure whereindividual population sites have asynchronous dynamics andwhere sites experience relatively high rates of extinction andre-colonization events (Levins 1970). The classic metapop-ulation theory has been criticized due to its limited practicalapplicability because few species have this specific popula-tion dynamic (Baguette 2004). In response, Hanski (2004)argues that metapopulation theory and models can helpresearchers understand spatial concepts and identify the keypopulation processes. In this paper we build on this dialog andconsider spatially distributed population structures in addi-tion to the classic metapopulation, including highly integratedpatchy populations and core-satellite or mainland-island pop-ulations (Boorman & Levitt 1973; Hastings & Harrison 1994)for Karner blue butterfly, a USA federally endangered species(U.S. Fish and Wildlife Service 2003).
These other spatially distributed metapopulation structuresmaybe better suited as recovery goals for some endangeredarthropod populations. Persistence of a classic metapopula-tion requires a delicate balance between the rate of extirpationof local populations and the rate of colonization, which deter-mines the equilibrium prevalence of the population (Hastings& Harrison 1994). In comparison, patchy or core-satellitepopulation structures have increased movement betweenhabitat sites and persistence maybe related to a spatial scaleof the population for a patchy metapopulation (Hanski 1991)or the persistence of the core population for a core-satellitemetapopulation (Harrison, Murphy, & Ehrlich 1988). Indeed,by focusing on a core population or increasing the spatialscale of the metapopulation, limiting factors can be identifiedthat may help to direct and improve conservation efforts foran imperiled species (Ehrlich, White, Singer, McKechnie, &Gilbert 1975) while reducing monitoring costs, simplifyingreserve design, and creating more robust populations.
Karner blue butterfly, Lycaeides melissa samuelis(Nabokov) [Lepidoptera: Lycaenidae], is the most widelygeographically distributed and locally abundant of all the
federally endangered arthropod species in the USA (Andow,Baker, & Lane 1994). Thus, it is possible that this speciescould be recovered into highly robust populations. In thispaper we analyze the population dynamics of L. m. samuelisat eleven sites at Fort McCoy, Wisconsin over six years (12butterfly generations) to evaluate the historical constancy ofthe population, and by comparing these temporal trajecto-ries, we conclude that these populations are unlikely to befunctioning as a classic metapopulation. Moreover, we sug-gest that recovery of this species should include managementto maintain a healthy core population around which addi-tional areas contributing to a larger viable population can besupported.
Materials and methods
Study organism and study area
Karner blue butterfly, L. m. samuelis, is a federallyendangered butterfly (U.S. Fish and Wildlife Service 2003)inhabiting the disappearing oak savanna and pine barrensecosystems in North America (Andow et al. 1994). Karnerblue butterfly is believed to have thrived historically in aclassic metapopulation structure, maintained on a shiftinglandscape renewed by fire (Givnish, Menges, & Schweitzer1988; Schweitzer 1994). A case has been made to base recov-ery of this species near its type locality in east central NewYork State on this classic metapopulation model, specifyingminimum population size, spatial area and fire-based renewalrates (Givnish et al. 1988).
The phenology of L. m. samuelis is linked to its exclusivelarval food species, the perennial wild lupine (Lupinus peren-nis L.) (Fabaceae). In late April/early May, L. m. samueliseggs hatch into larvae that live on and consume L. peren-nis leaves for approximately three weeks. Larvae, especiallyolder instars, and pupae are tended by ants (Savignano 1994).In late May/early June, the spring flight adults emerge andfeed on nectar from numerous flower species (U.S. Fish andWildlife Service 2003). The females lay eggs individually onL. perennis stems and leaves. The mean adult life span hasbeen estimated by mark release recapture data to be four days,but other data indicate that this is an underestimate (Brown& Boyce 1996; U.S. Fish and Wildlife Service 2003; Guiney& Andow 2009). The summer flight adults emerge in lateJuly/early August and females lay eggs on L. perennis and
Please cite this article in press as: Guiney, M. S., et al. Metapopulation structure and dynamics of an endangered butterfly. Basic andApplied Ecology (2010), doi:10.1016/j.baae.2009.09.006
ARTICLE IN PRESSBAAE-50405; No. of Pages 9
M.S. Guiney et al. / Basic and Applied Ecology xxx (2010) xxx–xxx 3
nearby vegetation, and these eggs will overwinter and hatchthe following spring (U.S. Fish and Wildlife Service 2003).
The 24,282 ha U.S. Department of Defense Army militarytraining base, Fort McCoy (44◦01′N, 90◦41′W), is locatedin southwest Wisconsin, where L. m. samuelis populationshave been documented on 95% of approximately 15 km2 ofthe mapped L. perennis (Maxwell 1998). In 1996, eleven L.m. samuelis sites at Fort McCoy were chosen for long-termmonitoring because they had relatively high adult butterflydensities. Five of these sites are in the north Fort, five are inthe south Fort in a large area of fairly contiguous lupine, andone is in the southwest corner of the Fort with no lupineconnecting it to the main south Fort area for about 3 km(see Appendix A: Fig. 1). Sites are identified by a letterand a number based on the training areas where they arelocated.
Lycaeides melissa samuelis surveys
Fort McCoy staff developed their monitoring plan andprotocols by following recommendations in the WisconsinHabitat Conservation Plan (Watermolen et al. 2000). Theserecommendations were developed from a study specificallyfocused on determining appropriate sampling intervals andtotal sampling duration for Karner blue butterflies usingstraight line transects (Brown & Boyce 1996). Permanentstraight line transects were established at each site, and siteboundaries were designated by including areas where L. m.samuelis had been observed in close proximity to both L.perennis and nectar plants. The first straight line transectwas located randomly and additional transects were placed20–40 m apart depending on the site size. Monitoring beganin 1996 and occurred approximately once every seven daysspanning the flights of the two adult generations each year,except 1996 and 1997, when only the larger summer genera-tion was surveyed. In 1996, only two sites were surveyed butthis increased to all eleven sites by 1999. Sampling followed astandard protocol including avoiding inclement weather con-ditions (Wilder 1999) and about 95% of the survey data werecollected by a single person. Site specific management anddisturbance histories between 1997 and 2004, and a descrip-tion and justification of the sampling methods are providedin Appendix A.
Population fluctuations and analysis of dynamics
We used trapezoidal integration to compute the area underthe butterfly count versus date curve to summarize the mul-tiple surveys at each site for each generation into a singlepopulation density index (Manly 1976). When necessary, weextrapolated the survey data to zero population size at eachend of the phenology curve, using a seven day samplinginterval. If the first or last observation was very high (>60butterflies), we extrapolated the zero time to fourteen days.We transformed the population index to natural logarithms to
account for exponential population growth. This populationdensity index is not the same as population size. The indexis the total number of butterfly-days at a site for a generationand is influenced by immigration and emigration. One pos-sible biological interpretation of the index is the number ofeggs laid in the site by adults for the entire generation. If sexratio and daily per capita fecundity were similar across gen-erations, the index would be proportional to egg abundanceoviposited to start the next generation.
We used autocorrelation (ACF) and partial autocorrelationfunction (PACF) to analyze the population dynamics occur-ring at each site that are difficult to observe in the originaltime series (Turchin & Taylor 1992). The ACF shape of anunregulated population is consistent with a random walk, andthe autocorrelation values (ACs) will slowly dampen to zero.The ACs of a regulated and stationary population will dampenquickly to zero, while the ACs of a population that is regu-lated with a long-term trend in the population will dampenslowly. A random walk can be differentiated from a trend-ing population by detrending the data; the detrended ACswill dampen faster than the original ACs for the trendingpopulation (Royama 1992).
The PACF graphs remove the correlation that occurs dueto the lower order correlations in the ACF. A significantpartial autocorrelation (PAC) value occurs when the lineis outside the 95% confidence interval (Barlett bands) andreveals the minimum number of independent factors thatneed to be included in a population model (Turchin & Taylor1992). The ACFs and PACFs were calculated on the originaland detrended data in Excel following methods in Royama(1992).
To assess whether population patterns were affected bysite area, we regressed the mean population index on area ofeach site. Area was estimated by multiplying the total transectlength by the distance between transects.
Between-generation population change
We calculated between-generation population change asthe difference between the ln transformed population indexesof the sequential flights for each site (n = 55 site-year com-binations for each generation transition). This value ofbetween-generation population change is equal to the ln ofthe “net population growth rate per butterfly day”. Becausethe population density index is in units of butterfly-days, apositive net growth rate could result from an increase in thenumber of butterflies or an increase in the number of daysa butterfly remains alive and stays in the sampled habitat. Apositive net growth rate could occur when butterfly numbersdecreased if the number of days that butterflies survived andstayed in the habitat increased enough. Net growth rate mea-sures changes in the number of butterflies that are observedduring an entire flight, including resightings. We calculatedthe mean ln net population growth rate per butterfly-day forall sites in the same year (n = 5 years). We back-transformed
Please cite this article in press as: Guiney, M. S., et al. Metapopulation structure and dynamics of an endangered butterfly. Basic andApplied Ecology (2010), doi:10.1016/j.baae.2009.09.006
ARTICLE IN PRESSBAAE-50405; No. of Pages 9
4 M.S. Guiney et al. / Basic and Applied Ecology xxx (2010) xxx–xxx
means and confidence intervals to the arithmetic scale, toshow the net population growth rate per butterfly-day.
We also used ln net population growth rate to test fordensity-dependent growth among sites within a generationin a year. To make the population index comparable acrosssites, we divided the population index by the total transectlength at each site, and then ln transformed this populationdensity index. We then regressed the subsequent net popu-lation growth rate on this population density index for thespring and summer generations separately. We used a gen-eral linear model in SAS to test for density-dependent growth(SAS Institute 1997) with year as a factor, sites as repli-cates and allowing annual variation in the strength of densitydependence.
In addition, we examined several weather variables aspotential explanatory factors of the yearly variation ofbetween-generation population change. We utilized weatherdata from the closest accessible NOAA weather station(43◦56′N/90◦49′W), 20 km west of the Fort McCoy head-quarters (Sparta station, http://www.ncdc.noaa.gov). We useda general linear model in SAS (SAS Institute 1997) to regressln net population growth rate and weather variables. For thespring-to-summer generation change, we examined the fol-lowing variables: cumulative rainfall (1 June–31 July), meanair temperature in June, and mean air temperature in July.
For the summer-to-spring (overwinter) generation changewe examined precipitation, temperature, and precipitationcombined with temperature [precipitation: winter snow (totalsnowfall 1 November–31 March, number of days with con-tinuous snow cover at 2.54 cm or above), spring cumulativerainfall (15 April–31 May); air temperature: fall heat (numberof days when daily maximum air temperature exceeded 29 ◦Cbetween 1 August and 30 September), winter cold (num-ber of days daily minimum air temperature <−23 ◦C), springaverage (mean temperature 1–31 May); precipitation com-bined with temperature in the winter (number of days dailyminimum temperature <−12 ◦C regardless of snow coverand number of days daily minimum temperature <−12 ◦Cwithout at least 2.54 cm of snow cover)]. The winter temper-atures, −12 ◦C and −23 ◦C, were chosen to test the effect ofmoderate and extreme cold air temperatures.
Results
Population fluctuations and analysis of dynamics
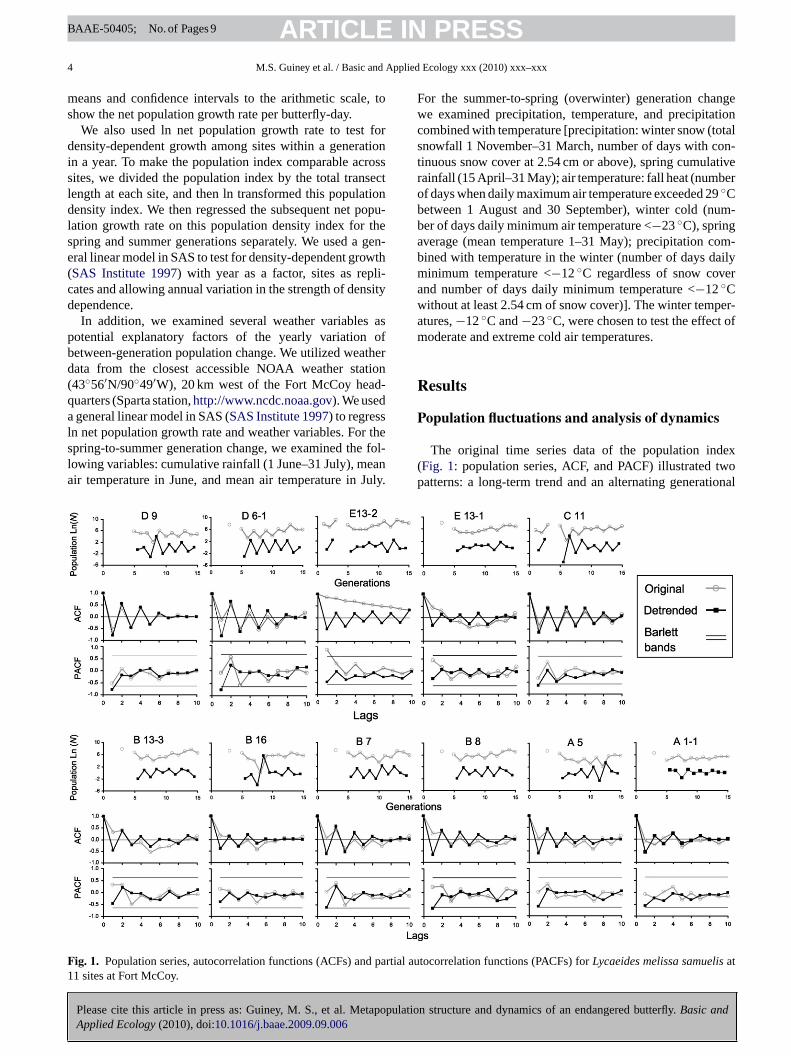
The original time series data of the population index(Fig. 1: population series, ACF, and PACF) illustrated twopatterns: a long-term trend and an alternating generational
Fig. 1. Population series, autocorrelation functions (ACFs) and partial autocorrelation functions (PACFs) for Lycaeides melissa samuelis at11 sites at Fort McCoy.
Please cite this article in press as: Guiney, M. S., et al. Metapopulation structure and dynamics of an endangered butterfly. Basic andApplied Ecology (2010), doi:10.1016/j.baae.2009.09.006
ARTICLE IN PRESSBAAE-50405; No. of Pages 9
M.S. Guiney et al. / Basic and Applied Ecology xxx (2010) xxx–xxx 5
cycle. The original time series data in the population seriesand ACF graphs showed a U-shaped pattern indicating along-term trend for seven of the eleven sites: A5, B7, B16,B13-3, B8, E13-1, and D6-1 (Fig. 1). For these sites, theACF generally decreased for generational lags one to five,then increased between lag six through ten. Site E13-1 illus-trated this pattern particularly well while other sites, similarto B8, still showed this U-shaped pattern but the curve wasnot as smooth. Generally the first generation in the pop-ulation series had the highest population index, and thenthe index dropped and reached its lowest value in the mid-dle of the times series. This was followed by an increasethat reached a higher value near the end of the time series.Because this U-shape was consistently evident at multiplesites, it suggested the presence of a long-term trend with ahalf period length of approximately five generations. Afterthe data were detrended, the U-shape pattern was eliminatedand the detrended ACF graphs oscillated around and dampedto zero (Fig. 1).
The remaining four sites did not show a long-term popu-lation trend. Although we cannot rule out the possibility thatthese sites also trended with the others, the long-term popu-lation dynamics for three sites (A1-1, C11, and D9) tended tofluctuate around a constant population index. Site E13-2 wassomewhat anomalous in that it showed an increasing trendin the population index. Three of these four sites occurred inthe northern part of Fort McCoy (see Appendix A: Fig. 1),and one (A1-1) occurred in the extreme southwest corner ofthe property. Both the southwest corner and the northern sitesare at least 3 km from the large group of sites in contiguouslupine area in the south Fort. All of these more isolated siteshad detrended ACF graphs that oscillated around and mostlydamped to zero.
The alternating generational pattern was most evident inthe ACFs. At all eleven sites in the detrended ACF graphs, thegeneration lag one was a negative correlation, while lag twowas positive, and this alternating pattern continued with mostodd lags showing a negative correlation while even lags werepositive. These observations correspond to the typical patternof a larger summer adult flight compared to the spring flight.Odd lags, which compared summer-to-spring and spring-to-summer flights, were negatively correlated, and even lags,which compared summer-to-summer and spring-to-springflights, were positively correlated.
The PACF graphs also illustrate the dramatic differencebetween the original and the detrended data. At lag one, theoriginal series PACFs showed a mix of positive and negativePACs, while for the detrended data, all the sites illustrated astrong negative PAC value (Fig. 1). Furthermore site E13-2showed a significant positive PAC at lag one but after detrend-ing this changed to a negative correlation. In addition, withinthe original data no sites had significant negative PACs, butthe detrended data showed four sites (C11, B8, D6-1, and D9)with significant negative PACs at lag one. This means at leastone independent factor affected population dynamics of lagone at these sites.
These results indicate that the alternate generational pat-tern was partially masked in the original population seriesby the long-term trend. This long-term trend also affectedthe strength of the ACs and PACs. When the original datawere detrended, the alternate generational pattern was morenoticeable in both the population series and the ACF andPACF graphs.
We examined site area as a potential explanation for thevariation between sites, but we did not find any patterns. Wedid not find a relationship between site area and the meanpopulation index for each site (R2 = 0.0027, P > 0.05). Alsothe four sites (A1-1, C11, D9, and E13-2) that did not clearlyshow the long-term population trend were not similar in areaor mean population index.
Between-generation population change
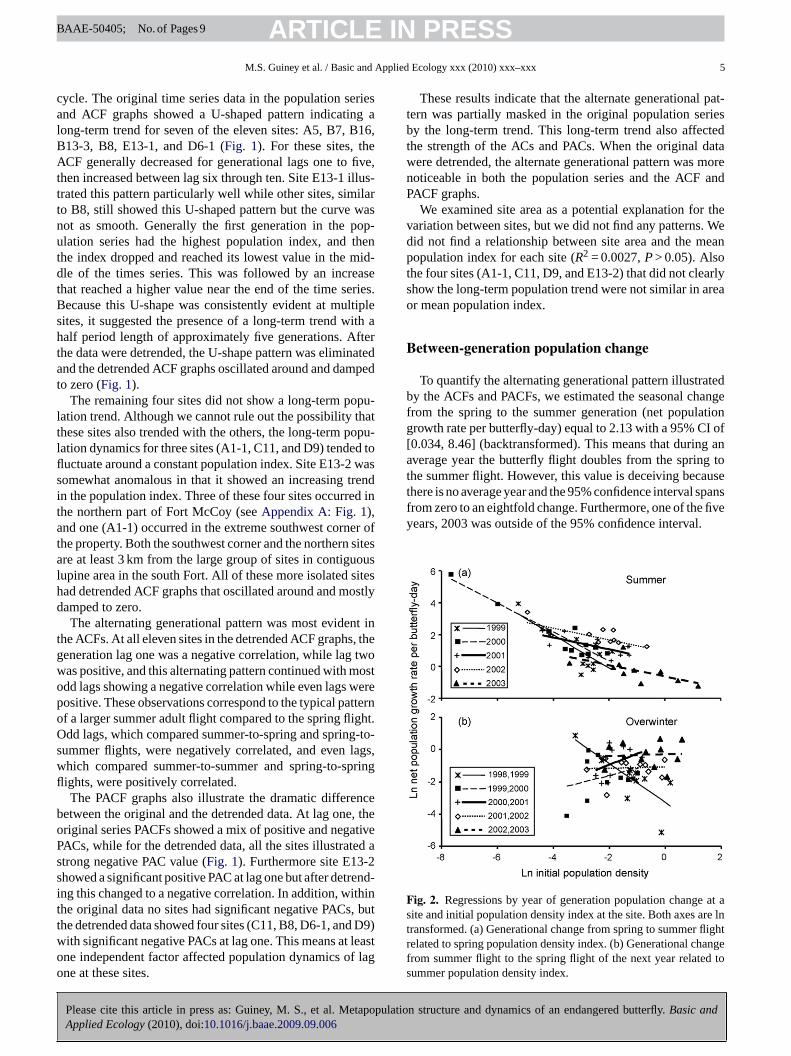
To quantify the alternating generational pattern illustratedby the ACFs and PACFs, we estimated the seasonal changefrom the spring to the summer generation (net populationgrowth rate per butterfly-day) equal to 2.13 with a 95% CI of[0.034, 8.46] (backtransformed). This means that during anaverage year the butterfly flight doubles from the spring tothe summer flight. However, this value is deceiving becausethere is no average year and the 95% confidence interval spansfrom zero to an eightfold change. Furthermore, one of the fiveyears, 2003 was outside of the 95% confidence interval.
Fig. 2. Regressions by year of generation population change at asite and initial population density index at the site. Both axes are lntransformed. (a) Generational change from spring to summer flightrelated to spring population density index. (b) Generational changefrom summer flight to the spring flight of the next year related tosummer population density index.
Please cite this article in press as: Guiney, M. S., et al. Metapopulation structure and dynamics of an endangered butterfly. Basic andApplied Ecology (2010), doi:10.1016/j.baae.2009.09.006
ARTICLE IN PRESSBAAE-50405; No. of Pages 9
6 M.S. Guiney et al. / Basic and Applied Ecology xxx (2010) xxx–xxx
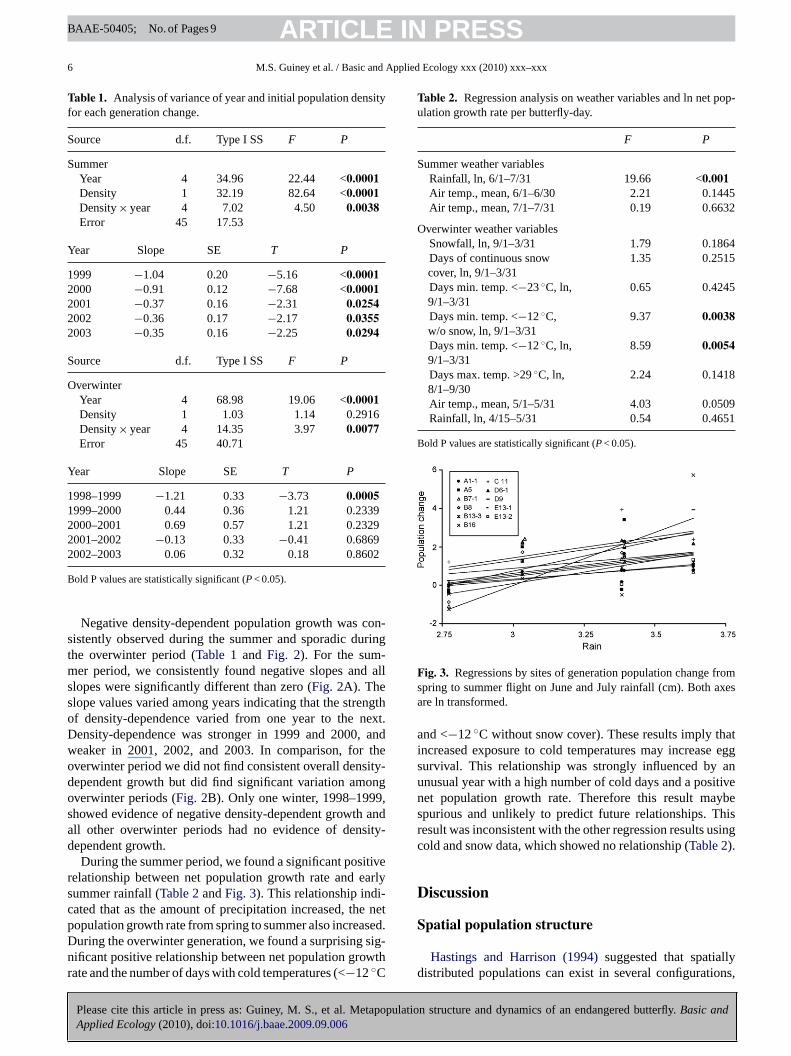
Table 1. Analysis of variance of year and initial population densityfor each generation change.
Source d.f. Type I SS F P
SummerYear 4 34.96 22.44 <0.0001Density 1 32.19 82.64 <0.0001Density × year 4 7.02 4.50 0.0038Error 45 17.53
Year Slope SE T P
1999 −1.04 0.20 −5.16 <0.00012000 −0.91 0.12 −7.68 <0.00012001 −0.37 0.16 −2.31 0.02542002 −0.36 0.17 −2.17 0.03552003 −0.35 0.16 −2.25 0.0294
Source d.f. Type I SS F P
OverwinterYear 4 68.98 19.06 <0.0001Density 1 1.03 1.14 0.2916Density × year 4 14.35 3.97 0.0077Error 45 40.71
Year Slope SE T P
1998–1999 −1.21 0.33 −3.73 0.00051999–2000 0.44 0.36 1.21 0.23392000–2001 0.69 0.57 1.21 0.23292001–2002 −0.13 0.33 −0.41 0.68692002–2003 0.06 0.32 0.18 0.8602
Bold P values are statistically significant (P < 0.05).
Negative density-dependent population growth was con-sistently observed during the summer and sporadic duringthe overwinter period (Table 1 and Fig. 2). For the sum-mer period, we consistently found negative slopes and allslopes were significantly different than zero (Fig. 2A). Theslope values varied among years indicating that the strengthof density-dependence varied from one year to the next.Density-dependence was stronger in 1999 and 2000, andweaker in 2001, 2002, and 2003. In comparison, for theoverwinter period we did not find consistent overall density-dependent growth but did find significant variation amongoverwinter periods (Fig. 2B). Only one winter, 1998–1999,showed evidence of negative density-dependent growth andall other overwinter periods had no evidence of density-dependent growth.
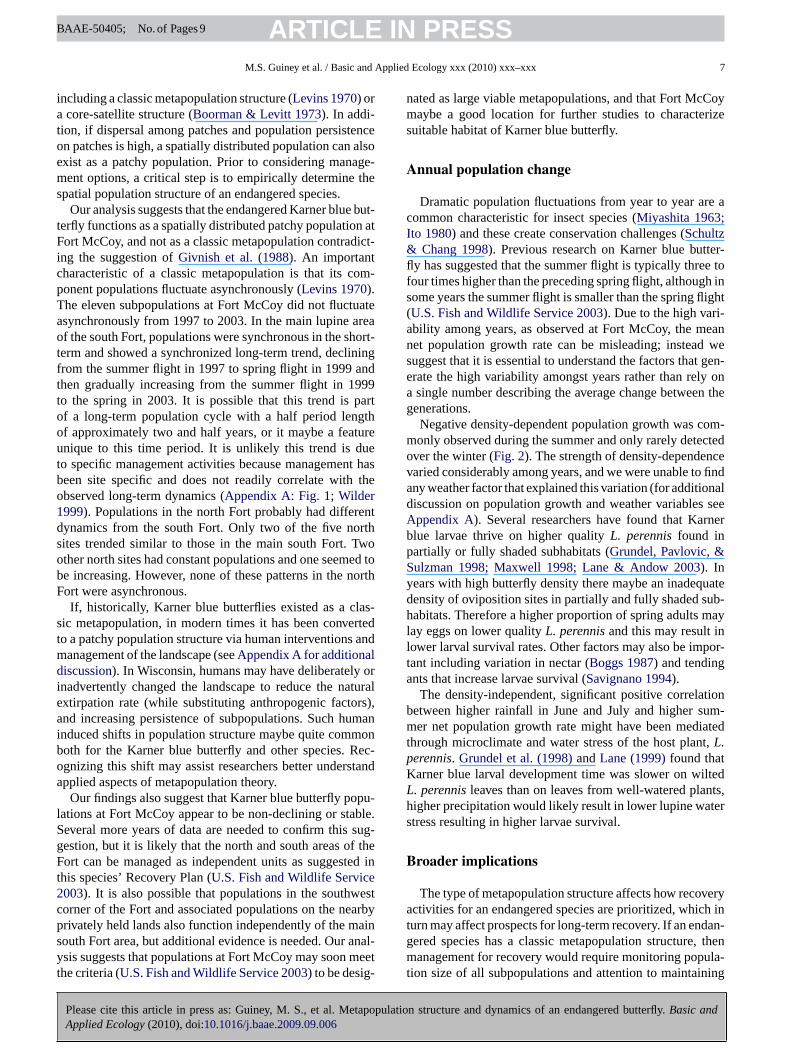
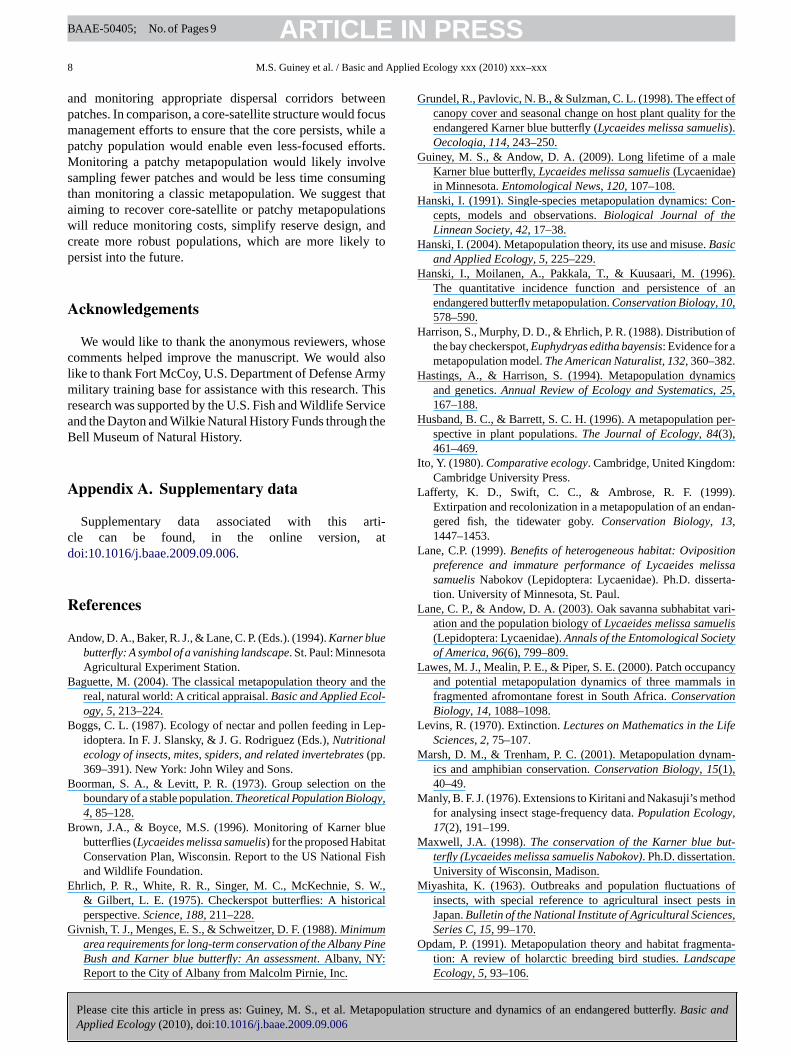
During the summer period, we found a significant positiverelationship between net population growth rate and earlysummer rainfall (Table 2 and Fig. 3). This relationship indi-cated that as the amount of precipitation increased, the netpopulation growth rate from spring to summer also increased.During the overwinter generation, we found a surprising sig-nificant positive relationship between net population growthrate and the number of days with cold temperatures (<−12 ◦C
Table 2. Regression analysis on weather variables and ln net pop-ulation growth rate per butterfly-day.
F P
Summer weather variablesRainfall, ln, 6/1–7/31 19.66 <0.001Air temp., mean, 6/1–6/30 2.21 0.1445Air temp., mean, 7/1–7/31 0.19 0.6632
Overwinter weather variablesSnowfall, ln, 9/1–3/31 1.79 0.1864Days of continuous snowcover, ln, 9/1–3/31
1.35 0.2515
Days min. temp. <−23 ◦C, ln,9/1–3/31
0.65 0.4245
Days min. temp. <−12 ◦C,w/o snow, ln, 9/1–3/31
9.37 0.0038
Days min. temp. <−12 ◦C, ln,9/1–3/31
8.59 0.0054
Days max. temp. >29 ◦C, ln,8/1–9/30
2.24 0.1418
Air temp., mean, 5/1–5/31 4.03 0.0509Rainfall, ln, 4/15–5/31 0.54 0.4651
Bold P values are statistically significant (P < 0.05).
Fig. 3. Regressions by sites of generation population change fromspring to summer flight on June and July rainfall (cm). Both axesare ln transformed.
and <−12 ◦C without snow cover). These results imply thatincreased exposure to cold temperatures may increase eggsurvival. This relationship was strongly influenced by anunusual year with a high number of cold days and a positivenet population growth rate. Therefore this result maybespurious and unlikely to predict future relationships. Thisresult was inconsistent with the other regression results usingcold and snow data, which showed no relationship (Table 2).
Discussion
Spatial population structure
Hastings and Harrison (1994) suggested that spatiallydistributed populations can exist in several configurations,
Please cite this article in press as: Guiney, M. S., et al. Metapopulation structure and dynamics of an endangered butterfly. Basic andApplied Ecology (2010), doi:10.1016/j.baae.2009.09.006
ARTICLE IN PRESSBAAE-50405; No. of Pages 9
M.S. Guiney et al. / Basic and Applied Ecology xxx (2010) xxx–xxx 7
including a classic metapopulation structure (Levins 1970) ora core-satellite structure (Boorman & Levitt 1973). In addi-tion, if dispersal among patches and population persistenceon patches is high, a spatially distributed population can alsoexist as a patchy population. Prior to considering manage-ment options, a critical step is to empirically determine thespatial population structure of an endangered species.
Our analysis suggests that the endangered Karner blue but-terfly functions as a spatially distributed patchy population atFort McCoy, and not as a classic metapopulation contradict-ing the suggestion of Givnish et al. (1988). An importantcharacteristic of a classic metapopulation is that its com-ponent populations fluctuate asynchronously (Levins 1970).The eleven subpopulations at Fort McCoy did not fluctuateasynchronously from 1997 to 2003. In the main lupine areaof the south Fort, populations were synchronous in the short-term and showed a synchronized long-term trend, decliningfrom the summer flight in 1997 to spring flight in 1999 andthen gradually increasing from the summer flight in 1999to the spring in 2003. It is possible that this trend is partof a long-term population cycle with a half period lengthof approximately two and half years, or it maybe a featureunique to this time period. It is unlikely this trend is dueto specific management activities because management hasbeen site specific and does not readily correlate with theobserved long-term dynamics (Appendix A: Fig. 1; Wilder1999). Populations in the north Fort probably had differentdynamics from the south Fort. Only two of the five northsites trended similar to those in the main south Fort. Twoother north sites had constant populations and one seemed tobe increasing. However, none of these patterns in the northFort were asynchronous.
If, historically, Karner blue butterflies existed as a clas-sic metapopulation, in modern times it has been convertedto a patchy population structure via human interventions andmanagement of the landscape (see Appendix A for additionaldiscussion). In Wisconsin, humans may have deliberately orinadvertently changed the landscape to reduce the naturalextirpation rate (while substituting anthropogenic factors),and increasing persistence of subpopulations. Such humaninduced shifts in population structure maybe quite commonboth for the Karner blue butterfly and other species. Rec-ognizing this shift may assist researchers better understandapplied aspects of metapopulation theory.
Our findings also suggest that Karner blue butterfly popu-lations at Fort McCoy appear to be non-declining or stable.Several more years of data are needed to confirm this sug-gestion, but it is likely that the north and south areas of theFort can be managed as independent units as suggested inthis species’ Recovery Plan (U.S. Fish and Wildlife Service2003). It is also possible that populations in the southwestcorner of the Fort and associated populations on the nearbyprivately held lands also function independently of the mainsouth Fort area, but additional evidence is needed. Our anal-ysis suggests that populations at Fort McCoy may soon meetthe criteria (U.S. Fish and Wildlife Service 2003) to be desig-
nated as large viable metapopulations, and that Fort McCoymaybe a good location for further studies to characterizesuitable habitat of Karner blue butterfly.
Annual population change
Dramatic population fluctuations from year to year are acommon characteristic for insect species (Miyashita 1963;Ito 1980) and these create conservation challenges (Schultz& Chang 1998). Previous research on Karner blue butter-fly has suggested that the summer flight is typically three tofour times higher than the preceding spring flight, although insome years the summer flight is smaller than the spring flight(U.S. Fish and Wildlife Service 2003). Due to the high vari-ability among years, as observed at Fort McCoy, the meannet population growth rate can be misleading; instead wesuggest that it is essential to understand the factors that gen-erate the high variability amongst years rather than rely ona single number describing the average change between thegenerations.
Negative density-dependent population growth was com-monly observed during the summer and only rarely detectedover the winter (Fig. 2). The strength of density-dependencevaried considerably among years, and we were unable to findany weather factor that explained this variation (for additionaldiscussion on population growth and weather variables seeAppendix A). Several researchers have found that Karnerblue larvae thrive on higher quality L. perennis found inpartially or fully shaded subhabitats (Grundel, Pavlovic, &Sulzman 1998; Maxwell 1998; Lane & Andow 2003). Inyears with high butterfly density there maybe an inadequatedensity of oviposition sites in partially and fully shaded sub-habitats. Therefore a higher proportion of spring adults maylay eggs on lower quality L. perennis and this may result inlower larval survival rates. Other factors may also be impor-tant including variation in nectar (Boggs 1987) and tendingants that increase larvae survival (Savignano 1994).
The density-independent, significant positive correlationbetween higher rainfall in June and July and higher sum-mer net population growth rate might have been mediatedthrough microclimate and water stress of the host plant, L.perennis. Grundel et al. (1998) and Lane (1999) found thatKarner blue larval development time was slower on wiltedL. perennis leaves than on leaves from well-watered plants,higher precipitation would likely result in lower lupine waterstress resulting in higher larvae survival.
Broader implications
The type of metapopulation structure affects how recoveryactivities for an endangered species are prioritized, which inturn may affect prospects for long-term recovery. If an endan-gered species has a classic metapopulation structure, thenmanagement for recovery would require monitoring popula-tion size of all subpopulations and attention to maintaining
Please cite this article in press as: Guiney, M. S., et al. Metapopulation structure and dynamics of an endangered butterfly. Basic andApplied Ecology (2010), doi:10.1016/j.baae.2009.09.006
ARTICLE IN PRESSBAAE-50405; No. of Pages 9
8 M.S. Guiney et al. / Basic and Applied Ecology xxx (2010) xxx–xxx
and monitoring appropriate dispersal corridors betweenpatches. In comparison, a core-satellite structure would focusmanagement efforts to ensure that the core persists, while apatchy population would enable even less-focused efforts.Monitoring a patchy metapopulation would likely involvesampling fewer patches and would be less time consumingthan monitoring a classic metapopulation. We suggest thataiming to recover core-satellite or patchy metapopulationswill reduce monitoring costs, simplify reserve design, andcreate more robust populations, which are more likely topersist into the future.
Acknowledgements
We would like to thank the anonymous reviewers, whosecomments helped improve the manuscript. We would alsolike to thank Fort McCoy, U.S. Department of Defense Armymilitary training base for assistance with this research. Thisresearch was supported by the U.S. Fish and Wildlife Serviceand the Dayton and Wilkie Natural History Funds through theBell Museum of Natural History.
Appendix A. Supplementary data
Supplementary data associated with this arti-cle can be found, in the online version, atdoi:10.1016/j.baae.2009.09.006.
References
Andow, D. A., Baker, R. J., & Lane, C. P. (Eds.). (1994). Karner bluebutterfly: A symbol of a vanishing landscape. St. Paul: MinnesotaAgricultural Experiment Station.
Baguette, M. (2004). The classical metapopulation theory and thereal, natural world: A critical appraisal. Basic and Applied Ecol-ogy, 5, 213–224.
Boggs, C. L. (1987). Ecology of nectar and pollen feeding in Lep-idoptera. In F. J. Slansky, & J. G. Rodriguez (Eds.), Nutritionalecology of insects, mites, spiders, and related invertebrates (pp.369–391). New York: John Wiley and Sons.
Boorman, S. A., & Levitt, P. R. (1973). Group selection on theboundary of a stable population. Theoretical Population Biology,4, 85–128.
Brown, J.A., & Boyce, M.S. (1996). Monitoring of Karner bluebutterflies (Lycaeides melissa samuelis) for the proposed HabitatConservation Plan, Wisconsin. Report to the US National Fishand Wildlife Foundation.
Ehrlich, P. R., White, R. R., Singer, M. C., McKechnie, S. W.,& Gilbert, L. E. (1975). Checkerspot butterflies: A historicalperspective. Science, 188, 211–228.
Givnish, T. J., Menges, E. S., & Schweitzer, D. F. (1988). Minimumarea requirements for long-term conservation of the Albany PineBush and Karner blue butterfly: An assessment. Albany, NY:Report to the City of Albany from Malcolm Pirnie, Inc.
Grundel, R., Pavlovic, N. B., & Sulzman, C. L. (1998). The effect ofcanopy cover and seasonal change on host plant quality for theendangered Karner blue butterfly (Lycaeides melissa samuelis).Oecologia, 114, 243–250.
Guiney, M. S., & Andow, D. A. (2009). Long lifetime of a maleKarner blue butterfly, Lycaeides melissa samuelis (Lycaenidae)in Minnesota. Entomological News, 120, 107–108.
Hanski, I. (1991). Single-species metapopulation dynamics: Con-cepts, models and observations. Biological Journal of theLinnean Society, 42, 17–38.
Hanski, I. (2004). Metapopulation theory, its use and misuse. Basicand Applied Ecology, 5, 225–229.
Hanski, I., Moilanen, A., Pakkala, T., & Kuusaari, M. (1996).The quantitative incidence function and persistence of anendangered butterfly metapopulation. Conservation Biology, 10,578–590.
Harrison, S., Murphy, D. D., & Ehrlich, P. R. (1988). Distribution ofthe bay checkerspot, Euphydryas editha bayensis: Evidence for ametapopulation model. The American Naturalist, 132, 360–382.
Hastings, A., & Harrison, S. (1994). Metapopulation dynamicsand genetics. Annual Review of Ecology and Systematics, 25,167–188.
Husband, B. C., & Barrett, S. C. H. (1996). A metapopulation per-spective in plant populations. The Journal of Ecology, 84(3),461–469.
Ito, Y. (1980). Comparative ecology. Cambridge, United Kingdom:Cambridge University Press.
Lafferty, K. D., Swift, C. C., & Ambrose, R. F. (1999).Extirpation and recolonization in a metapopulation of an endan-gered fish, the tidewater goby. Conservation Biology, 13,1447–1453.
Lane, C.P. (1999). Benefits of heterogeneous habitat: Ovipositionpreference and immature performance of Lycaeides melissasamuelis Nabokov (Lepidoptera: Lycaenidae). Ph.D. disserta-tion. University of Minnesota, St. Paul.
Lane, C. P., & Andow, D. A. (2003). Oak savanna subhabitat vari-ation and the population biology of Lycaeides melissa samuelis(Lepidoptera: Lycaenidae). Annals of the Entomological Societyof America, 96(6), 799–809.
Lawes, M. J., Mealin, P. E., & Piper, S. E. (2000). Patch occupancyand potential metapopulation dynamics of three mammals infragmented afromontane forest in South Africa. ConservationBiology, 14, 1088–1098.
Levins, R. (1970). Extinction. Lectures on Mathematics in the LifeSciences, 2, 75–107.
Marsh, D. M., & Trenham, P. C. (2001). Metapopulation dynam-ics and amphibian conservation. Conservation Biology, 15(1),40–49.
Manly, B. F. J. (1976). Extensions to Kiritani and Nakasuji’s methodfor analysing insect stage-frequency data. Population Ecology,17(2), 191–199.
Maxwell, J.A. (1998). The conservation of the Karner blue but-terfly (Lycaeides melissa samuelis Nabokov). Ph.D. dissertation.University of Wisconsin, Madison.
Miyashita, K. (1963). Outbreaks and population fluctuations ofinsects, with special reference to agricultural insect pests inJapan. Bulletin of the National Institute of Agricultural Sciences,Series C, 15, 99–170.
Opdam, P. (1991). Metapopulation theory and habitat fragmenta-tion: A review of holarctic breeding bird studies. LandscapeEcology, 5, 93–106.

Please cite this article in press as: Guiney, M. S., et al. Metapopulation structure and dynamics of an endangered butterfly. Basic andApplied Ecology (2010), doi:10.1016/j.baae.2009.09.006
ARTICLE IN PRESSBAAE-50405; No. of Pages 9
M.S. Guiney et al. / Basic and Applied Ecology xxx (2010) xxx–xxx 9
Royama, T. (1992). Analytical population dynamics. New York:Chapman and Hall.
SAS Institute, I. (1997). SAS user’s guide: Statistics. Cary, NC: SASInstitute, Inc.
Savignano, D. A. (1994). Benefits to Karner blue butterfly fromassociation with ants. In D. A. Andow, R. J. Baker, & C. P.Lane (Eds.), Karner blue butterfly: a symbol of a vanishing land-scape (pp. 37–46). St. Paul: Minnesota Agricultural ExperimentStation.
Schultz, C. B., & Chang, G. C. (1998). Challenges in insectconservation: Managing fluctuating populations in disturbedenvironments. In P. Fiedler, & P. Kareiva (Eds.), Conservationbiology for the coming decade (pp. 228–254). New York: Chap-man and Hall.
Schweitzer, D. F. (1994). Prioritizing Karner blue butterfly habi-tats for protection activities. In D. A. Andow, R. J. Baker, &C. P. Lane (Eds.), Karner blue butterfly: A symbol of a vanish-
ing landscape (pp. 173–184). St. Paul: Minnesota AgriculturalExperiment Station.
Turchin, P., & Taylor, A. D. (1992). Complex dynamics in ecologicaltime series. Ecology, 73(1), 289–305.
U.S. Fish and Wildlife Service. (2003). Karner blue butterfly(Lycaeides melissa samuelis) recovery plan. Minnesota: FortSnelling., p. 221
Watermolen, D. J., Bleser, C., Zastrow, D., Christenson, J.,Lentz, D. R., Wood, D., et al. (2000). Wisconsin statewideKarner blue butterfly habitat conservation plan and envi-ronmental impact statement. Madison: Wisconsin Dept.Natural Resources., 386 pp. + 8 appendices. Available athttp://dnr.wi.gov/forestry/karner/hcptext/ Accessed 5.06.08
Wilder, T. T. (1999). Fort McCoy Karner blue butterfly endangeredspecies management plan. Fort McCoy: United States Depart-ment of Defense.