captive double-crested cormorant phalacrocorax auritus predation on channel catfish ictalurus...
TRANSCRIPT
JOURNAL OF THE WORLD AQUACULTURE SOCIETY
Vol. 33, No. I March. 2002
Captive Double-crested Cormorant Phalacrocorax auritus Predation on Channel Catfish Ictalurus pUllctatus Fingerlings
and Its Influence on Single-batch Cropping Production
JAMES F. GLA HN AND BRJAN S. DDRR 1
U.S. Departmem of Agricllilll re, Natiol/al 'Wildlife Research Celller. P. O. Dr{lII"er 6099. Mississippi Stale Un iversity. Mississippi 39762 USA
Abstract.-W e studied the effects of captive doublecrested cormorant P"alacrocorax atlriws pred;.nion on channel catfi sh leta/lln1s pilI/ClaWS inventories from research ponds with and without altemal ive prey during the years 1998-2000. Ln 1998. predation by two groups of capti ve cormorants on ponds without alternati ve prey produced inventory reductions relati ve to a control pond that were eq ui valent to 10.2 (5 16 g) and 10.5 (608 g) catfi shlbird per d. In 1999 and 2000 individual cormorants foraging on 0.02-ha pond hal ves for 10 d (500 cormomnt d/ha) stocked with both c:ufi sh and golden shiners NOlemigolllls cryso/e llcas produced inventory reductions at harvest (7.5 mo after predation occurred) uvemging approximately 7 and 9 catfish/bird per d, respectively. In 1999. two ponds averaged a 30% reduction in fi sh inventoried and a 23% loss in biomass from ponds stocked at 12,355 fi shlha using a sing le batch cropping system. Production losses from predation were not appare nt at a third pond where disease reduced the catfi sh population by more lhan 50%. In contrast. two ponds with more modest di sease problems in 2000 had add itive predation losses that exceeded those observed in 1999. Observations of cormomnts fomging during 1999 and 2000 suggested that differences in catfish predation between these ye.irs may have been related to less shiner utilization by cormomms in 2000. However. based on availabili ty, there was no preference for shiners over catfish (Chesson's alpha < 0.41 ) in either year, a lthough shiners were a more readil y manipulated prey. Despite the possible moderating effects of alternati ve prey utilization. we conclude that cormorants can C;'lli se sign ificant economic losses to catfi sh at har vest.
Depredations caused by the double-crested cormorant Phalacrocorax aurirus have been a concern to channel catfish !ctalurus puncta/lis producers for many years (Stickley and Andrews 1989). In a 1996 national survey of catfish producers, depredations by cormorants were the most widely cited wildlife problem. Losses due to cormorants were c ited by 77% of Mississippi producers, 66%
I Corresponding author.
of Arkansas producers. and 50% of Alabama producers (Wywialowski 1999).
Observational studies provided the first evidence of the potential for cormorants to impact catfish production. Based on observations of the smaller subspecies of Florida cormorant (ftoridanus subspecies). Schramm et al. ( 1984) estimated that on average, each bird consumed 19 catfish fingerlings dai ly. ranging in size from 8 to 16 em. The authors assumed the average catfish weighed 16 g and estim ated Fl o rida cormorants co nsumed 304 g of catfish daily, but argued that this estimate was conse rvative.
Similarly, Stickley e t al. ( 1992) observed the larger subspecies of cormorant Foraging on selected catfi sh ponds in the delta region of Mississippi. Because they could not keep track of individual foragi ng activity. they recorded the numbers of birds o n po nds and the number of fish seen captured over specified lime inter vals and related thi s as the number of fish eaten per cormoralll-h of foraging activity. O ver the course of the study, they observed a mean of 30.5 cormorants per pond and an average of five catfi sh co ns um ed per co rmorant -h . A Ilhough it is difficult to precisely de te rmine from these data the amount of catfi sh that an indi vidual cormorant consumes per day, telemetry slUd ies have indicated that individual cormorants spend about I hId foraging (King et al. 1995).
In addilion to catfi sh, averaging 12 em in length , Stickley et aJ. ( 1992) observed cormorants consuming large numbers of gizzard shad Dorosol1la cepediallum in situat.ions where the wi ld-spawned fi sh had invaded catfi sh ponds. Based on these obser-
o Copyright b) the World Aquaculture Soc,et) 2002
85
GLA li ' A 0 OORR
'ations Stickley et al. ( 1992) suggested that :ormorants may prefer shad, possibly be:ause they were more read.ily manipulated md swallowed . Gi ven thi s, Glahn et aJ. 1995) suggested the ava ilability of more 'eadily manipulated allernative prey may lelp mitigate losses of catfish to connoants.
Consistent with findings of Stick ley et a l. 1992). food habits studies in the de lta re
~ ion of Mississippi revealed that catfish. av~ragi ng 16 cm in length. comprised about )4% and 50% (wt/wt) of the diet of cornoranls at catfish farms and roost sites. re;pectively (G lahn et al. 1995). Most of the "emaining diet was gizzard shad, averaging ,bollt 12 c m in length .
Glahn and Brugger ( 1995) developed a Jioencrgetic model physiologicall y specific :0 P. alirilUs and predicted that these cor-110rdnL' consume 504 g of fishlb ird per d juring the winter months. Using the bio!nergetic model and data on numbers and jjet of wi ntering cormorants in the delta region of Mississ ippi , G lahn and Brugger (1995) projected that during the winters of 1989- 1990 and 1990- 199 1, cormo rants ::onsumed 18 and 20 million catfi sh fingerlings. respectively. Based on the repl acement cost of fingerlings. the annual cost to producers in this region was calculated at approxi mately $2 million. Consideri ng that cormorant populations in this region have more than doubled in recent years, G lahn et a l. (2000) projected the annual loss to replace fingerlings during the winters of 1996-- 1997 and 1997- 1998 at approxi mately $5 milli on.
Despite a recognized need for more research regarding catfish losses due to cormorant predation (Erwin 1995). there have been no studies veri fy ing losses with and without alternati ve prey being present in ponds. Furthermore. no study has demonstrated the extent that cormorant foraging on fin gerlings actually reduces catfish production at harvest.
The o bjectives of our study were to determine: I ) the number and biomass of cat-
fi sh fingerlings removedlbird per d by captive cormorants foraging on research ponds: 2) the impact of cormorant predation on yield at harvest in research ponds simulating a single-batch grow-out pond containing readily manipulated alternati ve prey: and 3) differences in captive cormorant selection and handling time of catfish and readily manipulated alternative prey.
Methods
Study Allinw/s alld Facilities
All cormorants were captured at night roosts in the delta reg-ion of Mississippi using methods described by King et al. ( 1994). Captured cormorants were physically examined for any injuries. weighed, and indi vidually identified wi th a numbered leg band. Cormorants were held in capti vity at the USDA ational Wildlife Research Center testing facility in Starkville. Mississippi . This O.4-ha faci lity is completely enclosed with chain-lin k fe ncing and netting and is divided into three compartmellls. each containing a O.04-ha catfi sh pond approximately I -m deep. In al l predation tri als ( 1998- 2000). a prescribed number of channel catfish fingerlings were stocked into each pond. In 1999 and 2000. golden shiners Notemigollus crysoleucas obtained from local bai t fi sh producers were also stocked as an alternative cormorant prey to simulate field situations where both shad and catfish were available. Golden shiners were used as a surrogate for shad because they were the 1110St similar commercially avai lable fi sh in both physical and behavioral characteristics and wi ld spawn shad are very difficult to capture. transport. and maintain alive.
1998 Predatioll Trial
Between 16 January and 30 January 1998 the three O.04-ha ponds were stocked with 3,000 (75,ooofha) catfi sh fingerl ings eHch. At stocking. samples of fi sh were weighed to determine their average weight. The fi sh were maintained in these ponds for 7 wk. and fi sh mortalities were checked 4-
•
CORMORAi\rr PREDATION ON CATFlSH 87
5 times per wk. Throughout the study, dissol ved oxygen levels of ponds were checked daily. and fish in each pond were fed 1.5 kg of a 32% protei n Hoati ng catfish feed per d. During the evening of 8 March 1998 six and nine cormorants were placed on each of two ponds. while the third pond was excluded from cormorant use. COflllO
rants used in thi s trial were part of a telemetry package attachment study in which some bi rds were equi pped with a backpack harness that did not interfere with their foraging abi lity (King et a l. 2000). Midway through this testing period, an additiona l cormorant was inadvertently added to the pond wi th nine birds for an average of 9.5 birds on this pond over time. On 18 March 1998. aft e r 8.5 d of foragi ng. a ll cormorants were removed from the ponds. Between 23 March and 24 March we complete ly inventoried a ll catfi sh and weighed samples of catfish from each pond to determ_ine their mean we ight. We summari zed these data by comparing inventories of catfi sh with the numbers of catfi sh sLOcked. We subtracted the number of fish mi ssing from the control pond to correct for non-predation related fi sh losses from ponds where cormorants foraged. Biomass of fish consumed was estimated by multiply ing the number of catfish depredated times the mean weight of fish sampled at inventory.
1999 Predation Trial
We divided each of the three research ponds in half wi th a plastic mesh screening materi al to separate fish populations, and covered one pond half with netting to preven t cormorant predation. We simulated a commercial grow-out pond stocking rate ( 12,355 fi sh/hal by stocking each 0.02-ha pond half with 250 catfis h fi ngerl ings (Tucker and Robinson 1990). In addition, we stocked each pond ha lf with 5 kg of golden sh iners. or the amount we esti mated that cormorants would need to survive if they chose to forage exclusively on shjners. We used the largest shi ners available to us from our suppljer, averaging 18.2 glfish or
a mean (± SEM) of 274.00 ± 5 .48, (N =
6) per pond half. and stocked all fish on 4 January 1999.
Throughout the study we checked dissolved oxygen levels at least twice daj ly and bubble aerators placed in each pond half were turned on when dissolved oxygen dropped be low 3 mglL. We initiated peri odic low-level fi sh feeding on 27 January 1999 with a 32% protein (0 .3-cm) Hoating pe ll et, and ult imately shifted to satiation feed ing with a 0 .5-cm fl oating pellet during the summer months un til 17 October 1999.
To monitor fish mortality. we recorded and removed all dead fis h daily fro m all pond halves. When mortalities exceeded two dead fish per d. we submitted fish to the d.iagnostic laboratory at the Mississippi State University Co ll ege of Ve te r ina ry M edicine and followed their recom_mendations concerning a treatment regimen.
We complete ly inventoried aU catfish by seining and scrapping ponds (hand removing all remaining fish from drained ponds) on 19 and 20 October 1999, respective ly. In addition to counting all catfi sh, we in dividua lly weighed about half of a ll fis h counted to estimate the total biomass of fi sh in each po nd half. A lthough we attempted to count the shiners remaining. spawning of these fish in some ponds precl uded an accurate count. We summarized catfish production data by comparing inventories with and without cormorant predation. Fish losses (number and biomass) from predation were assumed to be the difference in the inventory between paired pond haJves with and without predati on.
The predation treatment consisted of one cormorant per unprotected pond half foraging for ten consecutive d. This foraging acti vity simulated 30 cormorants foraging on a 6-ha po nd (Stickley et al. 1992) for 100 d (500 cormorant dlha). Cormorants were placed on each test pond during the eveni ng of 22 February 1999 and removed on the evening of 4 March 1999.
Cormorant foraging activi ty was IlloniLOred during the trealment period. by ob-
88 GL\H N AI'lO DORR
serving birds from an elevated observation tower during (wo 3-h sessions each d. The first session started at 0830 h and ended at I 130 h. The second session started at 1330 h and ended at 1630 h. These time periods were selected because cormorants are almost exclusively diurnal (Hatch and Weseloh 1999) . During the 3-h sessions each of the three cormorants was sequentially observed continuously for 50 min . The dai ly sequence of focal observations was varied randomly.
During these observations the duration of primary activities (foraging and loafin g), fi sh species captured, total prey length, and the extent of time needed to manipulate fi sh for swallowing (handling time) were recorded . Connorants were considered to be foraging during sequences of diving or slow swimming with the bird's head under water (peering). To obtain more data on the ratio of catfi sh to shiners captured. observers recorded all fi sh seen captured by cormorants on lest ponds not intensively observed.
We sununari zed observational data by detennining the amount of time that cormorants devoted to foraging and the number of catfish captured during thi s time. The number of catfi sh captured per d was determined from the number of catfish captured per h by the total time cormorants spent foraging per d. Total foraging time was estimated by extrapolating the percent of t.ime that cormorants foraged during observations, and the number o f daylight hours avai lable for foraging . We summed the observed number of catfi sh and shiners captured for each cormorant, and compared these data to the number of these fish stocked using Chesson's alpha (a) as a measure of prey selection preference (Chesson 1978). We used a t test to compare mean prey hand l.ing times and observed prey length between catfish and shiners.
2000 PredCilioll Trial
The 2000 tria l was identical to the trial in 1999. with a few exceptions. Fi sh were stocked in ponds about I mo late r (9 Feb-
ruary 2000) than in 1999. and inventoried about 3 wk earlier (25 and 26 September). The same lotaJ biomass of golden shiners was used per pond half (5 kg); however. shiners were smaller, averaging only 5.9 g/ fi sh or a mean (± SEM) of 809.17 ± 37.96 (N = 6) fi sh per pond half. The feedin g regimen and water quality monitoring para lle led that used in 1999. but feeding had to be suspended periodically due to repeated disease outbreaks in test ponds. We summarized fish production data in an identical manner and, where appropriate, combined it with the 1999 data and ana lyzed diffe rences in production using a paired I test. Although a different group of lest birds was used, the predation treatment was identical and applied during the first 10 d of March. Observation data were collected and summarized in an identical manner and combined and compared with 1999 data using a I test.
Results
1998 Predation Trial
There was an in ventory shortage of 548 catfish from the pond where six cormorants foraged for 8.5 d, whi le 837 catfish were missing from the pond where approximately 9.5 cormorants foraged for the same period. In contrast, onl y 13 fish were missing from t.he control pond, which was consistent w ith the negligible di sease- related mortality observed on a ll po nds. Assuming equal disease-related mortality across all ponds. cormorants were estimated to consume 535 and 824 catfish or 10.5 and 10.2 catfishlbird per d. We calculated mean catfish weight at inventory for all ponds using fi ve samples of 50 fi sh each (N = 5). Mean (± SEM) fi sh weight for ponds with six and 9.5 cormorants were 57 .9 ± 2.5 and 50.6 ± 3.3 grams, respectively. The mean (± SEM) fi sh weight from the control pond was 4 1.7 ± 0 .7 g (N = 5). Assuming that mean fi sh weights changed little over the 2-wk test period. cormorants were estimated
CORMORANT PREDA nON ON CATFISH 89
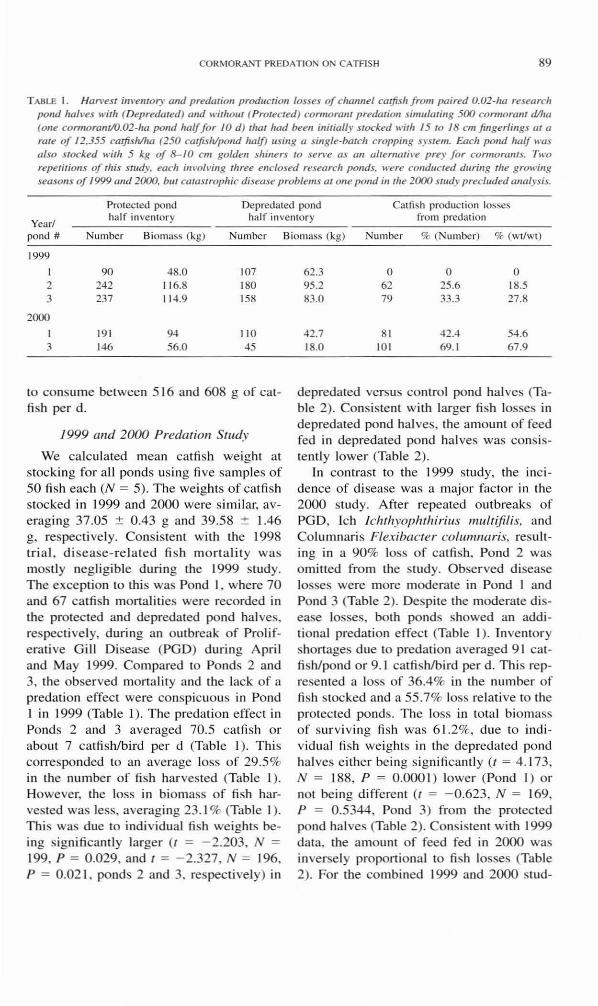
T ABLE I . Han'est ilJvemor), (lIId predmio/l productioll losses of challnel cmfish from paired 0.02-ha research pond ,w/\,t!s with (Depre(lated) and w;tho lll (Protected) cormoralll predation ,simulatilJg 500 cormomllf d/1w (one conuOrtlfJllO.02-ha pOlJd half for 10 d ) that had beell ;1I;tially stocked with 15 to / 8 cm finger/illgs at ( I
mte of 12.355 carjish/lw (250 catfish/pond ha/f) us ing a sing le-batch cropping system. Each pond half was also sl(x:ked with 5 kg of 8-10 cm goldell slliners to sen 'e as an alte matil'e pu)' for cormorallls. T,,'o repetitions of this slluly. each im'olving three enclosed research ponds. were cond"c ted during the gro\\'ill8 seasolls of 1999 and 2000. bm catastrophic disease problems at o lle pond ill the 2000 s tlldy precluded analysis.
Protected pond Depredated pond Catfish production losses
Yearl half inventory half inventory from predat ion
pond # Number Biomass (kg) Number
1999
90 48.0 107 2 242 11 6.8 180 3 237 11 4.9 158
2000
1 191 94 110 3 146 56.0 45
to consume between 5 16 and 608 g of catfi sh per d .
1999 and 2000 Pretialion Study
We calculated mean catfish weight at stocking for all ponds using fi ve samples o f 50 fi sh each (N = 5). The weights of catfi sh stocked in 1999 and 2000 were similar, averaging 37.05 ± 0.43 g and 39.58 ± 1.46 g, respecti vely. Consistent with the 1998 tri al. di sease-related fi sh mort ali( y was mostly negligible during the 1999 study. The exception to this was Pond I , where 70 and 67 catfish monal ities were recorded in the protected and depredated pond ha l ves. respecti vely. during an outbreak of Proliferative G ill Disease (PO D) during April and May 1999. Compared to Po nds 2 and 3, the observed mortality and the lack of a predation effect were conspicuous in Pond I in 1999 (Table I). The predation effect in Ponds 2 and 3 averaged 70 .5 catfish or about 7 catfish/bird per d (Table I). This corresponded to an average loss of 29.5% in the number of fi sh har vested (Table I). However, the loss in biomass of fi sh harvested was less, averaging 23. 1 % (Table I). Th is was due to individual fish weights being signi ficantly larger (I = - 2.203, N =
199, P = 0.029, and I = - 2.327, N = 196. P = 0.02 1, ponds 2 and 3. respectively) in
Biomass (kg) Number % (Number) % (Wt/WI)
62.3 0 0 0 95.2 62 25.6 18.5 83.0 79 33.3 27.8
42 .7 81 42.4 54.6 18.0 101 69. 1 67.9
depredated versus control pond halves (Table 2). Consistem with larger fi sh losses in depredated po nd ha lves. the amount o f feed fed in depredated pond halves was consistently lower (Table 2).
In contrast to the 1999 study, the inc idence of disease was a major factor in the 2000 study. After repeated outbreaks o f PO D, Ich Ichlhyophlhirills 1Il1l/liji/is, and Colunlnari s Flexibacler colul1lnaris, resulting in a 90% loss of catfish. Pond 2 was omitted fro m the study. Observed disease losses were more moderate in Pond I and Pond 3 (Table 2). Despite the moderate disease losses, both ponds showed an add itional predation effect (Table I). Inventory shortages due to predation averaged 9 1 catfis h/pond or 9. 1 catfishlbird per d . This represented a loss of 36.4% in the number of fi sh stocked and a 55.7% loss re lati ve to the protected ponds. The loss in (otal bi omass of surviving fi sh was 6 1.2%, due to individual fi sh weights in the depredated pond hal ves eithe r be ing significantly (t = 4. 173. N = 188, P = 0.000 I) lower (Pond I) or not be ing different (I = -0.623, N = 169, P = 0.5344, Pond 3) from the protected pond halves (Table 2) . Consistent with 1999 data, the amount of feed fed in 2000 was inverse ly proportiona l to fish losses (Table 2). For the combined 1999 and 2000 stud-
90 GLAHN AND DORR
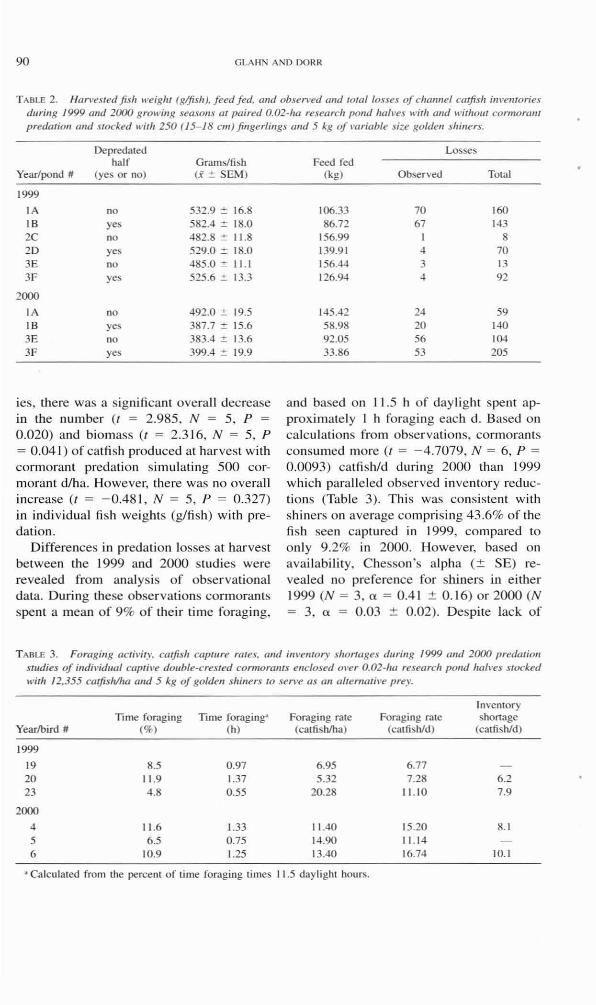
T ABLE 2. Harl't!sled fish weighl (gljish). feed fed. and observed and total losses of channel catfish im'enlories dUTillg 1999 and 2000 growing seasons al paired 0.02+/'0 resetlrch pond hah'l's wilh and wilholl' connOrl"'! predmion and stocked wilh 250 (15--18 cm)fillgeriings and 5 kg o/l·ariable size golden shiners.
Depredaled half Grams/fish
Year/pond # (yes or no) (.i' :!: SEM)
1999
IA no 532.9 ~ 16.8 IB yes 582.4 :::!: 18.0 2C no 482.8 :::!: 11.8 2D yes 529.0 :::!: 18.0 3E no 485.0 ", 11.1 3F yes 525.6 ::!: 13.3
2000
IA no 492.0 ::!: 19.5 IB yes 387.7 '" 15.6 3E no 383.4 ::!: 13.6 3F yes 399.4 ::!: 19.9
ies, there was a significant overall decrease in the nLlmber (I = 2.985, N = 5, P = 0.020) and biomass (I = 2.316, N = 5, P = 0.041) of cal fi sh produced al harveS! with cormorant predation simulating 500 cormorant d/ha. However, there was 110 overall increase (/ = - 0.48 1, N = 5, P = 0.327) in indi vidua l fi sh weights (g/fi sh) with predation.
Differences in predation losses at harvest between the 1999 and 2000 studies were revealed from analysis of observational data. During these observations cormorants spent a mean of 90/0 of their time foraging,
Losses Feed fed
(kg) Observed Total
106.33 70 160 86.72 67 143
156.99 8 139.91 ~ 70 156.44 3 13 126.9~ ~ 92
145.42 24 59 58.98 20 140 92.05 56 104 33.86 53 205
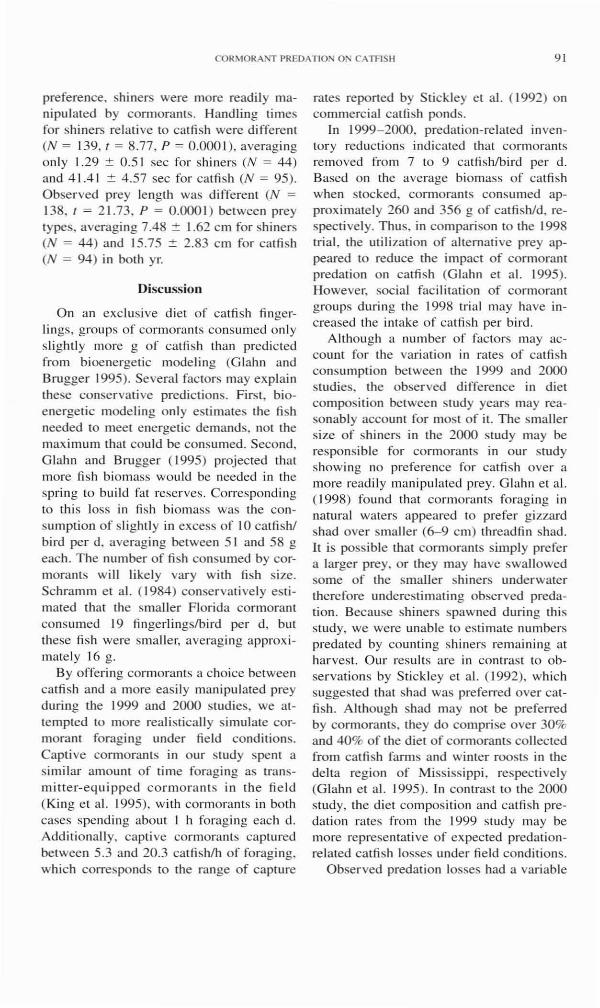
and based on I 1.5 h of daylight spenl approx.imately 1 h foraging each d. Based on calculations from observations, cormorants consumed more (I = - 4.7079, N = 6, P =
0.0093) catfish/d during 2000 than 1999 which paralleled observed in ventory reductions (Table 3). This was consistent with shiners on average comprising 43.6% of the fish seen caplUred in 1999, compared to only 9.2% in 2000. However, based on avai labililY, Chesson's alpha (0: SE) revealed no preference for shiners in either 1999 (N = 3, a = 0.41 0: 0.16) or 2000 (N = 3, a = 0 .03 0: 0 .02). Despite lack of
TABLE 3. Foraging aCfivilY. cOIfis" capwre rates. alld il/ventory shortages during 1999 alld 2()()() predation slUdies of imlil'idlla/ ClIP!;"/! double-crested cormoralllS enclosed ol'er O.02-Jw resellrch pond halves stocked with 12.355 Clltfishilla lind 5 kg of go/dell shiners 10 sen'e as (III alremat;, ,1' prey.
Inventory lime fomging Time fomging'" Foraging rate For.lging rate shollage
Yearlbird # (%) (h) (caLfi sh/ha) (catfish/d) (catfish/d)
1999
19 &.5 0.97 6.95 6.77 20 I 1.9 1.37 5.32 7.28 6.2 23 4.8 0.55 20.28 11.10 7.9
2000
4 I 1.6 1.33 11.40 15.20 8.1 5 6.5 0.75 14.90 I 1.14 6 10.9 1.25 13.40 16.74 10.1
.. Calculated from the percent of lime forag ing times I 1.5 daylight hours.
CORMORANT PREDATION ON CATFIS H 91
preference, shiners were more readily manipulated by cormorants. Handling times for shi ners relative to catfish were different (N = 139, 1 = 8.77, P = 0.000 1). averaging only 1.29 :!: 0.5 1 sec for shine rs (N = 44) and 4 1.4 1 :!: 4.57 sec for catfish (N = 95). Observed prey length was different (N = 138. I = 2 1.73. P = 0.000 I) between prey types. averaging 7.48 :!: 1.62 em for shiners (N = 44) and 15.75 :!: 2.83 em for catfish (N = 94) in both yr.
Discussion
On an exclusive diet of catfish fi ngerlings. groups of cormorants consumed on ly slightly more g of catfish than predi cted from bioenergetic modeling (G lahn and Brugger 1995). Severa l factors may explai n these conservative predictions. First, bioenergetic modeling only estimates the fish needed to meet energetic demands. not the max imum that could be consumed. Second. Glahn and Brugger ( 1995) projected that more fi sh biomass would be needed in the spring to build fat' reserves. Corresponding to this loss in fish biomass was the consumption of s li ghtl y in excess of 10 catfis h/ bird per d. averaging between 51 and 58 g each. T he number of fi sh consumed by cormorants will likely vary wi th fish size. Schramm e t al. ( 1984) conservatively estimated that the smaller Florida cormorant consumed 19 fi ngerlings/bird per d, but the~e fish were smaller, averaging approx imately 16 g.
By offering cormorants a choice between catfish and a more easi ly man ipulat.ed prey during the 1999 and 2000 studies, we at
tempted to more realistically simulate cormorant foraging under field conditions. Captive cormorants in our study spent a simi lar amount of time foraging as transmitter-equipped cormoran ts in the fi eld (King et al. 1995) , with cormorants in both cases spending about I h foraging each d. AdditionaJl y. capti ve cormorants captured between 5.3 and 20.3 catfishlh of foragi ng. whk h corresponds to the range of capture
rates reponed by Stickley et al. ( 1992) on commercial catfish ponds.
In 1999- 2000, predation-related inventory reductions indicated that cormorants removed from 7 to 9 cmfishlbird per d . Based on the average biomass of catfish when stocked, cormorants consumed approximately 260 and 356 g of catfish/d. respectively. Thus. in comparison to the 1998 triaL the utilization of alternative prey appeared to reduce the impact of connorant predation on catfish (G lahn et al. 1995). However. social facilitation of cormorant groups during the 1998 trial may have increased the intake of catfish per bird.
Although a number of fac tors may account for the variati on in rates of catfi sh consumption between the 1999 and 2000 studjes. the observed difference in diet composition between study years may reasonably account for most of it. The smaller size of shiners in the 2000 study may be responsible for cormorants in our study showi ng no preference for catfi sh over a more readil y manipulated prey. G lahn et a l. ( 1998) found that cormorants foraging in natural waters appeared to prefer gizzard shad over smalle r (6-9 em) threadfi n shad. It is possible that cormorants simply prefer a larger prey. or they may have swallowed some of the smaller shiners underwater therefore underesti mat ing observed predati on. Because shiners spawned during th is study, we were unable to estimate numbers predated by counting shiners remaining at harvest. Our results are in contrast to observati ons by Stick ley e t al. (1992). whi ch suggested that shad was preferred over catfish. Although shad may not be preferred by cormorants. they do comprise over 30% and 40% of the diet of cormorants collected from catfish farms and winter roosts in the delta region of Mississippi , respectively (Glahn et al. 1995). In contrast to the 2000 study, the diet compos ition and catfish predation rates frol11 the 1999 study may be more representative of expected predationre lated catfish losses under fie ld conditions.
Observed predation losses had a variable
92 GLAHN AND DORR
effect on catfi sh bio mass at harvest. In the 1999 study, two ponds experiencing neglig ible d isease problems had a 30% loss in the number of fish harvested, but fi sh harvested from the depredated pond ha l f were larger due to density-dependant factors on growth (Tucker and Robinson 1990). Thi s resulted in only a 23% loss in tota l fi sh biomass. I n contrast, no predation-related production loss was observed in a third pond experiencing a disease-related loss exceeding 50% of the fi sh stocked. However, po nds experiencing more modest diseasere lated losses in the 2000 study had large predati on-re lated production losses. In 2000 the percent loss in biomass ei ther equaled or exceeded the percent loss by number, presumably because stocki ng density had been decreased from disease mortality. With the exception of ponds suffering large production losses from disease, predation losses at harvest appeared to be additi ve and para lle led the expected number of fingerlings lost at the time of predation.
Some practi ca l implicati ons can be drawn from thi s study for s ingle-batch 6-ha commercia l ponds stocked at 12.355 fi shlha receiving 3.000 cormorant' d of predation (i.e., 30 cormorants foraging for 100 d) over the winter months. Based on the more conservati ve loss estimates of OUf 1999 study and assuming golden shiners were suitable surrogates for shad, cormorants foraging o n catfish ponds with shad as alternati ve prey would remove about 30% of fi ngerlings stocked . This equates to approximately 22,000 fi sh at a repl acement value of approx imately $2 ,200 (Glahn and Brugger 1995) . However, the correspo ndin g 20% biomass production loss at har vest would amount to a loss of 6.800 kg of catfi sh valued at $ 10,500 (assuming $ 1.54Ikg), or 5 times the va lue of fin gerlings los t. Further economic considerati ons of these data are d iscussed in detail by G lahn et al. (i n press).
Confinement of cormorants and differences in scale between O Uf research ponds and commercial ponds may have affected
observed predation levels and consequently extrapolation of results to field situations. Despite these factors and the probable moderating effects of alternative prey utilization. we conclude that cormorants can cause signi ficant economic losses to catfish production at harvest. A lthough these studies provide some preliminary insight regarding possible effects of cormorant predation on yield at harvest, further studies are needed to exam.ine the effects of cormorant social facilitation, alternati ve prey size and density. d ifferent stocking rates o f catfi sh, and multiple-batch c ropping of catfish (Tucker et a l. 1992; Erwin J 995).
Acknowledgments
We thank Louie T ho mpson of Thompson Fisheries for donating catfish fi ngerlings used in this study. Paul Fioranelli and Brent H arrel assisted wi th various aspects of this study. We also thank Aquaculture Unit personnel of the Mississippi State University A griculture and Forestry Experiment Statio n (MAFES) who assisted us with management of our fi sh ponds. Tommy King, Mark Tobin , and Scott Werner made he lpful suggestions on earlier drafts of thi s manuscript.
Literature Cited
Chesson, J. 1978. Measuring preference in selective predation. Ecology 59: 135- 144.
Erwin, M. R. 1995. The ecology o f comlOrants: some research needs and recommendations. Colonial Waterbirds 18 (Special Publication 1):240-246.
G lahn, J. F. and K. E. Brugger. 1995. The impact of double-crested cormorants on the Miss issippi delta catfi sh industry: a bioenergetics model. Colonial Waterbi rds 18 (Special Publ ication 1):168-175 .
Glahn , J. 1'. , P. J. Dixon, G. A. LiUauer, and R. U. McCoy. 1995. Food habi ts of double-crested cor· morilnts wintering in the de lta region of Miss iss ippi. Colonial Waterbirds 18 (Special Pu bl ication 1): 158- 167.
Glahn , J. "~ ., J. B. Harrel, and C. Vyles. 1998. The diet of wintering double-crestcd COnnOranL'i fceding at lakes in the southern United States. Colonial Waterbirds 2 1 :446-452.
Glahn. J. F .• O. S. Reinhold, and C. A. S loan. 2000. Recent population trends of double-<:rested cor·
CORMORANT PReOATION ON CATFISH 93
moranlS wintering in the delta region of Mississipp i: responses to roost dispersa l and re moval under a recent depredation orde r. Waterbi rds 23( I): 38-44.
G labn, J . F., S. J . Werner , T. Hanson, and C. R. Engle. In press. Cormorant depredation losses and their prevention at catfi sh farms: econo mic considerations. Proceeding of Human Conflicts with Wildlife: Economic Considerations Conference.
Hatch, J. J_ a nd D. V. Wese,loh. 1999. Double-crested Cormorant (Plwlacrocorax (Illrirus). III A. Poole and F Gill . ed itors. The birds of Nonh America.
o. 441. The Birds of North America. Inc .. Philadelphia. Pennsylvania. USA.
King, D. T., K. J. Andrews, J . O . King, R. D. Flynt, J. F. Glahn, and J. L.. C ummings. 1994. A nightlighting technique for capturing double-crested cormorants. Journal of Field Ornithology 65(2): 254-257.
King, D. T_. J. F. Glabn, and K. J. Andrews. 1995. Dai ly activity budgets and movemen ts o f winter roosting double-crested cormorants determined by biotelemetry in the delta region of Mississippi. Colo nial Waterbirds 18 (Special Publication I): 152- 157.
King, O. T .• M. E. Tobin, and M. Burr. 2000. Capture and telemetry techniques for double-c rested
comlOrants (Phalacrocora:c allritus). Proceeding of Vel1cbmte Pest Conference 19:54- 57.
Schramm, H. L .• Jr., B. French, and M. Ednoff. 1984. Depredation o f channel calfi sh by A orida double-crested cormoranls. Progressive Fish Culturist 46(1):41 --42.
Slickley, A. R., Jr_ and K. J. Andrews. 1989. Survey of Mississippi catfish farmers on means, c rfon . and costs to repel fish-eating birds from ponds. Proceeding Easte rn Wildlife Damage COnLrol Confercnce 4 : 1 05- 1 08.
Stickley, A. R., Jr., G. L. Wurrick , and J. F. Glahn. 1992. Impact of double-c rested cormorant populations on channel catfish farms. Journal of the World Aquaculture Society 23:192- 198.
Tucker, C. S. and E. H. Robinson. 1990. Channel catfi sh fann ing ha ndbook. Van Nostrand Reinhold. New York. USA. 454 pp.
Tucker. C. S .• J. A. St~by, J . E. Waldrop~ and A. B. Garrard. 1992. Effects of cropping syslcm and stocking density on production of channel ca tfish in ponds. Bullctin 988. Mississippi Agricultural and ForeslIY Experimcnt Station. Miss issippi State, Mississippi. USA.
Wywialowski, A. P. 1999. Wild life-caused losses for producers of chan nel catfi sh /cta lun4s pun(.·/lIIlIS
in 1996. Journal of World Aquacu lture Society 30: 461 - 472.