economic impact of double-crested cormorant, phalacrocorax auritus, depredation on channel catfish,...
TRANSCRIPT
JOURNAL OF THEWORLD AQUACULTURE SOCIETY
Vol. 43, No. 4August, 2012
Economic Impact of Double-Crested Cormorant, Phalacrocoraxauritus, Depredation on Channel Catfish, Ictalurus punctatus,
Aquaculture in Mississippi, USA
Brian S. Dorr1
U.S. Department of Agriculture, Wildlife Services, National Wildlife Research Center,Mississippi Field Station, P.O. Box 6099, Mississippi State, Mississippi 39762, USA
Loren W. Burger
Department of Wildlife, Fisheries and Aquaculture, P.O. Box 9690, Mississippi State,Mississippi 39762-9690, USA
Scott C. Barras
U.S. Department of Agriculture, Wildlife Services, P.O. Box 130, Moseley, Virginia 23120, USA
Kristina Casscles Godwin
U.S. Department of Agriculture, Wildlife Services, P.O. Drawer FW, 200 Thompson Hall,Mississippi State, Mississippi 39762, USA
AbstractThe Yazoo River Basin of Mississippi, USA, supports the largest concentration of hectares devoted
to channel catfish, Ictalurus punctatus , aquaculture production in North America. The Yazoo Basinalso supports large numbers of resident, wintering and migrating fish-eating birds, with the Double-crested Cormorant, Phalacrocorax auritus, implicated as the most serious depredating species. Weused data from aerial surveys of numbers and distribution of cormorants in the Yazoo Basin andon commercial catfish ponds during winters (November–April) 2000–2001 and 2003–2004 to refineestimates of regional economic losses due to cormorant depredation. In both periods, the greatestmonthly estimates of cormorant foraging occurred from 1 January to 31 March. Losses in terms ofbiomass, number, and dollar value were greater for foodfish ponds than fingerling ponds. Monthlyweighted estimates of catfish consumed were 1775.3 and 1346.6 m.t. over winters 2000–2001 and2003–2004, respectively. Total estimated losses for foodfish and fingerling ponds in 2000–2001 were$11.56 and $0.48 million, respectively, and in 2003–2004 were $5.22 and $0.40 million, respectively.Maximum dollar loss occurred during March in 2000–2001 and during February in 2003–2004. Inthis study, the volatility in variable production costs and nominal sales price, and distribution ofcormorants on pond types and regionally were key factors in resulting economic loss estimates.
Commercial production of channel catfish(catfish) is the largest aquaculture industry inthe United States with catfish being the sixthmost frequently consumed finfish in the UnitedStates as of 2008 (National Fisheries Insti-tute 2009). The farm-gate value of the catfishcrop was estimated at $373 million in 2009(USDA NASS 2009), and sales of fresh and
1 Corresponding author.
frozen processed product grossed $613 millionin 2008 (Hanson and Sites 2009). More thanhalf of the total hectares in production andassociated value of catfish produced occur inthe Yazoo River Basin (Yazoo Basin) of Mis-sissippi (Hargreaves and Tucker 2004). Geo-logic and socioeconomic factors, such as theready availability of large quantities of ground-water, existing agriculture infrastructure, flattopography, and clay soils with low infiltration
Published 2012. This article is a U.S. Government work and is in the public domain in the USA.
502
CORMORANT DEPREDATION ON CATFISH AQUACULTURE 503
rates, have made the Yazoo Basin conduciveto catfish aquaculture (Hargreaves and Tucker2004). These characteristics have allowed forlarge-scale catfish production methods in theYazoo Basin suited to “embankment” type pro-duction ponds (Boyd 1985, 2004). Embank-ment ponds are typically large (3–8 ha), shal-low (1.2–1.8 m), open rectangular ponds (Boyd2004) with the average farm in the Yazoo Basincomprised of 25 ponds totaling 117 ha of watersurface area (USDA 2003). These embankmenttype production ponds provide a readily avail-able food resource for many species of fish-eating birds.
Many of the characteristics that make theYazoo Basin conducive to large-scale catfishaquaculture also make it an important area forresident, migratory and wintering waterbirds.Included among these waterbirds are numer-ous piscivorous species that come into conflictwith aquaculture producers. A survey of cat-fish producers in 1996 indicated that the twoprimary sources of catfish losses in commer-cial operations were disease (45%) and wildlife(37%) (USDA 1997). Of wildlife species atcatfish farms, species or species groups of pis-civorous birds have been identified as the pri-mary depredators. These birds include Double-crested Cormorants (cormorant), wading birdsand the American White Pelican Pelecanus ery-throrhynchos (Wywialowski 1999). Cormorantswere implicated by catfish producers as themost serious depredating species with respectto direct predation losses (Wywialowski 1999).The fact that cormorants are perceived as theprimary depredating species is likely due to thefact that cormorant populations have increasedby an order of magnitude since the 1970s(Hatch 1995; Tyson et al. 1999). The impor-tance of catfish aquaculture production and thenumber of cormorants wintering in the YazooBasin and utilizing aquaculture have resulted inincreasing concern with the economic impactsof depredation.
Economic loss associated with cormorantdepredation has been estimated by variousmethods and at various scales. At the industryscale, Wywialowski (1999) used producer sur-veys to estimate a $12 million annual loss due
to wildlife. However, this estimate included alldepredating wildlife species and did not parti-tion the component attributable to cormorants.
Glahn and Brugger (1995) used a bioener-getics modeling approach to estimate regionalloss in the Yazoo Basin specific to cormorants.Spatial distribution of cormorants in the YazooBasin was a significant factor in Glahn andBrugger’s (1995) loss estimates because thereare significant differences in diet based onwhere cormorants forage in the Yazoo Basin.Glahn and Dorr (2002) estimated losses at har-vest for foodfish grow-out ponds at a givenstocking rate and levels of cormorant pre-dation (500 cormorant/d/ha/yr) observed byStickley et al. (1992) and in the presenceof a “buffer” prey species, golden shiner,Notemigonus chrysoleucas. Glahn and Dorr(2002) found that loss at harvest in this sce-nario was 22% of biomass, resulting in a 111%loss in profit per pond. Glahn et al. (2002) andGlahn and Dorr (2002) estimated that losses atharvest may be as much as five times greaterthan replacement cost to producers (i.e., fin-gerling sale price) if losses occur on foodfishponds compared with fingerling ponds. Becausedata on the distribution of cormorants on pro-duction pond types were unavailable to Glahnand Brugger (1995), their estimated losses of$5 million were determined at simple replace-ment cost of $0.10 per fingerling. The resultof the aforementioned research has been thatlosses to cormorant depredation on catfish aqua-culture in the Yazoo Basin have been estimatedat between $5 million and $25 million annu-ally, dependent on whether the loss is occur-ring on fingerling or foodfish ponds (Glahnet al. 2002). The estimated difference in lossis largely attributable to the distribution of cor-morants both geographically within the YazooBasin and their distribution on pond types (i.e.,foodfish or fingerling).
Our objective was to use aerial survey infor-mation on population estimates and distribu-tions of cormorants on commercial catfishponds obtained over a 2-yr period in the YazooBasin and incorporate this information withexisting food-habits and bioenergetics informa-tion specific to cormorants wintering in the
504 DORR ET AL.
Yazoo Basin. These data were then used torefine estimates of economic losses due to cor-morant depredation on catfish aquaculture in theYazoo Basin.
Materials and Methods
We used Glahn and Brugger’s (1995) approa-ch to estimating regional economic loss dueto cormorant depredation which was based onmodeling energy flow between predator andprey. Glahn and Brugger (1995) built a three-component model to estimate (1) individualenergy demand of cormorants wintering in theYazoo Basin, (2) extrapolate individual energydemands to population energy demands, and(3) estimate catfish crop losses per monthand total for the wintering season, given asNovember–April.
Glahn and Brugger (1995) developed esti-mates of basal metabolic rate (BMR) parti-tioned into active (day) and inactive (night)phases, adjusted for mean monthly temperature,average monthly day and night length in hoursand mean monthly biomass of cormorants col-lected for food habits in the Yazoo Basin duringwinters 1989–1990 and 1990–1991. The BMRestimate was adjusted upward for the additionalenergy required beyond BMR for thermoregu-lation based on time budgets for five activities(flying, diving, swimming, daytime loafing, andnight roosting) observed for VHF-marked cor-morants (King et al. 1995) in the Yazoo Basin.The resulting daily energy budget was thenadjusted for the average metabolic efficiency ofcormorants fed diets of catfish, gizzard shad,Dorosoma cepedianum, and bluegill, Lepomismacrochirus (Brugger 1992, 1993), which com-prise most of the diet of cormorants winteringin the Yazoo Basin (Glahn et al. 1995).
From this bioenergetics information, Glahnand Brugger (1995) developed the averagemonthly fish consumption in g/bird/d for cor-morants wintering in the Yazoo Basin. For thefirst and second model components, we used theaverage of the 2-yr individual fish consumptionin g/bird/d specific to each month developedfrom estimates derived by Glahn and Brugger(1995). We then extrapolated these individual
average monthly fish consumption estimates topopulation estimates derived from aerial nightroost surveys in the Yazoo Basin.
Aerial survey counts of cormorants in allknown night roosts in the Yazoo Basin werescheduled biweekly from October–April inwinters 2000–2001 and 2003–2004, and con-ducted by personnel with the United StatesDepartment of Agriculture, Wildlife Services,Mississippi (WS-MS). Aerial surveys were con-ducted in a Cessna 172 at 150–215 m aboveground level, at a flight speed of about 175 kph.Surveys were conducted from sunrise to 3 hafter sunrise and 3 h prior to sunset to sun-set following procedures described by Glahnet al. (1996).
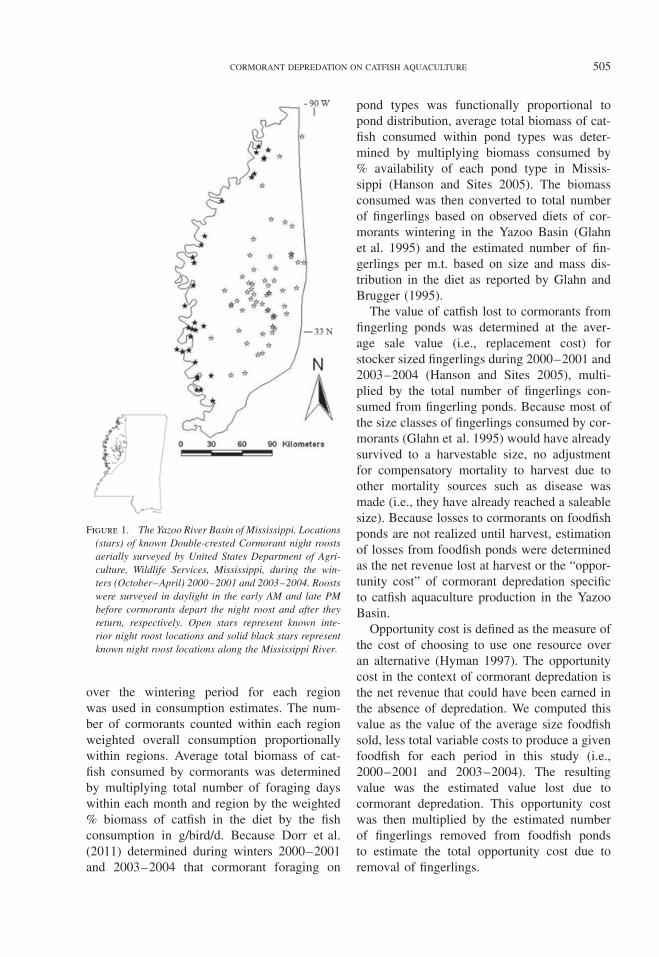
Aerial survey counts were used to developestimates of the number of cormorant forag-ing days per month derived from polynomialtrend equations that best described the relation-ship between the trend and biweekly night roostcounts as measured by the associated R2 value.Because diet varies between river and interiorroost locations (Glahn et al. 1995), we devel-oped separate polynomial equations for aerialcounts of cormorants night roosting within eachregion (Fig. 1). Cormorant counts at the begin-ning (i.e., 1 October) and end (i.e., 30 April) ofthe wintering period were assumed to be zero.The presence of resident birds and associateddepredation was considered to be negligible.By integrating the area under the curve of thetrend equation, we determined the total num-ber of cormorant days of predation per monthand region. Although aerial surveys were con-ducted to determine numbers of cormorants inthe Yazoo Basin in October, we did not usethese numbers in loss estimates because infor-mation on proportion of catfish in the diet islacking (Glahn et al. 1995). Also, bioenergeticsspecific to characteristics of cormorant physi-ology and activity in October have not beendeveloped as it has for other months.
Glahn et al. (1995) determined that the aver-age proportion of catfish biomass in diets ofcormorants roosting in the river region (Fig. 1)was 14.3 and 74.5% for the interior region(Fig. 1) in the Yazoo Basin (n = 461 stom-achs). The average biomass of catfish consumed
CORMORANT DEPREDATION ON CATFISH AQUACULTURE 505
Figure 1. The Yazoo River Basin of Mississippi. Locations(stars) of known Double-crested Cormorant night roostsaerially surveyed by United States Department of Agri-culture, Wildlife Services, Mississippi, during the win-ters (October–April) 2000–2001 and 2003–2004. Roostswere surveyed in daylight in the early AM and late PMbefore cormorants depart the night roost and after theyreturn, respectively. Open stars represent known inte-rior night roost locations and solid black stars representknown night roost locations along the Mississippi River.
over the wintering period for each regionwas used in consumption estimates. The num-ber of cormorants counted within each regionweighted overall consumption proportionallywithin regions. Average total biomass of cat-fish consumed by cormorants was determinedby multiplying total number of foraging dayswithin each month and region by the weighted% biomass of catfish in the diet by the fishconsumption in g/bird/d. Because Dorr et al.(2011) determined during winters 2000–2001and 2003–2004 that cormorant foraging on
pond types was functionally proportional topond distribution, average total biomass of cat-fish consumed within pond types was deter-mined by multiplying biomass consumed by% availability of each pond type in Missis-sippi (Hanson and Sites 2005). The biomassconsumed was then converted to total numberof fingerlings based on observed diets of cor-morants wintering in the Yazoo Basin (Glahnet al. 1995) and the estimated number of fin-gerlings per m.t. based on size and mass dis-tribution in the diet as reported by Glahn andBrugger (1995).
The value of catfish lost to cormorants fromfingerling ponds was determined at the aver-age sale value (i.e., replacement cost) forstocker sized fingerlings during 2000–2001 and2003–2004 (Hanson and Sites 2005), multi-plied by the total number of fingerlings con-sumed from fingerling ponds. Because most ofthe size classes of fingerlings consumed by cor-morants (Glahn et al. 1995) would have alreadysurvived to a harvestable size, no adjustmentfor compensatory mortality to harvest due toother mortality sources such as disease wasmade (i.e., they have already reached a saleablesize). Because losses to cormorants on foodfishponds are not realized until harvest, estimationof losses from foodfish ponds were determinedas the net revenue lost at harvest or the “oppor-tunity cost” of cormorant depredation specificto catfish aquaculture production in the YazooBasin.
Opportunity cost is defined as the measure ofthe cost of choosing to use one resource overan alternative (Hyman 1997). The opportunitycost in the context of cormorant depredation isthe net revenue that could have been earned inthe absence of depredation. We computed thisvalue as the value of the average size foodfishsold, less total variable costs to produce a givenfoodfish for each period in this study (i.e.,2000–2001 and 2003–2004). The resultingvalue was the estimated value lost due tocormorant depredation. This opportunity costwas then multiplied by the estimated numberof fingerlings removed from foodfish pondsto estimate the total opportunity cost due toremoval of fingerlings.
506 DORR ET AL.
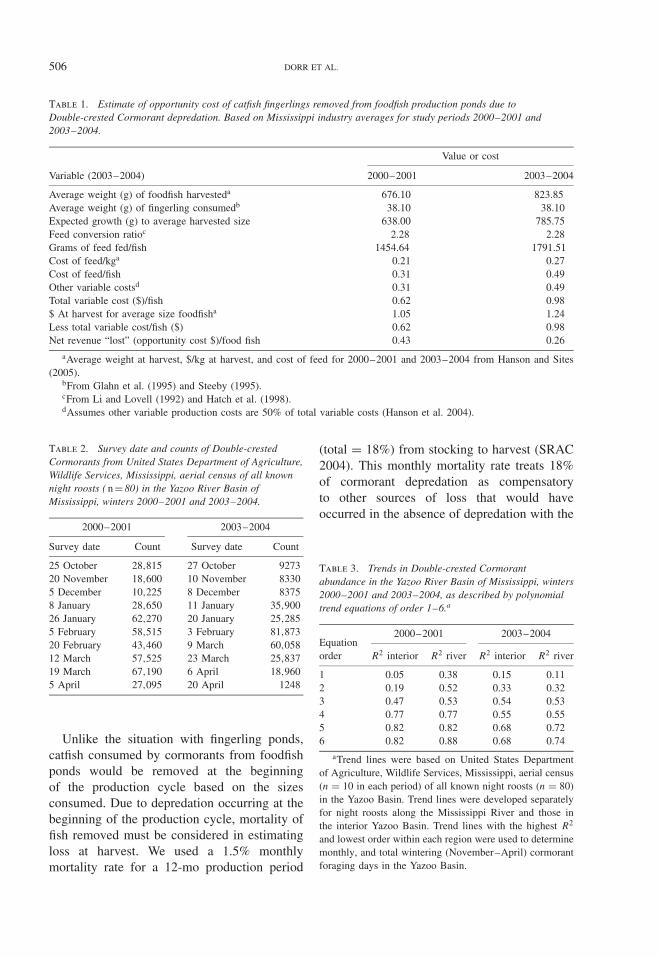
Table 1. Estimate of opportunity cost of catfish fingerlings removed from foodfish production ponds due toDouble-crested Cormorant depredation. Based on Mississippi industry averages for study periods 2000–2001 and2003–2004.
Value or cost
Variable (2003–2004) 2000–2001 2003–2004
Average weight (g) of foodfish harvesteda 676.10 823.85Average weight (g) of fingerling consumedb 38.10 38.10Expected growth (g) to average harvested size 638.00 785.75Feed conversion ratioc 2.28 2.28Grams of feed fed/fish 1454.64 1791.51Cost of feed/kga 0.21 0.27Cost of feed/fish 0.31 0.49Other variable costsd 0.31 0.49Total variable cost ($)/fish 0.62 0.98$ At harvest for average size foodfisha 1.05 1.24Less total variable cost/fish ($) 0.62 0.98Net revenue “lost” (opportunity cost $)/food fish 0.43 0.26
aAverage weight at harvest, $/kg at harvest, and cost of feed for 2000–2001 and 2003–2004 from Hanson and Sites(2005).
bFrom Glahn et al. (1995) and Steeby (1995).cFrom Li and Lovell (1992) and Hatch et al. (1998).dAssumes other variable production costs are 50% of total variable costs (Hanson et al. 2004).
Table 2. Survey date and counts of Double-crestedCormorants from United States Department of Agriculture,Wildlife Services, Mississippi, aerial census of all knownnight roosts ( n = 80) in the Yazoo River Basin ofMississippi, winters 2000–2001 and 2003–2004.
2000–2001 2003–2004
Survey date Count Survey date Count
25 October 28,815 27 October 927320 November 18,600 10 November 83305 December 10,225 8 December 83758 January 28,650 11 January 35,90026 January 62,270 20 January 25,2855 February 58,515 3 February 81,87320 February 43,460 9 March 60,05812 March 57,525 23 March 25,83719 March 67,190 6 April 18,9605 April 27,095 20 April 1248
Unlike the situation with fingerling ponds,catfish consumed by cormorants from foodfishponds would be removed at the beginningof the production cycle based on the sizesconsumed. Due to depredation occurring at thebeginning of the production cycle, mortality offish removed must be considered in estimatingloss at harvest. We used a 1.5% monthlymortality rate for a 12-mo production period
(total = 18%) from stocking to harvest (SRAC2004). This monthly mortality rate treats 18%of cormorant depredation as compensatoryto other sources of loss that would haveoccurred in the absence of depredation with the
Table 3. Trends in Double-crested Cormorantabundance in the Yazoo River Basin of Mississippi, winters2000–2001 and 2003–2004, as described by polynomialtrend equations of order 1–6.a
2000–2001 2003–2004Equationorder R2 interior R2 river R2 interior R2 river
1 0.05 0.38 0.15 0.112 0.19 0.52 0.33 0.323 0.47 0.53 0.54 0.534 0.77 0.77 0.55 0.555 0.82 0.82 0.68 0.726 0.82 0.88 0.68 0.74
aTrend lines were based on United States Departmentof Agriculture, Wildlife Services, Mississippi, aerial census(n = 10 in each period) of all known night roosts (n = 80)in the Yazoo Basin. Trend lines were developed separatelyfor night roosts along the Mississippi River and those inthe interior Yazoo Basin. Trend lines with the highest R2
and lowest order within each region were used to determinemonthly, and total wintering (November–April) cormorantforaging days in the Yazoo Basin.
CORMORANT DEPREDATION ON CATFISH AQUACULTURE 507
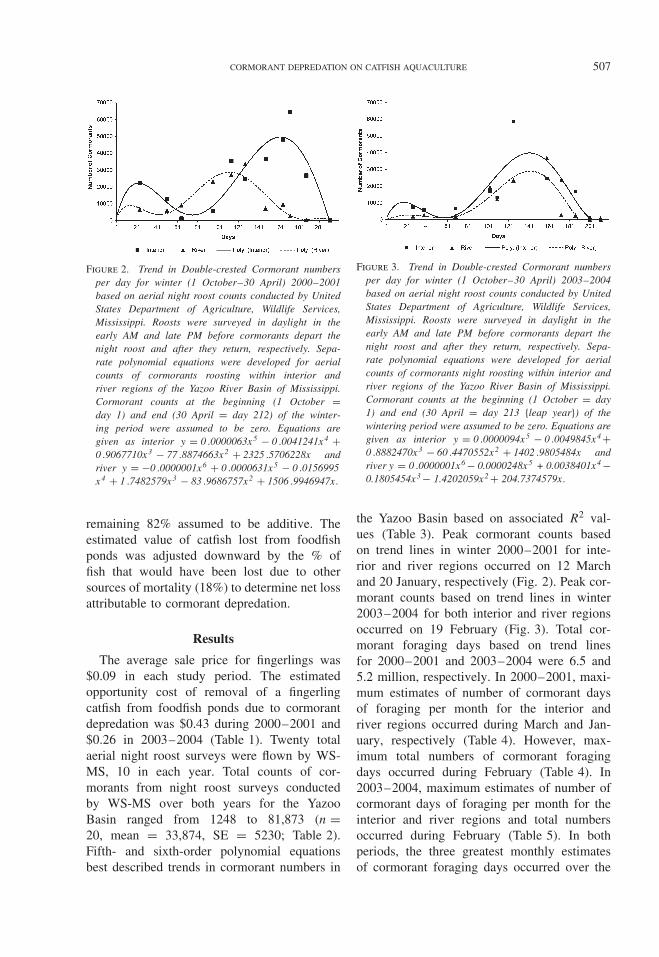
Figure 2. Trend in Double-crested Cormorant numbersper day for winter (1 October–30 April) 2000–2001based on aerial night roost counts conducted by UnitedStates Department of Agriculture, Wildlife Services,Mississippi. Roosts were surveyed in daylight in theearly AM and late PM before cormorants depart thenight roost and after they return, respectively. Sepa-rate polynomial equations were developed for aerialcounts of cormorants roosting within interior andriver regions of the Yazoo River Basin of Mississippi.Cormorant counts at the beginning (1 October =day 1) and end (30 April = day 212) of the winter-ing period were assumed to be zero. Equations aregiven as interior y = 0 .0000063x5 − 0 .0041241x4 +0 .9067710x3 − 77 .8874663x2 + 2325 .5706228x andriver y = −0 .0000001x6 + 0 .0000631x5 − 0 .0156995x4 + 1 .7482579x3 − 83 .9686757x2 + 1506 .9946947x.
remaining 82% assumed to be additive. Theestimated value of catfish lost from foodfishponds was adjusted downward by the % offish that would have been lost due to othersources of mortality (18%) to determine net lossattributable to cormorant depredation.
Results
The average sale price for fingerlings was$0.09 in each study period. The estimatedopportunity cost of removal of a fingerlingcatfish from foodfish ponds due to cormorantdepredation was $0.43 during 2000–2001 and$0.26 in 2003–2004 (Table 1). Twenty totalaerial night roost surveys were flown by WS-MS, 10 in each year. Total counts of cor-morants from night roost surveys conductedby WS-MS over both years for the YazooBasin ranged from 1248 to 81,873 (n =20, mean = 33,874, SE = 5230; Table 2).Fifth- and sixth-order polynomial equationsbest described trends in cormorant numbers in
Figure 3. Trend in Double-crested Cormorant numbersper day for winter (1 October–30 April) 2003–2004based on aerial night roost counts conducted by UnitedStates Department of Agriculture, Wildlife Services,Mississippi. Roosts were surveyed in daylight in theearly AM and late PM before cormorants depart thenight roost and after they return, respectively. Sepa-rate polynomial equations were developed for aerialcounts of cormorants night roosting within interior andriver regions of the Yazoo River Basin of Mississippi.Cormorant counts at the beginning (1 October = day1) and end (30 April = day 213 {leap year}) of thewintering period were assumed to be zero. Equations aregiven as interior y = 0 .0000094x5 − 0 .0049845x4 +0 .8882470x3 − 60 .4470552x2 + 1402 .9805484x andriver y = 0 .0000001x6 − 0.0000248x5 + 0.0038401x4 −0.1805454x3 − 1.4202059x2 + 204.7374579x.
the Yazoo Basin based on associated R2 val-ues (Table 3). Peak cormorant counts basedon trend lines in winter 2000–2001 for inte-rior and river regions occurred on 12 Marchand 20 January, respectively (Fig. 2). Peak cor-morant counts based on trend lines in winter2003–2004 for both interior and river regionsoccurred on 19 February (Fig. 3). Total cor-morant foraging days based on trend linesfor 2000–2001 and 2003–2004 were 6.5 and5.2 million, respectively. In 2000–2001, maxi-mum estimates of number of cormorant daysof foraging per month for the interior andriver regions occurred during March and Jan-uary, respectively (Table 4). However, max-imum total numbers of cormorant foragingdays occurred during February (Table 4). In2003–2004, maximum estimates of number ofcormorant days of foraging per month for theinterior and river regions and total numbersoccurred during February (Table 5). In bothperiods, the three greatest monthly estimatesof cormorant foraging days occurred over the
508 DORR ET AL.
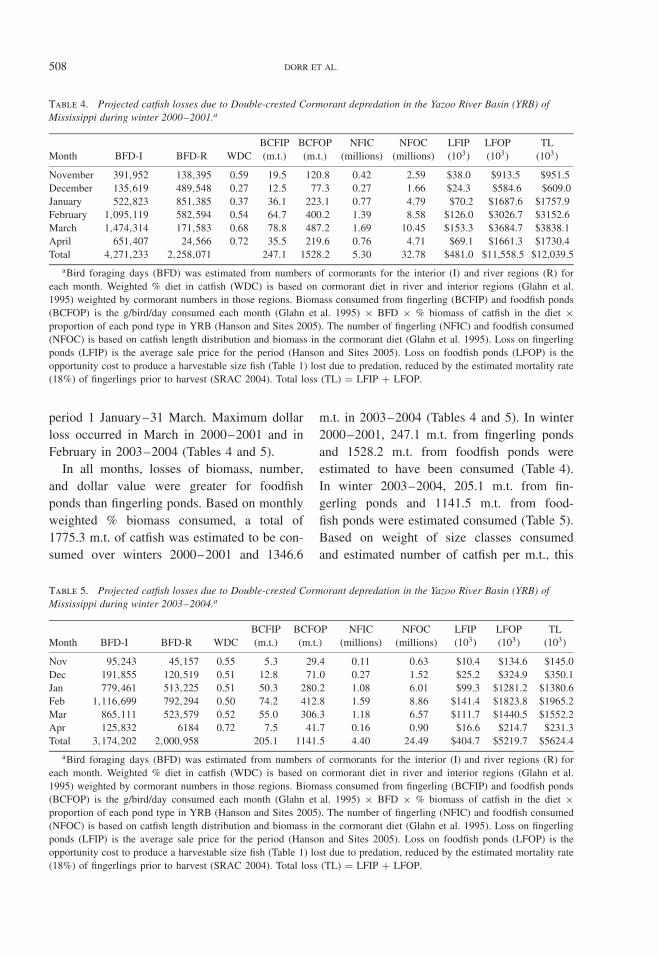
Table 4. Projected catfish losses due to Double-crested Cormorant depredation in the Yazoo River Basin (YRB) ofMississippi during winter 2000–2001.a
Month BFD-I BFD-R WDCBCFIP(m.t.)
BCFOP(m.t.)
NFIC(millions)
NFOC(millions)
LFIP(103)
LFOP(103)
TL(103)
November 391,952 138,395 0.59 19.5 120.8 0.42 2.59 $38.0 $913.5 $951.5December 135,619 489,548 0.27 12.5 77.3 0.27 1.66 $24.3 $584.6 $609.0January 522,823 851,385 0.37 36.1 223.1 0.77 4.79 $70.2 $1687.6 $1757.9February 1,095,119 582,594 0.54 64.7 400.2 1.39 8.58 $126.0 $3026.7 $3152.6March 1,474,314 171,583 0.68 78.8 487.2 1.69 10.45 $153.3 $3684.7 $3838.1April 651,407 24,566 0.72 35.5 219.6 0.76 4.71 $69.1 $1661.3 $1730.4Total 4,271,233 2,258,071 247.1 1528.2 5.30 32.78 $481.0 $11,558.5 $12,039.5
aBird foraging days (BFD) was estimated from numbers of cormorants for the interior (I) and river regions (R) foreach month. Weighted % diet in catfish (WDC) is based on cormorant diet in river and interior regions (Glahn et al.1995) weighted by cormorant numbers in those regions. Biomass consumed from fingerling (BCFIP) and foodfish ponds(BCFOP) is the g/bird/day consumed each month (Glahn et al. 1995) × BFD × % biomass of catfish in the diet ×proportion of each pond type in YRB (Hanson and Sites 2005). The number of fingerling (NFIC) and foodfish consumed(NFOC) is based on catfish length distribution and biomass in the cormorant diet (Glahn et al. 1995). Loss on fingerlingponds (LFIP) is the average sale price for the period (Hanson and Sites 2005). Loss on foodfish ponds (LFOP) is theopportunity cost to produce a harvestable size fish (Table 1) lost due to predation, reduced by the estimated mortality rate(18%) of fingerlings prior to harvest (SRAC 2004). Total loss (TL) = LFIP + LFOP.
period 1 January–31 March. Maximum dollarloss occurred in March in 2000–2001 and inFebruary in 2003–2004 (Tables 4 and 5).
In all months, losses of biomass, number,and dollar value were greater for foodfishponds than fingerling ponds. Based on monthlyweighted % biomass consumed, a total of1775.3 m.t. of catfish was estimated to be con-sumed over winters 2000–2001 and 1346.6
m.t. in 2003–2004 (Tables 4 and 5). In winter2000–2001, 247.1 m.t. from fingerling pondsand 1528.2 m.t. from foodfish ponds wereestimated to have been consumed (Table 4).In winter 2003–2004, 205.1 m.t. from fin-gerling ponds and 1141.5 m.t. from food-fish ponds were estimated consumed (Table 5).Based on weight of size classes consumedand estimated number of catfish per m.t., this
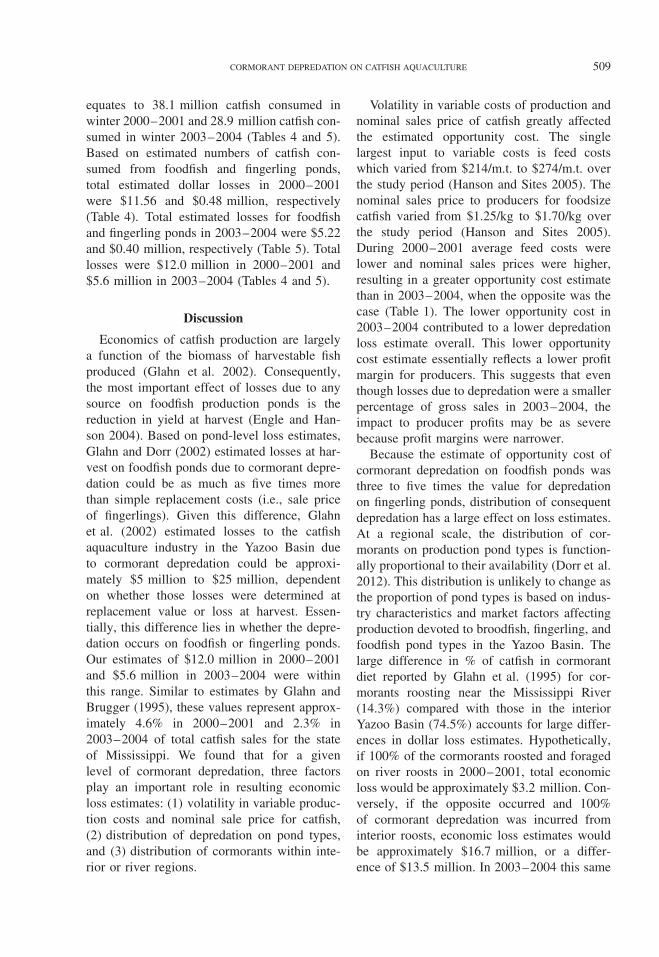
Table 5. Projected catfish losses due to Double-crested Cormorant depredation in the Yazoo River Basin (YRB) ofMississippi during winter 2003–2004.a
Month BFD-I BFD-R WDCBCFIP(m.t.)
BCFOP(m.t.)
NFIC(millions)
NFOC(millions)
LFIP(103)
LFOP(103)
TL(103)
Nov 95,243 45,157 0.55 5.3 29.4 0.11 0.63 $10.4 $134.6 $145.0Dec 191,855 120,519 0.51 12.8 71.0 0.27 1.52 $25.2 $324.9 $350.1Jan 779,461 513,225 0.51 50.3 280.2 1.08 6.01 $99.3 $1281.2 $1380.6Feb 1,116,699 792,294 0.50 74.2 412.8 1.59 8.86 $141.4 $1823.8 $1965.2Mar 865,111 523,579 0.52 55.0 306.3 1.18 6.57 $111.7 $1440.5 $1552.2Apr 125,832 6184 0.72 7.5 41.7 0.16 0.90 $16.6 $214.7 $231.3Total 3,174,202 2,000,958 205.1 1141.5 4.40 24.49 $404.7 $5219.7 $5624.4
aBird foraging days (BFD) was estimated from numbers of cormorants for the interior (I) and river regions (R) foreach month. Weighted % diet in catfish (WDC) is based on cormorant diet in river and interior regions (Glahn et al.1995) weighted by cormorant numbers in those regions. Biomass consumed from fingerling (BCFIP) and foodfish ponds(BCFOP) is the g/bird/day consumed each month (Glahn et al. 1995) × BFD × % biomass of catfish in the diet ×proportion of each pond type in YRB (Hanson and Sites 2005). The number of fingerling (NFIC) and foodfish consumed(NFOC) is based on catfish length distribution and biomass in the cormorant diet (Glahn et al. 1995). Loss on fingerlingponds (LFIP) is the average sale price for the period (Hanson and Sites 2005). Loss on foodfish ponds (LFOP) is theopportunity cost to produce a harvestable size fish (Table 1) lost due to predation, reduced by the estimated mortality rate(18%) of fingerlings prior to harvest (SRAC 2004). Total loss (TL) = LFIP + LFOP.
CORMORANT DEPREDATION ON CATFISH AQUACULTURE 509
equates to 38.1 million catfish consumed inwinter 2000–2001 and 28.9 million catfish con-sumed in winter 2003–2004 (Tables 4 and 5).Based on estimated numbers of catfish con-sumed from foodfish and fingerling ponds,total estimated dollar losses in 2000–2001were $11.56 and $0.48 million, respectively(Table 4). Total estimated losses for foodfishand fingerling ponds in 2003–2004 were $5.22and $0.40 million, respectively (Table 5). Totallosses were $12.0 million in 2000–2001 and$5.6 million in 2003–2004 (Tables 4 and 5).
Discussion
Economics of catfish production are largelya function of the biomass of harvestable fishproduced (Glahn et al. 2002). Consequently,the most important effect of losses due to anysource on foodfish production ponds is thereduction in yield at harvest (Engle and Han-son 2004). Based on pond-level loss estimates,Glahn and Dorr (2002) estimated losses at har-vest on foodfish ponds due to cormorant depre-dation could be as much as five times morethan simple replacement costs (i.e., sale priceof fingerlings). Given this difference, Glahnet al. (2002) estimated losses to the catfishaquaculture industry in the Yazoo Basin dueto cormorant depredation could be approxi-mately $5 million to $25 million, dependenton whether those losses were determined atreplacement value or loss at harvest. Essen-tially, this difference lies in whether the depre-dation occurs on foodfish or fingerling ponds.Our estimates of $12.0 million in 2000–2001and $5.6 million in 2003–2004 were withinthis range. Similar to estimates by Glahn andBrugger (1995), these values represent approx-imately 4.6% in 2000–2001 and 2.3% in2003–2004 of total catfish sales for the stateof Mississippi. We found that for a givenlevel of cormorant depredation, three factorsplay an important role in resulting economicloss estimates: (1) volatility in variable produc-tion costs and nominal sale price for catfish,(2) distribution of depredation on pond types,and (3) distribution of cormorants within inte-rior or river regions.
Volatility in variable costs of production andnominal sales price of catfish greatly affectedthe estimated opportunity cost. The singlelargest input to variable costs is feed costswhich varied from $214/m.t. to $274/m.t. overthe study period (Hanson and Sites 2005). Thenominal sales price to producers for foodsizecatfish varied from $1.25/kg to $1.70/kg overthe study period (Hanson and Sites 2005).During 2000–2001 average feed costs werelower and nominal sales prices were higher,resulting in a greater opportunity cost estimatethan in 2003–2004, when the opposite was thecase (Table 1). The lower opportunity cost in2003–2004 contributed to a lower depredationloss estimate overall. This lower opportunitycost estimate essentially reflects a lower profitmargin for producers. This suggests that eventhough losses due to depredation were a smallerpercentage of gross sales in 2003–2004, theimpact to producer profits may be as severebecause profit margins were narrower.
Because the estimate of opportunity cost ofcormorant depredation on foodfish ponds wasthree to five times the value for depredationon fingerling ponds, distribution of consequentdepredation has a large effect on loss estimates.At a regional scale, the distribution of cor-morants on production pond types is function-ally proportional to their availability (Dorr et al.2012). This distribution is unlikely to change asthe proportion of pond types is based on indus-try characteristics and market factors affectingproduction devoted to broodfish, fingerling, andfoodfish pond types in the Yazoo Basin. Thelarge difference in % of catfish in cormorantdiet reported by Glahn et al. (1995) for cor-morants roosting near the Mississippi River(14.3%) compared with those in the interiorYazoo Basin (74.5%) accounts for large differ-ences in dollar loss estimates. Hypothetically,if 100% of the cormorants roosted and foragedon river roosts in 2000–2001, total economicloss would be approximately $3.2 million. Con-versely, if the opposite occurred and 100%of cormorant depredation was incurred frominterior roosts, economic loss estimates wouldbe approximately $16.7 million, or a differ-ence of $13.5 million. In 2003–2004 this same
510 DORR ET AL.
scenario would produces losses of $1.6 millionor $8.2 million, respectively, a difference of$6.6 million.
Most of the number, biomass, and dollarloss of catfish occurred from foodfish ponds.Although this result seems intuitive, previousresearch indirectly concluded that fingerlingponds were more vulnerable to cormorantdepredation (Glahn et al. 2000b; 2002). Thisview was considered true because fingerlingponds are stocked at greater densities and mostcatfish in fingerling ponds are of a consumablesize. Based on the aforementioned factors,fingerling ponds presumably would be preferredby cormorants. Clearly, focusing managementefforts to reduce cormorant depredation onfingerling ponds will not provide the samedollar return as a similar effort and reductionin depredation on foodfish ponds. Although thisdoes not suggest that cormorants should not bedeterred from foraging in fingerling ponds, itshould not be done at the expense of efforts onfoodfish ponds.
We found a pronounced seasonal compo-nent to cormorant depredation on catfish aqua-culture. Peak cormorant numbers from aerialroost counts and from estimated foraging daysoccurred in February–March, which agreeswith Glahn et al. (2000a). The period Jan-uary–March in 2000–2001 and 2003–2004accounted for most (72 and 89%, respec-tively) of total estimated cormorant foragingdays in the Yazoo Basin. Similarly, the samemonthly period in 2000–2001 and 2003–2004accounted for most (73 and 87%, respectively)of total estimated dollar losses due to cormorantdepredation in the Yazoo Basin. One exceptionto this trend was in March 2001, when for-aging days for the month represented 25% ofthe total foraging days but dollar loss for themonth was 32% of the total dollar loss. Thisdifference was because more cormorants (90%)were counted from the interior portion of theYazoo Basin, where a greater % of the dietis comprised of commercially raised catfish.Conversely, December 2000, while accountingfor 9.7% of the total number of foraging days,only accounted for 5.1% of the total dollar lossbecause most (78%) cormorants were counted
from river roosts. Over both years, more birdswere estimated to be foraging in the interior(66%) compared with river regions (34%).
To date, the most effective means of reduc-ing cormorant impacts within the Yazoo Basinhas been a coordinated region-wide night roost-harassment program (Mott et al. 1998; Rein-hold and Sloan 1999; Glahn et al. 2000a).The effects of the program are twofold. Mottet al. (1998) demonstrated that harassment ofnight roosts reduces the number of cormorantsobserved at nearby aquaculture ponds. Con-sequently, producers reported less depredationmanagement costs associated with the roostharassment (Mott et al. 1998). The secondaspect of the program is to push cormorantsto river roosts where commercially raised cat-fish are a much smaller % of the diet. Pre-sumably this difference in diet is due to thegreater available natural foraging habitat alongthe Mississippi River and associated oxbowlakes. Glahn et al. (2000a) documented a larger% of cormorants shifted to river roosts fol-lowing the implementation of the region-wideroost-dispersal program in 1994, relative toroosting patterns prior to the program’s ini-tiation. Based on the 2000–2001 counts, ourdata suggest that an annual 10% shift in cor-morant numbers from interior to river roostswould result in an estimated $0.9 million reduc-tion in depredation losses to the industry in theYazoo Basin, all else being equal. The sameshift in 2003–2004 would result in an estimated$0.4 million reduction in depredation losses.
Although the roost-harassment program hasdemonstrated benefits to both individual pro-ducers and the industry in the Yazoo Basin,its effectiveness may be limited (Reinhold andSloan 1999; Glahn et al. 2000a,b). This lack ofeffectiveness is due to several factors includingincreased numbers of cormorants, proliferationof roost sites, and conflicts with other resourceactivities such as duck hunting (Reinhold andSloan 1999; Glahn et al. 2000a,b). The numberof cormorant roosts has increased from 12 in1990 to 80 in 2004 (Dorr et al. 2008). The roostproliferation alone has greatly increased thecomplexity and difficulty of implementing theprogram (Glahn et al. 2000b). Consequently,
CORMORANT DEPREDATION ON CATFISH AQUACULTURE 511
efforts to implement lethal control or imple-ment flyway-level management have been sug-gested as an alternative or supplement to farm-and regional-level management efforts (Glahnet al. 2000b). The objective of flyway manage-ment would be to alleviate depredation issuesby reducing the population of cormorants (VanEerden et al. 1995; Glahn et al. 2000b). All elsebeing equal, a 10% reduction in number of cor-morants in the Yazoo Basin would have resultedin an estimated $1.2 and $0.6 million decreasein losses to the catfish aquaculture industry inthe Yazoo Basin in 2000–2001 and 2003–2004,respectively.
Managing cormorants either by shifting themregionally, reducing flyway numbers, or a com-bination of these factors can reduce cormorantdepredation in the Yazoo Basin. However, alter-natives to these methods can be used concomi-tantly to supplement or enhance depredationmanagement. Recent research on modificationsto catfish cultural practices from current multi-batch systems to “modular” production sys-tems (Hanson and Steeby 2003) may improveproducers’ ability to protect vulnerable stocks,quantify loss due to depredation, and reducelosses of higher-value stocks. Although pond-level management techniques have been inves-tigated extensively, new technologies such aslasers, automated dispersal systems, and acous-tic technologies may provide new and cost-effective opportunities for pond-level manage-ment (Barras and Godwin 2005). The acreagedevoted to catfish aquaculture has declined sub-stantially since 2004. This change in the indus-try may affect how cormorants are distributedon catfish ponds or the intensity of use and con-sequently methods used to mitigate losses andtheir effectiveness.
The use of information on the distributionof cormorant depredation on catfish aquaculturein the Yazoo Basin and the opportunity costassociated with depredation of foodfish pondshave allowed for refinement of loss estimatesin the Yazoo Basin. However, several limita-tions exist that could increase or decrease eco-nomic loss estimates. Our projections assumethat bioenergetics and food-habit parameters arethe same as described previously by Brugger
(1992, 1993), Glahn and Brugger (1995), andGlahn et al. (1995). Although it is unlikely thatcormorant bioenergetics have changed, addi-tional research using improved bioenergeticsmethods such as doubly-labeled water (Speak-man 1997) could provide further insights andrefine estimates of energetic requirements forcormorants. Additionally, the increase in num-ber of identified roost sites used and possiblychanges in aquaculture practices suggest furtherstudy of cormorant food habits on aquaculturein the Yazoo Basin. The need for research isparticularly true for October, as relatively largenumbers of cormorants were observed in theYazoo Basin in this month (Figs. 2, 3). Glahnet al. (2000a) also suggested that aerial surveysof night roosts might underestimate cormorantnumbers by as much as 55%. Finally, determi-nation of opportunity costs due to cormorantdepredation on foodfish production ponds canbe refined with evaluation of how depreda-tion affects loss at harvest at various stockingrates and production strategies and the rela-tionship between depredation loss, opportunitycost and profit margins. Evaluation of these fac-tors would further refine regional loss estimates.Given these limitations, the data given in thisstudy provide the most accurate estimate of eco-nomic loss to the catfish aquaculture industry inthe Yazoo Basin to date.
Acknowledgments
USDA/WS/National Wildlife Research Cen-ter provided funding to conduct this researchunder Quality Assurance protocol QA-829. Wethank staff with United States Department ofAgriculture, Wildlife Services, Mississippi, foraerial night roost surveys, particularly G. Ellisand S. Swafford and A. “Butch” Nygren forhis professional aerial survey service. We alsothank T. Hanson, K. Hanson-Dorr, A. Pris-ock, F. Cunningham, J. Glahn and two anony-mous reviewers for their comments and edito-rial assistance.
Literature CitedBarras, S. C., and K. C. Godwin. 2005. Controlling
bird predation at aquaculture facilities: frightening
512 DORR ET AL.
techniques. Southern Regional Aquaculture CenterPublication 401.
Boyd, C. E. 1985. Hydrology and pond construction. Pages107–134 in C. S. Tucker, editor. Channel Catfish Cul-ture. Elsevier Scientific Publishing Company, Amster-dam, The Netherlands.
Boyd, C. E. 2004. Pond hydrology. Pages 196–214 inC. S. Tucker and J. A. Hargreaves, editors. Biologyand Culture of Channel Catfish. Elsevier B.V., Ams-terdam, The Netherlands.
Brugger, K. E. 1992. Differential digestibility of channelcatfish, bluegill, and gizzard shad: in vitro standardsfor gastric digestion by seabirds. Colonial Waterbirds15:257–260.
Brugger, K. E. 1993. Digestibility of three fish species bydouble-crested cormorants (Phalacrocorax auritus).Condor 95:25–32.
Dorr, B. S., L. W. Burger, S. C. Barras, and K. Godwin.2012. Double-crested Cormorant distribution on cat-fish aquaculture in the Yazoo River Basin of Missis-sippi. Wildlife Society Bulletin 36:70–77.
Dorr, B. S., L. W. Burger, and S. C. Barras. 2008.Evaluation of aerial cluster sampling of double-crestedcormorants on aquaculture in Mississippi. The Journalof Wildlife Management, 72:1634–1640.
Engle, C. R., and T. R. Hanson. 2004. Marketing andeconomics. Pages 601–633 in C. S. Tucker andJ. A. Hargreaves, editors. Biology and Culture ofChannel Catfish. Elsevier B.V., Amsterdam, TheNetherlands.
Glahn, J. F., and K. E. Brugger. 1995. The impact ofdouble-crested cormorants on the Mississippi deltacatfish industry: a bioenergetics model. ColonialWaterbirds 18: 168–175.
Glahn, J. F., P. J. Dixon, G. A. Littauer, and R. B.McCoy. 1995. Food habits of double-crested cor-morants wintering in the delta region of Missis-sippi. Colonial Waterbirds 1, 18 Special Publica-tion:158–167.
Glahn, J. F., and B. S. Dorr. 2002. Captive double-crested cormorant Phalacrocorax auritus predation onchannel catfish Ictalurus punctatus fingerlings and itsinfluence on single-batch cropping production. Journalof the World Aquaculture Society 33:85–93.
Glahn, J. F., A. May, K. Bruce, and D. S. Reinhold.1996. Censusing double-crested cormorants (Phalacro-corax auritus) at their winter roosts in the delta regionof Mississippi. Colonial Waterbirds 19:73–81.
Glahn, J. F., D. S. Reinhold, and C. A. Sloan. 2000a.Recent population trends of double-crested cormorantswintering in the delta region of Mississippi: responsesto roost dispersal and removal under a recent depre-dation order. Waterbirds 23:8–44.
Glahn, J. F., M. E. Tobin, and B. F. Blackwell. 2000b.A Science-based Initiative to Manage Double-CrestedCormorant Damage to Southern Aquaculture. Tech-nical Bulletin 11–55–010. U.S. Department of Agri-culture, Animal and Plant Health Inspection Service,Washington DC, USA.
Glahn, J. F., S. J. Werner, T. Hanson, and C. R. Engle.2002. Cormorant depredation losses and their preven-tion at catfish farms: economic considerations. Pages138–146 in L. Clark, editor. Human Conflicts withWildlife: Economic Considerations Proceedings of theThird National Wildlife Research Center Special Sym-posium, Fort Collins, Colorado, USA.
Hanson, T. R., S. Dean, and S. R. Spurlock. 2004. Eco-nomic impact of the farm-raised catfish industry on theMississippi state economy. Journal of Applied Aqua-culture 15:11–28.
Hanson, T. R., and D. Sites. 2005. 2004 U.S. Catfishdatabase. Information Report 2005-01. Department ofAgricultural Economics, Mississippi State University,Starkville, Mississippi, USA.
Hanson, T. R., and D. Sites. 2009. 2008 U.S. Catfishdatabase. Information Report 2009-01. Auburn Uni-versity, Department of Fisheries and Allied Aquacul-tures and Mississippi State University, Department ofAgricultural Economics, Starkville, Mississippi, USA.Accessed December 16, 2010, at http://www.aces.edu/dept/fisheries/aquaculture/catfish-database/catfish-2008.php.
Hanson, T. R., and J. A. Steeby. 2003. Comparison ofmultiple-batch and “modular” catfish production sys-tems. NWAC News, The Thad Cochran NationalWarmwater Aquaculture Center, Stoneville, Missis-sippi, USA.
Hargreaves, J. A., and C. S. Tucker. 2004. Industrydevelopment. Pages 1–14 in C. S. Tucker, and J.A.Hargreaves, editors. Biology and Culture of ChannelCatfish. Elsevier B.V., Amsterdam, The Netherlands.
Hatch, J. J. 1995. Changing populations of double-crested cormorants. Colonial Waterbirds 1, 18 SpecialPublication:8–24.
Hatch. U., T. Hanson, W. Zidak, T. Lovell, and M. Li.1998. Economic analysis of alternative protein levelschannel catfish feeds. Aquaculture Economics andManagement 2:13–22.
Hyman, D. N. 1997. Microeconomics, 4th edition. IrwinPublishing, Chicago, Illinois, USA.
King, D. T., J. F. Glahn, and K. J. Andrews. 1995. Dailyactivity budgets and movements of winter roostingdouble-crested cormorants determined by biotelemetryin the delta region of Mississippi. Colonial Waterbirds1, 18 Special Publication:152–157.
Li, M., and R. T. Lovell. 1992. Comparison of satiatefeeding and restricted feeding of channel catfish withvarious concentrations of dietary protein in productionponds. Aquaculture 103:165–175.
Mott, D. F., J. F. Glahn, P. L. Smith, D. S. Reinhold,K. J. Bruce, and C. A. Sloan. 1998. An evaluation ofwinter roost harassment for dispersing double-crestedcormorants away from catfish production areas inMississippi. Wildlife Society Bulletin 26:584–591.
National Fisheries Institute. 2009. Top ten consumedseafoods. Accessed December 16, 2010, at http://www.aboutseafood.com/about/about-seafood/top-10-consumed-seafoods.
CORMORANT DEPREDATION ON CATFISH AQUACULTURE 513
Reinhold, D. S., and C. A. Sloan. 1999. Strategies toreduce double-crested cormorant depredation at aqua-culture facilities in Mississippi. Page 99–105 in M. E.Tobin, Technical Coordinator. Symposium on Double-Crested Cormorants: Population Status and Manage-ment Issues in the Midwest. US Department of Agri-culture, Animal and Plant Health Inspection Service,Technical Bulletin 1879.
Southern Regional Aquaculture Center. 2004. Verifica-tion of recommended management practices for majoraquatic species: catfish yield verification trials 1997-2000. Final Report, University of Arkansas Coopera-tive Extension Program. University of Arkansas, PineBluff, Arkansas, USA.
Speakman, J. R. 1997. Doubly Labeled Water: Theory andPractice. Chapman & Hall, London, UK.
Steeby, J. A. 1995. A centimeter-based length-weightrelationship for channel catfish fingerlings grownunder commercial conditions in Mississippi. TheProgressive Fish-Culturist 57:161–163.
Stickley, A. R., Jr., G. L. Warrick, and J. F. Glahn.1992. Impact of double-crested cormorant depreda-tions on channel catfish farms. Journal of The WorldAquaculture Society 23:192–198.
Tyson, L. A., J. L. Belant, F. J. Cuthbert, and D. V.C. Weseloh. 1999. Nesting populations of double-crested cormorants in the United States and Canada.Pages 17–25 in M. E. Tobin, Technical Coordinator.Symposium on Double-Crested Cormorants: Popula-tion Status and Management Issues in The Midwest.
US Department of Agriculture, Animal and PlantHealth Inspection Service, Technical Bulletin 1879.
US Department of Agriculture. 1997. Part I: referenceof 1996 US catfish health and production practices(N235–597). US Department of Agriculture, Animaland Plant Health Inspection Service, Veterinary Ser-vices, Centers For Epidemiology and Animal Health,National Animal Health Monitoring System, FortCollins, Colorado, USA.
US Department of Agriculture. 2003. Part II: referenceof foodsize catfish health and production practices inthe United States (N407–1103). US Department ofAgriculture, Animal Plant Health Inspection Service,Veterinary Services, Centers For Epidemiology andAnimal Health National Animal Health MonitoringSystem, Fort Collins, Colorado, USA.
US Department of Agriculture, National AgricultureStatistics Service. 2009. Catfish production. ReleasedJanuary 30, 2009. Accessed December 3, 2010, athttp://www.nass.usda.gov/Publications/Todays_Reports/reports/cfpd0109.pdf.
Van Eerden, M. R., K. N. Koffijberg, and M. Platteeuw.1995. Riding the crest of the wave: possibilities andlimitations for a thriving population of migratorycormorants (Phalacrocorax carbo) in man dominatedwetlands. Ardea 83:1–10.
Wywialowski, A. P. 1999. Wildlife-caused losses forproducers of channel catfish (Ictalurus punctatus)in 1996. Journal of the World Aquaculture Society30:461–472.