the dead sea sinkhole hazard – new findings based on a multidisciplinary geophysical study
TRANSCRIPT

69Th e Dead Sea sinkhole hazard
Th e Dead Sea sinkhole hazard – new fi ndings based on a multidisciplinary geophysical study
Michael Ezersky, Anatoly Legchenko, Christian Camerlynck, Abdallah Al-Zoubi,Lev Eppelbaum, Shmariahu Keydar, Marie Boucher and Kostas Chalikakis
with 11 fi gures and 1 table
Abstract. A geophysical study has been carried out in the Dead Sea (DS) coastal area of Israel and Jordan with the goal of better understanding the development of sinkholes in the area. Th e following surface geophysical methods have been applied: (1) Seismic Refraction method for mapping the buried salt formation; (2) Microgravity and Magnetic Resonance Sounding (MRS) for detecting cavities in the subsurface; (3) Transient Electromagnetic method (TEM) for estimating groundwater salinity. It has been found that: (1) sinkholes have formed within a strip 50–100 m wide along the salt forma-tion edge; (2) a zone with a large density of cavities with a total volume of tens of thousands of cubic meters have been inferred in sinkhole sites; (3) cavities underlying sinkholes are fi lled with uncon-solidated sediments locally reducing hydraulic conductivity. Further development of new cavities has not been detected; (4) groundwater salinity variations along the DS shore are insignifi cant and changes in the electrical conductivity of the groundwater obtained using TEM were in most cases related to changes of porosity caused by collapse of subsurface sediments. (5) the applied geophysical methods provide valuable data on the development of sinkholes in the DS coastal areas.Key words. Dead Sea, MRS, TEM, salt, seismic, microgravity
1. Introduction
Since 1990 thousands of sinkholes have occurred along the Dead Sea (DS) coastal areas in both in Israel and in Jordan (Fig. 1). Th ere is an obvious potential for further collapses beneath main highways, near or under dwellings, and in the potash concentration facilities. Th is poses a serious threat to human life and development in the area.
Sinkhole hazard assessment should play a crucial role in planning and development of areas susceptible to sinkhole formation. To protect human life and infrastructure, it is necessary to understand how sinkholes form and to produce reliable sinkhole susceptibility and hazard maps identifying the most dangerous areas that should be avoided or properly engineered.
Subsurface cavities and the processes that lead to the development of sinkholes cause changes in the subsurface (porosity, fracture density, water saturation, etc). Th ese changes may be detected by geophysical methods such as gravity, seismics or electrical resistivity (Ezersky et al. 2006).
A multidisciplinary geophysical study has been carried out in several sinkhole areas. Main goals of the study were: (1) better understanding the phenomenon; (2) develop-ment of an integrated approach for predicting the spatial distribution of future sinkholes in the Dead Sea region of Israel and Jordan based on the application of multiple surface
©2010 Gebrüder Borntraeger Verlagsbuchhandlung, Stuttgart, Germany www.borntraeger-cramer.deDOI: 10.1127/0372-8854/2010/0054S2-0005 0372-8854/10/5402-0005 $ 5,50
Zeitschrift für Geomorphologie Vol. 54, Suppl. 2, 069–090 ArticleStuttgart, März 2010

70 Mikhail Ezersky et al.
geophysical methods; (3) testing the sinkhole formation mechanisms proposed in the litera-ture (i.e. Abelson et al. 2003, Arkin & Gilat 2000, Ezersky 2006, 2008, Frumkin & Raz 2001, Yechieli et al. 2002, 2006, Shalev 2006). Field studies have been performed at the Ein Gedi, Nahal Hever South and Newe Zohar sinkhole sites in Israel and at the Ghor Al-Haditha sinkhole site in Jordan (Fig. 1).
2. Investigated area
Th e DS is the terminal lake of the Jordan River system (Fig. 1) in the DS Rift, which is part of the Syrian-African Rift. It is the lowest lake in the world (-420 m b.s.l.) and is located in an arid environment with a mean annual precipitation of 50–100mm (Yechieli & Gavrieli 2000).
Fig. 1. Sinkhole sites along the DS shore: 1 – Palms, 2 – Samar Spring, 3 – Hamme Shalem, 4 – Ein Gedi and Nahal Arugot, 5 – Yesha, 6 – Nahal Hever north, 7 – Nahal Hever south, 8 – Asa’el, 9 – Nahal Zeelim, 10 – Mezada, 11 – Rahaf, 12 – Mor, 13 – Newe Zohar, 14 – Nahal Hemar, 15 – Lisan Peninsula, 16 – Ghor Al-Haditha (by Arkin and Gilat, 2000).
71Th e Dead Sea sinkhole hazard
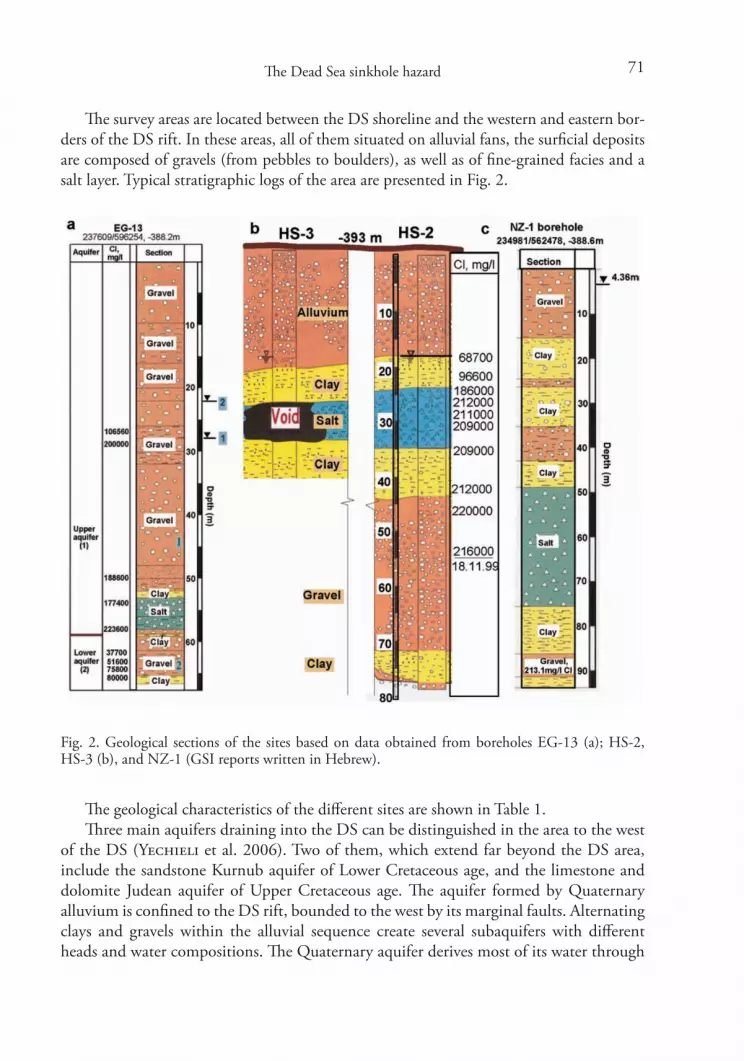
Th e survey areas are located between the DS shoreline and the western and eastern bor-ders of the DS rift. In these areas, all of them situated on alluvial fans, the surfi cial deposits are composed of gravels (from pebbles to boulders), as well as of fi ne-grained facies and a salt layer. Typical stratigraphic logs of the area are presented in Fig. 2.
Fig. 2. Geological sections of the sites based on data obtained from boreholes EG-13 (a); HS-2, HS-3 (b), and NZ-1 (GSI reports written in Hebrew).
Th e geological characteristics of the diff erent sites are shown in Table 1.Th ree main aquifers draining into the DS can be distinguished in the area to the west
of the DS (Yechieli et al. 2006). Two of them, which extend far beyond the DS area, include the sandstone Kurnub aquifer of Lower Cretaceous age, and the limestone and dolomite Judean aquifer of Upper Cretaceous age. Th e aquifer formed by Quaternary alluvium is confi ned to the DS rift, bounded to the west by its marginal faults. Alternating clays and gravels within the alluvial sequence create several subaquifers with diff erent heads and water compositions. Th e Quaternary aquifer derives most of its water through

72 Mikhail Ezersky et al.
lateral fl ows across the rift faults from the Judea Group aquifer, which is recharged over the mountain terrain, some 20–50 km to the west. Direct recharge to the aquifer over the alluvial segments is negligible because of the extreme aridity of the region (Yechieli et al. 2006).
Since the early 1960s the DS level is lowering at rates ranging from 0.5 to 1 m/yr. A total decline of ca. 30 m has been recorded between 1960 and 2007. Th e lowering of the DS level has been accompanied with formation of sinkholes related to the presence of a salt layer in the subsurface (Fig 3).
Table 1. Comparative geological charcteristics of the studied sites.
rahoZ eweN htuoS reveH lahaN )togurA( ideG niE Geological environment Alluvial fan Alluvial fan Alluvial fan Distance from the DS 100–600 m 300–600 m 50–200 m Surface elevation (m) -388 – -393 m -393 – -400 m -385 – -390 m Depth to the water table ~22–28 m ~22 m 4–10 m Depth to the salt top ~ 48m ~24–25 m 48–50 mThickness of saturated sediments over salt top*)
~20 m 5m 38–45 m
Salt thickness 20 m 10–11 m 20–25 m Boreholes EG-6, EG-7,
EG-13 etc. HS-1,2, HS-3**) NZ-1, NZ-2,
NZ-3**) Chloride/TDS maximum concentration (mg/l)
225,000/340,000 225,000/340,000 259,000/380,000
*) Varies with drop in the DS level; at Ein Gedi and Hever South sites it is decreasing at a rate of 0.8–1.0 m/yr, at the Newe Zohar site it is increasing slowly**) The groundwater has a very high salinity (~150–225g/l Cl)
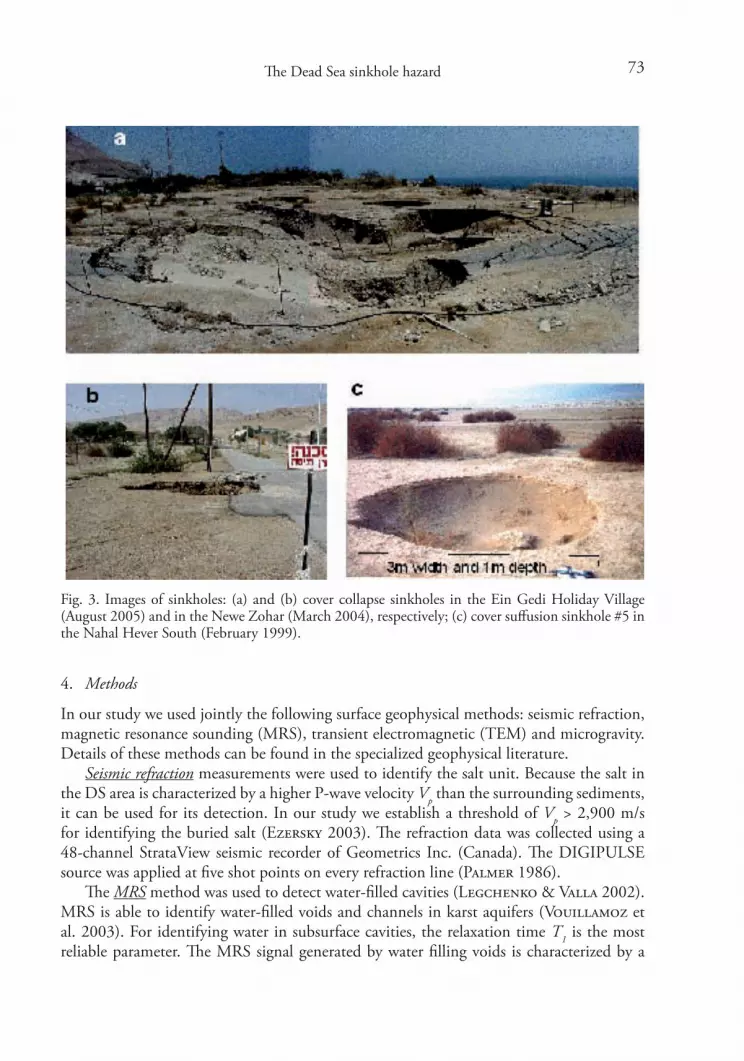
According to the genetic classifi cation of sinkholes proposed by Gutiérrez et al. (2008), sinkholes in mantled karst settings can be caused by sagging (not identifi ed in our study area), collapse or suff osion (Fig. 3). Cover collapse sinkholes are formed by the upward propagation of soils cavities by progressive roof collapse. Th is subsidence mechnism produces in our study areas scarp-edged sinkholes typically a few meters in diameter (Figs. 3a and 3b). Cover suff osion sinkholes result from the downward migration of particles through conduits and the progressive settlement of the cover. In our study area these are bowl-shaped holes reach up to ten meters across (Fig. 3c).
73Th e Dead Sea sinkhole hazard
4. Methods
In our study we used jointly the following surface geophysical methods: seismic refraction, magnetic resonance sounding (MRS), transient electromagnetic (TEM) and microgravity. Details of these methods can be found in the specialized geophysical literature.
Seismic refraction measurements were used to identify the salt unit. Because the salt in the DS area is characterized by a higher P-wave velocity Vp than the surrounding sediments, it can be used for its detection. In our study we establish a threshold of Vp > 2,900 m/s for identifying the buried salt (Ezersky 2003). Th e refraction data was collected using a 48-channel StrataView seismic recorder of Geometrics Inc. (Canada). Th e DIGIPULSE source was applied at fi ve shot points on every refraction line (Palmer 1986).
Th e MRS method was used to detect water-fi lled cavities (Legchenko & Valla 2002). MRS is able to identify water-fi lled voids and channels in karst aquifers (Vouillamoz et al. 2003). For identifying water in subsurface cavities, the relaxation time T1 is the most reliable parameter. Th e MRS signal generated by water fi lling voids is characterized by a
Fig. 3. Images of sinkholes: (a) and (b) cover collapse sinkholes in the Ein Gedi Holiday Village (August 2005) and in the Newe Zohar (March 2004), respectively; (c) cover suff usion sinkhole #5 in the Nahal Hever South (February 1999).
74 Mikhail Ezersky et al.
long relaxation time (T1 → 1,000 ms) whereas the signal generated by water in a porous medium by a shorter relaxation time (T1 < 400 ms) (Legchenko et al. 2008a). To interpret MRS results, based on modeling and experimental observations we assumed a threshold of T1 > 450 ms for interpreting water-fi lled caverns. MRS measurements in Israel and Jordan were carried out using a NUMISplus instrument (IRIS Instruments, France). In Israel we used a square loop (100 x 100 m2) and in Jordan an eight-shape loop (50 x 50 m2).
Th e Transient Electromagnetic Method (also referred to as the Time Domain Electro-magnetic Method) is sensitive to the bulk resistivity (conductivity) of the studied medium, especially in the low-resistivity range. Th e method has been used extensively in Israel for locating the fresh-saline water interface in coastal areas and for estimating groundwater salinity (Kafri et al. 1997). Th e resistivity of the subsurface depends on several parameters, the most important of which are the salinity of the interstitial fl uid and porosity. However, Kafri et al. (1997) have shown that a bulk resistivity ≤ 1 Ωm is typical of the concentrated brine in the DS region. It refl ects any lithology containing DS or slightly diluted brine. Th erefore, the 1 Ωm surface is an important element of the aquifer that defi nes the interface between the DS brine and the diluted one (hereafter 1 Ωm interface).
Th e TEM method was used for vertical depth sounding. A common procedure for ground exploration using transient techniques is laying a square loop in the vicinity of the area to be examined. A quasi 3D technique based on numerous 1D soundings was used to map variations in resistivity throughout the area (Barsukov et al. 2006). Th e TEM FAST 48 HPC system (AEMR, Holland) was used with coincident transmitter/receiver square loops with sides of 25, 50 and 100 m. TEM measurements were interpreted using two com-mercial 1D inversion programs.
Microgravity mapping was carried out by regular grid 5 x 5 m2 (20 x 20 m2 in places) using the Scintrex CG-3M AutoGrav gravity meter (Rybakov et al. 2001). Acquired data were completely terrain corrected. Th ese investigations were carried out in a zone of high horizontal gravity gradient (up to 10 mGal/km) caused by the infl uence of the regional Dead Sea gravity minimum. Th e values of the regional horizontal ΔgB gradient were sub-tracted from the observed ΔgB map.
5. Results
5.1. Mapping the salt formation
A methodology for mapping buried salt layers in the DS coastal areas was proposed for the fi rst time by Ezersky (2003, 2006). It uses a new criterion for delinating the areas sus-ceptible to sinkhole formation – the salt layer velocity. Using this methodology it has been discovered that in the Ein Gedi area sinkholes are arranged along the western edge of the salt layer. Based on this fact it was suggested that the salt edge dissolution model describes the formation of sinkholes in this particular area. In order to check the validity of the salt edge dissolution model in other areas of the Dead Sea we have reinterpreted previous seis-mic refraction data obtained by Geophysical Institute of Israel during 1999–2004 and per-formed new seismic refraction surveys. Ten sinkhole sites in Israel and one in Jordan have been investigated using the seismic refraction method (Ezersky et al. 2008a). Th e map

75Th e Dead Sea sinkhole hazard
presented in Fig. 4 shows the sinkhole sites studied using the seismic refraction method, the locations of boreholes drilled by the GSI, and that of the seismic lines.
Th e map produced in the Newe Zohar (NZ) site is shown in Fig. 5. Th e NZ site is a settlement with several thousands of residents and includes evaporation ponds (EPs) fed by water pumped from the northern DS basin. Borehole NZ-1 (Fig. 2c) penetrated a 27 m thick salt layer whose top is situated at a depth of 50 m. NZ is the fi rst area of the western DS coast where sinkholes aff ected the main road in 1989.
We mapped a 1000 m x 600 m area using the seismic refraction method to delineate the edge of the salt layer (Fig. 5). Th e map is based on the salt velocity criterion Vp > 2,900 m/s. Th e dashed line in Fig. 5 represents the western edge of the compact salt. Th e distribution of sinkholes shows a good spatial correlation with the mapped salt edge. Recent sinkholes (white circles) have developed along the salt border in February 2005. No new sinkholes have appeared since. Th us, in the NZ site the distribution of sinkholes supports the salt edge dissolution model.
Fig. 4. Dead Sea map with hypothetic salt border (solid brown line) connecting sites where salt edge was revealed experimentally (solid red segments). (a) northern DS basin, (b) EPs map.
76 Mikhail Ezersky et al.
Th e map presented in Fig. 4 shows that boreholes and seismic lines performed west of the brown line, which delineates the assumed western salt edge, did not reveal the presence of a salt unit (green).
Th e boreholes and seismic lines that detected the salt (designated in red) are located east of the salt edge. Th is can be stated with more confi dence in the northern DS basin, where the salt stratigraphy is relatively simple; a single salt layer 10–30 m thick at a depth of 20–50 m (top).
Th e southern sector of the DS (EPs) is characterized by a more complex geology, including shallow salt layers located at a depth of 8–12 m and active salt mushrooms in the EPs area2 (Closson 2005, Taqieddin et al. 1999). Th e coincidence between the salt edge and the sinkhole clusters was confi rmed there as well (Newe Zohar, Ein Boqeq).
5.2 Subsurface cavities in the buried salt and sinkholes
Monitoring measurements and numerical modeling have been carried out in Nahal Hever (Israel) for investigating changes in the subsurface related to the development of sinkholes. To our knowledge, seven small sinkholes 1–3 m in diameter had formed in the Nahal Hever south area till 1999 (Ezersky et al. 2008b). Microgravity mapping carried out in 1999 through a 200 m x 200 m area revealed a large residual gravity anomaly covering an area of 50 m x 80 m (Rybakov et al. 2001). Th e residual microgravity map is shown in Fig. 6a.
A strong anomaly located in the center of the map reaches -0.13 to -0.15 mGal. Th e threshold of the method is estimated by Rybakov et al. (2001) at -0.04 mGal. Th is anomaly was interpreted as “a concealed cavern with a complicated shape”. HS-2 borehole drilled in the southern sector of the anomaly in April 2001 (triangle in Figs. 6a and 6b) did not inter-sect any cavity. Th e borehole crossed a 11 m-thick compact salt layer at a depth range of 24–35 m. In Ezersky (2003) we suggested that the borehole was drilled very close to one of the cavities discussed above. During the following period we investigated the development of sinkholes throughout the mapped area. A large sinkhole formed at the HS-2 borehole loca-tion 21 months later. Th e damaged PVC pipe of the HS-2 borehole fell into a cavity located within the previously mapped anomaly. Until 2006 a large sinkhole cluster has formed on the cavernous zone detected by means of microgravi metry (1 in Fig. 6a, image is shown in Fig. 6b). Yellow and orange polygons in Fig 6a delineate sinkhole clusters (2–4) formed lat-terly. It can be observed that the central anomaly (1) coincides with the limits of the collapse sinkhole cluster. We suggest that sinkhole groups located in the surroundings of the large residual gravity anomaly (2–4) could be connected to the cavernous zone by subsurface chan-nels (Ezersky et al. 2008b). Fig. 6 displays two features revealed the by seismic refraction method. (1) Th e edge of the salt layer delineated in Fig. 6a by a black line (Ezersky 2003, Ezersky et al. 2006) shows that the microgravity anomaly is located within the area under-lain by salt. Consequently, the anomaly can be explained by the presence of multiple dissolu-tion cavities in the salt featheredge zone. (2) Th e seismic refraction line crossing the sinkhole cluster (6 in Fig. 6b) had been shot in 2007. Its depth velocity section comprises three units. Lower unit (refractor) with Vp = 3,640 m/s is undoubtedly interpreted as a salt unit. It means that the multiple cavities that have formed the sinkhole cluster are divided by salt partitions.

77Th e Dead Sea sinkhole hazard
Fig. 5. Map of the salt layer in the Newe Zohar area (south of the DS).

78 Mikhail Ezersky et al.
Th is study off ers a rare opportunity to estimate the approximate cumulative volume of cavities based on the 3D microgravity forward modeling (Eppelbaum et al. 2008). Such modeling was carried out using Emigma 7.8 software (PetRos EiKon Inc., Canada). Th e model of the theoretical cavern used in the calculations is shown in Fig. 7. Th e results of the calculations along the C-C’ section of Fig. 6a are depicted in the upper graph of Fig. 7. Th e following elements were incorporated to the model: alluvium and salt layers (after HS-2 borehole), a theoretical cavern based on the microgravity survey that represents a highly karstifi ed cavernous zone, the salt featheredge inferred from seismic refraction, and a bell-shaped zone over salt interpreted as water saturated alluvium (after seismic refl ection and geoelectric mapping (Ezersky 2003)). Th e densities of the modeled elements were esti-mated by means of laboratory tests (shown in Fig. 7).
By modifying the size of the theoretical cavern we matched the computed residual anomaly to the observed one (Eppelbaum et al., 2008). A total volume of 35,000 m3 has been estimated for the cavities in the gravity anomaly zone.
Fig. 6. a) Residual gravity anomaly map of the NHS site in 1999 and sinkhole clusters formed during some years (1–4) sinkhole clusters; b) Image of sinkhole cluster (1) comprising number of segments (5) in May 2007; (6) seismic refraction line, (7) place of HS-2 borehole collapsed in 2002 (see Fig. 6a for location). After Rybakov et al., 2001, from SEG permission, Ezersky et al., 2008b, from Springer permission.

79Th e Dead Sea sinkhole hazard
In 2005 MRS mapping was carried out in the Nahal Hever south area using MRS stations 2–15 (Fig. 8a). Th e reliability of the MRS results has been analysed numerically based on the signal-to-noise ratio typical for fi eld data measured in Nahal Hever. It has been shown that the water content (W %) cannot be used for identifi cation of cavities, but variations in the relaxation time caused by the voids are greater than the uncertainties of the MRS inversion caused by noise. Th us, MRS results in Nahal Hever are proven to be reliable. Th erefore, we used the relaxation time (T1) to diff erentiate between porous media and water-fi lled cavities (Legchenko et al. 2007, Vouillamoz et al. 2003). MRS relaxa-tion time (T1) was measured in the fi eld at every MRS station. Th e MRS relaxation time (T1) map is presented in Fig. 8a. A high value of T1 is a signature of water-fi lled cavities. Th us, MRS reliably detected voids in the central part of the area (Legchenko et al. 2008a) with an estimated total volume of 27,000 ±13,000 m3. A new MRS study was carried out in 2007. Location of the MRS stations 2–15 coincided with that in 2005. In addition, ten new MRS stations (16–25) extended the study area to the north. T1 map of 2007 is pre-sented in Fig. 8b. MRS measurements reveal that high values of T1 were not observed in 2007 at the same location as in 2005 (Legchenko et al. 2007, Ezersky et al. 2008b). Th ese results suggest that after sinkhole occurrence, the cavities in the salt unit were fi lled with unconsolidated collapse sediments.
Microgravity and MRS monitoring in Nahal Hever allow us to reconstruct changes in the subsurface associated with the development of sinkholes. Th e largest microgravity anomaly was detected in 1999. Th e signal of the small and isolated cavities was probably
Fig. 7. Results of 3D modeling of gravity fi eld along the fragment of profi le C-C’ (see Fig. 6a for location). From Copernicus permission, www.adv-geosci.net/18/1/2008.

80 Mikhail Ezersky et al.
masked by the anomaly caused by the zone with a high density of cavities (Fig. 6a). Dur-ing 2003–2005, a large sinkhole cluster formed at this location. In 2005, an MRS3 station (that included the cluster within the 100 x 100 m loop) did not reveal unfi lled cavities at the depth of salt in the same place. However, at a neighboring loop located to the east of this sinkhole MRS reliably detected a cavernous zone. In this location we observed in 2007 another large sinkhole. Under this sinkhole, no cavities were identifi ed by MRS.
Th us, our results suggest that no new voids were formed in the vicinity of the cavities fi lled with sediments by collapse processes.
5.3. Resistivity distribution and its temporal variations
TEM results (Ezersky et al. 2008c) show slight spatial changes in bulk resistivity through the Nahal Hever South study area (Fig. 9a). Soil resistivity in the vicinity of the salt edge is kept at 0.5–0.6 Ωm (not exceeding generally 1 Ωm), indicating that the pores are fi lled with the DS brine.
Fig. 8. Two T1 MRS maps of the Nahal Hever south area in 2005 (a) and in 2007 (b).Southern parts of both maps are conformed and characterize the same area. Area of the MRS map-ping in 2007 (Fig. 8b) is extended to north. Th e microgravity anomaly and salt edge band are shown in fi gures a and b, respectively.

81Th e Dead Sea sinkhole hazard
Fig.
9. (
a) R
esist
ivity
dist
ribut
ion
thro
ugho
ut N
ahal
Hev
er S
outh
are
a at
the d
epth
of t
he c
onfi n
ed a
quife
r; (b
, c) M
onito
ring
at th
e NH
-3 T
EM
statio
n: lo
ng-te
rm v
aria
tions
(1) o
f the
wat
er ta
ble
elev
atio
n (e
xtra
pola
ted)
, (2)
of t
he 1
Ωm
inte
rface
(3) o
f the
DS
leve
l; an
d (4
) of r
esist
ivity
of
the
DS
aqui
fer.

82 Mikhail Ezersky et al.
Th e temporal variations in the elevation of 1 Ωm interface (hL) and the resistivity of the aquifer (pL) at the NH-3 station in the Nahal Hever are illustrated in Figs. 9b and 9c, respectively.
TEM monitoring stations were marked on the surface by special pegs to fi x their loca-tions. Fig. 9b shows that the 1 Ωm interface follows the variations of the DS level over time (Fig. 9b). Th e resistivity of the DS aquifer remains at 0.5 Ωm for a long time (Fig. 9c). Th e TEM results were recently confi rmed by geochemical monitoring of borehole water.
6. Discussion
6.1. Implications of the geophysical fi ndings
Th e following main results were obtained:1. Sinkhole development along the salt edge was proved by means of seismic refraction
mapping of the salt at most of the ten sinkhole sites of the western DS coast (Ezersky 2003, 2006, Ezersky et al. 2008a).
2. High relaxation time T1 zones detected using the MRS method were interpreted as zones of high secondary porosity (karst cavities) (Legchenko et al. 2008a). A sharp decrease in T1 two years later in zones where sinkhole formed at the surface was interpreted as the expectable infi ll of cavities by collapse processes (Legchenko et al. 2007).
3. A large residual gravity anomaly was detected in the NHS area in 1999. Th e most rea-sonable explanation for this anomaly is the presence of a large density of cavities (highly cavernous zone) in the subsurface. Th e spatial distribution of sinkholes formed after the gravity survey support the reliability of such interpretation. Th e total volume of the multiple cavities based on 3D modeling can be estimated at 35,000 m3 (Eppelbaum et al. 2008).
4. Very low resistivities (0.3–0.6 ohm-m, at all <1.0 Ωm) in the areas of sinkhole develop-ment obtained using TEM attest to a very high salinity of the salt layer environment. No resistivity variations over time have been recorded at the same very low resistivity level (Ezersky et al. 2008c). Th is fi nding is supported by the results obtained through monitoring of boreholes.
6.1.1. Salt edge and northward propagation of sinkhole activity
Th e GIS study carried out by the Geological Survey of Israel (Abelson et al. 2006) includes two important fi ndings on the spatial-temporal distribution of sinkhole occurrences. Th e fi rst is the northward propagation of sinkhole activity through time. Th e second one is link between the occurrence of sinkholes and the lowering of the DS level. First sinkholes formed in the southern and western sites: Mor, Lynch, Newe Zohar, Ein Boqeq, and Ghor Al-Haditha. Th e latest sites of sinkhole formation are the northern and eastern ones such as Qidrone, Qane, and Avnat. Deviations from this temporal trend are probably related to geological factors that vary from site to site.
83Th e Dead Sea sinkhole hazard
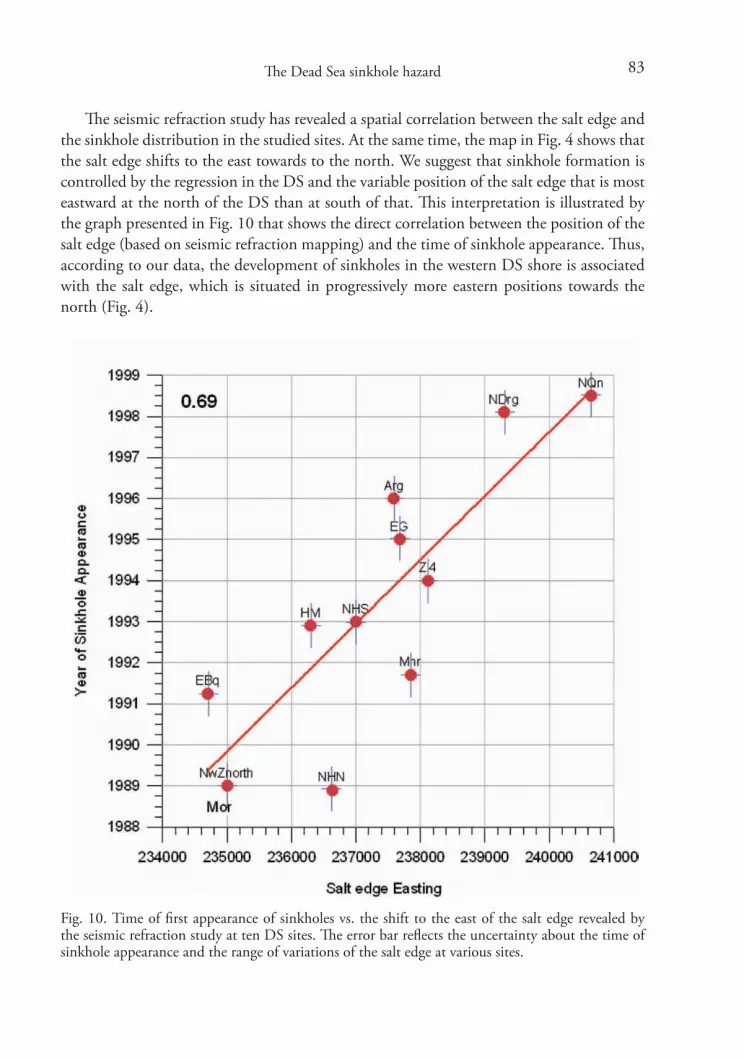
Th e seismic refraction study has revealed a spatial correlation between the salt edge and the sinkhole distribution in the studied sites. At the same time, the map in Fig. 4 shows that the salt edge shifts to the east towards to the north. We suggest that sinkhole formation is controlled by the regression in the DS and the variable position of the salt edge that is most eastward at the north of the DS than at south of that. Th is interpretation is illustrated by the graph presented in Fig. 10 that shows the direct correlation between the position of the salt edge (based on seismic refraction mapping) and the time of sinkhole appearance. Th us, according to our data, the development of sinkholes in the western DS shore is associated with the salt edge, which is situated in progressively more eastern positions towards the north (Fig. 4).
Fig. 10. Time of fi rst appearance of sinkholes vs. the shift to the east of the salt edge revealed by the seismic refraction study at ten DS sites. Th e error bar refl ects the uncertainty about the time of sinkhole appearance and the range of variations of the salt edge at various sites.

84 Mikhail Ezersky et al.
6.1.2. Pre-existing caverns
Microgravity and MRS results point to the existence of zones with a high density of cavities at the early stage of sinkhole appearance (Eppelbaum et al. 2008, Legchenko et al. 2008a). Dissolutional cavities develop in the salt layer in contact with sediments saturated with high salinity groundwater (50–80% of chloride saturation). Th e seismic refraction study points to the fact that these voids are aligned along the edge of the salt formation. One of the models of DS sinkhole formation developed by the Geological Survey of Israel (Sha-lev et al. 2006) considers salt dissolution by fresh water coming through faults from the aquifers underlying the salt. Th e authors indicate that it takes 20 years for the fresh water to fl ush out the brines from the salt layer and then to dissolve the salt to create a cavity up to the shallower clay layer (Shalev et al. 2006). Th e model requires that the faults should be active to disrupt the clay layers and to keep fault permeability high. Th e authors of the Geological Survey of Israel consider also other models of sinkhole formation. For instance, the clay layers can be noncontinuous, so that in places the salt layer is directly attached to the gravel aquifer. In this case dissolution occurs in these isolated places and not linked to a fault (Shalev et al 2008). Such case has been proved by the seismic refraction surveys in most of the ten investigated sites of the western DS coast (Section 5.1). Th is model does not estimate the time of salt dissolution and cave formation.
Almost fresh groundwater was discovered only in the Ein Gedi area, whereas sink-holes develop along the entire DS coast in a very saline environment. Furthermore, voids up to 5 m high (Fig. 2b, for instance) fi lled with saline groundwater (~ 200 g/l chloride) were detected in numerous boreholes (HS-2, Mineral-2, EB-1 etc). Taking into account the limited dissolution capacity of the saline groundwater and based on microgravity and MRS estimates of the volume of the cavities, we suggest as a non-corroborated hypo thesis (Legchenko et al. 2008) that the process of sinkhole development could be considerably slower than it is presumed in the model of Shalev et al. (2006) discussed above.
Based on geophysical results we suggest that the process of sinkhole formation com-prises three stages:
a) Development of dissolutional cavities in the salt layer long before collapse.
b) Upward propagation of the cavity by progressive roof collapse with the consequent infi ll of the original cavity reducing its permeability.
c) Slowing down and completion of the fi rst cycle of sinkhole development.
Our suggestion could be tested by computations using the parameters of the cavities identi-fi ed by geophysical methods. It would be very useful to obtain additional information of the unknown geometry and size of the cavities introducing optical and acoustic televiewers in boreholes. Nevertheless, geophysical methods and the fact that sinkhole development is controlled by the position of the salt edge may help to produce sinkhole susceptibility maps.

85Th e Dead Sea sinkhole hazard
Fig.
11.
Lon
g te
rm si
nkho
le d
evel
opm
ent i
n th
e co
asta
l are
a of
Isra
el. N
umbe
r of s
inkh
oles
vs.
fi rst
appe
aran
ce ti
me
grap
hs: (
a) in
tegr
al g
raph
fo
r ent
ire co
ast (
afte
r Abe
lson
et a
l); (b
) Nah
al H
ever
Sou
th si
te; (
c) N
ahal
Hev
er N
orth
site
; (d)
Ein
Ged
i – N
ahal
Aru
got a
rea:
curv
e 1 –
gra
ph
for
the
entir
e ar
ea b
etw
een
the
shift
to
the
nort
h 59
5045
to
5968
00, c
urve
2 –
gra
ph f
or t
he a
rea
betw
een
the
Mili
tary
cam
p an
d N
ahal
Ar
ugot
(hen
cefo
rth
sout
h of
Aru
got),
cur
ve 3
– g
raph
for t
he a
rea
betw
een
Nah
al A
rugo
t and
Nah
al D
avid
(nor
th o
f Aru
got);
(e) M
iner
al B
each
(S
hale
m-2
); (f
) Nah
al Q
ane
Nor
th. (
Afye
r dat
abas
e of
GSI
and
Tam
ar R
egio
nal C
ounc
il fo
r a p
erio
d of
199
8–20
07).

86 Mikhail Ezersky et al.
6.1.3. Sinkhole development in sites through time
Th e spatio-temporal distribution pattern of the sinkholes in several sites was analyzed using the sinkhole inventories complied by the Geological Survey of Israel and the Tamar Regional Council (Fig. 11).
Th e graph generated by Abelson et al. (2006) shows that until 2006 the total number of sinkholes along the DS shore increased parabolically (Fig. 11a). However, in some sites the process of sinkhole development was signifi cantly diff erent. In the southern sites such as the Nahal Hever South most of the sinkholes developed during 1999–2003 (Fig. 11b). At the present time sinkhole development is active in the northern part of the Nahal Hever South site; somewhat 300 m north of the earlier sinkhole area. Th e development of sink-holes in the Nahal Hever North area is similar to that of the Nahal Hever South site. Th e only diff erence being that after 2004 the rate of sinkhole formation has decreased in Nahal Hever North (Fig. 11c). Th e diff erences in local sinkhole development can be seen in the Ein-Gedi – Nahal Arugot area where a narrow sinuous strip of sinkholes oriented in the north-south direction is of about two kilometers long (Fig. 11c). Th e summary graph for the entire Ein Gedi – Arugot area (1 in Fig. 11d) is similar to the graph in Fig. 11a. Th e number of sinkholes increased in the course of the last 12 years at a faster rate. Sinkhole develop-ment in the area located south of Nahal Arugot has slowed down (curve 2 in Fig. 11d), whereas north of Nahal Arugot it has slightly increased since 2003 (curve 3 in Fig. 11d). Th e 50m-wide sinkhole strip does not exceed the boundaries drawn in Yechieli et al. (2002). At Mineral Beach site the process seems to have slowed down in 2005 (Fig. 11e) and in the Qane North (the northernmost of all examined sites, Fig. 11f ) the frequency of sinkhole occurrence has increased since 2004. It can be seen from graphs presented in Figs. 11b–11f that there are three characteristic time periods: (1) sinkhole increase at low rate; (2) sinkhole increase at a high linear rate; and (3) slowing down of sinkhole development at varying rate from high to low. Although the fi rst phase may be a subject to debate because of lack of enough data, that of the second one can be deduced from the GIS data presented in Fig. 11. Th e main (second) phase of sinkhole occurrence lasts for 4–6 years and sub-sequently the subsidence process slows down. Geophysical results explain this fact by the fi lling up of karstic cavities by collapse and internal erosion processes leading to a decrease in the hydraulic conductivity of the voids. Th e process tends to migrate northwards and eastwards controlled by the position of the salt edge and the regression of the DS.
6.1.4. Infl uence of the faults and featheredge on the sinkhole distribution
Although the seismic refl ection method was not applied within the framework of this project, the tectonic control on the subsidence phenomena should be addressed here. Abelson et al. (2003, 2006) found a good correlation between the main neotectonic fault directions and the preferred orientation of the sinkhole alignments in the DS western coast. Th is fact led to these authors to indicate that faults control the spatial distribution of sinkholes. Numerous faults widely distributed through DS coastal area have been reported by diff erent researchers (Abelson et al. 2003, 2006, Closson 2005, Shamir 2006). However, sinkholes are devel-oped in a narrow strip 50–100m wide along the DS shoreline.
87Th e Dead Sea sinkhole hazard
Th e high resolution refl ection study carried out in the Nahal Hever south area has shown numerous structures in the subsurface distributed along the 200 m long refl ection profi le (Ezersky et al. 2006). Th ese structures can be considered as subvertical faults and joints. Despite the fact that there is no defi nitive evidence on the correlation between sink-holes and faults, we do not exclude that the latter may infl uence to sinkhole development. However, in our opinion mapping faults demands additional comprehensive studies based on improved the seismic refl ection technique.
On the other hand, seismic refraction studies have shown the spatial correlation between sinkholes and the salt edge at the Ein Gedi site (Ezersky 2003, 2006). More recently, the same spatial association has been documented in most of the ten studied sites in Israel (Ezersky 2008a). Consequently, we consider the salt edge is a very important factor in sinkhole development. Th e seismic mapping of the salt edge could be used as a tool for pro-ducing sinkhole susceptibility maps.
Conclusions
A multidisciplinary geophysical study has been performed in the Dead Sea coastal areas of Israel and Jordan in order to gain insight into the factors and processes involved in the development of sinkholes. Th e main fi ndings of the investigation include:(1) Th e sinkholes develop in a narrow (50–100m) strip associated with the salt edge. Th e
50 m wide belt situated to the east of the salt featheredge can be considered as a particu-larly susceptible area to sinkhole formation. Seismic results show that the tendency of sinkhole activity to propagate northwards denoted by GIS data of GSI (Abelson et al. 2006) is controlled by the regression of the DS and the spatial distribution of the salt edge.
(2) Based on our microgravimetry and MRS studies, the karstic cavities in the sinkhole sites reach total volumes of the order of thousands of cubic meters.
(3) Th e karstic cavities developed in the salt are fi lled by collapse and suff osion processes. According to our MRS study, the infi ll of the voids involves a signifi cant reduction in the hydraulic conductivity (~ 2–5 times) and consequently sinkhole activity slows down.
(4) Th e salt edge environment has very low resistivity, mainly in the range of 0.25–0.6 Ωm, which indicates that the pores of the sediments are fi lled with high salinity DS brine (Kafri et al. 1997). Chloride concentration based on TEM calibration is estimated approximately at 54–80% of chloride saturation. It means that the groundwater in contact with salt is chloride-undersaturated and has a potential for dissolving salt. TEM monitoring shows that resistivity does not increase with time (based on 3–9 years of observation).
(5) Th e applied geophysical methods provide useful information of the sinkhole hazard management in the DS.
88 Mikhail Ezersky et al.
Acknowledgements
Th e investigation was sponsored by the NATO “Security Th rough Science” Program (project SfP N° 981128) and the Israel Ministry of Infrastructure. Th e authors wish to thank U. Frieslander for his contribution to the project. We are grateful to the GII staff for the effi cient organization of the fi eldwork. We wish to thank Dr. Y. Yechieli and Dr. M. Abelson at the Geological Survey of Israel for providing geological data about the investi-gated areas. Th anks to Dr. A. Frumkin for support and help with the interpretations. We are grateful to Tamar Regional Council, Mr Y.Goldman and Mr. E. Raz for assistance in the database construction. We are grateful to L. Yuhr for her constructive review of the manu-script and suggested improvements. Th anks also to Dr. F. Gutierrez and Prof. Jo De Waele for comprehensive editing of the manuscript.
References
Abelson, M., Baer, G., Shtivelman, V., Wachs, D., Raz, E., Crouvi, O., Kurzon, I. & Yechieli, Y. (2003): Collapse sinkholes and radar interferometry reveal neo-tectonics concealed within the Dead Sea basin, Geophys. – Res. Lett. 30 (10): 1545; doi: 10.1029/2003GL017103, 2003.
Abelson, M., Yechieli, Y., Crouvi, O., Baer, G., Wachs, D., Bein, A., & Shtivelman, V. (2006): Evolution of the Dead Sea sinkholes. – Geol. Soc. Amer., Spec. pap. 401: 1–14; doi: 10.1130/2006.2401.(16).
Arkin, Y. & Gilat, A. (2000): Dead Sea sinkholes – an ever-developing hazard. – Environ. Geol. 39 (7):711–722.
Barsukov, P., Fainberg, E. & Khabensky, E. (2006): Shallow investigations by TEM-FAST tech-nique: Methodology and examples. – In: Spichak, V. (ed.): Electromagnetic sounding of the Earth’s interior, Methods in Geochemistry and Geophysics, V. 40, Elcevier, 10: 55–77.
Closson, D. (2005): Concurrence between Geo-Hazards induced by the Dead Sea lowering and the geological Setting. – PhD thesis, University de Liege, Belgian.
Eppelbaum, L., Ezersky, M., Al-Zoubi, A. & Goldshmidt, V. (2008): Study of the factors aff ecting the karst volume assessment in the Dead Sea sinkhole problem using microgravity fi eld analysis and 3D modeling. – Advances in Geosci., Vol. 18: 1–19.
Ezersky, M. (2003b): Study of the shallow subsurface sinkhole hazard areas along Dead Sea shore using geophysical methods. Part 2. – Interpretation, G.I.I. No.211/247/02-2.
Ezersky, M. (2006): Th e geophysical properties of the Dead Sea salt in application to sinkhole problem. – J. Appl. Geoph. 58 (1): 45–58.
Ezersky, M. (2008): Geoelectric structure of the Ein Gedi sinkhole occurrence site at the Dead Sea shore in Israel. – J. Appl. Geoph., 64: 56–69.
Ezersky, M., Bruner, I., Keydar, S., Trachtman, P. & Rybakov, M. (2006): Integrated study of the sinkhole development site using geophysical methods at the Dead Sea western shore. – Near Surface Geophysics, 4 (5): 335–343.
Ezersky, M., & Legchenko, A. (2008a). Sinkhole Hazards. Part I. Mapping of the salt in sinkhole hazardous sites along western Dead Sea shore using Seismic Refraction method. – NATO Programme Science for Peace, Project SfP 981128. Report No.232/361/08. GII-IRD.
Ezersky, M., Legchenko, A., Camerlynck, C. & Al-Zoubi, A. (2008b): Identifi cation of sinkhole development mechanism based on a combined geophysical study in Nahal Hever South area (Dead Sea coast of Israel). – Environ. Geol. 58 (5): 1123–1141; doi 10.1007/s00254-008-1591-7.
Ezersky, M., Legchenko, A., Camerlynck, C. & Chalikakis, K. (2008c): Sinkhole hazards. Part III. TEM mapping of shallow aquifers and study of their link with sinkhole development in the
89Th e Dead Sea sinkhole hazard
Dead Sea coastal area of Israel. – NATO Programme Science for Peace, Project SfP 981128. Report No. 232/362/08. GII- Paris 6 University-IRD.
Frumkin, A. & Raz, E. (2001): Collapse and subsidence associated with salt karstifi cation along the Dead Sea. – Carbonates and Evaporites 16 (2): 117–130.
Gutiérrez, F., Cooper, A.H. & Johnson, K.S. (2008): Identifi cation, prediction, and mitigation of sinkhole hazards in evaporate karst areas. – Environ. Geol. 53: 1007–1022; doi: 10.1007/s00254-007-0728-4.
Kafri, U. Goldman, M. & Lang, B. (1997): Detection of subsurface brines, freshwater bodies and the interface confi guration in-between by the Time Domain Electromagnetic Method in the Dead Sea rift, Israel. – Environ. Geol. 31: 42–49.
Legchenko, A., Ezersky, M., Camerlink, C., Al-Zoubi, A., Chalikakis, K. & Girard, J.-F. (2008a): Locating water-fi lled karst caverns and estimating their volume using magnetic reso-nance soundings. – Geophysics 73 (5): 51–61; doi: 10.1190/1.2958007.
Legchenko, A., Ezersky, M., Boucher, M., Camerlynck, C., Al-Zoubi, A. & Chalikakis, K. (2008b): Pre-existing caverns in salt formations could be the major cause of sinkhole hazards along the coast of the Dead Sea. – Geophys. Res. Lett. 35: 19404; doi: 10.1029/2008GL035510.
Legchenko, A., Ezersky, M., Camerlynck, C. & Al-Zoubi, A. (2007): MRS study of the evolu-tion of aquifer in sinkhole hazardous area (Dead Sea coast). – 13th EAGE Near Surface Meeting & Exhibition 2007, Istanbul, Turkey, 3–5 Sep. 2007, B29.
Legchenko, A. & Valla, P. (2002): A review of the basic principles for proton magnetic resonance sounding measurements. – J. Appl. Geophys. 50: 3–19.
Palmer, D. (1986): Refraction seismic. Th e lateral resolution of structure and seismic velocity. – Geophys. Press Ltd., London–Amsterdam.
Rybakov, M., Goldshmidt, V., Fleischer, L. & Rotstein, Y. (2001): Cave detection and 4-d monitoring: a microgravity case history near the Dead Sea. – Th e Leading Edge 20 (8): 896–900; doi: 10.1190/1.1487303.
Shalev, E., Lyakhovsky, V. & Yechieli, Y. (2006): Salt dissolution and sinkhole formation along the Dead Sea shore. – J. Geophys. Res. 111: B03102; doi: 10.1029/2005JB004038.
Shamir, G. (2006): Th e active structures of the DS depression. – Geol. Soc. Amer., Spec. Pap. 401: 15–32.
Taqieddin, S.A., Abderahman, N.S. & Atallah, M. (1999): Sinkhole hazards along the eastern Dead Sea shoreline area, Jordan: a geological and geotechnical consideration. – Environ. Geol. 39 (11): 1237–1253.
Vouillamoz, J.-M., Legchenko, A., Albouy, Y., Bakalowicz, M., Baltassat, J.-M. & Al-Fares, W. (2003): Localization of saturated karst aquifer with magnetic resonance sounding and resistivity imagery. – Ground Water 41: 578–587.
Yechieli, Y., Abelson, M., Bein, A. & Crouvi, O. (2006): Sinkhole “swarms” along the Dead Sea coast: refl ection of disturbance of lake and adjacent groundwater systems. – GSA Bull. 118 (9/10): 1075–1087; doi: 10.1130/B25880.1.
Yechieli, Y. & Gavrieli, I. (2000): Geohydrological processes in the Dead Sea area. – GSI Current Res. 12: 1–6.
Yechieli, Y., Wachs, D., Shtivelman, V., Abelson, M., Onn, C., Raz, E. & Baer, G. (2002): Formation of sinkholes along the shore of the Dead Sea – summary of the fi rst stage of investiga-tions. – Geol. Surv. Israel, Curr. Res. 13: 1–6.
Addresses of the authors:Michael Ezersky, (corresponding author), Geophysical Institute of Israel, 6, Haba’al Shem Tov Str. PO Box 182, Lod 71100, Israel, Tel: +972 8 978 5888, Fax: +972 8 920 8811, Email: [email protected]

90 Mikhail Ezersky et al.
Anatoly Legchenko, Institut de Recherche pour le Développement (IRD-LTHE), LTHE, BP53, 38041 Grenoble Cedex 9, France, Tel: +33 4 76 82 50 63, Fax: +33 4 76 82 50 14, Email: [email protected] Camerlynck, Université Pierre et Marie Curie-Paris 6, UMR 7619 Sisyphe, 4, place Jussieu, 75252 Paris Cedex 05, France, Tel: +33 1 44 27 48 23, Fax: +33 1 44 27 48 23, Email: [email protected] Al-Zoubi, Al-Balqa Applied University, Eng. Faculty, Salt, 19117 Jordan, Tel: +62 5 3532519, Fax: +62 5 3532519, Email: [email protected] Eppelbaum, Dept. of Geophysical and Planetary Sciences, Raymond and Beverly Sakler Faculty of Exact Sciences, Tel-Aviv University, Ramat-Aviv 69978, Tel Aviv, Israel, Email: [email protected], Shmariahu, Geophysical Institute of Israel, 6, Haba’al Shem Tov Str. PO Box 182, Lod 71100, Israel, Email: [email protected] Boucher, Institut de Recherche pour le Développement (IRD-HSM), BP 11416, Niamey, Niger, Email: [email protected] Chalikakis, Institut de Recherche pour le Développement (IRD-LTHE), LTHE, BP53, 38041 Grenoble Cedex 9, France, Email: [email protected]