telecom italia - form 20-f 2006 - gruppo tim
TRANSCRIPT


UNITED STATESSECURITIES AND EXCHANGE COMMISSION
WASHINGTON, D.C. 20549
FORM 20-F‘ REGISTRATION STATEMENT PURSUANT TO SECTION 12(b) OR (g) OF THE SECURITIES EXCHANGE ACT OF 1934
ORÈ ANNUAL REPORT PURSUANT TO SECTION 13 OR 15(d) OF THE SECURITIES EXCHANGE ACT OF 1934
For the fiscal year ended: December 31, 2006OR
‘ TRANSITION REPORT PURSUANT TO SECTION 13 OR 15(d) OF THE SECURITIES EXCHANGE ACT OF 1934For the transition period from N/A to N/A
OR‘ SHELL COMPANY REPORT PURSUANT TO SECTION 13 OR 15(d) OF THE SECURITIES EXCHANGE ACT OF 1934
Date of event requiring this shell company reportCommission file number: 1-13882
Telecom Italia S.p.A.(Exact name of Registrant as specified in its charter)
Italy(Jurisdiction of incorporation or organization)Piazza degli Affari 2, 20123 Milan, Italy
(Address of principal executive offices)
Securities registered or to be registered pursuant to Section 12(b) of the Act:Title of each class Name of each exchange on which registered
American Depositary Shares, each representing 10 Ordinary Shares of€0.55 par value each (the “Ordinary Share ADSs”) The New York Stock Exchange
Ordinary Shares of €0.55 par value each (the “Ordinary Shares”) The New York Stock Exchange*American Depositary Shares, each representing 10 Savings Shares of
€0.55 par value each (the “Savings Share ADSs”) The New York Stock ExchangeSavings Shares of €0.55 par value each (the “Savings Shares”) The New York Stock Exchange*
Securities registered or to be registered pursuant to Section 12(g) of the Act:None
(Title of Class)Securities for which there is a reporting obligation pursuant to Section 15(d) of the Act:
None(Title of Class)
Indicate the number of outstanding shares of each of the issuer’s classes of capital or common stockas of the close of the period covered by the annual report.
Ordinary Shares 13,254,906,691Savings Shares 6,026,120,661
Indicate by check mark if the registrant is a well-known seasoned issuer, as defined in Rule 405 of the Securities Act. Yes È No ‘
If this report is an annual or transition report, indicate by check mark if the registrant is not required to file reports pursuant to Section 13 or 15(d)of the Securities Exchange Act of 1934. Yes ‘ No È
Note—Checking the box above will not relieve any registrant required to file reports pursuant to Section 13 or 15(d) of the Securities Exchange Actof 1934 from their obligations under those Sections.Indicate by check mark whether the registrant (1) has filed all reports required to be filed by Section 13 or 15(d) of the Securities Exchange Act of1934 during the preceding 12 months (or for such shorter period that the registrant was required to file such reports), and (2) has been subject tosuch filing requirements for the past 90 days. Yes È No ‘
Indicate by check mark whether the registrant is a large accelerated filer, an accelerated filer, or a non-accelerated filer. See definition of“accelerated filer and large accelerated filer” in Rule 12b-2 of the Exchange Act. (Check one):Large accelerated filer È Accelerated filer ‘ Non-accelerated filer ‘
Indicate by check mark which financial statement item the registrant has elected to follow. Item 17 ‘ Item 18 È
If this is an annual report, indicate by check mark whether the registrant is a shell company (as defined in Rule 12b-2 of the ExchangeAct). Yes ‘ No È
* Not for trading, but only in connection with the registration of American Depositary Shares representing such Ordinary Shares or SavingsShares, as the case may be, pursuant to the requirements of the Securities and Exchange Commission.


TABLE OF CONTENTS
INTRODUCTION . . . . . . . . . . . . . . . . . . . . . . . . . . . . . . . . . . . . . . . . . . . . . . . . . . . . . . . . . . . . . . . . . . . . . . . . . . . . . . . . . . . . . . . . . . . 1
KEY DEFINITIONS . . . . . . . . . . . . . . . . . . . . . . . . . . . . . . . . . . . . . . . . . . . . . . . . . . . . . . . . . . . . . . . . . . . . . . . . . . . . . . . . . . . . . . . . . 3
PART I . . . . . . . . . . . . . . . . . . . . . . . . . . . . . . . . . . . . . . . . . . . . . . . . . . . . . . . . . . . . . . . . . . . . . . . . . . . . . . . . . . . . . . . . . . . . . . . . . . . . 4
Item 1. IDENTITY OF DIRECTORS, SENIOR MANAGEMENT AND ADVISERS . . . . . . . . . . . . . . . . . . . . . . . . . 4
Item 2. OFFER STATISTICS AND EXPECTED TIMETABLE . . . . . . . . . . . . . . . . . . . . . . . . . . . . . . . . . . . . . . . . . . . . . 4
Item 3. KEY INFORMATION . . . . . . . . . . . . . . . . . . . . . . . . . . . . . . . . . . . . . . . . . . . . . . . . . . . . . . . . . . . . . . . . . . . . . . . . . . . . 4
3.1 RISK FACTORS . . . . . . . . . . . . . . . . . . . . . . . . . . . . . . . . . . . . . . . . . . . . . . . . . . . . . . . . . . . . . . . . . . . . . . . . . . . . . . . . . . . . 4
3.2 EXCHANGE RATES . . . . . . . . . . . . . . . . . . . . . . . . . . . . . . . . . . . . . . . . . . . . . . . . . . . . . . . . . . . . . . . . . . . . . . . . . . . . . . . . 13
3.3 SELECTED FINANCIAL AND STATISTICAL INFORMATION . . . . . . . . . . . . . . . . . . . . . . . . . . . . . . . . . . . . . . . . . 14
3.4 DIVIDENDS . . . . . . . . . . . . . . . . . . . . . . . . . . . . . . . . . . . . . . . . . . . . . . . . . . . . . . . . . . . . . . . . . . . . . . . . . . . . . . . . . . . . . . . 20
Item 4. INFORMATION ON THE TELECOM ITALIA GROUP . . . . . . . . . . . . . . . . . . . . . . . . . . . . . . . . . . . . . . . . . . . . 22
4.1 BUSINESS . . . . . . . . . . . . . . . . . . . . . . . . . . . . . . . . . . . . . . . . . . . . . . . . . . . . . . . . . . . . . . . . . . . . . . . . . . . . . . . . . . . . . . . . 22
4.2 BUSINESS UNITS . . . . . . . . . . . . . . . . . . . . . . . . . . . . . . . . . . . . . . . . . . . . . . . . . . . . . . . . . . . . . . . . . . . . . . . . . . . . . . . . . 36
4.3 REGULATION . . . . . . . . . . . . . . . . . . . . . . . . . . . . . . . . . . . . . . . . . . . . . . . . . . . . . . . . . . . . . . . . . . . . . . . . . . . . . . . . . . . . . 66
4.4 GLOSSARY OF SELECTED TELECOMMUNICATIONS TERMS . . . . . . . . . . . . . . . . . . . . . . . . . . . . . . . . . . . . . . . . 74
4.5 DESCRIPTION OF PROPERTY, PLANTS AND EQUIPMENT . . . . . . . . . . . . . . . . . . . . . . . . . . . . . . . . . . . . . . . . . . 82
Item 4A. UNRESOLVED STAFF COMMENTS . . . . . . . . . . . . . . . . . . . . . . . . . . . . . . . . . . . . . . . . . . . . . . . . . . . . . . . . . . . 86
Item 5. OPERATING AND FINANCIAL REVIEW AND PROSPECTS . . . . . . . . . . . . . . . . . . . . . . . . . . . . . . . . . . . . . 87
5.1 GENERAL FACTORS AFFECTING THE TELECOM ITALIA GROUP’S BUSINESS . . . . . . . . . . . . . . . . . . . . . . . . 87
5.2 SIGNIFICANT TRENDS IMPACTING OUR CORE BUSINESSES . . . . . . . . . . . . . . . . . . . . . . . . . . . . . . . . . . . . . . 89
5.3 CRITICAL ACCOUNTING POLICIES AND ESTIMATES . . . . . . . . . . . . . . . . . . . . . . . . . . . . . . . . . . . . . . . . . . . . . . 90
5.4 ADOPTION OF INTERNATIONAL FINANCIAL REPORTING STANDARDS . . . . . . . . . . . . . . . . . . . . . . . . . . . . . 95
5.5 RESULTS OF OPERATIONS FOR THE THREE YEARS ENDED DECEMBER 31, 2006 . . . . . . . . . . . . . . . . . . . 96
5.6 LIQUIDITY AND CAPITAL RESOURCES . . . . . . . . . . . . . . . . . . . . . . . . . . . . . . . . . . . . . . . . . . . . . . . . . . . . . . . . . . . . 133
5.7 RESEARCH, DEVELOPMENT AND INNOVATION . . . . . . . . . . . . . . . . . . . . . . . . . . . . . . . . . . . . . . . . . . . . . . . . . . . . 151
5.8 CONSOLIDATED FINANCIAL STATEMENTS AS OF AND FOR THE THREE YEAR PERIOD ENDEDDECEMBER 31, 2006—RECONCILIATION OF IFRS TO U.S. GAAP . . . . . . . . . . . . . . . . . . . . . . . . . . . . . . . . . . . . 152
5.9 CAUTIONARY STATEMENT FOR PURPOSES OF THE “SAFE HARBOR” PROVISIONS OF THE UNITEDSTATES PRIVATE SECURITIES LITIGATION REFORM ACT OF 1995 . . . . . . . . . . . . . . . . . . . . . . . . . . . . . . . . . . 157
5.10 QUANTITATIVE AND QUALITATIVE DISCLOSURES ABOUT MARKET RISKS . . . . . . . . . . . . . . . . . . . . . . . 158
Item 6. DIRECTORS, SENIOR MANAGEMENT AND EMPLOYEES . . . . . . . . . . . . . . . . . . . . . . . . . . . . . . . . . . . . . . 166
6.1 DIRECTORS . . . . . . . . . . . . . . . . . . . . . . . . . . . . . . . . . . . . . . . . . . . . . . . . . . . . . . . . . . . . . . . . . . . . . . . . . . . . . . . . . . . . . . . 166
6.2 EXECUTIVE OFFICERS . . . . . . . . . . . . . . . . . . . . . . . . . . . . . . . . . . . . . . . . . . . . . . . . . . . . . . . . . . . . . . . . . . . . . . . . . . . . 172
6.3 BOARD OF AUDITORS . . . . . . . . . . . . . . . . . . . . . . . . . . . . . . . . . . . . . . . . . . . . . . . . . . . . . . . . . . . . . . . . . . . . . . . . . . . . . 175
6.4 EXTERNAL AUDITORS . . . . . . . . . . . . . . . . . . . . . . . . . . . . . . . . . . . . . . . . . . . . . . . . . . . . . . . . . . . . . . . . . . . . . . . . . . . . . 176
6.5 EMPLOYEES . . . . . . . . . . . . . . . . . . . . . . . . . . . . . . . . . . . . . . . . . . . . . . . . . . . . . . . . . . . . . . . . . . . . . . . . . . . . . . . . . . . . . . 177
6.6 COMPENSATION OF DIRECTORS, OFFICERS AND MEMBERS OF THE BOARD OF AUDITORS . . . . . . . . 179
6.7 OPTIONS TO PURCHASE SECURITIES FROM REGISTRANT . . . . . . . . . . . . . . . . . . . . . . . . . . . . . . . . . . . . . . . . . 183
Item 7. MAJOR SHAREHOLDERS AND RELATED-PARTY TRANSACTIONS . . . . . . . . . . . . . . . . . . . . . . . . . . . 184
7.1 MAJOR SHAREHOLDERS . . . . . . . . . . . . . . . . . . . . . . . . . . . . . . . . . . . . . . . . . . . . . . . . . . . . . . . . . . . . . . . . . . . . . . . . . . 184
7.2 RELATED-PARTY TRANSACTIONS . . . . . . . . . . . . . . . . . . . . . . . . . . . . . . . . . . . . . . . . . . . . . . . . . . . . . . . . . . . . . . . . . 189
Item 8. FINANCIAL INFORMATION . . . . . . . . . . . . . . . . . . . . . . . . . . . . . . . . . . . . . . . . . . . . . . . . . . . . . . . . . . . . . . . . . . . . . 190
8.1 HISTORICAL FINANCIAL STATEMENTS . . . . . . . . . . . . . . . . . . . . . . . . . . . . . . . . . . . . . . . . . . . . . . . . . . . . . . . . . . . 190
8.2 LEGAL PROCEEDINGS . . . . . . . . . . . . . . . . . . . . . . . . . . . . . . . . . . . . . . . . . . . . . . . . . . . . . . . . . . . . . . . . . . . . . . . . . . . . . 191
i

Item 9. LISTING . . . . . . . . . . . . . . . . . . . . . . . . . . . . . . . . . . . . . . . . . . . . . . . . . . . . . . . . . . . . . . . . . . . . . . . . . . . . . . . . . . . . . . . . 192
9.1 TRADING OF TELECOM ITALIA ORDINARY SHARES AND SAVINGS SHARES . . . . . . . . . . . . . . . . . . . . . . . . 192
9.2 TRADING OF OLD TELECOM ITALIA ORDINARY SHARES AND SAVINGS SHARES . . . . . . . . . . . . . . . . . . . 194
9.3 SECURITIES TRADING IN ITALY . . . . . . . . . . . . . . . . . . . . . . . . . . . . . . . . . . . . . . . . . . . . . . . . . . . . . . . . . . . . . . . . . . 195
9.4 CLEARANCE AND SETTLEMENT OF TELECOM ITALIA SHARES . . . . . . . . . . . . . . . . . . . . . . . . . . . . . . . . . . . . . . 196
Item 10. ADDITIONAL INFORMATION . . . . . . . . . . . . . . . . . . . . . . . . . . . . . . . . . . . . . . . . . . . . . . . . . . . . . . . . . . . . . . . . . 197
10.1 CORPORATE GOVERNANCE . . . . . . . . . . . . . . . . . . . . . . . . . . . . . . . . . . . . . . . . . . . . . . . . . . . . . . . . . . . . . . . . . . . . . . 197
10.2 EXCHANGE CONTROLS AND OTHER LIMITATIONS AFFECTING SECURITY HOLDERS . . . . . . . . . . . . . . 215
10.3 DESCRIPTION OF BYLAWS . . . . . . . . . . . . . . . . . . . . . . . . . . . . . . . . . . . . . . . . . . . . . . . . . . . . . . . . . . . . . . . . . . . . . . . 216
10.4 DESCRIPTION OF CAPITAL STOCK . . . . . . . . . . . . . . . . . . . . . . . . . . . . . . . . . . . . . . . . . . . . . . . . . . . . . . . . . . . . . . . 218
10.5 DESCRIPTION OF AMERICAN DEPOSITARY RECEIPTS . . . . . . . . . . . . . . . . . . . . . . . . . . . . . . . . . . . . . . . . . . . 223
10.6 TAXATION . . . . . . . . . . . . . . . . . . . . . . . . . . . . . . . . . . . . . . . . . . . . . . . . . . . . . . . . . . . . . . . . . . . . . . . . . . . . . . . . . . . . . . . 231
Item 11. QUANTITATIVE AND QUALITATIVE DISCLOSURES ABOUT MARKET RISKS . . . . . . . . . . . . . . . . 236
Item 12. DESCRIPTION OF SECURITIES OTHER THAN EQUITY SECURITIES . . . . . . . . . . . . . . . . . . . . . . . . . 237
PART II . . . . . . . . . . . . . . . . . . . . . . . . . . . . . . . . . . . . . . . . . . . . . . . . . . . . . . . . . . . . . . . . . . . . . . . . . . . . . . . . . . . . . . . . . . . . . . . . . . . 238
Item 13. DEFAULTS, DIVIDEND ARREARAGES AND DELINQUENCIES . . . . . . . . . . . . . . . . . . . . . . . . . . . . . . . . 238
Item 14. MATERIAL MODIFICATION TO THE RIGHTS OF SECURITY HOLDERS AND USE OFPROCEEDS . . . . . . . . . . . . . . . . . . . . . . . . . . . . . . . . . . . . . . . . . . . . . . . . . . . . . . . . . . . . . . . . . . . . . . . . . . . . . . . . . . . . . . . . . . . . . 239
Item 15. CONTROLS AND PROCEDURES . . . . . . . . . . . . . . . . . . . . . . . . . . . . . . . . . . . . . . . . . . . . . . . . . . . . . . . . . . . . . . 240
15.1 DISCLOSURE CONTROLS AND PROCEDURES . . . . . . . . . . . . . . . . . . . . . . . . . . . . . . . . . . . . . . . . . . . . . . . . . . . . 240
15.2 MANAGEMENT’S ANNUAL REPORT ON INTERNAL CONTROL OVER FINANCIAL REPORTING . . . . . . 241
15.3 CHANGES IN INTERNAL CONTROL OVER FINANCIAL REPORTING . . . . . . . . . . . . . . . . . . . . . . . . . . . . . . . 244
Item 16A. AUDIT COMMITTEE FINANCIAL EXPERT . . . . . . . . . . . . . . . . . . . . . . . . . . . . . . . . . . . . . . . . . . . . . . . . . . . 245
Item 16B. CODE OF ETHICS AND CONDUCT . . . . . . . . . . . . . . . . . . . . . . . . . . . . . . . . . . . . . . . . . . . . . . . . . . . . . . . . . . 245
Item 16C. PRINCIPAL ACCOUNTANT FEES AND SERVICES . . . . . . . . . . . . . . . . . . . . . . . . . . . . . . . . . . . . . . . . . . . 246
Item 16D. EXEMPTIONS FROM THE LISTING STANDARDS FOR AUDIT COMMITTEES . . . . . . . . . . . . . . 248
Item 16E. REPURCHASES OF EQUITY SECURITIES . . . . . . . . . . . . . . . . . . . . . . . . . . . . . . . . . . . . . . . . . . . . . . . . . . . 248
PART III . . . . . . . . . . . . . . . . . . . . . . . . . . . . . . . . . . . . . . . . . . . . . . . . . . . . . . . . . . . . . . . . . . . . . . . . . . . . . . . . . . . . . . . . . . . . . . . . . . 249
Item 17. FINANCIAL STATEMENTS . . . . . . . . . . . . . . . . . . . . . . . . . . . . . . . . . . . . . . . . . . . . . . . . . . . . . . . . . . . . . . . . . . . . 249
Item 18. FINANCIAL STATEMENTS . . . . . . . . . . . . . . . . . . . . . . . . . . . . . . . . . . . . . . . . . . . . . . . . . . . . . . . . . . . . . . . . . . . . 250
Item 19. FINANCIAL STATEMENTS AND EXHIBITS . . . . . . . . . . . . . . . . . . . . . . . . . . . . . . . . . . . . . . . . . . . . . . . . . . . . 250
ii

Introduction
INTRODUCTION
Telecom Italia S.p.A. is incorporated as a joint stock company under the laws of Italy. As used in this AnnualReport, unless the context otherwise requires, the term Company means Telecom Italia S.p.A. the operatingcompany for fixed and mobile telecommunications services in Italy and the holding company for variousbusinesses, principally telecommunications, and the terms “we”, “us” and “our” refers to the Company, and, asapplicable, the Company and its consolidated subsidiaries.
Unless otherwise indicated, the financial information contained in this Annual Report has been prepared inconformity with International Financial Reporting Standards as adopted by the European Commission for use inthe European Union (“IFRS”), which, as described in “Note 46—Reconciliation of IFRS as Adopted by the EU toU.S. GAAP” of the Notes to the Consolidated Financial Statements, differ in certain material respects fromgenerally accepted accounting principles in the United States (“U.S. GAAP”). Unless otherwise indicated, anyreference in this Annual Report to Consolidated Financial Statements is to the Consolidated Financial Statementsof the Telecom Italia Group (including the notes thereto) included elsewhere herein.
Telecom Italia adopted IFRS for the first time in its annual Consolidated Financial Statements for the year endedDecember 31, 2005, which included comparative financial statements for the year ended December 31, 2004. See“Item 5. Operating and Financial Review and Prospects—5.4 Adoption of International Financial ReportingStandards”.
Cautionary Statement for Purposes of the “Safe Harbor” Provisions of the United States PrivateSecurities Litigation Reform Act of 1995. The Private Securities Litigation Reform Act of 1995 provides a“safe harbor” for forward-looking statements. This Annual Report contains certain forward-looking statements.Forward-looking statements are statements that are not historical facts and can be identified by the use offorward-looking terminology such as “believes,” “may,’ “is expected to,” “will,” “will continue,” “should,”“seeks” or “anticipates” or similar expressions or the negative thereof or other comparable terminology, or by theforward-looking nature of discussions of strategy, plans or intentions.
The forward-looking statements in this Annual Report include, but are not limited to, the discussion of thechanging dynamics of the telecommunications marketplace, including the continuing developments incompetition in all aspects of our businesses from new competitors and from new and enhanced technologies, ouroutlook for growth in the telecommunications industry both within and outside of Italy, including our outlookregarding developments in the telecommunications industry, and certain trends we have identified particularly inour core Italian market, including regulatory measures regarding pricing and access for other local operators.Such statements include, but are not limited to, statements under the following headings: (i) “Item 3. KeyInformation—3.1 Risk Factors”, (ii) “Item 4. Information on the Telecom Italia Group—4.1 Business—4.1.7Updated Strategy”, (iii) “Item 4. Information on the Telecom Italia Group—4.3 Regulation”, (iv) “Item 5.Operating and Financial Review and Prospects”, (v) “Item 8. Financial Information—8.2 Legal Proceedings” and(vi) “Item 11. Quantitative and Qualitative Disclosures About Market Risks”, including statements regarding thelikely effect of matters discussed therein.
Actual results may differ materially from those projected or implied in the forward-looking statements. Suchforward-looking information is based on certain key assumptions which we believe to be reasonable but forward-looking information by its nature involves risks and uncertainties, which are outside our control, that couldsignificantly affect expected results.
The following important factors could cause our actual results to differ materially from those projected or impliedin any forward-looking statements:
Š the continuing impact of increased competition in a liberalized market, including competition fromlonger established domestic competitors and global and regional alliances formed by othertelecommunications operators in our core Italian domestic fixed-line and wireless markets;
Š our ability to introduce new services to stimulate increased usage of our fixed and wireless networks tooffset declines in the traditional fixed-line voice business due to the continuing impact of regulatoryrequired price reductions, market share loss, pricing pressures generally and shifts in usage patterns;
Š the level of demand for telecommunications services, particularly wireless telecommunications services inthe maturing Italian market and for new higher value added products and services such as broadband;
1

Introduction
Š our ability to achieve the planned synergies expected to be generated by the convergence between fixedtelephony, mobile, broadband internet and media content including in expenses, capital expendituresand capacity to launch new convergent services;
Š the success of our customer loyalty and retention programs and the impact of such programs on ourrevenues;
Š our ability to successfully implement our Internet and broadband strategy both in Italy and abroad;
Š our ability to successfully achieve our debt reduction targets;
Š the impact of regulatory decisions and changes in the regulatory environment in Italy and othercountries in which we operate;
Š the impact of economic development generally on our international business and on our foreigninvestments and capital expenditures;
Š the continuing impact of rapid or disruptive changes in technologies;
Š the impact of political and economic developments in Italy and other countries in which we operate;
Š the impact of fluctuations in currency exchange and interest rates;
Š our ability to successfully implement our strategy over the 2007-2009 period;
Š our ability to achieve the expected return on the investments and capital expenditures we have madeand continue to make in Brazil on mobile and in Europe on broadband;
Š our ability to successfully strengthen our business and exploit new adjacent markets, such as Pay-TVand IT services;
Š the amount and timing of any future impairment charges for our licenses, goodwill or other assets;
Š the outcome of litigation, disputes and investigations in which we are involved or may become involved;and
Š decreased mobile communications usage arising from actual or perceived health risks or other problemsrelating to mobile handsets or transmission masts.
The foregoing factors should not be construed as exhaustive. Due to such uncertainties and risks, readers arecautioned not to place undue reliance on such forward-looking statements, which speak only as of the datehereof. We undertake no obligation to release publicly the result of any revisions to these forward-lookingstatements which may be made to reflect events or circumstances after the date hereof, including, withoutlimitation, changes in our business or acquisition strategy or planned capital expenditures, or to reflect theoccurrence of unanticipated events.
2

Key Definitions
KEY DEFINITIONS
The following terms appearing in this Annual Report have the meanings set forth below.
Domestic Mobile . . . . . . . . . . . . . . . . . . . . . . . . . . . . . . . . . . . . . means the unit which operates our Italian mobilebusiness.
EU . . . . . . . . . . . . . . . . . . . . . . . . . . . . . . . . . . . . . . . . . . . . . . . . . . . . . means the European Union.
IFRS . . . . . . . . . . . . . . . . . . . . . . . . . . . . . . . . . . . . . . . . . . . . . . . . . . . means International Financial Reporting Standards, asadopted by the European Commission for use in theEuropean Union.
Merger . . . . . . . . . . . . . . . . . . . . . . . . . . . . . . . . . . . . . . . . . . . . . . . . means the merger of Old Telecom Italia into Olivetti,which became effective on August 4, 2003.
Old Telecom Italia and Old Telecom Italia Group . . . means Telecom Italia and its consolidated subsidiariesas they existed immediately prior to the effective dateof the Merger.
Olivetti . . . . . . . . . . . . . . . . . . . . . . . . . . . . . . . . . . . . . . . . . . . . . . . . unless otherwise indicated, means Olivetti S.p.A., theholding company and controlling shareholder of OldTelecom Italia.
Olivetti Group . . . . . . . . . . . . . . . . . . . . . . . . . . . . . . . . . . . . . . . . . means Olivetti and its consolidated subsidiaries,including Old Telecom Italia.
Ordinary Shares . . . . . . . . . . . . . . . . . . . . . . . . . . . . . . . . . . . . . . means the Ordinary Shares, €0.55 par value each, ofTelecom Italia.
Savings Shares . . . . . . . . . . . . . . . . . . . . . . . . . . . . . . . . . . . . . . . means the Savings Shares, €0.55 par value each, ofTelecom Italia.
Telecom Italia . . . . . . . . . . . . . . . . . . . . . . . . . . . . . . . . . . . . . . . . means the entity which resulted from the Merger.
Telecom Italia Group and Group . . . . . . . . . . . . . . . . . . . . means the Company and its consolidated subsidiaries.
Telecom Italia Media . . . . . . . . . . . . . . . . . . . . . . . . . . . . . . . . . Telecom Italia Media is the Telecom Italia Group’ssubsidiary operating in the Media business.
TIM . . . . . . . . . . . . . . . . . . . . . . . . . . . . . . . . . . . . . . . . . . . . . . . . . . . . means Telecom Italia Mobile S.p.A., the Telecom ItaliaGroup’s subsidiary which operated in the mobiletelecommunications business, and merged with andinto Telecom Italia, with Telecom Italia as the survivingcompany, effective as from June 30, 2005.
Tim Italia . . . . . . . . . . . . . . . . . . . . . . . . . . . . . . . . . . . . . . . . . . . . . means the company deriving from the spin-off of TIM’sdomestic mobile assets, effective as from March 1,2005. After the merger of TIM with and into TelecomItalia, Tim Italia became a wholly-owned subsidiary ofTelecom Italia. Subsequently Tim Italia merged withand into Telecom Italia, with Telecom Italia as thesurviving company, effective as from March 1, 2006.
3

Item 1. Identity of Directors, Senior Management and AdvisersItem 2. Offer Statistics and Expected Timetable
Item 3. Key Information
Risk Factors
PART I
Item 1. IDENTITY OF DIRECTORS, SENIOR MANAGEMENT AND ADVISERS
Not Applicable
Item 2. OFFER STATISTICS AND EXPECTED TIMETABLE
Not Applicable
Item 3. KEY INFORMATION
3.1 RISK FACTORS
RISKS RELATED TO TELECOM ITALIA
Our business will be adversely affected if we are unable to successfully implement our organizationalrestructuring and strategic objectives. Factors beyond our control may prevent us from successfullyimplementing our strategy.
In 2006, the Group continued its organizational restructuring aimed at capturing opportunities and benefitsoffered by the convergence process in the telecommunications (fixed and mobile) sector and in adjacent markets(Pay-TV and IT services). The original organizational restructuring resulted in the implementation of a newworking model based on:
Š business functions dedicated to the development of specific market/segment targets (domestic andinternational fixed/broadband, domestic and international mobile, Top clients and ICT);
Š across-the-board monitoring to improve cost efficiency, process effectiveness and service quality(Technology for the development and operation of infrastructures and service platforms, Field Servicesfor the development and improvement of customer assistance); and
Š rationalization of Group Functions providing guidance and control.
The new model is intended to provide a more flexible operating structure to address the technological changesand national and international competition which is facilitating the convergence between fixed telephony, mobile,broadband internet and media content.
On March 9, 2007, we presented to the investor community our strategic targets for the period 2007-2009; theGroup’s strategy is to:
Š defend the Group’s leadership position in its Italian domestic fixed-line and mobile markets, leveragingthe increasing penetration of broadband, fixed-line/mobile convergence, transparent and flexiblecustomer offerings, ongoing innovation and development of value added services;
Š expand into adjacent market sectors, mainly through the rollout of content offerings on innovativeplatforms (IPTV and Mobile TV), while broadening and strengthening ICT offerings to businesscustomers;
Š increase focus on the customer, through higher investment in Customer Care and quality of service;
Š continue broadband network development and launch of the Next Generation Network 2 project,building an ultra-broadband network in line with market demand, and consistent with the evolution ofthe regulatory framework; and
Š develop the Group’s international footprint, maintaining its presence in South America (mobiletelephony in Brazil, and the project aimed at acquiring control of Telecom Argentina in 2009) whileconsolidating European projects in Germany, France and The Netherlands.
Our ability to achieve the strategic goals of our most recent reorganization and our targets may be influenced byseveral factors, including without limitation:
Š declining prices for some of our services, increasing competition and regulatory developments whichcreate pressure on margins and enhance competition;
4

Item 3. Key Information Risk Factors
Š our ability to manage costs;
Š our ability to attract and retain highly-skilled and qualified personnel;
Š the entry of new competitors in the liberalized Italian telecommunications market and the otherprincipal markets in which we operate, which may result in our losing market share in Italy andinternationally;
Š our ability to strengthen our competitive position through our focus on new adjacent markets (Pay-TVand IT services) and international markets (Mobile in Brazil and broadband in Europe) based on ourspecialized skills and technical resources;
Š our ability to successfully develop and introduce new technologies to meet market requirements, tomanage innovation, to provide value-added services and to increase the usage of our fixed and mobilenetworks;
Š our ability to achieve the synergies anticipated from the convergence of fixed communications, mobilecommunications and Internet;
Š the effect of adverse economic trends on our principal markets;
Š the success of new “disruptive” technologies that could cannibalize fixed and mobile revenues; and
Š the effect of foreign exchange fluctuations on our results of operations.
There can be no assurance that our objectives will be effectively implemented in the planned time-frames.
As a result of the Merger, the cash tender offer for TIM shares and the merger of TIM into TelecomItalia, in 2004 and 2005, we remain highly leveraged.
Our gross financial debt was €46,456 million at December 31, 2006 compared with €52,101 million atDecember 31, 2005, and our total net financial debt was €37,301 million as of December 31, 2006 compared with€39,858 million at December 31, 2005. See “Item 5. Operating and Financial Review and Prospects—5.5 Resultsof Operations for the Three Years Ended December 31, 2006—5.5.2. Non-GAAP Financial Measures”, whichreconciles our net financial debt to the gross financial debt.
Our goal is to reduce our net financial debt during 2007 through cash flow generation and the disposal ofnon-strategic equity holdings and assets. Factors beyond our control, including but not limited to, deterioration ingeneral economic conditions, could significantly affect our ability to generate cash to reduce debt or to refinanceexisting debt through further borrowing. In addition, our goal to reduce debt may diminish our ability to facecompetitive threats, take advantage of attractive acquisition opportunities or pursue a strategy requiringsubstantial cash consumption.
Due to the competitive environment and the economic conditions in which the Telecom Italia Group operates,there could be deterioration in the statement of income and balance sheet ratios. These same ratios are used bythe rating agencies, such as Moody’s and Standard & Poor’s, in rating the Group’s ability to repay its debt.
See “Item 5. Operating and Financial Review and Prospects—5.6. Liquidity and Capital Resources—5.6.2 CapitalResources”.
Although ratings downgrades do not have an immediate impact on outstanding debt, except for outstanding debtinstruments that specifically contemplate ratings in order to determine payouts, or on its relative cost to us,downgrades could lead to a greater risk with respect to refinancing existing debt or higher refinancing costs.
The management and further development of our business require us to make further significant investments. Wemay therefore incur additional debt in order to finance such investment. Our future results of operations may beinfluenced by our ability to enter into such transactions, which in turn will be determined by market conditionsand factors that are outside our control. In addition, if such transactions increased our leverage it could adverselyaffect our credit ratings.
5

Item 3. Key Information Risk Factors
We may not achieve the expected return on our significant investments and capital expenditures madein our international activities due to the competitive environments in these markets.
Telecom Italia intends to continue to build its international presence in the strategic broadband and mobile areas,maintaining the geographic focus in Europe and South America (Brazil and Argentina). Pursuant to our 2007-2009plan we will continue to target our international investments in South America, particularly mobiletelecommunications in Brazil and our existing investment in Telecom Argentina and European broadband, such asFrance, Germany and The Netherlands. These investments will continue to require significant capital expendituresand there can be no assurance that we will be able to achieve a satisfactory return on such internationalinvestments. In addition, our existing investments pose certain risks, such as:
Š in Germany, the main risk is represented by the integration process with America Online, which wasacquired in February, 2007;
Š in France, the efforts are directed to the turnaround of operations with a strong focus on the businessbecoming profitable;
Š in Brazil, is confirmed potential for growth in that market where Tim Brasil is pushing to further narrowthe gap with the leading operator;
Š in Argentina, in the medium term, it is expected that control of Telecom Argentina will be acquiredthrough the exercise of call options.
Telecom Italia could fail to obtain an adequate return on its foreign investments owing, among other things, togrowing competition and technological discontinuity in countries in which the Group has an international businesspresence.
System failures could result in reduced user traffic and reduced revenue and could harm TelecomItalia’s reputation.
Our technical infrastructure (including our network infrastructure for fixed-line and mobile telecommunicationservices) is vulnerable to damage or interruption from information and telecommunication technology failures,power loss, floods, windstorms, fires, terrorism, intentional wrongdoing, human error and similar events.Unanticipated problems at our facilities, system failures, hardware or software failures, computer viruses orhacker attacks could affect the quality of our services and cause service interruptions. Any of these occurrencescould result in reduced user traffic and reduced revenue and could harm our reputation.
Our business depends on the upgrading of our existing networks.
We must continue to upgrade our existing wireless and fixed-line networks in a timely and satisfactory manner inorder to retain and expand our customer base in each of our markets, to enhance our financial performance andto satisfy regulatory requirements. Among other things, we could be required to:
Š upgrade the functionality of our networks to permit increased customization of services;
Š increase coverage in some of our markets;
Š expand and maintain customer service, network management and administrative systems; and
Š upgrade older systems and networks to adapt them to new technologies.
Many of these tasks are not entirely under our control and may be affected by applicable regulation. If we fail toexecute them successfully, our services and products may be less attractive to new customers and we may loseexisting customers to our competitors, which would adversely affect our business, financial condition and resultsof operations.
We are continuously involved in disputes and litigation with regulators, competitors and other parties.The ultimate outcome of such legal proceedings is generally uncertain. When finally concluded, theymay have a material adverse effect on our results of operations and financial condition.
We are subject to numerous risks relating to legal and regulatory proceedings, in which we are currently a partyor which could develop in the future. Litigation and regulatory proceedings are inherently unpredictable. Legal or
6
Item 3. Key Information Risk Factors
regulatory proceedings in which we are or come to be involved (or settlements thereof) may have a materialadverse effect on our results of operations or financial condition.
Furthermore, our involvement in litigation and regulatory proceedings may adversely affect our reputation.
For information concerning some of the litigation in which we are involved, see “Item 8. Financial Information—8.2. Legal Proceedings”. For information concerning our regulatory framework, see “Item 4. Information on theTelecom Italia Group—4.3. Regulation.”
Risks associated with Telecom Italia’s ownership chain.
Telecom Italia elected a new Board of Directors on April 16, 2007. The appointment of the new Board of Directorswill expire upon the approval of the financial statements for the year 2007 when a new Board of Directors will beelected. Because of the so-called “voto di lista” system or “slate voting system” for the election of directors,Olimpia S.p.A., (“Olimpia”), our largest shareholder put forward a slate of directors from which 15 out of 19 ofTelecom Italia’s directors (of whom 9 are considered independent) were elected. Please see “Item 4. Informationon the Telecom Italia Group—4.1. Business—4.1.1. Background”. Since the shareholder meeting of April 16,2007, the shareholders in Olimpia have agreed to sell their stake in Olimpia to a new vehicle, Telco S.p.A., asdescribed below. Telco S.p.A., on completion of the acquisition of Olimpia will hold approximately 23.6% of ouroutstanding Ordinary Shares.
Although Olimpia does not and will not own a controlling interest in Telecom Italia voting shares, Olimpia mayexert a significant influence on all matters to be decided by a vote of shareholders. In addition, as a result of itsproposal of a majority of the present Telecom Italia Board members, Olimpia may be able to influence certaincorporate actions. In principle, the interests of Olimpia in deciding shareholder matters could be different fromthe interests of Telecom Italia’s other Ordinary Shareholders, and it is possible that certain decisions could betaken that may be influenced by the needs of Olimpia.
Olimpia is in effect a holding company and the sole operating company in which it holds shares is Telecom Italia.Therefore, if Olimpia were unable to obtain additional funding from new or existing shareholders or from othersources, Olimpia would be entirely dependent on dividends paid on its Telecom Italia shares for its funding needs,including to reimburse its existing debt. Under such circumstances, among the Telecom Italia corporate decisionsthat could be influenced by the needs of Olimpia, would be the level of dividends payable by Telecom Italia to itsshareholders.
Telecom Italia’s financial position is not directly related to Olimpia and—as such—Telecom Italia does not haveany obligations with respect to such debt since they are separate legal entities. Notwithstanding the foregoing,since certain rating agencies might view Telecom Italia’s financial position as linked in some way to that ofOlimpia, such a view could affect our debt ratings, which may adversely affect Telecom Italia’s financial flexibilityand its cost of capital. Please see “Item 7. Major Shareholders and Related-Party Transactions—7.1 MajorShareholders.
Olimpia’s shareholding structure is presently undergoing some major changes, which should result in TelecomItalia’s ownership chain being transformed. Please see “Item 4. Information on the Telecom Italia Group—4.1Business—4.1.1 Background”. More specifically, a group of Italian investors made up of Assicurazioni GeneraliS.p.A., Intesa Sanpaolo S.p.A., Mediobanca S.p.A. and Sintonia S.A., together with Telefónica S.A., the Spainbased international telecoms operator, entered into an agreement aimed at the acquisition of the entire sharecapital of Olimpia through a company vehicle named Telco S.p.A. The acquisition is subject to approval by thecompetent authorities. Presently Telefónica and Telecom Italia are direct competitors in certain areas out of theirrespective domestic markets; nevertheless, the agreement among the above mentioned parties provides that theTelecom Italia and Telefónica groups will be managed autonomously and independently. For further informationon this topic, please see “Item 10. Additional Information—10.1 Corporate Governance—10.1.2 General—Impact of Shareholders’ Agreements on the Nomination of Telecom Italia Group’s Companies Boards”. If, at thetime of the appointment of a new Board of Directors of Telecom Italia, Telco S.p.A. will be Telecom Italia’s largestshareholder, Telco S.p.A., through the slate voting system, will be able to put forward a slate of directors fromwhich the majority of the members of the Board of Directors is likely to be elected. In addition, the discussion inthe preceding three paragraphs will also apply to Telco S.p.A. if they successfully complete the acquisition ofOlimpia.
7

Item 3. Key Information Risk Factors
The Italian State, through the Treasury, is in a position to exert certain powers with respect toTelecom Italia.
Although no shareholder is in a position to prevent a takeover of Telecom Italia, the Italian State, through theTreasury, is in a position to exert certain powers with respect to Telecom Italia through the exercise of the specialpowers included in Telecom Italia’s Bylaws pursuant to compulsory legal provisions: specifically the so-called“Golden Share” still provides for the Italian State’s authority to oppose the acquisition of material interests in ourshare capital (which is defined as 3% of the voting share capital). Currently, the exercise of special powers by theItalian State with respect to privatized companies (including Telecom Italia) is governed by specific rules, but it ispossible that the Italian State’s Golden Share could make a merger with or takeover of Telecom Italia moredifficult or discourage certain bidders from making an offer. Please see “Item 7. Major Shareholders and Related-Party Transactions—7.1 Major Shareholders—7.1.3 Continuing Relationship with the Italian Treasury” for moreinformation.
RISKS RELATED TO THE TELECOMMUNICATIONS INDUSTRY AND FINANCIAL MARKETS
The value of our operations and investments may be adversely affected by political and economicdevelopments in Italy or other countries.
Our business is dependent to a large degree on general economic conditions in Italy, including levels of interestrates, inflation and taxes. A significant deterioration in these conditions could adversely affect our business andresults of operations. We may also be adversely affected by political and economic developments in othercountries where we have made significant investments. Certain of these countries have political, economic andlegal systems that are unpredictable. Political or economic upheaval or changes in laws or their application inthese countries may harm the operations of the companies in which we have invested and impair the value ofthese investments.
Because we operate in heavily regulated business environments, regulatory decisions and changes inthe regulatory environment could materially adversely affect our business.
Our fixed and mobile telecommunications operations, as well as our broadband services businesses, are subject toextensive regulatory requirements in Italy and our international operations and investments are subject toregulation in their host countries.
As a member of the EU, Italy has adapted its telecommunications regulatory framework to the legislative andregulatory framework established by the EU for the regulation of the European telecommunications market. TheEU Commission approved a new electronic communications framework in March 2002, which has been effective inItaly since September 2003. See “Item 4. Information on the Telecom Italia Group—4.3. Regulation”.
Included within this new framework is the obligation on the part of the Italian regulator responsible for theregulation of the telecommunications, radio and television broadcasting sector (the “National RegulatoryAuthority” or “NRA”) to identify operators with “significant market power” based on a market analysis ineighteen separate retail and wholesale markets in which it is considered necessary to intervene to protect freecompetition. The framework established criteria and procedures for identifying remedies applicable to operatorswith “significant market power”. During 2006, the NRA concluded all of its preliminary inquiries regarding theanalysis of the markets and introduced measures as a result of this analysis. For further details please see “Item4. Information on the Telecom Italia Group—4.3. Regulation”.
In Italy, we are subject to universal service obligations, which require us to provide fixed-line public voicetelecommunications services in non-profitable areas. We are the only operator in Italy which has this obligation.In addition, the NRA has identified us as an operator having significant market power in most relevant markets. Asa result, we are, and, if we continue to be identified as having significant market power in most relevant markets,will be, subject to a number of regulatory constraints, including:
Š a requirement to conduct our business in a transparent and non-discriminatory fashion;
Š a requirement to have our prices for fixed voice telephony services and Reference InterconnectionOffer, the tariff charged to other operators to utilize our network, subject respectively to a price cap anda network cap mechanism. This cap mechanism places certain limits on our ability to change our pricesfor certain services; and
8

Item 3. Key Information Risk Factors
Š a requirement to provide interconnection services, leased lines and access to the local loop to otheroperators at cost-orientated prices. These services include allowing other operators to connect to ournetwork and transport traffic through the network as well as offering certain services related to ourlocal access network, or local loop, on an unbundled basis to these other operators to enable theseoperators to directly access customers connected to the network by leasing the necessary componentsfrom us.
These constraints have had an adverse impact on our fixed line network pricing and service offerings and futureregulatory decisions are expected to continue to have an adverse impact on our market shares and margins.
In addition, the NRA intends to address other markets that are currently not subject to regulation (for examplevirtual private networks and VoIP). VoIP is an emerging market for nomadic voice telephony services that arebased on the Internet and are not dependent on specific customer telephone lines. Nevertheless, the NRA hasincluded VoIP in the same market as conventional voice telephony services. Therefore these markets may betreated in the same way as the market for conventional telephone services for the purpose of regulation and mayalso be subject to price regulation.
We are unable to predict the impact of any proposed or potential changes in the regulatory environment in whichwe operate both in Italy and internationally. Changes in laws, regulation or government policy could adverselyaffect our business and competitiveness. In particular, our ability to compete effectively in our existing or newmarkets could be adversely affected if regulators decide to expand the restrictions and obligations to which weare subject or extend them to new services and markets. Finally, decisions by regulators regarding the granting,amendment or renewal of licences, to us or to third parties, could adversely affect our future operations in Italyand in other countries where we operate.
Changes in the rules relating to radio and television broadcasting could adversely affect the development of ouractivities in this field.
Please see “Item 4. Information on the Telecom Italia Group—4.3. Regulation” in this report for moreinformation on the regulatory requirements to which we are subject.
Strong competition in Italy may further reduce our core market share for telecommunication servicesand may cause further reductions in prices and margins thereby having an adverse effect on ourresults of operations.
Strong competition exists in all of the principal telecommunications business areas in Italy in which we operate,including, most significantly, the fixed-line and mobile voice telecommunications businesses. The use of the singleEuropean currency and the liberalizations of the Italian telecommunication market (since January 1998) haveintensified competition by facilitating international operators’ entry into the Italian market and direct competitionwith our fixed-line and mobile telephony businesses, particularly in the local and long-distance markets.
Competition continued to intensify during 2006. As of December 31, 2006, there were a number of significantcompetitors offering fixed-line services and three other operators (in addition to Telecom Italia) offering mobileservices in the Italian domestic market. This competition may further increase due to the consolidation andglobalizations of the telecommunications industry in Europe, including Italy, and elsewhere.
We anticipate that in the short to medium-term there may be a stronger entry of peer-level internationalcompetitors into markets with existing operators, including Italy, increasing the direct competition we face in ourItalian domestic fixed-line and mobile telephony businesses and in the local and long-distance markets.
Competition in our principal lines of business could lead to:
Š further price and margin erosion for our products and services;
Š a loss of market share in core markets;
Š loss of existing or prospective customers and greater difficulty in retaining existing customers;
Š obsolescence of existing technologies and more rapid deployment of new technologies;
9

Item 3. Key Information Risk Factors
Š an increase in costs related to investments in new technologies that are necessary to retain customersand market share; and
Š difficulties reducing debt and strategic and technological investments if we cannot generate sufficientprofits and cash flow.
Although we have taken a number of steps to realize additional efficiencies and introduce innovative and valueadded services over our networks, and although our plans take into account that we face significant competitionfrom a number of operators in all the markets in which we operate, if any or all of the events described in thepreceding paragraph should occur, the impact of such factors could materially adversely affect our results ofoperations.
Our business may be adversely affected and we may be unable to increase our revenues if we areunable to continue the introduction of new services to stimulate increased usage of our fixed andwireless networks.
In order to sustain growth in revenues despite increased competition and lower prices, particularly in our coreItalian domestic market, our strategy has been to introduce new services in our fixed-line and wireless businessesto increase traffic on our networks and find alternative revenue sources, in addition to carrying voice traffic on ournetworks. In the past three years the Group’s strategy to increase revenues has been to focus on penetration ofthe broadband retail market with various broadband offers as well as to increase value added services in themobile businesses. These markets have been growing the past three years in line with increased use of theInternet and the enhanced services offered by mobile operators. However, if these markets do not continue toexpand, our revenues may not grow, or even decrease, as revenues from other parts of our business, particularlyour traditional fixed-line business, decline due to competition or other price pressures.
In addition, these strategic initiatives have required, and will continue to require, substantial expenditures andcommitment of human resources. Although these initiatives are core to our strategy, we may be unable tointroduce commercially these new products and services, and even if we introduce them, there can be noassurance they will be successful.
Continuing rapid changes in technologies could increase competition, reduce usage of traditionalservices or require us to make substantial additional investments.
Many of the services we offer are technology-intensive and the development or acceptance of new technologiesmay render such services non-competitive, replace such services or reduce prices for such services. In addition,as convergence of services accelerate, we make and will have to make substantial additional investments in newtechnologies to remain competitive. The new technologies we choose may not prove to be commerciallysuccessful. In addition, we may not receive the necessary licenses to provide services based on new technologiesin Italy or abroad. Furthermore, our most significant competitors in the future may be new entrants to ourmarkets who do not have to maintain an installed base of older equipment.
As a result, we could lose customers, fail to attract new customers or incur substantial costs in order to maintainour customer base or to maintain revenues from such customer base.
The mobile communications markets have matured in recent years and competition has increased.
In recent years, our consolidated revenues have grown modestly in large part because of the rapid growth in themobile communications business which has offset substantially flat revenues in our Italian fixed-line business.However, as a result of this growth, the mobile communications markets are approaching maturity levels in thevoice services segment while the data and value-added services segments are growing.
We acquired a third generation mobile telephone, or UMTS, license to provide UMTS services in Italy for€2,417 million and have made significant investments, in accordance with the terms and conditions of ourlicenses, to create the infrastructure to offer UMTS services. We commenced offering UMTS services in Italy inthe second half of 2004 and have made in 2005 and 2006, and will have to continue to make in the future,significant investments in promotional activities relating to our UMTS services. Given the substantial costs of
10

Item 3. Key Information Risk Factors
upgrading our existing networks to support UMTS, the ongoing costs to market and support these new services,and the significant competition among operators who offer these new services, including one operator onlyoffering 3G services, we may not be able to recoup our investments, as planned if at all.
Continued growth in the mobile telecommunications markets in which we operate will depend on a number offactors, many of which are outside our control. These factors include:
Š the activities of our competitors;
Š competitive pressures and regulations applicable to retail and wholesale prices;
Š the development and introduction of new and alternative technologies for mobile telecommunicationsproducts and services and their attractiveness to customers;
Š the success of new disruptive or substitutive technologies; and
Š the development of the mobile communications markets.
In addition, as our core domestic Italian market has become increasingly saturated, the focus of competition hasshifted to customer retention from customer acquisition, and increasing the value of existing customers. Suchfocus could result in increased expenses to retain customer loyalty or if we are unable to satisfactorily offer bettervalue to our customers our market share and revenues could decline.
If the mobile telecommunications markets in which we operate do not continue to expand, or we are unable toretain our existing customers or stimulate increases in customer usage, our financial condition and results ofoperations may be harmed.
We may be adversely affected if we fail to successfully implement our Internet and broadband strategyin Italy and internationally.
The introduction of Internet and broadband services is an important element of our growth strategy and means toincrease the use of our networks in Italy and expand our operations outside of Italy, particularly in Europe. Ourstrategy is to replace the mature, traditional voice services with value added content and services to consumersand small and medium-sized companies. Our ability to successfully implement this strategy may be affected if:
Š Internet usage in Italy grows more slowly than anticipated, for reasons such as changes in Internetusers’ preferences;
Š broadband penetration in Italy and other European countries does not grow as we expect;
Š competition increases, for reasons such as the entry of new competitors, consolidation in the industry ortechnological developments introducing new platforms for Internet access and/or Internet distribution orother operators can provide broadband connections superior to those that we can offer; and
Š we experience any network interruptions or related problems with network infrastructure.
Outside of Italy our ability to implement this strategy will depend on whether we are able to acquire assets ornetworks or utilize networks of incumbent operators that will allow us to offer such services. Any of the abovefactors may adversely affect the successful implementation of our strategy, our business and results ofoperations.
Actual or perceived health risks or other problems relating to mobile handsets or transmission mastscould lead to litigation or decreased mobile communications usage.
The effects of and any damage caused by exposure to an electromagnetic field were and are the subject of carefulevaluations by the international scientific community, but until now there is no scientific evidence of harmfuleffects on health. We cannot rule out that exposure to electromagnetic fields or other emissions originating fromwireless handsets will not be identified as a health risk in the future.
Our mobile communications business may be harmed as a result of these alleged health risks. For example, theperception of these health risks could result in a lower number of customers, reduced usage per customer or
11

Item 3. Key Information Risk Factors
potential consumer liability. In addition, although Italian law already requires strict limits in relation totransmission equipment, these concerns may cause regulators to impose greater restrictions on the constructionof base station towers or other infrastructure, which may hinder the completion of network build-outs and thecommercial availability of new services and may require additional investments.
Fluctuations in currency exchange and interest rates may adversely affect our results.
In the past, we have made substantial international investments, primarily in U.S. dollars, and have significantlyexpanded our operations outside of the Euro zone, particularly in Latin America.
We generally hedge our foreign exchange exposure, but do not cover translation risk relating to our foreignsubsidiaries. Movements in exchange rates of the Euro relative to other currencies (in particular Brazilian Real)may adversely affect consolidated results. A rise in the value of the Euro relative to other currencies in certaincountries in which we operate or have made investments will reduce the relative value of the revenues or assetsof our operations in those countries and, therefore, may adversely affect our operating results or financialposition.
In addition, we have raised, and may raise in an increasing proportion in the future, financing in currencies otherthan the Euro, principally the U.S. dollar and British Pound. We systematically hedge the foreign currency riskexposure relating to non-Euro denominated liabilities, through cross-currency and interest rate swaps.
Furthermore, we enter into derivative transactions to hedge our interest exposure and to diversify debtparameters in order to reduce debt cost and volatility within predefined target boundaries. However, no assurancecan be given that fluctuations in interest rates will not adversely affect our results of operations or cash flows.
12
Item 3. Key Information Exchange Rates
3.2 EXCHANGE RATES
We publish our consolidated financial statements in euros. References to “€”, “euro” and “Euro” are to the euro,the single unified currency that was introduced in Italy and 10 other member states of the EU on January 1, 1999.References to “U.S. dollars”, “dollars”, “U.S.$” or “$” are to U.S. dollars, the currency of the United States ofAmerica.
For convenience only (except where noted otherwise), certain euro figures have been translated into dollars at therate (the “Euro/Dollar Exchange Rate”) of €1.00= U.S.$ 1.3197, using the noon buying rate in The City of NewYork for cable transfers in foreign currencies as announced by the Federal Reserve Bank of New York for customspurposes (the “Noon Buying Rate”) on December 29, 2006.
These translations should not be construed as a representation that the euro amounts actually represent suchdollar amounts or have been or could be converted into dollars at the rate indicated.
For the purpose of this Annual Report, “billion” means a thousand million.
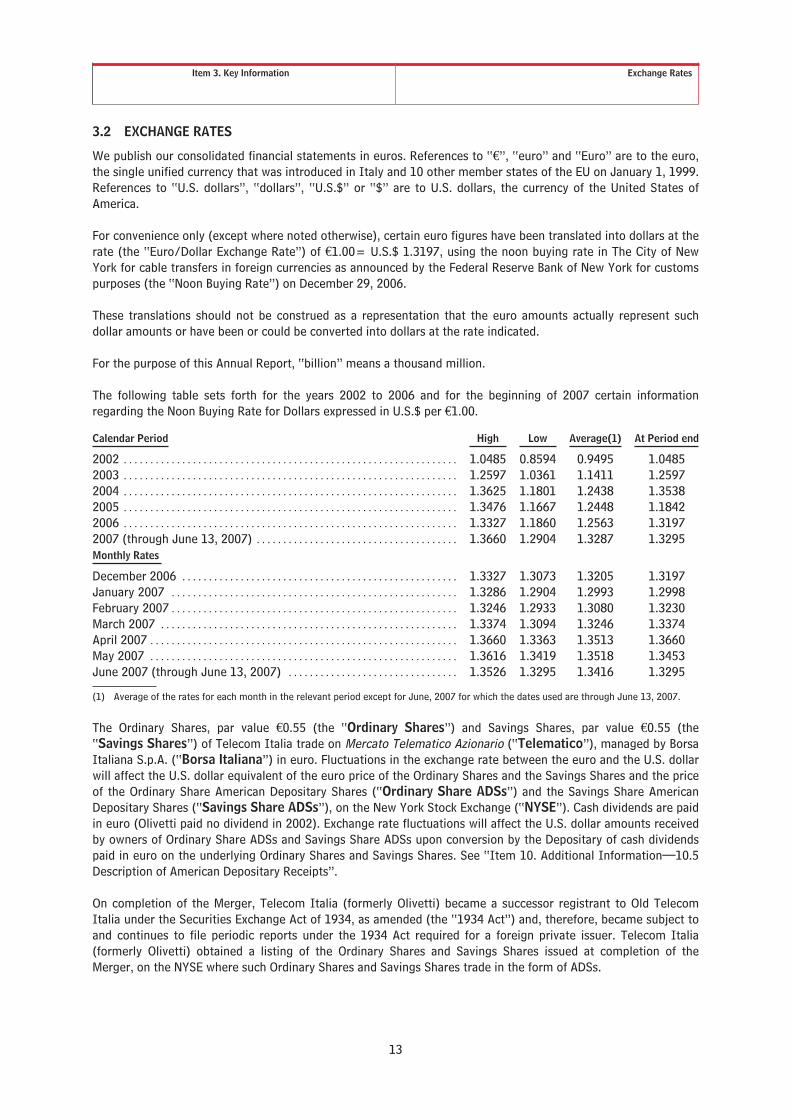
The following table sets forth for the years 2002 to 2006 and for the beginning of 2007 certain informationregarding the Noon Buying Rate for Dollars expressed in U.S.$ per €1.00.
Calendar Period High Low Average(1) At Period end
2002 . . . . . . . . . . . . . . . . . . . . . . . . . . . . . . . . . . . . . . . . . . . . . . . . . . . . . . . . . . . . . . . 1.0485 0.8594 0.9495 1.04852003 . . . . . . . . . . . . . . . . . . . . . . . . . . . . . . . . . . . . . . . . . . . . . . . . . . . . . . . . . . . . . . . 1.2597 1.0361 1.1411 1.25972004 . . . . . . . . . . . . . . . . . . . . . . . . . . . . . . . . . . . . . . . . . . . . . . . . . . . . . . . . . . . . . . . 1.3625 1.1801 1.2438 1.35382005 . . . . . . . . . . . . . . . . . . . . . . . . . . . . . . . . . . . . . . . . . . . . . . . . . . . . . . . . . . . . . . . 1.3476 1.1667 1.2448 1.18422006 . . . . . . . . . . . . . . . . . . . . . . . . . . . . . . . . . . . . . . . . . . . . . . . . . . . . . . . . . . . . . . . 1.3327 1.1860 1.2563 1.31972007 (through June 13, 2007) . . . . . . . . . . . . . . . . . . . . . . . . . . . . . . . . . . . . . . 1.3660 1.2904 1.3287 1.3295Monthly Rates
December 2006 . . . . . . . . . . . . . . . . . . . . . . . . . . . . . . . . . . . . . . . . . . . . . . . . . . . . 1.3327 1.3073 1.3205 1.3197January 2007 . . . . . . . . . . . . . . . . . . . . . . . . . . . . . . . . . . . . . . . . . . . . . . . . . . . . . . 1.3286 1.2904 1.2993 1.2998February 2007 . . . . . . . . . . . . . . . . . . . . . . . . . . . . . . . . . . . . . . . . . . . . . . . . . . . . . . 1.3246 1.2933 1.3080 1.3230March 2007 . . . . . . . . . . . . . . . . . . . . . . . . . . . . . . . . . . . . . . . . . . . . . . . . . . . . . . . . 1.3374 1.3094 1.3246 1.3374April 2007 . . . . . . . . . . . . . . . . . . . . . . . . . . . . . . . . . . . . . . . . . . . . . . . . . . . . . . . . . . 1.3660 1.3363 1.3513 1.3660May 2007 . . . . . . . . . . . . . . . . . . . . . . . . . . . . . . . . . . . . . . . . . . . . . . . . . . . . . . . . . . 1.3616 1.3419 1.3518 1.3453June 2007 (through June 13, 2007) . . . . . . . . . . . . . . . . . . . . . . . . . . . . . . . . 1.3526 1.3295 1.3416 1.3295
(1) Average of the rates for each month in the relevant period except for June, 2007 for which the dates used are through June 13, 2007.
The Ordinary Shares, par value €0.55 (the “Ordinary Shares”) and Savings Shares, par value €0.55 (the“Savings Shares”) of Telecom Italia trade on Mercato Telematico Azionario (“Telematico”), managed by BorsaItaliana S.p.A. (“Borsa Italiana”) in euro. Fluctuations in the exchange rate between the euro and the U.S. dollarwill affect the U.S. dollar equivalent of the euro price of the Ordinary Shares and the Savings Shares and the priceof the Ordinary Share American Depositary Shares (“Ordinary Share ADSs”) and the Savings Share AmericanDepositary Shares (“Savings Share ADSs”), on the New York Stock Exchange (“NYSE”). Cash dividends are paidin euro (Olivetti paid no dividend in 2002). Exchange rate fluctuations will affect the U.S. dollar amounts receivedby owners of Ordinary Share ADSs and Savings Share ADSs upon conversion by the Depositary of cash dividendspaid in euro on the underlying Ordinary Shares and Savings Shares. See “Item 10. Additional Information—10.5Description of American Depositary Receipts”.
On completion of the Merger, Telecom Italia (formerly Olivetti) became a successor registrant to Old TelecomItalia under the Securities Exchange Act of 1934, as amended (the “1934 Act”) and, therefore, became subject toand continues to file periodic reports under the 1934 Act required for a foreign private issuer. Telecom Italia(formerly Olivetti) obtained a listing of the Ordinary Shares and Savings Shares issued at completion of theMerger, on the NYSE where such Ordinary Shares and Savings Shares trade in the form of ADSs.
13

Item 3. Key Information Selected Financial And Statistical Information
3.3 SELECTED FINANCIAL AND STATISTICAL INFORMATION
The summary selected financial data set forth below are consolidated financial data of the Telecom Italia Group asof and for each of the years ended December 31, 2006, 2005 and 2004, which have been extracted or derivedfrom the Consolidated Financial Statements of the Telecom Italia Group prepared in accordance with IFRS andwhich have been audited by the independent auditor Reconta Ernst & Young S.p.A..
Unless otherwise indicated, amounts presented in this section are prepared in accordance with IFRS.
Until December 31, 2004, Telecom Italia prepared its consolidated financial statements and other interimfinancial information (including quarterly and semi-annual data) in accordance with Italian GAAP. Pursuant to SECRelease 33-8567, “First-Time Application of International Financial Reporting Standards”, Telecom Italia is onlyrequired to include Selected Financial Data extracted or derived from the Consolidated Financial Statements forthe years ended December 31, 2006, 2005 and 2004 (earlier periods are not required to be included).
For the purposes of the Consolidated Financial Statements included elsewhere in this Annual Report there are nodifferences between International Financial Reporting Standards issued by IASB and International FinancialReporting Standards adopted by the EU.
For a more complete description of the adoption of IFRS please see “Item 5. Operating and Financial Review andProspects—5.4 Adoption of International Financial Reporting Standards”.
The selected financial data below should be read in conjunction with the Consolidated Financial Statements andnotes thereto included elsewhere in this Annual Report.
14
Item 3. Key Information Selected Financial And Statistical Information
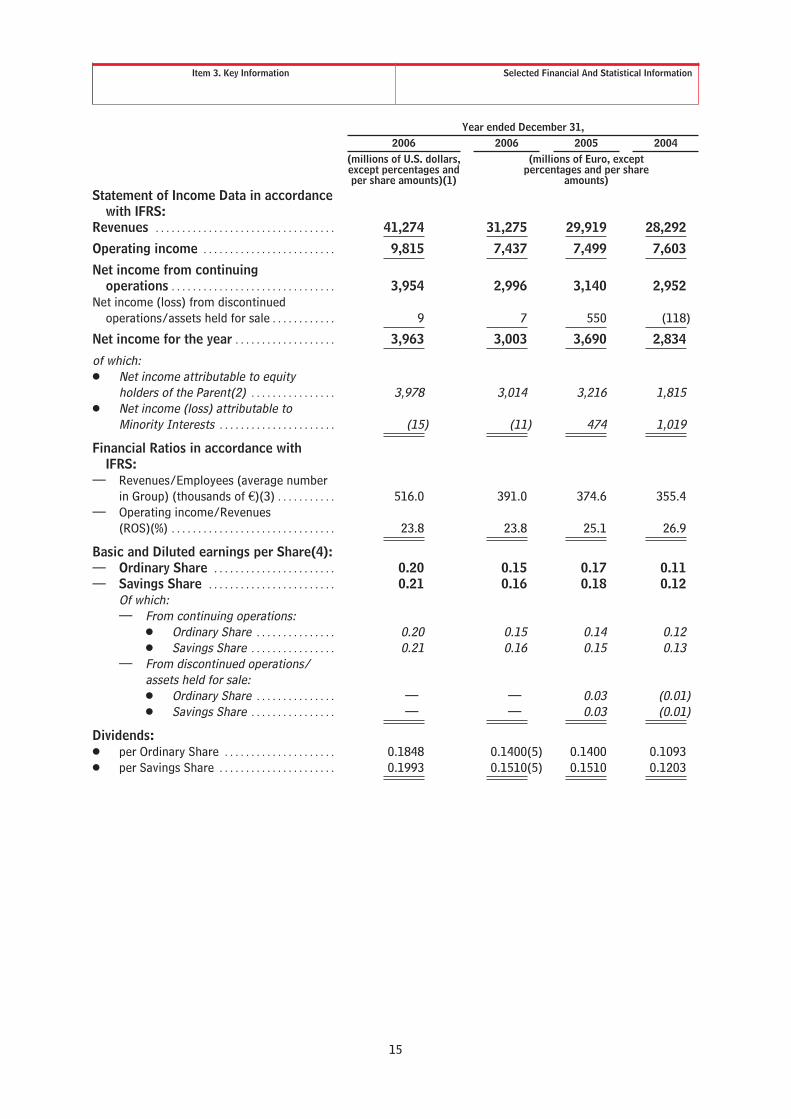
Year ended December 31,2006 2006 2005 2004
(millions of U.S. dollars,except percentages andper share amounts)(1)
(millions of Euro, exceptpercentages and per share
amounts)Statement of Income Data in accordance
with IFRS:Revenues . . . . . . . . . . . . . . . . . . . . . . . . . . . . . . . . . . 41,274 31,275 29,919 28,292
Operating income . . . . . . . . . . . . . . . . . . . . . . . . . 9,815 7,437 7,499 7,603
Net income from continuingoperations . . . . . . . . . . . . . . . . . . . . . . . . . . . . . . . 3,954 2,996 3,140 2,952
Net income (loss) from discontinuedoperations/assets held for sale . . . . . . . . . . . . 9 7 550 (118)
Net income for the year . . . . . . . . . . . . . . . . . . . 3,963 3,003 3,690 2,834
of which:Š Net income attributable to equity
holders of the Parent(2) . . . . . . . . . . . . . . . . 3,978 3,014 3,216 1,815Š Net income (loss) attributable to
Minority Interests . . . . . . . . . . . . . . . . . . . . . . (15) (11) 474 1,019
Financial Ratios in accordance withIFRS:
— Revenues/Employees (average numberin Group) (thousands of €)(3) . . . . . . . . . . . 516.0 391.0 374.6 355.4
— Operating income/Revenues(ROS)(%) . . . . . . . . . . . . . . . . . . . . . . . . . . . . . . . 23.8 23.8 25.1 26.9
Basic and Diluted earnings per Share(4):— Ordinary Share . . . . . . . . . . . . . . . . . . . . . . . 0.20 0.15 0.17 0.11— Savings Share . . . . . . . . . . . . . . . . . . . . . . . . 0.21 0.16 0.18 0.12
Of which:— From continuing operations:
Š Ordinary Share . . . . . . . . . . . . . . . 0.20 0.15 0.14 0.12Š Savings Share . . . . . . . . . . . . . . . . 0.21 0.16 0.15 0.13
— From discontinued operations/assets held for sale:Š Ordinary Share . . . . . . . . . . . . . . . — — 0.03 (0.01)Š Savings Share . . . . . . . . . . . . . . . . — — 0.03 (0.01)
Dividends:Š per Ordinary Share . . . . . . . . . . . . . . . . . . . . . 0.1848 0.1400(5) 0.1400 0.1093Š per Savings Share . . . . . . . . . . . . . . . . . . . . . . 0.1993 0.1510(5) 0.1510 0.1203
15

Item 3. Key Information Selected Financial And Statistical Information
As of December 31,2006 2006 2005 2004
(millions of U.S. dollars,except percentages and
employees)(1)
(millions of Euro,except percentages
and employees)Balance Sheet Data in accordance with IFRSTotal Assets . . . . . . . . . . . . . . . . . . . . . . . . . . . . . . . . . . . . . . . . . . . . . . 118,056 89,457 96,010 81,834
Equity:Equity attributable to equity holders of the Parent . . . . . 34,336 26,018 25,662 16,248Equity attributable to Minority Interests . . . . . . . . . . . . . . . 1,425 1,080 1,323 4,550
Total Equity . . . . . . . . . . . . . . . . . . . . . . . . . . . . . . . . . . . . . . . . . . . . . . 35,761 27,098 26,985 20,798
Total liabilities . . . . . . . . . . . . . . . . . . . . . . . . . . . . . . . . . . . . . . . . . . . 82,295 62,359 69,025 61,036
Total equity and liabilities . . . . . . . . . . . . . . . . . . . . . . . . . . . . . . . 118,056 89,457 96,010 81,834
Share capital(6) . . . . . . . . . . . . . . . . . . . . . . . . . . . . . . . . . . . . . . . . . . 13,995 10,605 10,599 8,809
Financial Ratios in accordance with IFRS:Š Net financial debt/Net invested capital (debt
ratio)(%)(7) . . . . . . . . . . . . . . . . . . . . . . . . . . . . . . . . . . . . . . . . . . . 57.9 57.9 59.6 61.2Š Employees (number in Group at year-end, excluding
employees relating to the consolidated companiesconsidered as discontinued operations/assets held forsale and including personnel with temp workcontracts) . . . . . . . . . . . . . . . . . . . . . . . . . . . . . . . . . . . . . . . . . . . . 83,209 83,209 85,484 82,620
16
Item 3. Key Information Selected Financial And Statistical Information
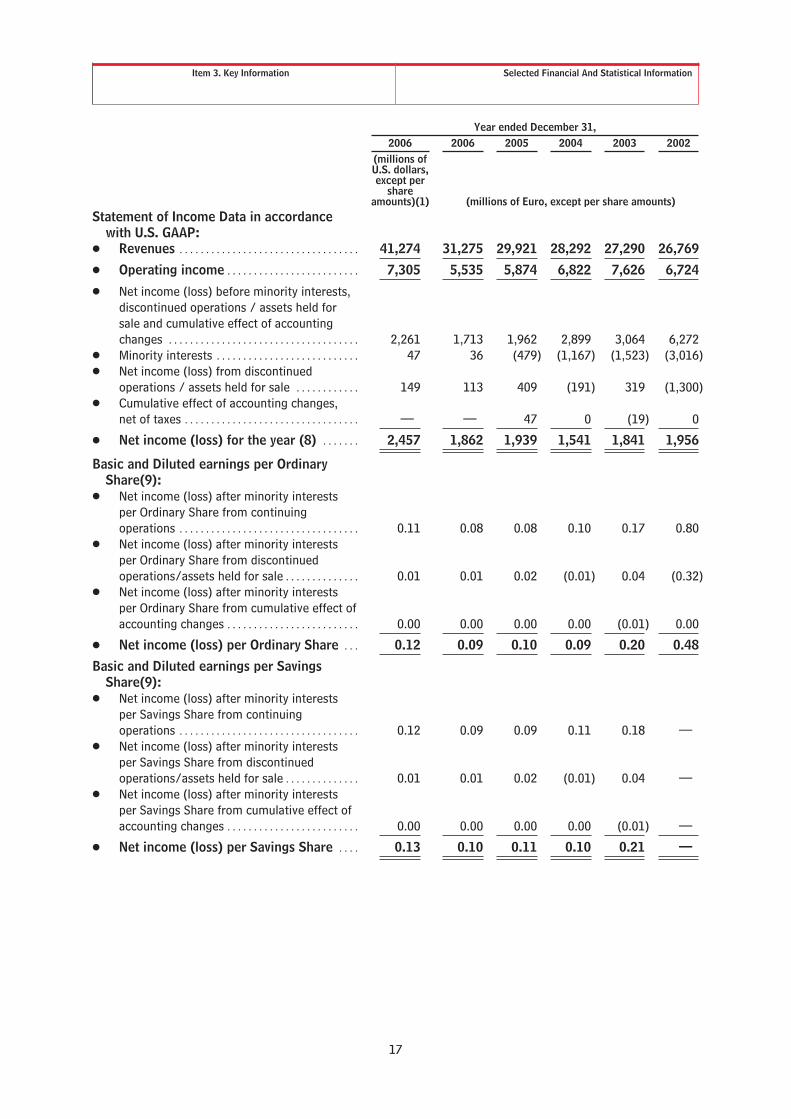
Year ended December 31,2006 2006 2005 2004 2003 2002
(millions ofU.S. dollars,except per
shareamounts)(1) (millions of Euro, except per share amounts)
Statement of Income Data in accordancewith U.S. GAAP:
Š Revenues . . . . . . . . . . . . . . . . . . . . . . . . . . . . . . . . . . 41,274 31,275 29,921 28,292 27,290 26,769
Š Operating income . . . . . . . . . . . . . . . . . . . . . . . . . 7,305 5,535 5,874 6,822 7,626 6,724
Š Net income (loss) before minority interests,discontinued operations / assets held forsale and cumulative effect of accountingchanges . . . . . . . . . . . . . . . . . . . . . . . . . . . . . . . . . . . . 2,261 1,713 1,962 2,899 3,064 6,272
Š Minority interests . . . . . . . . . . . . . . . . . . . . . . . . . . . 47 36 (479) (1,167) (1,523) (3,016)Š Net income (loss) from discontinued
operations / assets held for sale . . . . . . . . . . . . 149 113 409 (191) 319 (1,300)Š Cumulative effect of accounting changes,
net of taxes . . . . . . . . . . . . . . . . . . . . . . . . . . . . . . . . . — — 47 0 (19) 0
Š Net income (loss) for the year (8) . . . . . . . 2,457 1,862 1,939 1,541 1,841 1,956
Basic and Diluted earnings per OrdinaryShare(9):
Š Net income (loss) after minority interestsper Ordinary Share from continuingoperations . . . . . . . . . . . . . . . . . . . . . . . . . . . . . . . . . . 0.11 0.08 0.08 0.10 0.17 0.80
Š Net income (loss) after minority interestsper Ordinary Share from discontinuedoperations/assets held for sale . . . . . . . . . . . . . . 0.01 0.01 0.02 (0.01) 0.04 (0.32)
Š Net income (loss) after minority interestsper Ordinary Share from cumulative effect ofaccounting changes . . . . . . . . . . . . . . . . . . . . . . . . . 0.00 0.00 0.00 0.00 (0.01) 0.00
Š Net income (loss) per Ordinary Share . . . 0.12 0.09 0.10 0.09 0.20 0.48
Basic and Diluted earnings per SavingsShare(9):
Š Net income (loss) after minority interestsper Savings Share from continuingoperations . . . . . . . . . . . . . . . . . . . . . . . . . . . . . . . . . . 0.12 0.09 0.09 0.11 0.18 —
Š Net income (loss) after minority interestsper Savings Share from discontinuedoperations/assets held for sale . . . . . . . . . . . . . . 0.01 0.01 0.02 (0.01) 0.04 —
Š Net income (loss) after minority interestsper Savings Share from cumulative effect ofaccounting changes . . . . . . . . . . . . . . . . . . . . . . . . . 0.00 0.00 0.00 0.00 (0.01) —
Š Net income (loss) per Savings Share . . . . 0.13 0.10 0.11 0.10 0.21 —
17
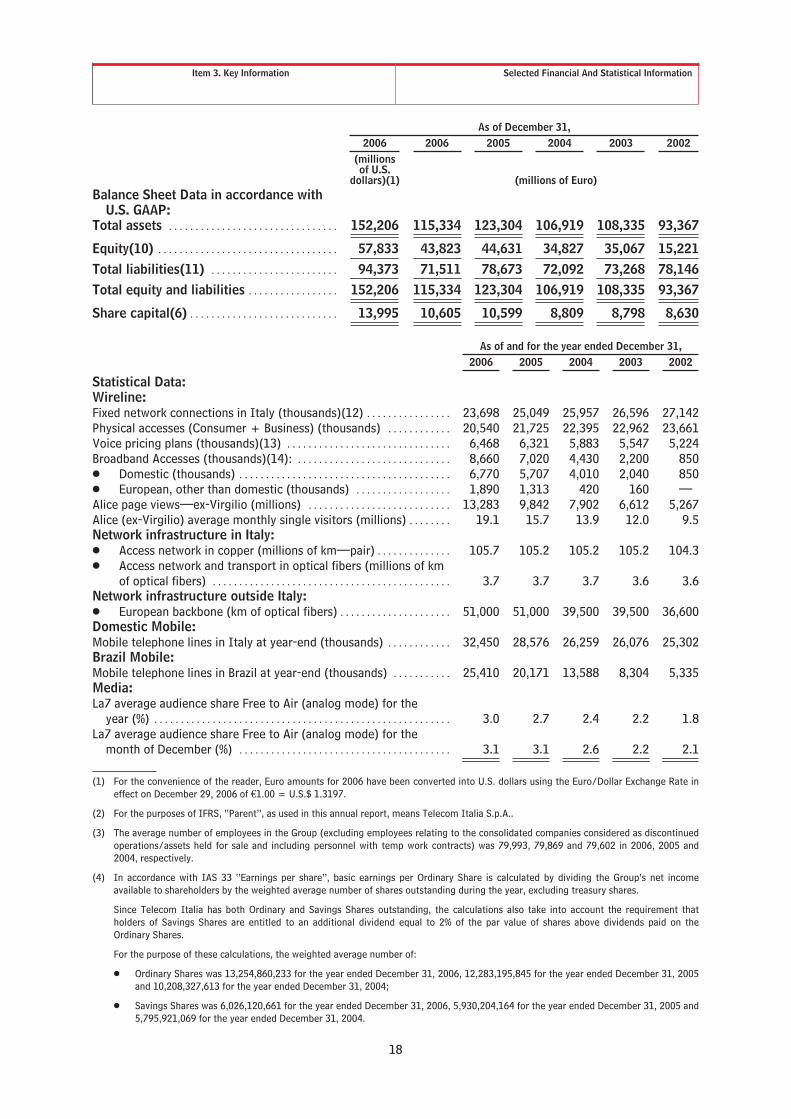
Item 3. Key Information Selected Financial And Statistical Information
As of December 31,2006 2006 2005 2004 2003 2002
(millionsof U.S.
dollars)(1) (millions of Euro)Balance Sheet Data in accordance with
U.S. GAAP:Total assets . . . . . . . . . . . . . . . . . . . . . . . . . . . . . . . . 152,206 115,334 123,304 106,919 108,335 93,367
Equity(10) . . . . . . . . . . . . . . . . . . . . . . . . . . . . . . . . . . 57,833 43,823 44,631 34,827 35,067 15,221Total liabilities(11) . . . . . . . . . . . . . . . . . . . . . . . . 94,373 71,511 78,673 72,092 73,268 78,146Total equity and liabilities . . . . . . . . . . . . . . . . . 152,206 115,334 123,304 106,919 108,335 93,367
Share capital(6) . . . . . . . . . . . . . . . . . . . . . . . . . . . . 13,995 10,605 10,599 8,809 8,798 8,630
As of and for the year ended December 31,2006 2005 2004 2003 2002
Statistical Data:Wireline:Fixed network connections in Italy (thousands)(12) . . . . . . . . . . . . . . . . 23,698 25,049 25,957 26,596 27,142Physical accesses (Consumer + Business) (thousands) . . . . . . . . . . . . 20,540 21,725 22,395 22,962 23,661Voice pricing plans (thousands)(13) . . . . . . . . . . . . . . . . . . . . . . . . . . . . . . . 6,468 6,321 5,883 5,547 5,224Broadband Accesses (thousands)(14): . . . . . . . . . . . . . . . . . . . . . . . . . . . . . 8,660 7,020 4,430 2,200 850Š Domestic (thousands) . . . . . . . . . . . . . . . . . . . . . . . . . . . . . . . . . . . . . . . . 6,770 5,707 4,010 2,040 850Š European, other than domestic (thousands) . . . . . . . . . . . . . . . . . . 1,890 1,313 420 160 —Alice page views—ex-Virgilio (millions) . . . . . . . . . . . . . . . . . . . . . . . . . . . 13,283 9,842 7,902 6,612 5,267Alice (ex-Virgilio) average monthly single visitors (millions) . . . . . . . . 19.1 15.7 13.9 12.0 9.5Network infrastructure in Italy:Š Access network in copper (millions of km—pair) . . . . . . . . . . . . . . 105.7 105.2 105.2 105.2 104.3Š Access network and transport in optical fibers (millions of km
of optical fibers) . . . . . . . . . . . . . . . . . . . . . . . . . . . . . . . . . . . . . . . . . . . . . 3.7 3.7 3.7 3.6 3.6Network infrastructure outside Italy:Š European backbone (km of optical fibers) . . . . . . . . . . . . . . . . . . . . . 51,000 51,000 39,500 39,500 36,600Domestic Mobile:Mobile telephone lines in Italy at year-end (thousands) . . . . . . . . . . . . 32,450 28,576 26,259 26,076 25,302Brazil Mobile:Mobile telephone lines in Brazil at year-end (thousands) . . . . . . . . . . . 25,410 20,171 13,588 8,304 5,335Media:La7 average audience share Free to Air (analog mode) for the
year (%) . . . . . . . . . . . . . . . . . . . . . . . . . . . . . . . . . . . . . . . . . . . . . . . . . . . . . . . . 3.0 2.7 2.4 2.2 1.8La7 average audience share Free to Air (analog mode) for the
month of December (%) . . . . . . . . . . . . . . . . . . . . . . . . . . . . . . . . . . . . . . . . 3.1 3.1 2.6 2.2 2.1
(1) For the convenience of the reader, Euro amounts for 2006 have been converted into U.S. dollars using the Euro/Dollar Exchange Rate ineffect on December 29, 2006 of €1.00 = U.S.$ 1.3197.
(2) For the purposes of IFRS, “Parent”, as used in this annual report, means Telecom Italia S.p.A..
(3) The average number of employees in the Group (excluding employees relating to the consolidated companies considered as discontinuedoperations/assets held for sale and including personnel with temp work contracts) was 79,993, 79,869 and 79,602 in 2006, 2005 and2004, respectively.
(4) In accordance with IAS 33 “Earnings per share”, basic earnings per Ordinary Share is calculated by dividing the Group’s net incomeavailable to shareholders by the weighted average number of shares outstanding during the year, excluding treasury shares.
Since Telecom Italia has both Ordinary and Savings Shares outstanding, the calculations also take into account the requirement thatholders of Savings Shares are entitled to an additional dividend equal to 2% of the par value of shares above dividends paid on theOrdinary Shares.
For the purpose of these calculations, the weighted average number of:
Š Ordinary Shares was 13,254,860,233 for the year ended December 31, 2006, 12,283,195,845 for the year ended December 31, 2005and 10,208,327,613 for the year ended December 31, 2004;
Š Savings Shares was 6,026,120,661 for the year ended December 31, 2006, 5,930,204,164 for the year ended December 31, 2005 and5,795,921,069 for the year ended December 31, 2004.
18

Item 3. Key Information Selected Financial And Statistical Information
For diluted earnings per share the weighted average number of shares outstanding is adjusted assuming conversion of all dilutivepotential shares. Potential shares are those securities that, if converted into shares, would increase the total number of sharesoutstanding and reduce the earnings attributable to each share. Potential shares include options, warrants and convertible securities. TheGroup’s net income is also adjusted to reflect the impact of the conversion of potential shares net of the related tax effects.
(5) Telecom Italia’s dividend coupons for the year ended December 31, 2006, were clipped on April 23, 2007 and were payable from April 26,2007.
(6) Share capital represents share capital issued net of the par value of treasury shares.
(7) Net Financial Debt is a “Non-GAAP Financial Measure” as defined in Item 10 of Regulation S-K under the 1934 Act. For further detailsplease see “Item 5. Operating and Financial Review and Prospects—5.5 Results of Operations for the Three Years Ended December 31,2006—5.5.2 Non-GAAP Financial Measures”.
(8) Refers only to Net income (loss) attributable to equity holders of the Parent.
(9) In accordance with U.S. GAAP, the Net income (loss) per Ordinary Share has been calculated using the two class method, since theCompany has both Ordinary Shares and Savings Shares outstanding. Under this method, set forth in Statement of Financial AccountingStandards No. 128, “Earnings per Share”, basic earnings per share is computed by dividing income available to shareholders by theweighted average number of shares outstanding. For the purpose of these calculations, the weighted average number of Ordinary Sharesand Savings Shares was 13,254,860,233 and 6,026,120,661 for the year ended December 31, 2006, 12,283,195,845 and 5,930,204,164for the year ended December 31, 2005, 10,208,327,613 and 5,795,921,069 for the year ended December 31, 2004 and 6,620,513,494 and2,414,967,112 for the year ended December 31, 2003. The weighted average number of Ordinary Shares was 4,054,375,543 for the yearended December 31, 2002. The calculations take into account the requirement that holders of Savings Shares are entitled to an additionaldividend equal to 2% of the par value of Savings Shares in addition to dividends paid on the Ordinary Shares. The calculations also takeinto account that in 2002 (after the redenomination of the share capital into Euro following the resolution taken by the ExtraordinaryShareholders’ Meeting held on July 4, 2000) the par value of Ordinary Shares was €1 per share, and that in 2003, after the Merger, thepar value of Ordinary Shares and Savings Shares was reduced to €0.55 per share. For diluted earnings per share the weighted averagenumber of shares outstanding is increased to include any potential common shares and is adjusted for any changes to income that wouldresult from the assumed conversion of those potential common shares.
(10) Equity under U.S. GAAP refers only to Equity attributable to equity holders of the Parent.
(11) Includes Minority Interests.
(12) Data exclude internal lines.
(13) Number of contracts; data include Teleconomy, Hellò and other Business voice offers.
(14) Number of contracts.
19

Item 3. Key Information Dividends
3.4 DIVIDENDS
The determination of our future dividend policy, and the amounts thereof, will depend upon a number of factors,including but not limited to our earnings, financial condition and cash requirements, prospects and such otherfactors as may be deemed relevant at the time. Subject to the foregoing, we plan to pay dividends over the period2007-2009 closer to the dividend policy of other European telecommunications operators.
Dividends declared by Old Telecom Italia. The following table sets forth the dividends per Ordinary Share andper Savings Share declared by Old Telecom Italia with respect to the fiscal year ended December 31, 2002 and theaggregate dividend paid in such year. Actual dividends paid are rounded to the nearest whole cent.
Dividends on Ordinary Shares Dividends on Savings Shares
Year ended December 31,Euro per
Share
U.S. dollarsper
Share(1)(millions of
Euro)Euro per
Share
U.S. dollarsper
Share(1)(millions of
Euro)
2002 . . . . . . . . . . . . . . . . . . . . . . . . . . . . . . . . . . . . . . 0.1357(2) 0.1386 713.47 0.1357(2) 0.1386 273.11
(1) Euro amounts have been translated into U.S. dollars using the Noon Buying Rate in effect on the respective payment dates.
(2) In order to ensure shareholders dividends commensurate with those paid out for 2001, in December 2002, reserves were distributed andpaid corresponding to a dividend of €0.1357 per Old Telecom Italia Ordinary Share and a dividend of €0.1357 per Old Telecom ItaliaSavings Share. Furthermore, the shareholders’ Meeting of Old Telecom Italia held on May 24, 2003 approved an additional dividend of€0.1768 per Old Telecom Italia Ordinary Share and €0.1878 per Old Telecom Italia Savings Share, payable from income and capitalreserves.
Dividends declared by Telecom Italia (formerly Olivetti). The following table sets forth the dividends perOrdinary Share and per Savings Share declared by Telecom Italia (Olivetti prior to the Merger) with respect toeach of the last five fiscal years and the aggregate dividend paid in such years. Actual dividends paid are roundedto the nearest whole cent.
Dividends on Ordinary Shares Dividends on Savings Shares
Year ended December 31,Euro per
Share
U.S. dollarsper
Share(1)(millions of
Euro)Euro per
Share
U.S. dollarsper
Share(1)(millions of
Euro)
2002 . . . . . . . . . . . . . . . . . . . . . . . . . . . . . . . . . . . . . . — — — — — —2003 . . . . . . . . . . . . . . . . . . . . . . . . . . . . . . . . . . . . . . 0.1041 0.1278 1,072.95 0.1151 0.1413 667.112004 . . . . . . . . . . . . . . . . . . . . . . . . . . . . . . . . . . . . . . 0.1093 0.1431 1,225.99 0.1203 0.1575 697.252005 . . . . . . . . . . . . . . . . . . . . . . . . . . . . . . . . . . . . . . 0.1400 0.1753 1,873.12 0.1510 0.1891 909.942006(2) . . . . . . . . . . . . . . . . . . . . . . . . . . . . . . . . . . . 0.1400 0.1903 1,873.13 0.1510 0.2052 909.94
(1) Euro amounts have been translated into U.S. dollars using the Noon Buying Rate in effect on the respective payment dates.
(2) Approved at the Annual Shareholders’ Meeting held on April 16, 2007. Pursuant to Italian Stock Exchange rules, dividends on theOrdinary Shares and the Savings Shares are payable from the fourth trading day after the third Friday of each month, and in any case, atleast four business days after the Annual Meeting of Shareholders approving the dividends. Telecom Italia’s dividend coupons for the yearended December 31, 2006 were clipped on April 23, 2007, and were payable from April 26, 2007.
Payment of annual dividends is subject to approval by the holders of Ordinary Shares at the annual generalshareholders’ meeting, which must be convened within 120 days after the end of the financial year to which itrelates or, in case specific reasons arise, within 180 days, and the reasons for the delay to be described in theannual report. In addition, Article 21 of the Company’s Bylaws gives the Board of Directors the power to approvethe distribution of “interim dividends”. Pursuant to Italian law, the distribution may be approved after the finalapproval of the preceding year’s financial statements, and the interim dividends may not exceed the lower of(i) the difference between profits from the preceding fiscal year and amounts required to be attributed to legaland statutory reserves and (ii) available reserves. Once paid in compliance with applicable laws, shareholderscannot be required to repay interim dividends to the Company if the shareholders collected such dividends ingood faith. Dividends not collected within five years from the date they become payable will be forfeited in favorof the Company. If profits are not fully distributed, additional reserves are created.
According to the Italian Civil Code, before dividends may be paid with respect to any year, an amount equal to 5%of the net income of the Company for such year must be set aside to the legal reserve until the legal reserve,including amounts set aside during prior years, is at least equal to one-fifth of the par value of the Company’s
20
Item 3. Key Information Dividends
issued share capital. This legal reserve is not available for payment of dividends. Such restriction on the paymentof dividends applies, on a non-consolidated basis, to each Italian subsidiary of the Telecom Italia Group. TheCompany may also pay dividends out of available retained earnings from prior years or other reserves.
Dividends in respect of Ordinary Shares and Savings Shares held with Monte Titoli S.p.A. (“Monte Titoli”) areautomatically credited to the accounts of the beneficial owners with the relevant participant of Monte Titoli,without the need for presentation by such beneficial owners of any documentation. See “Item 10. AdditionalInformation—10.4 Description of Capital Stock”.
Arrangements between Euroclear or Clearstream and Monte Titoli permit the shareholders to collect the dividendsthrough Euroclear or Clearstream. Holders of American Depositary Receipts (“ADRs”) are entitled to receivepayments in respect of dividends on the underlying Ordinary Shares and Savings Shares, as the case may be, inaccordance with the relevant Deposit Agreement.
Dividends payable on the Company’s Ordinary Shares and Savings Shares may be subject to deduction of Italianwithholding tax. See “Item 10. Additional Information—10.6 Taxation”. Italian regulations do not contain anyspecific restrictions on the payment of dividends to non-residents of Italy. See “Item 10. AdditionalInformation—10.2 Exchange Controls and Other Limitations Affecting Security Holders”.
Pursuant to Italian law, in connection with the payment of dividends, participants of Monte Titoli are required tosupply to the Italian tax authorities certain information concerning the identity of non-resident shareholdersholding Ordinary Shares or Savings Shares. Shareholders are required to provide their Italian tax identificationnumber, if any, or alternatively, in the case of legal entities, their name, country of establishment and address, orin the case of individuals, their name, address and place and date of birth, or in the case of partnerships, theinformation required for legal entities and the information required for individuals with respect to one of theirrepresentatives.
In the case of Ordinary Share ADSs and Savings Share ADSs owned by non-residents of Italy, Telecom Italiaunderstands that the provision of information concerning the Depositary, in its capacity as holder of record of theOrdinary Shares and Savings Shares, as the case may be, will satisfy these requirements. The Depositary, inaccordance with Telecom Italia, will provide information to beneficial owners of Ordinary Share ADSs and SavingsShare ADSs, that are considered U.S. residents for purposes of applicable law, to the extent such owners wish tobenefit from reduced withholding tax rates on dividends under an income tax convention, and claims for suchbenefits therefore must be accompanied by the required information. See “Item 10. Additional Information—10.6Taxation”.
21

Item 4. Information On The Telecom Italia Group Business
Item 4. INFORMATION ON THE TELECOM ITALIA GROUP
4.1 BUSINESS
For a glossary of selected telecommunications terms used in the following description of the Telecom ItaliaGroup’s business and elsewhere in this Report see “—4.4 Glossary of Selected Telecommunications Terms.”
4.1.1 BACKGROUND
The legal and commercial name of the company is Telecom Italia S.p.A..
Telecom Italia is a joint-stock company established under Italian law with registered offices in Milan at Piazzadegli Affari 2. The company is recorded in the Milan Companies Register at number 00488410010, R.E.A. number1580695.
The duration of the company, as stated in the company’s Bylaws, extends until December 31, 2100.
On July 18, 1997, Old Telecom Italia’s predecessor company was merged with and into Società FinanziariaTelefonica—per Azioni (“STET”), its parent holding company, with STET as the surviving corporation. As of theeffective date of the merger, STET changed its name to “Telecom Italia S.p.A.”. In November 1997, the Ministryof the Treasury of the Republic of Italy completed the privatization of Telecom Italia, selling substantially all of itsstake in the Old Telecom Italia Group through a global offering and a private sale to a stable group ofshareholders.
On May 21, 1999, Olivetti, through a tender offer, obtained control of the Old Telecom Italia Group whenapproximately 52.12% of Old Telecom Italia Ordinary Shares were tendered to Olivetti. Through a series oftransactions which started in July 2001, Olimpia acquired a 28.7% stake in Olivetti which resulted in thereplacement of the then boards of directors of Olivetti and Old Telecom Italia. Please see “Item 7. MajorShareholders and Related-Party Transactions—7.1 Major Shareholders—7.1.1 The Olimpia Shareholders’Agreements”.
On December 9, 2002, the Ministry of the Treasury sold its remaining stake in Old Telecom Italia Ordinary andSavings share capital.
On August 4, 2003, Old Telecom Italia merged with and into Olivetti (the “Merger”) with Olivetti as the survivingcompany changing its name to “Telecom Italia S.p.A.”. Following the Merger, the proportionate ownership ofTelecom Italia’s share capital by shareholders unaffiliated with Olimpia or Pirelli & C. S.p.A. (“Pirelli”), Olimpia’slargest shareholder, increased substantially to approximately 88.43% of the outstanding Ordinary Shares.Following the Merger, Olimpia acquired additional shares through market purchases and, prior to the acquisitionby Telecom Italia of the share capital in TIM it did non already own (the “TIM Acquisition”), Olimpia heldapproximately 17% of Telecom Italia’s Ordinary Shares, making it the largest shareholder of Telecom Italia. As aresult of a series of transactions in December 2004 and March 2005, Olimpia acquired additional Ordinary Sharesresulting in ownership of approximately 21.4% of the outstanding Ordinary Shares.
Following the issuance of shares of Telecom Italia in exchange for outstanding shares of TIM held by third parties,as a result of the merger of TIM into Telecom Italia through which the TIM Acquisition was effected, Olimpia’sstake was diluted to approximately 18% (corresponding to 2,407,345,359 Ordinary Shares).
Currently 80% of the share capital of Olimpia is held by Pirelli & C. S.p.A., with the remaining stake owned bySintonia S.p.A. that replaced Edizione Holding S.p.A. as a result of its demerger (effective as of March 2, 2007) andby Sintonia S.A., previously named Edizione Finance International S.A., a wholly owned subsidiary of Sintonia S.p.A..
According to publicly available filings with CONSOB, as of June 13, 2007, the shareholders of Pirelli with a 5%shareholding or greater in Pirelli’s voting capital were Camfin CAM Finanziaria S.p.A. (25.387%) and AssicurazioniGenerali S.p.A. (5.251%). On the same date shareholders of Camfin CAM Finanziaria S.p.A. with a 5% shareholdingor greater in the voting capital of the company included Mr. Marco Tronchetti Provera (through GruppoPartecipazioni Industriali S.p.A. (50.180%)) and Mr. Carlo Acutis (through Vittoria Assicurazioni S.p.A.(4.648%) and Yura International Holding B.V. (4.649%)).
22

Item 4. Information On The Telecom Italia Group Business
The following chart illustrates Telecom Italia’s current ownership structure.
Shareholdersof Pirelli & C.
(1)
SintoniaS.p.A.
Sintonia S.A.Pirelli & C.
20% 80%
Olimpia
18%
Telecom Italia
(1) Shareholders of Pirelli & C. S.p.A. with a 5% stake or greater in the voting capital of the company include: Camfin CAM Finanziaria S.p.A.(25.387%) and Assicurazioni Generali S.p.A. (5.251%).
On April 28, 2007 Pirelli & C. S.p.A., Sintonia S.p.A. and Sintonia S.A. announced by press release that they hadreached an agreement with a group of institutional financial investors and Telefónica S.A., the Spain-basedinternational telecoms operator for the sale of 100% of the share capital of Olimpia.
The acquisition (which is conditional upon the authorizations and approvals of competent authorities) will beeffected by a vehicle company (Telco S.p.A.) owned by Assicurazioni Generali S.p.A. (28.1%), Intesa SanpaoloS.p.A. (10.6%), Mediobanca S.p.A. (10.6%), Sintonia S.A. (8.4%) and Telefónica S.A. (42.3%). The transaction isexpected to be completed by October 2007.
Telco S.p.A., after the acquisition and the incorporation of Olimpia, will hold approximately 23.6% of the votingshare capital of Telecom Italia, 18% of which will be acquired with the acquisition of Olimpia and 5.6% of whichwill be contributed by Assicurazioni Generali S.p.A. and Mediobanca S.p.A..
23

Item 4. Information On The Telecom Italia Group Business
The following chart illustrates the expected ownership structure following completion of the transaction.
AssicurazioniGenerali
IntesaSanpaolo Sintonia TelefónicaMediobanca
Telco
Olimpia
TelecomItalia
10.6% 28.1%. 10.6% 8.4% 42.3%
100%
18%
5.6%
23.6%
4.1.2 DEVELOPMENT
Olivetti (now Telecom Italia) was founded in Ivrea (Province of Turin) in 1908 as a typewriter manufacturingcompany. Subsequently, Olivetti gradually altered its core business from office products (mechanical products atfirst and electronic products later) to products for information technology and telecommunications.
In May 1999, after the completion of a purchase and exchange offer, Olivetti and its subsidiary Tecnost S.p.A.acquired control of the “old” Telecom Italia, Italy’s main telecommunications operator, which, had previouslyheld the monopoly for such operations and had been state-controlled until its privatization in 1997.
In August 2003, Old Telecom Italia was merged into Olivetti; Olivetti adopted Telecom Italia’s corporate purposeand name.
In June 2005, TIM (a separate company listed on the Italian stock exchange, controlled by Telecom Italia,engaged in mobile communications services) was merged into Telecom Italia, after the spin-off of the corporateoperations relating to the domestic mobile communications business to Tim Italia, a wholly-owned subsidiary ofTIM and, after TIM’s merger into Telecom Italia, of Telecom Italia.
During the course of 2005, activities in the Internet sector, which were under the control of Telecom Italia Media,were also integrated into Telecom Italia through the acquisition of the assets of Virgilio (through the companiesFinanziaria Web and Matrix) and Tin.it (through the company Nuova Tin.it).
The final stage in this reorganization process took place in October 2005 when the Telecom Italia Board ofDirectors decided to adopt a new business model based on the integration of its wireline and mobile businesses(the so-called “One Company Model”). In line with this decision, Tim Italia was merged in Telecom Italia (witheffect from March 1, 2006). The One Company Model also led to the integration of the Internet activities in theparent company and, in the second half of 2006, the wholly-owned subsidiary Nuova Tin.it S.r.l. was merged intoTelecom Italia with effect from October 1, 2006.
The adoption of the One Company Model was our strategic response to changes in the demand fortelecommunications services, increased competitive pressure and technological innovations, which wereprogressively erasing the traditional distinctions between fixed and mobile business areas. We considered at thetime that our ability to offer wireline, mobile and Internet services, as the demand for these services converged,provided us with a longer term competitive advantage which, if exploited, would be the means of achieving ourtargets of growth and profitability.
24

Item 4. Information On The Telecom Italia Group Business
Given the opportunities offered by the market and technology (especially the focus on the integration betweenbroadband and media content) and the regulatory constraints placed on the Group’s activities, in September2006, the Board of Directors elected to separate the mobile telephony operations and local access networkbusiness, and to create specific business divisions focused on various market and services segments.
Subsequently, on January 22, 2007, the Telecom Italia Group implemented a new organizational plan which, whileimplementing a strategy that gives strong value to Fixed-Mobile convergence as a distinctive advantage, is aimedat maintaining a focused approach to the various markets, as they are still characterized by specific competitiveand regulatory contexts.
For more detail about the organizational structure deriving from this approach, please see “—4.1.8 TheOrganizational Structure”.
4.1.3 BUSINESS
The Telecom Italia Group is engaged principally in the communications sector and, particularly, in telephone and dataservices on fixed lines, for final retail customers and wholesale providers, in the development of fiber optic networks forwholesale customers, in innovative broadband services, in Internet services, in domestic and international mobiletelecommunications (especially in Brazil), in the television sector using both analog and digital terrestrial technologyand in the office products sector, and operates mainly in Europe, the Mediterranean Basin and in South America.
In particular, at December 31, 2006, the Telecom Italia Group was one of the world’s largest wireline operators,with approximately 23.7 million fixed network connections in Italy. In addition, the Telecom Italia Group was theleading mobile operator in Italy, with 32.4 million domestic mobile telephone lines at December 31, 2006; and asof the same date Telecom Italia Group had 25.4 million mobile telephone lines in Brazil. We have significantlyexpanded into broadband in recent years and, at December 31, 2006, we had 8.7 million broadband accesses,6.8 million in Italy and 1.9 million elsewhere in Europe (France, Germany and The Netherlands).
4.1.4 DISPOSALS AND ACQUISITIONS OF SIGNIFICANT EQUITY INVESTMENTS IN 2006
For a description of disposals and acquisitions of significant equity investments in 2006 please see “Note 1—Formand Content and Other General Information”, “Note 3—Business Combinations, Acquisitions of Minority Interestsand Transactions between Companies Under Common Control”, “Note 8—Other Non-Current Assets” and “Note16—Discontinued Operations/Assets Held for Sale” of the Notes to the Consolidated Financial Statements.
4.1.5 RECENT DEVELOPMENTS DURING 2007
Entel Bolivia
The Bolivian government, in pursuing its policy of nationalizing various privately-owned businesses, including EntelBolivia (acquired in 1995 by the Telecom Italia Group through the Dutch subsidiary ETI, entirely controlled by TelecomItalia International), recently issued a decree establishing a ministerial commission in order to start, conduct andconclude negotiations, within 30 days beginning from the publication of the decree, aimed at “recovering” Entel Boliviafor the State. The above-mentioned measure alleges that Entel Bolivia and ETI have committed a number of seriousadministrative and fiscal irregularities. Telecom Italia participated in the meetings with the commission with the soleaim of hearing the government’s position with regard to the “recovery” of Entel Bolivia, but rejected all the allegationsconcerning the supposed irregularities. Subsequently, on April 23, 2007, the Bolivian government adopted two moremeasures cancelling all the previous laws which were the basis on which the previous government had acknowledgedthat Entel Bolivia had fulfilled all the obligations it had assumed when the company was privatized, declaring that allinitiatives taken in executing the abrogated laws (particularly the capital reduction of Entel Bolivia resolved at the end of2005) would be punishable by law, and also annulled a number of further administrative measures, particularly the onepassed in 1995, which had launched the Entel Bolivia privatization process.
On April 30, 2007, as a reaction to the position assumed by the commission and the measures adopted by theBolivian government, and with the aim of protecting its interests in the country, ETI notified the government of itsintention to start the procedure provided for in the bilateral treaty for the protection of investments betweenBolivia and The Netherlands; upon such notification, the parties may initiate consultation procedures for sixmonths with a view to settling amicably the conflict between them. This action is preliminary to the possibility ofasking the International Center for Settlement of Investment Disputes (ICSID), an internal body of the WorldBank, to start an international arbitration to resolve the dispute.
25

Item 4. Information On The Telecom Italia Group Business
Change in Ownership Structure
On April 28, 2007 Pirelli & C. S.p.A., Sintonia S.p.A. and Sintonia S.A. reached an agreement with a group ofinstitutional financial investors and Telefónica S.A., the Spain-based international telecoms operator, for the saleof 100% of the share capital of Olimpia. For a description of the Olimpia sale please see “—4.1.1. Background”.
Consultation regarding fixed line network by the National Regulatory Authority
For a discussion of the consultation being held by the NRA with regard to Telecom Italia’s domestic fixed linenetwork please see “—4.3 Regulation”.
For a description of other recent developments please also see “Note 44—Events Subsequent to December 31,2006” and “Note 48—Additional U.S. GAAP Disclosures” of the Notes to the Consolidated Financial Statements.
4.1.6 OVERVIEW OF THE TELECOM ITALIA GROUP’S MAJOR BUSINESS AREAS
The following is a chart of the Telecom Italia Group’s Business Units as of December 31, 2006:
Telecom Italia Group
Wireline DomesticMobile Brazil Mobile
Operations Media Olivetti
Telecom Italia –Wireline Segment
Telecom Italia -Domestic Mobile Segment
TimGroup
Telecom Italia Media
Olivetti Group
Loquendo Telecom Italia Media Broadcasting
Matrix MTV Italia
Path.Net MTVPubblicità
TelecontactCenter
TM News
TI Sparkle Group
BBNED Group
Liberty Surf Group
HanseNetTelekommunikation
Brasil
26

Item 4. Information On The Telecom Italia Group Business
The table below sets forth revenues, operating income (loss), capital expenditures and number of employees byBusiness Units, for the periods indicated:
Wireline(1)
DomesticMobile
BrazilMobile Media Olivetti
Otheractivities
(1)(2)
Adjustmentsand
eliminationsConsolidated
Total(millions of Euro, except number of employees)
Revenues(3) . . . . . . . . . . . . . . . . . 20062005(4)2004(4)
17,79517,83417,508
10,21010,0769,923
3,9642,9001,800
207180168
440452590
1,5631,3211,289
(2,904)(2,844)(2,986)
31,27529,91928,292
Operating income (loss) . . . . . 20062005(4)2004(4)
4,3964,4884,709
3,7423,8564,010
21(190)(137)
(137)(130)(93)
(50)(38)17
(582)(547)(692)
4760
(211)
7,4377,4997,603
Capital expenditures . . . . . . . . . 20062005(4)2004(4)
3,0022,8232,449
1,1461,2761,469
699842817
856539
101915
200156213
(28)(8)
—
5,1145,1735,002
Number of employees atyear-end(5) . . . . . . . . . . . . . . .
20062005(4)2004(4)
55,70556,98755,833
11,21811,72011,767
9,5319,0436,967
919886
1,077
1,4281,7502,109
4,4085,0984,867
———
83,20985,48482,620
(1) As a result of the new organizational structure of the Group approved on October 5, 2005 (the so-called “One Company Model”), theactivities of the Innovation & Engineering Services business segment of Telecom Italia, ex-TILAB segment of Telecom Italia, previouslyincluded in Other activities, were transferred to the Wireline Business Unit; therefore 2005 and 2004 results have been reclassified forpurposes of comparison.
(2) Entel Bolivia group is included in Other Activities.
(3) Revenues are total revenues of the various business units of the Telecom Italia Group before elimination of intercompany sales (but afterelimination of sales between companies within the same major business area).
(4) The data relating to 2005 and 2004 have been reclassified and presented consistent with the 2006 presentation.
(5) The number of employees at year-end excludes employees relating to the consolidated companies considered as discontinuedoperations/assets held for sale, and includes personnel with temp work contracts.
27

Item 4. Information On The Telecom Italia Group Business
The following table sets forth, for the periods indicated, certain selected statistical data for the Telecom ItaliaGroup’s Business Units.
As of and for the year endedDecember 31,
2006 2005 2004
Statistical Data:Wireline:Fixed network connections in Italy (thousands)(1) . . . . . . . . . . . . . . . . . . . . . . . . . . . . . . . . . . . . 23,698 25,049 25,957Physical accesses (Consumer + Business) (thousands) . . . . . . . . . . . . . . . . . . . . . . . . . . . . . . . 20,540 21,725 22,395Voice pricing plans (thousands)(2) . . . . . . . . . . . . . . . . . . . . . . . . . . . . . . . . . . . . . . . . . . . . . . . . . . . 6,468 6,321 5,883Broadband Accesses (thousands)(3): . . . . . . . . . . . . . . . . . . . . . . . . . . . . . . . . . . . . . . . . . . . . . . . . . 8,660 7,020 4,430Š Domestic (thousands) . . . . . . . . . . . . . . . . . . . . . . . . . . . . . . . . . . . . . . . . . . . . . . . . . . . . . . . . . . . . 6,770 5,707 4,010Š European, other than domestic (thousands) . . . . . . . . . . . . . . . . . . . . . . . . . . . . . . . . . . . . . . 1,890 1,313 420Alice page views—ex-Virgilio (millions) . . . . . . . . . . . . . . . . . . . . . . . . . . . . . . . . . . . . . . . . . . . . . . 13,283 9,842 7,902Alice (ex-Virgilio) average monthly single visitors (millions) . . . . . . . . . . . . . . . . . . . . . . . . . . 19.1 15.7 13.9
Network infrastructure in Italy:Š Access network in copper (millions of km—pair) . . . . . . . . . . . . . . . . . . . . . . . . . . . . . . . . . 105.7 105.2 105.2Š Access network and transport in optical fibers (millions of km of optical fibers) . . . 3.7 3.7 3.7
Network infrastructure outside Italy:Š European backbone (km of optical fibers) . . . . . . . . . . . . . . . . . . . . . . . . . . . . . . . . . . . . . . . . 51,000 51,000 39,500
Domestic Mobile:Mobile telephone lines in Italy at year-end (thousands) . . . . . . . . . . . . . . . . . . . . . . . . . . . . . . . 32,450 28,576 26,259
Brazil Mobile:Mobile telephone lines in Brazil at year-end (thousands) . . . . . . . . . . . . . . . . . . . . . . . . . . . . . . 25,410 20,171 13,588
Media:La7 average audience share Free to Air (analog mode) for the year (%) . . . . . . . . . . . . . . . 3.0 2.7 2.4La7 average audience share Free to Air (analog mode) for the month of
December (%) . . . . . . . . . . . . . . . . . . . . . . . . . . . . . . . . . . . . . . . . . . . . . . . . . . . . . . . . . . . . . . . . . . . . . 3.1 3.1 2.6
(1) Data exclude internal lines.
(2) Number of contracts; data include Teleconomy, Hellò and other Business voice offers.
(3) Number of contracts.
4.1.7 UPDATED STRATEGY
On March 9, 2007, we set out our priorities for the 2007-2009 period.
Changes in the demand for telecommunications services, increased competitive pressure and technologicalbreakthroughs continue to erode the traditional distinctions between fixed and mobile business areas andconvergence increasingly appears as the means of developing a sustainable long-term competitive advantage.
After an initial phase in 2005-2006 in which we built a fully integrated business model, we have now evolved ourorganizational model focusing on business segments and flexibility, preserving the integrated approach in networkinfrastructures development and in platforms and systems management and development.
Our strategy is based on the following pillars to support the growth of the Group and the evolution of profitability.
Š Maintain clear leadership in Domestic TLC market:
– increasing broadband penetration and continuing our win back and retention strategy based ondual play (voice and broadband access) and triple play (voice, broadband access and IPTV) offersfor private customers and integrated solutions (voice, broadband and value added services “VAS”)for business customers in the domestic fixed market;
– developing a “volume and value strategy” in the domestic mobile market based on market andoffer segmentation, the migration towards 3G/High Speed solutions to exploit VAS growth and thepush on flat and post-paid (contract) offers;
28
Item 4. Information On The Telecom Italia Group Business
– leveraging fixed-mobile convergent offers (a bundle of fixed and mobile services) in voice, VAS andbroadband as a distinguishing factor in market positioning versus other operators;
– leading network evolution towards full IP and ultra broadband to maintain leadership in serviceinnovation and to efficiently manage future business evolutions;
– pushing on efficiency in all costs areas to protect Telecom Italia’s domestic profitability exploitingfull-IP network architecture simplification and consolidating convergent synergies.
Š Exploit the increasing growth opportunity in adjacent sectors (Content, Information andcommunication technology “ICT”):
– developing an IPTV service offer to increase the Average Revenue Per User (“ARPU”) and theshare of wallet on broadband customers and to accelerate broadband adoption and penetration;
– exploit network capabilities and strong Telecom Italia relationships with its business customer topush on ICT value added services as a means to increase customer loyalty.
Š Strongly increase the weight of international operations through the development ofEuropean broadband presence and the consolidation of Latin-American operations:
– strengthening and developing existing broadband activities in Europe and also exploiting highpotential incremental businesses (virtual mobile operator model, service multinationalcorporations) that can leverage on local presence in Germany, France and The Netherlands;
– maintaining leadership in mobile growth in Brazil by launching Fixed-Mobile convergent offers inorder to defend TIM from alternative convergent offers (a bundle of fixed and mobile services) andattract high value customers (fixed and mobile);
– anticipate the consolidation of Telecom Argentina operations (Telecom Italia owns 50% of SoforaTelecomunicaciones S.A. and owns call options rights to acquire control from 2009) to strengthenLatin-American presence.
While implementing a strategy that gives strong value to fixed-mobile convergence (a bundle of fixed and mobileservices) as a distinctive advantage, we therefore maintain a focused approach to the fixed and mobile markets,which are still characterized by specific competitive and regulatory contexts.
There can be no assurance that these objectives will actually be achieved.
Wireline business
In Wireline, the main focus is on broadband development and customer retention. At the end of 2006, thecustomer base of broadband access lines was 6.8 million in the domestic market and 1.9 million in the Europeanmarkets (France, Germany and The Netherlands). Broadband access services (Alice and Alice Business) havesupported continued growth. New voice packages, including flat rates on both the Public Service TelephonyNetwork (“PSTN”) and VoIP lines, and innovative integrated solutions for business clients were also introduced.
Our Wireline strategy continues to be driven by defense of market share in voice traffic, a strong emphasis onInternet growth and the development of broadband content and services, while maintaining a strong focus onobtaining cost efficiencies.
In particular, we intend to:
Š maintain the domestic leadership in our core business (voice services, Internet access, datatransmission services for businesses, national and international wholesale services); on voice, theprocess of migrating an increasing portion of our customers to flat rate packages will be a key to ensurethe success of our retention strategy;
Š strengthen our leadership in service innovation and increase the penetration of broadband services,through “dual play” offers, “triple play” offers, and also “quadruple play” offers (fixed and mobile voice,broadband access and IPTV);
29
Item 4. Information On The Telecom Italia Group Business
Š innovative services will be supported by increased bandwidth (>50Mbit/s on fixed infrastructure and10Mb/sec on mobile infrastructure), as we expect to lead network evolution towards full IP and ultrabroadband characterized by:
– Introduction of Fibre and VDSL2 technology in the access network;
– Significant extension of ADSL2+ / triple play coverage to anticipate Fttx (optical fiber based)solutions;
– Implementation of a full IP network;
– Progressive full migration to Telephony Over Internet Protocol (“ToIP”) starting from 2009;
– Development of new data centers and platforms to support new vertical services distribution;
Š consolidate our operational capabilities with the objective of offering top high quality service levels toour customers and leverage opportunities to retain our client base by enhancing customer loyalty(through customer relationship management and customer contact);
Š run efficient operations and continue to be focused on cost-cutting and cost control (personnel, realestate, general and administrative, network).
There can be no assurance that these objectives will actually be achieved.
Italian mobile business
Mobile Italy’s strategy is based on “a volume and value approach” and is focused on maintaining leadership onMobile market and achieving sustainable and profitable growth through:
Š continuous innovation and improved segmentation of voice and Value Added Services (VAS) offers; webelieve this should enable Telecom Italia to retain or improve its market share and to achieveleadership in the UMTS services market;
Š strong customer care, able to respond and anticipate customer needs with a segmented approach; and
Š full enhancement of the potential of the UMTS network and development of mobile broadbandtechnologies (such as HSDPA—High-Speed Downlink Packet Access: a UMTS evolution that allowsbroadband connections up to 3.6 Mbps) and of DVB-H (Digital Video Broadcasting-Handheld: atechnology used to broadcast digital video to mobile devices) services. These are expected to enablethe provision to mobile customers of value added services and content now available to fixed linecustomers, due to the development of convergent platforms.
The main strategic tools for the achievement of such objectives are:
Š focusing on the high end of the market, attracting valuable customers and leveraging caringdifferentiation and loyalty programs;
Š accelerating innovative marketing propositions, aimed at generating new and segmented offers toincrease voice traffic and VAS usage; penetration of mobile internet, access to premium and usergenerated content;
Š a multichannel and integrated approach to caring and distribution, tailored for different customerneeds/profile;
Š development of synergies between fixed and mobile services both on the revenue side, by launchingconvergent services, and on the cost side, by continuing to eliminate duplication and achieving costefficiencies on capital expenditures and operating expenditures;
Š focus on innovative capital expenditures, enabling us to retain our leadership in network quality and toprovide our customers with attractive wireless broadband services.
There can be no assurance that these objectives will actually be achieved.
30

Item 4. Information On The Telecom Italia Group Business
European Broadband Project
European broadband development represents increasingly a key driver in Telecom Italia’s overall growth strategy.Telecom Italia will continue to strengthen and develop existing activities and monitor any opportunities to exploitpotential incremental business (i.e. MVNO—Mobile Virtual Network Operator, a company that provides mobiletelephone services without its own infrastructures—services to multinational companies) that can leverage onlocal capabilities (sales, backbone and access network) and centralized support.
Telecom Italia’s European presence is today focused on Germany, France and The Netherlands. In particular onsingle country basis, Telecom Italia’s strategy is set upon the following guidelines:
Š In Germany. Telecom Italia will leverage on its AOL acquisition to consolidate growth, profitabilityand cash generation. The main strategic tools in Germany are:
– develop new VoIP and triple play offers;
– leverage on brand and sales efficiency;
– expand Local Loop Unbundled (“LLU”) coverage to maximise returns from market growth (from40% at the end of the year 2006 to 68% at the end of the year 2009);
– launch MVNO.
Š In France. Telecom Italia has completed a 12 months industrial turn around to achieve operating andeconomic efficiency. The main strategic tools in France are:
– develop new VoIP, triple play, quadruple play offers (new mediabox, rich portfolio of IPTV payingchannels; launch of Video On Demand services);
– maximum commercial focus on Local Loop Unbundled areas;
– increase quality of service and of end-to-end process management;
– Local Loop Unbundled coverage expansion (from 36% at the end of the year 2006 to over 50% bymiddle 2008);
– Wimax (Worldwide Interoperability for Microwave Access, a technology used to provide wirelessbroadband access) and MVNO (Mobile Virtual Network Operator, a company that provides mobiletelephone services without its own infrastructures) options.
Brazilian Mobile business (Tim Brasil)
In 2006, Tim Brasil continued to strengthen its market position and outperformed the Brazilian market line growthdue to its ability to attract high value customers. The Brazilian market has been characterized by strong growth inrecent years and is expected to continue to grow, although such residual market growth is predominantly in lowerincome social classes. Tim Brasil’s strategy will be focused on:
Š consolidating its position (revenue growth consistently above market average), and increasingprofitability;
Š ensuring profitability of low ARPU clients;
Š capturing fixed-line revenues (increase share of spending on Tim Brasil customer base) and defend TIMmobile leadership.
Tim Brasil will endeavor to reach these strategic objectives through:
Š end-to-end segmentation to attract and maintain high value consumer and business customers;
Š operational efficiency to support customer base expansion;
Š development of a new business model oriented to low-ARPU customers;
Š development of new convergent products (such as home zone with fixed numbering, Virtual PABX,Internet broadband access, etc.);
Š continuous innovation in VAS;
31

Item 4. Information On The Telecom Italia Group Business
Š shorter time to market and greater efficiency due to Tim Brasil’s plug and play strategy, which enables itto share resources and know-how with the domestic Italian business;
Š improved customer care and leveraging on its extensive distribution channel;
Š continued focus on quality of coverage.
Economies of scale and strict cost control should also allow Tim Brasil to further improve its profitability.
There can be no assurance that these objectives will actually be achieved.
4.1.8 THE ORGANIZATIONAL STRUCTURE
The following diagram highlights the organizational structure of the Telecom Italia Group as of the date of thisAnnual Report:
Assistant to Executive Deputy Chairman
Fausto Federici
Valeria Leone
Antonio ConcinaMassimiliano Paolucci(Co-dir)Andrea Imperiali (Co-dir)Aldo Cappuccio Nicola Verdicchio
Giorgio Rossi
HUMAN RESOURCES
Germanio Spreafico Giampaolo Zambeletti
EXECUTIVE DEPUTYCHAIRMAN
Carlo Orazio Buora
C.E.O.Riccardo Ruggiero
BUSINESS DEVELOPMENT
Giuseppe ZazaSergio FogliGilberto Nava (Co-dir)
REGULATORYAFFAIRS
INTERNATIONALWHOLESALE & BROADBAND SERVICES
Stefano MazzitelliAlessandro Talotta
NATIONALWHOLESALE SERVICES
Ottorino Passariello
QUALITY & FIELDSERVICES MANAGEMENT
STEFANO PILERI
DOMESTIC FIXEDSERVICES
MASSIMO CASTELLI
DOMESTIC MOBILE SERVICES
LUCA LUCIANI
TOP CLIENTS & ICT SERVICES
MAURO NANNI
TECHNOLOGY Tim BRASIL
MARIO CESAR ARAUJO
ENRICO PARAZZINI
FINANCE,ADMINISTRATION AND CONTROL
Gustavo Bracco
HUMAN RESOURCES, ORGANIZATION AND SECURITY
DOMESTIC LEGA LAFFAIRS AND SERVICE FOR THE JUDICIALAUTHORITIES
INTERNATIONALLEGAL AFFAIRS
PURCHASING
Filippo Bettini
STRATEGY
EXTERNAL RELATIONS INTERNATIONALAFFAIRS
INVESTOR
RELATIONSTI AUDIT ANDCOMPLIANCE SERVICES
BUSINESS UNIT MEDIA BUSINESS UNIT OLIVETTI
CHAIRMAN
Pasquale Pistorio
Francesco Chiappetta
GENERAL COUNSEL & CORPORATE AND LEGAL AFFAIRS
PUBLIC AFFAIRS
Paolo AnnunziatoRoberto Perrella (Co-dir)
LEGAL
Guglielmo Bove
PLANNING CONTROL
Riccardo Taranto
ANTONIO CAMPO DALL’ORTO GIOVANNI FERRARIO
Federico Maurizio D’Andrea
TELECOM ITALIALATAM
Giorgio Della Seta
Franco Rosario Brescia
BUSINESS MANAGEMENT & INTELLECTUAL PROPERTY RIGHTS
32

Item 4. Information On The Telecom Italia Group Business
The organizational structure of Telecom Italia Group at December 31, 2006 was as follows:
Š Central functions, organized according to Group Functions and/or Service Units, which were in chargeof directing the operations of the Group;
Š Operations and Business Units, which were responsible for business development and activitycoordination for the reference market.
The following reported to the then Chairman of the Board of Directors, Guido Rossi:
Š the Public Affairs Group function;
Š General Counsel.
The following reported to the Executive Deputy Chairman, Carlo Orazio Buora:
Š the Chief Executive Officer of Operations, Riccardo Ruggiero, who was responsible for ensuring themanagement and development of the fixed telecommunications, mobile telecommunications andInternet services businesses;
Š the Media and Olivetti Business Units;
Š the Group Functions of Advertising & Image, Brand Enrichment (Progetto Italia), Investor Relations,Finance Administration and Control, Human Resources, Organization and Security, Corporate and LegalAffairs, International Legal Affairs, Corporate Development, Purchasing, Services for the JudicialAuthorities and IT Governance, External Relations and Economic Studies;
Š Telecom Italia Audit and Compliance Services and Telecom Italia Latam.
The Support Activities function also reported directly to the Executive Deputy Chairman.
***
On January 22, 2007, the Telecom Italia Group implemented an organizational plan aimed at adapting its strategyto the evolution and advances in technology, the market, the competition and the regulatory developments aswell as fostering the convergence of the business areas (fixed-mobile, fixed-media, communication andinformation technology), while maintaining autonomy and flexibility.
Under this new organizational structure, the following Group Functions reported to the Chairman of the Board ofDirectors:
Š Public Affairs;
Š General Counsel & Corporate and Legal Affairs.
The following reported to the Executive Deputy Chairman:
Š the CEO of Telecom Italia, to whom the following reported:
– the Domestic Fixed Services Department, with responsibility for ensuring—at a national level—thedevelopment and management of activities relating to wireline telecommunications for consumerand business customers;
– the Domestic Mobile Services Department, with responsibility for ensuring—at a national level—the development and management of activities relating to mobile telecommunications forconsumer and business customers;
– the Top Clients & ICT Services Department, with responsibility for ensuring the development andmanagement of activities relating to fixed telecommunications and mobile telecommunicationsand the relative ICT services for TOP customers;
– the Technology Department, with responsibility for ensuring the technological innovation of theGroup, as well as the development and operation of the fixed and mobile telecommunicationsnetworks, systems and IT infrastructures;
– Tim Brasil, with responsibility for ensuring the development and management of the mobiletelecommunications business in Brazil;
33
Item 4. Information On The Telecom Italia Group Business
– Quality & Field Services Management, with responsibility for ensuring control over deliveryprocesses and technical assistance to the customers, as well as the monitoring of customersatisfaction and the coordination of plans for improving the quality of service;
– National Wholesale Services, with responsibility for ensuring the management of relations withdomestic licensee operators;
– International Wholesale and Broadband Services, with responsibility for ensuring the developmentof the international wholesale business of the Group and also the coordination of broadbandoperations outside Italy;
and also Business Development and Regulatory Affairs Functions;
Š the Media Business Unit;
Š the Olivetti Business Unit;
Š the Group Functions: Finance, Administration and Control, Human Resources, Organization andSecurity, Domestic Legal Affairs and Services for the Judicial Authorities, International Legal Affairs,Purchasing, Strategy, External Relations, International Affairs and Investor Relations.
In addition, Telecom Italia Audit and Compliance Services, reported to the Executive Deputy Chairman.
On February 16, 2007, the Telecom Italia Board of Directors appointed Massimo Castelli (Domestic Fixed ServicesDepartment), Luca Luciani (Domestic Mobile Services Department), Enrico Parazzini (Finance, Administration andControl Function) and Stefano Pileri (Technology Department) as General Managers.
* * *
On April 6, 2007 Guido Rossi resigned from the positions of Chairman and member of the Board of Directors ofTelecom Italia S.p.A. Following the shareholders’ meeting held on April 16, 2007, the newly elected Board ofDirectors of Telecom Italia held its first meeting on April 17, 2007 and appointed Mr. Pasquale Pistorio asChairman and confirmed Mr. Carlo Orazio Buora as Executive Deputy Chairman and Mr. Riccardo Ruggiero asChief Executive Officer. Subsequently, the Board of Directors confirmed the corporate responsibilities describedabove except that the Chairman, who is the legal representative of the Company, was also given the responsibilityfor:
Š overseeing the process of examination and definition of the strategic guidelines for the Company andthe Group, with the assistance of the Executive Deputy Chairman and the Chief Executive Officer;
Š proposing the strategic guidelines, so defined, to the Board of Directors; and
Š overseeing the development of the industrial plans and related implementation processes.
This additional responsibility was in addition to the organizational responsibility for the coordination of theFunctions of Group General Counsel and Corporate and Legal Affairs, Public Affairs and Strategy.
The roles of the Executive Deputy Chairman and the Chief Executive Officer remained as described above.
Committees
One of the most important tools for the management and operational integration of the Group is the CommitteeSystem, which aims at:
Š monitoring the implementation of strategies and the development of plans and results;
Š ensuring the overall coordination of business actions and management of the relative cross-overbusiness issues;
Š building up the necessary operating synergies between the various functions involved in thetechnological, business and support processes; and
Š supporting the integrated development of the innovation processes of the Group.
34

Item 4. Information On The Telecom Italia Group Business
In particular, as of December 31, 2006, the Committee System of the Group included:
Š the Management Committee, which coordinated the Group’s activities and ensured a unitary approachto the development and implementation of business strategies;
Š the Investments Committee, which was entrusted with approving investments that exceeded specificdelegated limits;
Š the Business Reviews Committee for Operations, Media and Olivetti which, for each business segment,analyzed forecasts, results and operating progress and examined the progress made on the mostimportant projects and action plans;
Š the Technological Innovation Committee, which ensured an integrate d approach to innovation andtechnological development processes;
Š the IT Governance Committee, which defined the guidelines for the information strategies of the Group,guided IT strategic decisions and investments consistently with business needs, monitored progress onthe most important IT projects, the quality of solutions and cost effectiveness; and
Š the Risk Management Committee, which ensured the identification, the assessment and themanagement of risks of the Group, coordinating preventive action plans designed to ensure theoperating continuity of the business.
To date, as a result of the new organizational structure, the Committee System of the Group is underre-examination and renewal.
35

Item 4. Information On The Telecom Italia Group Business Units
4.2 BUSINESS UNITS
4.2.1 OPERATIONS
On October 5, 2005, the Board of Directors of Telecom Italia adopted the “One Company Model” organizationalstructure by converging the two previous Wireline and Mobile Business Units into one single unit (Operations).
For purposes of accounting representation, starting from the first half of 2006, Mobile activities have been dividedinto Domestic Mobile and Brazil Mobile.
Operations is organized as follows:
Operations
WirelineDomestic MobileBrazil Mobile
4.2.2 WIRELINE
On a national level, the Wireline Business Unit operates as the consolidated market leader of wireline telephoneand data services for final customers (retail) and other operators (wholesale). On an international level, theWireline Business Unit develops fiber optic networks for wholesale customers (in Europe, in the Mediterraneanarea and in South America) and also offers innovative broadband services in France, Germany and TheNetherlands.
The organizational structure of the Wireline Business Unit as of December 31, 2006 was as follows:
WirelineTelecom Italia Wireline National Subsidiaries International Subsidiaries
Wireline TLC services:
Š Retail telephone
Š Internet
Š Data Business
Š National Wholesale
Loquendo S.p.A.Matrix S.p.A.Path. Net S.p.A.Telecontact Center S.p.A.
BBNED groupLiberty Surf groupHanseNet Telekommunikation
GmbH
Telecom Italia Sparkle group:
Š Telecom Italia Sparkle S.p.A.
Š Latin American Nautilus group
Š Med-1 group
Š Mediterranean Nautilus group
Š TMI group
Š Pan European Backbone
Š Telecom Italia Sparkle Singapore
Š Telecom Italia San Marino S.p.A.
Š Telecom Italia Sparkle of North America Inc.
Š Telefonia Mobile Sammarinese S.p.A.
Š Thinx.sm S.r.l.
Š TIS France S.A.S.
36

Item 4. Information On The Telecom Italia Group Business Units
❖ KEY FACTORS IN ITALY
Š The Wireline Business Unit is focused on encouraging its customers to migrate towards innovativetechnologies which provide access to a new generation of IP services and applications. In 2006, theWireline Business Unit aimed at expanding the penetration of ADSL into the retail broadband marketthrough its range of Alice products offered to consumers, SOHOs (Small Office Home Offices) and SMEs(Small-and Medium- size Enterprises).
Š At December 31, 2006, this strategy had achieved significant success with a broadband retail andwholesale portfolio of 6.8 million broadband points of access (compared to approximately 5.7 millionbroadband points of access at December 31, 2005), of which approximately 5.6 million had been sold toretail broadband customers. Throughout 2006, Telecom Italia’s sales strategy aimed at encouragingcustomers with pay per use rate plans to migrate towards flat rate plans and voice/data bundlepackages. Such plans now constitute approximately half of Telecom Italia’s retail broadband customers.
Š The Wireline Business Unit is continuing to develop new services to offset the decline in traditionalservices. On the Consumer market, the IPTV service was launched with a geographical coverage of 250cities by the end of 2006. In addition, Telecom Italia continued to develop its range of Internet contentand services and its range of advanced telephony such as video-communication and VAS. In thebusiness market, Telecom Italia efforts are focused on offering to its customers ICT solutions, as a toolto promote customer retention and increase revenues.
Š In the traditional voice business, the main strategy has been to increase the penetration of flat voicepackages, to achieve higher retention rates among existing customers and win back customers whohave moved to other service operators.
❖ WIRELINE STRATEGIC BUSINESS AREAS
Š Retail Telephone
Retail telephone services consist mainly of the supply of services using traditional technologies (PSTN and ISDN)and innovative technologies (VoIP). Retail telephone services include: network access, traffic (in terms of minutesand rate plans), hire of telephone equipment and value added telephone services.
Traditional access. In 2006 the new Linea Più package of services was launched. This package is aimed atsustaining the demand for new telephone lines and at increasing the penetration of Broadband and the use ofservices. The new package includes an additional VoIP number, a modem for surfing the Internet, the Tutto 4*services package and free consultation of the 1254 automatic subscriber information service.
For business customers, especially SOHO customers, there was a move towards VoIP lines, with a flat rate fornational calls.
Pricing (rate plans). In addition to activities aimed at increasing the number of flat rate packages, weexpanded our portfolio of pricing plans by extending the concept of “parli per 0 eurocents” to the fixed-mobilesegment. One of such pricing plans, Teleconomy Zero-Zero, enables customers to call or make video calls for 0eurocents a minute, both to fixed and mobile phones with a connection charge when the phone is answered.
We launched rate plans to encourage convergence with the mobile network, with a special promotion of the TeamBusiness and Teleconomy One Office rate plans, which provide subscribers with a free of charge first month.
Products. For the Business customers, the VoIP cordless model of the Aladino was launched, bundled withAlice Business Voice, the new entry level fax Pegaso MMS, and a new range of personal computers.
Š Retail Internet
Retail Internet services consist mainly of ADSL services (connections, traffic, services, equipment and portals) andtraditional Internet traffic (dial-up access).
Internet and VoIP—Alice. We introduced promotions on Alice Free to encourage customers to switch to ADSLby eliminating fixed costs for customers.
37

Item 4. Information On The Telecom Italia Group Business Units
We launched the Unica rate plan, the first integrated TIM-Telecom package, which allows VoIP calls from theWi-Fi connection of Alice inside the home and GSM TIM calls outside the home using a TIM UNICO cell phone.
We launched the double and triple play Alice Tutto Incluso rate plans which, starting at a price of €1 a day, offerscustomers Internet with speeds of up to 20 Mega, unlimited phone calls and video calls from the new Videotelephone and personally selected TV programs. Customers also have the option of buying a “season ticket” forthe TIM Serie A Soccer Championship or a portable PC with zero interest, including installation.
For the Business customers, there is a drive to promote VoIP associated with entry level ADSL to increasepenetration even to customers who do not use the Internet.
We introduced the new “Alice autoinstallante”, which can be installed without any technical assistance.
In October 2006, we provided our customers with a free automatic upgrade for Alice Flat accesses from 640Kbpsto 2 Mb.
Internet and VoIP—Alice business. We promoted VoIP with entry level ADSL to increase penetration andtarget customers who do not use the Internet yet.
In September 2006, we launched Alice Business 20 Mega, the Business rate plan based on ADSL 2+ technology.
We launched promotions associated with Alice Business Flat and 5 FAST, with no subscription charges for the first2 months, Alice Business Sicura with a basic subscription charge of €1/month for the first 6 months, and HDSL inLiberty with no basic subscription charge for the first month on 2-Mb broadband access service.
A new Video service (CCTV—Closed Circuit Television) rate plan is currently being developed.
IPTV. Coverage of the Alice Home TV (IPTV) service was extended to more than 250 Italian towns to enlargethe potential customer base. We also renewed the promotion, offering free installation by a Telecom Italiatechnical expert. At the end of 2006, we had 31,000 customers.
New agreements signed in 2006 expanded the portfolio of “basic” and “premium” content offered to Alice homeTV users. At the end of 2006, Alice home TV programs were being broadcast on 24 channels. The annual moviecatalog includes about 2,500 of the most famous Italian and international movies, of which 500 are available eachmonth on demand, with a monthly update of approximately 200 new titles of movies and TV series.
The commercial offering was enhanced by the upgrade of the access speed to 20 Megabytes and the launch of thenew triple-play “Alice Tutto Incluso” rate plans. The promotion providing the customer with free installation by aTelecom Italia technician was also renewed.
Public Telephone Services. In 2006 there was the launch of the “Mi chiami?” service, which enablescustomers to receive calls from fixed and mobile networks on public phones.
Alice portal was mainly geared at:
Š strengthening the editorial side of the portal by constant monitoring of the content being broadcast andsupplying updates in real time on events of topical importance;
Š implementing services using the web 2.0 logic to encourage customers to participate actively in the lifeof the portal and the creation of content. In this context, the new sections entitled Segnalo and Oknotizie were published and the new Alice video channel was released.
As a result of these actions in 2006, the Alice Portal confirmed its leadership position in Italy among the portals interms of audience (about 2.3 million single visitors on an average weekday—Source: Nielsen/NetratingsSitelensus) and Virgilio Advertising consolidated its leadership in Italy among advertising concession holders inthe field of “Internet Display Advertising” (in 2006 advertising revenues with third-party customers amounted to€23 million, an increase of 36% compared to 2005).
Š Data Business
Data Business services include data transmission and network services for business customers, leased lines,equipment for data services and value added services.
38

Item 4. Information On The Telecom Italia Group Business Units
The Wireline Business Unit offers a broad range of rate plans for data transmission and web application services,supported by a wide spectrum of technological platforms. These range from traditional to advanced platformsbased on broadband access (Synchronous Digital Hierarchy—SDH, the European standard for high-speed digitaland XDSL data transmission).
VAS relating to data are principally represented by web-based, outsourcing and security services.
Data business—Lambda. There was a significant repositioning of the price of the Lambda Wave service withregard to “Long Distance” and “Metro”. New POPs (Point of Presence) were activated to access the service,making it possible to extend the coverage of the new services in cities and over long-distance by more than 30%.
Data business—Hyperway, Datawan and Alice Business. Access technologies were extended for bothprivate Hyperway networks and for Internet access (Alice Business) by standardizing the fiber access solutions viaLambda with speeds ranging from 622 Mbps to 2.5 Gbps; with the launch of the new ADSL2+ profile speeds up to20 Mega, with greater speed also upstream and different values of guaranteed bandwidth.
We launched the first integrated service between broadband IP Fixed/Mobile networks. The new service providessecure access to private MPLS Hyperway networks from mobile handsets through TIM’s dedicated APN (AccessPoint Note) service.
Telephone VAS—Service. We launched the Alice Basic rate plan which provides free registration to e-mail,community and other services offered by the Alice portal. We introduced the Tutto 4* offer free for 3 months onall new installations and renewed the promotion in conjunction with Aladino and Videotelefono products. And forBusiness customers, we offered the Tutto 4* package and the NT1 Plus socket free for 3 months upon purchasingthe Aladino.
Š Wholesale
The Wholesale offering includes national and international services for other operators, both for fixed and mobileoperators and Internet service providers. Services offered to other domestic operators consist mainly ofinterconnection to the Telecom Italia network, in terms of access and traffic (collection, termination and transit),broadband access (ADSL and XDSL) and leased lines. Services offered to international OLOs—Other LicensedOperators—consist mainly of traffic (carried traffic and transits) and data accesses.
National Wholesale
In 2006, the national wholesale market clearly confirmed the trend for the service model whereby other operatorsacquire customers and keep them tied directly to their networks. All the main fixed network OLOs expanded theirpresence at Telecom Italia exchanges and, at the year end, 1,071 exchanges had an average of 3 operators perexchange, and hosted systems which were already operational. The main consequence of these decisions by theOLOs is clearly evidenced by the trends of the two services: the increase in unbundling lines, to which there is apartial and corresponding contraction in “Carrier Preselection” lines, and the reduction in traffic collected throughinterconnection which, compared to 2005, fell by approximately 17%.
The following figures show the main types of customers of the OLOs:
– Local Loop Unbundling (LLU). As of December 31, 2006, approximately 1,705,000 lines wereconnected directly to the networks of other operators, with an increase of approximately 590,000 lines,equal to 53%, compared to December 31, 2005. Similarly, as of December 31, 2006, shared access lines,with which other operators provide ADSL access to Telecom Italia’s telephone customers, wereapproximately 329,000, with an increase of approximately 190,000 lines compared to December 31,2005.
– Broadband Access. As of December 31, 2006, XDSL wholesale accesses acquired by other operatorswere approximately 1,130,000, with an increase of approximately 240,000 compared to December 31,2005.
– Carrier-PreSelection—CPS Lines. At December 31, 2006 the number of accesses configuredtotaled approximately 3,830,000, a decrease of approximately 255,000 compared to December 31,2005, as a result of the migration to LLU.
39

Item 4. Information On The Telecom Italia Group Business Units
International Wholesale
– Voice. In 2006, initiatives designed to support the growth and profitability of Voice traffic continuedto be implemented. As a result, despite competitive pressures with regard to incoming and outgoingtraffic, international transit traffic reported a growth in volumes equal to 524 million minutes (+8.7%compared to the prior year). This result was mainly due to the acquisition of other wholesale customers(112 new interconnections, of which 60% in Voice Over IP) and the consolidation of privilegedcommercial relations with traffic aggregators and with customers/suppliers in Africa, the Middle Eastand Eastern Europe.
In 2006, the amount of outgoing international traffic decreased by 11.0% compared to 2005. Outgoinginternational traffic is mainly concentrated in the following traffic areas and represents about 41% of thetotal number of minutes in 2006: Romania, Germany, Switzerland, France, the United Kingdom, theUnited States, Ukraine and Albania.
Incoming international traffic may be subdivided into two categories: incoming traffic towards fixednetworks and incoming traffic towards mobile networks. In 2006, incoming traffic towards fixednetworks increased by approximately 159 million minutes (+7.8%) compared to 2005, whileinternational traffic towards mobile networks reported a decrease of approximately 225 million minutes(-15.7%).
Attempts to safeguard profit margins were made by:
Š increasing use of VoIP technology (2.5 billion minutes, +67% compared to the prior year) with aconsequent reduction in unit costs;
Š altering the mix of traffic by favoring destinations with higher unit margins (i.e. 20 newinterconnections with mobile operators out of a total of 50 at the end of 2006).
The table below shows incoming and outgoing international traffic for the periods indicated (includingdirect dial and operator assisted calls and mobile traffic).
2006 2005
Outgoing traffic (millions of minutes) . . . . . . . . . . . . . . . . . . . . . . . . . . . . . . . . . . . 3,717 4,176Š Percentage change in outgoing traffic (%)(1) . . . . . . . . . . . . . . . . . (11.0) 4.7
Incoming traffic (millions of minutes) . . . . . . . . . . . . . . . . . . . . . . . . . . . . . . . . . . 3,414 3,480Š Percentage change in incoming traffic (%)(1) . . . . . . . . . . . . . . . . . (1.9) 1.0
Traffic in transit (millions of minutes) . . . . . . . . . . . . . . . . . . . . . . . . . . . . . . . . . . 6,575 6,051Š Percent growth in traffic in transit (%)(1) . . . . . . . . . . . . . . . . . . . . . 8.7 11.0
(1) Percentage of growth in traffic compared to the prior year.
– Data/IP. In 2006, the Data/IP market again reported substantial growth of bandwidth sold comparedto 2005: an increase of 62.4 Gbps of IP bandwidth (or 71.4%), and an increase of 273.7 Gbps ofmanaged bandwidth (or 68.4%).
This phenomenon offset the trend of lower prices, allowing an increase in revenues generated byinnovative wholesale services of approximately 18% compared to 2005.
Š European Broadband Project
In 2003, Telecom Italia began its “International Broadband” project, and has since created an offering ofinnovative access and Broadband services in France, Germany and The Netherlands through the subsidiariesTelecom Italia S.A.S., HanseNet GmbH and BBNed N.V..
– France. In 2006, Telecom Italia S.A.S., a subsidiary of the holding company Liberty Surf Group S.A.,extended its coverage of service to 184 new LLU sites (open to delivery; new ready for service (RFS)sites number 266) bringing the total number of sites ready for delivery to 415 at December 31, 2006. Tosupport the increases in coverage of LLU areas and Broadband traffic during 2006, it proved necessaryto extend the IP network by introducing 40 new POPs.
40

Item 4. Information On The Telecom Italia Group Business Units
The main services achievements in 2006 were the following:
Š increase in the VoIP platform;
Š introduction of Business Voice services to the platform;
Š IPTV (content provider for IPTV service (TPS) free bouquet);
Š Alice–Pro Micro Business;
Š Broadband to Broadband services (B2B).
– Germany. During 2006 HanseNet extended LLU coverage to 100 more exchange areas and launchedits wholesale service (broadband+voice) with Telefónica and QSC (another telecom operator) in 948areas.
As a result, at December 31, 2006, 594 sites were open to the LLU offering (an increase of 100 areassince December 31, 2005) whereas 948 sites were open to the wholesale offering.
During the year 2006, a due diligence was conducted with regard to the acquisition of the broadbandand narrowband customer portfolio of AOL Germany. The transaction closed in February 28, 2007following authorization received from the European regulatory authority.
The following were the main achievements in 2006:
Š introduction of IP Digital Subscriber Line Access Multiplexer (IPDSLAM) and Coarse WaiveDivision Multiplexer (CWDM) to support the significant use of IPTV and VOD in the Hamburg area;
Š introduction of the VoIP Italtel platform to manage wholesale customers;
Š Vdsl2+ (a high-speed evolution of ADSL Service) trials at 4 sites in the Hamburg area;
Š reorganization of the voice platform using an architecture which will manage customer growth in2006 and in the following years in a more flexible way (separation of the level of access from thelevel of transit / interconnection with other networks).
– The Netherlands. The Dutch market has reached the highest level of broadband penetration in theEuropean Union (70%). Within the DSL market KPN through a series of ISP acquisitions (the mostrecent being that of Tiscali Netherlands last September), consolidated its dominant position, reaching amarket share of 73%.
During 2006, the aggressive strategy on the part of KPN resulted in a contraction of about 10% ofBBNed’s customer base.
In an effort to counter this trend, in 2006, BBNed launched a Fiber offer for business customers(approximately 7,700 customers). The acquisition of the ISP InterNLNet is currently being assessedwith the aim of extending the Fiber offering to the residential market.
41

Item 4. Information On The Telecom Italia Group Business Units
❖ CUSTOMERS AND LINES
The table below sets forth, for the periods indicated certain statistical data of Wireline.
As of and for the year endedDecember 31,
2006 2005 2004
Statistical Data:Wireline:Fixed network connections in Italy (thousands)(1) . . . . . . . . . . . . . . . . . . . . . . . . . . . . . . . 23,698 25,049 25,957Physical accesses (Consumer + Business) (thousands) . . . . . . . . . . . . . . . . . . . . . . . . . . 20,540 21,725 22,395Voice pricing plans (thousands)(2) . . . . . . . . . . . . . . . . . . . . . . . . . . . . . . . . . . . . . . . . . . . . . . 6,468 6,321 5,883Broadband Accesses (thousands)(3): . . . . . . . . . . . . . . . . . . . . . . . . . . . . . . . . . . . . . . . . . . . . 8,660 7,020 4,430Š Domestic (thousands) . . . . . . . . . . . . . . . . . . . . . . . . . . . . . . . . . . . . . . . . . . . . . . . . . . . . . . 6,770 5,707 4,010Š European, other than domestic (thousands) . . . . . . . . . . . . . . . . . . . . . . . . . . . . . . . . 1,890 1,313 420Alice page views —ex-Virgilio (millions) . . . . . . . . . . . . . . . . . . . . . . . . . . . . . . . . . . . . . . . . . 13,283 9,842 7,902Alice (ex-Virgilio) average monthly single visitors (millions) . . . . . . . . . . . . . . . . . . . . . . 19.1 15.7 13.9Network infrastructure in Italy:Š Access network in copper (millions of km—pair) . . . . . . . . . . . . . . . . . . . . . . . . . . . . 105.7 105.2 105.2Š Access network and transport in optical fibers (millions of km of optical
fibers) . . . . . . . . . . . . . . . . . . . . . . . . . . . . . . . . . . . . . . . . . . . . . . . . . . . . . . . . . . . . . . . . . . . . . 3.7 3.7 3.7Network infrastructure outside Italy:Š European backbone (km of optical fibers) . . . . . . . . . . . . . . . . . . . . . . . . . . . . . . . . . . . 51,000 51,000 39,500
(1) Data exclude internal lines.
(2) Number of contracts; data include Teleconomy, Hellò and other Business voice offers.
(3) Number of contracts.
As of December 31, 2006, the Wireline Business Unit had approximately 23.7 million fixed subscriber linesincluding approximately:
Š 16.1 million residential lines (including ISDN equivalent channels);
Š 7.5 million business lines (including ISDN equivalent channels); and
Š 180,000 Public Telephones connections (including ISDN equivalent channels).
As of December 31, 2006, the Wireline Business Unit had approximately 5.1 million ISDN equivalent lines. Thecontinuing decline in the number of PSTN connections can be attributed to the gradual increase in ADSL lines,which provide greater speed on the Internet, as can be seen from the significant growth in broadband access.
❖ TRAFFIC AND TARIFFS
The table below sets forth, for the periods indicated, certain traffic data for Wireline.
Year ended December 31,2006 2005 2004
Wireline total traffic (Retail and Wholesale) (billions of minutes) . . . . . . . . . . . . . . . . . 173.8 185.1 192.0of which:Domestic(1) . . . . . . . . . . . . . . . . . . . . . . . . . . . . . . . . . . . . . . . . . . . . . . . . . . . . . . . . . . . . . . . . . . . . 160.1 171.3 179.1International(2) . . . . . . . . . . . . . . . . . . . . . . . . . . . . . . . . . . . . . . . . . . . . . . . . . . . . . . . . . . . . . . . . . 13.7 13.8 12.9
(1) Data include total retail traffic (international outgoing traffic excluded) and total domestic wholesale traffic. Data exclude the traffic ofNuova Tin.it and Matrix.
(2) Data include international retail outgoing traffic and total international wholesale traffic.
Domestic Fees and Tariffs. Since November 1, 1999, our traffic tariffs have been based on a per secondbilling system (TAT), with an initial fixed charge which varies depending on the type of call made (local, national,fixed-mobile, international) and a charge per second which, in addition to the type of call made, also varies
42

Item 4. Information On The Telecom Italia Group Business Units
according to the time of day and day of the week when the call is made. Since December 1997, we haveintroduced rate plans, aimed at the residential and business customers, which provide for discounts on nationaland international traffic against payment of an extra subscription charge.
Rate plans mainly consist of offers such as Teleconomy or Hello for the retail market and SOHO customers.Customized offers are provided to business customers.
For business customers, special offers have been introduced for companies with high volumes of traffic, allowingcompanies to choose from a wide range of rate plans.
Domestic Tariff Rebalancing. We commenced rebalancing our tariffs in 1991 and made various adjustmentsuntil 1997. The National Regulatory Authority has been responsible for tariff regulation since December 1998 andon July 28, 1999 introduced a price cap mechanism designed to promote productivity and efficiency for theTelecom Italia Group, as the incumbent operator in markets with a low level of competition. The price cap is aformula that limits the incumbent’s ability to modify the overall level of its prices. The formula is defined asRPI-X, where RPI is the Retail Price Index and X is a pre-defined level of efficiency fixed by the NRA. Therefore,RPI-X is the average percentage variation which the incumbent can apply to its prices. In real terms, at a givenlevel of inflation, RPI, the incumbent is obliged to reduce its prices by X. The higher the level of X, the greater theobligation to reduce prices. If the incumbent wants to maintain the same marginal return with lower prices, it isobliged to increase its efficiency (by a level of X). The price cap mechanism may also be used as a sub-cap, e.g.,as a price cap on service(s) of particular importance. For example, if the NRA did not want a raise in monthlyrental fees, then this would be achieved by setting a sub-cap of RPI-RPI for monthly rental fees.
The price cap was applied until December 31, 2002 to a whole basket of public voice telephone servicescomposed of activation fees, basic subscriber charges, local and long distance calls and international tariffs.
On July 23, 2003, the NRA introduced a new price cap mechanism, also referred to as a “safeguard cap”, whichwas intended to control the maximum prices we could charge for voice services for the four year period 2003-2006. In 2003 the NRA identified three separate baskets:
Š access;
Š local and long distance calls; and
Š fixed to mobile traffic, limited to the fixed call segment which is retained by Telecom Italia (the“Retention segment”).
Furthermore, for the “access” basket a sub-price cap for residential subscription charges was also established.
The basket of public voice telephone services includes one-off fees, monthly fees, domestic and fixed to mobilestandard tariffs.
In accordance with the Price Cap mechanism, during 2006, we introduced the following rate plan changes:
Š an increase of €153.2 million in “access” charges for business customers which represents an increaseof 8.5% for this segment of customers, even though this increase is only equivalent to 3.4% whenviewed from the standpoint of the access segment as a whole (residential + business);
Š a reduction in fixed-mobile rates with the consequent reduction of the amount retained ofapproximately €20.7 million (equal to a reduction of 4.1%).
The same price cap mechanism is applicable in 2007.
❖ INTERCONNECTION WITH OTHER OPERATORS
On March 22, 2003, the NRA approved the introduction of the Network Cap mechanism to regulateinterconnection charges until the end of 2006. The mechanism regulates the amounts which operators must payTelecom Italia if they use our network to offer their telecommunications services. Beginning with the 2003 BasicOffering (“RO”), the market has gained greater transparency with regard to interconnection services, allowingother operators to base their business plans on stable, pre-established economic values.
43

Item 4. Information On The Telecom Italia Group Business Units
With respect to LLU and with reference to Order (4/06/CONS) on market No. 11, on March 3, 2006 Telecom Italiapublished its new RO on Local Loop Unbundling (including shared access). We currently apply an LLU price of€8.05/a month, the lowest in Europe and significantly lower than the retail price of access. Regardingimplementation, the Italian LLU market reported the fastest growth in Europe, with about 1,705,000 unbundledlines activated at December 31, 2006 (Italy is in second place after Germany where LLU was started about twoyears before), representing an increase of about 590,000 lines compared to December 31, 2005.
In addition, Telecom Italia has the most detailed and complete LLU offering in Europe (physical LLU, sub loopunbundling, shared access and different ways of collocation) and has satisfied all the NRA’s requirements in termsof making available sites requested by other OLOs. During 2006, the OLOs increased their use of the shared accessservice and 329,000 lines were activated by the end of the year.
Since January 2005, we adopted a series of extraordinary and temporary measures for the two-year period 2005-2006 for broadband access, dedicated to transport and wholesale network infrastructure services with the aim offurther promoting competition.
On July 3, 2006, the NRA approved the 2006 RO published by Telecom Italia on October 28, 2005. For LLUservices, the approval was valid until March 2, 2006 as we published a new 2006 RO on March 3, 2006.
At December 31, 2006, the NRA had not yet approved our new 2006 RO.
The 2006 RO includes the conditions for the FRIACO (Flat-Rate Internet Access Call Origination) service, partiallines, shared access and subloop unbundling, fostering competitive growth of Internet access and broadbandservices:
Š FRIACO: the service has been offered since 2001;
Š Partial circuits: represent partial circuits from customer premises to the OLO’s POP (Point Of Presence),as a segment of an end-to-end leased line;
Š Billing and bad debt service: Telecom Italia must also offer billing services to OLOs who decide not tobill their customers (i.e. customers are connected to the network through indirect access service)accessing their toll-free numbers. Telecom Italia, as required by the NRA, fixed the charging level forthe billing service at 2.9% calculated on the total revenues of each OLO’s toll-free service. With respectto bad debt, the level of risk and insolvency is subject to negotiation between Telecom Italia and theOLOs. In Resolution No. 1/05/CIR, the Authority specified the need to create a special procedure forcalculating the value of invoicing for non-geographical services. Since the NRA has not created such aprocedure, despite numerous demands on the part of Telecom Italia, following the expiry of theadministrative terms for the creation of the above-mentioned procedure, Telecom Italia announcedthat, for the year 2006, the value of the invoicing service will be fixed at 9.1%, a figure taken from theresults of the Regulatory Accounts for fiscal year 2004.
In 2006, Telecom Italia presented its separate Regulatory Accounts for fiscal year 2005.
In compliance with Recommendation No. 2003/497 and with the Electronic Communications Code (LegislativeDecree 259 dated August 1, 2003), on May 19, 2004, the NRA started public consultations with regard to the 18significant markets identified in the Recommendation and in articles 18 and 19 of the Code. These marketanalyses were completed during the course of 2006.
In 2006, we signed or renewed the following contracts with operators:
Š 3 interconnection agreements;
Š 4 supplementary “reverse” agreements, termination on the network of another operator;
Š 17 agreements to supply high speed access through xDSL technology;
Š 3 carrier preselection contracts and 5 number portability contracts;
Š 4 contracts for the shared access service on the local network and 5 LLU contracts;
Š 7 contracts to supply Digital Data Circuits or partial circuits;
Š 5 agreements for fiber optic infrastructures.
44

Item 4. Information On The Telecom Italia Group Business Units
❖ MARKETING AND DISTRIBUTION
The sales structure of Telecom Italia is organized according to a vertical, multi-channel approach, in whichdifferent types of channels are specialized in different customer segments of the market. This approach rewardsthe focus and customization of the channel-offering-market mapping.
The top 20,000 customers benefit from direct supervision with almost 500 sales accounts, each one of which hasa dedicated portfolio to supervise and develop over the whole range of the offering: fixed, mobile, telephone,data, ICT services and products.
All other customers (both business and consumer) are managed by indirect commercial channels, with a total ofapproximately 300 partners (external sales firms working for Telecom Italia), employing 2,400 commercial staffand 5,000 telephone operators, handling approximately 2,000,000 contracts a year. Selling techniques range fromsale through physical consultancy to sales by phone through the outbound network.
The main channels are:
Š the “Telesales” channel: an “Outbound” network of about 40 partners with more than 4,000 operatorswho are assisted by about 200 internal resources, which focuses on volume acquisitions (for example,pricing offers, ADSL);
Š the “Agent Sale” channel: a territorial network of about 35 partners and 800 agents (commercial staff),which focuses on volumes, and is directed towards the Consumer market supervised according to a listand “door to door” supervision;
Š the ET—Export Team channel: a territorial network of 6 partners with approximately 500 agents and500 employees that sale by telephone, which focuses on the development of the SOHO segmentthrough offers with regard to pricing, ADSL and products, geared mainly to commercial businesses,small professional firms and SOHO;
Š the BP—Business Partner channel: a network of about 110 partners and 800 agents organizedgeographically, which focuses on supervising SME (Small and Medium-size companies), thedevelopment of broadband, and the sale of products;
Š the VAR—Value Added Reseller channel: a territorial network with about 65 partners and 180Commercial Staff, which focuses on the development of VAS, the customized offering and complexnetworks;
Š the “Public Telephone” channel: a network of about 40 partners focusing on national and internationalprepaid card services and associated traffic packages.
In addition to these partners, there is the “pull” channel, consisting of the retail network of shops, dealers, andorganized and specialized large-scale distribution, amounting to a total of about 5,000 retail points of sale.
❖ FIXED NETWORK
Domestic Network
General. Our domestic fixed network consists of 33 gateway areas (each gateway area has two interconnectionpoints which enable information to be exchanged between the fixed and mobile networks) and 628 main localswitches (only for fixed OLOs). Each local switch belongs to only one of the 33 gateway areas. The long-distancefixed network includes 2,300 VC4 (equivalent to 188,000 2-Mbps circuits), 56 2.5-Gbps point-to-point lambdasand 36 10-Gbps point-to-point lambdas for a further 3,200 VC4 equivalents (whose effective transported band isequal to approximately 120 Gbps). The fixed distribution network includes 105.7 million km of copper pairs.
45

Item 4. Information On The Telecom Italia Group Business Units
At December 31, 2006, the domestic fixed network consisted of the following:
Exchange areas . . . . . . . . . . . . . . . . . . . . . . . . . . . . . . . . . . . . . . . . . about 10,400Switching areas . . . . . . . . . . . . . . . . . . . . . . . . . . . . . . . . . . . . . . . . . 628 Urban Group Stages (SGU)Gateway areas . . . . . . . . . . . . . . . . . . . . . . . . . . . . . . . . . . . . . . . . . . 33Copper access network . . . . . . . . . . . . . . . . . . . . . . . . . . . . . . . . . . 105.7 million kilometers-pairFiber optic access network . . . . . . . . . . . . . . . . . . . . . . . . . . . . . . 430,000 kilometers-lineFiber optic carrier network . . . . . . . . . . . . . . . . . . . . . . . . . . . . . . 3.24 million kilometers-lineLong Distance VC4 . . . . . . . . . . . . . . . . . . . . . . . . . . . . . . . . . . . . . . 2,300Long Distance Lambda . . . . . . . . . . . . . . . . . . . . . . . . . . . . . . . . . . 56 2.5 Gbps, 36 at 10 GbpsNetwork for direct digital circuits (PARD) . . . . . . . . . . . . . . . . 339,000 access points with speed up to 2 Mbit/sNetwork for direct analog circuits (PARD) . . . . . . . . . . . . . . . 86,000 access pointsFrame Relay Accesses . . . . . . . . . . . . . . . . . . . . . . . . . . . . . . . . . . . 85,000 gates at 2Mbit/sPOP main data networks . . . . . . . . . . . . . . . . . . . . . . . . . . . . . . . . 32
SDH and ATM. We introduced SDH transmission technology into operation in the long distance fixed networkin 1996 and introduced such technology into operation for our local fixed network during 1997. Thesetransmission systems are operating on fiber optics from 155 Mbit/s up to 10 Gbit/s. Work on the development ofthe national network (Long distance) which, by use of the latest generation of SDH technologies and the opticalDWDM technology (Dense Wavelength Division Multiplexing) constitutes the basis for the transport network witha high transmission capacity capable of covering the entire Italian territory, continued during 2006. In order toreduce the number of fibers used, DWDM systems have been used to multiply by a factor of 12 up to 40 theavailable optical fiber band and the current transmission capacity, thus increasing the transport capacity of theconnections. In November 2002 Wireline introduced a new generation of Optical Digital Cross Connect on thedomestic wireline transmission backbone in order to progress with the transition from a national network basedon a SDH rings architecture, towards the new generation of meshed ASTN (Automatically Switched TransportNetwork) optical backbone which started in 2003, continued during 2005 connecting over 31 cities (all the majorcities of Italy) and continued through 2006 (adding a further 38 nodes). By using the ASTN approach it is possibleto build a multiservice platform with a high level of integration with the IP network.
The evolution of the transport network towards a completely optical network will make it possible to increase theoperating capacity for all types of traffic, from voice to Internet.
ATM switching technology, introduced in 1996, allows the transfer of information combining data, video, voiceand other services on public and private networks both at a national and international level. Telecom Italia’s ATM/Frame Relay networks that work together as a multiservice network, using SDH transmission systems as aphysical layer. The ATM Network allows for the provision of ATM native services with access rates ranking from2Mbit/s up to 155 Mbit/s. It also acts as a backbone for both the Frame Relay Access network (with access ratesranking from 64 kbit/s up to 2 Mbit/s), and for the DSL (Digital Subscriber Line) Network, used for theprovisioning of xDSL services (ADSL High-bit-rate Digital Subscriber Line or HDSL) and SDSL. The ATM/FrameRelay networks allow customers to access IP and MPLS services (Multi Protocol Label Switching) with accessspeeds of between 64 kbit/s to 155 Mbit/s.
OPB (Optical Packet Backbone). In 2006 the first phase of the construction of the OPB network wascompleted. This network will be used for Internet traffic of residential customers and for VPN (Virtual PrivateNetworks) for business customers.
OPM (Optical Packet Metro). An OPM was installed in 2006 in 30 metropolitan areas to collect flows to andfrom residential customers through DSLAM IP to supply the IPTV service. The OPB network is also used forbackhauling UMTS through the GBE (Gigabit Ethernet) concession, a first generation ROF (Radio Over Fiber).
Gigabit Ethernet Access. Work continued on construction of the network to support the marketing of servicesbased on Gigabit Ethernet technology (the Ethernity, Hyperway and Genius services on GBE optical access). 390new GBE access points were installed, bringing the overall number to approximately 2,070 accesses. In 2006,coverage of services with GBE optical access was extended to the towns of Cuneo and Novara. As a result, overallcoverage increased from 24 to 26 towns in Italy.
46
Item 4. Information On The Telecom Italia Group Business Units
Network quality and Productivity. In 2006, porting of all the OSS systems on OPEN platforms wascompleted, thus reducing running costs. In addition, the work of integrating the systems which supervise thefixed and mobile network began. The platforms for creating services are being reviewed and are scheduled forcompletion in 2007. In 2006, work began to extend the QoS control systems to embrace end to end monitoring.These systems are already active for the mobile network and are being extended for the fixed network.
Broadband/ADSL network. Telecom Italia’s broadband network can offer hi-tech telecommunicationsservices and multimedia applications. This objective is being reached through the gradual installation of fiberoptic cables. In 2006, the commercial services offering access to ADSL for residential customers, businesscustomers and Internet Service Providers were extended to 4,650 towns (compared to 3,800 at the end of 2005).Commercial services for the business sector include using ADSL in urban areas to access the IP and ATM servicessupplied by data networks. Services for ISP include the supply of ATM accesses with ADSL access to the public,leaving the ISP to handle relations with the customer. At the end of 2006, 5,630 local switching areas werecovered by ADSL technology, (compared to 4,500 at the end of 2005).
Fiber optic cables. At December 31, 2006 approximately 3.7 million kilometers of fiber optic cables have beeninstalled for access and transport, of which approximately 1.2 million kilometers are installed in the long-distancenetwork. Fiber optic cables significantly increase network capacity and make it possible to offer hi-tech servicesbased on the simultaneous transmission of various types of signal, such as voice, data and video. To make theseservices more widely available, introducing fiber optics to the access network is being considered.
VoIP (Voice over IP) Services. The complete digitalization of the network—both the backbone and themetropolitan network—is proceeding towards the distribution network (with ADSL), thus favoring theintroduction of VoIP and other associated services. These services are already available to the business customersand the residential customers who sign up for ADSL. VoIP is regarded as an additional service, the value of which,for the customer, is expressed in having access to a greater number of lines, numbers and terminals. Furthermore,by exploiting extra functions, such as the “presence” and “communities” typical of always-on connection systems,it is possible to have additional revenues. At the same time, the value added perceived by customers contributesto the expansion of broadband and, consequently, increases the benefits resulting from complete digitalization.
IPTV (Internet Protocol TV). “Quadruple play” is regarded as having significant value since customers findthemselves immersed in an environment that can be exploited on several levels and which is able to supply a vastrange of services. IPTV is an important part of this evolution. Tests were conducted in 2004-2005 and, in 2006,the first commercial service was launched. At the end of 2006, the commercial service with access to IP TVtechnology was extended to 258 towns (836 exchange areas). IPTV is seen as one of the pieces in the overalljig-saw which hopes to give each customer the chance to access information in any form, wherever they are, andusing the fixed or mobile networks according to the situation.
Flexible Data Networks. An important part of the network consists of dedicated data lines which are centrallycontrolled from a single workstation. At the end of December 2006, there were approximately 339,000 PARDCDN (Data Network Access Points with Direct Digital Circuits) and approximately 86,000 PARD CDA (Direct AnalogCircuits).
International Network
The Telecom Italia Sparkle network is a fully integrated cross-border backbone, located mainly in Europe, theMediterranean, the U.S.A. and Latin America. Construction of the backbone began in 1997.
Through Telecom Italia Sparkle we offer international wholesale services (Voice, Data and IP) and retail GlobalCorporate Network services for multinational customers using its cross-border backbone, bilateral connectionsand NNIA (Network to Network Interconnection Agreements).
The cross-border backbone integrates 3 regional networks in Europe (PEB), Latin America (LAN) and in theMediterranean basin (MED):
Š PEB (Pan European Backbone). Proprietary fiber optic network—2 fiber pairs, each with 400 Gbit/s—which extends into Europe’s leading industrialized countries: Italy, France, the U.K., The Netherlands,
47
Item 4. Information On The Telecom Italia Group Business Units
Belgium, Germany, Switzerland, Austria and Spain, with a total length of 12,000 km. In 2006, the PEBnetwork was integrated with the network acquired from Tiscali International Network S.A.S. so that itnow also stretches into the Czech Republic, Poland and Slovakia. The overall length of the entirebackbone is 23,500 km. The cross-border services available to wholesale customers are: ManagedBandwidth, IP Connectivity, International Private Leased Circuits (IPLC), Voice services and GRX (GPRSRoaming eXchange for Mobile Operators). The main services available for MNC (Multi NationalCorporate) customers are: IP/MPLS (Internet Protocol/Multi Protocol Label Switching), ManagedBandwidth and Voice services.
Š LAN (Latin American Nautilus). A high-capacity backbone based on an optical fiber ring network, bothland-based and under the sea, with a total length of 30,000 km, including the Miami-New York section.The ring, which has automatic optical traffic protection and a capacity of up to 320 Gbit/s, connects themain cities of South America to Central and North America.
Š MED (Mediterranean Nautilus). A submarine optical ring, with a highly reliable configuration, and atotal length of 7,000 km—6 fiber pairs, 64 lambdas (each one of 10 Gbit/s) per pair of fibers—whichconnects the main markets of the Mediterranean area: Italy, Greece, Cyprus, Turkey and Israel.Currently, the main landing points are Catania, Athens, Chania-Crete, Haifa and Tel Aviv.
The International Network connects more than 400 operators worldwide and extends for more than 434,500kilometers along submarine cables that, from Italy, transport traffic along two major paths: East/West routes(towards the United States, Middle and Far East) and North/South routes (toward Central and Northern Europe)the Mediterranean, split into longitudinal (towards the United States, the Middle East and the Far East) andtransversal traffic routers (towards Central Europe and Northern Europe).
The Backbone was created to provide end-to-end services in strategic areas for Telecom Italia Sparkle: it hasPoints of Presence (POP) in Europe (24 POP), the U.S.A. (6 POP), the Mediterranean (5 POP), South America (9POP) and Asia (1 POP).
The POP in the United States belong to Telecom Italia Sparkle of North America (“TISNA”), a company entirelycontrolled by Telecom Italia Sparkle, which has created POPs in Newark (NJ), New York (NY), Miami (FL), Ashburn(VA), Chicago (IL) and Palo Alto (CAL) to support the offering of IP/Data and Voice services with a networkconnected to the European Backbone and the Backbone in Latin America, Latin American Nautilus.
The services supplied include telephone, IP and Managed Bandwidth services in Europe and in the U.S.A., andManaged Bandwidth and IP services in the Mediterranean and in South America.
The platform for services to MNC (Multinational Corporate Clients) is integrated with the cross-border network.
During 2006, the major international network projects related to:
Š the complete integration of the European network of “Tiscali International Network SAS” (TINet S.a.s.),acquired at the end of 2005, with the Pan European Backbone;
Š new IP POPs in Chicago and Palo Alto, of the subsidiary TISNA, with the aim of increase directinterconnections with U.S.A. Tier 1 locations and content providers; and
Š expansion of capacity and development of new functions for the transmission network (creation ofmeshed architecture).
With the acquisition of TINet’s European network, a network, of approximately 11,500 kilometers, our networkextended its coverage to Eastern Europe and includes diversified fibers made by different suppliers on all the mainsections. In addition, interconnection of the two networks in Milan, Marseilles and Paris was completed, migrationof the running and control functions at the NOC (Network Operation Center) of Telecom Italia Sparkle wascompleted and the management software for implementing a meshed architecture was updated (at least threeseparate fiber routes on all the main POP with automatic circuit rerouting).
Telecom Italia Sparkle is one of the first European operators to implement this kind of architecture on itstransmission network.
48
Item 4. Information On The Telecom Italia Group Business Units
To support the increase in Internet traffic, efforts were made to expand the backbone in Europe, the U.S.A. (newPOPs were opened in Chicago and Palo Alto and a proprietary 10-Gbt/s backbone was built between the previousjunctions and Newark, Miami and Ashburn) and the network’s trans-Atlantic capacity. Meanwhile, in Italy, theconstruction of a second POP was completed in Milan with the aim of increasing the reliability of the IP backbone.
In 2006, significant extensions were made to the POP of Palermo, the landing points in Italy of the new SouthEast Asia-Middle East-Western Europe 4 (“SEA-ME-WE 4”) submarine cable system, activated at the end of 2005.
The system links 15 countries including Singapore, Malaysia, Thailand, Bangladesh, India, Sri Lanka, Pakistan, theUnited Arab Emirates, Saudi Arabia, Egypt, Italy, Tunisia, Algeria and France.
Palermo has become one of the main interconnection junctions between Western Europe and Asia, allowingTelecom Italia Sparkle to meet the demand for greater capacity and services from areas of the world with thefastest-growing economies.
In 2006, the NGN (Next Generation Network) platform was developed further. This has made it possible toimplement the IMS (IP Multimedia Subsystem) architecture. With the NGN platform, which currently managesmore than 300,000 circuits with more than 400 operators, Telecom Italia Sparkle has become the first Europeancarrier to use the IP protocol for its whole international telephone network.
4.2.3 DOMESTIC MOBILE
The Domestic Mobile Business Unit operates through the mobile segment of the Company. On March 1, 2006, TimItalia, the operator of the domestic mobile business was merged with Telecom Italia.
As of December 31, 2006, the Business Unit was organized as follows:
Domestic Mobile
Telecom Italia Domestic Mobile Segment
❖ KEY FACTORS
Š During 2006, the Domestic Mobile Business Unit focused on regaining and stabilizing its market share,which, in recent years, had been eroded by increasing competition from other operators, and onincreasing the penetration of UMTS users within its customer base (in 2006, UMTS customers wereapproximately 4.2 million, almost double the number of customers in December 2005). This strategyenabled the Business Unit to achieve growth in revenues, despite strong pressure from competition andnew regulations (in 2006 termination fees were significantly reduced).
Š In order to strengthen its competitive position on the Italian market, the Domestic Mobile Business Unitadopted a segmented business strategy, approaching specific customer segments (for example the Eliteand Young segments) with dedicated offers in areas where in recent years, the Business Unit hadassumed a weaker position. New rate plans were introduced in the Business segment to stimulateon-net traffic and new flat packages were offered which included voice, messaging and hi-speed dataservices.
Š With respect to technological innovation, the Domestic Mobile Business Unit introduced DVBH (DigitalVideo Broadcasting Handheld) technology (which activates TV services on mobile handsets) and HSDPAtechnology, an evolution of UMTS technology, which allows connection speeds of up to 3.6 Mbps. By theend of 2006, DVB-H had reached about 72% of the population, whereas penetration of HSDPA exceeded32%. This should further stimulate the use of value added services, especially interactive services (forexample Browsing), which, in 2006 increased by more than 20%.
❖ GENERAL INFORMATION ON SERVICES IN ITALY
Domestic Mobile offers a GSM digital service, which commenced operations in April 1995, and uses digitaltechnology and is the standard throughout Europe. GSM generally provides higher quality transmission thananalog service and may be used by customers to make and receive mobile calls throughout Europe and certain
49
Item 4. Information On The Telecom Italia Group Business Units
other countries. Beginning in 2005, Domestic Mobile offered its whole third generation services (based on UMTStechnology) and the advanced second generation services through the EDGE technology. These technologies areinteroperable and permit seamless usage of dual mode handsets linked to UMTS and GSM/EDGE networks. AtDecember 31, 2006, we had 456 active roaming agreements with 196 countries (an increase of 10 newagreements and 3 new countries compared to December 31, 2005) allowing our customers to make and receivecalls abroad. In particular, there were 186 GPRS agreements in 102 countries (an increase of 22 agreements and10 new countries compared to December 31, 2005), 47 3G agreements in 32 countries (with an increase of 18agreements in 8 countries), 120 customized application mobile enhanced agreements or Camel agreements,which allow international roaming for prepaid mobile services in 89 countries (an increase of 16 agreements in 12countries compared to December 31, 2005).
In 2006, Telecom Italia elected to comply with the code of self-regulation with regard to international roamingcharges. This code involves the introduction of an average wholesale charge of €0.45 for calls made within the EU.In addition, to compensate for the negative impact on revenues of the code of self-regulation and to supportinternational wholesale revenues, charges were reviewed, leading to an increase in charges for both SMS and callsmade outside the EU.
As a result, 60 Inter-Operator Tariff discount agreements were signed (valid in 100 countries) to reduce the costsof TIM Roamers abroad.
In May 2007, the EU Parliament approved a regulation which, starting summer 2007, will substantially reduce thecharges for using mobile phone abroad.
❖ CUSTOMERS AND LINES
The penetration of mobile telecommunications service in Italy is above the Western European average atapproximately 139 lines per 100 inhabitants at the end of 2006 compared to a penetration rate of 123.5 lines per100 inhabitants at the end of 2005. Growth rates have been substantially higher than the European average. Theincrease is due to innovative services and an increase in customers with multiple lines and the number ofoperators. The customer base consists of GSM subscribers and customers holding GSM/UMTS TIM Cards (“GSM/UMTS Prepaid Customers”).
At December 31, 2006 the number of GSM and UMTS mobile lines operated by Telecom Italia amount toapproximately 32.4 million (of which 4.2 million are UMTS lines) with a growth of 13.6% compared toDecember 31, 2005. This figure includes 4.3 million GSM subscribers and 28.1 million prepaid lines, which makeup 86.5% of total lines. The TACS service was closed down at December 31, 2005.
The continuous growth of lines shown in the table is mainly due to growth in UMTS services and the gradualavailability of third-generation handsets.
At December 31, 2006 Telecom Italia’s market share calculated on number of lines was at 40.4% compared to40.0% at December 31, 2005. In particular, in 2006, Telecom Italia had a market share of 43% in terms of the netadditions in GSM and UMTS lines, corresponding to about 3.9 million lines.
The number of lines counted by Telecom Italia does not include about 735,000 “inactive” lines.
Average monthly revenues per line (which include total revenues from fees, traffic (domestic and international)and VAS, excluding revenues from the sale of products) declined from about €29.3 in 2005 to about €25.6 in 2006(including revenues from services for non-TIM customers).
50

Item 4. Information On The Telecom Italia Group Business Units
The table below sets forth, for the periods indicated, selected customer data for our Domestic Mobile BusinessUnit.
As of and for the year endedDecember 31,
2006 2005 2004(number of customers
in thousands)Mobile telephone lines in Italy at year-end(1) . . . . . . . . . . . . . . . . . . . . . . . . . . . . . . . . . . . . 32,450 28,576 26,259GSM subscriber lines . . . . . . . . . . . . . . . . . . . . . . . . . . . . . . . . . . . . . . . . . . . . . . . . . . . . . . . . . . . . 4,370 3,186 2,809Prepaid GSM/UMTS Lines . . . . . . . . . . . . . . . . . . . . . . . . . . . . . . . . . . . . . . . . . . . . . . . . . . . . . . . 28,080 25,296 23,226
(in %)Customer growth . . . . . . . . . . . . . . . . . . . . . . . . . . . . . . . . . . . . . . . . . . . . . . . . . . . . . . . . . . . . . . . 13.6 8.8 0.7Churn rate(2) . . . . . . . . . . . . . . . . . . . . . . . . . . . . . . . . . . . . . . . . . . . . . . . . . . . . . . . . . . . . . . . . . . . 16.4 16.9 13.2
(in Euro)Average monthly revenues per line(3) . . . . . . . . . . . . . . . . . . . . . . . . . . . . . . . . . . . . . . . . . . . 25.6 29.3 29.9
(1) Includes Prepaid Customers and excludes the “inactive” lines. Also includes 25,000 and 52,000 TACS subscriber lines as of December 31,2005 and 2004, respectively, while TACS prepaid lines were 69,000 and 172,000 as of December 31, 2005 and 2004, respectively.
(2) The figures refer to the total number of lines. The churn rate for a given period represents the number of mobile customers who ceasedto be customers during the period (by choice or due to unpaid bills) expressed as a percentage of the average number calculated on thebasis of the annual numbers of customers during the period.
(3) Includes total revenues from fees, traffic (domestic and not) and VAS, excluding revenues from the sale of products.
❖ TRAFFIC
In 2006, traffic volumes increased by 5.1% in terms of minutes, although revenues from voice services, net of theimpact of new termination list prices, only increased by 3.0% compared to the prior year.
The table below sets forth, for the periods indicated, selected traffic data for our Domestic Mobile Business Unit.
Year ended December 31,2006 2005 2004
(millions of minutes)Total outgoing traffic per month . . . . . . . . . . . . . . . . . . . . . . . . . . . . . . . . . . . . . . . . . . . . . . . . . 2,443 2,314 2,211Total incoming and outgoing traffic per month . . . . . . . . . . . . . . . . . . . . . . . . . . . . . . . . . . 3,730(1) 3,550(2) 3,435(3)
(1) Includes domestic mobile incoming and outgoing traffic (92.8% of total mobile traffic), international traffic (2.2%) and roaming traffic(5.0%). Data includes fixed outgoing traffic to the mobile network.
(2) Includes domestic mobile incoming and outgoing traffic (92.2% of total mobile traffic), international traffic (2.6%) and roaming traffic(5.2%). Data includes fixed outgoing traffic to the mobile network.
(3) Includes domestic mobile incoming and outgoing traffic (93.8% of total mobile traffic), international traffic (2.2%) and roaming traffic(4.0%). Data includes fixed outgoing traffic to the mobile network.
❖ MOBILE TARIFFS
Domestic Mobile’s customers (other than Prepaid Customers) are billed in a staggered bimonthly billing cycle. Weendeavor to minimize bad debts by implementing a credit check on each customer at the time of sign-up and byrequiring certain customers to post a security deposit. In addition, if payment is not received, the customer isnotified accordingly and his or her ability to place outgoing calls is interrupted. If no payment is received, allservices are terminated.
Domestic Mobile customers (other than Prepaid Customers) are charged a one-time connection fee, a monthlybasic charge and traffic fees for calls, as well as a monthly government tax. Prepaid Customers are charged aninitial connection fee of €20 for the GSM/UMTS TIM Card and are required to pay a fee ranging from €5 to €1 tothe dealer for each recharge, according to the cost of each recharge (it should be noted that recharging fees wereabolished with the introduction, on March 5, 2007, of the so-called “Bersani Decree”). No other connection or
51

Item 4. Information On The Telecom Italia Group Business Units
subscription fees or taxes are payable by Prepaid Customers. Mobile customers (including Prepaid Customers)must purchase their own mobile telephone handsets. In 2006, approximately 64% of Domestic Mobile revenuesservices were derived from traffic charges (net of access charge), 8% from sales and rental of equipment, 17%from VAS and 11% were miscellaneous revenues (subscriptions and connection fees, including recharge fees).
We offer our customers a variety of tariff packages which are tailored to address different usage patterns andmarket segments (Consumer, SOHO, SME, Enterprise). Such packages include offerings to our GSM/UMTScustomers of “free minutes packages” which are available in various options. We also offer packages such as TIMMenù, a dedicated GSM prepaid card. The customer can choose a rate suited to his or her own needs, combiningthe various items on a menu. The objective is to simplify the service offer and at the same time make it moreflexible.
In 2006, innovative mobile telephone services were developed with the aim of increasing customer loyalty andhigher usage of mobile phones. The main initiatives were:
Š “TIM Tribù”. Launch of the TIM Tribù service dedicated to the young segment of the customers. Thenew rate plan aims to attain a competitive positioning by targeting young people, to educate andencourage them to favor the use of VAS services, and expand the TIM community. This rate plan offersadvantageous charges for calling and sending SMSs within the TIM tribù community. TIM Tribù is notonly a rate plan but also a range of exclusive services for young people. They include the TIM Tribù TAMTAM Push to Talk service, through which all TIM Tribù customers can send voice messages free withinthe TIM Tribù community. In May 2006 Ricarica Alice—Ricarica TIM Tribù was launched with a view tointegrating the fixed-mobile offering. As a result, for €10, a TIM Tribù customer receives €20 of traffic,of which €8 is for surfing the Internet with Alice ADSL and €12 for making calls to friends in the TIMTribù community. In October 2006 we launched a the new TIM Tribù rate plan which eliminates top-upcharges and is the first rate plan which enables customers to be reimbursed for the cost of the top-up,for top-ups of any amount and any channel, by awarding a bonus of voice and SMS credit to spendwithin the Tribù community.
Š TIM Famiglia. The TIM Famiglia package for prepaid users was launched at the end of 2005, and theversion for subscribers followed in February 2006. The rate plan for prepaid users involves reducedcharges for calls and video calls to 3 numbers (2 TIM numbers and 1 fixed-network number) at 1eurocent per minute and an automatic top-up for all calls received from all numbers on the fixednetwork.
Š Relax. This is the new portfolio of Relax rate plans for prepaid users and subscribers. The offerinvolves a UMTS handset at a special price, which can be paid for in installments, phone services, SMSand a VAS component. The aim of the rate plan is to attract customers with a high propensity forconsumption by guaranteeing flat rates and advantageous conditions. Telefono Relax, which is directedat the mass market, and emphasizes the appeal of the telephone, will help to augment customer loyalty,and will have a positive effect on the ARPU.
To speed up the process of acquiring and “locking-in” quality customers, in October 2006, two newfeatures were added to the Relax range, “Relax 15” and “Relax 40”, and new promotions are beingintroduced to the already existing rate plans.
Š TIM Welcome Home. Launch of the TIM Welcome Home rate plan for the ethnic internationalsegment for prepaid customers. This plan offers lower charges for international calls to some “ethnic”countries, together with a charge of 6 eurocents per minute for domestic calls made within the TIMWelcome Home community. On August 9, 2006, the launch of TIM Welcome Home top-ups forcustomers who signed up for the new TIM Welcome Home profile. Since October 2006, the TIMWelcome Home top-up (physical top-up) has been available at all the TIM POS.
Š 7 su 7 no tax. Launch in October 2006 of the “7 su 7 no tax” rate plan, designed for professionalsand small companies and a new feature of the “7 su 7” product range. The main feature of this serviceis the elimination of the Government Tax Concession of €12.91 per month (excluding VAT). Against amonthly payment of €7 (excluding VAT), “7 su 7 no tax” allows customers to call any numbers on thefixed and mobile networks from Monday to Friday at the cost of 7 eurocents per minute (excludingVAT), plus a connection charge of 15 eurocents. During weekends, all calls are free for the first 5minutes of each single call (after which the charge is 7 eurocents per minute). For all calls to
52
Item 4. Information On The Telecom Italia Group Business Units
numbers included within the same contract, only the connection charge of 15 eurocents (excludingVAT) applies, including the first 15 minutes of the call (after which the call is charged at 7 eurocents perminute).
Š 7 su 7 no cost. This new rate plan, launched in October 2006, enhances the “7 su7 no tax” rate plan.Both have the same charges but, in the case of “7 su 7 no cost”, the monthly subscription charge of €7(excluding VAT) is waived for the first 12 months of the subscription. The offer also gives customers thechance of choosing from a vast range of UMTS telephones.
Š 7 su 7 night and day. This rate plan is also an extension of the “7 su 7” range. By paying a rentalcharge of €19 per month (excluding VAT), customers can call any number on the domestic fixed ormobile network between 9 p.m. and 7 a.m., paying only the connection charge of 15 eurocents(excluding VAT), including the first 5 minutes of the call. After that, there is a charge of 7 eurocents perminute.
But all calls made between 7 a.m. and 9 p.m. are free (only the connection charge of 15 eurocents isapplied) until the customer has clocked up 6 hours per month of conversation for the first 3 months ofsubscription. After that, there is a ceiling of 3 hours per month of conversation. If traffic exceeds theestablished ceiling, the standard charge of 7 eurocents per minute (excluding VAT) is applied.
Š Messaging rate plans. In the summer 2006 we launched the promotion “Carta Vacanze MessaggiRelax”, from May 29 until August 6, 2006. Against payment of €5, customers could obtain a special ratefor SMS (5 eurocents) and MMS (30 eurocents) up to a maximum of 1,000 messages for 30 days to allmobile and fixed numbers. In September, the “TIM ScriviScrivi” service was launched. FromSeptember 12, 2006 until October 21, 2006, customers could send 500 SMS or MMS messages free toTIM and Telecom Italia numbers and all e-mail addresses, against payment of an activation cost of €9.
The “1x100 di TIM” rate plan launched on February 5, 2006 offers a bundle of 100 SMS, 100 MMS and 100video minutes. Each day, after the first text or the first minute of a paid video call, customers receive abundle of free traffic which they can use to send texts or video call any TIM customer within 30 days.
In November 2006, Domestic Mobile launched Alice Messenger, the new Instant Messaging serviceoffered to all Alice and TIM customers, which can be accessed either from fixed or mobile systems, andwhich allows users to communicate in “real time” using PC to PC, PC to mobile, mobile to PC or mobileto mobile. For the time being, the service is available from a mobile to 8 legacy terminals and 11 newterminals which have just become available on the market. After the launch, further developments areplanned to extend the number of compatible terminals and make the service available to other devices.
From a PC it is possible to send or receive text messages fixed and mobile systems, originate andreceive audio and video calls (through the [email protected]) other Alice customers from a PC, andcreate your own list of friends by pulling contacts directly from the centralized address book of theInternet.
From a mobile it is possible to exchange text messages with other TIM and Alice customers. Access tothe seamless service is based on a mobile telephone number.
Š Availability of services. Since August 2006, all TIM customers have been able to use the automaticrecall service with Telecom Italia fixed numbers. The “ChiamaOra di TIM” service for fixed line TelecomItalia numbers enables TIM customers to book a recall even if the fixed number being called is engaged.A TIM customer can either activate the recall option or select the option to receive an SMS alert as soonas the fixed number being called becomes free. This service is free and is automatically activated for allTIM customers.
Š Mobile Number Portability (MNP). In February 2006 we launched a new MNP rate plan with abonus of €250 of free traffic on TIM’s and the fixed network. In May 2006, the value of the bonus wasincreased to €1,000. In October 2006 we launched “SeiTIM”, a special rate reserved for customers whotransfer to TIM through MNP. Sei TIM allows a special rate of 6 eurocents per minute for all domesticcalls, with a connection charge of 16 eurocents, valid for one year.
Š Gross acquisitions, Prepaid. In January 2006 we launched Parli Gratis, a promotional rate of0 eurocents per minute with a connection charge of only 3 eurocents, valid for 30 days and renewablebased on the expense threshold. In June 2006, the rate plan was enhanced by an automatic bonusbased on incoming traffic.
53
Item 4. Information On The Telecom Italia Group Business Units
Š Roaming, Rate Plans. In response to the price reductions required by the European Commission, inDecember 2006, Telecom Italia launched the new “TIM Zero Confini” roaming rate plan which providesits customers with a simple, advantageous rate system for use in the 30 countries of the EU.
By activating TIM Zero Confini, customers can make phone calls and video calls in Europe for 0eurocents a minute, and only have to pay the connection charge of €1 (including VAT).
The charge is also valid for all the calls received while abroad and for the first 5 minutes of every phonecall or video call made in one of the 30 countries, up to a maximum of 100 calls. Any calls made overand above the ceiling imposed will be charged at the normal rates applied to calls made or receivedwhile abroad.
The special rate is valid for 30 days from the date of activation and costs €10 (including VAT). In thecase of MNP, activation is free.
The countries where TIM Zero Confini is applicable are: Austria, Belgium, Bulgaria, Greek Cyprus, theCzech Republic, Denmark, Estonia, Finland, France, Germany, Great Britain, Greece, Hungary, Iceland,Ireland, Latvia, Liechtenstein, Lithuania, Luxembourg, Malta, The Netherlands, Norway, Poland,Portugal, Romania, the Slovak Republic, Slovenia, Spain, Sweden and Switzerland.
Š Super UMTS Hi Speed. On July 3, 2006, Telecom Italia began to market the new small UMTS HiSpeed/HSDPA (High Speed Downlink Packet Access) handsets which allowed access to broadband at aspeed of up to 1.8 Mbps.
In November 2006, this speed was raised to 3.6 Mbps, thus further improving surfing potential andensuring a better quality of service than normal UMTS.
“All inclusive” packages were launched to promote data services using HSDPA technology, includingmobile Internet surfing and hi-speed PC card products (Tutto Relax Internet, Internet Relax):
– Tutto Relax Internet involves the acquisition (at advantageous terms) of a HI speed PC card(€49) and payment by installments for the HW and traffic for 12 months with installments startingat €19.95 per month;
– Internet Relax involves the acquisition (at advantageous terms) of a HI speed PC card (€99) andpayment by installments for the HW (€12 per month); the installments are cancelled if thecustomer decides to activate one of the Web rate plans available (WEB time, WEB facile).
Š DVBH. TIM’s DVBH (Digital Video Broadcasting Handheld) service, TIM TV, is currently available in3,000 towns in Italy, with a coverage of about 69% of the population.
The first handsets to be available were the Samsung SGH-P920, the Samsung SGH-P930 and theBrionvega 7100. The basic TIM TV service offers viewing on 8 channels: Canale 5, Italia 1, La7, MTV,Sky TG24, Sky Sport 24, Sport Italia and Sky Meteo. The monthly cost of activating TIM TV is €5. Theactivation of TIM TV includes the chance to watch the TIM “Serie A” soccer matches and the best ofEuropean soccer for the whole of the 2006-2007 season.
Customers can also choose to purchase a UMTS/DVBH handset through the “TIM TV Telefono Relax”rate plan. With TIM TV Telefono Relax, the customer pays an advance of €199 and a fixed monthlypayment of €10 for 24 months. But if the customer is able to guarantee the monthly activation of TIMTV and a monthly expenditure of at least €25 in domestic calls, the €10 monthly charge is waived.
Another way of acquiring a UMTS/DVBH phone is to select the “TIM TV Tutto Relax” rate plan. TIM TVTutto Relax offers customers the chance to pay an advance of €99 and 24 monthly installments of €1each. In addition, against payment of a monthly charge of €49, the customer benefits from a bundle ofservices. The bundle includes: access to the basic TIM TV service, 1,000 free SMS per month, 1,000minutes of calls and video calls at 0 eurocents a minute with a connection charge of 16 eurocents percall. All prices are inclusive of VAT.
❖ MARKETING AND DISTRIBUTION
At December 31, 2006, Domestic Mobile’s physical distribution network consisted of 4,838 Points of Sale (POS)belonging to 1,685 distribution partners and 35 shops owned by Telecom Italia.
54
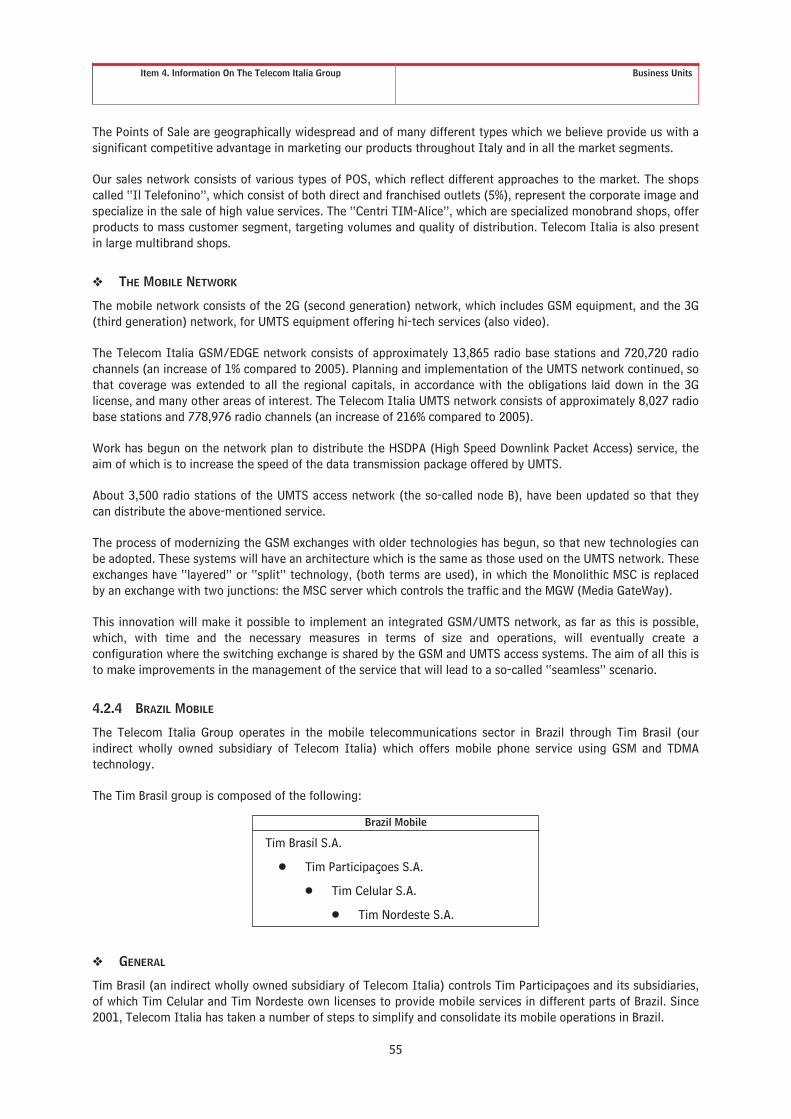
Item 4. Information On The Telecom Italia Group Business Units
The Points of Sale are geographically widespread and of many different types which we believe provide us with asignificant competitive advantage in marketing our products throughout Italy and in all the market segments.
Our sales network consists of various types of POS, which reflect different approaches to the market. The shopscalled “Il Telefonino”, which consist of both direct and franchised outlets (5%), represent the corporate image andspecialize in the sale of high value services. The “Centri TIM-Alice”, which are specialized monobrand shops, offerproducts to mass customer segment, targeting volumes and quality of distribution. Telecom Italia is also presentin large multibrand shops.
❖ THE MOBILE NETWORK
The mobile network consists of the 2G (second generation) network, which includes GSM equipment, and the 3G(third generation) network, for UMTS equipment offering hi-tech services (also video).
The Telecom Italia GSM/EDGE network consists of approximately 13,865 radio base stations and 720,720 radiochannels (an increase of 1% compared to 2005). Planning and implementation of the UMTS network continued, sothat coverage was extended to all the regional capitals, in accordance with the obligations laid down in the 3Glicense, and many other areas of interest. The Telecom Italia UMTS network consists of approximately 8,027 radiobase stations and 778,976 radio channels (an increase of 216% compared to 2005).
Work has begun on the network plan to distribute the HSDPA (High Speed Downlink Packet Access) service, theaim of which is to increase the speed of the data transmission package offered by UMTS.
About 3,500 radio stations of the UMTS access network (the so-called node B), have been updated so that theycan distribute the above-mentioned service.
The process of modernizing the GSM exchanges with older technologies has begun, so that new technologies canbe adopted. These systems will have an architecture which is the same as those used on the UMTS network. Theseexchanges have “layered” or “split” technology, (both terms are used), in which the Monolithic MSC is replacedby an exchange with two junctions: the MSC server which controls the traffic and the MGW (Media GateWay).
This innovation will make it possible to implement an integrated GSM/UMTS network, as far as this is possible,which, with time and the necessary measures in terms of size and operations, will eventually create aconfiguration where the switching exchange is shared by the GSM and UMTS access systems. The aim of all this isto make improvements in the management of the service that will lead to a so-called “seamless” scenario.
4.2.4 BRAZIL MOBILE
The Telecom Italia Group operates in the mobile telecommunications sector in Brazil through Tim Brasil (ourindirect wholly owned subsidiary of Telecom Italia) which offers mobile phone service using GSM and TDMAtechnology.
The Tim Brasil group is composed of the following:
Brazil Mobile
Tim Brasil S.A.
Š Tim Participaçoes S.A.
Š Tim Celular S.A.
Š Tim Nordeste S.A.
❖ GENERAL
Tim Brasil (an indirect wholly owned subsidiary of Telecom Italia) controls Tim Participaçoes and its subsidiaries,of which Tim Celular and Tim Nordeste own licenses to provide mobile services in different parts of Brazil. Since2001, Telecom Italia has taken a number of steps to simplify and consolidate its mobile operations in Brazil.
55

Item 4. Information On The Telecom Italia Group Business Units
In 2006, the Brazilian market continued to expand although at a slightly slower pace than in 2005. At the end of2006 there were 99.9 million lines (53.2% penetration of the population), compared to 86.2 million in 2005(47.2% penetration). The Tim Brasil group reinforced its position as the second-largest operator with 25.4 millionlines, of which more than 90% are GSM. Its market share increased to 25.4% from 23.4% at the end of 2005 andthe gap between the group and the largest operator closed even further (11 percentage points at the end of 2005compared to less than 4 percentage points at the end of 2006). In the last quarter of 2006, Tim Brasil was Brazil’smarket leader in terms of revenues.
These results were achieved due to the leadership of the Tim Brasil group on the GSM market, which, in 2006,grew more quickly as a result of the improvement in the quality of national coverage. In 2006, the strategy of theTim Brasil group focused on:
Š improving Customer Care activities so as to augment levels of loyalty and retention;
Š investing in the brand image to strengthen the group’s leadership position;
Š greater segmentation of the offering to limit the churn rate, especially in high spend segments, andstabilizing the ARPU as a whole;
Š reducing acquisition costs for customers, especially with regard to subsidies for purchasing handsets;and
Š increasing the levels of VAS use, including Data and messaging services by the Business customers.
Lastly, in 2006, Tim Brasil reorganized its corporate structure; this should streamline operations and also lead tomore effective financial management.
❖ SERVICES PROVIDED
In 2006 Tim Brasil extended GSM coverage to 165 more towns in Brazil, bringing coverage to about 160 millionpeople (85% of the total population) to encourage the migration of customers from TDMA to GSM.
At December 31, 2006 the total number of customers (source KPI Network) was 25.4 million, of which23.1 million used the GSM technology and 2.3 million used TDMA technology.
During 2006, 557 new GSM Base Transceiver Station (BTS) were introduced to the network, bringing the total to8,903 (the number of TDMA BTS remained almost constant at 2,362), 10 Base Station Controller (total equal to133), 5 Mobile Switching Center (total equal to 55) and 3 HLR (total equal to 14).
The main initiatives during 2006 also involved:
Š the introduction of the split architecture to extend the GSM Core Network;
Š launch of the COPA (Home Zone) service: calls originated within a local area and terminated with fixednumbers within the same area are managed on the basis of a differentiated charging system;
Š the optimization of existing leased lines, leading to a reduction of operating costs;
Š extension of the NGN IP backbone to support Long Distance traffic.
❖ MARKETING AND DISTRIBUTION
In 2006, the services of the Telecom Italia Group in Brazil were marketed through the country’s largestdistribution network, consisting of about 8,500 Points of Sale (“POS”) dedicated to retail customers. In terms ofcomposition, 8% of these POS are owned or franchised shops and 29% are owned by exclusive dealers. Theremaining 63% are multi-brand POS of organized large-scale distribution, a channel which focuses on providing anadequate level of representation throughout the territory covered by the company’s mobile services. Furthermore,again with respect to the retail channel, the company relied on more than 250 thousand POS to provide top-upservices.
With regard to the business segment, in 2006, the company had more than 150 direct exclusive sales outlets forlarge companies (Key Account Managers) and a network of more than 600 partner agencies (Tim BusinessPromoters) dedicated to small and medium-size companies.
56

Item 4. Information On The Telecom Italia Group Business Units
4.2.5 MEDIA
The Media Business Unit operates in the following segments:
Š the Television Business Area operates in the sector of producing and broadcasting content throughthe television broadcasting networks (La7 and MTV) operated under concession nationally and throughdigital networks, and in the marketing of advertising space in TV programming. It also operates as atelevision broadcasting network operator using analog and digital technology. Furthermore, Televisionmanages satellite channels and pay-per-view services using Digital Terrestrial TV (DTT);
Š the News Business Area operates through TM News, a leading national news agency with a markedinternational connotation. It was conceived as the result of a partnership with Associated Press (AP)and provides news on a 24 hour basis as well as analyses, special reports, and regular reports from itsoffices in Rome and Milan and from abroad: Brussels, New York and Budapest.
As of December 31, 2006, the Business Unit was organized as follows:
MEDIATelevision News
Telecom Italia Media S.p.A.Telecom Italia Media Broadcasting S.r.l.MTV Italia S.r.l.MTV Pubblicità S.r.l.
Telecom Media News S.p.A.
❖ KEY FACTORS
The sale of Gruppo Buffetti and the merger of La7 Televisioni S.p.A. with Telecom Italia Media S.p.A., in January2006, completed the process of rationalizing the activities of the Telecom Italia Media group which began in2005. As a result of this reorganization process and the important capital expenditures program implemented inthe prior year, Telecom Italia Media has strengthened its position on the media market and intends to seize theopportunities offered by the rapid evolution of new platforms (Digital Terrestrial TV, DVB-H (Digital VideoBroadcasting-Handheld), IPTV (Internet Protocol TV), etc.), consolidating its identity as a multimedia, multi-platform operator, having carved itself a reputation as one of the most dynamic operators on the Italian market.
❖ TELEVISION
Š Digital Terrestrial Television
Television manages pay-per-view services using Digital Terrestrial Television (DTT).
During the new Serie A return soccer championship in Italy, the commercial Digital Television offering“La7 Cartapiù” continued to broadcast events of 10 of the 20 Serie A teams, either singly or as apackage. At December 31, 2006 approximately 1,066,900 “La7 Cartapiù” had been put into circulationand about 65% of them had been sold.
June 2006 saw the launch of the “Estate Musica” offer, a new series of concerts by important Italianartists, which can be acquired singly or as a 30-day package.
During 2006, the pay-per-view service was further improved and extended both by introducing stereosound and dual sound (enabling customers to choose a different commentator to the one offered by themain channel) and the launch of the interactive “t-betting” application, pursuant to which owners ofSNAI Cards can bet on all the Serie A soccer games by tuning in to the La7 Cartapiù and La7 Sport TVchannels. The number of points of sale selling the smart cards increased, with the new tobacconist andnewsagent channels. Communication activities on La7 Cartapiù continued: an “autopromo” campaign onthe analog La7 channel and the digital La7 Cartapiù channels, in the sports sections of daily newspapersuntil the end of the soccer championship, and a poster campaign in the largest Italian cities.
Š La7 Free to Air
La7 provides news information on a 24-hour basis.
During the first half of 2006, the audience for La7 seemed to be mainly interested in information,analysis and political discussion in the period running up to the elections in April 2006. In January and
57

Item 4. Information On The Telecom Italia Group Business Units
February 2006, the network’s average audience share was 2.9%, an increase of 13% compared to thesame period in 2005. The credibility and style of programs broadcast by La7 have become a benchmarkfor an ever-wider audience which particularly favored its early-morning news and talk show programs(Omnibus and Omnibus W.E.), the usual programs broadcast in the evening such as “Otto e mezzo” and“L’infedele” and the various editions of the News.
In the spring 2006, the increase in the audience share was even more significant with an average of3.1% (+19% compared to 2005). Contributors to the increase in the evening audience share includedthe talk show “Le Invasioni Barbariche”, which confirmed the success of the previous year, and the talkshow “Crozza Italia”.
During the summer period of July and August 2006, the average audience share reached 3.2% with anaverage growth of 16% compared to 2005, and an increase of 26% for the daytime segment.
The autumn program schedule contained several novelties in the field of information and realtainment,sport, programs with a scientific slant and fiction. In 2006 La7 reached a 3% average daily share,continuing the growth trend seen in previous years; in 2006, after peaking in the summer, the figure fellto 3% in the last three months of the year, against a backdrop of intense competition starting inSeptember.
Š MTV
MTV Italia is a television channel broadcasting music programs on a 24-hour basis. The MTV brand is awell known in the music industry and in the television network business.
During 2006 MTV maintained its leadership position in audience share with 8,850,000 daily contacts, anincrease of 5% compared to the previous year and 15.8 million weekly contacts and has been makingconstant progress since 2001, according to Makno & Consulting’s Television System Observatorypublished in May 2006.
The positioning of music, the network’s core business, was further enhanced by two new programs: OurNoise (an hour of music looking at the most interesting new releases) and the charts program MTV 10of the Best.
❖ NEWS AREA
TM News is a national news agency operating on a 24-hour basis. It operates under the APCom brand. The mainRome office is supported by the editorial office in Milan and correspondent offices in Brussels, Budapest and NewYork. Its position is strong with regard to international coverage and quality (editorial standing) and quantity(average daily production of more than 900 news items) of its journalistic production.
In June 2006, the News area renewed its exclusive contract for Italy until 2010 with the Associated Press, whosenews the channel translates into Italian and then distributes. It now has an updated logo which is a graphicrepresentation of the partnership, and the offering of news bulletins has been further enhanced. The process ofupdating the production and distribution platforms continues in order to industrialize the multi-platformmanagement of printed and multimedia content.
4.2.6 OLIVETTI
The Olivetti Business Unit (which changed its name on April 5, 2005 from Olivetti Tecnost to Olivetti) operates inthe Office Products Division in the sector of ink-jet products for the office, digital printing systems and thedevelopment and production of products associated with silicon technology (ink-jet print heads and MEMS), andalso specialized applications for the banking field and commerce and information systems for gaming andlotteries. The reference market of the Business Unit is focused mainly in Europe and Asia.
58

Item 4. Information On The Telecom Italia Group Business Units
As of December 31, 2006, the Olivetti Business Unit included the following companies:
OLIVETTI
Olivetti S.p.A.
Š Olivetti I-Jet S.p.A.
Š Olivetti International B.V.(foreign sales companies)
Since 2006, the Olivetti Business Unit has operated with a new organizational structure based on the Business &Market Development area (responsible for all marketing and sales) and the Product/Technology Development &Industrial Operations area (responsible for manufacturing, research and logistics).
❖ KEY FACTORS
In 2006, Olivetti focused on improving its sales force, industrial reorganization and renewal of its products.
In a highly competitive market, work continued on a new line of multifunctional products and on strengtheningthe company’s position in the main European markets. Significant results were achieved in terms of volumes ofnew products and new business for specialized terminals.
The restructuring and rationalizing process at the manufacturing and technological level also neared completion.This involved:
Š the restructuring and concentration of production hubs mainly for specialized terminals and gamingproducts;
Š the centralization of research and development activities.
Product offers continued to be updated and expanded, including:
Š the launch of new multifunctional products based on ink-jet technology, achieving the goal fixed interms of cost reductions and product range expansion;
Š the optimization of the mix of traditional products and strict cost controls.
❖ BUSINESS AND MARKET DEVELOPMENTS
The year 2006 was marked by pricing pressure for hardware. In addition, significant efforts were made in thecommercial sphere to augment the company’s visibility and presence in the channels specialized in the new line ofproducts based on ink-jet technology (multifunctional printers and portable photo printers). As a result, significantsales volumes were obtained in the main European and South American markets.
In the second half of the year, the product range was expanded by the introduction of the new multifunctionalentry-level printer models, along with others with Wi-Fi functions.
The sales of other ink-jet products, fax machines, declined in the European market which resulted in even fiercercompetition with regard to prices. Consumption of fax accessories reported a decrease in volumes owing to astronger presence in the consumer area than in the business area.
Sales of the other product lines, photocopiers and office products based on laser technology, printers for banksand the retail market and cash registers increased compared to the same period of 2005 because of greaterintegration among sales channels as a result of the new organization which brought the entire product portfoliooffering to every customer. In particular, sales of printers for banking increased by 18% compared to the prioryear.
As far as the large customer market in Italy is concerned, the offering was expanded by participating in importantbids for multi-year contracts for complete ticketing services and network printing/copying systems withcustomers like Poste Italiane, Ferrovie (the Italian railway operator) and Italian banks. In this context, in July2006, Olivetti won a bid to supply printing/copying services for Poste Italiane worth €13 million.
59

Item 4. Information On The Telecom Italia Group Business Units
❖ PRODUCT/TECHNOLOGY DEVELOPMENTS & INDUSTRIAL OPERATIONS
The main activities in 2006 in the “consumer” ink-jet technology segment were as follows:
Š restyling of the range of multifunctional products launched in 2005 and the extension of the productrange with the introduction of a fax model (with printer, photocopier, scanner and fax functions);
Š introduction of a new multifunctional “entry-level” product;
Š development of a new platform of multifunctional products and associated high-performance printheads, scheduled to become available in the first half of 2007;
Š the introduction of new fax models.
In the professional products sector, the following took place:
Š activities aimed at updating and expanding printers for banks;
Š completion of the range of traditional fiscal cash registers and the development of a fiscal cash registerusing ink-jet technology.
4.2.7 OTHER TELECOM ITALIA GROUP ACTIVITIES
The Other Activities of the Telecom Italia Group consist of the Central Functions (Group Functions and ServiceUnits) and the foreign operations which are not included in other Business Units (Entel Bolivia, Sofora andETECSA).
❖ CENTRAL FUNCTIONS
Central Functions includes Group Functions and the Service Units.
The Group Functions are responsible for ensuring coordination, direction and control at the Group level in theirspheres of activities, whereas Service Units are responsible for ensuring the performance of common operatingactivities to support the business.
Group Functions include the Staff Functions of Telecom Italia (Human Resources & Organization excluding theWelfare function which is under the Service Units, Finance Administration & Control, Corporate & Legal Affairs,International Legal Affairs, Public & Economic Affairs, Corporate Development, Investor Relations, GeneralCounsel and IT Governance), Group Communication, which includes Progetto Italia, Advertising & Image andMedia & Opinion Maker Relations, Telecom Italia Latam and Telecom Italia International.
Starting January, 1, 2006, the former TILAB (now Innovation & Engineering Services) and Information activitieswere transferred to Operations.
Service Units include the operational service activities performed for the Business Units/Central Functions/Companies of the Group.
❖ ENTEL BOLIVIA GROUP
Telecom Italia International holds, indirectly, a 50% stake in Entel Bolivia, the Bolivian telephony operator whichwas acquired in 1995.
The Entel Bolivia group operates in the fixed (particularly long-distance national and international telephonesegments), mobile, internet and data transmission sectors in Bolivia.
In 2006, the fixed telephony business continued to focus on the commercial sphere, and in particular on the “AquíEntel” (public service) initiative. This initiative, used mainly for local calls to mobile phones but which hascapacity limitations (it is based on accesses with mobile technology), reported a growth in the number of lines ofapproximately 77% compared to December 2005 (21,970 at December 31, 2006 compared to 12,383 atDecember 31, 2005) and an increase in revenues mainly due to a 51% increase in local traffic volumes. At the
60

Item 4. Information On The Telecom Italia Group Business Units
same time, there were changes in rates and promotions aimed at increasing international long-distance trafficwhich, together, made it possible to completely offset the losses reported in the same telephony segment in thefirst half of the year.
At December 31, 2006, the number of fixed lines (74,000) increased by 29.8% compared to December 31, 2005(57,000).
During 2006 Entel Bolivia’s mobile business suffered fierce competition from the operator Telecel which launchedits own GSM service (under the Tigo brand). Telecel’s offers, which included subsidies for acquiring handsets andthe possibility of operating above 850 MHz and various offers by Viva caused a loss of market share ofapproximately 10% compared to December 31, 2005, especially in La Paz and Santa Cruz and in the east of thecountry. In order to limit the damaging effects of competition, Entel Bolivia launched new rate plans in the secondhalf of 2006, with the aim of increasing customers and mobile-mobile traffic. Also, in November 2006, the “2x1”(dos por uno) rate plan was launched, enabling customers to use twice the value of the top-up or, for customerswith postpaid traffic, twice the number of minutes of their subscribed rate plan. Due to this plan, it provedpossible to reverse the trend of the monthly variation in customers which had been negative since January 2006.
In the Value Added Services (“VAS”) sector, starting from August 2006 charges were reduced for GPRS and Edgeservices to make them more competitive than the services offered by Tigo, which had also adopted an aggressivesales policy for these types of services.
The number of mobile lines at December 31, 2006 (equal to 1,443,000) was in line with December 31, 2005(1,447,000) after having recovered the reduction in the number of lines after cleaning out the customer base(about 61,000 lines) and fierce competition.
Please see “4.1.5 Recent Developments During 2007” about the possible nationalization of Entel Bolivia.
❖ TELECOM ARGENTINA GROUP
Telecom Italia and Telecom Italia International through Nortel Inversora/Sofora hold a 13.97% stake in theTelecom Argentina group.
Telecom Argentina group operates in the sectors of wireline and mobile telephony, Internet and data transmissionin Argentina and also offers mobile telephone services in Paraguay.
At December 31, 2006, there were approximately 4,095,000 fixed lines in service (also including installed publictelephones), an increase of 3.7% compared to December 31, 2005.
Telecom Argentina’s broadband business grew significantly during 2006 and reached a total of approximately448,000 customers, an increase of 103% compared to December 31, 2005.
In the mobile business, the customer base of the Group reached approximately 9,589,000 (12.1% of which is inParaguay) with an increase of 41% compared to December 31, 2005. The number of postpaid customers increasedby 35.8% compared to December 31, 2005 and represents 31.6% of the total customer base (compared to 32.8%at the end of 2005). Customers who use GSM services reached 86.7% of the total customer base.
❖ ETECSA
Through Telecom Italia International we hold a 27% interest in ETECSA, the monopoly provider of fixed line andmobile telecommunications services, Internet and data transmission in Cuba.
Old Telecom Italia obtained an initial stake of 12.25% in ETECSA in 1995, when, prior to its privatization by theItalian government, Old Telecom Italia acquired, for approximately U.S.$291 million, a 25% stake in a Mexicantelecommunications company which owned 49% of ETECSA. In February 1997, Old Telecom Italia converted itsindirect stake in ETECSA into a direct investment and increased its interest to 29.29%. The acquisition price forsuch further 17.04% stake in ETECSA was U.S.$291.6 million. In connection with the merger of the local mobileoperators into ETECSA to form an integrated provider of telecommunications services we participated in a seriesof capital increases proportionate to our share ownership.
61

Item 4. Information On The Telecom Italia Group Business Units
These capital increases occurred during 2003 and through 2004; during this period we invested an additionalU.S.$41.3 million in ETECSA through capitalization of dividends paid by ETECSA and following these capitalincreases and the mergers we now own 27%. The other shareholders in the company include the Cubangovernment which controls 51% of the company and four other Cuban shareholders.
In addition to our shareholding in ETECSA Telecom Italia International is a party to a shareholders’ agreementpursuant to which it has the right to designate certain senior executive officers and a majority of the board ofdirectors of ETECSA on alternate years.
In addition to these governance arrangements we entered into agreements to provide certain technical assistanceto ETECSA with respect to its fixed line and wireless services.
In return for these services we receive annual fees of U.S.$900,000 (for fixed line technical assistance) and€950,000 (for mobile technical assistance) under each agreement respectively and certain other fees for specificservices provided (€771,477 in 2006 and €1,518,000 in 2005). The level of the fees earned over the last two yearsis set forth in “Note 41—Related Party Transactions” to Notes to our 2006 Consolidated Financial Statementsincluded elsewhere herein. The technical agreement with respect to fixed line services, renewed at the beginningof 2007, will expire at the end of 2009 and the technical agreement with respect to wireless services at the end of2009.
As we own only 27% of ETECSA we account for its results under the equity method. For further details see“Note 8—Other Non-Current Assets” to Notes to our 2006 Consolidated Financial Statements included elsewhereherein.
The number of fixed lines (also including installed public telephones) was approximately 973,000 at December 31,2006, an increase of 14% compared to December 31, 2005. Of the lines installed, 49,000 are invoiced in US dollarsand the others, connected to the social development of Cuban telecommunications, in pesos.
In 2006, the number of Internet and data customers increased and, at December 31, 2006, had reached about20,000 accesses (compared to 16,000 at the end of 2005).
In the mobile business, at December 31, 2006, the customer base had reached 152,700, an increase of 16%compared to December 31, 2005. The increase is mainly concentrated on the prepaid customers, whichrepresents almost 90% of the total. In 2006, the migration of customers from TDMA towards GSM technologycontinued and is now used by 81% of the total customer base (compared to 70% at the end of 2005).
We do not believe that our arrangements with, and investments in, Cuba are material to the results of operationsor financial condition of the Telecom Italia Group, taken as a whole.
* * *
Brasil Telecom
The company operates fixed telephone services in Region II (Paraná, Santa Catarina, Distrito Federal, Tocantins, MatoGrosso do Sul, Rondônia, Rio Grande do Sul, Acre and Goiás) covering about 2.8 million square kilometers (33% of thetotal area of the country), with a population estimated at approximately 43 million (23% of the total population) withthree metropolitan areas of more than one million inhabitants including Brasilia, the capital of the nation.
Brasil Telecom has one of the largest telecommunications networks in Brazil with a broad offering of services fortelecommunications, fixed telephony, broadband and narrow band, free Internet, data transmission and mobiletelephony using GSM technology.
On October 27, 2006, Telecom Italia International transferred, for U.S.$410 million, its 38% stake in the sharecapital of Solpart Participaçoes S.A. (the controlling holding company of Brasil Telecom) to Brasilco S.r.l., a newlyincorporated Italian company held by a trust set up under British law, with Telecom Italia International itself asthe beneficiary. Under the trust deed, Credit Suisse Securities (Europe) Limited (“CSFB”) acts as the trusteemanaging the stake and the corporate rights deriving there from, also for the purpose of selling the stake to thirdparties with the assistance of JP Morgan which have been engaged to evaluate possible sales opportunities.Telecom Italia International, as the sole beneficiary of the trust, will continue to receive any earnings from theinvestment in Solpart, including the price of its future sale.
62
Item 4. Information On The Telecom Italia Group Business Units
As a result of the above transfer, approved in advance by the Brazilian telecommunications authority, Anatel,Telecom Italia International transferred ownership of the Solpart shares and the relative governance rights, thusresolving the question concerning the overlapping of the mobile and long-distance licenses between the BrasilTelecom group and the TIM group in Brazil and consequently avoiding the possible application of sanctions byAnatel to the two operators.
During December 2006, Brasilco S.r.l. collected U.S.$4.5 million representing its share of a capital reimbursementapproved by the shareholders’ meeting of Solpart Participaçoes S.A.. On January 29, 2007, this amount wastransferred by Brasilco S.r.l. to Telecom Italia International as a reimbursement of reserves.
4.2.8 COMPETITION
Our domestic fixed and mobile telecommunications operations, as well as our broadband services businesses, aresubject to extensive regulatory requirements in Italy and our international operations and investments are subjectto regulation in their host countries. In particular, as a member of the EU, Italy has adapted itstelecommunications regulatory framework to the legislative and regulatory framework established by the EU forthe regulation of the European telecommunications market. The EU Commission approved a new electroniccommunications framework in March 2002, which has been effective in Italy since September 2003.
Fixed-line Domestic Telecommunications Services Market
As a result of the full liberalization of the Italian domestic market for telecommunications services, we have facedincreasingly significant competition since 1998, including competition from foreign telecommunicationsoperators.
In 2006, competition in the Italian domestic market was characterized by innovative offerings through theintroduction of bundled voice/broadband (double play) and bundled voice/broadband/IPTV (triple play) offers.The market was also characterized by a migration from a primarily reseller approach (Carrier Selection/CarrierPre Selection for voice and Wholesale for ADSL) to an infrastructure-based approach (Shared Access or Local LoopUnbundling).
In particular, in 2006 competition in the Italian domestic market was driven by five players (other than TelecomItalia) with differentiated business models and focus on different market segments:
Š Fastweb (a national player focused on broadband and triple play offers);
Š Albacom (focused on business customers and ICT offers: voice, data and IT solutions);
Š Wind-Infostrada (an integrated fixed/mobile/Internet operator focused on retail customers);
Š Tiscali (a Narrow Band and broadband Internet Operator, developing double play/VoIP low cost offers);and
Š Tele2 (voice, Internet dial up and broadband, developing discounted double play /VoIP offers focusedon retail customers).
Our market share in the Italian retail traffic volumes (retail voice and on-line traffic only) on December 31, 2006,was 71.9% compared with 72.3% on December 31, 2005 and 71.7% on December 31, 2004. Our main competitorsin this segment are Tele2 and Wind; Albacom and Fastweb target specific markets (business customers forAlbacom; high spending consumers for Fastweb).
The Italian fixed voice market has been influenced, on one hand, by the development of mobile operators thatattract voice traffic through the advantage of mobility, a wide range of VAS and high performance terminals,while, on the other hand, it has been subject to cannibalization by the increasing penetration of alternativecommunication solutions (messaging, e-mailing, chat).
The broadband market continued to grow but at a slowing rate and subject to increasing competition.
In 2006, competition intensified also in the top client/data market, with pressure on average prices.
63

Item 4. Information On The Telecom Italia Group Business Units
In this increasingly challenging market Wireline Business Unit revenues in 2006 decreased by 0.2% compared to2005, while maintaining a level of profitability at the top of its peers’ range.
We believe that our combination of service, performance, quality, reliability and price is an important factor inmaintaining our strong competitive position.
Domestic Mobile Telecommunications Services Market
In 2006 the mobile telecommunications market continued to grow in Italy but at a rate slower than in theprevious two years. Customer growth in the domestic mobile telecommunications market was 12.5% in 2006,compared to 13.2% in 2005 and 10.8% in 2004. As of December 31, 2006, the number of cellular phone linesreached 80.4 million, corresponding to a penetration rate of around 137% of the population.
There are three key competitors for Telecom Italia in the Italian mobile market: Vodafone, Wind and H3G (called“3”). At December 31, 2006, Telecom Italia held the market leadership with a market share of 40.4%, withVodafone, Wind and H3G having market shares of approximately 32.5%, 18.4% and 8.8%, respectively.
In 2006, we had a 43% market share of net additional GSM and UMTS lines, corresponding to 3.9 million net lines,compared to 2.4 million for Vodafone, 1.0 million for Wind and the remaining 1.6 million attributable to H3G.
Our figures do not include “inactive” lines to ensure greater consistency between the number of lines managedand business development.
Competition for mobile telecommunications services remained strong in 2006, and Telecom Italia respondedwith:
Š a strong commercial push to defend market leadership;
Š innovative and segmented offers;
Š a volume and value strategy:
– pushing on gross additions to slow competitors’ growth (Wind, H3G);
– securing the competitive gap on valuable customers (TIM vs. Vodafone), also through valueoriented mobile number portability with a focus on high end customers;
Š leveraging the benefits from fixed and mobile integration:
– strengthening the distribution channels;
– price defense (no price war in fixed/mobile substitution);
Š focus on handsets leadership (7.4 million handsets sold in 2006):
– TIM 3G successful strategy: 300,000 HSDPA handsets sold in 2006;
Š solid positioning in the small and medium enterprise segment;
Š focus on customer care and quality of service.
We believe that the continuous improvement of the quality of our services and the strengthening of ourleadership in network and marketing activities are important factors in maintaining our strong competitiveposition.
The European broadband Market
German broadband Market
Germany is the first broadband market in Europe measured by size: 15 million broadband accesses, approximately€8 billion in value, and it continues to grow rapidly. It is characterized by:
Š five main competitors and room for further merger and acquisition activity following the recentconsolidation process;
Š an increase of alternative operators, LLU coverage and early stage VDSL/Fiber Network projects;
Š the increasing penetration of dual and triple play offers;
64

Item 4. Information On The Telecom Italia Group Business Units
Š an ARPU of 40-50 €/month for bundle Voice + DSL, higher than the European average and withoutdramatic reductions expected in the short term;
Š the appearance of Fixed—Mobile convergent offers (mobile operators O2 and Vodafone announced theentry in the DSL market).
HanseNet strong performance in 2006 was based on:
Š a robust increase in the ADSL customer base (approximately 929,000 broadband access lines at the endof 2006);
Š strong focus on network coverage, reaching 40% of German households in the fourth quarter of 2006;
Š continuous improvement in profitability driven by operational efficiency.
In September 2006 Telecom Italia reached a preliminary agreement for the acquisition of AOL Germany’s Internetbusiness from Time Warner. This transaction was completed on February 28, 2007. The combined entityHanseNet plus AOL has become the third broadband player in Germany with approximately a 15% market share.The other main broadband operators are: T-Online with 41% market share, United Internet with 16% marketshare, Arcor with 13% market share and Freenet + Tiscali with 8% market share.
French broadband Market
The French broadband market reached approximately 13 million broadband accesses in 2006, corresponding to apenetration of 40% on total fixed lines, and it continues to grow at a rapid pace. It is characterized by:
Š strong competition, focused on portfolio innovation (launch of ADSL 2+, first market for VoIP and IPTVpenetration in Europe);
Š a stabilization of triple play average prices (approximately 30€/month for all players);
Š room for further merger and acquisition activity despite recent consolidation events (i.e. merger Neuf/Cegetel and following acquisition of AOL France, Tele 2 acquisition by SFR).
Telecom Italia France performance in 2006 was characterized by:
Š the consolidation of its market position through an increase in the ADSL customer base, reaching775,000 broadband accesses in December 2006 (+43% vs. 2005);
Š the increase of market share (from around 6% at the end of 2005 to approximately 7% at the end of2006). The other main competitors are: France Telecom with 49% of market share, Iliad with 19%market share, Neuf/Cegetel with 18% market share and Club Internet with 5% market share;
Š a strong focus on LLU network coverage, reaching 36% of fixed lines in the fourth quarter of 2006(approximately 11 million households);
Š the continuous recovering of EBITDA margin.
The Brazilian Mobile Market
In 2006, the Brazilian telecommunications market growth was driven by mobile and broadband servicesdevelopment.
The fixed line market (voice and broadband) still accounted for 60% of the total telecommunications business andapproximately reais 46 billion in revenues, representing an opportunity for challengers of fixed-line operators.
The mobile services market continued to grow, but at a slowing rate compared to 2005. As of December 31, 2006,the number of cellular phone lines reached 99.9 million, corresponding to a penetration rate of around 53.2% onthe Brazilian population (86.2 million lines in 2005; penetration rate of 47.2%).
There is significant competition in the Brazilian mobile business, with both local and international mobileoperators, the most significant of which are Vivo with 29.1% market share, Tim Brasil with 25.4%, Claro with23.9% and OI with 13.1%. Tim Brasil, the only mobile operator with national GSM coverage, was the bestperforming operator in net customer additions (+5.2 million lines, +2 percentage points in total market share),reaching, as of December 31, 2006, 25.4 million lines, compared to 20.2 million lines as of December 31, 2005.
65
Item 4. Information On The Telecom Italia Group Regulation
4.3 REGULATION
The E.U. Regulatory framework
Italy is a member of the EU and, as such, is required to implement the directives issued by the EU.
The European Commission began opening the telecommunications market to competition with the adoption ofdirectives in the late 1980s and early 1990s which beginning in 1990, opened to competition telecommunicationservices, other than fixed public voice telephony services, opening the market for value added services.Subsequent directives liberalized the market for satellite services, alternative infrastructure and mobile servicesand infrastructure. These liberalization measures culminated with the opening of competition in 1998 of publicvoice telephony and public network infrastructure. These directives were also accompanied by directives relatingto open networks, setting out a body of principles for access to public telecommunications networks and services.
The Regulatory framework in Italy
The law sources for the electronic communications sector are as follows:
Š the “Electronic Communications Code” (“ECC”—Legislative Decree No. 259 of August 1, 2003) whichincorporated into national law the EU directives of the “1999 Review” with regard to electroniccommunications networks and services: the “Framework directive” together with three directives“Access”, “Authorization” and “Universal Service”;
Š the “Consolidation Act on Radio-Television” (Legislative Decree No. 177 of July 31, 2005,) whichcontains the principles for convergence between radio-television and other sectors of interpersonalcommunications;
Š Legislative Decree No. 262 of October 3, 2006, which contains “Urgent measures with regard to tax andfinancial matters” and which, with reference to the ECC, partially altered the law on sanctions byintroducing further examples of administrative offences, a generalized increase in the fines for eachsanction and the elimination of the institution of the partial cash settlements of fines.
The main characteristics of the ECC are as follows:
Š redefinition of the concept of “significant market power” and of the criteria for imposing obligations oncertain operators, with the introduction of market analysis;
Š “electronic communication services and networks” can now be provided pursuant to a “generalauthorization”;
Š more flexibility by national regulatory authorities to select which access and interconnection obligationsto impose on operators notified as having “significant market power” in a relevant market; and
Š redefinition of certain measures relating to retail price regulation and extension of number portability tomobile operators.
Moreover, the ECC provides for guidelines on market analysis and calculation of “significant market power” andrefers to the relevant European Recommendation for the identification of the retail and wholesale markets. TheECC also provides for, among other things, the following:
Š allows the trading of the rights to the use of frequencies among operators offering the same type ofservices;
Š provides for specific and more defined rules aimed at reducing the burden of current legislation andlocal regulations which regulate the installation of networks; and
Š assigns roles and responsibilities among the Italian Ministry of Communications and the NationalRegulatory Authority (“NRA”) mainly by assigning to the Ministry of Communications the task ofsupervising the authorization process and compliance with the universal service obligations and to theNRA the task of conducting market analyses and proposing remedies.
The NRA, an independent regulatory authority, consists of a President appointed by the Italian Governmentthrough a Presidential decree, a Committee for Infrastructures and Networks, a Committee for Products and
66
Item 4. Information On The Telecom Italia Group Regulation
Services and the Council. Each of the Committees’ members is selected by the Italian Parliament and appointedthrough a Presidential decree. Each of the Committees and the Council is responsible for establishing regulationsfor their specific areas.
The NRA has the dual responsibility of (i) ensuring fair competition among telecommunications operators; and(ii) protecting consumers. In particular, the NRA is responsible for:
Š market analysis as defined by the ECC;
Š preparation of regulations in the telecommunications field;
Š establishment of the criteria to be followed by operators in determining tariffs;
Š monitoring operators to ensure their compliance with such tariff criteria;
Š ensuring, where appropriate, accounting separation between different activities carried out by the sameoperator;
Š monitoring of the performance of services to ensure compliance with contracts and qualitative levels ofservice;
Š issuance of directives regarding quality of services;
Š examination of complaints filed by users and customers in relation to quality of services and the level oftariffs;
Š control of steps taken by operators to ensure equal treatment of their customers and verifyingperiodically the quality of the service provided; and
Š control of operators’ compliance with the general principles issued by the Italian Government and theNRA in relation to public services.
The NRA has investigative powers, as well as the authority to impose sanctions on operators who do not complywith the directives and orders and to propose to the Ministry of Communications the revocation and/orsuspension of general authorizations and individual licenses in the event of repeated violations by the holder.
Universal Service
The Universal Service is a minimum set of services of a certain quality, which must be made available to allcustomers, regardless of their geographical location and, taking account of specific national conditions, offered ata reasonable price. To date Telecom Italia is the only operator charged with the obligation of providing theUniversal Service throughout Italy. The NRA permits only Telecom Italia to utilize all available means to fulfill itsobligation efficiently with regard to cost.
The net cost of providing the Universal Service is calculated as the difference between the Company’s net costwhen it is subject to the obligations of providing the Universal Service and the net cost of the same operation ifthe obligation did not exist. It is the NRA’s responsibility to verify the net cost.
A fund set up by the Ministry of Communications is used to finance the net cost. Companies in the sectorcontribute to it, including Telecom Italia.
If, at any time, the NRA determines that the net cost of the Universal Service constitutes an unfair burden forTelecom Italia, it sets off a mechanism to share the costs, which involves payments to the fund by companies inthe telecommunications sector.
The NRA is currently conducting procedures to establish the net cost sustained by Telecom Italia to provide theUniversal Service during the years 2004 and 2005.
Special status of operators having significant market power
In the old regulatory regime telecommunications operators operating fixed-line or mobile networks, or offeringfixed public voice telephony services, leased lines or international circuits, were subject to special obligations withrespect to interconnection and accounting policies if they had Significant Market Power (“SMP”). An operator
67
Item 4. Information On The Telecom Italia Group Regulation
was presumed to have Significant Market Power if its share of the relevant market was greater than 25%, althoughthe NRA might determine that an operator having a market share greater than 25% did not have SignificantMarket Power, in view of the operator’s ability to influence market conditions and its access to financial resources,or that an operator with a market share lower than 25% had such power.
With the introduction of the new European Framework in August 2003, criteria for the identification of SignificantMarket Power changed as 18 separate markets were identified and the NRA was asked to carry out a separateMarket Analysis in each such market, in order to identify operators with significant market power. The marketsidentified were divided into retail markets (markets from 1 to 7: access, national and international phone servicesand leased lines), wholesale markets (markets from 8 to 14: collection, termination and transit, unbundled access,broadband and wholesale circuits), mobile markets (markets from 15 to 17: collection, termination andinternational roaming) and the television broadcasting services market (market 18).
During 2006, the Italian NRA concluded all of its preliminary inquiries regarding the analysis of the markets andintroduced measures as a result of this analysis which are described below.
Š Retail markets
A general regulatory framework was confirmed for all the retail markets and, in particular, the Price Capmechanism has been retained for access services and national telephone services. With regard to the accessmarkets, the NRA has required Telecom Italia to provide a Wholesale Line Rental (“WLR”) service in those areaswhere unbundled access services are not provided, with a price which is calculated by means of the retail priceindex minus pricing method (equal to the retail subscription charges less 12%). When marketing of the WLRservice, which will be available by the end of 2007, begins, Telecom Italia is authorized to offer bundled access-traffic rate plans.
The NRA also has removed some of the restrictions for offerings aimed at large business customers together withthe obligations with regard to retail leased lines with speeds of more than 2Mbit/s.
Š Wholesale markets
The NRA has confirmed the continuation of the network cap mechanism for calculating the prices of wholesalecollection, termination and transit services and of unbundled network-access services (Local Loop Unbundling andShared Access). This mechanism also applies to circuits, with the aim of ensuring that cost orientation is used tocalculate the prices of the termination and long-distance circuit segments. As far as the price of termination onthe networks of other operators is concerned, the NRA has fixed a maximum price equal to 1.54 eurocents/minute, which will remain valid until June 30, 2007, with an annual reduction which will bring the price to 0.55eurocents/minute by 2011.
Š Mobile markets
The NRA has not imposed any obligations on the mobile telephone market or international roaming services. Onthe other hand, it has established a ceiling for termination on the networks of Telecom Italia (formerly TIM),Vodafone and Wind, with a target price of 8.90 eurocents/min. for Telecom Italia (formerly TIM) and Vodafone,and of 9.50 eurocents/min. for Wind for 2008. With regard to H3G, the NRA procedure for establishing the ceilingfor termination on the fourth Italian mobile operator has not yet been completed (the process began in July,2006).
Š Additional markets
The NRA is conducting market analysis on three new significant markets (additional markets to the original 18identified by the European Framework in 2003): mobile collection markets directing calls towardsNon-Geographical Numbers (Premium Rates, Freephone numbers and Splitting Charges) (market 15 bis); themarket for wholesale termination for international routing (market 19) and the market for retail dial-up Internettraffic (market 20).
* * *
68
Item 4. Information On The Telecom Italia Group Regulation
Finally, the NRA has deliberated on the following matters.
Order No. 694/06/CONS: procedure for setting up the Wholesale Line Rental offering in compliance with OrderNo. 33/06/CONS.
The WLR offering consists of the wholesale sale of the basic and ISDN telephone service associated with thesubscription charge paid by residential and non-residential customers who subscribe to the Telecom Italia publictelephone network. The marketing of this service and of the mandatory associated services must be madeavailable by Telecom Italia within 12 months of the date on which Telecom Italia was informed of OrderNo. 694/06/CONS (published in Gazzetta Ufficiale No. 297 on December 22, 2006).
Order No. 504/06/CONS: Urgent measures fixing the prices of calls to directory information services from mobilenetworks towards Non-Geographical Numbers (toll free numbers or other numbers without a geographic areacode).
The measure identifies, on a provisional and urgent basis, the mobile networks of Telecom Italia, Vodafone, Windand H3G as those with significant market power.
A ceiling was established for the prices charged for voice calls on the networks of the mobile operators TelecomItalia (formerly TIM), Vodafone, Wind and H3G, which must not be higher than the current value of thecorresponding termination rate, increased by a maximum of 100% for services which are different from andaccessory to the simple origination service.
Local Loop Unbundling (LLU)
In 2000, the NRA published the general guidelines regarding the services that must be offered by Telecom Italiaon an unbundled basis: twisted copper pairs; optical fibers; access extension (lines between switches), and digitaltransmission channels (i.e., digital circuits between the local office of Telecom Italia and the operator’s point ofpresence) and the related economic pricing criteria, based on fully distributed historical costs. The guidelinesallow other operators to have direct access to end users (customers) by leasing the network components fromTelecom Italia (full unbundling) as well as leasing only the high bandwidth (shared access).
With the national implementation of the new European framework, the wholesale unbundled access (includingshared access) to metallic loops and subloops for the purpose of providing broadband and voice services has beensubject to the market analysis procedure.
The NRA decided the introduction, for the years 2006 and 2007, of four baskets of LLU services each of which issubject to a cap of Retail Price Index (“RPI”)—4.75% per year. See “—4.2.2. Wireline—National Wholesale—Local Loop Unbundling (LLU)”.
Framework of the fixed access network
On May 2, 2007, the Council of the NRA launched a public consultation on the “regulatory aspects with regard tothe framework of the fixed access network and the future prospects of the new-generation broadband networks”.
The aim of the consultation, which is scheduled for conclusion by mid-July 2007, is to acquire observations andcomments from all the parties concerned, with particular reference to the structural characteristics of the market,the technological evolution of networks and services, and the future development of the competition andregulations.
The first matter to be evaluated by the consultation will be the regulatory options concerning the evolution of thepublic fixed telecommunications network, with particular reference to access by final users.
Secondly, the authority deems that it is important to assess the new regulatory problems arising with regard topromoting the development of the Next Generation Access Networks (NGAN). In fact, on the one hand, there isthe problem of forming a regulatory approach which does not constitute an obstacle, but which, on the contrary,will stimulate investments in the networks of the new generation. On the other hand, there is a need to ensurethat there is no discrimination and that all operators in the new context of competition and the market are treatedfairly.
69

Item 4. Information On The Telecom Italia Group Regulation
Interconnection
Telecommunications operators providing fixed-line public voice telephony services, mobile telecommunicationsservices or leased line systems and having Significant Market Power are required to negotiate and enter intointerconnection agreements at the request of other operators wishing to provide telecommunications services, toapply non-discriminatory terms and to provide copies of their interconnection agreements to the NRA. Public fixednetwork operators and leased line service providers having Significant Market Power are required to publish yearlya Reference Interconnection Offer (“RIO”).
Telecom Italia has had a number of RIOs approved by the NRA since 2003. On October 28, 2005 Telecom Italiapublished the RIO 2006. In Order No. 19/06/CIR, the NRA approved, with amendments, the economic conditionsof the Telecom Italia interconnection offering for the year 2006. In October 2006, Telecom Italia submitted itsinterconnection offering for 2007 to the NRA; the proposed offering is currently being assessed.
Number Portability (“NP”)
Since February 2000, Service Provider Portability in fixed networks was introduced, including Non-GeographicNumbers.
Service Provider Portability allows an end user to retain his number independent of the organization providingservice, in the case of geographic numbers at a specific location (same Local Area) and in the case of other thangeographic numbers at any location.
NP for mobile services was established during 2001 and commenced in April 2002. On March 28, 2002, the NRAissued Order No. 7/02/CIR which established that the price of Mobile NP (“per number costs”) had to be equal tothe one-off price that the operator receiving the customer (the “recipient”) had to pay to the operator giving thecustomer (the “donor”). In January 2003, the NRA with Order No. 13/02/CIR set a price cap for the portabilitycharge. This charge can not be higher than the price established for Number Portability between fixed operators.
Carrier Preselection (“CPS”)
Carrier selection (call by call) has been operational since the end of 1998 for long distance (national andinternational) and fixed mobile calls. Carrier selection for local calls has been available since January 2000.
Since February 2000, customers have been able to make inter-district, international calls and calls to mobilenetworks using a pre-selected carrier as an alternative to Telecom Italia, without dialing the identifying coderequired. Since July 2000 customers have also been able to make local calls (within the same district) with apre-selected operator.
Since April 2003, we have been subject to regulations which define common measures relating to thedisconnection of the CPS service, describing in detail the modes and time-scales involved in the disconnection ofCPS services, to safeguard users, and stating precise obligations with regard to transparency for operators of theservices.
In August 2003, Telecom Italia and other numerous operators signed an agreement regulating the operationalmodalities for the management of the communication of the CPS service cessation. As from RIO 2005, thesurcharge for a single minute of CPS traffic is no longer applied and the one-off activation charge is €5.46 perline.
In the management of activation/de-activation process of the CPS service, we operate in accordance with theapplicable orders. In the event of services contested by the client since not requested, we intervene, incompliance with applicable regulations, for the timely restoration of the previous line configuration.
Accounting separation and costs accounting
Operators having SMP are required to have an accounting system showing their costs in a transparent manner.Upon request, such operators must provide the NRA with a description of their cost accounting system to verifycompliance with the provisions of the electronic telecommunications regulatory framework. Moreover, operators
70

Item 4. Information On The Telecom Italia Group Regulation
of fixed public networks and mobile networks and providers of fixed public voice telephony services, mobiletelecommunications services and leased line services with significant market power must keep a separateaccounting system distinguishing between the activities related to the building and operation of publictelecommunications network, the activities related to the provision of telecommunication services, theinterconnection offering and the universal service provision.
The last accounting separation report of Telecom Italia audited by the NRA and published (both on the NRAwebsite and on the Telecom Italia Group’s website) relates to 2001.
However, Telecom Italia has provided the accounting separation reports relating to the years 2002, 2003 and2004 to the NRA. The NRA has appointed Mazars & Guerard with the task of verifying the accounting separationreports for 2002, 2003 and 2004.
The accounting separation report for 2005 is currently being prepared. The activities of that year developed bothoutside the company (relations with the NRA) with the aim of supervising the specific context with regard to theregulation and the law, and inside the company, with the aim of consolidating the revisions of the methods of thenew accounting separation system (“Nuovo Sistema di Contabilità Regolatoria”, NSAR) and then responding tothe new obligations of Accounting Separation for the Markets defined by the new regulatory framework for Italyand the EU as a whole.
In Europe, the “rules” of Accounting Separation were updated in EC Recommendation No. 2005/698/CEconcerning “Cost Accounting and Accounting Separation” which takes into account the regulation of the varioussectors divided according to “significant markets”.
On a national scale, the NRA issued orders about significant markets, by amending the previous OrderNo. 152/02/CONS on the subject and establishing new rules for accounting separation and cost accounting,which, however, have not yet been grouped into a single framework.
With this in mind, during 2006, Telecom Italia presented the NRA with a draft proposal for an accountingseparation of the fixed network for 2005 divided “by market”, followed by another project with a more detailedand analytical format which has the aim of: a) providing a single contribution for the concrete realization ofaccounting separation reports; b) identifying consistent, feasible rules to be applied, with effect from 2005; and c)guaranteeing consistency with Recommendation No. 2005/698/CE.
Directory Information Service
Since the coming into force of the ECC, the directory information service is no longer a service required to beoffered by the Universal Service. This market has been deregulated since October 2005 (now there is a range ofdirectory information services based on 12xy numbers).
In Order No. 12/05/CIR of May 19, 2005, due to the delays in the process of assigning numbers and receivingrequests from operators, the NRA established October 1, 2005 as the first day of the new 12xy number serviceand the end, on the same day, of the Telecom Italia “12” service and on December 1, 2005 the directoryinformation service with numbers beginning with “4”.
This last date was postponed twice by Orders No. 83/05/CIR and No. 18/06/CIR, and was eventually moved toSeptember 30, 2006.
Rights of way
The matter of rights of way to permit the building of electronic communications network infrastructuresunderground and above ground is defined in detail by the ECC.
The ECC describes the powers of local authorities with regard to procedures for granting rights of way, and thepowers of the NRA to provide incentives so that operators are encouraged to share the location and use of suchinfrastructures.
71

Item 4. Information On The Telecom Italia Group Regulation
General authorizations
Telecom Italia owns: a) the individual license to install and supply public telecommunications networks and toprovide a public voice telephone service; b) the individual license to install and operate a network of coastalstations with the aim of providing the mobile maritime service and land-based stations to provide a mobile servicethrough the Inmarsat satellite.
The licenses described above were issued to Telecom Italia by the NRA on January 19, 2001 with OrdersNo. 820/00/CONS and No. 738/00/CONS. In March 2001, the licenses for offering mobile communicationsservices based on GSM technology were also transformed into individual licenses.
The ECC has authorized the conversion of all pre-existing rights into general authorizations, and, at the sametime, decreed that they will continue to be valid until they expire spontaneously.
At the end of 2006, there were about 160 operators with a general authorization allowing them to operateelectronic communications services.
NRA fee for 2006
In Order No. 110/06/CONS, the NRA established how operators should pay their fee for the year 2006 and theamounts to be paid.
In particular, for the year 2006, the fee fixed by article 1, paragraph 66 of Italian Law No. 266 of December 23,2005 and owed to the NRA by companies operating in the communications sector which were identified in theMinisterial Decree of May 17, 2002, in a measure equal to 1.5 per thousand, is calculated based on the revenuesrecorded in the last financial statements approved prior to the coming into force of the above-described LawNo. 266 of December 23, 2005.
The Telecom Italia Group paid an overall amount of approximately €23.9 million for the year 2006 (the sum of theshare of the amounts due by Telecom Italia and the former TIM).
Competition Law
Telecom Italia is obliged to observe Italian laws concerning the protection of competition.
Italian Law No. 287 of October 10, 1990 (“Laws for protecting competition and the market”) created the “AutoritàGarante della Concorrenza e del Mercato”, or Antitrust Authority, which is an independent body.
The Antitrust Authority is responsible for:
Š applying Law No. 287 of 1990 and supervising the following matters: a) restrictive agreements by thecompetition; b) abuses of a dominant position; c) concentration of enterprises;
Š applying the standards of Legislative Decree No. 206 of 2005 with regard to deceitful advertising andcomparative advertising; and
Š looking out for conflicts of interest in the case of people holding government posts.
Regulatory framework in Brazil
The activities of the Telecom Italia Group in Brazil are subject to the General Law on Telecommunications (LeyGeneral de Telecomunicações—LGT) of 1997 and the regulatory framework for the supply of telecommunicationsservices promulgated by the Brazilian regulatory authority, Agência Nacional de Telecomunicações (“ANATEL”).
ANATEL is an independent, financially autonomous body which reports to the Brazilian Ministry ofCommunications.
Authorizations for supplying telecommunications services are granted either in the public sphere (by granting aconcession or permit) or in the private sphere (through an authorization).
72
Item 4. Information On The Telecom Italia Group Regulation
At the moment, only a few fixed-network operators operate in the public sphere. All the other telecommunicationsservices operate in the private sphere, including operators of mobile networks.
In 2005, ANATEL published a special set of regulations with regard to operators with Significant Market Power, towhich ANATEL intends to apply stricter standards with the aim of guaranteeing competition.
Authorizations
When the Telebras system was privatized, concessions for the analog mobile telephone system were grantedaccording to the “SMC” (Serviço Movel Celular—Brazilian Law No. 9295 of July 19, 1996), which involved thegranting of concessions, accompanied by a list of obligations, for geographical areas.
Later, ANATEL introduced the standards which allowed SMC concessions to be converted into authorizations, aslaid down in the new “PCS” (Personal Communications Services) regulations.
The companies of the Telecom Italia Group operating in Brazil acquired SMC concessions between 1997 and 1998(later converted into PCS authorizations in 2002) and PCS authorizations in 2001 as a result of bids.
Rules concerning interconnection
Telecommunications operators must publish a public offering of interconnection economic conditions and aresubject to the “General Interconnection Regulatory Framework” promulgated by ANATEL in 2005.
The amounts charged for interconnection are freely negotiated among the operators concerned. However, toavoid any detriment to the competition, ANATEL may fix the amounts if the operators do not succeed in coming toan agreement.
Interconnection agreements must be approved by ANATEL before they can be applied.
Major changes in regulations in 2006
In Order No. 438 of July 2006 (Resolução 438), the partial bill & keep rule was eliminated. This bill had requiredan obligation to pay the termination charge only if traffic exceeded 55% of the total in the calls between twomobile operators in the same (local) area.
This decision has had positive results on interconnection revenues and a corresponding negative effect on thecosts of interconnection, since each operator must pay (and receive) the termination charge for all the trafficexchanged at the interconnection instead of for a certain share.
Regulatory frameworks in France and Germany
Telecom Italia is represented in France and Germany by some companies which market broadband productsunder the “Alice” brand.
The regulatory framework in these two countries is a national transposition of the European Framework definedby the European Directives contained in the “99 Review” mentioned earlier.
The regulatory framework of both countries is therefore comparable to the Italian one, with responsibility beingshared between the relevant Ministry and an independent Authority (Arcep in France, BNetzA in Germany). Here,too, individual markets with Significant Market Power operators (with their relative obligations) have beenidentified as a result of an analysis of the relevant markets in those countries.
73
Item 4. Information On The Telecom Italia Group Glossary Of Selected Telecommunications Terms
4.4 GLOSSARY OF SELECTED TELECOMMUNICATIONS TERMS
The following explanations are not intended as technical definitions, but to assist the general reader tounderstand certain terms as used in this Annual Report.
2G (second-generation Mobile System): Second-generation protocols using digital encoding and includingGSM, D-AMPS (TDMA) and CDMA. 2G networks are in current use all over Europe and other parts of the world.These protocols support high bit rate voice and limited data communications. 2G networks technology offerauxiliary services such as data, fax and SMS. Most 2G protocols offer different levels of encryption.
3G (third-generation Mobile System): Third-generation wireless service, designed to provide high dataspeeds, always-on data access, and greater voice capacity.
3G networks technology: Permits the transfer of both voice data services (telephony, messaging) andnon-voice data (such as downloading Internet information, exchanging email, and instant messaging). The highdata speeds, measured in Mbps, are significantly higher than 2G and 3G networks technology enable full motionvideo, high-speed internet access and video-conferencing. 3G technology standards include UMTS, based onWCDMA technology (quite often the two terms are used interchangeably) and CDMA2000.
Access charge: Amount charged per minute by national operators for the use of their network by operators ofother networks. Also known as an “interconnection charge”.
ADSL (Asymmetric Digital Subscriber Line): A modem technology which converts existing twisted-pairtelephone lines into access paths for multimedia and high-speed data communications. ADSL can transmit up to 6Mbps to a subscriber, and up to as 832 Kbps or more in both directions. Such rates expand existing accesscapacity by a factor of 50 or more without new cabling.
Analog: A transmission which is not digital, e.g., the representation of voice, video or other not in digital form.
Analog network: A network using analog technology with circuit switching, capable of connecting one userwith all the others, but with limited transmission capacity.
ASTN (Automatically Switched Transport Network): Emerging architectural standard for switchedintelligent optical network for the management of the automatic signaling and routing of connection, auto-discovery and meshed optical network protection.
ATM (Asynchronous Transfer Mode): A broadband switching technology that permits the use of one networkfor different kinds of information (e.g., voice, data and video).
Backbone: A primary shared communication path that serves multiple networks and may facilitatecommunications between different protocols.
Broadband and broadband services: Services characterized by a transmission speed of 2 Mbit/s or more.According to international standards, these services are divided into two categories: (i) Interactive services,including videotelephone/videoconferencing (both point-to-point and multipoint); videomonitoring;interconnection of local networks; file transfer; CAD; high-speed fax; e-mail for moving images or mixeddocuments; broadband videotext; Video on demand; retrieval of sound programs or fixed and moving images; and(ii) Broadcast services, such as sound programs, television programs (including high-definition TV and pay TV)and selective document acquisition.
Broadcast: Simultaneous transmission of information to all nodes and terminal equipment of a network.
BSC (Base Station Controller): Interface with the MSC switching exchange. Has the task of supervising andcontrolling radio resources, both during the phase when a call is being set up and during the maintenance phase.
BSS (Business Support System): The system used by network operators to manage business operations suchas billing, sales management, customer-service management and customer databases. A type of OperationsSupport System (OSS).
74

Item 4. Information On The Telecom Italia Group Glossary Of Selected Telecommunications Terms
BTS (Base Transceiver Station): Radio base station which sends the GSM radio signal via the antenna tocover an area (cell) and coordinates one or more radio transceivers (TRX).
BWA (Broadband Wireless Access): Technology aimed at providing wireless access to data networks, withhigh data rates and providing data transmission up to a theoretical limit of 52 Mbit/s downstream and 12 Mbit/supstream over a single twisted pair of wires. VDSL is capable of supporting high bandwidth applications such asHDTV. From the point of view of connectivity, broadband wireless access is equivalent to broadband wired access,such as ADSL or cable modems. One particular broadband wireless access technology is being standardized byIEEE 802.16 also known as WiMAX.
Carrier: Traditionally, the carrier is the company that makes available the physical lines.
CATV (Cable television): Cable or fiber-based distribution of TV programs.
CDMA (Code Division Multiple Access): A digital wireless technology used in radio communication fortransmission between a mobile phone and a radio base station. CDMA was developed by Qualcomm, andcommercially introduced in 1995. It enables the simultaneous transmission and reception of several messages,each of which has a coded identity to distinguish it from the other messages.
Cells: Geographical portion of the territory illuminated by a BTS: 900MHz / 1800MHz.
Cellular: A technique used in mobile radio technology to use the same spectrum of frequencies in one networkmultiple times. Low power radio transmitters are used to cover a “cell” (i.e., a limited area) so that thefrequencies in use can be reused without interference for other parts of the network.
Channel: The portion of a communications system that connects a source to one or more destinations. Alsocalled circuit, line, link or path.
Client server: Software programme that is used to contact and obtain data from a Server software programmeon another computer. Each Client programme is designed to work with one or more specific kinds of Serverprogrammes, and each Server requires a specific kind of Client. This configuration model is opposed to aPeer-to-Peer configuration, where the contact is performed on the same level.
Closed User Group: A group of telecommunications users that share a longstanding economic interest. Thisdefinition has arisen in a regulatory context; it permits the partial liberalization of some telecommunicationsservices.
Coaxial cable: A type of electrical cable in which a central conductor covered by an insulator is thensurrounded with a cylindrical conducting sheath whose axis coincides with that of the central conductor, hencethe term “coaxial”.
Corporate Network: A network, which can be a virtual private network, provided by a corporation for its ownuse and possibly for that of other corporations. The network’s features are tailor-made to address the specificneeds of the client. It is separate from the network provided by the national telecommunications carrier, but itmay be connected to the latter for the use of selected facilities.
CPS (Carrier Pre-selection): Permits a customer to pre-select another operator as an alternative to TelecomItalia without dialing an identifying code.
D-AMPS (Digital-Advanced Mobile Phone Service): It is a digital version of AMPS (Advanced MobilePhone Service), the original analog standard for cellular telephone phone service in the United States.
Data Network Access Point: Unit of measurement used in the data network business.
DCS 1800 (Digital Communication System): A derivative of the GSM cellular mobile telephone standard.“1800” refers to the frequency used of 1800 MHz. DCS 1800 is the European PCN standard.
Digital: A mode of representing a physical variable such as speech using digits 0 and 1 only. The digits aretransmitted in binary form as a series of pulses. Digital networks are rapidly replacing the older analog ones. They
75
Item 4. Information On The Telecom Italia Group Glossary Of Selected Telecommunications Terms
allow for higher capacity and higher flexibility through the use of computer-related technology for thetransmission and manipulation of telephone calls. Digital systems offer lower noise interference and canincorporate encryption as a protection from external interference.
Digital Terrestrial TV: Digital Terrestrial Television Broadcasting is a new type of broadcasting technology thatprovides a more effective way of transmitting television services using a digital system instead of the existinganalogue system.
District traffic: Long distance telephone calls within the same area code.
DSL Network (Digital Subscriber Line Network): A network built on existing telephone lines with DSLtechnology devices which use sophisticated modulation schemes to pack data onto copper wires for connectionsfrom a telephone switching station to a home or office.
DVB-H (Digital Video Broadcasting-Handheld): DVB-H technology combines digital video with the InternetProtocol (IP): contents are subdivided into packets using the same basic technology employed by the Internet.The use of IP technology allows the transmission of TV and radio programmes, web pages, music and videogames to smartphones/PDA’s.
DWDM (Dense Wavelength Division Multiplexing): This is a technology for multiplying and transmittingdifferent wavelengths along a single optical fibre contemporaneously.
EDGE (Enhanced Data for GSM Evolution): This is a powerful technology that increases the datatransmission rate of the GPRS standard from rates of 30-40 kbit/s to more than 100 kbit/s and even up to200 kbit/s with optimal radio conditions.
ETSI (European Telecommunications Standards Institute): A not-for-profit enterprise whose mission is toproduce the telecommunications standards that will be used throughout Europe. Some of the standardsdeveloped by the ETSI may be adopted by the European Commission as the technical base for directives orregulations. The ETSI’s main task is to remove any possible variation from a global standard and to focus on adefined European-specific set of requirements. The ETSI also ensures that there is interoperability betweenstandards, such as Integrated Services Digital Network (ISDN), Global Systems for Mobile Communications (GSM)and Universal Mobile Telecommunications System (UMTS).
Exchange: See Switch.
Flat rate: The rate applied by providers to users surfing the web. It is usually a fixed monthly rate for asubscription to a specific Internet Service Provider, aside from the number of connection hours to the Net.
Frame Relay: A data transmission service using fast protocols based on direct use of transmission lines.
Gateway: A connection between the LANs and WANs of one or more suppliers. Can also mean the access nodesto international networks of various kinds.
GPRS (General Packet Radio Service): This is the data service for GSM and is the European standard digitalcellular service.
GPS (Global Positioning System): A constellation of satellites, orbiting the Earth two times a day, that is ableto pinpoint precisely the location of a certain object on Earth.
GRX (GPRS Roaming eXchange for Mobile Operators): The GRX service allows Mobile Operators tointerconnect GPRS networks around the world and offer global GPRS roaming coverage.
GSM (Global System for Mobile Communications): A standard for mobile cellular telephony used inEurope, Asia, South Africa and Australia, based on digital transmission and cellular network architecture withroaming.
GSM TIM Card: A prepaid, rechargeable card which permits the TIM mobile customer to make outgoing callsup to the limit of the card and receive an unlimited number of calls.
76

Item 4. Information On The Telecom Italia Group Glossary Of Selected Telecommunications Terms
HDSL (High-bit-rate Digital Subscriber Line): Technology for business customers which allows theprovision of local loop circuits at higher speeds and lower cost than through conventional means.
HSDPA (High-Speed Downlink Packet Access/UMTS Hi Speed—Universal Mobile TelecommunicationsSystem): UMTS evolution allows broadband connections up to 3.6 Mbps.
ICT (Information and communication(s) technology): Broad area concerned with information technology,telecommunications networking and services and other aspects of managing and processing information,especially in large organizations.
IEEE (Institute of Electrical and Electronics Engineers): An organization of engineers, scientists andstudents involved in electrical, electronics and related fields. IEEE also functions as a publishing house andstandards body.
IMSS/MSEM (Italtel Multi Service Solution/Multi Service Element Manager): It’s a proprietary platformfor the management of the whole network. Refer to a software switch that is compatible with many protocol typefor IP communication and network interworking as SIP, H323, MGCP and H248. The supplier is ITALTEL.
IN (Intelligent Network): Network architecture that centralized processing of calls and billing information forcalls.
Interactive: Allowing the user to change some aspect of the program.
Internet: The world’s best-known data network. Initially used by the U.S. Department of Defense, the Internetnow provides an interface for networks based on different technologies (LANs, WANs, data networks, etc.), butwhich use the TCP/IP protocol platform.
Internet Protocol TV or IPTV: The service provides the distribution of television channels over Internetconnections using the IP protocol. More than just duplicating a distribution means, IPTV enables interactiveservices so that the viewer can interact with the show as it is broadcast.
IP (Internet Protocol): A standard describing the software that keeps track of the Internet’s addresses fordifferent nodes, routes outgoing messages and recognized incoming messages.
IP/MPLS (Internet Protocol/Multi Protocol Labeling Switching): A packet switching protocol to optimizenetwork behaviors of mapping Layer3 (IP) end-to-end data flow to Layer2 traffic between adjacent networknodes.
ISDN (Integrated Services Digital Network): A system in which several services (e.g., speech and data) maybe simultaneously transmitted end to end in digital form.
ISPs (Internet Service Provider): A vendor who provides access to the Internet and World Wide Web.
ITU (International Telecommunication Union): The worldwide policy, spectrum regulation andstandardization body in telecommunication operating under the auspices of the United Nations.
LAN (Local Area Network): A private network that covers a local geographic area and provides publictelecommunications services as well as interconnection between personal computers.
Local Loop: Copper wire-couple, through which the telephone connection reaches users; it is the foundation oftraditional telephone lines and it is often called “last mile”.
MAS (Metro Access System): A network element based on CWDM (Course Wavelength Division Multiplexing)technology.
MGCP (Media Gateway Control Protocol): An Internet Engineering Task Force (IETF) signaling protocolproposal allowing a bridge between classic telephone networks and Internet (i.e., IP-based) infrastructures.
77

Item 4. Information On The Telecom Italia Group Glossary Of Selected Telecommunications Terms
MEMS (Micro-Electro-Mechanical Systems): MEMS are miniaturized devices ranging in size from a fewmicrometers to a few millimeters, which execute one or more monitoring, processing or actuation functions bydeploying a combination of electronic, mechanical, optical, chemical or biological components integrated on ausually silicon hybrid circuit.
MGW (Media GateWay): Junction for the connections which carry user traffic.
MMS (Mobile Multimedia Services): Represent an evolution of the SMS and the EMS service using variousmono-medial elements (text, design, photos, video-clips and audio), which are synchronized and combinedallowing them to be packed together and sent to GSM-GPRS platforms.
Modem: Modulator/Demodulator. A device that modulates digital data to allow their transmission on analogchannels, generally consisting of telephone lines.
MPLS (Multi Protocol Label Switching): A packet switching protocol to optimize network behaviors ofmapping Layer3 end-to-end data flow to Layer2 traffic between adjacent network nodes.
MS SPRING: A form of traffic protection mechanism for the equipment.
MSC (Mobile Switching Center): Executes functions such as controlling calls, switching traffic, taxation,controlling network interfaces and acts as an interface with other networks.
MSP: The name of a general purpose programmable switch made by Redcom Laboratories.
Multimedia: A service involving two or more communications media (e.g., voice, video, text, etc.) and hybridproducts created through their interaction.
Network: An interconnected collection of elements. In a telephone network, these consist of switchesconnected to each other and to customer equipment. The transmission equipment may be based on fiber optic ormetallic cable or point to point radio connections.
NGN (Non-Geographic Number): The non-geographic numbers are unique as they are by definition notassociated with any particular geographic location (e.g. premium rate services, toll free, directory assistanceservices).
NNI Agreements (Network Node Interface Agreements): Contractual agreements for the interfacebetween two public network pieces of equipment (“NNI”).
Node: Topological network junction, commonly a switching center or station.
Node B (counterpart of BTS in GSM): This is the Radio Base Station in UMTS technology which, via anantenna, sends the UMTS radio signal which creates the coverage of the cell (typically 3 for Node B). It alsoperforms functions which are strictly associated with managing the radio connection.
OLOs (Other Licensed Operators): Companies other than the incumbent operator which operatetelecommunications systems in a national market.
ONP (Open Network Provision): Principles and conditions laid down by the EU for access to and usage ofpublic telecommunications networks and services. A network architecture that permits telecommunicationsservices to be offered on facilities of public operators and for equipment to be connected to such networks.
Optical fiber: Thin glass, silicia or plastic wires, building the interstructure base for data transmission. Anoptical fiber cable contains several individual fibers, and each of them is capable of driving a signal (light impulse)at limited bandwidth. Optical fibers are usually employed for long-distance communication: they can transfer“heavy” data loads, and the signal reaches the recipient, protected from possible disturbances along the way. Theonly inconvenient are the high costs involved in the construction of an optical fiber network.
OSS (Operations Support System): Methods and procedures (whether mechanized or not) which directlysupport the daily operation of the telecommunications infrastructure.
78

Item 4. Information On The Telecom Italia Group Glossary Of Selected Telecommunications Terms
Outsourcing: Hiring outsiders to perform various telecommunications services, which may include planning,construction, or hosting of a network or specific equipment belonging to a company, and, ultimately, themanagement of entire telecommunications systems. Value-added applications may also be provided in varioussectors.
PABX (Private Automatic Branch Exchange): Telephone switchboard for private use, but linked to thenational telephone network.
Pard CDN: Points of access to a data network realized by direct digital circuits.
Pard CDA: Points of access to a data network realized by direct analog circuits.
Packet-Switched Services: Data services based on parceling or breaking the data stream into packets andswitching the individual packets. Information transmitted (whether voice or data) is segmented into cells of astandardized length, which are then transmitted independently of one another, allowing maximization of availablecapacity and usage of single transmission path for multiple communications. The cells are then reassembled uponreaching their destination.
Pay-Per-View or PPV: A system by which the viewer pays to see a single program (such as a sporting event,film or concert) at the moment at which it is transmitted or broadcast.
Pay TV: Paid-for TV channels. To receive Pay TV or Pay-Per-View programs, a decoder must be connected tothe television set, and a conditional access system.
PCS: Personal communications services.
PDA (Personal Digital Assistant): A handheld computer with a memory size up to several megabytes and atouch-sensitive screen, often using a stylus to input data. The PDA is mainly used for calendar, address book andmemoranda functions, but can incorporate advanced office or multimedia functions such as voice calls,messaging, video, mp3 player, etc..
Penetration: The measurement of the take-up of services. As of any date, the penetration is calculated bydividing the number of subscribers by the population to which the service is available and multiplying the quotientby 100.
Platform: The total input, including hardware, software, operating equipment and procedures, for producing(production platform) or managing (management platform) a particular service (service platform).
POP (Point Of Presence): Internet provider locations for network connection, often through dial-up phonelines. When a Pop is within a specific local area, users can connect to the Internet by dialing a local phonenumber.
POTS (Plain Old Telephone Service): Refers to the basic telephony service (homes use) supplying standard,single-line telephones, fixed-line services and access to public voice telephony network. In contrast, telephoneservices based on digital communications lines, such as ISDN, are not POTS. The main distinctions between POTSand non-POTS services are speed and bandwidth. POTS is generally restricted to about 52 Kbps.
PSTN (Public Switched Telephone Network): The public telephone network delivering the basic telephoneservice and, in certain circumstances, more advanced services.
RNC (Radio Network Controller—counterpart of BSC in GSM): Supervises and controls radio resources,both during the phase of setting up the call, and during the maintenance phase (for example, handover betweendifferent cells). Furthermore, it handles connectivity from and towards: Node B, MSC*, and other RNC.
Roaming: A function that enables wireless subscribers to use the service on networks of operators other thanthe one with which they signed their initial contract.
RoF (Radio Over Fiber): A technology to feed antennas with digital/analogue signals over optical fiber.
79
Item 4. Information On The Telecom Italia Group Glossary Of Selected Telecommunications Terms
RTG: Is the network of the world’s public circuit-switched telephone networks in much the same way that theInternet is the network of the world’s public IP-based packet-switched networks.
Satellite services: Satellites are used, among other things, for links with countries that cannot be reached bycable or as an alternative to cable and to form closed user networks.
SDH Standard (Synchronous Digital Hierarchy): The European standard for high-speed digital transmission.
SDSL (Symmetrical Digital Subscriber Line): Also known as HDSL.
Service Provider: The party that provides end users and content providers with a range of services, including aproprietary, exclusive or third-party service center.
SGT (Transit exchange interconnection level for telephone traffic): Transit Exchange for telephone trafficcarriage, routing and transmission.
SGU (Local exchange interconnection level for telephone traffic): Local Exchange for telephone trafficcarriage, routing and transmission.
SME: The small- and medium-size enterprise market which consists of businesses having between 3 and 50employees.
SMS (Short Message Service): Short text messages than can be received and sent through GSM-networkconnected cellular phones. The maximum text length is 160 alpha-numerical characters.
SNCP: A form of traffic protection mechanism for the equipment.
SOHO: The small office/home office market which consists of businesses that use telephone lines to connect tothe Internet, as opposed to dedicated lines, and is made up of small businesses, generally with one or twoemployees, and businesses conducted out of the home.
SPP (Service Provider Portability): Allows an end user to retain the same directory number after changingfrom one service provider to another.
Switch: These are used to set up and route telephone calls either to the number called or to the next switchamong the path. They may also record information for billing and control purposes.
Switched Transit Traffic: Calls placed between two other countries that are routed through the Italian fixednetwork.
Synchronous: Type of data transmission in which there is permanent synchronization between the transmitterand the receiver.
TACS (Total Access Communication System): An analog cellular network using the 900 MHz band based ona European standard also used in the UK, Ireland, Austria and Spain. Features include handover and availableadd-on services include answering, call notification, call transfer, differentiation of business and private calls,authorization code for outgoing international calls and itemized billing.
TDMA (Time Division Multiple Access): A technology for digital transmission of radio signals between, forexample, a mobile phone and a radio base station. TDMA breaks signals into sequential pieces of defined length,places each piece into an information conduit at specific intervals and then reconstructs the pieces at the end ofthe conduit.
UMA (Unlicensed Mobile Access): Technology that provides access to mobile services over unlicensedspectrum technologies, such as Bluetooth and IEEE 802.11 b/g. By deploying UMA technology, service providerscan enable subscribers to roam and handover between cellular networks and public and private unlicensedwireless networks using dual-mode mobile handsets.
80
Item 4. Information On The Telecom Italia Group Glossary Of Selected Telecommunications Terms
UMTS (Universal Mobile Telecommunication System): Third-generation mobile communication standard.Data travel at 2Mb-per-second.
UMTS Cells: Geographical portion of the territory illuminated by a Node B.
UMTS Channels: These enable all the customers of the cell to access both the CS (Circuit Switched) servicesand the PS (Packet Switched) services of UMTS technology.
Unbundling: A process which allows telephone carriers (other than Telecom Italia) to lease the last part of thetelephone loop, that is to say, the copper wire-cable, connecting Telecom Italia central station to the user’s home,disconnecting the user from Telecom terminals and connecting him/her to the telephone carrier’s terminals.
Universal service: The obligation to supply basic service to all users throughout the national territory atreasonable prices.
VAN (Value–added Network): A type of public network that leases basic transmission facilities from acommon carrier, adds features that enhance the service and provides the improved communications capability toend users. Automatic alternate routing network management and error correction are examples of the valueadded.
VAS (Value Added Services): Value Added Services provide a higher level of functionality than the basictransmission services offered by a telecommunications network for the transfer of information among itsterminals, which include wired or wireless switched-circuit analog voice communications; direct “unrestricted”digital point-to-point service at 9,600 bit/s; packet switching (virtual call); direct broadband analog transmissionof TV signals, and supplementary services, such as closed user groups; call waiting; collect calls; call forwarding,and identification of number called. Value Added Services performed by the network, the terminals or thespecialized centers include message handling services (MHS) (which can be used, among other things, forcommercial documents in predetermined formats); electronic directories listing users, network addressees andterminals; e-mail; fax; teletex; videotext and videotelephone. Value Added Services could include also value addedvoice telephony services such as Freephone or Premium Rate Services.
VDSL (Very-high-data-rate Digital Subscriber Line): One of four DSL technologies (very high bit-rate DSL)providing data transmission up to a theoretical limit of 52 Mbit/s downstream and 12 Mbit/s upstream over asingle twisted pair of wires. VDSL is capable of supporting high bandwidth applications such as HDTV. The higherlimit of date rate of VDSL is limited by the distance from the exchange.
Videotext: A service pursuant to an ITU standard, permitting remote access to a database by telephone.
VoIP (Voice over IP): Transmission of voice communications over Internet Protocol (IP) data networks, suchas IP-based LANs, intranets or the Internet. Many carriers offer integrated services such as voice and data over asingle “pipe.”
VPN (Virtual Private Network): A network designed for a business or government agency, using theinfrastructures of a carrier and providing customized services, and which operates in such a manner as to appeardedicated to the user thereof.
WAN (Wide Area Network): A private network that covers a wide geographic area using publictelecommunications services.
WAP (Wireless Application Protocol): A technology which allows access to the Internet using mobile sets,even without the use of a computer.
WI-FI: A service for wireless Internet connection and high speed access.
WLL (Wireless Local Loop): The means of configuring a local loop without the use of wiring.
XSDL ((generic) Digital Subscriber Line): A generic term for DSL equipment, services and technologieswhich provide extremely high bandwidth over the twisted-pair lines that run from a phone company’s centraloffice to a home or office.
81
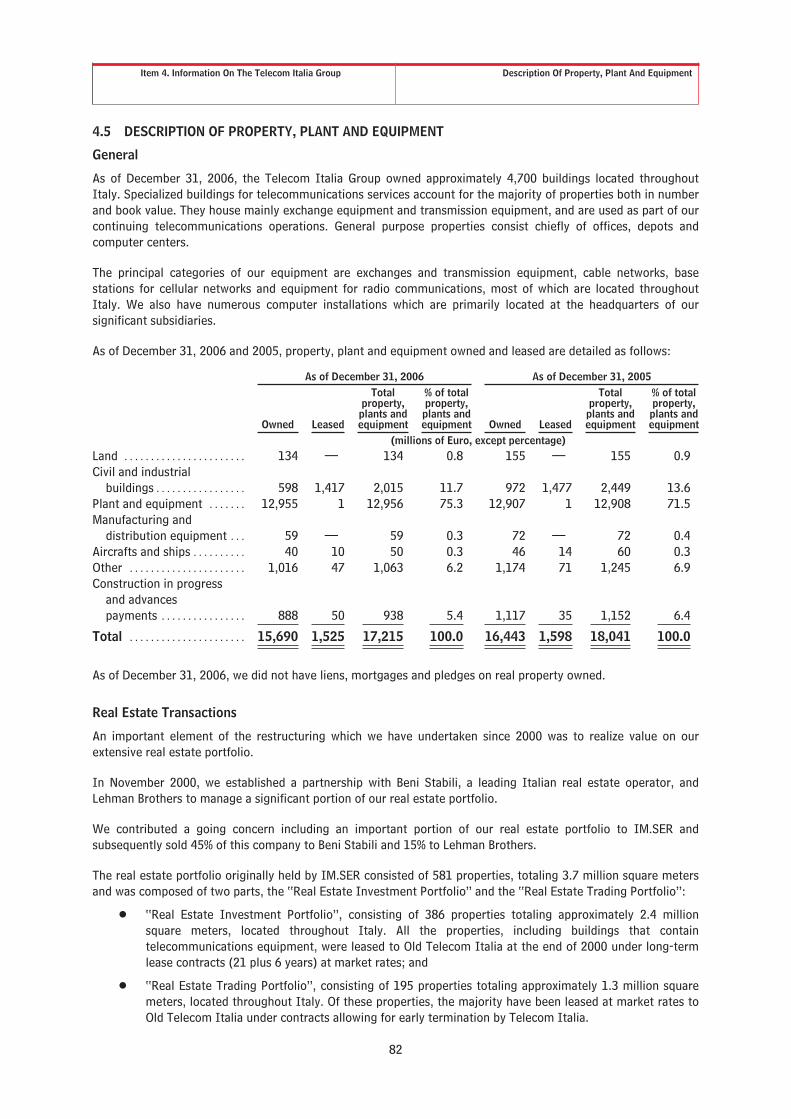
Item 4. Information On The Telecom Italia Group Description Of Property, Plant And Equipment
4.5 DESCRIPTION OF PROPERTY, PLANT AND EQUIPMENT
General
As of December 31, 2006, the Telecom Italia Group owned approximately 4,700 buildings located throughoutItaly. Specialized buildings for telecommunications services account for the majority of properties both in numberand book value. They house mainly exchange equipment and transmission equipment, and are used as part of ourcontinuing telecommunications operations. General purpose properties consist chiefly of offices, depots andcomputer centers.
The principal categories of our equipment are exchanges and transmission equipment, cable networks, basestations for cellular networks and equipment for radio communications, most of which are located throughoutItaly. We also have numerous computer installations which are primarily located at the headquarters of oursignificant subsidiaries.
As of December 31, 2006 and 2005, property, plant and equipment owned and leased are detailed as follows:
As of December 31, 2006 As of December 31, 2005
Owned Leased
Totalproperty,plants andequipment
% of totalproperty,plants andequipment Owned Leased
Totalproperty,plants andequipment
% of totalproperty,plants andequipment
(millions of Euro, except percentage)Land . . . . . . . . . . . . . . . . . . . . . . . 134 — 134 0.8 155 — 155 0.9Civil and industrial
buildings . . . . . . . . . . . . . . . . . 598 1,417 2,015 11.7 972 1,477 2,449 13.6Plant and equipment . . . . . . . 12,955 1 12,956 75.3 12,907 1 12,908 71.5Manufacturing and
distribution equipment . . . 59 — 59 0.3 72 — 72 0.4Aircrafts and ships . . . . . . . . . . 40 10 50 0.3 46 14 60 0.3Other . . . . . . . . . . . . . . . . . . . . . . 1,016 47 1,063 6.2 1,174 71 1,245 6.9Construction in progress
and advancespayments . . . . . . . . . . . . . . . . 888 50 938 5.4 1,117 35 1,152 6.4
Total . . . . . . . . . . . . . . . . . . . . . . 15,690 1,525 17,215 100.0 16,443 1,598 18,041 100.0
As of December 31, 2006, we did not have liens, mortgages and pledges on real property owned.
Real Estate Transactions
An important element of the restructuring which we have undertaken since 2000 was to realize value on ourextensive real estate portfolio.
In November 2000, we established a partnership with Beni Stabili, a leading Italian real estate operator, andLehman Brothers to manage a significant portion of our real estate portfolio.
We contributed a going concern including an important portion of our real estate portfolio to IM.SER andsubsequently sold 45% of this company to Beni Stabili and 15% to Lehman Brothers.
The real estate portfolio originally held by IM.SER consisted of 581 properties, totaling 3.7 million square metersand was composed of two parts, the “Real Estate Investment Portfolio” and the “Real Estate Trading Portfolio”:
Š “Real Estate Investment Portfolio”, consisting of 386 properties totaling approximately 2.4 millionsquare meters, located throughout Italy. All the properties, including buildings that containtelecommunications equipment, were leased to Old Telecom Italia at the end of 2000 under long-termlease contracts (21 plus 6 years) at market rates; and
Š “Real Estate Trading Portfolio”, consisting of 195 properties totaling approximately 1.3 million squaremeters, located throughout Italy. Of these properties, the majority have been leased at market rates toOld Telecom Italia under contracts allowing for early termination by Telecom Italia.
82

Item 4. Information On The Telecom Italia Group Description Of Property, Plant And Equipment
In May 2001, IM.SER contributed its Real Estate Trading Portfolio to Telemaco Immobiliare, a newly formedcompany. Following such contribution, IM.SER sold the shares of Telemaco Immobiliare to its shareholders. Theshareholders of Telemaco Immobiliare at that time were Beni Stabili with a 45% stake, Telecom Italia with a 40%stake and Lehman Brothers with a 15% stake.
On May 16, 2001, Beni Stabili exercised an option to buy the Lehman Brothers’ stake in IM.SER, resulting in BeniStabili holding a 60% stake in IM.SER and Old Telecom Italia a 40% stake.
Since 2002 certain additional real estate related transactions were completed.
Tiglio Project
Pursuant to a framework agreement signed in May 2002, among the Pirelli Group, Olivetti-Telecom Italia Groupand The Morgan Stanley Real Estate Funds (through MSMC Italy Holding B.V. and POPOY Holding B.V.), certainreal estate properties as well as the entities that provide real estate services to the same companies or to theirsubsidiaries were transferred to two new vehicle companies set up for this purpose (Tiglio I S.r.l. and Tiglio IIS.r.l.).
Among the preliminary transactions for the concentration of the real estate assets in Tiglio I and Tiglio II, onOctober 24, 2002, the non-proportional partial spin-off of IM.SER (60% Beni Stabili and 40% Telecom Italia) waseffected by which the real estate assets were contributed to the company IM SER 60 (98% Beni Stabili group and2% Telecom Italia) and to the company EMSA Immobiliare (100% controlled by Telecom Italia) in proportion tothe stakes held in IM.SER, respectively, by Beni Stabili and Telecom Italia.
Following this transaction, which came after the completion of the securitization of IM SER 60’s debt andacquisition of certain tangible asset by companies in the Seat Pagine Gialle group, EMSA Immobiliare had aportfolio of 169 real estate properties.
On October 29, 2002, the first stage of the Tiglio Project was concluded, through:
Š the subscription by Old Telecom Italia, simultaneously with all the other participants, to a capitalincrease by Tiglio I for cash, with the resulting stake in the company equaling 36.85% (in addition, atOld Telecom Italia Group level, to the 2.1% subscribed to by Seat Pagine Gialle), in proportion to thevalue of the assets transferred by Old Telecom Italia (and by Seat Pagine Gialle) to Tiglio I to the totalassets that were taken over by Tiglio I;
Š the subscription to a capital increase by Tiglio II paid for in kind by the contribution of Old TelecomItalia’s “Asset Management” business segment with resulting stake in the company equaling 49.47%;
Š the sale—directly and through the subsidiary Saiat—of the investment in Telimm S.r.l. to the companyMSMC Immobiliare Holding (entirely controlled by Tiglio I).
With reference to the part of the Tiglio Project regarding the optimization of the service activities, in November2002, Telecom Italia sold its “Property Management”, “Project Management” and “Agency” businesses to thePirelli & C. Real Estate group.
The above mentioned transactions gave rise to a total gross capital gain for the Telecom Italia Group of €234million.
Finally, as agreed between the parties, December 24, 2002 marked the completion of the merger by absorption, inTiglio I and Tiglio II, of the real estate investment holdings owned by them—falling under the Tiglio Project andalready 100% controlled, directly or indirectly; resulting in the optimization of the corporate structure of the twocompanies, in view of the successive actions to leverage the assets on the market.
In particular, the second stage of the Tiglio Project consisted of the change of asset ownership, through transfersto real estate funds, or through completion of certain other transfers. The real property has been divided intoseveral categories (office, industrial portfolio, trading portfolio, etc.), in order to optimize Tiglio I and Tiglio IIshareholders’ profit, and also into take account the real estate funds’ market features.
83

Item 4. Information On The Telecom Italia Group Description Of Property, Plant And Equipment
Under the second stage of the Tiglio project, in 2004 the following real estate funds were placed in the market:
Š “TECLA—FONDO UFFICI”—placement closed on March 1, 2004. The Fund consisted of a contributionon the part of Tiglio I (45.70%-owned by Telecom Italia) of a real estate portfolio including 65properties for a total market value of approximately €926 million, to which a 15% discount was appliedby virtue of their transfer en masse, in addition to a contribution of €25 million in cash. The total offer,net of indebtedness equal to 60% of the value contributed, amounted to €288 million, of which 10% waskept by Tiglio I, 2% was subscribed by Pirelli & C. Real Estate Società di Gestione del Risparmio S.p.A.as manager of the fund, while the remaining 88% was entirely placed on the market.
Š “CLOE FONDO UFFICI”—placed on the market on June 29, 2004. The Fund consisted of 39 propertiescontributed by Tiglio I for a market value equal to approximately €877 million, to which a 15% discountwas applied by virtue of their transfer en masse. The total offer, net of financial indebtedness equal to60% of the value contributed, amounted to approximately €298 million, of which 5% was subscribed byPirelli & C. Real Estate Società di Gestione del Risparmio S.p.A. as manager of the fund, while theremaining 95% was placed entirely with Italian investors (approximately 70%) and with foreigninvestors (approximately 30%.)
Š “OLINDA FONDO SHOPS”—placement offered to both qualified investors and the public closed onDecember 6, 2004. The Fund was officially listed on December 9, 2004. The company “Tiglio II”contributed three properties which did not originate from and were not used by the Telecom ItaliaGroup. A total of 42 properties were contributed to the Fund, all of which have a commercial use or canbe converted to such use, with a market value of over €562 million. The offer also called for inflows offinancial resources earmarked for the purchase of two entertainment centers which took place inDecember 2004. After these purchases, the Olinda Fund consisted of 44 properties with a market valueof approximately €742 million. The value of the Fund is approximately €261 million.
Š “CLARICE LIGHT INDUSTRIAL”—placement with qualified investors on December 16, 2004. The Fundconsisted of 27 properties transferred by Tiglio I and 43 properties transferred by Tiglio II, for a totalmarket value of €221 million, to which a 9% discount was applied by virtue of their transfer en masse.The contribution value was thus equal to €201 million and the value of the fund, after taking intoaccount financial indebtedness of approximately 55% of the contribution value, was approximately €90million. The Fund was entirely placed with European investors.
Š “BERENICE—FONDO UFFICI”—placement closed on July 14, 2005. The Fund consisted of 54properties transferred by five private parties, including Tiglio I (8 buildings) and Tiglio II (37 buildings),for a total market value of €860 million, to which a 13% discount was applied by virtue of their transferen masse. The contribution value was thus equal to €750 million and the value of the fund, after takinginto account financial indebtedness, was approximately €300 million. The Fund was entirely placed withItalian and European investors.
Subsequent to these transactions:
Š in 2004, Tiglio I and Tiglio II proceeded to distribute cash to the shareholders in the form of areimbursement of capital (additional paid-in capital) and the repayment of loans. For the Telecom ItaliaGroup, total receipts were approximately €104 million, of which €79 million was from Tiglio I and€25 million from Tiglio II;
Š in September 2005, Tiglio I and Tiglio II proceeded to distribute cash to the shareholders in the form ofa reimbursement of capital (additional paid-in capital) for €29.7 million and €33.1 million to TelecomItalia S.p.A., respectively. Furthermore, Tiglio II, resolved to pay dividends and Telecom Italia S.p.A. isentitled to €11.4 million, of which €8.9 million has already been received and €2.5 million is still to becollected;
Š in 2006, Tiglio I e Tiglio II distributed cash to the shareholders in the form of a reimbursement ofcapital (additional paid-in capital) for a total amount of approximately €31 million. Tiglio I approved adistribution of €24 million—collected in full—of which €23 million was Telecom Italia’s share and€1 million was Telecom Italia Media’s share. Tiglio II approved a distribution to Telecom Italia of€7 million, also collected in full during 2006. Furthermore, Tiglio II approved the distribution ofdividends to Telecom Italia for €2 million, collected in March 2006, and also made a payment of€3 million to Telecom Italia for its share of the distribution of dividends declared in 2005 which had not
84

Item 4. Information On The Telecom Italia Group Description Of Property, Plant And Equipment
yet been paid. Tiglio II, finally, approved the reduction in share capital and reimbursed theshareholders. Telecom Italia’s share amounts to an income of €4 million which was almost entirelycollected in December 2006.
Magnum Project
In order to optimize the physical space occupied by network equipment and to gradually free part of the buildingsused for such equipment, in 2005 the Board of Directors of Telecom Italia approved the sale of more than 1,300properties for a total amount of about €1 billion. The first part of this project was completed in 2005 and involved867 buildings. On March 1, 2006, June 1, 2006 and on November 17, 2006, Telecom Italia S.p.A. transferred,respectively, a second tranche consisting of 348 buildings, a third tranche consisting of 116 buildings and a fourthtranche consisting of 47 buildings to the subsidiary Olivetti Multiservices (“OMS”), and, at the same time, therelative lease contracts were signed.
Following two Framework Agreements in December 2005 (later amended on June 21, 2006) between TelecomItalia and OMS on one hand and Pirelli & C. Real Estate and other parties on the other, aimed at transferring theassets to closed-end real estate investment funds, (namely the “Raissa” and “Spazio Industriale” funds) thefollowing transactions took place:
Š on March 29, 2006, OMS contributed a second group of 201 properties to the Raissa Fund (27 of whichare under a simultaneous long-term finance leaseback) with a contribution value of €158 million and atthe same time transferred the financial debt of €97 million assumed beforehand by OMS. The majorityof the shares of the Raissa Fund that came from the properties contributed was sold to institutionalinvestors headed by The Morgan Stanley Real Estate Funds. Pirelli RE has a 35% stake in the RaissaFund under a joint venture with the same funds;
Š on March 30, 2006, OMS contributed a second group of 120 properties to the Spazio Industriale Fundwith a contribution value of €71 million and at the same time transferred the financial debt of€60 million assumed beforehand by OMS. The majority of the shares of the Spazio Industriale Fund thatcame from the properties contributed was sold to institutional investors headed by Cypress GroveInternational Funds. Pirelli RE has a 35% stake in the Spazio Industriale Fund under a joint venture withthe same funds;
Š on June 26, 2006, OMS contributed a third group of 54 properties to the Spazio Industriale Fund with acontribution value of €41 million and at the same time transferred the financial debt of €35 millionassumed beforehand by OMS. The majority of the shares of the Spazio Industriale Fund that came fromthe properties contributed was sold to institutional investors headed by Cypress Grove InternationalFunds;
Š on June 29, 2006, OMS contributed a third group of 57 properties to the Raissa Fund (13 of which areunder a simultaneous long-term finance leaseback) with a contribution value of €47 million and at thesame time transferred the financial debt of €29 million assumed beforehand by OMS. The majority ofthe shares of the Raissa Fund that came from the properties contributed was sold to institutionalinvestors headed by The Morgan Stanley Real Estate Funds;
Š on December 14, 2006, OMS contributed a fourth group of 33 properties to the Raissa Fund (5 of whichare under a simultaneous long-term finance leaseback) with a contribution value of €30 million and atthe same time transferred the financial debt of €18 million assumed beforehand by OMS. The majorityof the shares of the Raissa Fund that came from the properties contributed was sold to institutionalinvestors headed by The Morgan Stanley Real Estate Funds;
Š on December 20, 2006, OMS contributed a fourth group of 7 properties to the Spazio Industriale Fundwith a contribution value of €3 million and at the same time transferred the financial debt of €2 millionassumed beforehand by OMS. The majority of the shares of the Spazio Industriale Fund that came fromthe properties contributed was sold to institutional investors headed by Cypress Grove InternationalFunds.
Telecom Italia Group realized a gross consolidated gain of €135 million on the above-described transactions and apositive impact on the consolidated financial debt of the Group of €296 million before taxes.
With reference to the properties which came under the control of OMS following the transfer from Telecom Italia,OMS has 98 properties still to be monetized which are currently leased to the Company.
85

Item 4A. Unresolved Staff Comments
Item 4A. UNRESOLVED STAFF COMMENTS
None.
86
Item 5. Operating And Financial Review And Prospects General Factors Affecting The Telecom Italia Group’s Business
Item 5. OPERATING AND FINANCIAL REVIEW AND PROSPECTS
The following discussion should be read in conjunction with the Consolidated Financial Statements includedelsewhere in this Annual Report. Such financial statements have been prepared in accordance with IFRS, whichdiffer in certain material respects from U.S. GAAP. For a discussion of the principal differences between IFRS andU.S. GAAP as they relate to Telecom Italia, see “Note 46—Reconciliation of IFRS as Adopted by the EU to U.S.GAAP” of the Notes to the Consolidated Financial Statements included elsewhere herein.
5.1 GENERAL FACTORS AFFECTING THE TELECOM ITALIA GROUP’S BUSINESS
5.1.1 THE ITALIAN MARKET FOR TELECOMMUNICATIONS SERVICES
In 2006, based on external sources and internal estimates, the Italian telecommunications market grew by around3%. As a whole, this market has shown:
Š a growing process of substitution between fixed and mobile components in the traditional voicesegment;
Š broadband penetration as a strong key growth driver in both the fixed and mobile market;
Š an overall steady growth in consumption patterns.
Italy is one of the European countries with both the highest mobile penetration rate and highest absolute numberof subscribers. Italy is also a leader among European countries in terms of availability and spread of thirdgeneration mobile services.
Broadband penetration in the fixed market reached around 37% on total fixed access with a strong growth of VoIPpenetration. VoIP customers in the Italian market exceeded 1 million at the end of 2006.
Over the next three years, the market composed of telecommunication services, of ICT (InformationCommunication Technology) services and of Pay-TV is expected to continue to grow by approximately 4%annually (compound average growth rate (“CAGR”) 2006-2009) according to our estimates, with a stable “CoreTLC” market and strong growth in new business areas (ICT and IPTV) enabled by innovative technologies andplatforms.
The total Italian “Core TLC” retail market is expected to grow by approximately 1.6% annually (CAGR 2006-2009)according to our estimates.
In the short term (2007-2008) the Italian “Core TLC” market trends for revenues will be negatively influenced byregulatory actions (elimination of top-up fees—Bersani Decree (see: “Note 44-Events subsequent toDecember 31, 2006” of the Notes to the Consolidated Financial Statements included elsewhere in this AnnualReport), and international roaming costs reduction) principally in the mobile market.
As in recent years, the growth in demand for telecommunications carrier services is expected to be drivenprimarily by the development of broadband and fixed data services and by mobile telephone services.
In the Italian Wireline Retail market:
Š traditional voice services value as a whole is in the process of continuous reduction due to a slowdecline of market access lines, fixed to mobile migration and partial cannibalization by alternativecommunication solutions (e-mail, messaging, chat) on traffic and to reduction in tariffs relating tomobile termination, partially compensated in the coming years by the introduction of flat double playand triple play bundle offers that will contribute to retaining customers in the fixed network;
Š the Internet segment will continue to grow driven by broadband development that enables dual andtriple play services; there will be a strong development of Voice over IP and Value Added Internetrelated services;
Š the fixed data segment will complete the migration from traditional to broadband data transmissionsolutions and will be characterized by a slight decrease due to the renewed pressure on prices of Datatransmission solutions to Top Clients compensated by the growth of ICT solutions.
87

Item 5. Operating And Financial Review And Prospects General Factors Affecting The Telecom Italia Group’s Business
In the Italian Wireless Retail market:
Š the Italian Mobile Services market growth will be negatively influenced in the short term (2007-2008)by regulatory actions (elimination of top-up fees—Bersani Decree, and international roaming costsreduction). Apart from these regulatory actions, the Italian Mobile market trend will be driven by:
– a decreasing contribution of voice revenues to market growth due to price pressure caused by thedevelopment of flat offers and mobile virtual operators. Generally, lines, volumes and usage willcontinue to grow driven by fixed to mobile substitution;
– strong value added services growth (such as multimedia messages, browsing, contents andinteractive services) driven by migration to UMTS and broadband, innovative handsets penetrationand increasing bandwidth availability; web browsing will become a key driver of marketdevelopment;
Š the handsets market is expected to grow slightly, but is now a substitution market from GSM/GPRShandsets to innovative UMTS/HSDPA/DVBH handsets.
Telecom Italia’s market (ICT and PayTV) is expected to grow due to:
Š increased broadband penetration and bandwidth availability that fosters the adoption, by a largenumber of business customers, of Internet-enabled ICT applications and services previously availableonly locally;
Š progressive network upgrade in terms of bandwidth availability and IPTV platforms evolution will fosterthe developments of IPTV offers that let Telco operators catch the opportunity to enter in the growingPay-TV Italian market.
5.1.2 COMPETITION
We face domestic competition in all of our businesses. For details please see “Item 4. Information on theTelecom Italia Group—4.1 Business—4.1.7 Updated Strategy” and “Item 4. Information on the Telecom ItaliaGroup—4.2 Business Units—4.2.8 Competition”.
88
Item 5. Operating And Financial Review And Prospects Significant Trends Impacting Our Core Businesses
5.2 SIGNIFICANT TRENDS IMPACTING OUR CORE BUSINESSES
As described above under “—5.1 General Factors Affecting the Telecom Italia Group’s Business,” managementhas identified the following key trends that have, and will continue to have, an impact in our two main businessareas.
Š convergence of services, such as fixed and mobile voice bundled offers, dual mode access (UMA),integrated (fixed and mobile) access to messaging and content;
Š achievement of synergies from fixed/mobile integration; and
Š impact of Bersani law, self-regulation of International roaming charges and reduction of terminationcharges. For details see: “Note 44—Events subsequent to December 31, 2006”—“4.2.3 DomesticMobile—General information on services in Italy”–“4.3 Regulation—Special Status of operators havingsignificant market power”.
In addition, other key trends should continue to have a significant impact:
Wireline
Š Continuing defense of core traffic and access businesses with stabilization of traffic market share.
Š Strong development of new value added services (Voice VAS and Web Services) content and handsetscontributing to a stabilization in revenues.
Š Strong growth of Italian broadband market with significant increase of the Wireline broadband accessportfolio.
Š Strong growth of PayTV market and penetration of IPTV services.
Š Growth of ICT Market, and in particular of IT managed services to business customers, both“infrastructure based” services (development and management of activities related to IT systems,platforms and applications) and “people based” services (technical support, consulting and trainingactivities more related to business processes than to specific IT systems). Ability of increasedbroadband penetration and bandwidth availability to effectively foster the adoption of internet-enabledIT applications by business customers, and relevant effort towards ICT portfolio enrichment andpartnership development in order to increase Telecom Italia’s market share on the ICT market.
Š Consolidation of the European Broadband Project with growth of revenues and customer base inselected European countries.
Mobile
Š Continuing strong competition in the Italian market.
Š Stabilization/Growth of market share.
Š Significant growth in value added services driven by the introduction of new technologies/new handsetsand by a higher customer demand.
Š Profitable growth in the Brazilian market.
89

Item 5. Operating And Financial Review And Prospects Critical Accounting Policies And Estimates
5.3 CRITICAL ACCOUNTING POLICIES AND ESTIMATES
Our discussion and analysis of our financial condition and results of operations is based upon our ConsolidatedFinancial Statements, which have been prepared in accordance with IFRS and which, as described in “Note 46—Reconciliation of IFRS as adopted by the EU to U.S. GAAP” of the Notes to the Consolidated Financial Statementsincluded elsewhere herein, differ in certain material respects from U.S. GAAP. Our reported financial condition andresults of operations as reported under IFRS and in our reconciled U.S. GAAP financial information are based onthe application of the accounting methods which involve the use of assumptions and estimates that underlay thepreparation of our financial statements. We base our estimates on historical experience and on various otherassumptions that we believe are reasonable under the circumstances, the results of which form the basis formaking judgments about the carrying values of assets and liabilities that are not readily available. Actual resultsmay differ from these estimates under different assumptions or conditions.
Since our selection and application of accounting policies involve judgments and other assumptions affecting theapplication of those policies, reported results are sensitive to changes in conditions or assumptions ofmanagement and these are factors to be considered when reading our Consolidated Financial Statements. Webelieve the critical accounting policies described below involve the most significant assumptions and estimatesused in the preparation of our Consolidated Financial Statements under IFRS and in our reconciled U.S. GAAPinformation.
5.3.1 REVENUE RECOGNITION
Revenues are recognized to the extent that it is probable that the economic benefits will flow to the Group and therevenues can be reliably measured. Revenues are stated net of discounts, allowances, and returns. Trafficrevenues from interconnections and roaming are reported gross of the amounts due to other TLC operators.
In particular, our primary revenue streams consist of fixed line telecommunication services, mobiletelecommunication services, the sale of products including primarily telecommunication (both fixed and mobile)equipment and office products, and Internet access and related services.
Revenues related to fixed line and mobile telecommunication services, principally network access, long distancecalls, local and wireless airtime usage, are recognized when the services are provided based on the actual minutesof traffic provided and the contracted fee schedule with the customer.
Revenues from the activation of telephone services, as well as the related costs, are deferred over the expectedduration of the relationship with the customer (mainly 8 years for retail customers and 3 years for wholesalecustomers). The estimate of the duration of the customer relationship is based on historical turnover analysis.Revision of such estimates may lead to differences in the amount and timing of the recognition of revenues andexpenses.
Revenues from prepaid traffic are recorded on the basis of the minutes used at the contract price per minute.Moreover, when customers recharge their prepaid cards they pay a fixed amount as Recharging income. Therevenues from Recharging income and the relative costs (amounts paid to resellers, banks and other parties), withthe latter not exceeding the Recharging income, are deferred over the period between two subsequent recharges(about one month).
Furthermore, we have multiple element arrangements mainly in fixed and mobile business segments.
As allowed by IAS 8 (Accounting Policies Changes in Accounting Estimates and Errors), paragraph 12, to accountfor multiple element arrangements we have adopted the provisions of the Emerging Issues Task Force IssueNo. 00-21, “Accounting for Revenue Arrangements with Multiple Deliverables” (“EITF 00-21”) for multiple-element revenue arrangements entered into after December 31, 2003. EITF 00-21 requires that arrangementsinvolving the delivery of bundled products or services be separated into individual component deliverables, eachwith its own separate earnings process. Revenue relating to the bundled contract is allocated among the differentdeliverables, based on their relative fair values (the relative fair value of each of the component deliverables tothe aggregated relative fair value of the bundled deliverables). The determination of fair values in the fixed andmobile business is complex, because some of the components are price-sensitive and, thus, volatile in acompetitive marketplace. Revisions to our estimates of these relative fair values may significantly affect theallocation of sales values among the different deliverables, affecting our future operating results.
90

Item 5. Operating And Financial Review And Prospects Critical Accounting Policies And Estimates
5.3.2 ALLOWANCE FOR DOUBTFUL ACCOUNTS
Management maintains an allowance for doubtful accounts to account for estimated losses resulting from theinability of our customers to make required payments. Management bases its estimates on the ageing of ouraccounts receivable balances and our historical write-off experience with similar receivables, customer credit-worthiness and changes in our customer payment history when evaluating the adequacy of our allowance fordoubtful accounts. If the financial condition of our customers were to deteriorate, our actual write-offs might behigher than we estimate.
5.3.3 ACCOUNTING FOR TANGIBLE AND INTANGIBLE NON-CURRENT ASSETS
Accounting for tangible and intangible non-current assets involves the use of estimates for determining fair valueat the acquisition date in the case of assets acquired in a business combination. The expected useful lives ofassets with a finite life must be estimated. The determination of the fair values of assets, as well as the usefullives of the assets is based on management’s judgment. Changes in the economic conditions of the markets inwhich we operate, technology and competitive forces could significantly affect the estimated useful lives of theseassets and may lead to a difference in the timing and amount of depreciation and amortization expense.
5.3.4 ACQUISITION ACCOUNTING, GOODWILL AND PURCHASE PRICE ALLOCATION
We have entered into certain acquisitions and in the future may make further acquisitions. The calculation of thepurchase price, and the subsequent allocation of that purchase price to the fair value of the assets acquired andliabilities assumed, is critical due to the long term impact on the statement of income.
Under IFRS and U.S. GAAP, we are required to perform a purchase price allocation and, consequently, as part ofthat allocation, all consideration, including the fair value of exchanged shares, shall be valued. When equityinstruments are issued as part of the consideration, under IFRS we measure them at their fair value as of the dateof exchange whereas under U.S. GAAP we measure them by taking into account the market price for a reasonableperiod before and after the date the terms of the acquisition are agreed to and announced.
The purchase price is then allocated to the fair value of the assets acquired and liabilities assumed.
The purchase price allocation requires that all assets, liabilities and contingent liabilities be valued and thatsignificant estimates be made. A change in any of these estimates or judgments could change the amount to beallocated to a particular intangible or tangible asset. The resulting change in the purchase price allocation tonon-goodwill assets or liabilities has a direct impact on the final amount of the purchase price that cannot beallocated to a particular asset (i.e., goodwill).
If actual results differ from these estimates, or we adjust the estimated useful economic lives in future periods,operating results could be significantly affected by these estimates and judgments which involve:
Š the definition of the purchase price;
Š the identification of the assets acquired and liabilities assumed in the acquisition;
Š the valuation of these assets and liabilities in the purchase price allocation; and
Š the assessment of whether selected assets have a finite or indefinite life.
These could have a significant impact on both the level of total goodwill and ultimately on the statement ofincome.
5.3.5 ACCOUNTING FOR TRANSACTIONS ON INTERESTS IN GROUP COMPANIES
We have entered into certain acquisitions and sales of interests in Group companies, and in the future we maymake further similar transactions.
With regard to such transactions, under IFRS, in the absence of a Standard or a specific Interpretation on thematter and referring to IAS 8 (Accounting policies, changes in accounting estimates and errors), we have appliedthe following accounting treatments, identifying two types of transactions:
Š acquisition/sale of interests in companies already controlled: in the case of acquisitions, the Grouppays the minority interests in cash or with new shares and, at the same time, eliminates the relative
91

Item 5. Operating And Financial Review And Prospects Critical Accounting Policies And Estimates
share of the minority interest and records Goodwill equal to the excess of the acquisition cost over thecarrying amount of the assets and liabilities acquired. In the case of sales, the difference between thesales amount and the corresponding carrying amount on consolidation is recognized in the statement ofincome (Parent entity extension method);
Š transactions among companies under common control which result in a change in the percentage ofownership: the interests transferred remain recorded at historical cost and the gain or loss on thetransfer is eliminated in full. The minority interests which do not directly take part in the transaction areadjusted to reflect the change in the respective share of equity with a corresponding opposite effect onthe equity attributable to the equity holders of the Parent without recognition of any goodwill andtherefore without generating any impact on net income or total equity.
Under U.S. GAAP, such transactions are accounted for under the purchase method and, consequently, goodwill iscalculated as the difference between the consideration paid and the proportionate share of the fair value of netassets acquired at the date of acquisition.
Therefore, we are required to perform a purchase price allocation and, consequently, as part of that allocation, allconsideration shall be valued. When equity instruments are issued as part of the consideration, under U.S. GAAPwe measure them by taking into account the market price for a reasonable period before and after the date theterms of the acquisition are agreed to and announced.
The treatment of purchase price allocation is also affected by the considerations expressed in the last threeparagraphs under 5.3.4 Acquisition Accounting, Goodwill and Purchase Price Allocation above.
5.3.6 IMPAIRMENT OF ASSETS
The determination of impairments of tangible and intangible assets involves the use of estimates that include, butare not limited to, the cause, timing and amount of the impairment.
Assets with a finite life. For IFRS purposes, during the year, the Group assesses whether there are anyindicators that tangible and intangible assets with a finite life may have been impaired. If such indicators exists,the Group estimates if the carrying amount of an asset, a group of assets or a cash-generating unit exceeds therecoverable amount. Both internal and external sources of information are used to determine if indicators ofimpairment exist. Internal sources considered include obsolescence or physical damage, any significant changesin the use of the asset and the economic performance of the asset compared to estimated performance. Externalsources considered include market value of the asset, negative changes in technology, markets or laws, increasesin market interest rates and the cost of capital used to evaluate investments, and the comparison of the carryingamount of net assets of the Group to market capitalization.
Intangible assets with an indefinite life. Intangible assets with an indefinite life, including goodwill, aretested for impairment at least annually to assess the recoverable amount of the asset. The test is conducted inconjunction with the planning process of the Group, near the end of every year. Goodwill acquired and allocatedduring the year is tested for impairment before the end of the year in which the acquisition and allocation tookplace. To test for impairment, goodwill is allocated, at the date of acquisition, to each of the cash-generating unitsor groups of cash-generating units that is expected to benefit from the acquisition. Allocation is made to thelowest level at which goodwill is monitored for management purposes and that lowest level is not larger than thebusiness segment determined in accordance with IAS 14 (Segment Reporting).
Under IFRS, the recoverable amount of an asset is the higher of fair value less costs to sell and its value in use. Inassessing the value in use, the pre-tax estimated future cash flows are discounted to their present value using apre-tax discount rate that reflects current market assessments of the time value of money and the risks specific tothe asset. Where it is not possible to estimate the recoverable amount of an individual asset, the Group estimatesthe recoverable amount of the cash-generating unit to which the asset belongs.
The identification of impairment indicators, the estimation of future cash flows and the determination of fairvalues of assets, groups of assets (or cash-generating units) require management to make significant judgmentsconcerning the identification and validation of impairment indicators, expected cash flows, applicable discountrates, useful lives and residual values. These estimates can have a material impact on fair value and the amount ofany write-downs.
92

Item 5. Operating And Financial Review And Prospects Critical Accounting Policies And Estimates
If the carrying amount of a cash-generating unit (or group of units) exceeds the recoverable amount, animpairment loss is recognized in the statement of income. The impairment loss is first recognized as a deductionof the carrying amount of goodwill allocated to the cash-generating unit (or group of cash-generating units) andonly then to the carrying amount of the other assets of the cash-generating unit in proportion to their carryingamount up to the recoverable amount of the assets.
The determination of the recoverable amount of a cash-generating unit involves the use of estimates bymanagement.
When the conditions which led to the recognition of an impairment loss on assets cease to exist or have beenmitigated, the carrying amount of the asset other than goodwill, or cash-generating unit, is increased to therevised estimate of its recoverable amount, but not in excess of the carrying amount that would have beenrecorded had no impairment loss been recognized and such reversal is recognized as income immediately.
Under U.S. GAAP, in order to assess impairment of property, plant and equipment and amortizing intangibleassets, we apply the guidance outlined in SFAS 144, Accounting for the Impairment or Disposal of Long-LivedAssets. If, based on the preceding discussion, management has concluded that impairment indicators exist, wewill initially review for possible impairment by assessing the undiscounted cash flows expected to be derived fromthe asset or group of assets, comparing the lowest level of total expected undiscounted cash flow to the carryingvalue. If the carrying value of the asset or the group of assets exceeds the sum of the undiscounted cash flows,impairment is considered to exist. An impairment charge is assessed by comparing the assets fair value to thecarrying value. Fair value can be calculated by a number of different approaches, including discounted cash flow,comparables, market valuations or quoted market prices. The process and steps required to assess the possibleimpairments of assets, including the identification of possible impairment indicators, assessing undiscounted cashflows, selecting the appropriate discount rate, the calculation of the weighted average cost of capital and thediscounts or premiums inherent in market prices require a substantial amount of management discretion andjudgment. If actual results differ from these estimates, or if the Telecom Italia Group adjusts these estimates infuture periods, operating results could be significantly affected.
Furthermore, for purposes of our U.S. GAAP reporting, in order to assess impairment of intangible assets with anindefinite life, we use the requirements of SFAS 142, Goodwill and Other Intangible Assets, and as a result we donot amortize goodwill and indefinite lived intangible assets (likewise under IFRS). SFAS 142 requires that goodwillbe tested for impairment at least annually (and between annual tests when certain triggering events occur) usinga two-step methodology. The first step screens for triggering events indicating potential impairment at thereporting unit level, while the second step measures the impairment, if any. Under U.S. GAAP, the quoted marketprice of an asset or other valuation techniques, including discounted cash flow, comparables, etc., are acceptablevaluation methodologies to assess fair value. The selection of the various assumptions that are necessary to arriveat the fair value of a reporting unit, including the assumptions used in the underlying business plans or targets,requires substantial management judgment and discretion.
Subsequent reversals of recognized impairment losses on goodwill and other indefinite lived intangible assets arenot permitted by SFAS 142.
5.3.7 FINANCIAL ASSETS
Financial assets include, in particular, investments mainly in telecommunications companies that are principallyengaged in the mobile, fixed-line network, Internet and data communications businesses, some of which arepublicly traded and have highly volatile share prices. Generally, an impairment charge is recorded, in accordancewith IFRS, when an investment’s carrying amount exceeds the present value of its estimated future cash flows,and, in accordance with U.S. GAAP, when a decline in fair value is considered to be other than temporary. Thecalculation of the present value of estimated future cash flows and the determination of whether an impairment isother than temporary involve judgments and relies heavily on assessments by management regarding the futuredevelopment and prospects of the investee company. In determining value, quoted market prices are used, ifavailable, or other valuation methodologies. To determine whether an impairment is other than temporary, weconsider the ability and intent to hold the investment for a reasonable period of time to ascertain whether aforecasted recovery of fair value exceeds the carrying amount, including an assessment of factors such as, thelength of time and magnitude of the excess of carrying value over market value, the forecasted results of theinvestee company, the regional economic environment and state of the industry. Future adverse changes in
93

Item 5. Operating And Financial Review And Prospects Critical Accounting Policies And Estimates
market conditions, particularly a downturn in the telecommunications industry, or poor operating results couldresult in losses or an inability to recover the carrying amount of the investment, which could result in impairmentcharges.
5.3.8 DERIVATIVES
Telecom Italia enters into several different types of derivative contracts in order to adjust and manage the variouscash flows associated with foreign currency and interest rate exposures. Under IFRS, the changes in the fair valueof instruments which do not qualify for hedge accounting, fair value hedges and ineffective portion of cash flowhedges are recognized in the statement of income in the period of change. The gain or loss on the effectiveportion of qualifying cash flow hedges is reported in Other Comprehensive Income. The assessment of the fairvalue of a derivative contract requires the use of quoted market prices, banker price quotations, price quotationsfor similar instruments traded in different markets and, where applicable, pricing models. Pricing models and theirunderlying assumptions impact the amount and timing of unrealized gains and losses recognized. The Group relieson these pricing models when external fair values are unavailable. The estimates regarding future prices requireestimating several factors, including interest rates, currency values and cash flows. Prices realized in the futurecould differ from these estimates, therefore producing different financial results.
5.3.9 EMPLOYEE SEVERANCE INDEMNITIES
Employee severance indemnities (or Trattamento di Fine Rapporto—TFR) are a form of post employment benefitsand, both under IFRS and U.S. GAAP, are classified and accounted for as a defined benefit plan. The obligation foremployee severance indemnities is determined in accordance with actuarial methods, which rely on assumptionsincluding discount rates, services periods, future salary increases and life expectancies.
In the event that changes in assumptions are required, with respect to these assumptions the future amounts ofthe post employment benefit costs may be materially affected.
5.3.10 PROVISIONS AND CONTINGENT LIABILITIES
The Group exercises considerable judgment in determining our exposure to and recognizing provisions forcontingent liabilities related to pending litigations or other outstanding claims subject to negotiated settlement,mediation, arbitration or government regulation as well as other contingent liabilities.
Judgment is necessary in assessing the likelihood that a pending claim will succeed or a liability will arise and toquantify the possible range of the final settlement. Provisions are recorded for liabilities when losses areconsidered probable and can be reasonably estimated. Because of the inherent uncertainties in making suchjudgments, actual losses may be different from the originally estimated provision. Significant estimates areinvolved in the determination of provisions related to taxes, environmental liabilities, our workforce reductioninitiative and litigation risks. These estimates are subject to change as new information becomes available,primarily with the support of internal specialists or outside consultants, such as actuaries or legal counsel.Adjustments to loss provisions may significantly affect future operating results.
5.3.11 INCOME TAXES
The Group calculates income taxes in each of the tax jurisdictions in which it operates. This process involves ajurisdiction-by-jurisdiction calculation of the current tax charge and an assessment of temporary differencesresulting from the different treatment of certain items for IFRS consolidated financial and tax reporting purposes.Temporary differences result in the recognition of deferred tax assets or liabilities in the consolidated financialstatements. Deferred tax assets are recognized to the extent that their realization is probable. The realization ofdeferred tax assets depends, among other things, on the company’s ability to generate sufficient taxable incomein future years and the reversal of temporary liabilities, taking into account any restrictions on the carryforward oftax losses. Various factors are used to assess the probability of the future realization of deferred tax assets,including future reversals of existing taxable temporary differences, past operating results, operational plans, loss-carryforward periods, and tax planning strategies. If actual results differ from these estimates or, if theseestimates must be adjusted in future periods, the financial position, results of operations and cash flows may beaffected. In the event of a change in the assessment of future utilization of deferred tax assets, the recognizeddeferred tax assets must be increased or decreased, as the case may be, and the consequent effects recognized inthe statement of income.
94

Item 5. Operating And Financial Review And Prospects Adoption Of International Financial Reporting Standards
5.4 ADOPTION OF INTERNATIONAL FINANCIAL REPORTING STANDARDS
Telecom Italia applied IFRS adopted by the EU for the first time in its annual Consolidated Financial Statementsfor the year ended December 31, 2005, which included comparative financial statements for the year endedDecember 31, 2004. IFRS 1, First-time Adoption of International Financial Reporting Standards, requires that anentity develops accounting policies based on the standards and related interpretations effective at the reportingdate of its first annual IFRS financial statements (i.e., for Telecom Italia, December 31, 2005). IFRS 1 alsorequires that those policies be applied as of the date of transition to IFRS (i.e., for Telecom Italia, January 1,2004) and throughout all periods presented in the first IFRS financial statements.
For the purposes of these Financial Statements there are no differences between IFRS issued by IASB and IFRSadopted by the EU.
The differences arising from the application of IFRS compared to Italian GAAP as well as the choices made byTelecom Italia among the accounting options provided by IFRS are described in “Note 42—Transition toInternational Financial Reporting Standards (IFRS)” of the Notes to the Consolidated Financial Statementsincluded in the 2005 Form 20-F of Telecom Italia.
95

Item 5. Operating And Financial Review And Prospects Results Of Operations For The Three Years Ended December 31, 2006
5.5 RESULTS OF OPERATIONS FOR THE THREE YEARS ENDED DECEMBER 31, 2006
5.5.1 REORGANIZATION OF BUSINESS
The Telecom Italia businesses at December 31, 2006 are organized on the basis of the following Business Units orCorporate Functions:
Š Operations, which is responsible for the management and development of fixed and mobiletelecommunications and Internet services. Operations, for reporting purposes, is divided into:
– Wireline, On a national level, the Wireline Business Unit operates as the consolidated marketleader of wireline telephone and data services for final customers (retail) and other operators(wholesale). On an international level, Wireline develops fiber optic networks for wholesalecustomers (in Europe, in the Mediterranean area and in South America) and also offers innovativebroadband services in France, Germany and The Netherlands.
– Domestic Mobile, which operates in the sector of domestic mobile telecommunications.
– Brazil Mobile, which operates in the sector of mobile telecommunications in Brazil.
Š Business Units which are responsible for the development of the following businesses:
– Media, which operates in the area of journalistic information, TV production, TV and web contentofferings.
– Olivetti, which operates in the Office Products Division in the sector of ink-jet products for theoffice, digital printing systems and the development and production of products associated withsilicon technology (ink-jet print heads and MEMS), and also specialized applications for the bankingfield and commerce and information systems for gaming and lotteries. The reference market of theBusiness Unit is focused mainly in Europe and Asia.
For a complete description of these businesses, see “Item 4. Information on the Telecom Italia Group—4.2 Business Units”. For purposes of the following discussion selected financial data of each Business Unit hasbeen provided for 2006, 2005 and 2004, and consistent with the structure of each Business Unit at December 31,2006.
5.5.2 NON-GAAP FINANCIAL MEASURES
In this Annual Report on Form 20-F, in addition to figures presented in accordance with IFRS, we disclose figuresderived from IFRS that are non-GAAP financial measures (“Non-GAAP Measures”). Such financial data isconsidered Non-GAAP financial measures as defined in Item 10 of Regulation S-K under the 1934 Act.
As described in more detail below, such financial data is presented as additional information for Telecom Italia’sinvestors and should not be considered as substitutes for or confused with economic and financial IFRS measures.
In this Annual Report the only Non-GAAP Measures utilized relates to Net Financial Debt.
Net Financial Debt is a Non-GAAP financial measure as defined in Item 10 of Regulation S-K under the1934 Act, but is widely used in Italy by financial institutions to assess liquidity and the adequacy of a company’sfinancial structure. We believe that Net Financial Debt provides an accurate indicator of our ability to meet ourfinancial obligations, represented by gross debt, by our available liquidity, represented by the other items shownin the reconciliation table. Net Financial Debt allows us to show investors the trend in our net financial conditionover the periods presented. The limitation on the use of Net Financial Debt is that it effectively assumes that grossdebt can be reduced by our cash and other liquid assets. In fact, it is unlikely that we would use all of our liquidassets to reduce our gross debt all at once, as such assets must also be available to pay employees, suppliers, andtaxes, and to meet other operating needs and capital expenditure requirements. Net Financial Debt and its ratio toequity (including Minority Interests), or leverage, are used to evaluate our financial structure in terms ofsufficiency and cost of capital, level of debt, debt rating and funding cost, and whether our financial structure isadequate to achieve our business plan and our financial targets (which include our debt ratio, or Net FinancialDebt divided by net invested capital, the latter meaning net assets excluding Net Financial Debt). Ourmanagement believes that our financial structure is sufficient to achieve our business plan and financial targets.Our management monitors the Net Financial Debt and leverage or similar measures as reported by other
96
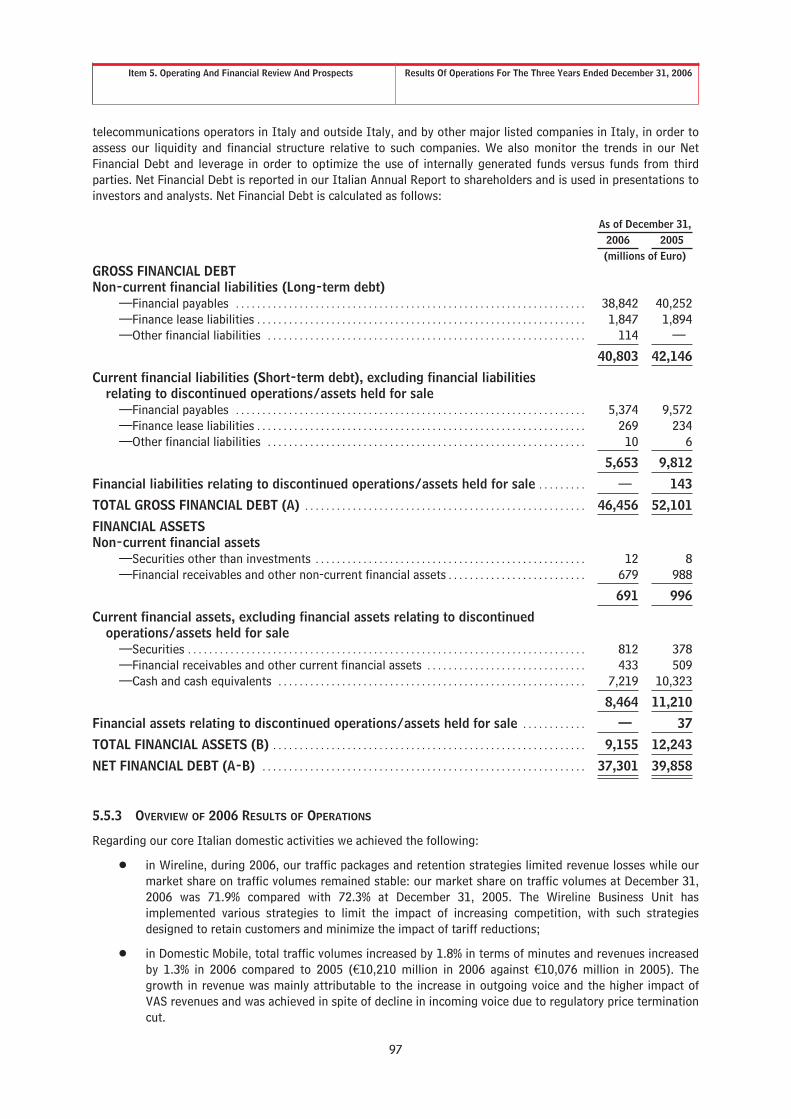
Item 5. Operating And Financial Review And Prospects Results Of Operations For The Three Years Ended December 31, 2006
telecommunications operators in Italy and outside Italy, and by other major listed companies in Italy, in order toassess our liquidity and financial structure relative to such companies. We also monitor the trends in our NetFinancial Debt and leverage in order to optimize the use of internally generated funds versus funds from thirdparties. Net Financial Debt is reported in our Italian Annual Report to shareholders and is used in presentations toinvestors and analysts. Net Financial Debt is calculated as follows:
As of December 31,2006 2005(millions of Euro)
GROSS FINANCIAL DEBTNon-current financial liabilities (Long-term debt)
—Financial payables . . . . . . . . . . . . . . . . . . . . . . . . . . . . . . . . . . . . . . . . . . . . . . . . . . . . . . . . . . . . . . . . . . 38,842 40,252—Finance lease liabilities . . . . . . . . . . . . . . . . . . . . . . . . . . . . . . . . . . . . . . . . . . . . . . . . . . . . . . . . . . . . . . 1,847 1,894—Other financial liabilities . . . . . . . . . . . . . . . . . . . . . . . . . . . . . . . . . . . . . . . . . . . . . . . . . . . . . . . . . . . . 114 —
40,803 42,146
Current financial liabilities (Short-term debt), excluding financial liabilitiesrelating to discontinued operations/assets held for sale
—Financial payables . . . . . . . . . . . . . . . . . . . . . . . . . . . . . . . . . . . . . . . . . . . . . . . . . . . . . . . . . . . . . . . . . . 5,374 9,572—Finance lease liabilities . . . . . . . . . . . . . . . . . . . . . . . . . . . . . . . . . . . . . . . . . . . . . . . . . . . . . . . . . . . . . . 269 234—Other financial liabilities . . . . . . . . . . . . . . . . . . . . . . . . . . . . . . . . . . . . . . . . . . . . . . . . . . . . . . . . . . . . 10 6
5,653 9,812
Financial liabilities relating to discontinued operations/assets held for sale . . . . . . . . . — 143
TOTAL GROSS FINANCIAL DEBT (A) . . . . . . . . . . . . . . . . . . . . . . . . . . . . . . . . . . . . . . . . . . . . . . . . . . . . . 46,456 52,101
FINANCIAL ASSETSNon-current financial assets
—Securities other than investments . . . . . . . . . . . . . . . . . . . . . . . . . . . . . . . . . . . . . . . . . . . . . . . . . . . 12 8—Financial receivables and other non-current financial assets . . . . . . . . . . . . . . . . . . . . . . . . . . 679 988
691 996
Current financial assets, excluding financial assets relating to discontinuedoperations/assets held for sale
—Securities . . . . . . . . . . . . . . . . . . . . . . . . . . . . . . . . . . . . . . . . . . . . . . . . . . . . . . . . . . . . . . . . . . . . . . . . . . . 812 378—Financial receivables and other current financial assets . . . . . . . . . . . . . . . . . . . . . . . . . . . . . . 433 509—Cash and cash equivalents . . . . . . . . . . . . . . . . . . . . . . . . . . . . . . . . . . . . . . . . . . . . . . . . . . . . . . . . . . 7,219 10,323
8,464 11,210
Financial assets relating to discontinued operations/assets held for sale . . . . . . . . . . . . — 37
TOTAL FINANCIAL ASSETS (B) . . . . . . . . . . . . . . . . . . . . . . . . . . . . . . . . . . . . . . . . . . . . . . . . . . . . . . . . . . . 9,155 12,243
NET FINANCIAL DEBT (A-B) . . . . . . . . . . . . . . . . . . . . . . . . . . . . . . . . . . . . . . . . . . . . . . . . . . . . . . . . . . . . . 37,301 39,858
5.5.3 OVERVIEW OF 2006 RESULTS OF OPERATIONS
Regarding our core Italian domestic activities we achieved the following:
Š in Wireline, during 2006, our traffic packages and retention strategies limited revenue losses while ourmarket share on traffic volumes remained stable: our market share on traffic volumes at December 31,2006 was 71.9% compared with 72.3% at December 31, 2005. The Wireline Business Unit hasimplemented various strategies to limit the impact of increasing competition, with such strategiesdesigned to retain customers and minimize the impact of tariff reductions;
Š in Domestic Mobile, total traffic volumes increased by 1.8% in terms of minutes and revenues increasedby 1.3% in 2006 compared to 2005 (€10,210 million in 2006 against €10,076 million in 2005). Thegrowth in revenue was mainly attributable to the increase in outgoing voice and the higher impact ofVAS revenues and was achieved in spite of decline in incoming voice due to regulatory price terminationcut.
97

Item 5. Operating And Financial Review And Prospects Results Of Operations For The Three Years Ended December 31, 2006
In both our core domestic and international markets our strategy remains to focus our investment on exploitinggrowth opportunities. In the domestic market our focus has been on value added services and internationally onmarkets which we consider to have the most potential for growth—mobile telecommunications in Brazil andbroadband in selected European markets.
Innovative offering:
Š the Wireline Business Unit is focused on converting its customers from traditional to innovativetechnologies to enlarge IP services and applications. The Wireline Business Unit is expanding itspenetration in the retail broadband market through ADSL connections offered to the consumer andSOHO (Small Office Home Office) markets with a number of different branded packages (e.g. Alice, AliceBusiness). The company continues to have significant success in Italy with approximately 6.8 millionbroadband accesses sold to the retail and the wholesale market at the end of 2006 (approximately5.7 million at December 31, 2005);
Š Domestic Mobile revenues from VAS (€1,649 million in 2006) increased by 10.2% compared to 2005.Due to the continuing introduction of new services and the success of interactive VAS, the VAS businessgrew significantly with its revenues representing 17.5% of service revenues, compared to 16.0% in 2005.
International markets:
Š in September 2006, we expanded the activities of the “International Broadband” project in Europe byreaching a preliminary agreement for the acquisition of AOL Germany’s Internet access business fromTime Warner. This transaction closed on February 28, 2007. Telecom Italia continued to organicallyexpand its customer base, and as of December 31, 2006, there were approximately 1.9 million contractsfor broadband access outside Italy (1.3 million as of December 31, 2005);
Š we continued to consolidate our role in Brazil during 2006. As of December 31, 2006 we hadapproximately 25.4 million total managed lines in our Brazilian subsidiaries and Tim Brasil consolidatedits position as the second operator in the Brazilian mobile market with a 25.4% Market share, reducingthe gap from first operator Vivo to less than 4 percentage points.
98

Item 5. Operating And Financial Review And Prospects Results Of Operations For The Three Years Ended December 31, 2006
The following table sets forth statement of income in accordance with IFRS for the years ended December 31,2006, 2005 and 2004.
Year ended December 31,2006 2005 2004
(millions of Euro)Statement of Income Data in accordance with IFRS:Revenues . . . . . . . . . . . . . . . . . . . . . . . . . . . . . . . . . . . . . . . . . . . . . . . . . . . . . . . . . . . . . . . . . . . . . . . 31,275 29,919 28,292Other income . . . . . . . . . . . . . . . . . . . . . . . . . . . . . . . . . . . . . . . . . . . . . . . . . . . . . . . . . . . . . . . . . . . 606 678 1,099Total operating revenues and other income . . . . . . . . . . . . . . . . . . . . . . . . . . . . . . . . 31,881 30,597 29,391Purchases of materials and external services . . . . . . . . . . . . . . . . . . . . . . . . . . . . . . . . . . . . (14,191) (12,937) (11,812)Personnel costs . . . . . . . . . . . . . . . . . . . . . . . . . . . . . . . . . . . . . . . . . . . . . . . . . . . . . . . . . . . . . . . . . (3,801) (4,142) (3,852)Other operating expenses . . . . . . . . . . . . . . . . . . . . . . . . . . . . . . . . . . . . . . . . . . . . . . . . . . . . . . . (1,543) (1,468) (1,603)Changes in inventories . . . . . . . . . . . . . . . . . . . . . . . . . . . . . . . . . . . . . . . . . . . . . . . . . . . . . . . . . . 8 (4) 27Capitalized internal construction costs . . . . . . . . . . . . . . . . . . . . . . . . . . . . . . . . . . . . . . . . . . 496 471 713Depreciation and amortization . . . . . . . . . . . . . . . . . . . . . . . . . . . . . . . . . . . . . . . . . . . . . . . . . . (5,487) (5,232) (4,808)Gains (losses) on disposals of non-current assets (1) . . . . . . . . . . . . . . . . . . . . . . . . . . . . 95 242 (9)Impairment reversals (losses) on non-current assets . . . . . . . . . . . . . . . . . . . . . . . . . . . . (21) (28) (444)Operating income . . . . . . . . . . . . . . . . . . . . . . . . . . . . . . . . . . . . . . . . . . . . . . . . . . . . . . . . . . . . . 7,437 7,499 7,603Share of profits (losses) of associates and joint ventures accounted for using the
equity method . . . . . . . . . . . . . . . . . . . . . . . . . . . . . . . . . . . . . . . . . . . . . . . . . . . . . . . . . . . . . . . 51 23 (5)Financial income . . . . . . . . . . . . . . . . . . . . . . . . . . . . . . . . . . . . . . . . . . . . . . . . . . . . . . . . . . . . . . . . 3,041 3,144 2,224Financial expenses . . . . . . . . . . . . . . . . . . . . . . . . . . . . . . . . . . . . . . . . . . . . . . . . . . . . . . . . . . . . . . (5,014) (5,131) (4,216)Income from continuing operations before taxes . . . . . . . . . . . . . . . . . . . . . . . . . . . 5,515 5,535 5,606Income taxes . . . . . . . . . . . . . . . . . . . . . . . . . . . . . . . . . . . . . . . . . . . . . . . . . . . . . . . . . . . . . . . . . . . (2,519) (2,395) (2,654)Net income from continuing operations . . . . . . . . . . . . . . . . . . . . . . . . . . . . . . . . . . . . . 2,996 3,140 2,952Net income (loss) from discontinued operations/assets held for sale . . . . . . . . . . . . . 7 550 (118)Net income for the year . . . . . . . . . . . . . . . . . . . . . . . . . . . . . . . . . . . . . . . . . . . . . . . . . . . . . . 3,003 3,690 2,834
Of which:Š Net income attributable to equity holders of the Parent . . . . . . . . . . . . . . . . . . . . . . 3,014 3,216 1,815Š Net income (loss) attributable to Minority Interests . . . . . . . . . . . . . . . . . . . . . . . . . (11) 474 1,019
(1) Excludes capital gains/losses realized on disposals of investments classified as discontinued operations/assets held for sale andinvestments other than in subsidiaries.
5.5.4 BUSINESS UNIT FINANCIAL DATA
The table below sets forth revenues, operating income (loss), capital expenditures and number of employees byBusiness Units, for the periods indicated:
Wireline(1)
DomesticMobile
BrazilMobile Media Olivetti
Otheractivities
(1)(2)
Adjustmentsand
eliminationsConsolidated
Total(millions of Euro, except number of employees)
Revenues(3) . . . . . . . . . . . . . . . . 20062005(4)2004(4)
17,79517,83417,508
10,21010,0769,923
3,9642,9001,800
207180168
440452590
1,5631,3211,289
(2,904)(2,844)(2,986)
31,27529,91928,292
Operating income (loss) . . . . 20062005(4)2004(4)
4,3964,4884,709
3,7423,8564,010
21(190)(137)
(137)(130)(93)
(50)(38)17
(582)(547)(692)
4760
(211)
7,4377,4997,603
Capital expenditures . . . . . . . . 20062005(4)2004(4)
3,0022,8232,449
1,1461,2761,469
699842817
856539
101915
200156213
(28)(8)
—
5,1145,1735,002
Number of employees atyear-end(5) . . . . . . . . . . . . . .
20062005(4)2004(4)
55,70556,98755,833
11,21811,72011,767
9,5319,0436,967
919886
1,077
1,4281,7502,109
4,4085,0984,867
———
83,20985,48482,620
(1) As a result of the new organizational structure of the Group approved on October 5, 2005 (the so-called “One Company Model”), theactivities of the Innovation & Engineering Services business segment of Telecom Italia (ex-TILAB segment of Telecom Italia, previouslyincluded in Other activities) were transferred to the Wireline Business Unit; therefore, 2005 and 2004 results have been reclassified forpurposes of comparison.
99

Item 5. Operating And Financial Review And Prospects Results Of Operations For The Three Years Ended December 31, 2006
(2) Entel Bolivia group is included in Other Activities.
(3) Revenues are total revenues of the various business units of the Telecom Italia Group before elimination of intercompany sales (but afterelimination of sales between companies within the same major business area).
(4) The data relating to 2005 and 2004 have been reclassified and presented consistent with the 2006 presentation.
(5) The number of employees at year-end excludes employees relating to the consolidated companies considered as discontinuedoperations/assets held for sale, and includes personnel with temp work contracts.
The table below sets forth revenues, operating income (loss), net income (loss) from discontinued operations/assets held for sale, capital expenditures and number of employees of discontinued operations/ assets held forsale, for the periods indicated:
Discontinued operations/Assets held for sale
Mobile(1)
Media(2)
EntelChilegroup IT Market Sub-Total
Other,adjustments
andeliminations
(3) Total(millions of Euro, except number of employees)
Revenues . . . . . . . . . . . . . . . . 200620052004
121734
1,177
—126127
—238925
—289706
1211,3872,935
(1)(53)
(142)
1201,3342,793
Operating income(loss)(3) . . . . . . . . . . . . . .
200620052004
1560
125
—44
—3696
—(3)21
1597
246
(8)506
(202)
760344
Net income (loss) fromdiscontinuedoperations/ assetsheld for sale . . . . . . . . . . .
200620052004
152858
—11
—2649
—(11)(7)
1544
101
(8)506
(219)
7550
(118)
Capital expenditures . . . . . 200620052004
1087
200
—32
—27
141
—5
28
10122371
———
10122371
Number of employees atyear-end . . . . . . . . . . . . . .
20062005
2004 adjusted (4)2004
—863
2,961841
—184195—
——
4,216—
——
4,0304,030
—1,047
11,4024,871
————
—1,047
11,4024,871
(1) Includes: Tim Hellas (sold at the beginning of June 2005), Tim Perù (sold in August 2005) and Digitel Venezuela (sold in May 2006).
(2) Includes the Gruppo Buffetti (sold in January 2006).
(3) Adjustments and eliminations relating to the operating income include, among other things:
- 2006: the gains on the sale of Digitel Venezuela (€22 million, net of the related incidental charges and provisions for risks andcharges) and the provision related to Tim Hellas sold in 2005 (€30 million);
- 2005: the gains on the sale of Tim Hellas (€410 million, net of the related incidental charges) and Tim Perù (€120 million, net ofthe related incidental charges), as well as other losses and incidental charges relating to the sale of the Entel Chile group and theFinsiel Group, for a total of €24 million;
- 2004: the adjustment of the estimated selling price of the Entel Chile group (a loss of €177 million) and the Finsiel group (a loss of€28 million).
(4) The numbers of employees at December 31, 2006 and at December 31, 2005 are compared both with the adjusted number of employeesat December 31, 2004 (which considers as discontinued operations / assets held for sale the same companies considered as such atDecember 31, 2006 and 2005, namely: the Finsiel Group, Digitel Venezuela, the Entel Chile group, Tim Hellas, Tim Perù and GruppoBuffetti) and with the historical number of employees at December 31, 2004 (which considers as discontinued operations / assets heldfor sale the Finsiel Group and Digitel Venezuela).
5.5.5 YEAR ENDED DECEMBER 31, 2006 COMPARED WITH YEAR ENDED DECEMBER 31, 2005
In 2006, consolidated net income attributable to equity holders of the Parent was €3,014 million (netincome of €3,003 million before Minority Interests), compared to consolidated net income attributable to equityholders of the Parent of €3,216 million (net income of €3,690 million before Minority Interests) in 2005.
100

Item 5. Operating And Financial Review And Prospects Results Of Operations For The Three Years Ended December 31, 2006
The decrease of €202 million in 2006 was principally due to the following factors:
Š operating income decreased by €62 million;
Š share of profits of associates and joint ventures accounted for using the equity method increased by €28million;
Š lower financial expenses, net of financial income of €14 million: the improvement in the financialmanagement balance (€173 million) was partly offset by a lower result from investment managementand the release in the year 2005 of provisions relating to Avea I.H.A.S. (for details see below “FinancialIncome and Expenses, net”);
Š higher income taxes of €124 million, due to the increase of the tax base and the provision for incometaxes recorded by the Parent Company;
Š lower net income from discontinued operations/assets held for sale of €543 million. In 2005, this itemincluded net gains from discontinued operations totaling €506 million;
Š lower net income attributable to Minority Interests (a decrease of €485 million), mainly in connectionwith the TIM merger transaction (tender offer and merger). During 2005, the total control over themobile business was reached as a result of the tender offer in January and the merger in June.
The following table summarizes the main factors which affected the change in consolidated net incomeattributable to equity holders of the Parent in 2006:
3,216 +28-62
-124
-543
+485 3,014
Net income from continuing operations:- €144 million
2005Operatingincome
Share of profits of associates andjoint ventures accounted for using the equity method
Incometaxes
Net income from DiscontinuedOperations/Assetsheld for sale
MinorityInterests
2006
(millions of euro)
-202 (-6,3%)
+14
Financial andInvestment management
101

Item 5. Operating And Financial Review And Prospects Results Of Operations For The Three Years Ended December 31, 2006
❖ REVENUES
Our consolidated revenues in 2006 were €31,275 million, an increase of €1,356 million, or 4.5% compared to€29,919 million in 2005.
The growth of revenues particularly reflects the following developments in the Business Units:
Š a decrease in revenues of the Wireline Business Unit. An increase in revenues due to the change in thescope of consolidation (mainly attributable to the Liberty Surf Group) and the constant growth of thedomestic and European broadband market and wholesale services were more than offset by a decline inthe traditional telephony market which was impacted by the reduction in fixed-mobile termination ratesand the migration of voice traffic from the fixed to the mobile network;
Š a positive contribution by the Domestic Mobile Business Unit, particularly due to the expansion of value-added services, the positive trend of revenues from outgoing voice traffic and the growth of revenuesfrom handset sales, offset in part by the negative impact of the new fixed-mobile and mobile-mobiletermination rates that came into effect;
Š a significant contribution by the Brazil Mobile Business Unit, driven by the expansion of its customerbase, growth in VAS and a positive foreign exchange rate effect. In July 2006, regulatory changes wereintroduced (abolition of the “Bill and Keep” rule) which generated a positive impact on revenues and acorresponding increase in interconnection costs;
Š an increase in the revenues of the Media Business Unit which showed a positive trend compared to theyear 2005 due to national advertising which grew at a faster pace than the market and the contributionmade by digital terrestrial Pay-per- View revenues;
Š a reduction in the revenues of the Olivetti Business Unit due to the decline in traditional Ink-jet andGaming sales, which was partly compensated by the growth in specialized printers, new ink jet productsand professionals office products;
Š an increase in Other activities and eliminations in connection with both lower eliminations ontransactions between the Wireline and Domestic Mobile Business Units, mainly as a result of thereduction in termination rates and the migration of voice traffic from the fixed to the mobile network,and also the increase in revenues from Other activities.
Revenues from telecommunications services are shown gross of the portion due to third-party operators of€5,721 million compared with €4,829 million in 2005. Such increase (€892 million or 18.5%) takes into accountthe positive impact of the regulatory changes (abolition of the “Bill and Keep” rule) that were applied to theBrazilian market from July 2006.
Foreign revenues (based on customer geographical location) amounted to €7,969 million in 2006 (€6,165 millionin 2005); 49.3% of the total came from Brazil (46.6% in 2005).
The table below sets forth, for the periods indicated, gross revenues and consolidated revenues by Business Unitand the percentage of their contributions to our consolidated revenues:
Year ended December 31,2006 2005
GrossRevenues(1)
ConsolidatedRevenues(2)
% ofConsolidated
RevenuesGross
Revenues(1)ConsolidatedRevenues(2)
% ofConsolidated
Revenues(millions of Euro, except percentages)
Wireline . . . . . . . . . . . . . . . . . . . . . . 17,795 16,426 52.5% 17,834 16,356 54.7%Domestic Mobile . . . . . . . . . . . . . . 10,210 9,939 31.8% 10,076 9,776 32.7%Brazil Mobile . . . . . . . . . . . . . . . . . . 3,964 3,959 12.7% 2,900 2,895 9.7%Media . . . . . . . . . . . . . . . . . . . . . . . . 207 197 0.6% 180 176 0.6%Olivetti . . . . . . . . . . . . . . . . . . . . . . . 440 385 1.2% 452 400 1.3%Other Activities(3) . . . . . . . . . . . . 1,563 369 1.2% 1,321 316 1.0%
Total revenues . . . . . . . . . . . . . . 34,179 31,275 100.0% 32,763 29,919 100.0%
(1) Gross revenues are total revenues of the various business units of the Telecom Italia Group before elimination of intercompany sales (butafter elimination of sales between companies within the same major business area).
102

Item 5. Operating And Financial Review And Prospects Results Of Operations For The Three Years Ended December 31, 2006
(2) Data include revenues recorded by each business area on a consolidated basis after elimination of intercompany sales.
(3) Other activities consist of the Central Functions (Group Functions and Service Units) and the foreign operations not included in otherbusiness units (the Entel Bolivia group). For further details on Other Activities please see “Item 4. Information on the Telecom ItaliaGroup—4.2 Business Units—4.2.7 Other Telecom Italia Group Activities”.
The table below sets forth, for the periods indicated, revenues by geographical area and the percentage of totalconsolidated revenues:
Year ended December 31,2006 2005
Geographical area (millions of Euro, except percentages)
Italy . . . . . . . . . . . . . . . . . . . . . . . . . . . . . . . . . . . . . . . . . . . . . . . . . . . . . . . . . . . . . . . . . . 23,306 74.5% 23,754 79.4%Rest of Europe . . . . . . . . . . . . . . . . . . . . . . . . . . . . . . . . . . . . . . . . . . . . . . . . . . . . . . . . 2,946 9.4% 2,265 7.6%Latin America . . . . . . . . . . . . . . . . . . . . . . . . . . . . . . . . . . . . . . . . . . . . . . . . . . . . . . . . . 4,220 13.5% 3,147 10.5%Other countries . . . . . . . . . . . . . . . . . . . . . . . . . . . . . . . . . . . . . . . . . . . . . . . . . . . . . . . . 803 2.6% 753 2.5%
Total consolidated revenues . . . . . . . . . . . . . . . . . . . . . . . . . . . . . . . . . . . . . . . . 31,275 100.0% 29,919 100.0%
❖ OTHER INCOME
Other income amounted to €606 million, a decrease of €72 million compared to €678 million in 2005.
The percentage of other income to revenues was 1.9% in 2006 compared to 2.3% in 2005.
Details are as follows:
Year ended December 31,2006 2005(millions of Euro)
Compensations for late payment of regulated telephone services . . . . . . . . . . . . . . . . . . . . . . . . 91 105Release of provisions and other liabilities . . . . . . . . . . . . . . . . . . . . . . . . . . . . . . . . . . . . . . . . . . . . . . . 179 228Recovery of costs of personnel and services rendered . . . . . . . . . . . . . . . . . . . . . . . . . . . . . . . . . . . 60 56Capital grants and grants related to income . . . . . . . . . . . . . . . . . . . . . . . . . . . . . . . . . . . . . . . . . . . . . 42 47Damage compensations and penalties . . . . . . . . . . . . . . . . . . . . . . . . . . . . . . . . . . . . . . . . . . . . . . . . . . 52 35Other income . . . . . . . . . . . . . . . . . . . . . . . . . . . . . . . . . . . . . . . . . . . . . . . . . . . . . . . . . . . . . . . . . . . . . . . . . . . 182 207
Total . . . . . . . . . . . . . . . . . . . . . . . . . . . . . . . . . . . . . . . . . . . . . . . . . . . . . . . . . . . . . . . . . . . . . . . . . . . . . . . . . . 606 678
The decrease of €72 million in 2006 is mainly attributable to a reduction of €49 million in the release of provisionsand other liabilities (which in 2005 included €37 million of the release of provisions for risks and charges relatingto the Antitrust fine of €152 million imposed in 2004 for the alleged abuse of a dominant position in the marketwhich, after appeals by the parties, was reduced to €115 million).
❖ OPERATING EXPENSES
The table below sets forth, for the periods indicated, total consolidated operating expenses by majorcomponents and expressed as a percentage of total consolidated revenues.
Year ended December 31,2006 2005
(millions of Euro, except percentages)Purchases of materials and external services . . . . . . . . . . . . . . . . . . . . . . . . . . . . . . . . . . 14,191 45.4% 12,937 43.2%Personnel costs . . . . . . . . . . . . . . . . . . . . . . . . . . . . . . . . . . . . . . . . . . . . . . . . . . . . . . . . . . . . . . . 3,801 12.1% 4,142 13.9%Other operating expenses . . . . . . . . . . . . . . . . . . . . . . . . . . . . . . . . . . . . . . . . . . . . . . . . . . . . . 1,543 4.9% 1,468 4.9%Changes in inventories . . . . . . . . . . . . . . . . . . . . . . . . . . . . . . . . . . . . . . . . . . . . . . . . . . . . . . . . (8) — 4 —Capitalized internal construction costs . . . . . . . . . . . . . . . . . . . . . . . . . . . . . . . . . . . . . . . . . (496) (1.6%) (471) (1.6%)Depreciation and amortization . . . . . . . . . . . . . . . . . . . . . . . . . . . . . . . . . . . . . . . . . . . . . . . . 5,487 17.5% 5,232 17.5%Gains/losses on disposals of non-current assets . . . . . . . . . . . . . . . . . . . . . . . . . . . . . . . (95) (0.3%) (242) (0.8%)Impairment reversals/losses on non-current assets . . . . . . . . . . . . . . . . . . . . . . . . . . . 21 0.1% 28 0.1%
Total operating expenses . . . . . . . . . . . . . . . . . . . . . . . . . . . . . . . . . . . . . . . . . . . . . . . . . . . 24,444 78.1 23,098 77.2%
103

Item 5. Operating And Financial Review And Prospects Results Of Operations For The Three Years Ended December 31, 2006
Our operating expenses increased by €1,346 million in 2006 compared to 2005; such increase is detailed asfollows:
Š Purchases of materials and external services increased by €1,254 million, or 9.7%, from€12,937 million in 2005 to €14,191 million in 2006. This increase is mainly due to the expansion ofBroadband, higher interconnection costs as a result of the growth of traffic managed, as well as theincrease in costs for the purchase of products and content.
Purchases of materials and external services included:
Year ended December 31,2006 2005(millions of Euro)
Purchases of materials and merchandise for resale . . . . . . . . . (A) 2,578 2,506
Costs of services:- Revenues due to other TLC operators . . . . . . . . . . . . . . . . . . . . . . . 5,721 4,829- Commissions, sales commissions and other selling
expenses . . . . . . . . . . . . . . . . . . . . . . . . . . . . . . . . . . . . . . . . . . . . . . . . . . . 1,511 1,263- Advertising and promotion expenses . . . . . . . . . . . . . . . . . . . . . . . . 584 593- Professional consulting and services . . . . . . . . . . . . . . . . . . . . . . . . 480 530- Utilities . . . . . . . . . . . . . . . . . . . . . . . . . . . . . . . . . . . . . . . . . . . . . . . . . . . . 421 308- Maintenance . . . . . . . . . . . . . . . . . . . . . . . . . . . . . . . . . . . . . . . . . . . . . . . 350 339- Outsourcing costs for other services . . . . . . . . . . . . . . . . . . . . . . . . 267 256- Mailing and delivery expenses for telephone bills, directories
and other materials to customers . . . . . . . . . . . . . . . . . . . . . . . . . . . 106 90- Other service expenses . . . . . . . . . . . . . . . . . . . . . . . . . . . . . . . . . . . . . 1,130 1,119
(B) 10,570 9,327
Lease and rental costs:- Property lease rents . . . . . . . . . . . . . . . . . . . . . . . . . . . . . . . . . . . . . . . . 560 641- TLC circuit lease rents and rents for use of satellite
systems . . . . . . . . . . . . . . . . . . . . . . . . . . . . . . . . . . . . . . . . . . . . . . . . . . . . 271 274- Other lease and rental costs . . . . . . . . . . . . . . . . . . . . . . . . . . . . . . . . 212 189
(C) 1,043 1,104
Total purchases of materials and external services . . . . . . . . . (A+B+C) 14,191 12,937
The principal reasons for the increase in Purchases of materials and external services were thefollowing:
Š purchases of materials and merchandise for resale increased by €72 million, from €2,506 million in2005 to €2,578 million in 2006. This increase was mainly attributable to the increase in costs forthe purchase of products and content. The percentage of purchases of materials and merchandisefor resale to revenues was 8.2% (8.4% in 2005);
Š costs of services increased by €1,243 million, or 13.3% in 2006 from €9,327 million in 2005 to€10,570 million in 2006 (of which €892 million was attributable to an increase in revenues due toother TLC operators), mainly due to the expansion of Broadband and higher interconnection costs.The percentage of cost of services to revenues was 33.8% (31.2% in 2005);
Š lease and rental costs decreased by €61 million, from €1,104 million in 2005 to €1,043 million in2006. The percentage of lease and rental costs to revenues was 3.3% (3.7% in 2005).
Š Personnel costs decreased by €341 million, or 8.2%, from €4,142 million in 2005 to €3,801 million in2006. Such decrease was due mainly to the reduction in charges for termination benefit incentive plans,and, only to a lesser extent, to the reduction of personnel costs at payroll and temp work costs of€28 million, or 0.8%. In particular, personnel costs outside Italy increased by €83 million, or 27.3%,principally due to the increased average number of salaried staff (an increase of 2,094 units); thedomestic component decreased by €424 million, or 11.0%, due to the reduction of the abovetermination benefit incentive plans and the reduced average number of salaried staff in 2006 (adecrease of 1,970 units).
104
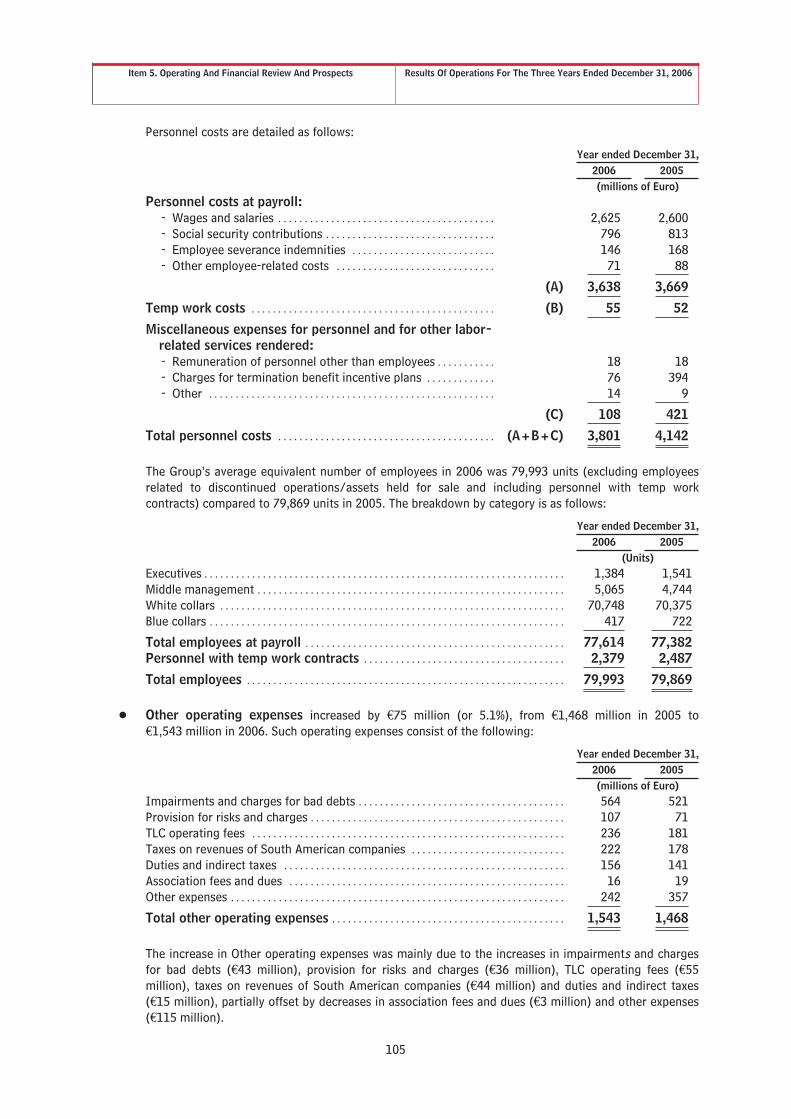
Item 5. Operating And Financial Review And Prospects Results Of Operations For The Three Years Ended December 31, 2006
Personnel costs are detailed as follows:
Year ended December 31,2006 2005(millions of Euro)
Personnel costs at payroll:- Wages and salaries . . . . . . . . . . . . . . . . . . . . . . . . . . . . . . . . . . . . . . . . . 2,625 2,600- Social security contributions . . . . . . . . . . . . . . . . . . . . . . . . . . . . . . . . 796 813- Employee severance indemnities . . . . . . . . . . . . . . . . . . . . . . . . . . . 146 168- Other employee-related costs . . . . . . . . . . . . . . . . . . . . . . . . . . . . . . 71 88
(A) 3,638 3,669
Temp work costs . . . . . . . . . . . . . . . . . . . . . . . . . . . . . . . . . . . . . . . . . . . . . . (B) 55 52
Miscellaneous expenses for personnel and for other labor-related services rendered:- Remuneration of personnel other than employees . . . . . . . . . . . 18 18- Charges for termination benefit incentive plans . . . . . . . . . . . . . 76 394- Other . . . . . . . . . . . . . . . . . . . . . . . . . . . . . . . . . . . . . . . . . . . . . . . . . . . . . . 14 9
(C) 108 421
Total personnel costs . . . . . . . . . . . . . . . . . . . . . . . . . . . . . . . . . . . . . . . . . (A+B+C) 3,801 4,142
The Group’s average equivalent number of employees in 2006 was 79,993 units (excluding employeesrelated to discontinued operations/assets held for sale and including personnel with temp workcontracts) compared to 79,869 units in 2005. The breakdown by category is as follows:
Year ended December 31,2006 2005
(Units)Executives . . . . . . . . . . . . . . . . . . . . . . . . . . . . . . . . . . . . . . . . . . . . . . . . . . . . . . . . . . . . . . . . . . . . 1,384 1,541Middle management . . . . . . . . . . . . . . . . . . . . . . . . . . . . . . . . . . . . . . . . . . . . . . . . . . . . . . . . . . 5,065 4,744White collars . . . . . . . . . . . . . . . . . . . . . . . . . . . . . . . . . . . . . . . . . . . . . . . . . . . . . . . . . . . . . . . . . 70,748 70,375Blue collars . . . . . . . . . . . . . . . . . . . . . . . . . . . . . . . . . . . . . . . . . . . . . . . . . . . . . . . . . . . . . . . . . . . 417 722
Total employees at payroll . . . . . . . . . . . . . . . . . . . . . . . . . . . . . . . . . . . . . . . . . . . . . . . . . 77,614 77,382Personnel with temp work contracts . . . . . . . . . . . . . . . . . . . . . . . . . . . . . . . . . . . . . . 2,379 2,487
Total employees . . . . . . . . . . . . . . . . . . . . . . . . . . . . . . . . . . . . . . . . . . . . . . . . . . . . . . . . . . . . 79,993 79,869
Š Other operating expenses increased by €75 million (or 5.1%), from €1,468 million in 2005 to€1,543 million in 2006. Such operating expenses consist of the following:
Year ended December 31,2006 2005(millions of Euro)
Impairments and charges for bad debts . . . . . . . . . . . . . . . . . . . . . . . . . . . . . . . . . . . . . . . 564 521Provision for risks and charges . . . . . . . . . . . . . . . . . . . . . . . . . . . . . . . . . . . . . . . . . . . . . . . . 107 71TLC operating fees . . . . . . . . . . . . . . . . . . . . . . . . . . . . . . . . . . . . . . . . . . . . . . . . . . . . . . . . . . . 236 181Taxes on revenues of South American companies . . . . . . . . . . . . . . . . . . . . . . . . . . . . . 222 178Duties and indirect taxes . . . . . . . . . . . . . . . . . . . . . . . . . . . . . . . . . . . . . . . . . . . . . . . . . . . . . 156 141Association fees and dues . . . . . . . . . . . . . . . . . . . . . . . . . . . . . . . . . . . . . . . . . . . . . . . . . . . . 16 19Other expenses . . . . . . . . . . . . . . . . . . . . . . . . . . . . . . . . . . . . . . . . . . . . . . . . . . . . . . . . . . . . . . . 242 357
Total other operating expenses . . . . . . . . . . . . . . . . . . . . . . . . . . . . . . . . . . . . . . . . . . . . 1,543 1,468
The increase in Other operating expenses was mainly due to the increases in impairments and chargesfor bad debts (€43 million), provision for risks and charges (€36 million), TLC operating fees (€55million), taxes on revenues of South American companies (€44 million) and duties and indirect taxes(€15 million), partially offset by decreases in association fees and dues (€3 million) and other expenses(€115 million).
105

Item 5. Operating And Financial Review And Prospects Results Of Operations For The Three Years Ended December 31, 2006
Š Capitalized internal construction costs include sales of equipment, installations and services atmarket prices by Group companies to other Group companies. These costs increased by €25 million (or5.3%), from €471 million in 2005 to €496 million in 2006, and consist of the following:
Year ended December 31,2006 2005(millions of Euro)
Capitalized internal construction costs on:– Intangible assets with a finite life . . . . . . . . . . . . . . . . . . . . . . . . . . . . . . . . . . . 318 287– Property, plant and equipment owned . . . . . . . . . . . . . . . . . . . . . . . . . . . . . . 178 184
Total capitalized internal construction costs . . . . . . . . . . . . . . . . . . . . . . . . . . . . . 496 471
Š Depreciation and amortization increased by €255 million (or 4.9%), from €5,232 million in 2005 to€5,487 million in 2006. The percentage of depreciation and amortization to revenue was 17.5% in 2006and 2005.
Depreciation and amortization are detailed as follows:
Year ended December 31,2006 2005(millions of Euro)
Amortization of Intangible assets with a finite life:– Industrial patents and intellectual property rights . . . . . . . . . . . 1,760 1,414– Concessions, licenses, trademarks and similar rights . . . . . . . . 310 253– Other intangible assets . . . . . . . . . . . . . . . . . . . . . . . . . . . . . . . . . . . . . 110 17
(A) 2,180 1,684
Depreciation of tangible assets owned:– Civil and industrial buildings . . . . . . . . . . . . . . . . . . . . . . . . . . . . . . . . 48 103– Plant and equipment . . . . . . . . . . . . . . . . . . . . . . . . . . . . . . . . . . . . . . . 2,644 2,910– Manufacturing and distribution equipments . . . . . . . . . . . . . . . . . 33 31– Aircrafts and ships . . . . . . . . . . . . . . . . . . . . . . . . . . . . . . . . . . . . . . . . . . 7 9– Other assets . . . . . . . . . . . . . . . . . . . . . . . . . . . . . . . . . . . . . . . . . . . . . . . . 446 363
(B) 3,178 3,416
Depreciation of tangible assets held under finance lease:– Civil and industrial buildings . . . . . . . . . . . . . . . . . . . . . . . . . . . . . . . . 99 93– Plant and equipment . . . . . . . . . . . . . . . . . . . . . . . . . . . . . . . . . . . . . . . 1 1– Aircrafts and ships . . . . . . . . . . . . . . . . . . . . . . . . . . . . . . . . . . . . . . . . . . 4 4– Other assets . . . . . . . . . . . . . . . . . . . . . . . . . . . . . . . . . . . . . . . . . . . . . . . . 25 34
(C) 129 132
Total depreciation and amortization . . . . . . . . . . . . . . . . . . . . . . . . . (A+B+C) 5,487 5,232
Amortization of intangible assets with a finite life increased by €496 million in 2006 partly due tohigher capital expenditures for the development of systems and new services, as well as thestrengthening in 2006 compared to 2005 of the average exchange rate of the Brazilian Real against theeuro in the Mobile Business Unit.
106

Item 5. Operating And Financial Review And Prospects Results Of Operations For The Three Years Ended December 31, 2006
Depreciation of tangible assets (owned and held in leasing) decreased by €241 million. Inparticular, the decrease was due to the effects of the revision in 2006 of the depreciation rates forassets relating the fixed and mobile network (a reduction of €319 million) which was partially offset byincreases due to higher capital expenditures for the development of infrastructures for the network andas support to the business as well as foreign exchange rate effects of the Brazilian companies in theMobile Business Unit.
Š Gains/losses on disposals of non-current assets changed from a net gain of €242 million in 2005to a net gain of €95 million in 2006 (a reduction in net gain of €147 million). In particular, in 2006, suchitem included:
Š gains of €135 million, net of incidental expenses, relating to additional real estate property salesmade by the Group in 2006 to the closed-end Raissa and Spazio Industriale Funds as part of theproperty sales program approved by the Board of Directors’ meeting held on December 21, 2005.In 2005 the gain arising from the realization of the first part of the program was €264 million;
Š the gain of €27 million on the sale of the entire real estate investment held in Ruf Gestion;
Š the loss of €33 million on the sale of the entire investment in Telecom Italia Learning Services;
Š the loss of €9 million on the sale of the “Radiomaritime Activities” business; and
Š the loss of €25 million as net balance between gains and losses on the sale of other non-currentassets.
Š Impairment losses on non-current assets decreased by €7 million, or 25.0%, from a loss of€28 million in 2005 to a loss of €21 million in 2006 mainly attributable to non current assets of the LatinAmerican Nautilus group.
❖ OPERATING INCOME
Operating income decreased by €62 million, or 0.8%, from €7,499 million in 2005 to €7,437 million in 2006. Asa percentage of revenues, operating income was 23.8% in 2006 (25.1% in 2005).
❖ SHARE OF PROFITS (LOSSES) OF ASSOCIATES AND JOINT VENTURES ACCOUNTED FOR USING THE EQUITY
METHOD
The Share of profits (losses) of associates and joint ventures accounted for using the equity methodrecorded profits of €51 million (profits of €23 million in 2005), an increase of €28 million compared with 2005.
Share of profits (losses) of associates and joint ventures accounted for using the equity method includes:
Year ended December 31,2006 2005(millions of Euro)
ETECSA. . . . . . . . . . . . . . . . . . . . . . . . . . . . . . . . . . . . . . . . . . . . . . . . . . . . . . . . . . . . . . . . . . . . . . . . . . . . . . . . . 47 45Sofora Telecomunicaciones S.A. . . . . . . . . . . . . . . . . . . . . . . . . . . . . . . . . . . . . . . . . . . . . . . . . . . . . . . . . 3 16Solpart Participações S.A. . . . . . . . . . . . . . . . . . . . . . . . . . . . . . . . . . . . . . . . . . . . . . . . . . . . . . . . . . . . . . . 1 94Avea I.H.A.S. . . . . . . . . . . . . . . . . . . . . . . . . . . . . . . . . . . . . . . . . . . . . . . . . . . . . . . . . . . . . . . . . . . . . . . . . . . . — (122)Other investments . . . . . . . . . . . . . . . . . . . . . . . . . . . . . . . . . . . . . . . . . . . . . . . . . . . . . . . . . . . . . . . . . . . . . . — (10)
Total share of profits (losses) of associates and joint ventures accounted forusing the equity method . . . . . . . . . . . . . . . . . . . . . . . . . . . . . . . . . . . . . . . . . . . . . . . . . . . . . . . . . . . 51 23
For further details about the above mentioned investments accounted for using the equity method please see“Item 4. Information on the Telecom Italia Group—4.2 Business Units—4.2.7 Other Telecom Italia GroupActivities”, and “Note 8—Other Non-current assets” of the Notes to the Consolidated Financial Statementsincluded elsewhere in this Annual Report.
107

Item 5. Operating And Financial Review And Prospects Results Of Operations For The Three Years Ended December 31, 2006
❖ FINANCIAL INCOME AND EXPENSES, NET
Total financial income and expenses showed a net expense balance of €1,973 million (a net expense balanceof €1,987 million in 2005), representing an improvement of €14 million compared to 2005.
The percentage of net financial expense to revenues was 6.3% compared with 6.6% in 2005.
Net financial income and expenses are detailed as follows:
Year ended December 31,2006 2005
(millions of Euro)Financial management balance(*) . . . . . . . . . . . . . . . . . . . . . . . . . . . . . . . . . (2,332) (2,505)Investment management and Avea provisions released to
income . . . . . . . . . . . . . . . . . . . . . . . . . . . . . . . . . . . . . . . . . . . . . . . . . . . . . . . . . 359 518
Total financial income and expenses, net . . . . . . . . . . . . . . . . . . . . . . (1,973) (1,987)
(*) It refers mainly to net interest expenses and other borrowing costs, foreign exchange gains and losses, and income and expenses fromhedging and non-hedging derivatives.
Net financial expense in 2006 decreased by €14 million due to the following factors:
Š the improvement in the financial management balance of €173 million mainly as a result of thereduction in net average debt exposure during 2006 compared to 2005 which more than compensatedfor the negative impact arising from the increase of interest rates on the floating rate portion of debt;
Š a decrease of €159 million due to investment management and to the release in the year 2005 ofprovisions relating to Avea I.H.A.S..
In 2006 the investment management balance and AVEA provisions released to income totaling€359 million comprised:
Š the gain on the sale of Avea I.H.A.S (€72 million) in the third quarter of 2006 and, at the sametime, the release to income of the remaining provisions for sureties provided to banks (€121million);
Š the gain on the sale of the entire 4.99% stake held in Neuf Télécom (€148 million);
Š other income relating to investment management (€18 million).
In 2005, the investment management balance and AVEA provisions released to income totaling€518 million comprised:
Š the release to income of a portion of the provisions set aside for sureties provided to banks whichhad financed Avea I.H.A.S. since there was no longer a risk owing to the cancellation of a part ofthe guarantees (€423 million);
Š gains connected with the sales of C-Mobil (€61 million), the investment in Intelsat (€2 million) andGolden Lines (€5 million).
For further details about financial income and expenses, net please see “Note 36—Financial income” and“Note 37—Financial expenses”, respectively, of the Notes to the Consolidated Financial Statements includedelsewhere in this Annual Report.
❖ INCOME FROM CONTINUING OPERATIONS BEFORE TAXES
Income from continuing operations before taxes decreased by €20 million (from €5,535 million in 2005 to€5,515 million in 2006).
As a percentage of revenues, income from continuing operations before taxes was 17.6% in 2006 (18.5% in 2005).
108

Item 5. Operating And Financial Review And Prospects Results Of Operations For The Three Years Ended December 31, 2006
❖ INCOME TAXES
Income taxes for the year increased by €124 million, or 5.2%, from €2,395 million in 2005 to €2,519 million in2006. Such change was mainly due to the increase in taxable income as well as to the provision for income taxesrecorded by the Parent Company Telecom Italia.
For further details about income taxes, please see “Note 38—Income taxes” of the Notes to the ConsolidatedFinancial Statements included elsewhere in this Annual Report.
The percentage of income taxes to revenues was 8.1% in 2006 compared to 8.0% in 2005.
❖ NET INCOME FROM CONTINUING OPERATIONS
Net income from continuing operations decreased by €144 million, or 4.6%, from €3,140 million in 2005 to€2,996 million in 2006. This decrease was due to the small decline in income from continuing operations beforetaxes and the higher level of taxes in 2006 compared to 2005.
As a percentage of revenues, net income from continuing operations was 9.6% in 2006 (10.5% in 2005).
❖ NET INCOME (LOSS) FROM DISCONTINUED OPERATIONS/ASSETS HELD FOR SALE
Net income from discontinued operations/assets held for sale decreased by €543 million, from€550 million in 2005 to €7 million in 2006 and included:
Š €31 million relating to the gain, net of incidental expenses, arising from the sale of Digitel Venezuela inMay 2006;
Š €9 million for a provision for risks and charges recorded in connection with the sale of DigitelVenezuela;
Š €15 million for the positive contribution to net income by the same Digitel Venezuela for the first fourmonths of 2006;
Š €30 million for a provision recorded in connection with the sale of Tim Hellas carried out in 2005.
In 2005 we had more significant asset sales which resulted in the high level of net income in that year whichincluded the gains, net of incidental expenses, on the sales of Tim Hellas (€410 million) and Tim Perù (€120million), losses and incidental charges on the sales of the Finsiel group, the Entel Chile group and Gruppo Buffetti(€24 million) and the net income of companies classified as discontinued operations/assets held for sale (€44million).
❖ NET INCOME FOR THE YEAR
Net income for the year in 2006 decreased by €687 million, or 18.6%, from €3,690 million in 2005 to€3,003 million in 2006.
As a percentage of revenues, net income for the year was 9.6% in 2006 (12.3% in 2005).
In particular:
Š net income attributable to equity holders of the Parent in 2006 was €3,014 million compared with€3,216 million in 2005, showing a decrease of €202 million;
Š net income (loss) attributable to Minority Interest in 2006 was a €11 million loss compared with€474 million of income in 2005, a decline of €485 million mainly due to the TIM merger transaction(tender offer and merger). During 2005, Telecom Italia S.p.A. acquired full control over the mobilebusiness through a tender offer in January 2005 and the merger in June 2005 with the consequenteffect of eliminating Minority Interests attributable to TIM.
109

Item 5. Operating And Financial Review And Prospects Results Of Operations For The Three Years Ended December 31, 2006
5.5.6 RESULTS OF OPERATIONS OF BUSINESS UNITS FOR THE YEAR ENDED DECEMBER 31, 2006 COMPARED WITH
THE YEAR ENDED DECEMBER 31, 2005.
❖ OPERATIONS
On October 5, 2005, the Board of Directors of Telecom Italia adopted the “One Company Model” organizationalstructure by converging the two previous Wireline and Mobile Business Units into one single unit (Operations).
For purposes of accounting presentation, Wireline continues to be shown separately and starting from 2006,Mobile activities have been divided into Domestic Mobile and Brazil Mobile.
In order to present an overall picture of Operations, the following table shows the key results for the year endedDecember 31, 2006, compared to the corresponding items of the year ended December 31, 2005, reclassified forpurposes of comparison.
Year ended December 31,Operations 2006 2005
(millions of Euro, exceptpercentages and employees)
Gross revenues . . . . . . . . . . . . . . . . . . . . . . . . . . . . . . . . . . . . . . . . . . . . . . . . . . . . . . . . . . . . . . . . . . . . 30,388 29,096
Operating income . . . . . . . . . . . . . . . . . . . . . . . . . . . . . . . . . . . . . . . . . . . . . . . . . . . . . . . . . . . . . . . . . . 8,148 8,144
% of gross revenues . . . . . . . . . . . . . . . . . . . . . . . . . . . . . . . . . . . . . . . . . . . . . . . . . . . . . . . . . . . . . . . . 26.8 28.0
Number of employees at year-end . . . . . . . . . . . . . . . . . . . . . . . . . . . . . . . . . . . . . . . . . . . . . . . . . . 76,457 77,754
A commentary on the operating and financial performance and the principal activities carried out during 2006 byOperations (Wireline, Domestic Mobile and Brazil Mobile) follows herewith.
❖ WIRELINE
The following table sets forth, for the periods indicated, certain financial and other data for the Wireline BusinessUnit.
Year ended December 31,Wireline 2006 2005(1)
(millions of Euro, exceptpercentages and employees)
Gross revenues . . . . . . . . . . . . . . . . . . . . . . . . . . . . . . . . . . . . . . . . . . . . . . . . . . . . . . . . . . . . . . . . . . 17,795 17,834
Operating income . . . . . . . . . . . . . . . . . . . . . . . . . . . . . . . . . . . . . . . . . . . . . . . . . . . . . . . . . . . . . . . 4,396 4,488
% of gross revenues . . . . . . . . . . . . . . . . . . . . . . . . . . . . . . . . . . . . . . . . . . . . . . . . . . . . . . . . . . . . . 24.7 25.2
Number of employees at year-end . . . . . . . . . . . . . . . . . . . . . . . . . . . . . . . . . . . . . . . . . . . . . . . 55,705 56,987
(1) As a result of the new organizational structure of the Group approved on October 5, 2005 (the so-called “One Company Model”), theactivities of the Innovation & Engineering Services business segment of Telecom Italia (ex-TILAB segment of Telecom Italia, previouslyincluded in Other activities) were transferred to the Wireline Business Unit; therefore 2005 results have been reclassified for purposes ofcomparison.
110

Item 5. Operating And Financial Review And Prospects Results Of Operations For The Three Years Ended December 31, 2006
The following table sets forth, for the periods indicated, certain statistical data for Wireline.
As of and for theyear ended December 31,
2006 2005
Subscriptions and customers:Fixed network connections in Italy (thousands)(1) . . . . . . . . . . . . . . . . . . . . . . . . . . . . . . . . . . . . . . 23,698 25,049Physical accesses (Consumer + Business) (thousands) . . . . . . . . . . . . . . . . . . . . . . . . . . . . . . . . . 20,540 21,725Voice pricing plans (thousands)(2) . . . . . . . . . . . . . . . . . . . . . . . . . . . . . . . . . . . . . . . . . . . . . . . . . . . . . 6,468 6,321Broadband Accesses (thousands)(3): . . . . . . . . . . . . . . . . . . . . . . . . . . . . . . . . . . . . . . . . . . . . . . . . . . . 8,660 7,020
Š Domestic (thousands) . . . . . . . . . . . . . . . . . . . . . . . . . . . . . . . . . . . . . . . . . . . . . . . . . . . . . . . . 6,770 5,707Š European, other than domestic (thousands) . . . . . . . . . . . . . . . . . . . . . . . . . . . . . . . . . . 1,890 1,313
Alice page views (ex-Virgilio)—(millions) . . . . . . . . . . . . . . . . . . . . . . . . . . . . . . . . . . . . . . . . . . . . . . . 13,283 9,842Alice (ex-Virgilio) average monthly single visitors—(millions) . . . . . . . . . . . . . . . . . . . . . . . . . . . 19.1 15.7Network infrastructure in Italy:
Š Access network in copper (millions of km-pair) . . . . . . . . . . . . . . . . . . . . . . . . . . . . . . . 105.7 105.2Š Access network and transport in optical fibers (millions of km of optical
fibers) . . . . . . . . . . . . . . . . . . . . . . . . . . . . . . . . . . . . . . . . . . . . . . . . . . . . . . . . . . . . . . . . . . . . . . . 3.7 3.7Network infrastructure outside Italy:
Š European backbone (km of optical fibers) . . . . . . . . . . . . . . . . . . . . . . . . . . . . . . . . . . . . . 51,000 51,000Wireline Traffic:Wireline total traffic (Retail and Wholesale) (billions of minutes) . . . . . . . . . . . . . . . . . . . . . . . . 173.8 185.1of which:
Š Domestic . . . . . . . . . . . . . . . . . . . . . . . . . . . . . . . . . . . . . . . . . . . . . . . . . . . . . . . . . . . . . . . . . . . . 160.1 171.3Š International . . . . . . . . . . . . . . . . . . . . . . . . . . . . . . . . . . . . . . . . . . . . . . . . . . . . . . . . . . . . . . . . . 13.7 13.8
(1) Data exclude internal lines.
(2) Number of contracts; data include Teleconomy, Hellò and other Business voice offers.
(3) Number of contracts.
Gross Revenues decreased by €39 million, or 0.2%, from €17,834 million in 2005 to €17,795 million in 2006.
Gross revenues were significantly affected by the reduction in the fixed-mobile termination rates (a decrease ingross revenues of €152 million), which took place starting from the second half of 2005, the acceleration of themigration of voice traffic from the fixed to the mobile network, as well as adjustments for amounts on premiumservices for traffic not recognized by customers (€43 million). This traffic was identified, by the customersthemselves, as the result of the fraudulent conduct of third parties. These decreases were partly offset by thestrong growth of the European and domestic broadband market.
Wireline tracks revenues in the following business areas: Retail Telephone, Retail Internet, Data Business,Wholesale and European Broadband Project.
Š Retail Telephone. Retail Telephone services consist mainly of services offered using traditionaltechnology (PSTN and ISDN) as well as innovative technology (VoIP). Retail telephone services include:access to the network, traffic (in terms of minutes of retail traffic and tariff packages), equipment rental andassurance and value added services for voice. Retail Telephone revenues consist mainly of traffic revenues,fee revenues and sales revenues. In particular, traffic revenues are directly related to traffic volumes, tariffsand fees for tariff packages; fees are attributable to access fees, fees for additional services and forequipment rental and assurance; sales revenues are related to sales of equipment (telephones).
Revenues from Retail Telephone were €9,308 million in 2006, a decrease of €787 million, or 7.8% from€10,095 million in 2005. This business area was marked by a decrease in traffic as a result of the migrationfrom fixed line to mobile traffic, reduced revenues due to changes in the regulatory framework (reducedcharges associated with fixed-mobile termination and the 12XY subscriber information services) andpressure from competitors over prices in the Top Customer segment.
Š Retail Internet. Revenues from Retail Internet consist primarily of revenues from ADSL (mass marketbroadband access) for access fees and traffic, and revenues from Internet dial-up traffic revenues.
111

Item 5. Operating And Financial Review And Prospects Results Of Operations For The Three Years Ended December 31, 2006
Revenues from Retail Internet were €1,511 million in 2006, an increase of €74 million, or 5.2% from€1,437 million in 2005, principally due to the growth in broadband revenues (an increase of €127 million,11.5% compared to 2005). Wireline’s portfolio of broadband retail customers in Italy at December 31, 2006totaled approximately 5.6 million accesses (an increase of 17.1% compared to December 31, 2005).
In 2006, certain revenues relating to some offerings to business customers were reclassified from DataBusiness revenues to Retail Internet revenues; as a result of this, in 2005 such revenues were consistentlyreclassified with an increase in Retail Internet revenues of €240 million (from €1,197 million to €1,437million) and a decrease for the same amount in Data Business revenues (from €2,107 million to €1,867million).
Š Data Business. Data Business consist primarily of data transmission and network services for businesscustomers and leased lines (trunk lines offering a customer-subscriber a permanent connection fortelecommunication services between two geographically separate points). This kind of connection can beused to handle high volume voice, data or video transmission.
Revenues from Data Business were €1,743 million in 2006, a decrease of €124 million, or 6.6% compared to€1,867 million in 2005. This reduction, due to stronger competition in the Corporate client market and to thepricing review of certain contracts with public authorities, is particularly evident in leased lines services (adecrease of €58 million) and traditional Data Transmission using data packet technology (a decrease of €58million). ICT services, however, recorded a positive performance, continuing its growth trend (an increase of€52 million, or 9.5% compared to 2005).
Š Wholesale. Wholesale consists of domestic and international services to other domestic and internationaloperators. Services offered to other domestic operators (wireline and wireless operators as well as Internetservice providers) consist mainly of interconnection to Telecom Italia’s network, in terms of access andtraffic (carried traffic and transits); broadband access (ADSL and XDSL access), and leased lines. Servicesoffered to international operators consist mainly of traffic (carried traffic and transits) and data access.
Revenues from Wholesale were €3,989 million in 2006, an increase of €463 million, or 13.1% compared to2005 (€3,526 million in 2005).
Revenues from Domestic Wholesale services were €2,131 million in 2006, an increase of €180 million, or9.2% compared to 2005 (€1,951 million in 2005); revenues from International Wholesale services were€1,858 million in 2006, an increase of €283 million, or 18.0% compared to 2005 (€1,575 million in 2005).
Š European Broadband Project. Revenues from the European Broadband Project (France, Germany andThe Netherlands), were €915 million in 2006 (an increase of €350 million compared to 2005). Wireline’soverall portfolio of European broadband customers at December 31, 2006 was 1,890,000 (an increase of577,000 units, or 43.9% compared to 2005), while total customers were 2.15 million.
In detail, the following table sets forth, for the periods indicated, certain financial and other data for theEuropean Broadband Project.
Year ended December 31,European Broadband Project 2006 2005
(millions of Euro, exceptpercentages and employees)
Gross revenues . . . . . . . . . . . . . . . . . . . . . . . . . . . . . . . . . . . . . . . . . . . . . . . . . . . . . . . . . . . . . . . 915 565
Operating loss . . . . . . . . . . . . . . . . . . . . . . . . . . . . . . . . . . . . . . . . . . . . . . . . . . . . . . . . . . . . . . . . (125) (117)
% of gross revenues . . . . . . . . . . . . . . . . . . . . . . . . . . . . . . . . . . . . . . . . . . . . . . . . . . . . . . . . . . . (13.7) (20.7)
Number of employees at year-end . . . . . . . . . . . . . . . . . . . . . . . . . . . . . . . . . . . . . . . . . . . . . 3,066 2,494
The contribution of the Wireline Business Unit to our consolidated revenues amounted to €16,426 million in 2006and €16,356 million in 2005.
112

Item 5. Operating And Financial Review And Prospects Results Of Operations For The Three Years Ended December 31, 2006
Operating income decreased by €92 million, or 2.0%, from €4,488 million in 2005 to €4,396 million in 2006 andwas highly affected by the variation in the revenue mix and by the added push given to sales to support newbusiness initiatives as a result of competitive pressure in Italy.
With regard to changes in costs, the following is noted:
Š purchases of materials and external services were €7,692 million in 2006, an increase of 3.6% comparedto 2005. The growth of €266 million is principally due to the costs associated with investment in thedevelopment of broadband in Europe (€246 million);
Š personnel costs were €2,635 million in 2006, a decrease of €192 million, or 6.8% compared to 2005.The decrease was largely due to the reduction in employees as well as lower restructuring costs (adecrease of € 160 million);
Š other operating expenses were €639 million in 2006, an increase of €79 million compared to 2005. Thisincrease is due in part to the inclusion in 2006 of an accrual set aside for the arbitration proceedingsinitiated by Fastweb with regard to the execution of the contract for “Local Loop Unbundling” (€61million).
In 2006 Telecom Italia performed a review of the estimated useful life of its tangible assets in order to bring theminto line with the technological and market developments of the last few years and also with the convergence offixed—mobile telecommunications. This review resulted in an increase in operating income for the WirelineBusiness Unit as depreciation charges were lowered by €219 million. This positive effect was largely offset by anincrease in the amortization charge for intangible assets, mainly software.
Operating margin decreased to 24.7% in 2006 compared to 25.2% in 2005.
❖ DOMESTIC MOBILE
The following table sets forth, for the periods indicated, certain financial and other data for the Domestic MobileBusiness Unit.
The 2006 data refers to Tim Italia S.p.A. through the date of the merger of Tim Italia S.p.A. into Telecom ItaliaS.p.A. (March 1, 2006), and to Telecom Italia S.p.A.’s domestic mobile segment for the period March—December2006. The 2005 data refers to TIM S.p.A. (the Company’s former subsidiary through which the domestic mobileoperations were conducted), through the date of the demerger of the mobile operations to Tim Italia S.p.A.(March 1, 2005), and to Tim Italia S.p.A. in the period March—December 2005.
Year ended December 31,Domestic Mobile 2006 2005
(millions of Euro, exceptpercentage and employees)
Gross revenues . . . . . . . . . . . . . . . . . . . . . . . . . . . . . . . . . . . . . . . . . . . . . . . . . . . . . . . . . . . . . . . . . . . . 10,210 10,076
Operating income . . . . . . . . . . . . . . . . . . . . . . . . . . . . . . . . . . . . . . . . . . . . . . . . . . . . . . . . . . . . . . . . . 3,742 3,856
% of gross revenues . . . . . . . . . . . . . . . . . . . . . . . . . . . . . . . . . . . . . . . . . . . . . . . . . . . . . . . . . . . . . . . 36.7 38.3
Number of employees at year-end . . . . . . . . . . . . . . . . . . . . . . . . . . . . . . . . . . . . . . . . . . . . . . . . . 11,218 11,720
113

Item 5. Operating And Financial Review And Prospects Results Of Operations For The Three Years Ended December 31, 2006
The following table sets forth, for the periods indicated, certain Domestic Mobile statistical data.
Year ended December 31,2006 2005
Mobile telephone lines in Italy at year-end (thousands)(1) . . . . . . . . . . . . . . . . . . . . . . . . . . . . . . 32,450 28,576GSM subscriber lines (thousands) . . . . . . . . . . . . . . . . . . . . . . . . . . . . . . . . . . . . . . . . . . . . . . . . . . . . . . . 4,370 3,186Prepaid GSM/UMTS lines (thousands) . . . . . . . . . . . . . . . . . . . . . . . . . . . . . . . . . . . . . . . . . . . . . . . . . . 28,080 25,296Customer growth(%) . . . . . . . . . . . . . . . . . . . . . . . . . . . . . . . . . . . . . . . . . . . . . . . . . . . . . . . . . . . . . . . . . . . 13.6 8.8Churn rate(2) . . . . . . . . . . . . . . . . . . . . . . . . . . . . . . . . . . . . . . . . . . . . . . . . . . . . . . . . . . . . . . . . . . . . . . . . . . . 16.4 16.9Average monthly revenues per line (€)(3) . . . . . . . . . . . . . . . . . . . . . . . . . . . . . . . . . . . . . . . . . . . . . . . 25.6 29.3Total Mobile outgoing traffic per month (millions of minutes) . . . . . . . . . . . . . . . . . . . . . . . . . . . 2,443 2,314Total Mobile incoming and outgoing traffic per month (millions of minutes) . . . . . . . . . . . . . 3,730 3,550
(1) Includes Prepaid Customers and excludes the “inactive” lines. Also includes 25,000 TACS subscriber lines as of December 31, 2005, whileTACS prepaid lines were 69,000 as of December 31, 2005.
(2) The figures refer to the total number of lines. The churn rate for a given period represents the number of mobile customers who ceasedto be customers during the period (by choice or due to unpaid bills) expressed as a percentage of the average number calculated on thebasis of the annual numbers of customers during the period.
(3) Includes total revenues from fees, traffic (domestic and not) and VAS, excluding revenues from the sale of products.
Gross revenues increased by €134 million, or 1.3%, from €10,076 million in 2005 to €10,210 million in 2006.Gross revenues were negatively impacted by the new termination price list which came into force (the price paidby fixed line operators when calls terminate on the mobile network) which reduced revenues by €372 million.Excluding such impact, gross revenues would have increased by 5% in 2006 compared to 2005.
The increase in 2006 revenues was principally due to the strong increase in VAS revenues to €1,649 million in2006 (an increase of €152 million, or 10.2% compared to 2005) due to the continuing innovation of services andthe portfolio of offerings on interactive services: revenues from interactive services increased by €103 million, or20.2% compared to 2005. The percentage of VAS revenues to gross revenues was 16.2% in 2006 (14.9% in 2005)and the percentage of VAS revenues to services revenues was 17.5% in 2006 (16.0% in 2005).
Revenues from voice services (€7,292 million in 2006) were impacted by an increase in outgoing traffic (anincrease of €141 million, or 2.6%), which was more than offset by the decrease in incoming traffic (a decrease of€288 million, or 14.2%) and by the reduction in termination charges (a decrease of €372 million). Excluding thenegative impact, due to the reduction in termination charges, revenues from voice services would have increasedby €83 million, or 4.1%.
Revenues from equipment sales were €812 million in 2006, an increase of €106 million, or 15.0% compared to2005. In 2006, 7.4 million handsets were sold (an increase of 1.6 million compared to 2005), of which 2.5 millionrelated to UMTS handsets.
The contribution of the Domestic Mobile to our consolidated revenues was €9,939 million in 2006 and€9,776 million in 2005.
Operating income decreased by €114 million, or 3.0%, from €3,856 million in 2005 to €3,742 million in 2006.Such decrease was mainly due to increased costs (including higher levels of amortization of intangibles), asdescribed below:
Š purchases of materials and external services of €4,837 million in 2006, an increase of 6.8% compared to2005 (€4,529 million). This increase (€308 million) is principally due to higher interconnection costs(€129 million, mainly as a result of greater off-net traffic volumes), higher purchase costs for productsand content (€189 million) and electrical power used on industrial installations (€30 million, principallyattributable to price increases);
Š personnel costs were €469 million in 2006 a decrease of €79 million, or 14.4%, compared to 2005 (€548million). This decrease was principally due to lower average number of employees, as well asrestructuring costs (a decrease of €14 million); and
Š other operating expenses were €147 million in 2006, an increase of €16 million, or 12.2% compared to2005 (€131 million).
114

Item 5. Operating And Financial Review And Prospects Results Of Operations For The Three Years Ended December 31, 2006
In 2006 Telecom Italia performed a review of the estimated useful life of its tangible assets in order to bring theminto line with the technological and market developments of the last few years and also with the convergence offixed—mobile telecommunications. The impact on the Domestic Mobile Business Unit of such review was to lowerdepreciation charges for tangible assets by €100 million. This positive effect was offset by an increase in theamortization charge for intangible assets, mainly referring to software.
In 2006, following the introduction of new contracts which bind the customer to the Telecom Italia Group for24 months, or a penalty is applied, the Group capitalized subscriber acquisition costs in intangible assets andrecognizes them in the statement of income over the period of the underlying contract. The capitalization ofsubscriber acquisition costs in 2006 resulted in higher amortization charges of €34 million compared to 2005.
Operating margin decreased from 38.3% in 2005 to 36.7% in 2006.
❖ BRAZIL MOBILE
The following table sets forth, for the periods indicated, certain financial and other data for Brazil Mobile BusinessUnit.
Year ended December 31,Brazil Mobile 2006 2005
(millions of Euro, exceptpercentage and employees)
Gross revenues . . . . . . . . . . . . . . . . . . . . . . . . . . . . . . . . . . . . . . . . . . . . . . . . . . . . . . . . . . . . . . . . . . . . 3,964 2,900
Operating income (loss) . . . . . . . . . . . . . . . . . . . . . . . . . . . . . . . . . . . . . . . . . . . . . . . . . . . . . . . . . . . . 21 (190)
% of gross revenues . . . . . . . . . . . . . . . . . . . . . . . . . . . . . . . . . . . . . . . . . . . . . . . . . . . . . . . . . . . . . . . . 0.5 (6.5)
Number of employees at year-end . . . . . . . . . . . . . . . . . . . . . . . . . . . . . . . . . . . . . . . . . . . . . . . . . . 9,531 9,043
Gross revenues were €3,964 million in 2006 compared to €2,900 million in 2005, an increase of €1,064 million,or 36.7%. The increase was due to the growth in the customer base (25.4 million mobile lines at December 31,2006 compared with 20.2 million mobile lines at December 31, 2005), as well as the contribution made by value-added services (which rose from 5.7% of revenues in 2005 to 6.9% in 2006).
In July 2006, Anatel (the Brazilian regulatory agency) eliminated the “Bill and Keep” regulation under whichmobile operators, until that date, had not received or paid interconnection charges on the minutes of localmobile-mobile traffic when the balance between the incoming and outgoing minutes exchanged with a operatorfell within a 45%-55% range. This change had a positive impact on revenues in 2006 of €262 million and a similarincrease in interconnection charges.
The contribution of the Brazil Mobile Business Unit to our consolidated revenues amounted to €3,959 million in2006 and €2,895 million in 2005.
Operating income in 2006 was €21 million compared to an operating loss of €190 million in 2005, animprovement of €211 million. The improvement in 2006 was due to the above mentioned increase in grossrevenues, although such increase was offset in large part by higher costs. The increased costs were attributable tothe following reasons:
Š purchases of materials and external services were €2,210 million in 2006, an increase of 22.5%compared to 2005 (€1,804 million), mainly due to the aforementioned increase in interconnectioncharges. Such purchases as a percentage of gross revenues were 55.8% (62.2% in 2005);
Š personnel costs were €209 million in 2006 and increased by 31.4% compared to 2005 (€159 million)due to the increase in the number of personnel. Personnel costs as a percentage of gross revenues were5.3% (5.5% in 2005);
115

Item 5. Operating And Financial Review And Prospects Results Of Operations For The Three Years Ended December 31, 2006
Š other operating expenses were €642 million in 2006 and increased by 26.1% compared to 2005 (€509million). They include sundry expenses (€466 million in 2006 compared to €378 million in 2005),principally made up of indirect taxes and duties, TLC operating fees, writedowns and bad debts expense(€164 million in 2006 compared to €117 million in 2005) and other items (€11 million in 2006compared to €15 million in 2005);
Š depreciation and amortization were €929 million in 2006 and increased by 44.0% compared to 2005(€645 million) as a consequence of higher investments in network infrastructure and informationsystems. Effective January 1, 2006, subscriber acquisition costs (referring to subsidies for the purchaseof handsets when there are contracts binding the customer to the company for a period of at least12 months, otherwise a penalty is applied in the event of the early cancellation of the contract) arecapitalized and amortized in relation to the revenues and on the basis of the period of the contract. In2006, such capitalization resulted in higher amortization of €58 million.
❖ MEDIA
The following table sets forth, for the periods indicated, certain financial and other data for the Media BusinessUnit.
Year ended December 31,Media 2006 2005
(millions of Euro, exceptpercentage and employees)
Gross revenues . . . . . . . . . . . . . . . . . . . . . . . . . . . . . . . . . . . . . . . . . . . . . . . . . . . . . . . . . . . . . . . . . . . . 207 180
Operating loss . . . . . . . . . . . . . . . . . . . . . . . . . . . . . . . . . . . . . . . . . . . . . . . . . . . . . . . . . . . . . . . . . . . . . (137) (130)
% of gross revenues . . . . . . . . . . . . . . . . . . . . . . . . . . . . . . . . . . . . . . . . . . . . . . . . . . . . . . . . . . . . . . . (66.2) (72.2)
Number of employees at year-end . . . . . . . . . . . . . . . . . . . . . . . . . . . . . . . . . . . . . . . . . . . . . . . . . 919 886
Gross revenues increased by €27 million, or 15.0%, from €180 million in 2005 to €207 million in 2006. Theincrease in gross revenues was due to the contribution of domestic advertising sales, which outpaced the flatsales of the Italian advertising market’s television sector during 2006, and the growth in digital terrestrialrevenues.
In particular:
Š revenues in 2006 of the Free to Air analog and satellite business area were €168 million, an increase of3.6% compared to 2005;
Š revenues from Digital Terrestrial Television were €32 million, compared to €10 million in 2005;
Š revenues from the News area were €9 million, an increase of 38.8% compared to 2005.
The contribution of the Media Business Unit to our consolidated revenues amounted to €197 million in 2006 and€176 million in 2005.
Operating loss increased by €7 million (a loss of €130 million in 2005 compared to a loss of €137 million in2006), mainly due to an increase in depreciation and amortization charges (€18 million) in the Television area as aresult of investments made during 2005 following the acquisition of a new nationally-televised network, as well asthe acquisitions made in 2006 of new frequencies for Digital Terrestrial TV.
2006 operating loss (excluding depreciation and amortization) improved in analog and satellite Free to Airbroadcasting, driven by the growth of national advertising (an increase of 10.8%). The improvement was also areflection of La7’s actions to concentrate its resources on adding more programs to its schedule with a higheraudience/advertising return and MTV’s actions of developing new multichannel/multiplatform strategies. Digitalterrestrial TV, notwithstanding an improvement in pay-per-view margins, still loss-making, reported higheroperating costs associated with the start-up of the new “free” channels (e.g. La7 Sport and Flux) in relation towhich advertising revenues remained negligible.
116

Item 5. Operating And Financial Review And Prospects Results Of Operations For The Three Years Ended December 31, 2006
❖ OLIVETTI
The following table sets forth, for the periods indicated, certain financial and other data for the Olivetti BusinessUnit.
Year ended December 31,Olivetti 2006 2005
(millions of Euro, exceptpercentage and employees)
Gross revenues . . . . . . . . . . . . . . . . . . . . . . . . . . . . . . . . . . . . . . . . . . . . . . . . . . . . . . . . . . . . . . . . . . . . 440 452
Operating loss . . . . . . . . . . . . . . . . . . . . . . . . . . . . . . . . . . . . . . . . . . . . . . . . . . . . . . . . . . . . . . . . . . . . . (50) (38)
% of gross revenues . . . . . . . . . . . . . . . . . . . . . . . . . . . . . . . . . . . . . . . . . . . . . . . . . . . . . . . . . . . . . . . . (11.4) (8.4)
Number of employees at year-end . . . . . . . . . . . . . . . . . . . . . . . . . . . . . . . . . . . . . . . . . . . . . . . . . . 1,428 1,750
Gross revenues decreased by €12 million, or 2.7% from €452 million in 2005 to €440 million in 2006. Excludingthe effects of change in the scope of consolidation, exchange rates and the sale of intellectual properties, thedecrease in gross revenues would have been €5 million (-1.1%). The decrease is mainly due to a decrease inrevenues related to products for Gaming and traditional Ink-jet products, which were only partly offset by higherrevenues of specialized printers, new Ink-jet products (multifunctional color printers and portable photo printerslaunched on the market during the last months of 2005) and professional Office products.
The contribution of the Olivetti Business Unit to our consolidated revenues was €385 million in 2006 and€400 million in 2005.
Operating loss increased by €12 million, or 31.6% from €38 million in 2005 compared to €50 million in 2006principally due to the decrease in revenues.
5.5.7 YEAR ENDED DECEMBER 31, 2005 COMPARED WITH YEAR ENDED DECEMBER 31, 2004
In 2005, our consolidated net income attributable to equity holders of the Parent was €3,216 million (netincome of €3,690 million before Minority Interests), compared to consolidated net income attributable to equityholders of the Parent of €1,815 million (net income of €2,834 million before Minority Interests) in 2004.
The increase of €1,401 million in 2005 was principally due to the following factors:
Š a higher share of profits in associates accounted for using the equity method, of €28 million;
Š lower financial expenses, net of financial income, of €5 million. In particular, in 2005, financial incomeincluded the release to the statement of income of a portion of provisions recorded in 2002 for theguarantees provided by the Group to banks which had financed AVEA I.H.A.S., our interest in mobileoperations in Turkey, since the risk had ceased with respect to the cancellation of the same guarantees(€423 million), partially offset by higher financial expenses due to the increase in indebtednessconnected with the tender offer for TIM shares and lower capital gains from the management ofinvestments (€418 million);
Š lower income taxes of €259 million;
Š an increase in net income from discontinued operations / assets held for sale of €668 million. In 2005net income from discontinued operations/assets held for sale amounted to €550 million compared to anet loss of €118 million in 2004. 2005 included €410 million relating to the net gain realized on the saleof the entire investment held in Tim Hellas and €120 million relating to the net gain realized on the saleof the entire investment held in Tim Perù; and
Š lower net income attributable to Minority Interests of €545 million (€474 million in 2005 compared to€1,019 million in 2004), mainly arising from the integration of TIM (tender offer and merger), which ledto full control over the Domestic Mobile business.
117

Item 5. Operating And Financial Review And Prospects Results Of Operations For The Three Years Ended December 31, 2006
These factors which increased net income were offset in part by a decrease in operating income of €104 million.
The following table summarizes the main factors which affected the change in consolidated net incomeattributable to equity holders of the Parent in 2005:
1,815 +33-104+259
+668
+545 3,216
Net income from continuing operations:+€ 188 million
2004Operatingincome
Share of profits of associates and financialmanagement results
Incometaxes
Netincome from discontinuedoperations /assets held for sale
Netincome attributable to Minority Interests
2005
(millions of euro)
+1,401 (+77.2%)
❖ ReVENUES
Our consolidated revenues in 2005 were €29,919 million, an increase of €1,627 million or 5.8% compared to€28,292 million in 2004.
The increase in revenues was principally due to:
Š a significant contribution to revenue by the Brazil Mobile Business Unit (chiefly attributable to theactivities of the Tim Brasil group and to the positive foreign exchange effect) and the Domestic MobileBusiness Unit (due to the increased level of value-added services and the sale of 3G handsets);
Š an increase in revenues of the Wireline Business Unit due mainly to the expansion of the broadbandmarket, enhanced offerings for wholesale services and the growth of innovative services, particularlyWeb services, offset by a decline in the traditional telephony market;
Š an increase in revenue of the Media Business Unit which benefited from the growth in advertising andstart-up activities relating to digital terrestrial television; and
Š a reduction in the sales of the Olivetti Business Unit due to the decline in the average prices of faxmachines, lower sales volumes of ink-jet heads and the fall in the volumes and prices of the Gaming andspecialized printers division.
Revenues from telecommunications services are shown gross of the portion due to third-party operators of€4,713 million (€4,177 million in 2004).
Foreign revenues amounted to €6,165 million in 2005 (€4,556 million in 2004); 51.1% of the total came from theLatin America area (44.7% in 2004), principally Brazil.
118

Item 5. Operating And Financial Review And Prospects Results Of Operations For The Three Years Ended December 31, 2006
The table below sets forth, for the periods indicated, gross revenues and consolidated revenues by Business Unitand the percentage of their contributions to our consolidated revenues:
Year ended December 31,2005 2004
GrossRevenues(1)
ConsolidatedRevenues(2)
% ofConsolidated
RevenuesGross
Revenues(1)ConsolidatedRevenues(2)
% ofConsolidated
Revenues(millions of Euro, except percentages)
Wireline . . . . . . . . . . . . . . . . . . . . . . 17,834 16,356 54.7% 17,508 15,843 56.0%Domestic Mobile . . . . . . . . . . . . . . 10,076 9,776 32.7% 9,923 9,661 34.2%Brazil Mobile . . . . . . . . . . . . . . . . . . 2,900 2,895 9.7% 1,800 1,795 6.3%Media . . . . . . . . . . . . . . . . . . . . . . . . 180 176 0.6% 168 165 0.6%Olivetti . . . . . . . . . . . . . . . . . . . . . . . 452 400 1.3% 590 536 1.9%Other Activities(3) . . . . . . . . . . . . 1,321 316 1.0% 1,289 292 1.0%
Total revenues . . . . . . . . . . . . . . 32,763 29,919 100.0% 31,278 28,292 100.0%
(1) Gross revenues are total revenues of the various business units of the Telecom Italia Group before elimination of intercompany sales (butafter elimination of sales between companies within the same major business area).
(2) Data include revenues recorded by each business area on a consolidated basis after elimination of intercompany sales.
(3) Other activities consist of the Central Functions (Group Functions and Service Units) and the foreign operations not included in otherbusiness units (the Entel Bolivia group). For further details on Other Activities please see “Item 4. Information on the Telecom ItaliaGroup—4.2 Business Units—4.2.7 Other Telecom Italia Group Activities”.
The table below sets forth, for the periods indicated, revenues by geographical area and the percentage of totalconsolidated revenues:
Year ended December 31,
Geographical area2005 2004
(millions of Euro, except percentages)Italy . . . . . . . . . . . . . . . . . . . . . . . . . . . . . . . . . . . . . . . . . . . . . . . . . . . . . . . . . . . . . . . . . . 23,754 79.4% 23,736 83.9%Rest of Europe . . . . . . . . . . . . . . . . . . . . . . . . . . . . . . . . . . . . . . . . . . . . . . . . . . . . . . . . 2,265 7.6% 1,746 6.2%Latin America . . . . . . . . . . . . . . . . . . . . . . . . . . . . . . . . . . . . . . . . . . . . . . . . . . . . . . . . . 3,147 10.5% 2,036 7.2%Other Countries . . . . . . . . . . . . . . . . . . . . . . . . . . . . . . . . . . . . . . . . . . . . . . . . . . . . . . . 753 2.5% 774 2.7%
Total consolidated revenues . . . . . . . . . . . . . . . . . . . . . . . . . . . . . . . . . . . . . . . . 29,919 100.0% 28,292 100.0%
❖ OTHER INCOME
Other income amounted to €678 million, a decrease of €421 million compared to 2004 €1,099 million in 2004.The percentage of Other income to revenues was 2.3% in 2005 (3.9% in 2004).
Details are as follows:
Year ended December 31,2005 2004
(millions of Euro)Compensation for late payment of regulated telephone services . . . . . . . . . . . . . . . . . . . . 105 85Release of provisions and other liabilities . . . . . . . . . . . . . . . . . . . . . . . . . . . . . . . . . . . . . . . . . . . 228 162Recovery of costs of personnel and services rendered . . . . . . . . . . . . . . . . . . . . . . . . . . . . . . . 56 35Capital grants and grants related to income . . . . . . . . . . . . . . . . . . . . . . . . . . . . . . . . . . . . . . . . 47 64Damage compensations and penalties . . . . . . . . . . . . . . . . . . . . . . . . . . . . . . . . . . . . . . . . . . . . . . 35 32Income from release of prior year TLC operating fee . . . . . . . . . . . . . . . . . . . . . . . . . . . . . . . . — 546Other income . . . . . . . . . . . . . . . . . . . . . . . . . . . . . . . . . . . . . . . . . . . . . . . . . . . . . . . . . . . . . . . . . . . . . . 207 175
Total . . . . . . . . . . . . . . . . . . . . . . . . . . . . . . . . . . . . . . . . . . . . . . . . . . . . . . . . . . . . . . . . . . . . . . . . . . . . . . 678 1,099
In 2004 the statement of income benefited from €546 million relating to the release of the TLC license operatingfee paid by Telecom Italia and TIM for the year 1999, following the ruling by the TAR (the Regional AdministrativeCourt) of Lazio on January 4, 2005.
119

Item 5. Operating And Financial Review And Prospects Results Of Operations For The Three Years Ended December 31, 2006
❖ OPERATING EXPENSES
The table below sets forth, for the periods indicated, total consolidated operating expenses by majorcomponents and expressed as a percentage of total consolidated revenues.
Year ended December 31,2005 2004
(millions of Euro, except percentages)Purchases of materials and external services . . . . . . . . . . . . . . . . . . . . . . . . . . . . . . . . . 12,937 43.2% 11,812 41.7%Personnel costs . . . . . . . . . . . . . . . . . . . . . . . . . . . . . . . . . . . . . . . . . . . . . . . . . . . . . . . . . . . . . . 4,142 13.9% 3,852 13.6%Other operating expenses . . . . . . . . . . . . . . . . . . . . . . . . . . . . . . . . . . . . . . . . . . . . . . . . . . . . 1,468 4.9% 1,603 5.7%Changes in inventories . . . . . . . . . . . . . . . . . . . . . . . . . . . . . . . . . . . . . . . . . . . . . . . . . . . . . . . 4 — (27) (0.1)%Capitalized internal construction costs . . . . . . . . . . . . . . . . . . . . . . . . . . . . . . . . . . . . . . . (471) (1.6)% (713) (2.5)%Depreciation and amortization . . . . . . . . . . . . . . . . . . . . . . . . . . . . . . . . . . . . . . . . . . . . . . . 5,232 17.5% 4,808 17.0%Gains/losses on disposals of non-current assets . . . . . . . . . . . . . . . . . . . . . . . . . . . . . . (242) (0.8)% 9 —Impairment reversals/losses on non-current assets . . . . . . . . . . . . . . . . . . . . . . . . . . 28 0.1% 444 1.6%
Total operating expenses . . . . . . . . . . . . . . . . . . . . . . . . . . . . . . . . . . . . . . . . . . . . . . . . . 23,098 77.2% 21,788 77.0%
Our operating expenses increased by €1,310 million in 2005 compared to 2004 which is detailed as follows:
Š Purchases of materials and external services increased by €1,125 million (or 9.5%), from€11,812 million in 2004 to €12,937 million in 2005; the percentage of purchases of materials andexternal services to revenues was 43.2% (41.8% in 2004).
Purchases of materials and external services included:
Year ended December 31,2005 2004(millions of Euro)
Purchases of materials and merchandise for resale . . . . . . . . . (A) 2,506 2,203
Costs of services:- Revenues due to other TLC operators . . . . . . . . . . . . . . . . . . . . . . . 4,829 4,241- Commissions, sales commissions and other selling
expenses . . . . . . . . . . . . . . . . . . . . . . . . . . . . . . . . . . . . . . . . . . . . . . . . . . . 1,263 1,006- Advertising and promotion expenses . . . . . . . . . . . . . . . . . . . . . . . . 593 504- Professional consulting and services . . . . . . . . . . . . . . . . . . . . . . . . 530 608- Utilities . . . . . . . . . . . . . . . . . . . . . . . . . . . . . . . . . . . . . . . . . . . . . . . . . . . . 308 244- Maintenance . . . . . . . . . . . . . . . . . . . . . . . . . . . . . . . . . . . . . . . . . . . . . . . 339 395- Outsourcing costs for other services . . . . . . . . . . . . . . . . . . . . . . . . 256 244- Mailing and delivery expenses for telephone bills, directories
and other materials to customers . . . . . . . . . . . . . . . . . . . . . . . . . . . 90 64- Other service expenses . . . . . . . . . . . . . . . . . . . . . . . . . . . . . . . . . . . . . 1,119 1,355
(B) 9,327 8,661
Lease and rental costs:- Property lease rents . . . . . . . . . . . . . . . . . . . . . . . . . . . . . . . . . . . . . . . . 641 624- TLC circuit lease rents and rents for use of satellite
systems . . . . . . . . . . . . . . . . . . . . . . . . . . . . . . . . . . . . . . . . . . . . . . . . . . . . 274 154- Other lease and rental costs . . . . . . . . . . . . . . . . . . . . . . . . . . . . . . . . 189 170
(C) 1,104 948
Total purchases of materials and external services . . . . . . . . . (A+B+C) 12,937 11,812
120

Item 5. Operating And Financial Review And Prospects Results Of Operations For The Three Years Ended December 31, 2006
The principal reasons for the increase in Purchases of materials and external services were thefollowing:
Š purchases of materials and merchandise for resale increased by €303 million, or 13.8%, from€2,203 million in 2004 to €2,506 million in 2005. This increase was attributable, among otherthings, to sales of 3G handsets as the UMTS services were more broadly offered in 2005, as well asto innovative terminals (Aladino cordless phones and phones for video communication). Thepercentage of purchases of materials and merchandise for resale to revenues in 2005 was 8.4%(7.8% in 2004);
Š costs of services increased by €666 million, or 7.7%, from €8,661 million in 2004 to €9,327 millionin 2005. Such increase was attributable to a €588 million increase in revenues due to other TLCoperators (increased from €4,241 million in 2004 to €4,829 million in 2005 of and an increase of€257 million in Commissions, sales commissions and other selling expenses (increased from€1,006 million in 2004 to €1,263 million in 2005), principally as a result of the growth in mobilecustomers in 2005. These increases are partly offset by a €179 million net decrease in otherexpenses (from €3,414 million in 2004 to €3,235 million in 2005). The percentage of cost ofservices to revenues in 2005 was 31.2% (30.6% in 2004);
Š lease and rental costs increased by €156 million, or 16.5%, of which €120 million was attributableto TLC circuit lease rents and rents for use of satellite systems. The percentage of lease and rentalcosts to revenues in 2005 was 3.7% (3.3% in 2004).
Š Personnel costs increased by €290 million or 7.5% from €3,852 million in 2004 to €4,142 million in2005. Such change was principally due to Charges for termination benefit incentive plans, whichincreased by €251 million in 2005. Excluding these charges personnel costs would have increased by1.0%. The percentage of personnel costs to revenues was 13.8% in 2005 compared to 13.6% in 2004.
Personnel costs are detailed as follows:
Year ended December 31,2005 2004(millions of Euro)
Personnel costs at payroll:– Wages and salaries . . . . . . . . . . . . . . . . . . . . . . . . . . . . . . . . . . . . . . . . . . 2,600 2,595– Social security contributions . . . . . . . . . . . . . . . . . . . . . . . . . . . . . . . . . 813 812– Employee severance indemnities . . . . . . . . . . . . . . . . . . . . . . . . . . . . . 168 183– Other employee-related costs . . . . . . . . . . . . . . . . . . . . . . . . . . . . . . . . 88 64
(A) 3,669 3,654
Temp work costs . . . . . . . . . . . . . . . . . . . . . . . . . . . . . . . . . . . . . . . . . . . . . . (B) 52 38
Miscellaneous expenses for personnel and for other labor-related services rendered:– Remuneration of personnel other than employees . . . . . . . . . . . . 18 17– Charges for termination benefit incentive plans . . . . . . . . . . . . . . 394 143– Other . . . . . . . . . . . . . . . . . . . . . . . . . . . . . . . . . . . . . . . . . . . . . . . . . . . . . . . . 9 —
(C) 421 160
Total personnel costs . . . . . . . . . . . . . . . . . . . . . . . . . . . . . . . . . . . . . . . . . (A+B+C) 4,142 3,852
121

Item 5. Operating And Financial Review And Prospects Results Of Operations For The Three Years Ended December 31, 2006
The Group’s average equivalent number of employees in 2005 was 79,869 units (excluding employeesrelated to discontinued operations/assets held for sale and including personnel with temp workcontracts) compared to 79,602 units in 2004. The breakdown by category is as follows:
Year ended December 31,2005 2004
(Units)Executives . . . . . . . . . . . . . . . . . . . . . . . . . . . . . . . . . . . . . . . . . . . . . . . . . . . . . . . . . . . . . . . . . . . . 1,541 1,592Middle management . . . . . . . . . . . . . . . . . . . . . . . . . . . . . . . . . . . . . . . . . . . . . . . . . . . . . . . . . . 4,744 4,597White collars . . . . . . . . . . . . . . . . . . . . . . . . . . . . . . . . . . . . . . . . . . . . . . . . . . . . . . . . . . . . . . . . . 70,375 70,540Blue collars . . . . . . . . . . . . . . . . . . . . . . . . . . . . . . . . . . . . . . . . . . . . . . . . . . . . . . . . . . . . . . . . . . . 722 920
Total employees at payroll . . . . . . . . . . . . . . . . . . . . . . . . . . . . . . . . . . . . . . . . . . . . . . . . . 77,382 77,649Personnel with temp work contracts . . . . . . . . . . . . . . . . . . . . . . . . . . . . . . . . . . . . . . 2,487 1,953
Total employees . . . . . . . . . . . . . . . . . . . . . . . . . . . . . . . . . . . . . . . . . . . . . . . . . . . . . . . . . . . . 79,869 79,602
Š Other operating expenses decreased by €135 million (or 8.4%), from €1,603 million in 2004 to€1,468 million in 2005. Such operating expenses consist of the following:
Year ended December 31,2005 2004(millions of Euro)
Impairments and charges for bad debts . . . . . . . . . . . . . . . . . . . . . . . . . . . . . . . . . . . . . . . 521 498Provision for risks and charges . . . . . . . . . . . . . . . . . . . . . . . . . . . . . . . . . . . . . . . . . . . . . . . . 71 289TLC operating fees . . . . . . . . . . . . . . . . . . . . . . . . . . . . . . . . . . . . . . . . . . . . . . . . . . . . . . . . . . . 181 114Taxes on revenues of South American companies . . . . . . . . . . . . . . . . . . . . . . . . . . . . . 178 112Duties and indirect taxes . . . . . . . . . . . . . . . . . . . . . . . . . . . . . . . . . . . . . . . . . . . . . . . . . . . . . 141 153Association fees and dues . . . . . . . . . . . . . . . . . . . . . . . . . . . . . . . . . . . . . . . . . . . . . . . . . . . . 19 18Other expenses . . . . . . . . . . . . . . . . . . . . . . . . . . . . . . . . . . . . . . . . . . . . . . . . . . . . . . . . . . . . . . . 357 419
Total other operating expenses . . . . . . . . . . . . . . . . . . . . . . . . . . . . . . . . . . . . . . . . . . . . 1,468 1,603
The decrease in Other operating expenses was mainly due to the reduction of €218 million in Provisionfor risks and charges (€71 million in 2005 and €289 million in 2004). In 2004 Provisions for risks andcharges included €152 million recorded against the fine levied by the Antitrust Authority for the allegedabuse of a dominant position in the market.
Š Capitalized internal construction costs include sales of equipment, installations and services atmarket prices by Group companies, principally to Telecom Italia and Domestic Mobile. These costsdecreased by €242 million (or 33.9%), from €713 million in 2004 to €471 million in 2005, and consist ofthe following:
Year ended December 31,2005 2004(millions of Euro)
Capitalized internal construction costs on:– Intangible assets with a finite life . . . . . . . . . . . . . . . . . . . . . . . . . . . . . . . . . . . . . . . . . 287 522– Property, plant and equipment owned . . . . . . . . . . . . . . . . . . . . . . . . . . . . . . . . . . . . . 184 191
Total capitalized internal construction costs . . . . . . . . . . . . . . . . . . . . . . . . . . . . . 471 713
The reduction in 2005 compared to 2004 was due to the fact that in 2004, the external costs relating tocontracts that had to be capitalized were recorded in the statement of income, whereas, in 2005, suchcosts were booked directly to the capital asset account.
122
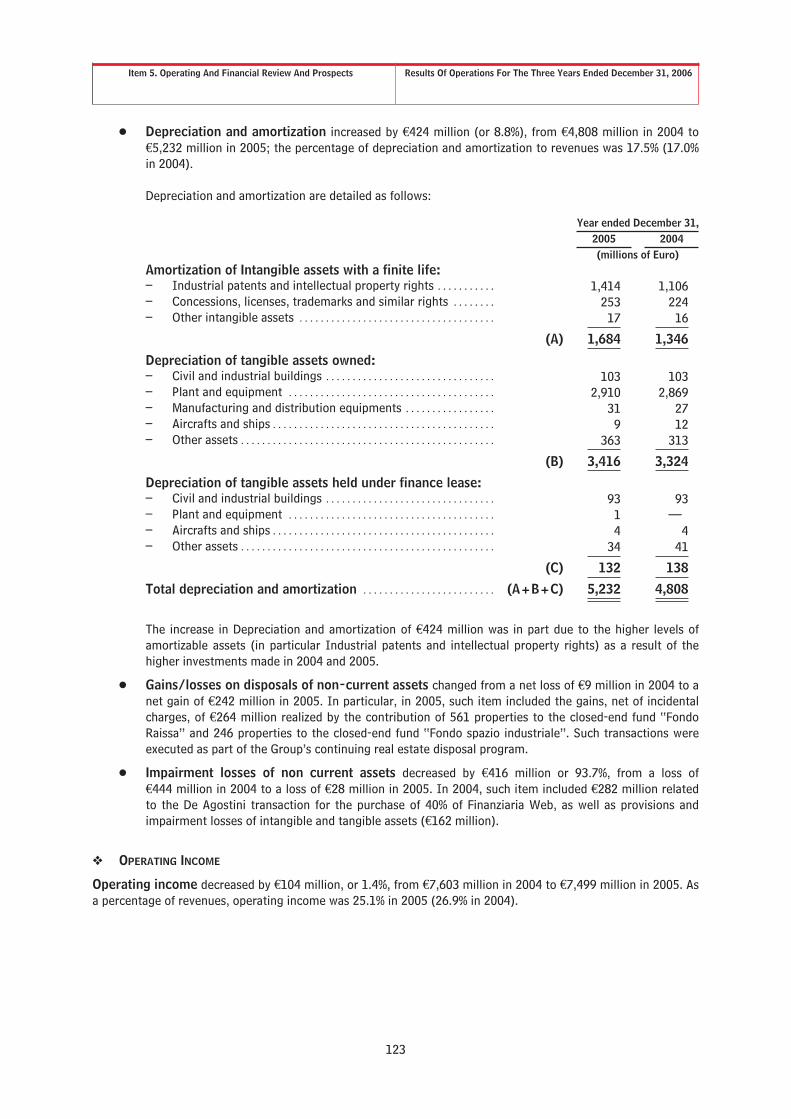
Item 5. Operating And Financial Review And Prospects Results Of Operations For The Three Years Ended December 31, 2006
Š Depreciation and amortization increased by €424 million (or 8.8%), from €4,808 million in 2004 to€5,232 million in 2005; the percentage of depreciation and amortization to revenues was 17.5% (17.0%in 2004).
Depreciation and amortization are detailed as follows:
Year ended December 31,2005 2004(millions of Euro)
Amortization of Intangible assets with a finite life:– Industrial patents and intellectual property rights . . . . . . . . . . . 1,414 1,106– Concessions, licenses, trademarks and similar rights . . . . . . . . 253 224– Other intangible assets . . . . . . . . . . . . . . . . . . . . . . . . . . . . . . . . . . . . . 17 16
(A) 1,684 1,346
Depreciation of tangible assets owned:– Civil and industrial buildings . . . . . . . . . . . . . . . . . . . . . . . . . . . . . . . . 103 103– Plant and equipment . . . . . . . . . . . . . . . . . . . . . . . . . . . . . . . . . . . . . . . 2,910 2,869– Manufacturing and distribution equipments . . . . . . . . . . . . . . . . . 31 27– Aircrafts and ships . . . . . . . . . . . . . . . . . . . . . . . . . . . . . . . . . . . . . . . . . . 9 12– Other assets . . . . . . . . . . . . . . . . . . . . . . . . . . . . . . . . . . . . . . . . . . . . . . . . 363 313
(B) 3,416 3,324
Depreciation of tangible assets held under finance lease:– Civil and industrial buildings . . . . . . . . . . . . . . . . . . . . . . . . . . . . . . . . 93 93– Plant and equipment . . . . . . . . . . . . . . . . . . . . . . . . . . . . . . . . . . . . . . . 1 —– Aircrafts and ships . . . . . . . . . . . . . . . . . . . . . . . . . . . . . . . . . . . . . . . . . . 4 4– Other assets . . . . . . . . . . . . . . . . . . . . . . . . . . . . . . . . . . . . . . . . . . . . . . . . 34 41
(C) 132 138
Total depreciation and amortization . . . . . . . . . . . . . . . . . . . . . . . . . (A+B+C) 5,232 4,808
The increase in Depreciation and amortization of €424 million was in part due to the higher levels ofamortizable assets (in particular Industrial patents and intellectual property rights) as a result of thehigher investments made in 2004 and 2005.
Š Gains/losses on disposals of non-current assets changed from a net loss of €9 million in 2004 to anet gain of €242 million in 2005. In particular, in 2005, such item included the gains, net of incidentalcharges, of €264 million realized by the contribution of 561 properties to the closed-end fund “FondoRaissa” and 246 properties to the closed-end fund “Fondo spazio industriale”. Such transactions wereexecuted as part of the Group’s continuing real estate disposal program.
Š Impairment losses of non current assets decreased by €416 million or 93.7%, from a loss of€444 million in 2004 to a loss of €28 million in 2005. In 2004, such item included €282 million relatedto the De Agostini transaction for the purchase of 40% of Finanziaria Web, as well as provisions andimpairment losses of intangible and tangible assets (€162 million).
❖ OPERATING INCOME
Operating income decreased by €104 million, or 1.4%, from €7,603 million in 2004 to €7,499 million in 2005. Asa percentage of revenues, operating income was 25.1% in 2005 (26.9% in 2004).
123

Item 5. Operating And Financial Review And Prospects Results Of Operations For The Three Years Ended December 31, 2006
❖ SHARE OF PROFITS (LOSSES) OF ASSOCIATES AND JOINT VENTURES ACCOUNTED FOR USING THE EQUITY
METHOD
The Share of profits (losses) of associates and joint ventures accounted for using the equity methodwas a profit of €23 million in 2005 (loss of €5 million in 2004), an increase of €28 million compared to 2004.
This item includes:
Year ended December 31,2005 2004(millions of Euro)
ETECSA. . . . . . . . . . . . . . . . . . . . . . . . . . . . . . . . . . . . . . . . . . . . . . . . . . . . . . . . . . . . . . . . . . . . . . . . . . . . . . . . . 45 (6)Sofora Telecomunicaciones S.A . . . . . . . . . . . . . . . . . . . . . . . . . . . . . . . . . . . . . . . . . . . . . . . . . . . . . . . . . 16 —Solpart Participaçoes S.A. . . . . . . . . . . . . . . . . . . . . . . . . . . . . . . . . . . . . . . . . . . . . . . . . . . . . . . . . . . . . . . . 94 —Avea I.H.A.S. . . . . . . . . . . . . . . . . . . . . . . . . . . . . . . . . . . . . . . . . . . . . . . . . . . . . . . . . . . . . . . . . . . . . . . . . . . . (122) —Other investments . . . . . . . . . . . . . . . . . . . . . . . . . . . . . . . . . . . . . . . . . . . . . . . . . . . . . . . . . . . . . . . . . . . . . . (10) 1
Total share of profits (losses) of associates and joint ventures accounted forusing the equity method . . . . . . . . . . . . . . . . . . . . . . . . . . . . . . . . . . . . . . . . . . . . . . . . . . . . . . . . . . . 23 (5)
In particular:
Š €45 million related to the Group’s share of income for 2005 of ETECSA (the operator of the Cubantelecommunications system); during 2004, the positive adjustment to ETECSA’s equity was more thanoffset by the impairment of goodwill;
Š €16 million related to Sofora Telecomunicaciones, the company through which Telecom Italia holds itsinterest in Telecom Argentina, mainly due to the significant result achieved by Telecom Argentina at theconclusion of the debt restructuring plan (at the end of August 2005) and following the positive effecton shareholder’s equity. The debt restructuring followed Telecom Argentina’s default on its obligationsin 2001 on account of the monetary crisis in Argentina;
Š €94 million related to restoring the equity method of accounting for the investment in SolpartParticipações through which Telecom Italia holds its interest in Brasil Telecom. Following theagreements signed on April 28, 2005, Telecom Italia reinstated its governance rights in SolpartParticipações, which had been temporarily suspended since August 2002, resuming its role in themanagement of the company;
Š the loss of €122 million relating to Avea I.H.A.S. (the group’s then mobile operations in Turkey) relatedto the Group’s share of the loss for 2005 of such associate. In 2004, the share of the loss had not beenrecognized as the investment was carried at zero value.
For further details about the above mentioned equity investments accounted for using the equity method pleasesee “Item 4. Information on the Telecom Italia Group—4.2 Business Units—4.2.7 Other Telecom Italia GroupActivities”, and “Note 8—Other Non Current Assets” of the Notes to the Consolidated Financial Statementsincluded elsewhere in this Annual Report.
❖ FINANCIAL INCOME AND EXPENSES, NET
Total financial income and expenses showed a net expense balance of €1,987 million (a net expense balanceof €1,992 million in 2004), representing an improvement of €5 million compared to 2004.
Net financial income and expense are detailed as follows:
Year ended December 31,2005 2004
(millions of Euro)Financial management balance (*) . . . . . . . . . . . . . . . . . . . . . . . . . . . . . . . . (2,505) (2,204)Investment management . . . . . . . . . . . . . . . . . . . . . . . . . . . . . . . . . . . . . . . . . . 95 212Avea provisions released to income . . . . . . . . . . . . . . . . . . . . . . . . . . . . . . . . 423 —
Total financial income and expenses, net . . . . . . . . . . . . . . . . . . . . . . (1,987) (1,992)
(*) It refers mainly to net interest expenses and other borrowing costs, foreign exchange gains and losses, and income and expenses fromhedging and non-hedging derivatives.
124

Item 5. Operating And Financial Review And Prospects Results Of Operations For The Three Years Ended December 31, 2006
The main changes are due to:
Š the release of provisions for €423 million booked in respect of sureties issued to the banks which hadfinanced the associate Avea, since there is no longer a risk following the cancellation of the guarantees;
Š the decrease in the net amount of income from the management of investments of €117 million, whichin 2004 had benefited from the gains realized in connection with the sale of the remaining investment inTelekom Austria (€86 million) as well as gains from the sale of the remaining stake in MirrorInternational (€85 million). In 2005, gains were realized on the sale of the investment in C-Mobil by theMobile Business Unit (€61 million), the sale of the investment in Intelsat by Entel Bolivia (€2 million)and the sale of the investment in Golden Lines by Telecom Italia International (€5 million);
Š the reduction in the balance of financial management is mainly due to disbursements made for thepurchase of TIM shares in the early months of the year through the Cash Tender Offer and otherpurchases on the market which had an impact in terms of both higher debt exposure and lower liquidity.
For further details about financial income and expenses, net please see “Note 36—Financial income” and“Note 37—Financial expenses”, respectively, of the Notes to the Consolidated Financial Statements includedelsewhere in this Annual Report.
❖ INCOME FROM CONTINUING OPERATIONS BEFORE TAXES
Income from continuing operations before taxes decreased by €71 million, from €5,606 million in 2004 to€5,535 million in 2005.
As a percentage of revenues, income from continuing operations before taxes was 18.5% in 2005 (19.8% in 2004).
❖ INCOME TAXES
Income taxes in 2005 decreased by €259 million, or 9.8%, from €2,654 million in 2004 to €2,395 million in 2005.
Besides the decrease in taxable income, the reduction of €259 million was due to the realignment made by TimItalia, ex art. 1, paragraph 469, Law No. 266/2005 and ex art. 14, Law No. 342/2000, of the figures in thestatutory financial statements with the tax figures, the latter being lower as a result of accelerated depreciationand the amortization of the UMTS license on which tax interference had already been eliminated in the 2004financial statements of TIM. This realignment led to a provision for equalization tax of €43 million and thereduction in the reserve for deferred taxes of €135 million.
The percentage of income taxes to revenues was 8.0% in 2005 (9.4% in 2004).
❖ NET INCOME FROM CONTINUING OPERATIONS
Net income from continuing operations increased by €188 million, or 6.4%, from €2,952 million in 2004 to€3,140 million in 2005. Although income from continuing operations before taxes decreased by €71 million from€5,606 million in 2004 to €5,535 million in 2005, such increase was attributable to the €259 million decrease inincome taxes due to the reasons discussed above.
The percentage of net income from continuing operations to revenues was 10.5% in 2005 (10.4% in 2004).
❖ NET INCOME (LOSS) FROM DISCONTINUED OPERATIONS/ASSETS HELD FOR SALE
Net income from discontinued operations/assets held for sale increased in 2005 by €668 million, from anet loss of €118 million in 2004 to a net income of €550 million in 2005.
This item in 2005 included:
Š €410 million gain (net of related incidental charges) from the sale of Tim Hellas;
Š €120 million gain (net of related incidental charges) from the sale of Tim Perù;
125

Item 5. Operating And Financial Review And Prospects Results Of Operations For The Three Years Ended December 31, 2006
Š €24 million loss (including incidental charges) from the sale of the Entel Chile group, Finsiel group andGruppo Buffetti. During 2004, net loss from discontinued operations/assets held for sale included: theimpairment loss on the goodwill related to Entel Chile (€177 million), the provision related to Finsielgroup for the adjustment to the estimated sale price (€28 million) and other provisions related tocompanies held for sale (€14 million), mainly relating to Entel Chile group;
Š €44 million related to net results of the companies classified as discontinued operations/assets held forsale including:
- net income of €26 million related to the Entel Chile group, consolidated for the first three monthsof 2005 (net income of €49 million in 2004);
- net loss of €11 million related to the Finsiel group, consolidated for the first six months of 2005(net loss of €7 million in 2004);
- net income of €11 million related to Tim Hellas, consolidated for the first five months of 2005 (netincome of €82 million in 2004);
- net loss of €3 million relating to Tim Perù, consolidated for to the first seven months of 2005 (netloss of €17 million in 2004);
- net income of €1 million relating to Gruppo Buffetti (unchanged compared to 2004);
- net income of €20 million relating to Digitel Venezuela (net loss of €7 million in 2004).
❖ NET INCOME FOR THE YEAR
Net income for the year 2005 increased by €856 million, or 30.2%, from €2,834 million in 2004 to€3,690 million in 2005. As a percentage of revenues, net income for the year was 12.3% in 2005 (10.0% in 2004).
Such increase was principally due to lower income taxes on income from continuing operations (€259 million), aswell as the increase of Net income from discontinued operations / assets held for sale (€668 million).
Net income for the year is broken down as follows:
Š net income attributable to equity holders of the Parent in 2005 was €3,216 million compared with€1,815 million in 2004, showing an increase of €1,401 million;
Š net income attributable to Minority Interests was €474 million in 2005 compared with €1,019 million in2004, showing a decrease of €545 million, mainly due to the acquisition by Telecom Italia of theminority interests in TIM.
5.5.8 RESULTS OF OPERATIONS OF BUSINESS UNITS FOR THE YEAR ENDED DECEMBER 31, 2005 COMPARED WITH
THE YEAR ENDED DECEMBER 31, 2004.
❖ OPERATIONS
In order to present an overall picture of Operations, the following table shows the key results for the year endedDecember 31, 2005, compared to the year ended December 31, 2004. All the data have been reclassified andpresented consistent with the 2006 presentation.
Year ended December 31,Operations 2005 2004
(millions of Euro, exceptpercentages and employees)
Gross revenues . . . . . . . . . . . . . . . . . . . . . . . . . . . . . . . . . . . . . . . . . . . . . . . . . . . . . . . . . . . . . . . . . . . 29,096 27,383
Operating income . . . . . . . . . . . . . . . . . . . . . . . . . . . . . . . . . . . . . . . . . . . . . . . . . . . . . . . . . . . . . . . . 8,144 8,540
% of gross revenues . . . . . . . . . . . . . . . . . . . . . . . . . . . . . . . . . . . . . . . . . . . . . . . . . . . . . . . . . . . . . . 28.0 31.2
Number of employees at year-end . . . . . . . . . . . . . . . . . . . . . . . . . . . . . . . . . . . . . . . . . . . . . . . . 77,754 74,576
126
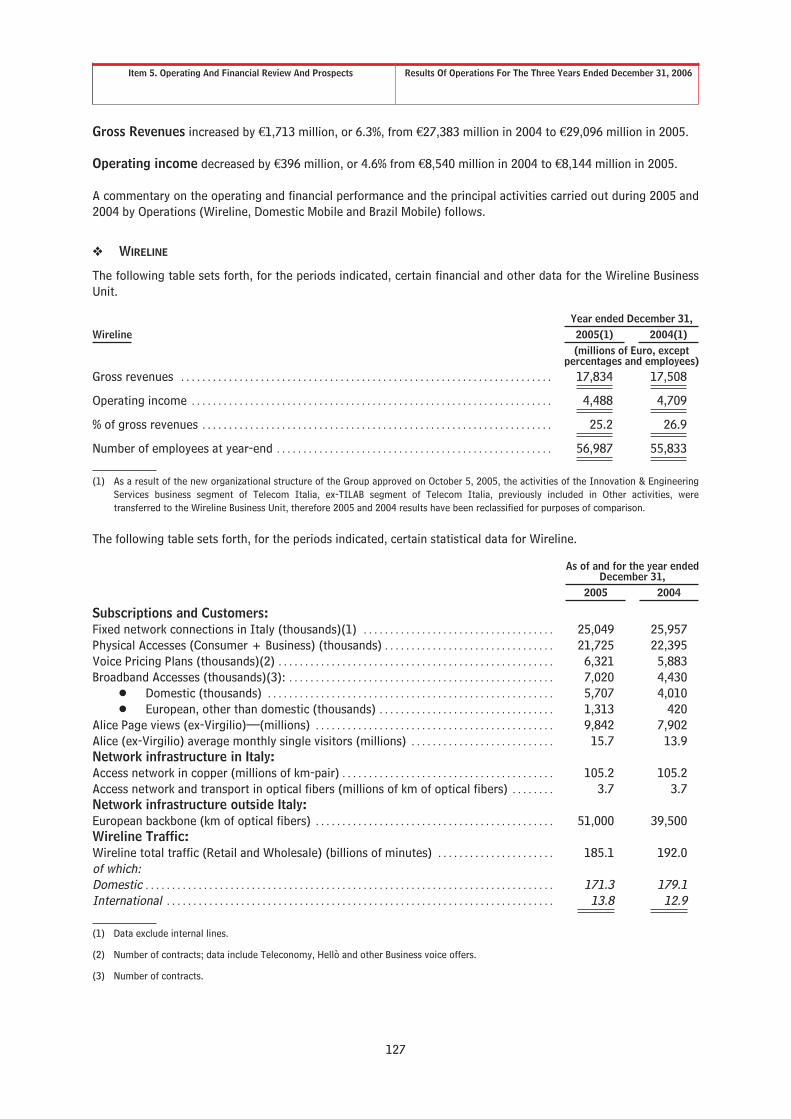
Item 5. Operating And Financial Review And Prospects Results Of Operations For The Three Years Ended December 31, 2006
Gross Revenues increased by €1,713 million, or 6.3%, from €27,383 million in 2004 to €29,096 million in 2005.
Operating income decreased by €396 million, or 4.6% from €8,540 million in 2004 to €8,144 million in 2005.
A commentary on the operating and financial performance and the principal activities carried out during 2005 and2004 by Operations (Wireline, Domestic Mobile and Brazil Mobile) follows.
❖ WIRELINE
The following table sets forth, for the periods indicated, certain financial and other data for the Wireline BusinessUnit.
Year ended December 31,Wireline 2005(1) 2004(1)
(millions of Euro, exceptpercentages and employees)
Gross revenues . . . . . . . . . . . . . . . . . . . . . . . . . . . . . . . . . . . . . . . . . . . . . . . . . . . . . . . . . . . . . . . . . . . . . . 17,834 17,508
Operating income . . . . . . . . . . . . . . . . . . . . . . . . . . . . . . . . . . . . . . . . . . . . . . . . . . . . . . . . . . . . . . . . . . . . 4,488 4,709
% of gross revenues . . . . . . . . . . . . . . . . . . . . . . . . . . . . . . . . . . . . . . . . . . . . . . . . . . . . . . . . . . . . . . . . . . 25.2 26.9
Number of employees at year-end . . . . . . . . . . . . . . . . . . . . . . . . . . . . . . . . . . . . . . . . . . . . . . . . . . . . 56,987 55,833
(1) As a result of the new organizational structure of the Group approved on October 5, 2005, the activities of the Innovation & EngineeringServices business segment of Telecom Italia, ex-TILAB segment of Telecom Italia, previously included in Other activities, weretransferred to the Wireline Business Unit, therefore 2005 and 2004 results have been reclassified for purposes of comparison.
The following table sets forth, for the periods indicated, certain statistical data for Wireline.
As of and for the year endedDecember 31,
2005 2004
Subscriptions and Customers:Fixed network connections in Italy (thousands)(1) . . . . . . . . . . . . . . . . . . . . . . . . . . . . . . . . . . . . 25,049 25,957Physical Accesses (Consumer + Business) (thousands) . . . . . . . . . . . . . . . . . . . . . . . . . . . . . . . . 21,725 22,395Voice Pricing Plans (thousands)(2) . . . . . . . . . . . . . . . . . . . . . . . . . . . . . . . . . . . . . . . . . . . . . . . . . . . . 6,321 5,883Broadband Accesses (thousands)(3): . . . . . . . . . . . . . . . . . . . . . . . . . . . . . . . . . . . . . . . . . . . . . . . . . . 7,020 4,430
Š Domestic (thousands) . . . . . . . . . . . . . . . . . . . . . . . . . . . . . . . . . . . . . . . . . . . . . . . . . . . . . . 5,707 4,010Š European, other than domestic (thousands) . . . . . . . . . . . . . . . . . . . . . . . . . . . . . . . . . 1,313 420
Alice Page views (ex-Virgilio)—(millions) . . . . . . . . . . . . . . . . . . . . . . . . . . . . . . . . . . . . . . . . . . . . . 9,842 7,902Alice (ex-Virgilio) average monthly single visitors (millions) . . . . . . . . . . . . . . . . . . . . . . . . . . . 15.7 13.9Network infrastructure in Italy:Access network in copper (millions of km-pair) . . . . . . . . . . . . . . . . . . . . . . . . . . . . . . . . . . . . . . . . 105.2 105.2Access network and transport in optical fibers (millions of km of optical fibers) . . . . . . . . 3.7 3.7Network infrastructure outside Italy:European backbone (km of optical fibers) . . . . . . . . . . . . . . . . . . . . . . . . . . . . . . . . . . . . . . . . . . . . . 51,000 39,500Wireline Traffic:Wireline total traffic (Retail and Wholesale) (billions of minutes) . . . . . . . . . . . . . . . . . . . . . . 185.1 192.0of which:Domestic . . . . . . . . . . . . . . . . . . . . . . . . . . . . . . . . . . . . . . . . . . . . . . . . . . . . . . . . . . . . . . . . . . . . . . . . . . . . . 171.3 179.1International . . . . . . . . . . . . . . . . . . . . . . . . . . . . . . . . . . . . . . . . . . . . . . . . . . . . . . . . . . . . . . . . . . . . . . . . . 13.8 12.9
(1) Data exclude internal lines.
(2) Number of contracts; data include Teleconomy, Hellò and other Business voice offers.
(3) Number of contracts.
127

Item 5. Operating And Financial Review And Prospects Results Of Operations For The Three Years Ended December 31, 2006
Gross Revenues increased by €326 million, or 1.9%, from €17,508 million in 2004 to €17,834 million in 2005.
The increase in gross revenues was largely due to the success of efforts to develop the Broadband market andinnovative services, particularly Web services, and to further develop the European Broadband Project, togetherwith efforts to defend the core Wireline market for telephone services and enhance the range of wholesaleservices.
Wireline tracks revenues in the following business areas: Retail Telephone, Retail Internet, Data Business,Wholesale and European Broadband Project.
Š Retail Telephone. Revenues from Retail Telephone were €10,095 million in 2005, a decrease of€496 million, or 4.7% from €10,591 million in 2004.
This business area was marked by a decrease in traffic revenues due to the migration of volumes to themobile network, partly due to competitive on-net rates (mobile to mobile calls between customers of thesame operator), countered by the continuous growth of Value-Added Services (VAS) and the rapid spread ofinnovative handsets.
Š Retail Internet. Revenues from Retail Internet were €1,197 million in 2005, an increase of €176 million,or 17.2% from €1,021 million in 2004. Revenues from ADSL (including revenues from portal services) wereapproximately €865 million, increasing strongly by 40% compared to 2004 (€618 million in 2004), mainly dueto the larger customer base and traffic. Revenues from Internet dial-up traffic decreased from €403 millionin 2004 to €332 million in 2005 due to migration to Internet connections using broadband access.
Š Data Business. Revenues from Data Business were €2,107 million in 2005, an increase of €125 million, or6.3% from €1,982 million in 2004.
The growth in services revenues was driven mainly by value added services (web services, outsourcing andsecurity services) and by innovative data services: VAS increased by 25.3% in 2005 compared to 2004 (€550million in 2005 and €439 million in 2004); innovative data services increased by 15.7% in 2005 compared to2004 (€723 million in 2005 and €625 million in 2004). Revenues from traditional Data services (datatransmission using data packet technology) and leased lines decreased from €620 million in 2004 to€553 million in 2005 (a decrease of 10.8%), mainly due to customer migration to broadband services andrepricing. Revenue from Data equipment decreased to €281 million in 2005 from €298 million in 2004 (adecrease of 5.7%).
Š Wholesale. Revenues from Wholesale were €3,526 million in 2005, an increase of €337 million, or 10.6%compared to 2004 (€3,189 million in 2004).
Revenues from International Wholesale services increased by €240 million or 18% due to significant volumesof traffic carried to other operators, while revenues from Domestic Wholesale services increased by€96 million or 5.1% due to continued growth in Data offers, especially broadband, and LLU services.
Š European Broadband Project. Revenues from the European Broadband Project (France, Germany andThe Netherlands) were €565 million in 2005 an increase of 109.6% compared to 2004. The EuropeanBroadband Project was given a further boost in growth by the purchase of Liberty Surf Group in France onMay 31, 2005. Wireline’s overall portfolio of European broadband customers at December 31, 2005 was1,313 thousand (an increase of 893 thousands compared to 2004), while total customers, including narrow-band, were 1,791 thousand.
The contribution of the Wireline Business Unit to our consolidated revenues amounted to €15,843 million in 2004and €16,356 million in 2005.
Operating income decreased by €221 million, or 4.7%, from €4,709 million in 2004 to €4,488 million in 2005,and was negatively impacted, among other things, by an increase in depreciation and amortization charges mainlyas a result of the increase in capital expenditures for the European Broadband Project.
Operating margin decreased to 25.2% in 2005 compared to 26.9% in 2004.
128

Item 5. Operating And Financial Review And Prospects Results Of Operations For The Three Years Ended December 31, 2006
❖ DOMESTIC MOBILE
The following table sets forth, for the periods indicated, certain financial and other data for Domestic Mobile.
In particular, the 2005 data refer to ex-TIM S.p.A. up to the date of the demerger of the mobile activities to TimItalia S.p.A. (March 1, 2005) and Tim Italia S.p.A. in the period March–December 2005. The 2004 data refer toex-TIM S.p.A.
Year ended December 31,Domestic Mobile 2005 2004
(millions of Euro, exceptpercentage and employees)
Gross revenues . . . . . . . . . . . . . . . . . . . . . . . . . . . . . . . . . . . . . . . . . . . . . . . . . . . . . . . . . . . . . . . . . . . . 10,076 9,923
Operating income . . . . . . . . . . . . . . . . . . . . . . . . . . . . . . . . . . . . . . . . . . . . . . . . . . . . . . . . . . . . . . . . . 3,856 4,010
% of gross revenues . . . . . . . . . . . . . . . . . . . . . . . . . . . . . . . . . . . . . . . . . . . . . . . . . . . . . . . . . . . . . . . 38.3 40.4
Number of employees at year-end . . . . . . . . . . . . . . . . . . . . . . . . . . . . . . . . . . . . . . . . . . . . . . . . . 11,720 11,767
The following table sets forth, for the periods indicated, certain Domestic Mobile statistical data.
Year ended December 31,2005 2004
Mobile telephone lines in Italy at year-end (thousands)(1) . . . . . . . . . . . . . . . . . . . . . . . . . . . . . . 28,576 26,259GSM subscriber lines (thousands) . . . . . . . . . . . . . . . . . . . . . . . . . . . . . . . . . . . . . . . . . . . . . . . . . . . . . . . 3,186 2,809Prepaid GSM/UMTS lines (thousands) . . . . . . . . . . . . . . . . . . . . . . . . . . . . . . . . . . . . . . . . . . . . . . . . . . 25,296 23,226Customer growth (%) . . . . . . . . . . . . . . . . . . . . . . . . . . . . . . . . . . . . . . . . . . . . . . . . . . . . . . . . . . . . . . . . . . . 8.8 0.7Churn rate (2) . . . . . . . . . . . . . . . . . . . . . . . . . . . . . . . . . . . . . . . . . . . . . . . . . . . . . . . . . . . . . . . . . . . . . . . . . . 16.9 13.2Average monthly revenues per line (€)(3) . . . . . . . . . . . . . . . . . . . . . . . . . . . . . . . . . . . . . . . . . . . . . . . 29.3 29.9Total Mobile outgoing traffic per month (millions of minutes) . . . . . . . . . . . . . . . . . . . . . . . . . . . 2,314 2,211Total Mobile incoming and outgoing traffic per month (millions of minutes) . . . . . . . . . . . . . 3,550 3,435
(1) Includes Prepaid Customers and excludes the “inactive” lines. Also includes 25,000 and 52,000 TACS subscriber lines as of December 31,2005 and 2004, respectively, while TACS prepaid lines were 69,000 and 172,000 as of December 31, 2005 and 2004, respectively.
(2) The figures refer to the total number of lines. The churn rate for a given period represents the number of mobile customers who ceasedto be customers during the period (by choice or due to unpaid bills) expressed as a percentage of the average number calculated on thebasis of the annual numbers of customers during the period.
(3) Includes total revenues from fees, traffic (domestic and not) and VAS, excluding revenues from the sale of products.
Gross revenues in 2005 increased by €153 million, or 1.5%, from €9,923 million in 2004 to €10,076 million in2005. In particular, the increase in revenues was principally due to the strong growth in VAS revenues to€1,497 million, due to the continuing innovation of services and the evolution of the portfolio of plans andpackages. The percentage of VAS revenues to total revenues was 14.9% in 2005 and the percentage of VASrevenues to service revenues was 16.0% in 2005.
In 2005, Domestic Mobile traffic volumes increased by 3.3% in terms of minutes compared to 2004, whileDomestic Mobile voice services revenues, net of the impact of the new termination price list, decreased by 0.1% in2005 compared to 2004. The average monthly revenue per Italian mobile line (which includes traffic and VASrevenues) decreased from approximately €29.9 in 2004 to €29.3 in 2005 (including service revenues from nonTIM Mobile customers).
Domestic Mobile revenues from equipment sales increased by 23.9% in 2005 compared to 2004 (€706 millionagainst €570 million in 2004). In particular handset volumes increased by 26% due to summer and Christmasadvertising and the launch of EDGE/UMTS services.
Domestic Mobile subscription fees decreased by 24.4% in 2005 compared to 2004 (€99 million in 2005 against€131 million in 2004) due to a change in contractual conditions, in order to reach a rebalancing amongsubscription fees and tariffs.
129

Item 5. Operating And Financial Review And Prospects Results Of Operations For The Three Years Ended December 31, 2006
The contribution of the Domestic Mobile Business Unit to our consolidated revenues amounted to €9,661 millionin 2004 and €9,776 million in 2005.
Mobile lines in Italy increased to approximately 28.6 million at December 31, 2005 (including TACS lines), anincrease of 8.8% compared to December 31, 2004. Total GSM and UMTS lines increased by 9.4% in 2005, toapproximately 28.5 million lines at December 31, 2005, while Domestic Mobile Italy’s total TACS lines decreasedto 94,000 lines at December 31, 2005, in each case compared to December 31, 2004. TACS service terminated onDecember 31, 2005. The continuing growth in GSM/UMTS lines was attributable principally to the development ofUMTS service offers and the enhanced availability of third generation handsets. The UMTS and GSM TIM Card (aprepaid rechargeable UMTS and GSM card), remained important with approximately 25.3 million lines byDecember 31, 2005 compared to approximately 23.2 million lines at December 31, 2004. Prepaid lines (GSM/UMTS and TACS) grew by 8.4% in 2005.
At December 31, 2005, Domestic Mobile had a market share of approximately 40.0% (including GSM/UMTS andTACS) compared to the approximately 42% at December 31, 2004, and a market share of approximately 39.9% forGSM/UMTS only compared to 41.4% in 2004. The overall market grew by 13.2% in 2005 from approximately63.2 million mobile lines at the end of 2004 to 71.5 million mobile lines at the end of 2005. The aggregatenumber of customers at December 31, 2005 for Domestic Mobile’s analog and GSM/UMTS services represented apenetration rate of 49.1% compared to 45.5% at December 31, 2004. In 2005, Domestic Mobile had a 29.0%market share of net additional GSM/UMTS lines, corresponding to 2.4 million of net lines, compared to 1.6 millionfor Vodafone Omnitel, 1.6 million for Wind and the remaining 2.8 million attributable to H3G.
Operating income decreased by €154 million, or 3.8%, from €4,010 million in 2004 to €3,856 million in 2005.Such decrease reflected the significant increase in depreciation and amortization charges due to recentinvestments for the development of third-generation network infrastructures and to support the evolution of plansand packages for new services.
Operating margin decreased to 38.3% in 2005 compared to 40.4% in 2004.
❖ BRAZIL MOBILE
The following table sets forth, for the periods indicated, certain financial and other data for the Brazil MobileBusiness Unit.
Year ended December 31,Brazil Mobile 2005 2004
(millions of Euro, exceptpercentage and employees)
Gross revenues . . . . . . . . . . . . . . . . . . . . . . . . . . . . . . . . . . . . . . . . . . . . . . . . . . . . . . . . . . . . . . . . . . . . 2,900 1,800
Operating loss . . . . . . . . . . . . . . . . . . . . . . . . . . . . . . . . . . . . . . . . . . . . . . . . . . . . . . . . . . . . . . . . . . . . . (190) (137)
% of gross revenues . . . . . . . . . . . . . . . . . . . . . . . . . . . . . . . . . . . . . . . . . . . . . . . . . . . . . . . . . . . . . . . . (6.5) (7.6)
Number of employees at year-end . . . . . . . . . . . . . . . . . . . . . . . . . . . . . . . . . . . . . . . . . . . . . . . . . . 9,043 6,967
Gross revenues were €2,900 million in 2005 compared to €1,800 million in 2004, an increase of €1,100 million,or 61.1%. The increase was due to the growth in the customer base (20.2 million mobile lines at December 31,2005 compared to 13.6 million mobile lines at December 31, 2004), the contribution made by value-addedservices (which rose from 3.2% of revenues in 2004 to 5.0% in 2005) and revenues from voice traffic.
The contribution of Brazil Mobile Business Unit to our consolidated revenues amounted to €1,795 million in 2004and €2,895 million in 2005.
Operating loss in 2005 was €190 million compared to €137 million in 2004, an increase of €53 million. Theincreased loss was due to the increase in depreciation and amortization mainly related to the capital expendituresfor the development of network infrastructures and information systems consistent with the significant growth inthe business.
130

Item 5. Operating And Financial Review And Prospects Results Of Operations For The Three Years Ended December 31, 2006
❖ MEDIA
The following table sets forth, for the periods indicated, certain financial and other data for the Media BusinessUnit.
Year ended December 31,Media 2005 2004
(millions of Euro, exceptpercentage and employees)
Gross revenues . . . . . . . . . . . . . . . . . . . . . . . . . . . . . . . . . . . . . . . . . . . . . . . . . . . . . . . . . . . . . . . . . . . . 180 168
Operating loss . . . . . . . . . . . . . . . . . . . . . . . . . . . . . . . . . . . . . . . . . . . . . . . . . . . . . . . . . . . . . . . . . . . . . (130) (93)
% of gross revenues . . . . . . . . . . . . . . . . . . . . . . . . . . . . . . . . . . . . . . . . . . . . . . . . . . . . . . . . . . . . . . . . (72.2) (55.4)
Number of employees at year-end . . . . . . . . . . . . . . . . . . . . . . . . . . . . . . . . . . . . . . . . . . . . . . . . . . 886 1,077
Gross revenues increased by €12 million, or 7.1%, from €168 million in 2004 to €180 million in 2005. Excludingthe impact of the change in the scope of consolidation (with reference to GPP Group, Televoice and Databank)equal to €24 million in 2004, as well as the start-up activities relating to the Digital Terrestrial Television of La7(sales of pay-per-view events and smart cards) equal to €10 million in 2005, growth was €24 million, or 16.7%,from €144 million in 2004 to €168 million in 2005. In particular:
Š revenues from the Television business area, including revenues for Digital Terrestrial Television,increased by €35 million, or 25.4%, from €138 million in 2004 to €173 million in 2005, confirming theeditorial success of the program schedule of the two TV networks:
Š revenues from La7 Televisioni, increased by 40.3%, from €62 million in 2004 to €87 million in2005; and
Š revenues from MTV, increased by 16.2%, from €80 million in 2004 to €93 million in 2005;
Š revenues from the News area, equal to €7 million in 2005 and €5 million in 2004, increased by€2 million, or 40.0%.
The contribution of the Media Business Unit to our consolidated revenues amounted to €176 million in 2005 and€165 million in 2004.
Operating loss increased by €37 million (a loss of €130 million in 2005 compared to a loss of €93 million in2004). Such increase was principally due to the Television area where losses increased by €41 million, from a lossof €60 million in 2004 to a loss of €101 million in 2005, mainly due to higher costs incurred for digital terrestrialtesting during 2005. Moreover, operating loss was affected by higher costs and investments in “content” requiredto support audience growth.
❖ OLIVETTI
The following table sets forth, for the periods indicated, certain financial and other data for the Olivetti BusinessUnit.
Year ended December 31,Olivetti 2005 2004
(millions of Euro, exceptpercentage and employees)
Gross revenues . . . . . . . . . . . . . . . . . . . . . . . . . . . . . . . . . . . . . . . . . . . . . . . . . . . . . . . . . . . . . . . . . . . . 452 590
Operating income (loss) . . . . . . . . . . . . . . . . . . . . . . . . . . . . . . . . . . . . . . . . . . . . . . . . . . . . . . . . . . . (38) 17
% of gross revenues . . . . . . . . . . . . . . . . . . . . . . . . . . . . . . . . . . . . . . . . . . . . . . . . . . . . . . . . . . . . . . . (8.4) 2.9
Number of employees at year-end . . . . . . . . . . . . . . . . . . . . . . . . . . . . . . . . . . . . . . . . . . . . . . . . . 1,750 2,109
Gross revenues decreased by €138 million, or 23.4%, from €590 million in 2004 to €452 million in 2005.Excluding the negative foreign exchange effects and the impact of the change in the scope of consolidation (with
131
Item 5. Operating And Financial Review And Prospects Results Of Operations For The Three Years Ended December 31, 2006
particular reference to the closing of operations in the U.S.A. and Mexico and the sale of Innovis S.p.A. andCell-Tel S.p.A.) which represented €70 million in revenues, the revenues from the sale of intellectual property toTelecom Italia for €9 million and revenues from the start-up activities relating to the new products of the OfficeDivision for €4 million, revenues decreased by €81 million (or 15.3%). Such decrease, in particular, was due to thedecrease from Office Division (a decrease of €56 million), and Gaming and Service Automation & SpecializedPrinters Products (a decrease of €23 million).
In 2005, gross revenues included €256 million from Office Products, €157 million from Gaming and ServiceAutomation & Specialized Printers Products, €36 million from the sale of intellectual property to Telecom Italiaand €3 million related to other activities. Such revenues were distributed as follows: €266 million related tohardware, €101 million to accessories, €85 million to services and other revenues.
The contribution of the Olivetti Business Unit to our consolidated revenues was €400 million in 2005 and€536 million in 2004.
Operating income decreased by €55 million (a loss of €38 million in 2005 compared to an income of €17 millionin 2004) principally due to the above mentioned decrease in revenues.
132

Item 5. Operating And Financial Review And Prospects Liquidity And Capital Resources
5.6 LIQUIDITY AND CAPITAL RESOURCES
5.6.1 LIQUIDITY
The Telecom Italia Group’s primary source of liquidity is cash generated from operations and its principal uses offunds are the payment of operating expenses, capital expenditures and investments, the servicing of debt, thepayment of dividends to shareholders and strategic investments, such as international acquisitions.
The table below summarizes, for the periods indicated, the Telecom Italia Group’s cash flows.
2006 2005 2004(millions of Euro)
Cash flows generated by (used in) operating activities . . . . . . . . . . . . . . . . . . . . . . . . . . . . . . . 9,194 9,778 10,266Cash flows generated by (used in) investing activities . . . . . . . . . . . . . . . . . . . . . . . . . . . . . . . (4,191) (17,421) (4,951)Cash flows generated by (used in) financing activities . . . . . . . . . . . . . . . . . . . . . . . . . . . . . . . (7,972) 8,767 (1,714)Cash flows generated by (used in) discontinued operations/assets held for sale . . . . . . (13) 26 (109)
Aggregate cash flows (A) . . . . . . . . . . . . . . . . . . . . . . . . . . . . . . . . . . . . . . . . . . . . . . . . . . . . . . . . (2,982) 1,150 3,492Net cash and cash equivalents (*) at the beginning of the year (B) . . . . . . . . . . . 9,958 8,667 5,211Net effect of foreign currency translation on net cash and cash
equivalents (C) . . . . . . . . . . . . . . . . . . . . . . . . . . . . . . . . . . . . . . . . . . . . . . . . . . . . . . . . . . . . . . . . . (16) 141 (36)
Net cash and cash equivalents (*) at the end of the year (D=A+B+C) . . . . . . . 6,960 9,958 8,667
(*) For details please see Consolidated Statements of Cash Flows for the years ended December 31, 2006, 2005 and 2004, in theConsolidated Financial Statements included elsewhere in this Annual Report.
Cash flows generated by operating activities. Cash flows generated by operating activities were €9,194 millionin 2006, €9,778 million in 2005 and €10,266 million in 2004.
2006 compared to 2005
The decrease in 2006 compared to 2005 of €584 million was primarily attributable to:
Š a reduction of €144 million of net income from continuing operations (income of €2,996 million in 2006compared to income of €3,140 million in 2005);
Š the negative effect of change in employee severance indemnities and other employee-related provisionsof €369 million (a negative contribution of €114 million in 2006 compared to a positive contribution of€255 million in 2005);
Š the negative effect of change in trade receivables and net receivables on construction contracts of€790 million (a negative contribution of €461 million in 2006 compared to a positive contribution of€329 million in 2005);
Š the negative effect of change in trade payables of €194 million (a negative contribution of €10 million in2006 compared to a positive contribution of €184 million in 2005).
Such negative effects were partially offset by:
Š an increase in depreciation and amortization of €255 million (€5,487 million in 2006 compared to€5,232 million in 2005);
Š an additional decrease in net deferred tax assets, equal to €496 million (to a reduction of €1,843 millionin 2006 compared to a reduction of €1,347 million in 2005);
Š a positive effect of net change in miscellaneous receivables/payables and other assets/liabilities of€177 million (a negative effect of €180 million in 2006 compared to a negative effect of €357 million in2005).
2005 compared to 2004
The decrease in 2005 compared to 2004 of €488 million was primarily attributable to:
Š the decrease in net impairment losses of non-current assets (including investments) of €443 million (€3million of losses in 2005 compared to €446 million of losses in 2004);
133

Item 5. Operating And Financial Review And Prospects Liquidity And Capital Resources
Š the increase in net gains realized on disposals of non-current assets (including investments) of€221 million (a net gain of €327 million in 2005 compared to a net gain of €106 million in 2004);
Š the negative effect of change of trade payables of €895 million (an increase of €184 million in 2005compared to an increase of €1,079 million in 2004);
Š the decrease in share of (profits) losses of associates and joint ventures accounted for using the equitymethod of €28 million (net profits of €23 million in 2005 compared to net losses of €5 million in 2004);
Š a negative effect of net change in miscellaneous receivables/payables and other assets/liabilities of€327 million (a negative contribution of €357 million in 2005 compared to a negative contribution of€30 million in 2004).
Such negative effects were mainly offset by:
Š an increase of €188 million in net income from continuing operations (income of €3,140 million in 2005compared to income of €2,952 million in 2004);
Š an increase in depreciation and amortization of €424 million (€5,232 million in 2005 compared to€4,808 million in 2004);
Š an additional decrease in net deferred tax assets equal to €223 million (a reduction of €1,347 million in2005 compared to a reduction of €1,124 million in 2004);
Š the positive effect of change in employee severance indemnities and other employee-related provisionsof €294 million (an increase of €255 million in 2005 compared to a decrease of €39 million in 2004);
Š the positive effect of change in trade receivables and net receivables on construction contracts of€278 million (a positive contribution of €329 million in 2005 compared to a positive contribution of€51 million in 2004).
Cash flows used in investing activities. Cash flows used in investing activities were €4,191 million in 2006,€17,421 million in 2005 and €4,951 million in 2004.
2006 compared to 2005
The decrease in 2006 compared to 2005 of €13,230 million was mainly due to:
Š a decrease in acquisitions of investments in subsidiaries and businesses, net of cash acquired, of€390 million (no acquisitions occurred in 2006 compared to acquisitions of €390 million in 2005 thatwere principally related to the purchase of the controlling interest in Liberty Surf Group and theacquisitions of Elefante TV and Delta TV);
Š a decrease in acquisitions of other investments of €14,338 million related to acquisitions of €206 millionin 2006 compared to acquisitions of €14,544 million in 2005 (such amount was mainly due to theconsideration paid for the tender offer for the TIM shares and the further purchases of TIM inconnection with acquiring the Minority Interests in TIM);
Š a positive effect of change in financial receivables and other financial assets of €210 million (a negativecontribution of €264 million in 2006 compared to a negative contribution of €474 million in 2005);
Š an increase in proceeds from sale/repayments of intangible, tangible and other non-current assets of€88 million (a positive contribution of €1,038 million in 2006 compared to a positive contribution of€950 million in 2005);
Š a decrease in capital expenditures on an accrual basis of €59 million (€5,114 million in 2006 comparedto €5,173 million in 2005). In 2006 capital expenditures included €2,187 million for acquisitions ofintangible assets (€1,785 million in 2005) and €2,927 million for acquisitions of tangible assets (€3,388million in 2005).
Such positive effects were offset by:
Š a negative effect of change in amounts due to fixed asset suppliers of €148 million (a positivecontribution of €10 million in 2006 compared to a positive contribution of €158 million in 2005);
134
Item 5. Operating And Financial Review And Prospects Liquidity And Capital Resources
Š a decrease of €1,707 million in proceeds from sale of investments in subsidiaries, net of cash disposedof (€345 million in 2006 compared to €2,052 million in 2005).
2005 compared to 2004
The increase in 2005 compared to 2004 of €12,470 million was mainly due to:
Š an increase of €171 million in capital expenditures on an accrual basis (€5,173 million in 2005compared to €5,002 million in 2004). In 2005 capital expenditures included €1,785 million foracquisitions of intangible assets (€1,882 million in 2004) and €3,388 million for acquisitions of tangibleassets (€3,120 million in 2004);
Š an increase of €389 million in acquisitions of investments in subsidiaries and businesses, net of cashacquired (€390 million in 2005 compared to €1 million in 2004), mainly related to the purchase of thecontrolling interest in Liberty Surf Group and the acquisitions of Elefante TV and Delta TV;
Š an increase of €13,677 million in acquisitions of other investments (€14,544 million in 2005 comparedto €867 million in 2004). Such increase was principally due to the consideration paid for the cash tenderoffer for TIM shares (€13,804 million) and for further purchases of TIM shares (€28 million) inconnection with acquiring the minority interests in TIM;
Š a negative effect of net change in financial receivables and other financial assets of €898 million(increase of €474 million in 2005 compared to a net decrease of €424 million in 2004).
Such negative effects were largely offset by:
Š an increase of €2,009 million of proceeds from sale of investments in subsidiaries, net of cash disposedof (€2,052 million in 2005 compared to €43 million in 2004), that were principally related to thedisposals of Entel Chile, Tim Hellas, Finsiel and Tim Perù;
Š an increase of €498 million of proceeds from sale/repayments of intangible, tangible and othernon-current assets (a positive contribution of €950 million in 2005 compared to a positive contributionof €452 million in 2004).
Cash flows generated by (used in) financing activities. Cash flows used in financing activities were€7,972 million in 2006, compared to cash flows generated of €8,767 million in 2005 and compared to cash flowsused of €1,714 million in 2004.
Cash flows used in financing activities in 2006 of €7,972 million reflected mainly the following:
Š a decrease in financial liabilities (current and non-current portion included) and other liabilities of€4,977 million, mainly as a result of repayment of non-current financial liabilities (€9,995 million)partially offset by proceeds from non-current financial liabilities (€5,222 million);
Š the payment of dividends (distribution of reserves included) of €2,997 million.
Cash flows generated by financing activities in 2005 of €8,767 million reflected the following:
Š an increase in financial liabilities (current and non-current portion included) and other liabilities of€11,153 million, mainly as a result of the additional debt incurred in connection with the cash tenderoffer for the TIM shares;
Š proceeds from equity instruments of €102 million;
Š a negative contribution in share capital increases/repayments of €160 million;
Š the payment of dividends (distribution of reserves included) of €2,328 million.
Cash flows used in financing activities in 2004 of €1,714 million reflected the following:
Š an increase in financial liabilities (current and non-current portion included) and other liabilities of €822million;
Š proceeds from equity instruments of €193 million;
135

Item 5. Operating And Financial Review And Prospects Liquidity And Capital Resources
Š a positive contribution in share capital increases/repayments of €51 million;
Š the payment of dividends (distribution of reserves included) of €2,780 million.
Cash flows generated by (used in) discontinued operations/assets held for sale. Cash flows used in discontinuedoperations/assets held for sale were €13 million in 2006, compared to cash flows generated of €26 million in2005 and compared to cash flows used of €109 million in 2004.
5.6.2 CAPITAL RESOURCES
Net Financial Debt
Net Financial Debt is a non-GAAP financial measure as defined in Item 10 of Regulation S-K under the 1934 Act.For further details please see “5.5.2—Non-GAAP Financial Measures”.
On a consolidated basis, at December 31, 2006, Net Financial Debt was €37,301 million compared to€39,858 million at December 31, 2005 (a decrease of €2,557 million). Net Financial Debt at December 31, 2005,included €106 million related to the discontinued operations/assets held for sale.
Given the ratio:
Net Financial Debt
Operating result before depreciation and amortization, capital gains(losses) realized and impairment reversals (losses) on non-current assets
we have targeted a value of such ratio below “3.0” to be achieved within the period 2007 - 2009, also through thedisposal of non-strategic equity holdings and assets.
Please see “Introduction—Cautionary Statement for Purposes of the “Safe Harbor” Provisions of the UnitedStates Private Securities Litigation Reform Act of 1995”, included elsewhere in this Annual Report, for adiscussion of factors which would cause our actual results to differ materially from the target discussed above.See, also, “Item 3. Key Information—3.1 Risk Factors”.
There can be no assurance that we will be able to achieve the financial target we have established.
136

Item 5. Operating And Financial Review And Prospects Liquidity And Capital Resources
Net Financial Debt is detailed in the following table:
As of December 31,2006 2005(millions of Euro)
GROSS FINANCIAL DEBTNon-current financial liabilities (Long-term debt)
—Financial payables . . . . . . . . . . . . . . . . . . . . . . . . . . . . . . . . . . . . . . . . . . . . . . . . . . . . . . . . . . . . . . . . . . . . 38,842 40,252—Finance lease liabilities . . . . . . . . . . . . . . . . . . . . . . . . . . . . . . . . . . . . . . . . . . . . . . . . . . . . . . . . . . . . . . . 1,847 1,894—Other financial liabilities . . . . . . . . . . . . . . . . . . . . . . . . . . . . . . . . . . . . . . . . . . . . . . . . . . . . . . . . . . . . . . 114 —
40,803 42,146
Current financial liabilities (Short-term debt), excluding financial liability relating todiscontinued operations/assets held for sale
—Financial payables . . . . . . . . . . . . . . . . . . . . . . . . . . . . . . . . . . . . . . . . . . . . . . . . . . . . . . . . . . . . . . . . . . . . 5,374 9,572—Finance lease liabilities . . . . . . . . . . . . . . . . . . . . . . . . . . . . . . . . . . . . . . . . . . . . . . . . . . . . . . . . . . . . . . . 269 234—Other financial liabilities . . . . . . . . . . . . . . . . . . . . . . . . . . . . . . . . . . . . . . . . . . . . . . . . . . . . . . . . . . . . . . 10 6
5,653 9,812
Financial liability relating to discontinued operations/assets held for sale . . . . . . . . . . . . — 143
TOTAL GROSS FINANCIAL DEBT (A) . . . . . . . . . . . . . . . . . . . . . . . . . . . . . . . . . . . . . . . . . . . . . . . . . . . . . . 46,456 52,101
FINANCIAL ASSETSNon-current financial assets
—Securities other than investments . . . . . . . . . . . . . . . . . . . . . . . . . . . . . . . . . . . . . . . . . . . . . . . . . . . . 12 8—Financial receivables and other non-current financial assets . . . . . . . . . . . . . . . . . . . . . . . . . . . 679 988
691 996
Current financial assets, excluding financial assets relating to discontinuedoperations/assets held for sale
—Securities . . . . . . . . . . . . . . . . . . . . . . . . . . . . . . . . . . . . . . . . . . . . . . . . . . . . . . . . . . . . . . . . . . . . . . . . . . . . 812 378—Financial receivables and other current financial assets . . . . . . . . . . . . . . . . . . . . . . . . . . . . . . . 433 509—Cash and cash equivalents . . . . . . . . . . . . . . . . . . . . . . . . . . . . . . . . . . . . . . . . . . . . . . . . . . . . . . . . . . . . 7,219 10,323
8,464 11,210
Financial assets relating to discontinued operations/assets held for sale . . . . . . . . . . . . . — 37
TOTAL FINANCIAL ASSETS (B) . . . . . . . . . . . . . . . . . . . . . . . . . . . . . . . . . . . . . . . . . . . . . . . . . . . . . . . . . . . . 9,155 12,243
NET FINANCIAL DEBT (A-B) . . . . . . . . . . . . . . . . . . . . . . . . . . . . . . . . . . . . . . . . . . . . . . . . . . . . . . . . . . . . . . . 37,301 39,858
137

Item 5. Operating And Financial Review And Prospects Liquidity And Capital Resources
The following chart summarizes the major components which had an impact on the change in Net Financial Debtduring 2006 (in millions of Euro):
39,858
+5,114 +206
-9,045
37,301
-2,557
+2,997
-431-23-1,375
Net FinancialDebt as of
December 31,2005
Capital expenditures
Financial investments
Dividends paid Conversion of 2001/2010
notes and capital increases from
exercises of stock options
Collection of the receivable for the TLC operating fee – payment of the Antitrust Authority
fine
Cash Flows generated by
operating activities, net of other uses
Net Financial Debt as of December 31,
2006 investments and other disposals
Sale of
In particular:
Š capital expenditures in 2006 total €5,114 million and decreased by €59 million from 2005. Details areas follows:
2006 2005(millions of Euro)
Wireline . . . . . . . . . . . . . . . . . . . . . . . . . . . . . . . . . . . . . . . . . . . . . . . . . . . . . . . . . . . . . 3,002 2,823Domestic Mobile . . . . . . . . . . . . . . . . . . . . . . . . . . . . . . . . . . . . . . . . . . . . . . . . . . . . 1,146 1,276Brazil Mobile . . . . . . . . . . . . . . . . . . . . . . . . . . . . . . . . . . . . . . . . . . . . . . . . . . . . . . . . 699 842Media, Olivetti and other activities . . . . . . . . . . . . . . . . . . . . . . . . . . . . . . . . . . . 295 240Adjustments . . . . . . . . . . . . . . . . . . . . . . . . . . . . . . . . . . . . . . . . . . . . . . . . . . . . . . . . . (28) (8)
Total . . . . . . . . . . . . . . . . . . . . . . . . . . . . . . . . . . . . . . . . . . . . . . . . . . . . . . . . . . . . . . . . 5,114 5,173
About 59% of capital expenditures was used for fixed telephony activities (Wireline Business Unit) and36% for Mobile activities (Domestic Mobile and Brazil Mobile Business Units). The remaining part wasrelated to Olivetti, Telecom Italia Media and the Central Functions of Telecom Italia.
In addition, starting from 2006, following the introduction of new types of contracts which bind thecustomer to the Telecom Italia Group for periods of 12 or 24 months, or a penalty is applied, the Groupcapitalizes subscriber acquisition costs in intangible assets and recognizes them in the statement ofincome over the period of the underlying contract. Capital expenditures in 2006 include €260 million ofcapitalized subscriber acquisition costs. Of that amount, €14 million relates to the Wireline BusinessUnit, €130 million to the Mobile Domestic Business Unit and €116 million to the Brazil Mobile BusinessUnit.
138

Item 5. Operating And Financial Review And Prospects Liquidity And Capital Resources
Additional details are provided as follows:
Š with regard to fixed telephony activities, a large portion of the capital expenditures (about 36%) wasused for broadband development (which mainly includes investments for ADSL) and New Services (Aliceservices development, IP-TV, videotelephony, etc.). About 16% of capital expenditures were for thesupport of the development of Broadband offerings outside Italy (in France and Germany) and theremaining expenditures were for the development of network and support systems (Business SupportSystems such as billing, revenue assurance, customer care and Operational Support Systems).
Capital expenditures for fixed telephony refer to the following:
2006 2005(millions of Euro) % of total (millions of Euro) % of total
Broadband development in Italy . . . . . . . . . . . . . . 622 20.7% 678 24.0%New services development . . . . . . . . . . . . . . . . . . . 463 15.4% 528 18.7%European projects (Broadband) . . . . . . . . . . . . . . . 467 15.6% 304 10.8%Other . . . . . . . . . . . . . . . . . . . . . . . . . . . . . . . . . . . . . . . . 1,450 48.3% 1,313 46.5%
Total . . . . . . . . . . . . . . . . . . . . . . . . . . . . . . . . . . . . . . . . 3,002 100.0% 2,823 100.0%
Š with regard to domestic mobile telephony, 50% of capital expenditures were used for the developmentof the UMTS and Systems Development (in particular, software development for the launch of new plansand services). The remainder of the capital expenditures related to revamping the network, supportingsales policies and costs for the acquisition of subscribers.
Capital expenditures for domestic mobile telephony refer to the following:
2006 2005(millions of Euro) % of total (millions of Euro) % of total
UMTS . . . . . . . . . . . . . . . . . . . . . . . . . . . . . . . . . . . . . . . . 265 23.1% 282 22.1%Systems development . . . . . . . . . . . . . . . . . . . . . . . . 308 26.9% 278 21.8%Other . . . . . . . . . . . . . . . . . . . . . . . . . . . . . . . . . . . . . . . . 573 50.0% 716 56.1%
Total . . . . . . . . . . . . . . . . . . . . . . . . . . . . . . . . . . . . . . . . 1,146 100.0% 1,276 100.0%
Š with regard to mobile telephony in Brazil, the reduction in capital expenditures by the Business Unit isconnected with the gradual completion of mobile coverage of the territory;
Š the sale of investments and other disposals led to a reduction in debt of €1,375 million and refers to thefollowing transactions:
Š sale of the investment in Gruppo Buffetti for €66 million (including the deconsolidation of the netfinancial debt of the subsidiary sold);
Š disposal of the real estate investment in Ruf Gestion for €51 million (including the deconsolidation ofthe net financial debt of the subsidiary sold);
Š sale of Corporación Digitel C.A. (Digitel Venezuela) for €318 million (including the deconsolidation ofthe net financial debt of the subsidiary sold);
Š sale of Neuf Télécom for €199 million;
Š sale of Avea I.H.A.S. to Turk Telekom for €279 million; this amount is the net balance between theproceeds on the sale (€393 million) and the recognition of non-current financial liabilities for€114 million, corresponding to the gain temporarily deferred on the sale of Avea I.H.A.S., against thecommitments undertaken for a subordinated loan to grant to Avea I.H.A.S. for an amount of U.S.$150million; the total net impact of the transaction for the sale of Avea I.H.A.S. amounts to €82 millionsince, at the time of the sale of the investment, the Telecom Italia Group invested €197 million in OgerTelecom (the parent of Turk Telekom);
Š disposals of real estate property by the Group to the closed-end real estate investment funds Raissa andSpazio Industriale which reduced debt by €296 million. Such disposals are part of the property salesprogram approved by the Board of Directors’ meeting on December 21, 2005 and completed in 2006;
139

Item 5. Operating And Financial Review And Prospects Liquidity And Capital Resources
Š reimbursements of capital and the distribution of dividends by Tiglio I, Tiglio II and Telegono (€43million);
Š collection of the remaining receivable on the sale, in 2005, of the Finsiel group (€27 million);
Š sale of other non-current assets, reimbursements of capital and distribution of dividends by associates(€96 million);
Š the collection of the receivable for the telecommunications operating fee and the payment of theAntitrust Authority fine reduced debt by a net amount of €431 million; of that amount, €115 million refersto the payment of the fine levied by the Antitrust Authority for the alleged abuse of a dominant position and€546 million refers to the refund from the Italian government following the ruling handed down by theRegional Administrative Court of Lazio on July 10, 2006, for the principal portion of the telecommunicationsoperating fee that Telecom Italia and TIM had paid for the year 1999 pursuant to art. 20, Law 448 datedDecember 23, 1998.
Securitization and factoring arrangements led to an improvement in consolidated Net Financial Debt as ofDecember 31, 2006 of €1,499 million, as follows:
As of December 31,2006 2005(millions of Euro)
Securitization . . . . . . . . . . . . . . . . . . . . . . . . . . . . . . . . . . . . . . . . . . . . . . . . . . . . . . . — 648Factoring . . . . . . . . . . . . . . . . . . . . . . . . . . . . . . . . . . . . . . . . . . . . . . . . . . . . . . . . . . . . 1,499 615
Total . . . . . . . . . . . . . . . . . . . . . . . . . . . . . . . . . . . . . . . . . . . . . . . . . . . . . . . . . . . . . . . . 1,499 1,263
The Group’s original securitization program came to its natural end in the month of July 2006. In the second halfof the year 2006, contracts were signed with leading financial counterparties for the sale of both the same type ofreceivables in the securitization transactions and other contracts for the sale of receivables.
Gross Financial Debt
On a consolidated basis, at December 31, 2006 our gross financial debt amounted to €46,456 million (€52,101million at December 31, 2005) and included non-current financial liabilities (long-term debt) of €40,803 million(€42,146 million at December 31, 2005), current financial liabilities (short-term debt) of €5,653 million (€9,812million at December 31, 2005).
As of December 31, 2006 approximately 71% of our gross financial debt was denominated in Euro, while theremainder was primarily denominated in U.S. Dollars, Pound Sterling, Brazilian Reais and Japanese Yen.
The following table sets out the currency composition of our gross financial debt:
As of December 31,2006 2005
Euro %Foreign
currency(*) % Total % Total %(millions of euro, except percentages)
Long-term debt . . . . . . . . . . . . . . . . . . . . . . . . . . . . 27,760 84 13,043 96 40,803 88 42,146 81Short-term debt (including
current portion of long term debt) . . . . . . . 5,172 16 481 4 5,653 12 9,812 19
Total gross financial debt . . . . . . . . . . . . . . . 32,932 100 13,524 100 46,456 100 51,958 100
Discontinued operations/assets held for sale . . . . . . . . . . . . . . . . . . . . . . — 143
Total . . . . . . . . . . . . . . . . . . . . . . . . . . . . . . . . . . . . . . . . . . . . . . . . . . . . . . . . . . . . . . . . . . 46,456 52,101
(*) Before hedging transactions.
140

Item 5. Operating And Financial Review And Prospects Liquidity And Capital Resources
In 2006, the share of our long-term debt (excluding current portion) as a percentage of total gross financial debtincreased from 81% to 88%. At December 31, 2006 approximately 30% of the long-term debt (including currentportion) carried a floating rate compared to 34% at December 31, 2005.
Long-term debt includes notes we have issued in order to reduce our dependence on short-term debt, extend theaverage life of our financial debt and expand our investor base. For this purpose, we issue long-term debt in thecapital markets under, among others:
Š the Telecom Italia Euro Medium Term Note (“EMTN”) Programme. On December 21, 2005, the Boardof Directors of Telecom Italia S.p.A. set a new maximum ceiling for its EMTN Programme, whichregulates the placement, also for more than one transaction, for more than one tranche and for morethan one currency, of bonds by Telecom Italia S.p.A. and/or its wholly-owned subsidiary Telecom ItaliaFinance S.A. under a guarantee by Telecom Italia S.p.A. The new maximum ceiling was raised to €15billion against the previous €10 billion (of which slightly less than €8 billion had already been used atDecember 31, 2005). At the same time, the Board of Directors authorized the issue of non-convertiblebonds in 2006 up to a maximum of €4.5 billion;
Š the Form F-3 registration statement, filed with the Securities and Exchange Commission on August 9,2005 and effective as of August 30, 2005 which allows issuances for a total amount of U.S.$10 billion indebt at various terms, rates and maturities;
Š the Olivetti Euro Medium Term Note Programme, as updated and amended on June 8, 2001 andMay 14, 2002, which allows for the issuance of a total amount of €15 billion in debt (or the equivalent inother currencies), at various terms, rates and maturities;
Š the Old Telecom Italia Global Medium Term Note Program (“Global Note Program”), which allows forthe issuance of a total amount of U.S.$12 billion in debt (or the equivalent in other currencies), atvarious terms, rates and maturities.
The following table highlights the utilization of the EMTN Programme at the end of 2006 compared to the prioryear.
Telecom Italia Group EMTN Programme: utilization status
As of December 31,2006 2005
(millions of Euro)Total amount of EMTN Programme . . . . . . . . . . . . . . . . . . . . . . . . . . . . . . . . . . . . . . . . . . . . . . . . 15,000.00 10,000.00
Notes and bonds issued:(1) . . . . . . . . . . . . . . . . . . . . . . . . . . . . . . . . . . . . . . . . . . . . . . . . . . . . . . . . 10,435.40 7,839.70of which: Telecom Italia S.p.A. . . . . . . . . . . . . . . . . . . . . . . . . . . . . . . . . . . . . . . . . . . . . . . . . . . . . . . . . 9,186.00 7,090.00
Telecom Italia Finance S.A. . . . . . . . . . . . . . . . . . . . . . . . . . . . . . . . . . . . . . . . . . . . . . . . . . 1,249.40 749.70Notes and bonds repaid:(1) . . . . . . . . . . . . . . . . . . . . . . . . . . . . . . . . . . . . . . . . . . . . . . . . . . . . . . . . (1,000.05) —of which: Telecom Italia S.p.A. . . . . . . . . . . . . . . . . . . . . . . . . . . . . . . . . . . . . . . . . . . . . . . . . . . . . . . . . (1,000.00) —
Telecom Italia Finance S.A. . . . . . . . . . . . . . . . . . . . . . . . . . . . . . . . . . . . . . . . . . . . . . . . . . (0.05) —
Net utilization of EMTN Programme . . . . . . . . . . . . . . . . . . . . . . . . . . . . . . . . . . . . . . . . . . . . . . . 9,435.35 7,839.70
Remaining available amount(2) . . . . . . . . . . . . . . . . . . . . . . . . . . . . . . . . . . . . . . . . . . . . . . . . . . . . 5,564.65 2,160.30
(1) Cumulative amount since the start of the EMTN Programme.
(2) Two further issuances of debt for a total principal amount of €1,250 million were made in June 2007. For further details please see “Note48—Additional U.S. GAAP Disclosures—Subsequent Events” of the Notes to the Consolidated Financial Statements included elsewhere inthis Annual Report.
141
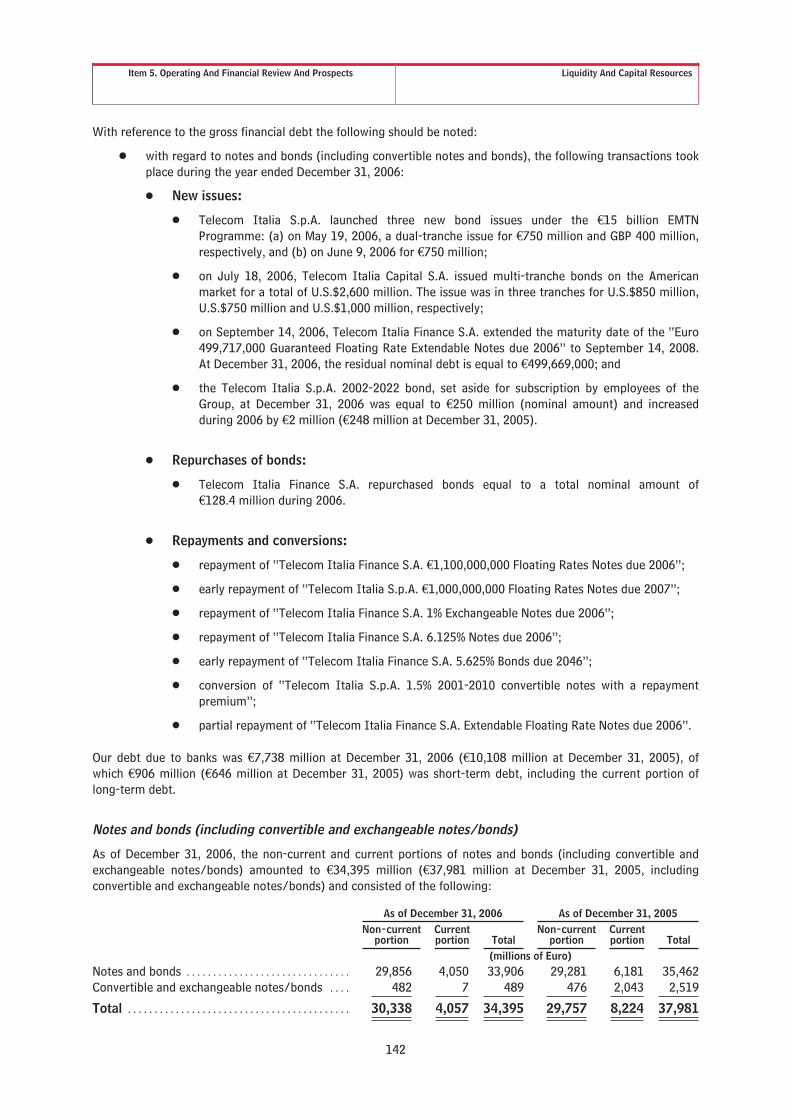
Item 5. Operating And Financial Review And Prospects Liquidity And Capital Resources
With reference to the gross financial debt the following should be noted:
Š with regard to notes and bonds (including convertible notes and bonds), the following transactions tookplace during the year ended December 31, 2006:
Š New issues:
Š Telecom Italia S.p.A. launched three new bond issues under the €15 billion EMTNProgramme: (a) on May 19, 2006, a dual-tranche issue for €750 million and GBP 400 million,respectively, and (b) on June 9, 2006 for €750 million;
Š on July 18, 2006, Telecom Italia Capital S.A. issued multi-tranche bonds on the Americanmarket for a total of U.S.$2,600 million. The issue was in three tranches for U.S.$850 million,U.S.$750 million and U.S.$1,000 million, respectively;
Š on September 14, 2006, Telecom Italia Finance S.A. extended the maturity date of the “Euro499,717,000 Guaranteed Floating Rate Extendable Notes due 2006” to September 14, 2008.At December 31, 2006, the residual nominal debt is equal to €499,669,000; and
Š the Telecom Italia S.p.A. 2002-2022 bond, set aside for subscription by employees of theGroup, at December 31, 2006 was equal to €250 million (nominal amount) and increasedduring 2006 by €2 million (€248 million at December 31, 2005).
Š Repurchases of bonds:
Š Telecom Italia Finance S.A. repurchased bonds equal to a total nominal amount of€128.4 million during 2006.
Š Repayments and conversions:
Š repayment of “Telecom Italia Finance S.A. €1,100,000,000 Floating Rates Notes due 2006”;
Š early repayment of “Telecom Italia S.p.A. €1,000,000,000 Floating Rates Notes due 2007”;
Š repayment of “Telecom Italia Finance S.A. 1% Exchangeable Notes due 2006”;
Š repayment of “Telecom Italia Finance S.A. 6.125% Notes due 2006”;
Š early repayment of “Telecom Italia Finance S.A. 5.625% Bonds due 2046”;
Š conversion of “Telecom Italia S.p.A. 1.5% 2001-2010 convertible notes with a repaymentpremium”;
Š partial repayment of “Telecom Italia Finance S.A. Extendable Floating Rate Notes due 2006”.
Our debt due to banks was €7,738 million at December 31, 2006 (€10,108 million at December 31, 2005), ofwhich €906 million (€646 million at December 31, 2005) was short-term debt, including the current portion oflong-term debt.
Notes and bonds (including convertible and exchangeable notes/bonds)
As of December 31, 2006, the non-current and current portions of notes and bonds (including convertible andexchangeable notes/bonds) amounted to €34,395 million (€37,981 million at December 31, 2005, includingconvertible and exchangeable notes/bonds) and consisted of the following:
As of December 31, 2006 As of December 31, 2005Non-current
portionCurrentportion Total
Non-currentportion
Currentportion Total
(millions of Euro)Notes and bonds . . . . . . . . . . . . . . . . . . . . . . . . . . . . . . . 29,856 4,050 33,906 29,281 6,181 35,462Convertible and exchangeable notes/bonds . . . . 482 7 489 476 2,043 2,519
Total . . . . . . . . . . . . . . . . . . . . . . . . . . . . . . . . . . . . . . . . . . 30,338 4,057 34,395 29,757 8,224 37,981
142

Item 5. Operating And Financial Review And Prospects Liquidity And Capital Resources
At December 31, 2006, the nominal repayment amount for notes and bonds (including convertible notes/bonds)amounted to €33,693 million (€37,219 million at December 31, 2005 including convertible and exchangeablenotes) and consisted of the following:
As of December 31,2006
As of December 31,2005
(millions of Euro)Notes and bonds . . . . . . . . . . . . . . . . . . . . . . . . . . . . . . . . . . . . . . . . . . . . . . . . . . . . . . . . . 33,119 34,577Convertible and exchangeable notes . . . . . . . . . . . . . . . . . . . . . . . . . . . . . . . . . . . . . . 574 2,642
Total . . . . . . . . . . . . . . . . . . . . . . . . . . . . . . . . . . . . . . . . . . . . . . . . . . . . . . . . . . . . . . . . . . . . 33,693 37,219
At December 31, 2006, outstanding convertible notes consisted of the following:
Original Currency
Nominalrepaymentamount(millionsof Euro) Coupon New shares issuer Issue date Maturity date
Issueprice(%)
Market priceas of
December 31,2006 (%)
Market valueas of
December 31,2006
(millions ofEuro)
Convertible notes issued by Telecom Italia S.p.A.Euro . . . . . . . . . . . . 574 1.5% Telecom Italia S.p.A. 11/23/2001 01/01/2010 100 120.948 587
143

Item 5. Operating And Financial Review And Prospects Liquidity And Capital Resources
At December 31, 2006 notes and bonds were detailed as follows:
OriginalCurrency
Amountin originalcurrency(million)
Nominalrepayment
amountin Euro
(million) Coupon Issue date Maturity dateIssue price
(%)
Marketprice as of
December 31,2006 (%)
Marketvalue as of
December 31,2006
(millionsof Euro)
Notes and bonds issued by Telecom Italia S.p.A.Euro . . . . . . . . 1,250 1,250 5.625% 02/01/2002 02/01/2007 99.841 100.126 1,252Euro . . . . . . . . 750 750 3 month Euribor +0.22% 06/09/2006 06/09/2008 100 100.000 750Euro . . . . . . . . 110 110 3 month Euribor +0.60% 04/08/2004 03/30/2009 100 100.797 111Euro . . . . . . . . 750 750 4.500% 01/29/2004 01/28/2011 99.56 99.390 745Euro . . . . . . . . 1,250 1,250 6.250% 02/01/2002 02/01/2012 98.952 106.038 1,325Euro . . . . . . . . 1,000 1,000 3 month Euribor +0.53% 12/06/2005 12/06/2012 100 99.270 993Euro . . . . . . . . 750 750 4.750% 05/19/2006 05/19/2014 99.156 98.000 735Euro . . . . . . . . 120 120 3 month Euribor +0.66% 11/23/2004 11/23/2015 100 97.694 117GBP . . . . . . . . . 500 744 5.625% 06/29/2005 12/29/2015 99.878 95.120 708Euro . . . . . . . . 1,250 1,250 5.375% 01/29/2004 01/29/2019 99.07 98.430 1,230GBP . . . . . . . . . 850 1,266 6.375% 06/24/2004 06/24/2019 98.85 100.076 1,267Euro . . . . . . . . 250 250 6 month Euribor (Base 365) 01/01/2002 01/01/2022 100 100.000 250GBP . . . . . . . . . 400 596 5.875% 05/19/2006 05/19/2023 99.622 95.714 570Euro . . . . . . . . 850 850 5.250% 03/17/2005 03/17/2055 99.667 84.550 719
Sub-Total . . 10,936 10,772
Notes and bonds issued by Telecom Italia Finance S.A. and guaranteed by Telecom Italia S.p.A.Euro . . . . . . . . 1,720 1,720 6.500% 04/24/2002 04/24/2007 100.911(*) 100.697 1,732Euro . . . . . . . . 1,659 1,659 5.875% 01/24/2003 01/24/2008 99.937 101.607 1,686Euro . . . . . . . . 499.67 500 3 month Euribor +1.3% 09/14/2006 09/14/2008 100 103.259 516Euro . . . . . . . . 1,500 1,500 5.150%(b) 02/09/1999 02/09/2009 99.633 101.501 1,523Euro . . . . . . . . 2,210 2,210 6.575%(c) 07/30/1999 07/30/2009 98.649(*) 105.114 2,323Euro . . . . . . . . 2,000 2,000 7.250%(a) 04/20/2001 04/20/2011 99.214 110.221 2,204Euro . . . . . . . . 1,000 1,000 7.250% 04/24/2002 04/24/2012 101.651(*) 110.782 1,108Euro . . . . . . . . 850 850 6.875% 01/24/2003 01/24/2013 99.332 109.599 932JPY . . . . . . . . . 20,000 127 3.550% 04/22/2002 05/14/2032 99.25 122.728 156Euro . . . . . . . . 1,050 1,050 7.750% 01/24/2003 01/24/2033 109.646(*) 118.860 1,248
Sub-Total . . 12,616 13,428
Notes and bonds issued by Telecom Italia Capital S.A. and guaranteed by Telecom Italia S.p.A.USD . . . . . . . . . 1,000 759 4.000% 10/29/2003 11/15/2008 99.953 97.326 739USD . . . . . . . . . 1,250 949 4.000% 10/06/2004 01/15/2010 99.732 95.498 906USD . . . . . . . . . 700 532 4.875% 09/28/2005 10/01/2010 99.898 97.202 517USD . . . . . . . . . 400 304 3 month US Libor +0.48% 09/28/2005 02/01/2011 100 99.476 302USD . . . . . . . . . 850 645 3 month US Libor +0.61% 07/18/2006 07/18/2011 100 99.867 644USD . . . . . . . . . 750 570 6.200% 07/18/2006 07/18/2011 99.826 101.448 578USD . . . . . . . . . 2,000 1,519 5.250% 10/29/2003 11/15/2013 99.742 95.418 1,449USD . . . . . . . . . 1,250 949 4.950% 10/06/2004 09/30/2014 99.651 92.600 879USD . . . . . . . . . 1,400 1,063 5.250% 09/28/2005 10/01/2015 99.370 93.173 990USD . . . . . . . . . 1,000 759 6.375% 10/29/2003 11/15/2033 99.558 94.430 717USD . . . . . . . . . 1,000 759 6.000% 10/06/2004 09/30/2034 99.081 90.759 689USD . . . . . . . . . 1,000 759 7.200% 07/18/2006 07/18/2036 99.440 104,022 790
Sub–Total . . 9,567 9,200
Total . . . . . . . 33,119 33,400
Notes (a), (b), (c): see the following paragraph “Mechanism describing how coupons change on step-up/step-down notes and bonds in
relation to a change in the rating”.
(*) Weighted average issue price for notes and bonds issued with more than one tranche.
144

Item 5. Operating And Financial Review And Prospects Liquidity And Capital Resources
Rating Triggers
As of the date hereof Telecom Italia had the following ratings:
As of December 31, 2006Rating Outlook
Standard & Poor’s: BBB+ Negative(1)Moody’s: Baa2 Negative(2)Fitch Ratings: BBB+ Stable(3)
(1) On March 13, 2007, Standard & Poor’s confirmed its “BBB+ negative outlook” rating.
(2) On March 12, 2007, Moody’s revised its expectations on Telecom Italia, changing its outlook from Stable to Negative, and affirmed theBaa2 rating on the company.
(3) On March 15, 2007, Fitch Ratings confirmed its “BBB+ stable outlook” rating.
a) Telecom Italia Finance S.A. “Euro Notes”: €2,000 million, 7% interest, maturing April 2011
These securities carry protection for investors which would be triggered by a change in the rating assigned toTelecom Italia to below the Baa1/BBB+ ratings (by Moody’s and S&P’s, respectively): each downgrade in therating by one “notch” by each of the two rating agencies to below the stated thresholds would cause an increasein the coupon rate of 0.25%, starting from the coupon payment date subsequent to the downgrade in the rating.
The downgrade in the rating from the thresholds is evaluated at the end of each coupon period and, on the basisof this evaluation, the interest for the next coupon is fixed; therefore, changes in the ratings during the couponinterest period would have no impact on the coupon payable during that period.
Nevertheless, the relative step-up/step-down will only be applied when the rating at the end of the coupon periodis different from the rating at the end of the preceding coupon period.
By virtue of this mechanism, the coupons for these securities are currently subject to an increase of 0.25% due toa Baa2 rating assigned by Moody’s in August 2003. The increase was applied beginning from the coupon periodwhich started in April 2004, accordingly, the coupon is equal to 7.25% for securities maturing in April 2011.
b) Telecom Italia Finance S.A. notes: €1,500 million, 5.15% interest, maturing February 2009
These notes carry protection for investors which would only be triggered by a downgrade in the minimum rating(among the ratings assigned by the various agencies, in this specific case, the Baa2 rating by Moody’s).
At the beginning of every coupon period, this minimum rating will be checked, and depending upon the rating, thecoupon interest will be fixed; once fixed, changes in the minimum rating during the coupon period will have noeffect on the coupon to be paid, and will only have an impact when the next coupon interest rate is fixed (if thechanges are still in effect).
Starting from the initial level of the coupon at issue (5%), a 0.15% increase in interest was granted to investors toremain in place until to the maturity date, bringing the current coupon interest rate to 5.15%.
This current coupon can be further increased in relation to the level of the minimum rating:
Š if, at the time the coupon interest is fixed, the minimum rating is Ba1/BB+ or below, the currentcoupon will be increased by 1.5%;
Š if, at the time the coupon interest is fixed, the minimum rating is Baa3/BBB-, the current coupon will beincreased by 0.5%;
Š ratings higher than the minimum rating do not lead to increases in the current coupon.
Therefore, only future downgrades in the minimum rating could cause an increase in the current coupon; thiscoupon cannot be reduced because of upgrades in the rating.
145

Item 5. Operating And Financial Review And Prospects Liquidity And Capital Resources
c) Telecom Italia Finance S.A. notes: €2,210 million, 6.575% interest, maturing July 2009
These notes carry protection for investors which would be triggered by a change in the minimum rating (amongthose assigned by the various agencies, in this specific case, the Baa2 rating by Moody’s).
At the beginning of every coupon period, this minimum rating will be checked and depending upon the rating, thecoupon interest will be fixed; once fixed, changes in the minimum rating during the coupon period will have noeffect on the coupon to be paid, and will only have an impact when the next coupon interest rate is fixed (if thechanges are still in effect).
Starting from the initial level of interest at issue (6.125%), the coupon to be paid will be increased in relation tothe level of the minimum rating:
Š if, at the time the coupon is fixed, the minimum rating is Ba1/BB+ or below, the original coupon will beincreased by 1.95%;
Š if, at the time the coupon interest is fixed, the minimum rating is Baa3/BBB-, the original coupon will beincreased by 0.95%;
Š if, at the time the coupon interest is fixed, the minimum rating is Baa2/BBB, the original coupon will beincreased by 0.45%;
Š if, at the time the coupon interest is fixed, the minimum rating is Baa1/BBB+, the original coupon willbe increased by 0.15%;
Š ratings higher than the minimum rating do not lead to increases in the original coupon.
Under this mechanism, since October 2000 (the date the mechanism was introduced), the original coupon hasbeen increased by 0.45% (reaching the current 6.575%).
Future upgrades/downgrades in the minimum rating could cause a reduction/increase in the coupon according tothe mechanism described above.
Financial covenants / other covenants / other features of convertible notes and bonds
Bonds issued by companies of the Group to third parties do not contain either financial covenants or terms andconditions that would require the early repayment of the bonds in relation to events other than the insolvency ofthe Telecom Italia Group. Furthermore, the repayment of the bonds and the payment of interest are not coveredby specific guarantees nor there are commitments provided relative to the assumption of future guarantees,except for the full and unconditional guarantees provided by Telecom Italia S.p.A. for the bonds issued byTelecom Italia Finance S.A. and Telecom Italia Capital S.A..
None of the securities summarized here carry any other interest rate structures or structural complexities.
Since these bonds have been placed principally with institutional investors on major world capital markets(Euromarket and the U.S.A.), the terms which regulate the bonds are in line with market practice for similartransactions effected on these same markets.
For a tabular description of our debt please see “Note 18—Financial liabilities (current and non-current)” of theNotes to the Consolidated Financial Statements included elsewhere in this Annual Report.
Bank Facilities
Committed credit lines outstanding at the end of 2006, consisting of the Revolving Credit Facilities, amount to€8 billion, divided as follows:
Š €2 billion credit line expiring in March 2007, completely undrawn;
Š €6 billion credit line expiring in August 2012 drawn down for €1.5 billion.
146

Item 5. Operating And Financial Review And Prospects Liquidity And Capital Resources
This composition and the level of the credit lines where achieved at through the repayment of the credit lineexpiring in 2012 and the partial cancellation of the credit line expiring in 2007, during the course of 2006. Asummary follows:
Revolving Credit Facilitiesexpiring 2007
Revolving Credit Facilitiesexpiring 2012 Total
(billions of Euro) Granted Drawn down Granted Drawn down Granted Drawn down
As of December 31, 2005 . . . . . . . . . . . . . . 5.0 — 6.0 4.5 11.0 4.5
Situation at June 13, 2006 followingrepayment . . . . . . . . . . . . . . . . . . . . . . . . . . 3.5 — 6.0 3.0 9.5 3.0
Situation at December 20, 2006following repayment . . . . . . . . . . . . . . . . . 2.0 — 6.0 1.5 8.0 1.5
As of December 31, 2006 . . . . . . . . . . . . . . 2.0 — 6.0 1.5 8.0 1.5
On January 15, 2007, €2 billion of the remaining available syndicated credit line expiring in March 2007 wascancelled and at the same time the Revolving Credit Facility expiring in 2012 was increased by the same amount.The new Revolving Credit Facility is therefore equal to €8 billion and, as of June 13, 2007, the total undrawn andavailable committed credit lines of Telecom Italia Group were equal to €6.6 billion.
Telecom Italia’s syndicated bank lines do not contain financial covenants that, if not complied with, would requirethe repayment of the existing loan. They do provide for the normal negative pledge clauses (within the limits ofrequirements for operations). These credit lines are subject, only with regard to the interest margin, to variationsin the ratings which would pertain to the credit risk of the company, on the basis of a pre-set grid.
Debt to Equity Ratio. The Telecom Italia Group’s debt to equity ratio, calculated as the ratio of consolidatednet financial debt to equity (including Minority Interests), was 137.7% and 147.7% as of December 31, 2006 andDecember 31, 2005, respectively.
Centralized Treasury. Telecom Italia has a centralized treasury that provides financial assistance to theTelecom Italia Group, and generally operates as the Group’s principal banker, allocating cash where needed andcollecting the liquid resources of the members of the Group. As a result, we are able to ensure that oursubsidiaries have adequate liquidity to satisfy their requirements. Telecom Italia also acts on behalf of itssubsidiaries in negotiating bank lines of credit and provides financial consultancy services to its subsidiaries.
The central treasury function reduces the need for the members of the Group to utilize banks, enables membersof the Group to obtain more favorable terms from banks when needed and enables us to maintain control overcash flows and to assure better utilization of surplus liquidity.
Cash Management. We utilize short-term credit lines to support expenses and disbursements that occur in theordinary course of business, using free cash flow generated by its business to fund capital expenditures andacquisitions and to repay long-term debt.
Lines of Credit. Short-term lines of credit granted to the Telecom Italia Group by banks, according to standardmoney market terms and conditions, consist partly of lines of credit with specified maturities and partly of lines ofcredit callable upon notice. All of the Company’s medium and long-term lines of credit relate to specific loansdrawn down to fund the Company’s activities.
Off-Balance Sheet Arrangements
Off-balance sheet arrangements refer to any transaction, agreement, or other contractual arrangement (otherthan contingent liabilities arising from litigation, arbitration or regulatory actions), involving an unconsolidatedentity under which Telecom Italia has:
Š guarantee contracts required to be initially recorded at fair value under FASB Interpretation No. 45,Guarantor’s Accounting and Disclosure Requirements for Guarantees, Including Indirect Guarantees ofIndebtedness of Others (FIN 45);
147

Item 5. Operating And Financial Review And Prospects Liquidity And Capital Resources
Š retained or contingent interests in transferred assets;
Š any obligation under derivative instruments classified as equity; or
Š any obligation arising out of a material variable interest in an unconsolidated entity that providesfinancing, liquidity, market risk or credit risk support to the company, or that engages in leasing,hedging, or research and development arrangements with the company.
As of December 31, 2006, the Telecom Italia Group had the following items that are considered to be off-balancesheet.
Purchase commitments for €455 million related mainly to:
Š €164 million of property lease rentals under contracts lasting more than 6 years;
Š €242 million of orders to suppliers of Telenergia relating to the electrical power supply agreementsreached with Endesa;
Š €17 million for the purchase by Telecom Italia Media Broadcasting of radio and television equipment inSicily.
Sale commitments for a total amount of €2 million.
The purchase and sale commitments above refer to commitments that do not fall within the normal “operatingcycle” of the Group.
As of December 31, 2006, the Group has given guarantees of €330 million, net of €180 million of counter-guarantees received, and consisted mainly of sureties provided by Telecom Italia on behalf of associatedcompanies (€102 million) and others for medium and long-term loans.
In addition, the 47.80% interest in Tiglio I and the 49.47% interest in Tiglio II have been pledged to the banksthat financed the two associates.
As of December 31, 2006 Telecom Italia Group companies have also issued support letters for a total of€141 million, mainly on behalf of associates to guarantee insurance policies, lines of credit and overdraftarrangements.
For further details please see “Note 26—Contingent assets and liabilities, commitments and other guarantees” ofthe Notes to the Consolidated Financial Statements.
Contractual Obligations and Commitments
The following tables aggregate our contractual obligations and commitments with definitive payment terms whichwill require significant cash outlays in the future in terms of nominal amounts and carrying values in accordancewith IFRS.
In 2007 we repaid on February 1, 2007 the “Telecom Italia S.p.A. Euro 1,250,000,000 Notes 5.625% due 2007” atmaturity.
The average maturity of financial non-current liabilities was equal to 7.99 years.
148
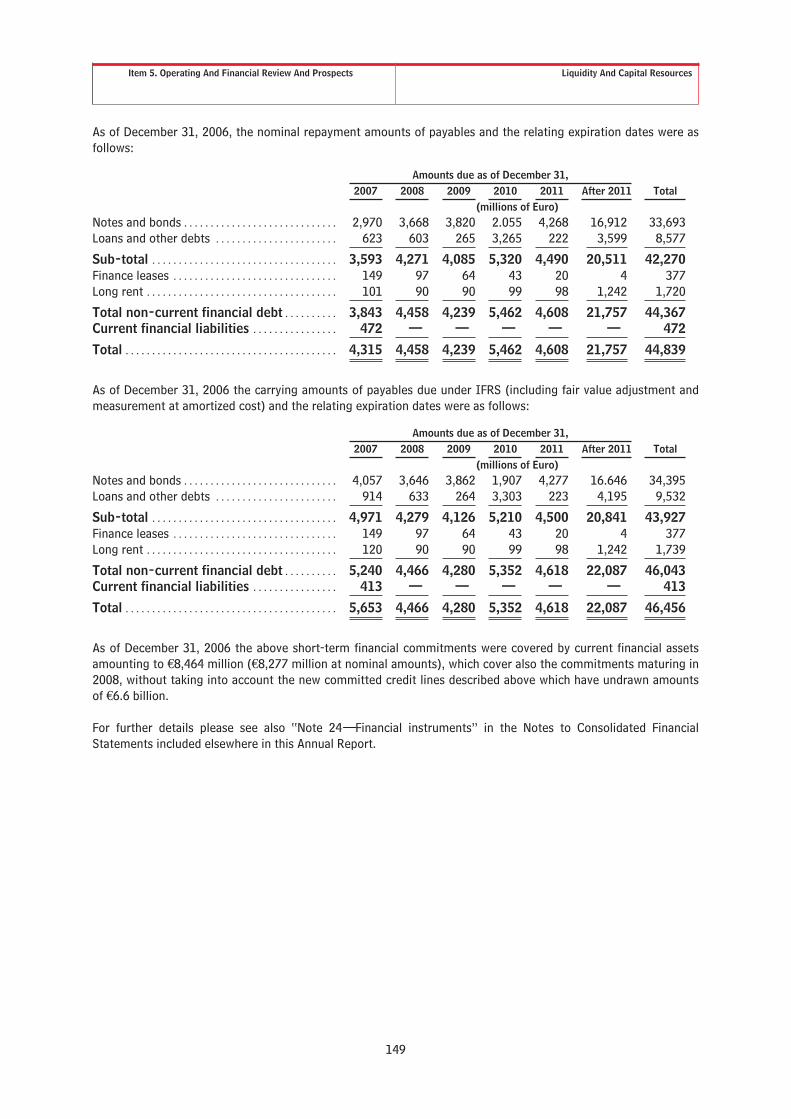
Item 5. Operating And Financial Review And Prospects Liquidity And Capital Resources
As of December 31, 2006, the nominal repayment amounts of payables and the relating expiration dates were asfollows:
Amounts due as of December 31,Total2007 2008 2009 2010 2011 After 2011
(millions of Euro)Notes and bonds . . . . . . . . . . . . . . . . . . . . . . . . . . . . . 2,970 3,668 3,820 2.055 4,268 16,912 33,693Loans and other debts . . . . . . . . . . . . . . . . . . . . . . . 623 603 265 3,265 222 3,599 8,577
Sub-total . . . . . . . . . . . . . . . . . . . . . . . . . . . . . . . . . . . 3,593 4,271 4,085 5,320 4,490 20,511 42,270Finance leases . . . . . . . . . . . . . . . . . . . . . . . . . . . . . . . 149 97 64 43 20 4 377Long rent . . . . . . . . . . . . . . . . . . . . . . . . . . . . . . . . . . . . 101 90 90 99 98 1,242 1,720
Total non-current financial debt . . . . . . . . . . 3,843 4,458 4,239 5,462 4,608 21,757 44,367Current financial liabilities . . . . . . . . . . . . . . . . 472 — — — — — 472
Total . . . . . . . . . . . . . . . . . . . . . . . . . . . . . . . . . . . . . . . . 4,315 4,458 4,239 5,462 4,608 21,757 44,839
As of December 31, 2006 the carrying amounts of payables due under IFRS (including fair value adjustment andmeasurement at amortized cost) and the relating expiration dates were as follows:
Amounts due as of December 31,Total2007 2008 2009 2010 2011 After 2011
(millions of Euro)Notes and bonds . . . . . . . . . . . . . . . . . . . . . . . . . . . . . 4,057 3,646 3,862 1,907 4,277 16.646 34,395Loans and other debts . . . . . . . . . . . . . . . . . . . . . . . 914 633 264 3,303 223 4,195 9,532
Sub-total . . . . . . . . . . . . . . . . . . . . . . . . . . . . . . . . . . . 4,971 4,279 4,126 5,210 4,500 20,841 43,927Finance leases . . . . . . . . . . . . . . . . . . . . . . . . . . . . . . . 149 97 64 43 20 4 377Long rent . . . . . . . . . . . . . . . . . . . . . . . . . . . . . . . . . . . . 120 90 90 99 98 1,242 1,739
Total non-current financial debt . . . . . . . . . . 5,240 4,466 4,280 5,352 4,618 22,087 46,043Current financial liabilities . . . . . . . . . . . . . . . . 413 — — — — — 413
Total . . . . . . . . . . . . . . . . . . . . . . . . . . . . . . . . . . . . . . . . 5,653 4,466 4,280 5,352 4,618 22,087 46,456
As of December 31, 2006 the above short-term financial commitments were covered by current financial assetsamounting to €8,464 million (€8,277 million at nominal amounts), which cover also the commitments maturing in2008, without taking into account the new committed credit lines described above which have undrawn amountsof €6.6 billion.
For further details please see also “Note 24—Financial instruments” in the Notes to Consolidated FinancialStatements included elsewhere in this Annual Report.
149

Item 5. Operating And Financial Review And Prospects Liquidity And Capital Resources
5.6.3 CAPITAL EXPENDITURES
The table below sets forth, for the periods indicated, our total capital expenditures on an accrual basis based onthe organization by Business Unit at December 31, 2006.
Year ended December 31,2006(1) 2005(1)(2) 2004(1)(2)
(millions of Euro)Acquisitions of tangible assets:
Wireline . . . . . . . . . . . . . . . . . . . . . . . . . . . . . . . . . . . . . . . . . . . . . . . . . . . . . . . . . . . . . . . . . . 1,881 1,972 1,432Domestic Mobile . . . . . . . . . . . . . . . . . . . . . . . . . . . . . . . . . . . . . . . . . . . . . . . . . . . . . . . . . . 538 671 821Brazil Mobile . . . . . . . . . . . . . . . . . . . . . . . . . . . . . . . . . . . . . . . . . . . . . . . . . . . . . . . . . . . . . . 342 598 701Media . . . . . . . . . . . . . . . . . . . . . . . . . . . . . . . . . . . . . . . . . . . . . . . . . . . . . . . . . . . . . . . . . . . . . 29 27 16Olivetti . . . . . . . . . . . . . . . . . . . . . . . . . . . . . . . . . . . . . . . . . . . . . . . . . . . . . . . . . . . . . . . . . . . 10 18 14Other activities(3) . . . . . . . . . . . . . . . . . . . . . . . . . . . . . . . . . . . . . . . . . . . . . . . . . . . . . . . . . 127 102 136
Total acquisition of tangible assets(4) . . . . . . . . . . . . . . . . . . . . . . . . . . . . . . . . . . . . . . . . . . 2,927 3,388 3,120Acquisition of intangible assets(5) . . . . . . . . . . . . . . . . . . . . . . . . . . . . . . . . . . . . . . . . . . . . . . 2,187 1,785 1,882
Total capital expenditures(6) . . . . . . . . . . . . . . . . . . . . . . . . . . . . . . . . . . . . . . . . . . . . . . . . 5,114 5,173 5,002
(1) All financial data exclude those relating to the consolidated companies considered as discontinued operations / assets held for sale.
(2) The data relating to 2004 and 2005 have been reclassified and presented consistent with the 2006 presentation.
(3) The economic and financial results of Entel Bolivia have been included in Other activities.
(4) Acquisitions of tangible assets are mainly related to local and long distance networks, exchange equipment, investments in subscribers’equipment, radio and transmission equipment.
(5) Acquisitions of intangible assets include expenditures such as software for telecommunications systems and licenses.
(6) Intercompany capital expenditures are adjusted to eliminate intercompany profit.
In the three years ended December 31, 2006, 2005 and 2004, cash flows generated by operating activities(€9,194 million in 2006, €9,778 million in 2005 and €10,266 in 2004) exceeded capital expenditures on an accrualbasis (€5,114 million in 2006, €5,173 million in 2005 and €5,002 million in 2004).
The capital expenditures planned for the three years 2007-2009 will be approximately €15 billion. The breakdownby sector of activity is as follows:
Š Domestic Business for approximately €11.0 billion;
Š European Broadband Project for approximately €1.2 billion; and
Š Tim Brasil for approximately €2.4 billion.
For further details please see “—5.6.2 Capital Resources”.
150

Item 5. Operating And Financial Review And Prospects Research, Development And Innovation
5.7 RESEARCH, DEVELOPMENT AND INNOVATION
The Italian market for telecommunications is considered among the most advanced, both from a technologicalviewpoint and evolution of customer attitudes as well as customer consumption profiles.
Technological innovation is therefore an essential and differentiating factor permitting the Telecom Italia Groupto develop a competitive advantage and maintain leadership in an increasingly competitive market.
The technological and innovative advances the Group has made over the years in the design, development andadoption of state-of-the-art networks, terminals and services, has also been utilized in foreign countries where theGroup operates through subsidiaries.
Technological research and development activities are carried out by the operational and business units (Network,Market, Information Technology, Web & Media and Security) as well as by Olivetti in addition to the“Innovation & Engineering Services” department (former Telecom Italia Lab) of Operations where all theactivities and competences concerning basic research, the assessment of developing technologies and the “intra-moenia” development are concentrated.
The technological research and development of Telecom Italia Group arises moreover from the strategicpartnerships with the most important manufacturers of telecommunication equipment and systems and withresearch centers of excellence in the most qualified academic institutions both at the national and internationallevel.
Technological research and development activities range from reviews of basic technologies, aimed at increasingnetwork and system efficiency, to complex activities involving the radical review of platforms, services andarchitectures; the effort concentrated on the field by business unit operational departments is therefore essentialto assure the compliance of new services with customer needs and the continuous improvement of servicequality.
During 2006, the innovative investments of Telecom Italia Group in tangible and intangible assets wereapproximately €3,200 million. Internal resources devoted to these activities as well as to research, in Italy, andBrazil, comprise approximately 6,300 employees, with an overall commitment equal to about €540 million (ofwhich about €130 million is already included in the investments).
Total research and development costs incurred in 2006 amounted to approximately €133 million (€180 million in2005 and €181 million in 2004) and included external costs, labor costs of dedicated staff and depreciation andamortization.
151

Item 5. Operating And Financial Review And Prospects Consolidated Financial Statements As Of And For The Three Year PeriodEnded December 31, 2006—Reconciliation Of IFRS To U.S. GAAP
5.8 CONSOLIDATED FINANCIAL STATEMENTS AS OF AND FOR THE THREE YEAR PERIOD ENDEDDECEMBER 31, 2006—RECONCILIATION OF IFRS TO U.S. GAAP
During the three years ended December 31, 2006, 2005 and 2004, the Telecom Italia Group engaged in certainsignificant transactions which, under U.S. GAAP, gave rise to material differences in net income and equity whencompared to IFRS. In addition, the application of the IFRS first time adoption at the transition date (January 1,2004), as well as of certain U.S. GAAP accounting principles, led to material adjustments to IFRS net income andequity. In particular, the most significant differences arose from the following:
Š business combinations prior to the adoption of IFRS;
Š TIM Acquisition of Minority Interest in 2005;
Š rationalization of the Group’s Internet operations;
Š sale of real estate properties (Magnum Project);
Š different basis of reference for the impairment test of goodwill (Cash Generating Unit under IFRS andReporting Unit under U.S. GAAP);
Š capitalization of interest on assets under construction under U.S. GAAP (under IFRS, as permitted,Telecom Italia has elected to charge interest to the statement of income);
Š deferred taxes on tax suspension equity reserves.
As a result of the foregoing elements there are material differences in reconciling Net income attributable toequity holders of the Parent for the three-year period ended December 31, 2006 under IFRS and Equityattributable to equity holders of the Parent as of December 31, 2006 and 2005 under IFRS to U.S. GAAP relevantamounts. The following is a discussion of the U.S. GAAP treatment of such transactions and the application of thedescribed U.S. GAAP accounting principles and the impact on Net income attributable to equity holders of theParent under IFRS for the three-year period ended December 31, 2006 and Equity attributable to equity holders ofthe Parent under IFRS as of December 31, 2006 and 2005. For a complete description of the Telecom ItaliaGroup’s reconciliation and other required U.S. GAAP disclosures see Notes 46, 47, and 48 of the Notes to the 2006Consolidated Financial Statements included elsewhere herein.
5.8.1 YEAR ENDED DECEMBER 31, 2006
Net income attributable to equity holders of the Parent
Under IFRS, Net income attributable to equity holders of the Parent was € 3,014 million in 2006, compared to netincome of €1,862 million under U.S. GAAP. The decrease in net income of €1,152 million is largely attributable tocertain of the transactions as well as the application of certain of the U.S. GAAP accounting principles describedabove which resulted in material adjustments to the IFRS results. The most significant items affecting the 2006results are as follows:
Š business combinations prior to the adoption of IFRS: Telecom Italia elected not to apply IFRS 3“Business Combinations”, to prior year business combinations (which mainly include Old Telecom Italiaacquisitions that occurred in the period 1999-2003) as allowed by IFRS 1 “First-time Adoption ofInternational Financial Reporting Standards”. As a result, under IFRS, certain differences relating tobusiness combinations prior to 2004 were accounted for as a pooling of interest or on the basis of bookvalues (for both assets acquired and shares issued). U.S. GAAP requires that the assets and liabilitiespurchased be recorded at fair value for all business combinations. As a result, these transactions gaverise to classes of assets, in particular tangible and intangible assets besides goodwill, that are beingamortized with an increase in depreciation and amortization expense of €789 million. Moreover, due tothe sale and leaseback transitions on assets, €174 million of prior year purchase allocation on realestate assets has been written off on disposal of the related assets;
Š TIM Acquisition of Minority Interest in 2005: during 2005, the Group acquired the outstandingminority interest in TIM through a Cash Tender Offer, other purchases in the market and the mergerwith and into Telecom Italia. Under IFRS such transactions were accounted for under the parent-entityextension method which gave rise to an increase in goodwill. Under U.S. GAAP, which requires theapplication of the purchase method and step acquisition accounting, the price allocation resulted in the
152

Item 5. Operating And Financial Review And Prospects Consolidated Financial Statements As Of And For The Three Year PeriodEnded December 31, 2006—Reconciliation Of IFRS To U.S. GAAP
recognition of a reduction of goodwill due to the allocation of the purchase price to the fair value of theGroup’s share of identifiable intangible assets acquired and an increase in amortization expense of €686million for the year;
Š tax effect on reconciling items: in 2006 the additional tax benefit of €624 million recorded for U.S.GAAP related mainly to the additional amortization and depreciation expense recorded for intangibleand tangible assets described above;
Š discontinued operations/assets held for sale: an additional net income of €105 million in 2006 wasrecorded under U.S. GAAP entirely relating to the disposal of the subsidiary Digitel Venezuela. Thedisposal of Digitel Venezuela led to the reversal to the statement of income of the cumulativetranslation adjustments which under IFRS first time adoption were recognized only from January 1,2004.
Equity attributable to equity holders of the Parent
Equity attributable to equity holders of the Parent, under IFRS was €26,018 million at December 31, 2006,compared to €43,823 million for U.S. GAAP. The overall impact of the U.S. GAAP adjustments was to increaseequity attributable to equity holders of the Parent by €17,805 million. The most significant items affecting thisincrease are as follows:
Š business combinations prior to the adoption of IFRS: as explained above in more details U.S. GAAPrequires that the assets and liabilities purchased be recorded at fair value for all business combinations.As a result, these transactions gave rise to classes of assets, in particular tangible and intangible assets,that are being amortized, as well as goodwill. The application of this accounting treatment resulted inan increase of €21,790 million of the equity (gross of minority interests and taxes) as of December 31,2006;
Š TIM Acquisition of Minority Interest in 2005: as explained above in more detail, under U.S. GAAP,which requires the application of the purchase method and step acquisition accounting, the priceallocation resulted in the recognition of a reduction of goodwill due to the allocation of the purchaseprice to the fair value of the Group’s share of identifiable intangible assets acquired and an increase inamortization expense for the year. Such accounting treatment resulted in an increase of €2,430 millionof the equity (gross of minority interests and taxes) as of December 31, 2006;
Š capitalization of interest: under IFRS, Telecom Italia has elected not to capitalize interest on assetsunder construction. U.S. GAAP requires interest to be capitalized on both tangible and intangible assetsregardless of whether specific borrowings relate to the project. The capitalized interest is amortizedover the remaining useful life of the assets. A large part of the interest capitalized prior to 2004 relatesto the UMTS license of TIM which was put into use in 2004 and on which amortization expense has beencalculated commencing in 2004. Such different accounting treatment resulted in an increase of €717million of the equity (gross of minority interests and taxes) as of December 31, 2006;
Š deferred taxes on tax-suspension equity reserves: under IFRS, IAS 12 “Income taxes”, allows, undercertain conditions, not to record deferred income taxes on tax suspension equity reserves, whereas,under U.S. GAAP, SFAS 109 “Accounting for Income Taxes” provides that deferred taxes, in any case,shall be provided. Such different accounting treatment resulted in an increase in deferred tax liabilityand consequently a decrease of €257 million of equity as of December 31, 2006;
Š tax effect on reconciling items: these effects resulted in a decrease of €7,078 million in equity (grossof minority interests) as of December 31, 2006, and mainly relate to additional tangible and intangibleassets (excluding goodwill) arising from the above business combinations.
Total liabilities under IFRS were €62,359 million versus €70,449 million (excluding minority interests) for U.S.GAAP. In particular, excluding financial liabilities relating to discontinued operations/assets held for sale,non-current financial liabilities were €41,712 million under U.S. GAAP at the end of 2006, versus €40,803 millionunder IFRS, with an increase of €909 million under U.S. GAAP. Such increase mainly arose from:
Š the different accounting treatment of some aspects of real estate transactions entered into by theTelecom Italia Group, mainly in previous years. Under IFRS, such transactions have been recorded inaccordance with the finance method, except for the land element which, in absence of a contractual
153

Item 5. Operating And Financial Review And Prospects Consolidated Financial Statements As Of And For The Three Year PeriodEnded December 31, 2006—Reconciliation Of IFRS To U.S. GAAP
purchase option or passage of title to Telecom Italia, was treated as an operating lease. Suchaccounting treatment was also followed under U.S. GAAP except for the land element which, when lessthan 25% of the fair value of the property, was treated as a finance lease with an additional increase indebt. The additional debt amounts to €660 million;
Š the application of the purchase accounting method to the Old Telecom Italia Acquisition under U.S.GAAP, which led to the valuation of liabilities at fair values and an increase of debt of €130 million.
5.8.2 YEAR ENDED DECEMBER 31, 2005
Net income attributable to equity holders of the Parent
Under IFRS, Net income attributable to equity holders of the Parent was €3,216 million in 2005, compared to netincome of €1,939 million under U.S. GAAP. The decrease in net income of €1,277 million is largely attributable tocertain of the transactions as well as the application of certain of the U.S. GAAP accounting principles describedabove which resulted in material adjustments to the IFRS results. The most significant items affecting the 2005results are as follows:
Š business combinations prior to the adoption of IFRS: as a result of the accounting treatmentdescribed above under 5.8.1 Year Ended December 31, 2006 there was an increase in depreciation andamortization expense of €860 million. Moreover, due to the sale and leaseback transactions on assets,€366 million of prior year purchase allocation on real estate assets has been written off on disposal ofthe related assets;
Š TIM Acquisition of Minority Interest in 2005: due to the accounting treatment described above for theTIM acquisition, the price allocation resulted in the recognition of a reduction of goodwill due to theallocation of the purchase price to the fair value of the Group’s share of identifiable intangible assetsacquired and an increase in amortization of €529 million for the year;
Š tax effect on reconciling items: in 2005 the additional tax benefit of €558 million recorded for U.S.GAAP related mainly to the additional amortization and depreciation expense recorded for intangibleand tangible assets described above;
Š discontinued operations/assets held for sale: an additional net loss of €175 million in 2005 wasrecorded under U.S. GAAP almost entirely relating to the disposal of the subsidiaries Entel Chile andTIM Perù. Such disposals led to the reversal to the statement of income of the cumulative translationadjustments which under IFRS first time adoption were recognized only from January 1, 2004.
Equity attributable to equity holders of the Parent
Equity, attributable to equity holders of the Parent, under IFRS was €25,662 million at December 31, 2005,compared to €44,631 million for U.S. GAAP. The overall impact of the U.S. GAAP adjustments was to increaseEquity attributable to equity holders of the Parent by €18,969 million. The most significant items affecting thisincrease are as follows:
Š business combinations prior to the adoption of IFRS: as explained above in more detail, U.S. GAAPrequires that the assets and liabilities purchased be recorded at fair value for all business combinations. Asa result, these transactions gave rise to classes of assets, in particular tangible and intangible assets, thatare being amortized, as well as goodwill. The application of this accounting treatment resulted in anincrease of €22,592 million of the equity (gross of minority interests and taxes) as of December 31, 2005;
Š TIM Acquisition of Minority Interest in 2005: as explained above in more detail, under U.S. GAAP,which requires the application of the purchase method and step acquisition accounting, the priceallocation resulted in the recognition of a reduction of goodwill due to the allocation of the purchaseprice to the fair value of the Group’s share of identifiable intangible assets acquired and an increase inamortization for the year. Such accounting treatment resulted in an increase of €3,075 million of theequity (gross of minority interests and taxes) as of December 31, 2005;
Š rationalization of the Group’s Internet operations: as described in Note 3 of the Notes to the 2006Consolidated Financial Statements included elsewhere herein, under IFRS, the acquisition in 2005 of theInternet business from Telecom Italia Media was treated as a transaction among shareholders, and the
154

Item 5. Operating And Financial Review And Prospects Consolidated Financial Statements As Of And For The Three Year PeriodEnded December 31, 2006—Reconciliation Of IFRS To U.S. GAAP
difference between the price paid and the share of the underlying net assets acquired (€364 million)was included as a movement of equity. Under U.S. GAAP, the acquisition has been accounted for underthe purchase method and the excess of the purchase price over the share of net assets acquired wasallocated to brand name, customer list and other intangibles for a total amount of approximately€285 million and to goodwill for approximately €83 million. Such different accounting treatmentresulted in an increase of €346 million of the equity (gross of minority interests and taxes) as ofDecember 31, 2005;
Š capitalization of interest: as a result of the treatment of capitalized interest, under U.S. GAAP therewas an increase of €752 million of the equity (gross of Minority Interests and taxes) as of December 31,2005, a large part of the interest capitalized prior to 2004 relates to the UMTS license of TIM which wasput into use in 2004 and on which amortization expense has been calculated commencing in 2004;
Š deferred taxes on tax-suspension equity reserves: under IFRS, IAS 12 “Income taxes”, allows, undercertain conditions, not to record deferred income taxes on tax suspension equity reserves, whereas,under U.S. GAAP, SFAS 109 “Accounting for Income Taxes” provides that deferred taxes, in any case,shall be provided. Such different accounting treatment resulted in an increase in deferred tax liabilityand consequently a decrease of €257 million of equity as of December 31, 2005;
Š tax effect on reconciling items: these effects resulted in a decrease of €7,694 million in equity (grossof minority interests) as of December 31, 2005, and mainly relate to additional tangible and intangibleassets (excluding goodwill) arising from the above business combinations.
Total liabilities under IFRS were €69,025 million versus €77,327 million (excluding minority interests) for U.S.GAAP. In particular, excluding financial liabilities relating to discontinued operations/assets held for sale,non-current financial liabilities were €43,065 million under U.S. GAAP at the end of 2005, versus €42,146 millionunder IFRS, with an increase of €919 million under U.S. GAAP. Such increase mainly arose from:
Š the different accounting treatment of some aspects of real estate transactions entered into by theTelecom Italia Group, mainly in previous years. Under IFRS, such transactions have been recorded inaccordance with the finance method, except for the land element which, in absence of a contractualpurchase option or passage of title to Telecom Italia, was treated as operating lease. Such accountingtreatment was also followed under U.S. GAAP except for the land element which, when less than 25% ofthe fair value of the property, was treated as finance lease with an additional increase in debt. Theadditional debt amounts to €575 million;
Š the application of the purchase accounting method to the Old Telecom Italia Acquisition under U.S.GAAP, which led to the valuation of liabilities at fair values and an increase of debt of €259 million.
5.8.3 YEAR ENDED DECEMBER 31, 2004
Net income attributable to equity holders of the Parent
Under IFRS, Net income attributable to equity holders of the Parent was €1,815 million in 2004, compared to netincome of €1,541 million under U.S. GAAP. The decrease in net income under U.S. GAAP of €274 million is largelyattributable to certain of the transactions as well as the application of certain of the U.S. GAAP accountingprinciples described above which resulted in material adjustments to the IFRS results. The most significant itemsaffecting the 2004 results are as follows:
Š business combinations prior to the adoption of IFRS: as a result of the o the accounting treatmentdescribed above under 5.8.1 Year Ended December 31, 2006, there was an increase in depreciation andamortization expense for the year of €978 million;
Š reversal of goodwill impairment: to evaluate and account for impairments of depreciable assets orassets to be disposed of, the Group follows the guidance provided in SFAS 144, “Accounting for theImpairment or Disposal of Long-Lived Assets” which provides, in particular, that carrying values shall befirstly compared with undiscounted cash flows.
Furthermore, to test for impairment goodwill is allocated, under IFRS, at the date of acquisition, to eachcash-generating units or groups of cash-generating units which are expected to benefit from theacquisition. Allocation is made to the lowest level at which goodwill is monitored for management
155
Item 5. Operating And Financial Review And Prospects Consolidated Financial Statements As Of And For The Three Year PeriodEnded December 31, 2006—Reconciliation Of IFRS To U.S. GAAP
purposes, which is never at a higher level than that of the business segments determined in accordancewith IAS 14 “Segment Reporting”. Under U.S. GAAP, the Group ceased amortizing goodwill onJanuary 1, 2002, upon the adoption of SFAS 142, “Goodwill and Other Intangible Assets”, whereasunder IFRS first time adoption the Group ceased amortizing goodwill on January 1, 2004.
As explained in more detail in Note 46.1 of the Notes to the Consolidated Financial Statements, inaccordance with SFAS 142, the first step in the test for impairment of goodwill is to identify potentialimpairment by comparing the fair value of a “reporting unit” (which encompasses a wider meaning than“cash generating unit” adopted by IFRS) with its carrying amount, including goodwill. If the carryingamount of a reporting unit exceeds its fair value, the second step of the goodwill impairment test isperformed to measure the amount of the loss, if any. The second part compares the implied value of thereporting unit’s goodwill to the carrying amount of that goodwill. The excess of the carrying value overthe implied value is then written-off in the period. Implied value of goodwill is determined in the samemanner as the amount of goodwill recognized in a business combination.
As a result, certain impairment losses recorded under IFRS were deemed not necessary under U.S.GAAP and therefore have been reversed to the statement of income with a positive effect on income of€438 million;
Š tax effect on reconciling items: in 2004 the additional tax benefit of €334 million recorded for U.S.GAAP related mainly to the additional amortization and depreciation expense recorded for intangibleand tangible assets described above in connection with the above business combinations andacquisitions;
Š minority interests on reconciling items: the negative impact on income in accordance with U.S. GAAPof €186 million relates mainly to the reversal of goodwill impairment as above and to other minor U.S.GAAP adjustments.
156

Item 5. Operating And Financial Review And Prospects Cautionary Statement For Purposes Of The “Safe Harbor” ProvisionsOf The United States Private Securities Litigation Reform Act Of 1995
5.9 CAUTIONARY STATEMENT FOR PURPOSES OF THE “SAFE HARBOR” PROVISIONS OF THE UNITEDSTATES PRIVATE SECURITIES LITIGATION REFORM ACT OF 1995
The Private Securities Litigation Reform Act of 1995 provides a “safe harbor” for forward-looking statements. Theforegoing discussion in “Item 5. Operating and Financial Review and Prospects” and the following discussionunder “Item 5.10. Quantitative and Qualitative Disclosures About Market Risks” contain forward-lookingstatements. Forward-looking statements are statements that are not historical facts and can be identified by theuse of forward-looking terminology such as “believes,” “may,” “is expected to,” “will,” “will continue,” “should,”“seeks” or “anticipates” or similar expressions or the negative thereof or other comparable terminology, or by theforward-looking nature of discussions of strategy, plans or intentions.
The following important factors could cause our actual results to differ materially from those projected or impliedin any forward-looking statements:
Š the continuing impact of increased competition in a liberalized market, including competition fromlonger established domestic competitors and global and regional alliances formed by othertelecommunications operators in our core Italian domestic fixed-line and wireless markets;
Š our ability to introduce new services to stimulate increased usage of our fixed and wireless networks tooffset declines in the traditional fixed-line voice business due to the continuing impact of regulatoryrequired price reductions, market share loss, pricing pressures generally and shifts in usage patterns;
Š the level of demand for telecommunications services, particularly wireless telecommunications services inthe maturing Italian market and for new higher value added products and services such as broadband;
Š our ability to achieve the planned synergies expected to be generated by the convergence between fixedtelephony, mobile, broadband internet and media content including in expenses, capital expendituresand capacity to launch new convergent services;
Š the success of our customer loyalty and retention programs and the impact of such programs on ourrevenues;
Š our ability to successfully implement our Internet and broadband strategy both in Italy and abroad;
Š our ability to successfully achieve our debt reduction targets;
Š the impact of regulatory decisions and changes in the regulatory environment in Italy and othercountries in which we operate;
Š the impact of economic development generally on our international business and on our foreigninvestments and capital expenditures;
Š the continuing impact of rapid or “disruptive” changes in technologies;
Š the impact of political and economic developments in Italy and other countries in which we operate;
Š the impact of fluctuations in currency exchange and interest rates;
Š our ability to successfully implement our strategy over the 2007-2009 period;
Š our ability to achieve the expected return on the investments and capital expenditures we have madeand continue to make in Brazil on mobile and in Europe on broadband;
Š our ability to successfully strengthen our business and exploit new adjacent markets, such as Pay-TVand IT services;
Š the amount and timing of any future impairment charges for our licenses, goodwill or other assets;
Š the outcome of litigation, disputes and investigations in which we are involved or may become involved;and
Š decreased mobile communications usage arising from actual or perceived health risks or other problemsrelating to mobile handsets or transmission masts.
The foregoing factors should not be construed as exhaustive. Due to such uncertainties and risks, readers arecautioned not to place undue reliance on such forward-looking statements, which speak only as of the date hereof.We undertake no obligation to release publicly the result of any revisions to these forward-looking statements whichmay be made to reflect events or circumstances after the date hereof, including, without limitation, changes in ourbusiness or acquisition strategy or planned capital expenditures, or to reflect the occurrence of unanticipated events.
157

Item 5. Operating And Financial Review And Prospects Quantitative And Qualitative Disclosures About Market Risks
5.10 QUANTITATIVE AND QUALITATIVE DISCLOSURES ABOUT MARKET RISKS
The following discussion should be read in conjunction with the “Note 2—Accounting Policies”, “Note 4—Financial Risk management”, “Note 24—Financial Instruments” and “Note 48—Additional U.S. GAAPDisclosures” of the Notes to the Consolidated Financial Statements included elsewhere in this Annual Report.
Derivative financial instruments are used by the Telecom Italia Group to manage its exposure to foreign exchangerate and interest rate risks and to diversify the parameters of debt so that costs and volatility can be reduced towithin prefixed operational limits.
Derivative financial instruments at December 31, 2006 are principally used by the Group for the management ofits debt positions. They include interest rate swaps (IRS) to reduce interest rate exposure on fixed-rate andfloating-rate bank loans and bonds and cross currency and interest rate swaps (CCIRS) and currency forwards toconvert the loans secured in different foreign currencies to the functional currencies of the various companies ofthe Group.
IRSs involve, at specified maturity dates, the exchange of flows of interest calculated on the notional amount atthe agreed fixed or floating rates, with the counterparts.
The same also applies to CCIRSs which, in addition to the settlement of periodic interest flows, can involve theexchange of principal, in the respective currencies of denomination, at maturity and, if necessary, at another date.
Although a small number of derivatives have not been designated for hedge accounting treatment under FAS 133and IAS 39, such derivatives are related to an underlying liability in all cases, therefore providing an economichedge despite the accounting designation and treatment (please see “—5.10.3—Financial Instruments”).Consequently management believes that Telecom Italia’s use of derivatives is not speculative.
5.10.1 DEBT POLICY
Telecom Italia Group’s debt used to support the financing of its domestic and international businesses contains anelement of market risk from changes in interest and currency rates. With respect to interest rates applicable tomedium and long-term debt, Telecom Italia Group’s policy is to utilize a defined ratio of floating rate and fixedrate debt with a different range of maturities. Telecom Italia Group’s policy is intended to optimize the cost offunding/risk exposure mix, utilizing as providers of funds domestic and international capital markets andsupranational agencies such as the European Investment Bank. Telecom Italia Group policies address the use offinancial derivatives, including the approval of counterparties and the investment of excess liquidity. Thesepolicies are intended to minimize financial risks and obtain more favorable terms from the counterparts. Inaddition, Telecom Italia has a centralized treasury that provides financial assistance to its subsidiaries worldwideand usually operates as the Telecom Italia Group’s main banker, allocating resources according to needs. Thecentralized treasury also gives support in negotiating credit lines and financial operations in general.
The table below sets forth, for the periods indicated, the aggregate nominal amount of total long-term financialliabilities (including current portion and leases payable/long rent and excluding discontinued operations/assetsheld for sale) due in each year through 2011 and thereafter.
Amounts due in the year ended December 31, Total as ofDecember 31,
20062007 2008 2009 2010 2011 Thereafter(millions of Euro)
Fixed Rate financial liabilities . . . . . . . . . . . . . . 3,310 1,864 3,992 3,728 2,875 15,005 30,774Floating Rate financial liabilities . . . . . . . . . . . 533 2,594 247 1,734 1,733 6,752 13,593
Total . . . . . . . . . . . . . . . . . . . . . . . . . . . . . . . . . . . . . . 3,843 4,458 4,239 5,462 4,608 21,757 44,367
As of December 31, 2006, the fair value of such outstanding debt amounted to approximately €44,716 million.The financial debt’s market value is estimated on the basis of the present value as of December 31, 2006 of thefuture cash flows.
158

Item 5. Operating And Financial Review And Prospects Quantitative And Qualitative Disclosures About Market Risks
The table below sets forth, for the periods indicated, the aggregate nominal amount of long-term debtoutstanding at December 31, 2006 (excluding current portion of long-term debt and leases payable/long rent)and the average interest rate, broken down into fixed and floating.
Amounts due in the year ended December 31,2007 2008 2009 2010 2011 2012 Thereafter
(millions of Euro, except percentages)Long-Term Fixed Rate Debt . . . . . . . . . . . . . . 19,922 18,235 14,497 13,896 11,127 8,863 6,484Average Fixed Rate . . . . . . . . . . . . . . . . . . . . . . 5.71% 5.70% 5.63% 5.81% 5.64% 5.38% 5.20%Long-Term Floating Rate Debt Swapped
into Fixed Rate Debt . . . . . . . . . . . . . . . . . . 5,742 5,742 5,632 2,632 2,632 132 132Average Swapped into Fixed Rate . . . . . . . . 3.39% 3.39% 3.36% 3.69% 3.69% 4.21% 4.21%Average Total Fixed Rate . . . . . . . . . . . . . . . . 5.31% 5.15% 4.99% 5.47% 5.27% 5.36% 5.18%
Total Fixed Rate Debt . . . . . . . . . . . . . . . . . 25,664 23,977 20,129 16,528 13,759 8,995 6,616
Long-Term Floating Rate Debt . . . . . . . . . . . 5,354 3,531 3,309 3,082 1,943 1,831 1,253Average Floating Rate . . . . . . . . . . . . . . . . . . . 4.66% 4.65% 4.17% 4.05% 4.20% 3.93% 3.75%Long-Term Fixed Rate Debt Swapped
into Floating Rate Debt . . . . . . . . . . . . . . . 7,659 6,897 6,884 5,391 4,809 4,801 4,799Average Swapped into Floating Rate . . . . . 3.65% 3.48% 3.46% 3.59% 3.65% 3.64% 3.64%Average Total Floating Rate . . . . . . . . . . . . . 4.07% 3.88% 3.69% 3.76% 3.81% 3.72% 3.66%
Total Floating Rate Debt . . . . . . . . . . . . . . 13,013 10,428 10,193 8,473 6,752 6,632 6,052
Total Long-Term Debt . . . . . . . . . . . . . . . . 38,677 34,405 30,322 25,001 20,511 15,627 12,668
As of December 31, 2006, approximately 68% of Telecom Italia Group’s long-term debt was denominated in Euro,while the remainder, €13,043 million, was denominated in foreign currencies primarily U.S.$, Pound Sterling,Brazilian Reais and Japanese Yen. After taking into account the Company’s derivative financial instruments, theCompany’s long-term debt is not materially exposed to fluctuations in foreign exchange rates. At December 31,2006, approximately 30% of the long-term debt (including current portion) carried a floating rate.
5.10.2 MARKET RISK POLICY
Telecom Italia Group’s policies regarding market risk consist of the following:
Š the Finance Department advises on the maximum level of interest rate risk to which the Telecom ItaliaGroup should be exposed, to an internal committee which meets on a regular basis in order to monitorthe activities and the level and value of the current market risk exposures; the Centralized Treasury,operating as a service center, within the Finance Department supplies financial services and activelysupports our subsidiaries according to their requirements and local circumstances;
Š we use derivative financial instruments to manage these financial market risks, and have establishedpolicies to handle and mitigate the adverse effects of these exposures; and
Š we continually evaluate the credit quality of counterparties to minimize the risk of non-performance.The counterparties to derivative contracts are generally highly rated banks and financial institutions andsuch counterparties are continually monitored in order to minimize the risk of non-performance.
For further details, please see “Note 4—Financial Risk Management” of the Notes to the Consolidated FinancialStatements included elsewhere in this Annual Report.
5.10.3 FINANCIAL INSTRUMENTS
❖ INTEREST RATE AND FOREIGN EXCHANGE RISK MANAGEMENT
We have established a set of guidelines in order to manage financial risks. In particular, an internal committeemonitors exposure to market risks (both interest rate and foreign exchange risk), the use of financial derivativesfor the management of those risks and credit risks. Counterparties in derivatives are banks and financialinstitutions having generally a rating not less than “A-” assigned by Standard & Poor’s or an equivalent levelassigned by other agencies, which is constantly monitored in order to minimize credit risk.
159

Item 5. Operating And Financial Review And Prospects Quantitative And Qualitative Disclosures About Market Risks
We seek to diversify and minimize interest rate exposure of our operating and financing activities throughportfolio diversification and, according to the evaluation of our exposures, selectively enter into derivativesinstruments. Since our corporate objective is pursued through our commercial operations, i.e., the sale oftelecommunications and media services, foreign exchange exposures are normally hedged, provided the riskswould affect our cash flows.
The Telecom Italia Group is exposed to market risks as a result of changes in interest rates and exchange rates inthe markets in which it operates or is present with bond issues, mainly Europe, the United States, Great Britainand Latin America.
The risk management policies of the Telecom Italia Group aim to diversify market risks and minimize interest rateexposure by suitable portfolio diversification, which is also implemented by using carefully selected derivativefinancial instruments.
The Group defines an optimum fixed-rate and floating-rate debt composition and uses derivative financialinstruments to achieve that prefixed composition. Taking into account the Group’s operations in various sectors,in terms of risk, volatility and the amount of expected operating cash flows, the optimum blend of medium/long-term non-current financial liabilities has been established at 70% for the fixed-rate component and 30% for thefloating-rate component.
The Group mainly uses derivative financial instruments to manage market risks:
Š Interest Rate Swaps (IRS) are used to modify the profile of the original exposure to interest rate riskson loans and bonds, whether fixed or floating;
Š Cross Currency and Interest Rate Swaps (CCIRS) and Currency Forwards are used to convert loans andbonds issues in currencies other than the euro—principally in U.S. dollars and British pounds—to thefunctional currencies of the operating companies.
As a result of the above policies, at December 31, 2006, the exchange rate risk on the financial payables assumedby the Group denominated in currencies other than Euro is completely hedged.
To determine the market value of the financial derivatives, we use various pricing models. The market value ofIRS and of CCIRS reflects the difference between the fixed rate to be paid/received and the interest rate (havingthe same expiration date as the swap) assessed on the basis of the market environment on the evaluation date.With regard to IRS the principal amount is not exchanged between the parties and therefore does not constitute ameasure of exposure to credit risk, which is instead limited to the amount of interest or interest differentials to bereceived or paid at the interest payment date.
The market value of CCIRS also depends on the difference between the reference foreign exchange rate on theagreement date and the foreign exchange rate on the valuation date, since generally CCIRS involve the exchangeof principal in the respective currencies of denomination at maturity and, if necessary, at another date, in additionto the settlement of periodic interest flows.
160

Item 5. Operating And Financial Review And Prospects Quantitative And Qualitative Disclosures About Market Risks
❖ Telecom Italia Group Derivative Instruments
As of December 31, 2006 the total notional amount of our derivative instruments amounted to €22,252 million, ofwhich €21,880 million related to derivative instruments on debt positions and €372 million related to derivativeinstruments on financial assets and on short-term treasury operations, as detailed in the following table:
Type of derivative Hedged RiskNotionalamount
Mark toMarket Spot(Clean Price)
as ofDecember 31,
2006(millions of Euro)
Interest Rate Swaps . . . . . . . . . . . . . . . . . . . . . . . Interest Rate Risk — —Cross Currency and Interest Rate Swaps . . . Interest Rate Risk and Foreign
Currency Exchange Rate Risk 8,623 (787)
Fair Value Hedge Derivatives . . . . . . . . . . . . . . . . . . . . . . . . . . . . . . . . . . . . . . . . . . . . . . . . . . . . 8,623 (787)Interest Rate Swaps . . . . . . . . . . . . . . . . . . . . . . . Interest Rate Risk 4,230 102Cross Currency and Interest Rate Swaps . . . Interest Rate Risk and Foreign
Currency Exchange Rate Risk 6,119 (538)Forward and Forex Options . . . . . . . . . . . . . . . . . Foreign Currency Exchange Rate Risk — —
Cash Flow Hedge Derivatives . . . . . . . . . . . . . . . . . . . . . . . . . . . . . . . . . . . . . . . . . . . . . . . . . . . . 10,349 (436)Interest Rate Swaps . . . . . . . . . . . . . . . . . . . . . . . Interest Rate Risk 2,878 5Cross Currency and Interest Rate Swaps . . . Interest Rate Risk and Foreign
Currency Exchange Rate Risk 30 1
Non-Hedge Accounting Derivatives . . . . . . . . . . . . . . . . . . . . . . . . . . . . . . . . . . . . . . . . . . . . . 2,908 6Total Derivative Instruments on Debt
Positions . . . . . . . . . . . . . . . . . . . . . . . . . . . . . . . . . . . . . . . . . . . . . . . . . . . . . . . . . . . . . . . . . . . . . . . (a) 21,880 (1,217)Commodity Swaps . . . . . . . . . . . . . . . . . . . . . . . . . Commodity Risk 89 (6)Forward and Forex Options . . . . . . . . . . . . . . . . . Foreign Currency Exchange Rate Risk 5 —
Cash Flow Hedge Derivatives . . . . . . . . . . . . . . . . . . . . . . . . . . . . . . . . . . . . . . . . . . . . . . . . . . . . 94 (6)Currency Forwards . . . . . . . . . . . . . . . . . . . . . . . . . Foreign Currency Exchange Rate Risk 278 —
Non-Hedge Accounting Derivatives . . . . . . . . . . . . . . . . . . . . . . . . . . . . . . . . . . . . . . . . . . . . . 278 —Derivative Instruments on Financial Assets and on Short-term Treasury
Operations . . . . . . . . . . . . . . . . . . . . . . . . . . . . . . . . . . . . . . . . . . . . . . . . . . . . . . . . . . . . . . . . . . . . . (b) 372 (6)
Total Telecom Italia Group Derivatives . . . . . . . . . . . . . . . . . . . . . . . . . . . . . . . . . . . . . . . . . (a+b) 22,252 (1,223)
Š DERIVATIVE INSTRUMENTS ON DEBT POSITIONS
The following tables give a description of our financial derivative contracts outstanding as of December 31, 2006,to manage the debt positions. The notional amount is net of compounded derivatives. Whenever a derivative isset up on another derivative, the notional amount is reported once and the net effect of the two compoundedderivatives is considered.
Notionalamount at
12/31/2006
Market valueof derivatives at
12/31/2006(a)
Market valueof underlying
debt positions at12/31/2006
(b)
Market valueof debt
includingrelated
derivatives at12/31/2006
(c)=(b-a)
Market valueof
derivatives at12/31/2005
(millions of Euro)Interest rate swaps and interest rate
options . . . . . . . . . . . . . . . . . . . . . . . . . . . . 7,108 107 7,108 7,001 6Cross-currency and interest rate
swaps . . . . . . . . . . . . . . . . . . . . . . . . . . . . . 14,772 (1,324) 13,497 14,821 (468)
Total . . . . . . . . . . . . . . . . . . . . . . . . . . . . . . . . 21,880 (*)(1,217) 20,605 21,822 (*)(462)
(*) Most of the market value of derivatives is attributable to the currency exchange variations which are offset by the currency exchangevariations on the underlying position.
161

Item 5. Operating And Financial Review And Prospects Quantitative And Qualitative Disclosures About Market Risks
As of December 31, 2006, derivative instruments on debt positions are classified as follows by maturity:
2007 2008 2009 2010 2011 Thereafter Total
Market value ofunderlying debt
position at12/31/2006
(millions of Euro)Derivatives on Debt Positions . . . . . . . . . . . . 4,346 851 110 5,593 1,597 9,383 21,880 20,605
The following tables set forth a description of our financial derivative contracts outstanding as of December 31,2006, used to hedge debt positions.
INTEREST RATE SWAPS
At December 31, 2006, Telecom Italia Group companies had IRS relating to financial liabilities recorded in thefinancial statements, for total principal equal to the notional amount of €7,108 million. Details of such contractsare set forth in the table below.
Maturities
Interest Rate Derivatives 2007 2008 2009 2010 2011 Thereafter TotalMark toMarket
(millions of Euro)EUR Interest Rate SwapsReceive variable, pay fixedAmount . . . . . . . . . . . . . . . . . . . . . . . . 2,798 110 3,000 120 6,028 99Average pay rate . . . . . . . . . . . . . . . . . 3.91% 3.35% 3.09% 4.16%Average receive rate . . . . . . . . . . . . . . 6M Euribor 3M Euribor
+ 60 bps6M Euribor 3M Euribor
+ 66 bpsAmount . . . . . . . . . . . . . . . . . . . . . . . . 1,000 1,000 5Average pay rate . . . . . . . . . . . . . . . . . 4.54%Average receive rate . . . . . . . . . . . . . . 3M Euribor
+53 bps
Sub-total . . . . . . . . . . . . . . . . . . . . . . 2,798 — 110 4,000 — 120 7,028 104
EUR Interest Rate SwapsReceive variable, pay variableAmount . . . . . . . . . . . . . . . . . . . . . . . . 22 22 0Average pay rate . . . . . . . . . . . . . . . . . 6M Euribor
– 3 bpsAverage receive rate . . . . . . . . . . . . . . Rendiob,
Bot,Rendistato (1)
Reais Interest Rate SwapsReceive fixed, pay variableAmount . . . . . . . . . . . . . . . . . . . . . . . . 14 13 10 9 7 5 58 3Average pay rate . . . . . . . . . . . . . . . . . 74% 73.7% 73.7% 73.6% 73.6% 72%
CDI (2) CDI (2) CDI (2) CDI (2) CDI (2) CDI (2)Average receive rate . . . . . . . . . . . . . . 11.30% 11.30% 11.30% 11.30% 11.30% 11.30%
Total . . . . . . . . . . . . . . . . . . . . . . . . . . 2,834 13 120 4,009 7 125 7,108 107
(1) Rolint, Robot, Rendint and Rendiob are customary domestic Italian parameters for medium / long term debt.
(2) The CDI is the customary domestic Brazilian measure of overnight interest rate. As of December 31, 2006 this rate was around 13.17%.
For a further discussion of interest rate swaps see “Note 4, Financial Risk Management” of our Notes to ourConsolidated Financial Statements included elsewhere in this Annual Report.
162

Item 5. Operating And Financial Review And Prospects Quantitative And Qualitative Disclosures About Market Risks
Cross-Currency And Interest Rate Swaps And Currency Forwards
At December 31, 2006, Telecom Italia Group companies had CCIRS contracts relating to financial liabilitiesrecorded in the financial statements, for total principal equal to a notional amount of €14,772 million. Details ofsuch contracts are set forth in the table below. References to “JPY” are to Japanese Yen and “BRL” to BrazilianReal.
Maturities
Foreign Exchange Derivatives 2007 2008 2009 2010 2011 Thereafter TotalMark toMarket
(millions of Euro)
CCIRSReceive fixed USD, pay variable EuroAmount . . . . . . . . . . . . . . . . . . . . . . . . . . . . . . . . 850 1,014 593 1,817 4,274 (421)Average pay rate . . . . . . . . . . . . . . . . . . . . . . . . . 3M Euribor
+53 bps6M Euribor
+41 bps6M Euribor
+71 bps6M Euribor
+83 bpsAverage receive rate . . . . . . . . . . . . . . . . . . . . . . 4.0% 4.0% 6.2% 5.4%Amount . . . . . . . . . . . . . . . . . . . . . . . . . . . . . . . . 579 1,156 1,735 (194)Average pay rate . . . . . . . . . . . . . . . . . . . . . . . . . 6M Euribor
+55 bps6M Euribor
+75 bpsAverage receive rate . . . . . . . . . . . . . . . . . . . . . . 4.88% 5.25%
Sub-total . . . . . . . . . . . . . . . . . . . . . . . . . . . . . . — 850 — 1,593 593 2,973 6,009 (615)
Receive fixed USD, pay fixed EuroAmount . . . . . . . . . . . . . . . . . . . . . . . . . . . . . . . . 791 791 (22)Average pay rate . . . . . . . . . . . . . . . . . . . . . . . . . 5.88%Average receive rate . . . . . . . . . . . . . . . . . . . . . . 7.2%
Amount . . . . . . . . . . . . . . . . . . . . . . . . . . . . . . . . 849 849 (202)Average pay rate . . . . . . . . . . . . . . . . . . . . . . . . . 6.00%Average receive rate . . . . . . . . . . . . . . . . . . . . . . 6.38%
Amount . . . . . . . . . . . . . . . . . . . . . . . . . . . . . . . . 1,709 1,709 (267)Average pay rate . . . . . . . . . . . . . . . . . . . . . . . . . 5.04%Average receive rate . . . . . . . . . . . . . . . . . . . . . . 5.25%
Sub-total . . . . . . . . . . . . . . . . . . . . . . . . . . . . . . — — — — — 3,349 3,349 (491)
Receive dual currency (fixed USD rate, JPYprincipal at maturity), pay fixed Euro
Amount . . . . . . . . . . . . . . . . . . . . . . . . . . . . . . . . 174 174 (72)Average pay rate . . . . . . . . . . . . . . . . . . . . . . . . . 6.94%Average receive rate . . . . . . . . . . . . . . . . . . . . . . 5.00%
Receive fixed Yen, pay variable EuroAmount . . . . . . . . . . . . . . . . . . . . . . . . . . . . . . . . 171 171 (80)Average pay rate . . . . . . . . . . . . . . . . . . . . . . . . . 6M Euribor
+ 246 bpsAverage receive rate . . . . . . . . . . . . . . . . . . . . . . 3.55%
Receive variable USD, pay variable EuroAmount . . . . . . . . . . . . . . . . . . . . . . . . . . . . . . . . 150 333 483 (43)Average pay rate . . . . . . . . . . . . . . . . . . . . . . . . . 3M Euribor
-4 bps6M Euribor
+ 56 bpsAverage receive rate . . . . . . . . . . . . . . . . . . . . . . 3M USD
Libor- 7 bps
3M USDLibor
+ 48 bps
Amount . . . . . . . . . . . . . . . . . . . . . . . . . . . . . . . . 671 671 (26)Average pay rate . . . . . . . . . . . . . . . . . . . . . . . . . 6M Euribor
+ 71 bpsAverage receive rate . . . . . . . . . . . . . . . . . . . . . . 3M USD
Libor+ 61 bps
Sub-total . . . . . . . . . . . . . . . . . . . . . . . . . . . . . . 150 — — — 1,004 — 1,154 (69)
163

Item 5. Operating And Financial Review And Prospects Quantitative And Qualitative Disclosures About Market Risks
Maturities
Foreign Exchange Derivatives 2007 2008 2009 2010 2011 Thereafter TotalMark toMarket
(millions of Euro)CCIRSReceive fixed GBP, pay variable EuroAmount . . . . . . . . . . . . . . . . . . . . . . . . . . . . . . . . . . 685 685 (15)Average pay rate . . . . . . . . . . . . . . . . . . . . . . . . . . . 6M Euribor
+67 bpsAverage receive rate . . . . . . . . . . . . . . . . . . . . . . . . 6.375%Amount . . . . . . . . . . . . . . . . . . . . . . . . . . . . . . . . . . 604 604 (8)Average pay rate . . . . . . . . . . . . . . . . . . . . . . . . . . . 3M Euribor
+73 bpsAverage receive rate . . . . . . . . . . . . . . . . . . . . . . . . 6.375%
Sub-total . . . . . . . . . . . . . . . . . . . . . . . . . . . . . . . . 1,289 — — — — — 1,289 (23)
Receive fixed GBP, pay fixed EuroAmount . . . . . . . . . . . . . . . . . . . . . . . . . . . . . . . . . . 751 751 13Average pay rate . . . . . . . . . . . . . . . . . . . . . . . . . . . 4.34%Average receive rate . . . . . . . . . . . . . . . . . . . . . . . . 5.63%
Amount . . . . . . . . . . . . . . . . . . . . . . . . . . . . . . . . . . 587 587 (3)Average pay rate . . . . . . . . . . . . . . . . . . . . . . . . . . . 5.53%Average receive rate . . . . . . . . . . . . . . . . . . . . . . . . 5.88%
Amount . . . . . . . . . . . . . . . . . . . . . . . . . . . . . . . . . . 1,258 1,258 15Average pay rate . . . . . . . . . . . . . . . . . . . . . . . . . . . 5.31%Average receive rate . . . . . . . . . . . . . . . . . . . . . . . . 6.38%
Sub-total . . . . . . . . . . . . . . . . . . . . . . . . . . . . . . . . — — — — — 2,596 2,596 25
Receive fixed USD, pay variable BRLAmount . . . . . . . . . . . . . . . . . . . . . . . . . . . . . . . . . . 23 1 24 1Average pay rate . . . . . . . . . . . . . . . . . . . . . . . . . . . 115.2% 128.3%
CDI (1) CDI (1)Average receive rate . . . . . . . . . . . . . . . . . . . . . . . . Exchange rate
variation +5.8% spread
Exchange ratevariation +
8.4% spread
Receive fixed JPY, pay variable BRLAmount . . . . . . . . . . . . . . . . . . . . . . . . . . . . . . . . . . 6 6 0Average pay rate . . . . . . . . . . . . . . . . . . . . . . . . . . . 109%
CDI (1)Average receive rate . . . . . . . . . . . . . . . . . . . . . . . . Exchange rate
variation +0.1% spread
Total . . . . . . . . . . . . . . . . . . . . . . . . . . . . . . . . . . . . 1,468 851 — 1,593 1,597 9,263 14,772 (1,324)
(1) The CDI is the customary domestic Brazilian measure of overnight interest rate. As of December 31, 2006 this rate was around 13.17%.
164

Item 5. Operating And Financial Review And Prospects Quantitative And Qualitative Disclosures About Market Risks
Š DERIVATIVE INSTRUMENTS ON FINANCIAL ASSETS AND ON SHORT-TERM TREASURY OPERATIONS
The Telecom Italia Group also entered into derivative contracts to manage the interest rate and foreign currencyrisk on treasury operations for a nominal amount of approximately €372 million.
Description
Equivalentnotionalamount(millionsof Euro)
Non Hedge AccountingCommodity Swaps (Telecom Italia S.p.A.) . . . . . . . . . . . . . . . . . . . . . . . . . . . . . . . . . . . . . . . . . . . . . . . . . . . . . . . . . . . . 89Forward and Forex Options (Telecom Media News S.p.A.) . . . . . . . . . . . . . . . . . . . . . . . . . . . . . . . . . . . . . . . . . . . . . 5Currency Forward transactions (Telecom Italia Finance S.A.). . . . . . . . . . . . . . . . . . . . . . . . . . . . . . . . . . . . . . . . . . 186Currency Forward transactions (Telecom Italia S.p.A.). . . . . . . . . . . . . . . . . . . . . . . . . . . . . . . . . . . . . . . . . . . . . . . . . 37Currency Forward transactions (Telecom Italia Capital S.A.). . . . . . . . . . . . . . . . . . . . . . . . . . . . . . . . . . . . . . . . . . . 6Currency Forward transactions (Telecom Italia Sparkle S.p.A.) . . . . . . . . . . . . . . . . . . . . . . . . . . . . . . . . . . . . . . . . 43Currency Forward transactions (Olivetti S.p.A.) . . . . . . . . . . . . . . . . . . . . . . . . . . . . . . . . . . . . . . . . . . . . . . . . . . . . . . . 6
Total . . . . . . . . . . . . . . . . . . . . . . . . . . . . . . . . . . . . . . . . . . . . . . . . . . . . . . . . . . . . . . . . . . . . . . . . . . . . . . . . . . . . . . . . . . . . . . . . 372
The market value of derivatives on financial assets and short-term treasury operations as of December 31, 2006was a net loss of approximately €6 million compared to a net loss of €11 million as of December 31, 2005. Themarket value of short-term treasury operations has been measured by discounting at December 31, 2006, foreach transaction, the product between (i) the amount purchased/sold and (ii) the difference between thecontractual exchange rate and the forward exchange rate as of December 31, 2006 having the same maturitydate.
For a further discussion of derivative instruments on financial assets and on short-term treasury operations see“Note 4, Financial Risk Management”, of our Notes to our Consolidated Financial Statements included elsewherein this Annual Report.
165

Item 6. Directors, Senior Management and Employees Directors
Item 6. DIRECTORS, SENIOR MANAGEMENT AND EMPLOYEES
6.1 DIRECTORS
The shareholders’ meeting held on May 6, 2004 established that the Board of Directors of Telecom Italia S.p.A. becomposed of 19 members and appointed the Board of Directors of Telecom Italia S.p.A. for the three years endingupon the approval of the financial statements for the year ended December 31, 2006. The shareholders’ meetingheld on April 7, 2005 then revised the number of members of the Board of Directors to 21 and appointed MarcoDe Benedetti and Enzo Grilli as directors to complement the original Board.
The shareholders’ meeting held on April 13, 2006 appointed Diana Bracco and Vittorio Merloni as directorsfollowing the resignations of Marco De Benedetti and Giovanni Consorte.
On September 15, 2006, Marco Tronchetti Provera submitted his resignation as Chairman and director of theBoard. On the same day, the Board of Directors appointed Guido Rossi as Chairman while Carlo Orazio Buora (thenCEO) was appointed Executive Deputy Chairman and the post of CEO held by Riccardo Ruggiero remainedunchanged.
In October 2006, Enzo Grilli passed away and on April 6, 2007 Guido Rossi resigned as Chairman of the Board ofDirectors and as a director, without the Board of Directors appointing new directors to replace them.
The shareholders’ meeting held on April 16, 2007 established that the Board of Directors of Telecom Italia S.p.A.be composed of 19 members and appointed the Board of Directors of Telecom Italia S.p.A. for a one year periodending upon the approval of the financial statements for the year ended December 31, 2007.
On April 17, 2007, the Board of Directors of Telecom Italia S.p.A. appointed Pasquale Pistorio as Chairman andconfirmed Carlo Orazio Buora as Executive Deputy Chairman and Riccardo Ruggiero as Chief Executive Officer.
The following are the members of the Board of Directors of Telecom Italia as of June 13, 2007.
Name Age Position Appointed
Pasquale Pistorio . . . . . . . . . . . . . . . . . . . . . . . . . . . . . . . 71 Chairman . . . . . . . . . . . . . . . . . . . . . . . . . . . . . . . . . 2004Carlo Orazio Buora . . . . . . . . . . . . . . . . . . . . . . . . . . . . . 61 Executive Deputy Chairman . . . . . . . . . . . . . . . 2003Riccardo Ruggiero . . . . . . . . . . . . . . . . . . . . . . . . . . . . . . 46 Chief Executive Officer . . . . . . . . . . . . . . . . . . . . 2003Paolo Baratta(1) . . . . . . . . . . . . . . . . . . . . . . . . . . . . . . . . 67 Director . . . . . . . . . . . . . . . . . . . . . . . . . . . . . . . . . . . 2004Gilberto Benetton . . . . . . . . . . . . . . . . . . . . . . . . . . . . . . 65 Director . . . . . . . . . . . . . . . . . . . . . . . . . . . . . . . . . . . 2003Diana Bracco(1) . . . . . . . . . . . . . . . . . . . . . . . . . . . . . . . . 65 Director . . . . . . . . . . . . . . . . . . . . . . . . . . . . . . . . . . . 2006Stefano Cao(1) . . . . . . . . . . . . . . . . . . . . . . . . . . . . . . . . . 55 Director . . . . . . . . . . . . . . . . . . . . . . . . . . . . . . . . . . . 2007Renzo Capra(1) . . . . . . . . . . . . . . . . . . . . . . . . . . . . . . . . 77 Director . . . . . . . . . . . . . . . . . . . . . . . . . . . . . . . . . . . 2007Claudio De Conto . . . . . . . . . . . . . . . . . . . . . . . . . . . . . . 44 Director . . . . . . . . . . . . . . . . . . . . . . . . . . . . . . . . . . . 2007Domenico De Sole(1) . . . . . . . . . . . . . . . . . . . . . . . . . . . 63 Director . . . . . . . . . . . . . . . . . . . . . . . . . . . . . . . . . . . 2004Luigi Fausti(1) . . . . . . . . . . . . . . . . . . . . . . . . . . . . . . . . . 78 Director . . . . . . . . . . . . . . . . . . . . . . . . . . . . . . . . . . . 2003Jean Paul Fitoussi(1) . . . . . . . . . . . . . . . . . . . . . . . . . . . 64 Director . . . . . . . . . . . . . . . . . . . . . . . . . . . . . . . . . . . 2004Luciano Gobbi . . . . . . . . . . . . . . . . . . . . . . . . . . . . . . . . . . 54 Director . . . . . . . . . . . . . . . . . . . . . . . . . . . . . . . . . . . 2007Aldo Minucci . . . . . . . . . . . . . . . . . . . . . . . . . . . . . . . . . . . 60 Director . . . . . . . . . . . . . . . . . . . . . . . . . . . . . . . . . . . 2007Gianni Mion . . . . . . . . . . . . . . . . . . . . . . . . . . . . . . . . . . . . 63 Director . . . . . . . . . . . . . . . . . . . . . . . . . . . . . . . . . . . 2003Renato Pagliaro . . . . . . . . . . . . . . . . . . . . . . . . . . . . . . . . 50 Director . . . . . . . . . . . . . . . . . . . . . . . . . . . . . . . . . . . 2004Carlo Alessandro Puri Negri . . . . . . . . . . . . . . . . . . . . 54 Director . . . . . . . . . . . . . . . . . . . . . . . . . . . . . . . . . . . 2003Cesare Giovanni Vecchio(1) . . . . . . . . . . . . . . . . . . . . 45 Director . . . . . . . . . . . . . . . . . . . . . . . . . . . . . . . . . . . 2007Luigi Zingales(1) . . . . . . . . . . . . . . . . . . . . . . . . . . . . . . . 44 Director . . . . . . . . . . . . . . . . . . . . . . . . . . . . . . . . . . . 2007
(1) Independent Directors. For details on the criteria applied to determine independence, see “Item 10. Additional Information—10.1Corporate Governance—10.1.2 General—Board of Directors—Independent Directors”.
As of June 13, 2007, the Secretary of the Board of Directors was the General Counsel of Telecom Italia, FrancescoUmile Chiappetta.
In 2006:
Š the Board of Directors met eight times, with such meetings generally scheduled pursuant to a timetableset forth in advance;
166

Item 6. Directors, Senior Management and Employees Directors
Š the Internal Control and Corporate Governance Committee (Guido Ferrarini—Chairman, FrancescoDenozza, Domenico De Sole and Marco Onado) held 15 meetings. The Committee meetings arenormally attended by the Chairman of the Board of Auditors or by another auditor it designates; wheredeemed desirable in light of the issues on the agenda, the Committee and the Board of Auditors haveheld joint meetings;
Š the Remuneration Committee (Luigi Fausti—Chairman, Pasquale Pistorio and Paolo Baratta) met 5times;
Š the Strategy Committee (the Chairman of the Board, the Executive Deputy Chairman Carlo Orazio Buora,and Directors Domenico De Sole, Marco Onado and Pasquale Pistorio) met 3 times.
In 2006 the Chairman of the Internal Control and Corporate Governance Committee (Guido Ferrarini) acted asLead Independent Director.
For a detailed description of Telecom Italia’s corporate governance, including activities, responsibilities andorganization of the Board of Directors and the Committees, see “Item 10. Additional Information—10.1Corporate Governance”.
6.1.1 BIOGRAPHICAL DATA
The following are the selected biographical data of the Directors.
Pasquale Pistorio: Pasquale Pistorio was born in Agira (Enna), in 1936. Mr. Pistorio has been a Director ofTelecom Italia since May 6, 2004. He was appointed Chairman of Telecom Italia S.p.A. on April 17, 2007. PasqualePistorio spent the first 17 years of his career at Motorola before taking the helm of ltaly’s SGS Microelettronica in1980. In May 1987, SGS and France’s Thomson Semiconducteurs merged to create SGS-THOMSONMicroelectronics, now ST Microelectronics N.V.. Under Pasquale Pistorio’s guidance, ST Microelectronicsestablished itself as a broad range manufacturer and rose through the world semiconductor ranks from number15 in 1987 to one of the top five companies in the industry. In the last 25 years, Pasquale Pistorio haschampioned the cause of Europe’s mìcroelectronics industry and has been on the Board of MEDEA+ andChairman of the European Union’s Technology Platform (ENIAC). He has also been a firm advocate of corporatesocial responsibility, especially in the environmental field, for ethical and social reasons, as well as his convictionthat environmentally friendly companies are more competitive. He has been a member of the United Nations TaskForce dedicated to bridging the Digital Divide. Since May 2004 Pasquale Pistorio was called to take the position ofDeputy Chairman for Research and Innovation of Confindustria, the Confederation of Italian Industrialists and inthis role he is a staunch advocate of research as a top priority for the political agenda of the country. He is also aDirector of the Boards of Fiat Group and Chartered Semiconductors (Singapore). Throughout his career PasqualePistorio has received numerous awards and honors for his achievements. Upon his retirement as President andCEO of ST Microelectronics N.V. on March 18, 2005, Pistorio was appointed Honorary Chairman of the Company.
Carlo Orazio Buora: Carlo Orazio Buora was born in Milan, in 1946. Mr. Buora has been Executive DeputyChairman of Telecom Italia S.p.A. since September 15, 2006 and from November 2001 to April 2007 ManagingDirector. He began working in finance with the BNL group. Afterwards he became head of Finance andAdministration at Merloni Finanziaria and Chief Financial Officer at Snia Viscosa. In 1984 he joined the Fiat group.In 1989 he was appointed Deputy General Manager of Telettra and subsequently General Manager of the Benettongroup, a position he held until 1991. In November 1991 he joined the Pirelli group as central manager for financeand administration and was appointed General Manager in 1992. In 1999 he became a general partner of Pirelli &C. S.a.p.a. and in 2001 was appointed Managing Director of Pirelli & C. S.p.A. Upon his appointment as ExecutiveDeputy Chairman at Telecom Italia, in November 2006, Mr. Buora relinquished all of his positions in the Pirelligroup. Mr. Buora is also a Director of Mediobanca S.p.A. and is a Board member of the European OncologyInstitute. Since January 2004, he has been Deputy Chairman of F.C. Internazionale S.p.A..
Riccardo Ruggiero: Riccardo Ruggiero was born in Naples, in 1960. Since October 1, 2001 Mr. Ruggiero hasbeen Head of the Telecom Italia Group Wireline Business Unit. On May 7, 2002 he was appointed GeneralManager of Telecom Italia and on September 5, 2002 he was appointed Chief Executive Officer. He began hiscareer in 1986 as sales manager of Fininvest S.p.A.. Between 1988 and 1990 he was sales and marketing managerof the Italian branch of AT&T. In 1990 he joined the Olivetti group, where he held various positions: in 1992 hewas appointed Vice President of Organizzazione Oliservice, with responsibility for international clients and the
167

Item 6. Directors, Senior Management and Employees Directors
commercial development of telecommunications services worldwide, and in 1994 of Olivetti Telemedia, withresponsibility for commercial development and market expansion. In 1996 he was appointed Managing Director ofInfostrada S.p.A. (with responsibility for the market, infrastructure and personnel functions) and was laterappointed Managing Director of Italia On Line. In July 2001, Mr. Ruggiero joined the Telecom Italia Group asHead of the Telecom France Business Unit, responsible for managing and developing Telecom Italia Group’sbusiness on the French market. Mr. Ruggiero has been Director of Safilo group S.p.A. since October 24, 2005.
Paolo Baratta: Paolo Baratta was born in Milan in 1939. Mr. Baratta has been a Director of Telecom Italia sinceMay 6, 2004. In 1967 he began doing economic research at the Associazione per lo sviluppo dell’industria nelMezzogiorno (Svimez) in Rome. In 1979 he became a Director of the Istituto per il Credito alle Imprese diPubblica Utilità (ICIPU) and then Deputy Chairman. From 1980 to 1992 he was Chairman of ICIPU, Consorzio diCredito per le Opere Pubbliche (CREDIOP), Deputy Chairman of Nuovo Banco Ambrosiano (later BancoAmbrosiano Veneto) and the Italian Bankers’ Association (ABI). In addition to being a Director of variouscompanies, he was Chairman of the Centro Beneduce per gli Studi in Campo Bancario e Assicurativo. In 1993 hebecame Minister for Privatizations with responsibility for the reorganization of the system of state holdings. In1993-94 he was Minister for Foreign Trade and Minister for Industry ad interim. In 1995-96 he was Minister forPublic Works and Minister for the Environment. From 1997 to 2000 he was chairman of Bankers’ Trust S.p.A. andfrom 1998 to 2000 Chairman of the Biennale di Venezia. He is a member of the Società Italiana degli Economistiand currently is Chairman of the Comitato Venezia Internazionale, the Centro per la Proprietà Intellettuale diVenezia and the Fondazione Lorenzo Valla. He is also a Director of Edizione Holding S.p.A., Svimez-Roma, theFondo per l’Ambiente Italiano (FAI).
Gilberto Benetton: Gilberto Benetton was born in Treviso, in 1941. Mr. Benetton has been a Director ofTelecom Italia since September 27, 2001. He began his activity in 1965 with his siblings Giuliana, Luciano andCarlo. The Benetton group is active in 120 countries. Mr. Benetton is also Deputy Chairman of Olimpia S.p.A,Chairman of Edizione Holding S.p.A. and Sintonia S.p.A., Autogrill S.p.A., Ragione S.a.p.a., Verde Sport S.p.A.,Deputy Chairman of Fondazione Benetton, Director of Benetton group S.p.A., Pirelli & C. S.p.A., MediobancaS.p.A., Schemaventotto S.p.A., Lloyd Adriatico S.p.A., Autostrade S.p.A. and Aldeasa S.A..
Diana Bracco: Diana Bracco was born in Milan, in 1941. Mrs. Bracco has been a Director of Telecom Italia sinceApril 13, 2006. Graduated with a Degree in Chemistry from the University of Pavia where, in 2001, she wasawarded an Honorary Degree in Pharmaceutical Science. Mrs. Bracco is currently Chairman and Managing Directorof Bracco S.p.A.; Managing Director of Centro Diagnostico Italiano S.p.A.; Director of Humanitas S.p.A., CNR(National Research Council) and Assonime (Association for Italy’s Limited Liability Companies). She is alsoPresident of Assolombarda (Association of Firms in the Province of Milan), member of the General Council ofConfindustria (Confederation of Italian Industry), member of the President’s Committee and past President ofFederchimica (Italian Federation of the Chemical Industry), and Confindustria’s Mai Foundation for Research. Shewas awarded the honorific title of Cavaliere del Lavoro in 2002; has an honorary degree in medicine from theUniversità Cattolica del Sacro Cuore in Rome.
Stefano Cao: Stefano Cao was born in Rome, in 1951. Mr. Cao has been a Director of Telecom Italia sinceApril 16, 2007. He graduated in Mechanical Engineering. Employed by the Eni group on December 1, 1976.Manager of the Eni group since October 1, 1983. Employed by Saipem in 1976, working until 1982 in the SeaPlatforms business as Field Engineer and Site Manager. Involved in various overseas postings from 1982 to 1986:Project Manager in England, Branch Manager in Denmark, Operation Manager for offshore activities in the NorthSea. Recalled to headquarters in 1986 to coordinate the Engineering activities and in 1988 was appointed DeputyGeneral Manager—Sea Platforms Business, a position held until 1993 when he assumed the position of GeneralManager—Marketing and Technical Activities. After nomination as Managing Director—Operations in 1996 andhaving taken on, in 1998, the position of Managing Director—Production and Marketing, in 1999 he has beenappointed for the Chairmanship of Saipem. In 2000 he has been appointed General Manager of Eni S.p.A.—Exploration and Production Division. From 2001 to 2003 he was President of Agip International B.V. and of AgipExploration B.V., a sub holding of the overseas sector of the Exploration and Production Division. From May 2002to 2006 he was President of Assomineraria (Italian Association for the Mining and Petroleum Industries). FromMay 2004 to 2006 he was President of Eni Corporate University.
Renzo Capra: Renzo Capra was born in Ponte dell’Olio (Piacenza), in 1929. Mr. Capra has been a Director ofTelecom Italia since April 16, 2007. He graduated in Electro Technical Industrial Engineering at Milan Polytechnic,and from 1956 until the end of 1964 he worked at ANIC S.p.A., and on the SNAM PROGETTI in the plants ofRavenna and Gela. In 1965 he was employed by the Azienda Servizi Municipalizzati of Brescia (Brescia Municipal
168
Item 6. Directors, Senior Management and Employees Directors
Utilities) as Energy Services Director; from 1979 until 1995 he was the General Manager; in 1995 he becamePresident of ASM Brescia, which became a Public Limited Company in July 1998 and which was listed on the MilanStock Exchange in July 2002. From 1968 until 1973 he collaborated in the “Electrical Power Station” teachingcourse at Milan Polytechnic; in 1973 he moved to the University of Brescia. From December 2002 until December2006 he was President of the Istituto di Economia delle Fonti di Energia (IEFE) at Milan’s Bocconi University. He isa member of the FederUtility Presidential Committee, Vice-President of CISPEL Lombardy, and Chairman of theFEDERAMBIENTE Board of Auditors. Since July 2006 he has represented Italy as President of CEDEC (BusinessConfederation of local European electricity and gas distributors), whose headquarters are in Brussels.
Claudio De Conto: Claudio De Conto was born in Milan, in 1962. Mr. De Conto has been a Director of TelecomItalia since April 16, 2007. He graduated in Business Economics in 1986 at the Luigi Bocconi CommercialUniversity of Milan. After graduation he joined Ernst & Whinney in England. In 1988 he joined the Pirelli group.After 5 years working in the group’s Treasury Office, in 1993 he undertook a long international experience in theareas of Administration, Finance and Control of the group subsidiaries in the Tyres Sector in Brazil, Spain andGermany. In particular, between 1996 and 2000 he was employed as CFO of Pirelli Neumaticos S.A. (Spain) andsubsequently CFO of Pirelli Deutschland A.G. (Germany). In 2000 he became Manager of Administration, Planningand Control of Pirelli S.p.A. In 2001 he was appointed General Manager—Administration and Control of PirelliS.p.A., a position he maintained in the Parent Company Pirelli & C. S.p.A. after the merger with Pirelli S.p.A. inAugust 2003. From November 2006 he is General Manager of Operations of Pirelli & C. S.p.A. Within the Pirelligroup, his responsibilities are: Chairman of the Board of Directors of Pirelli Broadband Solutions S.p.A. and ofCentro Servizi Amministrativi Pirelli S.r.l; Director of Pirelli Tyre S.p.A., Pirelli & C. Real Estate S.p.A., Pirelli &C. Ambiente S.p.A., Pirelli Labs S.p.A., Pirelli Servizi Finanziari S.p.A. and Pirelli International Limited. He is also amember of the Supervisory Board of Pirelli Deutschland Gmbh. He is also a Director of Rcs MediaGroup S.p.A.,Emittenti Titoli S.p.A. and Efibanca Palladio Finanziaria SGR. Since 2002 he has been a member of theInternational Financial Reporting Interpretation Committee (IFRIC) institute within the International AccountingStandards Board (IASB).
Domenico De Sole: Domenico De Sole was born in Rome in 1944. Mr. De Sole has been a Director of TelecomItalia since May 6, 2004. In 1970 he moved to the United States, where he became a partner with the law firm ofPatton, Boggs & Blow. In 1984 he joined the Gucci group as Managing Director of Gucci America Inc. and in 1995he became Managing Director for the entire Gucci group as President and Managing Director of Gucci group N.V.until April 2004. During this period Gucci group was listed on the New York and Amsterdam stock exchanges(1995), beat off a hostile takeover bid (1999), acquired Yves Saint Laurent, Sanofi Beauteé and Sergio Rossi in1999, Boucheron, Alexander McQueen and Bedat & Co in 2000 and Bottega Veneta, Stella McCartney andBalenciaga in 2001. Mr. De Sole is a Director of Delta Airlines (member of Finance and Governance Committees),of Bausch & Lomb (member of the Audit Committee), Gap Inc. (member of the Audit Committee) andErmenegildo Zegna S.p.A.. He is a member of the Advisory Board of the Harvard Law School.
Luigi Fausti: Luigi Fausti was born in Ancona, in 1929. Mr. Fausti has been a Director of Telecom Italia sinceNovember 7, 2001. He is also Director of Monrif S.p.A., of Poligrafici Editoriale S.p.A. di Bologna, of MediasetS.p.A. and Chairman of Patrimonio Immobiliare dello Stato S.p.A.. Mr. Fausti began his career in 1947 in BancaCommerciale Italiana where he was Executive Officer and General Director of several branches and subsequentlybecame Managing Director of the bank in 1990, Vice-Chairman and Managing Director in 1994, Chairman in 1997and Honorary Chairman in 1999. He received an “honoris causa” economics degree from Naples University.
Jean Paul Fitoussi: Jean-Paul Fitoussi was born in La Goulette (Tunisia) in 1942. Mr. Fitoussi has been aDirector of Telecom Italia since May 6, 2004. Mr. Fitoussi is Professor of Economics at the Institut d’ÉtudesPolitiques in Paris, where has taught since 1982 and whose Scientific Committee he now chairs. He is currentlyPresident of the Observatoire Français des Conjonctures Economiques (OFCE), an economic research andforecasting institute. Mr. Fitoussi graduated cum laude in Law and Economics from the University of Strasbourgwith a thesis on inflation, equilibrium and unemployment. He began his academic career as an assistant professorat the University of Strasbourg. Between 1979 and 1983 he taught at the European University Institute, Florence,and in 1984 was visiting professor at the University of California, Los Angeles. Since 1998 he has been a memberof the board of the École Normale Supérieure. In 1997 he became a member of the Prime Minister’s Council forEconomic Analysis. In 1996 he was named to the Commission Économique de la Nation. He was secretary of theInternational Economic Association beginning in 1984 and has been an expert for the Economic and MonetaryCommittee of the European Parliament. Between 1990 and 1993 he was Chairman of the Economic Council of the
169

Item 6. Directors, Senior Management and Employees Directors
European Bank for Reconstruction and Development. In the field of publishing, Mr. Fitoussi is managing editor ofthe Revue et Lettre de L’OFCE and serves on the scientific committee of the Revue Française d’Economie, theeditorial board of Labour and of The International Journal of Development Planning Literature, and the scientificcommittee of International Labour Review and Critique Internationale. His writing appears regularly innewspapers in France and abroad and he is commentator for La Repubblica and Le Monde. Since 2002 he hasbeen Director of the Fondation Nationale des Sciences Politiques. In the field of research, Mr. Fitoussi hasconcentrated on inflation theory, unemployment, foreign trade and the role of macroeconomic policy. Aspresident of the OFCE and founder of its International Economic Policy Group (of which he is a member), he hasmade numerous contributions to the current economic policy debate, particularly on the issues of economicintegration and transition.
Luciano Gobbi: Luciano Gobbi was born in Piacenza, in 1953. Mr. Gobbi has been a Director of Telecom Italiasince April 16, 2007. He graduated in Nuclear Engineering in 1977 at the Milan Polytechnic. In 1978 he took aMasters in Business Administration at the Luigi Bocconi Commercial University of Milan. He graduated inArchitecture in 1983 at the Milan Polytechnic. In 1978 he joined The Chase Manhattan Bank, where he worked asa Credit Analyst and subsequently as Senior Banker in London, Milan and Rome. In 1986 he joined the Pirelligroup as Corporate Finance Director. In 2000 he became General Manager—Finance, a position he maintained inthe parent company Pirelli & C. S.p.A. after the merger with Pirelli S.p.A. in August 2003. Since November 2006 hehas been General Manager—Finance and Strategic Planning for Pirelli & C. S.p.A.. Within the Pirelli group he alsoholds the position of Director of Pirelli Tyre S.p.A. and Pirelli Labs S.p.A.. He has been a Director of Olimpia S.p.A.since 2001.
Aldo Minucci: Aldo Minucci was born in Reggio Calabria, in 1946. Mr. Minucci has been a Director of Telecom Italiasince April 16, 2007. After graduating in Law, in 1972 he was employed by Assicurazioni Generali S.p.A., working in theFiscal Advice Service, for which he became Manager in 1983. In 1993 he was appointed Central Executive Officer withresponsibility for the Administration and Financial Coordination Service, and supervision of the Fiscal Advice Service. In1995 he took on the role of Vice Chief Executive Officer—Technical-Commercial Coordination for the InsuranceCompanies in Italy, and is Supervisor of the Group’s Internal Audit Service. Mr. Minucci is Director of AlleanzaAssicurazione S.p.A., Director of the Banca Generali S.p.A., Chairman of GENERTEL S.p.A., Director of AC.E.GA.S. S.p.A.,Chairman of SIMGENIA S.p.A., Director of Generali Servizi Amministrativi S.p.A., Director of Intesa Previdenza SIMS.p.A., Director of Intesa Vita S.p.A., Director of La Venezia Assicurazioni S.p.A., Director of Gemina S.p.A., Director ofToro S.p.A., Deputy Chairman of Nuova Tirrena S.p.A., Director of INA Assitalia S.p.A., Director of FATA Vita S.p.A. andDirector of FATA Assicurazioni Danni S.p.A..
Gianni Mion: Gianni Mion was born in Vó (Padova), in 1943. Mr. Mion has been a Director of Telecom Italiasince November 7, 2001. He is currently Managing Director of Edizione Holding S.p.A. (holding company of theBenetton family) and Sintonia S.p.A. (appointed in March 2007). He is also Director of Benetton group S.p.A.,Autogrill S.p.A., ADR Aeroporti di Roma S.p.A., 21-Investimenti, Autostrade S.p.A., Cartiere Burgo S.p.A.,Luxottica group S.p.A., Olimpia S.p.A. and Fondazione Cassa di Risparmio di Venezia. Mr. Mion is a RegisteredAuditor.
Renato Pagliaro: Renato Pagliaro was born in Milan in 1957. Mr. Pagliaro has been a Director of Telecom Italiasince May 6, 2004. A registered auditor, he joined Mediobanca—Banca di Credito Finanziario S.p.A. in 1981,where he has held positions of increasing responsibility. In April 2003 he was appointed Co-General Manager andSecretary to the Board of Directors of Mediobanca S.p.A.. Mr. Pagliaro is a Director and member of the ExecutiveCommittee of RCS Mediagroup S.p.A., Compass S.p.A. and Cartiere Burgo S.p.A.. He is also a Director ofSelmaBipiemme Leasing S.p.A. and Cofactor S.p.A.. Since 1993 he has been a member of the Board of Auditors ofIstituto Europeo di Oncologia S.r.l..
Carlo Alessandro Puri Negri: Carlo Alessandro Puri Negri was born in Genoa, in 1952. Mr. Puri Negri has beena Director of Telecom Italia since November 7, 2001. Mr. Puri Negri is also Director of Aon Italia S.p.A., OlimpiaS.p.A. and Pirelli Tyre S.p.A.. He is Deputy Chairman and Managing Director of Pirelli & C. Real Estate S.p.A.,Deputy Chairman of Camfin S.p.A. and Pirelli & C. S.p.A.. He is Chairman of Pirelli & C. Ambiente S.p.A.. Since2003 Mr. Puri Negri has been a Director of Istituto Europeo di Oncologia S.r.l. and a member of Real Estate Int.Advisory Board of Harvard University. Since 2004 Mr. Puri Negri is also Director of Fondazione Cerba andAssoimmobiliare (real estate industrial association in Italy).
170
Item 6. Directors, Senior Management and Employees Directors
Cesare Giovanni Vecchio: Cesare Giovanni Vecchio was born in Pavia, in 1962. Mr. Vecchio has been aDirector of Telecom Italia since April 16, 2007. Lawyer and official accounts auditor. Mr. Vecchio graduated withProf. Giulio Tremonti, he was an associate of his firm for nearly ten years. In 1977, after having practiced aslawyer also with Studio Chiomenti in Milan, he has been a partner of Freshfields Bruckhaus Deringer, which herecently left to take on a partnership at Delfino & Associati Willkie Farr & Gallagher. Author of numerous fiscal andfinancial publications (some published by “Sole 24 Ore”), he is considered a specialist in structured finance andcompany acquisitions, assisting leading Italian and international banks and financial institutions. He currentlyholds the Chairmanship of the Board of Directors of Fingruppo Holding S.p.A. and he is Director of Sorin S.p.A..
Luigi Zingales: Luigi Zingales was born in Padova, in 1963. Mr. Zingales has been a Director of Telecom Italiasince April 16, 2007. Luigi Zingales is the Robert C. McCormack Professor of Entrepreneurship and Finance at theGraduate School of Business of the University of Chicago, where he has been a member of the faculty since 1992.Last academic year he held the prestigious Taussig Research Professorship at Harvard University. He is a facultyresearch fellow of the NBER, a research fellow of the Centre for Economic Policy Research (CEPR), a director ofthe American Finance Association, a member of the Committee on Capital Market Regulation, and of the UnitedNation Advisory Board on Microfinance. In 2003 he won the Bernacer Prize for the best European young financialeconomist. His research interests span from corporate governance to financial development, from politicaleconomy to the economic effects of culture. He has published extensively in the major economics and financialjournals. He is an editorialist for “Il Sole 24 ore” (the leading Italian economic newspaper).
171

Item 6. Directors, Senior Management and Employees Executive Officers
6.2 EXECUTIVE OFFICERS
As of June 13, 2007, the executive officers of Telecom Italia and their respective ages, positions and year ofappointment as executive officers were as follows:
Name Age Position Appointed
Directors:Pasquale Pistorio . . . . . . . . . . . . . . . . . . . . . . . . . . . . . . . 71 Chairman . . . . . . . . . . . . . . . . . . . . . . . . . . . . . . . . . 2007Carlo Orazio Buora . . . . . . . . . . . . . . . . . . . . . . . . . . . . . 61 Executive Deputy Chairman . . . . . . . . . . . . . . . 2001Riccardo Ruggiero . . . . . . . . . . . . . . . . . . . . . . . . . . . . . . 46 Chief Executive Officer . . . . . . . . . . . . . . . . . . . . 2002
General Manager of Telecom Italia . . . . . . . . 2002
Managers:Paolo Annunziato . . . . . . . . . . . . . . . . . . . . . . . . . . . . . . 46 Head of Public Affairs Function . . . . . . . . . . . . 2007Filippo Bettini . . . . . . . . . . . . . . . . . . . . . . . . . . . . . . . . . . 46 Head of Strategy Function . . . . . . . . . . . . . . . . . 2007Gustavo Bracco . . . . . . . . . . . . . . . . . . . . . . . . . . . . . . . . 59 Head of Human Resources Organization
and Security Function . . . . . . . . . . . . . . . . . . . 2006Antonio Campo Dall’Orto . . . . . . . . . . . . . . . . . . . . . . . 43 Chief Executive
Officer of Telecom Italia Media . . . . . . . . . . . . 2007Massimo Castelli . . . . . . . . . . . . . . . . . . . . . . . . . . . . . . . 47 General Manager of Telecom Italia
Head of Domestic Fixed ServicesDepartment . . . . . . . . . . . . . . . . . . . . . . . . . . . . 2006
Francesco Chiappetta . . . . . . . . . . . . . . . . . . . . . . . . . . 46 General CounselHead of General Counsel & Corporate and
Legal Affairs Function . . . . . . . . . . . . . . . . . . . 2006Luca Luciani . . . . . . . . . . . . . . . . . . . . . . . . . . . . . . . . . . . . 39 General Manager of Telecom Italia
Head of Domestic Mobile ServicesDepartment . . . . . . . . . . . . . . . . . . . . . . . . . . . . 2006
Enrico Parazzini . . . . . . . . . . . . . . . . . . . . . . . . . . . . . . . . 63 General Manager of Telecom ItaliaHead of Finance, Administration and
Control FunctionChairman of Telecom Italia Media . . . . . . . . . 2006
Stefano Pileri . . . . . . . . . . . . . . . . . . . . . . . . . . . . . . . . . . 51 General Manager of Telecom ItaliaHead of Technology Department . . . . . . . . . . . 2006
Germanio Spreafico . . . . . . . . . . . . . . . . . . . . . . . . . . . . 54 Head of Purchasing Function . . . . . . . . . . . . . . 2006Gianpaolo Zambeletti . . . . . . . . . . . . . . . . . . . . . . . . . . 66 Head of International Affairs Function . . . . . 2006
The following are the selected biographical data of the executive officers, other than Directors:
For the biographical data of Mr. Pasquale Pistorio, Mr. Buora and Mr. Ruggiero, please see above under “—6.1Directors”.
Paolo Annunziato: Mr. Annunziato was born in Rome in 1961. On May 25, 2007, he became Head of PublicAffairs Department. Mr. Annunziato began his career at the World Bank and International Monetary Fund inWashington. In 1989, he moved to consulting firm A. T. Kearney in Chicago. He joined Confindustria in 1990,moving to Rome, where until 1997 he ran the “Real Economy” unit at the organization’s research center. AtConfindustria, he became Head of the Young Entrepreneurs unit, to which, in 2001, he added a role as Manager ofResearch, Innovation and the Net Economy.
Filippo Bettini: Mr. Bettini was born in Brescia, in 1960. On January, 22 2007 he became Head of Strategy,Telecom Italia Group. He began his career in 1985 at Hoffmann la Roche. Over the following six years he held variouspositions in research & development and marketing; in 1989 he was appointed Marketing Director of the Italiansubsidiary. From 1991 to 1993 he worked at Amplifon Group, as Marketirig and Sales Manager. From 1994 to 2000he managed companies focused in biomedical and biotechnological sector with a strong committment in research &development and innovation, among which the San Raffaele Biomedical Science Park and Molmed, a molecularmedicine research company. From 2001 to 2002 he took the responsibility of Pirelli Labs, the Pirelli group research &development company focused on optical and material innovation. In 2002 he joined Telecom Italia as responsibleof the Operations of Telecom Italia Lab, the group company focused on research & development and venture capitalactivities. From 2004 to 2006 he covered the position of Executive Assistant to the Chairman of Telecom Italia.
172

Item 6. Directors, Senior Management and Employees Executive Officers
Gustavo Emanuele Bracco: Mr. Bracco was born in Turin, in 1948. On October 1, 2001, he became Head ofTelecom Italia Group Human Resources. Mr. Bracco began his career at Fiat in 1972, working for the Trade UnionRelations Central Management. In 1976, he was appointed Personnel Manager at the Mirafiori factory. In 1977, hetransferred to Toro Assicurazioni as Head of Industrial Relations and Labour Disputes, under the aegis of CentralPersonnel Management. He joined the Turin Industrial Union in 1979, where he worked until 1982, initially at theResearch Office before moving to the Trade Union Service, where he rose through the ranks to the position ofHead. Between 1983 and 1987, he worked at Cinzano, Saiag and Carello, with responsibility for Personnel andExternal Relations. In 1988, he returned to the Fiat Group as Head of Personnel and Organization at the EngineControl Division. He took on the same role at CEAC in 1991 and at Fidis in 1994. He was appointed Head of GroupTrade Union Relations in 1996. In 1998, Mr. Bracco went to work in London for New Holland as Head of Personneland Organization, a position he subsequently filled in Chicago for Case-New Holland. He joined Pirelli in December2000 as Group Head of Human Resources. Mr. Bracco is Director of Telecom Italia Audit and Compliance ServicesS.c.a.r.l..
Antonio Campo Dall’Orto: Mr. Campo Dall’Orto was born in Conegliano in 1964. He was appointed GeneralManager, Television, of Telecom Italia Media in 2005. Mr. Campo Dall’Orto received a degree in Economics fromCa’ Foscari University in Venice in 1988 and a Master in Marketing and Corporate Communication from Publitalia,Milan in 1992. He started his career in 1989 where he was working for IMS Europe as Head of Industry Analysisuntil 1991. In 1992 he joined Plasmon, working in product marketing, where he was responsible for competitiveanalysis and actions from repositioning Plasmon brands in the market for dietetic and therapeutic foods. In thesame year he started working for Mediaset in Milan as Deputy Director of Canale 5 where he held this positionuntil 1996. From 1992 to 1996 Mr. Campo Dall’Orto was appointed Professor at the Communication’s Academy inMilan where he taught Competitive Analysis and Marketing. From 1997 to 1999, he worked as General Manager ofMTV Italia and in 1999 was promoted to Managing Director for MTV Southern Europe (Italy, France, Spain,Portugal, Greece) for MTV Europe. In 2001 Mr. Dall’Orto joined Telecom Italia Media as Managing Director of MTVItalia and MTV Pubblicità and as program and contents manager of TV channel La7 and in 2005 he was appointedthe General Manager Television with responsibility for the television business, based on both analogical anddigital terrestrial technology, overseeing selection and purchase of contents, management and optimization ofproduction processes as well as commercial development. Since February 2007 Mr. Campo Dall’Orto is member ofthe Board of Directors and Chief Executive Officer of Telecom Italia Media.
Massimo Castelli: Mr. Castelli was born in Rome, in 1959. On February 16, 2007, Mr Castelli was appointedGeneral Manager of Telecom Italia (Domestic Fixed Services). Mr. Castelli began his career in 1985 in OlivettiS.p.A., Commercial Division Italia, Marketing. In 1996 Mr. Castelli was appointed Vice President Marketing inInfostrada. Mr. Castelli began his career in the Telecom Italia Group on October 10, 2001, when he was appointedVice President Marketing of Wireline; in 2004 he became Executive Vice President Marketing & Sales of TIM and,on April 15, 2005, Chief Operating Officer of Tim Italia. On October 5, 2005, Mr. Castelli became Chief MarketingOfficer of Telecom Italia.
Francesco Chiappetta: Mr. Chiappetta was born in Rome, in 1960. Mr. Chiappetta was appointed TelecomItalia General Counsel on August 1, 2002 and Head of Corporate and Legal Affairs on November 25, 2005. He isalso the Secretary to the Telecom Italia Board of Directors. On January 22, 2007, he became Head of GroupFunction “General Counsel & Corporate and Legal Affairs”.Mr. Chiappetta began his career in 1983 at CONSOB, Italy’s stock market and corporate regulatory body. Over thenext ten years he held a number of positions at this organization, including Chief of the Regulation Office.Between 1998 and July 2001 he worked as Deputy General Manager for Assonime, the Association of ItalianCorporations, with responsibility for company law and capital markets. In August 2001 he joined the Pirelli &C. Group as Head of Legal and Corporate Affairs, a position he filled until joining the Telecom Italia Group. From1989 to 2006 he worked in academia, holding courses and lectures at leading Italian universities including “LaSapienza” in Rome, “Università di Roma Tre” and the “Luigi Bocconi” University in Milan. Mr. Chiappetta haswidely published both on company and securities law. At the present time he his also Chairman of the CompanyLaw Working Group of Unice (Union of Industrial and Employers’ Confederation of Europe). Since April 2005,Mr. Chiappetta is a member of the Advisory Group on Company Law and Corporate Governance, a group ofexperts established by the European Commission.
173

Item 6. Directors, Senior Management and Employees Executive Officers
Luca Luciani: Mr. Luciani was born in Padova, in 1967. On February 16, 2007 he was appointed GeneralManager of Telecom Italia (Domestic Mobile Services). Mr. Luciani began his career in Procter & Gamble in 1990;in 1994, he became Consulting Manager of Bain & Company Consulting and in 1998 Group Controller of EnelGroup. He joined the Telecom Italia Group in 1999 as Group Controller; in 2002 he was appointed Chief FinancialOfficer of TIM and, in 2003, he was appointed Executive Assistant to the Chairman of Telecom Italia. In 2004 hebecame Responsible for Marketing activities of TIM and from 2004 he was Responsible for IT and NetworkServices and coordination of International activities. In 2005, he was appointed Chief Marketing Officer of TIM.On October 5, 2005, Mr. Luciani became Responsible for the Indirect Sales channels of the Group.
Enrico Parazzini: Mr. Parazzini was born in Milan, in 1944. On February 16, 2007 he was appointed GeneralManager of Telecom Italia S.p.A. (Finance Administration and Control). Since February 7, 2007 he has beenChairman of Telecom Italia Media, maintaining also his position as Chief Financial Officer of the Telecom ItaliaGroup. Since October 1, 2001 he has been CFO of the Telecom Italia Group. After graduating in Economy andCommerce at Milan’s “Luigi Bocconi” University, he commenced his professional career in 1968 as Junior Auditorat Arthur Andersen and in 1969 changed to General Electric, where he worked in the Finance Department. In 1970he passed to Honeywell Information Systems Italia, a company where in the course of the next twenty years heheld positions of growing responsibility: Financial Planning Director from 1975 to 1980; Director of Administrationand Control from 1981 to 1986 and Chief Financial Officer from 1987 to 1990. A year later, following the disposalof Honeywell’s activities to Bull, Mr. Parazzini was appointed General Manager of Administration, Control,Information Technology Systems and Logistics. In May 1992 he joined Pirelli as Director of Planning and Control(Group Controller), and participated to the turnaround of the Group and, more particularly, to the reorganizationof the planning and control system. Between 1996 and 1999 he was in charge of Planning and Control,Administration, Group Purchases and Risk Management. In 2000 he was appointed Chief Financial Officer ofPirelli’s Cable and Systems Sector. From 1994 to 2000 he was visiting lecturer at the “Luigi Bocconi” Universityfor the course on Planning and Control in Multinational Groups; since 2002 he has been acting as Professor for theMaster in Corporate Finance at the “Luigi Bocconi” University’s Management School ( Scuola di DirezioneAziendale—SDA).
Stefano Pileri: Mr. Pileri was born in Rome, in 1955. On February 16, 2007 he was appointed General Managerof Telecom Italia (Technology). He has been in SIP (Italian Telecom Operator) since 1982 where he assumedgrowing responsibilities, during the years, in the Network Management Systems Department. From 1993 to 1994he was responsible for the Network Development and Operations in the Emilia-Romagna region, and in 1997 hebecame Responsible for Network Planning, Engineering and Marketing in the Network Division of Telecom Italia.In March 1998 he became Responsible of the Telecom Italia Wireline Network and in June 2005 he was alsoappointed Chief Technology Officer of the Telecom Italia Group, directly reporting the Chairman, with theresponsibility to drive and coordinate the fixed-mobile integration and the overall technological networkdevelopment. Mr. Pileri is Director of Italtel.
Germanio Spreafico: Mr. Spreafico was born in Lecco, in 1952. He was appointed Head of Telecom ItaliaGroup Purchasing on October 1, 2001. He began his career in 1977 at the Pirelli Financial Division, where heworked for 10 years, during which time he was promoted through various positions in domestic and internationalfinance and ultimately took charge of Italian market financial operations. Subsequent to this he moved to theCable sector, initially as Chief Financial Officer of the Italian operations, before taking on the same role in theFrench subsidiary. In 1997, he became Chief Financial Officer and board member of the Group Cable IndustryHolding Company, where he also took on the position of Chief Purchasing Officer. At the present time,Mr. Spreafico is Chairman of Telenergia S.r.l. and Olivetti Multiservices S.p.A..
Giampaolo Zambeletti: Mr. Zambeletti was born in Varese, in 1941. He was appointed Head of Telecom ItaliaGroup International Affairs on June, 2003. He began his career in 1966 in Madrid, starting the activities ofZambeletti Espana S.A., where he remained Chief Executive Officer until 1980. In the early eighties he was appointedChairman and Chief Executive Officier in Zambeletti S.p.A. parent company in Italy, which was sold then to theEnglish Beecham plc in 1984. Giampaolo Zambeletti remained in the company as Chairman and CEO until 1989,when he bought the Ellem Industria Farmaceutica from Farmitalia Carlo Erba together with the first private Frenchpharmaceutical Group. After 2001 Giampaolo Zambeletti was responsible of the sale of Spanish Auna, French NeufTelecom, Serbia Telekom, Entel Chile, Digitel Venezuela and Tim Perù. In addition to that, he had the responsibilityof some specific tasks for Telecom Italia company and alliances in Brasil, Argentina and Turkey. He is board memberof Telecom Italia International, Avea, Oger Telecom and Ojer Telekomunikasyon (Turkey).
174
Item 6. Directors, Senior Management and Employees Board Of Auditors
6.3 BOARD OF AUDITORS
The following table lists the members of the Telecom Italia Board of Auditors as of June 13, 2007, including theAlternate Auditors, with their respective positions and year of appointment. The current Telecom Italia Board ofAuditors was appointed by the shareholders’ meeting on April 13, 2006.
On April 16, 2007 the shareholders’ meeting of Telecom Italia appointed Enrico Maria Bignami as Auditor(previously he was an Alternate Auditor and as such replaced Stefano Meroi, who resigned as an Auditor onOctober 20, 2006) and Luigi Gaspari Alternate Auditor.
Name Position Appointed
Paolo GOLIA . . . . . . . . . . . . . . . . . . . . . . . . . . . . . . . . . . . . . . Chairman . . . . . . . . . . . . . . . . . . . . . . . . . . . . . . . . . . . . . . . 2006Enrico Maria BIGNAMI . . . . . . . . . . . . . . . . . . . . . . . . . . . . Auditor . . . . . . . . . . . . . . . . . . . . . . . . . . . . . . . . . . . . . . . . . 2007Salvatore SPINIELLO . . . . . . . . . . . . . . . . . . . . . . . . . . . . . . Auditor . . . . . . . . . . . . . . . . . . . . . . . . . . . . . . . . . . . . . . . . . 2006Ferdinando SUPERTI FURGA . . . . . . . . . . . . . . . . . . . . . . . Auditor . . . . . . . . . . . . . . . . . . . . . . . . . . . . . . . . . . . . . . . . . 2006Gianfranco ZANDA . . . . . . . . . . . . . . . . . . . . . . . . . . . . . . . . Auditor . . . . . . . . . . . . . . . . . . . . . . . . . . . . . . . . . . . . . . . . . 2006Luigi GASPARI . . . . . . . . . . . . . . . . . . . . . . . . . . . . . . . . . . . . Alternate Auditor . . . . . . . . . . . . . . . . . . . . . . . . . . . . . . . 2007Enrico LAGHI . . . . . . . . . . . . . . . . . . . . . . . . . . . . . . . . . . . . . Alternate Auditor . . . . . . . . . . . . . . . . . . . . . . . . . . . . . . . 2006
The positions held by the members of the Board of Auditors in other listed companies are shown below:
Paolo GOLIA . . . . . . . . . . . . . . . . . . . . . . . . . . . . . . . . . . . . . . . . . . . . —
Enrico Maria BIGNAMI . . . . . . . . . . . . . . . . . . . . . . . . . . . . . . . . . . Chairman of the Board of Auditors of BiancamanoS.p.A.
Salvatore SPINIELLO . . . . . . . . . . . . . . . . . . . . . . . . . . . . . . . . . . . Director of Fondiaria Sai S.p.A. and ImmobiliareLombarda S.p.A.; member of the board of auditors ofEdison S.p.A. and of Telecom Italia Media S.p.A.(Telecom Italia Group)
Ferdinando SUPERTI FURGA . . . . . . . . . . . . . . . . . . . . . . . . . . . . Independent director of Parmalat S.p.A.; chairman ofthe board of auditors of Arnoldo Mondadori EditoreS.p.A.; member of the board of auditors of EdisonS.p.A.
Gianfranco ZANDA . . . . . . . . . . . . . . . . . . . . . . . . . . . . . . . . . . . . . . —
For a detailed description of Telecom Italia’s corporate governance, including activities and responsibilities of theBoard of Auditors (acting as Audit Committee of the Company), see “Item 10. Additional Information—10.1Corporate Governance”.
175

Item 6. Directors, Senior Management and Employees External Auditors
6.4 EXTERNAL AUDITORS
According to Italian law, the Shareholders’ Meeting held on May 6, 2004 re-appointed Reconta Ernst & Young asthe audit firm of the Company for the three year period 2004-2006 (after a first appointment for the 2001-2003three-year period), taking into consideration the favorable opinion of the Board of Auditors. Such auditengagement came to an end with the issue of the audit report on the financial statements for the year endedDecember 31, 2006.
It should be noted that Law 262/2005 (the protection of savings law) as amended by Legislative Decree303/2006 (the “corrective” decree), amended the provisions of Legislative Decree 58/1998 (the ConsolidatedLaw on Finance) concerning the rules governing the audit of issuers and their groups. The Law 262/2005 alsofixed the total duration of audit engagements at nine years and prohibited the renewal of an engagement and theconferment of a new engagement for at least three years from the date of the end of the previous engagement.However, the transitional provision contained in Article 8.7 of Legislative Decree 303/2006 allowed companies toextend the appointment of their incumbent auditors (as of the date the Decree 303/2006 was implemented), sothat the overall duration of such engagement be equal to nine fiscal years.
The Shareholders’ Meeting held on April 16, 2007 appointed Reconta Ernst & Young to audit the annual financialstatements of Telecom Italia S.p.A., the consolidated annual financial statements of the Telecom Italia Group andthe half-yearly reports for the fiscal years 2007, 2008 and 2009.
Italian audit principles require that, in cases of corporate groups, the audit firm of Telecom Italia should carry outthe audit of the group’s most important entities in terms of the nature of operations, in such a way that it can actas the main group audit firm and express a professional evaluation of the financial statements in their entirety. Inaddition, the specific procedure set forth by Telecom Italia (the Group Procedure for the Appointment of ExternalAuditors) provides that the auditor of Telecom Italia is the principal auditor of the entire group headed byTelecom Italia and consequently is the auditor to be preferred in the conferral of appointments by subsidiaries formandatory auditing.
As a result, the Ernst & Young audit network presently is the sole audit firm for all of the companies of theTelecom Italia Group.
176

Item 6. Directors, Senior Management and Employees Employees
6.5 EMPLOYEES
6.5.1 EMPLOYEES AND CHANGES IN THE TELECOM ITALIA GROUP
The following table sets out the number of employees of the Telecom Italia Group at December 31, 2006 and2005 by Business Unit/Corporate Function:
Number of employeesas of December 31,2006 2005
Wireline . . . . . . . . . . . . . . . . . . . . . . . . . . . . . . . . . . . . . . . . . . . . . . . . . . . . . . . . . . . . . . . . . . . . . . . . . . . . . . . . . . . 55,705 56,987Domestic Mobile . . . . . . . . . . . . . . . . . . . . . . . . . . . . . . . . . . . . . . . . . . . . . . . . . . . . . . . . . . . . . . . . . . . . . . . . . . . 11,218 11,720Brazil Mobile . . . . . . . . . . . . . . . . . . . . . . . . . . . . . . . . . . . . . . . . . . . . . . . . . . . . . . . . . . . . . . . . . . . . . . . . . . . . . . . 9,531 9,043Media . . . . . . . . . . . . . . . . . . . . . . . . . . . . . . . . . . . . . . . . . . . . . . . . . . . . . . . . . . . . . . . . . . . . . . . . . . . . . . . . . . . . . . 919 886Olivetti . . . . . . . . . . . . . . . . . . . . . . . . . . . . . . . . . . . . . . . . . . . . . . . . . . . . . . . . . . . . . . . . . . . . . . . . . . . . . . . . . . . . 1,428 1,750Other activities . . . . . . . . . . . . . . . . . . . . . . . . . . . . . . . . . . . . . . . . . . . . . . . . . . . . . . . . . . . . . . . . . . . . . . . . . . . . . 4,408 5,098
Consolidated Total . . . . . . . . . . . . . . . . . . . . . . . . . . . . . . . . . . . . . . . . . . . . . . . . . . . . . . . . . . . . . . . . . . . . . . . 83,209 85,484
As of December 31, 2006, the Telecom Italia Group employed 83,209 employees (86,531 units at December 31,2005, which included 1,047 employees relating to discontinued operations/assets held for sale).
The following table summarizes the changes during 2006 relating to the number of employees:
Changes during the year
Employees atDecember 31,
2005(*) HiredTerminatedemployment
Decrease ofpersonnel with
temp workcontracts
Change inscope of
consolidationTotal
changes
Employees atDecember 31,
2006(*)
86,531 6,086 (7,127) (728) (1,553) (3,322) 83,209
(*) Include 3,382 and 2,654 personnel with temp work contracts at December 31, 2005 and 2006, respectively.
As of December 31, 2006, the Telecom Italia Group had 83,209 employees. Compared to December 31, 2005 totalemployment was lower by 3,322, mainly attributable to the following factors:
Š the hiring of 6,086 (of which 119 relating to discontinued operations/assets held for sale), thetermination of 7,127 (of which 67 relating to discontinued operations/assets held for sale), and thedecrease of 728 personnel with temp work contracts;
Š the sale of Digitel Venezuela (915), Gruppo Buffetti (183), Telecom Italia Learning Services (195),Eustema (134), Wirelab (54) and the “Radiomaritime Activities” business (72).
The following table sets out the number of employees of the Telecom Italia Group at December 31, 2006 brokendown by geographical area and function:
ExecutivesMiddle
ManagementWhitecollars
Bluecollars
Personnelwith temp
workcontracts Total
Italy . . . . . . . . . . . . . . . . . . . . . . . . . . . . . . . . . . . . . . . . . . . 1,207 4,277 61,262 431 1,646 68,823Europe (excluding Italy) . . . . . . . . . . . . . . . . . . . . . . . . 41 442 2,262 — 626 3,371Latin America . . . . . . . . . . . . . . . . . . . . . . . . . . . . . . . . . . 45 357 10,152 — 382 10,936Other countries . . . . . . . . . . . . . . . . . . . . . . . . . . . . . . . . 9 36 34 — — 79
Telecom Italia Group Total . . . . . . . . . . . . . . . . . . 1,302 5,112 73,710 431 2,654 83,209
6.5.2 INDUSTRIAL RELATIONS
Telecom Italia Group employees in Italy are represented by two categories of national unions, one for managerialstaff and another for non-managerial staff. Employment agreements in Italy are generally collectively negotiatedat the national level between the national employers’ associations and the workers’ unions and, for medium and
177
Item 6. Directors, Senior Management and Employees Employees
large companies, also at company level. Renewals of collective agreements are subject to general guidelinesagreed upon between the Italian Government, the employers’ associations and trade unions. These guidelinesestablish that salary increases negotiated at the national level should not exceed agreed upon inflation rates.Individual companies may enter into additional contracts in order to link collective bonuses t company’sproductivity or profitability.
Approximately 2% of the Group’s employees held executive positions on December 31, 2006.
Employment contracts for managerial staff are governed by a national collective agreement that expired inDecember 2003 and was renewed in November 2004. This new agreement applies through 2008.
Consistent with the agreement reached with trade unions in the 2005-2007 Industrial Plan (One Company Model)on February 27, 2006, the industrial procedure related to the merger by incorporation of Tim Italia into TelecomItalia has been accomplished. The integrated business model, representing a significant innovation in thetelecommunications market and consisting in joint management of the fixed and mobile businesses, is based ontechnological infrastructure optimization, on integrated offer to customers and on the unification of processes andresources. At the same date an agreement has been subscribed with Unions in order to harmonize differenttreatments for employees of the above mentioned companies.
Following the agreements signed on December 20, 2005 with Trade Unions (which foresaw 3,500 employeesenrolled in incentivized programs to encourage the employee to seek alternative professional developments, socalled “mobility lists”), in 2006 the Group enrolled 1,246 employees in mobility lists (using as a priorityidentification criterion the early retirement option during mobility). Consistently with such agreements signedwith Trade Unions, mobility ex lege 223/91 has been implemented on the basis of voluntary assent by theemployees involved. These have been granted, upon termination of employment, in addition to TFR (end ofemployment settlement) to ensure appropriate income for the time until eligibility for retirement pension. Moregenerally, mutually agreed employment termination has been implemented and, whenever possible, has beenachieved through professional re-employment solutions.
The Group also signed agreements with the manager’s bargaining Group on supplementary health assistance andcomplementary security for managers: on March 6, 2006 an agreement has been signed to redefine contributionsto ASSIDA (Supplementary Health Assistance Fund for Group companies senior managers), in order to oppose thegrowing unbalance between operating managers and associated retired managers; on July 19, 2006 andNovember 9, 2006 agreements have been signed to define contributions to Fontedir (Supplementary PensionFund for Telecom Italia managers), consistently with similar solutions adopted by Confindustria andFedermanager for the National Fund of the category.
178

Item 6. Directors, Senior Management and Employees Compensation Of Directors, Officers And Members Of The Board OfAuditors
6.6 COMPENSATION OF DIRECTORS, OFFICERS AND MEMBERS OF THE BOARD OF AUDITORS
6.6.1 COMPENSATION OF DIRECTORS
The total annual remuneration of the Board of Directors was established by the Company’s General Shareholders’Meeting of May 6, 2004, pursuant to article 2389, paragraph 1, of the Italian Civil Code, in the amount of€2,700,000 (amount to be divided amongst the directors in accordance with the resolutions that the Board itselfwould adopt).
The General Shareholders’ Meeting held on April 7, 2005, increased (exclusively for the second and third year ofthe Board’s mandate) the maximum total annual gross amount of the directors’ remuneration to €3,000,000,taking into account the increased size of the Board of Directors (from 19 to 21 members).
Such overall amount was distributed as follows:
Š €114,000 to each director in office;
Š an additional €63,000 to each of the members of the Internal Control and Corporate GovernanceCommittee;
Š an additional €52,000 to each of the members of the Remuneration Committee;
Š an additional €20,000 to each of the members of the Strategy Committee other than the Chairman ofthe Board and the Managing Director Carlo Orazio Buora;
Š an additional €20,000 to the director appointed to the Supervisory Panel set up under Legislative Decree231/2001 (see “Item 10. Additional Information—10.1 Corporate Governance—10.1.2 General—Boardof Directors—Internal Control System”).
The total compensation paid by Telecom Italia and by the Telecom Italia Group subsidiaries in 2006 to themembers of the Board of Directors of Telecom Italia was €13,000,000.
The General Shareholders’ Meeting held on April 16, 2007, established the maximum total annual remuneration ofthe newly appointed Board of Directors (to remain in office until the approval of 2007 account), according toarticle 2389, first paragraph, of the Italian Civil Code up to €2,800,000.00, such amount to be divided amongstthe directors in accordance with the resolution adopted by the Board itself in connection therewith.
The above mentioned overall amount will be distributed as follows, in compliance with the resolution adopted bythe Board of Directors on May 8, 2007:
Š €114,000 to each director in office;
Š an additional €70,000 to each of the members of the Internal Control and Corporate GovernanceCommittee;
Š an additional €40,000 to each of the members of the Remuneration Committee;
Š an additional €20,000 to each of the members of the Strategy Committee other than the Chairman ofthe Board, the Executive Deputy Chairman and the Managing Director Riccardo Ruggiero;
Š an additional €20,000 to the director appointed to the Supervisory Panel set up under Legislative Decree231/2001.
179

Item 6. Directors, Senior Management and Employees Compensation Of Directors, Officers And Members Of The Board OfAuditors
The following table lists the Directors who served during 2006 and their respective compensation as ofDecember 31, 2006. The compensation relates only to the period of 2006 in which they served as set forth below:
Name Position heldPeriod during which
position was heldCompensation
baseNon cashbenefits
Bonuses andother
incentivesOther
Compensations(thousands of Euro)
Guido ROSSI . . . . . . . . . . Chairman 9/16-12/31/2006 684 3Gilberto BENETTON . . . . . Deputy Chairman 1/1-12/31/2006 114Carlo Orazio BUORA . . . . . Managing Director 1/1-9/15/2006 1,471 8 1,220(1) 13(2)
Executive DeputyChairman 9/16-12/31/2006 692 12
Riccardo RUGGIERO . . . . Managing DirectorGeneral Manager 1/1-12/31/2006 829(3) 8 1,639(4) 968(5)
Paolo BARATTA . . . . . . . . Director 1/1-12/31/2006 166(6)John Robert Sotheby
BOAS . . . . . . . . . . . . . . Director 1/1-12/31/2006 114Diana BRACCO . . . . . . . . . Director 4/13-12/31/2006 85Francesco DENOZZA . . . . Director 1/1-12/31/2006 177(7)Domenico DE SOLE . . . . . Director 1/1-12/31/2006 197(8)Luigi FAUSTI . . . . . . . . . . Director 1/1-12/31/2006 166(6)Guido FERRARINI . . . . . . Director 1/1-12/31/2006 197(9)Jean Paul FITOUSSI . . . . Director 1/1-12/31/2006 114Vittorio MERLONI . . . . . . Director 4/13-12/31/2006 85Gianni MION . . . . . . . . . . Director 1/1-12/31/2006 114(10) 13(11)Massimo MORATTI . . . . . Director 1/1-12/31/2006 114Marco ONADO . . . . . . . . . Director 1/1-12/31/2006 197(8)Renato PAGLIARO . . . . . . Director 1/1-12/31/2006 114(12)Pasquale PISTORIO . . . . . Director 1/1-12/31/2006 186(13)Carlo A. PURI NEGRI . . . . Director 1/1-12/31/2006 114Luigi ROTH . . . . . . . . . . . Director 1/1-12/31/2006 114Marco TRONCHETTI
PROVERA . . . . . . . . . . . Chairman 1/1-9/15/2006 1,658 24 1,365(14)Giovanni CONSORTE . . . . Director 1/1-1/23/2006 9Enzo GRILLI . . . . . . . . . . Director 1/1-10/29/2006 95Giuseppe SALA . . . . . . . . General Manager 1/1-5/31/2006 3 1,827(15) 3,853(16)
(1) The amount includes variable remuneration ex art. 2389 paragraph 3 of the Italian Civil Code paid in 2006 since it was subject to reachinga consolidated operating income 2005 budget target, with a positive EVA change. With regard to 2007, the board of directors’ meetingheld on March 7, 2006 approved additional remuneration of €1,250,000.00 which was increased by resolution of the board of directors’meeting held on November 6, 2006 to €1,400,000.00, the payment of which, in 2007, is subject to reaching the economic and financialtargets of the Group.
(2) Remuneration ex art. 2389, paragraph 1 of the Italian Civil Code for the position of Chairman of Tim Italia S.p.A. during the period1/1-2/28/2006, not received but paid over to Telecom Italia S.p.A..
(3) Remuneration ex art. 2389, paragraph 1 of the Italian Civil Code is not paid to the individual.
(4) The amount includes remuneration paid in respect of Management By Objectives (MBO), one-off “Services” (for the contribution to thecorporate integration process), one-off “Retention” and one-off “Sundry Occasional” services.
(5) The amount includes gross compensation as an employee, remuneration ex art. 2389, paragraph 1 of the Italian Civil Code for theposition of CEO of Tim Italia S.p.A. for the period 1/1-2/28/2006 and for the position of Chairman of Telecom Italia Sparkle S.p.A. forthe period 4/1-12/31/2006, not received but paid over to Telecom Italia S.p.A..
(6) The amount includes remuneration paid as a member of the Remuneration Committee.
(7) The amount includes remuneration paid as a member of the Committee for Internal Control and Corporate Governance.
(8) The amount includes remuneration paid as a member of the Committee for Internal Control and Corporate Governance and as a memberof the Strategies Committee.
(9) The amount includes remuneration paid as a member of the Committee for Internal Control and Corporate Governance and as a memberof the Supervisory Panel under Legislative Decree 231/2001.
(10) Remuneration not received but paid over to Edizione Holding.
(11) The amount includes remuneration paid for the position of Deputy Chairman of the subsidiary Tim Italia S.p.A. from 1/1-2/28/2006, notreceived but paid over to Edizione Holding.
(12) Remuneration not received but paid over to Mediobanca.
(13) The amount includes remuneration paid as a member of the Remuneration Committee and as a member of the Strategies Committee.
180

Item 6. Directors, Senior Management and Employees Compensation Of Directors, Officers And Members Of The Board OfAuditors
(14) The amount includes variable remuneration ex art. 2389, paragraph 3 of the Italian Civil Code paid in 2006 since it was subject toreaching a consolidated operating income 2005 budget target, with a positive EVA change.
(15) The amount includes remuneration paid in respect of Management By Objectives (MBO), one-off “Services”, one-off “Substitute” MBO2006 and one-off “Retention”.
(16) The amount includes gross compensation as an employee, compensation for unused holidays and for the termination of employment withTelecom Italia S.p.A., according to the general settlement.
The following tables list the stock options held by Mr. Ruggiero. Applicable Italian law requires disclosure ofindividual compensation in the form of stock options for members of the Board of Directors and for GeneralManagers. The compensation in the form of stock options for Mr. Ruggiero was disclosed pursuant to legislativeDecree No. 58/98 in the Telecom Italia Group’s home jurisdiction Annual Report for the year ended December 31,2006. See also below “—6.7 Options to Purchase Securities from Registrant”.
Options held at thebeginning of 2006
Options grantedduring 2006
Options exercisedduring 2006
Optionsexpired
orlapsedin 2006
Options held at theend of 2006
Name
Numberof
options(*)
Averageexerciseprice(**)
Averageexpiration
date
Numberof
options
Averageexercise
price
Averageexpiration
date
Numberof
options
Averageexercise
price
Averagemarketprice
duringyear
Numberof
options
Numberof
options(*)
Averageexercise
price(**)
Averageexpiration
date
(1) (2) (3) (4) (5) (6) (7) (8) (9) (10)(11)=
1+4-7-10 (12) (13)Riccardo 750,000 3.177343 2007 — — — — — — — 750,000 3.177343 2007Ruggiero 200,000 2.788052 2010 — — — — — — — 200,000 2.788052 2010
(*) Each option corresponds to the subscription or purchase of 3.300871 Telecom Italia Ordinary Shares.(**) The average exercise price means the average subscription price of Telecom Italia Ordinary Shares deriving from the exercise of the
options.
6.6.2 COMPENSATION OF EXECUTIVE OFFICERS
The total compensation paid by the Company or by any of the Company’s subsidiaries in 2006 to the Company’sexecutive officers was €26,648,000.
The contracts with the executive officers contain the following clauses:
Š if the Company terminates the work relationship (with the exception of a termination for good cause)and the executive officer waives certain rights to which he is entitled pursuant to applicable Italian law,the Company will pay to the executive officer a separation allowance in the amount of two to four yearsof salary plus, in certain cases, a lump sum corresponding to the average bonus compensation receivedin the three years (or shorter period) preceding his termination; and
Š if the executive officer terminates the work relationship for good cause due to a reduction inresponsibilities and tasks assigned to the executive officer, then such executive officer will be entitled toan amount corresponding to 50% of the amount described above.
6.6.3 COMPENSATION OF MEMBERS OF THE BOARD OF AUDITORS
The annual compensation attributed to the Board of Auditors until the General Shareholders’ Meeting of April 13,2006 (which appointed the current Board of Auditors) was €128,000 for each Auditor and €171,000 for theChairman of the Board, according to the resolutions by Telecom Italia’s General Shareholders’ Meeting of May 6,2004. The shareholders’ meeting of April 13, 2006 set the gross annual remuneration of each member of theBoard of Auditors at €128,000 and the gross annual remuneration of the Chairman of the Board of Auditors at€171,000. It also decided to award an additional €20,000 to the member of the Board of Auditors appointed tothe Supervisory Panel set up under Legislative Decree 231/2001 (Ferdinando Superti Furga).
The total compensation paid by the Company or by any of the Telecom Italia Group subsidiaries in 2006 to themembers of the Board of Auditors was €705,000.
181

Item 6. Directors, Senior Management and Employees Compensation Of Directors, Officers And Members Of The Board OfAuditors
The following table sets forth the members of the Board of Auditors in office during 2006 and the compensationreceived by the Board of Auditors for services rendered during the year ended December 31, 2006:
Name Position heldPeriod during which
position was heldCompensation
base
Noncash
benefits
Bonusesand otherincentives
OtherCompensations
(thousands of Euro)Paolo GOLIA . . . . . . . . . . . . . . . Acting Auditor 1/1-4/13/2006 37
Chairman 4/14-12/31/2006 123Enrico Maria BIGNAMI . . . . . . Acting Auditor 10/21-12/31/2006 25(1)Ferdinando SUPERTI
FURGA . . . . . . . . . . . . . . . . . . . Chairman 1/1-4/13/2006 55(2)Acting Auditor 4/14-12/31/2006 105(2)
Salvatore SPINIELLO . . . . . . . Acting Auditor 1/1-12/31/2006 128 42(3)Gianfranco ZANDA . . . . . . . . . . Acting Auditor 1/1-12/31/2006 128 20(4)Rosalba CASIRAGHI . . . . . . . . Acting Auditor 1/1-4/13/2006 37Stefano MEROI . . . . . . . . . . . . . Acting Auditor 4/14-10/20/2006 67
(1) The amount includes remuneration not received but paid to the Bignami e Associati corporate and tax consulting firm.
(2) The amount includes remuneration paid as a member of the Supervisory Panel under Legislative Decree 231/2001.
(3) The amounts includes remuneration for the position of Acting Auditor of Telecom Italia Media S.p.A..
(4) The amount includes remuneration for the position of Chairman of the Board of Auditors of IT Telecom S.r.l. from 1/1-12/31/2006 andfor the position of Acting Auditor of Tim Italia S.p.A. from 1/1-2/28/2006.
182

Item 6. Directors, Senior Management and Employees Options to Purchase Securities From Registrant
6.7 OPTIONS TO PURCHASE SECURITIES FROM REGISTRANT
At the end of 2006, the existing stock options plans relate to options which give the right to the subscription ofnew Telecom Italia Ordinary Shares (including the options at one time granted to TIM S.p.A.) and new TelecomItalia Media Ordinary Shares.
For further details, please see “Note 42—Stock option plans of the Telecom Italia Group” of the Notes to theConsolidated Financial Statements.
183

Item 7. Major Shareholders And Related-Party Transactions Major Shareholders
Item 7. MAJOR SHAREHOLDERS AND RELATED-PARTY TRANSACTIONS
7.1 MAJOR SHAREHOLDERS
At December 31, 2006, according to the shareholders register and other information in the Company’s possession,the parties which held shares with voting rights, directly or indirectly, in excess of 2% of the ordinary share capitalof Telecom Italia were the following:
Type ofownership
No. OrdinaryShares
% of ordinaryshare capital
Olimpia S.p.A. . . . . . . . . . . . . . . . . . . . . . . . . . . . . . . . . . . direct 2,407,345,359 17.99%Assicurazioni Generali S.p.A. . . . . . . . . . . . . . . . . . . . . direct and indirect 636,242,171 4.75%Hopa S.p.A. . . . . . . . . . . . . . . . . . . . . . . . . . . . . . . . . . . . . direct and indirect 497,901,370 3.72%
At December 31, 2006, Telecom Italia S.p.A. held 1,272,014 ordinary treasury stock, while the subsidiary TelecomItalia Finance S.A. held another 124,544,373 shares, for a total of 0.94% of capital with voting rights.
7.1.1 THE SHAREHOLDERS’ AGREEMENTS
The information contained herein regarding the Olimpia shareholders’ agreements has been derived from publiclyavailable information filed by the parties involved with regulatory authorities. So far as Telecom Italia is aware, nofacts have been omitted herein which would render the information misleading. No further or other responsibilityin respect of such information is accepted by Telecom Italia.
Relations between the shareholders of Olimpia (currently the major shareholder of Telecom Italia, with a holdingof approximately 18% of the ordinary share capital of the Company) are governed by an agreement datedAugust 7, 2001, and subsequently amended on September 14, 2001 and on February 13, 2002, containing clausesof relevance for Telecom Italia pursuant article 122 of Legislative Decree 58/1998. As of March 2, 2007 EdizioneHolding S.p.A. was replaced by Sintonia S.p.A., and Edizione Finance International S.A. has changed its name toSintonia S.A.
Under the shareholders’ agreement (which is due to expire on October 4, 2007), Pirelli & C. S.p.A., on the onehand, and Edizione Holding S.p.A. and Edizione Finance International S.A. (now Sintonia S.p.A and Sintonia S.A.,respectively; together: “Sintonia”), on the other, undertook to do everything in their power to ensure, within thelimits allowed by law, that in the Board of Directors of Telecom Italia:
Š one-fifth of the directors (rounded to the nearest whole number up to two directors), whoseappointment is not reserved by law, regulation or bylaw to the market or to other persons, areappointed as designated by Sintonia;
Š the Deputy Chairman is appointed, with powers of legal representation from among the directorsdesignated by Sintonia;
Š if an Executive Committee is formed, one of its members is appointed from among the directorsdesignated by Sintonia.
In addition, Pirelli & C. undertook to ensure, within the limits allowed by law, that no resolution is adopted by theBoard of Directors of Telecom Italia without the favorable vote of at least one of the directors designated bySintonia, if present, on the following matters:
Š individual investments in excess of €250 million;
Š the purchase, sale and disposal in any other manner of controlling interests or interests in affiliates inexcess of €250 million on an individual basis;
Š the disposal in any way of businesses or business units in excess of €250 million;
Š proposals to call special shareholders’ meetings;
Š transactions between the Telecom Italia Group and the Pirelli Group in excess of €50 million;
Š transactions with related parties.
On July 12, 2006, Olimpia signed an agreement with Holinvest S.p.A. governing the former’s continuing right ofpre-emption on a portion (specifically 320,253,610 shares) of Telecom Italia Ordinary Shares held in Holinvest’s
184

Item 7. Major Shareholders And Related-Party Transactions Major Shareholders
portfolio, which simultaneously undertook, both on its behalf and on behalf of its subsidiary Hopa S.p.A., not toincrease the above-mentioned investment without the prior agreement of Olimpia. This agreement will be ineffect until July 12, 2008.
Finally, an agreement was concluded on October 18, 2006 between Pirelli & C. S.p.A., Edizione Holding S.p.A.(now Sintonia S.p.A.), Edizione Finance International S.A. (now Sintonia S.A.), Olimpia S.p.A., Mediobanca S.p.A.and Assicurazioni Generali S.p.A., containing clauses of certain agreements relevant to Telecom Italia’smanagement.
The agreement provides for a management board, composed of an even number of members, half of whom aredesignated by Olimpia (currently: Marco Tronchetti Provera, Chairman, and Gilberto Benetton) and, one by each ofthe other parties other than Pirelli and Sintonia (currently: Renato Pagliaro for Mediobanca and GiovanniPerissinotto for Generali). The agreement requires consultation among the parties before each Telecom Italiashareholders’ meeting on how to exercise their voting rights relating to the shares covered by the agreement,with the understanding that each party may freely exercise the right to vote when the board does not reach aunanimous decision.
The following Telecom Italia Ordinary Shares were initially committed to the agreement, which is due to last forthree years:
Party No. of Ordinary Shares% of ordinaryshare capital
Olimpia S.p.A. . . . . . . . . . . . . . . . . . . . . . . . . . . . . . . . . . . . . . . . . 2,407,345,359 17.99%Generali Group . . . . . . . . . . . . . . . . . . . . . . . . . . . . . . . . . . . . . . . 490,580,064 3.67%Mediobanca S.p.A. . . . . . . . . . . . . . . . . . . . . . . . . . . . . . . . . . . . . 206,464,069 1.54%
3,104,389,492 23.20%
Such shares are covered by lock-up and standstill provisions, although the agreement also provides for a series ofexceptions to such provisions. Olimpia’s commitment not to transfer the Telecom Italia shares contributed to thepact, for example, can be disregarded if Olimpia decides to sell its entire stake. However, in that case, Generaliand Mediobanca have a pre-emption right. This right cannot be exercised whenever the buyer agrees to purchasethe shares of the same Generali and Mediobanca contributed to the pact at the same terms. The same procedureapplies in the case of the sale by Pirelli, alone or with Sintonia, of a stake in excess of 50% of the capital ofOlimpia.
Telecom Italia is not subject to direction and coordination pursuant to Article 2497 et seq. of the Italian CivilCode nor to the control of any person pursuant to Article 93 of the Consolidated Law. Olimpia is the largestshareholder in Telecom Italia, with a stake equal to, as of June 13, 2007, approximately 18%. Under the “slatevoting” system for the election of directors, a shareholder or group of shareholders owning 1% or more of theshares may put forward a slate of directors for election to the Board. As a result of this system 15 of the directorselected at the shareholders’ meeting of April 16, 2007 were candidates put forward by Olympia. See “Item 10.Additional Information—10.1 Corporate Governance—10.1.2 General—Board of Directors—Appointment”.
There are no arrangements known to the Company the operation of which may result in any shareholder obtaininga controlling interest in Telecom Italia. See, however, the discussion below of the sale of Olimpia to Telco S.p.A.
On April 28, 2007 Pirelli & C. S.p.A., Sintonia S.p.A. and Sintonia S.A. announced by press release that they hadreached an agreement with a group of institutional financial investors and Telefónica S.A., the Spanish telecomsoperator for the sale of 100% of the share capital of Olimpia S.p.A..
The acquisition (which is conditional upon the authorisations and approvals of competent authorities) will beeffected by a vehicle company (Telco S.p.A.) owned by Assicurazioni Generali S.p.A. (28.1%), Intesa SanpaoloS.p.A. (10.6%), Mediobanca S.p.A. (10.6%), Sintonia S.A. (8.4%) and Telefónica S.A. (42.3%). The transaction isexpected to be completed by October 2007. According to the co-investment agreement between AssicurazioniGenerali S.p.A., Intesa Sanpaolo S.p.A., Mediobanca S.p.A., Sintonia S.A. and Telefónica S.A., the aforementionedagreement concluded on October 18, 2006 between Pirelli & C. S.p.A., Edizione Holding S.p.A. (now Sintonia
185

Item 7. Major Shareholders And Related-Party Transactions Major Shareholders
S.p.A.), Edizione Finance International S.A. (now Sintonia S.A.), Olimpia S.p.A., Mediobanca S.p.A. andAssicurazioni Generali S.p.A. shall cease to have any effect upon the acquisition by Telco S.p.A. of the entire sharecapital of Olimpia.
Telco S.p.A., after the acquisition and the incorporation of Olimpia S.p.A., will hold approximately 23.6% of thevoting share capital of Telecom Italia S.p.A., 18% of which will be acquired with the acquisition of Olimpia and5.6% of which will be contributed by Assicurazioni Generali S.p.A. and Mediobanca S.p.A..
The following chart illustrates the expected ownership structure following completion of the transaction.
AssicurazioniGenerali
IntesaSanpaolo Sintonia TelefónicaMediobanca
Telco
Olimpia
TelecomItalia
10.6% 28.1%. 10.6% 8.4% 42.3%
100%
18%
5.6%
23.6%
186

Item 7. Major Shareholders And Related-Party Transactions Major Shareholders
7.1.2 SHAREHOLDERS OWNERSHIP
❖ BOARD OF DIRECTORS
The following table shows the ownership of Telecom Italia and Telecom Italia Media shares, as of June 13, 2007,by the Directors of Telecom Italia who were in office during 2006 (as well as of the directors appointed by theGeneral Meeting of April 16, 2007).
Name CompanyClass ofshares
Number ofsharesheld at
the end of2005
(or at the dateof appointment)
Number ofshares
purchased
Number ofsharessold
Number ofshares
held as ofJune 13,
2007(or as of the date
on whichindividual leftpost, if before)
Guido ROSSI . . . . . . . . . Telecom Italia S.p.A. Ordinary 185,000(1) — — 185,000Gilberto BENETTON . . Telecom Italia S.p.A.
Telecom Italia S.p.A.OrdinarySavings
1,946,250990,000
——
——
1,946,250990,000
Diana BRACCO . . . . . . . Telecom Italia S.p.A.Telecom Italia Media S.p.A.
SavingsOrdinary
29,805594
——
——
29,805594
Renzo CAPRA . . . . . . . . Telecom Italia S.p.A. Ordinary 38,308 — — 38,308Claudio DE CONTO . . . Telecom Italia S.p.A.
Telecom Italia Media S.p.AOrdinaryOrdinary
3,63016
——
——
3,63016
Luigi FAUSTI . . . . . . . . . Telecom Italia S.p.A. Ordinary 5,985 50,000(1) — 55,985Guido FERRARINI . . . . Telecom Italia S.p.A. Ordinary — 50,000 — 50,000Aldo MINUCCI . . . . . . . Telecom Italia S.p.A. Ordinary 2,595 — — 2,595Gianni MION . . . . . . . . . Telecom Italia S.p.A.
Telecom Italia S.p.A.OrdinarySavings
27,000(1)35,000(1)
——
——
27,00035,000
Marco ONADO . . . . . . . . Telecom Italia S.p.A. Ordinary 17,000 30,000 — 47,000Telecom Italia S.p.A. Savings 11,092 — — 11,092
Renato PAGLIARO . . . . Telecom Italia S.p.A. Savings 45,000 15,000 — 60,000Pasquale PISTORIO . . Telecom Italia S.p.A. Ordinary 1,549,000(2) — — 1,549,000Luigi ROTH . . . . . . . . . . . Telecom Italia S.p.A. Ordinary 36,292(1) — — 36,292
Telecom Italia Media S.p.A Ordinary 726(1) — — 726Marco TRONCHETTI
PROVERA . . . . . . . . . . Telecom Italia S.p.A. Ordinary 2,000.000 — — 2,000.000Telecom Italia S.p.A. Savings 1,000,000 — — 1,000,000
(1) Shares held indirectly.
(2) Including 660,000 shares held indirectly.
❖ BOARD OF AUDITORS
The following table shows the ownership of Telecom Italia shares, as of June 13, 2007, by the auditors of TelecomItalia:
Name CompanyClass ofshares
Number ofsharesheld at
the end of2005
(or at the dateof appointment)
Number ofshares
purchased
Number ofsharessold
Number ofsharesheld as
of June 13,2007
(or as of the dateon which
individual leftpost, if before)
Paolo GOLIA . . . . . . . . . Telecom Italia Ordinary 1,437 — — 1,437
As of June 13, 2007 no member of the Board of Directors or Board of Auditors beneficially owned more than0.0244192% of the Ordinary Shares or Savings Shares.
* * *
187

Item 7. Major Shareholders And Related-Party Transactions Major Shareholders
The following table shows certain information, as of June 13, 2007, about the ownership of the Company’sOrdinary Shares and Savings Shares by the Company’s directors and executive officers as a group and by themembers of the Board of Auditors as a group.
Title of Class OwnerNumberOwned % of class
Ordinary Shares . . . . . . . . . . . . . . . . . . . . . . . . . . . . Directors and executive officers as agroup (19 Directors and 11 ExecutiveOfficers)
3,634,981 0.0271658%
Board of Auditors as a group (5 persons) 1,437 0.0000107%Savings Shares . . . . . . . . . . . . . . . . . . . . . . . . . . . . . Directors and executive officers as a
group (19 Directors and 11 ExecutiveOfficers)
1,179,639 0.0195754%
Board of Auditors as a group (5 persons) — —
Effective from April 1, 2006, according to article 114, prf. 7, of legislative decree n. 58/1998, as amended by lawn. 262/2005, and pursuant to ad hoc rules by CONSOB, persons performing administrative, supervisory andmanagement functions in a listed issuer (including directors and auditors) and managers who have regular access toinside information (so called “privileged information”, in accordance with the definition of law n. 262/2005) and thepower to make managerial decisions affecting the future development and prospects of the issuer, persons who holdshares amounting to at least 10 per cent of the share capital, and any other persons who control the issuer mustinform CONSOB and the public of transactions involving the issuer’s shares (or the shares issued by the issuer’s listedsubsidiaries, and unlisted shares issued by subsidiaries of the listed issuer when the book value of the holding in thesubsidiary represents more than fifty per cent of the listed issuer’s assets) or other financial instruments linked tothem that they have carried out directly or through nominees, for an amount equal to or above €5,000. Suchdisclosures must be performed within a five-trading day time limit and have also to be made when the transactionsare carried out by the spouse, unless legally separated, dependent children, including those of the spouse, cohabitantparents and relatives by blood or affinity of the persons referred to above.
The aforementioned requirement applies to Telecom Italia’s Directors, Auditors and Executive Officers.
7.1.3 CONTINUING RELATIONSHIP WITH THE ITALIAN TREASURY
Since December 9, 2002, the Treasury has not held a direct holding in Telecom Italia. However, the Treasurycontinues to be in a position to exert certain powers with respect to Telecom Italia through the exercise of thespecial powers included in Telecom Italia’s Bylaws. Such powers were established in 1997 according to LawNo. 474/1994, when Telecom Italia—formerly controlled by the Italian Treasury—was privatized.
On May 22, 2003, taking into account the proposed Merger, a Decree by the Minister for Economy and Finance, inagreement with the Minister for Productive Activities, maintained the power of approving the acquisition of majorshareholdings in the company’s voting capital (3% of Telecom Italia’s voting share capital or more) and the powerof veto over resolutions to dissolve the company, approve mergers, demergers or dispositions of the business,transfer the registered office abroad, change the corporate purposes or amend or modify the special powers. Onthe other hand, the Treasury’s power to approve major shareholders’ agreements and the power to appoint oneDirector and one Statutory Auditor were relinquished.
Law No. 350/2003, adopted in December 2003, significantly modified the rules governing the special powers ofthe Italian Government with respect to privatized companies stating, in particular, that the Government no longerhas the power to approve or disapprove the acquisition of material interests in the share capital of suchcompanies, but instead may object, within a ten-day period, in case of prejudice to vital State Interests and eachtime there is the need to protect subsequent undeniable reasons of public interest, in accordance with specificcriteria set forth in an ad-hoc decree of the Government dated June 10, 2004.
As a result, on April 1, 2005 a new Decree by the Minister for Economy and Finance, in agreement with the Ministerfor Productive Activities redefined accordingly the content of the “special powers” clause in Telecom Italia bylaws,and stated its exact wording. Therefore, as per the power entrusted to the Board of Directors by the Company’sbylaws, according to Italian Civil Code, to resolve upon revisions of the bylaws, if necessary to conform withstatutory provisions, on October 5, 2005 the Telecom Board of Directors amended the relevant provision.
188

Item 7. Major Shareholders And Related-Party Transactions Related-Party Transactions
7.2 RELATED-PARTY TRANSACTIONS
Related party transactions, including intragroup transactions, are neither unusual nor exceptional but fall underthe normal business operations of the companies of the Group. Such transactions, when not concluded asstandard conditions or dictated by specific laws, are in any case conducted at arm’s length.
For further details, please see “Note 41—Related party transactions” of the Notes to the Consolidated FinancialStatements included elsewhere in this Annual Report.
189

Item 8. Financial Information Historical Financial Statements
Item 8. FINANCIAL INFORMATION
8.1 HISTORICAL FINANCIAL STATEMENTS
See “Items 18 and 19” for a list of financial statements and other financial information filed with this report.
190

Item 8. Financial Information Legal Proceedings
8.2 LEGAL PROCEEDINGS
For further details, please see “Note 26—Contingent assets and liabilities, commitments and other guarantees”and “Note 48-Additional U.S. GAAP Disclosures—Subsequent Events” of the Notes to the Consolidated FinancialStatements included elsewhere herein.
191
Item 9. Listing Trading Of Telecom Italia Ordinary Shares And Savings Shares
Item 9. LISTING
9.1 TRADING OF TELECOM ITALIA ORDINARY SHARES AND SAVINGS SHARES
The principal trading market for the Ordinary Shares and the Savings Shares is on Telematico, an automatedscreen trading system managed by Borsa Italiana. (See “—9.3 Securities Trading in Italy”).
Following the Merger, which became effective on August 4, 2003, Olivetti as the surviving company changed itsname to “Telecom Italia S.p.A.”, succeeded to the 1934 Act registration of Old Telecom Italia and became subjectto the foreign private issuer reporting requirements of the Exchange Act.
Ordinary and Savings Share ADSs, each representing respectively ten Ordinary Shares and ten Savings Shares,have been quoted on the NYSE since August 4, 2003. JPMorgan Chase Bank is the Company’s Depositary issuingADRs evidencing the Ordinary Share ADSs and the Savings Share ADSs.
The table below sets forth, for the periods indicated, reported high and low official prices of the Ordinary Shareson Telematico and high and low closing prices of Ordinary Share ADSs on the NYSE from August 4, 2003.
Telematico NYSEHigh Low High Low
(€) (U.S.$)2003:Third Quarter—from August 4 to September 30(1) . . . . . . . . . . . . . . . . . . . . . . 2.3240 2.1040 26.31 23.57Fourth Quarter . . . . . . . . . . . . . . . . . . . . . . . . . . . . . . . . . . . . . . . . . . . . . . . . . . . . . . . . . 2.4390 2.1130 29.92 24.752004First Quarter . . . . . . . . . . . . . . . . . . . . . . . . . . . . . . . . . . . . . . . . . . . . . . . . . . . . . . . . . . . . 2.617 2.387 33.24 29.38Second Quarter . . . . . . . . . . . . . . . . . . . . . . . . . . . . . . . . . . . . . . . . . . . . . . . . . . . . . . . . . 2.703 2.452 32.80 29.74Third Quarter . . . . . . . . . . . . . . . . . . . . . . . . . . . . . . . . . . . . . . . . . . . . . . . . . . . . . . . . . . . 2.569 2.343 31.84 28.71Fourth Quarter . . . . . . . . . . . . . . . . . . . . . . . . . . . . . . . . . . . . . . . . . . . . . . . . . . . . . . . . . 3.046 2.531 41.10 31.282005:First Quarter . . . . . . . . . . . . . . . . . . . . . . . . . . . . . . . . . . . . . . . . . . . . . . . . . . . . . . . . . . . . 3.168 2.790 41.16 36.93Second Quarter . . . . . . . . . . . . . . . . . . . . . . . . . . . . . . . . . . . . . . . . . . . . . . . . . . . . . . . . . 2.978 2.486 38.59 30.14Third Quarter . . . . . . . . . . . . . . . . . . . . . . . . . . . . . . . . . . . . . . . . . . . . . . . . . . . . . . . . . . . 2.734 2.479 33.86 29.95Fourth Quarter . . . . . . . . . . . . . . . . . . . . . . . . . . . . . . . . . . . . . . . . . . . . . . . . . . . . . . . . . 2.719 2.305 32.13 26.952006:First Quarter . . . . . . . . . . . . . . . . . . . . . . . . . . . . . . . . . . . . . . . . . . . . . . . . . . . . . . . . . . . . 2.614 2.257 31.87 26.89Second Quarter . . . . . . . . . . . . . . . . . . . . . . . . . . . . . . . . . . . . . . . . . . . . . . . . . . . . . . . . . 2.427 2.119 30.21 26.68Third Quarter . . . . . . . . . . . . . . . . . . . . . . . . . . . . . . . . . . . . . . . . . . . . . . . . . . . . . . . . . . . 2.269 2.065 29.18 25.88Fourth Quarter . . . . . . . . . . . . . . . . . . . . . . . . . . . . . . . . . . . . . . . . . . . . . . . . . . . . . . . . . 2.405 2.205 31.06 27.992007:January . . . . . . . . . . . . . . . . . . . . . . . . . . . . . . . . . . . . . . . . . . . . . . . . . . . . . . . . . . . . . . . . 2.385 2.264 31.10 29.40February . . . . . . . . . . . . . . . . . . . . . . . . . . . . . . . . . . . . . . . . . . . . . . . . . . . . . . . . . . . . . . . 2.426 2.269 31.71 29.51March . . . . . . . . . . . . . . . . . . . . . . . . . . . . . . . . . . . . . . . . . . . . . . . . . . . . . . . . . . . . . . . . . . 2.242 2.108 29.48 27.88April . . . . . . . . . . . . . . . . . . . . . . . . . . . . . . . . . . . . . . . . . . . . . . . . . . . . . . . . . . . . . . . . . . . 2.430 2.208 32.53 29.95May . . . . . . . . . . . . . . . . . . . . . . . . . . . . . . . . . . . . . . . . . . . . . . . . . . . . . . . . . . . . . . . . . . . . 2.195 2.092 29.93 27.90June (through June 13, 2007) . . . . . . . . . . . . . . . . . . . . . . . . . . . . . . . . . . . . . . . . . . 2.161 2.031 29.10 27.01
Source: Bloomberg data
(1) The official prices of Shares for the periods prior to August 4, 2003 are not comparable to the official prices of these shares in thefollowing periods due to the effect of the incorporation of Old Telecom Italia with and into Olivetti, which became effective on August 4,2003. Please see “—9.2 Trading of Old Telecom Italia Ordinary Shares and Savings Shares”.
At the close of business on June 13, 2007 there were 49,095,013 Ordinary Share ADSs outstanding held by 131registered holders. One of the registered holders is the Depository Trust Company (“DTC”) which holds49,079,745 Ordinary Share ADSs on behalf of beneficial holders.
192

Item 9. Listing Trading Of Telecom Italia Ordinary Shares And Savings Shares
The table below sets forth, for the periods indicated, reported high and low official prices of the Savings Shares onTelematico and high and low closing prices of the Savings Share ADSs on the NYSE from August 4, 2003.
Telematico NYSEHigh Low High Low
(€) (U.S.$)2003:Third Quarter—from August 4 to September 30(1) . . . . . . . . . . . . . . . . . . . . . . 1.5760 1.4320 19.00 16.09Fourth Quarter . . . . . . . . . . . . . . . . . . . . . . . . . . . . . . . . . . . . . . . . . . . . . . . . . . . . . . . . . 1.6460 1.4650 20.90 17.332004First Quarter . . . . . . . . . . . . . . . . . . . . . . . . . . . . . . . . . . . . . . . . . . . . . . . . . . . . . . . . . . . . 1.862 1.634 23.54 20.78Second Quarter . . . . . . . . . . . . . . . . . . . . . . . . . . . . . . . . . . . . . . . . . . . . . . . . . . . . . . . . . 1.972 1.765 23.68 21.46Third Quarter . . . . . . . . . . . . . . . . . . . . . . . . . . . . . . . . . . . . . . . . . . . . . . . . . . . . . . . . . . . 1.861 1.711 23.35 21.19Fourth Quarter . . . . . . . . . . . . . . . . . . . . . . . . . . . . . . . . . . . . . . . . . . . . . . . . . . . . . . . . . 2.410 1.878 34.00 23.582005:First Quarter . . . . . . . . . . . . . . . . . . . . . . . . . . . . . . . . . . . . . . . . . . . . . . . . . . . . . . . . . . . . 2.519 2.303 32.90 30.71Second Quarter . . . . . . . . . . . . . . . . . . . . . . . . . . . . . . . . . . . . . . . . . . . . . . . . . . . . . . . . . 2.540 2.052 32.51 24.64Third Quarter . . . . . . . . . . . . . . . . . . . . . . . . . . . . . . . . . . . . . . . . . . . . . . . . . . . . . . . . . . . 2.306 2.063 27.97 24.75Fourth Quarter . . . . . . . . . . . . . . . . . . . . . . . . . . . . . . . . . . . . . . . . . . . . . . . . . . . . . . . . . 2.301 1.938 26.94 22.322006:First Quarter . . . . . . . . . . . . . . . . . . . . . . . . . . . . . . . . . . . . . . . . . . . . . . . . . . . . . . . . . . . . 2.2402 1.9046 27.12 22.70Second Quarter . . . . . . . . . . . . . . . . . . . . . . . . . . . . . . . . . . . . . . . . . . . . . . . . . . . . . . . . . 2.2092 1.9116 27.13 24.26Third Quarter . . . . . . . . . . . . . . . . . . . . . . . . . . . . . . . . . . . . . . . . . . . . . . . . . . . . . . . . . . . 2.0384 1.8407 26.31 23.43Fourth Quarter . . . . . . . . . . . . . . . . . . . . . . . . . . . . . . . . . . . . . . . . . . . . . . . . . . . . . . . . . 2.0434 1.8846 26.60 23.682007:January . . . . . . . . . . . . . . . . . . . . . . . . . . . . . . . . . . . . . . . . . . . . . . . . . . . . . . . . . . . . . . . . 2.0235 1.9196 26.35 24.76February . . . . . . . . . . . . . . . . . . . . . . . . . . . . . . . . . . . . . . . . . . . . . . . . . . . . . . . . . . . . . . . 2.0095 1.9116 26.20 24.75March . . . . . . . . . . . . . . . . . . . . . . . . . . . . . . . . . . . . . . . . . . . . . . . . . . . . . . . . . . . . . . . . . . 1.8936 1.8097 25.14 23.53April . . . . . . . . . . . . . . . . . . . . . . . . . . . . . . . . . . . . . . . . . . . . . . . . . . . . . . . . . . . . . . . . . . . 1.9845 1.7500 26.32 23.87May . . . . . . . . . . . . . . . . . . . . . . . . . . . . . . . . . . . . . . . . . . . . . . . . . . . . . . . . . . . . . . . . . . . . 1.814 1.715 24.37 22.89June (through June 13, 2007) . . . . . . . . . . . . . . . . . . . . . . . . . . . . . . . . . . . . . . . . . . 1.722 1.625 23.08 21.42
Source: Bloomberg data
(1) The official prices of Shares for the periods prior to August 4, 2003 are not comparable to the official prices of these shares in thefollowing periods due to the effect of the incorporation of Old Telecom Italia with and into Olivetti, which became effective on August 4,2003. Please see “—9.2 Trading of Old Telecom Italia Ordinary Shares and Savings Shares”.
At the close of business on June 13, 2007, there were 34,574,444 Savings Share ADSs outstanding held by 14registered holders. One of the registered holders is the Depository Trust Company (“DTC”) which holds34,570,581 Savings Share ADSs on behalf of beneficial holders.
Fluctuations between the Euro and the U.S. dollar will affect the dollar equivalent of the price of the OrdinaryShare and the Savings Shares on Telematico and the price of the Ordinary Share ADSs and the Savings ShareADSs on the New York Stock Exchange.
On June 13, 2007 the Noon Buying Rate for the Euro was U.S.$ 1.3295 = €1.00.
193

Item 9. Listing Trading Of Old Telecom Italia Ordinary Shares And Savings Shares
9.2 TRADING OF OLD TELECOM ITALIA ORDINARY SHARES AND SAVINGS SHARES
The table below sets forth, for the periods indicated, reported high and low official prices of the Ordinary Sharesof Old Telecom Italia on Telematico and high and low closing prices of Ordinary Share ADSs of Old Telecom Italiaon the NYSE until and including August 1, 2003.
Telematico NYSEHigh Low High Low
(€) (U.S.$)2002:First Quarter . . . . . . . . . . . . . . . . . . . . . . . . . . . . . . . . . . . . . . . . . . . . . . . . . . . . . . . . . 9.73 8.55 88.75 75.18Second Quarter . . . . . . . . . . . . . . . . . . . . . . . . . . . . . . . . . . . . . . . . . . . . . . . . . . . . . . 9.21 7.49 85.00 74.60Third Quarter . . . . . . . . . . . . . . . . . . . . . . . . . . . . . . . . . . . . . . . . . . . . . . . . . . . . . . . . . 8.35 7.08 83.20 71.35Fourth Quarter . . . . . . . . . . . . . . . . . . . . . . . . . . . . . . . . . . . . . . . . . . . . . . . . . . . . . . . 8.31 7.03 85.25 70.452003:First Quarter . . . . . . . . . . . . . . . . . . . . . . . . . . . . . . . . . . . . . . . . . . . . . . . . . . . . . . . . . 7.53 5.31 80.19 58.65Second Quarter . . . . . . . . . . . . . . . . . . . . . . . . . . . . . . . . . . . . . . . . . . . . . . . . . . . . . . 8.14 6.61 94.43 70.14Third Quarter (until August 1, 2003) . . . . . . . . . . . . . . . . . . . . . . . . . . . . . . . . . . 8.05 7.47 91.10 84.30
Source: Reuters data.
The table below sets forth, for the periods indicated, reported high and low official prices of the Savings Shares ofOld Telecom Italia on Telematico and high and low closing prices of the savings share ADSs of Old Telecom Italiaon the NYSE until and including August 1, 2003 for the period following such date.
Telematico NYSEHigh Low High Low
(€) (U.S.$)2002:First Quarter . . . . . . . . . . . . . . . . . . . . . . . . . . . . . . . . . . . . . . . . . . . . . . . . . . . . . . . . . . . . 6.20 5.21 55.96 47.51Second Quarter . . . . . . . . . . . . . . . . . . . . . . . . . . . . . . . . . . . . . . . . . . . . . . . . . . . . . . . . . 6.14 4.94 57.00 50.32Third Quarter . . . . . . . . . . . . . . . . . . . . . . . . . . . . . . . . . . . . . . . . . . . . . . . . . . . . . . . . . . . 5.50 4.80 56.50 53.00Fourth Quarter . . . . . . . . . . . . . . . . . . . . . . . . . . . . . . . . . . . . . . . . . . . . . . . . . . . . . . . . . 5.38 4.77 56.33 48.672003:First Quarter . . . . . . . . . . . . . . . . . . . . . . . . . . . . . . . . . . . . . . . . . . . . . . . . . . . . . . . . . . . . 4.90 3.35 52.00 37.50Second Quarter . . . . . . . . . . . . . . . . . . . . . . . . . . . . . . . . . . . . . . . . . . . . . . . . . . . . . . . . . 4.96 3.94 57.59 42.50Third Quarter (until August 1, 2003) . . . . . . . . . . . . . . . . . . . . . . . . . . . . . . . . . . . . 5.08 4.64 53.75 52.92
Source: Reuters data.
194

Item 9. Listing Securities Trading In Italy
9.3 SECURITIES TRADING IN ITALY
Since July 1994, all Italian equity securities have been traded on Telematico except for equity securities of(i) certain smaller companies and cooperative banks traded on Mercato Ristretto under certain specific rulesconcerning trading hours and procedures and (ii) high growth companies traded on Nuovo Mercato.
Telematico operates under the control of CONSOB, the public authority charged, among other things, withregulating securities markets and all public offerings of securities in Italy, and is managed by Borsa Italiana a jointstock company previously owned by the Treasury, sold through a tender offer to authorized intermediaries.
Securities transactions on Telematico are settled on a cash basis. Cash transactions are settled on the thirdtrading day following the trading date. Borsa Italiana issues a daily official list with certain information ontransactions in each listed security, including the volume traded and the high and low prices of the day. No“closing price” is reported, but an “official price” calculated as a weighted average price of all trades effectedduring the trading day and a “reference price” calculated as a weighted average of the last 10% of tender effectedduring such day are reported daily. The Bank of Italy, in accordance with CONSOB, regulates the governing of theclearing system; with a provision dated September 8, 2000, the Bank of Italy specifies that the clearing system beperformed by Monte Titoli (a centralized securities clearing system owned by certain major Italian banks andfinancial institutions).
Residents of Italy and non-residents through their authorized agents may purchase or sell shares on Telematico,subject to satisfying (i) in case of sales, either the Margin or the Deposit, and (ii) in case of purchases, the Margin.“Margin” means a deposit equal to 100% of the agreed price, and “Deposit” means a deposit of an equal numberof the same shares as those sold. If in the course of a trading day the maximum price variation between twoconsecutive contracts is ±5%, or maximum price variation of the contracts with respect to the control price(3) is±10% an automatic five-minute suspension is declared. In the event of such a suspension, effect is not given totrades agreed but not confirmed before the suspension. In addition, Borsa Italiana has the authority to suspendtrading in any security in response to extreme price fluctuations or for other reasons.
Starting May 15, 2000, the most liquid shares traded on Telematico, including the Ordinary Shares and the TIMordinary shares, have been traded on “Mercato After Hours”, an automated screen trading system managed byBorsa Italiana. “Mercato After Hours” operates, from 6.00 p.m. to 8.30 p.m. on every trading day, substantiallyunder the same rules as Telematico except that the price of any security may not fluctuate by more than 3.5%from the reference price of said securities on Telematico on the same day.
The S&P/MIB currently measures the performance of 40 equities listed on the markets organized and managed byBorsa Italiana. The index is derived from the universe of stocks trading on the Italian Exchange, including Borsa(MTA) and Nuovo Mercato. In September 2004, the S&P/MIB index substituted the MIB30 index which iscalculated as an informative index. The S&P/MIB Index provides diversity over 10 economic sector by adhering tothe Global Industry Classification Standard, or CICS. The 10 CIGS sectors that underlie the S&P/MIB are:Consumer Discretionary, Consumer Staples, Energy, Financials, Health care, Industrials, Information Technology,Materials, Telecommunication Services and Utilities. All stocks are classified using the CIGS methodology,therefore S&P/MIB Index reflect the Italian Markets in its entirety. Each constituent is weighted by its free floatcapital, considering the effective number of shares tradable in the market. Index Constituents are reviewed twicea year (March and September), whereas the rebalancing weights are re-calculated four times a year (March, June,September and December). The weighting structure can also be changed following extraordinary events (if thecapital of a stock increases or other events).
American style call and put options are traded on the derivative market managed by Borsa Italiana whichcurrently include the Ordinary and Savings Shares.
Effective July 1, 1998, the Italian financial markets have been regulated by the Draghi Law. With the Draghi Law,the Italian Government has introduced new laws and regulations governing some aspects of the financial sectorand, in particular: (i) brokers and firms managing financial instruments; (ii) the Italian regulated Stock Exchanges;(iii) the offering to the public of financial instruments; (iv) public tender offers; (v) some aspects of corporategovernance of listed companies; and (vi) insider trading. The Draghi Law contains framework provisions whichhave been implemented by specific regulations.
195

Item 9. Listing Clearance And Settlement Of Telecom Italia Shares
9.4 CLEARANCE AND SETTLEMENT OF TELECOM ITALIA SHARES
Legislative Decree No. 213 of June 24, 1998 (“Dematerialization Decree”) provided for the dematerialization offinancial instruments publicly traded on regulated markets including treasury bonds. From July 9, 1998, allcompanies that issue financial instruments that are publicly traded on regulated markets must inform MonteTitoli, which will open an account in the name of each company in its register.
Beneficial owners of Ordinary Shares and Savings Shares must hold their interests through specific depositaccounts with any participant having an account with Monte Titoli. The beneficial owners of Ordinary Shares andSavings Shares held with Monte Titoli may transfer their shares, collect dividends, create liens and exercise otherrights with respect to those Ordinary Shares and Savings Shares through such accounts and may no longer obtainphysical delivery of share certificates in respect of their Ordinary Shares and Savings Shares. All new issues ofOrdinary Shares and Savings Shares and all other transactions involving Ordinary Shares and Savings Shares mustsettle electronically in book-entry form.
Ordinary Shares and Savings Shares are accepted for clearance through Euroclear and Clearstream. Holders ofshares may elect to hold such Ordinary Shares and Savings Shares through Euroclear or Clearstream (outside theUnited States).
196

Item 10. Additional Information Corporate Governance
Item 10. ADDITIONAL INFORMATION
10.1 CORPORATE GOVERNANCE
10.1.1 DIFFERENCES IN TELECOM ITALIA’S CORPORATE GOVERNANCE AND NEW YORK STOCK EXCHANGE
CORPORATE GOVERNANCE PRACTICES
In November 2003, the SEC approved the NYSE’s new corporate governance rules for listed companies. Underthese new rules, as a NYSE-listed foreign private issuer, Telecom Italia must disclose any significant ways inwhich its corporate governance practices differ from those followed by US companies under NYSE listingstandards. We believe the following to be the significant differences between our corporate governance practicesand NYSE corporate governance rules applicable to US companies.
Independent Directors. Under NYSE listing rules applicable to US companies, independent directors mustcomprise a majority of the board of directors.
Article 147-ter of the Italian Consolidated Law on Finance requires Boards, with more than seven members, tohave at least two directors who meet the criteria set forth by Article 148 for the independence of statutoryauditors; in addition the Borsa Italiana Corporate Governance Code requires Boards to have an adequate numberof independent directors, while defining ad hoc independence criteria to this end.
As of June 13, 2007, 9 out of 19 members of Telecom Italia Board are deemed to be independent according to theBorsa Italiana Corporate Governance Code (and Telecom Italia Self-Regulatory Code, which incorporates byreference the same independence criteria set forth by the Borsa Italiana Code); in addition at least 6 Directorsqualify as independent pursuant to the requirements set forth by Article 148.
See also below under “—10.1 Corporate Governance—10.1.2 General—Board of Directors—IndependentDirectors”.
Non-management Directors Meetings. Pursuant to NYSE listing standards, non-management directors mustmeet on a regular basis without management present and independent directors must meet separately at leastonce per year.
Borsa Italiana’s Corporate Governance Code requires independent directors to meet separately at least once ayear.
Since 2004, the Board of Directors decided it was desirable to appoint a Lead Independent Director, with the aimof further enhancing the role of the independent directors and Article 5.5 of the Company’s Self Regulatory Codeformalized this position, which was held by Professor Guido Ferrarini, Chairman of the Internal Control andCorporate Governance Committee, until the term of his office as director ended on April 16, 2007. After itscomposition changed (General Shareholders’ Meeting on April 16, 2007) the Board of Directors has not yetdesignated the new Lead Independent Director. During 2006, five Independent Directors’ Executive Sessions wereheld; the subjects discussed included strategic scenarios and the possible reorganization of the Group. See alsobelow under “—10.1 Corporate Governance—10.1.2 General—Board of Directors—Executive Directors andActivities of the Board”.
Nominating/Corporate Governance Committee. Under NYSE standards, US companies listed on the NYSE arerequired to have a nominating/corporate governance committee composed entirely of independent directors. Inaddition to identifying individuals qualified to become board members, this committee must develop andrecommend to the board a set of corporate governance principles. Pursuant to NYSE standards, this committeeshould also adopt a written charter.
According to Borsa Italiana’s Corporate Governance Code, the Board of Directors shall evaluate whether toestablish among its members a nomination committee, while an internal control committee is required.
Telecom Italia does not have a Nominating Committee. Directors are appointed by shareholders through the slatesystem which permits shareholders, who alone or together, hold shares representing at least 1% of the sharecapital to put forward slates of directors; the system is intended to ensure the presence on the Board of persons
197

Item 10. Additional Information Corporate Governance
elected from slates submitted by minority shareholders. Thus, the Company took the view that using the slatesystem met the needs otherwise served by the creation of a Nominating Committee. Article 9 of Telecom Italiabylaws already provided for the members of the Board of Directors to be elected using the slate system, when theConsolidated Law on Finance made this system mandatory, as of 2006.
On the other hand Telecom Italia does have an Internal Control and Corporate Governance Committee, made upof independent directors and, among its other activities, this committee actively participates and assists indeveloping and implementing the corporate governance procedures adopted by Telecom Italia. Furthermore,Article 14 of Telecom Italia new Self Regulatory Code provides that, in cases of substitution of an independentdirector the Internal Control and corporate governance Committee proposes candidates for appointment to theBoard of Directors.
See also below under “—10.1 Corporate Governance—10.1.2 General—Board of Directors—InternalCommittees”.
Remuneration Committee. Under NYSE standards, US companies listed on the NYSE are required to establish aremuneration committee composed entirely of independent directors. In addition to the review and approval ofcorporate goals relevant to CEO compensation and evaluation of the CEO performance in light of those given, thiscommittee must determine and approve the CEO’s compensation and make recommendations to the Board ofDirectors with respect to non-CEO compensation, incentive-compensation plans and equity-based plans.
The Borsa Italiana’s Corporate Governance Code requires the Board to establish a remuneration committee madeup of non-executive directors, the majority of which are independent.
In accordance with Telecom Italia’s by-laws and the Self-Regulatory Code, the Board of Directors determines theremuneration of the Chairman and the Managing Directors. Such determination is made on the basis of proposalsdefined by the Remuneration Committee (made up of independent directors only, which provides also adviceregarding remuneration criteria for the Company’s senior management.
See also below under “—10.1 Corporate Governance—10.1.2 General—Board of Directors—InternalCommittees”.
Audit Committee. US companies listed on the NYSE are required to establish an audit committee that satisfiesthe requirements of Rule 10A-3 under the 1934 Act.
The Board of Auditors, as permitted by Rule 10A-3, is performing the corresponding functions for Telecom Italia,which therefore is exempted from the requirement to have a separate audit committee. A Rule 303A writtenaffirmation to this end was submitted to NYSE on June 13, 2006. In addition on October 26, 2006 an interimwritten affirmation was submitted to NYSE, since a statutory auditor had resigned and had been replaced by thealternate auditor purposely designed. See also below under “—10.1 Corporate Governance—10.1.2 General—Board of Directors—Internal Control System” and “—10.1.2 General—Board of Directors—Board of Auditors”.
Adoption and Disclosure of Corporate Governance Guidelines. US companies listed on the NYSE are required toadopt and disclose corporate governance guidelines.
Such disclosures are included in this Form 20-F and English translations of the Telecom Italia Group’s corporategovernance policies can be found on Telecom Italia’s website: www.telecomitalia.it under “Governance”.
Code of business conduct and ethics. NYSE listing standards require US companies to adopt a code of businessconduct and ethics for directors, officers and employees, and promptly disclose any waivers of the code fordirectors or executive officers. The code should provide for the reporting of violations of its provisions or of lawsand regulations.
Telecom Italia has adopted such a Code. See also below under “—10.1 Corporate Governance—10.1.2 General—Code of Ethics and Conduct”.
Annual Certification by The Chief Executive Officer. A chief executive officer of a US company listed on the NYSEmust annually certify that he or she is not aware of any violation by the company of NYSE corporate governancestandards.
198

Item 10. Additional Information Corporate Governance
In accordance with NYSE listing rules applicable to foreign private issuers, Telecom Italia submitted its foreignprivate issuer annual written affirmation on June 13, 2006.
10.1.2 GENERAL
In general, the Company’s corporate governance system is made up of a series of principles, rules and proceduresdrawn by applicable laws and regulations and from international best practices. The system, designed andconstructed bearing in mind the principles formulated by the Committee for Corporate Governance of BorsaItaliana, has been implemented with the adoption of codes, regulations and policies covering the activity of all theorganizational and operational components of the Company. These documents (available in an English languageversion on the Internet at www.telecomitalia.it under “Governance”) are:
Š the Group Code of Ethics and Conduct;
Š the Company’s Self-Regulatory Code;
Š the Related Parties Procedure;
Š the Procedure for Information to Directors and Auditors;
Š the Disclosure Committee Rules;
Š the Group Procedure for the Appointment of External Auditors;
Š the Procedure for the management and public disclosure of inside information;
Š the Organizational Model 231;
Š the Meeting Regulations;
Š the Risk Management Process (CRSA–Control Risk Self Assessment).
The above documents are reviewed regularly and updated to reflect legislative and regulatory developments andchanges in international practices. In particular, the Company’s corporate Governance tools have been revised toconform with legislation on protection of savings (Law n. 262/2005 and Legislative Decree 303/2006) and theso-called Market Abuse Directive. The review (which was finalized in March 2007) has also taken into account theMarch 2006 edition of the Corporate Governance Code by Borsa Italiana.
According to new article 124-bis of the Consolidated Law on Finance, listed issuers shall annually discloseinformation on their adoption of—and, in case, compliance with—codes of conduct promoted by managementcompanies of regulated markets (such as the aforementioned Corporate Governance Code by Borsa Italiana) or bytrade associations of market participants.
❖ CODE OF ETHICS AND CONDUCT
The Code of Ethics and Conduct (the “Code of Ethics”) of the Telecom Italia Group is central to Telecom ItaliaGroup’s system of corporate governance as it spells out the Company’s fundamental values and the principlesconsidered necessary to ensure an ethically oriented conduct of business. The Code can be considered as the lyingupstream of the whole corporate governance system, since every instrument of corporate governance is based onthe principles of transparency, fairness and loyalty specified in the Code. The Code has been gradually adopted byall the companies belonging to the Telecom Italia Group since it specifies the principles to be respected inrelations with all the main stakeholders the members companies interact with on a daily basis: shareholders,financial markets, customers, local communities and employees.
The Code of Ethics was drawn up on the basis of generally accepted ethical principles and in accordance with thehighest international standards, taking into account the principles of Section 406 of the Sarbanes Oxley Actconcerning:
Š honest and ethical conduct, including the handling of actual or apparent potential, direct or indirect,conflict of interest;
Š full, accurate and timely disclosure in reports and documents to be filed or made public;
Š compliance with any applicable law, rule and regulation;
199

Item 10. Additional Information Corporate Governance
Š internal reporting of alleged violations of the Code of Ethics; and
Š accountability for compliance of the Code of Ethics.
In addition, the Company’s Self-Regulatory Code, the Related Parties Procedure, the Procedure for the Disclosureof Price-sensitive Information also deal with specific aspects of the same principles.
As with all of the Company’s corporate governance codes and principles, the Code of Ethics is reviewedperiodically in order to conform it to the developments in the applicable law and market regulations, taking intoaccount the most advanced national and international practices.
For further details, please see “Item 16B. Code of Ethics and Conduct”.
❖ BOARD OF DIRECTORS
The Company’s system of corporate governance focuses on the central role of the Board of Directors in providingstrategic guidance and in monitoring the operations, ensuring transparency of decisions, both within the Companyand in relation to the market. The Telecom Italia Self-Regulatory Code supplements the applicable rulesconcerning the tasks and functioning of the Board of Directors. All the directors are required to comply with theSelf-Regulatory Code. The Self-Regulatory Code has been adopted by the Board of Directors as a self-regulatorymeasure only and can therefore be amended at any time with a resolution adopted by the Board and promptlydisclosed to the market. On march 2007, as part of the process of revising the Company’s mechanism of corporategovernance, the Board approved a new version of this Code.
In 2005, in line with the best international practices and before it was recommended by Borsa Italiana’s newCorporate Governance Code (2006 edition), Telecom Italia’s directors had carried out a Board performanceevaluation.
In 2006, for the second Board evaluation, the Directors hired an outside consultant (Egon Zehnder International)to work alongside the independent director chosen to act as an internal facilitator, both in preparing andperforming the self-evaluating methodologies and in processing the results obtained. The consultant issued aprofessional opinion based on the evaluation of factors as independence, size and composition of the Board, roleand functioning of the Board and the Board’s committees, flow of information, decision—making procedures,relations with shareholders and stakeholders.
Role and tasks
The Board of Directors has the power (and the duty) to lead the Company by pursuing the main objective ofcreating value for its shareholders; to that end the Company’s Self-Regulatory Code reserves to the Board’sseveral important tasks, including the following:
– examining and approving the strategic, business and financial plans of the Company and the Group;
– evaluating and approving the annual budget of the Company and the Group;
– examining and approving transactions—including investments and divestments—with a substantialimpact on the Company’s activity in view of their nature, strategic importance or size;
– verifying the adequacy of the general organizational and administrative structure of the Company andthe Group;
– preparing and adopting the Company’s corporate governance rules and the Group’s governanceguidelines;
– appointing the Supervisory Panel set up under Legislative Decree 231/2001;
– nominating the persons who are to hold the offices of Chairman and Managing Director in strategicsubsidiaries;
– assessing the overall performance of operations and periodically comparing the results achieved withthose planned;
– evaluating and approving the periodic reports required by the applicable legislation.
200

Item 10. Additional Information Corporate Governance
Meetings
The Self-Regulatory Code requires the Board to meet periodically (and at least quarterly).
In 2006 the Board of Directors met eight times. Board meetings were always well attended, with more than 92%of the directors present on average (the independent directors recorded an attendance rate of more than 92%).
When board meetings were to be held, documentation permitting effective participation in the proceedings wasnormally provided well in advance. As part of the revision of the corporate governance mechanisms mentionedabove, the Company has adopted a new procedure governing the flow of information to the members of the Boardof Directors and the Board of Auditors. The new procedure (which incorporates that introduced in the past tocomply with the information requirement laid down by Article 150 of the Consolidated Law on Finance) is finalizedto coordinate all the mechanisms necessary to provide the directors and the statutory auditors with the pertinentand relevant information on a continuous basis.
In November 2006, the Company released the calendar of corporate events scheduled for 2007, listing themeetings planned for the Board of Directors during the year.
Appointment of Directors
As noted above, Telecom Italia’s bylaws provide for the Board of Directors to be elected by the Shareholders’Meeting through the slate system, which became mandatory under the Consolidated Law on Finance and thelegislation on protection of savings.
The slate system is designed to ensure an adequate presence on the Board of Directors of persons drawn fromslates presented by minority shareholders. According to Telecom Italia’s Bylaws the slates of candidates arepresented by the shareholders or by the outgoing Board of Directors. Only those shareholders who alone ortogether with other shareholders hold a total number of Ordinary Shares representing at least 1% of the sharecapital entitled to vote at the Shareholders’ Meeting (or less, according to CONSOB regulations) may submitslates. Individual candidates are required to submit curricula setting out their personal and professional data, withthe indication, where appropriate, of the grounds for their qualifying as independent, in order to allow theshareholders to exercise the right to vote in an informed manner. Each person entitled to vote may vote for onlyone slate. Four-fifths of the directors to be elected are chosen from the slate that obtains the highest number ofshareholders’ votes in the progressive order in which they are listed on the slate. The remaining directors arechosen from the other slates; the votes obtained by the various slates are successively divided by one, two, three,four or five, depending on the number of directors to be chosen, and the quotients obtained are assignedprogressively to candidates on each of these slates, in the order respectively specified on the slate. The quotientsthus assigned to the candidates on the various slates are arranged in a single decreasing order. Those candidateswho have obtained the highest quotients are elected to the Board of Directors.
At the April 2007 Shareholders’ Meeting the slate of candidates proposed by Olimpia obtained the highest numberof votes and therefore 15 out of 19 of Telecom Italia’s Directors were elected from that slate. See: Risksassociated with Telecom Italia’s ownership chain under “Item 3. Key Information—3.1 Risk Factors”.
Composition
According to the bylaws, the Board of Directors has not less than 7 and not more than 23 members; it is up to theshareholders’ meeting to decide the exact number. Directors may serve for a maximum term of three years, theymay be re-elected and there is no statutory age limit for their eligibility. There are no provisions in Italian law thatset age or shareholding requirements for directors’ qualification. There are no provisions in the Telecom ItaliaBylaws relating to the retirement of a director under an age limit requirement or the number of shares requiredfor director’s qualification.
If during the term of the Board of Directors one or more directors cease to hold such position for any reason, theBoard of Directors is allowed to appoint replacements by a resolution approved by the Board of Auditors. Thedirectors so appointed will remain in office until the next Shareholders’ Meeting. As a rule, the replacementsfinally appointed by the Shareholders’ Meeting will remain in office for the same term as the other membersalready in office at the time of their appointments; the Shareholders’ Meeting may establish a different term ofoffice for them.
201

Item 10. Additional Information Corporate Governance
Impact of Shareholders’ Agreements on the Nomination of Telecom Italia Group’s Companies Boards
Relations between the shareholders of Olimpia (as of June 13, 2007 Telecom Italia’s largest shareholder with aninterest of approximately 18% in the Company’s Ordinary Share of capital) are regulated by an agreementconcluded on August 7, 2001 and subsequently amended on September 14, 2001 and February 13, 2002. As ofMarch 2, 2007 Edizione Holding S.p.A. has been replaced by Sintonia S.p.A., while Edizione Finance InternationalS.A. has changed its name to Sintonia S.A..
Under the agreement (which is due to expire on October 4, 2007) Pirelli S.p.A., on one hand, and Edizione HoldingS.p.A. and Edizione Finance International S.A. (now respectively Sintonia S.p.A. and Sintonia S.A., and jointly:Sintonia), on the other, undertook to do everything in their power to ensure, within the limits established by law,that in Telecom Italia’s Board of Directors:
Š one-fifth of the Directors (rounded up to the nearest whole number up to two) whose designationis not reserved by law or regulation or bylaws to the market or other persons, are appointed asindicated by Sintonia;
Š the Deputy Chairman is appointed, with powers of legal representation, from among the directorsnominated by Sintonia;
Š if an Executive Committee is set up, one of its members is appointed from among the directorsdesignated by Sintonia.
On April 28, 2007, a group of investors (the “Investors”), made up of 1) Assicurazioni Generali S.p.A., SintoniaS.A., Intesa Sanpaolo S.p.A., Mediobanca S.p.A. (the “Italian Investors”) and 2) Telefónica S.A., entered into aCo-Investment Agreement establishing terms and conditions for their participation in Telco, a vehicle throughwhich they intend to purchase the entire share capital of Olimpia, from Pirelli and Sintonia S.p.A. and Sintonia S.A.(together “Sintonia Sellers”).
On May 4, 2007, the Investors entered into a Share Purchase Agreement with Pirelli and Sintonia Sellers topurchase the entire capital share of Olimpia. See also “Item 7. Major Shareholders and Related-PartyTransactions—7.1 Major Shareholders—7.1.1 The Olimpia Shareholders’ Agreements. According to theShareholders’ Agreement entered into on April 28, 2007 by the Investors, as soon as possible after the closing ofthe Share Purchase Agreement, the Board of Directors of Telco or Olimpia, as the case may be, shall approve thelist to be submitted to the shareholders’ meeting of Telecom Italia, for the appointment of the directors ofTelecom Italia, pursuant to the following criteria: (i) Telefónica—to the extent holding at least 30% of Telco’sshare capital—shall have the right vis-à-vis the other parties to designate two directors of Telecom Italia to beincluded as designees for appointment in the Board of Telecom Italia in the list presented by Olimpia or Telco (asthe case may be) and, to the extent feasible, pursuant to article 2386, first paragraph, of the Italian Civil Code (i.e.through appointment) and (ii) the Italian Investors—to the extent holding at least 50% plus one share of Telco’sshare capital—shall designate the other members of the list as follows: (a) three members unanimously and(b) the remaining members on the basis of a proportionality criterium (i.e. 1/5 each for Intesa Sanpaolo S.p.A.,Sintonia S.A. and Mediobanca S.p.A. and 2/5 for Assicurazioni Generali S.p.A.).
In accordance with the Shareholders’ Agreement, the directors designated by Telefónica in Telco, Olimpia andTelecom Italia shall be directed by Telefónica to neither participate nor vote at the Board of Directors’ meetings atwhich resolutions will be discussed and proposed relating to the policies, management and operations ofcompanies directly or indirectly controlled by Telecom Italia providing services in countries where regulatory andlegal restrictions or limitations for the exercise of voting rights by Telefónica are in force.
Independent Directors
The Company’s Self Regulatory Code adopted specific criteria conforming to international best practice and theBorsa Italiana’s Corporate Governance Code (2002 version) to qualify directors as “independent”, before theMarch 2006 edition of the Borsa Italiana’s Corporate Governance Code. Presently, Article 5 of the new version ofthe Telecom Italia Self Regulatory Code (March 2007) incorporates by reference the independence criteria set outin the latest version of the Borsa Italiana’s Corporate Governance Code. On the basis of these criteria and in thelight of the declarations made by the parties concerned and verified by the Board of Directors, at present 9, out of
202
Item 10. Additional Information Corporate Governance
the 19 directors, are considered independent, namely Paolo Baratta, Diana Bracco, Stefano Cao, Renzo Capra,Domenico De Sole, Luigi Fausti, Jean Paul Fitoussi, Cesare Giovanni Vecchio and Luigi Zingales.
To qualify as independent under the Company’s Self-Regulatory Code, Telecom Italia directors should. notmaintain, nor have recently maintained, directly or indirectly any business relationships with the issuer or personslinked to the issuer (Group companies, executive directors or members of their families), of such a significance asto influence their autonomous judgment, and should not be in a position to influence the Company as aconsequence of the shares they hold or their participation in shareholders’ agreements. In particular, a director ispresumed not to be independent, when:
a) he/she controls, directly or indirectly, the issuer, or is able to exercise over the issuer dominant influence, orparticipates in a shareholders’ agreement through which one or more persons may exercise a control orconsiderable influence over the issuer;
b) he/she is, or has been in the preceding three fiscal years, a relevant representative of the issuer, of asubsidiary having strategic relevance or of a company under common control with the issuer, or of acompany or entity controlling the issuer or able to exercise over the same period a considerable influence,also jointly through a shareholders’ agreement;
c) he/she has, or had in the preceding fiscal year, directly or indirectly a significant commercial, financial orprofessional relationship:
– with the issuer, one of its subsidiaries, or any of its significant representatives;
– with a subject who, jointly with others through a shareholders’ agreement, controls the issuer, or – incase of a company or an entity;
– with the relevant significant representatives;
or is, or has been in the preceding three fiscal years, an employee of the above mentioned subjects;
d) he/she receives, or has received in the preceding three fiscal years, from the issuer or a subsidiary or holdingcompany of the issuer, a significant additional remuneration compared to the “fixed” remuneration of a nonexecutive director of the issuer, including the participation in incentive plans linked to the company’sperformance, such as stock option plans;
e) he/she was a director of the issuer for more than nine years in the last twelve years;
f) he/she is vested with the executive director office in another company in which an executive director of theissuer holds the office of director;
g) he/she is shareholder or quota holder or director of a legal entity belonging to the same network as thecompany appointed for the accounting audit of the issuer; and
h) he/she is a close relative of a person who is in any of the positions listed in the above points.
The Board of Directors verifies after the appointment by the shareholders’ meeting which members of the Boardmeet the above referred independence requirements. In this regard, the abovementioned criteria are neitherexhaustive nor mandatory: a director may be deemed independent even though he/she does not formally meetone or more of the aforementioned criteria; vice-versa a director who satisfies all the requirements maynevertheless be deemed not independent.
The Board of Auditors verifies the correct application of principles and procedures adopted by the Board toevaluate the independence of Directors.
As mentioned above, Article 5.5 of the Company’s new Self Regulatory Code (March 2007) formalized the role ofthe Lead Independent Director, who was initially appointed, on September 9, 2004, in the person of the Chairmanof the Internal Control and Corporate Governance Committee (Mr. Ferrarini). The Lead Independent Directorcoordinates the needs and inputs of the independent directors and, in performing this task, may use theCompany’s structures and call special meetings of independent directors (“Independent Directors’ ExecutiveSessions”) to discuss issues related to the functioning of the Board or the management of the business. TheChairman of the Board benefits from the collaboration of the Lead independent Director to improve the working ofthe Board.
203

Item 10. Additional Information Corporate Governance
During 2006, five Independent Directors’ Executive Sessions were held; they were focused, among other matters,on strategic plans and on the possible reorganization of the Group.
Executive Directors and Activities of the Board
The authority to grant delegated powers to directors and revoke such mandates is reserved to the Board ofDirectors, which also establishes the limits of such powers, the manner in which they have to be exercised and theintervals—not more than three months—at which executive directors must report to the Board of Directors andthe Board of Auditors on the activity performed under the mandates conferred on them. The authority todetermine the duties and responsibilities of the general managers is also reserved to the Board of Directors.
Telecom Italia adopted an ad hoc procedure formalizing the rules for gathering and transmitting information tothe Board of Auditors and the Board of Directors on the activity performed, transactions with major implicationsfor the profitability, financial position and/or balance sheet of the Company and the Telecom Italia Group,transactions with related parties (including intra-group dealings) and atypical or unusual transactions (theProcedure for Information to Directors and Auditors). This procedure generates the information flows by means ofwhich executive directors report to the Board of Directors and the Board of Auditors.
In particular, the procedure provides for the collection and disclosure to Directors and members of the Board ofAuditors of in-depth information on:
Š the activity carried out by the Company, with special reference to the implementation of transactionsalready approved by the Board of Directors and the actions taken by executive directors in the exerciseof their delegated powers, including the projects launched;
Š the transactions of greatest significance for the Company’s profitability, financial position and balancesheet;
Š any transactions potentially involving a conflict of interest, i.e. intra-group transactions and transactionswith related parties other than those of an intra-group nature;
Š atypical and unusual transactions, in which the parties or the nature of the transaction fall outside thenormal sphere of the Company’s business and that have critical aspects in relation to their nature, therisks inherent in the type of the counterparty or the time of their implementation.
On May 6, 2004 the Board of Directors appointed Marco Tronchetti Provera as Chairman and Carlo Orazio Buoraand Riccardo Ruggiero as Managing Directors; Gilberto Benetton was appointed as Deputy Chairman.
Following the resignation of the Chairman, Marco Tronchetti Provera, on September 15, 2006, the Board ofDirectors appointed Guido Rossi as Chairman and Carlo Orazio Buora as Executive Deputy Chairman. The latterwas entrusted with the powers and responsibilities previously assigned to Marco Tronchetti Provera. Moreover,the Board confirmed Gilberto Benetton in the position of Deputy Chairman and Riccardo Ruggiero in that ofManaging Director.
Following the Shareholders Meeting, held on April 16, 2007, the newly elected Board of Directors, on April 17,appointed as Chairman Pasquale Pistorio and confirmed Carlo Orazio Buora and Riccardo Ruggiero in their role,respectively as Executive Deputy Chairman and as Managing Director.
According to Italian law and the Company’s Bylaws the Chairman and the Managing Directors (including the ExecutiveDeputy Chairman) are all legal representatives of the Company and they are individually authorized to carry out anytransaction relating to the Company’s activity. Nevertheless, the power to take decisions on transactions of particularsignificance continues to be exercised by the Board as a whole, even when they are theoretically within the limits of theexecutive directors’ mandates. This is because mandates are not considered a way of attributing exclusive competencesbut as a means of ensuring, from the standpoint of organizing the management function, the greatest possibleoperational flexibility, both within the Company and in relation to third parties.
In 2002, the Company adopted guidelines for carrying out transactions with related parties in order to ensureboth procedural and substantial fairness and transparency: to this end Telecom Italia adopted the notion of“related party” spelled out in IAS 24, as suggested by CONSOB, the Italian authority competent to supervise
204

Item 10. Additional Information Corporate Governance
financial markets. Under the guidelines, the Board of Directors is required to give advance approval totransactions with related parties, including intra-group transactions, apart from those of a customary nature to beconcluded at standard conditions. Moreover, if the related party is a director or a third party that is related via adirector, the director concerned may only provide clarifications and must leave the meeting when the motion isexamined and voted upon. Depending on the nature, value and other characteristics of related-party transactions,the Board may be assisted by one or more experts, in order to prevent contracts being concluded at inappropriateconditions. Such experts must have suitable professional experience and qualifications in the relevant field andtheir independence and freedom from conflicts of interests must be carefully assessed.
In 2006, the Board of Directors approved a specific procedure (the Related Parties Procedure) to complement theaforementioned guidelines (now incorporated in the Company’s new Self Regulatory Code: Article 11). Theprocedure is intended to ensure; (i) the standardized treatment of the issue; (ii) the identification of decision-making responsibilities; and (iii) the traceability of the operational processes. In particular, the procedureprovides for the existence of a relationship with Telecom Italia to be checked in advance by consulting an expertsystem, which uses a database of related parties to Telecom Italia. The expert system provides automaticindications concerning decision-making procedures (including the need for an expert opinion) and internalinformation flows for reporting purposes.
For additional information, see “Item 7. Major Shareholders and Related-Party Transactions—7.2 Related-PartyTransactions”.
Internal Committees
According to article 13 of the Bylaws, the Board may set up committees from among its members charged withgiving advice and making proposals and shall establish their powers and duties. According to the Self RegulatoryCode (March 2007 edition), the Board establishes three Committees: the Strategy Committee, the RemunerationCommittee, the Internal Control and Corporate Governance Committee.
Strategy Committee
The Committee is entrusted with the task of assisting the Board of Directors in formulating the Group’ strategicchoices, with special reference to decisions concerning technology, organizational finance and corporate finance.The Committee reports on its activity to the Board of Directors at least once a year, at the time the budget ispresented. The Committee may invite to its meetings the heads of units within the Company and may employconsultants and external experts.
In 2006 the Strategy Committee consisted of the Chairman of the Board (who ensured the alignment andcoordination of the activities of the Committee, the Board and management), the Managing Director (and, sinceSeptember 15, 2007, Executive Deputy Chairman, Carlo Orazio Buora), and three non-executive directors(Domenico De Sole, Marco Onado and Pasquale Pistorio) specialized in the fields of competence reserved to theCommittee. It met three times, with an attendance rate of 93%. The meetings were attended by managers of theGroup, invited according to their specific expertise to provide inputs with regard to the matters on the agenda.
The present Board of Directors appointed the members of the current Strategy Committee in the persons of: theChairman of the Board (Pasquale Pistorio), the Deputy Executive Chairman (Carlo Orazio Buora), the ManagingDirector (Riccardo Ruggiero), and four directors, Paolo Baratta, Domenico De Sole, Jean-Paul Fitoussi e RenatoPagliaro.
Internal Control and Corporate Governance Committee
The Committee is entrusted with the following tasks:
(i) to evaluate the adequacy of the internal control system;
(ii) to evaluate the work plan prepared by the person in charge of the oversight of the internal control system,from whom it receives periodic reports;
(iii) to discuss with the heads of the Company’s administrative departments and the external auditors, andsubsequently to assess, whether the accounting policies have been correctly applied and are homogeneousfor the purpose of preparing the consolidated accounts;
205

Item 10. Additional Information Corporate Governance
(iv) to evaluate the proposals made by the external auditors in order to be awarded the appointment, the auditplan and the results set out in the letter of suggestions;
(v) to report to the Board of Directors at least once every half year on the activity performed and the adequacyof the internal control system;
(vi) to perform the additional tasks that may be assigned to it by the Board of Directors, particularly as regardsrelations with the external auditors; and
(vii) to monitor compliance with the rules of corporate governance and the periodic updating thereof.
In March 2007 the Company revised the Self Regulatory Code in order to conform to the latest version of BorsaItaliana’s Corporate Governance Code, whereby the Internal Control and Corporate Governance Committee ischarged with additional tasks, including:
– expressing its opinion on the proposal for appointing, removing and assigning duties to the personresponsible for preparing the Company’ financial reports,
– assessing, together with the person responsible for preparing the Company’s financial reports, whetherthe accounting policies have been correctly applied in preparing consolidated financial statements,
– in cases of substitution of an independent director, proposing candidates for co-optation to the Board ofdirectors,
– defining the procedures and timing for conducting the “board performance evaluation”.
According to the Company’s Self Regulatory Code, the Committee is composed of independent directors. TheCommittee in charge until April 16, 2007, was appointed on May 6, 2004 and comprised Guido Ferrarini(Chairman of the Committee), Francesco Denozza, Domenico De Sole and Marco Onado. The present InternalControl and Corporate Governance Committee was appointed by the Board of Directors on May 8, 2007 and iscomposed of: Paolo Baratta (Chaiman of the Committee), Diana Bracco, Domenico De Sole, Luigi Fausti andCesare Giovanni Vecchio.
During 2006 the Committee contributed to the implementation of the Company’s instruments of corporategovernance and participated in the process of their updating. Moreover the Committee monitored theintroduction of IAS/IFRS for the financial statements of the Group and the Company and kept abreast of theprogress made by the so called 404 Project, aimed at ensuring timely and correct compliance by the Companywith the disclosure requirements set forth by Section 404 of the Sarbanes-Oxley Act. As well as monitoringtransactions that the Board deemed especially delicate, the Committee examined and approved the basicelements of the internal audit plan for 2007 and periodically assessed the work of Telecom Italia Audit &Compliance Services.
In 2006, the Committee held 15 meetings, with an attendance rate of 95%. Committee meetings were attendedby the Chairman of the Board of Auditors or by the auditor he designated; where it was deemed desirable in thelight of the issues on the agenda, the Committee and the Board of Auditors held joint meetings. In particular, theCommittee met on a number of occasions with the Board of Auditors to consider actions to be taken with respectto:
Š events relating to the ex head of the Security Function within the Company—Giuliano Tavaroli,
Š network security and services provided to the Judicial Authorities in Italy by the Company inaccordance with legal obligations applicable to all telecommunication operators in Italy, and
Š issues that arose, including responding to an order of the Italian Privacy Authority, with respect totraffic data, privacy and the collection of information on employees.
Such issues were considered of such importance that the Committee prepared an ad-hoc report describing theprocedures and actions taken by the Company, the Committee and the Board of Directors since mid-2005 throughFebruary 2007 with respect to them. A full copy of the report was filed with the SEC by the Company on a Form6-K dated February 22, 2007. The report included in the Form 6-K is an unofficial English translation of the reportprepared in Italian by the Committee. In the event of conflict or inconsistency between the terms used in the
206
Item 10. Additional Information Corporate Governance
Italian version of the report and the English translation, the Italian version shall prevail, as the official documentis the Italian version.
Remuneration Committee
The Remuneration Committee is basically charged with submitting proposals to the Board of directors for theremuneration of the Managing Directors and the directors entrusted with special tasks, and is responsible forassessing the criteria for the remuneration of the Company’s top management. To perform these duties, theCommittee may use the structures of the Company as well as external consultants.
The Committee in charge until April 16, 2007 was appointed on May 6, 2004 and was composed by Luigi Fausti(Chairman of the Committee), Paolo Baratta and Pasquale Pistorio. The present Remuneration Committee wasappointed on May, 8, 2007 and is composed solely by independent directors: Stefano Cao, Renzo Capra, LuigiFausti e Luigi Zingales.
In 2006 the Committee met five times with an average attendance rate of more than 93%.
For more information concerning the remuneration of directors and top management see “Item 6. Directors,Senior Management and Employees—6.6 Compensation of Directors, Officers and Members of the Board ofAuditors”.
Internal Control System
The Company’s internal control system is conceived as a process made up of rules, procedures and organizationalstructures for the achievement of substantial and procedural fairness, transparency and accountability, the valueslaid down by the Code of Ethics. The aim of the system is to ensure that corporate operations are efficient and canbe known and verified, that accounting and operational data are reliable, that applicable laws and regulations arecomplied with, and that the assets of the business are safeguarded, not least with a view to preventing theperpetration of fraud against the Company and the financial market.
The principal rules of Telecom Italia’s internal control system are:
Š separation of roles in the performance of the activities involved in each operating process;
Š traceability and constant visibility of decisions, so that responsibility can be pinpointed and therationale of the actions performed can be identified; and
Š decision-making on an objective basis, so that purely subjective considerations are set aside anddecisions are taken according to criteria that are established in advance and can be verified.
The Board of Directors is responsible for the internal control system. It establishes the guidelines for the systemand verifies that it is adequate and works effectively, making sure that the main operational, regulatory, economicand financial risks are appropriately identified and managed. To verify the correct operation of the internal controlsystem the Board uses the Internal Control and Corporate Governance Committee and a suitably independententity which has sufficient resources to perform the internal control function (presently, the Consortium companyTelecom Italia Audit & Compliance Services).
The Executive Deputy Chairman Carlo Orazio Buora is charged with the task of determining the mechanisms of thesystem and the manner in which it is to be implemented in accordance with the guidelines established by theBoard; he is also responsible for ensuring the system’s overall adequacy, its effectiveness and its adaptation tochanges in operating conditions and the legislative and regulatory framework. In particular, he is responsible forthe identification, monitoring and management of corporate risks, which he submits for evaluation to the Board ofDirectors.
The entity is responsible for the internal control system and is entrusted with the task of verifying the adequacyand effectiveness of the system and, where deficiencies are found, to propose appropriate remedies. To this endthe Board appointed the Company’s internal auditor (the Consortium company Telecom Italia Audit & ComplianceServices). The consortium company—through its Chairman, whom Telecom Italia nominates—reports on its
207

Item 10. Additional Information Corporate Governance
activity to the Internal Control & Corporate Governance Committee, the Board of Auditors and the ExecutiveDeputy Chairman, who is the director in charge of the internal control system. The aim of entrusting the internalauditing function to a consortium company (in which TI Media also holds an interest) is to maximize theindependence of the person responsible for internal control from Telecom Italia’s corporate structures.
In 2005 the position of Group Compliance Officer was created to coordinate the implementation of the Group’sinternal control system. The Group Compliance Officer performs a role of coordination of the various plans for theimprovement of the Group’s internal control system and is responsible for monitoring and facilitating therelationship between the Company’s management and the internal auditor, so as to guarantee, with the assistanceof Telecom Italia Audit & Compliance Services, methodological correctness in the management of risks.Furthermore, to ensure coordination of risk management at the top level, in 2006 a specific Risk ManagementCommittee, chaired by the Executive Deputy Chairman, was established.
As regards compliance with the provisions implementing the Sarbanes-Oxley Act, in 2006 the Group followedthrough on its 404 Project which commenced in the second quarter of 2005. It involved the whole Group underthe guidance at top level of a specific Steering Committee, composed of the Managing Directors of Telecom Italia(after September 16, 2006: the Executive Deputy Chairman and the Managing Director), the Group’s ChiefFinancial Officer, the General Counsel and the managers in charge of Media and Olivetti.
As per applicable Italian law, the shareholders’ meeting on April 16, 2007, introduced into the Company’s Bylaws,the position of “person responsible for preparing the Company’s financial reports”. The bylaws specifies theexperience requirements (in the fields of administration, finance and auditing) for this new position, and the Boardof Directors is in charge of appointing (and removing) this officer after consulting with the Board of Auditors andto determine the powers and duties of the office.
The Telecom Italia Group’s internal control system is completed by an ad hoc organizational model (the so called231 Organizational Model) that goes beyond the mere application of the provisions of Legislative DecreeNo. 231/2001, since it provides a paradigm for the conduct of all those who act in the Company’s name and on itsbehalf. More specifically, the model comprises “principles for dealings with governmental bodies” (elaborated asa set of rules for relations with representatives of such bodies) and “internal control checklists” listing: (i) themain stages of every process, (ii) the offences that may be committed in relation to individual processes, and(iii) the control activities to prevent the related risks. The organizational model is reviewed periodically. In 2006some modifications were necessary to adapt the model to changes in the relevant legislation, while othermodifications were deemed appropriate in the light of experience in the application of the model. In addition,through the 231 Steering Committee, the Company checked the adequacy of the internal control system withrespect to new types of offenses, with special reference to the market abuse.
The functioning of the model and compliance with it are monitored by a Supervisory Panel composed of amember of the Board of Auditors, an independent director and the person responsible for the internal controlsystem. The panel’s composition thus embraces all the professional skills involved in the control of operations andis aimed to ensure the body’s independence. The Supervisory Panel reports to the Board of Directors, theCommittee for Internal Control and Corporate Governance and the Board of Auditors on the checks performedand their results. A special unit has been created within Telecom Italia Audit & Compliance Services to provideoperational support to the Supervisory Panels by handling reports of violations of the organizational model andconducting compliance audits on the basis of the data received through the information flows that have been putin place.
Board of Auditors
Tasks and role
The Board of Auditors verifies the observance of the law and the Bylaws and verifies the observance of the bestadministration principles, the adequacy and reliability of corporate structures, internal audit procedures andaccounting system, and the adequacy of instructions given by the Company to its subsidiaries. The Board ofAuditors must receive timely disclosures, at least on a quarterly basis, from the Board of Directors about thecompany’s business and significant transactions performed by the company and its subsidiaries, including relatedparties transactions. Statutory Auditors must inform the CONSOB of any irregularity they detect in the course of
208

Item 10. Additional Information Corporate Governance
their duties and are required to attend Shareholders’ Meetings, Board of Directors meetings and ExecutiveCommittee meetings (in case such Committee is established).
In order to make available the broad range of information needed by the Board of Auditors (if such Committee isestablished) to perform its control function effectively, the Company introduced the Procedure for Compliancewith the Requirements of Article 150.1 of the Consolidated Law On Finance. This procedure has been recentlyincorporated by the Procedure for Information to Directors and Auditors.
The Board of Auditors held 32 meetings during 2006 (some jointly with the Internal Control and CorporateGovernance Committee), with an attendance rate of 92%. In addition, its members participated in the meetings ofthe Board of Directors and periodically received the reports from the executive directors, as provided in the abovementioned procedure.
In addition to the tasks performed while acting in lieu of the Audit Committee (see below), in 2006 the Board ofAuditors carried out supervisory functions provided for under Italian law: verifying that the transactions ofgreatest significance for the Company’s profitability, financial position and assets and liabilities conformed withthe law, the bylaws and the principles of correct management; checking that transactions with related partiescomplied with the self-regulatory principles and procedures adopted by the Company and that they were in itsinterest; and checking the adequacy of the organizational structure. The Board of Auditors also monitored theadequacy of the internal control system and that of the administrative and accounting system and the latter’sreliability in correctly representing transactions. In particular, during 2006, the adequacy of organizationalstructure and the internal control system has been subject matter of evaluation by the Board of Auditors (whichmet several times jointly with the Internal Control and Corporate Governance Committee), in connection withproblems concerning the Group’s Security Function, network security and handling of traffic data. Lastly, theBoard investigated the reports it received under Article 2408 of the Italian Civil Code and the complaintssubmitted to it as Audit Committee (see below the description of the ad-hoc procedure it adopted to this end).
Appointment
Telecom Italia’s Board of Auditors is composed of five regular auditors, and two alternate auditors. Pursuant toArticle 17 of Telecom Italia’s Bylaws the Board of Auditors is appointed by the Shareholders’ Meeting through theslate system under the same procedure used for the election of the Board of Directors. Three regular auditors andone alternate auditor are drawn from the so called “majority slate” (that is a slate that obtained the majority ofthe votes cast by the shareholders), two regular auditors are taken from the other slates, so called “minorityslates”. One alternate auditor is drawn from the “minority slate” which has obtained the largest number of votes.
In case an auditor chosen from the “majority slate” or one of the “minority slates” ceases from office, thealternate chosen respectively from the “majority slate” or the “minority slate” takes his/her place, until the nextShareholders’ Meeting, which will appoint a replacement. Pursuant to article 148 of the Consolidated Law onFinance (as amended by the legislation on protection of savings), the Chairman of the Board of Auditors isappointed by the shareholders’ meeting from among the auditors elected from a “minority slate”.
Auditors serve for a three-year term, may be reappointed and may be removed from their office for just cause andupon a resolution approved by the competent court.
The present Board of Auditors was elected, for a three year term, by the shareholders meeting of April 13, 2006,on the basis of two slates presented respectively by Olimpia (Telecom Italia’s largest shareholder) and by minorityshareholders. Salvatore Spiniello, Ferdinando Superti Furga and Gianfranco Zanda were elected from the “majorityslate”, while Paolo Golia and Stefano Meroi were elected from the “minority slate”. Paolo Golia was appointed, bythe shareholders meeting, as Chairman of the Board. Following the resignation of one of the two minoritymembers, Stefano Meroi, on October 20, 2006, the alternate director elected from the minority slate, Enrico MariaBignami, took the office until the shareholders’ meeting of April 16, 2007, which formally appointed him. Thesame meeting appointed a new alternate auditor, in the person of Luigi Gaspari, who was designated by the sameshareholders who had submitted the slate from which Stefano Meroi e Enrico Maria Bignami were elected.
209
Item 10. Additional Information Corporate Governance
Audit Committee
As described above, the Board of Auditors plays a key role in the Company’s system of corporate governance. Thisis confirmed not only by the number of meetings in 2006 (32 meetings of which some, as mentioned earlier, wereheld jointly with the Committee for Internal Control and Corporate Governance) but also by the Company’schoices relating to US law.
More specifically, according to Rule 10A-3 under the 1934 Act and NYSE listing standards, the Board of Auditorshas been identified to act as Telecom Italia’s Audit Committee. The Board of Auditors meets the requirements ofthe general exemption contained in Rule 10A-3(c)(3):
Š the Board of Auditors is established pursuant to applicable Italian law and Telecom Italia’s Bylaws;
Š under Italian legal requirements, the Board of Auditors is separate from the Board of Directors;
Š the Board of Auditors is not elected by the management of the Company and no executive officer isa member of the Board of Auditors;
Š all of the members of the Board of Auditors meet specific independence requirements from theCompany and its Group, the management and the auditing firm, as set forth by Italian legalprovisions;
Š the Board of Auditors, in accordance with and to the extent permitted by Italian law, is responsiblefor the appointment, retention (via proposal to the shareholders’ meeting) and oversight of thework of the Company’s external auditors engaged for the purpose of issuing the audit report on theannual financial statements;
Š the Board of Auditors is authorized to engage independent counsel and other advisers, as it deemsappropriate; and
Š the Board of Auditors has adopted a complaints procedure in accordance with Rule 10A-3 of the1934 Act.
As concerns the appointment and retention of the external auditor, in 2003 the Telecom Italia Group introduced aprocedure that made the choices of the Directors subject to the corroborating opinion of the Board of Auditors(the procedure is available on the Company’s website, under “Governance”). Pursuant to the legislation onprotection of savings, at present, the Board of Auditors is directly called to submit the proposal for theappointment of the external auditor directly to the shareholders’ meeting. Consequently, the Board of Auditorssubmitted its proposal concerning the appointment of the external auditor to shareholders meeting of April 16,2007.
In view of its responsibilities under Italian law and the obligations deriving from US law, in 2005 the Board ofAuditors adopted a complaints procedure for receiving, retaining and treating the “reports” it receives. Suchreports can be of the following kinds:
Š statements of violations submitted by shareholders concerning matters deemed to be improper;
Š complaints by any person, thus including non-shareholders, concerning alleged irregularities,improper facts or, more generally, any problem or issue deemed to merit investigation by thecontrol body;
Š complaints specifically regarding accounting, internal accounting controls, or auditing matters;
Š confidential, possibly anonymous submissions of “concerns” by employees of the Company or theGroup regarding questionable accounting or auditing matters.
A short description of how such reports are to be submitted to the Board of Auditors/Audit Committee is availableon the Company’s website under “Governance”.
210

Item 10. Additional Information Corporate Governance
Shareholders’ Meetings
Meetings of Ordinary Shareholders
Holders of Ordinary Shares are entitled to attend and vote at ordinary and extraordinary shareholders’ meetings(“Shareholders’ Meetings”). At any Shareholders’ Meeting, each holder is entitled to cast one vote for eachOrdinary Share held. Votes may be cast personally or by proxy. Holders of Ordinary Shares can also vote by mail.
Shareholders’ Meetings are called by the Company’s Board of Directors when required by law or the shareholdersor deemed necessary.
Shareholders’ Meetings must be convened at least once a year. At these ordinary meetings, holders of OrdinaryShares (i) approve the annual accounts, (ii) appoint/revoke directors and auditors and determine theirremuneration, when necessary, (iii) vote on other issues defined in the Bylaws, if any, (iv) authorize thecompletion of the transactions by the directors, if and when the Bylaws call for such previous authorization, itbeing understood that directors remain directly responsible for the transactions accomplished, (v) adopt rules ofprocedure for the shareholders’ meetings (Meeting Regulations). Telecom Italia’s Bylaws do not entrust to theordinary shareholders’ meeting any additional responsibility according to points (iii) and (iv) above. The annualaccounts of the Company are submitted for approval to the annual Shareholders’ Meeting, which must beconvened within 120 days after the end of the financial year to which they relate or, where special circumstancesmake this necessary, within 180 days of the end of the fiscal year; if the meeting is called within 180 days, thedirectors shall give the reasons for the delay in the report on operations included in the annual report.
Extraordinary Shareholders’ Meetings may be called to pass upon proposed amendments to the Bylaws, capitalincreases, mergers, dissolutions, issuance of convertible debentures (which can also be delegated to the Board ofDirectors), appointment of receivers and similar extraordinary actions.
Shareholders are informed of all Shareholders’ Meetings to be held by publication of a notice in Gazzetta Ufficialedella Repubblica Italiana at least 30 days before the date fixed for the meeting. In the case of a Shareholders’Meeting that is called at the request of the minority shareholders or a Shareholders’ Meeting called to approve theliquidation of the Company, the notice period is reduced to 20 days. The notice period is reduced to 15 days if theCompany is subject to a tender offer and a Shareholders’ Meeting is called to consider defensive actions againstsuch tender offer (in which case resolutions must be approved by at least 30% of the holders of the voting sharesoutstanding at all calls of the Shareholders’ Meeting). The notice must also be published in at least one nationaldaily newspaper. The notice of a Shareholders’ Meeting may specify up to two meeting dates for an ordinaryShareholders’ Meeting and up to three meeting dates for an extraordinary Shareholders’ Meeting (“calls”).
An ordinary Shareholders’ Meeting is duly constituted on first call with the attendance of at least 50% of theoutstanding Ordinary Shares, while on second call there is no quorum requirement. In either case, resolutions areapproved by holders of the majority of the Ordinary Shares represented at the meeting.
Extraordinary Shareholders’ Meetings are duly constituted with the attendance of shareholders representing atleast one-half or more than one-third or at least one-fifth of the company’s ordinary share capital, on the first call,second call and third call, respectively. The favorable vote of at least two-thirds of the Ordinary Sharesrepresented at the meeting is necessary for the resolution approval. Resolutions concerning capital increases withthe exclusion or limitation of subscription rights must always be approved by holders of more than 50% of theshares outstanding, irrespective of the call in which the resolution is taken.
To attend any Shareholders’ Meeting, an ad hoc communication by the authorized intermediary must have beenreceived by the Company at least two days before the meeting takes place. The communication procedure doesnot involve any blocking of the so called deposited shares: no transfer is required and the shares may bewithdrawn at any time. In case of the shares’ withdrawal, their prior deposit becomes ineffective for purposes ofattending the meeting.
Special arrangements with the Depositary may be required for the beneficial owner of ADRs representing ADSs toattend Shareholders’ Meetings and exercise voting rights with respect to underlying Ordinary Shares. See “—10.5Description of American Depositary Receipts—Voting of Deposited Securities”.
211

Item 10. Additional Information Corporate Governance
As a rule, votes cast in the Shareholders’ Meeting are open, as the minutes of the meeting are required toevidence how attending shareholders voted.
Shareholders may attend the meeting by proxy using a power of attorney. Any one proxy cannot represent morethan 200 shareholders. A proxy may be appointed only for one single meeting (including, however, the first,second and—in case of extraordinary meetings—third call) and may be substituted only by the person expresslyindicated in the form. The proxy can neither be a director, statutory auditor, employee of the company or of oneof its controlled subsidiaries, nor a controlled company or the independent auditors of Telecom Italia orshareholders, directors, statutory auditors or employees of such independent auditors.
Votes by proxy may be solicited and collected for the shareholders’ meetings of listed companies. Proxysolicitation provisions allow individuals (so-called consignors), to promote, through special brokers, the solicitingof votes by proxy at shareholders’ meetings. The ownership—including joint ownership—of at least 0.5% of thecompany’s voting share capital (registered in the shareholders’ register for at least six months) is a requisite forbecoming a consignor. Soliciting brokers may be investment companies, banks, asset management companiesand joint-stock companies, with soliciting votes by proxy as their only corporate object.
Shareholders associations composed of at least 50 people, each with no more than 0.1% voting share capital, maycollect proxies among their group. In order to facilitate such operation among employee shareholders, the Bylawsprovides that special spaces will be made available to such shareholders associations where information aboutsolicitation can be made available and proxy collection operations can be carried out.
Ordinary Shareholders may also vote by mail. The “vote by mail” cannot be cast by proxy. The system isessentially based on the following principles: (a) the notice calling the shareholders’ meetings must specify thatshareholders can vote by mail and must describe the procedures they have to follow; (b) the notice must also besent to the centralized securities depositary system which will in turn distribute the notice to the depositarybanks; (c) shareholders wishing to vote by mail must send the company a copy of the communication issued bythe depositary banks certifying their shareholding and entitling them to vote and a special form (so called ballot)made available to such purpose by the issuer, which has to comply with specific CONSOB requirements; (d) suchspecial forms are kept by the Chairman of the Board of Auditors until the votes are counted; (e) votes cast by mailmust be delivered to the company at least 48 hours prior to the Shareholders’ Meeting; and, finally, (f) votes castby mail remain valid for the second and third calls of the meeting and can be revoked by a written declarationuntil the day before the meeting.
The shareholders’ meetings shall be called when requested by shareholders representing at least 10% of acompany’s share capital. In the case the directors or in their place the statutory auditors don’t call theShareholders Meeting, the Court orders with a decree the call of the Shareholders Meeting, after having heard thedirectors and statutory auditors, if the refusal is unjustified. Shareholders are not allowed to present requests ontopics upon which the Shareholders Meeting resolves, pursuant to Italian law, on directors’ proposal or on aproject basis or on their reports only.
Shareholders representing at least 2.5% of the share capital may request, within five days of the publication of thenotice convening the meeting, additions to the agenda, specifying in the request the additional items theypropose. Additions to the agenda may not be made for matters on which the shareholders’ meeting is required bylaw to resolve on proposals put forward by the directors or on the basis of a plan or report by the Board ofDirectors. Notice of items added to the agenda following requests by shareholders, as above, shall be given in thesame forms prescribed for the publication of the notice convening the meeting. The shareholders’ power torequest additions to the agenda is now formally regulated by an ad-hoc amendment to Article 18 of the Bylaws,approved by the shareholders’ meeting of April 16, 2007.
The Shareholders’ Meeting on May 6, 2004 adopted a set of Rules of Proceeding, which apply to both Ordinaryand Extraordinary meetings, which has been amended by the shareholders’ Meeting of April 16, 2007, in order toconform to the legislation on the protection of savings. The new version of the Rules requires shareholdersrequesting additions to the agenda of the shareholders’ meeting to present an ad-hoc report describing theirproposal.
212

Item 10. Additional Information Corporate Governance
Meetings of Savings Shareholders
Although holders of Savings Shares are not entitled to vote in meetings of holders of Ordinary Shares, they areentitled to attend special meetings of holders of Savings Shares (“Special Meetings”) and to appoint a jointrepresentative (the “Joint Representative”) to represent them, with respect to the Company.
The Joint Representative, who is appointed by the Special Meeting or, in default, by the Court, is entitled (i) toinspect certain corporate books of the Company, (ii) to attend the Shareholders’ Meetings and (iii) to challenge incourt the resolutions adopted by such meetings. The Joint Representative is appointed for a maximum three-yearterm and, according to the Bylaws, is kept informed by the Company regarding corporate events that can affectthe price trend of Savings Shares. The Savings Shareholders Meeting held on May 16, 2007 reappointed Mr. CarloPasteris as joint Representative for a three year period.
Special Meetings of Savings Shareholders may be called when deemed necessary or upon request by SavingsShareholders representing at least 1% of the outstanding Savings Shares either by the Joint Representative or bythe Company’s Board of Directors in order to (a) appoint and revoke the Joint Representative, (b) approve theresolutions of the Shareholders’ Meetings that may affect the rights of Savings Shares, (c) set up an expense fundfor the coverage of costs incurred in protecting rights of the Savings Shareholders, (d) negotiate possible disputeswith the Company; and (e) resolve other issues relating to their position as holders of Savings Shares. To adoptresolutions related to (a), (c) and (e) above, a favorable vote of at least 20% of the Savings Shares is required atSpecial Meetings held on the first call, a favorable vote of at least 10% is required at Special Meetings held on thesecond call, and a favorable vote of at least a majority of the Savings Shares present is required at SpecialMeetings held on the third call. To adopt resolutions related to (b) and (d) above, a favorable vote of at least 20%of the Savings Shares is required at all calls of the Special Meetings.
To attend any Special Meeting, an ad hoc communication by an authorized intermediary must have been receivedby the Company at least two days before the meeting takes place. Special arrangements with the Depositary maybe required for the beneficial owner of ADRs representing Savings Share ADSs to attend Special Meetings andexercise voting rights with respect to underlying Savings Shares. See “—10.5 Description of American DepositaryReceipts—Voting of Deposited Securities”.
Disclosure
Transparent relations with the financial markets, and the provision of accurate, clear and complete informationare standards for the conduct of the members of the governing bodies, the management and all the employees ofthe Telecom Italia Group. Specific procedures are used for classifying and managing information from astandpoint of confidentiality.
The procedure for disclosing price-sensitive information adopted in 2002 (Procedure for the Disclosure of Price-sensitive Information) was replaced pursuant to a resolution of the Board of Directors on March 7, 2006, by amore comprehensive procedure for the disclosure of inside information, as the result of activity of the workinggroup the Company set up to evaluate the effects of the transposition into Italian law of the EU’s Market AbuseDirective.
The procedure (posted on the Company’s website under “Governance”) covers the handling—including the publicdisclosure—of inside information concerning Telecom Italia, its unlisted subsidiaries and listed financialinstruments, and is addressed to all the members of the governing bodies, employees and outside consultants ofGroup companies who have potential access to inside information. It also applies as an instruction to allsubsidiaries for the purpose of promptly obtaining the necessary information for timely and correct compliancewith public disclosure requirements. The procedure also governs the register of persons with access to insideinformation, which has been operational since April 1, 2006.
The Procedure for the management and public disclosure of inside information provides for:
Š the requirements and responsibility for the classification of inside information;
Š the manner of tracing access to inside information being prepared, with special regard to thecreation of the register required by Italian law;
213

Item 10. Additional Information Corporate Governance
Š the instruments and rules for safeguarding inside information in the making;
Š the operational rules for the disclosure of inside information to the market and in general for publicannouncements and/or communications to analysts/investors.
The procedure resulted from the initiative of the Disclosure Committee that the Company established in 2004 toprovide assistance to the Board of Directors and top management as regards the processing and handling of dataand news necessary for the correct provision of information. The main tasks of the Committee were:
Š to assist the Board in the preparation of corporate communications (including preparation of theAnnual Report on Form 20-F), the Senior Officers (as defined below) in the certification of theAnnual Report of Form 20-F filed with the SEC in accordance with the Sarbanes-Oxley Act, and thedirector appointed to handle price-sensitive information;
Š to monitor the application of procedures and controls for the collection, analysis and retention ofdata and information for publication and filing, verify their adequacy and effectiveness and proposecorrective measures where appropriate; and
Š to supervise the structure and updating of the Company’s website as regards its institutionalcontents.
The role and operating rules of the Disclosure Committee (which are posted on the Company’s website under“Governance”), have been revised as part of a process of updating the Company’s different mechanisms ofcorporate governance, so that the Disclosure Committee is now focused on validating, monitoring and checkingthe effectiveness of the procedures and controls used for gathering, analyzing, retaining and processing the dataand information to be transmitted to Directors and Statutory Auditors on the one hand and to be disclosed to themarket on the other.
With reference to the preparation of the Annual Report, the Committee, which had sponsored the 404 Project,examined the “Procedure for the Preparation of the Telecom Italia 2006 Annual Report (Form 20-F)”. In thisconnection, a specific mechanism of upward attestation by the people in charge of the various corporatestructures involved in the process of gathering and handling data and drafting the document was set up to giveadequate assurance to and support the senior officers, the Board of Auditors, the Internal control and CorporateGovernance Committee and the Board of Directors as a whole in fulfilling their responsibility for oversight of theaccuracy and timeliness of required disclosures.
214

Item 10. Additional Information Exchange Controls And Other Limitations Affecting Security Holders
10.2 EXCHANGE CONTROLS AND OTHER LIMITATIONS AFFECTING SECURITY HOLDERS
Foreign Investment and Exchange Control Regulations in Italy
There are no exchange controls in Italy. Residents of Italy may hold foreign currency and foreign securities of anykind, within and outside Italy. Non-residents may invest in Italian securities and may export cash, instruments ofcredit and securities, in both foreign currency and euro, representing interest, dividends, other asset distributionsand the proceeds of dispositions without restriction other than those outlined below. There are no limitations onthe right of non-resident or foreign beneficial owners to vote their Shares except as provided for all Telecom Italiashareholders by law. See “—10.4 Description of Capital Stock—Limitations on Voting and Shareholdings”.
Updated reporting and record-keeping requirements are contained in recent Italian legislation which implementsan EU Directive regarding the free movement of capital. Such legislation requires that transfers of cash or bearerbank or postal passbooks or bearer instruments in euro or in foreign currency, effected for whatsoever reasonbetween different parties, shall be carried out by means of authorized intermediaries when the total amount ofthe value to be transferred is more than €12,500.00. The threshold referred to above also applies when there isreason to believe that several transactions, effected at different times within a certain period of time, constitutepart of a single transaction, even if individually below the threshold amount specified. Whenever the execution ofsuch transactions leads to believe that there are irregularities in their performance, such transactions shall bereported in writing to the Ufficio Italiano Cambi (the Italian Exchange Office) which shall carry out necessarychecks. Credit institutions and other intermediaries effecting such transactions on behalf of residents ornon-residents of Italy are required to maintain records of such transactions for ten years, which may be inspectedat any time by Italian tax and judicial authorities. Non-compliance with the above may result in administrativefines or, criminal penalties, if the transactions fall within a case ruled by the criminal code. The Ufficio ItalianoCambi will maintain records relating to either persons notified of infringements or persons in whose regard adefinitive sanction has been issued in its information system for a period which varies depending on the case.
Certain additional procedural requirements are imposed for tax reasons. Non-corporate residents of Italy effectingtransfers to and from Italy in excess of €12,500.00 in one year must disclose them in their annual income taxreturns. Non-corporate residents must also give details in their income tax returns of financial assets held outsideItaly at the end of the fiscal year and of transfers in excess of €12,500.00 to, from, within and between foreigncountries in connection with such assets during the fiscal year. No tax returns is required in respect of foreigninvestments and foreign income-earning assets that are exempt from income tax or subject to withholding tax inItaly. Such disclosure requirements do not apply (i) if the total value of the investments and assets at the end ofthe taxable period or the total amount of the transfers effected during the year is not greater than €12,500.00 or(ii) in respect of foreign investments, foreign assets or transfers within the EU (except for transfer from or toItaly). For corporate residents there is no requirement for such a declaration because their financial statements(on the basis of which their tax returns are prepared) already contain the information.
There can be no assurance that the present regulatory environment in or outside Italy will endure or thatparticular policies presently in effect will be maintained, although Italy is required to maintain certain regulationsand policies by virtue of its membership in the EU and other international organizations and its adherence tovarious bilateral and multilateral international agreements.
215

Item 10. Additional Information Description Of Bylaws
10.3 DESCRIPTION OF BYLAWS
Object
Telecom Italia’s objects are described in Article 3 of the Bylaws. Such objects are:
Š to install and operate fixed or mobile equipment and installations for the purpose of providing andoperating telecommunications services and to carry out the activities directly or indirectly relatedthereto;
Š to hold interests in other businesses falling within the scope of the above stated corporate object orotherwise related thereto; and
Š to control and provide the strategic, technical, administrative and financial coordination, overseeing andmanaging the financial activities of controlled companies and businesses, and carrying out alltransactions related thereto.
Directors
There are no provisions in the Bylaws relating to: (1) the power of a director to vote on a proposal in which suchdirector is materially interested, (2) the power of a director to (in the absence of an independent quorum) votecompensation to himself or any member of its body, (3) the power of a director to borrow money from theCompany, (4) the retirement of a director under an age limit requirement and (5) the number of shares requiredfor director’s qualification.
For a description of a Director’s power to vote on matters in which he may be materially interested, and to vote oncompensation issues, please See “—10.1 Corporate Governance—10.1.2 General—Board of Directors—ExecutiveDirectors and Activities of the Board” and “—10.1 Corporate Governance—10.1.2 General—Board of Directors—Internal Committees—Remuneration Committee”.
The Board of Directors grants specific positions to any of its members in compliance with the Bylaws of thecompany; such positions include, among others, those of Chairman and Managing Director. According to Italianlaw the remuneration corresponding to such positions is then defined by the Board of Directors in its discretion,after acknowledging the opinion of the Board of Auditors.
There are no provisions in Italian law that govern the issue of directors borrowing money from the company andthat set age or shareholding requirements for director’s qualification.
Recent amendments
The shareholders’ meeting held on April 16, 2007 approved a series of amendments to the Bylaws to adapt it tothe provisions of Law 262/2005 (the so-called Law on the Protection of Savings), as amended by LegislativeDecree 303/2006. Some amendments also responded to the recommendations and criteria set forth by the ItalianStock Exchange new Corporate Governance Code (March 2006 edition).
In brief:
– the amendments to the Company’s object (Article 3) updated the description of the Company’s goals(dating back to 1997 in its formulation). The formal revision of the clause therefore was aimed atclarifying and modernizing a text that had become obsolete;
– rules were introduced concerning the organization of savings shareholders (Article 6) and bondholders(Article 8). In both cases the principle was introduced that the Company should bear the relatedorganizational costs, within different limits;
– various changes were passed to the provisions on the Board of Directors (Article 9), some servingmerely to clarify or simplify the text, while others to adapt the provisions to the new legislative andregulatory framework. Corresponding amendments were approved with reference to the Board ofAuditors (Article 17);
216

Item 10. Additional Information Description Of Bylaws
– the provisions concerning corporate offices (Article 10) was revised and the possibility of appointingmore than one Deputy Chairman was introduced;
– as established by law, the Board was entrusted with appointing the manager responsible for thepreparation of the Company’s financial reports (Article 13);
– the articles concerning the shareholders’ meetings (Articles 18 and 20) were modified in order both toadapt them to the new legislative provisions and to clarify and simplify their formulation.
For a description of the new set of rules, please See “—10.1 Corporate Governance”.
217
Item 10. Additional Information Description Of Capital Stock
10.4 DESCRIPTION OF CAPITAL STOCK
As of April 18, 2007, the subscribed and fully paid-up capital stock was equal to €10,673,776,696.55 divided into13,380,746,060 Ordinary Shares and 6,026,120,661 Savings Shares, each with a par value of €0.55.
The Shareholders’ Meeting of May 26, 2003, reiterating, updating and, where necessary, renewing earlierresolutions of the Shareholders’ Meeting and the Board of Directors resolved to increase the share capital by up toa maximum of €624,936,779.50 (at April 18, 2007 €125,771,565.15), by means of the issue of up to a maximumof 1,136,248,690 (at April 18, 2007 228,675,573).
Ordinary Shares with a par value of €0.55 each to be reserved irrevocably and exclusively for the conversion of the“Olivetti 1.5% 2001-2010 convertible notes with redemption premium” (now “Telecom Italia 1.5% 2001-2010convertible notes with redemption premium”) convertible bonds, on the basis of 0.471553 Ordinary Shares foreach bond presented for conversion.
The Shareholders’ Meeting of May 26, 2003 also resolved to increase the share capital by up to a maximum of€183,386,986.75 (at April 18, 2007 €55,307,528.10), by means of the issue of up to a maximum of 333,430,885(at April 18, 2007 100,559,142).
Ordinary Shares with a par value of €0.55 each, divided into the following outstanding divisible tranches:
Š a tranche of up to a maximum of €37,398,868.65 (at April 18, 2007 €9,712,784.40) for the exercise ofthe “Piano di Stock Option 2000” stock options, increase to be implemented by July 30, 2008 by meansof the issue of up to a maximum of 67,997,943 (at 18 April 2007 17,659,608) shares with a par value of€0.55 each, to be subscribed for at a total price of €13.815 per option held (i.e. at a price of €4.185259for each newly-issued share);
Š a tranche of up to a maximum of €21,422,652.90 (at April 18, 2007 €16,484,542.80) for the exercise ofthe “Piano di Stock Option Top 2002” stock options, increase to be implemented by February 28, 2010by means of the issue of up to a maximum of 38,950,278 (at April 18, 2007 29,971,896) shares with apar value of €0.55 each, to be subscribed for at a total price of €9.203 per option held (i.e. at a price of€2.788052 for each newly-issued share);
Š a tranche of up to a maximum of €50,268,799.90 (at April 18, 2007 €29,110,200.90) for the exercise ofthe “Piano di Stock Option 2002” stock options, increase to be implemented by March 31, 2008 for thefirst lot, by March 31, 2009 for the second lot and by March 31, 2010 for the third lot by means of theissue of up to a maximum of 91,397,818 (at April 18, 2007 52,927,638) shares with a par value of €0.55each, to be subscribed for at a total price for the different options of respectively €9.665, €7.952 and€7.721 per option held (i.e. at a price for the different options of respectively €2.928015 €2.409061 and€2.339080 for each newly-issued share).
The Shareholders’ Meeting held on April 7, 2005 resolved to increase the share capital by up to a maximum of€38,655,832.60 (at April 18, 2007 €27,304,720.30), by means of the issue of up to a maximum of 70,283,332 (atApril 18, 2007 49,644,946) Ordinary Shares with a par value of €0.55 each, divided into the following outstandingdivisible tranches:
1. a tranche of up to a maximum of €11,705,656.05 (at April 18, 2007 €9,320,515.05) for the exercise ofthe “2000- 2002 Stock-Option Plans” stock options, increase to be implemented by December 31, 2008by means of the issue of up to 21,283,011 (at April 18, 2007 16,946,391) Telecom Italia OrdinaryShares with a par value of €0.55 each, to be subscribed for at a total price of €6.42 per option held (i.e.at a price of €3.710983 for each newly-issued share);
2. a tranche of up to a maximum of €22,150,920 (at April 18, 2007 €16,380,072.50) for the exercise of the“2002-2003 Stock-Option Plans” stock options, increase to be implemented by December 31, 2008 bymeans of the issue of up to 40,274,400 (at April 18, 2007 29,781,950) Telecom Italia Ordinary Shareswith a par value of €0.55 each, to be subscribed for at a total price of €5.67 per option held (i.e. at aprice of €3.277457 for each newly-issued share);
218
Item 10. Additional Information Description Of Capital Stock
3. a tranche of up to a maximum of €3,192,173.05 (at April 18, 2007 €1,604,132.75) for the exercise of the“2003-2005 Stock-Option Plans” stock options, increase to be implemented by December 31, 2008 forthe first lot, by December 31, 2009 for the second lot and by December 31, 2010 for the third lot bymeans of the issue of up to a maximum of 5,803,951 (at April 18, 2007 2,916,605) Telecom ItaliaOrdinary Shares with a par value of €0.55 each, to be subscribed for at a total price of €5.07 per optionheld (i.e. at a price of €2.930636 for each newly-issued share).
Telecom Italia’s Extraordinary Shareholders’ Meeting of May 6, 2004 resolved that for five years starting fromMay 6, 2004 the Board of Directors may increase the share capital in one or more tranches by up to a maximumtotal amount of €880,000,000 by means of cash issues of up to a maximum of 1,600,000,000 Ordinary Shares, allor part of which:
(i) to be offered with the right of pre-emption to shareholders and holders of convertible bonds; or
(ii) to be offered for subscription to employees of Telecom Italia S.p.A. or its subsidiaries, with theexclusion of the right of pre-emption, provided such increase in capital does not exceed 1% of thecapital attested at the date of the offering, pursuant to the combined effects of Article 2441, lastparagraph, of the Civil Code and Articles 134(2) of Legislative Decree 58/1998.
Resolutions to increase the share capital adopted by the Board of Directors in exercising the powers attributedabove shall set the subscription price (including any premium) and a time limit for the subscription of the shares;they may also provide, in the event that the increase approved is not fully subscribed within the time limitestablished for each issue, for the capital to be increased by an amount equal to the subscriptions received up tosuch time. Up until now, the aforementioned powers have not been exercised.
Telecom Italia Extraordinary Shareholders’ Meeting of May 6, 2004 also resolved that the Board of Directors mayissue, in one or more tranches and for up to a maximum of five years from May 6, 2004, convertible bonds up to amaximum amount of €880,000,000. Up until now, the aforementioned powers have not been exercised.
Classes of shares
According to Italian law, Savings Shares may not be issued for an amount which, including other preferred shares,if any, exceeds one-half of the Company’s share capital.
Pursuant to Telecom Italia’s Bylaws, any reduction in share capital made for the purpose of absorbing losses isapplied to the par value of the Ordinary Shares until they have been reduced to zero and only then is the par valueof the Savings Shares reduced. If, as a consequence of capital reduction, the Savings Shares exceed half of theCompany’s share capital, such excess must be eliminated within the following two years.
Form and Transfer
The Dematerialization Decree provides for the dematerialization of financial instruments publicly traded onregulated markets, including treasury bonds.
As a result, Ordinary Shares and Savings Shares must be held with Monte Titoli. Most Italian banks, brokers andsecurities dealers have securities accounts as participants with Monte Titoli and beneficial owners of OrdinaryShares and Savings Shares may hold their interests through special deposit accounts with any such participant.The beneficial owners of Ordinary Shares and Savings Shares held with Monte Titoli may transfer their OrdinaryShares, collect dividends and exercise other rights with respect to those shares through such accounts. Suchshares held by Monte Titoli are transferred between beneficial owners by appropriate instructions being given tothe relevant participants associated with Monte Titoli to debit the account with the bank of the vendor and tocredit the account with the bank of the purchaser.
Voting rights relating to Ordinary Shares and Savings Shares that have not been deposited with Monte Titoli maybe exercised only by depositing them with an authorized intermediary. The Company may be requested toperform the functions of an intermediary.
Each person owning a beneficial interest in Ordinary Shares and Savings Shares held through Euroclear orClearstream must rely on the procedures of Euroclear or Clearstream, respectively, and of institutions that have
219

Item 10. Additional Information Description Of Capital Stock
accounts with Euroclear or Clearstream to exercise any rights of a holder of shares. Holders may requestEuroclear or Clearstream to transfer their Ordinary Shares and Savings Shares to an account of such holder with aparticipant of Monte Titoli, in which case such holders may transfer their shares, collect dividends and exerciseother shareholder rights through that participant. Any such transfer through that participant is not subject toItalian transfer tax if non-Italian parties are involved. See “—10.6 Taxation”.
Dividend Rights
Holders of Savings Shares are entitled each year to a distribution with respect to such year’s net income in theamount up to 5% of the par value of their shares. If with respect to any year a lesser amount is paid, theentitlement to payment of the shortfall is carried over for two successive years. In the event that dividends arepaid to holders of Ordinary Shares, holders of Savings Shares have a preferential right to receive a dividend pershare that is higher by 2% of its the par value than the dividend per Ordinary Share.
In case the net income is insufficient, the Annual Ordinary Shareholders’ meeting is allowed to satisfy theaforementioned preferential rights by distributing reserves, when available.
Subscription Rights
New Ordinary Shares and/or Savings Shares may be issued pursuant to a resolution of holders of Ordinary Sharesat any extraordinary Shareholders’ Meeting.
Pursuant to Italian law, shareholders (including holders of Savings Shares) are entitled to subscribe for new issuesof Ordinary Shares and/or Savings Shares, debentures convertible into Ordinary Shares and/or Savings Sharesand rights to subscribe for Ordinary Shares and/or Savings Shares in proportion to their respective shareholdings.
As a rule, subject to certain conditions principally designed to prevent dilution of the rights of shareholders,subscription rights may be waived or limited by resolutions taken by an extraordinary Shareholders’ Meeting withthe affirmative vote of holders of more than 50% of the Ordinary Shares outstanding. This majority is required atthe first, second and third call. On the other hand, according to the Bylaws the subscription rights can be excludedby the extraordinary Shareholders’ Meeting in the amount of 10% of the pre-existent share capital with no specialquorum requirement, on condition that the subscription price is equal to the shares market price and it isconfirmed in the independent auditors’ report.
Shareholders can adopt a resolution, at an extraordinary Shareholders’ Meeting, to convert available reserves intoadditional share capital. In such case, either the par value of all outstanding Ordinary Shares is identically raisedor the Ordinary Shares resulting from the increase in share capital are allocated to the shareholders in proportionto their ownership before the increase without further contribution or payment from the shareholder.
Liquidation Rights
Subject to the satisfaction of all other creditors, holders of Ordinary Shares are entitled to a distribution inliquidation.
Holders of Savings Shares and preferred shares, if any, are entitled to a preferred right to distribution fromliquidation up to their par value. No liquidation dividend is payable to the holders of other classes of shares untilsuch preferential right has been satisfied in full. Thereafter, in case of surplus assets, holders of all classes ofshares rank equally in the distribution of such surplus assets. Shares rank pari passu among themselves in aliquidation.
Purchase of Ordinary Shares or Savings Shares by the Company
The Company may purchase its own Ordinary Shares or Savings Shares subject to certain conditions andlimitations. Such purchases must be authorized by a Shareholders’ Meeting and made only out of retainedearnings or distributable reserves as shown on the most recent financial statements approved by theShareholders’ Meeting. The par value of the Ordinary Shares or Savings Shares purchased by the Company,
220

Item 10. Additional Information Description Of Capital Stock
including the Ordinary Shares or Savings Shares, if any, held by the Company’s subsidiaries, may not exceed 10%of the Company’s share capital. The Company may purchase its own Ordinary Shares or Savings Shares:
Š by means of a tender offer;
Š on regulated markets in accordance with trading methods laid down in the market rules, that do notpermit the direct matching of buy orders with predetermined sell orders;
Š by means of the purchase and sale of derivative instruments traded on regulated markets that providefor the delivery of the underlying shares, provided the market rules lay down methods for the purchaseand sale of such instruments that (i) do not permit the direct matching of buy orders withpredetermined sell orders and (ii) ensure the easy participation of investors in the trading of suchderivative instruments used for buybacks;
Š by granting shareholders, in relation to the shares they hold, a put option to be exercised within aperiod established by the shareholders’ meeting authorizing the share purchase programme.
Before entering into transactions aimed at the purchase of its own shares other than by means of a tender offer(which in Italy is governed by specific disclosure requirements), the Company must disclose to the public all thedetails of the share purchase programme.
Ordinary Shares or Savings Shares purchased and held by the Company or one of its subsidiaries may be disposedof only pursuant to a resolution of the Company’s or, if applicable, its subsidiary’s shareholders’ meeting.
As a rule, neither the Company nor any company under its control may vote or subscribe for new Ordinary Sharesor Savings Shares of the Company, but the shareholders’ meeting may authorize the exercise of subscriptionrights. If no such authorization is granted, the subscription rights accrue to the other holders so long as suchOrdinary Shares or Savings Shares are held by the Company or a company under its control. The Ordinary Sharesor the Savings Shares, as long as they are owned by the Company, are not entitled to receive dividends.
As of June 13, 2007, Telecom Italia owns 1,272,014 of its own Ordinary Shares.
The Shareholders’ Meeting of April 13, 2006 authorized, for a period of 18 months from the date of the resolution,the purchase, on one or more occasions and at any time, in any of the ways permitted by the applicable rules andregulations, at the Board’s discretion, of Ordinary and/or Savings shares up to the limits established by law and inany case with a limit of €1,000,000,000 on the amount that can be spent. According to the resolution thepurchase price must lie between a minimum and a maximum corresponding to the weighted average of theofficial prices of shares of the same class recorded by Borsa Italiana on the ten trading days prior to the date ofthe purchase or of the determination of the purchase price, respectively reduced and augmented by 20%. TheShareholders’ Meeting simultaneously authorized, for the same period of time, the disposal, on one or moreoccasions and at any time, of all or some of the shares repurchased by the Company, including treasury sharesalready held by Telecom Italia when the resolution was taken.
The Shareholders’ Meeting of April 16, 2007 revoked the aforementioned authorizations for the purchase anddisposal of treasury shares, while authorizing, for an 18-month period, the purchase, on one or more occasionsand at any time, of up to a maximum of 25,000,000 Ordinary Shares, servicing a plan for the award of freeTelecom Italia S.p.A. Ordinary Shares aimed at members of the top management of the Group, to be selected bythe Board of Directors. According to the resolution the purchase price must lie between a minimum and amaximum corresponding to the weighted average of the official prices of Ordinary Shares recorded by BorsaItaliana on the ten trading days prior to the date of the purchase, respectively decreased and increased by 10%.The purchases must be made on regulated markets and according to the procedures allowed by the statutory andregulatory provisions in force.
Reporting Requirements and Restrictions on Acquisitions of Shares
Pursuant to Italian securities regulations, any acquisition or sale of an interest in excess of 2%, 5%, 7.5%, 10% andall higher multiples of five, in the voting shares of a listed company, must be notified to the listed company and toCONSOB within five trading days (defined as days on which Borsa Italiana is open) following the acquisition orsale. CONSOB must make such information public within three trading days from the notification.
221

Item 10. Additional Information Description Of Capital Stock
For purposes of the disclosure requirements referred above: (i) a person’s holding must include both the sharesowned by such person, even if the voting rights belong or are assigned to third parties, and the shares whosevoting rights belong or are assigned to such person; (ii) a person’s holding shall also include both the sharesowned by nominees, trustees or subsidiary companies and the shares of which the voting rights belong or areassigned to such persons; (iii) shares registered in the names of or endorsed to trustees and those whose votingrights are assigned to an intermediary in connection with collective or individual portfolio management servicesare not to be attributed to the persons controlling the trustee or the intermediary.
For the purposes of the disclosure requirements for 5%, 10%, 25%, 50% and 75% thresholds, the calculation ofholdings shall also include issued and subscribed shares that a person may buy or sell on his own initiative, eitherdirectly or through nominees, trustees or subsidiary companies. Shares that may be acquired by exercisingconversion rights or warrants shall be included in the calculation only if the acquisition can be made within sixtydays.
Shareholder agreements concerning the voting shares of a listed company must be notified to CONSOB, publishedin an abridged form in the daily press and filed with the Company Register of the place where the company has itsregistered office if they provide for duties of consultation before voting, set limits on the transfer or provide forthe purchase of the relevant shares, have as their object or effect the exercise of a dominant influence on thecompany. The same rule applies when the shareholder agreements concern the shares issued by a non-listedcompany that controls a listed company. The notification must include the share ownership of all parties filing it.
When listed companies change their share capital, they must notify CONSOB and Borsa Italiana of the amount ofthe share capital and the number and classes of shares into which it is divided. CONSOB and Borsa Italiana mustmake the information available to the public no later than the day following the notification. The notification shallbe made no later than the day following the event causing such modification or the day following the filing of theamended Bylaws.
Any holdings by a listed company of an interest in excess of 10% in the voting shares of an unlisted company mustbe notified to CONSOB and to the company. The reduction of the participation within the 10% threshold must benotified to the company only. Notifications to CONSOB must be made within 30 days from the approval by theBoard of Directors of the half-year and the annual reports; notifications to the company whose shares are beingacquired or sold must be made within seven days from the transaction which results in exceeding or going withinthe 10% threshold. Such information must be made public when the half-year and the annual reports aredeposited. For purposes of calculating the interest threshold above, the following unlisted companies shares mustbe taken into account: (i) shares owned by a listed company even if the voting rights belong to a third party; and(ii) shares attributing voting rights to a listed company if such voting rights grant the listed company dominant orsignificant voting powers.
In accordance with Italian antitrust laws and regulations, the Antitrust Authority is required to prohibitacquisitions of sole or joint control over a company that would create or strengthen a dominant position in thedomestic market or a significant part thereof. However, if the acquiring party and the company to be acquiredoperate in more than one Member State of the EU and exceed certain revenue thresholds, the antitrust approvalof the acquisition falls within the exclusive jurisdiction of the European Commission. See “Item 4. Information onthe Telecom Italia Group—4.3 Regulation—Competition Law”.
Limitations on Voting and Shareholdings
There are no limitations imposed by Italian law or by the Bylaws of Telecom Italia on the rights of non-residentsof Italy or foreign persons to hold or vote the Shares other than those limitations resulting from the specialpowers of the State, which apply equally to all owners of Shares, Italian and foreign alike.
222
Item 10. Additional Information Description Of American Depositary Receipts
10.5 DESCRIPTION OF AMERICAN DEPOSITARY RECEIPTS
Following the Merger, Olivetti as the surviving company changed its name to “Telecom Italia S.p.A.”, succeededto the Exchange Act registration of Old Telecom Italia and became subject to the foreign private issuer reportingrequirements of the Exchange Act. New Telecom Italia has completed the listing of its Ordinary Share AmericanDepositary Shares and Savings Share American Depositary Shares on the New York Stock Exchange. New TelecomItalia has entered into two Deposit Agreements among the Company, JPMorgan Chase Bank, as depositary, andthe registered Holders from time to time of ADRs issued thereunder. The first such Deposit Agreement, dated asof July 17, 2003, provides for the deposit of Ordinary Shares in registered form, par value €0.55 each and theissuance of the Ordinary Share ADSs; the second such Deposit Agreement, also dated as of July 17, 2003 providesfor the deposit of Savings Shares in registered form, par value €0.55 each and the issuance of the Savings ShareADSs. Because these agreements are otherwise substantially identical, such agreements (including all exhibits andamendments thereto) are referred to herein as the “Deposit Agreement”, deposited Shares as w ell as depositedSavings Shares are referred to as “Shares”, and the Ordinary Share ADSs or Savings Share ADSs, as the case maybe, are referred to as the “ADSs”. The following is a summary of the material provisions of the DepositAgreement. This summary does not purport to be complete and is qualified in its entirety by reference to theDeposit Agreement. Copies of the Deposit Agreement are available for inspection at the principal office of theDepositary in New York (the “Principal New York Office”), which is presently located at 4 New York Plaza, NewYork, New York 10004. Terms used herein and not otherwise defined shall have the respective meanings set forthin the Deposit Agreement.
ADRs evidencing ADSs are issuable by the Depositary pursuant to the terms of the Deposit Agreement. Each ADSrepresents, as of the date hereof, the right to receive 10 Ordinary Shares (in the case of each Ordinary Share ADS)or 10 Savings Shares (in the case of each Savings Share ADS) in each case deposited under the DepositAgreement (together with any additional Ordinary Shares deposited thereunder and all other securities, propertyand cash received and held thereunder at any time in respect of or in lieu of such deposited Ordinary Shares, the“Deposited Securities”) with the Custodian, currently the Milan office of BNP Paribas (together with any successoror successors thereto, the “Custodian”). An ADR may evidence any number of ADSs. Only persons in whosenames ADRs are registered on the books of the Depositary will be treated by the Depositary and the Company asHolders.
Deposit, Issuance, Transfer and Withdrawal
In connection with the deposit of Ordinary Shares under the Deposit Agreement, the Depositary or the Custodianmay require the following in form satisfactory to it: (a) a written order directing the Depositary to issue or executeand deliver to, or upon the written order of, the person or persons designated in such order an ADR or ADRsevidencing the number of ADSs representing such Deposited Securities (a “Delivery Order”); (b) properendorsements or duly executed instruments of transfer in respect of such Deposited Securities; and(c) instruments assigning to the Custodian or its nominee any distribution on or in respect of such DepositedSecurities until the Ordinary Shares are registered in the name required by the Depositary or indemnity therefore.As soon as practicable after the Custodian receives Deposited Securities pursuant to any such deposit or pursuantto any distribution upon Deposited Securities or change affecting Deposited Securities, the Custodian shallpresent such Deposited Securities for registration of transfer into the name of the Custodian or its nominee, tothe extent such registration is practicable, at the cost and expense of the person making such deposit (or forwhose benefit such deposit is made) and shall obtain evidence satisfactory to it of such registration. DepositedSecurities shall be held by the Custodian for the account and to the order of the Depositary at such place or placesand in such manner as the Depositary shall determine. The Depositary agrees to instruct the Custodian to place allOrdinary Shares accepted for deposit into a segregated account separate from any Ordinary Shares of theCompany that may be held by such Custodian under any other depositary receipt facility relating to the OrdinaryShares. Deposited Securities may be delivered by the Custodian to any person only under the circumstancesexpressly contemplated in the Deposit Agreement. To the extent that the provisions of or governing the Sharesmake delivery of certificates therefore impracticable, Ordinary Shares may be deposited by such delivery thereofas the Depositary or the Custodian may reasonably accept, including, without limitation, by causing them to becredited to an account maintained by the Custodian for such purpose with the Company or an accreditedintermediary, such as a bank, acting as a registrar for the Ordinary Shares, together with delivery of thedocuments, payments and Delivery Order referred to herein to the Custodian or the Depositary. Neither theDepositary nor the Custodian shall lend Deposited Securities.
223

Item 10. Additional Information Description Of American Depositary Receipts
After any such deposit of Ordinary Shares, the Custodian shall notify the Depositary of such deposit and of theinformation contained in any related Delivery Order by letter, first class airmail postage prepaid, or, at therequest, risk and expense of the person making the deposit, by cable, telex or facsimile transmission. Afterreceiving such notice from the Custodian (or such other evidence as the Company may accept), the Depositary,subject to the Deposit Agreement, shall properly issue or execute and deliver, as the case may be at the transferoffice of the Depositary (the “Transfer Office”), to or upon the order of any person named in such notice, an ADRor ADRs registered as requested and evidencing the aggregate ADSs to which such person is entitled. ADSs maybe issued in certificated form or through the direct registration system utilized by the Depositary pursuant towhich the Depositary may record the ownership of ADRs without the issuance of a certificate, which ownershipshall be evidenced by periodic statements issued by the Depositary to the Holders entitled thereto.
Subject to the terms of the Deposit Agreement, the Depositary may so issue ADRs for delivery at the TransferOffice only against deposit with the Custodian of: (a) Ordinary Shares in form satisfactory to the Custodian;(b) rights to receive Ordinary Shares from the Company or any registrar, transfer agent, clearing agent or otherentity recording Share ownership or transactions; or (c) other rights to receive Shares (until such Shares areactually deposited pursuant to (a) or (b) above, “Pre-released ADRs”) only if (i) Pre-released ADRs are fullycollateralized (marked to market daily) with cash or U.S. government securities held by the Depositary for thebenefit of Holders (but such collateral shall not constitute Deposited Securities), (ii) each recipient of Pre-releasedADRs agrees in writing with the Depositary that such recipient (a) owns such Shares, (b) assigns all beneficialright, title and interest therein to the Depositary, (c) holds such Shares for the account of the Depositary and(d) will deliver such Shares to the Custodian as soon as practicable and promptly upon demand therefore and(iii) all Pre-released ADRs evidence not more than 20% of all ADSs (excluding those evidenced by Pre-releasedADRs provided); however, that the Depositary reserves the right to change or disregard such limit from time totime as it deems appropriate. The Depositary may retain for its own account any earnings on collateral forPre-released ADRs and its charges for issuance thereof. At the request, risk and expense of the person depositingShares, the Depositary may accept deposits for forwarding to the Custodian and may deliver ADRs at a place otherthan its office. Shares or evidence of rights to receive Shares may be deposited through (x) electronic transfer ofsuch Shares to the account maintained by the Custodian for such purpose at Monte Titoli S.p.A., (y) evidencesatisfactory to the Custodian of irrevocable instructions to cause such Shares to be transferred to such account or(z) delivery of the certificates representing such Shares. If use of the Monte Titoli book-entry system inconnection with the Shares is discontinued at any time for any reason, the Company shall make other book-entryarrangements (if any) that it determines, after consultation with the Depositary, are reasonable. Every persondepositing Shares under the Deposit Agreement represents and warrants that such Shares are validly issued andoutstanding, fully paid, non assessable and free of pre-emptive rights, that the person making such deposit is dulyauthorized so to do and that such Shares (A) are not “restricted securities” as such term is defined in Rule 144under the Securities Act of 1933 unless at the time of deposit they may be freely transferred in accordance withRule 144(k) and may otherwise be offered and sold freely in the United States or (B) have been registered underthe Securities Act of 1933. Such representations and warranties shall survive the deposit of Shares and issuanceof ADRs.
Subject to the terms and conditions of the Deposit Agreement, upon surrender of (i) a certificated ADR in formsatisfactory to the Depositary at the Transfer Office or (ii) proper instructions and documentation in the case of aDirect Registration ADR, the Holder is entitled to delivery at the Custodian’s office of the Deposited Securities atthe time represented by the ADSs evidenced thereby. At the request, risk and expense of the Holder of an ADR,the Depositary may deliver such Deposited Securities at such other place as may have been requested by theHolder.
Distributions on Deposited Securities
Subject to the terms and conditions of the Deposit Agreement, to the extent practicable, the Depositary willdistribute to each Holder entitled thereto on the record date set by the Depositary therefore at such Holder’saddress shown on the ADR Register, in proportion to the number of Deposited Securities (on which the followingdistributions on Deposited Securities are received by the Custodian) represented by ADSs evidenced by suchHolder’s ADRs:
(a) Cash. Any U.S. dollars available to the Depositary resulting from a cash dividend or other cash distribution orauthorized portion thereof (“Cash”), on an averaged, if possible, or other practicable basis, subject to appropriate
224

Item 10. Additional Information Description Of American Depositary Receipts
adjustments for (i) appropriate adjustments for taxes withheld, (ii) such distribution being impermissible orimpracticable with respect to certain Holders, and (iii) deduction of the Depositary’s expenses in (1) convertingany foreign currency to U.S. dollars by sale or in such other manner as the Depositary may determine to theextent that it determines that such conversion may be made on a reasonable basis, (2) transferring foreigncurrency or U.S. dollars to the United States by such means as the Depositary may determine to the extent that itdetermines that such transfer may be made on a reasonable basis, (3) obtaining any approval or license of anygovernmental authority required for such conversion or transfer, which is obtainable at a reasonable cost andwithin a reasonable time and (4) making any sale by public or private means in any commercially reasonablemanner.
(b) Shares. (i) Additional ADRs evidencing whole ADSs representing any Shares available to the Depositaryresulting from a dividend or free distribution on Deposited Securities consisting of Shares (a “Share Distribution”)and (ii) U.S. dollars available to it resulting from the net proceeds of sales of Shares received in a ShareDistribution, which Shares would give rise to fractional ADSs if additional ADRs were issued therefore, as in thecase of Cash.
(c) Rights. (i) Warrants or other instruments in the discretion of the Depositary after consultation with theCompany, to the extent practicable, representing rights to acquire additional ADRs in respect of any rights tosubscribe for additional Shares or rights of any nature available to the Depositary as a result of a distribution onDeposited Securities (“Rights”), to the extent that the Company timely furnishes to the Depositary evidencesatisfactory to the Depositary that the Depositary may lawfully distribute the same (the Company has noobligation to so furnish such evidence), or (ii) to the extent the Company does not so furnish such evidence andsales of Rights are practicable, any U.S. dollars available to the Depositary from the net proceeds of sales ofRights as in the case of Cash, or (iii) to the extent the Company does not so furnish such evidence and such salescannot practicably be accomplished by reason of the non- transferability of the Rights, limited markets therefore,their short duration or otherwise, nothing (and any Rights may lapse).
(d) Other Distributions. (i) Securities or property available to the Depositary resulting from any distribution onDeposited Securities other than Cash, Share Distributions and Rights (“Other Distributions”), by any means thatthe Depositary may deem equitable and practicable, or (ii) to the extent the Depositary deems distribution of suchsecurities or property not to be equitable and practicable, any U.S. dollars available to the Depositary from the netproceeds of sales of Other Distributions as in the case of Cash. Such U.S. dollars available will be distributed bychecks drawn on a bank in the United States for whole dollars and cents (any fractional cents being withheldwithout liability for interest and added to future Cash distributions).
To the extent that the Depositary determines in its discretion that any distribution is not practicable with respectto any Holder, the Depositary, after consultation with the Company, may make such distribution as it so deemspracticable, including the distribution of foreign currency, securities or property (or appropriate documentsevidencing the right to receive foreign currency, securities or property) or the retention thereof as DepositedSecurities with respect to such Holder’s ADRs (without liability for interest thereon or the investment thereof).
There can be no assurance that the Depositary will be able to effect any currency conversion or to sell orotherwise dispose of any distributed or offered property, subscription or other rights, Shares or other securities ina timely manner or at a specified rate or price, as the case may be.
Disclosure of Interests
To the extent that the provisions of or governing any Deposited Securities may require disclosure of or imposelimits on beneficial or other ownership of Deposited Securities, other Shares and other securities and may providefor blocking transfer, voting or other rights to enforce such disclosure or limits, Holders and all persons holdingADRs agree to comply with all such disclosure requirements and ownership limitations and to cooperate with theDepositary in the Depositary’s compliance with any Company instructions in respect thereof, and the Depositarywill use reasonable efforts to comply with such Company instructions.
Record Dates
The Depositary shall, to the extent necessary, after consultation with the Company, if practicable, fix a record date(which shall be as near as practicable to any corresponding record date set by the Company) for the
225

Item 10. Additional Information Description Of American Depositary Receipts
determination of the Holders who shall be entitled to receive any distribution on or in respect of DepositedSecurities, to give instructions for the exercise of any voting rights, to receive any notice or to act in respect ofother matters and only such Holders at the close of business on such record date shall be so entitled.
Voting of Deposited Securities
Upon receipt of notice of any meeting or solicitation of consents or proxies of holders of Shares the Depositarywill, unless otherwise instructed by the Company, promptly thereafter, distribute to all Holders a notice containing(i) the information (or a summary thereof) included in any such notice received by the Depositary, including theagenda for the meeting, (ii) a statement that the Holders as of the close of business on a specified record date willbe entitled, subject to applicable provisions of Italian law and of the Company’s Certificate of Incorporation andBylaws (any such provisions, if material, will be summarized in such notice), to instruct the Depositary as to theexercise of voting rights, if any (subject to compliance by such Holder with the requirements described below)pertaining to the number of Shares represented by their respective ADSs, (iii) if applicable, a statement as to themanner in which such Holders may request a proper communication to the issuer attesting that beneficialownership of the related Shares is in the name of the Holders and therefore enabling them to exercise votingrights with respect to the Shares represented by their ADSs without the use of ADS proxy cards, (iv) if applicable,an ADS proxy card pursuant to which such Holder may appoint the Depositary (with power of substitution) as hisor her proxy to vote at such meeting in accordance with the directions set out in such ADS proxy card, and(v) such other information, including any such modification to the foregoing procedures as agreed between theDepositary and the Company.
Upon receipt by the Depositary of a properly completed ADS proxy card, on or before the date set by theDepositary for such purpose, the Depositary will attempt, insofar as practicable and permitted under anyapplicable provisions of Italian law and the Company’s Certificate of Incorporation and Bylaws, to vote or cause tobe voted the Shares underlying such ADRs in accordance with any nondiscretionary instructions set forth in suchADS proxy card. The Depositary will not vote or attempt to exercise the right to vote that attaches to Sharesunderlying such ADRs other than in accordance with such instructions.
A Holder desiring to exercise voting rights with respect to the Shares represented by its ADSs without the use ofan ADS proxy card may do so by (A) depositing its ADRs in a blocked account with the Depositary until thecompletion of such meeting and (B) instructing the Depositary to (x) furnish the Custodian with the name andaddress of such Holder, the number of ADSs represented by ADRs held by such Holder and any other informationrequired in accordance with Italian law or the Company’s Certificate of Incorporation and Bylaws, (y) notify theCustodian of such deposit, and (z) instruct the Custodian to issue a communication for such meeting, which givesnotice to the Company of such Holder’s intention to vote the Shares underlying its ADRs. By giving theinstructions set forth under point (B) above, Holders will be deemed to have authorized the Custodian to prohibitany transfers of the related Shares for the blocked period.
A precondition for the issue of the communication for a specific meeting by the Custodian may be that beneficialownership of the related Shares has been in the name of the Holder for a specific number of days prior to the dateof the meeting according to applicable provisions (if any) of Italian laws and regulations and/or applicableprovisions (if any) of the Company’s Certificate of Incorporation and Bylaws.
Under Italian law, shareholders at shareholders’ meetings may modify the resolutions presented for their approvalby the Board of Directors. In such case Holders who have given prior instructions to vote on such resolutions, andwhose instructions do not provide for the case of amendments or additions to such resolutions, will be deemed tohave elected to have abstained from voting on any such revised resolution.
When the Company makes its annual accounts available at its offices in connection with a general meeting ofshareholders at which a vote will be taken on such accounts, the Company will deliver to the Depositary and theCustodian copies of such accounts. Until such meeting, the Depositary will make available copies of such accountsfor inspection at the office of the Depositary in New York (the “Transfer Office”), the office of the Custodian inMilan, Italy and any other designated transfer offices.
In the Deposit Agreement, the Depositary and the Company agree to use reasonable efforts to make and maintainarrangements (in addition to or in substitution of the arrangements described in this paragraph) to enable Holdersto vote the Shares underlying their ADRs.
226

Item 10. Additional Information Description Of American Depositary Receipts
Inspection of Transfer Books
The Deposit Agreement provides that the Depositary or its agent will keep books at its Transfer Office for theregistration, registration of transfer, combination and split-up of ADRs, and, in the case of Direct RegistrationADRs, shall include the Direct Registration System which at all reasonable times will be open for inspection by theHolders and the Company for the purpose of communicating with Holders in the interest of the business of theCompany or a matter relating to the Deposit Agreement.
Reports and Other Communications
The Deposit Agreement, the provisions of or governing Deposited Securities and any written communicationsfrom the Company, which are both received by the Custodian or its nominee as a holder of Deposited Securitiesand made generally available to the holders of Deposited Securities, are available for inspection by Holders at theoffices of the Depositary and the Custodian and at the Transfer Office. The Depositary will mail copies of suchcommunications (or English translations or summaries thereof) to Holders when furnished by the Company.
On or before the first date on which the Company makes any communication generally available to holders ofDeposited Securities or any securities regulatory authority or stock exchange, by publication or otherwise, theCompany shall transmit to the Depositary a copy thereof in English or with an English translation or summary. TheCompany has delivered to the Depositary and the Custodian, a copy of all provisions of or governing the Shares(other than copies of Italian law) and any other Deposited Securities issued by the Company or any affiliate of theCompany, if any, and, promptly upon any change thereto, the Company shall deliver to the Depositary andCustodian, a copy (in English or with an English translation) of such provisions (other than copies of Italian law)as so changed.
Changes Affecting Deposited Securities
Subject to the terms of the Deposit Agreement and the ADRs, the Depositary may, in its discretion, amend theADRs or distribute additional or amended ADRs (with or without calling ADRs for exchange) or cash, securities orproperty on the record date set by the Depositary therefore to reflect any change in par value, split-up,consolidation, cancellation or other reclassification of Deposited Securities, any Share Distribution or OtherDistribution not distributed to Holders or any cash, securities or property available to the Depositary in respect ofDeposited Securities from (and the Depositary is hereby authorized to surrender any Deposited Securities to anyperson and to sell by public or private sale any property received in connection with) any recapitalization,reorganization, merger, consolidation, liquidation, receivership, bankruptcy or sale of all or substantially all theassets of the Company, and to the extent the Depositary does not so amend the ADRs or make a distribution toHolders to reflect any of the foregoing, or the net proceeds thereof, whatever cash, securities or property resultsfrom any of the foregoing shall constitute Deposited Securities and each ADS evidenced by ADRs shallautomatically represent its pro rata interest in the Deposited Securities as then constituted.
Amendment and Termination of Deposit Agreement
The ADRs and the Deposit Agreement may be amended by the Company and the Depositary, provided that anyamendment that imposes or increases any fees or charges (other than stock transfer or other taxes and othergovernmental charges, transfer or registration fees, cable, telex or facsimile transmission costs, delivery costs orother such expenses), or that shall otherwise prejudice any substantial existing right of Holders, shall becomeeffective 30 days after notice of such amendment shall have been given to the Holders. Every Holder of an ADR atthe time any amendment to the Deposit Agreement so becomes effective shall be deemed, by continuing to holdsuch ADR, to consent and agree to such amendment and to be bound by the Deposit Agreement and the ADRs asamended thereby. In no event shall any amendment impair the right of the Holder of any ADR to surrender suchADR and receive the Deposited Securities represented thereby, except in order to comply with mandatoryprovisions of applicable law. Any amendments or supplements which (i) are reasonably necessary (as agreed bythe Company and the Depositary) in order for (a) the ADSs to be registered on Form F-6 under the Securities Actof 1933 or (b) the ADSs or Shares to be traded solely in electronic book-entry form and (ii) do not in either suchcase impose or increase any fees or charges to be borne by Holders, shall be deemed not to prejudice anysubstantial rights of Holders. Notwithstanding the foregoing, if any governmental body should adopt new laws,rules or regulations which would require amendment or supplement of the Deposit Agreement or the form of ADR
227

Item 10. Additional Information Description Of American Depositary Receipts
to ensure compliance therewith, the Company and the Depositary may amend or supplement the DepositAgreement and the ADR at any time in accordance with such changed rules. Such amendment or supplement tothe Deposit Agreement in such circumstances may become effective before a notice of such amendment orsupplement is given to Holders or within any other period of time as required for compliance.
Upon any resignation of the Depositary which does not become effective during the earlier of (i) 90 days from thedate of the Depositary shall have resigned as such and (ii) the date on which the Company shall have appointed asuccessor depositary or on any removal of the Depositary pursuant to the Deposit Agreement, the Depositarymay, and shall at the written direction of the Company, terminate the Deposit Agreement and this ADR by mailingnotice of such termination to the Holders at least 30 days prior to the date fixed in such notice for suchtermination. After the date so fixed for termination, the Depositary and its agents will perform no further actsunder the Deposit Agreement and this ADR, except to receive and hold (or sell) distributions on DepositedSecurities and deliver Deposited Securities being withdrawn. As soon as practicable after the expiration of sixmonths from the date so fixed for termination, the Depositary shall sell the Deposited Securities and shallthereafter (as long as it may lawfully do so) hold in a segregated account the net proceeds of such sales, togetherwith any other cash then held by it under the Deposit Agreement, without liability for interest, in trust for the prorata benefit of the Holders of ADRs not theretofore surrendered. After making such sale, the Depositary shall bedischarged from all obligations in respect of the Deposit Agreement and this ADR, except to account for such netproceeds and other cash. After the date so fixed for termination, the Company shall be discharged from allobligations under the Deposit Agreement except for its obligations to the Depositary and its agents.
Charges of Depositary
The Depositary may charge each person to whom ADSs are issued against deposits of Shares, including depositsin respect of Share Distributions, Rights and Other Distributions, and each person surrendering ADSs forwithdrawal of Deposited Securities, U.S.$5.00 for each 100 ADSs (or portion thereof) delivered or surrendered.The Depositary may sell (by public or private sale) sufficient securities and property received in respect of ShareDistributions, Rights and Other Distributions prior to such deposit to pay such charge. In addition, the Depositarymay charge Holders, a fee for the distribution of securities, such fee being in an amount equal to the fee for theexecution and delivery of ADSs referred to above which would have been charged as a result of the deposit ofsuch securities (for purposes hereof treating all such securities as if they were Shares) but which securities or thenet cash proceeds from the sale thereof are instead distributed by the Depositary to Holders entitled thereto. TheCompany will pay all other charges and expenses of the Depositary and any agent of the Depositary (except theCustodian) pursuant to agreements from time to time between the Company and the Depositary, except (i) stocktransfer or other taxes and other governmental charges (which are payable by Holders or persons depositingShares), (ii) cable, telex and facsimile transmission and delivery charges incurred at the request of personsdepositing, or Holders delivering Shares, ADRs or Deposited Securities (which are payable by such persons orHolders), (iii) transfer or registration fees for the registration of transfer of Deposited Securities on any applicableregister in connection with the deposit or withdrawal of Deposited Securities (which are payable by personsdepositing Shares or Holders withdrawing Deposited Securities; there are no such fees in respect of the Shares asof the date of the Deposit Agreement), (iv) expenses of the Depositary in connection with the conversion offoreign currency into U.S. dollars (which are paid out of such foreign currency) and (v) such fees and expenses asare incurred by the Depositary (including without limitation expenses incurred on behalf of Holders in connectionwith compliance with foreign exchange control regulations or any law or regulation relating to foreign investment)in delivery of Deposited Securities or otherwise in connection with the Depositary’s or its Custodian’s compliancewith applicable law, rule or regulation.
Liability of Holders for Taxes
If any tax or other governmental charge shall become payable by or on behalf of the Custodian or the Depositarywith respect to an ADR, any Deposited Securities represented by the ADSs evidenced thereby or any distributionthereon, such tax or other governmental charge shall be paid by the Holder thereof to the Depositary. TheDepositary may refuse to effect any registration, registration of transfer, split-up or combination or, only for thosereasons set forth in General Instruction I.A.(1) of Form F-6 under the Securities Act, any withdrawal of DepositedSecurities until such payment is made. The Depositary may also deduct from any distributions on or in respect ofDeposited Securities, or may sell by public or private sale for the account of the respective Holder any part or allof such Deposited Securities (after attempting by reasonable means to notify the Holder thereof prior to such
228

Item 10. Additional Information Description Of American Depositary Receipts
sale), and may apply such deduction or the proceeds of any such sale in payment of such tax or othergovernmental charge, the respective Holder remaining liable for any deficiency, and shall reduce the number ofADSs evidenced thereby to reflect any such sales of Shares.
In connection with any distribution to Holders, the Company or its agents will remit to the appropriategovernmental authority or agency all amounts (if any) required to be withheld and owing to such authority oragency by the Company or its agents; and the Depositary and the Custodian will remit to the appropriategovernmental authority or agency all amounts (if any) required to be withheld by the Depositary or the Custodian.The Depositary shall forward to the Company or its agent such information from its records as the Company mayrequest to enable the Company or its agent to file necessary reports with governmental authorities or agencies. Ifthe Depositary determines that any distribution in property other than cash (including Shares or rights) onDeposited Securities is subject to any tax that the Depositary or the Custodian is obligated to withhold, theDepositary may dispose of all or a portion of such property in such amounts and in such manner as the Depositarydeems necessary and practicable to pay such taxes, by public or private sale, and the Depositary shall distributethe net proceeds of any such sale or the balance of any such property after deduction of such taxes to the Holdersentitled thereto.
The Depositary and the Company agree to use reasonable efforts to make and maintain arrangements (in additionto or in substitution of the arrangements described herein) to enable persons that are considered United Statesresidents for purposes of applicable law to receive any rebates, tax credits or other benefits (pursuant to treaty orotherwise) relating to distributions on the ADSs to which such persons are entitled. Notwithstanding the above,the Company may, by written notice to the Depositary, modify or withdraw the procedures described in thisparagraph (including by ceasing to pay to the Depositary any amounts in respect of refunds of Italian withholdingtaxes), to the extent the Company determines that its participation in the refund process is no longer lawful orpractical.
See “—10.6 Taxation” for additional information on tax issues relating to ADRs.
General Limitations
The Depositary, the Company, their agents and each of them shall: (a) incur no liability (i) if any present or futurelaw, regulation, the provisions of or governing any Deposited Securities, act of God, war or other circumstancebeyond its control shall prevent, delay or subject to any civil or criminal penalty any act which the DepositAgreement or this ADR provides shall be done or performed by it, or (ii) by reason of any exercise or failure toexercise any discretion given it in the Deposit Agreement or this ADR; (b) assume no liability except to perform itsobligations to the extent they are specifically set forth in this ADR and the Deposit Agreement without grossnegligence or bad faith; (c) in the case of the Depositary and its agents, be under no obligation to appear in,prosecute or defend any action, suit or other proceeding in respect of any Deposited Securities or this ADR; (d) inthe case of the Company and its agents hereunder be under no obligation to appear in, prosecute or defend anyaction, suit or other proceeding in respect of any Deposited Securities or this ADR, which in its opinion mayinvolve it in expense or liability, unless indemnity satisfactory to it against all expense (including fees anddisbursements of counsel) and liability be furnished as often as may be required; or (e) not be liable for any actionor inaction by it in reliance upon the advice of or information from legal counsel, accountants, any personpresenting Shares for deposit, any Holder, or any other person believed by it in good faith to be competent to givesuch advice or information. The Depositary, its agents and the Company may rely and shall be protected in actingupon any written notice, request, direction or other document believed by them in good faith to be genuine and tohave been signed or presented by the proper party or parties. The Depositary and its agents will not beresponsible for any failure to carry out any instructions to vote any of the Deposited Securities (provided that suchact or omission to act is in good faith), for the manner in which any such vote is cast or for the effect of any suchvote. The Depositary and its agents may own and deal in any class of securities of the Company and its affiliatesand in ADRs. Neither the Company, the Depositary nor any of their respective agents shall be liable to Holders orbeneficial owners of interests in ADSs for any indirect, special, punitive or consequential damages.
Prior to the issue, registration, registration of transfer, split-up or combination of any ADR, the delivery of anydistribution in respect thereof, or, subject to the last sentence of this paragraph, the withdrawal of any DepositedSecurities, and from time to time, in the case of clause (b)(ii) of this paragraph, the Company, the Depositary orthe Custodian may require: (a) payment with respect thereto of (i) any stock transfer or other tax or other
229

Item 10. Additional Information Description Of American Depositary Receipts
governmental charge, (ii) any stock transfer or registration fees in effect for the registration of transfers of Sharesor other Deposited Securities upon any applicable register and (iii) any applicable charges; (b) the production ofproof satisfactory to it of (i) the identity and genuineness of any signature and (ii) such other information,including without limitation, information as to citizenship, residence, exchange control approval, beneficialownership of any securities, compliance with applicable law, regulations, provisions of or governing DepositedSecurities and terms of the Deposit Agreement and the ADRs, as it may deem necessary or proper; and(c) compliance with such regulations as the Depositary may establish consistent with the Deposit Agreement. TheDepositary shall provide to the Company, promptly upon its written request, copies of any such proofs ofcitizenship or residence or other information referred to in (b) above so requested. The issuance of ADRs, theacceptance of deposits of Shares, the registration, registration of transfer, split-up or combination of ADRs or,subject to the last sentence of this paragraph, the withdrawal of Deposited Securities may be suspended,generally or in particular instances, when the ADR register or any register for Deposited Securities is closed orwhen any such action is deemed necessary or advisable by the Depositary or the Company. Notwithstanding anyother provision of the Deposit Agreement or the ADRs, the withdrawal of Deposited Securities may be restrictedonly for the reasons set forth in General Instruction I.A.(1) of Form F-6 (as such instructions may be amendedfrom time to time) under the Securities Act.
Governing Law
The Deposit Agreement is governed by and shall be construed in accordance with the laws of the State of NewYork.
JPMorgan Chase Bank
The Depositary is JPMorgan Chase Bank, N.A., a New York banking corporation, which has its principal officelocated in New York, New York. JPMorgan Chase Bank N.A. delivers financial information and transactionprocessing services to corporations, financial institutions and government entities around the world, offering awide range of products: ADRs, cash management, treasury, custody, investor and institutional trust services.
JPMorgan Chase Bank N.A. is a commercial bank offering a wide range of banking and trust services to itscustomers in the New York metropolitan area, throughout the United States and around the world.
The Consolidated Balance Sheets of J.P. Morgan Chase & Co. Incorporated (“J.P. Morgan”), the parentcorporation of JPMorgan Chase Bank N.A., are set forth in the most recent Annual Report and Form 10-Q. TheAnnual Report, Form 10-K and Form 10-Q of J.P. Morgan are on file with the SEC.
The Articles of Association of JPMorgan Chase Bank and Bylaws together with the annual report, Form 10-K andForm 10-Q of J.P. Morgan are available for inspection at the Principal New York Office of the Depositary.Information about the firm is also available at www.jpmorganchase.com.
230

Item 10. Additional Information Taxation
10.6 TAXATION
Unless otherwise indicated, for purposes of the following discussion regarding taxation the Shares and the SavingsShares are collectively referred to as the “Telecom Italia Shares”.
Italian Taxation
The following is a summary of certain Italian tax consequences of the purchase, ownership and disposition ofShares, Savings Shares or ADRs as at the date hereof. It does not purport to be a complete analysis of allpotential tax matters relevant to a decision to hold Shares, Savings Shares or ADRs. For purposes of Italian lawand the Italian-U.S. Income Tax Convention (the “Treaty”), holders of American Depositary Shares which areevidenced by ADRs will be treated as holders of the underlying Shares or Savings Shares, as the case may be.
Income Tax
Under Italian law, dividends paid to holders of Savings Shares and applicable ADRs who are not Italian residentsand do not have a permanent establishment in Italy to which dividends are connected are subject to a 12.5%withholding tax.
Under Italian law, dividends paid to holders of Shares and applicable ADRs who are not Italian residents and donot have a permanent establishment in Italy to which dividends are connected are subject to a 27% withholdingtax.
Under Italian law, all shares of Italian listed companies have to be registered in a centralized deposit system. Withrespect to dividends paid in connection with shares held in the centralized deposit system managed by MonteTitoli, such as Telecom Italia Shares, instead of the 27% or 12.5% withholding taxes mentioned above, asubstitute income tax will apply at the same tax rates as the above-mentioned withholding taxes. This substituteincome tax is levied by the Italian authorized intermediaries participating in the Monte Titoli system and withwhom the securities are deposited and also by non-Italian authorized intermediaries participating, directly orthrough a non-Italian centralized deposit system, in the Monte Titoli system.
Non-resident holders of Shares and ADRs have the right to recover within 48 months from the date of payment ofthe Italian substitute income tax, up to four-ninths of such 27% substitute tax on their dividend income, uponproviding adequate evidence, certified by the tax authorities in their home country, that they paid a correspondingamount of income tax in their home country on the same dividend income.
These refunds are normally subject to extensive delays. In addition, these refunds are an alternative to seekingany relief from double taxation under an income tax treaty, including the Treaty.
U.S. resident owners of Shares and ADRs may be entitled to a reduced tax rate on their dividends under theTreaty. Where a U.S. resident owner qualifies for the benefits of the Treaty, is the actual beneficiary of thedividends and the dividends paid are not connected with a permanent establishment in Italy through which theU.S. resident owner carries on a business or with a fixed base in Italy through which the U.S. resident ownerperforms independent personal services, the Treaty generally provides that Italian taxes cannot exceed 15% of thegross amount of the dividend.
To obtain the reduced tax rate afforded by the Treaty, a beneficial owner of Shares or ADRs must provide, beforethe dividend is paid (usually, according to the intermediary instructions), the intermediary with which the sharesare deposited and which participates in the Monte Titoli system with the following:
(i) a declaration by the beneficial owner containing all the data identifying such person as the beneficial ownerand establishing the existence of all the conditions necessary for the application of the Treaty; and
(ii) a certification (Form 6166) issued by the U.S. Internal Revenue Service that states that the beneficial owneris a U.S. resident for tax purposes. The certification is valid until March 31 of the year following thesubmission.
231

Item 10. Additional Information Taxation
The processing of requests for certification by the U.S. Internal Revenue Service may take a substantial period oftime. Accordingly, in order to be eligible for the procedure described below, eligible ADR holders should begin theprocess of obtaining Form 6166 as soon as possible after receiving instructions from the Depositary on how toclaim the reduced rate provided by the Treaty.
The Depositary’s instructions, which will be sent to all ADR holders before the dividend payment date, will specifycertain deadlines for delivering to the Depositary any documentation required to obtain the reduced rate providedby the Treaty, including the certification that the eligible ADR holders must obtain from the U.S. Internal RevenueService. In the case of ADRs held through a broker or other financial intermediary, the required documentationshould be delivered to such financial intermediary for transmission to the Depositary. In all other cases, theeligible ADR holders should deliver the required documentation directly to the Depositary.
If the holder of Shares or ADRs fails to obtain the reduced rate provided by the Treaty at the time the dividend ispaid, a refund equal to the difference between the Treaty rate and the Italian 27% substitute tax, applied at thepayment of dividends, may be claimed directly from the Italian tax authorities. Extensive delays have beenencountered by U.S. residents seeking payments directly from the Italian authorities.
In the case of dividends derived by a U.S. partnership, the reduction of the tax rate under the Treaty is onlyavailable to the extent such dividends are subject to U.S. tax in the hands of the partners.
Transfer Tax
Transfer tax is not payable upon the transfer of Telecom Italia Shares or ADRs through Telematico or any otherregulated financial market. Transfers of Telecom Italia Shares or ADRs which occur outside a regulated financialmarket are exempted from the payment of transfer tax provided that the parties entering into the agreementpursuant to which the transfer takes place are all non-residents of Italy and the relevant Telecom Italia Shares orADRs are not deposited at an Italian intermediary. Other types of transfers of shares listed on Telematico or anyother regulated financial market which occur outside a regulated financial market are also exempted from thepayment of transfer tax provided that the parties entering into the agreement pursuant to which the transfer taxestake place are (i) banks, Italian securities dealing firms (“SIMs”) or exchange agents or (ii) banks, SIMs orexchange agents on the one hand, and non-residents on the other hand or (iii) banks, SIMs or resident ornon-resident exchange agents, on the one hand, and investment funds on the other hand. In any other case,transfer tax is currently payable at the following rates:
Š €0.072 per €51.65 (or any fraction) of the price at which the Telecom Italia Shares or ADRs aretransferred when the transfer is made directly between the parties or through an intermediary that isnot a bank, SIM or broker; and
Š €0.0258 per €51.65 (or any fraction) of the price at which the Telecom Italia Shares or ADRs aretransferred when the transfer is made either (i) between a bank, SIM or broker and a private party or(ii) between private parties through a bank, SIM or broker.
The mere change of a depositary (e.g., Euroclear, Clearstream, Monte Titoli, DTC or the Depositary) not involvinga transfer of the ownership of the transferred Telecom Italia Shares will not trigger the Italian transfer tax.
In general, with respect to U.S. holders, the transfer tax will not be applicable on transfers of Telecom ItaliaShares or ADRs through regulated financial markets. However, in the case of transfers which are not executed ona regulated financial market and are entered into with an Italian counterparty other than a bank or authorizedfinancial intermediary or an investment fund, it is advisable that U.S. holders consult their own tax advisorsconcerning the applicability of this transfer tax. Deposits and withdrawals of Telecom Italia Shares in return forADRs by non-Italian residents will not be subject to the transfer tax.
Capital Gains Tax
Under Italian law, capital gains tax (“CGT”) is levied on capital gains realized by non-residents from the disposalof shares in companies resident in Italy for tax purposes even if those shares are held outside of Italy. For thepurposes of CGT, the exchange of shares under a merger or de-merger of Italian companies does not constitute adisposal of shares. In such transactions, the tax value and the holding period of the exchanged shares is carried
232

Item 10. Additional Information Taxation
over to the shares received in the exchange. Capital gains realized by non-resident holders on the sale ofnon-qualified shareholdings (as defined below) in companies listed on a stock exchange and resident in Italy fortax purposes (as is Telecom Italia’s case) are not subject to CGT.
A “qualified shareholding” consists of securities (except for Saving Shares and applicable ADRs) that (i) entitle theholder to exercise more than 2% of the voting rights of a company with shares listed on a stock exchange (as isTelecom Italia’s case) in the ordinary meeting of the shareholders or (ii) represent more than 5% of the sharecapital of a company with shares listed on a stock exchange (as is Telecom Italia’s case). A “non-qualifiedshareholding” is any shareholding that does not meet the above mentioned interest rights to be qualified as a“qualified shareholding”.
The relevant percentage is calculated taking into account the shareholdings sold during the prior 12-monthperiod.
Pursuant to the Treaty, a U.S. resident will not be subject to Italian CGT on a sale of qualified shareholdingsunless the Telecom Italia Shares or ADRs form part of the business property of a permanent establishment of theholder in Italy or pertain to a fixed base available to a holder in Italy for the purpose of performing independentpersonal services. U.S. residents who sell Telecom Italia Shares or ADRs may be required to produce appropriatedocumentation establishing that the above mentioned conditions of non-taxability pursuant to the Treatyprovisions have been satisfied if CGT would otherwise be applicable.
Inheritance and Gift Tax
Pursuant to Law Decree No. 262 of October 3, 2006, converted—with amendments—into Law No. 286 ofNovember 24, 2006, effective from November 29, 2006, and Law No. 296 of December 27, 2006, the transfers ofany valuable asset (including Shares, Savings Shares and ADRs) as a result of death or donation (or othertransfers for no consideration) and the creation of liens on such assets for a specific purpose are taxed as follows:
(i) transfers in favour of the spouse and of direct descendants or ascendants are subject to an inheritance andgift tax applied at a rate of 4% on the value of the inheritance or the gift exceeding €1,000,000 (perbeneficiary);
(ii) transfers in favour of the brothers and sisters are subject to an inheritance and gift tax applied at a rate of 6%on the value of the inheritance or the gift exceeding €100,000 (per beneficiary). The same tax rate applies infavour of handicapped individuals on the value of inheritance or gift exceeding €1,500,000 (per beneficiary);
(iii) transfers in favour of all other relatives up to the fourth degree or relatives-in-law up to the third degree, aresubject to an inheritance and gift tax applied at a rate of 6% on the entire value of the inheritance or the gift;
(iv) any other transfer is subject to an inheritance and gift tax applied at a rate of 8% on the entire value of theinheritance or the gift.
With respect to listed Shares, the value for inheritance and gift tax purposes is the average stock exchange priceof the last quarter preceding the date of the succession or of the gift (increased by the interest accruedmeanwhile). With respect to unlisted Shares, the value for inheritance and gift tax purposes is determined byreference to the value of listed debt securities having similar features or based on other certain elements.
There is currently no gift tax convention between Italy and the United States.
United States Federal Income Taxation
The following summary describes the material U.S. federal income tax consequences of the acquisition, ownershipand sale of Telecom Italia Shares, including Telecom Italia Shares represented by American Depositary Sharesevidenced by ADRs, that are generally applicable to the U.S. holders described herein who own Telecom ItaliaShares or ADRs as capital assets for U.S. federal income tax purposes, but it does not purport to be acomprehensive description of all of the tax considerations that may be relevant to a particular person’s decision toacquire such securities. For these purposes, you are a U.S. holder if you are for U.S. federal income tax purposes:
Š a citizen or resident of the United States;
233

Item 10. Additional Information Taxation
Š a corporation, or other entity taxable as a corporation, created or organized under the laws of theUnited States or of any political subdivision of the United States; or
Š an estate or trust the income of which is subject to U.S. federal income taxation regardless of its source.
This discussion is based on the tax laws of the United States currently in effect, including the Internal RevenueCode of 1986, as amended, Treasury regulations, administrative announcements, and judicial decisions, as well asthe Italian-U.S. income tax convention (the “Treaty”). These laws may change, possibly with retroactive effect.This discussion does not address U.S. state, local or non-U.S. tax consequences.
This discussion is based in part upon representations of the Depositary and assumes that each obligation providedfor in, or otherwise contemplated by, the Deposit Agreement and any related agreement will be performed inaccordance with its respective terms. The U.S. Treasury has expressed concerns that parties to whom ADRs arepre-released may be taking actions that are inconsistent with U.S. holders of ADRs claiming foreign tax credits forU.S. federal income tax purposes. Such actions would also be inconsistent with the claiming of the reduced rate oftax applicable to dividends received by certain non-corporate U.S. holders. Accordingly, the analysis of thecreditability of Italian taxes by ADR holders and the availability of the reduced tax rate on dividends received bycertain non-corporate U.S. holders, both discussed below, could be affected by actions that may be taken byparties to whom ADRs are pre-released.
This discussion does not address all of the tax consequences that may be relevant in light of your particularcircumstances. In particular, it does not address purchasers subject to special rules, including:
Š partnerships and other entities classified as partnerships for U.S. federal income tax purposes;
Š persons subject to the alternative minimum tax;
Š tax-exempt entities;
Š dealers and traders in securities or foreign currencies;
Š insurance companies;
Š financial institutions;
Š persons who own the Telecom Italia Shares or ADRs as part of an integrated investment, including astraddle, hedging or conversion transaction, comprised of the Telecom Italia Shares or ADRs and one ormore other positions for tax purposes;
Š persons whose functional currency is not the U.S. dollar for U.S. federal income tax purposes;
Š persons who actually or constructively own 10% or more of the Company’s voting stock; or
Š persons who acquire Telecom Italia Shares or ADRs pursuant to the exercise of any employee stockoption or otherwise as compensation.
Please consult your tax advisor with regard to the application of U.S. federal income tax laws to the Telecom ItaliaShares or ADRs, and any tax consequences arising under the laws of any state, local or non-U.S. taxingjurisdiction. For U.S. federal income tax purposes, holders of ADRs evidencing American Depositary Shares willgenerally be treated as owners of the underlying Shares or Savings Shares, as the case may be, represented bythose American Depositary Shares. Accordingly, no gain or loss will be recognized if you exchange ADRs for theunderlying shares represented by those ADRs.
This discussion assumes that the Company was not a passive foreign investment company for 2006 (as discussedbelow).
Taxation of dividends
Distributions made with respect to the Telecom Italia Shares or ADRs (other than certain pro rata distributions ofTelecom Italia Shares or ADRs), including any Italian tax withheld, will generally constitute foreign sourcedividend income for U.S. federal income tax purposes to the extent such distributions are made from theCompany’s current or accumulated earnings and profits, as determined in accordance with U.S. federal income taxprinciples. Since the Company does not maintain calculations of earnings and profits under U.S. federal incometax principles, distributions will generally be reported to U.S. holders as dividends. Subject to applicablelimitations that may vary depending on a U.S. holder’s individual circumstances and the discussion above
234
Item 10. Additional Information Taxation
regarding concerns expressed by the U.S. Treasury, under current law, dividends paid to certain non-corporateU.S. holders in taxable years beginning before January 1, 2011 will be taxable at a maximum tax rate of 15%. Non-corporate U.S. holders should consult their own tax advisors to determine whether they are subject to any specialrules that may limit their ability to be taxed at this favorable rate.
You will not be entitled to claim a dividends-received deduction for dividends paid on the Telecom Italia Shares orADRs. The amount of any cash distribution paid in euros, including the amount of any Italian tax withheld, will beequal to the U.S. dollar value of such euros on the date of receipt by the Depositary in the case of U.S. holders ofADRs, or by the U.S. holder in the case of U.S. holders of Telecom Italia Shares, regardless of whether thepayment is in fact converted into U.S. dollars. Gain or loss, if any, recognized on the sale or other disposition ofsuch euros will be U.S. source ordinary income or loss. If the dividend is converted into U.S. dollars on the date ofreceipt, by the Depositary you generally should not be required to recognize foreign currency gain or loss inrespect of the dividend income. You may have foreign currency gain or loss if the amount of such dividend is notconverted into U.S. dollars on the date of its receipt. The amount of any distribution of property other than cashwill be the fair market value of such property on the date of distribution.
Subject to certain limitations and restrictions and the discussion above regarding concerns expressed by the U.S.Treasury, Italian taxes withheld from distributions at a rate not in excess of that provided in the Treaty will beeligible for credit against a U.S. holder’s U.S. federal income tax liability. Italian taxes withheld in excess of therate provided in the Treaty will generally not be eligible for credit against a U.S. holder’s U.S. federal income taxliability. The limitation on foreign taxes eligible for credit is calculated separately with respect to specific classesof income. Instead of claiming a credit, you may, at your election, deduct such Italian taxes in computing yourtaxable income, subject to generally applicable limitations under U.S. law. You should consult your tax advisorconcerning the foreign tax credit implications of the payment of any Italian withholding taxes.
Taxation of capital gains
You will generally recognize U.S. source capital gain or loss for U.S. federal income tax purposes on the sale orexchange of Telecom Italia Shares or ADRs, which will be long-term capital gain or loss if the Telecom ItaliaShares or ADRs were held for more than one year. The amount of gain or loss will be equal to the differencebetween the amount realized and your adjusted basis in the Telecom Italia Shares or ADRs. You should consultyour own tax advisor about the treatment of capital gains, which may be taxed at lower rates than ordinaryincome for non-corporate taxpayers, and capital losses, the deductibility of which may be limited.
Passive Foreign Investment Company Rules
The Company believes that it was not a “passive foreign investment company” (“PFIC”) for U.S. federal incometax purposes for 2006 and does not expect to be considered a PFIC in the foreseeable future. However, since PFICstatus depends upon the composition of the Company’s income and assets and the market value of the Company’sassets (including, among others, less than 25% owned equity investments) from time to time, there can be noassurance that the Company will not be considered a PFIC for any taxable year. If the Company were treated as aPFIC for any taxable year during which a U.S. holder held Telecom Italia Shares or ADRs, certain adverse taxconsequences could apply to the U.S. holder.
Information Reporting and Backup Withholding
You may, under certain circumstances, be subject to information reporting and backup withholding with respectto dividends or the proceeds of any sale, exchange or redemption of ADRs or Telecom Italia Shares unless you:
Š are a corporation or come within certain other exempt categories, and, when required,demonstrate this fact, or
Š in the case of backup withholding, provide a correct taxpayer identification number, certify thatyou are not subject to backup withholding and otherwise comply with applicable requirements ofthe backup withholding rules.
Any amount withheld under these rules will be creditable against your U.S. federal income tax liability and mayentitle you to a refund, provided that the required information is timely furnished to the U.S. Internal RevenueService. If you are required to and do not provide a correct taxpayer identification number, you may be subject topenalties imposed by the U.S. Internal Revenue Service.
235

Item 11. Quantitative And Qualitative Disclosures About Market Risks
Item 11. QUANTITATIVE AND QUALITATIVE DISCLOSURES ABOUT MARKET RISKS
See “Item 5. Operating and Financial Review and Prospects—5.10 Quantitative and Qualitative Disclosures AboutMarket Risks”.
236

Item 12. Description Of Securities Other Than Equity Securities
Item 12. DESCRIPTION OF SECURITIES OTHER THAN EQUITY SECURITIES
Not applicable.
237

Item 13. Defaults, Dividend Arrearages And Delinquencies
PART II
Item 13. DEFAULTS, DIVIDEND ARREARAGES AND DELINQUENCIES
Not applicable.
238

Item 14. Material Modification to the Rights Of Security Holders AndUse Of Proceeds
Item 14. MATERIAL MODIFICATION TO THE RIGHTS OF SECURITY HOLDERS AND USE OF PROCEEDS
Not applicable.
239

Item 15. Controls And Procedures Disclosure Controls And Procedures
Item 15. CONTROLS AND PROCEDURES
15.1 DISCLOSURE CONTROLS AND PROCEDURES
As of December 31, 2006, the Company, under the supervision and with the participation of the officers selectedby the 404 Implementation Team (made up of managers from the Finance Adminstration and Control, the HumanResources, the Information Technology Governance and the legal departments, together with representatives ofTelecom Italia Audit and Compliance Services), according to the guidelines set forth by the Steering Committeefor the 404 Project (composed of the Executive Deputy Chairman and the Managing Director of Telecom Italia, theGroup’s Chief Financial Officer, the General Counsel and the managers in charge of Media and Olivetti), andTelecom Italia Audit and Compliance Services S.c.a.r.l. performed an evaluation of the effectiveness of theCompany’s disclosure controls and procedures. The Company’s management necessarily applied its judgment inassessing the costs and benefits of such controls and procedures, which by their nature can provide onlyreasonable assurance regarding management’s control objectives. Based on this evaluation, the Company’sExecutive Deputy Chairman and Chief Executive Officer and the Chief Financial Officer concluded that theCompany’s disclosure controls and procedures (as defined in Rule 13a-15(e) of the Exchange Act) are effective atthe reasonable assurance level.
240
Item 15. Controls And Procedures Management’s Annual Report On Internal Control OverFinancial Reporting
15.2 MANAGEMENT’S ANNUAL REPORT ON INTERNAL CONTROL OVER FINANCIAL REPORTING
The Company’s management is responsible for establishing and maintaining adequate internal control overfinancial reporting. Internal control over financial reporting is defined in Rule 13a-15(f) or 15d-15(f) promulgatedunder the Exchange Act as a process designed by, or under the supervision of, the company’s Chief ExecutiveOfficer and Chief Financial Officer and effected by the Company’s board of directors, management and otherpersonnel, to provide reasonable assurance regarding the reliability of financial reporting and the preparation offinancial statements for external purposes in accordance with generally accepted accounting principles andincludes those policies and procedures that:
– pertain to the maintenance of records that in reasonable detail accurately and fairly reflect thetransaction and dispositions of the assets of the company;
– provide reasonable assurance that transactions are recorded as necessary to permit preparation offinancial statements in accordance with generally accepted accounting principles, and that receipts andexpenditures for the company are being made only in accordance with authorizations of managementand directors of the company; and
– provide reasonable assurance regarding prevention or timely detection of unauthorized acquisition, useor disposition of the company’s assets that could have a material effect on the financial statements.
Because of its inherent limitations, internal control over financial reporting may not prevent or detectmisstatements. Projections of any evaluation of effectiveness to future periods are subject to the risk that controlsmay become inadequate because of changes in conditions, or that the degree of compliance with the policies orprocedures may deteriorate.
The Company’s management assessed the effectiveness of the company’s internal control over financial reportingas of December 31, 2006. In making this assessment, the company’s management used the criteria set forth bythe Committee of Sponsoring Organizations of the Treadway Commission (COSO) in Internal Control-IntegratedFramework.
Based on our assessment, management believes that, as of December 31, 2006, the Company’s internal controlover financial reporting is effective based on those criteria.
The company’s independent auditors have issued an audit report on our assessment of the company’s internalcontrol over financial reporting. This report appears below.
241

Item 15. Controls And Procedures Management’s Annual Report On Internal Control OverFinancial Reporting
Report of Independent Registered Public Accounting Firm
To the Board of Directors and Shareholders of Telecom Italia S.p.A.
We have audited management’s assessment, included in the accompanying Management’s Annual Report onInternal Control over Financial Reporting, that Telecom Italia S.p.A. maintained effective internal control overfinancial reporting as of December 31, 2006, based on criteria established in Internal Control—IntegratedFramework issued by the Committee of Sponsoring Organizations of the Treadway Commission (the COSOcriteria). Telecom Italia S.p.A.’s management is responsible for maintaining effective internal control overfinancial reporting and for its assessment of the effectiveness of internal control over financial reporting. Ourresponsibility is to express an opinion on management’s assessment and an opinion on the effectiveness of thecompany’s internal control over financial reporting based on our audit.
We conducted our audit in accordance with the standards of the Public Company Accounting Oversight Board(United States). Those standards require that we plan and perform the audit to obtain reasonable assurance aboutwhether effective internal control over financial reporting was maintained in all material respects. Our auditincluded obtaining an understanding of internal control over financial reporting, evaluating management’sassessment, testing and evaluating the design and operating effectiveness of internal control, and performingsuch other procedures as we considered necessary in the circumstances. We believe that our audit provides areasonable basis for our opinion.
A company’s internal control over financial reporting is a process designed to provide reasonable assuranceregarding the reliability of financial reporting and the preparation of financial statements for external purposes inaccordance with generally accepted accounting principles. A company’s internal control over financial reportingincludes those policies and procedures that (1) pertain to the maintenance of records that, in reasonable detail,accurately and fairly reflect the transactions and dispositions of the assets of the company; (2) provide reasonableassurance that transactions are recorded as necessary to permit preparation of financial statements in accordancewith generally accepted accounting principles, and that receipts and expenditures of the company are being madeonly in accordance with authorizations of management and directors of the company; and (3) provide reasonableassurance regarding prevention or timely detection of unauthorized acquisition, use, or disposition of thecompany’s assets that could have a material effect on the financial statements.
Because of its inherent limitations, internal control over financial reporting may not prevent or detectmisstatements. Also, projections of any evaluation of effectiveness to future periods are subject to the risk thatcontrols may become inadequate because of changes in conditions, or that the degree of compliance with thepolicies or procedures may deteriorate.
242
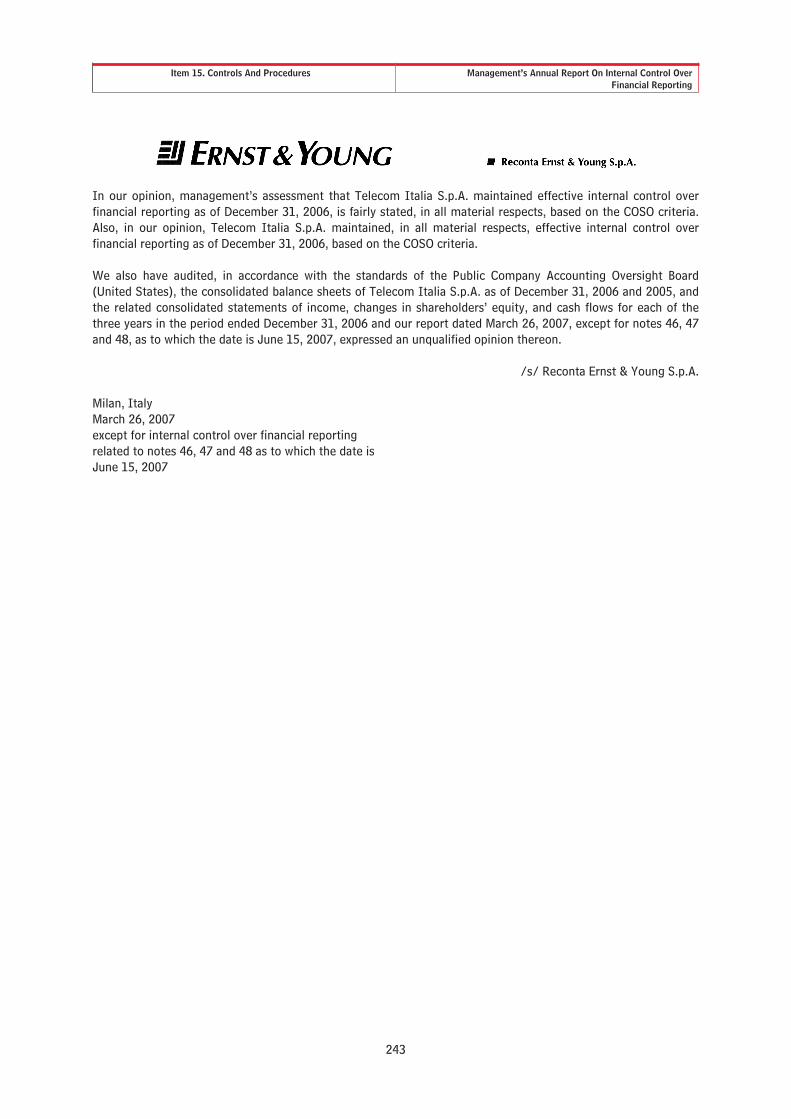
Item 15. Controls And Procedures Management’s Annual Report On Internal Control OverFinancial Reporting
In our opinion, management’s assessment that Telecom Italia S.p.A. maintained effective internal control overfinancial reporting as of December 31, 2006, is fairly stated, in all material respects, based on the COSO criteria.Also, in our opinion, Telecom Italia S.p.A. maintained, in all material respects, effective internal control overfinancial reporting as of December 31, 2006, based on the COSO criteria.
We also have audited, in accordance with the standards of the Public Company Accounting Oversight Board(United States), the consolidated balance sheets of Telecom Italia S.p.A. as of December 31, 2006 and 2005, andthe related consolidated statements of income, changes in shareholders’ equity, and cash flows for each of thethree years in the period ended December 31, 2006 and our report dated March 26, 2007, except for notes 46, 47and 48, as to which the date is June 15, 2007, expressed an unqualified opinion thereon.
/s/ Reconta Ernst & Young S.p.A.
Milan, ItalyMarch 26, 2007except for internal control over financial reportingrelated to notes 46, 47 and 48 as to which the date isJune 15, 2007
243

Item 15. Controls And Procedures Changes in Internal Control Over Financial Reporting
15.3 CHANGES IN INTERNAL CONTROL OVER FINANCIAL REPORTING
There has been no change in the Company’s internal control over financial reporting that occurred during theperiod covered by this annual report that has materially affected, or is reasonably likely to materially affect, theCompany’s internal control over financial reporting.
244

Item 16A. Audit Committee Financial ExpertItem 16B. Code Of Ethics And Conduct
Item 16. [RESERVED]
Item 16A. AUDIT COMMITTEE FINANCIAL EXPERT
After its reintegration as per the resolutions by the Shareholders’ Meeting of April 16, 2007, the Board of Auditorshas determined that each of its members is an “audit committee financial expert” as defined in Item 16A ofForm 20-F. For the names of the members of the Board of Auditors, See “Item 10. Additional Information—10.1Corporate Governance—10.1.2 General—Board of Directors—Board of Auditors”.
Item 16B. CODE OF ETHICS AND CONDUCT
On March 23, 2004, Telecom Italia adopted a new Code of Ethics and Conduct which applies to the Chairman, theExecutive Deputy Chairman, the Chief Executive Officer, the Chief Financial Officer, as well as to all the Group’semployees in and outside Italy. The Code of Ethics and Conduct is available on Telecom Italia’s website atwww.telecomitalia.it. “Item 10. Additional Information—10.1 Corporate Governance—10.1.1 DifferencesTelecom Italia’s Corporate Governance and New York Stock Exchange Corporate Governance Practices” and“—10.1 Corporate Governance—10.1.2 General—Code of Ethics and Conduct”.
245

Item 16C. Principal Accountant Fees And Services
Item 16C. PRINCIPAL ACCOUNTANT FEES AND SERVICES
Ernst & Young served as Telecom Italia’s primary independent auditors since the year ended December 31, 2001.
“Ernst & Young” means Reconta Ernst & Young S.p.A., the auditor of the Company, as well as all the Italian andforeign entities belonging to the Ernst & Young Global Network.
The following table sets forth the aggregate fees for professional services and other services rendered by Ernst &Young in 2006 and 2005.
For the fiscal year endedDecember 31,
Type of Fees 2006 2005(thousands of Euro)
Audit Fees(1) . . . . . . . . . . . . . . . . . . . . . . . . . . . . . . . . . . . . . . . . . . . . . . . . . . . . . . . . . . . . . . . . . . . . . . . . . . . . 11,381 13,434Audit-related Fees(2) . . . . . . . . . . . . . . . . . . . . . . . . . . . . . . . . . . . . . . . . . . . . . . . . . . . . . . . . . . . . . . . . . . . . 795 843
Total . . . . . . . . . . . . . . . . . . . . . . . . . . . . . . . . . . . . . . . . . . . . . . . . . . . . . . . . . . . . . . . . . . . . . . . . . . . . . . . . . . . . 12,176 14,277
(1) Audit fees consisted of fees for professional services in connection with Telecom Italia’s annual financial statements, reviews of interimfinancial statements as well as comfort letters issued in relation to capital market transactions, agreed upon procedures for certainfinancial statement areas, the agreed upon procedures required under regulations in Italy and abroad for certain transactions (such asmerger and acquisitions) and technical Accounting Consultations.
(2) Audit-related fees consisted of fees billed for professional services rendered in connection with assurance and related services notincluded under “Audit Fees”.
Audit Committee’s Pre-Approval Policies and Procedures
The Board of Auditors (also in its role as Telecom Italia’s Audit Committee), in accordance with and to the extentpermitted by applicable Italian law, is responsible for the appointment, retention and oversight of the work of theCompany’s external auditors engaged for the purpose of issuing the audit report on the annual financialstatements. To this effect, the Board of Auditors makes a recommendation to the Shareholders’ Meeting whichappoints the external auditors and determines their compensation. The three-year period 2004-2006 auditengagement conferred to Reconta Ernst & Young S.p.A. by the Telecom Italia Shareholders’ Meeting on May 6,2004 came to an end with the issuance by Reconta Ernst & Young S.p.A. of its audit report on the financialstatements of Telecom Italia for the year ended December 31, 2006. As a result of this and under the applicableItalian rules and regulations governing the appointment of independent auditors for listed companies, on April 16,2007, the Telecom Italia Shareholders’ Meeting resolved to extend the appointment of Reconta Ernst & YoungS.p.A. as Telecom Italia’s primary independent auditors for the three year period 2007-2009.
In October 2003, Telecom Italia, together with the Board of Auditors, adopted the Group Procedure for theAppointment of Auditors (the “Group Procedure”). The Group Procedure requires that Ernst & Young beappointed throughout the Group with any exceptions subject to prior approval by the Director with delegatedauthority and the Board of Auditors. The Group Procedure pre-approved certain audit and permissible non-auditservices to be provided by the external auditors (and associated persons) and prohibited certain services.According to the Group Procedure, the Board of Auditors pre-approved (subject to annual review) the followingaudit and permitted non-audit services:
Audit Services:
1. Audit of annual and interim financial statements on the basis of applicable laws and regulations (includingthe audit of SEC registered companies’ annual report).
2. Audit of annual and interim financial consolidated reporting packages.
3. Audit conformity of the Telecom Italia Group’s sustainability reports or social reports.
4. Reports or opinions required by law for specific transactions from the auditor appointed to audit the annualfinancial statements, to the extent permitted.
246

Item 16C. Principal Accountant Fees And Services
5. Audits governed by the principles of national and international auditing such as:
Š procedures performed in relation to the issuance of a comfort letter (including for pro formaaccounts and/or balance sheets) in relation to the carrying out of extraordinary financialoperations;
Š audits agreed with management covering specific areas or accounts or accounting situations, tosupport the audit of periodic statements;
Š auditing of subsidiaries and associated companies (including review of the working papers of otherauditors) made necessary for the purpose of auditing the periodic statements of the companybeing audited.
6. Audit of annual accounts and/or balance sheets to be published in prospectuses, information documents,offering memoranda and similar documents.
7. Services required by regulatory authorities and control agencies (such as, for example, those connected withso-called ‘regulatory accounting’).
8. Audit of statements required by national or supranational administrations (such as, for example the EU) forthe concession of grants or loans for specific actions or projects.
9. Audits aimed at issuance of an attestation of the system of internal control under Section 404 of theSarbanes-Oxley Act.
Permitted Non-audit Services:
1. “Audits” in the following areas:
Š procedures for auditing associated companies provided for by agreements between shareholders(in relation to so-called “audit rights”);
Š financial due diligence procedures on companies to be bought or sold;
Š procedures performed in the area of regulatory accounting;
Š procedures performed on areas related to internal control in support of the internal auditor.
2. Opinions on accounting and reporting including those regarding (i) application of new accounting principlesand new regulations on accounting and regulatory reporting, (ii) implementation of accounting principlescurrent in other countries, (iii) implementation of rules and regulations issued by the SEC, CONSOB andsimilar bodies.
3. Assistance to the internal audit department within the limits imposed by SEC regulations.
The pre-approved services listed above are in all cases subject to scrutiny by the Director with delegated powersfor internal controls, by the Board of Directors who may (by his own initiative or on request by the Committee forInternal Control and Corporate Governance or by the Board of Auditors) request supplementary documentation toverify the independent status of the auditor and take appropriate action if necessary.
Services that are not included in one of the categories listed above require specific pre-approval of the Directorwith delegated powers for internal controls, by the Board of Directors and the Board of Auditors. An approval maynot be granted if the service falls within a category of services not permitted by current law or if it is inconsistentwith maintaining auditor independence.
247

Item 16D. Exemptions from the Listing Standards for AuditCommittees
Item 16E. Repurchases of Equity Securities
Item 16D. EXEMPTIONS FROM THE LISTING STANDARDS FOR AUDIT COMMITTEES
Please see “Item 10. Additional Information—10.1 Corporate Governance—10.1.2 General—Board ofDirectors—Board of Auditors—Audit Committee”.
Item 16E. REPURCHASES OF EQUITY SECURITIES
From January 1, 2006, to December 31, 2006, no purchases were made by or on behalf of Telecom Italia or anyaffiliated purchaser of Shares or Savings Shares.
248

Item 17. Financial Statements
PART III
Item 17. FINANCIAL STATEMENTS
Not applicable.
249
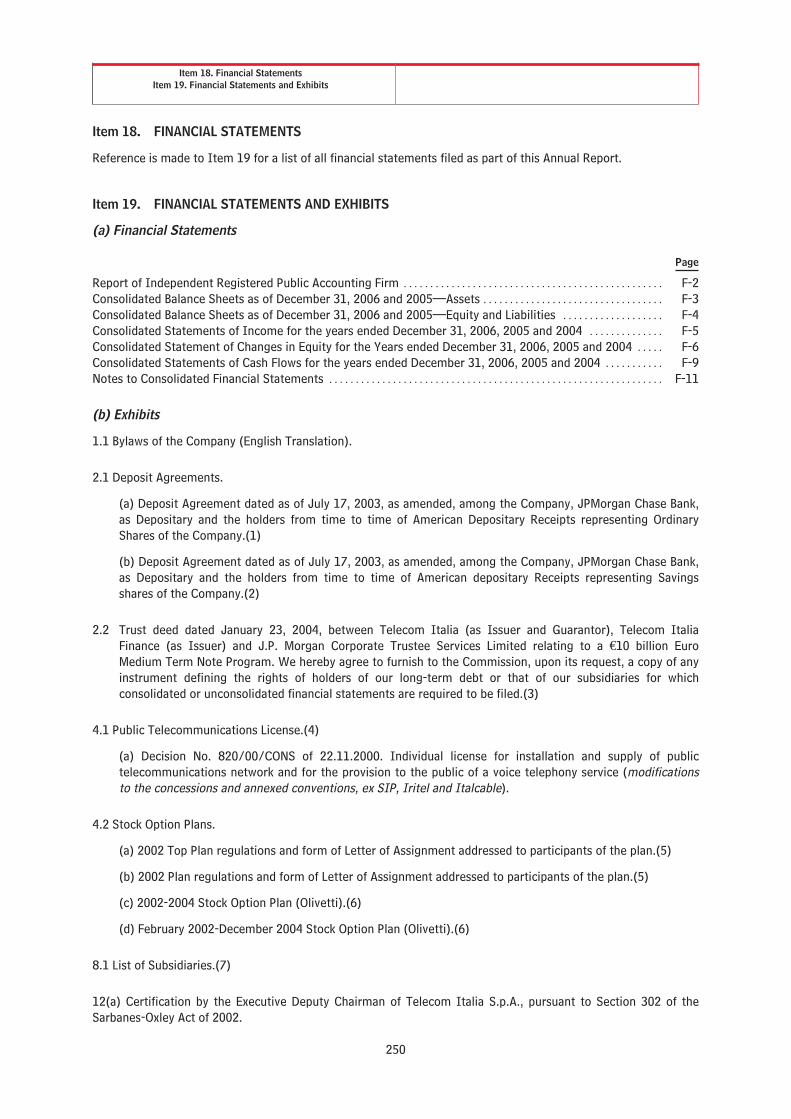
Item 18. Financial StatementsItem 19. Financial Statements and Exhibits
Item 18. FINANCIAL STATEMENTS
Reference is made to Item 19 for a list of all financial statements filed as part of this Annual Report.
Item 19. FINANCIAL STATEMENTS AND EXHIBITS
(a) Financial Statements
Page
Report of Independent Registered Public Accounting Firm . . . . . . . . . . . . . . . . . . . . . . . . . . . . . . . . . . . . . . . . . . . . . . . . . F-2Consolidated Balance Sheets as of December 31, 2006 and 2005—Assets . . . . . . . . . . . . . . . . . . . . . . . . . . . . . . . . . . F-3Consolidated Balance Sheets as of December 31, 2006 and 2005—Equity and Liabilities . . . . . . . . . . . . . . . . . . . F-4Consolidated Statements of Income for the years ended December 31, 2006, 2005 and 2004 . . . . . . . . . . . . . . F-5Consolidated Statement of Changes in Equity for the Years ended December 31, 2006, 2005 and 2004 . . . . . F-6Consolidated Statements of Cash Flows for the years ended December 31, 2006, 2005 and 2004 . . . . . . . . . . . F-9Notes to Consolidated Financial Statements . . . . . . . . . . . . . . . . . . . . . . . . . . . . . . . . . . . . . . . . . . . . . . . . . . . . . . . . . . . . . . . F-11
(b) Exhibits
1.1 Bylaws of the Company (English Translation).
2.1 Deposit Agreements.
(a) Deposit Agreement dated as of July 17, 2003, as amended, among the Company, JPMorgan Chase Bank,as Depositary and the holders from time to time of American Depositary Receipts representing OrdinaryShares of the Company.(1)
(b) Deposit Agreement dated as of July 17, 2003, as amended, among the Company, JPMorgan Chase Bank,as Depositary and the holders from time to time of American depositary Receipts representing Savingsshares of the Company.(2)
2.2 Trust deed dated January 23, 2004, between Telecom Italia (as Issuer and Guarantor), Telecom ItaliaFinance (as Issuer) and J.P. Morgan Corporate Trustee Services Limited relating to a €10 billion EuroMedium Term Note Program. We hereby agree to furnish to the Commission, upon its request, a copy of anyinstrument defining the rights of holders of our long-term debt or that of our subsidiaries for whichconsolidated or unconsolidated financial statements are required to be filed.(3)
4.1 Public Telecommunications License.(4)
(a) Decision No. 820/00/CONS of 22.11.2000. Individual license for installation and supply of publictelecommunications network and for the provision to the public of a voice telephony service (modificationsto the concessions and annexed conventions, ex SIP, Iritel and Italcable).
4.2 Stock Option Plans.
(a) 2002 Top Plan regulations and form of Letter of Assignment addressed to participants of the plan.(5)
(b) 2002 Plan regulations and form of Letter of Assignment addressed to participants of the plan.(5)
(c) 2002-2004 Stock Option Plan (Olivetti).(6)
(d) February 2002-December 2004 Stock Option Plan (Olivetti).(6)
8.1 List of Subsidiaries.(7)
12(a) Certification by the Executive Deputy Chairman of Telecom Italia S.p.A., pursuant to Section 302 of theSarbanes-Oxley Act of 2002.
250

Item 19. Financial Statements and Exhibits
12(b) Certification by the Chief Executive Officer of Telecom Italia S.p.A., pursuant to Section 302 of theSarbanes-Oxley Act of 2002.
12(c) Certification by the Head of Finance, Administration and Control of Telecom Italia S.p.A., pursuant toSection 302 of the Sarbanes-Oxley Act of 2002.
13.1 Certification pursuant to 18 U.S.C Section 1350, as adopted pursuant to Section 906 of the Sarbanes-OxleyAct of 2002.
15.1 Report on Form 6-K dated February 22, 2007 (unofficial English translation of a report prepared by theInternal Control and Corporate Governance Committee of the Board of Directors of Telecom Italia S.p.A. for theBoard of Directors). (8)
(1) Incorporated by reference to exhibit (a) filed with Olivetti’s Registration Statement on Form F-6 filed with the SEC on July 18, 2003(File No. 333-107144).
(2) Incorporated by reference to exhibit (a) filed with Olivetti’s Registration Statement on Form F-6 filed with the SEC on July 18, 2003(File No. 333-107142).
(3) Incorporated by reference to the Exhibits filed with the Company’s Annual Report on Form 20-F on June 10, 2004 (File No. 001-13882).
(4) Incorporated by reference to the Exhibits filed with the Company’s Annual Report on Form 20-F/A on June 29, 2001 (File No. 001-13882).
(5) Incorporated by reference to the Exhibits filed with the Company’s Annual Report for the fiscal year ended December 31, 2002 onForm 20-F filed with the SEC on June 26, 2003 (File No. 001-13882).
(6) Incorporated by reference to the Exhibits filed with the Company’s Annual Report on Form 20-F on June 10, 2004 (File No. 001-13882).
(7) Please see “Note 45-List of Companies of the Telecom Italia Group” of the Notes to the Consolidated Financial Statements includedelsewhere herein.
(8) Incorporated by reference (File No. 001-13882).
251

Item 19. Financial Statements and Exhibits
SIGNATURE
Pursuant to the requirements of Section 12 of the Securities Exchange Act of 1934, the registrantcertifies that it meets all the requirements for filing on Form 20-F and has duly caused this AnnualReport to be signed on its behalf by the undersigned, thereunto duly authorized.
TELECOM ITALIA S.p.A.
By: /s/ CARLO ORAZIO BUORA
Name: Carlo Orazio BuoraTitle: Executive Deputy Chairman
Dated June 21, 2007

TELECOM ITALIA S.P.A.
CONSOLIDATED FINANCIAL STATEMENTS
REPORT OF INDEPENDENT REGISTERED PUBLIC ACCOUNTING FIRM . . . . . . . . . . . . . . . . . . . . . . . . . . . . . . . . . . . . F-2CONSOLIDATED BALANCE SHEETS AS OF DECEMBER 31, 2006 AND 2005—ASSETS . . . . . . . . . . . . . . . . . . . . . . F-3CONSOLIDATED BALANCE SHEETS AS OF DECEMBER 31, 2006 AND 2005—EQUITY AND LIABILITIES . . . . F-4CONSOLIDATED STATEMENTS OF INCOME FOR THE YEARS ENDED DECEMBER 31, 2006, 2005 AND
2004 . . . . . . . . . . . . . . . . . . . . . . . . . . . . . . . . . . . . . . . . . . . . . . . . . . . . . . . . . . . . . . . . . . . . . . . . . . . . . . . . . . . . . . . . . . . . . . . . . . F-5CONSOLIDATED STATEMENT OF CHANGES IN EQUITY FOR THE YEAR ENDED DECEMBER 31, 2004 . . . . . . . F-6CONSOLIDATED STATEMENT OF CHANGES IN EQUITY FOR THE YEAR ENDED DECEMBER 31, 2005 . . . . . . . F-7CONSOLIDATED STATEMENT OF CHANGES IN EQUITY FOR THE YEAR ENDED DECEMBER 31, 2006 . . . . . . . F-8CONSOLIDATED STATEMENTS OF CASH FLOWS FOR THE YEARS ENDED DECEMBER 31, 2006, 2005 AND
2004 . . . . . . . . . . . . . . . . . . . . . . . . . . . . . . . . . . . . . . . . . . . . . . . . . . . . . . . . . . . . . . . . . . . . . . . . . . . . . . . . . . . . . . . . . . . . . . . . . . F-9NOTE 1—FORM AND CONTENT AND OTHER GENERAL INFORMATION . . . . . . . . . . . . . . . . . . . . . . . . . . . . . . . . . . . . F-11NOTE 2—ACCOUNTING POLICIES . . . . . . . . . . . . . . . . . . . . . . . . . . . . . . . . . . . . . . . . . . . . . . . . . . . . . . . . . . . . . . . . . . . . . . . F-14NOTE 3—BUSINESS COMBINATIONS, ACQUISITIONS OF MINORITY INTERESTS AND TRANSACTIONS
BETWEEN COMPANIES UNDER COMMON CONTROL . . . . . . . . . . . . . . . . . . . . . . . . . . . . . . . . . . . . . . . . . . . . . . . . . . . F-28NOTE 4—FINANCIAL RISK MANAGEMENT . . . . . . . . . . . . . . . . . . . . . . . . . . . . . . . . . . . . . . . . . . . . . . . . . . . . . . . . . . . . . . . F-33NOTE 5—GOODWILL . . . . . . . . . . . . . . . . . . . . . . . . . . . . . . . . . . . . . . . . . . . . . . . . . . . . . . . . . . . . . . . . . . . . . . . . . . . . . . . . . . . . F-37NOTE 6—INTANGIBLE ASSETS WITH A FINITE LIFE . . . . . . . . . . . . . . . . . . . . . . . . . . . . . . . . . . . . . . . . . . . . . . . . . . . . . F-40NOTE 7—TANGIBLE ASSETS (OWNED AND UNDER FINANCE LEASES) . . . . . . . . . . . . . . . . . . . . . . . . . . . . . . . . . . . . F-42NOTE 8—OTHER NON-CURRENT ASSETS . . . . . . . . . . . . . . . . . . . . . . . . . . . . . . . . . . . . . . . . . . . . . . . . . . . . . . . . . . . . . . . . F-45NOTE 9—DEFERRED TAX ASSETS AND DEFERRED TAX LIABILITIES . . . . . . . . . . . . . . . . . . . . . . . . . . . . . . . . . . . . . . F-51NOTE 10—INVENTORIES . . . . . . . . . . . . . . . . . . . . . . . . . . . . . . . . . . . . . . . . . . . . . . . . . . . . . . . . . . . . . . . . . . . . . . . . . . . . . . . . F-53NOTE 11—TRADE AND MISCELLANEOUS RECEIVABLES AND OTHER CURRENT ASSETS . . . . . . . . . . . . . . . . . . F-53NOTE 12—CURRENT INCOME TAX RECEIVABLES . . . . . . . . . . . . . . . . . . . . . . . . . . . . . . . . . . . . . . . . . . . . . . . . . . . . . . . . F-54NOTE 13—SECURITIES (CURRENT ASSETS) . . . . . . . . . . . . . . . . . . . . . . . . . . . . . . . . . . . . . . . . . . . . . . . . . . . . . . . . . . . . . F-55NOTE 14—FINANCIAL RECEIVABLES AND OTHER CURRENT FINANCIAL ASSETS . . . . . . . . . . . . . . . . . . . . . . . . . F-55NOTE 15—CASH AND CASH EQUIVALENTS . . . . . . . . . . . . . . . . . . . . . . . . . . . . . . . . . . . . . . . . . . . . . . . . . . . . . . . . . . . . . . F-56NOTE 16—DISCONTINUED OPERATIONS/ASSETS HELD FOR SALE AND LIABILITIES RELATING TO
DISCONTINUED OPERATIONS/ASSETS HELD FOR SALE . . . . . . . . . . . . . . . . . . . . . . . . . . . . . . . . . . . . . . . . . . . . . . . F-56NOTE 17—EQUITY . . . . . . . . . . . . . . . . . . . . . . . . . . . . . . . . . . . . . . . . . . . . . . . . . . . . . . . . . . . . . . . . . . . . . . . . . . . . . . . . . . . . . . F-61NOTE 18—FINANCIAL LIABILITIES (CURRENT AND NON-CURRENT) . . . . . . . . . . . . . . . . . . . . . . . . . . . . . . . . . . . . . F-66NOTE 19—EMPLOYEE SEVERANCE INDEMNITIES AND OTHER EMPLOYEE-RELATED PROVISIONS . . . . . . . . F-76NOTE 20—PROVISIONS FOR RISKS AND CHARGES . . . . . . . . . . . . . . . . . . . . . . . . . . . . . . . . . . . . . . . . . . . . . . . . . . . . . . F-78NOTE 21—MISCELLANEOUS PAYABLES AND OTHER NON-CURRENT LIABILITIES . . . . . . . . . . . . . . . . . . . . . . . . F-79NOTE 22—TRADE AND MISCELLANEOUS PAYABLES AND OTHER CURRENT LIABILITIES . . . . . . . . . . . . . . . . . F-80NOTE 23—CURRENT INCOME TAX PAYABLES . . . . . . . . . . . . . . . . . . . . . . . . . . . . . . . . . . . . . . . . . . . . . . . . . . . . . . . . . . . . F-80NOTE 24—FINANCIAL INSTRUMENTS . . . . . . . . . . . . . . . . . . . . . . . . . . . . . . . . . . . . . . . . . . . . . . . . . . . . . . . . . . . . . . . . . . . F-81NOTE 25— FINANCIAL ASSETS PLEDGED AS COLLATERAL FOR FINANCIAL LIABILITIES . . . . . . . . . . . . . . . . . F-87NOTE 26—CONTINGENT ASSETS AND LIABILITIES, COMMITMENTS AND OTHER GUARANTEES . . . . . . . . . . F-87NOTE 27—REVENUES . . . . . . . . . . . . . . . . . . . . . . . . . . . . . . . . . . . . . . . . . . . . . . . . . . . . . . . . . . . . . . . . . . . . . . . . . . . . . . . . . . . F-99NOTE 28—OTHER INCOME . . . . . . . . . . . . . . . . . . . . . . . . . . . . . . . . . . . . . . . . . . . . . . . . . . . . . . . . . . . . . . . . . . . . . . . . . . . . . . F-100NOTE 29—PURCHASES OF MATERIALS AND EXTERNAL SERVICES . . . . . . . . . . . . . . . . . . . . . . . . . . . . . . . . . . . . . . . F-100NOTE 30—PERSONNEL COSTS . . . . . . . . . . . . . . . . . . . . . . . . . . . . . . . . . . . . . . . . . . . . . . . . . . . . . . . . . . . . . . . . . . . . . . . . . . . F-100NOTE 31—OTHER OPERATING EXPENSES . . . . . . . . . . . . . . . . . . . . . . . . . . . . . . . . . . . . . . . . . . . . . . . . . . . . . . . . . . . . . . . F-102NOTE 32—CAPITALIZED INTERNAL CONSTRUCTION COSTS . . . . . . . . . . . . . . . . . . . . . . . . . . . . . . . . . . . . . . . . . . . . . F-102NOTE 33—DEPRECIATION AND AMORTIZATION . . . . . . . . . . . . . . . . . . . . . . . . . . . . . . . . . . . . . . . . . . . . . . . . . . . . . . . . F-102NOTE 34—GAINS (LOSSES) ON DISPOSALS OF NON-CURRENT ASSETS . . . . . . . . . . . . . . . . . . . . . . . . . . . . . . . . . . F-103NOTE 35—IMPAIRMENT REVERSALS (LOSSES) ON NON-CURRENT ASSETS . . . . . . . . . . . . . . . . . . . . . . . . . . . . . . F-104NOTE 36—FINANCIAL INCOME . . . . . . . . . . . . . . . . . . . . . . . . . . . . . . . . . . . . . . . . . . . . . . . . . . . . . . . . . . . . . . . . . . . . . . . . . . F-105NOTE 37—FINANCIAL EXPENSES . . . . . . . . . . . . . . . . . . . . . . . . . . . . . . . . . . . . . . . . . . . . . . . . . . . . . . . . . . . . . . . . . . . . . . . . F-106NOTE 38—INCOME TAXES . . . . . . . . . . . . . . . . . . . . . . . . . . . . . . . . . . . . . . . . . . . . . . . . . . . . . . . . . . . . . . . . . . . . . . . . . . . . . . F-108NOTE 39—EARNINGS PER SHARE . . . . . . . . . . . . . . . . . . . . . . . . . . . . . . . . . . . . . . . . . . . . . . . . . . . . . . . . . . . . . . . . . . . . . . . F-110NOTE 40—SEGMENT INFORMATION . . . . . . . . . . . . . . . . . . . . . . . . . . . . . . . . . . . . . . . . . . . . . . . . . . . . . . . . . . . . . . . . . . . . . F-111NOTE 41—RELATED PARTY TRANSACTIONS . . . . . . . . . . . . . . . . . . . . . . . . . . . . . . . . . . . . . . . . . . . . . . . . . . . . . . . . . . . . . F-116NOTE 42—STOCK OPTION PLANS OF THE TELECOM ITALIA GROUP . . . . . . . . . . . . . . . . . . . . . . . . . . . . . . . . . . . . . . F-137NOTE 43—OTHER INFORMATION . . . . . . . . . . . . . . . . . . . . . . . . . . . . . . . . . . . . . . . . . . . . . . . . . . . . . . . . . . . . . . . . . . . . . . . F-144NOTE 44—EVENTS SUBSEQUENT TO DECEMBER 31, 2006 . . . . . . . . . . . . . . . . . . . . . . . . . . . . . . . . . . . . . . . . . . . . . . . F-145NOTE 45—LIST OF COMPANIES OF THE TELECOM ITALIA GROUP . . . . . . . . . . . . . . . . . . . . . . . . . . . . . . . . . . . . . . . F-146NOTE 46—RECONCILIATION OF IFRS AS ADOPTED BY THE EU TO U.S. GAAP . . . . . . . . . . . . . . . . . . . . . . . . . . . . F-157NOTE 47—CONDENSED CONSOLIDATED U.S. GAAP FINANCIAL STATEMENTS . . . . . . . . . . . . . . . . . . . . . . . . . . . F-164NOTE 48—ADDITIONAL U.S. GAAP DISCLOSURES . . . . . . . . . . . . . . . . . . . . . . . . . . . . . . . . . . . . . . . . . . . . . . . . . . . . . . . F-166
F-1

Financial Statements Report Of Independent Registered Public Accounting Firm
REPORT OF INDEPENDENT REGISTERED PUBLIC ACCOUNTING FIRM
To the Shareholders of Telecom Italia S.p.A.
We have audited the accompanying consolidated balance sheets of Telecom Italia S.p.A. (the Company) as ofDecember 31, 2006 and 2005, and the related consolidated statements of income, changes in shareholders’ equityand cash flows for each of the three years in the period ended December 31, 2006. These financial statements arethe responsibility of the Company’s management. Our responsibility is to express an opinion on these financialstatements based on our audits.
We conducted our audits in accordance with the standards of the Public Company Accounting Oversight Board(United States). Those standards require that we plan and perform the audit to obtain reasonable assurance aboutwhether the financial statements are free of material misstatement. An audit includes examining, on a test basis,evidence supporting the amounts and disclosures in the financial statements. An audit also includes assessing theaccounting principles used and significant estimates made by management, as well as evaluating the overallfinancial statement presentation. We believe that our audits provide a reasonable basis for our opinion.
In our opinion, the financial statements referred to above present fairly, in all material respects, the consolidatedfinancial position of Telecom Italia S.p.A. at December 31, 2006 and 2005 and the consolidated results of itsoperations and its cash flows for each of the three years in the period ended December 31, 2006, in conformitywith International Financial Reporting Standards as adopted by the European Union.
International Financial Reporting Standards as adopted by the European Union vary in certain significant respectsfrom accounting principles generally accepted in the United States of America. Information relating to the natureand effect of such differences is presented in Notes 46, 47 and 48 to the financial statements.
We also have audited, in accordance with the standards of the Public Company Accounting Oversight Board(United States), the effectiveness of Telecom Italia S.p.A.’s internal control over financial reporting as ofDecember 31, 2006, based on criteria established in Internal Control—Integrated Framework issued by theCommittee of Sponsoring Organizations of the Treadway Commission (COSO) and our report dated March 26 andJune 15, 2007 expressed an unqualified opinion thereon.
/s/ Reconta Ernst & Young S.p.A.
Milan, ItalyMarch 26, 2007except for notes 46, 47 and 48 as to which the date isJune 15, 2007
F-2
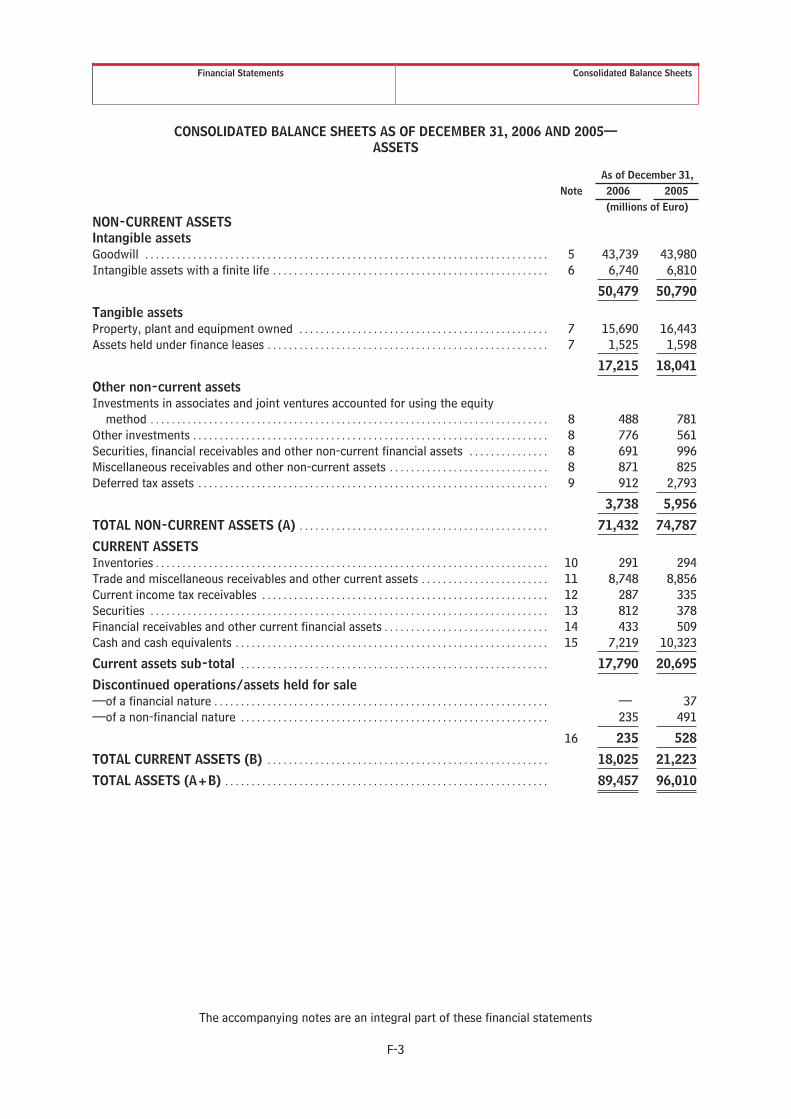
Financial Statements Consolidated Balance Sheets
CONSOLIDATED BALANCE SHEETS AS OF DECEMBER 31, 2006 AND 2005—ASSETS
As of December 31,Note 2006 2005
(millions of Euro)NON-CURRENT ASSETSIntangible assetsGoodwill . . . . . . . . . . . . . . . . . . . . . . . . . . . . . . . . . . . . . . . . . . . . . . . . . . . . . . . . . . . . . . . . . . . . . . . . . . . . 5 43,739 43,980Intangible assets with a finite life . . . . . . . . . . . . . . . . . . . . . . . . . . . . . . . . . . . . . . . . . . . . . . . . . . . . 6 6,740 6,810
50,479 50,790
Tangible assetsProperty, plant and equipment owned . . . . . . . . . . . . . . . . . . . . . . . . . . . . . . . . . . . . . . . . . . . . . . . 7 15,690 16,443Assets held under finance leases . . . . . . . . . . . . . . . . . . . . . . . . . . . . . . . . . . . . . . . . . . . . . . . . . . . . . 7 1,525 1,598
17,215 18,041
Other non-current assetsInvestments in associates and joint ventures accounted for using the equity
method . . . . . . . . . . . . . . . . . . . . . . . . . . . . . . . . . . . . . . . . . . . . . . . . . . . . . . . . . . . . . . . . . . . . . . . . . . . 8 488 781Other investments . . . . . . . . . . . . . . . . . . . . . . . . . . . . . . . . . . . . . . . . . . . . . . . . . . . . . . . . . . . . . . . . . . . 8 776 561Securities, financial receivables and other non-current financial assets . . . . . . . . . . . . . . . 8 691 996Miscellaneous receivables and other non-current assets . . . . . . . . . . . . . . . . . . . . . . . . . . . . . . 8 871 825Deferred tax assets . . . . . . . . . . . . . . . . . . . . . . . . . . . . . . . . . . . . . . . . . . . . . . . . . . . . . . . . . . . . . . . . . . 9 912 2,793
3,738 5,956
TOTAL NON-CURRENT ASSETS (A) . . . . . . . . . . . . . . . . . . . . . . . . . . . . . . . . . . . . . . . . . . . . . . . 71,432 74,787
CURRENT ASSETSInventories . . . . . . . . . . . . . . . . . . . . . . . . . . . . . . . . . . . . . . . . . . . . . . . . . . . . . . . . . . . . . . . . . . . . . . . . . . 10 291 294Trade and miscellaneous receivables and other current assets . . . . . . . . . . . . . . . . . . . . . . . . 11 8,748 8,856Current income tax receivables . . . . . . . . . . . . . . . . . . . . . . . . . . . . . . . . . . . . . . . . . . . . . . . . . . . . . . 12 287 335Securities . . . . . . . . . . . . . . . . . . . . . . . . . . . . . . . . . . . . . . . . . . . . . . . . . . . . . . . . . . . . . . . . . . . . . . . . . . . 13 812 378Financial receivables and other current financial assets . . . . . . . . . . . . . . . . . . . . . . . . . . . . . . . 14 433 509Cash and cash equivalents . . . . . . . . . . . . . . . . . . . . . . . . . . . . . . . . . . . . . . . . . . . . . . . . . . . . . . . . . . . 15 7,219 10,323
Current assets sub-total . . . . . . . . . . . . . . . . . . . . . . . . . . . . . . . . . . . . . . . . . . . . . . . . . . . . . . . . . . 17,790 20,695
Discontinued operations/assets held for sale—of a financial nature . . . . . . . . . . . . . . . . . . . . . . . . . . . . . . . . . . . . . . . . . . . . . . . . . . . . . . . . . . . . . . . — 37—of a non-financial nature . . . . . . . . . . . . . . . . . . . . . . . . . . . . . . . . . . . . . . . . . . . . . . . . . . . . . . . . . . 235 491
16 235 528
TOTAL CURRENT ASSETS (B) . . . . . . . . . . . . . . . . . . . . . . . . . . . . . . . . . . . . . . . . . . . . . . . . . . . . . 18,025 21,223
TOTAL ASSETS (A+B) . . . . . . . . . . . . . . . . . . . . . . . . . . . . . . . . . . . . . . . . . . . . . . . . . . . . . . . . . . . . . 89,457 96,010
The accompanying notes are an integral part of these financial statements
F-3

Financial Statements Consolidated Balance Sheets
CONSOLIDATED BALANCE SHEETS AS OF DECEMBER 31, 2006 AND 2005—EQUITY AND LIABILITIES
As of December 31,Note 2006 2005
(millions of Euro)EQUITYShare capital issued . . . . . . . . . . . . . . . . . . . . . . . . . . . . . . . . . . . . . . . . . . . . . . . . . . . . . . . . . . . . . . . . . 10,674 10,668Less: Treasury shares . . . . . . . . . . . . . . . . . . . . . . . . . . . . . . . . . . . . . . . . . . . . . . . . . . . . . . . . . . . . . . . . (69) (69)
Share Capital . . . . . . . . . . . . . . . . . . . . . . . . . . . . . . . . . . . . . . . . . . . . . . . . . . . . . . . . . . . . . . . . . . . . . . 10,605 10,599
Reserve for additional paid-in capital . . . . . . . . . . . . . . . . . . . . . . . . . . . . . . . . . . . . . . . . . . . . . . . . 1,689 6,465Other reserves and retained earnings (accumulated losses), including net income
(loss) for the year . . . . . . . . . . . . . . . . . . . . . . . . . . . . . . . . . . . . . . . . . . . . . . . . . . . . . . . . . . . . . . . . . 13,724 8,598
Equity attributable to equity holders of the Parent . . . . . . . . . . . . . . . . . . . . . . . . . . . . . . 26,018 25,662Equity attributable to Minority Interests . . . . . . . . . . . . . . . . . . . . . . . . . . . . . . . . . . . . . . . . . 1,080 1,323
TOTAL EQUITY (A) . . . . . . . . . . . . . . . . . . . . . . . . . . . . . . . . . . . . . . . . . . . . . . . . . . . . . . . . . . . . . . . . . 17 27,098 26,985
NON-CURRENT LIABILITIESNon-current financial liabilities . . . . . . . . . . . . . . . . . . . . . . . . . . . . . . . . . . . . . . . . . . . . . . . . . . . . . . 18 40,803 42,146Employee severance indemnities and other employee-related provisions . . . . . . . . . . . . . 19 1,262 1,351Deferred tax liabilities . . . . . . . . . . . . . . . . . . . . . . . . . . . . . . . . . . . . . . . . . . . . . . . . . . . . . . . . . . . . . . . 9 194 137Provisions for risks and charges . . . . . . . . . . . . . . . . . . . . . . . . . . . . . . . . . . . . . . . . . . . . . . . . . . . . . 20 775 797Miscellaneous payables and other non-current liabilities . . . . . . . . . . . . . . . . . . . . . . . . . . . . . 21 1,857 2,113
TOTAL NON-CURRENT LIABILITIES (B) . . . . . . . . . . . . . . . . . . . . . . . . . . . . . . . . . . . . . . . . . . . 44,891 46,544
CURRENT LIABILITIESCurrent financial liabilities . . . . . . . . . . . . . . . . . . . . . . . . . . . . . . . . . . . . . . . . . . . . . . . . . . . . . . . . . . . 18 5,653 9,812Trade and miscellaneous payables and other current liabilities . . . . . . . . . . . . . . . . . . . . . . . 22 11,596 12,157Current income tax payables . . . . . . . . . . . . . . . . . . . . . . . . . . . . . . . . . . . . . . . . . . . . . . . . . . . . . . . . . 23 219 227
Current liabilities sub-total . . . . . . . . . . . . . . . . . . . . . . . . . . . . . . . . . . . . . . . . . . . . . . . . . . . . . . . 17,468 22,196
Liabilities relating to discontinued operations/assets held for sale—of a financial nature . . . . . . . . . . . . . . . . . . . . . . . . . . . . . . . . . . . . . . . . . . . . . . . . . . . . . . . . . . . . . . . — 143—of a non-financial nature . . . . . . . . . . . . . . . . . . . . . . . . . . . . . . . . . . . . . . . . . . . . . . . . . . . . . . . . . . — 142
16 — 285
TOTAL CURRENT LIABILITIES (C) . . . . . . . . . . . . . . . . . . . . . . . . . . . . . . . . . . . . . . . . . . . . . . . . . 17,468 22,481
TOTAL LIABILITIES (D=B+C) . . . . . . . . . . . . . . . . . . . . . . . . . . . . . . . . . . . . . . . . . . . . . . . . . . . . . 62,359 69,025
TOTAL EQUITY AND LIABILITIES (A+D) . . . . . . . . . . . . . . . . . . . . . . . . . . . . . . . . . . . . . . . . . . 89,457 96,010
The accompanying notes are an integral part of these financial statements
F-4

Financial Statements Consolidated Statements Of Income
CONSOLIDATED STATEMENTS OF INCOME FOR THE YEARS ENDEDDECEMBER 31, 2006, 2005 AND 2004
Year ended December 31,Note 2006 2005 2004
(millions of Euro)Revenues . . . . . . . . . . . . . . . . . . . . . . . . . . . . . . . . . . . . . . . . . . . . . . . . . . . . . . . . . . . . . . . . . . . 27 31,275 29,919 28,292Other income . . . . . . . . . . . . . . . . . . . . . . . . . . . . . . . . . . . . . . . . . . . . . . . . . . . . . . . . . . . . . . . 28 606 678 1,099
Total operating revenues and other income . . . . . . . . . . . . . . . . . . . . . . . . . . . . 31,881 30,597 29,391
Purchases of materials and external services . . . . . . . . . . . . . . . . . . . . . . . . . . . . . . . . 29 (14,191) (12,937) (11,812)Personnel costs . . . . . . . . . . . . . . . . . . . . . . . . . . . . . . . . . . . . . . . . . . . . . . . . . . . . . . . . . . . . . 30 (3,801) (4,142) (3,852)Other operating expenses . . . . . . . . . . . . . . . . . . . . . . . . . . . . . . . . . . . . . . . . . . . . . . . . . . . 31 (1,543) (1,468) (1,603)Changes in inventories . . . . . . . . . . . . . . . . . . . . . . . . . . . . . . . . . . . . . . . . . . . . . . . . . . . . . . 10 8 (4) 27Capitalized internal construction costs . . . . . . . . . . . . . . . . . . . . . . . . . . . . . . . . . . . . . . 32 496 471 713Depreciation and amortization . . . . . . . . . . . . . . . . . . . . . . . . . . . . . . . . . . . . . . . . . . . . . . 33 (5,487) (5,232) (4,808)Gains (losses) on disposals of non-current assets(1) . . . . . . . . . . . . . . . . . . . . . . . . . 34 95 242 (9)Impairment reversals (losses) on non-current assets . . . . . . . . . . . . . . . . . . . . . . . . 35 (21) (28) (444)
Operating income . . . . . . . . . . . . . . . . . . . . . . . . . . . . . . . . . . . . . . . . . . . . . . . . . . . . . . . . 7,437 7,499 7,603
Share of profits (losses) of associates and joint ventures accounted for usingthe equity method . . . . . . . . . . . . . . . . . . . . . . . . . . . . . . . . . . . . . . . . . . . . . . . . . . . . . . . 8 51 23 (5)
Financial income . . . . . . . . . . . . . . . . . . . . . . . . . . . . . . . . . . . . . . . . . . . . . . . . . . . . . . . . . . . . 36 3,041 3,144 2,224Financial expenses . . . . . . . . . . . . . . . . . . . . . . . . . . . . . . . . . . . . . . . . . . . . . . . . . . . . . . . . . . 37 (5,014) (5,131) (4,216)
Income from continuing operations before taxes . . . . . . . . . . . . . . . . . . . . . . . 5,515 5,535 5,606Income taxes . . . . . . . . . . . . . . . . . . . . . . . . . . . . . . . . . . . . . . . . . . . . . . . . . . . . . . . . . . . . . . . 38 (2,519) (2,395) (2,654)
Net income from continuing operations . . . . . . . . . . . . . . . . . . . . . . . . . . . . . . . . . 2,996 3,140 2,952Net income (loss) from discontinued operations/assets held for sale . . . . . . . . 16 7 550 (118)
Net income for the year . . . . . . . . . . . . . . . . . . . . . . . . . . . . . . . . . . . . . . . . . . . . . . . . . . 3,003 3,690 2,834Of which:Š Net income attributable to equity holders of the Parent . . . . . . . . . . . . . . . . . . . 3,014 3,216 1,815Š Net income (loss) attributable to Minority Interests . . . . . . . . . . . . . . . . . . . . . . . (11) 474 1,019
(1) Excludes capital gains/losses realized on disposals of investments classified as discontinued operations/assets held for sale andinvestments other than in subsidiaries.
Year ended December 31,2006 2005 2004
Basic and Diluted Earnings Per Share (EPS)(*) 39 (Euro)
—Ordinary Share . . . . . . . . . . . . . . . . . . . . . . . . . . . . . . . . . . . . . . . . . . . . . . . . . . . . . . . . . . . 0.15 0.17 0.11—Savings Share . . . . . . . . . . . . . . . . . . . . . . . . . . . . . . . . . . . . . . . . . . . . . . . . . . . . . . . . . . . . 0.16 0.18 0.12
Of which:—From continuing operations
—Ordinary Share . . . . . . . . . . . . . . . . . . . . . . . . . . . . . . . . . . . . . . . . . . . . . . . . . . . . . . . . 0.15 0.14 0.12—Savings Share . . . . . . . . . . . . . . . . . . . . . . . . . . . . . . . . . . . . . . . . . . . . . . . . . . . . . . . . . 0.16 0.15 0.13
—From discontinued operations/assets held for sale—Ordinary Share . . . . . . . . . . . . . . . . . . . . . . . . . . . . . . . . . . . . . . . . . . . . . . . . . . . . . . . . — 0.03 (0.01)—Savings Share . . . . . . . . . . . . . . . . . . . . . . . . . . . . . . . . . . . . . . . . . . . . . . . . . . . . . . . . . — 0.03 (0.01)
(*) Basic EPS is equal to Diluted EPS.
The accompanying notes are an integral part of these financial statements
F-5

Financial Statements Consolidated Statement Of Changes In Equity
CONSOLIDATED STATEMENT OF CHANGES IN EQUITY FOR THE YEARS ENDEDDECEMBER 31, 2006, 2005 AND 2004
Equity attributable to equity holders of the Parent
Sharecapital
Reservefor
additionalpaid-incapital
Reservefor net
translationdifferences
Otherreserves and
retainedearnings
(accumulatedlosses),
including netincome (loss)for the year Total
Equityattributableto MinorityInterests
Totalequity
(millions of Euro)Balance at December 31, 2003 in
accordance with Italian GAAP . . . . . . . . . . . . 8,854 88 — 7,150 16,092 4,497 20,589Adoption of IFRS . . . . . . . . . . . . . . . . . . . . . . . . . . . . . (56) (56) — 275 163 32 195
Balance at December 31, 2003 inaccordance with IFRS . . . . . . . . . . . . . . . . . . . . 8,798 32 — 7,425 16,255 4,529 20,784
Changes in equity in 2004:Fair value adjustments of available-for-sale
financial assets:Š Unrealized gains (losses) from fair value
adjustments . . . . . . . . . . . . . . . . . . . . . . . . . . . . . . — — — 52 52 — 52Š Gains/losses transferred to the statement of
income . . . . . . . . . . . . . . . . . . . . . . . . . . . . . . . . . . — — — (9) (9) — (9)Fair value adjustments of hedging instruments:
Š Unrealized gains (losses) from fair valueadjustments of cash flow hedgingderivatives . . . . . . . . . . . . . . . . . . . . . . . . . . . . . . . — — — (313) (313) — (313)
Š Gains/losses transferred to the statement ofincome . . . . . . . . . . . . . . . . . . . . . . . . . . . . . . . . . . — — — 100 100 — 100
Translation differences . . . . . . . . . . . . . . . . . . . . . . . . — — (50) — (50) (26) (76)Income taxes . . . . . . . . . . . . . . . . . . . . . . . . . . . . . . . . — — — 81 81 — 81
Income (loss) recognized directly inequity—other comprehensive income(loss) . . . . . . . . . . . . . . . . . . . . . . . . . . . . . . . . . . . . — — (50) (89) (139) (26) (165)
Net income for the year . . . . . . . . . . . . . . . . . . . . — — — 1,815 1,815 1,019 2,834
Total comprehensive income (loss) for theyear . . . . . . . . . . . . . . . . . . . . . . . . . . . . . . . . . . . . . — — (50) 1,726 1,676 993 2,669
Š Dividends approved . . . . . . . . . . . . . . . . . . . . . . . — — — (1,730) (1,730) (1,050) (2,780)Š Conversion of bonds . . . . . . . . . . . . . . . . . . . . . . . 1 3 — — 4 — 4Š Exercise of stock options . . . . . . . . . . . . . . . . . . . 10 30 — — 40 207 247Š Dilution of TIM shares held following stock
options . . . . . . . . . . . . . . . . . . . . . . . . . . . . . . . . . . — — — 66 66 (66) —Š Effect of consolidation of TIM shares
previously recorded in current assets . . . . . . . . — — — — — (20) (20)Š Other changes . . . . . . . . . . . . . . . . . . . . . . . . . . . . — — — (63) (63) (43) (106)
Balance at December 31, 2004 inaccordance with IFRS . . . . . . . . . . . . . . . . . . . . 8,809 65 (50) 7,424 16,248 4,550 20,798
The accompanying notes are an integral part of these financial statements
F-6

Financial Statements Consolidated Statement Of Changes In Equity
CONSOLIDATED STATEMENT OF CHANGES IN EQUITY FOR THE YEARS ENDEDDECEMBER 31, 2006, 2005 AND 2004
Equity attributable to equity holders of the Parent
Sharecapital
Reservefor
additionalpaid-incapital
Reservefor net
translationdifferences
Otherreserves and
retainedearnings
(accumulatedlosses),
including netincome (loss)for the year Total
Equityattributableto MinorityInterests
Totalequity
(millions of Euro)Balance at December 31, 2004 in
accordance with Italian GAAP . . . . . . . . . . . 8,865 120 — 6,187 15,172 4,689 19,861Adoption of IFRS . . . . . . . . . . . . . . . . . . . . . . . . . . . . (56) (55) (50) 1,237 1,076 (139) 937
Balance at December 31, 2004 inaccordance with IFRS . . . . . . . . . . . . . . . . . . . 8,809 65 (50) 7,424 16,248 4,550 20,798
Changes in equity in 2005:Fair value adjustments of available-for-sale
financial assets:Š Unrealized gains (losses) from fair value
adjustments . . . . . . . . . . . . . . . . . . . . . . . . . . . . . — — — 57 57 — 57Š Gains/losses transferred to the statement of
income . . . . . . . . . . . . . . . . . . . . . . . . . . . . . . . . . — — — (11) (11) — (11)Fair value adjustments of hedging instruments:
Š Unrealized gains (losses) from fair valueadjustments of cash flow hedgingderivatives . . . . . . . . . . . . . . . . . . . . . . . . . . . . . . — — — (122) (122) — (122)
Š Gains/losses transferred to the statement ofincome . . . . . . . . . . . . . . . . . . . . . . . . . . . . . . . . . — — — 75 75 — 75
Translation differences . . . . . . . . . . . . . . . . . . . . — — 848 — 848 357 1,205Income taxes . . . . . . . . . . . . . . . . . . . . . . . . . . . . . — — — (1) (1) — (1)
Income (loss) recognized directly inequity—other comprehensive income(loss) . . . . . . . . . . . . . . . . . . . . . . . . . . . . . . . . . . . — — 848 (2) 846 357 1,203
Net income for the year . . . . . . . . . . . . . . . . . . . — — — 3,216 3,216 474 3,690
Total comprehensive income (loss) for theyear . . . . . . . . . . . . . . . . . . . . . . . . . . . . . . . . . . . . . — — 848 3,214 4,062 831 4,893
Š Dividends approved . . . . . . . . . . . . . . . . . . . . . . — — — (1,912) (1,912) (430) (2,342)Š Conversion of bonds . . . . . . . . . . . . . . . . . . . . . . 488 1,640 — (315) 1,813 — 1,813Š Exercise of stock options . . . . . . . . . . . . . . . . . . 6 23 — — 29 — 29Š Cash tender offer and other purchases of
shares . . . . . . . . . . . . . . . . . . . . . . . . . . . . . . . . . . — — — — — (2,124) (2,124)Š Telecom Italia/TIM Merger . . . . . . . . . . . . . . . 1,309 4,768 — (64) 6,013 (1,102) 4,911Š Transfer of Tin.it from Telecom Italia Media
to Telecom Italia . . . . . . . . . . . . . . . . . . . . . . . . . — — — (364) (364) 364 —Š Cash tender offer on Telecom Italia Media
shares . . . . . . . . . . . . . . . . . . . . . . . . . . . . . . . . . . — — — — — (134) (134)Š Reorganization of Mobile business segment
in Brazil . . . . . . . . . . . . . . . . . . . . . . . . . . . . . . . . . — — — (14) (14) 40 26Š Reimbursement of Entel Bolivia capital . . . . . . — — — — — (160) (160)Š Changes in the scope of consolidation . . . . . . — — (5) — (5) (577) (582)Š Telecom Italia shares held by Telecom Italia
Finance . . . . . . . . . . . . . . . . . . . . . . . . . . . . . . . . . (13) — — — (13) — (13)Š Other changes . . . . . . . . . . . . . . . . . . . . . . . . . . . — (31) — (164) (195) 65 (130)
Balance at December 31, 2005 inaccordance with IFRS . . . . . . . . . . . . . . . . . . . 10,599 6,465 793 7,805 25,662 1,323 26,985
The accompanying notes are an integral part of these financial statements
F-7

Financial Statements Consolidated Statement Of Changes In Equity
CONSOLIDATED STATEMENT OF CHANGES IN EQUITY FOR THE YEARS ENDEDDECEMBER 31, 2006, 2005 AND 2004
Equity attributable to equity holders of the Parent
Sharecapital
Reservefor
additionalpaid-incapital
Reservefor net
translationdifferences
Otherreserves and
retainedearnings
(accumulatedlosses),
including netincome (loss)for the year Total
Equityattributableto MinorityInterests
Totalequity
(millions of Euro)Balance at December 31, 2005 in
accordance with IFRS . . . . . . . . . . . . . . . . . . . 10,599 6,465 793 7,805 25,662 1,323 26,985Application of Legislative Decree
No. 38/2005 . . . . . . . . . . . . . . . . . . . . . . . . . . . . . — (4,796) — 4,796 — — —
Balance at December 31, 2005 inaccordance with IFRS as adjusted . . . . . . . 10,599 1,669 793 12,601 25,662 1,323 26,985
Changes in equity in 2006:Fair value adjustments of available-for-sale
financial assets:Š Unrealized gains (losses) from fair value
adjustments . . . . . . . . . . . . . . . . . . . . . . . . . . . . — — — 68 68 — 68Š Gains/losses transferred to the statement
of income . . . . . . . . . . . . . . . . . . . . . . . . . . . . . . — — — — — — —Fair value adjustments of hedging instruments:
Š Unrealized gains (losses) from fair valueadjustments of cash flow hedgingderivatives . . . . . . . . . . . . . . . . . . . . . . . . . . . . . — — — (48) (48) — (48)
Š Gains/losses transferred to the statementof income . . . . . . . . . . . . . . . . . . . . . . . . . . . . . . — — — 290 290 — 290
Translation differences . . . . . . . . . . . . . . . . . . . . — — (119) — (119) (44) (163)Income taxes . . . . . . . . . . . . . . . . . . . . . . . . . . . . . — — — (83) (83) — (83)
Income (loss) recognized directly inequity—other comprehensive income(loss) . . . . . . . . . . . . . . . . . . . . . . . . . . . . . . . . . . . — — (119) 227 108 (44) 64
Net income for the year . . . . . . . . . . . . . . . . . . . — — — 3,014 3,014 (11) 3,003
Total comprehensive income (loss) for theyear . . . . . . . . . . . . . . . . . . . . . . . . . . . . . . . . . . . . . — — (119) 3,241 3,122 (55) 3,067
Š Dividends approved . . . . . . . . . . . . . . . . . . . . . — — — (2,766) (2,766) (236) (3,002)Š Conversion of bonds . . . . . . . . . . . . . . . . . . . . 6 20 — (4) 22 — 22Š Exercise of stock options . . . . . . . . . . . . . . . . — — — — — 2 2Š Reorganization of Mobile business segment
in Brazil . . . . . . . . . . . . . . . . . . . . . . . . . . . . . . . . — — — (59) (59) 59 —Š Changes in the scope of consolidation . . . . . — — 12 — 12 (15) (3)Š Other changes . . . . . . . . . . . . . . . . . . . . . . . . . . — — — 25 25 2 27
Balance at December 31, 2006 inaccordance with IFRS . . . . . . . . . . . . . . . . . . . 10,605 1,689 686 13,038 26,018 1,080 27,098
The accompanying notes are an integral part of these financial statements
F-8

Financial Statements Consolidated Statements Of Cash Flows
CONSOLIDATED STATEMENTS OF CASH FLOWS FOR THE YEARS ENDEDDECEMBER 31, 2006, 2005 AND 2004
Year ended December 31,Note 2006 2005 2004
(millions of Euro)CASH FLOWS FROM OPERATING ACTIVITIES:Net income from continuing operations . . . . . . . . . . . . . . . . . . . . . . . . . . . . . . . . . . . . . . 2,996 3,140 2,952Adjustments to reconcile net income from continuing operations to cash flows
generated by (used in) operating activities:Depreciation and amortization . . . . . . . . . . . . . . . . . . . . . . . . . . . . . . . . . . . . . . . . . . . . . . . 5,487 5,232 4,808Impairment (reversals) losses of non-current assets (including investments) . . . . . . 1 3 446Net change in deferred tax assets and liabilities . . . . . . . . . . . . . . . . . . . . . . . . . . . . . . . 1,843 1,347 1,124Net (gains) losses realized on disposals of non-current assets (including
investments) . . . . . . . . . . . . . . . . . . . . . . . . . . . . . . . . . . . . . . . . . . . . . . . . . . . . . . . . . . . . (317) (327) (106)Share of (profits) losses of associates and joint ventures accounted for using the
equity method . . . . . . . . . . . . . . . . . . . . . . . . . . . . . . . . . . . . . . . . . . . . . . . . . . . . . . . . . . (51) (23) 5Change in employee severance indemnities and other employee-related
provisions . . . . . . . . . . . . . . . . . . . . . . . . . . . . . . . . . . . . . . . . . . . . . . . . . . . . . . . . . . . . . . (114) 255 (39)Change in other operating assets/liabilities:Š Change in inventories . . . . . . . . . . . . . . . . . . . . . . . . . . . . . . . . . . . . . . . . . . . . . . . . . . . . . . — (5) (24)Š Change in trade receivables and net receivables on construction contracts . . . . . . . . . (461) 329 51Š Change in trade payables . . . . . . . . . . . . . . . . . . . . . . . . . . . . . . . . . . . . . . . . . . . . . . . . . . . (10) 184 1,079Š Net change in miscellaneous receivables/payables and other assets/liabilities . . . . . (180) (357) (30)
CASH FLOWS GENERATED BY (USED IN) OPERATING ACTIVITIES (A) . . . . . . 9,194 9,778 10,266CASH FLOWS FROM INVESTING ACTIVITIES:Acquisitions of intangible assets on an accrual basis . . . . . . . . . . . . . . . . . . . . . . . . . . . 6 (2,187) (1,785) (1,882)Acquisition of tangible assets on an accrual basis . . . . . . . . . . . . . . . . . . . . . . . . . . . . . . 7 (2,927) (3,388) (3,120)
Total acquisitions of intangible and tangible assets on an accrual basis . . . . . . . . . . . (5,114) (5,173) (5,002)Change in amounts due to fixed asset suppliers (*) . . . . . . . . . . . . . . . . . . . . . . . . 10 158 —
Total acquisitions of intangible and tangible assets on a cash basis . . . . . . . . . . . . . . (5,104) (5,015) (5,002)Acquisitions of investments in subsidiaries and businesses, net of cash
acquired (I) . . . . . . . . . . . . . . . . . . . . . . . . . . . . . . . . . . . . . . . . . . . . . . . . . . . . . . . . . . . . . 3,5,6 — (390) (1)Acquisitions of other investments . . . . . . . . . . . . . . . . . . . . . . . . . . . . . . . . . . . . . . . . . . . . 3,5,8 (206) (14,544) (867)Change in financial receivables and other financial assets . . . . . . . . . . . . . . . . . . . . . . . (264) (474) 424Proceeds from sale of investments in subsidiaries, net of cash disposed of (II) . . . . 5,16 345 2,052 43Proceeds from sale/repayments of intangible, tangible and other non-current
assets (II) . . . . . . . . . . . . . . . . . . . . . . . . . . . . . . . . . . . . . . . . . . . . . . . . . . . . . . . . . . . . . . 1,038 950 452
CASH FLOWS GENERATED BY (USED IN) INVESTING ACTIVITIES (B) . . . . . . . (4,191) (17,421) (4,951)CASH FLOWS FROM FINANCING ACTIVITIES:Net change in current financial liabilities and other liabilities . . . . . . . . . . . . . . . . . . . . (204) (1,053) 1,247Proceeds from non-current financial liabilities (including current portion) . . . . . . . . 5,222 15,357 7,845Repayments of non-current financial liabilities (including current portion) . . . . . . . . (9,995) (3,151) (8,270)Proceeds from equity instruments . . . . . . . . . . . . . . . . . . . . . . . . . . . . . . . . . . . . . . . . . . . 2 102 193Share capital increases/repayments . . . . . . . . . . . . . . . . . . . . . . . . . . . . . . . . . . . . . . . . . — (160) 51Dividends paid (distribution of reserves included) . . . . . . . . . . . . . . . . . . . . . . . . . . . . . . (2,997) (2,328) (2,780)
CASH FLOWS GENERATED BY (USED IN) FINANCING ACTIVITIES (C) . . . . . . (7,972) 8,767 (1,714)CASH FLOWS GENERATED BY (USED IN) DISCONTINUED OPERATIONS/
ASSETS HELD FOR SALE (D) . . . . . . . . . . . . . . . . . . . . . . . . . . . . . . . . . . . . . . . . . . . . 16 (13) 26 (109)AGGREGATE CASH FLOWS (E=A+B+C+D) . . . . . . . . . . . . . . . . . . . . . . . . . . . . . . . (2,982) 1,150 3,492NET CASH AND CASH EQUIVALENTS AT THE BEGINNING OF THE
YEAR (F) . . . . . . . . . . . . . . . . . . . . . . . . . . . . . . . . . . . . . . . . . . . . . . . . . . . . . . . . . . . . . . . 9,958 8,667 5,211Net effect of foreign currency translation on net cash and cash
equivalents (G) . . . . . . . . . . . . . . . . . . . . . . . . . . . . . . . . . . . . . . . . . . . . . . . . . . . . . . . . (16) 141 (36)NET CASH AND CASH EQUIVALENTS AT THE END OF THE YEAR
(H=E+F+G) . . . . . . . . . . . . . . . . . . . . . . . . . . . . . . . . . . . . . . . . . . . . . . . . . . . . . . . . . . . 6,960 9,958 8,667
(I) Net of change in payables arising from the related acquisition.
(II) Net of change in receivables arising from the related disposal.
(*) Not available for the year ended December 31, 2004.
The accompanying notes are an integral part of these financial statements
F-9

Financial Statements Consolidated Statements Of Cash Flows
CONSOLIDATED STATEMENTS OF CASH FLOWS FORTHE YEARS ENDED DECEMBER 31, 2006, 2005 AND 2004
Year ended December 31,2006 2005 2004
(millions of Euro)ADDITIONAL CASH FLOW INFORMATION:Income taxes (paid)/received . . . . . . . . . . . . . . . . . . . . . . . . . . . . . . . . . . . . . . . . . . . . . . . . . . . (566) (708) (1,476)
Interest expense paid . . . . . . . . . . . . . . . . . . . . . . . . . . . . . . . . . . . . . . . . . . . . . . . . . . . . . . . . . . . (3,108) (2,796) (2,779)
Interest income received . . . . . . . . . . . . . . . . . . . . . . . . . . . . . . . . . . . . . . . . . . . . . . . . . . . . . . . . 1,156 1,067 1,025
Dividends received . . . . . . . . . . . . . . . . . . . . . . . . . . . . . . . . . . . . . . . . . . . . . . . . . . . . . . . . . . . . . . 63 61 35
ANALYSIS OF NET CASH AND CASH EQUIVALENTS:
NET CASH AND CASH EQUIVALENTS AT THE BEGINNING OF THE YEAR:Š Cash and cash equivalents—from continuing operations . . . . . . . . . . . . . . . . . . . . . . 10,323 8,746 5,515Š Bank overdrafts repayable on demand—from continuing operations . . . . . . . . . . . (383) (248) (510)Š Cash and cash equivalents—from discontinued operations/assets held for
sale . . . . . . . . . . . . . . . . . . . . . . . . . . . . . . . . . . . . . . . . . . . . . . . . . . . . . . . . . . . . . . . . . . . . . . . . . . 37 210 206Š Bank overdrafts repayable on demand—from discontinued operations/assets
held for sale . . . . . . . . . . . . . . . . . . . . . . . . . . . . . . . . . . . . . . . . . . . . . . . . . . . . . . . . . . . . . . . . . . (19) (41) —
9,958 8,667 5,211
NET CASH AND CASH EQUIVALENTS AT THE END OF THE YEAR:Š Cash and cash equivalents—from continuing operations . . . . . . . . . . . . . . . . . . . . . . 7,219 10,323 8,746Š Bank overdrafts repayable on demand—from continuing operations . . . . . . . . . . . (259) (383) (248)Š Cash and cash equivalents—from discontinued operations/assets held for
sale . . . . . . . . . . . . . . . . . . . . . . . . . . . . . . . . . . . . . . . . . . . . . . . . . . . . . . . . . . . . . . . . . . . . . . . . . . — 37 210Š Bank overdrafts repayable on demand—from discontinued operations/assets
held for sale . . . . . . . . . . . . . . . . . . . . . . . . . . . . . . . . . . . . . . . . . . . . . . . . . . . . . . . . . . . . . . . . . . — (19) (41)
6,960 9,958 8,667
The accompanying notes are an integral part of these financial statements
F-10

Financial Statements Notes To Consolidated Financial Statements
NOTE 1—FORM AND CONTENT AND OTHER GENERAL INFORMATION
FORM AND CONTENT
Telecom Italia S.p.A. is a corporation organized under the laws of the Republic of Italy. Telecom Italia S.p.A. andits subsidiaries (the “Group”) operate mainly in Europe, the Mediterranean Basin and South America.
The Group is engaged principally in the communications sector and, particularly, in telephone and data serviceson fixed lines, for final retail customers and wholesale providers, in the development of fiber optic networks forwholesale customers, in innovative broadband services, in Internet services, in domestic and international mobiletelecommunications (especially in Brazil), in the television sector using both analog and digital terrestrialtechnology and in the office products sector.
The head office of the Parent Company, Telecom Italia, is located in Milan, Italy.
The consolidated financial statements of the Telecom Italia Group are expressed in millions of euro which is alsothe currency of the primary economies in which the Group operates. Foreign subsidiaries are included in theconsolidated financial statements in accordance with the accounting policies described in “Note 2—Accountingpolicies”.
The consolidated financial statements for the year ended December 31, 2006 have been prepared in accordancewith IFRS issued by the International Accounting Standards Board and endorsed by the European Union (“IFRS”),and by the national laws in force. IFRS also include all effective International Accounting Standards (“IAS”) andall Interpretations issued by the International Financial Reporting Interpretations Committee (“IFRIC”),comprising those previously issued by the Standing Interpretations Committee (“SIC”).
The consolidated financial statements have been prepared under the historic cost convention, except foravailable-for-sale financial assets, financial assets held for trading and derivative instruments which have beenmeasured at fair value, as well as discontinued operations/assets held for sale and the liabilities related todiscontinued operations/assets held for sale which have been stated at the lower of carrying value or fair valueless costs to sell. The carrying amounts of hedged assets and liabilities have been adjusted to reflect the changesin fair value of the hedged risks (fair value hedge).
The Group did not opt for the early adoption of any IFRS in 2006.
Minor changes have been made to the classification of certain items in the consolidated financial statements ofprior years to allow comparison with the presentation in the consolidated financial statements at December 31,2006.
FINANCIAL STATEMENT FORMATS
The financial statement formats adopted are consistent with those indicated in IAS 1. In particular:
Š the consolidated balance sheets have been prepared by classifying the assets and liabilities according to“current and non-current” criterion and separately indicating on two lines “Discontinued operations/assets held for sale” and “Liabilities relating to discontinued operations/assets held for sale” asrequired by IFRS 5;
Š the consolidated statements of income have been prepared by classifying the operating costs by natureof expense, since this form of presentation is considered more appropriate and representative of thespecific business of the Group, and conforms to internal reporting and is in line with the industrialsector of reference. Moreover, results from continuing operations are shown separately from the “Netincome (loss) from discontinued operations/assets held for sale” as required by IFRS 5;
Š the consolidated statements of changes in equity have been prepared in conformity with the IAS 1;
Š the consolidated statements of cash flows have been prepared by presenting financial flows fromoperating activities according to the “indirect method”, as permitted by IAS 7, and separately showingfinancial flows from “Discontinued operations/assets held for sale”, as required by IFRS 5.
F-11

Financial Statements Notes To Consolidated Financial Statements
SEGMENT INFORMATION
The disclosure of segment information has been modified to present the Brazil Mobile segment separately fromthe Domestic Mobile segment in light of the increasing importance of the Brazilian mobile business and theorganizational changes that took place during 2006.
The segment information presented for prior periods has been reclassified for purpose of comparison.
The accounting presentation by business segment is therefore as follows:
Š Wireline
Š Domestic Mobile
Š Brazil Mobile
Š Media
Š Olivetti
Š Other activities
SEASONAL FACTORS AFFECTING REVENUES
Š Wireline
The trend of revenues from basic subscription charges and traffic relating to fixed telecommunicationswas not significantly affected by seasonal factors in 2006 with respect to 2005 and 2004. However, thepromotional campaigns launched in 2006 had a positive effect on product sales.
Š Domestic Mobile
The trend of voice traffic revenues relating to the domestic mobile business was not influenced byseasonal factors related to market campaigns. These campaigns, however, have an effect on therevenues from sales and marginally also on revenues from Valued Added Services (VAS). Nevertheless,there are seasonal phenomena relating to the number of holidays during the year.
Š Brazil Mobile
The trend of revenues relating to the Brazil mobile business were only marginally affected by seasonalfactors involving marketing campaigns but were influenced by seasonal phenomena relating to thenumber of holidays during the year.
SCOPE OF CONSOLIDATION
Excluding the effects of discontinued operations/assets held for sale at December 31, 2006 and 2005 (describedbelow), the impact of the other changes in the scope of consolidation on the results of operations, the financialposition and cash flows during 2006 and 2005 was not material.
The changes in the scope of consolidation at December 31, 2006 compared to December 31, 2005 can besummarized as follows:
a) inclusions in the scope of consolidation:
– Olivetti: AdValso S.p.A (established in November 2006);
b) exclusions from the scope of consolidation:
– Wireline: Telecom Media International Italy-Canada Inc. (wind-up closed in November 2006), EmaxTrade S.r.l. (wind-up closed in November 2006) and Liberty Telecom B.V. (wind-up closed in December2006);
– Olivetti: Wirelab S.p.A. (partial sale of investment), Olivetti Tecnost Portugal S.A. (wind-up closed inMay 2006) and Olivetti Tecnost H.K. Ltd (wind-up closed in October 2006);
F-12

Financial Statements Notes To Consolidated Financial Statements
– Other activities: Ruf Gestion S.a.S. (sold in March 2006), Olivetti International (Service) S.A. (wind-upclosed in April 2006), Eustema S.p.A. (sold in April 2006), Consorzio Energia (wind-up closed in May2006), Consorzio Formazione Area Mediterranea (reclassified to investments in associates), TelecomItalia Learning Services S.p.A. (sold in July 2006), Blah! Inc. (wind-up closed in October 2006) andEdotel S.p.A. (wind-up closed in December 2006);
c) merged companies:
– effective January 2006, La7 Televisioni S.p.A. was merged with the parent Telecom Italia Media S.p.A.;
– effective March 2006, Tim Italia S.p.A. was merged with the parent Telecom Italia S.p.A.;
– effective March 2006, Blah!- Sociedade Anonima de Servicos e Comercio and CRC–Centro deRelacionamento com Clientes were merged into the parent Tim Celular S.A., whose investment waslater contributed by Tim Brasil S.A. to Tim Participações S.A.;
– effective June 2006, Tim Sul S.A. was merged into Tim Celular S.A., Tim Nordeste TelecomunicaçoesS.A. was merged into Maxitel S.A. and renamed Tim Nordeste S.A.;
– effective October 2006, Nuova Tin.It S.r.l. was merged with the parent Telecom Italia S.p.A..
The changes in the scope of consolidation at December 31, 2005 compared to December 31, 2004 can besummarized as follows:
a) inclusions in the scope of consolidation:
– Wireline: Rits Tele.com. B.V. (acquired in March 2005), Nuova Tin.It S.r.l. (established in May 2005),Liberty Surf Group S.A. (acquired on May 31, 2005), Telecom Italia Data Center S.r.l. (established inAugust 2005) and TIS France S.a.S. (established in August 2005);
– Other activities: Progetto Italia S.p.A. (established in January 2005) and Ascai Servizi S.r.l.(controlling interest acquired in May 2005);
b) exclusions from the scope of consolidation:
– Wireline: Med 1/c-1 (1999) Ltd (sold in July 2005), and Kmatrix S.r.l. (deleted from the CompaniesRegister in July 2005);
– Media: Televoice S.p.A. (sold in January 2005), Databank S.p.A. and Dbk S.A. (sold in February 2005);
– Olivetti: Innovis S.p.A. (controlling interest sold in January 2005), Cell-Tell S.p.A. (controlling interestsold in March 2005), Olivetti Servicios y Soluciones Integrales S.A. de C.V. in liquidation (deleted fromthe Companies Register in March 2005), Olivetti Lexikon Nordic AB in liquidation (closed in April 2005),Olivetti Tecnost Africa Ltd (sold in July 2005) and Olivetti Peruana S.A. (deleted from the CompaniesRegister in November 2005);
c) merged companies:
– Wireline: Finanziaria Web S.p.A., Ism S.r.l. and Telecom Italia Data Center S.r.l. merged into TelecomItalia S.p.A.; Tiscali Telecom S.a.S., Tiscali Contact S.A., Tiscali Media S.A., Film non Stop S.A. andTelecom Italia France S.a.S. merged into Tiscali Access S.A. then renamed Telecom Italia S.A.; RitsTele.com B.V. merged in BBNed;
– Mobile: Telecom Italia Mobile S.p.A. merged into Telecom Italia S.p.A.;
– Olivetti: Olivetti Sistema e Serviços Ltda merged in Olivetti do Brasil and Olivetti Tecnost de MexicoS.A. de C.V. merged in Olivetti Mexicana S.A..
F-13

Financial Statements Notes To Consolidated Financial Statements
At December 31, 2006 and 2005, the subsidiaries, associates and joint ventures of Telecom Italia can besummarized as follows:
At December 31, 2006Italy Outside Italy Total
Companies:– subsidiaries consolidated on a line-by-line basis . . . . . . . . . . . . . 43 85 128– joint ventures accounted for using the equity method . . . . . . . 1 1 2– associates accounted for using the equity method . . . . . . . . . . . 26 7 33
Total companies . . . . . . . . . . . . . . . . . . . . . . . . . . . . . . . . . . . . . . . . . . . . . 70 93 163
At December 31, 2005Italy Outside Italy Total
Companies:– subsidiaries consolidated on a line-by-line basis (*) . . . . . . . . . 54 100 154– joint ventures accounted for using the equity method . . . . . . . 1 1 2– associates accounted for using the equity method . . . . . . . . . . . 31 12 43
Total companies . . . . . . . . . . . . . . . . . . . . . . . . . . . . . . . . . . . . . . . . . . . . . 86 113 199
(*) Including subsidiaries held for sale.
For further details, see the “Note 45—List of companies of the Telecom Italia Group”.
DISCONTINUED OPERATIONS/ASSETS HELD FOR SALE
As required by IFRS 5 (Non-current assets held for sale and discontinued operations), balance sheet andstatement of income items relating to discontinued operations/ assets held for sale have been classified in twoseparate lines on the balance sheet in “Discontinued operations/assets held for sale” and in “Liabilities relating todiscontinued operations/assets held for sale” and in one line on the statement of income in “Net income (loss)from discontinued operations/assets held for sale.”
In particular:
– the 2006 statement of income includes the data of Digitel Venezuela (sold in May 2006);
– the 2005 statement of income includes the data of: Digitel Venezuela (sold in May 2006), the Entel Chilegroup (sold in March 2005), Tim Hellas (sold at the beginning of June 2005), the Finsiel group (sold atthe end of June 2005), Tim Perù (sold in August 2005) and Gruppo Buffetti (sold in January 2006);
– the 2004 statement of income includes the data of: Entel Chile group (sold in March 2005), the Finsielgroup and Tim Hellas (sold in June 2005), Tim Perù (sold in August 2005), the Gruppo Buffetti (sold inJanuary 2006) and Digitel Venezuela (sold in May 2006);
– the balance sheet at December 31, 2006 includes the investments held in Solpart Participações andBrasil Telecom Participações following the decision to proceed with their sale;
– the balance sheet at December 31, 2005 includes the assets and liabilities of Digitel Venezuela andGruppo Buffetti.
NOTE 2—ACCOUNTING POLICIES
CONSOLIDATION
The consolidated financial statements include the financial statements of all subsidiaries from when control oversuch subsidiaries commences until the date that control ceases.
Control exists when the Group has the majority of voting rights or has the power, directly or indirectly, todetermine, also through contractual agreements, the financial and operating policies of an enterprise so as toobtain benefits from its activities.
F-14

Financial Statements Notes To Consolidated Financial Statements
In the preparation of the consolidated financial statements, assets, liabilities, revenues and expenses of theconsolidated companies are consolidated on a line-by-line basis and minority interests in the equity and in the netincome for the year are disclosed separately under appropriate captions, respectively, in the consolidated balancesheet and in the consolidated statement of income.
The carrying amount of the investment in each subsidiary is eliminated against the corresponding share of equityin each subsidiary, after adjustment, if any, to fair value at the acquisition date; any resulting difference is treatedas goodwill and recognized in intangible assets, as described below.
All intragroup balances and transactions, and any unrealized gains and losses arising from intragroup transactions,are eliminated on consolidation.
Assets and liabilities of foreign consolidated subsidiaries expressed in currencies other than euro are translatedusing the exchange rates in effect at the balance sheet date (the current method). Income and expenses aretranslated at the average exchange rate for the year. Translation differences resulting from the application of thismethod are classified as equity until the disposal of the investment. The average exchange rates for the year areused to translate the cash flows of foreign consolidated subsidiaries included in the consolidated statement ofcash flows.
For subsidiaries, associates and joint-ventures which adopt inflation accounting to eliminate distorting effects onthe result for the year, the statement of income has been translated at the year-end exchange rates, as requiredby IAS 29 (Financial reporting in hyperinflationary economies), instead of at the average rates for the year.
In the context of IFRS first-time adoption, the cumulative translation differences arising from the consolidation offoreign subsidiaries outside the eurozone was set at nil, as allowed by IFRS 1 (First-time adoption of InternationalFinancial Reporting Standards); therefore, only accumulated translation differences generated and recorded afterJanuary 1, 2004 are included in the determination of gains or losses arising from the disposal of such foreignsubsidiaries, if any.
Goodwill and fair value adjustments arising from the allocation of the purchase price of a foreign entity arerecorded in the relevant foreign currency and are translated using the year-end exchange rate.
If losses attributable to minority interests in a consolidated subsidiary exceed the minority interests in thesubsidiary’s equity, the excess, and any further losses attributable to the minority interests, are allocated againstthe equity interest attributable to the equity holders of the Parent except to the extent that the minority interestshave a binding obligation, and are able, to make an additional investment to cover the losses. If the subsidiarysubsequently reports profits, such profits are allocated to the interest attributable to the equity holders of theParent until the minority interests’ share of losses previously absorbed by the equity holders of the Parent hasbeen recovered.
Investments in associates and in joint-ventures are accounted for in the consolidated financial statements by theequity method, as provided, respectively, by IAS 28 (Investments in associates) and IAS 31 (Interests in jointventures). Associates are enterprises in which the Group holds at least 20% of the voting rights or exercises asignificant influence, but no control or joint control over the financial and operating policies.
The consolidated financial statements include the Group’s share in the earnings of associates and joint-venturesaccounted for by the equity method, from the date that significant influence commences until the date suchinfluence ceases. When the Group’s share of losses of an associate and joint-ventures, if any, exceeds the carryingamount of the investment on the Group’s balance sheet, the carrying amount of the investment is reduced to zeroand the share of further losses is not recognized except to the extent that the Group has an obligation to coversuch losses.
Unrealized gains and losses arising from transactions with associates or joint-ventures are eliminated to theextent of the Group’s interest in those entities.
F-15
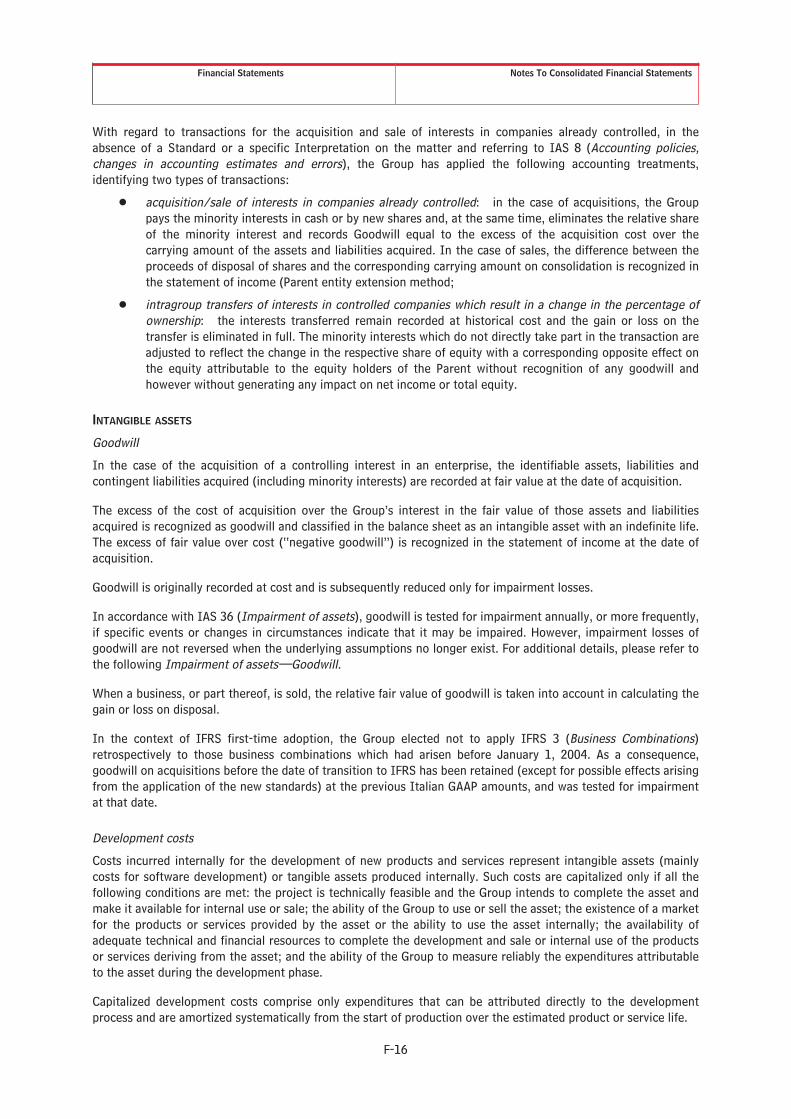
Financial Statements Notes To Consolidated Financial Statements
With regard to transactions for the acquisition and sale of interests in companies already controlled, in theabsence of a Standard or a specific Interpretation on the matter and referring to IAS 8 (Accounting policies,changes in accounting estimates and errors), the Group has applied the following accounting treatments,identifying two types of transactions:
Š acquisition/sale of interests in companies already controlled: in the case of acquisitions, the Grouppays the minority interests in cash or by new shares and, at the same time, eliminates the relative shareof the minority interest and records Goodwill equal to the excess of the acquisition cost over thecarrying amount of the assets and liabilities acquired. In the case of sales, the difference between theproceeds of disposal of shares and the corresponding carrying amount on consolidation is recognized inthe statement of income (Parent entity extension method;
Š intragroup transfers of interests in controlled companies which result in a change in the percentage ofownership: the interests transferred remain recorded at historical cost and the gain or loss on thetransfer is eliminated in full. The minority interests which do not directly take part in the transaction areadjusted to reflect the change in the respective share of equity with a corresponding opposite effect onthe equity attributable to the equity holders of the Parent without recognition of any goodwill andhowever without generating any impact on net income or total equity.
INTANGIBLE ASSETS
Goodwill
In the case of the acquisition of a controlling interest in an enterprise, the identifiable assets, liabilities andcontingent liabilities acquired (including minority interests) are recorded at fair value at the date of acquisition.
The excess of the cost of acquisition over the Group’s interest in the fair value of those assets and liabilitiesacquired is recognized as goodwill and classified in the balance sheet as an intangible asset with an indefinite life.The excess of fair value over cost (“negative goodwill”) is recognized in the statement of income at the date ofacquisition.
Goodwill is originally recorded at cost and is subsequently reduced only for impairment losses.
In accordance with IAS 36 (Impairment of assets), goodwill is tested for impairment annually, or more frequently,if specific events or changes in circumstances indicate that it may be impaired. However, impairment losses ofgoodwill are not reversed when the underlying assumptions no longer exist. For additional details, please refer tothe following Impairment of assets—Goodwill.
When a business, or part thereof, is sold, the relative fair value of goodwill is taken into account in calculating thegain or loss on disposal.
In the context of IFRS first-time adoption, the Group elected not to apply IFRS 3 (Business Combinations)retrospectively to those business combinations which had arisen before January 1, 2004. As a consequence,goodwill on acquisitions before the date of transition to IFRS has been retained (except for possible effects arisingfrom the application of the new standards) at the previous Italian GAAP amounts, and was tested for impairmentat that date.
Development costs
Costs incurred internally for the development of new products and services represent intangible assets (mainlycosts for software development) or tangible assets produced internally. Such costs are capitalized only if all thefollowing conditions are met: the project is technically feasible and the Group intends to complete the asset andmake it available for internal use or sale; the ability of the Group to use or sell the asset; the existence of a marketfor the products or services provided by the asset or the ability to use the asset internally; the availability ofadequate technical and financial resources to complete the development and sale or internal use of the productsor services deriving from the asset; and the ability of the Group to measure reliably the expenditures attributableto the asset during the development phase.
Capitalized development costs comprise only expenditures that can be attributed directly to the developmentprocess and are amortized systematically from the start of production over the estimated product or service life.
F-16

Financial Statements Notes To Consolidated Financial Statements
Other intangible assets with a finite life
Other purchased or internally-generated intangible assets are recognized as assets in accordance with IAS 38(Intangible assets), where it is probable that the use of the asset will generate future economic benefits andwhere the cost of the asset can be determined reliably.
Such assets are recorded at purchase or development cost, or, for those assets existing at the transition date toIFRS (January 1, 2004), at the deemed cost which for certain assets is the revalued cost, and amortized on astraight-line basis over their estimated useful lives. Intangible assets with finite useful lives are also tested forimpairment annually or more frequently, whenever there is an indication that the asset may be impaired.
Amortization is calculated on a straight-line basis over the estimated useful life of the assets. The amortizationrates are reviewed yearly and revised if the current estimated useful life is different from that estimatedpreviously. The effect of such changes is recognized in the statement of income prospectively.
TANGIBLE ASSETS—PROPERTY, PLANT AND EQUIPMENT OWNED
Property, plant and equipment owned is stated at acquisition or production cost or, for those assets existing atthe transition date to IFRS at January 1, 2004, at the deemed cost which for some assets is the revalued cost.Subsequent expenditures are capitalized only if they increase the future economic benefits embodied in therelated item of property, plant and equipment. All other expenditures (including interest expenses directlyattributable to the acquisition or construction of the asset) are expensed as incurred.
Cost also includes the expected costs of decommissioning the asset and restoring the site if a legal or constructiveobligation exists. The corresponding liability is recognized in the period in which the obligation arises in a balancesheet provision under the provisions for risks and charges. These capitalized costs are depreciated and charged tothe statement of income over the useful life of the related tangible assets.
Depreciation of property, plant and equipment owned is calculated on a straight-line basis over the estimateduseful life of the assets.
Land, including the land appurtenant to the buildings, is not depreciated.
These depreciation rates are reviewed yearly and revised if the current estimated useful live is different from thatestimated previously. The effect of such changes is recognized in the statement of income prospectively.
In 2006, a complete review of the useful lives of tangible assets was undertaken because of the following recentdevelopments:
Š integration of fixed and mobile telecommunications;
Š planning of a New Generation Network (NGN) to support the domestic broadband services market.
Such changes led to an extension of the relative useful lives for some assets (power supply and air-conditioningsystems and transmission installations).
As part of the review of the depreciation rates, technical evaluations of the tangible assets were made andaccount was taken of technological innovation, market evolution and market comparisons.
The revision of the depreciation rates led to a reduction in the depreciation charge for the year 2006 of€319 million and, assuming that other existing conditions remain the same, will lead to a reduction in thedepreciation charge of €193 million in 2007 and €159 million in 2008.
The minimum and maximum depreciation rates used in 2006, 2005 and 2004 are the following:
Depreciation rates
Civil and industrial buildings . . . . . . . . . . . . . . . . . . . . . . . . . . . . . . . . . . . . . . . . . . 3%-7%Plant and equipment . . . . . . . . . . . . . . . . . . . . . . . . . . . . . . . . . . . . . . . . . . . . . . . . . . 3%-33%Manufacturing and distribution equipment . . . . . . . . . . . . . . . . . . . . . . . . . . . . 15%-25%Ships . . . . . . . . . . . . . . . . . . . . . . . . . . . . . . . . . . . . . . . . . . . . . . . . . . . . . . . . . . . . . . . . . 9%Other . . . . . . . . . . . . . . . . . . . . . . . . . . . . . . . . . . . . . . . . . . . . . . . . . . . . . . . . . . . . . . . . . 11%-33%
F-17
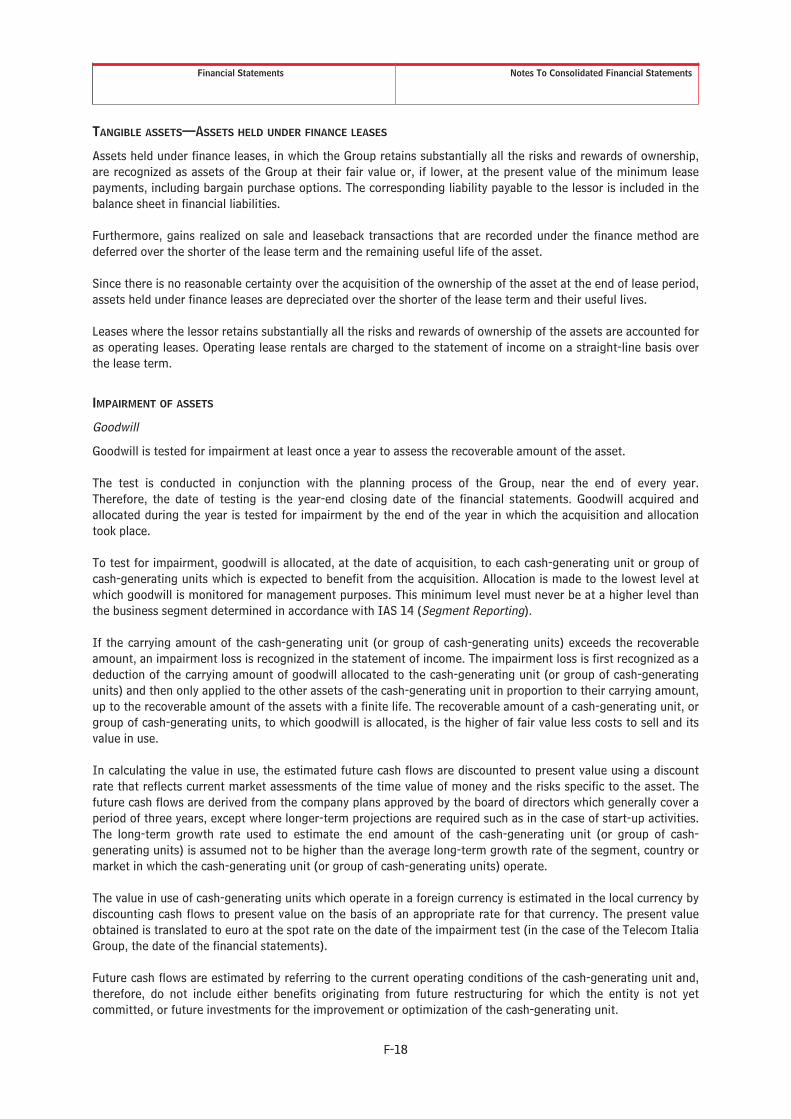
Financial Statements Notes To Consolidated Financial Statements
TANGIBLE ASSETS—ASSETS HELD UNDER FINANCE LEASES
Assets held under finance leases, in which the Group retains substantially all the risks and rewards of ownership,are recognized as assets of the Group at their fair value or, if lower, at the present value of the minimum leasepayments, including bargain purchase options. The corresponding liability payable to the lessor is included in thebalance sheet in financial liabilities.
Furthermore, gains realized on sale and leaseback transactions that are recorded under the finance method aredeferred over the shorter of the lease term and the remaining useful life of the asset.
Since there is no reasonable certainty over the acquisition of the ownership of the asset at the end of lease period,assets held under finance leases are depreciated over the shorter of the lease term and their useful lives.
Leases where the lessor retains substantially all the risks and rewards of ownership of the assets are accounted foras operating leases. Operating lease rentals are charged to the statement of income on a straight-line basis overthe lease term.
IMPAIRMENT OF ASSETS
Goodwill
Goodwill is tested for impairment at least once a year to assess the recoverable amount of the asset.
The test is conducted in conjunction with the planning process of the Group, near the end of every year.Therefore, the date of testing is the year-end closing date of the financial statements. Goodwill acquired andallocated during the year is tested for impairment by the end of the year in which the acquisition and allocationtook place.
To test for impairment, goodwill is allocated, at the date of acquisition, to each cash-generating unit or group ofcash-generating units which is expected to benefit from the acquisition. Allocation is made to the lowest level atwhich goodwill is monitored for management purposes. This minimum level must never be at a higher level thanthe business segment determined in accordance with IAS 14 (Segment Reporting).
If the carrying amount of the cash-generating unit (or group of cash-generating units) exceeds the recoverableamount, an impairment loss is recognized in the statement of income. The impairment loss is first recognized as adeduction of the carrying amount of goodwill allocated to the cash-generating unit (or group of cash-generatingunits) and then only applied to the other assets of the cash-generating unit in proportion to their carrying amount,up to the recoverable amount of the assets with a finite life. The recoverable amount of a cash-generating unit, orgroup of cash-generating units, to which goodwill is allocated, is the higher of fair value less costs to sell and itsvalue in use.
In calculating the value in use, the estimated future cash flows are discounted to present value using a discountrate that reflects current market assessments of the time value of money and the risks specific to the asset. Thefuture cash flows are derived from the company plans approved by the board of directors which generally cover aperiod of three years, except where longer-term projections are required such as in the case of start-up activities.The long-term growth rate used to estimate the end amount of the cash-generating unit (or group of cash-generating units) is assumed not to be higher than the average long-term growth rate of the segment, country ormarket in which the cash-generating unit (or group of cash-generating units) operate.
The value in use of cash-generating units which operate in a foreign currency is estimated in the local currency bydiscounting cash flows to present value on the basis of an appropriate rate for that currency. The present valueobtained is translated to euro at the spot rate on the date of the impairment test (in the case of the Telecom ItaliaGroup, the date of the financial statements).
Future cash flows are estimated by referring to the current operating conditions of the cash-generating unit and,therefore, do not include either benefits originating from future restructuring for which the entity is not yetcommitted, or future investments for the improvement or optimization of the cash-generating unit.
F-18

Financial Statements Notes To Consolidated Financial Statements
For the purpose of calculating impairment, the carrying amount of the cash-generating unit is established basedon the same criteria used to determine the recoverable amount of the cash-generating unit, excluding surplusassets (that is, financial assets, deferred tax assets and net assets held for sale) and includes the goodwillattributable to minority interests.
After conducting the goodwill impairment test for the cash-generating unit (or group of cash-generating units), asecond level of impairment testing is carried out which includes the corporate assets which do not generatepositive cash flows and which cannot be allocated by a reasonable and consistent criterion to the single units. Atthis second level, the total recoverable amount of all cash-generating units or groups of cash-generating units iscompared to the carrying amount of all cash-generating units (or groups of cash-generating units), including alsothe net assets of those cash-generating units to which no goodwill was allocated and the corporate assets.
When the conditions that gave rise to an impairment loss no longer exist, the original amount of goodwill is notreinstated, as set forth in IAS 36 (Impairment of assets).
Intangible and tangible assets with a finite life
During the year, the Group assesses whether there are any indications of impairment of tangible assets andintangible assets with a finite life. Both internal and external sources of information are used for this purpose.Internal sources include obsolescence or physical damage, and significant changes in the use of the asset and theeconomic performance of the asset compared to estimated performance. External sources include the marketvalue of the asset, changes in technology, markets or laws, increases in market interest rates and the cost ofcapital used to evaluate investments, and an excess of the carrying amount of the net assets of the Group overmarket capitalization.
If indicators of an impairment exist, the carrying amount of the assets is reduced to the recoverable amount. Therecoverable amount of an asset is the higher of fair value less costs to sell and its value in use. In calculating thevalue in use, the estimated future cash flows are discounted to present value using a discount rate that reflectscurrent market views of the time value of money and the risks specific to the asset. Where it is not possible toestimate the recoverable amount of an individual asset, the Group estimates the recoverable amount of the cash-generating unit to which the asset belongs.
An impairment losses are recognized in the statement of income.
When the conditions that gave rise to an impairment loss no longer exist, the carrying amount of the asset orcash-generating unit is increased to the revised estimate of its recoverable amount, up to the carrying amountthat would have been recorded had no impairment loss been recognized. The reversal of an impairment loss isrecognized as income in the statement of income.
FINANCIAL INSTRUMENTS
In the context of IFRS first-time adoption, the Group elected to adopt IAS 32 (Financial instruments: disclosureand presentation) and IAS 39 (Financial instruments: recognition and measurement) at January 1, 2004 instead ofapplying the standards from the year beginning January 1, 2005. Furthermore, as allowed by IFRS 1, thedesignation of financial instruments as a financial asset “at fair value through profit or loss” or “available for sale”or a financial liability valued at “fair value through profit or loss” has been carried out at January 1, 2004 insteadof at the date of initial recognition.
Investments in other companies
Investments in other companies (other than those in subsidiaries, associates and joint-ventures) are classifiedupon acquisition as available-for-sale financial assets in current or non-current assets or as “financial assets at fairvalue through profit or loss” in current assets.
Such investments are valued at fair value or at cost in the case of unlisted companies or investments whose fairvalue cannot be determined reliably, adjusted by any impairment losses, as required by IAS 39 (Financialinstruments: recognition and measurement). Changes in the value of investments classified as available-for-sale,
F-19

Financial Statements Notes To Consolidated Financial Statements
if valued at cost, are recognized directly in the statement of income; those valued at fair value are recognized in aspecific equity reserve until the financial asset is disposed of or impaired at which time the equity reserve isreversed to the statement of income. Changes in the value of investments classified as assets at fair value throughprofit or loss are recognized directly in the statement of income.
Securities other than investments
Securities other than investments classified as non-current assets are those held to maturity. The assets arerecorded on the trade date and, on initial recognition, are measured at acquisition cost (which generally coincideswith fair value), including transaction costs. Subsequently, they are measured at amortized cost.
The amortized cost is represented by the initial amount of the financial instrument net of repayments of principalalready received, adjusted (up or down) on the basis of the amortization (using the effective interest method) ofany differences between the initial amount and the amount at maturity, less any writedown for impairment oruncollectibility.
Securities other than investments classified as current assets are those that, by decision of the directors, areintended to be kept in the Group’s portfolio for a period of not more than 12 months, and are included in thefollowing categories:
Š held to maturity (originally more than 3 months but less than 12 months, or, with an original maturityof more than 12 months but the remaining maturity at the date of purchase is more than 3 months butless than 12 months) and measured at amortized cost;
Š held for trading and measured at fair value through profit or loss;
Š available-for-sale and measured at fair value with a contra-entry to an equity reserve.
When market prices are not available, the fair value of financial instruments is measured using appropriatevaluation techniques e.g. discounted cash flow based on market information available at the balance sheet date.
The increase/decrease in the value of securities other than investments classified as available-for-sale is directlyrecognized in a specific equity reserve (Reserve for fair value adjustments of available-for-sale financial assets)until the financial asset is disposed of or impaired; at that time, accumulated gains and losses are reversed to thestatement of income for the year.
Receivables and loans
Receivables and loans classified both as non-current and current assets are measured at amortized cost.
Receivables with maturities of over one year which bear no interest or an interest rate significantly lower thanmarket rates are discounted using market rates.
Cash and cash equivalents
Cash and cash equivalents are recorded, according to their nature, at nominal value or amortized cost.
Cash includes cash on hand and valuables.
Cash equivalents are short-term and highly liquid investments that are readily convertible to known amounts ofcash, are subject to an insignificant risk of changes in value, and whose original maturity or the remainingmaturity at the date of purchase does not exceed 3 months.
Impairment of financial assets
Assessments are made regularly as to whether there is any objective evidence that a financial asset or a group offinancial assets may be impaired. If any such evidence exists, an impairment loss is recognized in the statementof income for the year.
F-20

Financial Statements Notes To Consolidated Financial Statements
Financial liabilities
Financial liabilities include financial debt, including advances received on the assignment of accounts receivableand other financial liabilities such as derivatives and financial lease obligations.
Financial liabilities other than derivatives are initially recognized at fair value less transaction costs and aresubsequently measured at amortized cost. The amortized cost is represented by the initial amount of the financialinstrument net of repayments of principal already made, adjusted (up or down) on the basis of the amortization(using the effective interest method) of any differences between the initial amount and the amount at maturity.
Compound financial instruments represented by bonds convertible into shares of the issuer are recognized byseparating the debt and the call option: the debt is included in financial liabilities using the amortized cost methodwhile the call option amount, computed as the difference between the fair value of the debt and the nominalamount of the financial instrument, is classified in a specific equity reserve (Other equity instruments).
Compound financial instruments represented by bonds exchangeable with shares of entities other than the issuerare recognized by splitting the debt and the call option: the debt is included in financial liabilities using theamortized cost method while the call option amount is classified as a written option among the financial liabilitiesand measured at fair value. Changes in fair value are recognized in the statement of income at each reportingdate.
Financial liabilities hedged by derivative instruments designed to manage exposure to changes in fair value of theliabilities are measured at fair value in accordance with the hedge accounting principles of IAS 39. Gains andlosses arising from re-measurement at fair value, to the extent of the hedged component, are recognized in thestatement of income and are offset by the effective portion of the gain or loss arising from re-measurement at fairvalue of the hedging instrument.
Financial liabilities hedged by derivative instruments designed to manage exposure to variability in cash flows aremeasured at amortized cost in accordance with the hedge accounting principles of IAS 39.
Derivative financial instruments
Derivative financial instruments are used by the Telecom Italia Group to manage its exposure to exchange rateand interest rate risks and to diversify the parameters of debt so that costs and volatility can be reduced to withinprefixed operational limits.
In accordance with IAS 39, derivative financial instruments qualify for hedge accounting only when:
a) at the inception of the hedge there is formal designation and documentation of the hedgingrelationship;
b) the hedge is expected to be highly effective;
c) its effectiveness can be reliably measured;
d) it is highly effective throughout the financial reporting periods for which the hedge is designated.
All derivative financial instruments are measured at fair value in accordance with IAS 39.
When derivative financial instruments qualify for hedge accounting, the following accounting treatment applies:
Š Fair value hedge—Where a derivative financial instrument is designated as a hedge of the exposure tochanges in fair value of an asset or liability due to a particular risk, the gain or loss from re-measuringthe hedging instrument at fair value is recognized in the statement of income. The gain or loss on thehedged item attributable to the hedged risk adjusts the carrying amount of the hedged item and isrecognized in the statement of income.
Š Cash flow hedge—Where a derivative financial instrument is designated as a hedge of the exposure tovariability in cash flows of an asset or liability or a highly probable forecasted transaction, the effectiveportion of any gain or loss on the derivative financial instrument is recognized directly in a specificequity reserve (Reserve for fair value adjustments of hedge instruments). The cumulative gain or loss is
F-21

Financial Statements Notes To Consolidated Financial Statements
removed from equity and recognized in the statement of income at the same time as the hedgedtransaction affects the statement of income. The gain or loss associated with the ineffective portion of ahedge is recognized in the statement of income immediately. If the hedged transaction is no longerprobable, the cumulative unrealized gains or losses included in the equity reserve are immediatelyrecognized in the statement of income.
If hedge accounting is not appropriate, gains or losses arising from the measurement of the fair value ofderivative financial instruments are directly recognized in the statement of income.
SALES OF RECEIVABLES
During the first half of 2006, the Telecom Italia Group sold a significant part of its receivables through thesecuritization program which ended on July 25, 2006.
In December 2005, the securitization program was partly restructured by a “Master DPP Transfer Agreement” (orFramework Agreement for the sale of the Deferred Purchase Price (DPP)) signed between Telecom Italia S.p.A.and certain financial institutions under which the DPP on Telecom Italia S.p.A. receivables relating to invoicesissued between October 1, 2005 and May 31, 2006 were sold without recourse to such financial institutions.
Consequently, as a result of the sale of the DPP without recourse, the risks and rewards of ownership of suchreceivables were transferred in full to the financial institutions which, having taken over control of the SpecialPurpose Entity (SPE) according to the criteria established in SIC—12, consolidate TI Securitisation Vehicle S.r.l.(TISV).
Commencing June 2006, Telecom Italia put into place contracts for the sale of the similar receivables under thefactoring Law 52/91 on factoring. These sales are characterized by the transfer of all the risks and rewards ofownership of the receivables to third parties and thus meet IFRS requirements for derecognition. Specificservicing contracts, through which the buyer institutions conferred a mandate to Telecom Italia S.p.A. for thecollection and management of the receivables, leave the current Company/customer relationship unaffected.
Other receivables are sold by Telecom Italia under factoring agreements which, in the majority of cases, meetIFRS requirements for asset derecognition.
In some cases, however, certain receivables sold to factoring companies do not meet IFRS requirements forderecognition. These are sales of mainly receivables due from the tax authorities for income taxes, primarlycarried out in prior year. Such receivables were legally sold without recourse but Telecom Italia has provided afirst loss guarantee up to a limited amount or retained a continuing significant risk related to the connected cashflows. In these cases, since the risks were not substantially transferred to the third parties, the receivables soldremain in the financial statements and a corresponding financial liability is recorded for the same amount.
RECEIVABLES FOR CONSTRUCTION CONTRACTS
Construction contracts, regardless of the duration of the contracts, are recognized in accordance with the stage ofcompletion and classified as receivables in current assets. Losses on such contracts, if any, are recorded in full inthe statement of income when they become known.
INVENTORIES
Inventories of raw materials, purchased products, semifinished goods, work in progress and finished goods arevalued at the lower of cost or estimated realizable value, cost being determined on a weighted average cost (bysingle movement) basis. The valuation of inventories includes the direct costs of materials, labor and indirectproduction costs (variable and fixed). Provision is made for obsolete and slow-moving raw materials, finishedgoods, spare parts and other supplies based on their expected future use and estimated realizable value.
DISCONTINUED OPERATIONS/ASSETS HELD FOR SALE
Discontinued operations/assets held for sale include assets (or groups of assets to be disposed of) whose carryingamount will be recovered principally through a sale transaction rather than through continuing use. Discontinuedoperations/assets held for sale are measured at the lower of their carrying amount or fair value less costs to sell.
F-22

Financial Statements Notes To Consolidated Financial Statements
In accordance with IFRS, discontinued operations/assets held for sale are presented in the financial statementsas follows:
Š in two lines on the balance sheet: Discontinued operations/assets held for sale and Liabilities relating todiscontinued operations/assets held for sale;
Š in one line on the statement of income: Net income (loss) from discontinued operations/assets held forsale.
EMPLOYEE BENEFITS
Provision for employee severance indemnities
The Provision for employee severance indemnities, mandatory for Italian companies pursuant to art. 2120 of theItalian Civil Code, is considered a defined benefit plan under IFRS and is based, among other things, on theemployees’ years of service and the remuneration earned by the employee during the service period.
In accordance with IAS 19, the amount of provision to be recognized in the financial statements is determined byactuarial calculations using the Projected Unit Credit Method. As allowed by IFRS 1 and IAS 19, the Telecom ItaliaGroup has elected, in the context of IFRS first-time adoption and for subsequent years, to recognize all actuarialgains and losses in the statement of income as they arise.
The expenses relative to the increase in the present value of the severance indemnity obligation, as the time forpayment of the benefit comes closer, are included in Personnel costs in the statement of income.
Stock compensation plans
Stock option plans granted starting from January 1, 2005 are recognized in accordance with IFRS 2 (Share-basedPayment).
The Group elected to apply the exemptions provided by paragraph 25B of IFRS 1 and, therefore, did not applyIFRS 2 to stock option plans granted before November 7, 2002, where the terms and conditions of such plans hadnot changed.
For the valuation of stock option plans, the Telecom Italia Group uses the binomial “Cox-Ross-Rubenstein (CRR)”model. This model calculates the possible values which the underlying stock can assume over the life of theoption.
The companies of the Group provide additional benefits to certain managers and employees through stockcompensation plans (stock options). In accordance with IFRS 2 (Share-based Payment), employee stock optionsare measured at fair value at the grant date using models that take account of circumstances applicable at thegrant date (option exercise price, vesting period, current price of the underlying shares, expected share pricevolatility, expected dividends and interest rate for a risk-free investment over the option term).
If the right vests after a certain period of time and/or upon attainment of certain performance conditions (vestingperiod), the total stock option amount must be apportioned prorata over the vesting period and recorded in equityunder “Other equity instruments”, with a contra-entry recorded in the statement of income in “Personnel costs”(given that this is non-monetary consideration intended to enhance employee loyalty and provide an incentive toimprove business performance).
At the end of each year, the previously determined fair value of each option is not restated or updated, butmaintained in equity. However, at that date, the Group reviews the estimated number of options that will vestuntil expiry based on the number of employees who will have exercise rights. The change in estimate must bededucted from or added to “Other equity instruments” with a contra-entry recorded in the statement of income in“Personnel costs”.
When the option expires, the amount reflected in “Other equity instruments” is reclassified as follows: the portionrelating to exercised options is reclassified to “Reserve for additional paid-in capital” and the portion relating tonon-exercised options is reclassified under “Retained earnings (accumulated losses), including net income (loss)for the year”.
F-23
Financial Statements Notes To Consolidated Financial Statements
PROVISIONS FOR RISKS AND CHARGES
The Group records provisions for risks and charges when it has a present obligation, legal or constructive, to athird party, as a result of a past event, when it is probable that an outflow of Group resources will be required tosatisfy the obligation and when a reliable estimate of the amount of the obligation can be made.
Changes in estimates are reflected in the statement of income in the year in which the changes occur.
TREASURY SHARES
Treasury shares are recognized as a deduction from equity. In particular, the nominal amount of treasury shares isreported as a deduction from the share capital issued while the excess portion of cost at acquisition over thenominal amount is presented as a reduction of “Other reserves”.
FOREIGN CURRENCY TRANSACTIONS
Transactions in foreign currencies are recorded at the foreign exchange rate prevailing at the date of thetransaction. Monetary assets and liabilities denominated in foreign currencies are translated at the foreignexchange rate prevailing at the balance sheet date. Exchange differences arising from the settlement of monetaryitems or from their conversion at rates different from those at which they were initially recorded during the yearor in previous financial statements, are recognized in the statement of income.
REVENUE RECOGNITION
Revenues are recognized to the extent that it is probable that the economic benefits will flow to the Group and therevenues can be reliably measured. Revenues are stated net of discounts, allowances, and returns. Trafficrevenues from interconnection and roaming are reported gross of the amounts due to other TLC operators.
Revenues from services rendered are recognized in the statement of income according to the prorata performanceof the transaction and only when the outcome of the service rendered can be estimated reliably. Revenues fromthe activation of telephone services (and related costs) are deferred over the expected duration of the relationshipwith the customer (mainly 8 years for retail customers and 3 years for wholesale customers).
Revenues from prepaid traffic are recorded on the basis of the minutes used at the contract price per minute.Deferred income for unused minutes is recorded in “Trade and miscellaneous payables and other currentliabilities”. When customers recharge their prepaid cards they pay a fixed amount as Recharging income. Therevenues from Recharging income and the relative costs (amounts paid to resellers, banks and other parties), withthe latter not exceeding the Recharging income, are deferred over the period between two subsequent recharges(about one month).
The Group capitalizes, as intangible assets, directly attributable subscriber acquisition costs (represented bycommissions for the sales network and subsidies for the purchase of handsets) when the following conditions aremet:
Š the costs can be clearly identified;
Š there is a contract binding the customer for a specific period of time;
Š it is probable that the amount of the costs will be recovered through the sales generated by the servicecontract, or, where the customer withdraws from the contract in advance, through the collection of thepenalty.
Capitalized costs are amortized over the period of underlying contract.
In all other cases, subscriber acquisition costs are expensed when incurred.
Revenues from construction contracts are recognized based on the percentage of completion method.
ADVERTISING EXPENSES
Advertising expenses are charged to the statement of income as incurred.
RESEARCH COSTS
Research costs are charged directly to the statement of income in the year in which they are incurred.
F-24

Financial Statements Notes To Consolidated Financial Statements
TAXES
Income taxes include all taxes calculated on the basis of the taxable income of the companies of the Group,including relative incidental expenses of a non-financial nature (e.g. penalties). The relative interest expenses arerecognized in “Financial expenses”.
Income taxes are recognized in the statement of income except to the extent that they relate to items directlycharged or credited to equity, in which case the related income tax effect is recognized in equity. Accruals forincome taxes that could arise on the remittance of a subsidiary’s retained earnings are only made where there isthe actual intention to remit such earnings. Other taxes, other than income taxes, are included in either operatingexpenses or financial expenses, depending on the case.
Deferred tax assets/liabilities are provided using the “Balance sheet liability method”. They are calculated on alltemporary differences that arise between the tax base of an asset or liability and the carrying amounts in theconsolidated financial statements except for non tax-deductible goodwill and for those differences related toinvestments in subsidiaries which will not reverse in the foreseeable future. Deferred tax assets relating to unusedtax loss carryforwards and tax credits are recognized to the extent that it is probable that future profits will beavailable against which they can be utilized. Current and deferred tax assets and liabilities are offset when theincome taxes are levied by the same tax authority and where there is a legally enforceable right of offset. Deferredtax assets and liabilities are determined based on enacted tax rates in the respective jurisdictions in which theGroup operates that are expected to apply to taxable income in the years in which those temporary differencesare expected to be recovered or settled.
DIVIDENDS
Dividends received from companies other than subsidiaries, associates and joint-ventures are recognized in thestatement of income in the period in which they become receivable following the resolution by the shareholders’meeting for the distribution of dividends of the investee companies.
Dividends payable to third parties are reported as a change in equity in the year in which they are approved by theshareholders’ meeting.
EARNINGS PER SHARE
Basic earnings per ordinary share is calculated by dividing the Group’s net income attributable to Ordinary Sharesby the weighted average number of Ordinary Shares outstanding during the year, excluding treasury shares.Similarly, basic earnings per savings share is calculated by dividing the Group’s net income attributable to savingsshares by the weighted average number of savings shares outstanding during the year. For diluted earnings perordinary share, the weighted average number of shares outstanding is adjusted by all dilutive potential sharesfrom the conversion of bonds and the exercise of warrants. The Group net income is also adjusted to reflect theimpact of these transactions net of the related tax effects.
USE OF ESTIMATES AND JUDGMENTS
The preparation of consolidated financial statements and related disclosures that conform to IFRS requiresmanagement to make estimates and assumptions that affect the reported amounts of assets and liabilities anddisclosure of contingent assets and liabilities at the date of the financial statements. Actual results could differfrom those estimates. Estimates and judgments are used to arrive at the recoverable amount of non-currentassets (including goodwill), revenues, bad debt accruals, obsolete and slow-moving inventories, depreciation andamortization, employee benefits, taxes, restructuring provisions and other accruals and provisions. Estimates andassumptions are reviewed periodically and the effects of any changes are reflected immediately in the statementof income.
In the absence of a Standard or an Interpretation that specifically applies to a transaction, management uses itsjudgment as to which accounting methods to adopt to disclose relevant and reliable information so that thefinancial statements:
– represent faithfully the financial position, the result of operations and cash flows of the Group;
– reflect the economic substance of transactions;
F-25
Financial Statements Notes To Consolidated Financial Statements
– are neutral;
– are prudent;
– are complete in all material respects.
NEW STANDARDS AND INTERPRETATIONS ENDORSED BY THE EUROPEAN UNION EFFECTIVE BEGINNING ON JANUARY 1,2006
Amendments to IAS 19—Employee benefits
Such amendments, endorsed by the European Union in November 2005 (Regulation EC 1910-2005), provide,among other things, the option of recognizing actuarial gains and losses in full in the period in which they occur,not in the statement of income but directly in a specific reserve in equity.
The Telecom Italia Group did not elect this option and recognizes all actuarial gains and losses immediately in thestatement of income in the year in which they occur.
IFRIC 4—Determining whether an arrangement contains a lease
Such Interpretation, endorsed by the European Union in November 2005 (Regulation EC 1910-2005), states that ifan arrangement does not have the legal form of a lease but contains a lease, such lease should be classified as afinance or operating lease in accordance with IAS 17 (Leasing).
The application of this Interpretation did not have any effect on the consolidated financial statements atDecember 31, 2006.
Amendments to IAS 39—Application of the fair value option
Such amendments, endorsed by the European Union in November 2005 (Regulation EC 1864-2005), restrict theuse of the “fair value option” to designate every financial asset or liability as measured at fair value through profitor loss. Such change in the Standard restricts the use of this option to those financial instruments which meet thefollowing conditions:
Š the designation according to the fair value option significantly eliminates or reduces an accountingmismatch;
Š a group of financial assets, financial liabilities or both are managed, and their performance is valued, ona fair value basis in accordance with a documented risk or investment management strategy;
Š an instrument contains an implicit derivative which meets specific conditions.
The Group elected to use the fair value option only for assets and liabilities which are effectively held for tradingstarting from January 1, 2006. The adoption of these amendments had no effect on the consolidated financialstatements at December 31, 2006.
Amendments to IAS 39—Cash flow hedge accounting of forecast intragroup transactions
Such amendment, endorsed by the European Union in December 2005 (Regulation EC 2106-2005), allows aplanned highly probable intragroup forecast transaction expressed in foreign currency to be designated as ahedged item in a cash flow hedge in consolidated financial statements, provided that the transaction isdenominated in a currency other than the functional currency of the entity entering into that transaction and theforeign currency risk will affect the consolidated statement of income.
This amendment did not have any impact on the consolidated financial statements at December 31, 2006.
Amendments to IAS 39 and IFRS 4—Financial guarantee contracts
Such amendments, endorsed by the European Union in January 2006 (Regulation EC 108-2006), extend the scopeof IAS 39 to include the recognition of financial guarantee contracts by the issuer (guarantor). However, if anissuer has previously stated explicitly that such contracts are considered as insurance contracts and hasaccounted for them as such, it may elect to apply either IAS 39 or IFRS 4 to such financial guarantee contracts.
F-26
Financial Statements Notes To Consolidated Financial Statements
The Telecom Italia Group has elected to measure the guarantees in accordance with IAS 39 and consequently theintroduction of this amendment did not produce an impact on the consolidated financial statements atDecember 31, 2006.
IFRIC 6—Liabilities arising from participating in a specific market—Waste electrical and electronical equipment
Such Interpretation, endorsed by the European Union in January 2006 (Regulation EC 108–2006), was publishedafter the adoption of the European Union Directive on Waste Electrical and Electronic Equipment (WE&EE) whichrequires member states to implement a regulated system for the collection, treatment, recovery and ecologicallycorrect decommissioning of the waste of electrical and electronic equipment. This Interpretation providesguidelines on the recognition of liabilities for such waste management in the financial statements of producers ofelectrical equipment based on the sales of such equipment to private households before August 13, 2005(so-called historical waste). IFRIC 6 has clarified that what triggers the recognition of an accrual for themanagement costs of such waste, in accordance with IAS 37 (Provisions, contingent liabilities and contingentassets), is participation in the market during the measurement period. Consequently, since the obligation arisesonly on condition that a share of the market exists during the measurement period, the time frame for recognitioncan be independent of the specific period in which the activities for the management of the waste wereundertaken and the relative costs were incurred.
The Italian government has not as yet enacted the necessary decrees for implementation: therefore, in theabsence of a reference framework, the Group is not currently able to evaluate the impact, if any, of the applicationof this Interpretation on the financial statements.
NEW STANDARDS AND INTERPRETATIONS ENDORSED BY THE EUROPEAN UNION BUT NOT YET EFFECTIVE
As required by IAS 8 (Accounting policies, changes in accounting estimates and errors) the IFRS in effect fromJanuary 1, 2007 or subsequently are indicated below and briefly illustrated.
IFRS 7—Financial instruments: disclosures
This Standard, endorsed by the European Union in January 2006 (Regulation EC 108-2006), completely replacesIAS 30 (Disclosures in financial statements of banks and other financial institutions) and includes the section onDisclosures contained in IAS 32 (Financial instruments: presentation and disclosures) with amendments andrevisions; consequently, the title of IAS 32 is changed to “Financial instruments: presentation”.
IFRS 7 is effective starting on January 1, 2007.
Amendments to IAS 1—Presentation of Financial Statements—Capital Disclosures
Such amendments, endorsed by the European Union in January 2006 (Regulation EC 108-2006), provide that anentity must present disclosures which allow the users of its financial statements to assess its objectives, itspolicies and its processes for managing capital.
These amendments are effective starting on January 1, 2007.
IFRIC 8—Scope of IFRS 2
On September 8, 2006, the European Commission endorsed Interpretation IFRIC 8 (Scope of IFRS 2) withRegulation EC 1329-2006.
IFRIC 8 clarifies that IFRS 2 (Share-based Payment) applies to contracts where an entity makes share-basedpayments also for services for apparently nil or inadequate consideration.
IFRIC 8 specifically explains that if the identifiable consideration given appears to be less than the fair value ofthe equity instruments granted (or liability incurred), this situation typically indicates that other consideration hasbeen or will be received.
This Interpretation is effective starting on January 1, 2007.
F-27

Financial Statements Notes To Consolidated Financial Statements
It is not believed that this Interpretation will have any relevant impact on the consolidated financial statements ofthe Group.
IFRIC 9—Reassessment of embedded derivatives
On September 8, 2006, the European Commission endorsed Interpretation IFRIC 9 (Reassessment of embeddedderivatives) with Regulation EC 1329-2006.
This Interpretation concludes that an entity must assess whether an embedded derivative is required to beseparated from the host contract and accounted for as a derivative when the entity first becomes a party to thecontract. Subsequent reassessment is prohibited unless there is a change in the terms of the contract thatsignificantly modifies the cash flows that otherwise would be required under the contract, in which casereassessment on the separation of the embedded derivative is required.
This Interpretation is effective starting on January 1, 2007.
It is not believed that this Interpretation will have any relevant impact on the consolidated financial statements ofthe Group.
NOTE 3—BUSINESS COMBINATIONS, ACQUISITIONS OF MINORITY INTERESTS AND TRANSACTIONSBETWEEN COMPANIES UNDER COMMON CONTROL
BUSINESS COMBINATIONS
YEAR 2006
In 2006, there were no transactions involving business combinations as defined in IFRS 3.
YEAR 2005
Acquisition of Liberty Surf Group S.A.
In 2005, the entire investment in the capital of the company Liberty Surf Group S.A. was purchased from Tiscalifor a total cost of €268 million (inclusive of €6 million for incidental charges).
The difference of €257 million between the price paid (€268 million) and the net assets acquired (€11 million),less pre-existing goodwill (€34 million), was allocated as follows:
€ 249 million to Goodwill€ 13 million to Intangible assets with a finite life—Customer List€ -5 million to Deferred tax liabilities
€257 million
The value of the Customer List has been determined on the basis of the Subscriber Acquisition Costs (SAC) for thecustomers acquired. The replacement cost method was elected in lieu of the income method owing to the factthat Tiscali’s customer wholesale business showed a loss at the date of purchase.
The goodwill arising on acquisition (€249 million) was tested for impairment at the date of purchase. The value inuse of the company acquired served as the basis of reference and consideration was also given to the synergiesexpected from the merger with Telecom Italia France. There was no indication of impairment.
F-28
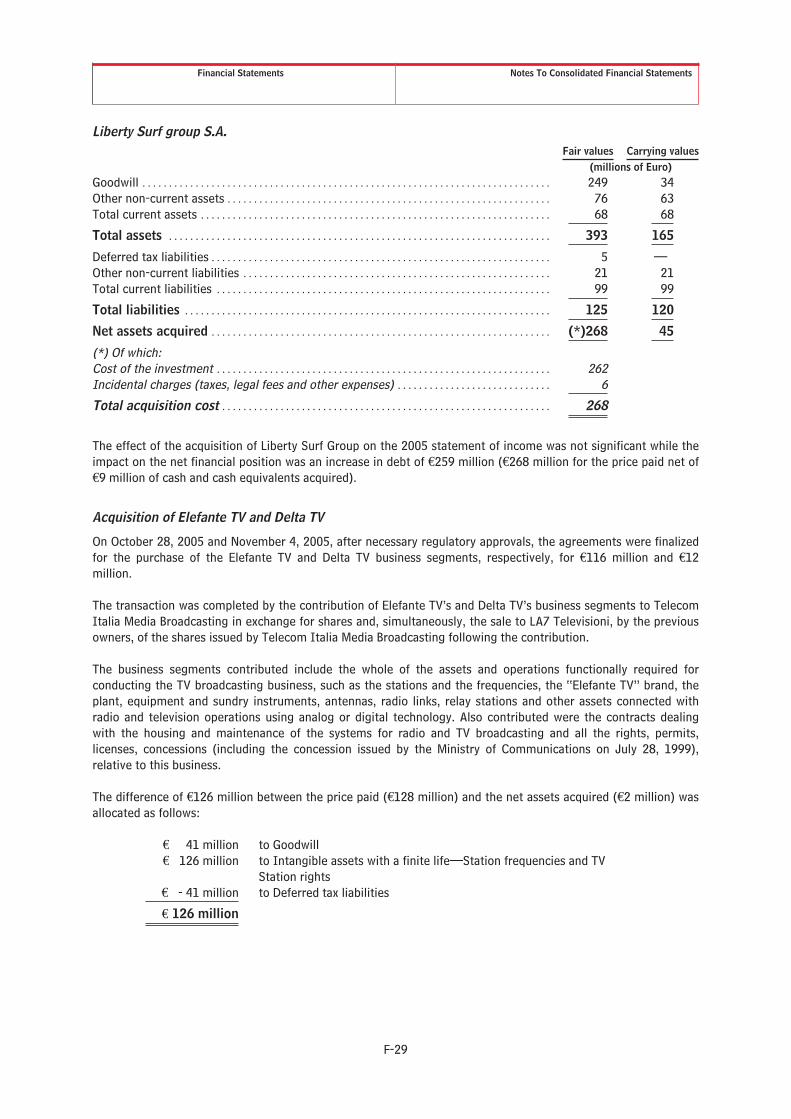
Financial Statements Notes To Consolidated Financial Statements
Liberty Surf group S.A.Fair values Carrying values
(millions of Euro)Goodwill . . . . . . . . . . . . . . . . . . . . . . . . . . . . . . . . . . . . . . . . . . . . . . . . . . . . . . . . . . . . . . . . . . . . . . . . . . . . . 249 34Other non-current assets . . . . . . . . . . . . . . . . . . . . . . . . . . . . . . . . . . . . . . . . . . . . . . . . . . . . . . . . . . . . . 76 63Total current assets . . . . . . . . . . . . . . . . . . . . . . . . . . . . . . . . . . . . . . . . . . . . . . . . . . . . . . . . . . . . . . . . . . 68 68
Total assets . . . . . . . . . . . . . . . . . . . . . . . . . . . . . . . . . . . . . . . . . . . . . . . . . . . . . . . . . . . . . . . . . . . . . . . . 393 165
Deferred tax liabilities . . . . . . . . . . . . . . . . . . . . . . . . . . . . . . . . . . . . . . . . . . . . . . . . . . . . . . . . . . . . . . . . 5 —Other non-current liabilities . . . . . . . . . . . . . . . . . . . . . . . . . . . . . . . . . . . . . . . . . . . . . . . . . . . . . . . . . . 21 21Total current liabilities . . . . . . . . . . . . . . . . . . . . . . . . . . . . . . . . . . . . . . . . . . . . . . . . . . . . . . . . . . . . . . . 99 99
Total liabilities . . . . . . . . . . . . . . . . . . . . . . . . . . . . . . . . . . . . . . . . . . . . . . . . . . . . . . . . . . . . . . . . . . . . . 125 120
Net assets acquired . . . . . . . . . . . . . . . . . . . . . . . . . . . . . . . . . . . . . . . . . . . . . . . . . . . . . . . . . . . . . . . . (*)268 45
(*) Of which:Cost of the investment . . . . . . . . . . . . . . . . . . . . . . . . . . . . . . . . . . . . . . . . . . . . . . . . . . . . . . . . . . . . . . . 262Incidental charges (taxes, legal fees and other expenses) . . . . . . . . . . . . . . . . . . . . . . . . . . . . . 6
Total acquisition cost . . . . . . . . . . . . . . . . . . . . . . . . . . . . . . . . . . . . . . . . . . . . . . . . . . . . . . . . . . . . . . 268
The effect of the acquisition of Liberty Surf Group on the 2005 statement of income was not significant while theimpact on the net financial position was an increase in debt of €259 million (€268 million for the price paid net of€9 million of cash and cash equivalents acquired).
Acquisition of Elefante TV and Delta TV
On October 28, 2005 and November 4, 2005, after necessary regulatory approvals, the agreements were finalizedfor the purchase of the Elefante TV and Delta TV business segments, respectively, for €116 million and €12million.
The transaction was completed by the contribution of Elefante TV’s and Delta TV’s business segments to TelecomItalia Media Broadcasting in exchange for shares and, simultaneously, the sale to LA7 Televisioni, by the previousowners, of the shares issued by Telecom Italia Media Broadcasting following the contribution.
The business segments contributed include the whole of the assets and operations functionally required forconducting the TV broadcasting business, such as the stations and the frequencies, the “Elefante TV” brand, theplant, equipment and sundry instruments, antennas, radio links, relay stations and other assets connected withradio and television operations using analog or digital technology. Also contributed were the contracts dealingwith the housing and maintenance of the systems for radio and TV broadcasting and all the rights, permits,licenses, concessions (including the concession issued by the Ministry of Communications on July 28, 1999),relative to this business.
The difference of €126 million between the price paid (€128 million) and the net assets acquired (€2 million) wasallocated as follows:
€ 41 million to Goodwill€ 126 million to Intangible assets with a finite life—Station frequencies and TV
Station rights€ - 41 million to Deferred tax liabilities
€ 126 million
F-29
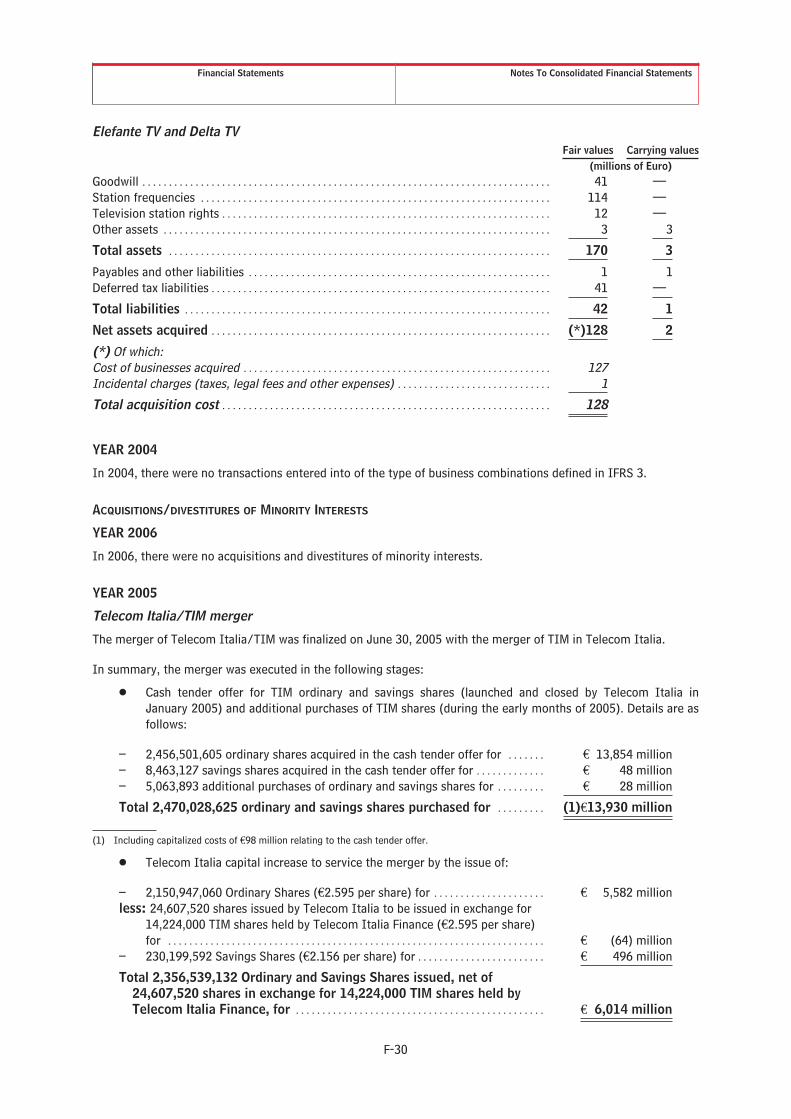
Financial Statements Notes To Consolidated Financial Statements
Elefante TV and Delta TVFair values Carrying values
(millions of Euro)Goodwill . . . . . . . . . . . . . . . . . . . . . . . . . . . . . . . . . . . . . . . . . . . . . . . . . . . . . . . . . . . . . . . . . . . . . . . . . . . . . 41 —Station frequencies . . . . . . . . . . . . . . . . . . . . . . . . . . . . . . . . . . . . . . . . . . . . . . . . . . . . . . . . . . . . . . . . . . 114 —Television station rights . . . . . . . . . . . . . . . . . . . . . . . . . . . . . . . . . . . . . . . . . . . . . . . . . . . . . . . . . . . . . . 12 —Other assets . . . . . . . . . . . . . . . . . . . . . . . . . . . . . . . . . . . . . . . . . . . . . . . . . . . . . . . . . . . . . . . . . . . . . . . . . 3 3
Total assets . . . . . . . . . . . . . . . . . . . . . . . . . . . . . . . . . . . . . . . . . . . . . . . . . . . . . . . . . . . . . . . . . . . . . . . . 170 3
Payables and other liabilities . . . . . . . . . . . . . . . . . . . . . . . . . . . . . . . . . . . . . . . . . . . . . . . . . . . . . . . . . 1 1Deferred tax liabilities . . . . . . . . . . . . . . . . . . . . . . . . . . . . . . . . . . . . . . . . . . . . . . . . . . . . . . . . . . . . . . . . 41 —
Total liabilities . . . . . . . . . . . . . . . . . . . . . . . . . . . . . . . . . . . . . . . . . . . . . . . . . . . . . . . . . . . . . . . . . . . . . 42 1
Net assets acquired . . . . . . . . . . . . . . . . . . . . . . . . . . . . . . . . . . . . . . . . . . . . . . . . . . . . . . . . . . . . . . . . (*)128 2
(*) Of which:Cost of businesses acquired . . . . . . . . . . . . . . . . . . . . . . . . . . . . . . . . . . . . . . . . . . . . . . . . . . . . . . . . . . 127Incidental charges (taxes, legal fees and other expenses) . . . . . . . . . . . . . . . . . . . . . . . . . . . . . 1
Total acquisition cost . . . . . . . . . . . . . . . . . . . . . . . . . . . . . . . . . . . . . . . . . . . . . . . . . . . . . . . . . . . . . . 128
YEAR 2004
In 2004, there were no transactions entered into of the type of business combinations defined in IFRS 3.
ACQUISITIONS/DIVESTITURES OF MINORITY INTERESTS
YEAR 2006
In 2006, there were no acquisitions and divestitures of minority interests.
YEAR 2005
Telecom Italia/TIM merger
The merger of Telecom Italia/TIM was finalized on June 30, 2005 with the merger of TIM in Telecom Italia.
In summary, the merger was executed in the following stages:
Š Cash tender offer for TIM ordinary and savings shares (launched and closed by Telecom Italia inJanuary 2005) and additional purchases of TIM shares (during the early months of 2005). Details are asfollows:
– 2,456,501,605 ordinary shares acquired in the cash tender offer for . . . . . . . € 13,854 million– 8,463,127 savings shares acquired in the cash tender offer for . . . . . . . . . . . . . € 48 million– 5,063,893 additional purchases of ordinary and savings shares for . . . . . . . . . € 28 million
Total 2,470,028,625 ordinary and savings shares purchased for . . . . . . . . . (1)€13,930 million
(1) Including capitalized costs of €98 million relating to the cash tender offer.
Š Telecom Italia capital increase to service the merger by the issue of:
– 2,150,947,060 Ordinary Shares (€2.595 per share) for . . . . . . . . . . . . . . . . . . . . . € 5,582 millionless: 24,607,520 shares issued by Telecom Italia to be issued in exchange for
14,224,000 TIM shares held by Telecom Italia Finance (€2.595 per share)for . . . . . . . . . . . . . . . . . . . . . . . . . . . . . . . . . . . . . . . . . . . . . . . . . . . . . . . . . . . . . . . . . . . . . . . € (64) million
– 230,199,592 Savings Shares (€2.156 per share) for . . . . . . . . . . . . . . . . . . . . . . . . € 496 million
Total 2,356,539,132 Ordinary and Savings Shares issued, net of24,607,520 shares in exchange for 14,224,000 TIM shares held byTelecom Italia Finance, for . . . . . . . . . . . . . . . . . . . . . . . . . . . . . . . . . . . . . . . . . . . . . . . € 6,014 million
F-30

Financial Statements Notes To Consolidated Financial Statements
The part of the merger for the percentage of ownership held previous to the cash tender offer was accounted forat the carrying amount in the financial statements at December 31, 2005 since the merged company was alreadycontrolled by the merging company and thus the conditions for the application of IFRS 3 (Business combinations)did not exist.
The acquisition of the remaining TIM shares through the cash tender offer and additional share purchases on themarket, and the subsequent merger, were treated as a purchase of minority interests, which is not dealt witheither by IFRS 3 or any other IFRS.
This transaction was accounted for in the consolidated financial statements at December 31, 2005 at fair value byapplying the parent-entity extension method. This method resulted in the recognition of goodwill (differencebetween the fair value of the shares purchased and the newly issued shares and the share of the carrying value ofTIM’s net assets acquired) of €16,654 million, of which €11,804 million came from the cash tender offer andadditional share purchases and €4,850 million from the exchange of TIM shares. The Telecom Italia shares issuedto service the exchange were valued at the market price at June 30, 2005 (€2.595 for each ordinary share and€2.156 for each savings share).
Reorganization of the Brazilian mobile telephone companies
On May 30, 2005, the special shareholders’ meetings of the three interested companies unanimously approved theacquisition of the shares of the minority shareholders of Tim Sul S.A. and Tim Nordeste Telecomunicações S.A.through a share capital increase effected by Tim Participações S.A.. The exchange ratios were determined on thebasis of economic and equity valuations performed by Banco ABN-AMRO Real S.A.. Tim Participações effected ashare capital increase on behalf of the shareholders of the two subsidiaries by issuing ordinary and preferredshares. On the same date, Tim Sul S.A. and Tim Nordeste Telecomunicações S.A. were delisted from the Brazilianstock exchange and Tim Participações then cancelled the shares purchased from the shareholders which exercisedthe right of withdrawal. The two companies, although maintaining separate legal and administrative status, arenow wholly-owned subsidiaries of Tim Participações.
The effect on Goodwill was as follows:
Š an increase of €62 million for the purchase of the shares of the minority shareholders of Tim Sul S.A.and Tim Nordeste Telecomunicações S.A. through the capital increase set aside for them and effectedby the parent Tim Participações S.A. (€57 million) and for the purchase of Tim Participações S.A.ordinary shares on the market by the parent Tim Brasil Serviçõs e Participações S.A. (€5 million);
Š a decrease of €25 million for the derecognition of goodwill as a result of the dilution of the investmentin Tim Participações S.A. following the capital increase set aside for the minority shareholders.
The goodwill of €57 million for the purchase of the shares of the minority shareholders of Tim Sul S.A. and TimNordeste Telecomunicações S.A was calculated as the difference between the market value of ordinary andpreferred shares, at the transaction date, issued by Tim Participações S.A. to the minority shareholders of Tim SulS.A. and Tim Nordeste Telecomunicações S.A. (€204 million), and equity attributable to minority interests of TimSul S.A. and Tim Nordeste Telecomunicações S.A. at the time of the transaction and covered by the acquisition(€147 million).
The transaction had a negative effect of €14 million on the equity attributable to equity holders of the Parent anda positive effect of €40 million on the equity attributable to minority interests.
YEAR 2004
Acquisition of a 40% stake in Finanziaria Web
At the end of June 2004, an agreement was reached to settle the dispute concerning the framework agreementsigned on September 20, 2000 between Seat Pagine Gialle S.p.A. (now Telecom Italia Media) and its subsidiaries,and the companies in the De Agostini group.
Based on the agreement, De Agostini Invest transferred the entire investment held in Finanziaria Web to TelecomItalia Media (which already had control of the company with a 60% holding) for cash consideration of €287million, in lieu of the originally agreed price of €700 million.
F-31

Financial Statements Notes To Consolidated Financial Statements
In addition to this amount, €38 million was paid to reimburse De Agostini Invest for the amounts paid to coverlosses and recapitalize Finanziaria Web since July 2001.
The effect on the statement of income of the Telecom Italia Group was an impairment loss of €116 million net oftaxes.
Finanziaria Web was merged with and into Telecom Italia as of December 31, 2005.
Acquisition of Digitel Venezuela shares
With regard to the numerous disputes pending between Tim International and the other shareholders in DigitelVenezuela, related to the coverage of the losses incurred in 2002, a settlement agreement was reached in April2004 wherein Tim International agreed to purchase all the other shareholders stakes (corresponding to 32.88% ofDigitel Venezuela’s share capital).
According to the agreement, executed on July 1, 2004, Tim International purchased 1,480,562 shares held by theminority shareholders of the Venezuelan company for U.S.$109.6 million. The closing took place after verificationof the contractual conditions put into place to protect Tim International and Digitel Venezuela.
As a result, since July 1, 2004, Tim International held 100% of the shares of the Venezuelan mobile operator.
In May 2006 the entire investment in Digitel Venezuela was disposed of.
TRANSACTIONS BETWEEN COMPANIES UNDER COMMON CONTROL
YEAR 2006
Reorganization of the Brazilian mobile telephone companies
In June 2006, the Tim Brasil group concluded the reorganization of its corporate structure, after which, Tim BrasilServiçõs e Participações S.A., which previously held a 100% stake in Tim Celular S.A. and a 19.88% economicinterest in Tim Participações S.A., now has a 69.66% economic interest in the new Tim Participações S.A.
The reorganization took place in the following stages:
Š in March 2006:
Š Tim Celular S.A. merged the wholly-owned subsidiaries Blah!—Sociedade Anonima de Servicos eComercio and CRC—Centro de Relacionamento com Clientes;
Š Tim Brasil Serviços e Participações S.A. conferred the Tim Celular S.A. shares to Tim ParticipaçõesS.A. in exchange for a reserved capital increase, raising its controlling stake in Tim ParticipaçõesS.A. from 50.33% to 81.19%. The transaction was recorded at book value since it was carried outwithin the same group and gave rise to a reduction in the equity attributable to equity holders ofthe parent of €59 million with an increase of the same amount in the equity attributable tominority interests;
Š in June 2006, Tim Sul S.A. was merged in Tim Celular S.A and Tim Nordeste Telecomunicações S.A. wasmerged in Maxitel S.A., which changed its name to Tim Nordeste S.A.
YEAR 2005
Acquisition of Virgilio and Tin.it by Telecom Italia S.p.A.
As part of the process to reorganize the Telecom Italia Group’s Internet operations, the following transactionswere finalized on the basis of the contractual agreements signed with Telecom Italia Media in 2005:
Š on May 30, 2005, Telecom Italia purchased, from Telecom Italia Finance, the entire investment in ISMS.r.l. (which already held a 40% stake in Finanziaria Web which, in turn, held a 66% interest in Matrix)for a total amount of €98 million;
F-32

Financial Statements Notes To Consolidated Financial Statements
Š on June 1, 2005, ISM S.r.l. (in which Telecom Italia holds a 100% interest), after having received apayment for an increase of share capital from Telecom Italia for €70 million, acquired 60% of FinanziariaWeb and 0.7% of Matrix from Telecom Italia Media for €70 million;
Š on June 1, 2005, Telecom Italia purchased a 100% interest in Nuova Tin.it S.r.l., a newly-establishedcompany in which Telecom Italia Media contributed the Tin.it business segment, at a price of €880million.
At the conclusion of the foregoing transactions, Telecom Italia S.p.A. holds, directly or indirectly (through ISM),full control over Virgilio’s operations.
In June 2005, Telecom Italia Media successfully concluded the buyback of 364,251,922 ordinary shares and6,107,723 savings shares (in execution of the resolution passed by the shareholders’ meeting of Telecom ItaliaMedia held on May 24, 2005) for a total amount of €148 million.
Following the cancellation of the shares on October 18, 2005, Telecom Italia S.p.A. increased its direct controllinginterest (60.2%) and indirect holding (2.1% through Telecom Italia Finance) from a total of 62.3% to 69.2%. Thepercentage investment in share capital, also taking into account the stock options exercised, increased from61.47% to 68.07% at December 31, 2005.
Reorganization of the Med Group
In July 2005, the Telecom Italia Group executed the agreement reached in December 2004 with the minorityshareholders of Med Nautilus S.A., Med Nautilus Ltd and Med 1, negotiated to resolve certain matters disputedconcerning Med Nautilus S.A.’s and Telecom Italia/Telecom Italia International’s put option on 49% of the sharesof Med Nautilus Ltd and Med 1, and to resolve the arbitration proceedings set in motion in Luxembourg by theFishman group (FTT) aimed at the restitution of the sums paid to Telecom Italia International N.V. in 2000 for thepurchase of a 30% stake in Med Nautilus S.A..
This agreement allows the Telecom Italia Group to strengthen its presence in the sector of IP services andwholesale data in the East Mediterranean and to now hold 100% stakes in Med Nautilus Ltd (through Med NautilusS.A.) and in Med 1, following the purchase of the minority stake for consideration of €135 million.
Concurrently, non-strategic activities in certain local Israeli operations were sold which were managed by thesame Med Nautilus Ltd and Med 1 (for the latter, the entire investment in Med 1 IC-1 (1999) Ltd was sold).Furthermore, the Fishman group, in disposing of its investment in Med Nautilus S.A., acquired 30% of the capitalof the subsidiary Elettra S.p.A. for consideration of approximately €35 million.
Overall, the agreement entailed a net disbursement of €49 million.
YEAR 2004
In 2004, there were no transactions between companies under common control.
NOTE 4—FINANCIAL RISK MANAGEMENT
Objectives and policies for the management of the financial risks of the Telecom Italia Group
The Telecom Italia Group is exposed to the following financial risks during the ordinary course of its businessoperations:
Š market risk: stemming from changes in interest rates and exchange rates in connection with financialactivities that have been originated and financial liabilities that have been assumed;
Š credit risk: represented by the risk of the non-fulfillment of the obligations undertaken by thecounterpart with respect to the Group’s investment of liquidity;
Š liquidity risk: connected with the need to meet short-term financial commitments.
F-33

Financial Statements Notes To Consolidated Financial Statements
These financial risks are managed through:
Š the establishment, at a central level, of guidelines for financial operations;
Š the activities of an internal committee which monitors the level of exposure to market risks inaccordance with pre-established general objectives;
Š the identification of the most suitable financial instruments, including derivatives, to achieve thepre-established objectives;
Š the monitoring of the financial performance;
Š the exclusion of the use of financial instruments for speculative purposes.
The policies for the management of the above financial risks by the Telecom Italia Group are described below.
Market risk
The Telecom Italia Group is exposed to market risks as a result of changes in interest rates and exchange rates inthe markets in which it operates or is present with bond issues, mainly Europe, the United States, Great Britainand Latin America.
The risk management policies of the Telecom Italia Group aim to diversify market risks and minimize interest rateexposure by suitable portfolio diversification, which is also implemented by using carefully selected derivativefinancial instruments.
The Group defines an optimum fixed-rate and floating-rate debt composition and uses derivative financialinstruments to achieve that prefixed composition. Taking into account the Group’s operations in various sectors,in terms of risk, volatility and the amount of expected operating cash flows, the optimum blend of medium/long-term non-current financial liabilities has been established at 70% for the fixed-rate component and 30% for thefloating-rate component.
The Group mainly uses derivative financial instruments to manage market risks:
Š Interest Rate Swaps (IRS) are used to modify the profile of the original exposure to interest rate riskson loans and bonds, whether fixed or floating;
Š Cross Currency and Interest Rate Swaps (CCIRS) and Currency Forwards are used to convert loans andbonds issued in currencies other than the euro—principally in U.S. dollars and British pounds—to thefunctional currencies of the operating companies.
As a result of the above policies, at December 31, 2006, the exchange rate risk on the financial payablesassumed by the Group denominated in currencies other than Euro is completely hedged.
Derivative financial instruments are used by the Group and are designated as fair value hedges for themanagement of exchange rate risks on instruments denominated in currencies other than euro and themanagement of the interest rate risk on fixed-rate loans. Derivative financial instruments are designated as cashflow hedges when the objective is to fix the exchange rate of future transactions and the interest rate.
All derivative financial instruments are with high-credit-quality banking and financial counterparties with a highrating.
F-34

Financial Statements Notes To Consolidated Financial Statements
The following tables present the nominal repayment/investment amount (insofar as that amount expresses theeffective interest rate exposure of the Group) and, as far as financial assets are concerned, account was taken ofthe intrinsic nature of the transactions under consideration (financial characteristics and duration) rather than thestated contractual terms alone. Transactions with short term characteristics and frequent renewals, such that theinterest rate is periodically re-fixed on the basis of market parameters (such as in the case of bank deposits andeuro commercial paper), have been included in the category of floating rate, even though the contract does notcall for re-fixing the interest rate.
Financial liabilities (at the nominal repayment amount)As of December 31, 2006 As of December 31, 2005
Fixedrate
Floatingrate Total
Fixedrate
Floatingrate Total
(millions of Euro)Notes and bonds . . . . . . . . . . . . . . . . . . . . . . . . . . . . . . . . . . . . 23,101 10,018 33,119 24,511 10,066 34,577Convertible/exchangeable notes and bonds . . . . . . . . . 574 — 574 2,642 — 2,642Loans and other payables . . . . . . . . . . . . . . . . . . . . . . . . . . . 7,167 3,979 11,146 5,434 7,644 13,078Liabilities related to discontinued operations/assets
held for sale . . . . . . . . . . . . . . . . . . . . . . . . . . . . . . . . . . . . . . — — — — 112 112
Total . . . . . . . . . . . . . . . . . . . . . . . . . . . . . . . . . . . . . . . . . . . . . . . 30,842 13,997 44,839 32,587 17,822 50,409
Financial assets (at the nominal investment amount)As of December 31, 2006 As of December 31, 2005
Fixedrate
Floatingrate Total
Fixedrate
Floatingrate Total
(millions of Euro)Deposits and cash . . . . . . . . . . . . . . . . . . . . . . . . . . . . . . . . . . . — 7,204 7,204 — 10,041 10,041Euro commercial paper . . . . . . . . . . . . . . . . . . . . . . . . . . . . . . — 20 20 — 326 326Securities . . . . . . . . . . . . . . . . . . . . . . . . . . . . . . . . . . . . . . . . . . . 17 813 830 4 380 384Other receivables . . . . . . . . . . . . . . . . . . . . . . . . . . . . . . . . . . . 472 199 671 24 1,038 1,062Discontinued operations/assets held for sale . . . . . . . . — — — — 37 37
Total . . . . . . . . . . . . . . . . . . . . . . . . . . . . . . . . . . . . . . . . . . . . . . . 489 8,236 8,725 28 11,822 11,850
For floating-rate financial instruments, the contracts provide for revisions of the interest rate within the next 12months.
For the categories where the effective interest rate can be determined, the effective interest rate represents theoriginal rate net of the effect of any related derivative hedging instruments.
The adjusted carrying amount for each class of financial assets and liabilities, was determined, for purposes ofcalculating the weighted average effective interest rate. The adjusted carrying amount of financial assets andliabilities includes accruals and fair value adjustments representing the amortized cost, net of accruals and anyfair value adjustments as a consequence of hedge accounting.
Financial liabilitiesAs of December 31, 2006 As of December 31, 2005Adjustedcarryingamount
Effectiveinterest rate
Adjustedcarryingamount
Effectiveinterest rate
(millionsof Euro)
(%) (millionsof Euro)
(%)
Notes and bonds . . . . . . . . . . . . . . . . . . . . . . . . . . . . . . . . . . . . . . . . . . . . . . . 33,037 5.81% 34,453 5.71%Convertible and exchangeable notes and bonds . . . . . . . . . . . . . . . . . 482 7.43% 2,505 6.39%Loans and other payables . . . . . . . . . . . . . . . . . . . . . . . . . . . . . . . . . . . . . . . 10,152 5.24% 12,891 3.93%
Total . . . . . . . . . . . . . . . . . . . . . . . . . . . . . . . . . . . . . . . . . . . . . . . . . . . . . . . . . . 43,671 5.70% 49,849 5.28%
F-35
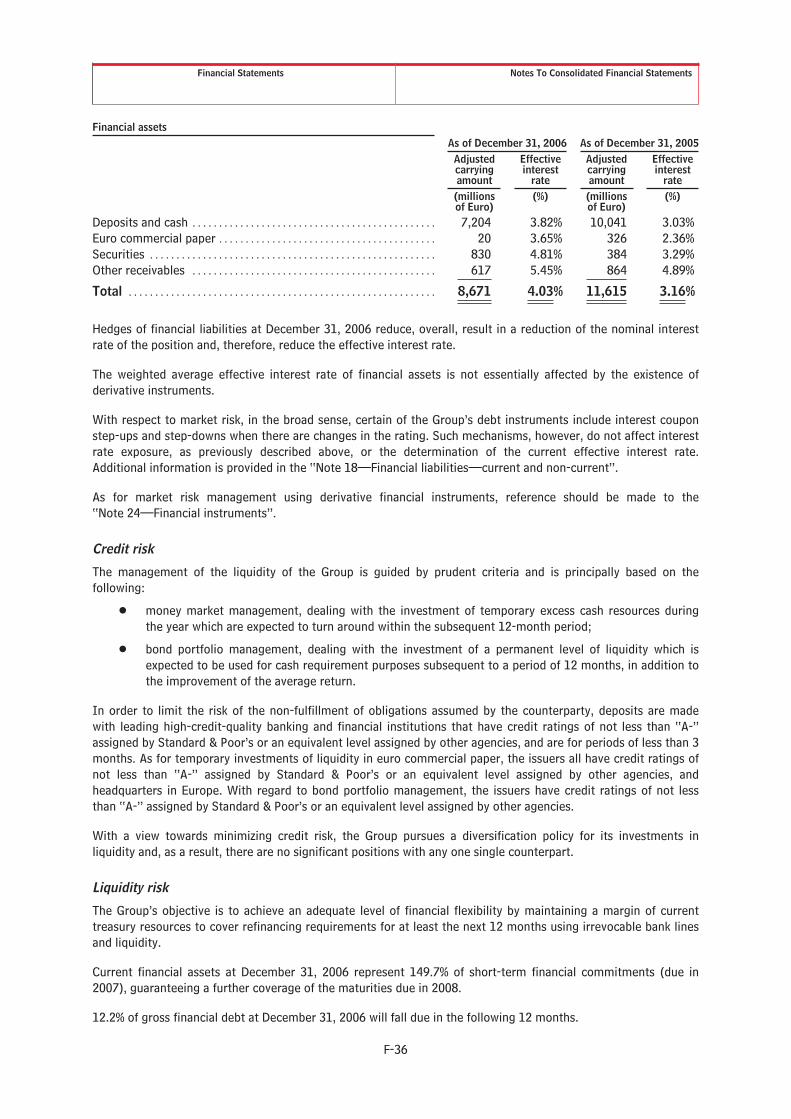
Financial Statements Notes To Consolidated Financial Statements
Financial assetsAs of December 31, 2006 As of December 31, 2005
Adjustedcarryingamount
Effectiveinterest
rate
Adjustedcarryingamount
Effectiveinterest
rate(millionsof Euro)
(%) (millionsof Euro)
(%)
Deposits and cash . . . . . . . . . . . . . . . . . . . . . . . . . . . . . . . . . . . . . . . . . . . . . . 7,204 3.82% 10,041 3.03%Euro commercial paper . . . . . . . . . . . . . . . . . . . . . . . . . . . . . . . . . . . . . . . . . 20 3.65% 326 2.36%Securities . . . . . . . . . . . . . . . . . . . . . . . . . . . . . . . . . . . . . . . . . . . . . . . . . . . . . . 830 4.81% 384 3.29%Other receivables . . . . . . . . . . . . . . . . . . . . . . . . . . . . . . . . . . . . . . . . . . . . . . 617 5.45% 864 4.89%
Total . . . . . . . . . . . . . . . . . . . . . . . . . . . . . . . . . . . . . . . . . . . . . . . . . . . . . . . . . . 8,671 4.03% 11,615 3.16%
Hedges of financial liabilities at December 31, 2006 reduce, overall, result in a reduction of the nominal interestrate of the position and, therefore, reduce the effective interest rate.
The weighted average effective interest rate of financial assets is not essentially affected by the existence ofderivative instruments.
With respect to market risk, in the broad sense, certain of the Group’s debt instruments include interest couponstep-ups and step-downs when there are changes in the rating. Such mechanisms, however, do not affect interestrate exposure, as previously described above, or the determination of the current effective interest rate.Additional information is provided in the “Note 18—Financial liabilities—current and non-current”.
As for market risk management using derivative financial instruments, reference should be made to the“Note 24—Financial instruments”.
Credit risk
The management of the liquidity of the Group is guided by prudent criteria and is principally based on thefollowing:
Š money market management, dealing with the investment of temporary excess cash resources duringthe year which are expected to turn around within the subsequent 12-month period;
Š bond portfolio management, dealing with the investment of a permanent level of liquidity which isexpected to be used for cash requirement purposes subsequent to a period of 12 months, in addition tothe improvement of the average return.
In order to limit the risk of the non-fulfillment of obligations assumed by the counterparty, deposits are madewith leading high-credit-quality banking and financial institutions that have credit ratings of not less than “A-”assigned by Standard & Poor’s or an equivalent level assigned by other agencies, and are for periods of less than 3months. As for temporary investments of liquidity in euro commercial paper, the issuers all have credit ratings ofnot less than “A-” assigned by Standard & Poor’s or an equivalent level assigned by other agencies, andheadquarters in Europe. With regard to bond portfolio management, the issuers have credit ratings of not lessthan “A-” assigned by Standard & Poor’s or an equivalent level assigned by other agencies.
With a view towards minimizing credit risk, the Group pursues a diversification policy for its investments inliquidity and, as a result, there are no significant positions with any one single counterpart.
Liquidity risk
The Group’s objective is to achieve an adequate level of financial flexibility by maintaining a margin of currenttreasury resources to cover refinancing requirements for at least the next 12 months using irrevocable bank linesand liquidity.
Current financial assets at December 31, 2006 represent 149.7% of short-term financial commitments (due in2007), guaranteeing a further coverage of the maturities due in 2008.
12.2% of gross financial debt at December 31, 2006 will fall due in the following 12 months.
F-36
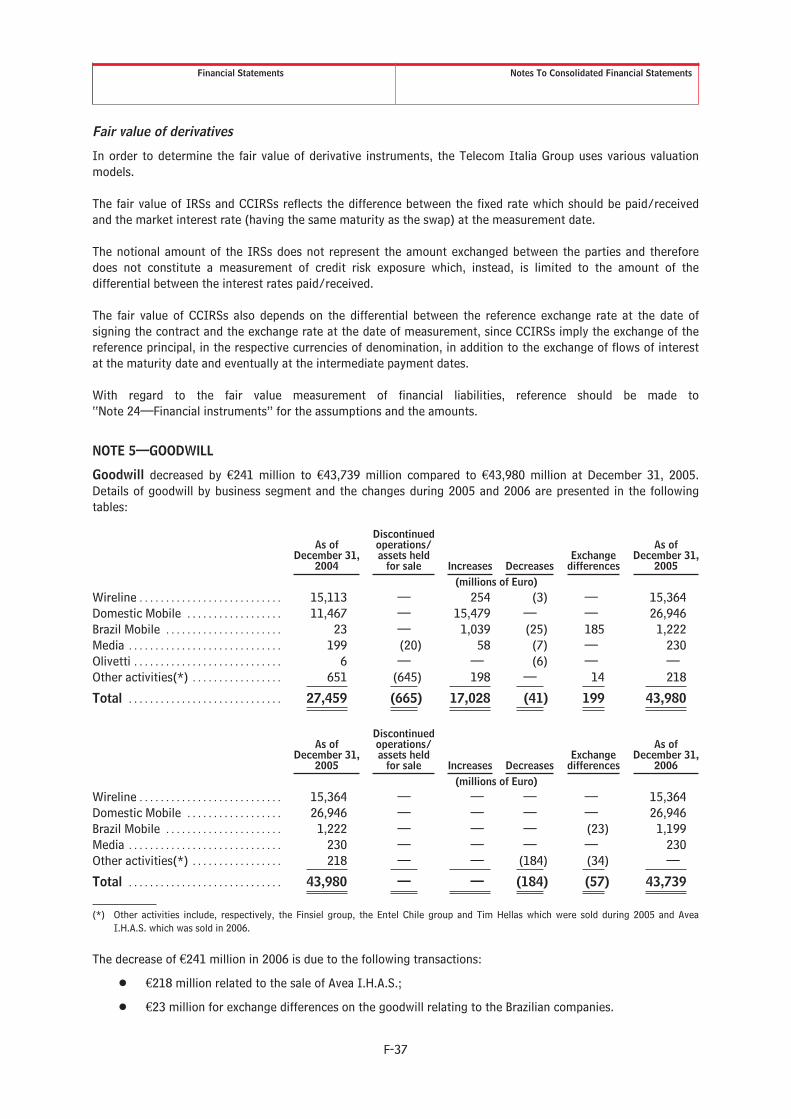
Financial Statements Notes To Consolidated Financial Statements
Fair value of derivatives
In order to determine the fair value of derivative instruments, the Telecom Italia Group uses various valuationmodels.
The fair value of IRSs and CCIRSs reflects the difference between the fixed rate which should be paid/receivedand the market interest rate (having the same maturity as the swap) at the measurement date.
The notional amount of the IRSs does not represent the amount exchanged between the parties and thereforedoes not constitute a measurement of credit risk exposure which, instead, is limited to the amount of thedifferential between the interest rates paid/received.
The fair value of CCIRSs also depends on the differential between the reference exchange rate at the date ofsigning the contract and the exchange rate at the date of measurement, since CCIRSs imply the exchange of thereference principal, in the respective currencies of denomination, in addition to the exchange of flows of interestat the maturity date and eventually at the intermediate payment dates.
With regard to the fair value measurement of financial liabilities, reference should be made to“Note 24—Financial instruments” for the assumptions and the amounts.
NOTE 5—GOODWILL
Goodwill decreased by €241 million to €43,739 million compared to €43,980 million at December 31, 2005.Details of goodwill by business segment and the changes during 2005 and 2006 are presented in the followingtables:
As ofDecember 31,
2004
Discontinuedoperations/assets held
for sale Increases DecreasesExchange
differences
As ofDecember 31,
2005(millions of Euro)
Wireline . . . . . . . . . . . . . . . . . . . . . . . . . . . 15,113 — 254 (3) — 15,364Domestic Mobile . . . . . . . . . . . . . . . . . . 11,467 — 15,479 — — 26,946Brazil Mobile . . . . . . . . . . . . . . . . . . . . . . 23 — 1,039 (25) 185 1,222Media . . . . . . . . . . . . . . . . . . . . . . . . . . . . . 199 (20) 58 (7) — 230Olivetti . . . . . . . . . . . . . . . . . . . . . . . . . . . . 6 — — (6) — —Other activities(*) . . . . . . . . . . . . . . . . . 651 (645) 198 — 14 218
Total . . . . . . . . . . . . . . . . . . . . . . . . . . . . . 27,459 (665) 17,028 (41) 199 43,980
As ofDecember 31,
2005
Discontinuedoperations/assets held
for sale Increases DecreasesExchange
differences
As ofDecember 31,
2006(millions of Euro)
Wireline . . . . . . . . . . . . . . . . . . . . . . . . . . . 15,364 — — — — 15,364Domestic Mobile . . . . . . . . . . . . . . . . . . 26,946 — — — — 26,946Brazil Mobile . . . . . . . . . . . . . . . . . . . . . . 1,222 — — — (23) 1,199Media . . . . . . . . . . . . . . . . . . . . . . . . . . . . . 230 — — — — 230Other activities(*) . . . . . . . . . . . . . . . . . 218 — — (184) (34) —
Total . . . . . . . . . . . . . . . . . . . . . . . . . . . . . 43,980 — — (184) (57) 43,739
(*) Other activities include, respectively, the Finsiel group, the Entel Chile group and Tim Hellas which were sold during 2005 and AveaI.H.A.S. which was sold in 2006.
The decrease of €241 million in 2006 is due to the following transactions:
Š €218 million related to the sale of Avea I.H.A.S.;
Š €23 million for exchange differences on the goodwill relating to the Brazilian companies.
F-37

Financial Statements Notes To Consolidated Financial Statements
The gross carrying amounts of goodwill and the relative impairment losses accumulated from January 1, 2004(date of allocation to the Cash-Generating Units—CGU) to December 31, 2006 and 2005 can be summarized asfollows:
As of December 31, 2006 As of December 31, 2005Gross
carryingamount
Accumulatedimpairment
losses
Netcarryingamount
Grosscarryingamount
Accumulatedimpairment
losses
Netcarryingamount
(millions of Euro)Wireline . . . . . . . . . . . . . . . . . . . . . . . . . . . . . . (**)15,656 (**)(292) 15,364 (**)15,656 (**)(292) 15,364Domestic Mobile . . . . . . . . . . . . . . . . . . . . . 26,946 — 26,946 26,946 — 26,946Brazil Mobile . . . . . . . . . . . . . . . . . . . . . . . . . 1,206 (7) 1,199 1,229 (7) 1,222Media . . . . . . . . . . . . . . . . . . . . . . . . . . . . . . . . 230 — 230 230 — 230Olivetti . . . . . . . . . . . . . . . . . . . . . . . . . . . . . . . 6 (6) — 6 (6) —Other activities(*) . . . . . . . . . . . . . . . . . . . . — — — 218 — 218
Total . . . . . . . . . . . . . . . . . . . . . . . . . . . . . . . . . 44,044 (305) 43,739 44,285 (305) 43,980
(*) Other activities include Avea I.H.A.S. which was sold in 2006.
(**) Includes €282 million relating to the settlement with De Agostini in 2004.
Goodwill under IAS 36 is not amortized but is tested for impairment annually or more frequently if specific eventsor circumstances indicate that it may be impaired. To test for impairment, goodwill must be allocated to cash-generating units or groups of cash-generating units which must not be at a higher level than the businesssegment determined in accordance with IAS 14. The criteria followed for the allocation of goodwill considers thelowest level at which goodwill is monitored for internal management purposes. The business units (or groups ofunits) to which goodwill was allocated are as follows:
Sector Group of units
Wireline Liberty SurfHansenetWireline (excluded Liberty Surf and Hansenet)
Mobile DomesticBrazil
Media Telecom Italia Media
The value used to determine the recoverable amount of the units (or groups of units) to which the goodwill wasallocated is the value in use, except for Liberty Surf, for which fair value was used net of costs to sell (estimatedon the basis of multiplies of comparable companies), and for Telecom Italia Media, for which market capitalizationat December 31, 2006 was used as the fair value of the entity.
The most representative basic assumptions for the calculation of the value in use of each group of cashgenerating units are presented in the following table:
Hansenet Wireline Domestic Mobile Brazil Mobile
Number of customers Ebitda margin (Ebitda/sales) during the periodof the plan
Ebitda margin (Ebitda/sales) during the periodof the plan
Growth rate of salesduring the explicitforecast period(2007-2009)
Gross operating margin Investments to maintainprofit capability (inproportion to sales)
Investments to maintainprofit capability (inproportion to sales)
Ebitda margin (Ebitda/sales) during the periodof the plan
Non-recurring expensesexcluded from expectedEbitda for extrapolation inthe calculation of the endamount
Exchange rate RealBrazilian/Euro
Cost of capital Cost of capital Cost of capital Cost of capital
Long-term growth rate Long-term growth rate Long-term growth rate Long-term growth rate
F-38

Financial Statements Notes To Consolidated Financial Statements
All the plan figures are based on the actual results for 2006 and rely on the management forecasts for the periodof the 2007/2009 plan.
For Hansenet, in order to exclude the net present value of future investments in the impairment test (IAS 36,paragraph 44), only the flow of the expected result for 2007 was considered, forecasting it in perpetuity.
The recoverable amount of Liberty Surf was assumed to be equal to fair value less costs to sell, which is higherthan the value in use which was calculated without considering the net present value of future investments fornetwork development.
The nominal growth rates used to estimate the end amount are the following (the growth rate of Brazil refers toflows in Brazilian Reais):
Hansenet Wireline Domestic Mobile Brazil Mobile
+0.5% 0% +0.5% +6.55%
Such rates fall within the range of growth rates applied by the analysts following Telecom Italia stock (as can beseen from the reports published after the announcement of the third-quarter 2006 results).
The cost of capital was estimated by considering the following:
a) the CAPM—Capital Asset Pricing Model to estimate the value in use and referred to in Annex A of IAS36;
b) the Beta coefficient for business segments obtained by using the Beta coefficients of the Europeantelephone incumbents, including Telecom Italia itself, adjusted to take into account the financialstructure;
c) the WACC—Weighted Average Cost of Capital used by other operators to test the value of goodwill;
d) the WACC—Weighted Average Cost of Capital used by the analysts following Telecom Italia stock in thereports published after the announcement of third-quarter 2006 results relative to the principal businesssegments of the Group. Since there is a direct correlation between the cost of capital used by theanalysts and the long-term growth rate (g) forecast for the purpose of estimating the end amount, thecomparison was also made on the capitalization rates (WACC-g).
On the basis of these elements, the post-tax Weighted Average Cost of Capital and the capitalization rate (WACCafter taxes—g) were estimated for each business unit (Reais are used for Brazil) as follows:
Hansenet Wireline Domestic Mobile Brazil Mobile
Wacc after taxes . . . . . . . . . . . . . . . . . . . . . . . . . . . . . . 7.6% 6.8% 7.0% 13.5%Wacc after taxes -g . . . . . . . . . . . . . . . . . . . . . . . . . . . 7.1% 6.8% 6.5% 7.0%
Having considered the nominal flows of the result for the estimate of the value in use, the discount rates are alsoexpressed in nominal terms (in Reais for Brazil).
A sensitivity analysis of the results was also carried out for those units for which the value in use was estimated:in all cases the value in use remains higher than the carrying amounts, even assuming an increase in the weightedaverage cost of capital of 50 basis point (hundredths of a percentage point).
The second level of impairment testing was carried out by comparing the total recoverable value of all thebusiness units of the Group, including those without any goodwill allocation (Olivetti, Bolivia, Central Functionsand Other activities) to the carrying amount of total operating capital of the Group. This second level of test didnot show any impairment.
F-39

Financial Statements Notes To Consolidated Financial Statements
NOTE 6—INTANGIBLE ASSETS WITH A FINITE LIFE
Intangible assets with a finite life decreased from €6,810 million at December 31, 2005 to €6,740 million.Details on the composition and movements during the year are as follows:
As ofDecember 31,
2004
DiscontinuedOperations/assets held
for sale Additions Amortization
Impairmentlosses/
Reversals DisposalsExchange
differencesOther
changes
As ofDecember 31,
2005(millions of Euro)
Industrial patentsand intellectualpropertyrights . . . . . . . . . 2,510 (99) 1,276 (1,414) (10) (20) 91 476 2,810
Concessions,licenses,trademarks andsimilar rights . . . 3,504 (365) 51 (253) — (6) 188 199 3,318
Other intangibleassets . . . . . . . . . 52 (16) 47 (17) — — — (9) 57
Work in progressand advancepayments . . . . . . 708 (14) 411 — — — 18 (498) 625
Total . . . . . . . . . . . . 6,774 (494) 1,785 (1,684) (10) (26) 297 168 6,810
As ofDecember 31,
2005
DiscontinuedOperations/assets held
for sale Additions Amortization
Impairmentlosses/
Reversals DisposalsExchange
differencesOther
changes
As ofDecember 31,
2006(millions of Euro)
Industrial patentsand intellectualpropertyrights . . . . . . . . . 2,810 — 1,126 (1,760) — — (9) 454 2,621
Concessions,licenses,trademarks andsimilar rights . . . 3,318 — 184 (310) (14) (7) (19) 20 3,172
Other intangibleassets . . . . . . . . . 57 — 260 (110) — — (1) (30) 176
Work in progressand advancepayment . . . . . . . 625 — 617 — (1) (1) (1) (468) 771
Total . . . . . . . . . . . . 6,810 — 2,187 (2,180) (15) (8) (30) (24) 6,740
Additions made during 2006 include €318 million of internal costs capitalized (€287 million in 2005).
Industrial patents and intellectual property rights at December 31, 2006 consist almost entirely ofapplications software purchased outright and user license rights acquired for an indefinite time period (amortizedover the period of useful benefit estimated in three years). They mainly refer to the Wireline Business Unit (€1,290million), the Mobile Domestic Business Unit (€774 million) and the Brazil Mobile Business Unit (€441 million).
Concessions, licenses, trademarks and similar rights at December 31, 2006 mainly refer to the DomesticMobile Business Unit (€2,025 million) and the Brazil Mobile Business Unit (€618 million) with respect to theremaining unamortized cost of UMTS and PCS licenses, to the Wireline Business Unit (€375 million, of which€131 million refers to costs for Indefeasible Rights of Use-IRU) and to the Media Business Unit (€150 million,mainly for TV frequencies acquired at the end of 2005).
The remaining unamortized mobile telephone licenses totaling €2,643 million (amortized on a straight—linebasis) refer to the following:
Š licenses of Telecom Italia S.p.A.:
– UMTS for €2,014 million expiring in 2021 (amortized over 18 years);
– Wireless Local Loop for €11 million expiring in 2021 (amortized over 15 years);
F-40

Financial Statements Notes To Consolidated Financial Statements
Š licenses of the Tim Participações group:
– GSM for €495 million expiring between 2007 and 2018 (amortized in 4-15 years);
– TDMA for €123 million expiring in 2012 (amortized in about 14 years).
The user rights for televisions frequencies totaling €144 million are amortized as follows: if used for analogbroadcasting, amortization is taken to December 31, 2008; if used for digital terrestrial broadcasting, amortizationis taken until 2018, the period (12 years) of the network operator license for which the request was filed in thefirst half of 2006.
Other intangible assets at December 31, 2006 include €160 million for the capitalization of subscriberacquisition costs referring to the new sales offers of Telecom Italia S.p.A. (€96 million), the Tim Brasil group(€57 million) and Liberty Surf Group S.A. (€7 million). Following the introduction of new types of sales contractsin 2006 which bind the customer to the Telecom Italia Group for periods of 12 or 24 months, otherwise a penaltyis applied, the Group capitalized subscriber acquisition costs in intangible assets. These costs represent negativemargins on handset sales and commissions for the sales network. This accounting treatment, permitted by IAS 38makes it possible to match the amortization charge with cash flows.
Other intangible assets also include €9 million allocated to the Customer List and representing a portion of thegoodwill that arose on the acquisition of the controlling interest in Liberty Surf Group S.A..
In 2006, the impairment losses of €15 million mainly refer to Latin American Nautilus group. In 2005, theimpairment losses of €10 million, net of impairment reversals of €1 million, mainly referred to Maxitel (nowrenamed Tim Nordeste S.A.).
Amortization and impairment losses are recorded in the statement of income as components of the operatingresult.
The gross carrying amount, accumulated impairment losses and accumulated amortization at December 31, 2006and 2005 can be summarized as follows:
As of December 31, 2006Gross
carryingamount
Accumulatedimpairment
lossesAccumulatedamortization
Netcarryingamount
(millions of Euro)Industrial patents and intellectual property rights . . . . . . . . . . . . . . . . 11,806 (8) (9,177) 2,621Concessions, licenses, trademarks and similar rights . . . . . . . . . . . . . . 4,595 (262) (1,161) 3,172Other intangible assets . . . . . . . . . . . . . . . . . . . . . . . . . . . . . . . . . . . . . . . . . . . 424 (75) (173) 176Work in progress and advance payments . . . . . . . . . . . . . . . . . . . . . . . . . 772 (1) — 771
Total . . . . . . . . . . . . . . . . . . . . . . . . . . . . . . . . . . . . . . . . . . . . . . . . . . . . . . . . . . . . 17,597 (346) (10,511) 6,740
As of December 31, 2005Gross
carryingamount
Accumulatedimpairment
lossesAccumulatedamortization
Netcarryingamount
(millions of Euro)Industrial patents and intellectual property rights . . . . . . . . . . . . . . . . 9,886 (8) (7,068) 2,810Concessions, licenses, trademarks and similar rights . . . . . . . . . . . . . . 4,457 (276) (863) 3,318Other intangible assets . . . . . . . . . . . . . . . . . . . . . . . . . . . . . . . . . . . . . . . . . . . 170 (80) (33) 57Work in progress and advance payments . . . . . . . . . . . . . . . . . . . . . . . . . 625 — — 625
Total . . . . . . . . . . . . . . . . . . . . . . . . . . . . . . . . . . . . . . . . . . . . . . . . . . . . . . . . . . . . 15,138 (364) (7,964) 6,810
The impairment losses in “Concessions, licenses, trademarks and similar rights” mainly refer to the IndefeasibleRights of Use—IRU of the transmission capacity and cables relating to the international connections acquired bythe Latin American Nautilus group.
Such impairments, principally relating to the years prior to 2004, are the result of the altered and shrunkenmarket value of international broadband compared to the expectations anticipated at the historical date of thoseinvestments.
F-41

Financial Statements Notes To Consolidated Financial Statements
NOTE 7—TANGIBLE ASSETS (OWNED AND UNDER FINANCE LEASES)
Property, plant and equipment owned
Property, plant and equipment owned decreased from €16,443 million at December 31, 2005 to €15,690 million.Details on the composition and movements during the years 2006 and 2005 are as follows:
As ofDecember 31,
2004
Discontinuedoperations/assets held
for sale Additions Depreciation
Impairmentlosses/
Reversals DisposalsExchange
differencesOther
changes
As ofDecember 31,
2005(millions of Euro)
Land . . . . . . . . . . . . . 224 (14) — — — (62) 2 5 155Civil and industrial
buildings . . . . . . . 1,458 (181) 23 (103) (1) (249) 19 6 972Plant and
equipment . . . . . . 14,150 (1,219) 2,069 (2,910) — (29) 378 468 12,907Manufacturing and
distributionequipment . . . . . . 62 (5) 38 (31) — — — 8 72
Aircrafts andships . . . . . . . . . . 55 — — (9) — — — — 46
Other . . . . . . . . . . . . 962 (86) 380 (363) — (6) 99 188 1,174Work in progress and
advancepayments . . . . . . . 942 (77) 790 — (8) (2) 59 (587) 1,117
Total . . . . . . . . . . . . 17,853 (1,582) 3,300 (3,416) (9) (348) 557 88 16,443
As ofDecember 31,
2005
Discontinuedoperations/assets held
for sale Additions Depreciation
Impairmentlosses/
Reversals DisposalsExchange
differencesOther
changes
As ofDecember 31,
2006(millions of Euro)
Land . . . . . . . . . . . . . 155 — — — — (3) (1) (17) 134Civil and industrial
buildings . . . . . . . 972 — 9 (48) — (195) (3) (137) 598Plant and
equipment . . . . . . 12,907 — 2,206 (2,644) (3) (23) (68) 580 12,955Manufacturing and
distributionequipment . . . . . . 72 — 17 (33) (1) — — 4 59
Aircrafts andships . . . . . . . . . . 46 — 1 (7) — — — — 40
Other . . . . . . . . . . . . 1,174 — 190 (446) — (3) (7) 108 1,016Work in progress and
advancepayments . . . . . . . 1,117 — 462 — (2) (12) (3) (674) 888
Total . . . . . . . . . . . . 16,443 — 2,885 (3,178) (6) (236) (82) (136) 15,690
Additions in 2006 include €178 million of internal costs capitalized (€184 million in 2005).
In 2006, the impairment losses of €6 million (€9 million in 2005) mainly refer to the writedown of telephonematerials in the process of being replaced with new more advanced technological equipment.
Depreciation and impairment losses/reversals are recorded in the statement of income as components of theoperating result.
In 2006, the plan was completed for the disposal of real estate properties approved by the Board of Directors onDecember 21, 2005 for more than 1,300 buildings for a total of approximately €1 billion.
After a first stage of the disposal plan was concluded in 2005, 291 properties were sold to Fondo Raissa and 181to Fondo Spazio Industriale for a total amount of €350 million in March 2006, June 2006 and December 2006. Thetransaction generated a gross gain on consolidation of €135 million and reduced the consolidated net financialdebt by €296 million before taxes.
These effects take into account the recognition, in accordance with the finance method in IAS 17, of thecontribution of 45 properties to Fondo Raissa and the simultaneous long-term financial leaseback of theseproperties which have been reclassified from properties owned to properties held under finance leases.
F-42

Financial Statements Notes To Consolidated Financial Statements
Other changes include not only properties sold and simultaneously leased back for €30 million but the revision ofthe estimates for the restoring costs of the Tim Brasil group for €105 million. The change in estimate is due to areduction in the unit cost for restoring the sites achieved following the renewal of contracts with foreign suppliers,subsequent to the reorganization of the company, and also greater use of co-siting contracts which do not requirethe companies to restore the sites. These changes in estimate have been recorded with a contra-entry toProvisions for risks and charges, as provided by IFRIC 1.
The gross carrying amount, accumulated impairment losses and accumulated depreciation at December 31, 2006and 2005 can be summarized as follows:
As of December 31, 2006Gross
carryingamount
Accumulatedimpairment
lossesAccumulateddepreciation
Netcarryingamount
(millions of Euro)Land . . . . . . . . . . . . . . . . . . . . . . . . . . . . . . . . . . . . . . . . . . . . . . . . . . . . . . . . . . . . 134 — — 134Civil and industrial buildings . . . . . . . . . . . . . . . . . . . . . . . . . . . . . . . . . . . . . 1,333 (2) (733) 598Plant and equipment . . . . . . . . . . . . . . . . . . . . . . . . . . . . . . . . . . . . . . . . . . . . . 58,112 (66) (45,091) 12,955Manufacturing and distribution equipment . . . . . . . . . . . . . . . . . . . . . . . 751 — (692) 59Aircrafts and ships . . . . . . . . . . . . . . . . . . . . . . . . . . . . . . . . . . . . . . . . . . . . . . . 145 (11) (94) 40Other . . . . . . . . . . . . . . . . . . . . . . . . . . . . . . . . . . . . . . . . . . . . . . . . . . . . . . . . . . . . 4,046 (6) (3,024) 1,016Work in progress and advance payments . . . . . . . . . . . . . . . . . . . . . . . . . 897 (9) — 888
Total . . . . . . . . . . . . . . . . . . . . . . . . . . . . . . . . . . . . . . . . . . . . . . . . . . . . . . . . . . . . 65,418 (94) (49,634) 15,690
As of December 31, 2005Gross
carryingamount
Accumulatedimpairment
lossesAccumulateddepreciation
Netcarryingamount
(millions of Euro)Land . . . . . . . . . . . . . . . . . . . . . . . . . . . . . . . . . . . . . . . . . . . . . . . . . . . . . . . . . . . . 155 — — 155Civil and industrial buildings . . . . . . . . . . . . . . . . . . . . . . . . . . . . . . . . . . . . . 2,247 (35) (1,240) 972Plant and equipment . . . . . . . . . . . . . . . . . . . . . . . . . . . . . . . . . . . . . . . . . . . . . 58,143 (151) (45,085) 12,907Manufacturing and distribution equipment . . . . . . . . . . . . . . . . . . . . . . . 756 (5) (679) 72Aircrafts and ships . . . . . . . . . . . . . . . . . . . . . . . . . . . . . . . . . . . . . . . . . . . . . . . 145 (11) (88) 46Other . . . . . . . . . . . . . . . . . . . . . . . . . . . . . . . . . . . . . . . . . . . . . . . . . . . . . . . . . . . . 4,159 (7) (2,978) 1,174Work in progress and advance payments . . . . . . . . . . . . . . . . . . . . . . . . . 1,126 (9) — 1,117
Total . . . . . . . . . . . . . . . . . . . . . . . . . . . . . . . . . . . . . . . . . . . . . . . . . . . . . . . . . . . . 66,731 (218) (50,070) 16,443
The reduction in the gross carrying amount, accumulated impairment losses and accumulated depreciation is dueto the aforementioned disposal of part of the corporate buildings to real estate investment funds and the sale ofnetwork installations and other equipment that has been almost completely depreciated, also comprising, to alesser degree, the tangible assets acquired in 2002 as a result of the merger of BLU S.p.A., which had beencompletely written down.
Assets held under finance leasesAssets held under finance leases decreased from €1,598 million at December 31, 2005 to €1,525 million. Detailson the composition and changes are as follows:
As ofDecember 31,
2004
DiscontinuedOperations/assets held
for sale Additions Depreciation DisposalsExchange
differencesOther
changes
As ofDecember 31,
2005(millions of Euro)
Civil and industrial buildings . . 1,561 (21) 14 (93) — — 16 1,477Plant and equipment . . . . . . . . . 1 (1) — (1) — — 2 1Aircrafts and ships . . . . . . . . . . . 18 — — (4) — — — 14Other . . . . . . . . . . . . . . . . . . . . . . 73 (5) 46 (34) (4) — (5) 71Work in progress and advance
payments . . . . . . . . . . . . . . . . — — 28 — — — 7 35
Total . . . . . . . . . . . . . . . . . . . . . . 1,653 (27) 88 (132) (4) — 20 1,598
F-43

Financial Statements Notes To Consolidated Financial Statements
As ofDecember 31,
2005
DiscontinuedOperations/assets held
for sale Additions Depreciation DisposalsExchange
differencesOther
changes
As ofDecember 31,
2006(millions of Euro)
Civil and industrial buildings . . 1,477 — 29 (99) (1) — 11 1,417Plant and equipment . . . . . . . . . 1 — — (1) — — 1 1Aircrafts and ships . . . . . . . . . . . 14 — — (4) — — — 10Other . . . . . . . . . . . . . . . . . . . . . . 71 — 2 (25) — — (1) 47Work in progress and advance
payments . . . . . . . . . . . . . . . . 35 — 11 — — — 4 50
Total . . . . . . . . . . . . . . . . . . . . . . 1,598 — 42 (129) (1) — 15 1,525
Depreciation and impairment losses are recorded in the statement of income as components of the operatingresult.
Other changes in 2006 include €30 million representing the net carrying amount of owned properties contributedto Fondo Raissa and the simultaneous long-term financial leaseback of these properties which, in accordance withIAS 17, have been reclassified from owned properties to properties held under finance leases, and €23 million dueto the change in the scope of consolidation following the sale of RUF Gestion.
The gross carrying amount, accumulated impairment losses and accumulated depreciation at December 31, 2006and 2005 can be summarized as follows:
As of December 31, 2006Gross
carryingamount
Accumulatedimpairment
lossesAccumulateddepreciation
Netcarryingamount
(millions of Euro)Civil and industrial buildings . . . . . . . . . . . . . . . . . . . . . . . . . . . . . . . . . . . . . . 1,926 (27) (482) 1,417Plant and equipment . . . . . . . . . . . . . . . . . . . . . . . . . . . . . . . . . . . . . . . . . . . . . 16 — (15) 1Aircrafts and ships . . . . . . . . . . . . . . . . . . . . . . . . . . . . . . . . . . . . . . . . . . . . . . . . 30 — (20) 10Other . . . . . . . . . . . . . . . . . . . . . . . . . . . . . . . . . . . . . . . . . . . . . . . . . . . . . . . . . . . . 160 — (113) 47Work in progress and advance payments . . . . . . . . . . . . . . . . . . . . . . . . . . 50 — — 50
Total . . . . . . . . . . . . . . . . . . . . . . . . . . . . . . . . . . . . . . . . . . . . . . . . . . . . . . . . . . . . 2,182 (27) (630) 1,525
As of December 31, 2005Gross
carryingamount
Accumulatedimpairment
lossesAccumulateddepreciation
Netcarryingamount
(millions of Euro)Civil and industrial buildings . . . . . . . . . . . . . . . . . . . . . . . . . . . . . . . . . . . . . . 1,967 (27) (463) 1,477Plant and equipment . . . . . . . . . . . . . . . . . . . . . . . . . . . . . . . . . . . . . . . . . . . . . 22 — (21) 1Aircrafts and ships . . . . . . . . . . . . . . . . . . . . . . . . . . . . . . . . . . . . . . . . . . . . . . . . 30 — (16) 14Other . . . . . . . . . . . . . . . . . . . . . . . . . . . . . . . . . . . . . . . . . . . . . . . . . . . . . . . . . . . . 152 — (81) 71Work in progress and advance payments . . . . . . . . . . . . . . . . . . . . . . . . . . 35 — — 35
Total . . . . . . . . . . . . . . . . . . . . . . . . . . . . . . . . . . . . . . . . . . . . . . . . . . . . . . . . . . . . 2,206 (27) (581) 1,598
At December 31, 2006 and 2005, minimum lease payments due in future years and their present value are asfollows:
As of December 31,2006 2005
Minimumlease
payments
Presentvalue of
minimumlease
payments
Minimumlease
payments
Presentvalue of
minimumlease
payments(millions of Euro)
Within 1 year . . . . . . . . . . . . . . . . . . . . . . . . . . . . . . . . . . . . . . . . . 227 121 234 218From 2 to 5 years . . . . . . . . . . . . . . . . . . . . . . . . . . . . . . . . . . . . . 819 377 868 685Beyond . . . . . . . . . . . . . . . . . . . . . . . . . . . . . . . . . . . . . . . . . . . . . . . . 1,841 1,241 1,965 891
2,887 1,739 3,067 1,794
F-44

Financial Statements Notes To Consolidated Financial Statements
As of December 31,2006 2005
(millions of Euro)Future lease payments (minimum lease payments) . . . . . . . . . . . . . . . . . . . . 2,887 3,067Less: Interest portion . . . . . . . . . . . . . . . . . . . . . . . . . . . . . . . . . . . . . . . . . . . . . . . . . (1,148) (1,273)
Present value of lease payments . . . . . . . . . . . . . . . . . . . . . . . . . . . . . . . . . . . 1,739 1,794
Finance lease liabilities . . . . . . . . . . . . . . . . . . . . . . . . . . . . . . . . . . . . . . . . . . . . . . . . 2,116 2,128Financial receivables for lessors’ net investments . . . . . . . . . . . . . . . . . . . . . . (377) (334)
Total net finance lease liabilities . . . . . . . . . . . . . . . . . . . . . . . . . . . . . . . . . . . 1,739 1,794
NOTE 8—OTHER NON-CURRENT ASSETS
Other non-current assets amount to €3,738 million (€5,956 million at December 31, 2005). The composition isas follows:
As of December 31,2006 2005(millions of Euro)
Investments accounted for using the equity method:– Associates . . . . . . . . . . . . . . . . . . . . . . . . . . . . . . . . . . . . . . . . . . . . . . . . . . . . . . . . . . . . . . . . 471 765– Joint ventures . . . . . . . . . . . . . . . . . . . . . . . . . . . . . . . . . . . . . . . . . . . . . . . . . . . . . . . . . . . . 17 16
488 781
Other investments . . . . . . . . . . . . . . . . . . . . . . . . . . . . . . . . . . . . . . . . . . . . . . . . . . . . . . . . . . . . . 776 561
Securities, financial receivables and other non-current financial assets:– Securities other than investments . . . . . . . . . . . . . . . . . . . . . . . . . . . . . . . . . . . . . . . . . 12 8– Financial receivables and other non-current financial assets . . . . . . . . . . . . . . . 679 988
691 996
Miscellaneous receivables and other non-current assets:– Miscellaneous receivables . . . . . . . . . . . . . . . . . . . . . . . . . . . . . . . . . . . . . . . . . . . . . . . . 360 358– Medium/long-term prepaid expenses . . . . . . . . . . . . . . . . . . . . . . . . . . . . . . . . . . . . . 511 467
871 825
Deferred tax assets (*) . . . . . . . . . . . . . . . . . . . . . . . . . . . . . . . . . . . . . . . . . . . . . . . . . . . . . . . . 912 2,793
Total . . . . . . . . . . . . . . . . . . . . . . . . . . . . . . . . . . . . . . . . . . . . . . . . . . . . . . . . . . . . . . . . . . . . . . . . . . 3,738 5,956
(*) Please see “Note 9—Deferred tax assets and deferred tax liabilities”.
Major transactions involving investments
a) Acquisitions and divestitures in 2006
Sale of Avea I.H.A.S. to Türk Telekomünikasyon A.S. and additional purchase of a stake in OgerTelecom Limited
On September 15, 2006, the sale of the 40.56% stake in Avea I.H.A.S. to Türk Telekomünikasyon A.S. wasfinalized for U.S.$500 million. Moreover, as established in the July 14, 2006 agreements, Telecom ItaliaS.p.A. reinvested US$250 million in the capital of Oger Telecom.
This sale reduced net financial debt by €279 million, being the balance between the proceeds on the sale(€393 million) and the recognition of non-current financial liabilities (€114 million) corresponding to the fairvalue of the commitments to provide financing or guarantee a bank loan to Avea I.H.A.S. in the amount ofUS$ 150 million.
The sale resulted in a gain of €72 million and the release to income of €121 million for the remainingguarantee provisions which were cancelled during September 2006.
F-45

Financial Statements Notes To Consolidated Financial Statements
b) Acquisitions and divestitures in 2005
Privatization of Türk Telekomünikasyon A.S.
On July 1, 2005, the bidding ended for the privatization of the majority stake (55%) of the Turkishtelecommunications operator Türk Telekomünikasyon A.S.. The bid was won for U.S.$6,550 million by avehicle company controlled by Oger Telecom, a newly-formed company controlled by the Saudi-Lebanesegroup Saudi Oger Limited and in which Telecom Italia S.p.A.—through Tim International—made an initialinvestment of U.S.$200 million (13.33%). The partnership between Telecom Italia S.p.A. and Saudi OgerLimited covers mobile telecommunications, while for fixed-line telecommunications Oger Telecom willcontinue its collaboration with BT Telconsult. The agreements with Saudi Oger also envisaged the possibilityof Tim International selling its investment in Avea I.H.A.S. to Türk Telekomünikasyon A.S., which took placeon September 15, 2006, as described above.
Within the next three years Oger Telecom is expected to be listed on the Dubai stock exchange with thepossibility of Tim International investing proportionally in the initial placement. Should the listing not takeplace within the agreed timeframe, Tim International may exercise a put option to sell Saudi Oger Limitedthe Oger Telecom shares deriving from the sale of the current investment in Avea I.H.A.S. and alsoone-fourth of the Oger Telecom shares initially subscribed by Tim International. If the put option is notexercised, the counterpart may exercise a call option on the same shares.
Acquisition of Luna Rossa Challenge 2007 S.L. and Luna Rossa Trademark S.a.r.l.
On July 27, 2005, Telecom Italia S.p.A. acquired 49% of the share capital of Luna Rossa Challenge 2007 S.L.,a Spanish-registered company, by subscribing to a share capital increase reserved for Telecom Italia S.p.A.for approximately €2 million.
On July 28, 2005, Telecom Italia purchased 49% of the share capital of Luna Rossa Trademark S.a.r.l., aLuxembourg-registered company, from Prada S.A. for €10 million.
Sale of CMobil CZ
Under the process for the rationalization of the international investment portfolio, on March 24, 2005, TIMfinalized the sale of 7.16% of the share capital of CMobil CZ (a Dutch holding company which has a 60.8%stake in T-Mobile CZ) to T-Mobile Global Holding. This investment corresponded to an indirect interest of4.35% in T-Mobile CZ, one of the largest mobile operators in the Czech Republic. The sales price was€70.5 million on which a gain was realized of approximately €61 million.
Investments in associates accounted for using the equity method are detailed as follows:
As ofDecember 31,
2004 Investments
Disposals andcapital
reimbursements
Valuationusing the
equitymethod
Reclassificationsand other changes
As ofDecember 31,
2005(millions of Euro)
AVEA I.H.A.S. . . . . . . . . . . — 122 — (122) — —Brasil Telecom
Participações . . . . . . . . — — — (2) 23 21ETECSA. . . . . . . . . . . . . . . . . 290 — — 39 — 329Italtel Group . . . . . . . . . . . 32 — — 6 — 38Siemens Informatica . . . 14 — — (10) — 4Solpart Participações . . . — — (17) 142 89 214Tiglio I . . . . . . . . . . . . . . . . . 153 — (41) (17) — 95Tiglio II . . . . . . . . . . . . . . . . 60 — (33) (10) — 17Other . . . . . . . . . . . . . . . . . . . 36 14 (7) 4 — 47
Total . . . . . . . . . . . . . . . . . . . 585 136 (98) 30 112 765
F-46

Financial Statements Notes To Consolidated Financial Statements
As ofDecember 31,
2005 Investments
Disposals andcapital
reimbursements
Valuationusing the
equitymethod
Reclassificationsand other changes
As ofDecember 31,
2006(millions of Euro)
Brasil TelecomParticipações . . . . . . . . 21 — — 1 (22) —
ETECSA. . . . . . . . . . . . . . . . . 329 — — (18) — 311Italtel Group . . . . . . . . . . . 38 — — 5 — 43Siemens Informatica . . . 4 — — (4) — —Solpart Participações . . . 214 — — 2 (216) —Tiglio I . . . . . . . . . . . . . . . . . 95 — (24) (2) — 69Tiglio II . . . . . . . . . . . . . . . . 17 — (11) (2) — 4Other . . . . . . . . . . . . . . . . . . . 47 1 (3) (1) — 44
Total . . . . . . . . . . . . . . . . . . . 765 1 (38) (19) (238) 471
The decrease of €294 million from December 31, 2005 mainly related to Solpart Participações and Brasil TelecomParticipações.
On October 27, 2006, following approval by the Brazilian Telecommunications Authority (ANATEL), the 38% stakein Solpart Participações (the controlling holding company of Brasil Telecom Participações) was transferred toBrasilco S.r.l., a newly incorporated Italian company held by a trust set-up under British law, with Telecom ItaliaInternational as the beneficiary. The investment in Solpart Participações is now held and managed, throughBrasilco S.r.l., by Credit Suisse as a trustee but Telecom Italia International will be the sole beneficiary of the trustand, consequently, of the earnings deriving from the investment in Solpart, including the price of its future sale.
As a result of this transaction, the Telecom Italia Group effectively disposed of its ownership interest in theinvestment in Solpart Participações (although it remains the beneficiary) and the governance rights derivingthereof thus resolving the question concerning the overlapping of mobile and long-distance licenses held by theTim Brasil group and Brasil Telecom group, to the benefit of all parties concerned, including the same BrasilTelecom and its shareholders.
Following the decision to dispose of the investments in Solpart Participações and Brasil Telecom Participações(both held by Telecom Italia International), and appointing JP Morgan as sales agent, the carrying amount of thetwo investments, as of September 30, 2006, were reclassified to “discontinued operations/assets held for sale”.
The value of the investment in ETECSA includes €64 million of residual goodwill, being the excess of the carryingamount over the corresponding share of net assets acquired.
The investment in Italtel Group S.p.A. in 2005 was recorded in investments in associates accounted for using theequity method because, although the Group owns a 19.37% stake (below 20% of the voting rights exercisable),Telecom Italia S.p.A. exercises significant influence through the rights attributed to it by the shareholders’agreements.
On June 21, 2006, the Board of Directors of Italtel Group S.p.A. voted not to proceed with the project to list theshares of the company on the Italian stock exchange in the immediate future as resolved by the shareholders’meeting held on February 27, 2006.
The valuation using the equity method includes the share of profits (losses) for the year and the differencesarising from the translation of foreign company financial statements. The 2006 consolidated statement of incomewas particularly impacted by ETECSA (€47 million) and other companies (€4 million) and in 2005 by Avea I.H.A.S.(-€122 million), ETECSA (€45 million), Solpart Participações (€94 million) and other companies (-€10 million).
F-47

Financial Statements Notes To Consolidated Financial Statements
Aggregate 2006 and 2005 data relating to the major associates, prepared in accordance with IFRS, based on theTelecom Italia Group’s share, is as follows:
As of December 31,2006 2005(millions of Euro)
Total assets . . . . . . . . . . . . . . . . . . . . . . . . . . . . . . . . . . . . . . . . . . . . . . . . . . . . . . . . . . . . . . . . . . . 1,173 4,961
Total liabilities . . . . . . . . . . . . . . . . . . . . . . . . . . . . . . . . . . . . . . . . . . . . . . . . . . . . . . . . . . . . . . . . . 740 2,606
Revenues . . . . . . . . . . . . . . . . . . . . . . . . . . . . . . . . . . . . . . . . . . . . . . . . . . . . . . . . . . . . . . . . . . . . . . 498 2,278
Net income (loss) for the year . . . . . . . . . . . . . . . . . . . . . . . . . . . . . . . . . . . . . . . . . . . . . . . . . 67 (114)
Investments in joint ventures include the investments in Perseo S.r.l. and Sofora Telecomunicaciones S.A., inwhich 50% stakes are held.
The investment in Sofora Telecomunicaciones S.A. is accounted for using the equity method. From 2001 to 2004,following the monetary crisis in Argentina, the net equity of the company, which controls the Telecom Argentinagroup, was negative and the carrying amount, including the goodwill acquired, was written off. In 2005, the netequity of the Sofora group again became positive as a result of restructuring a part of the Telecom Argentinagroup’s debt and, consequently, the carrying amount was proportionally adjusted for the Group’s share ofownership (€16 million). In 2006, the value of the investment was adjusted by €1 million bringing the investmentvalue to €17 million at December 31, 2006. However, the impairment loss has not been reversed since all theconditions which led to the impairment of the investment in previous years have not been eliminated.
Aggregate 2006 and 2005 data, based on the Telecom Italia Group’s share, is as follows:
As of December 31,2006 2005(millions of Euro)
Non-current assets . . . . . . . . . . . . . . . . . . . . . . . . . . . . . . . . . . . . . . . . . . . . . . . . . . . . . . . . . . . . 825 938Current assets . . . . . . . . . . . . . . . . . . . . . . . . . . . . . . . . . . . . . . . . . . . . . . . . . . . . . . . . . . . . . . . . . 307 269
Total assets . . . . . . . . . . . . . . . . . . . . . . . . . . . . . . . . . . . . . . . . . . . . . . . . . . . . . . . . . . . . . . . . . . 1,132 1,207
Non-current liabilities . . . . . . . . . . . . . . . . . . . . . . . . . . . . . . . . . . . . . . . . . . . . . . . . . . . . . . . . . 500 767Current liabilities . . . . . . . . . . . . . . . . . . . . . . . . . . . . . . . . . . . . . . . . . . . . . . . . . . . . . . . . . . . . . . 477 299
Total liabilities . . . . . . . . . . . . . . . . . . . . . . . . . . . . . . . . . . . . . . . . . . . . . . . . . . . . . . . . . . . . . . . 977 1,066
Revenues . . . . . . . . . . . . . . . . . . . . . . . . . . . . . . . . . . . . . . . . . . . . . . . . . . . . . . . . . . . . . . . . . . . . . . 971 787
Operating income . . . . . . . . . . . . . . . . . . . . . . . . . . . . . . . . . . . . . . . . . . . . . . . . . . . . . . . . . . . . . 113 65
Income before taxes . . . . . . . . . . . . . . . . . . . . . . . . . . . . . . . . . . . . . . . . . . . . . . . . . . . . . . . . . . . 32 207
Net income for the year . . . . . . . . . . . . . . . . . . . . . . . . . . . . . . . . . . . . . . . . . . . . . . . . . . . . . 29 54
The list of investments accounted for using the equity method is presented in “Note 45—List of companies of theTelecom Italia Group”.
F-48

Financial Statements Notes To Consolidated Financial Statements
Other investments refer to the following:
As ofDecember 31,
2004
Discontinuedoperations/assets held
for saleNew
Investments
Disposals andcapital
reimbursements
Valuationat fairvalue
Reclassificationsand otherchanges
As ofDecember 31,
2005(millions of Euro)
Brasil TelecomParticipações . . . . . . 17 — — — — (17) —
CMobil . . . . . . . . . . . . . . . 9 — — (9) — — —Consortium . . . . . . . . . . . 20 — — — — — 20Euskaltel . . . . . . . . . . . . . 13 — — (13) — — —Fin. Priv. . . . . . . . . . . . . . . 15 — — — — — 15Forthnet . . . . . . . . . . . . . . 10 — — (10) — — —MCC . . . . . . . . . . . . . . . . . . 36 — — — — — 36Mediobanca . . . . . . . . . . 168 — — — 59 — 227Neuf Telecom . . . . . . . . 51 — — — — — 51Oger Telecom . . . . . . . . — — 178 — — — 178Sia . . . . . . . . . . . . . . . . . . . 11 — — — — — 11Solpart
Participações . . . . . . 95 — — — — (95) —Other . . . . . . . . . . . . . . . . . 34 (11) 4 (4) — — 23
Total . . . . . . . . . . . . . . . . . 479 (11) 182 (36) 59 (112) 561
As ofDecember 31,
2005
Discontinuedoperations/assets held
for saleNew
Investments
Disposals andcapital
reimbursements
Valuationat fairvalue
Reclassificationsand otherchanges
As ofDecember 31,
2006(millions of Euro)
Capitalia . . . . . . . . . . . . . . — — — — 39 36 75Consortium . . . . . . . . . . . 20 — — (2) — (18) —Fin. Priv. . . . . . . . . . . . . . . 15 — — — — — 15Assicurazioni
Generali . . . . . . . . . . . — — — — 1 4 5MCC . . . . . . . . . . . . . . . . . . 36 — — — — (36) —Mediobanca . . . . . . . . . . 227 — — — 26 14 267Neuf Telecom . . . . . . . . 51 — — (51) — — —New Satellite Radio . . . — — 7 — — — 7Oger Telecom . . . . . . . . 178 — 197 — — — 375Sia . . . . . . . . . . . . . . . . . . . 11 — — — — — 11Other . . . . . . . . . . . . . . . . . 23 — 1 (3) — — 21
Total . . . . . . . . . . . . . . . . . 561 — 205 (56) 66 — 776
The increase of €215 million compared to December 31, 2005 is mainly due to the investment in Oger Telecomand the fair value adjustment to the investments in Capitalia and Mediobanca, partly offset by the sale of NeufTélécom.
On May 26, 2006, the meeting of the parties to the Mediobanca shareholders’ agreement approved the earlydissolution of the investment company Consortium S.r.l. and assigned direct ownership of the Mediobanca andAssicurazioni Generali shares to the shareholders, in proportion to their respective stakes in the investmentcompany. The transaction took place in over the counter market with settlement deferred and compensatedthrough the distribution of profits and reserves by Consortium S.r.l. in July 2006. The net proceeds amount to€5 million.
After this transaction, Telecom Italia holds a 0.01% stake in Assicurazioni Generali and a 1.84% interest inMediobanca.
F-49

Financial Statements Notes To Consolidated Financial Statements
On May 11, 2006, the entire stake held in Neuf Télécom by Telecom Italia International (equal to about 4.99% ofshare capital) was sold to Louis Dreyfus and Société Française du Radiotéléphone for €199 million, realizing a gainof €148 million.
Effective January 1, 2006, MCC S.p.A. was non-proportionally partially spun-off to Capitalia S.p.A. by assigning apart of the equity of MCC S.p.A. to the beneficiary Capitalia S.p.A. with allocation of its shares, deriving from thereserved capital increase, to the minority shareholders of MCC S.p.A.. After this transaction, the shares ofCapitalia S.p.A., since the company is listed, were measured at fair value and the fair value adjustment wasrecognized in a specific reserve under equity.
Financial receivables and other non-current financial assets decreased by €309 million compared toDecember 31, 2005. The composition is as follows:
As of December 31,2006 2005(millions of Euro)
Financial receivables for lessors’ net investments . . . . . . . . . . . . . . . . . . . . . . . . . . . . . . 229 212Loans to employees . . . . . . . . . . . . . . . . . . . . . . . . . . . . . . . . . . . . . . . . . . . . . . . . . . . . . . . . . . . 70 79Hedging derivatives relating to hedged items classified as non-current assets/
liabilities of a financial nature . . . . . . . . . . . . . . . . . . . . . . . . . . . . . . . . . . . . . . . . . . . . . . . 243 276Other financial receivables . . . . . . . . . . . . . . . . . . . . . . . . . . . . . . . . . . . . . . . . . . . . . . . . . . . . . 137 421
Total . . . . . . . . . . . . . . . . . . . . . . . . . . . . . . . . . . . . . . . . . . . . . . . . . . . . . . . . . . . . . . . . . . . . . . . . . . 679 988
Financial receivables for lessors’ net investments refer to:
– Teleleasing lease contracts directly negotiated with customers and guaranteed by Telecom Italia S.p.A.;
– medium/long-term portion of contracts which provide for the finance lease, of assets to customerswhich the Group has available under finance leaseback contracts, with the performance of accessoryservices under the “full rent” formula.
The total amount (non-current and current portions) of these receivables are as follows:
As of December 31,2006 2005(millions of Euro)
Non-current portion . . . . . . . . . . . . . . . . . . . . . . . . . . . . . . . . . . . . . . . . . . . . . . . . . . . . . . . . . . . 229 212Current portion . . . . . . . . . . . . . . . . . . . . . . . . . . . . . . . . . . . . . . . . . . . . . . . . . . . . . . . . . . . . . . . . 148 122
Total . . . . . . . . . . . . . . . . . . . . . . . . . . . . . . . . . . . . . . . . . . . . . . . . . . . . . . . . . . . . . . . . . . . . . . . . . . 377 334
Hedging derivatives relating to hedged items classified in non-current assets and liabilities of a financial naturerefer to the accrued income component of the derivatives.
Additional information is provided in the “Note 24—Financial instruments”.
Other financial receivables decreased from €421 million at December 31, 2005 to €137 million mainly as a resultof the reclassification of €309 million to cash from the escrow account at ABN Amro. This amount becameavailable since the conditions for the contractual commitments with Opportunity did not occur. At December 31,2006 such receivables include:
– €68 million relating to cash collateral with Goldman Sachs to guarantee the two Cross Currency InterestRate Swap contracts;
– €22 million for the non-current portion of the remaining receivable due from PTT Srbija on the sale ofTelekom Srbija;
– €24 million for loans made to Aree Urbane S.r.l..
F-50

Financial Statements Notes To Consolidated Financial Statements
Miscellaneous receivables and other non-current assets increased from €825 million at December 31, 2005to €871 million and include:
– the fair value of the two call options on 50% of Sofora Telecomunicaciones share capital for€190 million (€160 million at December 31, 2005);
– the remaining receivable on the sale of 100% of Gruppo Buffetti for €6 million;
– the tax credit from the advance payment of taxes on the provision for employee severance indemnitiesof €19 million (€35 million at December 31, 2005);
– medium/long-term prepaid expenses of €511 million (€467 million at December 31, 2005) relating tothe deferral of costs in conjunction with the recognition of revenues.
NOTE 9—DEFERRED TAX ASSETS AND DEFERRED TAX LIABILITIES
Net deferred tax assets decreased from €2,656 million at December 31, 2005 to €718 million and are presented inthe balance sheet as follows:
As of December 31,2006 2005(millions of Euro)
Deferred tax assets . . . . . . . . . . . . . . . . . . . . . . . . . . . . . . . . . . . . . . . . . . . . . . . . . . . . . . . . . . . . 912 2,793Deferred tax liabilities . . . . . . . . . . . . . . . . . . . . . . . . . . . . . . . . . . . . . . . . . . . . . . . . . . . . . . . . . (194) (137)
Total . . . . . . . . . . . . . . . . . . . . . . . . . . . . . . . . . . . . . . . . . . . . . . . . . . . . . . . . . . . . . . . . . . . . . . . . . . 718 2,656
Deferred tax assets and liabilities are offset in the financial statements when the income taxes are levied by thesame tax authority and where there is a legally enforceable right of offset. The gross amounts are as follows:
As of December 31,2006 2005(millions of Euro)
Deferred tax assets . . . . . . . . . . . . . . . . . . . . . . . . . . . . . . . . . . . . . . . . . . . . . . . . . . . . . . . . . . . . 1,714 3,118Deferred tax liabilities . . . . . . . . . . . . . . . . . . . . . . . . . . . . . . . . . . . . . . . . . . . . . . . . . . . . . . . . . (996) (462)
Total . . . . . . . . . . . . . . . . . . . . . . . . . . . . . . . . . . . . . . . . . . . . . . . . . . . . . . . . . . . . . . . . . . . . . . . . . . 718 2,656
Changes in deferred tax assets and liabilities gave rise to a deferred tax charge for the year ended December 31,2006 of €1,837 million (see “Note 38—Income taxes” for additional details on the tax charge). The tax effect onincome and losses recognized directly in equity in 2006 is a charge of €83 million and mainly relates to the fairvalue adjustment of the hedging derivative instruments.
The other changes during the year in deferred taxes which did not have an effect on net income mainly related tothe reduction in deferred tax liabilities recorded on the business combinations recognized according to IFRS 3 (€5million, of which €3 million relates to the purchase of Elefante TV-Delta TV and €2 million to the purchase ofLiberty Surf Group S.A.).
F-51
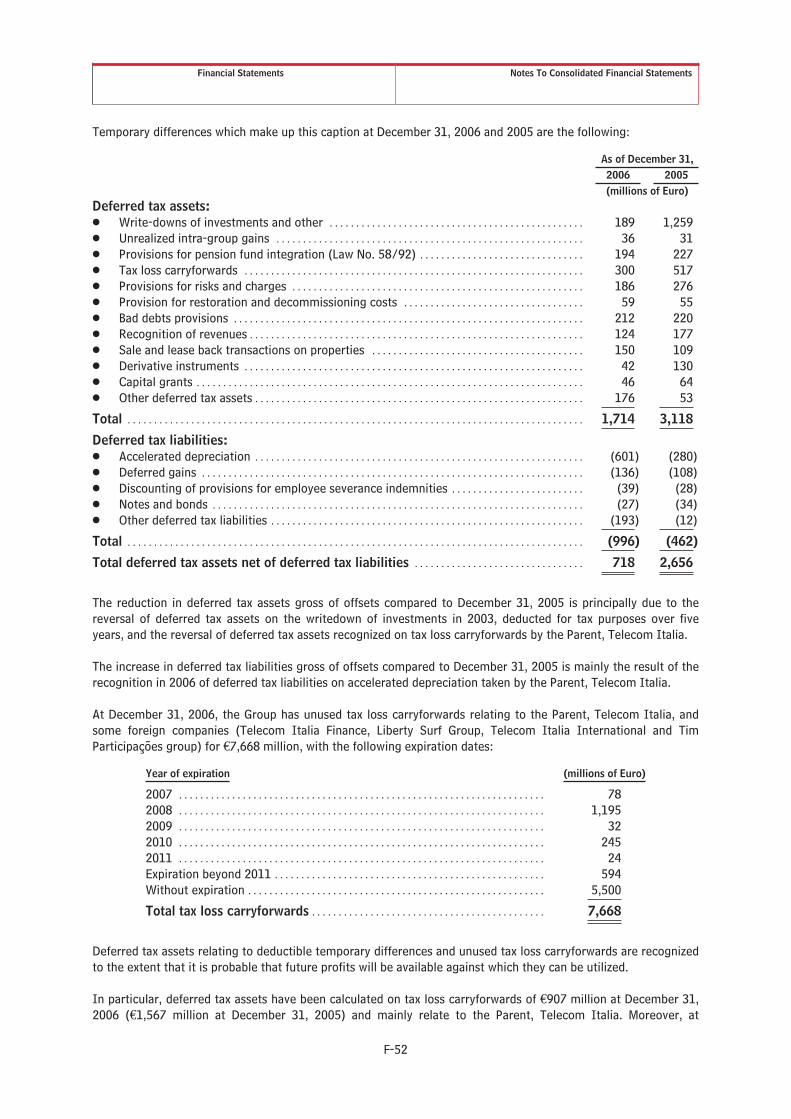
Financial Statements Notes To Consolidated Financial Statements
Temporary differences which make up this caption at December 31, 2006 and 2005 are the following:
As of December 31,2006 2005(millions of Euro)
Deferred tax assets:Š Write-downs of investments and other . . . . . . . . . . . . . . . . . . . . . . . . . . . . . . . . . . . . . . . . . . . . . . . . 189 1,259Š Unrealized intra-group gains . . . . . . . . . . . . . . . . . . . . . . . . . . . . . . . . . . . . . . . . . . . . . . . . . . . . . . . . . . 36 31Š Provisions for pension fund integration (Law No. 58/92) . . . . . . . . . . . . . . . . . . . . . . . . . . . . . . . 194 227Š Tax loss carryforwards . . . . . . . . . . . . . . . . . . . . . . . . . . . . . . . . . . . . . . . . . . . . . . . . . . . . . . . . . . . . . . . . 300 517Š Provisions for risks and charges . . . . . . . . . . . . . . . . . . . . . . . . . . . . . . . . . . . . . . . . . . . . . . . . . . . . . . . 186 276Š Provision for restoration and decommissioning costs . . . . . . . . . . . . . . . . . . . . . . . . . . . . . . . . . . 59 55Š Bad debts provisions . . . . . . . . . . . . . . . . . . . . . . . . . . . . . . . . . . . . . . . . . . . . . . . . . . . . . . . . . . . . . . . . . . 212 220Š Recognition of revenues . . . . . . . . . . . . . . . . . . . . . . . . . . . . . . . . . . . . . . . . . . . . . . . . . . . . . . . . . . . . . . . 124 177Š Sale and lease back transactions on properties . . . . . . . . . . . . . . . . . . . . . . . . . . . . . . . . . . . . . . . . 150 109Š Derivative instruments . . . . . . . . . . . . . . . . . . . . . . . . . . . . . . . . . . . . . . . . . . . . . . . . . . . . . . . . . . . . . . . . 42 130Š Capital grants . . . . . . . . . . . . . . . . . . . . . . . . . . . . . . . . . . . . . . . . . . . . . . . . . . . . . . . . . . . . . . . . . . . . . . . . . 46 64Š Other deferred tax assets . . . . . . . . . . . . . . . . . . . . . . . . . . . . . . . . . . . . . . . . . . . . . . . . . . . . . . . . . . . . . . 176 53
Total . . . . . . . . . . . . . . . . . . . . . . . . . . . . . . . . . . . . . . . . . . . . . . . . . . . . . . . . . . . . . . . . . . . . . . . . . . . . . . . . . . . . . . 1,714 3,118
Deferred tax liabilities:Š Accelerated depreciation . . . . . . . . . . . . . . . . . . . . . . . . . . . . . . . . . . . . . . . . . . . . . . . . . . . . . . . . . . . . . . (601) (280)Š Deferred gains . . . . . . . . . . . . . . . . . . . . . . . . . . . . . . . . . . . . . . . . . . . . . . . . . . . . . . . . . . . . . . . . . . . . . . . . (136) (108)Š Discounting of provisions for employee severance indemnities . . . . . . . . . . . . . . . . . . . . . . . . . (39) (28)Š Notes and bonds . . . . . . . . . . . . . . . . . . . . . . . . . . . . . . . . . . . . . . . . . . . . . . . . . . . . . . . . . . . . . . . . . . . . . . (27) (34)Š Other deferred tax liabilities . . . . . . . . . . . . . . . . . . . . . . . . . . . . . . . . . . . . . . . . . . . . . . . . . . . . . . . . . . . (193) (12)
Total . . . . . . . . . . . . . . . . . . . . . . . . . . . . . . . . . . . . . . . . . . . . . . . . . . . . . . . . . . . . . . . . . . . . . . . . . . . . . . . . . . . . . . (996) (462)
Total deferred tax assets net of deferred tax liabilities . . . . . . . . . . . . . . . . . . . . . . . . . . . . . . . . 718 2,656
The reduction in deferred tax assets gross of offsets compared to December 31, 2005 is principally due to thereversal of deferred tax assets on the writedown of investments in 2003, deducted for tax purposes over fiveyears, and the reversal of deferred tax assets recognized on tax loss carryforwards by the Parent, Telecom Italia.
The increase in deferred tax liabilities gross of offsets compared to December 31, 2005 is mainly the result of therecognition in 2006 of deferred tax liabilities on accelerated depreciation taken by the Parent, Telecom Italia.
At December 31, 2006, the Group has unused tax loss carryforwards relating to the Parent, Telecom Italia, andsome foreign companies (Telecom Italia Finance, Liberty Surf Group, Telecom Italia International and TimParticipações group) for €7,668 million, with the following expiration dates:
Year of expiration (millions of Euro)
2007 . . . . . . . . . . . . . . . . . . . . . . . . . . . . . . . . . . . . . . . . . . . . . . . . . . . . . . . . . . . . . . . . . . . . . 782008 . . . . . . . . . . . . . . . . . . . . . . . . . . . . . . . . . . . . . . . . . . . . . . . . . . . . . . . . . . . . . . . . . . . . . 1,1952009 . . . . . . . . . . . . . . . . . . . . . . . . . . . . . . . . . . . . . . . . . . . . . . . . . . . . . . . . . . . . . . . . . . . . . 322010 . . . . . . . . . . . . . . . . . . . . . . . . . . . . . . . . . . . . . . . . . . . . . . . . . . . . . . . . . . . . . . . . . . . . . 2452011 . . . . . . . . . . . . . . . . . . . . . . . . . . . . . . . . . . . . . . . . . . . . . . . . . . . . . . . . . . . . . . . . . . . . . 24Expiration beyond 2011 . . . . . . . . . . . . . . . . . . . . . . . . . . . . . . . . . . . . . . . . . . . . . . . . . . . 594Without expiration . . . . . . . . . . . . . . . . . . . . . . . . . . . . . . . . . . . . . . . . . . . . . . . . . . . . . . . . 5,500
Total tax loss carryforwards . . . . . . . . . . . . . . . . . . . . . . . . . . . . . . . . . . . . . . . . . . . . 7,668
Deferred tax assets relating to deductible temporary differences and unused tax loss carryforwards are recognizedto the extent that it is probable that future profits will be available against which they can be utilized.
In particular, deferred tax assets have been calculated on tax loss carryforwards of €907 million at December 31,2006 (€1,567 million at December 31, 2005) and mainly relate to the Parent, Telecom Italia. Moreover, at
F-52

Financial Statements Notes To Consolidated Financial Statements
December 31, 2006, deferred tax assets of €2,124 million have not been recognized on unused tax losses of€6,761 million since their recoverability is not considered probable (€5,737 million at December 31, 2005).
At December 31, 2006, deferred taxes have not been recognized on tax-suspension reserves, subject to taxation inthe event of distribution or utilization, in that their distribution or utilization is not foreseen.
Deferred taxes have not been recognized on the undistributed earnings of subsidiaries and associates in that thetax system of their parents provide for the participation exemption.
NOTE 10—INVENTORIES
Inventories decreased from €294 million at December 31, 2005 to €291 million. The composition of inventories isas follows:
As of December 31,2006 2005(millions of Euro)
Raw materials and supplies . . . . . . . . . . . . . . . . . . . . . . . . . . . . . . . . . . . . . . . . . . . . . . . . . . . . 5 8Work in progress and semi-finished products . . . . . . . . . . . . . . . . . . . . . . . . . . . . . . . . . . 13 24Finished goods . . . . . . . . . . . . . . . . . . . . . . . . . . . . . . . . . . . . . . . . . . . . . . . . . . . . . . . . . . . . . . . . 273 262
Total . . . . . . . . . . . . . . . . . . . . . . . . . . . . . . . . . . . . . . . . . . . . . . . . . . . . . . . . . . . . . . . . . . . . . . . . . . 291 294
Inventories are mainly held by Telecom Italia S.p.A. (€125 million) and the companies in the Brazil MobileBusiness Unit (€58 million). They mainly consist of equipment, handsets and related fixed and mobiletelecommunications accessories. Another €88 million relates to the Olivetti Business Unit for office products,specialized printers and gaming terminals.
Writedowns of inventories made in 2006 total €31 million (€26 million in 2005) and mainly refer to theadjustment of equipment and fixed and mobile telephone handsets of Telecom Italia S.p.A. to estimated realizablevalue (€22 million) and writedowns to the realizable value recorded by Olivetti S.p.A. (€8 million).
No inventories are pledged as collateral.
NOTE 11—TRADE AND MISCELLANEOUS RECEIVABLES AND OTHER CURRENT ASSETS
Trade and miscellaneous receivables and other current assets decreased from €8,856 million atDecember 31, 2005 to €8,748 million and consist of the following:
As of December 31,2006 2005(millions of Euro)
Receivables for construction contracts . . . . . . . . . . . . . . . . . . . . . . . . . . . . . . . . . . . . 12 37
Trade receivables:Š Receivables from customers . . . . . . . . . . . . . . . . . . . . . . . . . . . . . . . . . . . . . . . . . . . . . . 5,731 5,960Š Receivables from other telecommunication operators . . . . . . . . . . . . . . . . . . . . . 1,638 978
7,369 6,938
Miscellaneous receivables and other current assets:Š Other receivables . . . . . . . . . . . . . . . . . . . . . . . . . . . . . . . . . . . . . . . . . . . . . . . . . . . . . . . . . 972 1,533Š Trade and miscellaneous prepaid expenses . . . . . . . . . . . . . . . . . . . . . . . . . . . . . . . . 395 348
1,367 1,881
Total . . . . . . . . . . . . . . . . . . . . . . . . . . . . . . . . . . . . . . . . . . . . . . . . . . . . . . . . . . . . . . . . . . . . . . . . . . 8,748 8,856
Receivables for construction contracts of €12 million mainly refer to Telecom Italia S.p.A. for networkequipment, Lombardy Region health cards and works related to telephone installations customized for customers.They also include advances to suppliers of €2 million.
F-53

Financial Statements Notes To Consolidated Financial Statements
Trade receivables amount to €7,369 million (€6,938 million at December 31, 2005), and are net of the provisionfor bad debts of €791 million (€773 million at December 31, 2005).
The increase in trade receivables from December 31, 2005 is principally the result of a different presentation ofreceivables due from other mobile operators which, partly as a result of the revision of the contracts that,following the integration of fixed-mobile operations, are no longer shown net of the corresponding liability.
The caption also includes €3 million (€4 million at December 31, 2005) of medium/long-term trade receivablesdue from customers.
Trade receivables specifically refer to Telecom Italia S.p.A. (€5,542 million) and the foreign mobile telephonecompanies (€872 million).
Movements in the provision for bad debts are as follows:
2006 2005(millions of Euro)
At January 1 . . . . . . . . . . . . . . . . . . . . . . . . . . . . . . . . . . . . . . . . . . . . . . . . . . . . . . . . . . . . . . . . . 773 897Discontinued operations/assets held for sale . . . . . . . . . . . . . . . . . . . . . . . . . . . . . . . . . . . — (132)Charge to the statement of income . . . . . . . . . . . . . . . . . . . . . . . . . . . . . . . . . . . . . . . . . . . . 252 264Utilization . . . . . . . . . . . . . . . . . . . . . . . . . . . . . . . . . . . . . . . . . . . . . . . . . . . . . . . . . . . . . . . . . . . . . (212) (264)Release of the provision in excess of requirements . . . . . . . . . . . . . . . . . . . . . . . . . . . . . (17) (15)Exchange differences and other changes . . . . . . . . . . . . . . . . . . . . . . . . . . . . . . . . . . . . . . . (5) 23
At December 31 . . . . . . . . . . . . . . . . . . . . . . . . . . . . . . . . . . . . . . . . . . . . . . . . . . . . . . . . . . . . . 791 773
Other receivables amount to €972 million (€1,533 million at December 31, 2005) and are net of a provision of€52 million. Details are as follows:
As of December 31,2006 2005(millions of Euro)
Advances to suppliers . . . . . . . . . . . . . . . . . . . . . . . . . . . . . . . . . . . . . . . . . . . . . . . . . . . . . . . . . 144 60Receivables from employees . . . . . . . . . . . . . . . . . . . . . . . . . . . . . . . . . . . . . . . . . . . . . . . . . . . 33 55Tax receivables . . . . . . . . . . . . . . . . . . . . . . . . . . . . . . . . . . . . . . . . . . . . . . . . . . . . . . . . . . . . . . . . 223 230Receivables on the sales of consolidated investments . . . . . . . . . . . . . . . . . . . . . . . . . . 4 28Sundry items . . . . . . . . . . . . . . . . . . . . . . . . . . . . . . . . . . . . . . . . . . . . . . . . . . . . . . . . . . . . . . . . . . 568 1,160
Total . . . . . . . . . . . . . . . . . . . . . . . . . . . . . . . . . . . . . . . . . . . . . . . . . . . . . . . . . . . . . . . . . . . . . . . . . . 972 1,533
Advances to suppliers increased by €84 million mainly due to advances paid to the supplier Ericsson (€61 million)on the contract for software updates for the GSM/EGPRS/UMTS networks for the Telecom Italia S.p.A. mobilenetwork for the three years 2006-2008. These advances will be recovered when the invoices are issued for therelease of the software.
Sundry items decreased by €592 million largely on account of the refund from the Tax Authorities, following theruling handed down by the Regional Administrative Court (TAR) of Lazio on July 10, 2006, for the principal portion(€546 million) of the TLC operating fee that Telecom Italia S.p.A. and ex-TIM S.p.A. had paid for the year 1999pursuant to art. 20, Law No. 448/1998.
Sundry items include a receivable from the Tax Authorities (€100 million) for the interest earned up to the date ofthe refund on the above principal portion of the TLC operating fee and receivables from factoring companies(€146 million) following the assignment of receivables mostly due from the sales network.
Trade and miscellaneous prepaid expenses principally pertain to building leases, rentals and maintenance aswell as the deferral of costs related to revenue recognition.
NOTE 12—CURRENT INCOME TAX RECEIVABLES
Current income tax receivables amount to €287 million (€335 million at December 31, 2005) and mainly referto IRES tax receivable on the consolidated national tax return filed by the Telecom Italia Group.
F-54
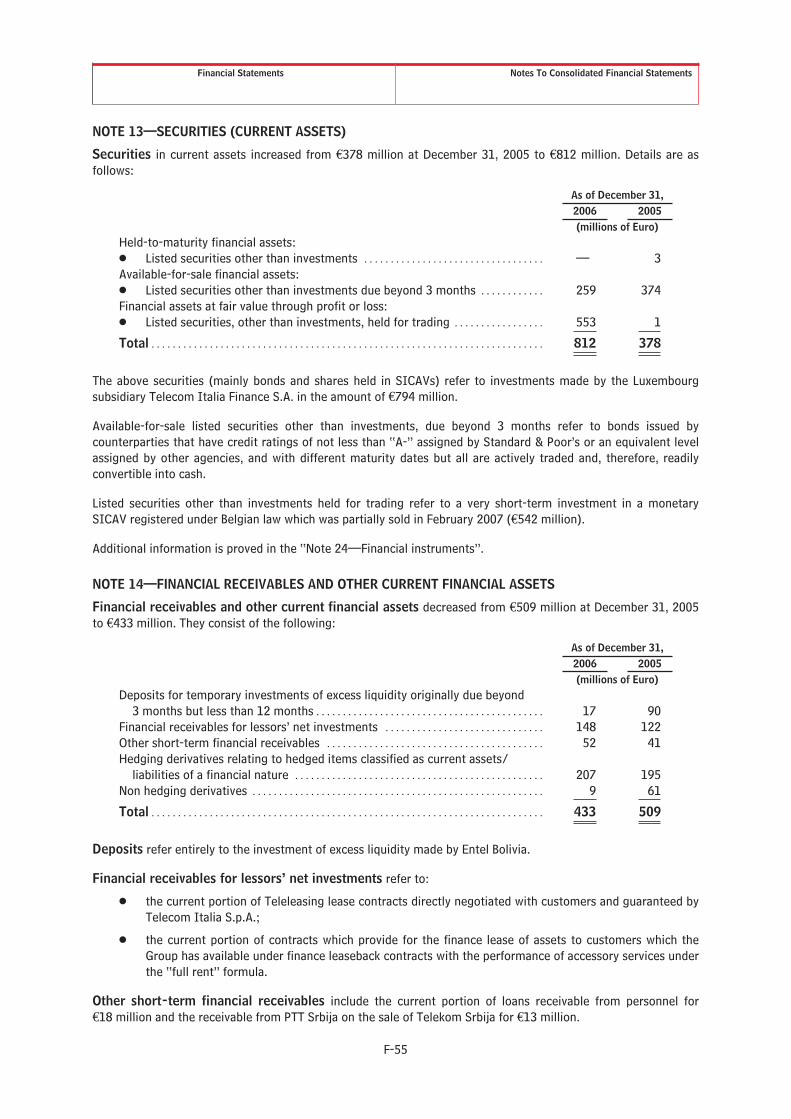
Financial Statements Notes To Consolidated Financial Statements
NOTE 13—SECURITIES (CURRENT ASSETS)
Securities in current assets increased from €378 million at December 31, 2005 to €812 million. Details are asfollows:
As of December 31,2006 2005(millions of Euro)
Held-to-maturity financial assets:Š Listed securities other than investments . . . . . . . . . . . . . . . . . . . . . . . . . . . . . . . . . . — 3Available-for-sale financial assets:Š Listed securities other than investments due beyond 3 months . . . . . . . . . . . . 259 374Financial assets at fair value through profit or loss:Š Listed securities, other than investments, held for trading . . . . . . . . . . . . . . . . . 553 1
Total . . . . . . . . . . . . . . . . . . . . . . . . . . . . . . . . . . . . . . . . . . . . . . . . . . . . . . . . . . . . . . . . . . . . . . . . . . 812 378
The above securities (mainly bonds and shares held in SICAVs) refer to investments made by the Luxembourgsubsidiary Telecom Italia Finance S.A. in the amount of €794 million.
Available-for-sale listed securities other than investments, due beyond 3 months refer to bonds issued bycounterparties that have credit ratings of not less than “A-” assigned by Standard & Poor’s or an equivalent levelassigned by other agencies, and with different maturity dates but all are actively traded and, therefore, readilyconvertible into cash.
Listed securities other than investments held for trading refer to a very short-term investment in a monetarySICAV registered under Belgian law which was partially sold in February 2007 (€542 million).
Additional information is proved in the “Note 24—Financial instruments”.
NOTE 14—FINANCIAL RECEIVABLES AND OTHER CURRENT FINANCIAL ASSETS
Financial receivables and other current financial assets decreased from €509 million at December 31, 2005to €433 million. They consist of the following:
As of December 31,2006 2005(millions of Euro)
Deposits for temporary investments of excess liquidity originally due beyond3 months but less than 12 months . . . . . . . . . . . . . . . . . . . . . . . . . . . . . . . . . . . . . . . . . . . 17 90
Financial receivables for lessors’ net investments . . . . . . . . . . . . . . . . . . . . . . . . . . . . . . 148 122Other short-term financial receivables . . . . . . . . . . . . . . . . . . . . . . . . . . . . . . . . . . . . . . . . . 52 41Hedging derivatives relating to hedged items classified as current assets/
liabilities of a financial nature . . . . . . . . . . . . . . . . . . . . . . . . . . . . . . . . . . . . . . . . . . . . . . . 207 195Non hedging derivatives . . . . . . . . . . . . . . . . . . . . . . . . . . . . . . . . . . . . . . . . . . . . . . . . . . . . . . . 9 61
Total . . . . . . . . . . . . . . . . . . . . . . . . . . . . . . . . . . . . . . . . . . . . . . . . . . . . . . . . . . . . . . . . . . . . . . . . . . 433 509
Deposits refer entirely to the investment of excess liquidity made by Entel Bolivia.
Financial receivables for lessors’ net investments refer to:
Š the current portion of Teleleasing lease contracts directly negotiated with customers and guaranteed byTelecom Italia S.p.A.;
Š the current portion of contracts which provide for the finance lease of assets to customers which theGroup has available under finance leaseback contracts with the performance of accessory services underthe “full rent” formula.
Other short-term financial receivables include the current portion of loans receivable from personnel for€18 million and the receivable from PTT Srbija on the sale of Telekom Srbija for €13 million.
F-55

Financial Statements Notes To Consolidated Financial Statements
Hedging derivatives relating to hedged items classified as current assets/liabilities of a financialnature refer to accrued income on derivatives.
Additional details are provided in the “Note 24—Financial instruments”.
NOTE 15—CASH AND CASH EQUIVALENTS
Cash and cash equivalents decreased from €10,323 million at December 31, 2005 to €7,219 million. Theyconsist of the following:
As of December 31,2006 2005(millions of Euro)
Liquidity with banks, financial institutions and post offices . . . . . . . . . . . . . . . . . . . . . . . . 7,186 9,956Checks . . . . . . . . . . . . . . . . . . . . . . . . . . . . . . . . . . . . . . . . . . . . . . . . . . . . . . . . . . . . . . . . . . . . . . . . . . . 4 —Cash . . . . . . . . . . . . . . . . . . . . . . . . . . . . . . . . . . . . . . . . . . . . . . . . . . . . . . . . . . . . . . . . . . . . . . . . . . . . . 1 2Other receivables and deposits for cash flexibility . . . . . . . . . . . . . . . . . . . . . . . . . . . . . . . . . 1 34Securities other than investments (due within 3 months) . . . . . . . . . . . . . . . . . . . . . . . . . . 27 331
Total . . . . . . . . . . . . . . . . . . . . . . . . . . . . . . . . . . . . . . . . . . . . . . . . . . . . . . . . . . . . . . . . . . . . . . . . . . . . . 7,219 10,323
The decrease in liquidity with banks, financial institutions and post offices from the end of 2005 is mainlydue to the following:
Š repayment of liabilities which became due during the course of 2006;
Š early partial repayment of €3 billion of the Revolving Credit Facility maturing in 2012;
Š payment of dividends.
The different technical forms used for the liquidity as of December 31, 2006 can be further analyzed as follows:
Š maturities: 95% of deposits have a maximum maturity date of one month;
Š counterpart risk: deposits are made with leading banks and financial institutions that have creditratings of not less than “A-” assigned by Standard & Poor’s or an equivalent level assigned by otheragencies;
Š country risk: the geographical location of deposits is principally on major European markets.
Securities other than investments (due within 3 months) include €20 million (€327 million at December 31,2005) of Euro Commercial Paper held by Telecom Italia Finance S.A. maturing within one month. The issuers allhave credit ratings of not less than “A-” assigned by Standard & Poor’s or an equivalent level assigned by otheragencies, and are located in Europe.
NOTE 16—DISCONTINUED OPERATIONS/ASSETS HELD FOR SALE AND LIABILITIES RELATING TODISCONTINUED OPERATIONS/ASSETS HELD FOR SALE
In the balance sheet at December 31, 2006, “Discontinued operations/assets held for sale” include theinvestments in Solpart Participações and Brasil Telecom Participações following the Group’s decision to dispose ofthe investments.
In the statement of income and in the statement of cash flows for the year 2006, the respective captions, “Netincome (loss) from discontinued operations/assets held for sale” and “Cash flows generated by (used in)discontinued operations/assets held for sale” include the relative effects of the divestitures of Gruppo Buffetti(sold in January 2006) and Digitel Venezuela (sold in May 2006). These captions include the results of DigitelVenezuela up to its divestiture (May 2006), the effects of the sale itself (a gain of €31 million net of transactioncharges) and accruals to the provisions for risks and charges relating to the divestitures of Digitel Venezuela (€9million) and Tim Hellas (€30 million).
In the balance sheet at December 31, 2005, “Discontinued operations/assets held for sale” and “Liabilitiesrelating to discontinued operations/assets held for sale” include the balance sheet data of Gruppo Buffetti andDigitel Venezuela (sold in 2006).
F-56

Financial Statements Notes To Consolidated Financial Statements
In the statement of income and in the statement of cash flows for the year 2005, the respective captions, “Netincome (loss) from discontinued operations/assets held for sale” and “Cash flows generated by (used in)discontinued operations/assets held for sale” include the data of the Entel Chile group (sold in March 2005), theFinsiel group and Tim Hellas (sold in June 2005), Tim Perù (sold in August 2005), and Gruppo Buffetti (sold inJanuary 2006) and Digitel Venezuela (sold in May 2006).
In the statement of income and cash flows for the year 2004 the respective captions “Net income (loss) fromdiscontinued operations/assets held for sale” and “Cash flows generated by (used in) discontinued operations/assets held for sale” include the results of the Entel Chile group (sold in March 2005), the Finsiel group and TimHellas (sold in June 2005), Tim Perù (sold in August 2005), the Gruppo Buffetti (sold in January 2006) and DigitelVenezuela (sold in May 2006).
Divestitures in 2006
Gruppo Buffetti
On January 11, 2006, the sale of 100% of the capital of Gruppo Buffetti S.p.A. to Dylog Italia S.p.A. and PalladioFinanziaria S.p.A. was finalized, with a total positive financial effect of €66 million.
There was no effect on the statement of income in 2006 since the carrying amount had already been adjusted tothe sale price at the end of 2005.
Digitel Venezuela
On May 25, 2006, the sale of 100% of the capital of Digitel by Tim International to Telvenco S.A. was finalized at aprice of U.S.$425 million (enterprise value). As a result, there was a reduction in net financial debt ofapproximately €318 million (including the deconsolidation of the net financial debt of the subsidiary sold).
In December 2006, under the contractual commitments guaranteed at the time of sale, Telvenco S.A. notified TimInternational about a tax assessment issued by the local tax authorities on Digitel for approximately U.S.$15million.
Digitel filed an appeal against the assessment for approximately U.S.$10 million, paying the difference of aboutU.S.$5 million in January 2007.
Accordingly, an accrual was made to the provision for risks and charges on investments and corporate-relatedtransactions for about €9 million to take into account not only the amount paid by Digitel but also the interestpayable from the date the payment was due up to the date of payment in addition to the relative penaltiesnormally applied.
Divestitures in 2005
Entel Chile
On March 29, 2005, Telecom Italia sold its 54.76% investment in the Chilean company Entel Chile S.A. toAlmendral S.A. (an investment holding company listed on the stock exchange in Santiago, Chile which representslocal businesses including the Hurtado Vicuña group and the Matte group).
The sale price was U.S.$934 million (€723 million) with a loss of €1 million in addition to €6 million of transactioncharges.
Finsiel
On April 26, 2005, Telecom Italia agreed the sale of its entire interest in Finsiel (79.5%) to the COS group. Thesale was based on an enterprise value of €164 million. The sales terms are as follows:
Š on June 28, 2005, a 59.6% interest was sold for a price of €87 million;
Š on November 7, 2005, the remaining 19.9% was sold for a price of €28 million.
F-57

Financial Statements Notes To Consolidated Financial Statements
The sale had no effect on the statement of income since the carrying amount had previously been adjusted to thesales price.
The residual receivable from the COS group of €26 million was collected in December 2006.
Tim Hellas
On June 15, 2005, Tim International N.V. sold the 80.87% investment in Tim Hellas Telecommunications S.A. to avehicle owned by Apax Partners and Texas Pacific Group (TPG) for a price of €1,114 million corresponding to atotal enterprise value of Tim Hellas of about €1,600 million or approximately €16.43 per share. The sale gave riseto a net gain of €410 million on consolidation.
During 2006, following progress on the legal disputes against Tim Hellas (whose potential negative outcome ispartially guaranteed by Tim International), the provision for risks and charges on investments and corporate-related transactions was increased by €30 million bringing the total to €52 million.
* * *
Tim Perù
On August 10, 2005, Tim International N.V. sold the entire investment in Tim Perù S.A.C. to Sercotel S.A. de C.V.,a company controlled 100% by America Movil S.A. de C.V. at a price of €330 million. The sale gave rise to a netgain on consolidation in 2005 of €120 million (net of the relative transaction charges) and a decrease in netfinancial debt of more than €400 million.
The composition of discontinued operations/assets held for sale (and the related liabilities) is provided inthe following table:
As of December 31,2006 2005(millions of Euro)
Discontinued operations/assets held for sale:Š of a financial nature . . . . . . . . . . . . . . . . . . . . . . . . . . . . . . . . . . . . . . . . . . . . . . . . . . . . . . — 37Š of a non-financial nature . . . . . . . . . . . . . . . . . . . . . . . . . . . . . . . . . . . . . . . . . . . . . . . . . . 235 491
Total . . . . . . . . . . . . . . . . . . . . . . . . . . . . . . . . . . . . . . . . . . . . . . . . . . . . . . . . . . . . . . . . . . . . . . . . . . 235 528
Liabilities relating to discontinued operations/assets held for sale:Š of a financial nature . . . . . . . . . . . . . . . . . . . . . . . . . . . . . . . . . . . . . . . . . . . . . . . . . . . . . . — 143Š of a non-financial nature . . . . . . . . . . . . . . . . . . . . . . . . . . . . . . . . . . . . . . . . . . . . . . . . . . — 142
Total . . . . . . . . . . . . . . . . . . . . . . . . . . . . . . . . . . . . . . . . . . . . . . . . . . . . . . . . . . . . . . . . . . . . . . . . . . — 285
Discontinued operations/assets held for sale of a financial nature refer to:
As of December 31,2006 2005(millions of Euro)
Gruppo Buffetti . . . . . . . . . . . . . . . . . . . . . . . . . . . . . . . . . . . . . . . . . . . . . . . . . . . . . . . . . . . . . . . . — 4Digitel Venezuela . . . . . . . . . . . . . . . . . . . . . . . . . . . . . . . . . . . . . . . . . . . . . . . . . . . . . . . . . . . . . . — 33
— 37
Discontinued operations/assets held for sale of a non-financial nature refer to:
As of December 31,2006 2005(millions of Euro)
Investements in Solpart Participacões and Brasil Telecom Participacões . . . . . . . . 235 —Gruppo Buffetti . . . . . . . . . . . . . . . . . . . . . . . . . . . . . . . . . . . . . . . . . . . . . . . . . . . . . . . . . . . . . . . . — 113Digitel Venezuela . . . . . . . . . . . . . . . . . . . . . . . . . . . . . . . . . . . . . . . . . . . . . . . . . . . . . . . . . . . . . . — 378
235 491
F-58

Financial Statements Notes To Consolidated Financial Statements
At December 31, 2005, this caption includes goodwill of €171 million, of which €12 million refers to GruppoBuffetti (net of the writedown of €7 million to adjust the amount to the sale price) and €158 million to DigitelVenezuela.
Liabilities relating to discontinued operations/assets held for sale of a financial nature refer to:
As of December 31,2006 2005(millions of Euro)
Gruppo Buffetti (current liabilities) . . . . . . . . . . . . . . . . . . . . . . . . . . . . . . . . . . . . . . . . . . . . . — 19Digitel Venezuela (non-current liabilities) . . . . . . . . . . . . . . . . . . . . . . . . . . . . . . . . . . . . . . — 124
— 143
Liabilities relating to discontinued operations/assets held for sale of a non-financial nature refer to:
As of December 31,2006 2005(millions of Euro)
Gruppo Buffetti . . . . . . . . . . . . . . . . . . . . . . . . . . . . . . . . . . . . . . . . . . . . . . . . . . . . . . . . . . . . . . . . — 40Digitel Venezuela . . . . . . . . . . . . . . . . . . . . . . . . . . . . . . . . . . . . . . . . . . . . . . . . . . . . . . . . . . . . . . — 102
— 142
The net income (loss) from discontinued operations/assets held for sale in the statement of income is asfollows:
Year ended December 31,2006 2005 2004
(millions of Euro)Results from discontinued operations/assets held for sale:
Revenues . . . . . . . . . . . . . . . . . . . . . . . . . . . . . . . . . . . . . . . . . . . . . . . . . . . . . . . . . . 121 1,387 2,935Other income . . . . . . . . . . . . . . . . . . . . . . . . . . . . . . . . . . . . . . . . . . . . . . . . . . . . . . — 18 39Operating expenses . . . . . . . . . . . . . . . . . . . . . . . . . . . . . . . . . . . . . . . . . . . . . . . . (89) (1,127) (2,324)Depreciation and amortization, impairment reversals (losses), gains
(losses) on disposals . . . . . . . . . . . . . . . . . . . . . . . . . . . . . . . . . . . . . . . . . . . . (17) (181) (404)
Operating income . . . . . . . . . . . . . . . . . . . . . . . . . . . . . . . . . . . . . . . . . . . . . . . 15 97 246Net financial income (expenses) . . . . . . . . . . . . . . . . . . . . . . . . . . . . . . . . . . . — (22) (64)
Income before taxes from discontinued operations/assetsheld for sale . . . . . . . . . . . . . . . . . . . . . . . . . . . . . . . . . . . . . . . . . . . . . . . . . . . 15 75 182
Income taxes . . . . . . . . . . . . . . . . . . . . . . . . . . . . . . . . . . . . . . . . . . . . . . . . . . . . . . — (31) (81)
Income after taxes from discontinued operations/assetsheld for sale . . . . . . . . . . . . . . . . . . . . . . . . . . . . . . . . . . . . . . . . . . . . . . . . . . . (A) 15 44 101
Results of disposal:Write-downs/provisions relating to assets held for sale . . . . . . . . . . . . (39) (9) (205)Net gain from discontinued operations . . . . . . . . . . . . . . . . . . . . . . . . . . . . . 31 515 —Income taxes . . . . . . . . . . . . . . . . . . . . . . . . . . . . . . . . . . . . . . . . . . . . . . . . . . . . . . — — (14)
(B) (8) 506 (219)
Net income (loss) from discontinued operations/assets held forsale . . . . . . . . . . . . . . . . . . . . . . . . . . . . . . . . . . . . . . . . . . . . . . . . . . . . . . . . . . . . . . . . . (A+B) 7 550 (118)
F-59

Financial Statements Notes To Consolidated Financial Statements
A breakdown of the Income after taxes from discontinued operations/assets held for sale (A) is asfollows:
Year ended December 31,2006 2005 2004
(millions of Euro)Entel Chile group . . . . . . . . . . . . . . . . . . . . . . . . . . . . . . . . . . . . . . . . . . . . . . . . . . — 26 49Finsiel group . . . . . . . . . . . . . . . . . . . . . . . . . . . . . . . . . . . . . . . . . . . . . . . . . . . . . . — (11) (7)Tim Hellas . . . . . . . . . . . . . . . . . . . . . . . . . . . . . . . . . . . . . . . . . . . . . . . . . . . . . . . . — 11 82Tim Perù . . . . . . . . . . . . . . . . . . . . . . . . . . . . . . . . . . . . . . . . . . . . . . . . . . . . . . . . . . — (3) (17)Gruppo Buffetti . . . . . . . . . . . . . . . . . . . . . . . . . . . . . . . . . . . . . . . . . . . . . . . . . . . . — 1 1Digitel Venezuela . . . . . . . . . . . . . . . . . . . . . . . . . . . . . . . . . . . . . . . . . . . . . . . . . . 15 20 (7)
15 44 101
A breakdown of the Results of disposal (B) is as follows:
Year ended December 31,2006 2005 2004
(millions of Euro)Entel Chile group . . . . . . . . . . . . . . . . . . . . . . . . . . . . . . . . . . . . . . . . . . . . . . . . . — (7) (191)Finsiel group . . . . . . . . . . . . . . . . . . . . . . . . . . . . . . . . . . . . . . . . . . . . . . . . . . . . . . — (8) (28)Tim Hellas . . . . . . . . . . . . . . . . . . . . . . . . . . . . . . . . . . . . . . . . . . . . . . . . . . . . . . . . (30) 410 —Tim Perù . . . . . . . . . . . . . . . . . . . . . . . . . . . . . . . . . . . . . . . . . . . . . . . . . . . . . . . . . . — 120 —Gruppo Buffetti . . . . . . . . . . . . . . . . . . . . . . . . . . . . . . . . . . . . . . . . . . . . . . . . . . . . — (9) —Digitel Venezuela . . . . . . . . . . . . . . . . . . . . . . . . . . . . . . . . . . . . . . . . . . . . . . . . . . 22 — —
(8) 506 (219)
Net cash flows from operating, investing and financing activities relating to discontinued operations/assets heldfor sale are as follows:
Total cash flows generated by (used in) discontinued operations/assets held for sale
Year ended December 31,2006 2005 2004
(millions of Euro)Cash flows from operating activities . . . . . . . . . . . . . . . . . . . . . . . . . . . . . . . 33 190 505Cash flows from investing activities . . . . . . . . . . . . . . . . . . . . . . . . . . . . . . . . (10) (124) (336)Cash flows from financing activities . . . . . . . . . . . . . . . . . . . . . . . . . . . . . . . . (36) (40) (278)
Total cash flows generated by (used in) discontinuedoperations/assets held for sale . . . . . . . . . . . . . . . . . . . . . . . . . . . . . . (13) 26 (109)
In particular:
Cash flows from operating activities are as follows:
Year ended December 31,2006 2005 2004
(millions of Euro)Entel Chile group . . . . . . . . . . . . . . . . . . . . . . . . . . . . . . . . . . . . . . . . . . . . . . . . . — 61 289Finsiel group . . . . . . . . . . . . . . . . . . . . . . . . . . . . . . . . . . . . . . . . . . . . . . . . . . . . . . — (12) (45)Tim Hellas . . . . . . . . . . . . . . . . . . . . . . . . . . . . . . . . . . . . . . . . . . . . . . . . . . . . . . . . — 27 143Tim Perù . . . . . . . . . . . . . . . . . . . . . . . . . . . . . . . . . . . . . . . . . . . . . . . . . . . . . . . . . . — 21 40Gruppo Buffetti . . . . . . . . . . . . . . . . . . . . . . . . . . . . . . . . . . . . . . . . . . . . . . . . . . . . — 11 7Digitel Venezuela . . . . . . . . . . . . . . . . . . . . . . . . . . . . . . . . . . . . . . . . . . . . . . . . . . 33 69 58Other, adjustments and eliminations . . . . . . . . . . . . . . . . . . . . . . . . . . . . . . . — 13 13
33 190 505
F-60
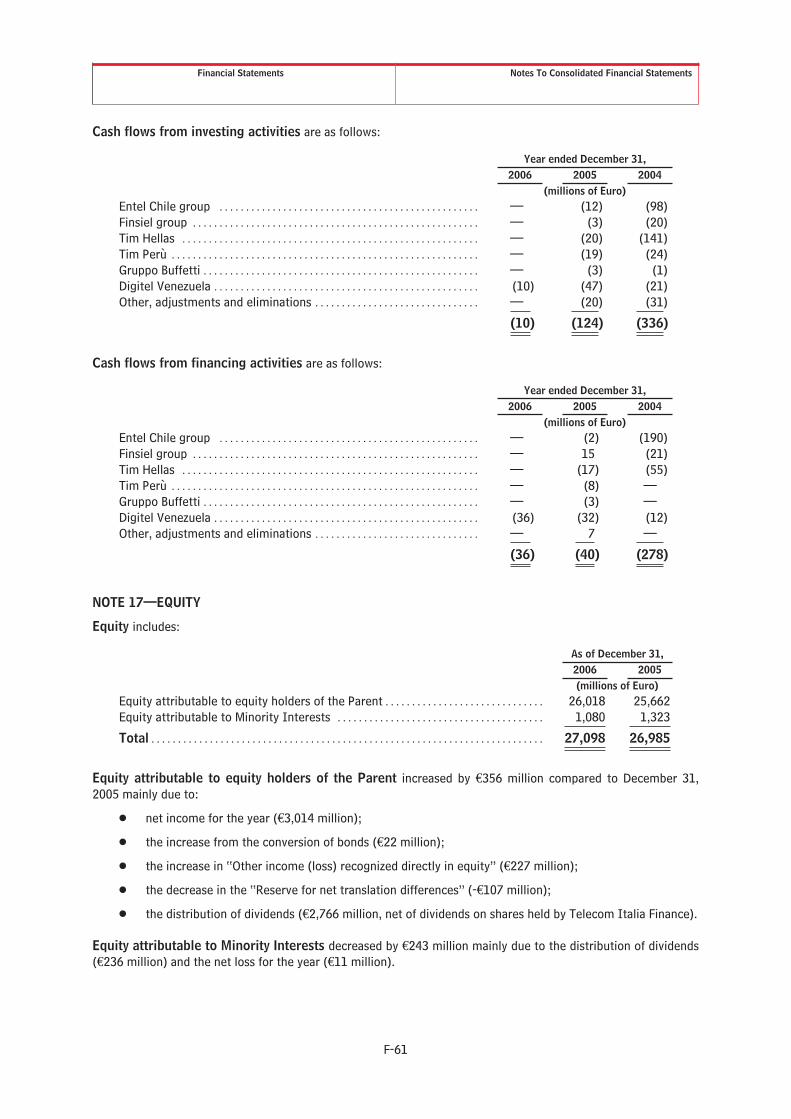
Financial Statements Notes To Consolidated Financial Statements
Cash flows from investing activities are as follows:
Year ended December 31,2006 2005 2004
(millions of Euro)Entel Chile group . . . . . . . . . . . . . . . . . . . . . . . . . . . . . . . . . . . . . . . . . . . . . . . . . — (12) (98)Finsiel group . . . . . . . . . . . . . . . . . . . . . . . . . . . . . . . . . . . . . . . . . . . . . . . . . . . . . . — (3) (20)Tim Hellas . . . . . . . . . . . . . . . . . . . . . . . . . . . . . . . . . . . . . . . . . . . . . . . . . . . . . . . . — (20) (141)Tim Perù . . . . . . . . . . . . . . . . . . . . . . . . . . . . . . . . . . . . . . . . . . . . . . . . . . . . . . . . . . — (19) (24)Gruppo Buffetti . . . . . . . . . . . . . . . . . . . . . . . . . . . . . . . . . . . . . . . . . . . . . . . . . . . . — (3) (1)Digitel Venezuela . . . . . . . . . . . . . . . . . . . . . . . . . . . . . . . . . . . . . . . . . . . . . . . . . . (10) (47) (21)Other, adjustments and eliminations . . . . . . . . . . . . . . . . . . . . . . . . . . . . . . . — (20) (31)
(10) (124) (336)
Cash flows from financing activities are as follows:
Year ended December 31,2006 2005 2004
(millions of Euro)Entel Chile group . . . . . . . . . . . . . . . . . . . . . . . . . . . . . . . . . . . . . . . . . . . . . . . . . — (2) (190)Finsiel group . . . . . . . . . . . . . . . . . . . . . . . . . . . . . . . . . . . . . . . . . . . . . . . . . . . . . . — 15 (21)Tim Hellas . . . . . . . . . . . . . . . . . . . . . . . . . . . . . . . . . . . . . . . . . . . . . . . . . . . . . . . . — (17) (55)Tim Perù . . . . . . . . . . . . . . . . . . . . . . . . . . . . . . . . . . . . . . . . . . . . . . . . . . . . . . . . . . — (8) —Gruppo Buffetti . . . . . . . . . . . . . . . . . . . . . . . . . . . . . . . . . . . . . . . . . . . . . . . . . . . . — (3) —Digitel Venezuela . . . . . . . . . . . . . . . . . . . . . . . . . . . . . . . . . . . . . . . . . . . . . . . . . . (36) (32) (12)Other, adjustments and eliminations . . . . . . . . . . . . . . . . . . . . . . . . . . . . . . . — 7 —
(36) (40) (278)
NOTE 17—EQUITY
Equity includes:
As of December 31,2006 2005(millions of Euro)
Equity attributable to equity holders of the Parent . . . . . . . . . . . . . . . . . . . . . . . . . . . . . . 26,018 25,662Equity attributable to Minority Interests . . . . . . . . . . . . . . . . . . . . . . . . . . . . . . . . . . . . . . . 1,080 1,323
Total . . . . . . . . . . . . . . . . . . . . . . . . . . . . . . . . . . . . . . . . . . . . . . . . . . . . . . . . . . . . . . . . . . . . . . . . . . 27,098 26,985
Equity attributable to equity holders of the Parent increased by €356 million compared to December 31,2005 mainly due to:
Š net income for the year (€3,014 million);
Š the increase from the conversion of bonds (€22 million);
Š the increase in “Other income (loss) recognized directly in equity” (€227 million);
Š the decrease in the “Reserve for net translation differences” (-€107 million);
Š the distribution of dividends (€2,766 million, net of dividends on shares held by Telecom Italia Finance).
Equity attributable to Minority Interests decreased by €243 million mainly due to the distribution of dividends(€236 million) and the net loss for the year (€11 million).
F-61

Financial Statements Notes To Consolidated Financial Statements
The movements in share capital during 2004, 2005 and 2006 are presented in the following tables:
Reconciliation between the number of outstanding shares at December 31, 2003 and December 31,2004
Shares as ofDecember 31, 2003
Shares issued as aresult of
bond conversions,exercise of warrants
and stock option plansShares as of
December 31, 2004(number of shares)
Ordinary Shares . . . . . . . . . . . . . . . . . . . . . . . . . . . . . . . . . . . 10,302,243,740 19,757,329 10,322,001,069Less: Treasury Shares . . . . . . . . . . . . . . . . . . . . . . . . . . . . . . (101,208,867) — (101,208,867)
Outstanding Ordinary Shares . . . . . . . . . . . . . . . . . . . . . . . 10,201,034,873 19,757,329 10,220,792,202
Outstanding Savings Shares . . . . . . . . . . . . . . . . . . . . . . . . 5,795,921,069 — 5,795,921,069
Total shares issued by Telecom Italia S.p.A. . . . 16,098,164,809 19,757,329 16,117,922,138Less: Treasury Shares . . . . . . . . . . . . . . . . . . . . . . . . . . . . . . (101,208,867) — (101,208,867)
Telecom Italia S.p.A. total outstandingshares . . . . . . . . . . . . . . . . . . . . . . . . . . . . . . . . . . . . . . . . . . 15,996,955,942 19,757,329 16,016,713,271
Reconciliation between the number of outstanding shares at December 31, 2004 and December 31,2005
Shares as ofDecember 31, 2004
Shares issued as aresult of
bond conversions,stock option plansand merger of TIMinto Telecom Italia
Shares as ofDecember 31, 2005
(number of shares)Ordinary Shares . . . . . . . . . . . . . . . . . . . . . . . . . . . . . . . . . . . . . . . 10,322,001,069 3,048,481,087 13,370,482,156Less: Treasury Shares . . . . . . . . . . . . . . . . . . . . . . . . . . . . . . . . . (101,208,867) (24,607,520) (125,816,387)
Outstanding Ordinary Shares . . . . . . . . . . . . . . . . . . . . . . . . . . 10,220,792,202 3,023,873,567 13,244,665,769
Outstanding Savings Shares . . . . . . . . . . . . . . . . . . . . . . . . . . . 5,795,921,069 230,199,592 6,026,120,661
Total shares issued by Telecom Italia S.p.A. . . . . . . . 16,117,922,138 3,278,680,679 19,396,602,817Less: Treasury Shares . . . . . . . . . . . . . . . . . . . . . . . . . . . . . . . . . (101,208,867) (24,607,520) (125,816,387)
Telecom Italia S.p.A. total outstanding shares . . . . . 16,016,713,271 3,254,073,159 19,270,786,430
Reconciliation between the number of outstanding shares at December 31, 2005 and December 31,2006
Shares as ofDecember 31, 2005
Shares issued as aresult of
bond conversionsShares as of
December 31, 2006(number of shares)
Ordinary Shares . . . . . . . . . . . . . . . . . . . . . . . . . . . . . . . . . . . . . . . 13,370,482,156 10,240,922 13,380,723,078Less: Treasury Shares . . . . . . . . . . . . . . . . . . . . . . . . . . . . . . . . . . (125,816,387) — (125,816,387)
Outstanding Ordinary Shares . . . . . . . . . . . . . . . . . . . . . . . . . . 13,244,665,769 10,240,922 13,254,906,691
Outstanding Savings Shares . . . . . . . . . . . . . . . . . . . . . . . . . . . 6,026,120,661 — 6,026,120,661
Total shares issued by Telecom Italia S.p.A. . . . . . . . 19,396,602,817 10,240,922 19,406,843,739Less: Treasury Shares . . . . . . . . . . . . . . . . . . . . . . . . . . . . . . . . . . (125,816,387) — (125,816,387)
Telecom Italia S.p.A. total outstanding shares . . . . . 19,270,786,430 10,240,922 19,281,027,352
F-62

Financial Statements Notes To Consolidated Financial Statements
Reconciliation between the value of the outstanding shares as of December 31, 2003 andDecember 31, 2004
Share capital as ofDecember 31, 2003
Changes in sharecapital as a result ofbond conversions,
exercise of warrantsand stock option plans
Share capital as ofDecember 31, 2004
(millions of Euro)Ordinary Shares . . . . . . . . . . . . . . . . . . . . . . . . . . . . . . . . . . . 5,666 11 5,677Less: Treasury Shares . . . . . . . . . . . . . . . . . . . . . . . . . . . . . . (56) — (56)
Outstanding Ordinary Shares . . . . . . . . . . . . . . . . . . . . . . . 5,610 11 5,621
Outstanding Savings Shares . . . . . . . . . . . . . . . . . . . . . . . . 3,188 — 3,188
Share capital issued by Telecom Italia S.p.A. . . 8,854 11 8,865Less: Treasury Shares . . . . . . . . . . . . . . . . . . . . . . . . . . . . . . (56) — (56)
Telecom Italia S.p.A. share capital . . . . . . . . . . . . . . 8,798 11 8,809
Reconciliation between the value of the outstanding shares as of December 31, 2004 andDecember 31, 2005
Share capital as ofDecember 31, 2004
Changes in sharecapital as a result ofbond conversions,
stock option plans andmerger of TIM into
Telecom ItaliaShare capital as ofDecember 31, 2005
(millions of Euro)Ordinary Shares . . . . . . . . . . . . . . . . . . . . . . . . . . . . . . . . . . . 5,677 1,677 7,354Less: Treasury Shares . . . . . . . . . . . . . . . . . . . . . . . . . . . . . . (56) (13) (69)
Outstanding Ordinary Shares . . . . . . . . . . . . . . . . . . . . . . . 5,621 1,664 7,285
Outstanding Savings Shares . . . . . . . . . . . . . . . . . . . . . . . . 3,188 126 3,314
Share capital issued by Telecom Italia S.p.A. . . 8,865 1,803 10,668Less: Treasury Shares . . . . . . . . . . . . . . . . . . . . . . . . . . . . . . (56) (13) (69)
Telecom Italia S.p.A. share capital . . . . . . . . . . . . . . 8,809 1,790 10,599
Reconciliation between the value of the outstanding shares as of December 31, 2005 andDecember 31, 2006
Share capital as ofDecember 31, 2005
Changes in sharecapital as a result of
bond conversionsShare capital as ofDecember 31, 2006
(millions of Euro)Ordinary Shares . . . . . . . . . . . . . . . . . . . . . . . . . . . . . . . . . . . . . . 7,354 6 7,360Less: Treasury Shares . . . . . . . . . . . . . . . . . . . . . . . . . . . . . . . . (69) — (69)
Outstanding Ordinary Shares . . . . . . . . . . . . . . . . . . . . . . . . . 7,285 6 7,291
Outstanding Savings Shares . . . . . . . . . . . . . . . . . . . . . . . . . . 3,314 — 3,314
Share capital issued by Telecom Italia S.p.A. . . . . 10,668 6 10,674Less: Treasury Shares . . . . . . . . . . . . . . . . . . . . . . . . . . . . . . . . (69) — (69)
Telecom Italia S.p.A. share capital . . . . . . . . . . . . . . . . 10,599 6 10,605
The Company’s share capital is divided into two classes of shares: Ordinary and Savings. Ordinary shares havethe right to attend, take part and vote in the ordinary and extraordinary shareholders’ meetings. The holders ofsuch shares have the right to the earnings distributed by the Company after the distribution of dividends to theholders of savings shares. Savings shares, in the absence of voting rights in the ordinary and extraordinaryshareholders’ meetings of the Company, have the right to receive distribution of the net income for the year up to
F-63

Financial Statements Notes To Consolidated Financial Statements
5% of the par value of the shares (€0.55) and to receive a dividend premium of 2% of the par value of the Sharesin excess of the dividend on ordinary shares.
Reserve for additional paid-in capital is equal to €1,689 million at December 31, 2006 and decreased by€4,776 million compared to December 31, 2005. The decrease is due to the balance of the following:
Š the reclassification, for €4,796 million, to “Other reserves and retained earnings (accumulated losses),including net income (loss) for the year”, of the portion of the “Reserve for additional paid-in capital”deriving from the share capital increase to service the merger of TIM in Telecom Italia following theapplication of art. 7, paragraph 7 of Legislative Decree No. 38/2005;
Š the additional paid-in capital, of €20 million, deriving from the issue of shares following the conversionof “Telecom Italia 1.5% 2001 – 2010 convertible notes with a repayment premium”.
Reserve for net translation differences shows a positive balance of €686 million at December 31, 2006, adecreased of €107 million compared to December 31, 2005. This relates mainly to translation differences on thefinancial statements of the Brazilian mobile telephone companies.
Other reserves and retained earnings (accumulated losses), including net income (loss) for the yearamount to €13,038 million (€7,805 million at December 31, 2005) and include:
Š Other income (loss) recognized directly in equity of a positive €118 million at December 31, 2006(a negative €109 million at December 31, 2005) referring to the following:
Š “Reserve for fair value adjustments of hedging instruments” for a negative €54 million atDecember 31, 2006 (a negative €216 million at December 31, 2005), attributable to the Parent for-€62 million and other Group companies for +€8 million. This reserve is expressed net of deferredtax assets of €15 million (€95 million at December 31, 2005). This reserve includes the gains orlosses related to the fair value adjustment on the effective portion of cash flow derivatives whichhedge the exposure of cash flow fluctuations on assets or liabilities;
Š “Reserve for fair value adjustments of available-for-sale financial assets” is a positive €172 million(a positive €107 million at December 31, 2005). This reserve relates to the measurement at marketprice of Mediobanca shares (€133 million), Capitalia shares (€37 million) and AssicurazioniGenerali shares (€1 million) held by the Parent, in addition to other shares held by the Group (€1million) and is expressed net of deferred tax liabilities of €9 million.
Š Other reserves are a positive €5,175 million at December 31, 2006 (a positive €3,835 million atDecember 31, 2005) and include the other reserves of the Parent net of the value of the treasury stockheld by the Parent and Telecom Italia Finance for the amount in excess of the relative par value whichwas deducted from “Share capital”. “Other reserves” increased principally due to the aforementionedreclassification from “Reserve for additional paid-in capital” (€1,022 million: €4,796 million net of€3,774 million reclassified to “Retained earnings (accumulated losses), including net income (loss) forthe year”), in addition to the appropriation of a part of the 2005 income (€319 million).
Š Retained earnings (accumulated losses), including net income (loss) for the year, atDecember 31, 2006, is €7,745 million, with an increase of €3,666 million compared to December 31,2005 and is mainly due to:
Š net income for the year attributable to the equity holders of the Parent, equal to €3,014 million(€3,216 million in 2005);
Š the amount (+€3,774 million) deriving from the above reclassification of the “Reserve foradditional paid-in capital” pursuant to the application of art. 7, paragraph 7, of Legislative DecreeNo. 38/2005;
Š the dividends declared and approved by shareholders of €2,766 million (€1,912 million in 2005).Dividends payable to ordinary and savings shareholders are, respectively, €1,856 million (€0.1400per share) and €910 million (€0.1510 per share).
Equity attributable to Minority Interests, equal to €1,080 million (€1,323 million at December 31, 2005),includes the “Net loss for the year attributable to Minority Interests” of €11 million (net income of €474 million in
F-64

Financial Statements Notes To Consolidated Financial Statements
2005) and decreased compared to December 31, 2005 principally due to the distribution of dividends(€236 million). This item consists mainly of the equity attributable to the minority interests of the Brazil mobiletelephony companies and the Media Business Unit.
The following table shows the future potential changes in share capital related to the convertible bonds andoptions in the stock option plans still outstanding at December 31, 2006:
Outstandingbonds /options
rights at12/31/2006
Conversion/grant ratio
Number ofmaximum
shares issuable
Par value(thousandof Euro)
Additionalpaid-incapital
(thousandof Euro)
Subscriptionprice per
share(Euro)
Additional increases approved(Ordinary Shares)
“Telecom Italia 1.5% 2001 –2010” notes . . . . . . . . . . . . . . . . . . . 484,990,163.00 0.471553 228,698,566 125,784 359,206 —
Stock Option Plan 2000 . . . . . . . . . . 5,349,998.00 3.300871 17,659,608 9,713 64,197 4.185259Stock Option Plan 2001 . . . . . . . . . . 31,847,500.00 3.300871 105,123,871 57,818 276,196 3.177343Stock Option Plan 2002 Top . . . . . . 9,480,001.33 3.300871 31,292,243 17,211 70,034 2.788052Stock Option Plan 2002 . . . . . . . . . . 16,471,053.93 3.300871 54,368,456 29,902 128,141 —Of which:—Grants in March 2002 . . . . . . . . . . 15,801,053.50 3.300871 52,156,879 28,686 124,030 2.928015—Grants in August 2002 . . . . . . . . . 670,000.43 3.300871 2,211,577 1,216 4,111 2.409061Stock Option Plans 2000-2002 –
ex TIM . . . . . . . . . . . . . . . . . . . . . . . . 9,795,656.00 1.73 16,946,391 9,321 53,568 3.710983Stock Option Plans 2002-2003 –
ex TIM . . . . . . . . . . . . . . . . . . . . . . . . 17,395,000.00 1.73 30,093,350 16,551 82,065 3.277457Stock Option Plans 2003-2005 –
ex TIM . . . . . . . . . . . . . . . . . . . . . . . . 1,685,900.00 1.73 2,916,605 1,604 6,944 2.930636
Total additional increasesapproved (OrdinaryShares) . . . . . . . . . . . . . . . . . . . . . . . 487,099,090 267,904 1,040,351
Additional increases not yetapproved (OrdinaryShares) . . . . . . . . . . . . . . . . . . . . . . . 1,600,000,000 880,000
With regard to the “Telecom Italia 1.5% 2001 – 2010 convertible notes with a repayment premium”, it should benoted that the number of outstanding notes at December 31, 2006 includes 3,500 notes for which the conversionto shares had already been requested. On January 15, 2007, the corresponding No. 1,649 Ordinary Shares wereissued for a total par value of €0.9 thousand and additional paid-in capital of €2.6 thousand.
Additional details on the stock option plans are disclosed in “Note 42—Stock option plans of the Telecom ItaliaGroup”.
The May 6, 2004 Shareholders’ Meeting also granted the Board of Directors the right (which, to date, has not beenexercised), for a maximum period of five years beginning May 6, 2004, to increase against payment, at one ormore times, the share capital for a maximum total amount of €880,000,000, through the issue of a maximum of1,600,000,000 Ordinary Shares, in whole or in part:
(i) to be offered as pre-emptive rights to the shareholders and convertible noteholders, or
(ii) to be offered for subscription to the employees of Telecom Italia S.p.A. or to the companies which itcontrols, with the exclusion of the pre-emptive rights, pursuant to the combined provision of art. 2441,last paragraph, of the Italian Civil Code, and art. 134, second paragraph, of Legislative Decree No.58/1998.
The resolutions to be adopted by the Board of Directors for capital increases in exercising the aforementionedright shall establish the subscription price (including any additional paid-in-capital) and shall fix a specific deadline
F-65
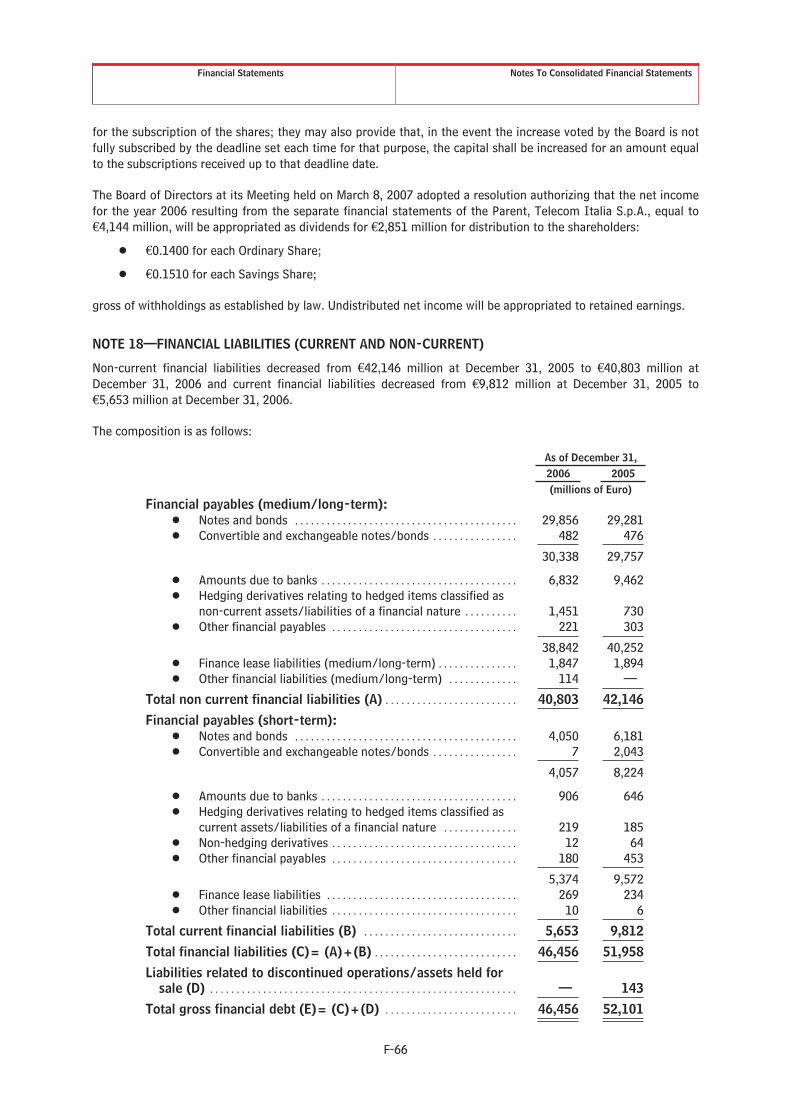
Financial Statements Notes To Consolidated Financial Statements
for the subscription of the shares; they may also provide that, in the event the increase voted by the Board is notfully subscribed by the deadline set each time for that purpose, the capital shall be increased for an amount equalto the subscriptions received up to that deadline date.
The Board of Directors at its Meeting held on March 8, 2007 adopted a resolution authorizing that the net incomefor the year 2006 resulting from the separate financial statements of the Parent, Telecom Italia S.p.A., equal to€4,144 million, will be appropriated as dividends for €2,851 million for distribution to the shareholders:
Š €0.1400 for each Ordinary Share;
Š €0.1510 for each Savings Share;
gross of withholdings as established by law. Undistributed net income will be appropriated to retained earnings.
NOTE 18—FINANCIAL LIABILITIES (CURRENT AND NON-CURRENT)
Non-current financial liabilities decreased from €42,146 million at December 31, 2005 to €40,803 million atDecember 31, 2006 and current financial liabilities decreased from €9,812 million at December 31, 2005 to€5,653 million at December 31, 2006.
The composition is as follows:
As of December 31,2006 2005(millions of Euro)
Financial payables (medium/long-term):Š Notes and bonds . . . . . . . . . . . . . . . . . . . . . . . . . . . . . . . . . . . . . . . . . . 29,856 29,281Š Convertible and exchangeable notes/bonds . . . . . . . . . . . . . . . . 482 476
30,338 29,757
Š Amounts due to banks . . . . . . . . . . . . . . . . . . . . . . . . . . . . . . . . . . . . . 6,832 9,462Š Hedging derivatives relating to hedged items classified as
non-current assets/liabilities of a financial nature . . . . . . . . . . 1,451 730Š Other financial payables . . . . . . . . . . . . . . . . . . . . . . . . . . . . . . . . . . . 221 303
38,842 40,252Š Finance lease liabilities (medium/long-term) . . . . . . . . . . . . . . . 1,847 1,894Š Other financial liabilities (medium/long-term) . . . . . . . . . . . . . 114 —
Total non current financial liabilities (A) . . . . . . . . . . . . . . . . . . . . . . . . . 40,803 42,146
Financial payables (short-term):Š Notes and bonds . . . . . . . . . . . . . . . . . . . . . . . . . . . . . . . . . . . . . . . . . . 4,050 6,181Š Convertible and exchangeable notes/bonds . . . . . . . . . . . . . . . . 7 2,043
4,057 8,224
Š Amounts due to banks . . . . . . . . . . . . . . . . . . . . . . . . . . . . . . . . . . . . . 906 646Š Hedging derivatives relating to hedged items classified as
current assets/liabilities of a financial nature . . . . . . . . . . . . . . 219 185Š Non-hedging derivatives . . . . . . . . . . . . . . . . . . . . . . . . . . . . . . . . . . . 12 64Š Other financial payables . . . . . . . . . . . . . . . . . . . . . . . . . . . . . . . . . . . 180 453
5,374 9,572Š Finance lease liabilities . . . . . . . . . . . . . . . . . . . . . . . . . . . . . . . . . . . . 269 234Š Other financial liabilities . . . . . . . . . . . . . . . . . . . . . . . . . . . . . . . . . . . 10 6
Total current financial liabilities (B) . . . . . . . . . . . . . . . . . . . . . . . . . . . . . 5,653 9,812
Total financial liabilities (C)= (A)+(B) . . . . . . . . . . . . . . . . . . . . . . . . . . . 46,456 51,958
Liabilities related to discontinued operations/assets held forsale (D) . . . . . . . . . . . . . . . . . . . . . . . . . . . . . . . . . . . . . . . . . . . . . . . . . . . . . . . . . . — 143
Total gross financial debt (E)= (C)+(D) . . . . . . . . . . . . . . . . . . . . . . . . . 46,456 52,101
F-66

Financial Statements Notes To Consolidated Financial Statements
Notes and bonds total €33,906 million (€35,462 million at December 31, 2005) and decreased by €1,556 million.Details are as follows:
As of December 31,2006 2005(millions of Euro)
Non-current portion . . . . . . . . . . . . . . . . . . . . . . . . . . . . . . . . . . . . . . . . . . . . . . . . . 29,856 29,281Current portion . . . . . . . . . . . . . . . . . . . . . . . . . . . . . . . . . . . . . . . . . . . . . . . . . . . . . . 4,050 6,181
Total carrying amounts . . . . . . . . . . . . . . . . . . . . . . . . . . . . . . . . . . . . . . . . . . . . 33,906 35,462Fair value adjustment and measurement at amortized cost . . . . . . . . . . . (787) (885)
Total nominal repayment amount . . . . . . . . . . . . . . . . . . . . . . . . . . . . . . . . 33,119 34,577
The nominal repayment amount totals €33,119 million and decreased by €1,458 million compared toDecember 31, 2005 (€34,577 million), mainly due to repayments made by Telecom Italia S.p.A. and TelecomItalia Finance S.A. during 2006 and strengthening of the euro against the U.S.$.
The regulations and/or Offering Circulars relating to the bonds described below are available on the corporatewebsite http://www.telecomitalia.it.
Bonds expressed at the nominal amount of principal refer to the following:
Notes and bonds issued by Telecom Italia S.p.A. (for a total of €10,936 million):
Š notes in the aggregate principal amount of €2,500 million, issued on February 1, 2002, divided into twotranches of €1,250 million each, at annual fixed rates, respectively, with a coupon of 5.625%, maturingFebruary 1, 2007 (the tranche was duly repaid at maturity) and with a coupon of 6.25%, maturingFebruary 1, 2012;
Š bonds 2002-2022 reserved in the aggregate principal amount of subscription by employees, in serviceor retired, of companies, directly and indirectly, controlled by Telecom Italia S.p.A., with headquartersin Italy, for €250 million;
Š bonds in the aggregate principal amount of €3,000 million, issued on January 29, 2004, divided intothree tranches: the first, for €1,000 million, with a quarterly coupon indexed to the 3-month Euribor +0.33%, maturing October 29, 2007 was repaid before maturity on January 30, 2006); the second, for€750 million, with an annual fixed-rate coupon of 4.50%, maturing January 28, 2011; the third, for€1,250 million, with an annual fixed-rate coupon of 5.375%, maturing January 29, 2019;
Š notes in the aggregate principal amount of €110 million issued on April 8, 2004 with a quarterly couponequal to the 3-month Euribor + 0.60%, maturing March 30, 2009;
Š bonds in the aggregate principal amount of GBP 850 million (equivalent to €1,266 million atDecember 31, 2006) issued on June 24, 2004, with an annual fixed-rate coupon of 6.375%, maturingJune 24, 2019;
Š bonds in the aggregate principal amount of €120 million issued on November 23, 2004 with a quarterlycoupon equal to the 3-month Euribor + 0.66%, maturing November 23, 2015;
Š bonds in the aggregate principal amount of €850 million issued on March 17, 2005 with an annual fixed-rate coupon of 5.25%, maturing March 17, 2055;
Š bonds in the aggregate principal amount of GBP 500 million (equivalent to €744 million atDecember 31, 2006) issued on June 29, 2005, with an annual fixed-rate coupon of 5.625%, maturingDecember 29, 2015;
Š notes in the aggregate principal amount of €1,000 million issued on December 6, 2005 with a quarterlycoupon equal to the 3-month Euribor + 0.53%, maturing December 6, 2012;
Š notes in the aggregate principal amount of €750 million issued on May 19, 2006 with an annual fixed-rate coupon of 4.75%, maturing May 19, 2014;
Š bonds in the aggregate principal amount of GBP 400 million (equivalent to €596 million atDecember 31, 2006) issued on May 19, 2006 with an annual fixed-rate coupon of 5.875%, maturingMay 19, 2023;
F-67
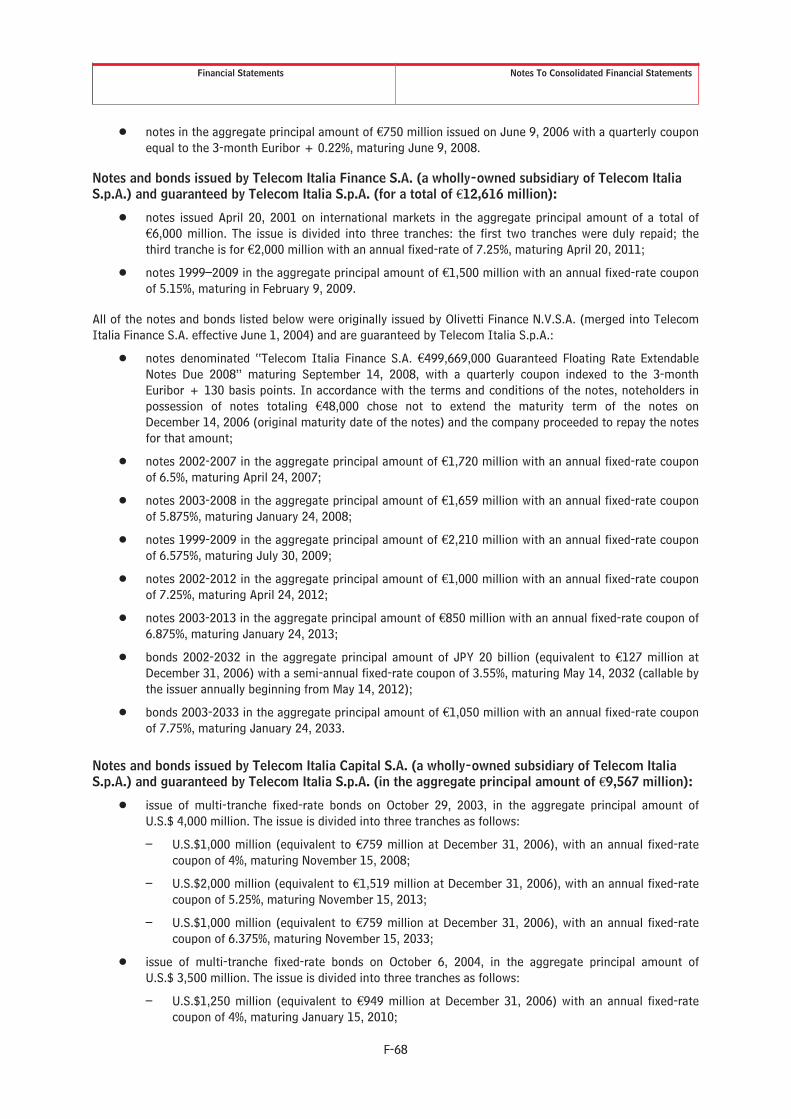
Financial Statements Notes To Consolidated Financial Statements
Š notes in the aggregate principal amount of €750 million issued on June 9, 2006 with a quarterly couponequal to the 3-month Euribor + 0.22%, maturing June 9, 2008.
Notes and bonds issued by Telecom Italia Finance S.A. (a wholly-owned subsidiary of Telecom ItaliaS.p.A.) and guaranteed by Telecom Italia S.p.A. (for a total of €12,616 million):
Š notes issued April 20, 2001 on international markets in the aggregate principal amount of a total of€6,000 million. The issue is divided into three tranches: the first two tranches were duly repaid; thethird tranche is for €2,000 million with an annual fixed-rate of 7.25%, maturing April 20, 2011;
Š notes 1999–2009 in the aggregate principal amount of €1,500 million with an annual fixed-rate couponof 5.15%, maturing in February 9, 2009.
All of the notes and bonds listed below were originally issued by Olivetti Finance N.V.S.A. (merged into TelecomItalia Finance S.A. effective June 1, 2004) and are guaranteed by Telecom Italia S.p.A.:
Š notes denominated “Telecom Italia Finance S.A. €499,669,000 Guaranteed Floating Rate ExtendableNotes Due 2008” maturing September 14, 2008, with a quarterly coupon indexed to the 3-monthEuribor + 130 basis points. In accordance with the terms and conditions of the notes, noteholders inpossession of notes totaling €48,000 chose not to extend the maturity term of the notes onDecember 14, 2006 (original maturity date of the notes) and the company proceeded to repay the notesfor that amount;
Š notes 2002-2007 in the aggregate principal amount of €1,720 million with an annual fixed-rate couponof 6.5%, maturing April 24, 2007;
Š notes 2003-2008 in the aggregate principal amount of €1,659 million with an annual fixed-rate couponof 5.875%, maturing January 24, 2008;
Š notes 1999-2009 in the aggregate principal amount of €2,210 million with an annual fixed-rate couponof 6.575%, maturing July 30, 2009;
Š notes 2002-2012 in the aggregate principal amount of €1,000 million with an annual fixed-rate couponof 7.25%, maturing April 24, 2012;
Š notes 2003-2013 in the aggregate principal amount of €850 million with an annual fixed-rate coupon of6.875%, maturing January 24, 2013;
Š bonds 2002-2032 in the aggregate principal amount of JPY 20 billion (equivalent to €127 million atDecember 31, 2006) with a semi-annual fixed-rate coupon of 3.55%, maturing May 14, 2032 (callable bythe issuer annually beginning from May 14, 2012);
Š bonds 2003-2033 in the aggregate principal amount of €1,050 million with an annual fixed-rate couponof 7.75%, maturing January 24, 2033.
Notes and bonds issued by Telecom Italia Capital S.A. (a wholly-owned subsidiary of Telecom ItaliaS.p.A.) and guaranteed by Telecom Italia S.p.A. (in the aggregate principal amount of €9,567 million):
Š issue of multi-tranche fixed-rate bonds on October 29, 2003, in the aggregate principal amount ofU.S.$ 4,000 million. The issue is divided into three tranches as follows:
– U.S.$1,000 million (equivalent to €759 million at December 31, 2006), with an annual fixed-ratecoupon of 4%, maturing November 15, 2008;
– U.S.$2,000 million (equivalent to €1,519 million at December 31, 2006), with an annual fixed-ratecoupon of 5.25%, maturing November 15, 2013;
– U.S.$1,000 million (equivalent to €759 million at December 31, 2006), with an annual fixed-ratecoupon of 6.375%, maturing November 15, 2033;
Š issue of multi-tranche fixed-rate bonds on October 6, 2004, in the aggregate principal amount ofU.S.$ 3,500 million. The issue is divided into three tranches as follows:
– U.S.$1,250 million (equivalent to €949 million at December 31, 2006) with an annual fixed-ratecoupon of 4%, maturing January 15, 2010;
F-68

Financial Statements Notes To Consolidated Financial Statements
– U.S.$1,250 million (equivalent to €949 million at December 31, 2006) with an annual fixed-ratecoupon of 4.95%, maturing September 30, 2014;
– U.S.$1,000 million (equivalent to €759 million at December 31, 2006) with an annual fixed-ratecoupon of 6%, maturing September 30, 2034;
Š issue of multi-tranche bonds on September 28, 2005 in the aggregate principal amount of U.S.$2,500million. The issue is divided into three tranches as follows:
– U.S.$400 million (equivalent to €304 million at December 31, 2006) with a quarterly couponindexed to the 3-month U.S.$ Libor + 0.48%, maturing February 1, 2011;
– U.S.$700 million (equivalent to €532 million at December 31, 2006) with 4.875% annual fixed-rateinterest with a semi-annual coupon, maturing October 1, 2010;
– U.S.$1,400 million (equivalent to €1,063 million at December 31, 2006) with 5.25% annual fixed-rate interest with a semi-annual coupon, maturing October 1, 2015;
Š issue of multi-tranche bonds on July 18, 2006 in the aggregate principal amount of U.S.$2,600 million.The issue is divided into three tranches as follows:
– U.S.$850 million (equivalent to €645 million at December 31, 2006), with a coupon indexed to the3-month U.S.$ Libor + 0.61%, maturing July 18, 2011;
– U.S.$750 million (equivalent to €570 million at December 31, 2006), with 6.20% annual fixed-rateinterest with a semi-annual coupon, maturing July 18, 2011;
– U.S.$1,000 million (equivalent to €759 million at December 31, 2006), with 7.20% annual fixed-rate interest with a semi-annual coupon, maturing July 18, 2036.
F-69

Financial Statements Notes To Consolidated Financial Statements
The following table lists the notes and bonds issued to third parties by companies in the Telecom Italia Group,divided by issuing company, expressed at the nominal repayment amount and market value.
OriginalCurrency
Amountin
originalcurrency(million)
Nominalrepaymentamount in
Euro(million) Coupon Issue date Maturity date
Issueprice(%)
Market priceas of
December 31,2006 (%)
Market valueas of
December 31,2006
(millions ofEuro)
Notes and bonds issued by Telecom Italia S.p.A.Euro . . . . . . . . 1,250 1,250 5.625% 02/01/2002 02/01/2007 99.841 100.126 1,252Euro . . . . . . . . 750 750 3 month Euribor +0.22% 06/09/2006 06/09/2008 100 100.00 750Euro . . . . . . . . 110 110 3 month Euribor +0.60% 04/08/2004 03/30/2009 100 100.797 111Euro . . . . . . . . 750 750 4.500% 01/29/2004 01/28/2011 99.56 99.39 745Euro . . . . . . . . 1,250 1,250 6.250% 02/01/2002 02/01/2012 98.952 106.038 1,325Euro . . . . . . . . 1,000 1,000 3 month Euribor +0.53% 12/06/2005 12/06/2012 100 99.27 993Euro . . . . . . . . 750 750 4.750% 05/19/2006 05/19/2014 99.156 98.00 735Euro . . . . . . . . 120 120 3 month Euribor +0.66% 11/23/2004 11/23/2015 100 97.694 117GBP . . . . . . . . . 500 744 5.625% 06/29/2005 12/29/2015 99.878 95.12 708Euro . . . . . . . . 1,250 1,250 5.375% 01/29/2004 01/29/2019 99.07 98.43 1,230GBP . . . . . . . . . 850 1,266 6.375% 06/24/2004 06/24/2019 98.85 100.076 1,267Euro . . . . . . . . 250 250 6 month Euribor (base 365) 01/01/2002 01/01/2022 100 100 250GBP . . . . . . . . . 400 596 5.875% 05/19/2006 05/19/2023 99.622 95.714 570Euro . . . . . . . . 850 850 5.250% 03/17/2005 03/17/2055 99.667 84.55 719
Sub-Total . . . 10,936 10,772
Notes and bonds issued by Telecom Italia Finance S.A. and guaranteed by Telecom Italia S.p.A.Euro . . . . . . . . 1,720 1,720 6.500% 04/24/2002 04/24/2007 100.911(*) 100.697 1,732Euro . . . . . . . . 1,659 1,659 5.875% 01/24/2003 01/24/2008 99.937 101.607 1,686Euro . . . . . . . . 499.67 500 3 month Euribor +1.3% 09/14/2006 09/14/2008 100 103.259 516Euro . . . . . . . . 1,500 1,500 5.150%(b) 02/09/1999 02/09/2009 99.633 101.501 1,523Euro . . . . . . . . 2,210 2,210 6.575%(c) 07/30/1999 07/30/2009 98.649(*) 105.114 2,323Euro . . . . . . . . 2,000 2,000 7.250%(a) 04/20/2001 04/20/2011 99.214 110.221 2,204Euro . . . . . . . . 1,000 1,000 7.250% 04/24/2002 04/24/2012 101.651(*) 110.782 1,108Euro . . . . . . . . 850 850 6.875% 01/24/2003 01/24/2013 99.332 109.599 932JPY . . . . . . . . . 20,000 127 3.550% 04/22/2002 05/14/2032 99.25 122.728 156Euro . . . . . . . . 1,050 1,050 7.750% 01/24/2003 01/24/2033 109.646(*) 118.86 1,248
Sub-Total . . . 12,616 13,428
Notes and bonds issued by Telecom Italia Capital S.A. and guaranteed by Telecom Italia S.p.A.USD . . . . . . . . . 1,000 759 4.000% 10/29/2003 11/15/2008 99.953 97.326 739USD . . . . . . . . . 1,250 949 4.000% 10/06/2004 01/15/2010 99.732 95.498 906USD . . . . . . . . . 700 532 4.875% 09/28/2005 10/01/2010 99.898 97.202 517USD . . . . . . . . . 400 304 3 month U.S.$ Libor +0.48% 09/28/2005 02/01/2011 100 99.476 302USD . . . . . . . . . 850 645 3 month U.S.$ Libor +0.61% 07/18/2006 07/18/2011 100 99.867 644USD . . . . . . . . . 750 570 6.200% 07/18/2006 07/18/2011 99.826 101.448 578USD . . . . . . . . . 2,000 1,519 5.250% 10/29/2003 11/15/2013 99.742 95.418 1,449USD . . . . . . . . . 1,250 949 4.950% 10/06/2004 09/30/2014 99.651 92.60 879USD . . . . . . . . . 1,400 1,063 5.250% 09/28/2005 10/01/2015 99.370 93.173 990USD . . . . . . . . . 1,000 759 6.375% 10/29/2003 11/15/2033 99.558 94.43 717USD . . . . . . . . . 1,000 759 6.000% 10/06/2004 09/30/2034 99.081 90.759 689USD . . . . . . . . . 1,000 759 7.200% 07/18/2006 07/18/2036 99.440 104.022 790
Sub-Total . . . 9,567 9,200
Total . . . . . . . . 33,119 33,400
Notes (a), (b), (c): see the following paragraph “Mechanism describing how coupons change on step-up/step-down notes and bonds inrelation to a change in the rating”.
(*) Weighted average issue price for notes and bonds issued with more than one tranche.
F-70
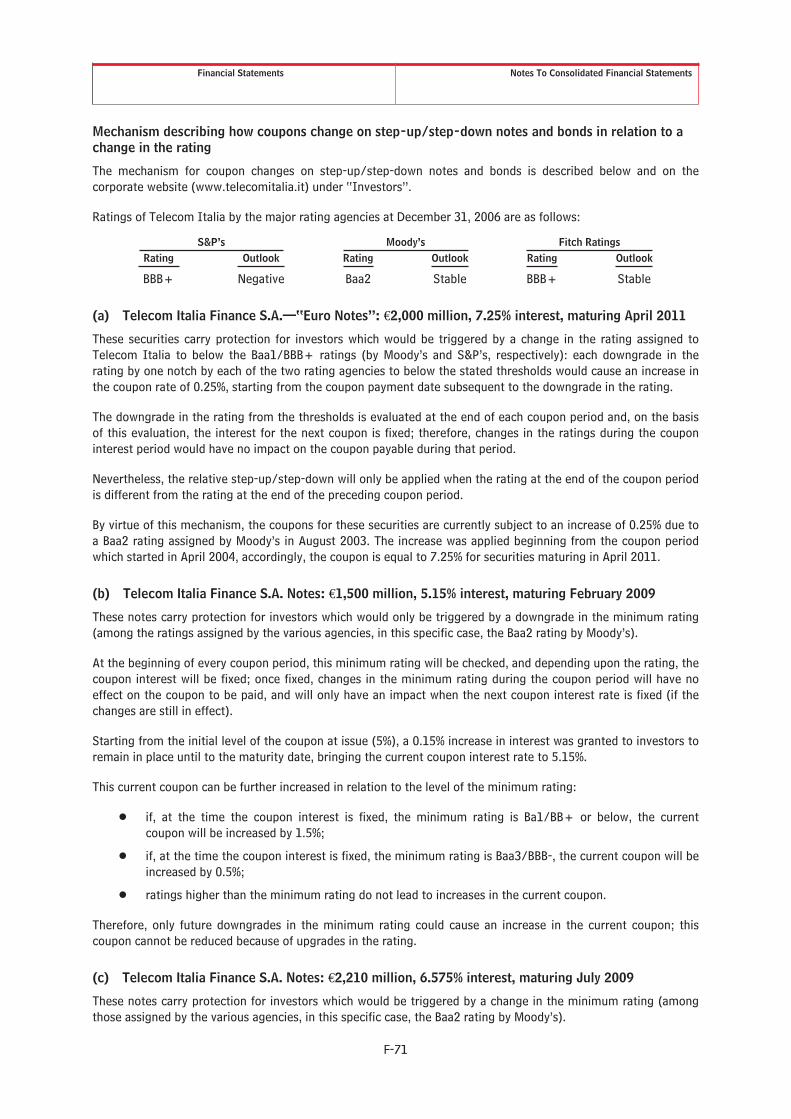
Financial Statements Notes To Consolidated Financial Statements
Mechanism describing how coupons change on step-up/step-down notes and bonds in relation to achange in the rating
The mechanism for coupon changes on step-up/step-down notes and bonds is described below and on thecorporate website (www.telecomitalia.it) under “Investors”.
Ratings of Telecom Italia by the major rating agencies at December 31, 2006 are as follows:
S&P’s Moody’s Fitch RatingsRating Outlook Rating Outlook Rating Outlook
BBB+ Negative Baa2 Stable BBB+ Stable
(a) Telecom Italia Finance S.A.—“Euro Notes”: €2,000 million, 7.25% interest, maturing April 2011
These securities carry protection for investors which would be triggered by a change in the rating assigned toTelecom Italia to below the Baa1/BBB+ ratings (by Moody’s and S&P’s, respectively): each downgrade in therating by one notch by each of the two rating agencies to below the stated thresholds would cause an increase inthe coupon rate of 0.25%, starting from the coupon payment date subsequent to the downgrade in the rating.
The downgrade in the rating from the thresholds is evaluated at the end of each coupon period and, on the basisof this evaluation, the interest for the next coupon is fixed; therefore, changes in the ratings during the couponinterest period would have no impact on the coupon payable during that period.
Nevertheless, the relative step-up/step-down will only be applied when the rating at the end of the coupon periodis different from the rating at the end of the preceding coupon period.
By virtue of this mechanism, the coupons for these securities are currently subject to an increase of 0.25% due toa Baa2 rating assigned by Moody’s in August 2003. The increase was applied beginning from the coupon periodwhich started in April 2004, accordingly, the coupon is equal to 7.25% for securities maturing in April 2011.
(b) Telecom Italia Finance S.A. Notes: €1,500 million, 5.15% interest, maturing February 2009
These notes carry protection for investors which would only be triggered by a downgrade in the minimum rating(among the ratings assigned by the various agencies, in this specific case, the Baa2 rating by Moody’s).
At the beginning of every coupon period, this minimum rating will be checked, and depending upon the rating, thecoupon interest will be fixed; once fixed, changes in the minimum rating during the coupon period will have noeffect on the coupon to be paid, and will only have an impact when the next coupon interest rate is fixed (if thechanges are still in effect).
Starting from the initial level of the coupon at issue (5%), a 0.15% increase in interest was granted to investors toremain in place until to the maturity date, bringing the current coupon interest rate to 5.15%.
This current coupon can be further increased in relation to the level of the minimum rating:
Š if, at the time the coupon interest is fixed, the minimum rating is Ba1/BB+ or below, the currentcoupon will be increased by 1.5%;
Š if, at the time the coupon interest is fixed, the minimum rating is Baa3/BBB-, the current coupon will beincreased by 0.5%;
Š ratings higher than the minimum rating do not lead to increases in the current coupon.
Therefore, only future downgrades in the minimum rating could cause an increase in the current coupon; thiscoupon cannot be reduced because of upgrades in the rating.
(c) Telecom Italia Finance S.A. Notes: €2,210 million, 6.575% interest, maturing July 2009
These notes carry protection for investors which would be triggered by a change in the minimum rating (amongthose assigned by the various agencies, in this specific case, the Baa2 rating by Moody’s).
F-71

Financial Statements Notes To Consolidated Financial Statements
At the beginning of every coupon period, this minimum rating will be checked and depending upon the rating, thecoupon interest will be fixed; once fixed, changes in the minimum rating during the coupon period will have noeffect on the coupon to be paid, and will only have an impact when the next coupon interest rate is fixed (if thechanges are still in effect).
Starting from the initial level of interest at issue (6.125%), the coupon to be paid will be increased in relation tothe level of the minimum rating:
Š if, at the time the coupon is fixed, the minimum rating is Ba1/BB+ or below, the original coupon will beincreased by 1.95%;
Š if, at the time the coupon interest is fixed, the minimum rating is Baa3/BBB-, the original coupon will beincreased by 0.95%;
Š if, at the time the coupon interest is fixed, the minimum rating is Baa2/BBB, the original coupon will beincreased by 0.45%;
Š if, at the time the coupon interest is fixed, the minimum rating is Baa1/BBB+, the original coupon willbe increased by 0.15%;
Š ratings higher than the minimum rating do not lead to increases in the original coupon.
Under this mechanism, since October 2000 (the date the mechanism was introduced), the original coupon hasbeen increased by 0.45% (reaching the current 6.575%).
Future upgrades/downgrades in the minimum rating could cause a decrease/increase in the coupon according tothe mechanism described above.
Convertible and exchangeable notes and bonds outstanding amount to €489 million (€2,519 million atDecember 31, 2005) and decreased by €2,030 million. The composition is as follows:
As of December 31,2006 2005(millions of Euro)
Non-current portion . . . . . . . . . . . . . . . . . . . . . . . . . . . . . . . . . . . . . . . . . . . . . . . . . . . . . . . . . . . 482 476Current portion . . . . . . . . . . . . . . . . . . . . . . . . . . . . . . . . . . . . . . . . . . . . . . . . . . . . . . . . . . . . . . . . 7 2,043
Total carrying amounts . . . . . . . . . . . . . . . . . . . . . . . . . . . . . . . . . . . . . . . . . . . . . . . . . . . . . . 489 2,519Measurement at amortized cost . . . . . . . . . . . . . . . . . . . . . . . . . . . . . . . . . . . . . . . . . . . . . . . . 85 123
Total nominal repayment amount . . . . . . . . . . . . . . . . . . . . . . . . . . . . . . . . . . . . . . . . . . 574 2,642
The nominal repayment amount of convertible and exchangeable notes and bonds totals €574 million. This showsa decrease of €2,068 million compared to December 31, 2005 (€2,642 million) due to the repayment on maturity(March 15, 2006) of the bonds exchangeable into shares of TIM or Seat Pagine Gialle, with a carrying amount of€2,035 million at the end of 2005 and to the conversion of “Telecom Italia S.p.A. 1.5% 2001-2010 convertiblenotes with a repayment premium” (€26 million).
The following table shows the “Telecom Italia S.p.A. 1.5% 2001-2010 convertible notes with a repaymentpremium”, expressed at the nominal repayment amount and at market value:
OriginalCurrency
Nominalrepaymentamount(millionsof Euro) Coupon New share issuers Issue date Maturity date
Issue price(%)
Marketprice as of
December 31,2006(%)
Marketvalue
(millionsof Euro)
Convertible notes issued by Telecom Italia S.p.A.Euro . . . 574 1.50% Telecom Italia S.p.A. 11/23/2001 01/01/2010 100 120.948 587
F-72
Financial Statements Notes To Consolidated Financial Statements
Financial covenants / other covenants / other features of convertible bonds
Bonds issued by companies of the Group to third parties do not contain financial covenants or terms andconditions that would require the early repayment of the bonds in relation to events other than the insolvency ofthe Telecom Italia Group. Furthermore, the repayment of the bonds and the payment of interest are not coveredby specific guarantees nor are there commitments provided relative to the assumption of future guarantees,except for the full and unconditional guarantees provided by Telecom Italia S.p.A. for the bonds issued byTelecom Italia Finance S.A. and Telecom Italia Capital S.A..
None of the securities summarized here carry any other interest rate structures or structural complexities.
Since these bonds have been placed principally with institutional investors on major world capital markets(Euromarket and the U.S.A.), the terms which regulate the bonds are in line with market practice for similartransactions effected on these same markets.
Medium/long-term amounts due to banks total €6,832 million (€9,462 million at December 31, 2005) anddecreased by €2,630 million mainly as a result of the early repayment of €3 billion of the Revolving Credit Facilityexpiring in 2012, reducing the amount drawn down to €1.5 billion, and new loans obtained from the EuropeanInvestment Bank (EIB).
Short-term amounts due to banks of €906 million increased by €260 million (€646 million at December 31, 2005)and include €625 million of the current portion of medium/long-term debt due within 12 months.
Hedging derivatives relating to hedged items classified as non-current assets/liabilities of a financial natureamount to €1,451 million (€730 million at December 31, 2005). The increase is due to a negative mark to marketchange connected principally with the decrease in the value of the U.S. dollar against the euro and the increase inrates during 2006 which were offset by a positive change in the underlying amounts. Hedging derivatives relatingto hedged items classified as current assets/liabilities total €219 million (€185 million at December 31, 2005).Additional details are provided in the “Note 24—Financial instruments”.
Short-term non-hedging derivatives totaling €12 million (€64 million at December 31, 2005) decreased by€52 million and refer to the measurement of derivatives which, although put into place for hedging purposes, donot possess the formal requisites to be considered as such under IFRS.
Medium/long-term other financial payables amount to €221 million (€303 million at December 31, 2005). Theyinclude €127 million for the Telecom Italia Finance S.A. loan of JPY 20,000 million maturing in 2029 and€64 million of payables to the Ministry of Industry. Short-term other financial payables amount to €180 million(€453 million at December 31, 2005) and include €43 million of payables to the Cassa Depositi e Prestiti,€14 million of payables to the Ministry of Industry and €86 million of payables for factoring transactions.
Medium-long term finance lease liabilities total €1,847 million (€1,894 million at December 31, 2005) andmainly refer to building sale and leaseback transactions recorded in accordance with IAS 17. Short-term financelease liabilities amount to €269 million (€234 million at December 31, 2005).
Medium/long-term other financial liabilities amount to €114 million and refer to the gain that has beentemporarily deferred on the sale of Avea I.H.A.S. in relation to the Telecom Italia Group’s commitment to make orhave a bank make a subordinated loan to Avea I.H.A.S. for U.S.$150 million. Short-term other financial liabilitiesamount to €10 million (€6 million at December 31, 2005).
At December 31, 2006, the unused credit lines of the Telecom Italia Group amount to €8,443 million (€8,227million at December 31, 2005) and include unused committed credit lines of €2 billion and €4.5 billion expiring,respectively, in March 2007 and in August 2012. Approximately 98% of the credit lines are denominated in euroand based on a floating interest rate.
The analysis of gross financial debt in the following tables presents discontinued operations separately.
F-73
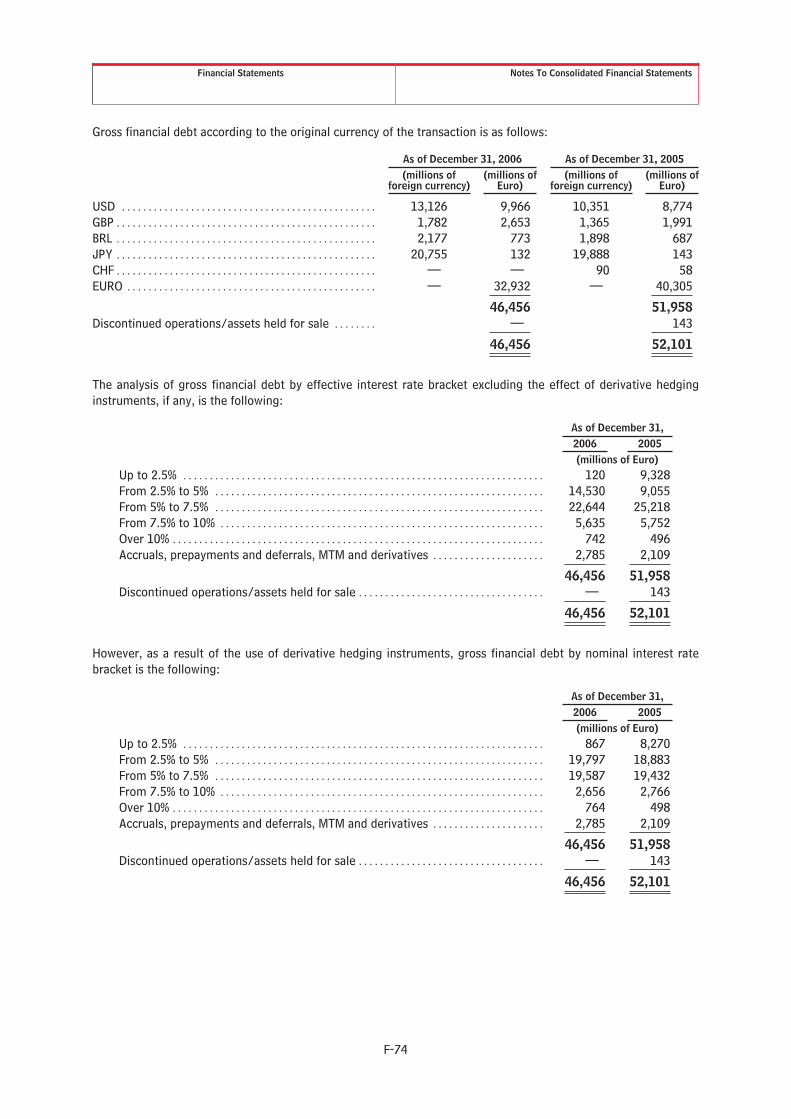
Financial Statements Notes To Consolidated Financial Statements
Gross financial debt according to the original currency of the transaction is as follows:
As of December 31, 2006 As of December 31, 2005(millions of
foreign currency)(millions of
Euro)(millions of
foreign currency)(millions of
Euro)
USD . . . . . . . . . . . . . . . . . . . . . . . . . . . . . . . . . . . . . . . . . . . . . . . . 13,126 9,966 10,351 8,774GBP . . . . . . . . . . . . . . . . . . . . . . . . . . . . . . . . . . . . . . . . . . . . . . . . . 1,782 2,653 1,365 1,991BRL . . . . . . . . . . . . . . . . . . . . . . . . . . . . . . . . . . . . . . . . . . . . . . . . . 2,177 773 1,898 687JPY . . . . . . . . . . . . . . . . . . . . . . . . . . . . . . . . . . . . . . . . . . . . . . . . . 20,755 132 19,888 143CHF . . . . . . . . . . . . . . . . . . . . . . . . . . . . . . . . . . . . . . . . . . . . . . . . . — — 90 58EURO . . . . . . . . . . . . . . . . . . . . . . . . . . . . . . . . . . . . . . . . . . . . . . . — 32,932 — 40,305
46,456 51,958Discontinued operations/assets held for sale . . . . . . . . — 143
46,456 52,101
The analysis of gross financial debt by effective interest rate bracket excluding the effect of derivative hedginginstruments, if any, is the following:
As of December 31,2006 2005(millions of Euro)
Up to 2.5% . . . . . . . . . . . . . . . . . . . . . . . . . . . . . . . . . . . . . . . . . . . . . . . . . . . . . . . . . . . . . . . . . . . . 120 9,328From 2.5% to 5% . . . . . . . . . . . . . . . . . . . . . . . . . . . . . . . . . . . . . . . . . . . . . . . . . . . . . . . . . . . . . . 14,530 9,055From 5% to 7.5% . . . . . . . . . . . . . . . . . . . . . . . . . . . . . . . . . . . . . . . . . . . . . . . . . . . . . . . . . . . . . . 22,644 25,218From 7.5% to 10% . . . . . . . . . . . . . . . . . . . . . . . . . . . . . . . . . . . . . . . . . . . . . . . . . . . . . . . . . . . . . 5,635 5,752Over 10% . . . . . . . . . . . . . . . . . . . . . . . . . . . . . . . . . . . . . . . . . . . . . . . . . . . . . . . . . . . . . . . . . . . . . . 742 496Accruals, prepayments and deferrals, MTM and derivatives . . . . . . . . . . . . . . . . . . . . . 2,785 2,109
46,456 51,958Discontinued operations/assets held for sale . . . . . . . . . . . . . . . . . . . . . . . . . . . . . . . . . . . — 143
46,456 52,101
However, as a result of the use of derivative hedging instruments, gross financial debt by nominal interest ratebracket is the following:
As of December 31,2006 2005(millions of Euro)
Up to 2.5% . . . . . . . . . . . . . . . . . . . . . . . . . . . . . . . . . . . . . . . . . . . . . . . . . . . . . . . . . . . . . . . . . . . . 867 8,270From 2.5% to 5% . . . . . . . . . . . . . . . . . . . . . . . . . . . . . . . . . . . . . . . . . . . . . . . . . . . . . . . . . . . . . . 19,797 18,883From 5% to 7.5% . . . . . . . . . . . . . . . . . . . . . . . . . . . . . . . . . . . . . . . . . . . . . . . . . . . . . . . . . . . . . . 19,587 19,432From 7.5% to 10% . . . . . . . . . . . . . . . . . . . . . . . . . . . . . . . . . . . . . . . . . . . . . . . . . . . . . . . . . . . . . 2,656 2,766Over 10% . . . . . . . . . . . . . . . . . . . . . . . . . . . . . . . . . . . . . . . . . . . . . . . . . . . . . . . . . . . . . . . . . . . . . . 764 498Accruals, prepayments and deferrals, MTM and derivatives . . . . . . . . . . . . . . . . . . . . . 2,785 2,109
46,456 51,958Discontinued operations/assets held for sale . . . . . . . . . . . . . . . . . . . . . . . . . . . . . . . . . . . — 143
46,456 52,101
F-74
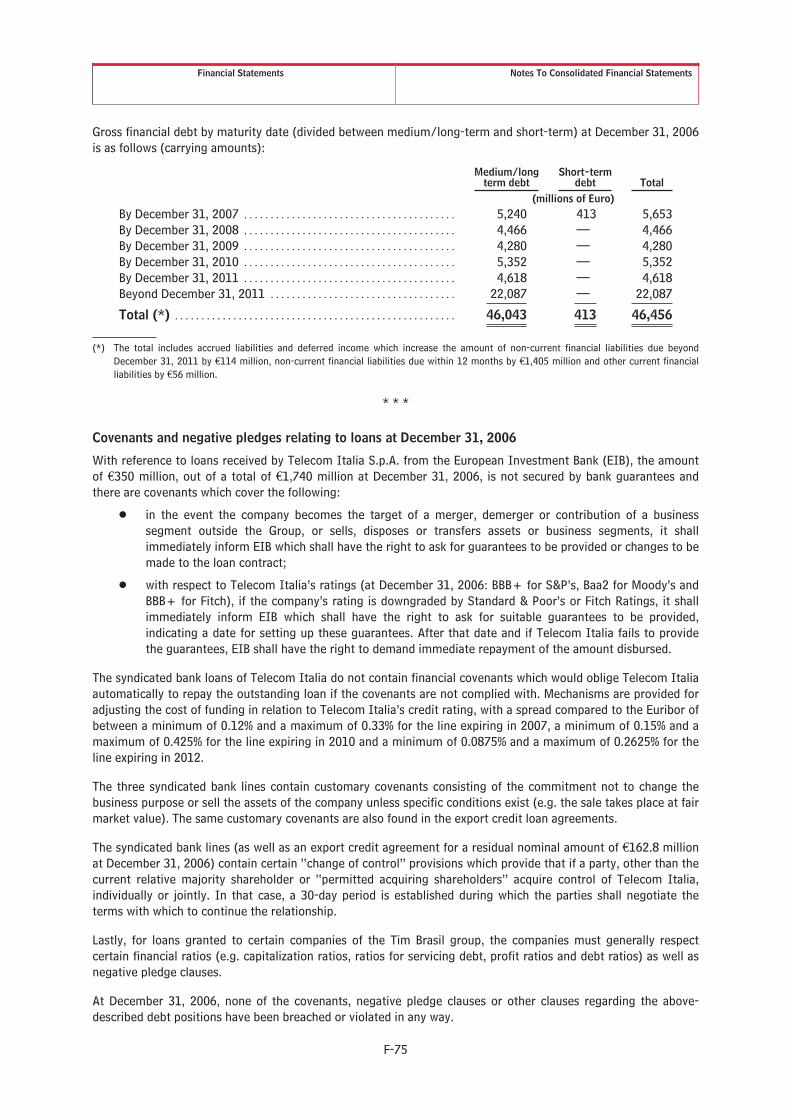
Financial Statements Notes To Consolidated Financial Statements
Gross financial debt by maturity date (divided between medium/long-term and short-term) at December 31, 2006is as follows (carrying amounts):
Medium/longterm debt
Short-termdebt Total
(millions of Euro)By December 31, 2007 . . . . . . . . . . . . . . . . . . . . . . . . . . . . . . . . . . . . . . . . 5,240 413 5,653By December 31, 2008 . . . . . . . . . . . . . . . . . . . . . . . . . . . . . . . . . . . . . . . . 4,466 — 4,466By December 31, 2009 . . . . . . . . . . . . . . . . . . . . . . . . . . . . . . . . . . . . . . . . 4,280 — 4,280By December 31, 2010 . . . . . . . . . . . . . . . . . . . . . . . . . . . . . . . . . . . . . . . . 5,352 — 5,352By December 31, 2011 . . . . . . . . . . . . . . . . . . . . . . . . . . . . . . . . . . . . . . . . 4,618 — 4,618Beyond December 31, 2011 . . . . . . . . . . . . . . . . . . . . . . . . . . . . . . . . . . . 22,087 — 22,087
Total (*) . . . . . . . . . . . . . . . . . . . . . . . . . . . . . . . . . . . . . . . . . . . . . . . . . . . . . 46,043 413 46,456
(*) The total includes accrued liabilities and deferred income which increase the amount of non-current financial liabilities due beyondDecember 31, 2011 by €114 million, non-current financial liabilities due within 12 months by €1,405 million and other current financialliabilities by €56 million.
* * *
Covenants and negative pledges relating to loans at December 31, 2006
With reference to loans received by Telecom Italia S.p.A. from the European Investment Bank (EIB), the amountof €350 million, out of a total of €1,740 million at December 31, 2006, is not secured by bank guarantees andthere are covenants which cover the following:
Š in the event the company becomes the target of a merger, demerger or contribution of a businesssegment outside the Group, or sells, disposes or transfers assets or business segments, it shallimmediately inform EIB which shall have the right to ask for guarantees to be provided or changes to bemade to the loan contract;
Š with respect to Telecom Italia’s ratings (at December 31, 2006: BBB+ for S&P’s, Baa2 for Moody’s andBBB+ for Fitch), if the company’s rating is downgraded by Standard & Poor’s or Fitch Ratings, it shallimmediately inform EIB which shall have the right to ask for suitable guarantees to be provided,indicating a date for setting up these guarantees. After that date and if Telecom Italia fails to providethe guarantees, EIB shall have the right to demand immediate repayment of the amount disbursed.
The syndicated bank loans of Telecom Italia do not contain financial covenants which would oblige Telecom Italiaautomatically to repay the outstanding loan if the covenants are not complied with. Mechanisms are provided foradjusting the cost of funding in relation to Telecom Italia’s credit rating, with a spread compared to the Euribor ofbetween a minimum of 0.12% and a maximum of 0.33% for the line expiring in 2007, a minimum of 0.15% and amaximum of 0.425% for the line expiring in 2010 and a minimum of 0.0875% and a maximum of 0.2625% for theline expiring in 2012.
The three syndicated bank lines contain customary covenants consisting of the commitment not to change thebusiness purpose or sell the assets of the company unless specific conditions exist (e.g. the sale takes place at fairmarket value). The same customary covenants are also found in the export credit loan agreements.
The syndicated bank lines (as well as an export credit agreement for a residual nominal amount of €162.8 millionat December 31, 2006) contain certain “change of control” provisions which provide that if a party, other than thecurrent relative majority shareholder or “permitted acquiring shareholders” acquire control of Telecom Italia,individually or jointly. In that case, a 30-day period is established during which the parties shall negotiate theterms with which to continue the relationship.
Lastly, for loans granted to certain companies of the Tim Brasil group, the companies must generally respectcertain financial ratios (e.g. capitalization ratios, ratios for servicing debt, profit ratios and debt ratios) as well asnegative pledge clauses.
At December 31, 2006, none of the covenants, negative pledge clauses or other clauses regarding the above-described debt positions have been breached or violated in any way.
F-75

Financial Statements Notes To Consolidated Financial Statements
NOTE 19—EMPLOYEE SEVERANCE INDEMNITIES AND OTHER EMPLOYEE-RELATED PROVISIONS
Employee severance indemnities and other employee-related provisions decreased from €1,494 million atDecember 31, 2005 to €1,372 million. Details are as follows:
As ofDecember 31,
2004
Discontinuedoperations/assets held
for sale Increases DecreasesExchange
differences
As ofDecember 31,
2005(millions of Euro)
Provisions for employeeseverance indemnities . . . . . . . . (A) 1,181 (4) 168 (111) — 1,234
Provisions for pension plans . . . . . . . 40 (10) 6 (3) 1 34Provisions for termination benefit
incentives . . . . . . . . . . . . . . . . . . . . . . . 71 — 234 (79) — 226
Other employee-relatedprovisions (*) . . . . . . . . . . . . . . . . . (B) 111 (10) 240 (82) 1 260
Total . . . . . . . . . . . . . . . . . . . . . . . . . . . . . (A+B) 1,292 (14) 408 (193) 1 1,494
Of which :Non-current portion . . . . . . . . . . . . . . . 1,222 1,351Current portion (*) . . . . . . . . . . . . . . . . 70 143
As ofDecember 31,
2005
Discontinuedoperations/assets held
for sale Increases DecreasesExchange
differences
As ofDecember 31,
2006(millions of Euro)
Provisions for employeeseverance indemnities . . . . . . . . (A) 1,234 — 146 (152) — 1,228
Provisions for pension plans . . . . . . . 34 — 2 (4) (1) 31Provisions for termination benefit
incentives . . . . . . . . . . . . . . . . . . . . . . . 226 — 7 (120) — 113
Other employee-relatedprovisions (*) . . . . . . . . . . . . . . . . . (B) 260 — 9 (124) (1) 144
Total . . . . . . . . . . . . . . . . . . . . . . . . . . . . . (A+B) 1,494 — 155 (276) (1) 1,372
Of which :Non-current portion . . . . . . . . . . . . . . . 1,351 1,262Current portion (*) . . . . . . . . . . . . . . . . 143 110
Provisions for employee severance indemnities refer only to Italian companies of the Group. Theseprovisions decreased in 2006 by €6 million mainly as a result of the accrual to the statement of income(€146 million), utilizations for indemnities paid to employees who terminated employment, advances andtransfers to pension funds (€140 million) and other negative changes (€12 million).
According to the law and national regulations, the amount to which each employee is entitled matures in relationto the period of service and must be paid immediately when the employee leaves the company. This severanceindemnity is due upon termination of employment and is calculated in accordance with civil laws and Italian laborlaws on the basis of the period of employment and the taxable income of each employee. This liability is adjustedannually based on the official cost-of-living index and interest accrued. This liability is not associated with anyvesting condition or period or any funding obligation. Consequently, in accordance with IAS 19, this provision hasbeen recognized as a defined benefit plan. Since there are no funding obligations there are no assets to servicethe provision.
F-76

Financial Statements Notes To Consolidated Financial Statements
In accordance with IAS 19 “Employee Benefits”, the “Projected Unit Credit Method” was used to measureemployee severance indemnities, as described below:
Š the future possible benefits which could be paid to each employee in the event of retirement, death,disability, resignation etc. have been projected on the basis of a series of financial assumptions(cost-of-living increases, increase in remuneration etc.). The estimate of the future benefits includesany increases for additional service seniority as well as the estimated increase in the remuneration levelat the measurement date;
Š the average present value of future benefits has been calculated, at the measurement date, on the basisof the annual interest rate and on the expected payment date;
Š the liability of each interested company has been determined as the average present value of futurebenefits for service matured by the employee at the measurement date.
The following assumptions were made:
Financial assumptions Executives Non executives
Cost-of-living increases . . . . . . . . . . . . . . . . . . 2.2% per annum 2.2% per annum
Discount rate . . . . . . . . . . . . . . . . . . . . . . . . . . . . 4.4% per annum 4.4% per annum
Increase in remuneration:
– equal to or less than 40 years ofage . . . . . . . . . . . . . . . . . . . . . . . . . . . . . . 3.2% per annum 3.2% per annum
– over 40 years, but equal to or lessthan 55 years of age . . . . . . . . . . . . . 2.7% per annum 2.7% per annum
– over 55 years of age . . . . . . . . . . . . . 2.2% per annum 2.2% per annum
Demographic assumptions Executives Non executives
Probability of death . . . . . . . . . . . . . . . . . . . . . Mortality tables RG 48 publishedby “Ragioneria Generale delloStato”
Mortality tables RG 48 publishedby “Ragioneria Generale delloStato”
Probability of disability . . . . . . . . . . . . . . . . . . Unisex tables based on a studypublished by C.N.R. for“Università di Roma” reduced by80%
Unisex tables based on a studypublished by C.N.R. for“Università di Roma” reduced by80%
Probability of resignation (in relation toeach company):– up to 40 years of age . . . . . . . . . . . . From 3.0% to 4.0% per annum From 3.0% to 4.0% per annum– over 40 up to 50 years of age . . . . From 1.5% to 2.5% per annum From 1.5% to 2.5% per annum– over 50 years of age . . . . . . . . . . . . . None None
Probability of retirement:– up to 60 years of age . . . . . . . . . . . . 35% (100% for women) 60% (100% for women)– over 60 but less than 65 years of
age . . . . . . . . . . . . . . . . . . . . . . . . . . . . . . 15% per annum 10% per annum– at 65 years of age . . . . . . . . . . . . . . . . 100% 100%
The adoption of the above assumptions resulted in a liability for employee severance indemnities at December 31,2006 and 2005, respectively, of €1,228 million and €1,234 million.
F-77

Financial Statements Notes To Consolidated Financial Statements
The effect on the statement of income (Personnel costs) is as follows:
Year ended December 31,2006 2005 2004
(millions of Euro)Current service cost . . . . . . . . . . . . . . . . . . . . . . . . . . . . . . . . . . . . . . . . . . . . . . . 129 134 127Interest expense . . . . . . . . . . . . . . . . . . . . . . . . . . . . . . . . . . . . . . . . . . . . . . . . . . 49 45 57Net actuarial (gains) losses recognized during the year . . . . . . . . . . . . . (32) (11) —
Total expense . . . . . . . . . . . . . . . . . . . . . . . . . . . . . . . . . . . . . . . . . . . . . . . . . . . . 146 168 184
Effective return on plan assets . . . . . . . . . . . . . . . . . . . . . . . . . . . . . . . . . n/a n/a n/a
Provisions for pension plans principally refer to pension plans operating in foreign companies of the Group.
Provisions for termination benefit incentives include provisions both for agreements regarding mobilitypursuant to Law No. 223/91, agreed in December 2005 with the labor unions, and the plan for terminationincentive benefits for managers with regard to the cases currently pending.
The decreases are due to the termination of employees during the year while the increases refer to the accrualsfor the year 2006 (€3 million) and the effect of the reversal of discounting the provision to present value in the2005 financial statements (€4 million).
NOTE 20—PROVISIONS FOR RISKS AND CHARGES
Provisions for risks and charges decreased from €1,569 million at December 31, 2005 to €1,355 million. Thecomposition and changes are as follows:
As ofDecember 31,
2005 Increases
Releases tothe
statementof income Uses
Exchangedifferences
andother
As ofDecember 31,
2006(millions of Euro)
Provision for taxation and tax risks . . . . . . . . . . . . . 226 64 (21) (7) — 262Provision for restoration and the
decommissioning costs . . . . . . . . . . . . . . . . . . . . . . 443 62 — (5) (113) 387Provision for legal disputes . . . . . . . . . . . . . . . . . . . . . 148 93 (1) (36) 2 206Provision for commercial risks . . . . . . . . . . . . . . . . . . 122 14 (4) (30) (12) 90Provision for risks and charges on investments
and corporate-related transactions . . . . . . . . . . . 429 40 (121) (29) (30) 289Other provisions for risks and charges . . . . . . . . . . 201 18 (5) (130) 37 121
Total . . . . . . . . . . . . . . . . . . . . . . . . . . . . . . . . . . . . . . . . . . 1,569 291 (152) (237) (116) 1,355
Of which :Non-current portion . . . . . . . . . . . . . . . . . . . . . . . . . . . . 797 775Current portion . . . . . . . . . . . . . . . . . . . . . . . . . . . . . . . . 772 580
Provision for restoration and decommissioning costs refers to the accrual for the estimated cost todecommission tangible assets and restore the sites of the Parent (€331 million) and the companies of BrazilMobile Business Unit (€56 million).
This provision decreased, compared to December 31, 2005, mainly as a result of the change in the estimates ofthe Brazilian companies (€105 million) and was partially countered by the increase caused by the reduction in thediscount rate and the release of the effects of discounting to present value (€37 million), offset by the increase inthe number of sites leased (€25 million).
The changes in estimate became necessary after the unit cost of restoring the sites decreased following therenewal of contracts with foreign suppliers, subsequent to the corporate reorganization of the Braziliancompanies, and greater use of co-siting contracts which do not require the companies to restore the sites. Thesechanges in estimate have been recorded with a contra-entry to tangible assets, as provided by IFRIC 1.
F-78
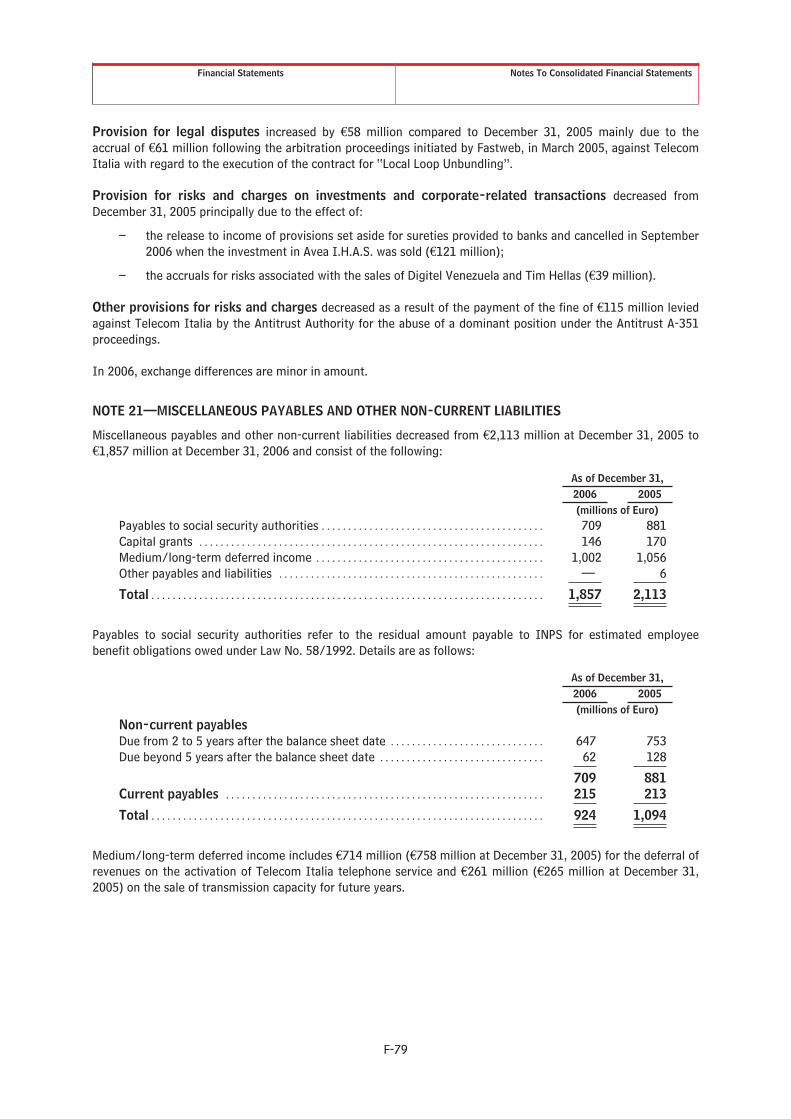
Financial Statements Notes To Consolidated Financial Statements
Provision for legal disputes increased by €58 million compared to December 31, 2005 mainly due to theaccrual of €61 million following the arbitration proceedings initiated by Fastweb, in March 2005, against TelecomItalia with regard to the execution of the contract for “Local Loop Unbundling”.
Provision for risks and charges on investments and corporate-related transactions decreased fromDecember 31, 2005 principally due to the effect of:
– the release to income of provisions set aside for sureties provided to banks and cancelled in September2006 when the investment in Avea I.H.A.S. was sold (€121 million);
– the accruals for risks associated with the sales of Digitel Venezuela and Tim Hellas (€39 million).
Other provisions for risks and charges decreased as a result of the payment of the fine of €115 million leviedagainst Telecom Italia by the Antitrust Authority for the abuse of a dominant position under the Antitrust A-351proceedings.
In 2006, exchange differences are minor in amount.
NOTE 21—MISCELLANEOUS PAYABLES AND OTHER NON-CURRENT LIABILITIES
Miscellaneous payables and other non-current liabilities decreased from €2,113 million at December 31, 2005 to€1,857 million at December 31, 2006 and consist of the following:
As of December 31,2006 2005(millions of Euro)
Payables to social security authorities . . . . . . . . . . . . . . . . . . . . . . . . . . . . . . . . . . . . . . . . . . 709 881Capital grants . . . . . . . . . . . . . . . . . . . . . . . . . . . . . . . . . . . . . . . . . . . . . . . . . . . . . . . . . . . . . . . . . 146 170Medium/long-term deferred income . . . . . . . . . . . . . . . . . . . . . . . . . . . . . . . . . . . . . . . . . . . 1,002 1,056Other payables and liabilities . . . . . . . . . . . . . . . . . . . . . . . . . . . . . . . . . . . . . . . . . . . . . . . . . . — 6
Total . . . . . . . . . . . . . . . . . . . . . . . . . . . . . . . . . . . . . . . . . . . . . . . . . . . . . . . . . . . . . . . . . . . . . . . . . . 1,857 2,113
Payables to social security authorities refer to the residual amount payable to INPS for estimated employeebenefit obligations owed under Law No. 58/1992. Details are as follows:
As of December 31,2006 2005(millions of Euro)
Non-current payablesDue from 2 to 5 years after the balance sheet date . . . . . . . . . . . . . . . . . . . . . . . . . . . . . 647 753Due beyond 5 years after the balance sheet date . . . . . . . . . . . . . . . . . . . . . . . . . . . . . . . 62 128
709 881Current payables . . . . . . . . . . . . . . . . . . . . . . . . . . . . . . . . . . . . . . . . . . . . . . . . . . . . . . . . . . . . 215 213
Total . . . . . . . . . . . . . . . . . . . . . . . . . . . . . . . . . . . . . . . . . . . . . . . . . . . . . . . . . . . . . . . . . . . . . . . . . . 924 1,094
Medium/long-term deferred income includes €714 million (€758 million at December 31, 2005) for the deferral ofrevenues on the activation of Telecom Italia telephone service and €261 million (€265 million at December 31,2005) on the sale of transmission capacity for future years.
F-79
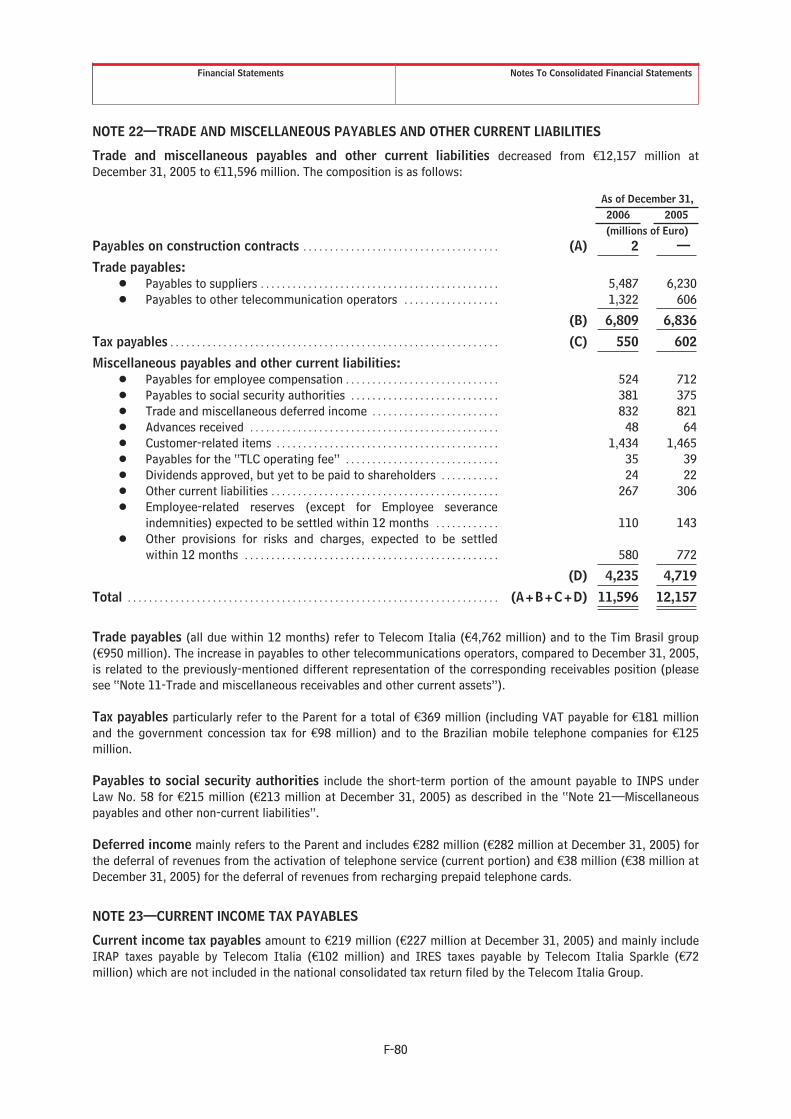
Financial Statements Notes To Consolidated Financial Statements
NOTE 22—TRADE AND MISCELLANEOUS PAYABLES AND OTHER CURRENT LIABILITIES
Trade and miscellaneous payables and other current liabilities decreased from €12,157 million atDecember 31, 2005 to €11,596 million. The composition is as follows:
As of December 31,2006 2005(millions of Euro)
Payables on construction contracts . . . . . . . . . . . . . . . . . . . . . . . . . . . . . . . . . . . . . (A) 2 —
Trade payables:Š Payables to suppliers . . . . . . . . . . . . . . . . . . . . . . . . . . . . . . . . . . . . . . . . . . . . . 5,487 6,230Š Payables to other telecommunication operators . . . . . . . . . . . . . . . . . . 1,322 606
(B) 6,809 6,836
Tax payables . . . . . . . . . . . . . . . . . . . . . . . . . . . . . . . . . . . . . . . . . . . . . . . . . . . . . . . . . . . . . . (C) 550 602
Miscellaneous payables and other current liabilities:Š Payables for employee compensation . . . . . . . . . . . . . . . . . . . . . . . . . . . . . 524 712Š Payables to social security authorities . . . . . . . . . . . . . . . . . . . . . . . . . . . . 381 375Š Trade and miscellaneous deferred income . . . . . . . . . . . . . . . . . . . . . . . . 832 821Š Advances received . . . . . . . . . . . . . . . . . . . . . . . . . . . . . . . . . . . . . . . . . . . . . . . 48 64Š Customer-related items . . . . . . . . . . . . . . . . . . . . . . . . . . . . . . . . . . . . . . . . . . 1,434 1,465Š Payables for the “TLC operating fee” . . . . . . . . . . . . . . . . . . . . . . . . . . . . . 35 39Š Dividends approved, but yet to be paid to shareholders . . . . . . . . . . . 24 22Š Other current liabilities . . . . . . . . . . . . . . . . . . . . . . . . . . . . . . . . . . . . . . . . . . . 267 306Š Employee-related reserves (except for Employee severance
indemnities) expected to be settled within 12 months . . . . . . . . . . . . 110 143Š Other provisions for risks and charges, expected to be settled
within 12 months . . . . . . . . . . . . . . . . . . . . . . . . . . . . . . . . . . . . . . . . . . . . . . . . 580 772
(D) 4,235 4,719
Total . . . . . . . . . . . . . . . . . . . . . . . . . . . . . . . . . . . . . . . . . . . . . . . . . . . . . . . . . . . . . . . . . . . . . . (A+B+C+D) 11,596 12,157
Trade payables (all due within 12 months) refer to Telecom Italia (€4,762 million) and to the Tim Brasil group(€950 million). The increase in payables to other telecommunications operators, compared to December 31, 2005,is related to the previously-mentioned different representation of the corresponding receivables position (pleasesee “Note 11-Trade and miscellaneous receivables and other current assets”).
Tax payables particularly refer to the Parent for a total of €369 million (including VAT payable for €181 millionand the government concession tax for €98 million) and to the Brazilian mobile telephone companies for €125million.
Payables to social security authorities include the short-term portion of the amount payable to INPS underLaw No. 58 for €215 million (€213 million at December 31, 2005) as described in the “Note 21—Miscellaneouspayables and other non-current liabilities”.
Deferred income mainly refers to the Parent and includes €282 million (€282 million at December 31, 2005) forthe deferral of revenues from the activation of telephone service (current portion) and €38 million (€38 million atDecember 31, 2005) for the deferral of revenues from recharging prepaid telephone cards.
NOTE 23—CURRENT INCOME TAX PAYABLES
Current income tax payables amount to €219 million (€227 million at December 31, 2005) and mainly includeIRAP taxes payable by Telecom Italia (€102 million) and IRES taxes payable by Telecom Italia Sparkle (€72million) which are not included in the national consolidated tax return filed by the Telecom Italia Group.
F-80

Financial Statements Notes To Consolidated Financial Statements
NOTE 24—FINANCIAL INSTRUMENTS
FAIR VALUE
The majority of non-current financial liabilities of the Telecom Italia Group consist of bonds and theirmeasurement at fair value can be easily determined since they are represented by financial instruments which,because of their size and diffusion among investors, are frequently exchanged on the markets (see the “Note 18—Financial liabilities (current and non-current)”). Instead, for other types of loans, where there is no public trading,the following assumptions were made:
Š the floating-rate loans were considered at the nominal repayment amount;
Š the fixed-rate loans were measured at fair value (present value of future flows using December 31, 2006market rates).
Finally, the carrying amount of most of the financial assets represents a reasonable approximation of their fairvalue as they are highly liquid short-term financial investments.
Fair values (accruals included) of financial liabilities and financial assets at December 31, 2006 and atDecember 31, 2005 are set out below:
Financial liabilities As of December 31, 2006 As of December 31, 2005
Carryingamounts
Fair values(includedaccruals)
Carryingamounts
Fair values(includedaccruals)
(millions of Euro)Notes and bonds . . . . . . . . . . . . . . . . . . . . . . . . . . . . . . . . . . . . . . . . . . . . . . . 33,906 34,478 35,462 37,427Convertible and exchangeable notes and bonds . . . . . . . . . . . . . . . . . 489 701 2,519 2,680Drawn bank Facility . . . . . . . . . . . . . . . . . . . . . . . . . . . . . . . . . . . . . . . . . . . . . 4,549 4,567 7,535 7,574Loans, other debt and finance lease liabilities . . . . . . . . . . . . . . . . . . . 7,512 7,616 6,442 6,509
46,456 47,362 51,958 54,190Discontinued operations/assets held for sale . . . . . . . . . . . . . . — — 143 143
Total Gross Financial Debt . . . . . . . . . . . . . . . . . . . . . . . . . . . . . . . . . . . 46,456 47,362 52,101 54,333
Financial assets As of December 31, 2006 As of December 31, 2005
Carryingamounts
Fair values(includedaccruals)
Carryingamounts
Fair values(includedaccruals)
(millions of Euro)Deposits and cash . . . . . . . . . . . . . . . . . . . . . . . . . . . . . . . . . . . . . . . . . . . . . . 7,191 7,191 9,958 9,958Euro Commercial Paper . . . . . . . . . . . . . . . . . . . . . . . . . . . . . . . . . . . . . . . . 20 20 327 327Deposits for temporary investments maturing beyond 3
months . . . . . . . . . . . . . . . . . . . . . . . . . . . . . . . . . . . . . . . . . . . . . . . . . . . . . . 17 17 90 90Securities . . . . . . . . . . . . . . . . . . . . . . . . . . . . . . . . . . . . . . . . . . . . . . . . . . . . . . 831 831 390 390Other receivables . . . . . . . . . . . . . . . . . . . . . . . . . . . . . . . . . . . . . . . . . . . . . . . 1,096 1,096 1,441 1,441
9,155 9,155 12,206 12,206Discontinued operations/assets held for sale . . . . . . . . . . . . . . — — 37 37
Total Financial Assets . . . . . . . . . . . . . . . . . . . . . . . . . . . . . . . . . . . . . . . . 9,155 9,155 12,243 12,243
DERIVATIVES
Derivative financial instruments are used by the Telecom Italia Group to manage its exposure to foreign currencyand interest rate risks and to diversify the parameters of debt so that costs and volatility can be reduced to withinpredetermined operational limits.
Derivative financial instruments at December 31, 2006 are principally used to manage debt positions. Theyinclude interest rate swaps (IRS) to reduce interest rate exposure on fixed-rate and floating-rate bank loans andbonds, as well as cross currency and interest rate swaps (CCIRS) and currency forwards to convert the loanssecured in different foreign currencies to the functional currencies of the various companies of the Group.
F-81
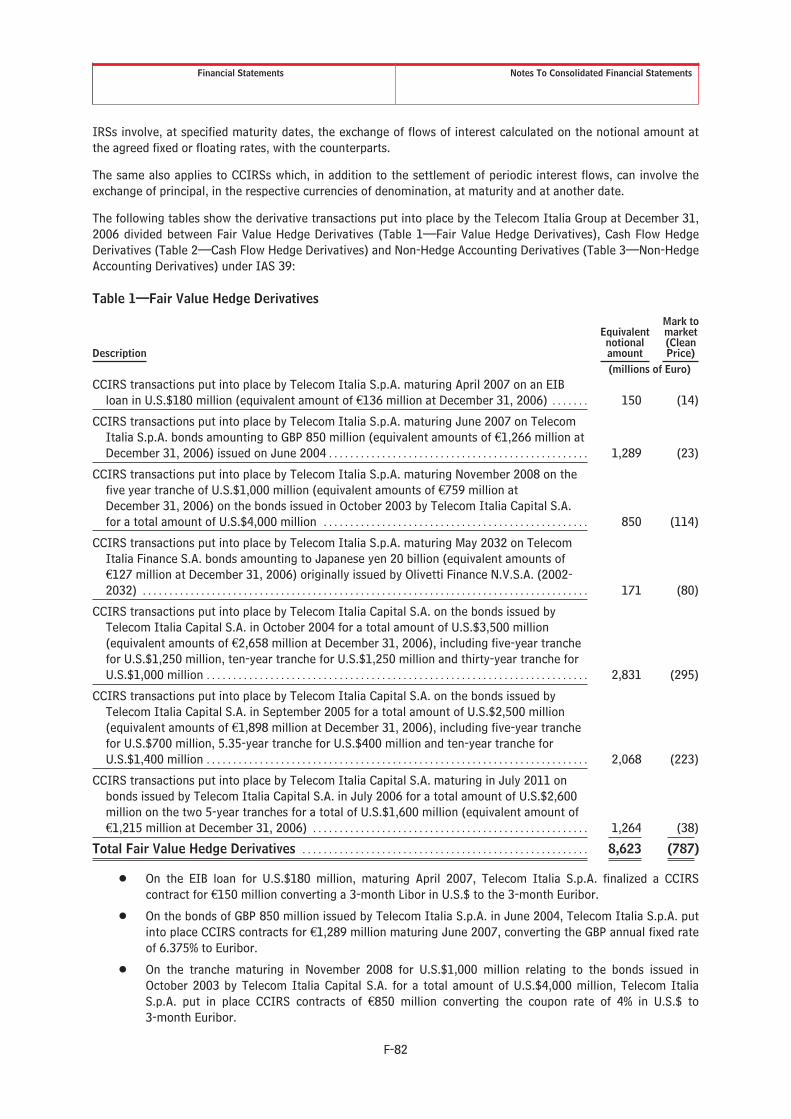
Financial Statements Notes To Consolidated Financial Statements
IRSs involve, at specified maturity dates, the exchange of flows of interest calculated on the notional amount atthe agreed fixed or floating rates, with the counterparts.
The same also applies to CCIRSs which, in addition to the settlement of periodic interest flows, can involve theexchange of principal, in the respective currencies of denomination, at maturity and at another date.
The following tables show the derivative transactions put into place by the Telecom Italia Group at December 31,2006 divided between Fair Value Hedge Derivatives (Table 1—Fair Value Hedge Derivatives), Cash Flow HedgeDerivatives (Table 2—Cash Flow Hedge Derivatives) and Non-Hedge Accounting Derivatives (Table 3—Non-HedgeAccounting Derivatives) under IAS 39:
Table 1—Fair Value Hedge Derivatives
Description
Equivalentnotionalamount
Mark tomarket(CleanPrice)
(millions of Euro)CCIRS transactions put into place by Telecom Italia S.p.A. maturing April 2007 on an EIB
loan in U.S.$180 million (equivalent amount of €136 million at December 31, 2006) . . . . . . . 150 (14)
CCIRS transactions put into place by Telecom Italia S.p.A. maturing June 2007 on TelecomItalia S.p.A. bonds amounting to GBP 850 million (equivalent amounts of €1,266 million atDecember 31, 2006) issued on June 2004 . . . . . . . . . . . . . . . . . . . . . . . . . . . . . . . . . . . . . . . . . . . . . . . . . 1,289 (23)
CCIRS transactions put into place by Telecom Italia S.p.A. maturing November 2008 on thefive year tranche of U.S.$1,000 million (equivalent amounts of €759 million atDecember 31, 2006) on the bonds issued in October 2003 by Telecom Italia Capital S.A.for a total amount of U.S.$4,000 million . . . . . . . . . . . . . . . . . . . . . . . . . . . . . . . . . . . . . . . . . . . . . . . . . . 850 (114)
CCIRS transactions put into place by Telecom Italia S.p.A. maturing May 2032 on TelecomItalia Finance S.A. bonds amounting to Japanese yen 20 billion (equivalent amounts of€127 million at December 31, 2006) originally issued by Olivetti Finance N.V.S.A. (2002-2032) . . . . . . . . . . . . . . . . . . . . . . . . . . . . . . . . . . . . . . . . . . . . . . . . . . . . . . . . . . . . . . . . . . . . . . . . . . . . . . . . . . . . 171 (80)
CCIRS transactions put into place by Telecom Italia Capital S.A. on the bonds issued byTelecom Italia Capital S.A. in October 2004 for a total amount of U.S.$3,500 million(equivalent amounts of €2,658 million at December 31, 2006), including five-year tranchefor U.S.$1,250 million, ten-year tranche for U.S.$1,250 million and thirty-year tranche forU.S.$1,000 million . . . . . . . . . . . . . . . . . . . . . . . . . . . . . . . . . . . . . . . . . . . . . . . . . . . . . . . . . . . . . . . . . . . . . . . . 2,831 (295)
CCIRS transactions put into place by Telecom Italia Capital S.A. on the bonds issued byTelecom Italia Capital S.A. in September 2005 for a total amount of U.S.$2,500 million(equivalent amounts of €1,898 million at December 31, 2006), including five-year tranchefor U.S.$700 million, 5.35-year tranche for U.S.$400 million and ten-year tranche forU.S.$1,400 million . . . . . . . . . . . . . . . . . . . . . . . . . . . . . . . . . . . . . . . . . . . . . . . . . . . . . . . . . . . . . . . . . . . . . . . . 2,068 (223)
CCIRS transactions put into place by Telecom Italia Capital S.A. maturing in July 2011 onbonds issued by Telecom Italia Capital S.A. in July 2006 for a total amount of U.S.$2,600million on the two 5-year tranches for a total of U.S.$1,600 million (equivalent amount of€1,215 million at December 31, 2006) . . . . . . . . . . . . . . . . . . . . . . . . . . . . . . . . . . . . . . . . . . . . . . . . . . . . 1,264 (38)
Total Fair Value Hedge Derivatives . . . . . . . . . . . . . . . . . . . . . . . . . . . . . . . . . . . . . . . . . . . . . . . . . . . . . . 8,623 (787)
Š On the EIB loan for U.S.$180 million, maturing April 2007, Telecom Italia S.p.A. finalized a CCIRScontract for €150 million converting a 3-month Libor in U.S.$ to the 3-month Euribor.
Š On the bonds of GBP 850 million issued by Telecom Italia S.p.A. in June 2004, Telecom Italia S.p.A. putinto place CCIRS contracts for €1,289 million maturing June 2007, converting the GBP annual fixed rateof 6.375% to Euribor.
Š On the tranche maturing in November 2008 for U.S.$1,000 million relating to the bonds issued inOctober 2003 by Telecom Italia Capital S.A. for a total amount of U.S.$4,000 million, Telecom ItaliaS.p.A. put in place CCIRS contracts of €850 million converting the coupon rate of 4% in U.S.$ to3-month Euribor.
F-82

Financial Statements Notes To Consolidated Financial Statements
Š For €171 million, on the bonds 2002-2032 of JPY 20 billion with a 3.55% fixed rate coupon maturingMay 2032, originally issued by Olivetti Finance N.V.S.A., the following transactions were put into place:
– by Telecom Italia Finance S.A., an IRS contract in which Telecom Italia Finance S.A. receives thesemiannual coupon of 3.55% in JPY and pays a semiannual floating rate in JPY;
– by Telecom Italia S.p.A., a CCIRS contract, on a floating rate intragroup loan in JPY, in whichTelecom Italia S.p.A. receives 6-month Libor in JPY and pays 6-month Euribor.
Š On the bonds of U.S.$3,500 million issued by Telecom Italia Capital S.A. in October 2004, Telecom ItaliaCapital S.A. put in place CCIRS contracts for €2,831 million converting the coupon rate in U.S.$ to the6-month Euribor.
Š On the bonds of U.S.$2,500 million issued by Telecom Italia Capital S.A. in September 2005, TelecomItalia Capital S.A. put in place CCIRS contracts for €2,068 million converting the coupon rate in U.S.$ tothe 6-month Euribor.
Š On the two tranches maturing July 2011 for U.S.$1,600 million of bonds for a total of U.S.$2,600 millionissued by Telecom Italia Capital S.A. in July 2006, Telecom Italia Capital S.A. put into place CCIRScontracts for €1,264 million converting the coupon rate (respectively, of 6.2% in U.S.$ and the 3-monthU.S.$ Libor + 0.61%) to the 6-month Euribor.
Tab. 2—Cash Flow Hedge Derivatives
DescriptionNotionalamount
Mark toMarket(CleanPrice)
(millions of Euro)Forward purchase transactions of U.S.$3 million (equivalent amount of €2 million at
December 31, 2006) put into place by Telecom Media News S.p.A. with monthly maturitiesbetween January 2007 and December 2008 . . . . . . . . . . . . . . . . . . . . . . . . . . . . . . . . . . . . . . . . . . . . . . . . 2 —
U.S.$ Call / EUR Put options purchased by Telecom Media News S.p.A. maturing December2009, December 2010 and February 2011 . . . . . . . . . . . . . . . . . . . . . . . . . . . . . . . . . . . . . . . . . . . . . . . . . . 3 —
Commodity swaps put into place by Telecom Italia S.p.A. on behalf of Telenergia S.r.l. for thepurchase of electrical energy in 2007 . . . . . . . . . . . . . . . . . . . . . . . . . . . . . . . . . . . . . . . . . . . . . . . . . . . . . . . 89 (6)
IRS transactions put into place by Telecom Italia S.p.A. maturing March 2009 on notes of€110 million issued by Telecom Italia S.p.A. (2004-2009) . . . . . . . . . . . . . . . . . . . . . . . . . . . . . . . . . . . 110 3
IRS transactions put into place by Telecom Italia S.p.A. maturing January 2010 on five-yeartranche C of the Term Loan for a total amount of €12,000 million finalized in December2004 in connection with Cash Tender Offer by Telecom Italia for TIM shares . . . . . . . . . . . . . . . . 3,000 88
CCIRS transactions put into place by Telecom Italia S.p.A. maturing November 2013 onten-year tranche for a total amount of U.S.$2,000 million (equivalent amount of€1,519 million at December 31, 2006) on the bonds issued by Telecom Italia Capital S.A. inOctober 2003 for a total amount of U.S.$4,000 million . . . . . . . . . . . . . . . . . . . . . . . . . . . . . . . . . . . . . . 1,709 (267)
IRS transactions put into place by Telecom Italia S.p.A. maturing November 2015 on bonds of€120 million issued by Telecom Italia S.p.A. (2004-2015) . . . . . . . . . . . . . . . . . . . . . . . . . . . . . . . . . . . 120 6
CCIRS transactions put into place by Telecom Italia S.p.A. maturing December 2015 on bondsof GBP 500 million (equivalent amount €745 million at December 31, 2006) issued byTelecom Italia S.p.A. in June 2005 . . . . . . . . . . . . . . . . . . . . . . . . . . . . . . . . . . . . . . . . . . . . . . . . . . . . . . . . . 751 13
CCIRS transactions put into place by Telecom Italia S.p.A. starting June 2007 and maturingJune 2019 on bonds of GBP 850 million (equivalent amount of €1,266 million atDecember 31, 2006) issued by Telecom Italia S.p.A. in June 2004 . . . . . . . . . . . . . . . . . . . . . . . . . . . 1,258 15
CCIRS transactions put into place by Telecom Italia S.p.A. maturing May 2023 on bonds ofGBP 400 million (equivalent amount of €596 million at December 31, 2006) issued byTelecom Italia S.p.A. in May 2006 . . . . . . . . . . . . . . . . . . . . . . . . . . . . . . . . . . . . . . . . . . . . . . . . . . . . . . . . . . 587 (3)
F-83

Financial Statements Notes To Consolidated Financial Statements
DescriptionNotionalamount
Mark toMarket(CleanPrice)
(millions of Euro)IRS transaction put into place by Telecom Italia S.p.A. maturing December 2010 on floating-
rate notes of €1,000 million issued by Telecom Italia S.p.A. in December 2005 and maturingDecember 2012 . . . . . . . . . . . . . . . . . . . . . . . . . . . . . . . . . . . . . . . . . . . . . . . . . . . . . . . . . . . . . . . . . . . . . . . . . . . . 1,000 5
CCIRS transactions put into place by Telecom Italia S.p.A. maturing October 2029 related tothe Telecom Italia Finance S.A. the “Dual-Currency” loan with a notional principal ofJapanese yen 20 billion (equivalent amount of €127 million at December 31, 2006)originally received by Olivetti International Finance N.V . . . . . . . . . . . . . . . . . . . . . . . . . . . . . . . . . . . . 174 (72)
CCIRS transactions put into place by Telecom Italia S.p.A. maturing November 2033 on thirty-year tranche for a total amount of U.S.$1,000 million (equivalent amount of €759 million atDecember 31, 2006) on the bonds issued by Telecom Italia Capital S.A. in October 2003 fora total amount of U.S.$4,000 million . . . . . . . . . . . . . . . . . . . . . . . . . . . . . . . . . . . . . . . . . . . . . . . . . . . . . . . 849 (202)
CCIRS transactions put into place by Telecom Italia S.p.A. maturing July 2036 on the 30-yeartranche of U.S.$1,000 million (equivalent amount of €759 million at December 31, 2006) onthe bonds issued by Telecom Italia Capital S.A. in July 2006 for a total amount ofU.S.$2,600 million . . . . . . . . . . . . . . . . . . . . . . . . . . . . . . . . . . . . . . . . . . . . . . . . . . . . . . . . . . . . . . . . . . . . . . . . . 791 (22)
Total Cash Flow Hedge Derivatives . . . . . . . . . . . . . . . . . . . . . . . . . . . . . . . . . . . . . . . . . . . . . . . . . . . . . . . . 10,443 (442)
Š Forward purchase transactions in U.S.$, for an equivalent amount of €2 million, put into place byTelecom Media News S.p.A. to hedge the exchange rate risk on the commitment to make monthlypayments in U.S.$ from January 2007 to December 2008.
Š U.S.$ call / EUR put options, for an equivalent amount of €3 million, purchased by Telecom Media NewsS.p.A. to hedge the exchange rate risk on the commitment to make monthly payments in U.S.$ fromJanuary 2009 to February 2011.
Š Commodity swaps for €89 million by which Telenergia S.r.l. set the price for a part of the energypurchased at €56.10 per MWh (fixed weighted average price). The contract expires in December 31,2007.
Š On the notes 2004-2009 of €110 million at a quarterly floating rate issued by Telecom Italia S.p.A.maturing March 2009, Telecom Italia S.p.A. put into place an IRS contract converting the 3-monthEuribor to an annual fixed rate of 3.35%.
Š In reference to the term loan for a total amount of €12,000 million finalized in December 2004 inconnection with the cash tender offer for TIM S.p.A., Telecom Italia S.p.A. put into place IRS contractsfor a total amount of €3,000 million converting the 6-month Euribor on tranche C to an annual fixedrate of 3.088%, maturing January 2010.
Š On the tranche maturing in November 2013 of U.S.$2,000 million relating to the bonds issued inOctober 2003 by Telecom Italia Capital S.A. for a total amount of U.S.$4,000 million, Telecom ItaliaS.p.A. put into place CCIRS contracts for €1,709 million converting the coupon rate of 5.25% in U.S.$ toa fixed rate of 5.035% in euro.
Š On the bonds of €120 million at a quarterly floating rate issued by Telecom Italia S.p.A. maturingNovember 2015, Telecom Italia S.p.A. put into place IRS contracts converting the 3-month Euribor toan annual fixed rate of 4.161%.
Š On the bonds 2005-2015 of GBP 500 million issued by Telecom Italia S.p.A. in June 2005, TelecomItalia S.p.A. put into place CCIRS contracts for €751 million converting a rate of 5.625% in GBP to afixed rate of 4.34% in euro.
Š On the GBP 850 million bonds issued by Telecom Italia S.p.A. in June 2004, Telecom Italia S.p.A. putinto place CCIRS contracts for €1,258 million, converting the fixed rate of 6.375% in GBP to a fixed rateof 5.31% in euro, starting June 2007 and maturing June 2019.
F-84

Financial Statements Notes To Consolidated Financial Statements
Š On the bonds 2006-2023 of GBP 400 million issued by Telecom Italia S.p.A. in May 2006, Telecom ItaliaS.p.A. put into place CCIRS contracts for €587 million converting a rate of 5.875% in GBP to a fixed rateof 5.53% in euro.
Š On the notes 2005-2012 of €1,000 million issued by Telecom Italia S.p.A. in December 2005, TelecomItalia S.p.A. put into place IRS contracts converting the Euribor + 0.53% coupon rate to a fixed rate of4.54% in euro up to December 2010.
Š For €174 million, with reference to the Telecom Italia Finance S.A. “Dual Currency” loan with a notionalprincipal of JPY 20 billion and a 5% fixed interest rate with a step-up of +0.45% in U.S.$ maturingOctober 2029, originally received by Olivetti International Finance N.V., equivalent to €127 million atDecember 31, 2006, the following was put in place:
– by Telecom Italia Finance S.A., an IRS contract converting the 5% fixed rate in U.S.$ to the6-month Libor in JPY;
– by Telecom Italia S.p.A., a CCIRS contract with which Telecom Italia S.p.A., with regard to theintragroup loan in JPY, receives 6-month Libor in JPY and pays 6-month Euribor;
– by Telecom Italia S.p.A. an IRS contract converting the semiannual floating rate in euro to a 6.94%fixed rate up to maturity.
Š On the tranche of U.S.$1,000 million maturing in November 2033 relating to the bonds issued inOctober 2003 by Telecom Italia Capital S.A. for a total amount of U.S.$4,000 million, Telecom ItaliaS.p.A. put in place CCIRS contracts for €849 million converting the rate of 6.375% in U.S.$ to the fixedrate of 6% in euro.
Š On the tranche of U.S.$1,000 maturing in July 2036 relating to the bonds issued in July 2006 byTelecom Italia Capital S.A. for a total of U.S.$2,600 million, Telecom Italia S.p.A. put into place CCIRScontracts for €791 million converting the rate of 7.20% in U.S.$ to the fixed rate of 5.88% in euro.
The method used to test the effectiveness, retrospectively and prospectively, of Fair Value Hedge instruments andCash Flow Hedge instruments is the Volatility Risk Reduction (VRR) Test. This test assesses the ratio between theportfolio risk (where the portfolio means the hedging instrument and the item hedged) and the risk of the hedgeditem taken separately. In short, the portfolio risk must be less than the risk of the item hedged:
VRR = 1 – (portfolio risk / risk of the hedged item)
The better the hedging ratio, the more VRR tends to the value 1. To establish if a hedge is effective, this ratiomust be higher than the threshold over which the test identifies the hedging as “highly effective” as required byIFRS.
Tab. 3—Non-Hedge Accounting Derivatives
Description
Equivalentnotionalamount
Mark toMarket(CleanPrice)
(millions of Euro)Floating to floating IRS contracts put into place by Telecom Italia S.p.A. . . . . . . . . . . . . . . . . . . . . . 22 —
FRA contracts put into place by Telecom Italia S.p.A. maturing January 2007 . . . . . . . . . . . . . . . . 593 —
FRA contracts put into place by Telecom Italia S.p.A. maturing March 2007 . . . . . . . . . . . . . . . . . . 806 1
FRA contracts put into place by Telecom Italia S.p.A. maturing July 2007 . . . . . . . . . . . . . . . . . . . . 593 —
FRA contracts put into place by Telecom Italia S.p.A. maturing September 2007 . . . . . . . . . . . . . 806 1
Interest rate and foreign exchange contracts put into place by Group companies . . . . . . . . . . . . . 366 4
Total Non-Hedge Accounting Derivatives . . . . . . . . . . . . . . . . . . . . . . . . . . . . . . . . . . . . . . . . . . . . . . . 3,186 6
Š The floating to floating IRS contracts put in place by Telecom Italia S.p.A. for a notional amount of€22 million convert interest on loans indexed on domestic parameters (Rendint, Rolint and Robot) withconversion to the 6-month Euribor.
F-85

Financial Statements Notes To Consolidated Financial Statements
Š Purchase of Forward Rate Agreements (FRA):
– for a notional amount of €593 million, through which in January 2007 Telecom Italia S.p.A. willreceive the 6-month Euribor at the January 2007 fixing and will pay a fixed rate of 3.83% relatingto a period of 6 months. The FRAs purchased are for the management of risks associated with apossible increase in the short-term rates in euro;
– for a notional amount of €806 million, through which in March 2007 Telecom Italia S.p.A. willreceive the 6-month Euribor at the March 2007 fixing and will pay a fixed rate of 3.91% relating toa period of 6 months. The FRAs purchased are for the management of risks associated with apossible increase in the short-term rates in euro;
– for a notional amount of €593 million, through which in July 2007 Telecom Italia S.p.A. will receivethe 6-month Euribor at the July 2007 fixing and will pay a fixed rate of 3.99% relating to a period of6 months. The FRAs purchased are for the management of risks associated with a possible increasein the short-term rates in euro;
– for a notional amount of €806 million, through which in September 2007 Telecom Italia S.p.A. willreceive the 6-month Euribor at the September 2007 fixing and will pay a fixed rate of 3.91% for 6months. The FRAs purchased are for the management of risks associated with a possible increasein the short-term rates in euro.
Š Interest rate and foreign exchange contracts amount to €366 million, of which €88 million are carriedby companies in Brazil.
The following table shows the derivative financial instruments of the Telecom Italia Group by type:
Type Hedged riskNotionalamount
Mark toMarket Spot(Clean Price)
as ofDecember 31,
2006
Mark toMarket Spot(Clean Price)
as ofDecember 31,
2005(millions of Euro)
Interest Rate Swaps . . . . . . . . . . . . . . . Interest Rate Risk — — —Cross Currency and Interest Rate
Swaps . . . . . . . . . . . . . . . . . . . . . . . . . .
Interest Rate Risk and ForeignCurrency Exchange Rate Risk 8,623 (787) (62)
Total Fair Value Hedge Derivatives . . . . . . . . . . . . . . . . . . . . . . . . . . . . . . . . . . . 8,623 (787) (62)
Interest Rate Swaps . . . . . . . . . . . . . . . Interest Rate Risk 4,230 102 13Cross Currency and Interest Rate
Swaps . . . . . . . . . . . . . . . . . . . . . . . . . .
Interest Rate Risk and ForeignCurrency Exchange Rate Risk 6,119 (538) (405)
Commodity Swap . . . . . . . . . . . . . . . . . Commodity Risk 89 (6) —Forward and Forex Options . . . . . . . . Foreign currency exchange rate risk 5 — —
Total Cash Flow Hedge Derivatives . . . . . . . . . . . . . . . . . . . . . . . . . . . . . . . . . . . 10,443 (442) (392)
Non-Hedge Accounting Derivatives . . . . . . . . . . . . . . . . . . . . . . . . . . . . . . . . . . . 3,186 6 (19)
Total Telecom Italia Group Derivatives . . . . . . . . . . . . . . . . . . . . . . . . . . . . . . . 22,252 (1,223) (473)
F-86

Financial Statements Notes To Consolidated Financial Statements
The following table shows, for Cash Flow Hedge Derivatives, the amount recognized in the Reserve for fair valueadjustments to hedging derivatives during 2006 and the portion reversed from the reserve to the statement ofincome as an exchange rate adjustment, before the relative tax effect:
Description
Reserve forfair value
adjustmentsto Cash Flow
Hedgederivatives atDecember 31,
2006
Reserve forfair value
adjustmentsto Cash Flow
Hedgederivatives atDecember 31,
2005
Mark to Marketchange
recognized inthe Reserve for
fair valueadjustments to
hedgingderivatives
Amountreversed fromthe Reserve for
fair valueadjustments to
hedgingderivatives to
the statement ofincome as
an exchangerate adjustment
Impact of CashFlow Hedge
derivatives in2006 on the
Reserve for fairvalue
adjustments tohedging
derivatives(millions of Euro)
Cash Flow Hedge Derivatives . . . (69) (311) (48) 290 242
NOTE 25—FINANCIAL ASSETS PLEDGED AS COLLATERAL FOR FINANCIAL LIABILITIES
The contracts for subsidized loans granted by the Brazilian development bank BNDES (Banco Nacional deDesenvolvimento Econômico e Social) to certain operating companies of the Tim Brasil Serviços e ParticipaçõesS.A. group for a total equivalent amount of €434 million are guaranteed by a part of the receipts of thosecompanies which pass through bank accounts that are pledged in favor of BNDES. The bank will have access tosuch amounts only in the case of default by the company, otherwise the funds will be automatically transferred toaccounts on which the company has full access.
NOTE 26—CONTINGENT ASSETS AND LIABILITIES, COMMITMENTS AND OTHER GUARANTEES
The main legal and arbitration proceedings in which companies of the Telecom Italia Group were involved as ofDecember 31, 2006 are described below. Except where explicitly mentioned, provisions have not been made, asthere is not an adequate objective basis for doing so or because a negative outcome of the dispute is consideredunlikely.
a) Contingent liabilities
TAX AUDIT OF BLU
On January 26, 2007 Telecom Italia received the report containing the Revenue Agency’s preliminary findings ofthe tax audit of the 2002 merger of Blu into TIM.
The audit began in July 2004 for financial years 2000 (only for purposes of value-added tax) and 2002 (for bothvalue-added tax and income taxes) of Blu. In March 2005, the Revenue Agency extended the audit to TIM’s 2002financial year and the tax consequences of the merger, whose tax effects were backdated to January 1 of thatyear.
Blu was the subject of a complex break-up operation, carried out with the full accord of the Government and thevarious regulatory authorities involved, that entailed the transfer of three distinct business units from Blu to Wind,Vodafone-Omnitel and H3G, respectively, and the transfer of 100% of its share capital to TIM.
Towards the end of 2002, TIM, because of the business reasons underlying the merger, petitioned the taxauthorities not to apply the anti-avoidance provisions of the tax law, which would have prevented TIM from usingBlu’s prior-year tax losses (amounting to €857 million). The tax authorities in a ruling dated March 6, 2003,allowed the waiver on the basis of anti-avoidance rules.
The Revenue Agency increased its focus on this matter during their audit and the above-mentioned waiver hasbeen challenged on the basis that the merger of Blu had not created the business synergies and values suggestedin the petition. The Revenue Agency claims that the petition had given an incomplete or even misleadingdescription of the terms of the transaction and that such transaction should be considered as a tax avoidancescheme.
F-87
Financial Statements Notes To Consolidated Financial Statements
On these grounds, the report of preliminary findings sets out the following assessments (which would involveadditional income taxes totaling €465 million in connection with TIM’s 2002 financial year):
Š First assessment: disallowance of the tax saving (€156 million) resulting from the backdating of themerger;
Š Second assessment: disallowance of the right to use Blu’s prior-year tax losses (corresponding to€309 million in terms of additional taxes due).
The rationale for both assessments is the alleged tax-avoidance purpose of the whole transaction, theconsequence being not only the (unprecedented) revocation of the ruling already issued by the Revenue Agencybut also, in connection with the first assessment, the denial of the tax deduction arising from the retroactivity ofthe merger. In addition, the report alleges that the write-downs and losses deducted for tax purposes by theformer shareholders of Blu in relation with their investment, before the sale to TIM, would in any case reduce theprior-year losses of Blu that could be utilized by Tim by an equal amount (€625 million in total) inasmuch as thetax rule designed to prevent double deduction of losses is in the nature of a “systematic” rule, not an anti-avoidance provision, and therefore cannot be waived upon request of the taxpayer.
In relation to this entire matter the Company, based on authoritative opinions, considers that it can validly appealin all the administrative and, if necessary, civil courts, and accordingly has not deemed it appropriate to make anyprovisions in the financial statements.
The Turin Office of the Revenue Agency must evaluate the validity of the objections and of the Company’s repliesbefore deciding whether and for what amount to proceed with the assessment.
A copy of the report has been transmitted to the public prosecutor at the Turin Court.
FASTWEB
In December 2006 Fastweb notified Telecom Italia of the start of an arbitration proceeding under the arbitrationclause of the interconnection contract concluded between the parties in January 2000, alleging non-performancein connection with the fixed-mobile termination fees charged from January 1, 2000 to the end of November 2006.
Specifically, Fastweb asserts that Telecom Italia violated the obligation, imposed by the regulations in force onfirms with dominant market power, to apply cost-related, non-discriminatory fees. The consequent request fordamages amounts to approximately €70 million.
In December 2006 Fastweb also notified Telecom Italia that it had sent a petition to the National RegulatoryAuthority under Article 23 of the Communications Code and Resolution 148/01/CONS (for the resolution ofdisputes between operators) claiming “the termination charges on Telecom Italia’s mobile network to be invalidand therefore no longer applicable”, and requesting the Authority to establish “new termination charges inconformity with the regulations in force”.
Telecom Italia filed a counterclaim in the arbitration proceeding, challenging Fastweb’s statements.
* * *
In January 2007 the award was issued in the arbitration proceeding initiated by Fastweb in 2005 for allegednon-performance by Telecom Italia of the contract for the supply of unbundled local access services (“Local LoopUnbundling”). The arbitration board recognized non-performance and ordered the Company to pay damages ofapproximately €61 million. A specific provision has been made in the financial statements for 2006.
The dispute concerned a claim by Fastweb for €168 million of damages in relation to more than 21,000 customerswho were allegedly taken away by Telecom Italia between 2002 and 2005 as a result of non-activation ofunbundled lines. The award ascertained non-performance by the Company in about 11,000 cases, compared witha total of some 550,000 requests by Fastweb for activation of unbundling in the period considered (up to April 30,2005). The Company intends to challenge the award before the Rome Court of Appeal.
* * *
F-88

Financial Statements Notes To Consolidated Financial Statements
In November 2006 Fastweb initiated a proceeding before the Milan Court of Appeal to have Telecom Italia paydamages of €522 million resulting from violations already punished by the Antitrust Authority in Case A-351(which ended with Telecom Italia being ordered to pay a fine of €115 million for anti-competitive conduct).
Telecom Italia has defended the case, arguing that Fastweb’s requests are unfounded and inadmissible.
* * *
Still pending is the arbitration proceeding that Telecom Italia initiated in December 2005 with Fastweb(concerning “inverse termination”) with a view to obtaining a decision recognizing: (i) that Fastweb had breachedthe interconnection contract concluded on January 28, 2000 by unilaterally altering the economic conditions fortermination on Fastweb’s fixed network of traffic developed towards geographical numbers; (ii) that the value oftermination on the Fastweb network be determined in accordance with the principle of reciprocity; and (iii) thatTelecom Italia did not owe the larger sums requested by Fastweb applying its “self-determined” terminationcharges.
Specifically, Telecom Italia seeks to obtain a decision finding that Fastweb breached the January 2000interconnection contract and consequently recognizing the applicability, for termination on Fastweb’s fixednetwork in the period from January 1, 2004 to June 30, 2006, of the contractual price (€0.55 per minute) insteadof the higher price that Fastweb demanded and billed (€2.71 per minute). The time limit for the publication of thearbitration award will expire on May 31, 2007.
EUTELIA
In January 2007, Eutelia S.p.A. brought an action against Telecom Italia, claiming damages of €50 million inrelation to the omission from Telecom Italia bills, in the space reserved to telephone traffic towards specialnumbers, of the name of the new operator (Voiceplus) to which the numbers to these value-added servicespreviously assigned to Eutelia, had consequentely been trasferred.
According to Eutelia, Telecom Italia omitted the new assignee’s name from the telephone bills it sent to its ownsubscribers with a view to harming Eutelia’s image and business reputation. Eutelia asserts that as a consequenceof the omission it is involved in disputes initiated by final users who contend they never requested the telephonyservices supplied by Voiceplus.
Telecom Italia intends to defend the case, disputing Eutelia’s claims.
* * *
In January 2007, Eutelia brought a further action claiming damages of not less than €40 million in relation toalleged abuse of dominant position by Telecom Italia in the form of illegitimately disconnecting the lines ofcustomers of the operator Grapes Network Services Srl who were about to move over to Eutelia as a result of thetransfer to Eutelia of the contracts for voice and data transmission with business and retail customers from theGrapes Network Services Srl.
Telecom Italia intends to defend the case, disputing Eutelia’s claims.
* * *
Furthermore, in February 2007, Eutelia also brought an action before the Milan Court of Appeal against TelecomItalia for alleged abuse of dominant position in the markets for access to the switched and voice telephonynetworks, related to the offer called “Casa Vacanza”.
The alleged abuses consist, in general, of charging an unjustifiably high fee for the basic telephone line andapplying a below-cost fee for additional telephone lines in the name of the same customer (with the “CasaVacanza” offer), and, lastly, in coupling (with the “Hello Gratis” offer) an hour and half of free traffic every twomonths with the access service (i.e. the subscription fee).
F-89

Financial Statements Notes To Consolidated Financial Statements
In essence, Eutelia alleges that the subscription fee for the basic residential line (currently €14.57 per month)generates monopoly excessive profits enabling Telecom Italia to compensate for the costs of access services forthe customer’s principal line, subsidize the cost of the access service for the same customers’ secondary lines andfinance the costs of the hour and half of traffic offered free of charge every two months for all the lines held bythe same customer. Eutelia claims damages of €150 million.
Telecom Italia intends to defend the case, arguing that Eutelia’s claims are unfounded.
* * *
The proceeding initiated by Eutelia in December 2005 with an urgent petition filed pursuant to Article 700 of theItalian Code of Civil Procedure and Article 33 of Law No. 287/1990 claiming abusive conduct by Telecom Italia onthe broadband access markets is still pending. The alleged abuses consisted of the non-execution or delayedexecution by Telecom Italia of requests to activate Eutelia’s ADSL service for Eutelia’s customers or in theactivation of Telecom Italia’s ADSL service for customers who had not requested it, thereby preventing them fromusing the ADSL service offered by Eutelia. In addition, Eutelia asserts that Telecom Italia’s refusal to activateso-called “data only” ADSL lines’ inasmuch as these were separate from the telephony service offered by TelecomItalia constituted an abuse of dominant position. Eutelia claims total damages of €40 million.
Telecom Italia is defending the case, arguing that Eutelia’s claims are without merit.
* * *
A proceeding initiated by Eutelia in November 2006 before the Milan Court of Appeal is also still pending. Euteliaalleges that Telecom Italia committed abuses on the broadband access market by applying anti-competitiveprices to Eutelia and has claimed damages, to be quantified, for alleged losses. Telecom Italia has disputedEutelia’s allegations and has requested that this proceeding be brought together with that initiated by Eutelia inDecember 2005, described in the preceding paragraph.
NHAI
The action brought by Nhai S.r.l. (formerly Help S.p.A.) in September 2005 is still pending. Nhai’s purpose inbringing the action was to establish that in the first half of the 1990s Telesoft (subsequently merged into TelecomItalia), in its capacity as a member of the CREATT, a Consortium for Automatic Telephone Traffic Data Collectionand Processing, (whose participants included the petitioner and Telesoft) had competed with the consortium, inviolation of the obligations provided for in the consortium’s agreements and the articles of association. Nhaiconsequently asked that Telecom Italia be ordered to pay damages of between €16 million and €25 million for thelosses incurred by the consortium and by Help, for its share, in connection with the orders not received.
Nhai also alleged that Telesoft, during the life of CREATT, had appropriated software developed by Help, inviolation of the agreements between the members of the consortium, and for this it claimed damages of €1million.
Telecom Italia is defending the case, arguing that Nhai’s claims are unfounded and inadmissible.
GALACTICA
The dispute initiated in 2000-2001 by the Internet Service Provider Galactica owing to Telecom Italia’s allegednon-performance of an “experimental contract” for the supply of connectivity and in relation to conduct on thepart of Telecom Italia allegedly constituting acts of unfair competition under Article 2598 of the Italian Civil Codeis still pending. Galactica’s claims for damages amount to more than €90 million.
In the proceedings Telecom Italia has argued that Galactica’s claims are unfounded and has filed a counterclaimfor Galactica to be ordered to pay more than €5 million as consideration for the increase in traffic in the periodJanuary-July 2001.
F-90
Financial Statements Notes To Consolidated Financial Statements
VODAFONE
In October 2006, Telecom Italia filed an urgent petition with the Rome Court for an injunction on any actionaimed at promoting, advertising or marketing, including preselling, the ‘Vodafone Casa Numero Fisso’ offer.Partially granting Telecom Italia’s petition with an order issued on November 29, 2006 the court enjoinedVodafone from any further marketing and preselling of the “Vodafone Casa Numero Fisso” service involving theoffer to users of the portability of their Telecom Italia fixed line number to the Vodafone mobile network.Vodafone has filed an appeal against this order.
Meanwhile, the Ministry of Communications had authorized Vodafone to supply the service on an experimentalbasis with a decision issued on December 7, 2006. Telecom Italia challenged the authorization and petitioned fora suspension of its execution. In February 2007 the Lazio Administrative Court granted the petition, deeming itnecessary to acquire information from the National Regulatory Authority as to whether the service in questioncould be classified as a fixed-line service and whether Vodafone had a valid authorization and acknowledging thatthere were sufficient indications of serious and irreparable prejudice “at least in a competitive perspective”. TheLazio Administrative Court set a time limit for the National Regulatory Authority to produce the above-mentionedinformation, pending which it suspended the enforceability of the authorization. The discussion regarding themerits of the case is scheduled for May 2007.
For the sake of completeness, on December 29, 2006, the National Regulatory Authority decided to begin a publicconsultation on integrated services, including “Vodafone Casa Numero Fisso”.
Since Telecom Italia had suspended negotiations on the inverse interconnection contract underlying the“Vodafone Casa Numero Fisso” offer, on November 2, 2006. Vodafone brought a civil action before the MilanCourt to establish that Telecom Italia had breached its obligation to negotiate the interconnection service andalleging that this refusal constituted unfair competition. Vodafone also petitioned the court to order TelecomItalia to supply the interconnection service immediately and to pay damages in an amount to be determinedduring the trial. Telecom Italia is defending the case, challenging the regularity of all the initiatives undertaken.
* * *
The appeal Telecom Italia filed with the Supreme Court in December 2005 against the decision of October 2005with which the State Council reversed the ruling of the Lazio Regional Administrative Court and annulled NationalRegulatory Authority Resolution 1/CIR/98 (Approval of Telecom Italia’s Reference Interconnection Offer) is stillpending.
The question originated from a claim with which Omnitel (now Vodafone) challenged the part of Resolution1/CIR/98 establishing that, pursuant to a ministerial decree issued on April 23, 1998, the new economicconditions for interconnections would become effective for the existing GSM licence-holders (TIM and Omnitel)from July 25, 1998 (the date Telecom Italia’s reference offer was submitted) rather than retroactively fromJanuary 1, as envisaged for the fixed-network operators.
In November 2005, following the State Council’s decision in favour of Vodafone’s claim transmitted an extra-judicial request to Telecom Italia for the restitution of more than €16 million in alleged overpayments forinterconnection services supplied between January 1 and July 24, 1998. The sum has not been paid because ofthe appeal pending before the Supreme Court.
* * *
Proceedings, under Article 33 of Law No. 287/1990, are underway before the Milan Court of Appeal in the actionbrought by Vodafone against Telecom Italia in July 2006 for damages amounting to approximately €525 million inrelation to Telecom Italia’s alleged abuse of dominant position consisting of the exploitation of its position infixed telephony markets to strengthen its position in the contiguous market for mobile communication serviceswith exclusionary effects to the detriment of its competitor.
According to Vodafone, Telecom Italia had abused its dominant position in the fixed telephony market and takenadvantage of its market power in the supply of mobile telephony services and the recent restructuring of the
F-91

Financial Statements Notes To Consolidated Financial Statements
group with the organizational and functional integration of Telecom Italia and TIM by: (a) exploiting theinformation it held as the incumbent fixed telephony operator to create client profiles and offer targeted mobilecommunication services and combined fixed/mobile services; (b) using strategic information regarding fixedtelephony to compete in the mobile telephony market with offers that competitors could not replicate; (c) offeringdiscounts for fixed telephony services to take clients away from Vodafone in the mobile telephony market; and(d) using the “187” service to promote mobile communication services.
The conduct in question is alleged to have concerned business as well as retail customers and to have violated thelaw on the protection of personal data.
During the trial Vodafone produced certain documental evidence of the abusive conduct of which it accusesTelecom Italia and increased its July 2006 claim for damages to €759 million as of December 31, 2006.
Telecom Italia is defending the case, challenging Vodafone’s claims.
IL NUMERO ITALIA
The action initiated in September 2005 by Il Numero Italia S.r.l. and its subsidiary DA Directory AssistanceCompany S.r.l. for damages of approximately €92 million for unfair competition in relation to the alleged violationby Telecom Italia of National Regulatory Authority Resolution 15/04/CIR (concerning assignment of the rights touse new numbers of the “12xy” series for subscriber information services) is still pending.
Telecom Italia has filed a counterclaim for about €100 million for unfair competition in the form of misleading anddenigratory comparative advertising.
TELE2
The following actions involving Tele2, are currently pending:
Š the action brought by Tele2 in May 2005 requesting an injunction—and payment of related damagesamounting to approximately €100 million—relating to the alleged abuse of dominant position byTelecom Italia consisting in the application to all users, including the customers of other operators, of adiscount equal to one hour of local telephone calls for residential and non-residential customers and tohalf an hour of long-distance calls for residential customers every two months (the offer known as“Hello Gratis”);
Š the action brought by Tele2 (following an urgent petition upheld in September 2005 with an ordersubsequently revoked after Telecom Italia had lodged a complaint) requesting an injunction—andpayment of related damages amounting to approximately €15 million—on the alleged abuse ofdominant position by Telecom Italia in connection with the wholesale offer of ADSL broadband dataaccess (with special reference to Telecom Italia’s application in the [email protected] contract of the obligationto buy at least 5 hours of traffic);
Š the action brought by Tele2 in December 2005 (subsequent to an urgent petition under Article 700 ofthe Italian Code of Civil Procedure and Article 33 of Law No. 287/1990) calling for payment by TelecomItalia of damages amounting to more than €18 million deriving from alleged abusive conduct on thebroadband access market by Telecom Italia consisting of the non-execution or delayed execution oforders from Tele2 to activate ADSL service for its own customers or in the activation of Telecom Italia’sADSL service for customers who had never requested it, thereby preventing them from using the ADSLservice offered by Tele2;
Š the action brought by Telecom Italia in March 2005 against Tele2 and Tele2 AB calling for the paymentof approximately €200 million of damages in connection with alleged unfair competition by Tele2 inrelation to comparative advertising campaigns it had run that were misleading and denigratory ofTelecom Italia. Tele2 subsequently filed a counterclaim (for an amount of approximately €100 million)in connection with alleged anticompetitive conduct of Telecom Italia.
TISCALI
The action regarding so-called shared access brought by Tiscali before the Court of Rome in December 2005 isstill pending. The merits of the case are now being examined following the ruling—unfavourable to TelecomItalia—on the preliminary petition Tiscali made in early in 2005.
F-92
Financial Statements Notes To Consolidated Financial Statements
In this court case, Tiscali has requested Telecom Italia’s obligation, established in the preliminary petition, to beconfirmed and for the Company to be required to pay damages, as quantified during the case, for the loss ofrevenue caused by the impossibility of providing the ADSL service to retail customers and for the harm done toTiscali’s image and reputation.
Telecom Italia is defending the case. The case dates back to the shared access service supply contract concludedbetween Telecom Italia and Tiscali on July 27, 2004. The contract called for Tiscali to be supplied unbundledshared access to the connections of Telecom Italia’s copper distribution network (with which Telecom Italiacontinues to supply final customers with voice telephony, while Internet access is provided by another operator,Tiscali in the case in question). According to Tiscali, requests to activate the shared access service for numerouscustomers met with a refusal by Telecom Italia to free up the lines with which it provides Internet access services(marketed under the trademarks “Alice” and “Tin.it”) to final customers, so that Telecom Italia customers whoopted to use Tiscali’s Internet access services in place of those supplied by Telecom Italia were in fact unable toextricate themselves from Telecom Italia, which was therefore violating both its contractual obligations in respectof Tiscali and the rules laid down by the National Regulatory Authority.
ALICE 20 MEGA
In November 2006 the Lazio Regional Administrative Court published its ruling upholding the claim submitted bythe Italian Association of Internet Providers to suspend and void the decision of the National Regulatory Authorityauthorizing Telecom Italia’s offer of access to ADSL services up to 20 Mbit/sec (“Alice 20 Mega”), together with awholesale offer based on managed IP solutions. According to the claim, the wholesale offer, as configured, didnot allow competitors to replicate the offer to final customers. Telecom Italia has appealed the AdministrativeCourt ruling before the Council of State.
In the meantime, however, in a resolution notified to the Company on February 13, 2007, the National RegulatoryAuthority, while approving the offer of “wholesale flat ADSL with individual access and downstream access speedsup to 20 Mbit/sec using Ethernet IP technology” (presented in December 2006 and characterized by technicalaccess parameters corresponding to those of the retail “Alice 20 Mega” service), authorized the marketing of“Alice 20 Mega” again. The National Regulatory Authority considered that the marketing of wholesale ADSL offersthat meet the requirements of replicability made the overall offer consistent with the ruling of the Lazio RegionalAdministrative Court.
PRESUMED VIOLATIONS OF ANTITRUST LAW (CASE A-285)
In a judgment handed down on January 10, 2007, the Council of State partially upheld the cross appeal by theNational Regulatory Authority against the decision of the Lazio Regional Administrative Court concerning fine no.9472 imposed by the Antitrust Authority on April 27, 2001 at the end of case A-285 for Telecom Italia’s abuse ofdominant position in the supply of ADSL services. The fine was equal to €59.4 million which the AdministrativeCourt’s judgment reduced to about €29.4 million, which the Company paid under protest in January 2002. TheCouncil of State subsequently increased the fine to approximately €31.7 million. The financial statements for theyear ended December 31, 2006 include the residual amount payable of approximately €2.5 million.
* * *
ANTITRUST PROCEEDING A-357
On February 23, 2005, the Antitrust Authority initiated an investigation of Tim Italia S.p.A. and Telecom ItaliaMobile S.p.A. (now part of Telecom Italia), Vodafone Omnitel N.V. and Wind Telecomunicazioni S.p.A. to establishwhether violations of Articles 81 and 82 of the European Community Treaty had been committed in relation to:
Š refusal to grant alternative operators (MVNO, ESP and ATR) access to the mobile network;
Š the offer to final business customers of integrated fixed/mobile telephony services at prices below theprice of the termination service alone (offered to competitors as an intermediate factor);
Š the offer exclusively to business customers of a technical solution (MSC PABX) permitting them toobtain more advantageous integrated fixed/mobile tariffs;
Š the marketing practices adopted by TIM in relation to business customers.
F-93

Financial Statements Notes To Consolidated Financial Statements
The time limit for completion of the investigation, initially scheduled for December 14, 2006, has been extendedto May 10, 2007. If the investigation should find one or more violations, the Antitrust Authority could impose afine whose size would depend on their seriousness and duration.
ACTIONS UNDER ARTICLE 33 OF LAW No. 287/1990 CONCERNING THE MARKETING OF X-DSLSERVICES
After the completion of the above-mentioned antitrust proceeding no. A-285 with an unfavourable ruling forTelecom Italia and the imposition of a fine, between 2001 and 2005 a number of companies brought actions fordamages against the Company in relation to its alleged abuse of dominant position in the supply of X-DSLservices.
The companies in question were Wind Telecomunicazioni, I.Net S.p.A., Cybernet Italia S.p.A., KPNQwest andITnet S.p.A. In 2001, the proceedings were unified and the total damages claimed amounted to approximately€120 million.
In the past, other operators (including Infostrada, Albacom and the Italian Internet Provider Association) hadbrought similar claims and in 2003 Telecom Italia was ordered to pay damages of approximately €2 million(compared with alleged damages of more than €87.5 million).
Telecom Italia therefore reasonably believes, if the court remains faithful to the earlier ruling, that the damagesawarded are likely to be much less than those claimed by the plaintiffs and Telecom Italia has accordingly createdan appropriate provision for risks and charges.
SOCIAL SECURITY CONTRIBUTION RELIEFS GRANTED TO TIM S.p.A.
In a letter dated February 13, 2007, the National Social Security Institution (INPS) requested Telecom Italia torefund the social security contribution relief received by TIM between 1995 and 2001 in connection with thehiring of workers pursuant to on-the-job training contracts. According to INPS, relief granted under Italian law,constituted, on the basis of the criteria recently specified by the European Union, state aid that was incompatiblewith the standards of free competition of the European common market. INPS requested the Company to refund atotal of €9.6 million, including accrued interest.
The analyses that the Company has carried out so far have not revealed any facts indicating that the above-mentioned relief was irregular.
LEVY PURSUANT TO ARTICLE 20.2 OF LAW No. 448/1948
In a ruling published on July 10, 2006, the Lazio Administrative Court upheld the compliance petition submittedby Telecom Italia and ordered the Ministry for the Economy and Finance and the Ministry for Communications,jointly and severally, to implement the decisions published in January 2005, in which the administrative court hadupheld the appeals filed by TIM and Telecom Italia and ascertained the obligation for the government to returnthe amounts paid as a levy for 1999 under Article 20.2 of Law No. 448/1998 and the related interest accrued inthe meantime (respectively €546 million and over €100 million).
In September 2006, on behalf of the above referenced Ministries, the Avvocatura Generale dello Stato notified anappeal to the Council of State for the suspension of the enforceability and annulment of the administrative court’sruling. On November 7, 2006, the Council of State dismissed the request for a suspension and consequently theMinistry for the Economy and Finance paid the principal amount but not the interest, with the right to itsrestoration depending on the outcome of the appeal.
CECCHI GORI
In relation to the complex set of legal disputes initiated by the Cecchi Gori Group against SEAT (now TelecomItalia Media) and, in particular, the action related to the resolutions adopted on April 27, 2001 by theshareholders’ meetings of Cecchi Gori Communications (now Holding Media Communications) approving theannual report and financial statements for the year ended December 31, 2000 and the cancellation andsubsequent reconstitution of the company’s share capital, in November 2005 the Rome Court of Appeal dismissedthe Cecchi Gori group’s appeal against the ruling of the Rome Court of first instance to reject the petition forannulment of the resolutions. The Rome Court of Appeal’s ruling has been challenged before the Supreme Court.
F-94

Financial Statements Notes To Consolidated Financial Statements
In addition, in a ruling issued in December 2006, the Rome Court of Appeal dismissed the action brought by theCecchi Gori Group against the ruling of the court of first instance dismissing the request to declare null and voidthe resolution of the extraordinary shareholders’ meeting of Cecchi Gori Communications of August 11, 2000concerning amendments to the company’s bylaws. The Cecchi Gori Group has challenged the Rome Court ofAppeal’s ruling before the Supreme Court.
In March 2006, the Milan Court of Appeal dismissed the appeal by the Cecchi Gori Group against the ruling issuedby the court of first instance rejecting the petition for annulment or cancellation of the act pledging the CecchiGori Communications shares owned by Cecchi Gori Media Holding. This ruling has also been challenged before theSupreme Court.
The following claim is still pending before the Court of Milan: an action for damages for illicit extracontractualconduct by the Cecchi Gori Group in relation to the presumed adverse effect caused by the alleged conduct ofSEAT and by the directors it appointed to the board of Cecchi Gori Communications aimed at the removal of themajority shareholder Cecchi Gori Media Holding. The case is currently suspended pending the rulings of theSupreme Court on the other disputes.
BRAZIL
As reported in last year’s Annual Report, on April 28, 2005 we agreed:
Š to settle a series of disputes in different venues involving Telecom Italia and Telecom ItaliaInternational against respectively: (i) Brasil Telecom, for alleged abuses by the Group in extraordinarycorporate actions undertaken by the Brazilian operator; and (ii) Telecom Italia International’s partnersin Solpart Participações (controlling Brasil Telecom through Brasil Telecom Participações) and Solpart,Brasil Telecom Participações and Brasil Telecom in connection with the agreement concluded onAugust 27, 2002 for the temporary reduction from 37.29% to 19% of the Group’s interest in the ordinarycapital of Solpart and the reduction—again temporary—of its governance rights, with an option for therepurchase of the aforesaid equity interest;
Š to amend the shareholders’ agreement among the shareholders of Solpart (Telecom Italia International,Techold and Timepart);
Š to draw up a plan for the merger of Brasil Telecom Celular into Tim Brasil.
Reference was also made in last years’ Annual Report to the beginning of several disputes regarding the above-mentioned agreements in which the Telecom Italia Group was sometimes the plaintiff and sometimes thedefendant, with reciprocal requests for damages, both before the Brazilian courts and in arbitration proceedingsbefore the International Chamber of Commerce of Paris. These disputes are ongoing.
Other developments include:
Š the definitive dismissal of the requests put forward by the association of small shareholders of the listedBrazilian telecommunications companies (ANIMEC) to reconsider the decision of the Brazilian AntitrustAuthority (CADE) recognizing the right of Telecom Italia International to be readmitted to the groupcontrolling Solpart (with some restrictions), with the consequent right to appoint the independentmembers of the Boards of Directors of Solpart, Brasil Telecom Participações and Brasil Telecom;
Š following the termination of the agreement for the merger of Brasil Telecom Celular into Tim Brasil,application has been made for the closure of the related proceedings since the disputed matter nolonger exists. In one of the two proceedings the judge has upheld the request, while in the second thejudge has asked the parties whether they intend to settle the dispute.
CUBA
Since 2002, Banco Nacional de Comercio Exterior (“Bancomext”) has accused ETECSA and Telan (majorityshareholder of ETECSA, controlled by the Cuban government) of non-performance of alleged payment andguarantee obligations amounting to U.S.$300 million established in a series of contracts between ETECSA, Telan,BanCuba (Central Bank of Cuba), Intesa BCI and Bancomext.
F-95

Financial Statements Notes To Consolidated Financial Statements
These accusations were the subject (i) of an action brought by Bancomext in Italy before the Turin court and(ii) of an international arbitration proceeding initiated by Telan and ETECSA, in which they pleaded thatperformance was impossible owing to a Cuban legislative measure prohibiting actions aimed at satisfyingBancomext’s claim.
In the award issued on August 5, 2004, the arbitration board:
Š upheld ETECSA’s argument that it was neither a debtor of Bancomext nor a guarantor of Telan;
Š nonetheless determined that ETECSA was contractually required to satisfy the obligations towardsBancomext deriving from the loan agreement and therefore to restore the procedure envisaged for thepayment of dividends belonging to Telan with a view to satisfying Bancomext.
This decision would oblige ETECSA to transfer around U.S.$147 million to Telan, paying the sum into an escrowaccount in Bancomext’s name.
On May 3, 2005, Bancomext therefore notified ETECSA and Telan of the award, together with a request forpayment of an amount equal to the dividends distributed to Telan from April 2002. The related enforcementproceedings, initially undertaken by Bancomext against Telecom Italia, TI Sparkle and TIM following thedeclaration of the award’s effectiveness in Italy, were subsequently suspended.
In November 2005, at the conclusion of the first-degree trial initiated by Bancomext before the Italian courts, theCourt of Turin ordered ETECSA to pay Bancomext damages of U.S.$168 million and to restore the mechanism forthe payment of dividends belonging to Telan, as contractually provided.
Following the publication of the decision of the Court of Turin (which ETECSA nonetheless appealed), in December2005 Bancomext applied to the Court of Milan (i) to convert the precautionary sequestration of the Company’sclaims on ETECSA, which the Court of Turin had ordered in 2002 as a precautionary measure, into seizure and(ii) to assign Bancomext the sum of €2.8 million due to Telecom Italia, which was therefore paid to Bancomext inSeptember 2006.
In October 2006, at Bancomext’s request, the High Court of Justice-Queen’s Bench Division in London enforcedthe judgment of the Turin Court referred to above by issuing an attachment order covering all ETECSA’s assetsand claims in England and Wales up to GBP 100 million. ETECSA was also enjoined not to dispose of any otherassets or claims, wherever located, up to the same amount.
Lastly, in November 2006 the Paris Court of Appeal upheld ETECSA’s request to declare the above-mentionedarbitration reward null and void. Accordingly, ETECSA applied to the Turin Court of Appeal for the revocation ofthe provisional enforceability of the judgment of the Court of Turin.
GREECE
On January 23, 2007, Telecom Italia, among others, received notice of a claim by TCS Capital Management LLC(TCS) before the United States District Court for the Southern District of New York.
TCS (previously a minority shareholder of Tim Hellas) claimed an indemnity for the losses it allegedly incurredfollowing the sale of Tim International’s interest in Tim Hellas to certain investment funds (which are also calledto respond) and the subsequent cash-out merger carried out by the funds, allegedly to the detriment of theinterests of the minority shareholders of Tim Hellas.
TCS has requested the court to ascertain Telecom Italia’s violation of U.S. law, which is applicable because TimHellas is listed on NASDAQ and to order it to pay punitive damages and legal expenses in an amount to beestablished during the trial.
OTHER LIABILITIES RELATED TO THE DISPOSAL OF ASSETS AND EQUITY INTERESTS
As part of the major disposals of assets and companies in 2006 and in prior years, the Telecom Italia Groupundertook to indemnify the buyers in the event of the companies incurring certain liabilities, normally up to a
F-96

Financial Statements Notes To Consolidated Financial Statements
percentage of the purchase price. The amounts in question mainly refer to contingent liabilities arising fromguarantees contained in the contracts and disputes in the legal, tax, social security and labour law fields.
The financial statements for the year ended December 31, 2006 report €200 million of provisions charged inrespect of these potential obligations. The additional guarantees related to the above-mentioned disposals, whichare considered to represent a remote risk, amounted to approximately €700 million.
The Telecom Italia Group also undertook to indemnify buyers in other cases for which no maximum amount wasfixed, so that it is not possible to estimate the amount that the Company might be requested to pay.
b) Contingent assets
APPEAL AGAINST PAYMENT OF LICENCE FEES FOR 1998
With reference to the appeals submitted by Telecom Italia and TIM regarding their right to the restitution of thelicence fees they paid for 1998 (€386 million for Telecom Italia and €143 million for TIM plus interest), in May2006 the Lazio Administrative Court applied to the European Court of Justice for a ruling on the compatibility withCommunity law of Article 20 of Law No. 488/1998, which, in an already liberalized market, had extended theobligation to pay the licence fee to 1998. The Italian court considered this provision to be potentially in conflictwith Directive 97/13 and therefore to fall within the scope of the European Court’s decision on the illegitimacy ofthe levy provided for in Article 20.2 of Law No. 448/1998, as referred to above.
CONSIP AUCTION
In May 2006, Fastweb was awarded the contract in the auction held by Consip in 2005 for fixed telephony, IPconnectivity and satellite data transmission services for governmental bodies.
With an appeal filed with the Lazio Administrative Court on July 6, 2006 Telecom Italia applied for the suspensionand annulment of the award because of evident anomalies in the economic conditions of Fastweb’s bid. It alsoapplied for the annulment of the Consip letters in which the application for access to the auction documentationwas only partially granted. In fact Fastweb had requested that access be denied to all the tender documentationor at least to the percentage division between local loop unbundling and carrier pre-selection services and the listshowing the geographical distribution and date of takeover of unbundled lines. In examining the application forthe suspension of the award, the court upheld the petition for access to the auction documentation filed byFastweb.
On the basis of the documentation subsequently acquired, Telecom Italia filed a document with additionalgrounds for opposing the acts of the auction committee.
On November 13, 2006 the court ordered a technical appraisal of the overall reliability of the assessment ofnon-abnormality put forward by the auction committee against Fastweb. The technical appraisal began inDecember 2006 and was completed with the filing of the related report on March 28, 2007.
H3G
In July 2006, Telecom Italia notified H3G Italia of the beginning of an arbitration proceeding on the basis of thearbitration clause contained in the agreements concluded between the parties in February 2004 and subsequentlysupplemented in May 2005. These agreements govern, among other things, the prices for mobile networktermination on a reciprocal basis.
The dispute has its origin in H3G’s position regarding the contractual amounts payable, which it claims have beenmodified in its favour by the evolution of the regulatory framework.
Consequently, Telecom Italia has called for verification, through arbitration, of H3G’s failure to fulfill itscontractual obligations and the determination of the amount of the losses H3G must make good.
F-97
Financial Statements Notes To Consolidated Financial Statements
ACTIONS BROUGHT AGAINST OTHER OPERATORS FOR UNFAIR COMPETITION AND VIOLATION OFPRIVACY
In October 2006, Telecom Italia submitted an urgent petition to the Rome court, accusing Fastweb, Wind andTele2 of unfair competition. In particular, it applied for the court to declare that the three companies’telemarketing policies violated competition rules because they were based on indiscriminate telephone calls toTelecom Italia’s customers, including some whose numbers were not listed and others who had not consented tosuch contacts (and who therefore should not have been contactable for telephone promotions).
Despite recognizing the legal validity of Telecom Italia’s arguments as a matter of law, in December 2006, thecourt dismissed the claim on the grounds that it failed to adequately prove that Telecom Italia’s competitors hadactually used Telecom Italia’s customers personal data without their prior consent. In January 2007, TelecomItalia submitted an appeal against the court’s order accompanied by the evidence whose absence had led to thedismissal of the petition by the lower court.
The circumstances that led to the above-mentioned petition have also been reported to the Privacy Regulator.
* * *
EMPLOYEE BENEFIT OBLIGATIONS UNDER LAW No. 58/1992
Pursuant to Law No. 58/1992 Telecom Italia is required to provide full national insurance coverage for all theemployees of Stet, Sip, Italcable and Telespazio as of February 20, 1992 as well as for all employees transferredfrom the public administration to the former Iritel through the “Telephone Companies Employees Social SecurityFund”, which on January 1, 2000 became part of the general Employees Pension Fund.
At the present time, the amount of the liability can be estimated only roughly due to disagreements with theNational Social Security Institute (INPS) regarding the calculation of the amounts due and the fact that atDecember 31, 2006 INPS had not yet notified the Company of all the positions to be covered.
The dispute with INPS concerns the application of the criteria established by Law No. 29/1979 for thoseemployees (except for those of the former Iritel) who had already applied for benefits pursuant to this law andwhich had not been processed by INPS. The parties have agreed that the differences in interpretation shall besettled through test appeals before the ordinary magistrate, with recourse to the Court of Appeals being waivedfor a final determination of the law in question. While proceedings are pending, Telecom Italia has agreed to pay,with reservation, the amounts requested by INPS, subject to subsequent equalization adjustments if the Courtsultimately accept the Company’s interpretation. The amounts due were calculated by INPS and are to be paid in15 equal annual deferred installments (including annual interest of 5%), starting when INPS formally submits itsrequests.
The principal amount of the liability attributable to Telecom Italia as of December 31, 2006 was €924 millionrecorded under “Payables to social security authorities” item (€881 million as principal amount and €43 million asaccrued interest, not yet paid), including €215 million due in the short-term.
c) Commitments and other guarantees
Guarantees provided amounted to €330 million, net of €180 million of counter-guarantees received, and consistedmainly of sureties provided by Telecom Italia on behalf of associates (€102 million) and others for medium andlong-term loans.
In addition, the 47.80% interest in Tiglio I and the 49.47% interest in Tiglio II have been pledged to the banksthat financed the two associates.
Purchase and sale commitments at December 31, 2006 amounted to €455 million and €2 million, respectively,and referred to the part of commitments not falling within the normal “operating cycle” of the Group still to befulfilled.
F-98
Financial Statements Notes To Consolidated Financial Statements
The purchase commitments consisted mainly of:
– €164 million of property leasing rentals under contracts lasting more than 6 years;
– €242 million of orders to suppliers of Telenergia in relation to the electricity supply agreements reachedwith Endesa;
– €17 million for the purchase by Telecom Italia Media Broadcasting of radio and television equipment inSicily.
Companies included in the scope of the consolidation issued letters of patronage for a total of €141 million,chiefly on behalf of associates to guarantee insurance policies, lines of credit and overdraft arrangements.
Guarantees provided by third parties for obligations of Group companies referred to loans (€1,934 million) and theperformance of contracts (€295 million). The total included sureties issued by BBVA for €817 million, by SanpaoloIMI for €420 million, by Sumitomo for €73 million, Bank of Tokyo—Mitsubishi UFJ for €86 million, and BancoSantander for €86 million in respect of EIB loans for the following projects: Tim Mobile Network, Telecom ItaliaBreitband Infrastruktur Deutschland and Telecom Italia Media Digital Network.
NOTE 27—REVENUES
Revenues amount to €31,275 million in 2006, €29,919 million in 2005 and €28,292 million in 2004, showing anincrease of €1,356 million in 2006 compared to 2005 (or 4.5%) and an increase of €1,627 million in 2005compared to 2004 (or 5.7%).
Details of revenues are as follows:
Year ended December 31,2006 2005 2004
(millions of Euro)Sales:Š telephone products . . . . . . . . . . . . . . . . . . . . . . . . . . . . . . . . . . . . . . . . . . . 2,002 1,952 1,595Š other sales . . . . . . . . . . . . . . . . . . . . . . . . . . . . . . . . . . . . . . . . . . . . . . . . . . . . 388 362 584
(A) 2,390 2,314 2,179
Services:Š traffic . . . . . . . . . . . . . . . . . . . . . . . . . . . . . . . . . . . . . . . . . . . . . . . . . . . . . . . . . 16,607 15,810 14,960Š subscription charges . . . . . . . . . . . . . . . . . . . . . . . . . . . . . . . . . . . . . . . . . . 8,111 8,133 7,837Š fees . . . . . . . . . . . . . . . . . . . . . . . . . . . . . . . . . . . . . . . . . . . . . . . . . . . . . . . . . . 400 359 327Š Value Added Services (VAS)—mobile telecommunications . . . . . 1,967 1,641 1,314Š fixed fee for recharging prepaid cards . . . . . . . . . . . . . . . . . . . . . . . . . 738 737 617Š other services . . . . . . . . . . . . . . . . . . . . . . . . . . . . . . . . . . . . . . . . . . . . . . . . . 1,022 850 882
(B) 28,845 27,530 25,937
Revenues on construction contracts . . . . . . . . . . . . . . . . . . . . . . . . . . . . (C) 40 75 176
Total . . . . . . . . . . . . . . . . . . . . . . . . . . . . . . . . . . . . . . . . . . . . . . . . . . . . . . . . . . . . . . (A+B+C) 31,275 29,919 28,292
Revenues from telecommunications services are presented gross of amounts due to other TLC operators, equal to€5,721 million in 2006, (up 18.5%), €4,829 million in 2005 (up 13.9%) and €4,241 million in 2004.
In 2006, the increase in the amount due to other TLC operators of €892 million reflects the positive impact of€262 million deriving from changes in operations and regulations regarding the interconnection relationshipsamong the mobile telephone operators in the Brazilian market starting from July 2006 (similarly, there was anincrease in costs for the portion to be paid to other TLC operators).
In 2005, the increase of €588 million is mainly a result of the increase of revenues.
For a breakdown of revenues by business/geographical segment, reference should be made to “Note 40-Segmentinformation”.
F-99

Financial Statements Notes To Consolidated Financial Statements
NOTE 28—OTHER INCOME
Other income amounted to €606 million in 2006, €678 million in 2005 and €1,099 million in 2004, showing adecrease of €72 million in 2006 compared to 2005 and a decrease of €421 million in 2005 compared to 2004.
Details of other income are as follows:
Year ended December 31,2006 2005 2004
(millions of Euro)Compensation for late payment of regulated telephone services . . . . . . . . . . . . . . . . . 91 105 85Release of provisions and other liabilities . . . . . . . . . . . . . . . . . . . . . . . . . . . . . . . . . . . . . . . . 179 228 162Recovery of costs of personnel and services rendered . . . . . . . . . . . . . . . . . . . . . . . . . . . . 60 56 35Capital grants and grants related to income . . . . . . . . . . . . . . . . . . . . . . . . . . . . . . . . . . . . . 42 47 64Damage compensations and penalties . . . . . . . . . . . . . . . . . . . . . . . . . . . . . . . . . . . . . . . . . . . 52 35 32Income from release of prior TLC operating fee . . . . . . . . . . . . . . . . . . . . . . . . . . . . . . . . . . — — 546Other income . . . . . . . . . . . . . . . . . . . . . . . . . . . . . . . . . . . . . . . . . . . . . . . . . . . . . . . . . . . . . . . . . . . 182 207 175
Total . . . . . . . . . . . . . . . . . . . . . . . . . . . . . . . . . . . . . . . . . . . . . . . . . . . . . . . . . . . . . . . . . . . . . . . . . . . 606 678 1,099
NOTE 29—PURCHASES OF MATERIALS AND EXTERNAL SERVICES
Purchases of materials and external services amounted to €14,191 million in 2006, €12,937 million in 2005and €11,812 million in 2004, showing an increase of €1,254 million in 2006 (or 9.7%) compared to 2005 and anincrease of €1,125 million in 2005 (or 9.5%) compared to 2004.
Details are as follows:
Year ended December 31,2006 2005 2004
(millions of Euro)Purchases of materials and merchandise for resale . . . . . . . . . . . (A) 2,578 2,506 2,203
Costs of services:Revenues due to other TLC operators . . . . . . . . . . . . . . . . . . . . . . . . . . 5,721 4,829 4,241Commissions, sales commissions and other selling expenses . . 1,511 1,263 1,006Advertising and promotion expenses . . . . . . . . . . . . . . . . . . . . . . . . . . 584 593 504Professional consulting and services . . . . . . . . . . . . . . . . . . . . . . . . . . . 480 530 608Utilities . . . . . . . . . . . . . . . . . . . . . . . . . . . . . . . . . . . . . . . . . . . . . . . . . . . . . . . 421 308 244Maintenance . . . . . . . . . . . . . . . . . . . . . . . . . . . . . . . . . . . . . . . . . . . . . . . . . . 350 339 395Outsourcing costs for other services . . . . . . . . . . . . . . . . . . . . . . . . . . . 267 256 244Mailing and delivery expenses for telephone bills, directories
and other materials to customers . . . . . . . . . . . . . . . . . . . . . . . . . . . 106 90 64Other service expenses . . . . . . . . . . . . . . . . . . . . . . . . . . . . . . . . . . . . . . . . 1,130 1,119 1,355
(B) 10,570 9,327 8,661
Lease and rental costs:Property lease rents . . . . . . . . . . . . . . . . . . . . . . . . . . . . . . . . . . . . . . . . . . . 560 641 624TLC circuit lease rents and rents for use of satellite systems . . . 271 274 154Other lease and rental costs . . . . . . . . . . . . . . . . . . . . . . . . . . . . . . . . . . . 212 189 170
(C) 1,043 1,104 948
Total . . . . . . . . . . . . . . . . . . . . . . . . . . . . . . . . . . . . . . . . . . . . . . . . . . . . . . . . . . . . . . (A+B+C) 14,191 12,937 11,812
NOTE 30—PERSONNEL COSTS
Personnel costs amount to €3,801 million in 2006, €4,142 million in 2005 and €3,852 million in 2004, showing adecrease of €341 million in 2006 (or 8.2%) compared to 2005 and an increase of €290 million in 2005 (or 7.5%)compared to 2004.
F-100

Financial Statements Notes To Consolidated Financial Statements
Personnel costs (which include, among others, costs relating to defined contribution plans) consist of thefollowing:
Year ended December 31,2006 2005 2004
(millions of Euro)Personnel costs at payroll:
Wages and salaries . . . . . . . . . . . . . . . . . . . . . . . . . . . . . . . . . . . . . . . . . . . . 2,625 2,600 2,595Social security contributions . . . . . . . . . . . . . . . . . . . . . . . . . . . . . . . . . . . 796 813 812Employee severance indemnities . . . . . . . . . . . . . . . . . . . . . . . . . . . . . . . 146 168 183Other employee-related costs . . . . . . . . . . . . . . . . . . . . . . . . . . . . . . . . . . 71 88 64
(A) 3,638 3,669 3,654
Temp work costs . . . . . . . . . . . . . . . . . . . . . . . . . . . . . . . . . . . . . . . . . . . . . . . . . . (B) 55 52 38
Miscellaneous expenses for personnel and for otherlabor-related services rendered:
Remuneration of personnel other than employees . . . . . . . . . . . . . . 18 18 17Charges for termination benefit incentives plans . . . . . . . . . . . . . . . . 76 394 143Other . . . . . . . . . . . . . . . . . . . . . . . . . . . . . . . . . . . . . . . . . . . . . . . . . . . . . . . . . . 14 9 —
(C) 108 421 160
Total . . . . . . . . . . . . . . . . . . . . . . . . . . . . . . . . . . . . . . . . . . . . . . . . . . . . . . . . . . . . . . . (A+B+C) 3,801 4,142 3,852
In 2006, the decrease of €341 million is principally due to a reduction in accruals and expenses recorded in 2005for employee termination benefit incentive plans and, to a lesser extent, the reduction of personnel costs atpayroll and temp work costs which fell by €28 million (-0.8%).
The decrease in the charge for employee severance indemnities is due to the effect of the actuarial calculation ofthe provision for employee severance indemnities and the turnover of personnel working at the Italian companiesof the Group.
Other employee-related costs in 2006 include €1 million for the valuation of stock options and €22 million forother benefits to employees.
In 2005, the increase of €290 million was principally due to charges for termination benefit incentive plans, whichincreased by €251 million; excluding these charges personnel costs would have increased by 1.0%.
The decrease in the charge for employee severance indemnities is due to the effect of the actuarial calculation ofthe provision for employee severance indemnities and the turnover of personnel working at the Italian companiesof the Group.
Other employee-related costs in 2005 included €4 million for the valuation of stock options and €81 million forother benefits to employees.
The average equivalent number of salaried personnel, excluding those of discontinued operations/assets held forsale and including personnel with temp work contracts, is 79,993 in 2006, 79,869 in 2005 and 79,602 in 2004. Abreakdown by category is as follows:
Year ended December 31,2006 2005 2004
(units)Executives . . . . . . . . . . . . . . . . . . . . . . . . . . . . . . . . . . . . . . . . . . . . . . . . . . . . . . . . 1,384 1,541 1,592Middle management . . . . . . . . . . . . . . . . . . . . . . . . . . . . . . . . . . . . . . . . . . . . . . 5,065 4,744 4,597White collars . . . . . . . . . . . . . . . . . . . . . . . . . . . . . . . . . . . . . . . . . . . . . . . . . . . . . . 70,748 70,375 70,540Blue collars . . . . . . . . . . . . . . . . . . . . . . . . . . . . . . . . . . . . . . . . . . . . . . . . . . . . . . . . 417 722 920
Total employees at payroll . . . . . . . . . . . . . . . . . . . . . . . . . . . . . . . . . . . . . . 77,614 77,382 77,649Personnel with temp work contracts . . . . . . . . . . . . . . . . . . . . . . . . . . . 2,379 2,487 1,953
Total employees . . . . . . . . . . . . . . . . . . . . . . . . . . . . . . . . . . . . . . . . . . . . . . . . . 79,993 79,869 79,602
F-101

Financial Statements Notes To Consolidated Financial Statements
At December 31, 2006, the number of employees, excluding those relating to discontinued operations/assets heldfor sale is 83,209 (85,484 at December 31, 2005) with a decrease of 2,275.
Employees by segment are analyzed in “Note 40-Segment information”.
NOTE 31—OTHER OPERATING EXPENSES
Other operating expenses amount to €1,543 million in 2006, €1,468 million in 2005 and €1,603 million in 2004,showing an increase of €75 million in 2006 (or 5.1%) compared to 2005 and a decrease of €135 million in 2005(or 8.4%) compared to 2004.
Details are as follows:
Year ended December 31,2006 2005 2004
(millions of Euro)Impairments and charges for bad debts . . . . . . . . . . . . . . . . . . . . . . . . . . . 564 521 498Provision for risks and charges . . . . . . . . . . . . . . . . . . . . . . . . . . . . . . . . . . . . 107 71 289TLC operating fees . . . . . . . . . . . . . . . . . . . . . . . . . . . . . . . . . . . . . . . . . . . . . . . . 236 181 114Taxes on revenues of South American companies . . . . . . . . . . . . . . . . . . 222 178 112Duties and indirect taxes . . . . . . . . . . . . . . . . . . . . . . . . . . . . . . . . . . . . . . . . . . 156 141 153Association fees and dues . . . . . . . . . . . . . . . . . . . . . . . . . . . . . . . . . . . . . . . . . 16 19 18Other expenses . . . . . . . . . . . . . . . . . . . . . . . . . . . . . . . . . . . . . . . . . . . . . . . . . . . . 242 357 419
Total . . . . . . . . . . . . . . . . . . . . . . . . . . . . . . . . . . . . . . . . . . . . . . . . . . . . . . . . . . . . . 1,543 1,468 1,603
NOTE 32—CAPITALIZED INTERNAL COSTRUCTION COSTS
Capitalized internal construction costs amount to €496 million in 2006, €471 million in 2005 and €713 millionin 2004, showing an increase of €25 million in 2006 (or 5.3%) compared to 2005 and a decrease of €242 million in2005 (or 33.9%) compared to 2004.
Capitalized internal construction costs consist of the following:
Year ended December 31,2006 2005 2004
(millions of Euro)Capitalized internal construction costs on:
Š Intangible assets with a finite life . . . . . . . . . . . . . . . . . . . . . . . . 318 287 522Š Property, plant and equipment owned . . . . . . . . . . . . . . . . . . . 178 184 191
Total . . . . . . . . . . . . . . . . . . . . . . . . . . . . . . . . . . . . . . . . . . . . . . . . . . . . . . . . . . . . . 496 471 713
NOTE 33—DEPRECIATION AND AMORTIZATION
Depreciation and amortization amount to €5,487 million in 2006, €5,232 million in 2005 and €4,808 million in2004, showing an increase of €255 million in 2006 (or 4.9%) compared to 2005 and an increase of €424 million in2005 (or 8.8%) compared to 2004.
F-102
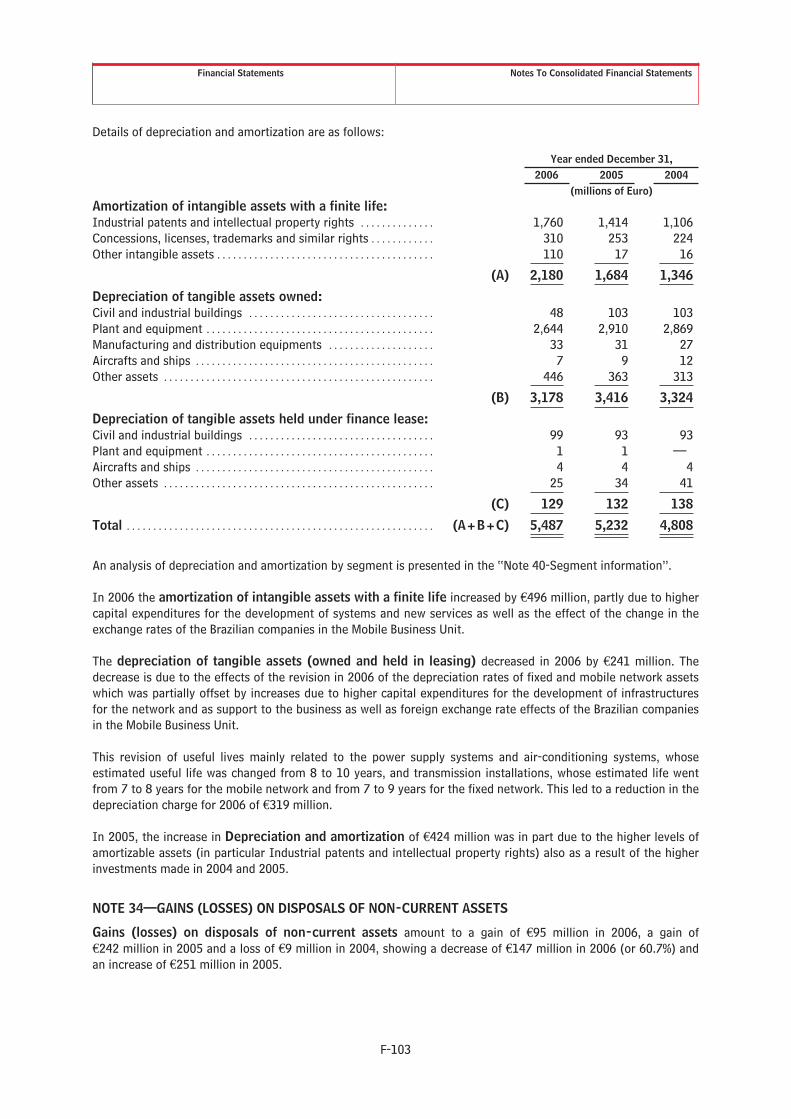
Financial Statements Notes To Consolidated Financial Statements
Details of depreciation and amortization are as follows:
Year ended December 31,2006 2005 2004
(millions of Euro)Amortization of intangible assets with a finite life:Industrial patents and intellectual property rights . . . . . . . . . . . . . . 1,760 1,414 1,106Concessions, licenses, trademarks and similar rights . . . . . . . . . . . . 310 253 224Other intangible assets . . . . . . . . . . . . . . . . . . . . . . . . . . . . . . . . . . . . . . . . . 110 17 16
(A) 2,180 1,684 1,346
Depreciation of tangible assets owned:Civil and industrial buildings . . . . . . . . . . . . . . . . . . . . . . . . . . . . . . . . . . . 48 103 103Plant and equipment . . . . . . . . . . . . . . . . . . . . . . . . . . . . . . . . . . . . . . . . . . . 2,644 2,910 2,869Manufacturing and distribution equipments . . . . . . . . . . . . . . . . . . . . 33 31 27Aircrafts and ships . . . . . . . . . . . . . . . . . . . . . . . . . . . . . . . . . . . . . . . . . . . . . 7 9 12Other assets . . . . . . . . . . . . . . . . . . . . . . . . . . . . . . . . . . . . . . . . . . . . . . . . . . . 446 363 313
(B) 3,178 3,416 3,324
Depreciation of tangible assets held under finance lease:Civil and industrial buildings . . . . . . . . . . . . . . . . . . . . . . . . . . . . . . . . . . . 99 93 93Plant and equipment . . . . . . . . . . . . . . . . . . . . . . . . . . . . . . . . . . . . . . . . . . . 1 1 —Aircrafts and ships . . . . . . . . . . . . . . . . . . . . . . . . . . . . . . . . . . . . . . . . . . . . . 4 4 4Other assets . . . . . . . . . . . . . . . . . . . . . . . . . . . . . . . . . . . . . . . . . . . . . . . . . . . 25 34 41
(C) 129 132 138
Total . . . . . . . . . . . . . . . . . . . . . . . . . . . . . . . . . . . . . . . . . . . . . . . . . . . . . . . . . . (A+B+C) 5,487 5,232 4,808
An analysis of depreciation and amortization by segment is presented in the “Note 40-Segment information”.
In 2006 the amortization of intangible assets with a finite life increased by €496 million, partly due to highercapital expenditures for the development of systems and new services as well as the effect of the change in theexchange rates of the Brazilian companies in the Mobile Business Unit.
The depreciation of tangible assets (owned and held in leasing) decreased in 2006 by €241 million. Thedecrease is due to the effects of the revision in 2006 of the depreciation rates of fixed and mobile network assetswhich was partially offset by increases due to higher capital expenditures for the development of infrastructuresfor the network and as support to the business as well as foreign exchange rate effects of the Brazilian companiesin the Mobile Business Unit.
This revision of useful lives mainly related to the power supply systems and air-conditioning systems, whoseestimated useful life was changed from 8 to 10 years, and transmission installations, whose estimated life wentfrom 7 to 8 years for the mobile network and from 7 to 9 years for the fixed network. This led to a reduction in thedepreciation charge for 2006 of €319 million.
In 2005, the increase in Depreciation and amortization of €424 million was in part due to the higher levels ofamortizable assets (in particular Industrial patents and intellectual property rights) also as a result of the higherinvestments made in 2004 and 2005.
NOTE 34—GAINS (LOSSES) ON DISPOSALS OF NON-CURRENT ASSETS
Gains (losses) on disposals of non-current assets amount to a gain of €95 million in 2006, a gain of€242 million in 2005 and a loss of €9 million in 2004, showing a decrease of €147 million in 2006 (or 60.7%) andan increase of €251 million in 2005.
F-103
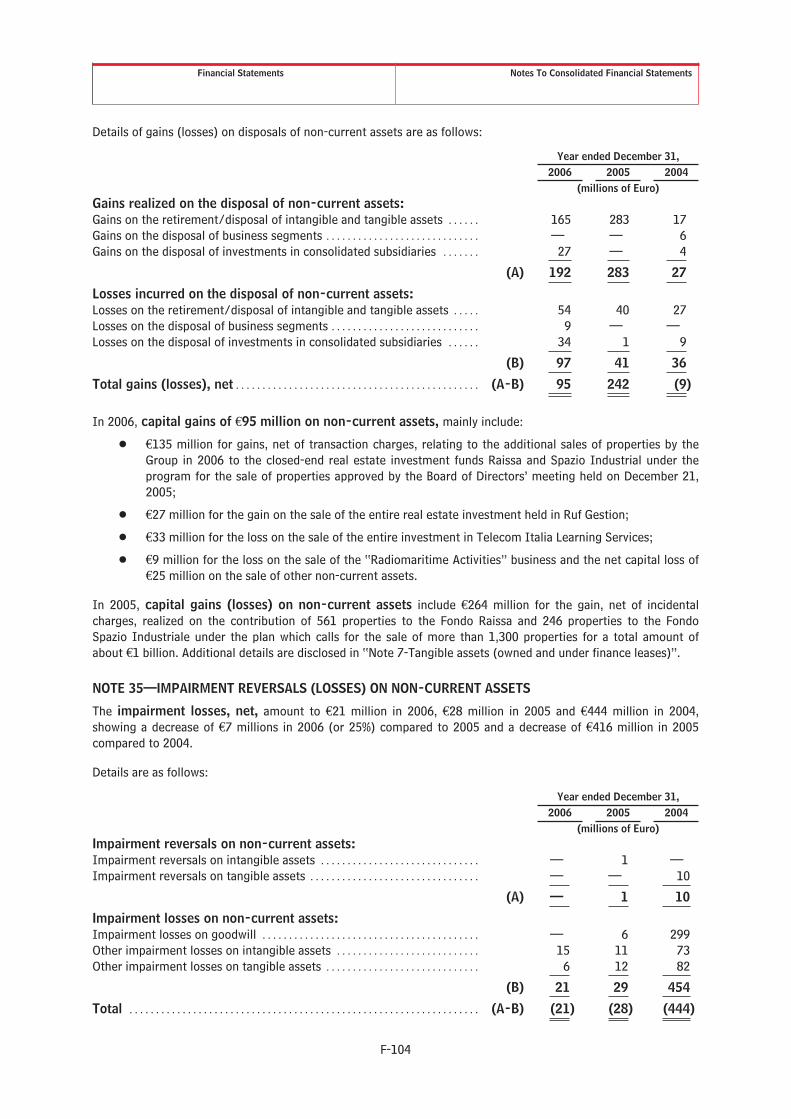
Financial Statements Notes To Consolidated Financial Statements
Details of gains (losses) on disposals of non-current assets are as follows:
Year ended December 31,2006 2005 2004
(millions of Euro)Gains realized on the disposal of non-current assets:Gains on the retirement/disposal of intangible and tangible assets . . . . . . 165 283 17Gains on the disposal of business segments . . . . . . . . . . . . . . . . . . . . . . . . . . . . . — — 6Gains on the disposal of investments in consolidated subsidiaries . . . . . . . 27 — 4
(A) 192 283 27
Losses incurred on the disposal of non-current assets:Losses on the retirement/disposal of intangible and tangible assets . . . . . 54 40 27Losses on the disposal of business segments . . . . . . . . . . . . . . . . . . . . . . . . . . . . 9 — —Losses on the disposal of investments in consolidated subsidiaries . . . . . . 34 1 9
(B) 97 41 36
Total gains (losses), net . . . . . . . . . . . . . . . . . . . . . . . . . . . . . . . . . . . . . . . . . . . . . . (A-B) 95 242 (9)
In 2006, capital gains of €95 million on non-current assets, mainly include:
Š €135 million for gains, net of transaction charges, relating to the additional sales of properties by theGroup in 2006 to the closed-end real estate investment funds Raissa and Spazio Industrial under theprogram for the sale of properties approved by the Board of Directors’ meeting held on December 21,2005;
Š €27 million for the gain on the sale of the entire real estate investment held in Ruf Gestion;
Š €33 million for the loss on the sale of the entire investment in Telecom Italia Learning Services;
Š €9 million for the loss on the sale of the “Radiomaritime Activities” business and the net capital loss of€25 million on the sale of other non-current assets.
In 2005, capital gains (losses) on non-current assets include €264 million for the gain, net of incidentalcharges, realized on the contribution of 561 properties to the Fondo Raissa and 246 properties to the FondoSpazio Industriale under the plan which calls for the sale of more than 1,300 properties for a total amount ofabout €1 billion. Additional details are disclosed in “Note 7-Tangible assets (owned and under finance leases)”.
NOTE 35—IMPAIRMENT REVERSALS (LOSSES) ON NON-CURRENT ASSETS
The impairment losses, net, amount to €21 million in 2006, €28 million in 2005 and €444 million in 2004,showing a decrease of €7 millions in 2006 (or 25%) compared to 2005 and a decrease of €416 million in 2005compared to 2004.
Details are as follows:
Year ended December 31,2006 2005 2004
(millions of Euro)Impairment reversals on non-current assets:Impairment reversals on intangible assets . . . . . . . . . . . . . . . . . . . . . . . . . . . . . . — 1 —Impairment reversals on tangible assets . . . . . . . . . . . . . . . . . . . . . . . . . . . . . . . . — — 10
(A) — 1 10
Impairment losses on non-current assets:Impairment losses on goodwill . . . . . . . . . . . . . . . . . . . . . . . . . . . . . . . . . . . . . . . . . — 6 299Other impairment losses on intangible assets . . . . . . . . . . . . . . . . . . . . . . . . . . . 15 11 73Other impairment losses on tangible assets . . . . . . . . . . . . . . . . . . . . . . . . . . . . . 6 12 82
(B) 21 29 454
Total . . . . . . . . . . . . . . . . . . . . . . . . . . . . . . . . . . . . . . . . . . . . . . . . . . . . . . . . . . . . . . . . . . (A-B) (21) (28) (444)
F-104

Financial Statements Notes To Consolidated Financial Statements
In 2006, the impairment losses of non-current assets total €21 million and mainly refer to the Latin AmericanNautilus group following a revision of the prospects for the South American wholesale market.
In 2005, the impairment losses, net, totaled €28 million, of which €6 million was for the impairment of thegoodwill relating to the Olivetti cash-generating unit and €10 million for the write-downs made by the companiesof the Brazil Mobile Business Unit.
In 2004, the impairment losses, net, totaled €444 million and included €282 million related to the De Agostinitransaction for the purchase of 40% of Finanziaria Web, as well as provisions and impairment losses on intangibleand tangible assets (€162 million).
NOTE 36—FINANCIAL INCOME
Financial income amounts to €3,041 million in 2006, €3,144 million in 2005 and €2,224 million in 2004,showing a decrease of €103 million in 2006 (or 3.3%) compared to 2005 and an increase of €920 million in 2005(or 41.4%) compared to 2004.
Details are as follows:
Year ended December 31,2006 2005 2004
(millions of Euro)Income from investments . . . . . . . . . . . . . . . . . . . . . . . . . . . . . . . . . . . . (A) 240 95 212
Other financial income:Income from financial receivables classified as non-current
assets . . . . . . . . . . . . . . . . . . . . . . . . . . . . . . . . . . . . . . . . . . . . . . . . . . . . . . . 9 15 19Income from securities other than investments, classified as
non-current assets . . . . . . . . . . . . . . . . . . . . . . . . . . . . . . . . . . . . . . . . . . . 14 — 1Income from securities other than investments, classified as
current assets . . . . . . . . . . . . . . . . . . . . . . . . . . . . . . . . . . . . . . . . . . . . . . . 19 31 52Income other than the above:
– Interest income . . . . . . . . . . . . . . . . . . . . . . . . . . . . . . . . . . . . . . 243 219 164– Foreign exchange gains . . . . . . . . . . . . . . . . . . . . . . . . . . . . . . 559 596 315– Income from fair value hedging derivatives . . . . . . . . . . . 474 465 290– Reversal of the Reserve for fair value adjustments to
cash flow hedging derivatives (interest ratecomponent) to the statement of income . . . . . . . . . . . . . . 327 180 56
– Income from non-hedging derivatives . . . . . . . . . . . . . . . . 34 80 166– Miscellaneous financial income . . . . . . . . . . . . . . . . . . . . . . . 177 476 137
(B) 1,856 2,062 1,200
Positive fair value adjustments :Fair value hedging derivatives . . . . . . . . . . . . . . . . . . . . . . . . . . . . . . . . . . 34 693 88Underlying financial assets and liabilities of fair value hedging
derivatives . . . . . . . . . . . . . . . . . . . . . . . . . . . . . . . . . . . . . . . . . . . . . . . . . . 767 167 548Non-hedging derivatives . . . . . . . . . . . . . . . . . . . . . . . . . . . . . . . . . . . . . . . 143 124 148
(C) 944 984 784
Impairment reversals on financial assets . . . . . . . . . . . . . . . . . . . (D) 1 3 28
Total . . . . . . . . . . . . . . . . . . . . . . . . . . . . . . . . . . . . . . . . . . . . . . . . . . . . . . . . . . (A+B+C+D) 3,041 3,144 2,224
Income from investments (€240 million) in 2006 increased by €145 million compared to 2005 (€95 million) andmainly includes gains realized on the sale of the entire 4.99% holding in Neuf Télécom (€148 million) and theinvestment in Avea I.H.A.S (€72 million).
In 2005, such item (€95 million) referred to gains on the sale of C-Mobil (€61 million), Intelsat (€2 million) andGolden Lines (€5 million).
F-105

Financial Statements Notes To Consolidated Financial Statements
In 2004, such income (€212 million) referred to the gain on the sale of the residual interest in Telekom Austria(€86 million) and the gain connected with the sale of the remaining stake in Mirror International (€85 million).
Foreign exchange gains (€559 million) decreased by €37 million in 2006 compared to 2005 (€596 million) andincreased by €281 million in 2005 compared to 2004 (€315 million). Foreign exchange gains in 2006 are net of€313 million for the foreign exchange losses originating from the reversal of the Reserve for fair valueadjustments to cash flow hedge derivatives to the statement of income (€21 million in 2005 and €178 million in2004). The counterbalance of foreign exchange gains is represented by foreign exchange losses which amount to€586 million in 2006 (€538 million in 2005 and €336 million in 2004). Additional information is provided in the“Note 37-Financial expenses”.
Income from fair value hedging derivatives (€474 million) increased by €9 million compared to 2005 (€465million) and by €175 million compared to 2004 (€290 million). Income from fair value hedge derivatives in 2006includes €444 million on CCIRS contracts (€159 million in 2005) and €30 million on IRS contracts (€306 million in2005).
The positive effect of the reversal of the Reserve for fair value adjustments to cash flow hedgingderivatives (interest rate component) to the statement of income (€327 million) increased in 2006 by€147 million compared to 2005 (€180 million) and by €124 million in 2005 compared to 2004 (€56 million). Thisitem in 2006 refers to CCIRS contracts for €269 million (€125 million in 2005) and IRS contracts for €58 million(€55 million in 2005).
Income from non-hedging derivatives (€34 million) in 2006 decreased by €46 million compared to 2005 (€80million) and by €86 million in 2005 compared to 2004 (€166 million). Such item in 2006 refers to CCIRS contractsfor €7 million (€6 million in 2005) and IRS contracts for €21 million (€56 million in 2005) and other derivativecontracts for €6 million (€18 million in 2005).
Miscellaneous financial income (€177 million) in 2006 decreased by €299 million compared to 2005 (€476million) and increased in 2005 by €339 million compared to 2004 (€137 million). The increase in 2006 is mainlydue to the lower effect on income in 2006 (€121 million) compared to 2005 (€423 million) of the release toincome of provisions recorded for sureties provided to the banks which had financed Avea I.H.A.S., since therewas no longer a risk because the guarantees themselves were cancelled.
Positive fair value adjustments to fair value hedging derivatives (€34 million) decreased in 2006 by€659 million compared to 2005 (€693 million) and increased in 2005 by €605 million compared to 2004 (€88million). The counterbalance of this amount is represented by negative fair value adjustments to the underlyingfinancial assets and liabilities of fair value hedging derivatives which amount to €70 million in 2006, €689 millionin 2005 and €88 million in 2004. Additional information is provided in the “Note 37-Financial expenses”.
Positive fair value adjustments to the underlying financial assets and liabilities of fair value hedgingderivatives (€767 million) increased in 2006 by €600 million compared to 2005 (€167 million) and decreased in2005 by €381 million compared to 2004 (€548 million). The counterbalance of this item is represented bynegative fair value adjustments to the corresponding fair value hedging derivatives which amount to €758 millionin 2006, €157 million in 2005 and €547 million in 2004. Additional information is provided in the “Note37-Financial expenses”.
Positive fair value adjustments to non-hedging derivatives (€143 million) increased in 2006 by €19 millioncompared to 2005 (€124 million) and decreased in 2005 by €24 million compared to 2004 (€148 million). Suchitem in 2006 includes, in particular, €30 million for the fair value adjustment of the call option on Sofora shares(€45 million in 2005).
NOTE 37—FINANCIAL EXPENSES
Financial expenses amount to €5,014 million in 2006, €5,131 million in 2005 and 4,216 million in 2004,showing a decrease of €117 million in 2006 compared to 2005 and an increase in 2005 of €915 compared to2004.
F-106

Financial Statements Notes To Consolidated Financial Statements
Details are as follows:
Year ended December 31,2006 2005 2004
(millions of Euro)Charges from investments . . . . . . . . . . . . . . . . . . . . . . . . . . . . . . . . . . . . (A) — — —Interest expenses and other borrowing costs:Interest expenses and other costs relating to notes and bonds . . . 1,889 2,056 2,064Interest expenses to banks . . . . . . . . . . . . . . . . . . . . . . . . . . . . . . . . . . . . . . 363 296 45Interest expenses to others . . . . . . . . . . . . . . . . . . . . . . . . . . . . . . . . . . . . . 237 214 224
2,489 2,566 2,333Commissions . . . . . . . . . . . . . . . . . . . . . . . . . . . . . . . . . . . . . . . . . . . . . . . . . . . 27 61 82Foreign exchange losses . . . . . . . . . . . . . . . . . . . . . . . . . . . . . . . . . . . . . . . . . 586 538 336Charges from fair value hedging derivatives . . . . . . . . . . . . . . . . . . . . . 364 264 152Reversal of the Reserve for fair value adjustments of cash flow
hedging derivatives (interest rate component) to thestatement of income . . . . . . . . . . . . . . . . . . . . . . . . . . . . . . . . . . . . . . . . . . 326 255 155
Charges from non-hedging derivatives . . . . . . . . . . . . . . . . . . . . . . . . . . . 69 170 114Miscellaneous financial expenses . . . . . . . . . . . . . . . . . . . . . . . . . . . . . . . . 216 223 156
(B) 4,077 4,077 3,328
Negative fair value adjustments :Fair value hedging derivatives . . . . . . . . . . . . . . . . . . . . . . . . . . . . . . . . . . . 758 157 547Underlying financial assets and liabilities of fair value hedges . . . . 70 689 88Non-hedging derivatives . . . . . . . . . . . . . . . . . . . . . . . . . . . . . . . . . . . . . . . . 100 184 149
(C) 928 1,030 784
Impairment losses on financial assets (investments andsecurities other than investments) . . . . . . . . . . . . . . . . . . . . . . . . (D) 9 24 104
Total . . . . . . . . . . . . . . . . . . . . . . . . . . . . . . . . . . . . . . . . . . . . . . . . . . . . . . . . . . . (A+B+C+D) 5,014 5,131 4,216
Interest expense and other borrowing costs relating to notes and bonds, and due to banks and others(€2,489 million), decreased in 2006 by €77 million compared to 2005 (€2,566 million) and increased in 2005 by€233 million compared to 2004 (€2,333 million). The decrease in 2006 mainly is the result of a reduction in theaverage debt exposure which was partially offset by the negative effect of a rise in interest rates on a portion offloating-rate debt, whereas the increase in 2005 is mainly due to the financing of the Cash Tender Offer on TIMshares.
Foreign exchange losses (€586 million) increased in 2006 by €48 million compared to 2005 (€538 million) andby €202 million in 2005 compared to 2004 (€336 million). Foreign exchange losses in 2006 are net of €23 millionfor the foreign exchange gains arising from the reversal of the Reserve for fair value adjustments of cash flowhedging derivatives to the statement of income (€341 million in 2005). The counterbalance of foreign exchangelosses is represented by the Foreign exchange gains which amount to €559 million in 2006 (€596 million in 2005and €315 million in 2004). Additional information is provided in “Note 36-Financial income”.
Charges from fair value hedging derivatives (€364 million) increased in 2006 by €100 million compared to2005 (€264 million) and by €112 million in 2005 compared to 2004 (€152 million in 2004). Such charges in 2006include €292 million on CCIRS contracts (€89 million in 2005) and €72 million on IRS contracts (€175 million in2005).
The negative effect of the reversal of the Reserve for fair value adjustments of cash flow hedgingderivatives (interest rate component) to the statement of income (€326 million) increased in 2006 by€71 million compared to 2005 (€255 million) and by €100 million compared to 2004 (€155 million). Such item, inparticular, in 2006 refers to CCIRS contracts for €212 million (€138 million in 2005) and IRS contracts for€114 million (€117 million in 2005).
F-107

Financial Statements Notes To Consolidated Financial Statements
Charges from non-hedging derivatives (€69 million) decreased in 2006 by €101 million compared to 2005(€170 million) and increased in 2005 by 56 million compared to 2004 (€114 million). Such charges in 2006include €32 million on CCIRS contracts (€121 million in 2005), €23 million on IRS contracts (€22 million in 2005)and €14 million on other derivative contracts (€28 million in 2005).
Negative fair value adjustments to fair value hedging derivatives (€758 million) increased in 2006 by€601 million compared to 2005 (€157 million) and decreased in 2005 by €390 million compared to 2004 (€547million). The counterbalance of this item is represented by the positive fair value adjustments to the underlyingfinancial assets and liabilities of fair value hedging derivatives which amount to €767 million in 2006, €167 millionin 2005 and €548 million in 2004. Additional information is provided in “Note 36-Financial income”.
Negative fair value adjustments to underlying financial assets and liabilities of fair value hedgingderivatives (€70 million) decreased in 2006 by €619 million compared to 2005 (€689 million) and increased in2005 by €601 million compared to 2004 (€88 million). The counterbalance of this item is represented by thepositive fair value adjustments to the corresponding fair value hedge derivatives which amount to €34 million in2006 (€693 million in 2005 and €88 million in 2004). Additional information is provided in “Note 36-Financialincome”.
Negative fair value adjustments to non-hedging derivatives (€100 million) decreased in 2006 by €84 millioncompared to 2005 (€184 million) and increased in 2005 by €35 million compared to 2004 (€149 million).
NOTE 38—INCOME TAXES
Income taxes for the years ended December 31, 2006, 2005 and 2004 are detailed as follows:
Year ended December 31,2006 2005 2004
(millions of Euro)Current taxes for the year . . . . . . . . . . . . . . . . . . . . . . . . . . . . . . . . . . . . . . . . . . . . . . 760 1,017 1,387Current taxes for prior years . . . . . . . . . . . . . . . . . . . . . . . . . . . . . . . . . . . . . . . . . . . 15 29 10Reversal of prior years income tax liabilities . . . . . . . . . . . . . . . . . . . . . . . . . . . . (93) (37) (16)
Total current taxes . . . . . . . . . . . . . . . . . . . . . . . . . . . . . . . . . . . . . . . . . . . . . . . . . . . . 682 1,009 1,381Deferred taxes . . . . . . . . . . . . . . . . . . . . . . . . . . . . . . . . . . . . . . . . . . . . . . . . . . . . . . . . . 1,837 1,386 1,273
Total income taxes on continuing operations . . . . . . . . . . . . . . . . . . . . . . (A) 2,519 2,395 2,654
Current taxes for the year . . . . . . . . . . . . . . . . . . . . . . . . . . . . . . . . . . . . . . . . . . . . . . — 23 79Deferred taxes . . . . . . . . . . . . . . . . . . . . . . . . . . . . . . . . . . . . . . . . . . . . . . . . . . . . . . . . . — 8 16
Total income taxes on discontinued operations/assets held forsale . . . . . . . . . . . . . . . . . . . . . . . . . . . . . . . . . . . . . . . . . . . . . . . . . . . . . . . . . . . . . . . . (B) — 31 95
Total income taxes for the year . . . . . . . . . . . . . . . . . . . . . . . . . . . . . . . . . . . . . (A+B) 2,519 2,426 2,749
Incomes taxes on discontinued operations/assets held for sale are classified in the statement of income in “Netincome (loss) from discontinued operations/assets held for sale”.
F-108

Financial Statements Notes To Consolidated Financial Statements
Income before taxes and the income tax charge for the years ended December 31, 2006, 2005 and 2004 aresummarized as follows:
Year ended December 31,2006 2005 2004
(millions of Euro)Income before taxes:
Š from continuing operations . . . . . . . . . . . . . . . . . . . . . . . . . . . . . . . . . . 5,515 5,535 5,606Š from discontinued operations/assets held for sale . . . . . . . . . . . . 7 581 (23)
Total income before taxes . . . . . . . . . . . . . . . . . . . . . . . . . . . . . . . . . . . . . . . . . . 5,522 6,116 5,583Of which:
Š Italy . . . . . . . . . . . . . . . . . . . . . . . . . . . . . . . . . . . . . . . . . . . . . . . . . . . . . . . . . 5,296 5,789 6,153Š Abroad . . . . . . . . . . . . . . . . . . . . . . . . . . . . . . . . . . . . . . . . . . . . . . . . . . . . . . 226 327 (570)
Current taxes:Š Italy . . . . . . . . . . . . . . . . . . . . . . . . . . . . . . . . . . . . . . . . . . . . . . . . . . . . . . . . . 641 957 1,359Š Abroad . . . . . . . . . . . . . . . . . . . . . . . . . . . . . . . . . . . . . . . . . . . . . . . . . . . . . . 41 75 101
Total current taxes . . . . . . . . . . . . . . . . . . . . . . . . . . . . . . . . . . . . . . . . . . . . . . . . . . (A) 682 1,032 1,460
Deferred taxes:Š Italy . . . . . . . . . . . . . . . . . . . . . . . . . . . . . . . . . . . . . . . . . . . . . . . . . . . . . . . . . 1,775 1,457 1,227Š Abroad . . . . . . . . . . . . . . . . . . . . . . . . . . . . . . . . . . . . . . . . . . . . . . . . . . . . . . 62 (63) 62
Total deferred taxes . . . . . . . . . . . . . . . . . . . . . . . . . . . . . . . . . . . . . . . . . . . . . . . . . (B) 1,837 1,394 1,289
Total income taxes . . . . . . . . . . . . . . . . . . . . . . . . . . . . . . . . . . . . . . . . . . . . . . . . . . (A+B) 2,519 2,426 2,749
Year ended December 31,2006 2005 2004
(millions of Euro)Income taxes:
Š from continuing operations . . . . . . . . . . . . . . . . . . . . . . . . . . . . . . . . . . . . . . . . . . . . 2,519 2,395 2,654Š from discontinued operations/assets held for sale . . . . . . . . . . . . . . . . . . . . . — 31 95
Total income taxes . . . . . . . . . . . . . . . . . . . . . . . . . . . . . . . . . . . . . . . . . . . . . . . . . . . . . . . . . . . . 2,519 2,426 2,749
The reconciliation of the income taxes on the pretax income of the Group at the tax rate in force and at theeffective tax rate for the years ended December 31, 2006, 2005 and 2004 is the following:
Year ended December 31,2006 2005 2004
(millionsof Euro) rate
(millionsof Euro) rate
(millionsof Euro) rate
Income before taxes . . . . . . . . . . . . . . . . . . . . . . . . . . . . . . . . . . . . . . . . . . 5,522 6,116 5,488
Taxes calculated at the 33% tax rate in force . . . . . . . . . . . . . . . . . . . . 1,822 33% 2,018 33% 1,811 33%Tax losses for the year not considered recoverable . . . . . . . . . . . . . . 127 2% 81 1% 168 3%Tax losses not considered recoverable in previous years and
recovered during the year . . . . . . . . . . . . . . . . . . . . . . . . . . . . . . . . . . . . (39) (1%) (3) — (15) —Deferred tax benefits not recorded in prior years and considered
recoverable during the year . . . . . . . . . . . . . . . . . . . . . . . . . . . . . . . . . . (7) — (21) — (161) (3%)Reversal of the provision for deferred taxes . . . . . . . . . . . . . . . . . . . . . — — (136) (2%) — —Non-deductible costs . . . . . . . . . . . . . . . . . . . . . . . . . . . . . . . . . . . . . . . . . . . 57 1% 156 3% 290 5%Other net differences . . . . . . . . . . . . . . . . . . . . . . . . . . . . . . . . . . . . . . . . . . . 31 1% (180) (3%) (84) (1%)IRAP and other taxes calculated on a different basis other than
income before taxes . . . . . . . . . . . . . . . . . . . . . . . . . . . . . . . . . . . . . . . . . 528 10% 511 8% 740 13%
Total effective taxes recognized in the statement ofincome . . . . . . . . . . . . . . . . . . . . . . . . . . . . . . . . . . . . . . . . . . . . . . . . . . . . . 2,519 46% 2,426 40% 2,749 50%
F-109

Financial Statements Notes To Consolidated Financial Statements
Subsequent to the enactment of Legislative Decree No. 10 dated February 15, 2007, it became possible to recoverwithholding taxes improperly withheld by the Parent, Telecom Italia, on the companies of the Group residing inthe European Union, for an amount of approximately €133 million. Therefore, this amount will be recognized inthe 2007 statement of income as deduction from the tax charge.
NOTE 39—EARNINGS PER SHARE
The potential shares originating from the conversions of stock options and convertible bonds have an anti-dilutiveeffect and therefore the corresponding shares have not been considered in the calculation of earnings per share.
The additional dividends (at an invariable amount of €0.011 per share) due conventionally to the savings shareswere entirely allocated to continuing operations.
Year ended December 31,2006 2005 2004
Basic and Diluted Earnings PerShare
Net income attributable to equityholders of the Parent . . . . . . . . . . . . . . 3,014 3,216 1,815
Less: additional dividend per SavingsShares (€0.011 per share) . . . . . . . . . . (66) (65) (64)
(millions of Euro) 2,948 3,151 1,751
Weighted average number ofOrdinary and SavingsShares . . . . . . . . . . . . . . . . . . . . . . . . (million) 19,281 18,213 16,004
Basic and diluted earnings pershare—Ordinary Shares . . . . . . . 0.15 0.17 0.11
Plus: additional dividend perSavings Share (€0.011 pershare) . . . . . . . . . . . . . . . . . . . . . . . . 0.01 0.01 0.01
Basic and diluted earnings pershare—Savings Shares . . . . . . . (Euro) 0.16 0.18 0.12
Basic and Diluted Earnings PerShare From ContinuingOperations
Net income from continuingoperations . . . . . . . . . . . . . . . . . . . . . . . . . 3,007 2,666 1,933
Less: additional dividend per SavingsShares (€0.011 per share) . . . . . . . . . . (66) (65) (64)
(millions of Euro) 2,941 2,601 1,869
Weighted average number ofOrdinary and SavingsShares . . . . . . . . . . . . . . . . . . . . . . . . (millions) 19,281 18,213 16,004
Basic and diluted earnings pershare from continuingoperations—OrdinaryShares . . . . . . . . . . . . . . . . . . . . . . . . 0.15 0.14 0.12
Plus: additional dividend perSavings Shares (€0.011 pershare) . . . . . . . . . . . . . . . . . . . . . . . . 0.01 0.01 0.01
Basic and diluted earnings pershare from continuingoperations—Savings Shares . . (Euro) 0.16 0.15 0.13
F-110

Financial Statements Notes To Consolidated Financial Statements
Year ended December 31,2006 2005 2004
Basic and Diluted Earnings PerShare From DiscontinuedOperations/Assets Held ForSale
Net income (loss) from discontinuedoperations/assets held for sale . . . . (millions of Euro) 7 550 (118)
Weighted average number ofOrdinary and SavingsShares . . . . . . . . . . . . . . . . . . . . . . . (millions) 19,281 18,213 16,004
Basic and diluted earnings (loss)per share from discontinuedoperations/assets held forsale—Ordinary Shares . . . . . . . . (Euro) — 0.03 (0.01)
Basic and diluted earnings (loss)per share from discontinuedoperations/assets held forsale—Savings Shares . . . . . . . . . (Euro) — 0.03 (0.01)
Weighted average number ofOrdinary Shares . . . . . . . . . . . . . . . . . . . 13,254,860,233 12,283,195,845 10,208,327,613
Weighted average number of SavingsShares . . . . . . . . . . . . . . . . . . . . . . . . . . . . 6,026,120,661 5,930,204,164 5,795,921,069
Total . . . . . . . . . . . . . . . . . . . . . . . . . . . . . . . . 19,280,980,894 18,213,400,009 16,004,248,682
NOTE 40—SEGMENT INFORMATION
a) Information by business segment
The disclosure by business segment has been modified to present the Brazil Mobile segment separately from theDomestic Mobile segment in light of the increasing importance of the Brazilian mobile business and theorganizational changes that took place during 2006.
In order to facilitate the comparability of the data, the segment information presented for prior periods has beenreclassified for purposes of comparison.
The accounting representation by business segment is as follows:
Š Wireline
Š Domestic Mobile
Š Brazil Mobile
Š Media
Š Olivetti
Š Other activities
F-111

Fina
ncia
lSta
tem
ents
Not
esTo
Cons
olid
ated
Fina
ncia
lSta
tem
ents
CON
SOLI
DAT
EDST
ATEM
ENT
OF
INCO
ME
BYBU
SIN
ESS
SEG
MEN
T
Wir
elin
eD
omes
ticM
obile
Braz
ilM
obile
Med
iaO
livet
tiO
ther
activ
ities
Adju
stm
ents
and
elim
inat
ions
Cons
olid
ated
Tota
l
2006
2005
2004
2006
2005
2004
2006
2005
2004
2006
2005
2004
2006
2005
2004
2006
2005
2004
2006
2005
2004
2006
2005
2004
(mill
ions
ofEu
ro)
Third
-par
tyre
venu
es..
....
....
..16
,426
16,3
5615
,843
9,93
99,
776
9,66
13,
959
2,89
51,
795
197
176
165
385
400
536
369
316
292
——
—31
,275
29,9
1928
,292
Intr
agro
upre
venu
es..
....
....
..1,
369
1,47
81,
665
271
300
262
55
510
43
5552
541,
194
1,00
599
7(2
,904
)(2
,844
)(2
,986
)—
——
Reve
nues
byse
gmen
t..
....
...
17,7
9517
,834
17,5
0810
,210
10,0
769,
923
3,96
42,
900
1,80
020
718
016
844
045
259
01,
563
1,32
11,
289
(2,9
04)(
2,84
4)(2
,986
)31,
275
29,9
1928
,292
Oth
erin
com
e..
....
....
....
....
269
302
619
177
162
234
6530
150
1311
2027
2218
102
227
150
(47)
(76)
(92)
606
678
1,09
9
Tota
lope
ratin
gre
venu
esan
dot
her
inco
me
....
....
....
...
18,0
6418
,136
18,1
2710
,387
10,2
3810
,157
4,02
92,
930
1,95
022
019
118
846
747
460
81,
665
1,54
81,
439
(2,9
51)(
2,92
0)(3
,078
)31,
881
30,5
9729
,391
Purc
hase
sof
mat
eria
lsan
dex
tern
alse
rvic
es..
....
....
....
....
..(7
,692
)(7
,426
)(6
,864
)(4
,837
)(4
,529
)(4
,387
)(2,
210)
(1,8
04)(
1,25
9)(2
13)
(200
)(16
1)(3
97)
(388
)(4
43)(
1,71
5)(1
,386
)(1,
361)
2,87
32,
796
2,66
3(1
4,19
1)(1
2,93
7)(1
1,81
2)Pe
rson
nelc
osts
....
....
....
....
(2,6
35)
(2,8
27)
(2,6
73)
(469
)(5
48)
(517
)(2
08)
(159
)(1
14)
(76)
(75)
(69)
(91)
(100
)(1
11)
(324
)(4
56)
(391
)2
2323
(3,8
01)
(4,1
42)
(3,8
52)
ofw
hich
empl
oyee
seve
ranc
ein
dem
nitie
s..
....
....
....
...
(110
)(1
22)
(139
)(1
7)(3
0)(1
9)—
——
(3)
(3)
(3)
(4)
(5)
(6)
(12)
(8)
(16)
——
—(1
46)
(168
)(1
83)
Oth
erop
erat
ing
expe
nses
....
....
(639
)(5
60)
(1,0
16)
(147
)(1
31)
(110
)(6
42)
(509
)(3
19)
(14)
(12)
(27)
(11)
(11)
(25)
(112
)(2
73)
(144
)22
2838
(1,5
43)
(1,4
68)
(1,6
03)
ofw
hich
char
gefo
rbad
debt
san
dpr
ovis
ion
forr
isks
and
char
ges
..(4
37)
(358
)(6
12)
(38)
(44)
(46)
(174
)(1
30)
(70)
(3)
(4)
(4)
(9)
(6)
(16)
(10)
(50)
(39)
——
—(6
71)
(592
)(7
87)
Chan
ges
inin
vent
orie
s..
....
....
(6)
(30)
3838
6—
(19)
8(7
)(1
)3
1(1
)9
(1)
(3)
—(4
)—
——
8(4
)27
Capi
taliz
edin
tern
alco
nstr
uctio
nco
sts
....
....
....
....
....
..38
235
731
170
5038
——
—1
24
—1
——
1—
4360
360
496
471
713
Dep
reci
atio
nan
dam
ortiz
atio
n..
..(3
,010
)(3
,125
)(3
,084
)(1
,296
)(1
,224
)(1
,165
)(9
30)
(645
)(3
82)
(55)
(38)
(28)
(18)
(16)
(16)
(235
)(2
48)
(211
)57
6478
(5,4
87)
(5,2
32)
(4,8
08)
Gai
ns(lo
sses
)on
disp
osal
sof
non-
curr
enta
sset
s..
....
....
..(4
7)(2
5)(3
)(3
)2
—1
(2)
(3)
1(1
)1
1—
814
226
810
——
(22)
9524
2(9
)Im
pairm
entr
ever
sals
(loss
es)o
nno
n-cu
rren
tass
ets
....
....
....
(21)
(12)
(127
)(1
)(8
)(6
)—
(9)
(3)
——
(2)
—(7
)(3
)—
(1)
(30)
19
(273
)(2
1)(2
8)(4
44)
Ope
ratin
gin
com
e..
....
....
...
4,39
64,
488
4,70
93,
742
3,85
64,
010
21(1
90)
(137
)(13
7)(1
30)
(93)
(50)
(38)
17(5
82)
(547
)(6
92)
4760
(211
)7,
437
7,49
97,
603
Shar
eof
prof
it(lo
sses
)of
inve
stm
ents
acco
unte
dfo
rusi
ngth
eeq
uity
met
hod
....
....
....
(1)
21
——
——
——
——
——
——
5221
(6)
——
—51
23(5
)Fi
nanc
iali
ncom
e..
....
....
....
....
....
....
....
....
....
....
....
....
....
....
....
....
....
....
....
....
....
....
....
....
....
....
....
....
....
....
....
....
....
....
....
...
3,04
13,
144
2,20
5Fi
nanc
iale
xpen
ses
....
....
....
....
....
....
....
....
....
....
....
....
....
....
....
....
....
....
....
....
....
....
....
....
....
....
....
....
....
....
....
....
....
....
....
...
(5,0
14)
(5,1
31)
(4,1
97)
Inco
me
from
cont
inui
ngop
erat
ions
befo
reta
xes
....
....
....
....
....
....
....
....
....
....
....
....
....
....
....
....
....
....
....
....
....
....
....
....
....
....
....
....
...
5,51
55,
535
5,60
6In
com
eta
xes
....
....
....
....
....
....
....
....
....
....
....
....
....
....
....
....
....
....
....
....
....
....
....
....
....
....
....
....
....
....
....
....
....
....
....
....
...
(2,5
19)
(2,3
95)
(2,6
54)
Net
inco
me
from
cont
inui
ngop
erat
ions
....
....
....
....
....
....
....
....
....
....
....
....
....
....
....
....
....
....
....
....
....
....
....
....
....
....
....
....
....
....
...
2,99
63,
140
2,95
2N
etin
com
e(lo
ss)f
rom
disc
ontin
ued
oper
atio
ns/a
sset
she
ldfo
rsal
e..
....
....
....
....
....
....
....
....
....
....
....
....
....
....
....
....
....
....
....
....
....
....
....
....
....
.7
550
(118
)
Net
inco
me
for
the
year
....
....
....
....
....
....
....
....
....
....
....
....
....
....
....
....
....
....
....
....
....
....
....
....
....
....
....
....
....
....
....
....
....
....
.3,
003
3,69
02,
834
ofw
hich
:–
Net
inco
me
attr
ibut
able
toeq
uity
hold
ers
ofth
ePa
rent
....
....
....
....
....
....
....
....
....
....
....
....
....
....
....
....
....
....
....
....
....
....
....
....
....
....
..3,
014
3,21
61,
815
–N
etin
com
e(lo
ss)a
ttrib
utab
leto
Min
ority
Inte
rest
s..
....
....
....
....
....
....
....
....
....
....
....
....
....
....
....
....
....
....
....
....
....
....
....
....
....
....
...
(11)
474
1,01
9
F-112

Fina
ncia
lSta
tem
ents
Not
esTo
Cons
olid
ated
Fina
ncia
lSta
tem
ents
Capi
tale
xpen
ditu
rein
form
atio
nby
busi
ness
segm
ent
Wir
elin
eD
omes
ticM
obile
Braz
ilM
obile
Med
iaO
livet
tiO
ther
activ
ities
Adju
stm
ents
and
elim
inat
ions
Cons
olid
ated
Tota
l20
0620
0520
0420
0620
0520
0420
0620
0520
0420
0620
0520
0420
0620
0520
0420
0620
0520
0420
0620
0520
0420
0620
0520
04(m
illio
nsof
Euro
)In
tang
ible
asse
ts..
....
1,12
185
11,
017
608
605
648
357
244
116
5638
23—
11
7354
77(2
8)(8
)—
2,18
71,
785
1,88
2Ta
ngib
leas
sets
....
....
1,88
11,
972
1,43
253
867
182
134
259
870
129
2716
1018
1412
710
213
6—
——
2,92
73,
388
3,12
0
Tota
l..
....
....
....
.3,
002
2,82
32,
449
1,14
61,
276
1,46
969
984
281
785
6539
1019
1520
015
621
3(2
8)(8
)—
5,11
45,
173
5,00
2
Empl
oyee
sat
the
year
end
bybu
sine
ssse
gmen
t
Wir
elin
eD
omes
ticM
obile
Braz
ilM
obile
Med
iaO
livet
tiO
ther
activ
ities
Cons
olid
ated
Tota
lAs
ofD
ecem
ber
31,2
006
Asof
Dec
embe
r31
,200
5
Asof
Dec
embe
r31
,200
6
Asof
Dec
embe
r31
,200
5
Asof
Dec
embe
r31
,200
6
Asof
Dec
embe
r31
,200
5
Asof
Dec
embe
r31
,200
6
Asof
Dec
embe
r31
,200
5
Asof
Dec
embe
r31
,200
6
Asof
Dec
embe
r31
,200
5
Asof
Dec
embe
r31
,200
6
Asof
Dec
embe
r31
,200
5
Asof
Dec
embe
r31
,200
6
Asof
Dec
embe
r31
,200
5(n
umbe
rof
empl
oyee
s)Em
ploy
ees(
*)..
....
....
55,7
0556
,987
11,2
1811
,720
9,53
19,
043
919
886
1,42
81,
750
4,40
85,
098
83,2
0985
,484
(*)
Empl
oyee
sat
year
end
dono
ttak
eac
coun
toft
hose
rela
ting
toD
isco
ntin
ued
Ope
ratio
ns/A
sset
she
ldfo
rsal
e.
Oth
erin
form
atio
nby
busi
ness
segm
ent
Wir
elin
eD
omes
ticM
obile
Braz
ilM
obile
Med
iaO
livet
tiO
ther
activ
ities
Adju
stm
ents
and
elim
inat
ions
Cons
olid
ated
Tota
lAs
ofD
ecem
ber
31,2
006
Asof
Dec
embe
r31
,200
5
Asof
Dec
embe
r31
,200
6
Asof
Dec
embe
r31
,200
5
Asof
Dec
embe
r31
,200
6
Asof
Dec
embe
r31
,200
5
Asof
Dec
embe
r31
,200
6
Asof
Dec
embe
r31
,200
5
Asof
Dec
embe
r31
,200
6
Asof
Dec
embe
r31
,200
5
Asof
Dec
embe
r31
,200
6
Asof
Dec
embe
r31
,200
5
Asof
Dec
embe
r31
,200
6
Asof
Dec
embe
r31
,200
5
Asof
Dec
embe
r31
,200
6
Asof
Dec
embe
r31
,200
5(m
illio
nsof
Euro
)O
pera
ting
asse
tsby
segm
ent
..34
,597
35,5
6134
,714
35,7
975,
379
5,62
764
659
132
330
52,
476
4,11
3(5
33)
(3,1
93)
77,6
0278
,801
Inve
stm
ents
acco
unte
dfo
rus
ing
the
equi
tym
etho
d..
..7
7—
——
——
—1
148
077
3—
—48
878
1D
isco
ntin
ued
oper
atio
ns/a
sset
she
ldfo
rsal
e..
....
....
....
....
....
....
....
....
....
....
....
....
....
....
....
....
....
....
....
....
....
....
....
....
....
....
....
....
....
....
.23
552
8U
nallo
cate
das
sets
....
....
....
....
....
....
....
....
....
....
....
....
....
....
....
....
....
....
....
....
....
....
....
....
....
....
....
....
....
....
....
....
....
....
....
....
11,1
3215
,900
Tota
lass
ets
....
....
....
....
....
....
....
....
....
....
....
....
....
....
....
....
....
....
....
....
....
....
....
....
....
....
....
....
....
....
....
....
....
....
....
....
....
89,4
5796
,010
Ope
ratin
glia
bilit
ies
byse
gmen
t..
....
....
....
..9,
210
9,64
63,
542
4,46
71,
277
1,60
518
920
125
725
21,
059
2,65
9(4
24)
(2,8
82)
15,1
1015
,948
Liab
ilitie
sre
latin
gto
disc
ontin
ued
oper
atio
ns/a
sset
she
ldfo
rsal
e..
....
....
....
....
....
....
....
....
....
....
....
....
....
....
....
....
....
....
....
....
....
....
....
....
....
....
—28
5U
nallo
cate
dlia
bilit
ies
....
....
....
....
....
....
....
....
....
....
....
....
....
....
....
....
....
....
....
....
....
....
....
....
....
....
....
....
....
....
....
....
....
....
....
.47
,249
52,7
92Eq
uity
....
....
....
....
....
....
....
....
....
....
....
....
....
....
....
....
....
....
....
....
....
....
....
....
....
....
....
....
....
....
....
....
....
....
....
....
....
....
.27
,098
26,9
85
Tota
lequ
ityan
dlia
bilit
ies
....
....
....
....
....
....
....
....
....
....
....
....
....
....
....
....
....
....
....
....
....
....
....
....
....
....
....
....
....
....
....
....
....
....
89,4
5796
,010
F-113

Financial Statements Notes To Consolidated Financial Statements
Key economic and other data referring to discontinued operations/assets held for sale:
Discontinued operations/assets held forsale
Mobile(1) Media(2)Entel
Chile group IT Market Sub Total
Other,adjustments
andeliminations(3) Total
(millions of Euro, except number of employees)Revenues . . . . . . . . . . . . . . . . . . . 2006 121 — — — 121 (1) 120
2005 734 126 238 289 1,387 (53) 1,3342004 1,177 127 925 706 2,935 (142) 2,793
Operating income(loss)(3) . . . . . . . . . . . . . . . . . . 2006 15 — — — 15 (8) 7
2005 60 4 36 (3) 97 506 6032004 125 4 96 21 246 (202) 44
Net income (loss) fromdiscontinued operations/assets held for sale . . . . . . . 2006 15 — — — 15 (8) 7
2005 28 1 26 (11) 44 506 5502004 58 1 49 (7) 101 (219) (118)
Capital expenditures . . . . . . . . 2006 10 — — — 10 — 102005 87 3 27 5 122 — 1222004 200 2 141 28 371 — 371
Number of employees atyear-end . . . . . . . . . . . . . . . . . 2006 — — — — — — —
2005 863 184 — — 1,047 — 1,0472004adjusted(4) 2,961 195 4,216 4,030 11,402 — 11,4022004 841 — — 4,030 4,871 — 4,871
(1) Includes: Tim Hellas (sold at the beginning of June 2005), Tim Perù (sold in August 2005) and Digitel Venezuela (sold in May 2006).
(2) Includes the Gruppo Buffetti (sold in January 2006).
(3) Adjustments and eliminations relating to the operating income (loss) include, among other things:
– 2006: the gain net of the related incidental charges and provisions for risks and charges on the sale of Digitel Venezuela(€22 million) and a provision relating to Tim Hellas, a company sold in 2005 (€30 million);
– 2005: the gain on the sale of Tim Hellas (€410 million, net of the related incidental charges) and Tim Perù (€120 million), as wellas other losses and incidental charges relating to the sale of the Entel Chile group and the Finsiel Group (€24 million);
– 2004: the adjustment of the estimated selling price of the Entel Chile group (a loss of €177 million) and the Finsiel group (a loss of€28 million).
(4) The numbers of employees at December 31, 2006 and at December 31, 2005 are compared both with the adjusted number of employeesat December 31, 2004 (which considers as discontinued operations / assets held for sale the same companies considered as such atDecember 31, 2006 and 2005, namely: the Finsiel Group, Digitel Venezuela, the Entel Chile group, Tim Hellas, Tim Perù and GruppoBuffetti) and with the historical number of employees at December 31, 2004 (which considers as discontinued operations / assets heldfor sale the Finsiel Group and Digitel Venezuela).
b) Information by geographical segment:Geographical segment information on revenues by geographical location of the Group’s customers:
Year ended December 31,2006 2005 2004
(millions of Euro)Italy . . . . . . . . . . . . . . . . . . . . . . . . . . . . . . . . . . . . . . . . . . . . . . . . . . . . . . . . . . . . . . . . . 23,306 23,754 23,736Europe (excluding Italy) . . . . . . . . . . . . . . . . . . . . . . . . . . . . . . . . . . . . . . . . . . . . . 2,946 2,265 1,746Latin America . . . . . . . . . . . . . . . . . . . . . . . . . . . . . . . . . . . . . . . . . . . . . . . . . . . . . . . . 4,220 3,147 2,036Other countries . . . . . . . . . . . . . . . . . . . . . . . . . . . . . . . . . . . . . . . . . . . . . . . . . . . . . . 803 753 774
Total . . . . . . . . . . . . . . . . . . . . . . . . . . . . . . . . . . . . . . . . . . . . . . . . . . . . . . . . . . . . . . . . 31,275 29,919 28,292
F-114
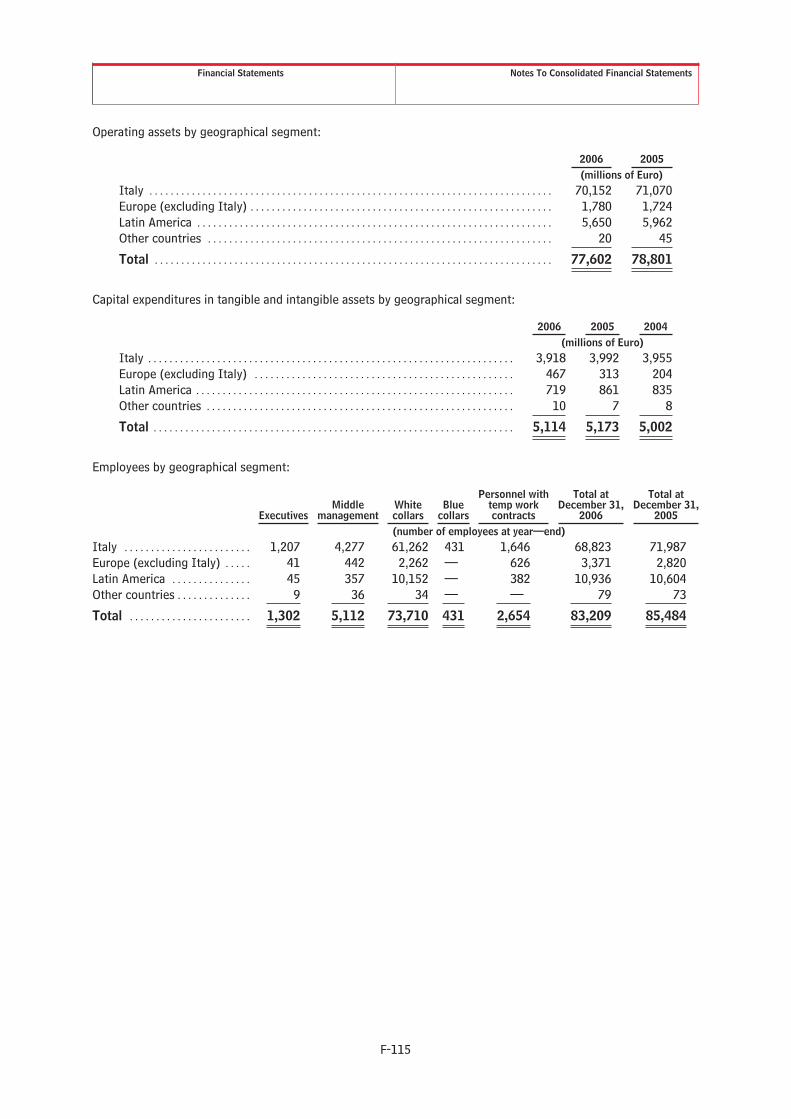
Financial Statements Notes To Consolidated Financial Statements
Operating assets by geographical segment:
2006 2005(millions of Euro)
Italy . . . . . . . . . . . . . . . . . . . . . . . . . . . . . . . . . . . . . . . . . . . . . . . . . . . . . . . . . . . . . . . . . . . . . . . . . . . . 70,152 71,070Europe (excluding Italy) . . . . . . . . . . . . . . . . . . . . . . . . . . . . . . . . . . . . . . . . . . . . . . . . . . . . . . . . . 1,780 1,724Latin America . . . . . . . . . . . . . . . . . . . . . . . . . . . . . . . . . . . . . . . . . . . . . . . . . . . . . . . . . . . . . . . . . . . 5,650 5,962Other countries . . . . . . . . . . . . . . . . . . . . . . . . . . . . . . . . . . . . . . . . . . . . . . . . . . . . . . . . . . . . . . . . . 20 45
Total . . . . . . . . . . . . . . . . . . . . . . . . . . . . . . . . . . . . . . . . . . . . . . . . . . . . . . . . . . . . . . . . . . . . . . . . . . . 77,602 78,801
Capital expenditures in tangible and intangible assets by geographical segment:
2006 2005 2004(millions of Euro)
Italy . . . . . . . . . . . . . . . . . . . . . . . . . . . . . . . . . . . . . . . . . . . . . . . . . . . . . . . . . . . . . . . . . . . . . 3,918 3,992 3,955Europe (excluding Italy) . . . . . . . . . . . . . . . . . . . . . . . . . . . . . . . . . . . . . . . . . . . . . . . . . 467 313 204Latin America . . . . . . . . . . . . . . . . . . . . . . . . . . . . . . . . . . . . . . . . . . . . . . . . . . . . . . . . . . . . 719 861 835Other countries . . . . . . . . . . . . . . . . . . . . . . . . . . . . . . . . . . . . . . . . . . . . . . . . . . . . . . . . . . 10 7 8
Total . . . . . . . . . . . . . . . . . . . . . . . . . . . . . . . . . . . . . . . . . . . . . . . . . . . . . . . . . . . . . . . . . . . . 5,114 5,173 5,002
Employees by geographical segment:
ExecutivesMiddle
managementWhitecollars
Bluecollars
Personnel withtemp workcontracts
Total atDecember 31,
2006
Total atDecember 31,
2005(number of employees at year—end)
Italy . . . . . . . . . . . . . . . . . . . . . . . . 1,207 4,277 61,262 431 1,646 68,823 71,987Europe (excluding Italy) . . . . . 41 442 2,262 — 626 3,371 2,820Latin America . . . . . . . . . . . . . . . 45 357 10,152 — 382 10,936 10,604Other countries . . . . . . . . . . . . . . 9 36 34 — — 79 73
Total . . . . . . . . . . . . . . . . . . . . . . . 1,302 5,112 73,710 431 2,654 83,209 85,484
F-115

Financial Statements Notes To Consolidated Financial Statements
NOTE 41—RELATED PARTY TRANSACTIONS
Related party transactions, including intragroup transactions, are neither qualifiable unusual nor atypical but fallwhithin the ordinary business operations of the companies of the Group. Such transactions, when not concludedat standard conditions or dictated by specific laws, are in any case conducted at arm’s length.
The balances relating to transactions with related parties and the effects of these amounts on the statement ofincome and the statement of cash flows for the years ended December 31, 2006, 2005 and 2004 and the balancesheet as of December 31, 2006 and 2005 are presented in the following tables:
Transactions withrelated parties inthe years endedDecember 31,
Corresponding captionsin consolidated financial
statements as ofDecember 31,
% impact ofrelated parties
2006 2005 2004 2006 2005 2004 2006 2005 2004(millions of Euro)
RevenuesOf which attributable to transactions with:Š associates and joint-ventures . . . . . . . . . . . . 270 336 310Š subsidiaries of associates and joint-
ventures . . . . . . . . . . . . . . . . . . . . . . . . . . . . . . . . 176 104 13Š other related parties through Directors,
Statutory Auditors and managers with keyresponsibilities . . . . . . . . . . . . . . . . . . . . . . . . . . 18 33 40
Š post-employment benefit plans . . . . . . . . . . — — —
464 473 363Transactions of Discontinued Operations
with related parties . . . . . . . . . . . . . . . . . . . . . . — (10) —
Total net of Discontinued Operations . . . . . 464 463 363 31,275 29,919 28,292 1.5 1.5 1.3
Other incomeOf which related to transactions with:Š associates and joint-ventures . . . . . . . . . . . . 6 6 5Š subsidiaries of associates and joint-
ventures . . . . . . . . . . . . . . . . . . . . . . . . . . . . . . . . 1 — —Š other related parties through Directors,
Statutory Auditors and Managers with keyresponsibilities . . . . . . . . . . . . . . . . . . . . . . . . . . — — 1
Š post-employment benefit plans . . . . . . . . . . — — —7 6 6
Total, net of Discontinued Operations . . . . 7 6 6 606 678 1,099 1.2 0.9 0.5
Purchases of material and externalservices
Of which related to transactions with:Š associates and joint- ventures . . . . . . . . . . . 103 266 403Š subsidiaries of associates and joint-
ventures . . . . . . . . . . . . . . . . . . . . . . . . . . . . . . . . 61 36 29Š other related parties through Directors,
Statutory Auditors and managers withkey responsibilities . . . . . . . . . . . . . . . . . . . . . . 93 112 120
Š post-employment benefit plans . . . . . . . . . . — — —
257 414 552Transactions of Discontinued Operations
with related parties . . . . . . . . . . . . . . . . . . . . . . — (5) —
Net of Discontinued Operations . . . . . . . . . . . 257 409 552 14,191 12,937 11,812 1.8 3.2 4.7
F-116

Financial Statements Notes To Consolidated Financial Statements
Transactions withrelated parties inthe years endedDecember 31,
Corresponding captionsin consolidated financial
statements as ofDecember 31,
% impact ofrelated parties
2006 2005 2004 2006 2005 2004 2006 2005 2004(millions of Euro)
Personnel costsOf which related to transactions with:Š associates and joint- ventures . . . . . . . . . . . . . . . — — —Š subsidiaries of associates and joint-
ventures . . . . . . . . . . . . . . . . . . . . . . . . . . . . . . . . . . . . — — —Š other related parties through Directors,
Statutory Auditors and managers with keyresponsibilities . . . . . . . . . . . . . . . . . . . . . . . . . . . . . . — — —
Š post-employment benefit plans . . . . . . . . . . . . . . 25 23 20Š remuneration to managers with key
responsibilities . . . . . . . . . . . . . . . . . . . . . . . . . . . . . . 33 25 28
58 48 48 3,801 4,142 3,852 1.5 1.2 1.2
Other operating expensesOf which related to transactions with:Š associates and joint- ventures . . . . . . . . . . . . . . . — — —Š subsidiaries of associates and joint-
ventures . . . . . . . . . . . . . . . . . . . . . . . . . . . . . . . . . . . . — — —Š other related parties through Directors,
Statutory Auditors and managers with keyresponsibilities . . . . . . . . . . . . . . . . . . . . . . . . . . . . . . 6 — 1
Š post-employment benefit plans . . . . . . . . . . . . . . — — —
6 — 1 1,543 1,468 1,603 0.4 — 0.1
Financial incomeOf which related to transactions with:Š associates and joint- ventures . . . . . . . . . . . . . . . 1 2 5Š subsidiaries of associates and joint-
ventures . . . . . . . . . . . . . . . . . . . . . . . . . . . . . . . . . . . . — — —Š other related parties through Directors,
Statutory Auditors and managers with keyresponsibilities . . . . . . . . . . . . . . . . . . . . . . . . . . . . . . — — —
Š post-employment benefit plans . . . . . . . . . . . . . . — — —
1 2 5 3,041 3,144 2,205 0.0 0.1 0.2
Financial expensesOf which related to transactions with:Š associates and joint- ventures . . . . . . . . . . . . . . . 27 32 60Š subsidiaries of associates and joint-
ventures . . . . . . . . . . . . . . . . . . . . . . . . . . . . . . . . . . . . — — —Š other related parties through Directors,
Statutory Auditors and managers with keyresponsibilities . . . . . . . . . . . . . . . . . . . . . . . . . . . . . . — — —
Š post-employment benefit plans . . . . . . . . . . . . . . — — —
27 32 60 5,014 5,131 4,197 0.5 0.6 1.4
F-117

Financial Statements Notes To Consolidated Financial Statements
Transactions withrelated parties inthe years endedDecember 31,
Corresponding captionsin consolidated financial
statements as ofDecember 31,
% impact ofrelated parties
2006 2005 2004 2006 2005 2004 2006 2005 2004(millions of Euro)
Capital expenditure for intangible andtangible assets on an accrual basis
Of which related to transactions with:Š associates and joint- ventures . . . . . . . . . . . . . . . 144 147 71Š subsidiaries of associates and joint-
ventures . . . . . . . . . . . . . . . . . . . . . . . . . . . . . . . . . . . . 338 319 324Š other related parties through Directors,
Statutory Auditors and managers with keyresponsibilities . . . . . . . . . . . . . . . . . . . . . . . . . . . . . 61 69 24
Š post-employment benefit plans . . . . . . . . . . . . . — — —
543 535 419 5,114 5,173 5,002 10.6 10.3 8.4
Dividends paid to third partiesOf which related to transactions with:Š associates and joint- ventures . . . . . . . . . . . . . . . — — —Š subsidiaries of associates and joint-
ventures . . . . . . . . . . . . . . . . . . . . . . . . . . . . . . . . . . . . — — —Š other related parties through Directors,
Statutory Auditors and managers with keyresponsibilities . . . . . . . . . . . . . . . . . . . . . . . . . . . . . 348 264 140
Š post-employment benefit plans . . . . . . . . . . . . . — 6 1
348 270 141 2,997 2,328 2,780 11.6 11.6 5.1
Balances withrelated parties as of
December 31,
Corresponding captionsin consolidated financial
statements as ofDecember 31,
% impact ofrelated parties
2006 2005 2006 2005 2006 2005(millions of Euro)
Securities, financial receivables and othernon-current financial assets
Of which related to transactions with:Š associates and joint-ventures . . . . . . . . . . . . . . . . . . . . 24 24Š subsidiaries of associates and joint- ventures . . . . — —Š other related parties through Directors, Statutory
Auditors and managers with keyresponsibilities . . . . . . . . . . . . . . . . . . . . . . . . . . . . . . . . . . — —
Š post-employment benefit plans . . . . . . . . . . . . . . . . . . — —
24 24 691 996 3.5 2.4
Securities (Current assets)Of which related to transactions with:Š associates and joint- ventures . . . . . . . . . . . . . . . . . . . — —Š subsidiaries of associates and joint- ventures . . . . — —Š other related parties through Directors, Statutory
Auditors and Managers with keyresponsibilities . . . . . . . . . . . . . . . . . . . . . . . . . . . . . . . . . . — —
Š post-employment benefit plans . . . . . . . . . . . . . . . . . . — —
— — 812 378 — —
F-118

Financial Statements Notes To Consolidated Financial Statements
Balances withrelated parties as of
December 31,
Corresponding captionsin consolidated financial
statements as ofDecember 31,
% impact ofrelated parties
2006 2005 2006 2005 2006 2005(millions of Euro)
Financial receivables and other current financialassets
Of which related to transactions with:Š associates and joint- ventures . . . . . . . . . . . . . . . . . . . 1 —Š subsidiaries of associates and joint- ventures . . . . — —Š other related parties through Directors, Statutory
Auditors and Managers with keyresponsibilities . . . . . . . . . . . . . . . . . . . . . . . . . . . . . . . . . . — —
Š post-employment benefit plans . . . . . . . . . . . . . . . . . . — —
1 — 433 509 0.2 —
Balances withrelated parties as of
December 31,
Corresponding captionsin consolidated financial
statements as ofDecember 31,
% impact ofrelated parties
2006 2005 2006 2005 2006 2005(millions of Euro)
Cash and cash equivalentsOf which related to transactions with:Š associates and joint- ventures . . . . . . . . . . . . . . . . . . 1 14Š subsidiaries of associates and joint- ventures . . . — —Š other related parties through Directors,
Statutory Auditors and Managers with keyresponsibilities . . . . . . . . . . . . . . . . . . . . . . . . . . . . . . . . . — —
Š post-employment benefit plans . . . . . . . . . . . . . . . . . — —
1 14 7,219 10,323 0.0 0.1
Financial assets relating to discontinuedoperations/assets held for sale
Of which related to transactions with:Š associates and joint- ventures . . . . . . . . . . . . . . . . . . — —Š subsidiaries of associates and joint- ventures . . . — —Š other related parties through Directors,
Statutory Auditors and Managers with keyresponsibilities . . . . . . . . . . . . . . . . . . . . . . . . . . . . . . . . . — —
Š post-employment benefit plans . . . . . . . . . . . . . . . . . — —
— — — 37 — —
Non-current financial liabilitiesOf which related to transactions with:Š associates and joint- ventures . . . . . . . . . . . . . . . . . . 239 279Š subsidiaries of associates and joint- ventures . . . — —Š other related parties through Directors,
Statutory Auditors and Managers with keyresponsibilities . . . . . . . . . . . . . . . . . . . . . . . . . . . . . . . . . — —
Š post-employment benefit plans . . . . . . . . . . . . . . . . . — —
239 279 40,803 42,146 0.6 0.7
F-119

Financial Statements Notes To Consolidated Financial Statements
Balances withrelated parties as of
December 31,
Corresponding captionsin consolidated financial
statements as ofDecember 31,
% impact ofrelated parties
2006 2005 2006 2005 2006 2005(millions of Euro)
Current financial liabilitiesOf which related to transactions with:Š associates and joint-ventures . . . . . . . . . . . . . . . . . . . 148 124Š subsidiaries of associates and joint- ventures . . . — —Š other related parties through Directors,
Statutory Auditors and Managers with keyresponsibilities . . . . . . . . . . . . . . . . . . . . . . . . . . . . . . . . . — —
Š post-employment benefit plans . . . . . . . . . . . . . . . . . — —
148 124 5,653 9,812 2.6 1.3
Financial liabilities relating to discontinuedoperations/assets held for sale
Of which related to transactions with:Š associates and joint-ventures . . . . . . . . . . . . . . . . . . . — —Š subsidiaries of associates and joint- ventures . . . — —Š other related parties through Directors,
Statutory Auditors and Managers with keyresponsibilities . . . . . . . . . . . . . . . . . . . . . . . . . . . . . . . . . — —
Š post-employment benefit . . . . . . . . . . . . . . . . . . . . . . — —
— — — 143 — —
Miscellaneous receivables and othernon-current assets
Of which related to transactions with:Š associates and joint-ventures . . . . . . . . . . . . . . . . . . . 10 15Š subsidiaries of associates and joint- ventures . . . — —Š other related parties through Directors,
Statutory Auditors and Managers with keyresponsibilities . . . . . . . . . . . . . . . . . . . . . . . . . . . . . . . . . — —
Š post-employment benefit . . . . . . . . . . . . . . . . . . . . . . — —
10 15 871 825 1.1 1.8
Trade and miscellaneous receivables and othercurrent assets
Of which related to transactions with:Š associates and joint-ventures . . . . . . . . . . . . . . . . . . . 201 210Š subsidiaries of associates and joint- ventures . . . 14 12Š other related parties through Directors,
Statutory Auditors and Managers with keyresponsibilities . . . . . . . . . . . . . . . . . . . . . . . . . . . . . . . . . 5 6
Š post-employment benefit . . . . . . . . . . . . . . . . . . . . . . — —
220 228 8,748 8,856 2.5 2.6
F-120

Financial Statements Notes To Consolidated Financial Statements
Balances withrelated parties as of
December 31,
Corresponding captionsin consolidated financial
statements as ofDecember 31,
% impact ofrelated parties
2006 2005 2006 2005 2006 2005(millions of Euro)
Miscellaneous payables and other non-currentliabilities
Of which related to transactions with:Š associates and joint- ventures . . . . . . . . . . . . . . . . . . . — —Š subsidiaries of associates and joint- ventures . . . . 23 10Š other related parties through Directors, Statutory
Auditors and Managers with keyresponsibilities . . . . . . . . . . . . . . . . . . . . . . . . . . . . . . . . . . — —
Š post-employment benefit . . . . . . . . . . . . . . . . . . . . . . . . — —
23 10 1,857 2,113 1.2 0.5
Trade and miscellaneous payables and othercurrent liabilities
Of which related to transactions with:Š associates and joint- ventures . . . . . . . . . . . . . . . . . . . 99 116Š subsidiaries of associates and joint- ventures . . . . 58 103Š other related parties through Directors, Statutory
Auditors and Managers with keyresponsibilities . . . . . . . . . . . . . . . . . . . . . . . . . . . . . . . . . . 27 43
Š post-employment benefit . . . . . . . . . . . . . . . . . . . . . . . . 20 19
204 281 11,596 12,157 1.8 2.3
The economic and financial effects of transactions with related parties on the consolidated financial statements ofthe Telecom Italia Group as of December 31, 2006 and 2005 and for the years ended December 31, 2006, 2005and 2004 are presented below.
The following tables present the major economic, balance sheet and financial items and related transactionsbetween companies consolidated line-by-line on one hand and associates and joint ventures on the other.
Transactions with related parties in the years ended December 31,2006 2005 2004
ItemsIn the
aggregate Main transactionsIn the
aggregate Main transactionsIn the
aggregate Main transactions
Revenues . . . . . . €270million
These mainly referto revenues fromTeleleasing S.p.A.€225 million,LI.SIT. S.p.A.€12 million, SharedService Center Scrl€20 million,ETECSA €8 million,AVEA I.H.A.S.€1 million,Nordcom S.p.A.€1 million andSiemensInformatica S.p.A.€1 million.
€336million
These mainly referto revenues fromTeleleasing S.p.A.€230 million,LI.SIT. S.p.A.€68 million, SharedService CenterS.c.r.l. €22 million,Golden Lines Ltd€3 million, ETECSA€6 million, AVEAI.H.A.S. €2 millionand NordComS.p.A. €2 million.
€310million
These mainly referto revenues fromTeleleasing S.p.A.€200 million,LI.SIT. S.p.A.€50 million, SharedService CenterS.c.r.l. €32 million,Golden Lines Ltd€10 million,ETECSA €9 million,AVEA I.H.A.S.€1 million.
F-121

Financial Statements Notes To Consolidated Financial Statements
Transactions with related parties in the years ended December 31,2006 2005 2004
ItemsIn the
aggregate Main transactionsIn the
aggregate Main transactionsIn the
aggregate Main transactions
Other income . . €6 million This mainly refersto cost recoveriesfor off-sitepersonnel by certainsubsidiaries andassociates.
€6 million This mainly refersto cost recoveriesfor off-sitepersonnel bycertain subsidiariesand associates.
€5 million This mainly refersto cost recoveriesfor off-sitepersonnel bycertain subsidiariesand associates.
Purchases ofmaterials andexternalservices . . . . . €103
millionThese refer mainlyto costs for rentfrom Tiglio I S.r.l.€5 million, Tiglio IIS.r.l. €3 million, forTLC services fromETECSA €6 million,AVEA I.H.A.S. €2million, formaintenance andassistance contractsfrom Shared ServiceCenter Scrl €27million, for softwareand computermaterials and formaintenance andassistance contractsfrom SiemensInformatica S.p.A.€17 million, for TLCequipment fromTeleleasing S.p.A.€15 million, forsponsorship costsfrom Luna RossaChallenge 2007 S.L.€17 million, foraccessories andconsumables fromBaltea S.r.l. €4million, for remotemedicine servicesfrom Telbios S.p.A.€5 million and forsoftware servicesfrom NordcomS.p.A. €2 million.
€266million
These refer mainlyto costs for rentfrom Tiglio I S.r.l.€10 million, Tiglio IIS.r.l. €12 million, forTLC services fromETECSA €90 million,AVEA I.H.A.S. €3million, formaintenance andassistance contractsfrom Shared ServiceCenter S.c.r.l. €34million, for softwareand computermaterials and formaintenance andassistance contractsfrom SiemensInformatica S.p.A.€52 million, for TLCequipment fromTeleleasing S.p.A.€23 million,sponsorship costsfrom Luna RossaChallenge 2007 S.L.€17 million, costsfor accessories andconsumables fromBaltea S.r.l. €3million, costs forremote medicineservices fromTelbios S.p.A. €3million, cost forsoftware servicesfrom NordcomS.p.A. €1 millionand transport costsfrom Eurofly ServiceS.p.A. €3 million.
€403million
These refer mainlyto costs for rentfrom Tiglio I S.r.l.€50 million, TiglioII S.r.l. €26 million,for TLC servicesfrom ETECSA €123million, formaintenance andassistancecontracts fromShared ServiceCenter S.c.r.l. €106million, forsoftware andcomputer materialsand formaintenance andassistancecontracts fromSiemensInformatica S.p.A.€63 million, for TLCequipment fromTeleleasing S.p.A.€15 million, costsfor accessories andconsumables fromBaltea S.r.l. €4million and costsfor remotemedicine servicesfrom Telbios S.p.A.€1 million,Telegono S.r.l. €1million and AVEAI.H.A.S. €1 million.
F-122

Financial Statements Notes To Consolidated Financial Statements
Transactions with related parties in the years ended December 31,2006 2005 2004
ItemsIn the
aggregate Main transactionsIn the
aggregate Main transactionsIn the
aggregate Main transactions
Financialincome . . . . . . €1 million This includes
accrued interestincome earned onloans granted tocertain associates
€2 million This includesaccrued interestincome earned onloans granted tocertain associates.
€5 million This includesaccrued interestincome earned onloans granted tocertain associates.
Financialexpenses . . . . €27 million These mainly refer
to (i) interestexpenses toTeleleasing S.p.A.€26 million forfinance leases and(ii) interestexpenses to TiglioI S.r.l. €1 million.
€32 million These mainly referto interestexpenses toTeleleasing S.p.A.€23 million, forfinance leases andinterest expensesto Tiglio I S.r.l. €4million and TiglioII S.r.l. €4 million,for sale andleasebacktransactions.
€60 million These mainly referto interestexpenses toTeleleasing S.p.A.€20 million, forfinance leases andinterest expensesto Tiglio I S.r.l.€29 million andTiglio II S.r.l. €10million for saleand leasebacktransactions.
Capitalexpendituresin tangibleandintangibleassets (on anaccrualbasis) . . . . . . .
€144 million These refer mainlyto acquisitions ofcomputer projectsfrom SharedService CenterS.c.r.l. €77 million,SiemensInformatica S.p.A.€65 million andTelbios S.p.A. €1million.
€147million
These refer mainlyto acquisitions ofcomputer projectsfrom SharedService CenterS.c.r.l. €84 million,SiemensInformatica S.p.A.€42 million,Telbios S.p.A. €1million and ValueTeam S.p.A. €8million.
€71million
These refer mainlyto acquisitions ofcomputer projectsfrom SharedService CenterS.c.r.l. €21 million,SiemensInformatica S.p.A.€50 million.
Balances with related parties as of December 31,2006 2005
ItemsIn the
aggregate Main transactionsIn the
aggregate Main transactions
Securities, financialreceivables and othernon-current financialassets . . . . . . . . . . . . . . . . . . . €24 million These refer to medium/
long-term loans grants toAree Urbane S.r.l. €24million.
€24 million These refer mainly tomedium/long term loansgrants to Aree UrbaneS.r.l. €21 million andTiglio II S.r.l. €3 million.
Miscellaneous receivablesand other non-currentassets . . . . . . . . . . . . . . . . . . . €10 million These refer to
receivables from LI.SITS.p.A. €10 million for theresidual additional paid-in capital paid.
€15 million These refer toreceivables from LI.SITS.p.A. €15 million for theresidual additional paid-in capital paid.
F-123

Financial Statements Notes To Consolidated Financial Statements
Balances with related parties as of December 31,2006 2005
ItemsIn the
aggregate Main transactionsIn the
aggregate Main transactions
Trade and miscellaneousreceivables and othercurrent assets . . . . . . . . . . . €201 million These refer mainly to
receivables from LI.SIT.S.p.A. €120 million,Teleleasing S.p.A. €64million, Luna RossaChallenge 2007 S.L. €10million, Shared ServiceCenter S.c.r.l. €2 million,ETECSA €2 million,Telbios S.p.A. €1 millionand Im.Ser S.r.l. €1million.
€210 million These refer mainly toreceivables from LI.SIT.S.p.A. €109 million,Teleleasing S.p.A. €75million, Luna RossaChallenge 2007 S.L. €4million, Shared ServiceCenter S.c.r.l. €4 million,ETECSA €3 million,Telbios S.p.A. €1 millionand Im.Ser S.r.l. €1million. At December 31,2005, there were alsoreceivables from AveaIHAS €8 million, Tiglio IIS.r.l. €3 million,NordCom S.p.A. €1million and Tiglio I S.r.l.€1 million.
Financial receivables andother current financialassets . . . . . . . . . . . . . . . . . . . €1 million These refer to loans
made to Aree UrbaneS.r.l..
—
Cash and cashequivalents . . . . . . . . . . . . . . €1 million These refer to treasury
accounts with associates.€14 million These refer to treasury
accounts with associates.
Non-current financialliabilities . . . . . . . . . . . . . . . . €239 million These refer to non-
current financialpayables for financeleases (i) to TeleleasingS.p.A. €231 million and(ii) for sale and leasebackreal estate transactionsto Tiglio I S.r.l. €7million and Tiglio II S.r.l.€1 million.
€279 million These refer to non-current financialpayables for financeleases to TeleleasingS.p.A. €203 million, forsale and leaseback realestate transactions toTiglio I S.r.l. €43 millionand Tiglio II S.r.l. €33million.
Current financialliabilities . . . . . . . . . . . . . . . . €148 million These refer to current
financial payables forfinance leases (i) toTeleleasing S.p.A. €143million and (ii) for saleand leaseback real estatetransactions Tiglio I S.r.l.€4 million and Tiglio IIS.r.l. €1 million.
€124 million These refer to currentfinancial payables forfinance leases (i) toTeleleasing S.p.A. €113million, (ii) for sale andleaseback real estatetransactions to Tiglio IS.r.l. €8 million andTiglio II S.r.l. €3 million.
F-124

Financial Statements Notes To Consolidated Financial Statements
Balances with related parties as of December 31,2006 2005
ItemsIn the
aggregate Main transactionsIn the
aggregate Main transactions
Trade and miscellaneouspayables and othercurrent liabilities . . . . . . . . €99 million These mainly refer to
payables, for supplytransactions connectedwith operating andinvestment activities, toSiemens InformaticaS.p.A. €48 million,Shared Service CenterS.c.r.l. €16 million,LI.SIT S.p.A. €14 millionmainly regardingaccruals relating to theportion of deferredincome frominvestments, TeleleasingS.p.A. €3 million, ETECSA€12 million, TelbiosS.p.A. €2 million, BalteaS.r.l. €1 million, LunaRossa Challenge 2007S.L. €1 million, AsscomS.r.l. €1 million andNordCom S.p.A. €1million.
€116 million These mainly refer topayables, for supplytransactions connectedwith operating andinvesting activities withSiemens InformaticaS.p.A. €56 million,Shared Service CenterS.c.r.l. €18 million,LI.SIT S.p.A. principallyfor the portion ofdeferred income fromequity investments €11million, TeleleasingS.p.A. €8 million, ETECSA€11 million, Tiglio I S.r.l.€2 million, Tiglio II S.r.l.€4 million, Telbios S.p.A.€2 million, Baltea S.r.l.€1 million and AVEAI.H.A.S. €1 million.
The Telecom Italia Group has also provided guarantees on behalf of associates for a total of €102 million(€276 million at December 31, 2005) of which €54 million is on behalf of Tiglio I S.r.l. (€54 million atDecember 31, 2005), €11 million on behalf of Aree Urbane S.r.l. (€44 million at December 31, 2005), €25 millionon behalf of Italtel Group (€31 million at December 31, 2005) and €12 million on behalf of other companies(€13 million at December 31, 2005). At December 31, 2005, there were guarantees provided on behalf of AVEAI.H.A.S. for €121 million and on behalf of Tiglio II S.r.l. for €13 million.
F-125

Financial Statements Notes To Consolidated Financial Statements
The following table presents the major economic, balance sheet and financial items and related transactionsbetween companies consolidated line-by-line on one hand and companies controlled by associates and by joint-ventures on the other (the companies of the Italtel group, a related party through the investment in the parentItaltel group S.p.A. and the companies of the Telecom Argentina group related through SoforaTelecomunicaciones S.A.). The companies of the Brasil Telecom Participações S.A. group are considered relatedparties through Solpart Participações S.A. from July 1, 2005 to October 1, 2006 since the investment in SolpartParticipações S.A. was transferred in October 2006 to Brasilco S.r.l., a newly-established Italian company held bya trust registered under British law of which Telecom Italia International is the beneficiary. This is described ingreater detail in the “Note 8—Other non-current assets”.
Transactions with related parties in the years ended December 31,2006 2005 2004
ItemsIn the
aggregate Main transactionsIn the
aggregate Main transactionsIn the
aggregate Main transactions
Revenues . . . . . . . . . . . . . €176 million These refer torevenues fortelecommunicationsservices from theBrasil TelecomParticipaçoes group€158 million, theTelecom Argentinagroup €16 millionand the Italtelgroup €2 million.
€104 million These refer torevenues fortelecommunicationsservices from theBrasil TelecomParticipações group€89 million, theTelecom Argentinagroup €12 millionand the Italtelgroup €3 million.
€13 million These mainly referto revenues fortelecommunicationsservices renderedto the TelecomArgentina group€10 million.
Other income . . . . . . . . . €1 million This mainly refersto cost recoveriesfor off-sitepersonnel bycertain subsidiariesand associates.
— —
Purchases of materialsand externalservices . . . . . . . . . . . . €61 million These refer (i) to
costs formaintenance andassistance contractsfrom the Italtelgroup €25 million;(ii) TLC servicecosts from theBrasil TelecomParticipações group€29 million andfrom the TelecomArgentina group €7million.
€36 million These refer (i) tocosts formaintenance andassistance contractsfrom the Italtelgroup €20 million;(ii) TLC servicecosts from theBrasil TelecomParticipações group€10 million andfrom the TelecomArgentina group €6million.
€29 million These refer to costsfor maintenanceand assistancecontracts from theItaltel group €23million and TelecomArgentina group €6million.
Capital expenditures intangible andintangible assets (onan accrual basis) . . . . €338 million These refer to the
purchase oftelephoneexchanges from theItaltel group.
€319 million These refer to thepurchase oftelephoneexchanges from theItaltel group.
€324 million These refer to thepurchase oftelephoneexchanges from theItaltel group.
F-126

Financial Statements Notes To Consolidated Financial Statements
Balances with related parties as of December 31,2006 2005
ItemsIn the
aggregate Main transactionsIn the
aggregate Main transactions
Trade and miscellaneousreceivables and othercurrent assets . . . . . . . . . . . . . €14 million These refer to telephone
services to the Italtelgroup €1 million andreceivables from theTelecom Argentina groupconnected with TLCactivities for €13 million.
€12 million These refer to telephoneservices to the Italtelgroup €2 million andreceivables from theTelecom Argentina groupconnected with TLCactivities for €4 million.At December 31, 2005,there were alsoreceivables of €6 millionfrom the Brasil TelecomParticipações group.
Miscellaneous payables andother non-currentliabilities . . . . . . . . . . . . . . . . . . €23 million These refer to the
medium/long-termportion of the deferralrelating to the supply of“IRU” transmissioncapacity to TelecomArgentina S.A..
€10 million These refer to themedium/long-termportion of the deferralrelating to the supply of“IRU” transmissioncapacity to TelecomArgentina S.A..
Trade and miscellaneouspayables and other currentliabilities . . . . . . . . . . . . . . . . . . €58 million These refer to payables,
for the supplytransactions connectedwith investment andoperating activities, tothe Italtel group €54million and to theTelecom Argentina groupfor TLC activities €4million of which €2million represent theshort-term portion of thedeferral relating to thesupply of “IRU”transmission capacity toTelecom Argentina S.A..
€103 million These refer to payables,for the supplytransactions connectedwith investing andoperating activities toItaltel group for €100million and to theTelecom Argentina groupfor TLC activities for €2million.
F-127

Financial Statements Notes To Consolidated Financial Statements
The following table presents the major economic and financial transactions between companies consolidatedline-by-line on one hand and parties related to the Telecom Italia S.p.A. through directors, statutory auditors andmanagers of the company with key responsibilities on the other.
Transactions with related parties in the years ended December 31,2006 2005 2004
ItemsIn the
aggregate Main transactionsIn the
aggregate Main transactionsIn the
aggregate Main transactions
Revenues . . . . . . . . . . . . €18million
These refer to (i) ITand energy servicessupplied to the Pirelligroup €3 million; (ii)telephone servicessupplied to the Pirelligroup €8 million, tothe Edizione Holdinggroup €5 million, toTelepost €1 millionand to relatedcompanies throughMr. Moratti €1 million.
€33million
These refer to (i) ITand energy servicessupplied to the Pirelligroup €3 million; (ii)telephone servicessupplied to the Pirelligroup €7 million, tothe Edizione Holdinggroup €4 million, toTelepost €1 millionand to relatedcompanies throughMr. Moratti €2 million.In 2005, theyincluded €16 millionto the Unipol Groupand €1 million toSTMicroelectronicswhich are no longerrelated parties in2006.
€40million
These refer to (i) ITand energy servicessupplied to the Pirelligroup €5 million, and(ii) telephone servicessupplied to the Pirelligroup €3 million, tothe Edizione Holdinggroup €5 million, tothe Unipol group €13million, to theSTMicroelectronicsgroup €2 million andto related companiesthrough Mr. Moratti€1 million. In 2004,they included €11million of revenuesfrom the Banca Intesagroup and theUnicredito groupwhich are no longerrelated parties in2006 and 2005.
Purchases of materialsand externalservices . . . . . . . . . . . €93
millionThese refer to R&Dexpenditures,purchases of modemsand ADSL equipment,consulting andservices regardingindustrial propertyand real estateactivities from thePirelli group, €69million, DocumentManagement servicesfrom Telepost €18million, sponsorshipand content providercosts from F.C.Internazionale MilanoS.p.A.—a relatedcompany throughMr. Moratti, €3million, commissionspaid to Autogrill S.p.A(Edizione Holdinggroup) for the sale ofprepaid telephonecards €2 million andthe supply of gas byCamfin €1 million.
€112million
These refer to R&Dexpenditures,purchases of modemsand ADSL equipment,consulting and servicesregarding industrialproperty and realestate activities fromthe Pirelli group, €72million, DocumentManagement servicesfrom Telepost €21million, sponsorshipand content providercosts from F.C.Internazionale MilanoS.p.A.—a relatedcompany throughMr. Moratti, €5 million,commissions paid toAutogrill S.p.A(Edizione Holdinggroup) for the sale ofprepaid telephonecards €2 million. In2005, they included€10 million relating toinsurance servicesfrom the Unipol groupand €2 million fromSTMicroelectronics,which are no longerrelated parties in 2006.
€120million
These refer to R&Dexpenditures andmatters regardingintellectual propertyrights from the Pirelligroup €86 million,Documentmanagement servicesfrom Telepost €15million, insuranceservices from theUnipol group €11million, sponsorshipand content providercosts from F.C.Internazionale MilanoS.p.A., a relatedcompany throughMr. Moratti €5 million,commissions paid toAutogrill S.p.A(Edizione Holdinggroup) for the sale ofprepaid telephonecards €2 million andthe purchase ofelectroniccomponents fromSTMicroelectronics €1million.
F-128

Financial Statements Notes To Consolidated Financial Statements
Transactions with related parties in the years ended December 31,2006 2005 2004
ItemsIn the
aggregate Main transactionsIn the
aggregate Main transactionsIn the
aggregate Main transactions
Other income . . . . . . . . — — €1million
These refer tomiscellaneousrevenues from thePirelli group.
Other operatingexpenses . . . . . . . . . . €6
millionThese refer tocommercialsettlements with thePirelli group.
— €1million
These refer tomiscellaneousexpenses with thePirelli group.
Capital expenditures intangible andintangible assets (onan accrual basis) . . . €61
millionThese mainly refer topurchases ofmodems, cables andADSL equipment fromthe Pirelli group.
€69million
These refer topurchases of cables,modems and ADSLequipment from thePirelli group.
€24million
These refer topurchases of cables,modems and ADSLequipment from thePirelli group €24million.
Balances with related parties as of December 31,2006 2005
ItemsIn the
aggregate Main transactionsIn the
aggregate Main transactions
Trade and miscellaneousreceivables and othercurrent assets . . . . . . . . . . €5 million These mainly refer to the
above-mentioned servicesunder revenues with thePirelli group €3 million, theEdizione Holding group €1million and other companies€1 million.
€6 million These mainly refer to theabove-mentioned servicesunder revenues with thePirelli group €2 million, theEdizione Holding group €2million and other companies€2 million.
Trade and miscellaneouspayables and othercurrent liabilities . . . . . . . €27 million These mainly refer to supply
transactions connected bothto the purchases and theperformance of servicesboth to the investingactivities, to the Pirelligroup €20 million, toTelepost for DocumentManagement services€4 million, to F.C.Internazionale MilanoS.p.A.—a related companythrough Mr. Moratti, forsponsorship and contentprovider costs €2 million.
€43 million These mainly refer to supplytransactions connected tothe performance of servicesand investing activities withthe Pirelli group €34 million,costs for DocumentManagement services fromTelepost €7 million. In 2005they included €1 million ofpayables toSTMicroelectronics, which isno longer a related party in2006.
F-129

Financial Statements Notes To Consolidated Financial Statements
The following table presents the major economic, balance sheet and financial items and related transactionsbetween companies consolidated line-by-line on one hand and pension plans of the companies of the TelecomItalia Group on the other.
Transactions with related parties in the years ended December 31,2006 2005 2004
ItemsIn the
aggregate Main transactionsIn the
aggregate Main transactionsIn the
aggregate Main transactions
Personnel costs . . . . . €25million
These refer to thecontribution madeto pension funds ofwhich €17 millionfor Telemaco, €6million for Fontedirand €2 million forother Italian andforeign pensionfunds.
€23million
These refer to thecontribution madeto pension funds ofwhich €16 millionfor Telemaco, €5million for Fontedirand €1 million forother Italian andforeign pensionfunds.
€20million
These mainly referto the contributionmade to pensionfunds of which €15million forTelemaco and €4million forFontedir.
Balances with related parties as of December 31,2006 2005
ItemsIn the
aggregate Main transactionsIn the
aggregate Main transactions
Trade andmiscellaneouspayables andother currentliabilities . . . . . .
€20million
These refer to contributionspayable to pension funds ofwhich €15 million for Telemaco,€4 million for Fontedir and €1million for other Italian andforeign pension funds.
€19million
These refer to contributionspayable to pension funds ofwhich €14 million for Telemaco,€4 million for Fontedir and €1million for other Italian andforeign pension funds.
The following is a brief description of the contents of the main contracts between the Telecom Italia Group on onehand and companies controlled by associates or by joint ventures and related parties through directors, statutoryauditors and managers with key responsibilities on the other.
Contracts with:
Avea I.H.A.S.
Revenue related
The contracts refer to international telecommunications services, particularly roaming by Avea customers on theTelecom Italia network, technical assistance services rendered and cost recoveries for off-site personnel ofTelecom Italia at Avea.
Expense related
The contracts refer to interconnection fees for roaming traffic by Telecom Italia customers on the Avea network.
Baltea S.p.A
Expense related
The contracts refer to purchases of accessories and consumable stores for Olivetti S.p.A. photocopiers destinedfor resale.
ETECSA
Revenue related
The main contracts relate to:
Š Telecom Italia Sparkle data traffic;
F-130

Financial Statements Notes To Consolidated Financial Statements
Š technical assistance supplied by Telecom Italia S.p.A.;
Š recovery of costs for off-site personnel.
Expense related
The main contracts relate to roaming traffic originated by Telecom Italia customers on the ETECSA network.
IN.VA S.p.A.
Revenue related
The main contracts refer to the supply of telephone and data transmission services.
LI.SIT S.p.A.
Revenue related
The contract provides for developing and implementing the computer and information network for the socialhealth system of the Lombardy Region, making services available online to all the regional health structures bysupplying:
Š cards with microchips for all citizens and health operators in Lombardy;
Š outsourcing services for the management of the Internet Data Center and hardware and softwaresystems;
Š professional and applications consulting for the implementation and management of the system.
Luna Rossa Challenge 2007 S.L.
Revenue related
The main contracts cover the supply of telephone and data transmission services.
Expense related
The main contracts refer to the sponsorship of the Luna Rossa sailboat during the XXXII America’s Cup. Accordingto these contracts, Telecom Italia Group became the Main Sponsor of Luna Rossa and Partner and Official Sponsorof the race. It also acquired the sublicense rights on the “Luna Rossa” trademark for certain categories of goods.
Nordcom S.p.A.
Revenue related
The main contracts refer to the supply of data network connections and software applications.
Expense related
The contract refers to the development of systems and computer solutions.
Shared Service Center S.c.a.r.l.
Revenue related
The main contracts refer to:
Š the supply of telephone and data transmission services;
Š the operation of the client’s software applications at the Telecom Italia S.p.A. data center;
Š the recovery of costs of off-site personnel and centralized expenses (management fee and conventionexpenses).
F-131

Financial Statements Notes To Consolidated Financial Statements
Expense related
The main contracts refer to the supply of computer and information services relating to:
Š design, implementation, release, operation and management of portals, institutional sites, SAP anddedicated solutions;
Š SAP application maintenance and service management services.
Siemens Informatica S.p.A.
Expense related
The main contracts cover:
Š the supply of software services to Group companies;
Š Applications Management services;
Š support services for the operation of Telecom Italia S.p.A. OSS and BSS systems;
Š the supply of support services for distributed computer technology;
Š applications software development and technical services for Telecom Italia S.p.A..
Teleleasing S.p.A.
Revenue related
The contracts relate to the application of the commercial cooperation agreement signed in 2000. By virtue of thisagreement, Telecom Italia S.p.A. is committed to guaranteeing Teleleasing the role of preferential partner in thecase of the purchase of goods under finance leases by its customers. Teleleasing S.p.A. purchases the equipmentfrom Telecom Italia S.p.A. and signs the leasing contract with the customer; Telecom Italia S.p.A. sees to thecollection of lease payments after having acquired the rights.
Expense related
The contracts refer both to the finance lease of telephone systems to Telecom Italia S.p.A. and its subsidiaries andthe finance lease of a building.
Telbios S.p.A.
Revenue related
The main contracts cover the supply of telephone services and services for WBS activities.
Expense related
The main contracts refer to the supply of services, products and hardware systems and software for the remotemedicine offering.
Tiglio I S.r.l.
Revenue related
The main contracts call for the supply of telephone services.
Expense related
The main contracts refer to:
Š the lease of buildings (also premises housing telecommunications equipment) with a term of 21 yearsand the possibility of tacit renewal, unless notice of termination is given by Telecom Italia S.p.A., forsuccessive periods of 6 years, at the same terms and conditions as originally agreed;
Š the lease of buildings solely for office use, for standard lease periods.
F-132

Financial Statements Notes To Consolidated Financial Statements
Tiglio II S.r.l.
Expense related
The main contracts refer to:
Š the lease of buildings (also premises housing telecommunications equipment) with a term of 19 yearsand the possibility of tacit renewal, unless notice of termination is given, by Telecom Italia S.p.A. forsuccessive periods of 6 years, at the same terms and conditions as originally agreed;
Š the lease of buildings solely for office use, for standard lease periods.
* * *
Brasil Telecom Participações group
Revenue related
The contracts refer to telecommunications services, interconnection services in particular, and site sharing.
Expense related
These refer to telecommunications services, interconnection services in particular, site sharing and line leases.
Telecom Argentina group
Revenue related
The main contracts refer to technical assistance provided by Telecom Italia S.p.A. for broadband development andfor the study and implementation of Value Added Services, as well as data transmission and voice services and thesupply of “IRU” transmission capacity by Telecom Italia Sparkle.
Expense related
The contracts relate to international telecommunications services and roaming.
Italtel Group
Revenue related
The main contracts provide for the supply of telephone and data transmission services.
Expense related
The main contracts provide for the supply and maintenance of traditional switching and innovative switching(VoIP) equipment and the relative services, as well as the supply of innovative devices and their maintenance forthe data networks using CISCO technology.
* * *
Camfin S.p.A.
Revenue related
The main contracts refer to the supply of telephone and data transmission services.
Expense related
The contract refers to the supply of gas with the company Cam Gas S.p.A..
Edizione Holding group
Revenue related
The main contracts provide for the supply of telephone and data transmission services that are operated byoutsourcing with dedicated assistance.
F-133

Financial Statements Notes To Consolidated Financial Statements
Expense related
The main contracts refer to commissions paid to Autogrill S.p.A. for the sale of prepaid telephone cards andoccupancy charges for public telephones located at their structures.
F.C. Internazionale Milano S.p.A.
Revenue related
The main contracts call for the supply of telephone and data transmission services.
Expense related
The main contracts refer to costs for the sponsorship and the rights to diffuse content regarding the sports eventsof the company F.C. Internazionale Milano (Inter) by Telecom Italia S.p.A.. The sponsorship contract particularlyprovides for the possibility of using the Inter brand and logo for all advertising activities and the sale of mobiletelephone products, the participation of Inter in the Trofeo TIM and the visibility of the TIM brand during theInter championship and Coppa Italia/TIM Cup games at home.
Pirelli & C. S.p.A.
Revenue related
The main contracts provide for the supply of telecommunications and computer and information services.
Expense related
The main contracts refer to:
Š consulting and services contract regarding patent rights;
Š defining strategies regarding patent rights;
Š determination of the competitive positioning of the various businesses of the Telecom Italia Group incomparison with similar business of the competition;
Š assistance in negotiations over partnerships, licenses and cooperation contracts;
Š litigation and analyses of patents of the competition;
Š obtaining patents (drawing up documents, filings in Italy and outside Italy, continuation during thestages of examination, challenges and conflicts);
Š control over costs by project and/or by business;
Š training of technicians;
Š management of a database for patent data and relative reports;
Š control over results reached;
Š patent researches;
Š filing and classification of important documents regarding patents;
Š brands, including their management (research, filings in Italy and outside Italy, renewals, challenges,disputes, licenses inside and outside the Group);
Š technical cooperation between Telecom Italia S.p.A. and Pirelli in the areas of optical devices andadvanced telecommunications networks. The contract provides:
1. with regard to the results of research for which patents are not filed, three areas of competencewhich have been identified as follows:
– simple and complex devices, competence of Pirelli;
– networks and services, competence of Telecom Italia S.p.A.;
– subsystems, joint competence of Telecom Italia S.p.A.—Pirelli;
F-134
Financial Statements Notes To Consolidated Financial Statements
2. with regard to patents resulting from research, ownership is joint, with the understanding thateach party must give the other a license on the respective portion of ownership according to thefollowing format:
– Pirelli grants Telecom Italia S.p.A. an exclusive license which can be sublicensed for patentsfor use in the “Networks and Services” area;
– Telecom Italia S.p.A. grants Pirelli an exclusive license which can be sublicensed for patentsfor use in the “Devices” area; each of the parties is required to pay the other party 50% of theconsideration from any sublicenses granted.
Furthermore, Pirelli is obliged to sell, under an exclusive arrangement, any optical devices fortelecommunications that use patents deriving from the research projects, for a period of one year fromthe completion of the single project. However, the parties may agree upon alternative solutions whichensure a similar or substitute advantage to Telecom Italia S.p.A.;
Š supply of user apparatus for network access and broadband services;
Š cooperation agreement concerning joint initiatives. Under this contract, Pirelli has developed tworesearch projects for Telecom Italia S.p.A.: one relating to the “Distributed Sensor Network” and thesecond to “Third-generation poles for the wireline network”. The agreements state that Telecom ItaliaS.p.A. is entitled to ownership of the rights to the intellectual properties deriving from the workestablished in the contracts where they are:
a) exclusively applicable to telecommunications networks and/or telecommunications services orcomponents of telecommunications networks which technical appendices of the projects identifyas their specific objective, such as cards of the SIM-card type or network poles, and
b) characterized by the inclusion of specific chemical compositions and/or treatments using specificchemical processes.
Pirelli & C. Real Estate S.p.A.
Revenue related
The contracts provide for the supply of call center services, data transmission services and electrical energy.
Expense related
The contracts refer to project management (development of real estate projects), property management(administrative management of lease contracts) and agency services (commercial management of owned andleased buildings) and maintenance of air-conditioning systems.
Furthermore, Pirelli & C. Real Estate has a 35% stake in the capital of the companies which hold the closed-endreal estate investment funds Raissa and Spazio Industriale (to which properties were contributed as part of thereal estate transaction approved by the board of directors on December 21, 2005) and hold control of themanagement companies (Pirelli & C. Real Estate SGR and Pirelli & C. Real Estate SGR Opportunities) of the abovereal estate funds.
Telepost S.p.A.
Revenue related
The main contracts call for the supply of telephone services.
Expense related
The main contracts refer to:
Š the management of services connected with incoming and outgoing correspondence;
Š the management of outgoing correspondence generated on files with printing by a specialized center;
Š management of the distribution of correspondence;
Š management of the paper archives and management of all photocopy machines.
***
F-135

Financial Statements Notes To Consolidated Financial Statements
Pension funds
Expense related
The payables mainly refer to Telemaco and Fontedir for:
Š payment of contributions by both Telecom Italia S.p.A. and the employee;
Š supply of personal information records of the associated employees by Telecom Italia S.p.A..
For the other minor funds (BYBLOS, LABORFOND, etc.), the payables refer to payments made for contributions.
* * *
Remuneration to managers with key responsibilities
“Key managers”, that is, those persons having authority and responsibility, directly or indirectly, for planning,management and control of the activities of Telecom Italia, including directors, are as follows:
Name Position
Directors:Marco Tronchetti Provera (*) . . . ChairmanGuido Rossi (**) . . . . . . . . . . . . . . . . ChairmanCarlo Orazio Buora . . . . . . . . . . . . . Chief Executive Officer
Executive Deputy Chairman as from September 15, 2006Riccardo Ruggiero . . . . . . . . . . . . . . Chief Executive Officer
General ManagerManagers:Gustavo Bracco . . . . . . . . . . . . . . . . . Head of Group Human Resources, Organization and Security FunctionEnrico Parazzini . . . . . . . . . . . . . . . . Head of Group Finance, Administration and Control Function
Head of Media Business UnitChief Executive Officer of Telecom Italia Media S.p.A.
Massimo Castelli . . . . . . . . . . . . . . . Head of Market Development in OperationsFancesco Chiappetta . . . . . . . . . . . General Counsel
Head of Group Corporate and Legal Affairs FunctionLuca Luciani . . . . . . . . . . . . . . . . . . . . Head of Sales & Customer Services in OperationsGiuseppe Sala (***) . . . . . . . . . . . . General Manager
Head of Top Client and Customer Services in OperationsStefano Pileri . . . . . . . . . . . . . . . . . . . Chief Technology Officer
Head of Technology in OperationsRamon Grijuela (****) . . . . . . . . . Head of Top Clients in Operations
Germanio Spreafico . . . . . . . . . . . . Head of Purchasing
(*) Up to September 15, 2006.
(**) From September 16, 2006.
(***) Up to May 31, 2006.
(****) From September 11, 2006.
The total compensation recorded on the accrual basis by Telecom Italia S.p.A. or by companies controlled by theGroup in respect of managers with key responsibilities amounted to €33 million (€25 million in 2005), divided asfollows :
Year endedDecember 31,
2006 2005(millions of Euro)
Short-term compensation . . . . . . . . . . . . . . . . . . . . . . . . . . . . . . . . . . . . . . . . . . . . . . . . . . (*)19 (*)23Long-term compensation . . . . . . . . . . . . . . . . . . . . . . . . . . . . . . . . . . . . . . . . . . . . . . . . . . 4 2Employment termination benefit incentives . . . . . . . . . . . . . . . . . . . . . . . . . . . . . . . . 10 —
33 25
(*) Of which €0.3 million paid by the subsidiary TI Media S.p.A..
F-136
Financial Statements Notes To Consolidated Financial Statements
NOTE 42—STOCK OPTION PLANS OF THE TELECOM ITALIA GROUP
At December 31, 2006, the existing stock option plans relate to options that give the right to the subscription ofTelecom Italia Ordinary Shares (including the options granted at the time by TIM S.p.A.) and Telecom Italia MediaOrdinary Shares.
During 2006, no new stock option plans were introduced; options were last granted in 2005 and referred to theStock Option Plan Telecom Italia Media S.p.A..
The stock option plans of the Group are described below.
Telecom Italia S.p.A. Stock Option Plans
With respect to the Telecom Italia stock option plans, account should be taken of the mergers that previouslytook place and which are described below:
Š merger of Telecom Italia S.p.A. into Olivetti S.p.A.: starting from the date the merger came into effect(August 4, 2003), the holders of the options of the merged company and the merging companypreserved the corresponding subscription rights. However, the number of shares that could originally besubscribed under the respective plans (one share for each option) was changed on the basis of theassignment ratio established for the shareholders of the two companies. In particular, each option ofthe pre-merger Telecom Italia S.p.A. stock option plans allows the subscription of 3.300871 newTelecom Italia Ordinary Shares post-merger, whereas each option of the Olivetti S.p.A. stock optionplans, now all ended, allowed the subscription of 0.471553 new Telecom Italia S.p.A. Ordinary Sharespost-merger. Accordingly, the subscription price of each Telecom Italia Ordinary Share resulting fromthe exercise of the option was adjusted for each plan, dividing the exercise price of the options alreadydetermined by the respective assignment ratio;
Š merger of TIM S.p.A. into Telecom Italia S.p.A.: starting from the date the merger came into effect(June 30, 2005), the holders of the options of the merged company preserved the correspondingsubscription rights. However, the number of shares that could originally be subscribed under the TIMS.p.A. plans (one share for each option) was changed on the basis of the exchange ratio established forthe shareholders of TIM S.p.A.. Therefore, each option of the pre-merger TIM S.p.A. stock option plansallows the subscription of 1.73 post-merger Telecom Italia S.p.A. Ordinary Shares. Accordingly, thesubscription price of each Telecom Italia Ordinary Share resulting from the exercise of the options wasadjusted for each plan, dividing the exercise price of the options already determined by the exchangeratio.
With respect to the stock option plans, for the purpose of rendering the representation of the optionshomogeneous with that of the underlying subscribable shares to which they correspond, and to facilitate theirmeasurement on the basis of the relative subscription prices, the Group has used the concept of “equivalentoptions”. “Equivalent options” mean a quantity of options equal to those that would be necessary for thesubscription of post-merger Telecom Italia Ordinary Shares to the extent of one share for each option exercised,or, more simply, a quantity of options equal to the number of Telecom Italia Ordinary Shares subscribable post-merger.
In this manner, the weighted average prices and the exercise prices indicated below, since they refer, dependingon the cases, to the list prices of the assignable shares (eventually adjusted following the above mergers) orequivalent options, are consistent and directly comparable among each other.
The Telecom Italia stock option plans for the period from December 31, 2005 to December 31, 2006 arepresented below.
Š In the meeting held on September 11, 2000, the Telecom Italia S.p.A. Board of Directors approved theintroduction of the “Stock Option Plan 2000”, with 51,430,000 options granted at an exercise price of€13.815 per option. Such options, following the merger of Telecom Italia S.p.A. into Olivetti S.p.A.,correspond to 169,763,796 equivalent options, at an exercise price of €4.185259 per equivalent option.
The options were divided into three lots of 15,460,000 options each (51,031,466 equivalent options),vesting, respectively, in July 2001, 2002 and 2003 and an extraordinary fourth lot of 5,050,000 options
F-137

Financial Statements Notes To Consolidated Financial Statements
(16,669,399 equivalent options) vesting in July 2003. The Stock Option Plan 2000 provides for differentexpiration dates depending on the date the options vest: the first lot expired in July 2006, the secondexpires in June 2007, the third lot and the extraordinary lot in June 2008. For each of the first threelots, the options vested on condition that a performance parameter was met which was linked to theratio of the arithmetic mean of the official market prices of Telecom Italia Ordinary Shares (consideredover a specific period of time) to the arithmetic mean of the corresponding values of the Dow JonesEurostoxx for the Telecommunications sector. The first and second lots met the performance criteriaand, consequently, the options vested. The third lot and the extraordinary lot did not meet theperformance criteria and, therefore, such options did not vest and were forfeited in 2003.
At December 31, 2005, 10,699,996 options of the Stock Option Plan 2000 were outstanding andcorresponded to 35,319,216 equivalent options. In July 2006, the deadline for exercising the first lotexpired and the rights relating to 5,349,998 options were forfeited.
At December 31, 2006, 5,349,998 options of the Stock Option Plan 2000 are outstanding andcorrespond to 17,659,608 equivalent options, at an exercise price equal to €4.185259 per equivalentoption.
At the end of 2006 and 2005, the market price of Telecom Italia Ordinary Shares was lower than theexercise price per equivalent option.
Š In the meeting held on July 27, 2001, the Telecom Italia S.p.A. Board of Directors approved theintroduction of the “Stock Option Plan 2001”, with 67,025,000 options granted to managers and middlemanagement of the Group at an exercise price of €10.488 per option. Such options, following themerger of Telecom Italia S.p.A. into Olivetti S.p.A., correspond to 221,240,879 equivalent options, at anexercise price of €3.177343 per equivalent option.
The options were divided into two lots of 33,512,500 options each, vesting, respectively, in April 2002and 2003, expiring, respectively, in April 2007 and 2008. For each of the two lots, the options vested oncondition that a performance parameter was met which was linked to the ratio of the arithmetic meanof the official market prices of Telecom Italia Ordinary Shares (considered over a specific period oftime) to the arithmetic mean of the corresponding values of the Dow Jones Eurostoxx for theTelecommunications sector. The first lot met the performance criteria and, consequently, the optionsvested. The second lot, instead, did not meet the performance criteria and, therefore, such options didnot vest and were forfeited in 2003.
At December 31, 2005, 31,862,500 options, of the Stock Option Plan 2001 were outstanding andcorresponded to 105,173,383 equivalent options. During 2006, the rights to 15,000 options lapsed dueto the termination of employment.
At December 31, 2006, 31,847,500 options are outstanding and correspond to 105,123,871 equivalentoptions, at an exercise price equal to €3.177343 per equivalent option.
At the end of 2006 and 2005, the market value of Telecom Italia Ordinary Shares was lower than theexercise price per equivalent option.
Š In the meeting held on February 13, 2002, the Telecom Italia S.p.A. Board of Directors approved theintroduction of the “Stock Option Plan 2002 Top”, with 11,800,000 options granted to sixteen topmanagers of the Group at an exercise price of €9.203 per option. Such options, following the merger ofTelecom Italia S.p.A., into Olivetti S.p.A. correspond to 38,950,278 equivalent options, at an exerciseprice of €2.788052 per equivalent option.
The options of the “Stock Option Plan 2002 Top” were not subject to reaching performance parametersand vested by February 2005 and expire in February 2010.
At December 31, 2005 and December 31, 2006, 9,480,001.33 options of Stock Option Plan 2002 Topwere outstanding and corresponded to 31,292,243 equivalent options, at an exercise price equal to€2.788052 per equivalent option.
At the end of 2006 and 2005, the market value of Telecom Italia Ordinary Shares was lower than theexercise price per equivalent option.
In the meeting held on March 26, 2002, the Telecom Italia S.p.A. Board of Directors considered theobjective ineffectiveness of the Stock Option Plan 2000 Top as an incentive and as a means of retaining
F-138

Financial Statements Notes To Consolidated Financial Statements
management loyalty, in relation to the exercise price of the options compared to the general markettrend of the stock market. As a result, the Board approved the introduction of the “Stock Option Plan2002”, set aside for management of the Group who were already grantees of the Stock Option Plan2000 and other managers hired after July 27, 2001 (starting date of the Stock Option Plan 2001). Thegrantees of the original Stock Option Plan 2000, on condition of voluntarily relinquishing the relativeoptions, could take part in the new plan. The options of the “Stock Option Plan 2002” were not subjectto reaching performance parameters and vested by March 2005 and expire in March 2010.
The options were granted as follows:
1. in March 2002, 29,958,000 options were granted at an exercise price of €9.665 per option. Suchoptions, following the merger of Telecom Italia S.p.A. into Olivetti S.p.A., correspond to98,887,493 equivalent options, at an exercise price of €2.928015 for each equivalent option.
At December 31, 2005, 19,905,053.50 options granted in March 2002 were outstanding andcorresponded to 65,703,601 equivalent options. During 2006, 4,104,000 options lapsed due to thetermination of employment.
At December 31, 2006, 15,801,053.50 options are outstanding and correspond to 52,156,879equivalent options, at an exercise price equal to €2.928015 per equivalent option .
At the end of 2006 and 2005, the market value of Telecom Italia Ordinary Shares was lower thanthe exercise price per equivalent option;
2. in August 2002, 840,000 options were granted at an exercise price of €7.952 per option. Suchoptions, following the merger of Telecom Italia S.p.A. into Olivetti S.p.A., correspond to 2,772,723equivalent options, at an exercise price equal to €2.409061 per equivalent option.
At December 31, 2005, 719,000.43 options granted in August 2002 were outstanding andcorresponded to 2,373,319 equivalent options, at an exercise price equal to €2.409061 perequivalent option. During 2006, 49,000 options lapsed due to the termination of service.
At December 31, 2006, 670,000.43 options are outstanding and correspond to 2,211,577equivalent options, at an exercise price equal to €2.409061 per equivalent option.
At the end of 2006, the market value of Telecom Italia Ordinary Shares was lower than the exerciseprice per equivalent option whereas at the end of 2005 it was higher.
The stock option plans awarded at the time by TIM (pre-merger into Telecom Italia S.p.A.) for the periodfrom December 31, 2005 to December 31, 2006 are described below.
Š In the meeting held on December 22, 1999, the TIM S.p.A. Board of Directors approved the introductionof the “Stock Option Plans 2000-2002”, with 21,210,000 options granted at an exercise price of€6.42 per option. Such options, following the merger of TIM S.p.A. into Telecom Italia S.p.A.,correspond to 36,693,300 equivalent options, at an exercise price of €3.710983 per equivalent option.
The options can be exercised subject to reaching an objective minimum parameter to be measured withreference to the results achieved by the company in terms of E.V.A. (Economic Value Added), net offinancial investments, compared to the minimum measurement indicated in the annual budget,respectively, in the years 1999, 2000 and 2001. The parameter was reached and, consequently, theoptions vested by the end of 2002 and expire in December 2008.
At December 31, 2005, 11,735,653 options of the Stock Option Plans 2000-2002 were outstanding andcorresponded to 20,302,679 equivalent options. During 2006, the rights to 1,939,997 lapsed due to thetermination of employment.
At December 31, 2006, 9,795,656 options are outstanding and correspond to 16,946,391 equivalentoptions, at an exercise price equal to €3.710983 per equivalent option.
At the end of 2006 and 2005, the market value of Telecom Italia Ordinary Shares was lower than theexercise price per equivalent option.
Š In the meeting held on February 12, 2002, the TIM S.p.A. board of directors approved the introductionof the “Stock Option Plans 2002-2003”, with 25,510,000 options granted to managers and employees at
F-139

Financial Statements Notes To Consolidated Financial Statements
an exercise price of €5.67 per option. Such options, following the merger of TIM S.p.A. into TelecomItalia S.p.A., corresponded to 44,132,300 equivalent options, at an exercise price of €3.277457 perequivalent option.
The options of the Stock Option Plans 2002-2003 were not subject to reaching performance parameters,vested by the end of December 2003 and expire in December 2008.
At December 31, 2005, 22,025,000 options of the Stock Option Plans 2002-2003 were outstanding andcorresponded to 38,103,250 equivalent options. During 2006, the rights to 4,630,000 options lapseddue to the termination of employment.
At December 31, 2006, 17,395,000 options are outstanding and correspond to 30,093,350 equivalentoptions, at an exercise price equal to €3.277457 per equivalent option.
At the end of 2006 and 2005, the market value of Telecom Italia Ordinary Shares was lower than theexercise price per equivalent option.
Š In the meeting held on May 6, 2002, the TIM S.p.A. Board of Directors approved the introduction of the“Stock Option Plans 2003-2005” set aside for management of the Group who already held options inthe Stock Option Plans 2001-2003 and the Supplementary Plans 2001-2003 and new grantees. Thegrantees who already held options in the previous plans could take advantage of the new plans, oncondition of voluntarily relinquishing the relative options beforehand. The Stock Option Plans 2003-2005 provided for 50,057,000 options to be granted at an exercise price equal to €5.07 per option. Suchoptions, following the merger of TIM S.p.A. into Telecom Italia S.p.A., correspond to 86,598,610equivalent options, at an exercise price of €2.930636 per equivalent option. Of the total options,48,142,000 were granted to grantees of the previous plans and 1,915,000 were granted to newgrantees.
The options of the Stock Option Plans 2003-2005 were not subject to reaching performance parameters,vested by December 2004 and expire in December 2010.
At December 31, 2005, 1,915,900 options of the Stock Option Plans 2003-2005 were outstanding andcorresponded to 3,314,507 equivalent options. During 2006, the rights to 230,000 options lapsed due tothe termination of employment.
At December 31, 2006, 1,685,900 options are outstanding and correspond to 2,916,605 equivalentoptions, at an exercise price equal to €2.930636 per equivalent option.
At the end of 2006 and 2005, the market value of Telecom Italia Ordinary Shares was lower than theexercise price per equivalent option.
Movements in TIM stock option plans for the period from December 31, 2004 to June 30, 2005, effective date ofthe merger of TIM into Telecom Italia are presented in the following table.
Number ofoptions
WeightedAverageprice per
option(Euro)
Options outstanding at December 31, 2004 . . . . . . . . . . . . . . . . . . . . . . . . . . . . . . . . . . . . . . . . 45,132,319 5.87Exercised . . . . . . . . . . . . . . . . . . . . . . . . . . . . . . . . . . . . . . . . . . . . . . . . . . . . . . . . . . . . . . . . . . . . . . . . . . . . . . (5,945,100) 5.07Lapsed(1) . . . . . . . . . . . . . . . . . . . . . . . . . . . . . . . . . . . . . . . . . . . . . . . . . . . . . . . . . . . . . . . . . . . . . . . . . . . . . . (1,136,666) 5.90
Options outstanding at June 30, 2005 . . . . . . . . . . . . . . . . . . . . . . . . . . . . . . . . . . . . . . . . . . . . . . 38,050,553 5.99
Equivalent options outstanding at June 30, 2005(2) . . . . . . . . . . . . . . . . . . . . . . . . . . . . . . . 65,827,457 3.46
(1) These options lapsed since they could no longer be exercised as a result of the termination of employment and/or other reasons (e.g.relinquished by the interested party).
(2) Equivalent number of options and relative weighted average price deriving from the application of the TIM—Telecom Italia conversionratio equal to 1.73.
F-140
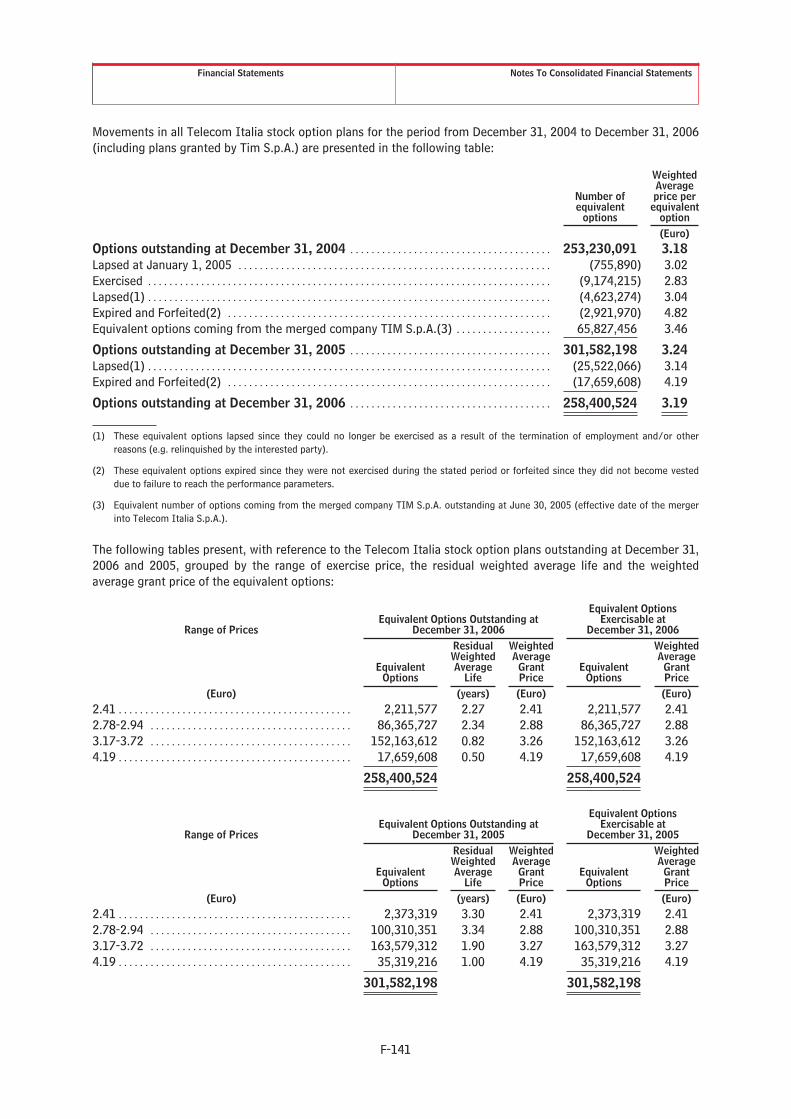
Financial Statements Notes To Consolidated Financial Statements
Movements in all Telecom Italia stock option plans for the period from December 31, 2004 to December 31, 2006(including plans granted by Tim S.p.A.) are presented in the following table:
Number ofequivalent
options
WeightedAverageprice per
equivalentoption(Euro)
Options outstanding at December 31, 2004 . . . . . . . . . . . . . . . . . . . . . . . . . . . . . . . . . . . . . . 253,230,091 3.18Lapsed at January 1, 2005 . . . . . . . . . . . . . . . . . . . . . . . . . . . . . . . . . . . . . . . . . . . . . . . . . . . . . . . . . . . (755,890) 3.02Exercised . . . . . . . . . . . . . . . . . . . . . . . . . . . . . . . . . . . . . . . . . . . . . . . . . . . . . . . . . . . . . . . . . . . . . . . . . . . . (9,174,215) 2.83Lapsed(1) . . . . . . . . . . . . . . . . . . . . . . . . . . . . . . . . . . . . . . . . . . . . . . . . . . . . . . . . . . . . . . . . . . . . . . . . . . . . (4,623,274) 3.04Expired and Forfeited(2) . . . . . . . . . . . . . . . . . . . . . . . . . . . . . . . . . . . . . . . . . . . . . . . . . . . . . . . . . . . . . (2,921,970) 4.82Equivalent options coming from the merged company TIM S.p.A.(3) . . . . . . . . . . . . . . . . . . 65,827,456 3.46
Options outstanding at December 31, 2005 . . . . . . . . . . . . . . . . . . . . . . . . . . . . . . . . . . . . . . 301,582,198 3.24Lapsed(1) . . . . . . . . . . . . . . . . . . . . . . . . . . . . . . . . . . . . . . . . . . . . . . . . . . . . . . . . . . . . . . . . . . . . . . . . . . . . (25,522,066) 3.14Expired and Forfeited(2) . . . . . . . . . . . . . . . . . . . . . . . . . . . . . . . . . . . . . . . . . . . . . . . . . . . . . . . . . . . . . (17,659,608) 4.19
Options outstanding at December 31, 2006 . . . . . . . . . . . . . . . . . . . . . . . . . . . . . . . . . . . . . . 258,400,524 3.19
(1) These equivalent options lapsed since they could no longer be exercised as a result of the termination of employment and/or otherreasons (e.g. relinquished by the interested party).
(2) These equivalent options expired since they were not exercised during the stated period or forfeited since they did not become vesteddue to failure to reach the performance parameters.
(3) Equivalent number of options coming from the merged company TIM S.p.A. outstanding at June 30, 2005 (effective date of the mergerinto Telecom Italia S.p.A.).
The following tables present, with reference to the Telecom Italia stock option plans outstanding at December 31,2006 and 2005, grouped by the range of exercise price, the residual weighted average life and the weightedaverage grant price of the equivalent options:
Range of PricesEquivalent Options Outstanding at
December 31, 2006
Equivalent OptionsExercisable at
December 31, 2006
EquivalentOptions
ResidualWeightedAverage
Life
WeightedAverage
GrantPrice
EquivalentOptions
WeightedAverage
GrantPrice
(Euro) (years) (Euro) (Euro)2.41 . . . . . . . . . . . . . . . . . . . . . . . . . . . . . . . . . . . . . . . . . . . . 2,211,577 2.27 2.41 2,211,577 2.412.78-2.94 . . . . . . . . . . . . . . . . . . . . . . . . . . . . . . . . . . . . . . 86,365,727 2.34 2.88 86,365,727 2.883.17-3.72 . . . . . . . . . . . . . . . . . . . . . . . . . . . . . . . . . . . . . . 152,163,612 0.82 3.26 152,163,612 3.264.19 . . . . . . . . . . . . . . . . . . . . . . . . . . . . . . . . . . . . . . . . . . . . 17,659,608 0.50 4.19 17,659,608 4.19
258,400,524 258,400,524
Range of PricesEquivalent Options Outstanding at
December 31, 2005
Equivalent OptionsExercisable at
December 31, 2005
EquivalentOptions
ResidualWeightedAverage
Life
WeightedAverage
GrantPrice
EquivalentOptions
WeightedAverage
GrantPrice
(Euro) (years) (Euro) (Euro)2.41 . . . . . . . . . . . . . . . . . . . . . . . . . . . . . . . . . . . . . . . . . . . . 2,373,319 3.30 2.41 2,373,319 2.412.78-2.94 . . . . . . . . . . . . . . . . . . . . . . . . . . . . . . . . . . . . . . 100,310,351 3.34 2.88 100,310,351 2.883.17-3.72 . . . . . . . . . . . . . . . . . . . . . . . . . . . . . . . . . . . . . . 163,579,312 1.90 3.27 163,579,312 3.274.19 . . . . . . . . . . . . . . . . . . . . . . . . . . . . . . . . . . . . . . . . . . . . 35,319,216 1.00 4.19 35,319,216 4.19
301,582,198 301,582,198
F-141

Financial Statements Notes To Consolidated Financial Statements
Telecom Italia Media S.p.A. Stock Option Plans
All the options in the stock option plans of Telecom Italia Media give the right to subscribe to a quantity ofTelecom Italia Media Ordinary Shares equal to the number of options exercised, at a specific exercise price.
The Telecom Italia Media stock option plans for the period from December 31, 2005 to December 31, 2006 arepresented below.
Š In the meeting held on May 17, 2002, the Telecom Italia Media S.p.A. (formerly Seat S.p.A.) Board ofDirectors approved the introduction of the “Key People Plan”, with 46,400,000 options granted at anexercise price of €0.8532.
The rights of the Key People Plan vested by May 2005 and expire in May 2008.
At December 31, 2005 and December 31, 2006, 2,250,000 options were outstanding.
At the end of 2006 and 2005, the market price of Telecom Italia Media Ordinary Shares was lower thanthe exercise price.
Š In the meeting held on February 23, 2005, the Telecom Italia Media S.p.A. Board of Directors approvedthe introduction of the “Plan 2005”, set aside for employees in service at Telecom Italia Media and itssubsidiaries, identified on the basis of their specific responsibilities and/or expertise who were alreadygrantees of the Stock Option Plan 2000-2002 and the Key People Plan. The grantees of the previousplans, on condition of voluntarily relinquishing the relative options beforehand, could take part in thenew plan. The previous plans, however, remain in place at the same conditions, procedures andregulations for the employee grantees of the other Companies of the Telecom Italia Group, for retiredemployees and for employees of the Media Business Unit who did not relinquish the options.
Under the Plan 2005, 39,725,000 options were granted at an exercise price of €0.3826.
The options are divided into three lots, respectively of 15,890,000, 11,917,500 and 11,917,500 options,vesting, respectively, in July 2005, January 2006 and January 2007 and all expiring in December 2008.
At December 31, 2005, 25,254,830 options were outstanding. During the first half of 2006, 6,100,000options were exercised and 1,872,500 options lapsed as a result of the termination of service.
At December 31, 2006, 17,282,330 options were outstanding.
At December 31, 2005, the market price of Telecom Italia Media Ordinary Shares was higher than theexercise price, while at December 31, 2006, the market price was lower.
On February 23, 2005, at the same time the options relating to the Plan 2005 were granted, the fairvalue of these options was determined, using the binomial CRR model on the basis of the followingvariables:
Š price of the share resulting from the exercise of the options: €0.3826 (average of the officialmarket prices of Telecom Italia Media Ordinary Shares from January 23, 2005 to February 23,2005—opening and closing dates included);
Š exercise price: equal to the price of the share resulting from the exercise of the options(€0.3826);
Š volatility: at the date of valuation, the historical volatility of the stock of 37.30% was used;
Š option period: 3.85 years (from February 23, 2005 to December 31, 2008, corresponding to theend of the life of the option);
Š expected dividends: zero, on the basis of the consideration that Telecom Italia Media up toFebruary 23, 2005 has never paid out dividends;
Š risk-free interest rate: the rate on Italian Government securities (BTP) was considered,interpolated at the expiration date of the option: December 31, 2008. Therefore, a rate of 2.82%was applied.
The fair value was determined as €0.1246 per option.
F-142
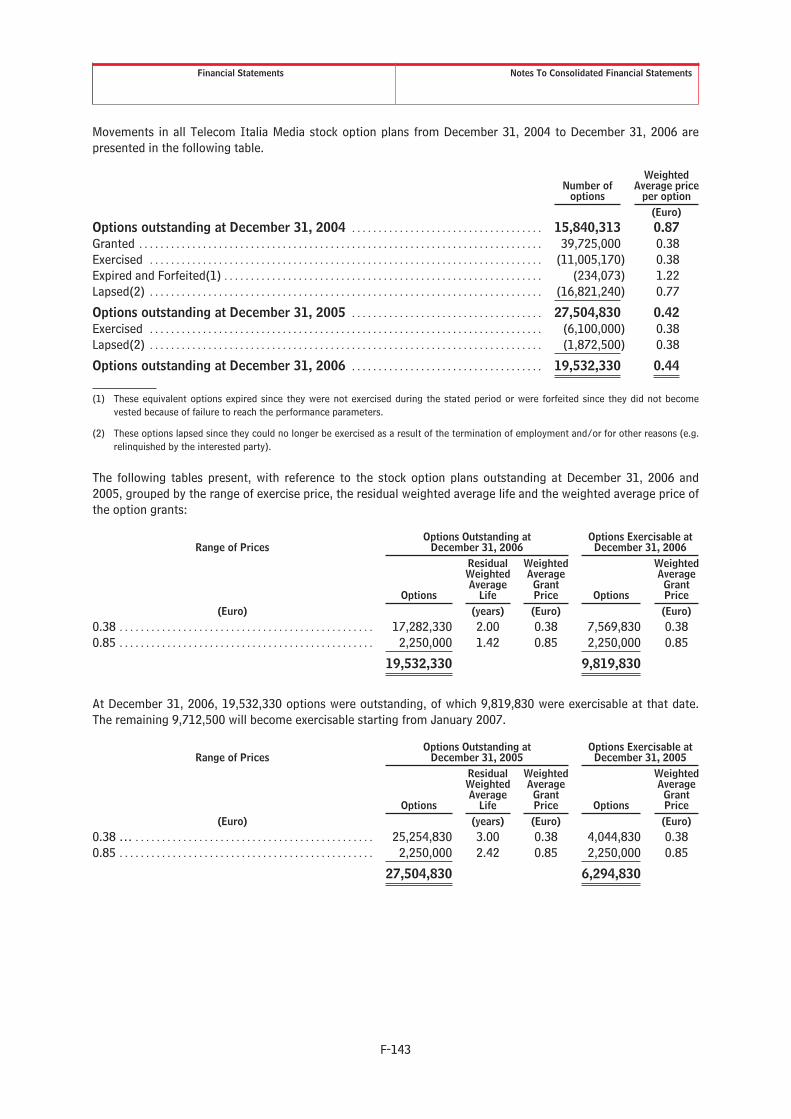
Financial Statements Notes To Consolidated Financial Statements
Movements in all Telecom Italia Media stock option plans from December 31, 2004 to December 31, 2006 arepresented in the following table.
Number ofoptions
WeightedAverage price
per option(Euro)
Options outstanding at December 31, 2004 . . . . . . . . . . . . . . . . . . . . . . . . . . . . . . . . . . . . 15,840,313 0.87Granted . . . . . . . . . . . . . . . . . . . . . . . . . . . . . . . . . . . . . . . . . . . . . . . . . . . . . . . . . . . . . . . . . . . . . . . . . . . . 39,725,000 0.38Exercised . . . . . . . . . . . . . . . . . . . . . . . . . . . . . . . . . . . . . . . . . . . . . . . . . . . . . . . . . . . . . . . . . . . . . . . . . . (11,005,170) 0.38Expired and Forfeited(1) . . . . . . . . . . . . . . . . . . . . . . . . . . . . . . . . . . . . . . . . . . . . . . . . . . . . . . . . . . . . (234,073) 1.22Lapsed(2) . . . . . . . . . . . . . . . . . . . . . . . . . . . . . . . . . . . . . . . . . . . . . . . . . . . . . . . . . . . . . . . . . . . . . . . . . . (16,821,240) 0.77
Options outstanding at December 31, 2005 . . . . . . . . . . . . . . . . . . . . . . . . . . . . . . . . . . . . 27,504,830 0.42Exercised . . . . . . . . . . . . . . . . . . . . . . . . . . . . . . . . . . . . . . . . . . . . . . . . . . . . . . . . . . . . . . . . . . . . . . . . . . (6,100,000) 0.38Lapsed(2) . . . . . . . . . . . . . . . . . . . . . . . . . . . . . . . . . . . . . . . . . . . . . . . . . . . . . . . . . . . . . . . . . . . . . . . . . . (1,872,500) 0.38
Options outstanding at December 31, 2006 . . . . . . . . . . . . . . . . . . . . . . . . . . . . . . . . . . . . 19,532,330 0.44
(1) These equivalent options expired since they were not exercised during the stated period or were forfeited since they did not becomevested because of failure to reach the performance parameters.
(2) These options lapsed since they could no longer be exercised as a result of the termination of employment and/or for other reasons (e.g.relinquished by the interested party).
The following tables present, with reference to the stock option plans outstanding at December 31, 2006 and2005, grouped by the range of exercise price, the residual weighted average life and the weighted average price ofthe option grants:
Range of PricesOptions Outstanding at
December 31, 2006Options Exercisable at
December 31, 2006
Options
ResidualWeightedAverage
Life
WeightedAverage
GrantPrice Options
WeightedAverage
GrantPrice
(Euro) (years) (Euro) (Euro)0.38 . . . . . . . . . . . . . . . . . . . . . . . . . . . . . . . . . . . . . . . . . . . . . . . . 17,282,330 2.00 0.38 7,569,830 0.380.85 . . . . . . . . . . . . . . . . . . . . . . . . . . . . . . . . . . . . . . . . . . . . . . . . 2,250,000 1.42 0.85 2,250,000 0.85
19,532,330 9,819,830
At December 31, 2006, 19,532,330 options were outstanding, of which 9,819,830 were exercisable at that date.The remaining 9,712,500 will become exercisable starting from January 2007.
Range of PricesOptions Outstanding at
December 31, 2005Options Exercisable at
December 31, 2005
Options
ResidualWeightedAverage
Life
WeightedAverage
GrantPrice Options
WeightedAverage
GrantPrice
(Euro) (years) (Euro) (Euro)0.38 … . . . . . . . . . . . . . . . . . . . . . . . . . . . . . . . . . . . . . . . . . . . . . 25,254,830 3.00 0.38 4,044,830 0.380.85 . . . . . . . . . . . . . . . . . . . . . . . . . . . . . . . . . . . . . . . . . . . . . . . . 2,250,000 2.42 0.85 2,250,000 0.85
27,504,830 6,294,830
F-143
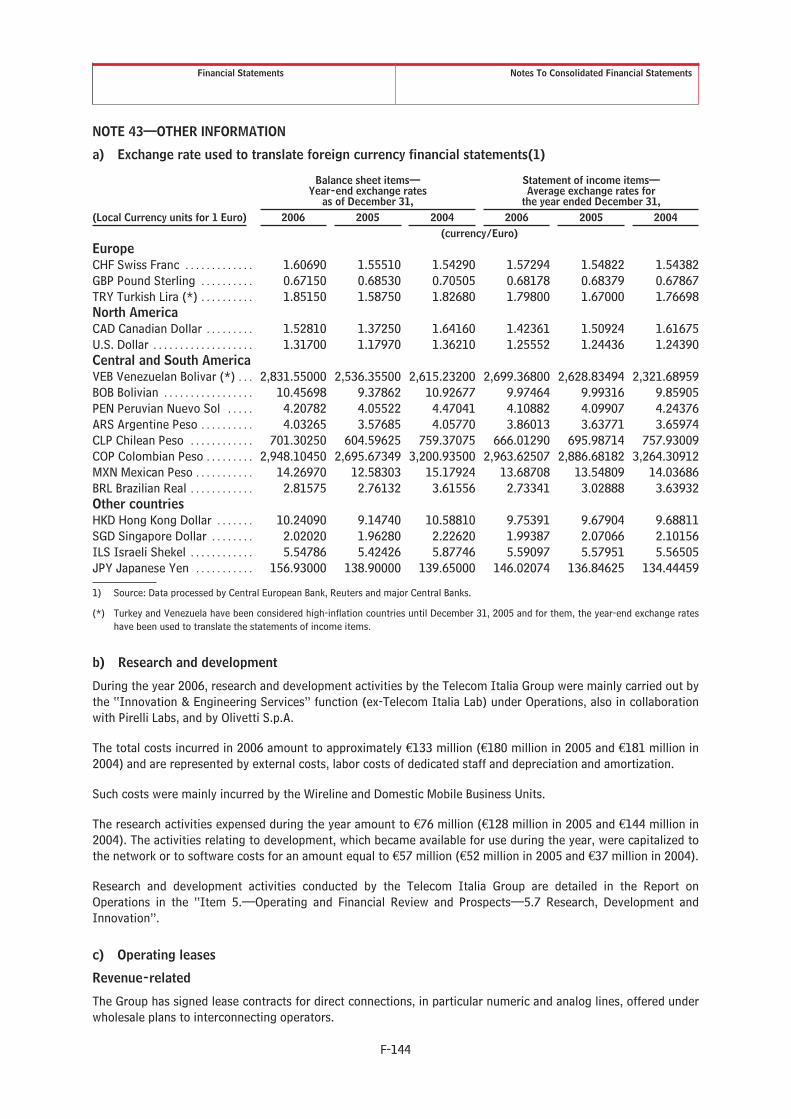
Financial Statements Notes To Consolidated Financial Statements
NOTE 43—OTHER INFORMATION
a) Exchange rate used to translate foreign currency financial statements(1)
Balance sheet items—Year-end exchange rates
as of December 31,
Statement of income items—Average exchange rates for
the year ended December 31,(Local Currency units for 1 Euro) 2006 2005 2004 2006 2005 2004
(currency/Euro)EuropeCHF Swiss Franc . . . . . . . . . . . . . 1.60690 1.55510 1.54290 1.57294 1.54822 1.54382GBP Pound Sterling . . . . . . . . . . 0.67150 0.68530 0.70505 0.68178 0.68379 0.67867TRY Turkish Lira (*) . . . . . . . . . . 1.85150 1.58750 1.82680 1.79800 1.67000 1.76698North AmericaCAD Canadian Dollar . . . . . . . . . 1.52810 1.37250 1.64160 1.42361 1.50924 1.61675U.S. Dollar . . . . . . . . . . . . . . . . . . . 1.31700 1.17970 1.36210 1.25552 1.24436 1.24390Central and South AmericaVEB Venezuelan Bolivar (*) . . . 2,831.55000 2,536.35500 2,615.23200 2,699.36800 2,628.83494 2,321.68959BOB Bolivian . . . . . . . . . . . . . . . . . 10.45698 9.37862 10.92677 9.97464 9.99316 9.85905PEN Peruvian Nuevo Sol . . . . . 4.20782 4.05522 4.47041 4.10882 4.09907 4.24376ARS Argentine Peso . . . . . . . . . . 4.03265 3.57685 4.05770 3.86013 3.63771 3.65974CLP Chilean Peso . . . . . . . . . . . . 701.30250 604.59625 759.37075 666.01290 695.98714 757.93009COP Colombian Peso . . . . . . . . . 2,948.10450 2,695.67349 3,200.93500 2,963.62507 2,886.68182 3,264.30912MXN Mexican Peso . . . . . . . . . . . 14.26970 12.58303 15.17924 13.68708 13.54809 14.03686BRL Brazilian Real . . . . . . . . . . . . 2.81575 2.76132 3.61556 2.73341 3.02888 3.63932Other countriesHKD Hong Kong Dollar . . . . . . . 10.24090 9.14740 10.58810 9.75391 9.67904 9.68811SGD Singapore Dollar . . . . . . . . 2.02020 1.96280 2.22620 1.99387 2.07066 2.10156ILS Israeli Shekel . . . . . . . . . . . . 5.54786 5.42426 5.87746 5.59097 5.57951 5.56505JPY Japanese Yen . . . . . . . . . . . 156.93000 138.90000 139.65000 146.02074 136.84625 134.44459
1) Source: Data processed by Central European Bank, Reuters and major Central Banks.
(*) Turkey and Venezuela have been considered high-inflation countries until December 31, 2005 and for them, the year-end exchange rateshave been used to translate the statements of income items.
b) Research and development
During the year 2006, research and development activities by the Telecom Italia Group were mainly carried out bythe “Innovation & Engineering Services” function (ex-Telecom Italia Lab) under Operations, also in collaborationwith Pirelli Labs, and by Olivetti S.p.A.
The total costs incurred in 2006 amount to approximately €133 million (€180 million in 2005 and €181 million in2004) and are represented by external costs, labor costs of dedicated staff and depreciation and amortization.
Such costs were mainly incurred by the Wireline and Domestic Mobile Business Units.
The research activities expensed during the year amount to €76 million (€128 million in 2005 and €144 million in2004). The activities relating to development, which became available for use during the year, were capitalized tothe network or to software costs for an amount equal to €57 million (€52 million in 2005 and €37 million in 2004).
Research and development activities conducted by the Telecom Italia Group are detailed in the Report onOperations in the “Item 5.—Operating and Financial Review and Prospects—5.7 Research, Development andInnovation”.
c) Operating leases
Revenue-related
The Group has signed lease contracts for direct connections, in particular numeric and analog lines, offered underwholesale plans to interconnecting operators.
F-144

Financial Statements Notes To Consolidated Financial Statements
At December 31, 2006 and 2005, the amounts of lease installments receivable on non-cancelable lease contracts,which decreased from last year due to reduction of one year of the relevant expiration dates, are the following:
At December 31,2006 2005(millions of Euro)
Within 1 year . . . . . . . . . . . . . . . . . . . . . . . . . . . . . . . . . . . . . . . . . . . . . . . . . . . . . . . . . . . 10 152From 2 to 5 years . . . . . . . . . . . . . . . . . . . . . . . . . . . . . . . . . . . . . . . . . . . . . . . . . . . . . . . — 88
Total . . . . . . . . . . . . . . . . . . . . . . . . . . . . . . . . . . . . . . . . . . . . . . . . . . . . . . . . . . . . . . . . . . . 10 240
Expense-related
The Group has signed lease contracts for buildings (for periods from 6 to 9 years) and lines. At December 31,2006 and 2005, the amounts of lease installments payable on non-cancelable lease contracts are the following:
At December 31,2006 2005(millions of Euro)
Within 1 year . . . . . . . . . . . . . . . . . . . . . . . . . . . . . . . . . . . . . . . . . . . . . . . . . . . . . . . . . . . . 355 233From 2 to 5 years . . . . . . . . . . . . . . . . . . . . . . . . . . . . . . . . . . . . . . . . . . . . . . . . . . . . . . . . 788 716Beyond 5 years . . . . . . . . . . . . . . . . . . . . . . . . . . . . . . . . . . . . . . . . . . . . . . . . . . . . . . . . . . 323 311
Total . . . . . . . . . . . . . . . . . . . . . . . . . . . . . . . . . . . . . . . . . . . . . . . . . . . . . . . . . . . . . . . . . . . . 1,466 1,260
NOTE 44—EVENTS SUBSEQUENT TO DECEMBER 31, 2006
Š Revolving Credit Facility expiring 2012
On January 15, 2007, €2 billion of the remaining available syndicated credit line expiring in March 2007 wascancelled and at the same time the revolving credit facility of €6 billion expiring in 2012 was increased by thesame amount. The new amount of the revolving credit facility is therefore equal to €8 billion.
As a result of the above, Telecom Italia S.p.A. has kept its unused committed credit lines at €6.6 billion andextended the average term of the facility.
Š “Bersani” Decree (Decree Law 7, dated January 31, 2007)
In January 2007, the Italian Government enacted the “Bersani” Decree (Decree Law 7, dated January 31,2007) which establishes the elimination of the fixed top-up cost for recharging prepaid phone cards. It alsoprohibits fixing a date for the expiration of the remaining prepaid credit on the card and eliminates certainpenalties for rescinding from the subscription contract with mobile operators before expiration. TelecomItalia has estimated the potential negative impact of the “Bersani Decree” on revenues for 2007 in the rangeof €350-400 million. This takes into account the effect of the potential changes in market share (as a resultof pricing policies), the flexibility with respect to traffic volumes, the possible re-balancing of retail rates andthe efficiencies attainable on recharging costs.
Š Repayment of Telecom Italia S.p.A. 5.625% bonds due 2007
On February 1, 2007, at maturity, Telecom Italia repaid the 5.625% bonds in the principal amount of €1,250million.
Š Finalization of the acquisition of the AOL Internet activities in Germany from Time Warner
On February 28, 2007, the transaction was finalized for the purchase by the Telecom Italia Group of theassets relating to the Internet access business in Germany (broadband and narrowband) from the TimeWarner/AOL Group. The total internet access portfolio has approximately 2.1 million customers. Theconsideration paid was €665 million.
The transaction, which was approved in November 2006 by the European antitrust authority, was concludedafter the seller provided proof of the definitive completion of the process to simplify the corporate chainwhich constituted the last condition to finalizing the transaction.
F-145

Financial Statements Notes To Consolidated Financial Statements
At the same time the internet access business was purchased, a 5-year commercial partnership was alsoagreed with the Time Warner/AOL group which will involve the creation of a dedicated portal under a jointbrand, managed by AOL, which will represent the home page for Telecom Italia’s entire customer base inGermany. A revenue-sharing agreement is also envisaged which will be based on the number of visits to thatportal and the use of the services offered with proceeds estimated at approximately €20 million for theTelecom Italia Group.
The valuations necessary for purposes of that allocation, at February 28, 2007, of the cost of the businesscombination to the acquired assets and liabilities is currently in progress.
NOTE 45—LIST OF COMPANIES OF THE TELECOM ITALIA GROUP
In accordance with Consob resolution No. 11971 dated May 14, 1999, as amended and Consob CommunicationDEM/6064293 dated July 28, 2006, the list of significant companies and investments held by the Group isprovided herein.
The list is divided by type of investment, consolidation method and business segment.
The following is indicated for each company: name, head office, country, the share capital in the original currency,in addition to the percentage holding of share capital, the percentage of voting rights in the ordinaryshareholders’ meeting if different than the percentage holding of share capital, and which companies hold theinvestment.
List of companies consolidated on a line-by-line basis
Name Head Office CurrencyShareCapital
%ownership
% ofvotingrights Held by
WIRELINE
TELECOM ITALIA S.P.A. (WIRELINEBUSINESS)
BBEYOND B.V. AMSTERDAM EUR 18,000 100.0000 BBNED N.V.(telecommunications services) (HOLLAND)
BBNED N.V. AMSTERDAM EUR 82,430,000 99.9939 TELECOM ITALIA INTERNATIONAL N.V.(telecommunications services) (HOLLAND) 0.0061 BBNED N.V.
ELETTRA TLC S.p.A. ROME EUR 10,329,200 70.0000 MEDITERRANEAN NAUTILUS S.A.(services rendered in connection with
submarine cable systems fortelecommunications)
(ITALY)
HANSENET TELEKOMMUNIKATIONGmbH
HAMBURG(GERMANY)
EUR 91,521,500 100.0000 TELECOM ITALIA DEUTSCHLANDHOLDING GmbH
(telecommunications services)
I.T. TELECOM S.r.l. POMEZIA EUR 7,000,000 100.0000 TELECOM ITALIA S.p.A.(other software development and
software consulting)(ROME -ITALY)
INTERCALL S.A. PARIS EUR 807,060 88.6342 LIBERTY SURF GROUP S.A.S(audiotex services and sale of prepaid
phone cards)(FRANCE)
LATIN AMERICAN NAUTILUSARGENTINA S.A.
BUENOSAIRES(ARGENTINA)
ARS 9,998,000 95.0000 LATIN AMERICAN NAUTILUS LTD
(installation and maintenance ofsubmarine cable systems)
5.0000 LATIN AMERICAN NAUTILUS S.A.
LATIN AMERICAN NAUTILUS BOLIVIASRL
LA PAZ(BOLIVIA)
BOB 6,730,600 99.9985 LATIN AMERICAN NAUTILUS S.A.
(installation and maintenance ofsubmarine cable systems)
0.0015 LATIN AMERICAN NAUTILUS USA Inc.
LATIN AMERICAN NAUTILUS BRASILLtda
RIO DEJANEIRO
BRL 63,900 99.9999 LATIN AMERICAN NAUTILUS BRASILPARTICIPACOES LTDA
(installation and maintenance ofsubmarine cable systems)
(BRAZIL) 0.0001 LATIN AMERICAN NAUTILUS USA Inc.
F-146

Financial Statements Notes To Consolidated Financial Statements
Name Head Office CurrencyShareCapital
%ownership
% ofvotingrights Held by
LATIN AMERICAN NAUTILUS BRASILPARTICIPACOES Ltda
RIO DEJANEIRO
BRL 2,058,168 100.0000 LATIN AMERICAN NAUTILUS LTD
(holding company) (BRAZIL)
LATIN AMERICAN NAUTILUS CHILES.A.
SANTIAGO(CHILE)
CLP 9,265,000,000 100.0000 LATIN AMERICAN NAUTILUS LTD
(installation and maintenance ofsubmarine cable systems)
LATIN AMERICAN NAUTILUSCOLOMBIA Ltda
BOGOTA’(COLOMBIA)
COP 240,225,000 100.0000 LATIN AMERICAN NAUTILUS LTD
(installation and maintenance ofsubmarine cable systems)
LATIN AMERICAN NAUTILUS Ltd DUBLIN USD 1,000,000 100.0000 LATIN AMERICAN NAUTILUS S.A.(installation and maintenance of
submarine cable systems)(IRELAND)
LATIN AMERICAN NAUTILUSMEXICO S.A.
MEXICO D.F.(MEXICO)
MXN 100,000 99.9900 LATIN AMERICAN NAUTILUS LTD
(installation and maintenance ofsubmarine cable systems)
0.0100 LATIN AMERICAN NAUTILUS USAInc.
LATIN AMERICAN NAUTILUSPANAMA S.A.
PANAMA USD 10,000 100.0000 LATIN AMERICAN NAUTILUS LTD
(installation and maintenance ofsubmarine cable systems)
LATIN AMERICAN NAUTILUS PERU’S.A.
LIMA(PERÙ)
PEN 56,704,995 100.0000 LATIN AMERICAN NAUTILUS LTD
(installation and maintenance ofsubmarine cable systems)
LATIN AMERICAN NAUTILUS S.A. LUXEMBOURG USD 55,500,000 99.9999 TELECOM ITALIA SPARKLE S.p.A.(holding company) (LUXEMBOURG) 0.0001 TELECOM ITALIA FINANCE S.A.
LATIN AMERICAN NAUTILUSSERVICE Inc.
FLORIDA(USA)
USD 10,000 100.0000 LATIN AMERICAN NAUTILUS USAInc.
(installation and maintenance ofsubmarine cable systems)
LATIN AMERICAN NAUTILUS St.Croix LLC
VIRGINISLANDS
USD 10,000 100.0000 LATIN AMERICAN NAUTILUS LTD.
(installation and maintenance ofsubmarine cable systems)
(USA)
LATIN AMERICAN NAUTILUS USAInc.
FLORIDA(USA)
USD 20,000 100.0000 LATIN AMERICAN NAUTILUS LTD.
(installation and maintenance ofsubmarine cable systems)
LATIN AMERICAN NAUTILUSVENEZUELA C.A.
CARACAS(VENEZUELA)
VEB 51,709,000 100.0000 LATIN AMERICAN NAUTILUS LTD.
(installation and maintenance ofsubmarine cable systems)
LIBERTY SURF COMMUNICATIONSLTD (in liquidation)
LONDON(UK)
GBP 1,000 100.0000 LIBERTY SURF NETWORK B.V. (inliquidations)
(telecommunications services)
LIBERTY SURF GROUP S.A.S. PARIS EUR 282,559,451 100.0000 TELECOM ITALIA S.p.A.(holding company) (FRANCE)
LIBERTY SURF NETWORK B.V. (inliquidation)
AMSTERDAM EUR 20,001 100.0000 LIBERTY SURF GROUP S.A.S.
(telecommunications services) (HOLLAND)
LOQUENDO SOCIETA’ PER AZIONI TURIN EUR 3,573,741 99.9846 TELECOM ITALIA S.p.A.(research, development and
marketing of technologies andequipment regarding voicesynthesis recognition and/orinteraction)
(ITALY)
MATRIX S.p.A. MILAN EUR 1,100,000 100.0000 TELECOM ITALIA S.p.A.(internet services) (ITALY)
F-147
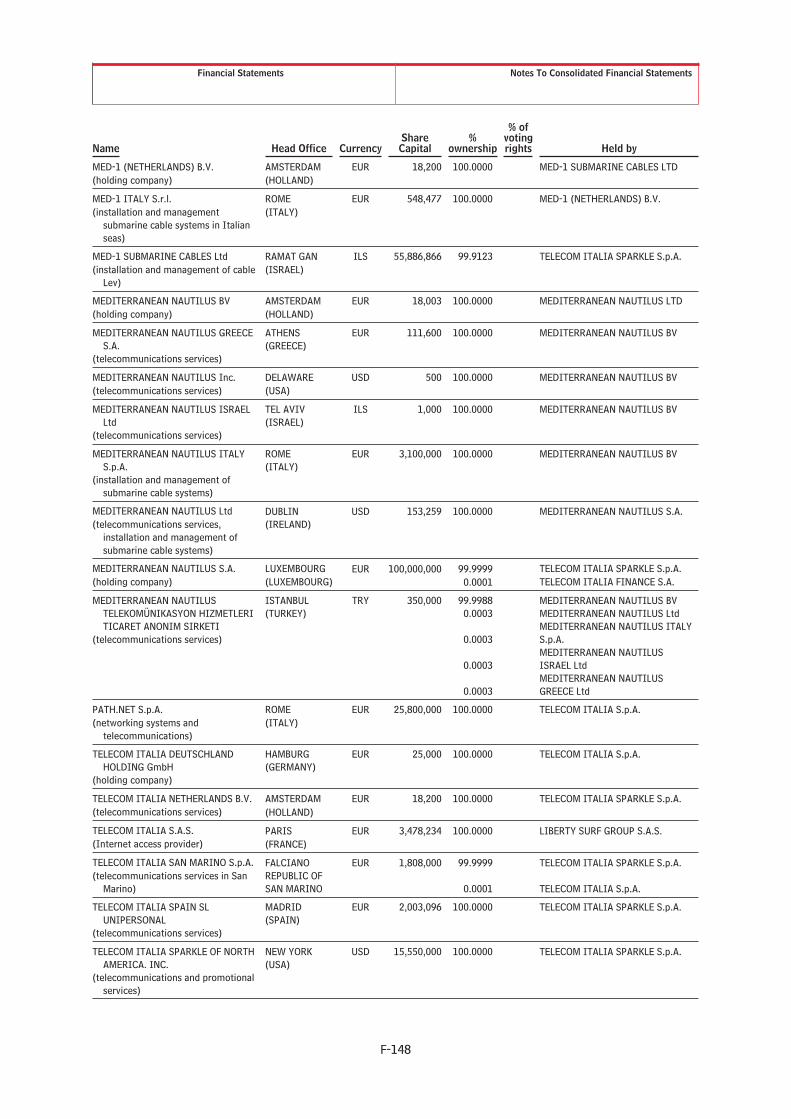
Financial Statements Notes To Consolidated Financial Statements
Name Head Office CurrencyShareCapital
%ownership
% ofvotingrights Held by
MED-1 (NETHERLANDS) B.V. AMSTERDAM EUR 18,200 100.0000 MED-1 SUBMARINE CABLES LTD(holding company) (HOLLAND)
MED-1 ITALY S.r.l. ROME EUR 548,477 100.0000 MED-1 (NETHERLANDS) B.V.(installation and management
submarine cable systems in Italianseas)
(ITALY)
MED-1 SUBMARINE CABLES Ltd RAMAT GAN ILS 55,886,866 99.9123 TELECOM ITALIA SPARKLE S.p.A.(installation and management of cable
Lev)(ISRAEL)
MEDITERRANEAN NAUTILUS BV AMSTERDAM EUR 18,003 100.0000 MEDITERRANEAN NAUTILUS LTD(holding company) (HOLLAND)
MEDITERRANEAN NAUTILUS GREECES.A.
ATHENS(GREECE)
EUR 111,600 100.0000 MEDITERRANEAN NAUTILUS BV
(telecommunications services)
MEDITERRANEAN NAUTILUS Inc. DELAWARE USD 500 100.0000 MEDITERRANEAN NAUTILUS BV(telecommunications services) (USA)
MEDITERRANEAN NAUTILUS ISRAELLtd
TEL AVIV(ISRAEL)
ILS 1,000 100.0000 MEDITERRANEAN NAUTILUS BV
(telecommunications services)
MEDITERRANEAN NAUTILUS ITALYS.p.A.
ROME(ITALY)
EUR 3,100,000 100.0000 MEDITERRANEAN NAUTILUS BV
(installation and management ofsubmarine cable systems)
MEDITERRANEAN NAUTILUS Ltd DUBLIN USD 153,259 100.0000 MEDITERRANEAN NAUTILUS S.A.(telecommunications services,
installation and management ofsubmarine cable systems)
(IRELAND)
MEDITERRANEAN NAUTILUS S.A. LUXEMBOURG EUR 100,000,000 99.9999 TELECOM ITALIA SPARKLE S.p.A.(holding company) (LUXEMBOURG) 0.0001 TELECOM ITALIA FINANCE S.A.
MEDITERRANEAN NAUTILUSTELEKOMÜNIKASYON HIZMETLERITICARET ANONIM SIRKETI
(telecommunications services)
ISTANBUL(TURKEY)
TRY 350,000 99.99880.0003
0.0003
MEDITERRANEAN NAUTILUS BVMEDITERRANEAN NAUTILUS LtdMEDITERRANEAN NAUTILUS ITALYS.p.A.
0.0003MEDITERRANEAN NAUTILUSISRAEL Ltd
0.0003MEDITERRANEAN NAUTILUSGREECE Ltd
PATH.NET S.p.A. ROME EUR 25,800,000 100.0000 TELECOM ITALIA S.p.A.(networking systems and
telecommunications)(ITALY)
TELECOM ITALIA DEUTSCHLANDHOLDING GmbH
HAMBURG(GERMANY)
EUR 25,000 100.0000 TELECOM ITALIA S.p.A.
(holding company)
TELECOM ITALIA NETHERLANDS B.V. AMSTERDAM EUR 18,200 100.0000 TELECOM ITALIA SPARKLE S.p.A.(telecommunications services) (HOLLAND)
TELECOM ITALIA S.A.S. PARIS EUR 3,478,234 100.0000 LIBERTY SURF GROUP S.A.S.(Internet access provider) (FRANCE)
TELECOM ITALIA SAN MARINO S.p.A. FALCIANO EUR 1,808,000 99.9999 TELECOM ITALIA SPARKLE S.p.A.(telecommunications services in San
Marino)REPUBLIC OFSAN MARINO 0.0001 TELECOM ITALIA S.p.A.
TELECOM ITALIA SPAIN SLUNIPERSONAL
MADRID(SPAIN)
EUR 2,003,096 100.0000 TELECOM ITALIA SPARKLE S.p.A.
(telecommunications services)
TELECOM ITALIA SPARKLE OF NORTHAMERICA. INC.
NEW YORK(USA)
USD 15,550,000 100.0000 TELECOM ITALIA SPARKLE S.p.A.
(telecommunications and promotionalservices)
F-148

Financial Statements Notes To Consolidated Financial Statements
Name Head Office Currency Share Capital%
ownership
% ofvotingrights Held by
TELECOM ITALIA SPARKLE S.p.A. ROME EUR 200,000,000 100.0000 TELECOM ITALIA S.p.A.(public and private
telecommunication servicesmanagement)
(ITALY)
TELECOM ITALIA SPARKLESINGAPORE PTE. LTD
SINGAPORE USD 500,000 99.9998 TELECOM ITALIA SPARKLE S.p.A.
(telecommunications services) 0.0002 TELECOM ITALIA SPARKLE OFNORTH AMERICA. INC.
TELECONTACT CENTER S.p.A NAPLES EUR 770,000 100.0000 TELECOM ITALIA S.p.A.(telemarketing services) (ITALY)
TELEFONIA MOBILE SAMMARINESES.p.A.
BORGOMAGGIORE
EUR 78,000 51.0000 TELECOM ITALIA SAN MARINOS.p.A.
(mobile telephony services) REPUBLIC OFSAN MARINO
TELEMEDIA INTERNATIONAL USAInc.
NEW JERSEY(USA)
USD 154,022,890 100.0000 TMI—TELEMEDIAINTERNATIONAL LTD
(telecommunications services)
THINX-SM TELEHOUSE INTERNETEXCHANGE S.r.l.
GUALDICCIOLOREPUBLIC OFSAN MARINO
EUR 25,800 99.0000 TELECOM ITALIA SAN MARINOS.p.A.
(housing and hosting) 1.0000 TELECOM ITALIA SPARKLE S.p.A.
TI BELGIUM S.P.R.L.—B.V.B.A BRUSSELS EUR 3,000,000 99.9967 TELECOM ITALIA SPARKLE S.p.A.(telecommunications services) (BELGIUM)
TI GERMANY GmbH FRANKFURT EUR 25,000 100.0000 TELECOM ITALIA SPARKLE S.p.A..(telecommunications services) (GERMANY)
TI SWITZERLAND GmbH ZURICH CHF 2,000,000 100.0000 TELECOM ITALIA SPARKLE S.p.A..(telecommunications services) (SWITZERLAND)
TI TELECOM ITALIA (AUSTRIA)TELEKOMMUNICATIONDIESTEGMBH
VIENNA(AUSTRIA)
EUR 2,735,000 100.0000 TELECOM ITALIA SPARKLE S.p.A.
(telecommunications services)
TI UNITED KINGDOM Ltd LONDON GBP 4,150,000 100.0000 TELECOM ITALIA SPARKLE S.p.A.(telecommunications services) (UK)
TIS FRANCE S.A.S. PARIS EUR 3,295,000 100.0000 TELECOM ITALIA SPARKLE S.p.A.(installation and management of
services connected to fixednetwork and related activities)
(FRANCE)
TMI—TELEMEDIA INTERNATIONALLtd
LONDON(UK)
EUR 3,983,254 100.0000 TELECOM ITALIA SPARKLE S.p.A.
(telecommunications services) GBP 1
TMI TELEMEDIA INTERNATIONALDO BRASIL LTDA
SAO PAULO(BRAZIL)
BRL 2,589,317 100.0000 TMI—TELEMEDIAINTERNATIONAL LTD
(telecommunications services)
DOMESTIC MOBILE
TELECOM ITALIA S.P.A. (MOBILEBUSINESS)
BRAZIL MOBILE
TIM BRASIL SERVIÇOS EPARTICIPAÇÕES S.A.
RIO DEJANEIRO
BRL 10,948,214,541 100.0000 TIM INTERNATIONAL N.V.
(holding company) (BRAZIL)
TIM CELULAR S.A. SAO PAULO BRL 8,434,645,238 100.0000 TIM PARTICIPAÇÕES S.A.(mobile telephony operator) (BRAZIL)
TIM NORDESTE S.A. JABOATÃO DOS BRL 1,585,220,696 100.0000 TIM CELULAR S.A.(mobile telephony operator) GUARARAPES
(BRAZIL)
TIM PARTICIPACOES S.A.(holding company)
RIO DEJANEIRO
BRL 7,512,709,900 69.6703 81.2059 TIM BRASIL SERVIÇOS EPARTICIPAÇÕES S.A.
(BRAZIL)
F-149

Financial Statements Notes To Consolidated Financial Statements
Name Head Office CurrencyShareCapital
%ownership
% ofvotingrights Held by
MEDIA
BEIGUA S.r.l. ROME EUR 51,480 51.0004 TI MEDIA BROADCASTING S.r.l.(purchase, sale, management and
maintenance of installation for therepair and distribution of radio andTV broadcasting)
(ITALY)
GIALLO VIAGGI.IT S.r.l. (in liquidation) MILAN EUR 10,000 100.0000 TELECOM ITALIA MEDIA S.p.A.(research, design, development,
production of information andtelematic products for tourism)
(ITALY)
HOLDING MEDIA E COMUNICAZIONEPUBBLICITA’ S.r.l. (in liquidation)
ROME(ITALY)
EUR 10,000 100.000 HOLDING MEDIA E COMUNICAZIONEHMC S.p.A.
(purchase/sale of ad space andmanagement of advertising onradio/TV stations/channels)
HOLDING MEDIA E COMUNICAZIONEH.M.C. S.p.A.
ROME(ITALY)
EUR 5,064,000 100.0000 TELECOM ITALIA MEDIA S.p.A.
(production, marketing on TV andpress)
MTV ITALIA S.r.l. ROME EUR 12,151,928 51.0000 TELECOM ITALIA MEDIA S.p.A.(services in the field of radio and TV
broadcasting. production and sale ofradio, TV and cinema programs)
(ITALY)
MTV PUBBLICITA’ S.r.l. MILAN EUR 10,400 100.0000 MTV ITALIA S.r.l.(advertising agency) (ITALY)
SCS COMUNICAZIONE INTEGRATAS.p.A. (in liquidation)
ROME(ITALY)
EUR 600,000 100.0000 TELECOM ITALIA MEDIA S.p.A.
(marketing and communicationconsulting)
TELECOM ITALIA MEDIA S.p.A. ROME EUR 100,510,259 65.7069 66.7962 TELECOM ITALIA S.p.A.(management of all activities
connected with the handling ofinformation)
(ITALY) 2.2471 2.2846 TELECOM ITALIA FINANCE S.A.
TELECOM MEDIA NEWS S.p.A. ROME EUR 120,000 100.0000 TELECOM ITALIA MEDIA S.p.A.(multimedia journalistic information) (ITALY)
TI MEDIA BROADCASTING S.r.l. ROME EUR 15,000,000 100.0000 TELECOM ITALIA MEDIA S.p.A.(purchase, sale, management and
maintenance of installation for therepair and distribution of radio andTV broadcasting)
(ITALY)
OLIVETTI
ADVALSO S.p.A. IVREA(TURIN—ITALY)
EUR 500,000 100.0000 OLIVETTI S.p.A.(planning, production and servicing of
telecommunication services andproduct)
CONSORZIO MAEL ROME EUR 52,000 60.0000 OLIVETTI S.p.A.(participation in bids and competitions
held by public and private entities)(ITALY) 40.0000 TIEMME SISTEMI S.r.l.
DIASPRON DO BRASIL S.A. (inliquidation) SAO PAULO
BRL 5,135,417 100.0000 OLIVETTI DO BRASIL S.A.
(manufacture and export of typewritersand printers)
(BRAZIL)
MULTIDATA S/A ELETRONICAINDUSTRIA E COMERCIO (inliquidation)
MANAUS(BRAZIL)
BRL 5,583,350 100.0000 OLIVETTI DO BRASIL S.A.
(manufacture and export of typewritersand printers)
OLIVETTI ARGENTINA S.A.C.e.I. (inliquidation)
BUENOSAIRES
ARS 7,590,000 100.0000 OLIVETTI INTERNATIONAL B.V.
(sale and maintenance of officeequipment)
(ARGENTINA)
F-150

Financial Statements Notes To Consolidated Financial Statements
Name Head Office CurrencyShareCapital
%ownership
% ofvotingrights Held by
OLIVETTI AUSTRIA G.m.b.H VIENNA EUR 36,336 100.0000 OLIVETTI INTERNATIONAL B.V.(sale of office equipment and
accessories)(AUSTRIA)
OLIVETTI CHILE S.A. (inliquidation)
SANTIAGO(CHILE)
CLP 2,574,015,843 100.0000 OLIVETTI INTERNATIONAL B.V.
(sale and maintenance of officeequipment, accessories andsoftware)
OLIVETTI COLOMBIANA S.A.( inliquidation)
BOGOTA’(COLOMBIA)
COP 2,500,000,000 90.5288 OLIVETTI INTERNATIONAL B.V.
(sale of office and industrialequipment)
9.4700 OLIVETTI S.p.A.
0.0001 OLIVETTI CHILE S.A. (inliquidation)
OLIVETTI DE PUERTO RICO, Inc. SAN JUAN USD 1,000 100.0000 OLIVETTI INTERNATIONAL B.V.(office equipment in the United
States and Central America)(PUERTO RICO)
OLIVETTI DEUTSCHLAND GmbH NURNBERG EUR 25,600,000 100.0000 OLIVETTI INTERNATIONAL B.V.(sale of office equipment and
holding company)(GERMANY)
OLIVETTI DO BRASIL S.A. SAO PAULO BRL 111,660,625 96.6446 OLIVETTI INTERNATIONAL B.V.(manufacture and sale of
typewriters, accessories, spareparts and assistance)
(BRAZIL) 3.3554 OLIVETTI MEXICANA S.A. (inliquidation)
OLIVETTI ENGINEERING S.A. YVERDON LESBAINS(SWITZERLAND)
CHF 100,000 100.0000 OLIVETTI I-JET S.p.A.(product research and development
based on ink-jet technology)
OLIVETTI ESPANA S.A. BARCELONA EUR 1,229,309 99.9863 OLIVETTI INTERNATIONAL B.V.(sale and maintenance of office
equipment, consulting andtelematic network management)
(SPAIN)
OLIVETTI FRANCE S.A. PUTEAUX EUR 2,200,000 100.0000 OLIVETTI INTERNATIONAL B.V.(sale of office equipment and
software)(FRANCE)
OLIVETTI I-JET S.p.A. ARNAD EUR 15,000,000 100.0000 OLIVETTI S.p.A.(manufacture and sale of products
and accessories for officeequipment)
(AOSTA—ITALY)
OLIVETTI INTERNATIONAL B.V. AMSTERDAM EUR 355,027,092 100.0000 OLIVETTI S.p.A.(holding company) (HOLLAND)
OLIVETTI MEXICANA S.A.(in liquidation)
MEXICO CITY(MEXICO)
MXN 34,637,065 99.9999 OLIVETTI INTERNATIONAL B.V.
(manufacture and sale, import-export of typewriters, addingmachines, accessories and spareparts, technical assistanceservices)
0.0001 OLIVETTI S.p.A.
OLIVETTI S.p.A. IVREA EUR 154,000,000 100.0000 TELECOM ITALIA S.p.A.(manufacture and sale of products
and accessories for officeequipment)
(TURIN—ITALY)
OLIVETTI TECNOST NEDERLANDB.V. (in liquidation)
LEIDERDORP(HOLLAND)
EUR 6,468,280 100.0000 OLIVETTI INTERNATIONAL B.V.
(sale of office equipment andaccessories)
OLIVETTI UK Ltd. MILTON KEYNES GBP 6,295,712 100.0000 OLIVETTI INTERNATIONAL B.V.(sale of office equipment) (UK)
TIEMME SISTEMI S.r.l. CARSOLI EUR 1,040,000 100.0000 OLIVETTI S.p.A.(electric, electromechanical,
electronic equipment and relatedsystems)
(L’AQUILA—ITALY)
F-151

Financial Statements Notes To Consolidated Financial Statements
Name Head Office CurrencyShareCapital
%ownership
% ofvotingrights Held by
TIESSE S.c.p.A. ROME EUR 103,292 42.0000 OLIVETTI S.p.A.(installation and assistance for
electromechanical, electronic,computer, telematic andtelecommunications equipment)
(ITALY) 19.0000 TIEMME SISTEMI S.r.l.
TOP SERVICE S.p.A. MODUGNO EUR 293,618 91.2069 OLIVETTI S.p.A.(electronic diagnostics and repairs of
computer products)(BARI—ITALY)
OTHER ACTIVITIES
ASCAI SERVIZI S.r.l. (in liquidation) ROME(ITALY)
EUR 73,337 64.9599 SAIAT SOCIETA’ATTIVITA’INTERMEDIEAUSILIARIE TLC P.A.
(strategy and communicationprocesses promotion)
DATACOM S.A. LA PAZ BOB 66,938,200 99.9991 ENTEL BOLIVIA(data transmission services) (BOLIVIA)
DOMUS ACADEMY S.p.A. MILAN EUR 140,000 67.3336 TELECOM ITALIA S.p.A.(specialized design courses) (ITALY)
EMSA Servizi S.p.A. (in liquidation) ROME EUR 5,000,000 100.0000 TELECOM ITALIA S.p.A.(real estate services management) (ITALY)
ENTEL S.A.-EMPRESA NACIONAL DETELECOMUNICACIONES
LA PAZ(BOLIVIA)
BOB 1,280,898,800 50.0000 ETI-EUROTELECOMINTERNATIONAL N.V.
(long-distance telecommunicationsservices, mobile and datatransmission services)
ETI—EURO TELECOMINTERNATIONAL N.V.
AMSTERDAM(HOLLAND)
EUR 50,050 100.0000 ICH—INTERNATIONALCOMMUNICATION HOLDING N.V.
(holding company)
ICH—INTERNATIONALCOMMUNICATION HOLDING N.V.
AMSTERDAM(HOLLAND)
EUR 50,000 100.0000 TELECOM ITALIA INTERNATIONALN.V.
(holding company)
IRIDIUM ITALIA S.p.A. (inliquidation)
ROME(ITALY)
EUR 2,575,000 65.0000 TELECOM ITALIA S.p.A.
(satellite telecommunicationsservices)
NETESI S.p.A. (in liquidation) MILAN EUR 434,715 100.0000 TELECOM ITALIA S.p.A.(telecommunications and multimedia
services)(ITALY)
O&B COSTRUZIONI GENERALI S.r.l.(in liquidation)
IVREA(TURIN—ITALY)
EUR 100,000 50.1000 OLIVETTI MULTISERVICES S.p.A.
(real estate purchases, exchangesand sales)
OFI CONSULTING S.r.l. IVREA EUR 95,000 100.0000 TELECOM ITALIA S.p.A.(administrative consulting) (TURIN—ITALY)
OLIVETTI GESTIONI IVREA S.p.A. (inliquidation)
IVREA EUR 1,300,000 100.0000 TELECOM ITALIA S.p.A.
(real estate services) (TURIN—ITALY)
OLIVETTI HOLDING B.V. AMSTERDAM EUR 15,882,770 100.0000 TELECOM ITALIA FINANCE S.A.(holding company) (HOLLAND)
OLIVETTI MULTISERVICES S.p.A. MILAN EUR 20.337.161 100.0000 TELECOM ITALIA S.p.A.(real estate management) (ITALY)
OLIVETTI SYSTEMS TECHNOLOGYCORPORATION (in liquidation)
YOKOHAMA(JAPAN)
JPY 100,000,000 100.0000 TELECOM ITALIA FINANCE S.A.
(real estate management)
OMS HOLDING B.V. (in liquidation) AMSTERDAM EUR 20,000 100.0000 OLIVETTI MULTISERVICES S.p.A.(financing) (HOLLAND)
PROGETTO ITALIA S.p.A. MILAN EUR 1,000,000 100.0000 TELECOM ITALIA S.p.A.(development and improvement of
the Telecom Italia brand)(ITALY)
F-152

Financial Statements Notes To Consolidated Financial Statements
Name Head Office CurrencyShareCapital
%ownership
% ofvotingrights Held by
SAIAT SOCIETA’ ATTIVITA’INTERMEDIE AUSILIARIE TLC P.A.
TURIN(ITALY)
EUR 35,745,120 100.0000 TELECOM ITALIA S.p.A.
(financing)
SATURN VENTURE PARTNERS LLC DELAWARE USD 25,806,100 56.9600 TELECOM ITALIA LAB SA(financing) (USA) 17.8482 TELECOM ITALIA S.p.A.
TECNOSERVIZI MOBILI S.r.l. ROME EUR 26,000 51.0000 TELECOM ITALIA S.p.A.(management of movable assets) (ITALY)
TECO SOFT ARGENTINA S.A. (inliquidation)
BUENOS AIRES(ARGENTINA)
ARS 12,000 99.9917 TELECOM ITALIA S.p.A.
(design. development and sale ofsoftware)
TELECOM ITALIA AMERICA LATINAS.A.
SAO PAULO(BRAZIL)
BRL 43,614,072 99.9996 TELECOM ITALIA S.p.A.
(services and relations office)
TELECOM ITALIA AUDIT ANDCOMPLIANCE SERVICES—SCARL
MILAN(ITALY)
EUR 2,750,000 81.8182 TELECOM ITALIA S.p.A.
(internal auditing for the TelecomItalia Group)
18.1818 TELECOM ITALIA MEDIA S.p.A.
TELECOM ITALIA CAPITAL S.A. LUXEMBOURG EUR 2,336,000 99.9999 TELECOM ITALIA S.p.A.(financing) (LUXEMBOURG) 0.0001 TELECOM ITALIA FINANCE S.A.
TELECOM ITALIA FINANCE S.A. LUXEMBOURG EUR 542,090,241 100.0000 TELECOM ITALIA S.p.A.(financing) (LUXEMBOURG)
TELECOM ITALIA INTERNATIONALN.V.
AMSTERDAM(HOLLAND)
EUR 2,399,483,000 100.0000 TELECOM ITALIA S.p.A.
(holding company)
TELECOM ITALIA LAB S.A. LUXEMBOURG USD 163,870 99.9939 TELECOM ITALIA S.p.A.(holding company) (LUXEMBOURG) 0.0061 TELECOM ITALIA FINANCE S.A.
TELENERGIA S.r.l. ROME EUR 50,000 100.0000 TELECOM ITALIA S.p.A.(import, export, purchase, sale and
exchange of electrical energy)(ITALY)
TELSI Unlimited LONDON GBP 499,661,807 100.0000 TELECOM ITALIA FINANCE S.A.(financing company) (UK)
TELSY ELETTRONICA ETELECOMUNICAZIONI S.p.A.
TURIN(ITALY)
EUR 390,000 100.0000 TELECOM ITALIA S.p.A.
(manufacturing and sale of systemsfor encrypted telecommunications)
TIAUDIT LATAM S.A.(internal auditing)
SAO PAULO(BRAZIL)
BRL 1,500,000 69.9996 TELECOM ITALIA AUDIT ANDCOMPLIANCE SERVICES—SCARL
30.0000 TIM BRASIL SERVICOS EPARTICIPACOES S.A.
TIM INTERNATIONAL N.V. AMSTERDAM EUR 555,431,000 100.0000 TELECOM ITALIA S.p.A.(holding company) (HOLLAND)
TRAINET S.p.A. (in liquidation) ROME EUR 674,446 100.0000 TELECOM ITALIA S.p.A.(development. operation and sales of
teleteaching systems)(ITALY)
Telecom Italia Group
List of companies accounted for using the equity method
Name Head Office CurrencyShareCapital
%ownership
% ofvotingrights Held by
ARCHEO S.p.A. (in liquidation) BARI EUR 464,400 25.0000 OFI CONSULTING S.r.l.(services) (ITALY)
AREE URBANE S.r.l. MILAN EUR 307,717 31.6508 TELECOM ITALIA S.p.A.(real estate) (ITALY) 0.9700 TELECOM ITALIA MEDIA S.p.A.
ASSCOM INSURANCE BROKERS S.r.l. MILAN EUR 100,000 20.0000 TELECOM ITALIA S.p.A.(insurance mediation) (ITALY)
F-153

Financial Statements Notes To Consolidated Financial Statements
Name Head Office CurrencyShareCapital
%ownership
% ofvotingrights Held by
BALTEA S.r.l. IVREA EUR 2,220,000 49.0000 OLIVETTI S.p.A.(manufacture and sale of office
equipment and computer andtelecommunications services)
(TURIN—ITALY)
BROAD BAND SERVICE S.A. SERRAVALLEREPUBLIC OFSAN MARINO
EUR 258,000 20.0000 TELECOM ITALIA SAN MARINOS.p.A.(production and sales of
multimedia services)
CONSORZIO E O (in liquidation) ROME EUR 19,107 50.0000 TELECOM ITALIA S.p.A.(professional training) (ITALY)
CONSORZIO S.I.A.R.C. (inliquidation)
NAPLES(ITALY)
EUR 25,821 30.0000 TELECOM ITALIA S.p.A.
(supply of information productsand services)
CONSORZIO SCUOLA SUPERIOREALTA FORMAZIONEUNIVERSITARIA FEDERICO II(in liquidation)
NAPLES(ITALY)
EUR 127,500 20.0000 TELECOM ITALIA S.p.A.
(professional training)
CONSORZIO TURISTEL ROME EUR 77,460 33.3333 TELECOM ITALIA S.p.A.(online tourism services) (ITALY)
Empresa de Telecomunicacionesde Cuba S.A. ETEC-SA
HAVANA(CUBA)
USD 1,749,313,080 27.0030 TELECOM ITALIAINTERNATIONAL N.V.
(telecommunications services)
IM.SER S.p.A. TURIN EUR 367,200 40.0000 TELECOM ITALIA S.p.A.(real estate management) (ITALY)
IN.VA. S.p.A. AOSTA EUR 520,000 40.0000 TELECOM ITALIA S.p.A.(information systems) (ITALY)
INTERCALL HELLAS S.A. ATHENS EUR 496,696 29.4099 INTERCALL S.A.(sale of prepaid telephone cards) (GREECE)
ITALTEL GROUP S.p.A. MILAN EUR 115,459,344 19.3733 TELECOM ITALIA FINANCE S.A.(holding company) (ITALY)
LI.SIT.—LOMBARDIA INTEGRATASERVIZI INFOTELEMATICI PERIL TERRITORIO S.p.A.
MILAN(ITALY)
EUR 6,500,000 24.2000 TELECOM ITALIA S.p.A.
(information, TLC services andproducts for the local publicadministration)
LUNA ROSSA CHALLENGE 2007S.L.
VALENCIA(SPAIN)
EUR 4,000,000 49.0000 TELECOM ITALIA S.p.A.
(promotion, organization ofsailboat races include theAmerica’s Cup)
LUNA ROSSA TRADEMARK s.a.r.l. LUXEMBOURG EUR 20,000,000 49.0000 TELECOM ITALIA S.p.A.(purchase, management,
development of intellectualproperty rights)
MIAECONOMIA S.r.l. ROME EUR 1,000,000 30.0000 MATRIX S.p.A.(publishing in the field of personal
finance)(ITALY)
MOVENDA S.p.A. ROME EUR 133,333 24.9998 TELECOM ITALIA LAB SA(technological platforms for the
development of mobile Internetservices)
(ITALY)
NAUTILUS S.c.a.r.l. ROME(ITALY)
EUR 30,000 20.0000 MEDITERRANEAN NAUTILUSLTD(professional training)
F-154
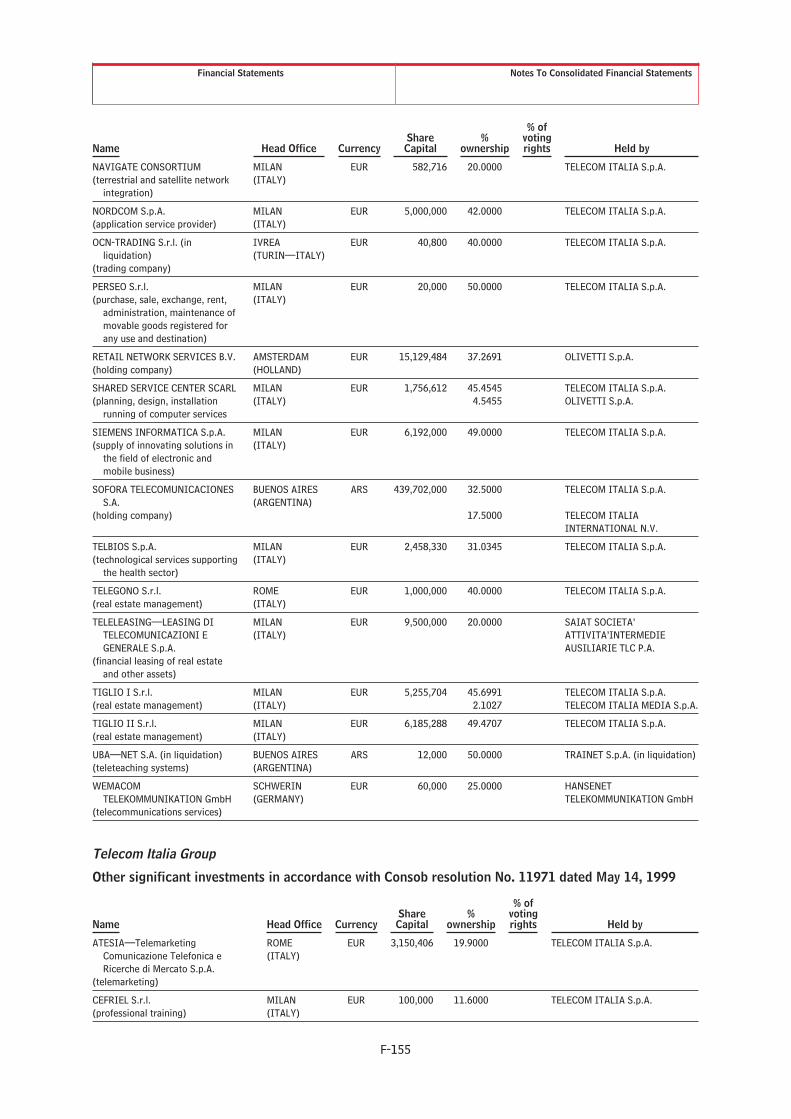
Financial Statements Notes To Consolidated Financial Statements
Name Head Office CurrencyShareCapital
%ownership
% ofvotingrights Held by
NAVIGATE CONSORTIUM MILAN EUR 582,716 20.0000 TELECOM ITALIA S.p.A.(terrestrial and satellite network
integration)(ITALY)
NORDCOM S.p.A. MILAN EUR 5,000,000 42.0000 TELECOM ITALIA S.p.A.(application service provider) (ITALY)
OCN-TRADING S.r.l. (inliquidation)
IVREA(TURIN—ITALY)
EUR 40,800 40.0000 TELECOM ITALIA S.p.A.
(trading company)
PERSEO S.r.l. MILAN EUR 20,000 50.0000 TELECOM ITALIA S.p.A.(purchase, sale, exchange, rent,
administration, maintenance ofmovable goods registered forany use and destination)
(ITALY)
RETAIL NETWORK SERVICES B.V. AMSTERDAM EUR 15,129,484 37.2691 OLIVETTI S.p.A.(holding company) (HOLLAND)
SHARED SERVICE CENTER SCARL MILAN EUR 1,756,612 45.4545 TELECOM ITALIA S.p.A.(planning, design, installation
running of computer services(ITALY) 4.5455 OLIVETTI S.p.A.
SIEMENS INFORMATICA S.p.A. MILAN EUR 6,192,000 49.0000 TELECOM ITALIA S.p.A.(supply of innovating solutions in
the field of electronic andmobile business)
(ITALY)
SOFORA TELECOMUNICACIONESS.A.
BUENOS AIRES(ARGENTINA)
ARS 439,702,000 32.5000 TELECOM ITALIA S.p.A.
(holding company) 17.5000 TELECOM ITALIAINTERNATIONAL N.V.
TELBIOS S.p.A. MILAN EUR 2,458,330 31.0345 TELECOM ITALIA S.p.A.(technological services supporting
the health sector)(ITALY)
TELEGONO S.r.l. ROME EUR 1,000,000 40.0000 TELECOM ITALIA S.p.A.(real estate management) (ITALY)
TELELEASING—LEASING DITELECOMUNICAZIONI EGENERALE S.p.A.
MILAN(ITALY)
EUR 9,500,000 20.0000 SAIAT SOCIETA’ATTIVITA’INTERMEDIEAUSILIARIE TLC P.A.
(financial leasing of real estateand other assets)
TIGLIO I S.r.l. MILAN EUR 5,255,704 45.6991 TELECOM ITALIA S.p.A.(real estate management) (ITALY) 2.1027 TELECOM ITALIA MEDIA S.p.A.
TIGLIO II S.r.l. MILAN EUR 6,185,288 49.4707 TELECOM ITALIA S.p.A.(real estate management) (ITALY)
UBA—NET S.A. (in liquidation) BUENOS AIRES ARS 12,000 50.0000 TRAINET S.p.A. (in liquidation)(teleteaching systems) (ARGENTINA)
WEMACOMTELEKOMMUNIKATION GmbH
SCHWERIN(GERMANY)
EUR 60,000 25.0000 HANSENETTELEKOMMUNIKATION GmbH
(telecommunications services)
Telecom Italia Group
Other significant investments in accordance with Consob resolution No. 11971 dated May 14, 1999
Name Head Office CurrencyShareCapital
%ownership
% ofvotingrights Held by
ATESIA—TelemarketingComunicazione Telefonica eRicerche di Mercato S.p.A.
ROME(ITALY)
EUR 3,150,406 19.9000 TELECOM ITALIA S.p.A.
(telemarketing)
CEFRIEL S.r.l. MILAN EUR 100,000 11.6000 TELECOM ITALIA S.p.A.(professional training) (ITALY)
F-155

Financial Statements Notes To Consolidated Financial Statements
Name Head Office CurrencyShareCapital
%ownership
% ofvotingrights Held by
CELL—TEL S.p.A. IVREA EUR 500,000 15.0000 OLIVETTI S.p.A.(telecommunications
equipment, plant andsystems)
(TURIN—ITALY)
FIN.PRIV. S.r.l. MILAN EUR 20,000 14.2900 TELECOM ITALIA S.p.A.(financing) (ITALY)
IFM INFOMASTER S.p.A. GENOA EUR 161,765 12.0000 TELECOM ITALIA LAB S.A.(planning and development of
call center solutions)(ITALY)
INNOVIS S.p.A. IVREA EUR 325,000 15.0000 OLIVETTI S.p.A.(computer, online and
telecommunicationsequipments and services)
(TURIN—ITALY)
INSULA S.p.A. VENICE—MESTRE EUR 2,064,000 12.0000 TELECOM ITALIA S.p.A.(telecommunications services) (ITALY)
ITALBIZ.COM Inc. CALIFORNIA(USA)
USD 4,720 19.5000 TELECOM ITALIA MEDIAS.p.A.(Internet services)
LEGACY LLH LIMITED (EXLEISURE LINK ltd)
STAFFORDSHIRE(UK)
GBP 7,809,179 11.4700 TELECOM ITALIA FINANCES.A.
(manufacture of gaming andleisure-time machines)
NEW SATELLITE RADIO S.r.l. MILAN EUR 10,000 12.7200 TELECOM ITALIA S.p.A.(production and realization of
radio-tv channel andprogram)
(ITALY)
OGER TELECOM LIMITED DUBAY USD 4,343,436,360 10.3600 TIM INTERNATIONAL N.V.(holding company) (UNITED ARAB
EMIRATES)
PIEDMONT INTERNATIONALS.A.
LUXEMBOURG(LUXEMBOURG)
USD 10,507,500 17.1300 10.3000 TELECOM ITALIA FINANCES.A.
(financing)
TWICE SIM S.p.A. MILAN EUR 8,450,000 14.2300 TELECOM ITALIA MEDIAS.p.A.(investment services) (ITALY)
USABLENET INC DELAWARE USD 4 18.1081 TELECOM ITALIA LAB SA(development of software for
the analysis of web siteusability)
(USA)
F-156

Financial Statements Notes To Consolidated Financial Statements
NOTE 46—RECONCILIATION OF IFRS AS ADOPTED BY THE EU TO U.S. GAAP
The Consolidated Financial Statements of the Group have been prepared in accordance with IFRS, which differ incertain respects from generally accepted accounting principles in the United States (U.S. GAAP).
Certain amounts in the presentation of the 2005 and 2004 reconciliations of Net income for the year and Equity,from IFRS to U.S. GAAP have been reclassified to conform to the 2006 presentation.
Application of U.S. GAAP would have affected net income for each of the years ended December 31, 2006, 2005and 2004 and equity as of December 31, 2006 and 2005 to the extent described below.
Year ended December 31,2006 2005 2004
(millions of Euro)RECONCILIATION OF NET INCOME FOR THE YEAR
FROM IFRS TO U.S. GAAPNet income for the year as reported in the consolidated
statements of income . . . . . . . . . . . . . . . . . . . . . . . . . . . . . . . . . . . 3,003 3,690 2,834Minority Interests . . . . . . . . . . . . . . . . . . . . . . . . . . . . . . . . . . . . . . . . . 11 (474) (1,019)
Net income attributable to equity holders of theParent under IFRS . . . . . . . . . . . . . . . . . . . . . . . . . . . . . . . . . . . . A) 3,014 3,216 1,815
U.S. GAAP reconciling adjustments:1. Purchase method of accounting, reversal of
amortization and other adjustments:(a) Goodwill . . . . . . . . . . . . . . . . . . . . . . . . . . . . . . . . . . . — — 438(b) Other intangible assets with an indefinite
life . . . . . . . . . . . . . . . . . . . . . . . . . . . . . . . . . . . . . . . . . (5) — —(c) Intangible assets with a finite life . . . . . . . . . . . (1,512) (1,387) (1,026)(d) Tangible assets . . . . . . . . . . . . . . . . . . . . . . . . . . . . . (168) (404) 48(e) Other . . . . . . . . . . . . . . . . . . . . . . . . . . . . . . . . . . . . . . 78 90 136
(1,607) (1,701) (404)2. Reversal of revaluation on tangible assets . . . . . . . . 39 85 73. Capitalization of interest . . . . . . . . . . . . . . . . . . . . . . . . . (43) (26) (60)4. Sale of real estate properties . . . . . . . . . . . . . . . . . . . . (23) (44) 445. Convertible notes/bonds . . . . . . . . . . . . . . . . . . . . . . . . 14 12 286. Deferred taxes on tax-suspension equity
reserves . . . . . . . . . . . . . . . . . . . . . . . . . . . . . . . . . . . . . . . . . — (57) —7. Other . . . . . . . . . . . . . . . . . . . . . . . . . . . . . . . . . . . . . . . . . . . (287) (3) (37)
Total U.S. GAAP reconciling adjustments . . . . . . . . . . . . . . B) (1,907) (1,734) (422)Tax effect on reconciling items . . . . . . . . . . . . . . . . . . . . . . . . . C) 624 558 334Minority Interests on reconciling items . . . . . . . . . . . . . . . . D) 26 27 (186)Total effect of discontinued operations/assets held
for sale . . . . . . . . . . . . . . . . . . . . . . . . . . . . . . . . . . . . . . . . . . . . . . . . E) 105 (175) —Cumulative effect of accounting changes, net of taxes
and after Minority Interests . . . . . . . . . . . . . . . . . . . . . . . . . . F) — 47 —
Net income in accordance with U.S. GAAP . . . . . . . . . . . . . A+B+C+D+E+F) 1,862 1,939 1,541
F-157

Financial Statements Notes To Consolidated Financial Statements
As of December 31,2006 2005
(millions of Euro)RECONCILIATION OF EQUITY FROM IFRS TO U.S. GAAPEquity as reported in the consolidated balance sheets . . . . . . . . . . . 27,098 26,985Minority Interests . . . . . . . . . . . . . . . . . . . . . . . . . . . . . . . . . . . . . . . . . . . . . . (1,080) (1,323)
Equity attributable to equity holders of the Parent underIFRS . . . . . . . . . . . . . . . . . . . . . . . . . . . . . . . . . . . . . . . . . . . . . . . . . . . . . . . . . A) 26,018 25,662
U.S. GAAP reconciling adjustments:1. Purchase method of accounting, reversal of
amortization and other adjustments:(a) Goodwill . . . . . . . . . . . . . . . . . . . . . . . . . . . . . . . . . . . . . . . . . 6,468 6,227(b) Other intangible assets with an indefinite life . . . . . 3,015 3,020(c) Intangible assets with a finite life . . . . . . . . . . . . . . . . 15,373 16,887(d) Tangible assets . . . . . . . . . . . . . . . . . . . . . . . . . . . . . . . . . . 374 542(e) Other . . . . . . . . . . . . . . . . . . . . . . . . . . . . . . . . . . . . . . . . . . . . (169) (13)
25,061 26,6632. Reversal of revaluation on tangible assets . . . . . . . . . . . . . (248) (284)3. Capitalization of interest . . . . . . . . . . . . . . . . . . . . . . . . . . . . . . 717 7524. Sale of real estate properties . . . . . . . . . . . . . . . . . . . . . . . . . (238) (215)5. Convertible notes/bonds . . . . . . . . . . . . . . . . . . . . . . . . . . . . . (50) (67)6. Deferred taxes on tax-suspension equity reserves . . . . . (257) (257)7. Other . . . . . . . . . . . . . . . . . . . . . . . . . . . . . . . . . . . . . . . . . . . . . . . . . (120) 1998. Discontinued operations/assets held for sale . . . . . . . . . . — (105)
Total U.S. GAAP reconciling adjustments . . . . . . . . . . . . . . . . . . . B) 24,865 26,686Tax effect on reconciling items . . . . . . . . . . . . . . . . . . . . . . . . . . . . . . C) (7,078) (7,694)Minority Interests on reconciling items . . . . . . . . . . . . . . . . . . . . . D) 18 (23)Cumulative effect of accounting changes, net of taxes and
after Minority Interests . . . . . . . . . . . . . . . . . . . . . . . . . . . . . . . . . . . . E) — —
Equity in accordance with U.S. GAAP . . . . . . . . . . . . . . . . . . . . . . . . A+B+C+D+E) 43,823 44,631
F-158

Financial Statements Notes To Consolidated Financial Statements
1. PURCHASE METHOD OF ACCOUNTING, REVERSAL OF AMORTIZATION AND OTHER ADJUSTMENTS
On the adoption of IFRS as of January 1, 2004, Telecom Italia elected not to apply IFRS 3 “BusinessCombinations” to prior year business combinations as allowed by IFRS 1 “First-time Adoption of InternationalFinancial Reporting Standards”. Certain business combinations prior to 2004 (mainly related to the Old TelecomItalia acquisitions that had occurred during the period from 1999 to 2003) had been accounted for as a pooling ofinterest or on the basis of book values (for both assets acquired and shares issued).
Also, as permitted by IFRS 1 “First-time Adoption of International Financial Reporting Standards”, the carryingvalue of goodwill under Italian GAAP as of December 31, 2003, was subject to an impairment test at January 1,2004, (which did not result in the recognition of impairment charges) and carried forward in the opening balancesheet as of January 1, 2004.
Furthermore, under IFRS, for certain transactions which are not within the scope of IFRS 3 “BusinessCombinations” the following accounting policies have been established:
Š acquisition/sale of interests in companies already controlled: in the case of acquisitions, the Group paysthe Minority Interests in cash or by new shares and, at the same time, eliminates the relative share ofthe Minority Interest and records Goodwill equal to the excess of the acquisition cost over the carryingamount of the assets and liabilities acquired. In the case of sales, the difference between the proceedsof disposal of shares and the corresponding carrying amount on consolidation is recognized in thestatement of income (Parent Entity extension method);
Š intragroup transfers of interests in controlled companies which result in a change in the percentage ofownership: the interests transferred remain recorded at historical cost and the gain or loss on thetransfer is eliminated in full. The Minority Interests which do not directly take part in the transaction areadjusted to reflect the change in the respective share of equity with a corresponding opposite effect onthe equity attributable to the equity holders of the Parent without recognition of any goodwill. Suchtreatment does not have any impact on net income or total equity.
Under U.S. GAAP, in accordance with Statement of Financial Accounting Standards (“SFAS”) 141, “BusinessCombinations” all acquisitions (including acquisitions of Minority Interests and intragroup transfers of interests incontrolled companies) are accounted for using the purchase method. Under this method the transaction isaccounted for on the basis of the fair value of the purchase consideration, the assets and liabilities purchased arerecorded at fair value and the difference between the fair value of the purchase consideration and the fair value ofthe Group’s share of assets and liabilities acquired is recorded as goodwill.
Under U.S. GAAP goodwill is assessed for impairment at least annually. If indicators of impairment exist duringthe year, then an impairment review is conducted before the annual review. In accordance with SFAS 142,“Goodwill and Other Intangible Assets”, the first step in the test for impairment of goodwill is to identify potentialimpairment by comparing the fair value of a “reporting unit” (which encompasses a wider meaning than “cashgenerating unit” adopted by IFRS) with its carrying amount, including goodwill. If the fair value of a reportingunit exceeds its carrying amount, goodwill of the reporting unit is not considered impaired and the second part ofthe test is not considered necessary. If the carrying amount of a reporting unit exceeds its fair value, the secondstep of the goodwill impairment test is performed to measure the amount of the loss, if any. The second partcompares the implied value of the reporting unit’s goodwill to the carrying amount of that goodwill. The excess ofthe carrying value over the implied value is then written-off in the period. Implied value of goodwill is determinedin the same manner as the amount of goodwill recognized in a business combination: the assets and liabilitiespurchased are recorded at fair value and the excess of the fair value of the purchase consideration over the fairvalue of the Group’s share of assets and liabilities acquired is recorded as goodwill. Impairment losses of goodwillare not reversed.
F-159
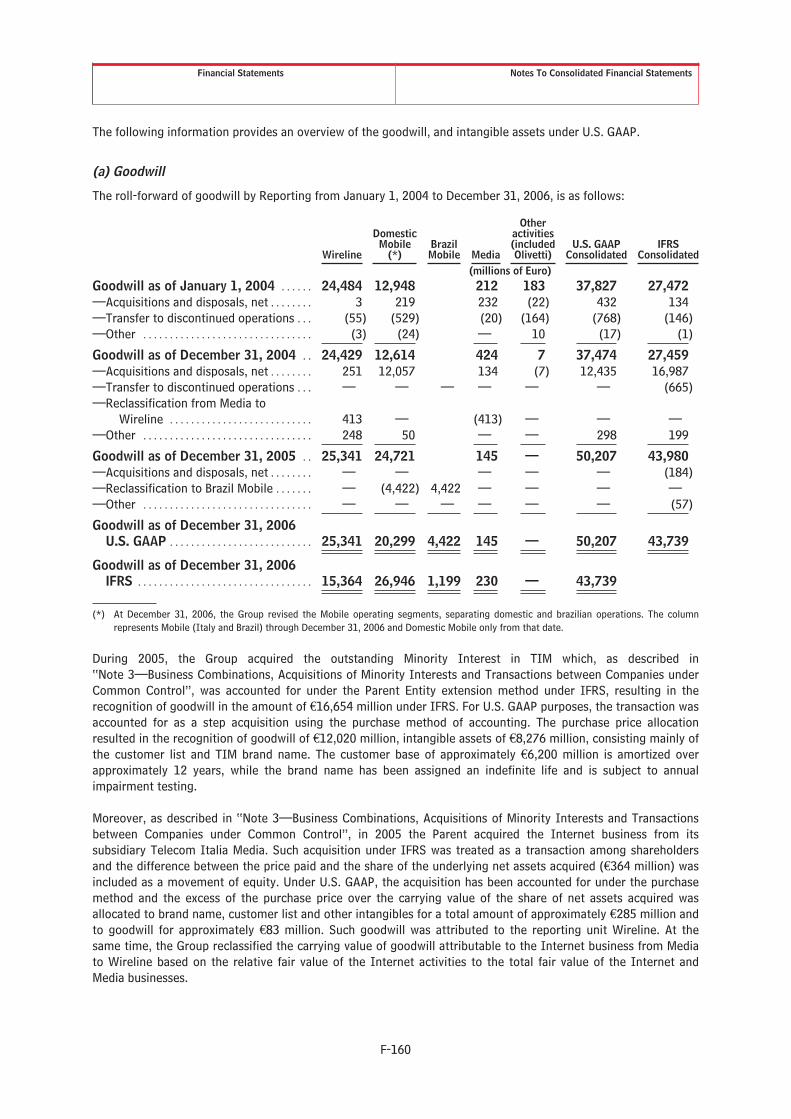
Financial Statements Notes To Consolidated Financial Statements
The following information provides an overview of the goodwill, and intangible assets under U.S. GAAP.
(a) Goodwill
The roll-forward of goodwill by Reporting from January 1, 2004 to December 31, 2006, is as follows:
Wireline
DomesticMobile
(*)BrazilMobile Media
Otheractivities(includedOlivetti)
U.S. GAAPConsolidated
IFRSConsolidated
(millions of Euro)Goodwill as of January 1, 2004 . . . . . . 24,484 12,948 212 183 37,827 27,472—Acquisitions and disposals, net . . . . . . . . 3 219 232 (22) 432 134—Transfer to discontinued operations . . . (55) (529) (20) (164) (768) (146)—Other . . . . . . . . . . . . . . . . . . . . . . . . . . . . . . . . (3) (24) — 10 (17) (1)
Goodwill as of December 31, 2004 . . 24,429 12,614 424 7 37,474 27,459—Acquisitions and disposals, net . . . . . . . . 251 12,057 134 (7) 12,435 16,987—Transfer to discontinued operations . . . — — — — — — (665)—Reclassification from Media to
Wireline . . . . . . . . . . . . . . . . . . . . . . . . . . . 413 — (413) — — ——Other . . . . . . . . . . . . . . . . . . . . . . . . . . . . . . . . 248 50 — — 298 199
Goodwill as of December 31, 2005 . . 25,341 24,721 145 — 50,207 43,980—Acquisitions and disposals, net . . . . . . . . — — — — — (184)—Reclassification to Brazil Mobile . . . . . . . — (4,422) 4,422 — — — ——Other . . . . . . . . . . . . . . . . . . . . . . . . . . . . . . . . — — — — — — (57)
Goodwill as of December 31, 2006U.S. GAAP . . . . . . . . . . . . . . . . . . . . . . . . . . . 25,341 20,299 4,422 145 — 50,207 43,739
Goodwill as of December 31, 2006IFRS . . . . . . . . . . . . . . . . . . . . . . . . . . . . . . . . . 15,364 26,946 1,199 230 — 43,739
(*) At December 31, 2006, the Group revised the Mobile operating segments, separating domestic and brazilian operations. The columnrepresents Mobile (Italy and Brazil) through December 31, 2006 and Domestic Mobile only from that date.
During 2005, the Group acquired the outstanding Minority Interest in TIM which, as described in“Note 3—Business Combinations, Acquisitions of Minority Interests and Transactions between Companies underCommon Control”, was accounted for under the Parent Entity extension method under IFRS, resulting in therecognition of goodwill in the amount of €16,654 million under IFRS. For U.S. GAAP purposes, the transaction wasaccounted for as a step acquisition using the purchase method of accounting. The purchase price allocationresulted in the recognition of goodwill of €12,020 million, intangible assets of €8,276 million, consisting mainly ofthe customer list and TIM brand name. The customer base of approximately €6,200 million is amortized overapproximately 12 years, while the brand name has been assigned an indefinite life and is subject to annualimpairment testing.
Moreover, as described in “Note 3—Business Combinations, Acquisitions of Minority Interests and Transactionsbetween Companies under Common Control”, in 2005 the Parent acquired the Internet business from itssubsidiary Telecom Italia Media. Such acquisition under IFRS was treated as a transaction among shareholdersand the difference between the price paid and the share of the underlying net assets acquired (€364 million) wasincluded as a movement of equity. Under U.S. GAAP, the acquisition has been accounted for under the purchasemethod and the excess of the purchase price over the carrying value of the share of net assets acquired wasallocated to brand name, customer list and other intangibles for a total amount of approximately €285 million andto goodwill for approximately €83 million. Such goodwill was attributed to the reporting unit Wireline. At thesame time, the Group reclassified the carrying value of goodwill attributable to the Internet business from Mediato Wireline based on the relative fair value of the Internet activities to the total fair value of the Internet andMedia businesses.
F-160

Financial Statements Notes To Consolidated Financial Statements
(b) Other intangible assets with an indefinite life
As a result of purchase accounting in 2006 and previous years, the Group has recorded the following intangibleassets with indefinite useful lives:
2006 2005(millions of Euro)
Wireline brand name . . . . . . . . . . . . . . . . . . . . . . . . . . . . . . . . . . . . . . . . . . . . . . . . . . . . . 1,283 1,283Domestic Mobile brand name . . . . . . . . . . . . . . . . . . . . . . . . . . . . . . . . . . . . . . . . . . . . 1,680 1,680Other . . . . . . . . . . . . . . . . . . . . . . . . . . . . . . . . . . . . . . . . . . . . . . . . . . . . . . . . . . . . . . . . . . . . 52 57
Total . . . . . . . . . . . . . . . . . . . . . . . . . . . . . . . . . . . . . . . . . . . . . . . . . . . . . . . . . . . . . . . . . . . . 3,015 3,020
(c) Intangible assets with a finite life
Amortization expense for the years ended December 31, 2006, 2005 and 2004 was €3,744 million, €3,076 millionand €2,618 million, respectively. The following table presents expected amortization of intangible assets with afinite life for each of the next five years based on the carrying values as of December 31, 2006:
(millions of Euro)
2007 . . . . . . . . . . . . . . . . . . . . . . . . . . . . . . . . . . . . . . . . . . . . . . . . . . . . . . . . . . . . . . . . . . . . . 3,8562008 . . . . . . . . . . . . . . . . . . . . . . . . . . . . . . . . . . . . . . . . . . . . . . . . . . . . . . . . . . . . . . . . . . . . . 3,4952009 . . . . . . . . . . . . . . . . . . . . . . . . . . . . . . . . . . . . . . . . . . . . . . . . . . . . . . . . . . . . . . . . . . . . . 1,8062010 . . . . . . . . . . . . . . . . . . . . . . . . . . . . . . . . . . . . . . . . . . . . . . . . . . . . . . . . . . . . . . . . . . . . . 1,7692011 . . . . . . . . . . . . . . . . . . . . . . . . . . . . . . . . . . . . . . . . . . . . . . . . . . . . . . . . . . . . . . . . . . . . . 1,767
2. REVERSAL OF REVALUATION ON TANGIBLE ASSETS
Prior to the adoption of IFRS, under Italian accounting principles (“Italian GAAP”), the Group revalued certaintangible assets as required or permitted by specific regulations. As allowed by the IFRS first time adoption, as ofJanuary 1, 2004, the Group elected to use the revalued cost at the revaluation date as deemed cost.
U.S. GAAP does not permit the revaluation of tangible assets and requires depreciation based on historicalacquisition cost. Consequently, such different accounting treatment resulted in an increase in net income, due tothe reversal of the depreciation expense, and a reduction in equity due to the reversal of the net book value of therevalued amount.
3. CAPITALIZATION OF INTEREST
Under IFRS, Telecom Italia has elected not to capitalize interest on assets under construction. U.S. GAAP requiresinterest to be capitalized on both tangible and intangible assets regardless of whether specific borrowings relateto the project. The capitalized interest is amortized over the remaining useful life of the assets. A large part of theinterest capitalized prior to 2004 relates to the UMTS license of TIM which was put into use in 2004 and on whichamortization expense has been calculated commencing in 2004. The Group capitalized interest expense of€84 million in 2006, €114 million in 2005 and €57 million in 2004.
4. SALE OF REAL ESTATE PROPERTIES
Through 2006, the Group entered into a series of real estate transactions that involved IM.SER, Tiglio I, Tiglio II,Pirelli and other Group related parties.
Under IFRS such transactions have been recorded in accordance with the finance method in that the present valueof the contractually provided payments approximates the fair value of the properties under lease, except for landwhich, in absence of a contractual favorable purchase option, was treated as an operating lease.
Such accounting treatment was also followed under U.S. GAAP except for lease contracts relating to land whichwere generally treated as finance leases.
Furthermore, during 2005 and 2006, Telecom Italia carried out a series of transactions in the context of thereorganization of the physical space occupied by network equipment to gradually free part of the buildings used
F-161

Financial Statements Notes To Consolidated Financial Statements
for such equipment. Such project (“Magnum Project”) involved the sale of more than 1,300 properties for atotal amount of approximately €1 billion. Under IFRS, these transactions generated capital gains, net of incidentalcharges of €264 million in 2005 and €135 million in 2006. For further details see “Note 7—Tangible Assets(Owned and under Finance Leases)”.
Under U.S. GAAP, the related assets had been subject to purchase accounting adjustments recorded under thereconciling difference at 46.1.(d) above. As a result, of the disposal of such assets, there has been a reduction inthe purchase price adjustment for the real estate assets of €174 million in 2006 and €366 million in 2005 with acorresponding reduction in pre-tax income.
5. CONVERTIBLE NOTES/BONDS
Under IFRS, compound financial instruments represented by notes and bonds convertible into shares of the issuer(convertible bonds) are recognized by bifurcating the debt and the call option: the debt is included in financialliabilities under the amortized cost method while the call option value, computed as the difference between thefair value of the debt and the nominal value of the financial instrument, is classified in a specific equity reserve.
Under U.S. GAAP, convertible notes and bonds are recognized as debt. The different accounting treatmentresulted in a decrease of equity and an increase in liabilities.
6. DEFERRED TAXES ON TAX-SUSPENSION EQUITY RESERVES
For U.S. GAAP reporting purposes, the Group follows the provisions of SFAS 109, “Accounting for Income Taxes”(“SFAS 109”). In accordance with SFAS 109, the Group has recognized deferred tax assets and liabilities basedon the difference between the financial statement carrying amounts of existing assets and liabilities and theirrespective tax bases. Deferred tax assets and liabilities are measured using enacted tax rates in effect in the yearswhen those temporary differences are expected to reverse. The effect on the deferred taxes of changes in taxrates is recognized in income in the period that includes the enactment date. Where it is more likely than not thatall or a portion of a deferred tax asset will not be realized, a valuation allowance has been recorded against it inorder to reduce the deferred tax asset to the amount that is more likely than not to be realized.
No provision has been made for Italian or foreign taxes that may result from future remittances of undistributedearnings of subsidiaries, as it is expected that all such earnings will be permanently reinvested in theseoperations. It is not practical to estimate the amount of taxes that might be payable on the eventual remittance ofthese earnings due to the complexities associated with its hypothetical calculation.
In connection with acquisitions in prior years, a portion of Net Operating Losses carry-forwards of the Group werecovered by a valuation allowance at the date of acquisition. If these assets are subsequently recognized, the taxbenefit will reduce goodwill and other non current intangible assets.
Under IFRS, IAS 12 “Income taxes”, allows, under certain conditions, for deferred income taxes ontax-suspension reserves not to be recorded, whereas, under U.S. GAAP, SFAS 109 provides that deferred taxes, inany case, shall be provided.
The valuation allowance amounted to €2,256 million as of December 31, 2006 and to €1,850 million as ofDecember 31, 2005, with increases of €406 million and €391 million in 2006 and 2005, respectively. The valuationallowance is recorded because it is more likely than not that certain net operating losses will not be utilized.
7. OTHER
Other mainly comprises the following:
Š Impairment of Tangible and Intangible Assets
Under U.S. GAAP, the Group follows the guidance provided in SFAS 144, “Accounting for the Impairmentor Disposal of Long-Lived Assets” to evaluate and account for impairments of depreciable assets or assetsto be disposed of. Such statement provides that carrying values shall be firstly compared withundiscounted cash flows; as a result of this analysis in prior years certain impairment losses recordedunder IFRS were deemed not necessary under U.S. GAAP and therefore had been reversed. In 2006, theundiscounted cash flows of certain assets where less than the carrying value under U.S. GAAP, resulting inthe recognition of an additional impairment of €56 million.
F-162

Financial Statements Notes To Consolidated Financial Statements
Š Provisions For Termination Benefit Incentives
Under U.S. GAAP, in accordance with SFAS 146, “Accounting for Costs Associated with Exit or DisposalActivities” and SFAS 88, “Employers’ Accounting for Settlements and Curtailments of Defined BenefitPension Plans and for Termination Benefits”, certain conditions must be met before a restructuringaccrual can be established. Therefore, part of the accruals recorded for IFRS purposes (€140 million)were reversed under U.S. GAAP in previous years and additional expense of approximately €70 millionhas been recognized under U.S. GAAP in 2006.
Š Derivatives Financial Instruments
Under IFRS, the Group treats the call option in Sofora as a derivative instrument which is valued at fairvalue at the end of each reporting period as described in “Note 8—Other Non-Current Assets”. UnderSFAS 133 “Accounting for Derivative Instruments and Hedging Activities”, the call option does not meetthe definition of a derivative instrument and has been accounted for based at cost subject to review forimpairment. The related income effect for the year 2006, resulting in a reduction of pre-tax income,amounts to €30 million.
Š Asset Retirement Obligations
The Group capitalizes asset retirement costs and records a liability for the present value of theobligation at the inception of the retirement obligation under both IFRS and U.S. GAAP. Differently fromU.S. GAAP, IFRS requires that adjustments are made to the asset retirement obligation and the relatedcost to reflect changes in discount rates. This results in differences in accretion expense of theretirement obligations and depreciation expense of the asset retirement costs between IFRS and U.S.GAAP.
Š Present Value Adjustments
Under IFRS, liabilities are recorded at their present value. Under U.S. GAAP, liabilities with maturitiesexceeding one year are recorded at their present value only when required by a specific accountingstandard.
8. DISCONTINUED OPERATIONS/ASSETS HELD FOR SALE
Under U.S. GAAP, Telecom Italia identifies discontinued operations under the framework established by SFAS 144which is similar to the framework of IFRS 5 “Non-Current Asset Held for Sale and Discontinued Operations”except as it relates to balance sheet presentation for comparative purposes. Under IFRS, only the comparativeinformation for the statement of income and the cash flow statement is restated. Under U.S. GAAP, thecomparative balance sheet shows the assets and liabilities of operations which were discontinued or sold on thecurrent period separately. In 2006 and 2005, additional charges of €4 million and €180 million, respectively, wererecorded under U.S. GAAP as a result of the reclassification to the statement of income of the amount ofcumulative translation adjustments recorded prior to the date of adoption of IFRS. Under IFRS, the Grouptransferred the cumulative translation reserve to other equity reserves as permitted by IFRS 1 on the firstadoption date.
F-163

Financial Statements Notes To Consolidated Financial Statements
NOTE 47—CONDENSED CONSOLIDATED U.S. GAAP FINANCIAL STATEMENTS
The condensed consolidated balance sheets as of December 31, 2006 and 2005 and the condensed consolidatedstatements of income for the years ended December 31, 2006, 2005 and 2004 presented below have beenprepared to reflect the principal differences between the Telecom Italia Group’s accounting policies and U.S.GAAP discussed above.
CONDENSED CONSOLIDATED BALANCE SHEETSIN ACCORDANCE WITH U.S. GAAP AS OF DECEMBER 31, 2006 AND 2005
As of December 31,2006 2005(millions of Euro)
ASSETSNON-CURRENT ASSETS:
Goodwill . . . . . . . . . . . . . . . . . . . . . . . . . . . . . . . . . . . . . . . . . . . . . . . . . . . . . . . . . . . . . . . . . . . . . . . . . . . . . 50,207 50,207Other intangible assets with an indefinite life . . . . . . . . . . . . . . . . . . . . . . . . . . . . . . . . . . . . . . . . . 3,015 3,020Intangible assets with a finite life . . . . . . . . . . . . . . . . . . . . . . . . . . . . . . . . . . . . . . . . . . . . . . . . . . . . 22,264 23,971Tangible assets . . . . . . . . . . . . . . . . . . . . . . . . . . . . . . . . . . . . . . . . . . . . . . . . . . . . . . . . . . . . . . . . . . . . . . 18,188 19,196Other non-current assets:• Deferred tax assets . . . . . . . . . . . . . . . . . . . . . . . . . . . . . . . . . . . . . . . . . . . . . . . . . . . . . . . . . . . . . 187 489• Other . . . . . . . . . . . . . . . . . . . . . . . . . . . . . . . . . . . . . . . . . . . . . . . . . . . . . . . . . . . . . . . . . . . . . . . . . . . 2,798 3,299
TOTAL NON-CURRENT ASSETS . . . . . . . . . . . . . . . . . . . . . . . . . . . . . . . . . . . . . . . . . . . . . . . . . . . . . . . . 96,659 100,182
TOTAL CURRENT ASSETS, EXCLUDING DISCONTINUED OPERATIONS/ASSETSHELD FOR SALE . . . . . . . . . . . . . . . . . . . . . . . . . . . . . . . . . . . . . . . . . . . . . . . . . . . . . . . . . . . . . . . . . . . . . . 18,425 22,698
TOTAL DISCONTINUED OPERATIONS/ASSETS HELD FOR SALE . . . . . . . . . . . . . . . . . . . . . . 250 424
TOTAL ASSETS . . . . . . . . . . . . . . . . . . . . . . . . . . . . . . . . . . . . . . . . . . . . . . . . . . . . . . . . . . . . . . . . . . . . . . . . . . 115,334 123,304
EQUITY AND LIABILITIESEQUITY . . . . . . . . . . . . . . . . . . . . . . . . . . . . . . . . . . . . . . . . . . . . . . . . . . . . . . . . . . . . . . . . . . . . . . . . . . . . . . . . . . 43,823 44,631of which Share Capital . . . . . . . . . . . . . . . . . . . . . . . . . . . . . . . . . . . . . . . . . . . . . . . . . . . . . . . . . . . . . . . . . . . . 10,605 10,599
MINORITY INTERESTS . . . . . . . . . . . . . . . . . . . . . . . . . . . . . . . . . . . . . . . . . . . . . . . . . . . . . . . . . . . . . . . . . . 1,062 1,346
NON-CURRENT LIABILITIES:Non-current financial liabilities . . . . . . . . . . . . . . . . . . . . . . . . . . . . . . . . . . . . . . . . . . . . . . . . . . . . . . . 41,712 43,065Employee severance indemnities and other employee-related provisions . . . . . . . . . . . . . . 1,261 1,273Deferred tax liabilities . . . . . . . . . . . . . . . . . . . . . . . . . . . . . . . . . . . . . . . . . . . . . . . . . . . . . . . . . . . . . . . . 6,870 7,796Provisions for risks and charges, miscellaneous payables and other non-current
liabilities . . . . . . . . . . . . . . . . . . . . . . . . . . . . . . . . . . . . . . . . . . . . . . . . . . . . . . . . . . . . . . . . . . . . . . . . . . 2,617 2,804
TOTAL NON-CURRENT LIABILITIES . . . . . . . . . . . . . . . . . . . . . . . . . . . . . . . . . . . . . . . . . . . . . . . . . . . . 52,460 54,938
CURRENT LIABILITIES:Current financial liabilities . . . . . . . . . . . . . . . . . . . . . . . . . . . . . . . . . . . . . . . . . . . . . . . . . . . . . . . . . . . 5,639 9,778Current income tax payables, trade and miscellaneous payables and other current
liabilities . . . . . . . . . . . . . . . . . . . . . . . . . . . . . . . . . . . . . . . . . . . . . . . . . . . . . . . . . . . . . . . . . . . . . . . . . . 12,350 12,326
TOTAL CURRENT LIABILITIES, EXCLUDING LIABILITIES RELATING TODISCONTINUED OPERATIONS/ASSETS HELD FOR SALE . . . . . . . . . . . . . . . . . . . . . . . . . . . . 17,989 22,104
TOTAL LIABILITIES RELATING TO DISCONTINUED OPERATIONS/ASSETS HELD FORSALE . . . . . . . . . . . . . . . . . . . . . . . . . . . . . . . . . . . . . . . . . . . . . . . . . . . . . . . . . . . . . . . . . . . . . . . . . . . . . . . . . . — 285
TOTAL LIABILITIES(*) . . . . . . . . . . . . . . . . . . . . . . . . . . . . . . . . . . . . . . . . . . . . . . . . . . . . . . . . . . . . . . . . . . . 71,511 78,673
TOTAL EQUITY AND LIABILITIES . . . . . . . . . . . . . . . . . . . . . . . . . . . . . . . . . . . . . . . . . . . . . . . . . . . . . . . 115,334 123,304
(*) Includes Minority Interests.
F-164

Financial Statements Notes To Consolidated Financial Statements
CONDENSED CONSOLIDATED STATEMENTS OF INCOMEIN ACCORDANCE WITH U.S. GAAP FOR THE YEARS ENDED DECEMBER 31, 2006, 2005 AND 2004
Year ended December 31,2006 2005 2004
(millions of Euro)Revenues . . . . . . . . . . . . . . . . . . . . . . . . . . . . . . . . . . . . . . . . . . . . . . . . . . . . . . . . . . . . . . . . . . . . . . . 31,275 29,921 28,292Other income . . . . . . . . . . . . . . . . . . . . . . . . . . . . . . . . . . . . . . . . . . . . . . . . . . . . . . . . . . . . . . . . . . . 606 670 1,080
Total operating revenues and other income . . . . . . . . . . . . . . . . . . . . . . . . . . . . . . . . . 31,881 30,591 29,372Total operating expenses . . . . . . . . . . . . . . . . . . . . . . . . . . . . . . . . . . . . . . . . . . . . . . . . . . . . . . . . (26,346) (24,717) (22,550)
Operating income . . . . . . . . . . . . . . . . . . . . . . . . . . . . . . . . . . . . . . . . . . . . . . . . . . . . . . . . . . . . . 5,535 5,874 6,822
Share of profits (losses) of associates and joint ventures accounted for using theequity method . . . . . . . . . . . . . . . . . . . . . . . . . . . . . . . . . . . . . . . . . . . . . . . . . . . . . . . . . . . . . . . . 48 (146) (5)
Financial expenses, net . . . . . . . . . . . . . . . . . . . . . . . . . . . . . . . . . . . . . . . . . . . . . . . . . . . . . . . . . . (1,975) (1,870) (1,456)
Income from continuing operations before taxes . . . . . . . . . . . . . . . . . . . . . . . . . . . 3,608 3,858 5,361Income taxes . . . . . . . . . . . . . . . . . . . . . . . . . . . . . . . . . . . . . . . . . . . . . . . . . . . . . . . . . . . . . . . . . . . (1,895) (1,896) (2,462)
Net income before Minority Interests, discontinued operations/assetsheld for sale and cumulative effect of accounting changes . . . . . . . . . . . . . . 1,713 1,962 2,899
Minority Interests . . . . . . . . . . . . . . . . . . . . . . . . . . . . . . . . . . . . . . . . . . . . . . . . . . . . . . . . . . . . . . . 36 (479) (1,167)Net income (loss) from discontinued operations/assets held for sale . . . . . . . . . . . . . 113 409 (191)Cumulative effect of accounting changes, net of taxes . . . . . . . . . . . . . . . . . . . . . . . . . . . — 47 —
Net income . . . . . . . . . . . . . . . . . . . . . . . . . . . . . . . . . . . . . . . . . . . . . . . . . . . . . . . . . . . . . . . . . . . . 1,862 1,939 1,541
Year ended December 31,2006 2005 2004
(Euro)Basic and Diluted Earnings Per Share (EPS) (*) (**)—Ordinary Share . . . . . . . . . . . . . . . . . . . . . . . . . . . . . . . . . . . . . . . . . . . . . . . . . . . . . . . . . . . . . . . 0.09 0.10 0.09—Savings Share . . . . . . . . . . . . . . . . . . . . . . . . . . . . . . . . . . . . . . . . . . . . . . . . . . . . . . . . . . . . . . . . 0.10 0.11 0.10Of which:—From continuing operations
—Ordinary Share . . . . . . . . . . . . . . . . . . . . . . . . . . . . . . . . . . . . . . . . . . . . . . . . . . . . . . . . . . 0.08 0.08 0.10—Savings Share . . . . . . . . . . . . . . . . . . . . . . . . . . . . . . . . . . . . . . . . . . . . . . . . . . . . . . . . . . . 0.09 0.09 0.11
—From discontinued operations/assets held for sale—Ordinary Share . . . . . . . . . . . . . . . . . . . . . . . . . . . . . . . . . . . . . . . . . . . . . . . . . . . . . . . . . . 0.01 0.02 (0.01)—Savings Share . . . . . . . . . . . . . . . . . . . . . . . . . . . . . . . . . . . . . . . . . . . . . . . . . . . . . . . . . . . 0.01 0.02 (0.01)
(*) Basic EPS is equal to Diluted EPS.
(**) Change in accounting principle for Employee severance indemnities had no effect on Earnings Per Share.
The following table illustrates the detail of the total operating expenses line item in our Condensed ConsolidatedStatements of Income in accordance with U.S. GAAP for the Year Ended December 31, 2006 under the cost ofsales method.
Year endedDecember 31, 2006(millions of Euro)
Cost of revenues (services and sales) (*) . . . . . . . . . . . . . . . . . . . . . . . . . . . . . . . . . . . . . . . . . . 11,157Selling, general and administrative expenses (*) . . . . . . . . . . . . . . . . . . . . . . . . . . . . . . . . . . . 4,093Personnel costs . . . . . . . . . . . . . . . . . . . . . . . . . . . . . . . . . . . . . . . . . . . . . . . . . . . . . . . . . . . . . . . . . . . 3,868Depreciation and amortization . . . . . . . . . . . . . . . . . . . . . . . . . . . . . . . . . . . . . . . . . . . . . . . . . . . . 7,098(Gains) losses on disposals of non-current assets . . . . . . . . . . . . . . . . . . . . . . . . . . . . . . . . . . 46Impairment (reversal) losses on non-current assets . . . . . . . . . . . . . . . . . . . . . . . . . . . . . . . 84
Total operating expenses . . . . . . . . . . . . . . . . . . . . . . . . . . . . . . . . . . . . . . . . . . . . . . . . . . . . . . . 26,346
(*) Exclusive of Personnel costs and Depreciation and amortization.
F-165

Financial Statements Notes To Consolidated Financial Statements
NOTE 48—ADDITIONAL U.S. GAAP DISCLOSURES
(A) NEW U.S. GAAP ACCOUNTING STANDARDS
Š In December, 2004, the FASB issued Statement 123 (revised 2004) (“SFAS 123(R)”), “Share-BasedPayment”. SFAS 123(R) replaces FASB Statement No. 123, “Accounting for Stock-Based Compensation”,which superseded APB Opinion No. 25, “Accounting for Stock Issued to Employees”. SFAS 123(R) requiresall share-based awards to employees, including grants of employee stock options, be recognized in thefinancial statements based on their grant-date fair values. The related compensation costs are to berecognized over the period during which an employee is required to provide service in exchange for theaward. We have adopted the prospective provisions of SFAS 123(R) to new and existing plans as ofJanuary 1, 2006. The grant-date fair values of unvested awards that are outstanding on the date ofadoption are charged to expense over their remaining vesting periods. The introduction of SFAS 123(R) didnot have an impact on the Group consolidated financial position or results of operations.In March, 2005, the Securities and Exchange Commission (“SEC”) issued Staff Accounting Bulletin(“SAB”) No. 107, “Share Based Payment”. SAB 107 summarizes the views of the SEC staff regarding theinteraction between SFAS 123(R) and certain SEC rules and regulations, and provides the staff’s viewsregarding the valuation of share-based payment arrangements for public companies. We have adoptedSAB 107 concurrently with the adoption of SFAS 123(R) with effect from January 1, 2006. The introductionof SAB 107 did not have an impact on the Group consolidated financial position or results of operations.
Š In July 2005, the FASB issued FASB Staff Position (FSP) APB 18-1 (“FSP APB 18-1”), “Accounting byan Investor for its Proportionate Share of Other Comprehensive Income of an Investee Accounted forunder the Equity Method in Accordance with APB Opinion No. 18 upon a Loss of Significant Influence”.The FSP requires that if an investor loses significant influence over an investee, the investor’sproportionate share of the investee’s equity adjustments for Other Comprehensive Income should beoffset against the carrying value of the investment at the time significant influence is lost by theinvestor. The adoption of FSP APB 18-1 in 2006 did not have a material impact on the Groupconsolidated financial position or results of operations.
Š In October 2005, the FASB issued FSP FAS 13-1, “Accounting for Rental Costs Incurred during aConstruction Period”. The FSP concludes that rental costs associated with ground or building operatingleases that are incurred during a construction period should be recognized as rental expense. Theadoption of this FSP in 2006 did not have a material impact on the Group consolidated financial positionor results of operations.
Š In February 2006, the Financial Accounting Standards Board (FASB) issued SFAS No. 155, “Accountingfor Certain Hybrid Financial Instruments an amendment of FASB statements No. 133 and 140”(“SFAS 155”). SFAS 155 amends FASB Statement No. 133 “Accounting for Derivative Instruments andHedging Activities (“SFAS 133”) and No. 140 “Accounting for Transfers and Servicing of FinancialAssets and Extinguishments of Liabilities”. SFAS 155 among other things, allows any hybrid financialinstrument that contains an embedded derivative that otherwise would require bifurcation under SFAS133, to be carried at fair value in its entirety, with changes in fair value recognized in earnings. Inaddition, SFAS 155 requires that beneficial interests in securitized financial assets be analyzed todetermine whether they are freestanding derivatives or contain an embedded derivative. SFAS 155 isapplicable to new or modified financial instruments in fiscal years beginning after September 15, 2006.The Group is currently evaluating the potential impact, if any, that the adoption of SFAS 155 will haveon the consolidated financial position or results of operations.
Š In March 2006, the FASB issued SFAS No. 156, “Accounting for Servicing of Financial Assets”(“SFAS 156”). SFAS 156 addresses the accounting for recognized servicing assets and servicingliabilities related to certain transfers of the servicer’s financial assets and for acquisitions orassumptions of obligations to service financial assets that do not relate to the financial assets of theservicer and its related parties. SFAS 156 requires that all recognized servicing assets and servicingliabilities are initially measured at fair value, and subsequently measured at either fair value or byapplying an amortization method for each class of recognized servicing assets and servicing liabilities.SFAS 156 is effective in fiscal years beginning after September 15, 2006. The Group is currentlyevaluating the potential impact, if any, that the adoption of SFAS 156 will have on the consolidatedfinancial position or results of operations.
F-166

Financial Statements Notes To Consolidated Financial Statements
Š In June 2006, the FASB ratified the consensus on Emerging Issues Task Force (“EITF”) Issue No. 06-3,“How Taxes Collected from Customers and Remitted to Governmental Authorities Should Be Presentedin the Income Statement” (“EITF 06-3”). The scope of EITF 06-3 includes any tax assessed by agovernmental authority that is directly imposed on a revenue-producing transaction between a sellerand a customer and may include, but is not limited to, sales, use, value added, and certain excise taxes.EITF 06-3 states that presentation of taxes within the scope of this EITF on either a gross basis or a netbasis is an accounting policy decision which should be disclosed pursuant to APB No. 22, Disclosure ofAccounting Policies. If such taxes are significant, and are presented on a gross basis, the amounts ofthose taxes should be disclosed. The consensus on EITF 06-3 will be effective for interim and annualreporting periods beginning after December 15, 2006. The Group does not expect the adoption of EITF06-3 to have a material impact on the consolidated financial position or result of operations.
Š In June 2006, the FASB issued FASB Interpretation No. 48, “Accounting for Uncertainty in IncomeTaxes—an Interpretation of FASB Statement No. 109,” (FIN 48). FIN 48 prescribes a comprehensivemodel for how a company should recognize, measure, present, and disclose in its financial statementsuncertain tax positions that it has taken or expects to take on a tax return. The Group is currentlyevaluating the impact of adopting FIN 48 on the consolidated financial position and results ofoperations.
Š In September 2006, the FASB issued SFAS No. 157, “Fair Value Measurements,” (“SFAS 157”).SFAS 157 defines fair value, establishes a framework for measuring fair value in generally acceptedaccounting principles, and expands disclosures about fair value measurements. The provisions of thisstandard apply to other accounting pronouncements that require or permit fair value measurementsand do not require any new fair value measurement. The new Statement shall be adopted prospectivelyfor fiscal years beginning after November 15, 2007. The Group is currently evaluating the potentialimpact, if any, that the adoption of SFAS 157 will have on the consolidated financial position or resultsof operations.
Š In September 2006, the FASB ratified Emerging Issues Task Force Issue No. 06-1, “Accounting forConsideration Given by a Service Provider to Manufacturers or Resellers of Equipment Necessary for anEnd-Customer to Receive Service from the Service Provider” (“EITF 06-1”). This guidance requires theapplication of EITF 01-9, “Accounting for Consideration Given by a Vendor to a Customer”(“EITF 01-9”), when consideration is given to a reseller or manufacturer for benefit to the serviceprovider’s end customer. EITF 06-1 is effective for the first annual reporting period beginning afterJune 15, 2007. The Group does not expect the adoption of EITF 06-1 to have a material impact on itsconsolidated financial position or result of operations.
Š In September 2006, the FASB issued Statement 158 (“SFAS 158”) “Employers’ Accounting for DefinedBenefit Pension and Other Post retirement Plans—an amendment of FASB Statements No. 87, 88, 106and 132 (R)” that improves financial reporting by requiring an employer to recognize the overfunded orunderfunded status of a defined benefit post-retirement plan (other than a multiemployer plan) as anasset or liability in its statement of financial position and to recognize changes in that funded status inthe year in which the changes occur through comprehensive income. These requirements are effectiveas of the end of the fiscal year ending after December 15, 2006. This Statement had no effect in ourfinancial position and results of operations. SFAS 158 also improves financial reporting by requiring anemployer to measure the funded status of a plan as of the date of its year-end statement of financialposition, with limited exceptions. This requirement is effective for fiscal years ending afterDecember 15, 2008. The Group does not anticipate that the adoption of this requirement will have asignificant effect in its results of operations, financial position or cash flows.
Š In February 2007, the FASB issued Statement 159 (“SFAS 159”) “The Fair Value Option for FinancialAssets and Financial Liabilities—Including an Amendment of FASB Statement No. 115” that permitsentities to choose to measure many financial instruments and certain other items at fair value. Theobjective is to improve financial reporting by providing entities with the opportunity to mitigatevolatility in reported earnings caused by measuring related assets and liabilities differently withouthaving to apply complex hedge accounting provisions. This Statement is effective from fiscal years afterNovember 15, 2007. The Company is currently determining the policy of adoption as well as theresulting effect of SFAS 159 on its results of operations and financial position.
F-167

Financial Statements Notes To Consolidated Financial Statements
(B) CHANGES IN ACCOUNTING PRINCIPLES IN THE THREE YEAR PERIOD ENDED DECEMBER 31, 2006
Š Under IFRS, the Provisions for employee severance indemnities, to be accrued by Italian companies inaccordance with the Italian Civil Code, is considered a defined benefit plan. The liability for thisunfunding pension obligation is determined using the “Projected Unit Credit Method”.
Under U.S. GAAP, until December 31, 2004, the Group elected to account for it consistently with theItalian accounting policies as permitted by EITF 88-1 “Determination of Vested Benefit Obligation for aDefined Benefit Pension Plan”.
However, commencing in 2005 under U.S. GAAP, the Provisions for employee severance indemnities hasbeen treated as a defined benefit plan, as required by IFRS. This is also a permitted option under theEITF 88-1, and as a consequence there was no reconciling adjustment in equity as of December 31,2005 and 2006.
The effect of the cumulative catch up adjustment of €47 million in 2005 is separately disclosed in thecondensed U.S. GAAP Statement of Income for the year ended December 31, 2005, in accordance withAccounting Principles Board Opinion 20 (APB 20) “Accounting Changes”. Had the change been appliedin previous periods the net income for U.S. GAAP in 2004 would not have been significantly different.
Š Effective January 1, 2006, the Group adopted the fair value recognition provisions of FASB StatementNo. 123(R) (“SFAS 123(R)”), Share-Based Payment, using the modified prospective-transition method.For more detail please see “—(D) Stock-Based Compensation”.
(C) SECURITIZATION OF ACCOUNTS RECEIVABLE
As discussed in “Note 2—Accounting Policies”, the Group entered into certain transactions for the on-going saleof trade accounts receivable to a Special Purpose Entity (TISV—TI Securitization Vehicle S.r.l.) in a securitizationprogram, which ended July 25, 2006.
In particular, Telecom Italia regularly sold a portfolio of trade receivables without recourse to the TISecuritization Vehicle S.r.l., which financed the purchase of the receivables by issuing asset-backed securities. Thesales price of the receivables were paid to Telecom Italia partly as an Advanced Purchase Price (APP), at the timeof sale, and partly as a Deferred Purchase Price (DPP).
Under the terms of the agreement, the Vehicle charged the Group an initial discount which varied based on thecredit profile and other characteristics of each tranche of accounts receivable sold. Additionally, for the purposesof credit enhancement, the Vehicle withheld a portion of the purchase price as a deferred payment, representingthe Group’s retained interest in the sold receivables. The amount of deferred payment withheld was adjusted on amonthly basis based on an evaluation of actual collections, delinquencies and other factors. The Group retainedthe servicing responsibility related to the sold receivables and received a servicing fee from the Vehicle which wasestimated to approximate the fair value of providing such services.
For invoices issued and sold through September 2005, with regard to the risk of uncollectability, Telecom Italiawas responsible for the ultimate recovery from the debtors on the receivables sold, up to the limit of the amountof the DPP and the SPE retained the risk of uncollected amounts over the DPP. In accordance with SIC 12(Consolidation—Special Purpose Entities (SPE)), through September 30, 2005, TI Securitization Vehicle S.r.l.(TISV) was included in the scope of consolidation, because the exposure of the assignor to the risk ofuncollectability of the deferred purchase price implied, in substance, control over the SPE.
On December 15, 2005, the securitization program was restructured based on a “Master DPP TransferAgreement” signed by Telecom Italia and certain financial institutions under which the DPP on Telecom Italiareceivables relating to invoices issued between October 1, 2005 and May 31, 2006, were sold without recourse tosuch financial institutions.
Consequently, following the sale of the DPP without recourse, the risks and rewards of ownership of thesereceivables were transferred in full to the financial institutions which, having taken the control of the SPE, inaccordance with SIC 12 provisions, consolidated TISV.
For U.S. GAAP, the accounting for the securitization of accounts receivable is primarily governed by SFAS 140,“Accounting for Transfers and Servicing of Financial Assets and Extinguishments of Liabilities” (“SFAS 140”).
F-168

Financial Statements Notes To Consolidated Financial Statements
Under the provisions of SFAS 140, the sale agreement must meet certain defined criteria to qualify as a sale offinancial assets, the Qualifying Special Purpose entity (“QSPE”) must meet certain defined criteria to precludeconsolidation, and the amount of gain or loss on the sale is determined based on the consideration received, thecarrying value of the underlying financial components sold and the fair value of the financial components retained.Even though the underlying accounting principles differ, there was no material difference on equity and netincome as of and for the years ended December 31, 2006, 2005 and 2004 between IFRS and U.S. GAAP.
During 2006, 2005 and 2004 the following cash flows were received from and paid to the Vehicle:
Year ended December 31,2006 2005 2004
(millions of Euro)Gross trade receivables sold to the Vehicle . . . . . . . . . . . . . . . . . . . . . . . . . . . . . . . . . . . . . . 3,595 8,926 8,821Collections remitted to the Vehicle . . . . . . . . . . . . . . . . . . . . . . . . . . . . . . . . . . . . . . . . . . . . . . (4,254) (8,097) (8,012)Discount . . . . . . . . . . . . . . . . . . . . . . . . . . . . . . . . . . . . . . . . . . . . . . . . . . . . . . . . . . . . . . . . . . . . . . . . (18) (92) (93)
Remaining retained interest at year end . . . . . . . . . . . . . . . . . . . . . . . . . . . . . . . . . . . . . . . . . — (181) (285)
Net cash received in advance from the Vehicle . . . . . . . . . . . . . . . . . . . . . . . . . . . . . — 556 431
The amounts recorded in the consolidated condensed balance sheets and statements of income under U.S. GAAPfor 2006, 2005 and 2004 are as follows:
As of and for the year ended December 31,2006 2005 2004
(millions of Euro)Balance Sheet ItemsAmounts due from the Vehicle . . . . . . . . . . . . . . . . . . . . . . . . . . . . . . . . . . . . . . . . . — 829 869Retained interest . . . . . . . . . . . . . . . . . . . . . . . . . . . . . . . . . . . . . . . . . . . . . . . . . . . . . . . — 181 285Allowance for bad debts . . . . . . . . . . . . . . . . . . . . . . . . . . . . . . . . . . . . . . . . . . . . . . . . — 106 23
Statement of Income ItemsLoss recognized in the statement of income . . . . . . . . . . . . . . . . . . . . . . . . . . . . 18 116 116
The losses on the sales of receivables to the Vehicle are due to the discount applied by the Vehicle and, only forthe years ended December 31, 2005 and 2004, the bad debt provisions made in order to adjust the retained risksto fair value as required by SFAS 140. The retained interests represented the deferred purchase price that was yetto be received from the Vehicle and were included under other current assets as of December 31, 2005 and 2004.
(D) STOCK-BASED COMPENSATION
At December 31, 2006, the Group has several stock-based employee compensation plans which are describedmore fully in “Note 2—Accounting Policies” and “Note 42—Stock option plans of the Telecom Italia Group”. Priorto January 1, 2006, the Group accounted for all of its employee compensation plans under the recognition andmeasurement provisions of APB Opinion No. 25, Accounting for Stock Issued to Employees, and relatedInterpretations, as permitted by FASB Statement No. 123 (“SFAS 123”), Accounting for Stock-BasedCompensation.
Effective January 1, 2006, the Group adopted the fair value recognition provisions of FASB Statement No. 123(R)(“SFAS 123(R)”), Share-Based Payment, using the modified prospective-transition method. There were no newstock options granted or modifications to outstanding options made during 2006. Compensation cost for theunvested options granted that were outstanding as of January 1, 2006 will be recognized over the remainingservice period based on the compensation cost estimated for the SFAS 123 pro forma disclosures. Results forprior periods have not been restated. The effect of adopting SFAS 123(R) on operating income, income beforetaxes, net income, cash flows generated by operating activities, and basic and diluted earnings per share wasimmaterial.
The Group uses the Cox-Ross-Rubenstein (“CRR”) binomial model for estimating the fair value of employee stockoptions on the date of the grant which uses a binomial tree to assess the probabilities that the price of theunderlying stock might follow over the life of the option.
F-169

Financial Statements Notes To Consolidated Financial Statements
The following table illustrates the effect on net income if the Group had applied the fair value recognitionprovisions of SFAS 123 to options granted in all periods presented prior to the adoption of SFAS 123(R). For thepurpose of this pro forma disclosure, the value of the options is estimated using the CRR option-pricing formulaand charged to expense over the options’ vesting periods.
Year ended December 31,2005 2004(millions of Euro)
Net income in accordance with U.S. GAAP . . . . . . . . . . . . . . . . . . . . . . . . . . . . . . . . . . . . . . . . . . 1,939 1,541Add: Stock-based compensation expense under APB 25 . . . . . . . . . . . . . . . . . . . . . . . . . . . . . . . . . 2 3Less: Total stock-based compensation expense under SFAS 123 . . . . . . . . . . . . . . . . . . . . . . . . . (5) (25)
Pro forma net income . . . . . . . . . . . . . . . . . . . . . . . . . . . . . . . . . . . . . . . . . . . . . . . . . . . . . . . . . . . . . . . . 1,936 1,519
The Group’s pro forma earnings per share, had compensation costs been recorded in accordance with SFAS 123,would not be materially affected.
A summary of additional U.S. GAAP disclosures for the Telecom Italia Group stock option compensation plans ispresented below:
Number ofOptions
Weighted AverageExercise Price
Weighted AverageContractual Life of
Options OutstandingAggregate
Intrinsic Value(Euro) (years) (Euro)
Options outstanding at December 31,2006 . . . . . . . . . . . . . . . . . . . . . . . . . . . . . . . . . . . . . . . 277,932,854 2.99 1.36 —
Options expected to vest at December 31,2006 . . . . . . . . . . . . . . . . . . . . . . . . . . . . . . . . . . . . . . . 9,712,500 0.38 2.00 —
Options exercisable at December 31,2006 . . . . . . . . . . . . . . . . . . . . . . . . . . . . . . . . . . . . . . . 268,220,354 3.09 1.34 —
The weighted-average grant-date fair value of options granted during 2005 by Telecom Italia Media and in 2004by Tim Hellas was approximately €0.12 and €2.69, respectively. The total intrinsic value of options exercisedduring the years ended December 31, 2006, 2005, and 2004, was approximately €0.4 million, €6 million, and€26 million, respectively.
The number of options expected to vest is based on estimated forfeitures of options that were outstanding atDecember 31, 2006. Once vested, options become exercisable immediately.
As of December 31, 2006, there was approximately €0.4 million of total unrecognized compensation cost relatedto non vested options granted under the plans. That cost is expected to be recognized over a weighted-averageperiod of approximately 7 months.
Cash received from the options exercised under all plans for the years ended December 31, 2006, 2005 and 2004,was approximately €2 million, €60 million and €233 million, respectively.
(E) DEFERRED TAX ASSETS AND LIABILITIES
Paragraph 43 of SFAS 109, “Accounting for Income Taxes” requires the disclosure of the total of all deferred taxassets and the total valuation allowance, as well as the net change during the year in the valuation allowance.
F-170
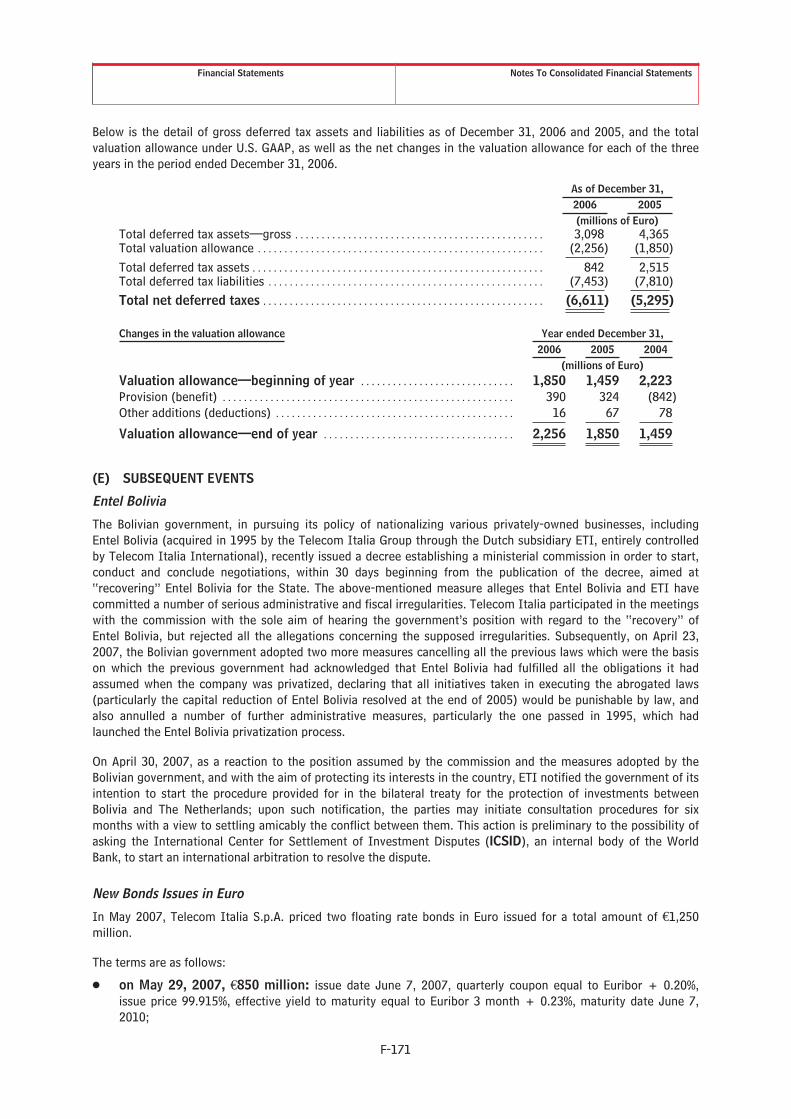
Financial Statements Notes To Consolidated Financial Statements
Below is the detail of gross deferred tax assets and liabilities as of December 31, 2006 and 2005, and the totalvaluation allowance under U.S. GAAP, as well as the net changes in the valuation allowance for each of the threeyears in the period ended December 31, 2006.
As of December 31,2006 2005(millions of Euro)
Total deferred tax assets—gross . . . . . . . . . . . . . . . . . . . . . . . . . . . . . . . . . . . . . . . . . . . . . . . 3,098 4,365Total valuation allowance . . . . . . . . . . . . . . . . . . . . . . . . . . . . . . . . . . . . . . . . . . . . . . . . . . . . . . (2,256) (1,850)Total deferred tax assets . . . . . . . . . . . . . . . . . . . . . . . . . . . . . . . . . . . . . . . . . . . . . . . . . . . . . . . 842 2,515Total deferred tax liabilities . . . . . . . . . . . . . . . . . . . . . . . . . . . . . . . . . . . . . . . . . . . . . . . . . . . . (7,453) (7,810)Total net deferred taxes . . . . . . . . . . . . . . . . . . . . . . . . . . . . . . . . . . . . . . . . . . . . . . . . . . . . . (6,611) (5,295)
Changes in the valuation allowance Year ended December 31,2006 2005 2004
(millions of Euro)Valuation allowance—beginning of year . . . . . . . . . . . . . . . . . . . . . . . . . . . . . 1,850 1,459 2,223Provision (benefit) . . . . . . . . . . . . . . . . . . . . . . . . . . . . . . . . . . . . . . . . . . . . . . . . . . . . . . . 390 324 (842)Other additions (deductions) . . . . . . . . . . . . . . . . . . . . . . . . . . . . . . . . . . . . . . . . . . . . . 16 67 78
Valuation allowance—end of year . . . . . . . . . . . . . . . . . . . . . . . . . . . . . . . . . . . . 2,256 1,850 1,459
(E) SUBSEQUENT EVENTS
Entel Bolivia
The Bolivian government, in pursuing its policy of nationalizing various privately-owned businesses, includingEntel Bolivia (acquired in 1995 by the Telecom Italia Group through the Dutch subsidiary ETI, entirely controlledby Telecom Italia International), recently issued a decree establishing a ministerial commission in order to start,conduct and conclude negotiations, within 30 days beginning from the publication of the decree, aimed at“recovering” Entel Bolivia for the State. The above-mentioned measure alleges that Entel Bolivia and ETI havecommitted a number of serious administrative and fiscal irregularities. Telecom Italia participated in the meetingswith the commission with the sole aim of hearing the government’s position with regard to the “recovery” ofEntel Bolivia, but rejected all the allegations concerning the supposed irregularities. Subsequently, on April 23,2007, the Bolivian government adopted two more measures cancelling all the previous laws which were the basison which the previous government had acknowledged that Entel Bolivia had fulfilled all the obligations it hadassumed when the company was privatized, declaring that all initiatives taken in executing the abrogated laws(particularly the capital reduction of Entel Bolivia resolved at the end of 2005) would be punishable by law, andalso annulled a number of further administrative measures, particularly the one passed in 1995, which hadlaunched the Entel Bolivia privatization process.
On April 30, 2007, as a reaction to the position assumed by the commission and the measures adopted by theBolivian government, and with the aim of protecting its interests in the country, ETI notified the government of itsintention to start the procedure provided for in the bilateral treaty for the protection of investments betweenBolivia and The Netherlands; upon such notification, the parties may initiate consultation procedures for sixmonths with a view to settling amicably the conflict between them. This action is preliminary to the possibility ofasking the International Center for Settlement of Investment Disputes (ICSID), an internal body of the WorldBank, to start an international arbitration to resolve the dispute.
New Bonds Issues in Euro
In May 2007, Telecom Italia S.p.A. priced two floating rate bonds in Euro issued for a total amount of €1,250million.
The terms are as follows:
Š on May 29, 2007, €850 million: issue date June 7, 2007, quarterly coupon equal to Euribor + 0.20%,issue price 99.915%, effective yield to maturity equal to Euribor 3 month + 0.23%, maturity date June 7,2010;
F-171

Financial Statements Notes To Consolidated Financial Statements
Š on May 31, 2007, €400 million: issue date June 7, 2007, quarterly coupon equal to Euribor + 0.79%,issue price 100%, effective yield to maturity equal to Euribor 3 month + 0.79%, maturity date June 7, 2016.
The new bonds were issued pursuant to Telecom Italia’s €15 billion Euro Medium Term Note (EMTN) Programme.
Application for the listing of the bonds shall be made with the Luxembourg Stock Exchange.
Disputes, Litigation and Legal Proceedings Pending
The information given in “Note 26—Contingent Assets and Liabilities, Commitments and Other Guarantees” onthe main disputes involving the Telecom Italia Group is updated below.
Š FASTWEB
With reference to the arbitration proceeding that Telecom Italia initiated in December 2005 with FastwebS.p.A. concerning “inverse termination”, on May 19, 2007, the Arbitration Board notified Telecom Italiathat the unilateral change made by Fastweb to its price for inverse termination was ruled to be illegal.
The Arbitration Board declared that it was competent to decide on the questions raised by TelecomItalia and Fastweb and falling outside the scope of the National Regulatory Authority, while leaving thelatter to determine:
(i) the price of the “inverse termination” service (the question is in fact the subject of a disputebetween the parties pending before the National Regulatory Authority since December 2005,currently waiting for the Technical Consultant appointed by the Authority to begin its work again);and
(ii) the time from which the change to the termination price was to apply (which, being related to thequestion of the determination of the price, will be established by the National Regulatory Authorityin the context of the dispute filed earlier by Fastweb).
As regards the refunding of the higher-than-contractual amounts paid (subject to reserve) by TelecomItalia to Fastweb, the Arbitration Board suspended the proceeding until the decision of the NationalRegulatory Authority fixing the termination price, after which one or other of the parties may request itto be resumed within 6 months of such decision.
* * *
With reference to the arbitration proceeding initiated by Fastweb in 2005 regarding allegednon-performance by Telecom Italia of the contract for the supply of “local loop unbundling” services,the Company has challenged the award before the Rome Court of Appeal.
Š VODAFONE
As regards the petition relating to the “Vodafone Casa Numero Fisso” offer, the Lazio AdministrativeCourt set a time limit for the National Regulatory Authority to produce the required information,pending which it suspended the enforceability of the administrative order. The hearing of the case isscheduled for June 2007.
Š WIND
Following the petition submitted in November 2006 by the Associazione Italiana Internet Providerrelating to Telecom Italia’s “Alice 20 Mega” offer, on April 23, 2007 Wind also notified Telecom Italia ofan appeal to the Lazio Regional Administrative Court for the suspension and subsequent annulment ofthe resolution adopted by the National Regulatory Authority that, by approving the Telecom Italia offerof “single access ADSL wholesale flat with downstream velocities up to 20 Mbit/s using Ethernet/IPtechnology” (marked by technical access parameters corresponding to those of the “Alice 20 Mega”retail service), authorized the continuation of Telecom Italia’s “Alice 20 Mega” product on the groundsthat the wholesale ADSL offers present on the market allowed the offer in question to satisfy thereplicability requirement.
F-172
Financial Statements Notes To Consolidated Financial Statements
According to Wind, the failure to disaggregate Telecom Italia’s wholesale offer, the narrow profitmargins granted to competing operators wishing to take it up and the impossibility of providing finalclients with services equivalent to those proposed by Telecom Italia implied a loss of market shares forWind and all of Telecom Italia’s competitors.
Telecom Italia will take part in the proceedings as an adverse party.
Š ANTITRUST PROCEEDING A-357
With reference to Antitrust Authority investigation to establish the violations of Articles 81 and 82 of theEuropean Community Treaty, the time limit for completion of the investigation has been scheduled toterminate by August 10, 2007.
In the hearing of May 24, 2007 the Antitrust Authority ended its inquiry of Vodafone’s activities withoutfinding Vodafone liable of irregularities on the basis of the commitments undertaken pursuant to Article14 ter. of Law No. 287/90 by Vodafone on November 10, 2006.
The final hearing took place on June 6, 2007.
Š BRAZIL
In relation to the various disputes in which Telecom Italia Group is involved, it should be noted that:following the termination of the agreement regarding the merger of Brasil Telecom Celular into TimBrasil, Telecom Italia International, Tim International and Tim Brasil applied for the closure of therelated court proceedings since the matter at issue no longer existed. In one case the judge upheld therequest, whereas in the second case the proceedings are still pending.
In 2006 Brasil Telecom and Brasil Telecom Celular had initiated arbitration proceedings against TimInternational and Tim Brasil before the International Chamber of Commerce (“ICC”) in Parischallenging the validity of the agreement (and asking damages) regarding the merger of Brasil TelecomCelular into Tim Brasil. Following a request by Brasil Telecom, the Arbitration Panel suspended theproceedings in April 2007 pending the decision in other arbitration proceedings under way betweenTelecom Italia International, Telecom Italia, Techold and Timepart.
The four arbitration proceedings between Telecom Italia International and Techold (and in one caseTimepart) (in one of which, following a request of Techold, Telecom Italia S.p.A. is involved) are at trialstage and the hearings have been held before the ICC in Paris.
Š CUBA
As regards the dispute between ETECSA and Banco Nacional de Comercio Exterior (“Bancomext”) itshould be noted that in November 2006 the Paris Court of Appeal upheld ETECSA’s request to declarethe arbitration award of August 5, 2004 null and that ETECSA accordingly applied to the Turin Court ofAppeal for the revocation of the provisional enforceability of the judgment of the Court of Turin. Theapplication has been denied on procedural grounds.
Š GREECE
The proceedings are still at the preliminary stage.
Š CONSIP TENDER
In a ruling dated May 31, 2007 the Lazio Administrative Court rejected Telecom Italia’s appeal.
Š ACTIONS BROUGHT AGAINST OTHER OPERATORS FOR UNFAIR COMPETITION AND VIOLATIONOF PRIVACY
We are awaiting the issuance of the ruling by the Court.
F-173

[THIS PAGE INTENTIONALLY LEFT BLANK]

EXHIBITS

[THIS PAGE INTENTIONALLY LEFT BLANK]

Exhibit 1.1
BYLAWS
April 2007
INDEX
Name - Registered office – Purpose and duration of the Company . . 2Share Capital - Shares - Bonds . . . . . . . . . . . . . . . . . . . . . . . . . . . . . . . . . . . . . 2Board of Directors . . . . . . . . . . . . . . . . . . . . . . . . . . . . . . . . . . . . . . . . . . . . . . . . . 5Board of Auditors . . . . . . . . . . . . . . . . . . . . . . . . . . . . . . . . . . . . . . . . . . . . . . . . . . 8Shareholders’ Meeting . . . . . . . . . . . . . . . . . . . . . . . . . . . . . . . . . . . . . . . . . . . . . 10Fiscal year - Dividends . . . . . . . . . . . . . . . . . . . . . . . . . . . . . . . . . . . . . . . . . . . . . 11Special Powers . . . . . . . . . . . . . . . . . . . . . . . . . . . . . . . . . . . . . . . . . . . . . . . . . . . . 12
Approved by the Shareholders’ Meeting on 16 April 2007, as pernotarial deeds n. 2746/1368, dated 9 May 2007 by Mr. Carlo Marchetti,Public Notary in Milan.
1 ��

TELECOM ITALIA • BYLAWS
NAME - REGISTERED OFFICE - PURPOSE AND DURATION OF THE COMPANY
Article 1
1.1 - The name of the Company shall be “TELECOM ITALIA S.p.A.”
Article 2
2.1 - The registered office of the Company shall be in Milan.
Article 3
3.1 - The Company’s purpose shall be:
- the installation and operation, using any technique, method or system, of fixed andmobile equipment and installations, including radio stations, links for maritimewireless communications, and dedicated and/or integrated networks, for thepurpose of providing, operating and marketing, without territorial restrictions,communications services, including those resulting from technological progress,and the performance of activities directly or indirectly related thereto, including thedesign, construction, operation, maintenance, integration and marketing oftelecommunications, information technology and electronic products, services,networks and systems and, in general, ICT (Information CommunicationTechnology) solutions for final users;
- the performance of related and instrumental activities, including publishing,advertising, information technology, online and multimedia activities and, ingeneral, all commercial, financial, property, research, training and consultingactivities;
- the acquisition, provided it is not the Company’s principal activity, of equityinterests in other companies and undertakings falling within the scope of thecorporate purpose or related, complementary or similar thereto;
- the control and the strategic, technical and administrative and financialcoordination of subsidiary companies and undertakings, and the financial planningand management thereof, with the implementation of all related transactions.
3.2 - Activities reserved to persons entered in a professional register and activitiesinvolving dealings with the public covered by Article 106 of Legislative Decree 385/1993shall be expressly excluded.
Article 4
4.1 - The duration of the Company shall be until 31 December 2100. Extension of the timelimit shall not result in shareholders who do not vote in favour of such resolution havingthe right of withdrawal.
SHARE CAPITAL – SHARES - BONDS
Article 5
5.1 - The subscribed and fully paid-up share capital shall be equal to Euro10,673,776,696.55, divided into 13,380,746,060 ordinary shares with a par value of Euro0.55 each and 6,026,120,661 savings shares with a par value of Euro 0.55 each.
5.2 - In resolutions to increase the share capital by issuing shares for cash, the right ofpre-emption may be excluded for up to a maximum of ten per cent of the previouslyexisting capital, provided the issue price corresponds to the market value of the sharesand this is confirmed in a report prepared by the firm appointed to audit the accounts.
�� 2

TELECOM ITALIA • BYLAWS
5.3 - The Shareholders’ Meeting of 26 May 2003, reiterating, updating and, wherenecessary, renewing earlier resolutions of the Shareholders’ Meeting and the Board ofDirectors resolved to increase the share capital by up to a maximum of Euro624,936,779.50 (at 18 April 2007 Euro 125,771,565.15), by means of the issue of up to amaximum of 1,136,248,690 (at 18 April 2007 228,675,573) ordinary shares with a parvalue of Euro 0.55 each to be reserved irrevocably and exclusively for the conversion ofthe “Olivetti 1.5% 2001-2010 convertibile con premio al rimborso” (now Prestito“Telecom Italia 1.5% 2001-2010 convertibile con premio al rimborso”) convertible bonds,on the basis of 0.471553 ordinary shares for each bond presented for conversion.
5.4 - The Shareholders’ Meeting of 26 May 2003 also resolved to increase the sharecapital by up to a maximum of Euro 183,386,986.75 (at 18 April 2007 Euro55,307,528.10), by means of the issue of up to a maximum of 333,430,885 (at 18 April2007 100,559,142) ordinary shares with a par value of Euro 0.55 each, divided into thefollowing outstanding divisible tranches:
1 a tranche of up to a maximum of Euro 37,398,868.65 (at 18 April 2007 Euro9,712,784.40) for the exercise of the “Piano di Stock Option 2000” stock options,increase to be implemented by 30 July 2008 by means of the issue of up to amaximum of 67,997,943 (at 18 April 2007 17,659,608) shares with a par value ofEuro 0.55 each, to be subscribed for at a total price of Euro 13.815 per option held(i.e. at a price of Euro 4.185259 for each newly-issued share);
2 a tranche of up to a maximum of Euro 21,422,652.90 (at 18 April 2007 Euro16,484,542.80) for the exercise of the “Piano di Stock Option Top 2002” stockoptions, increase to be implemented by 28 February 2010 by means of the issue ofup to a maximum of 38,950,278 (at 18 April 2007 29,971,896) shares with a parvalue of Euro 0.55 each, to be subscribed for at a total price of Euro 9.203 per optionheld (i.e. at a price of Euro 2.788052 for each newly-issued share);
3 a tranche of up to a maximum of Euro 50,268,799.90 (at 18 April 2007 Euro29,110,200.90) for the exercise of the “Piano di Stock Option 2002” stock options,increase to be implemented by 31 March 2008 for the first lot, by 31 March 2009 forthe second lot and by 31 March 2010 for the third lot by means of the issue of up toa maximum of 91,397,818 (at 18 April 2007 52,927,638) shares with a par value ofEuro 0.55 each, to be subscribed for at a total price for the different options ofrespectively Euro 9.665, Euro 7.952 and Euro 7.721 per option held (i.e. at a price forthe different options of respectively Euro 2.928015 Euro 2.409061 and Euro2.339080 for each newly-issued share).
5.5 - The Shareholders’ Meeting of 7 April 2005 resolved to increase the share capital byup to a maximum of Euro 38,655,832.60 (at 18 April 2007 Euro 27,304,720.30), by meansof the issue of up to a maximum of 70,283,332 (at 18 April 2007 49,644,946) ordinaryshares with a par value of Euro 0.55 each, divided into the following outstanding divisibletranches:
1. a tranche of up to a maximum of Euro 11,705,656.05 (at 18 April 2007 Euro9,320,515.05) for the exercise of the “2000-2002 Stock-Option Plans” stock options,increase to be implemented by 31 December 2008 by means of the issue of up to21,283,011 (at 18 April 2007 16,946,391) Telecom Italia ordinary shares with a parvalue of Euro 0.55 each, to be subscribed for at a total price of Euro 6.42 per optionheld (i.e. at a price of Euro 3.710983 for each newly-issued share);
2. a tranche of up to a maximum of Euro 22,150,920 (at 18 April 2007 Euro16,380,072.50) for the exercise of the “2002-2003 Stock-Option Plans” stockoptions, increase to be implemented by 31 December 2008 by means of the issue ofup to 40,274,400 (at 18 April 2007 29,781,950) Telecom Italia ordinary shares with apar value of Euro 0.55 each, to be subscribed for at a total price of Euro 5.67 peroption held (i.e. at a price of Euro 3.277457 for each newly-issued share);
3 ��
TELECOM ITALIA • BYLAWS
3. a tranche of up to a maximum of Euro 3,192,173.05 (at 18 April 2007 Euro1,604,132.75) for the exercise of the “2003-2005 Stock-Option Plans” stock options,increase to be implemented by 31 December 2008 for the first lot, by 31 December2009 for the second lot and by 31 December 2010 for the third lot by means of theissue of up to a maximum of 5,803,951 (at 18 April 2007 2,916,605) shares with apar value of Euro 0.55 each, to be subscribed for at a total price of Euro 5.07 peroption held (i.e. at a price of Euro 2.930636 for each newly-issued share).
5.6 - For five years starting from 6 May 2004 the Directors may increase the share capitalin one or more tranches by up to a maximum total amount of Euro 880,000,000 by meansof cash issues of up to a maximum of 1,600,000,000 ordinary shares, all or part of which:
(i) to be offered with the right of pre-emption to shareholders and holders ofconvertible bonds; or
(ii) to be offered for subscription to employees of Telecom Italia S.p.A. or itssubsidiaries, with the exclusion of the right of pre-emption, provided such increase incapital does not exceed 1% of the capital attested at the date of the offering,pursuant to the combined effects of Article 2441, last paragraph, of the Civil Codeand Article 134(2) of Legislative Decree 58/1998.
5.7 - Resolutions to increase the share capital adopted by the Board of Directors inexercising the powers attributed above shall set the subscription price (including anypremium) and a time limit for the subscription of the shares; they may also provide, in theevent that the increase approved is not fully subscribed within the time limit establishedfor each issue, for the capital to be increased by an amount equal to the subscriptionsreceived up to such time.
5.8 - The Board of Directors may issue, in one or more tranches and for up to a maximumof five years from 6 May 2004, convertible bonds up to a maximum amount of Euro880,000,000.
Article 6
6.1 - Savings shares shall have the preferential rights set forth in this Article.
6.2 - The net profit shown in the duly approved annual accounts, less the amount to beallocated to the legal reserve, must be distributed to the savings shares up to five percent of their par value.
6.3 - The net profit that remains after the allocation to the savings shares of the preferreddividend provided for in the second paragraph, payment of which must be approved bythe Shareholders’ Meeting, shall be divided among all the shares in such a way that thedividend per savings share is higher by two per cent of its par value than the dividend perordinary share.
6.4 - When the dividend paid on savings share in a fiscal year is less than that indicated inthe second paragraph, the difference shall go to increase the preferred dividend in thenext two fiscal years.
6.5 - In the event of a distribution of reserves, the savings shares have the same rights asthe other shares. If the net profit for the year is nil or insufficient to satisfy the propertyrights referred to in the preceding paragraphs, the Shareholders’ Meeting called toapprove the annual accounts may resolve to satisfy the right referred to in the secondparagraph and/or the right to the premium referred to in the third paragraph by drawingon the reserves. Payment made by drawing on the reserves shall exclude application ofthe mechanism for carrying over, to the two following fiscal years, the right to preferreddividends not received through the distribution of profits referred to in the fourthparagraph.
�� 4

TELECOM ITALIA • BYLAWS
6.6 - A reduction of the share capital due to losses shall not entail a reduction of the parvalue of the savings shares, except for the amount of the loss that exceeds the total parvalue of the other shares.
6.7 - Upon dissolution of the Company, the savings shares shall have priority in therepayment of the capital up to their entire par value.
6.8 - If the Company’s ordinary or savings shares are delisted, holders of savings sharesmay apply to the Company for their conversion into ordinary shares, in the mannerapproved by an ad hoc Extraordinary Shareholders’ Meeting called within two months ofthe delisting.
6.9 - The organization of savings shareholders shall be governed by law and these bylaws.The costs associated with organizing special meetings of savings shareholders andremunerating the common representative shall be borne by the Company.
Article 7
7.1 - The shares shall be indivisible. In the event of joint ownership, the rights of the jointowners shall be exercised by a common representative. Fully paid-up shares may bebearer shares when the law permits. In such case, shareholders may apply for their sharesto be converted, at their own expense, into registered shares or vice versa.
7.2 - Vis-à-vis the Company, shareholders shall be deemed to elect domicile for all legalpurposes at the domicile indicated in the Shareholders’ Register.
7.3 - The imposition or removal of restrictions on the circulation of shares shall not resultin shareholders who do not vote in favour of such resolution having the right ofwithdrawal.
Article 8
8.1 - The Company may issue bonds and shall establish the terms and conditions of theirplacement.
8.2 - The costs associated with organizing meetings of bondholders shall be borne by theCompany, which, in the absence of a bondholder resolution in the form prescribed by law,shall also bear the cost of the common representatives up to the maximum amount set bythe Board of Directors for each issue, taking account of its size.
BOARD OF DIRECTORS
Article 9
9.1 - The Company shall be managed by a Board of Directors consisting of not less thanseven and not more than twenty-three members. The Shareholders’ Meeting shallestablish the number of members of the Board of Directors, which shall remainunchanged until a different number is established.
9.2 - The Board of Directors shall be appointed on the basis of slates presented byshareholders pursuant to the following paragraphs or by the outgoing Board of Directors,on which the candidates shall be listed by serial number.
9.3 - When the Board of Directors presents its own slate, it shall be filed at the registeredoffice of the Company and published in at least one Italian daily newspaper with nationalcirculation, at least twenty days prior to the date set for the Shareholders’ Meeting on thefirst call.
5 ��
TELECOM ITALIA • BYLAWS
9.4 - The slates presented by shareholders shall be filed at the registered office of theCompany and published at the expense of the shareholders in the manner indicated in thepreceding paragraph at least fifteen days prior to the date set for the Shareholders’Meeting on the first call.
9.5 - Each shareholder may present or participate in the presentation of only one slateand each candidate may appear on only one slate on pain of ineligibility.
9.6 - Only shareholders who alone or together with other shareholders hold a totalnumber of shares representing at least 1% (or less, according to Consob regulations) ofthe share capital entitled to vote at the Ordinary Shareholders’ Meeting may submitslates, subject to their proving ownership of the number of shares needed for thepresentation of slates at least two days prior to the date set for the Shareholders’ Meetingat the first call on pain of nullity.
9.7 - Together with each slate, and within the respective time limits specified above, it isnecessary to file individual candidates’ acceptances of their candidacy and declarations inwhich they attest, on their own responsibility, that there are no grounds for ineligibility orincompatibility, and that they meet any requirements prescribed for the positions inquestion as well as any other piece of information requested by applicable law orregulation or the bylaws. Together with the declarations, a curriculum vitae shall be filedfor each candidate setting out their main personal and professional data with anindication of the positions held in management and control bodies of other companiesand of the grounds for their qualifying as independent in accordance with the criteriaestablished by law and the Company. Any changes that occur up to the day theShareholders’ Meeting is held must be promptly notified to the Company.
9.8 - Each person entitled to vote may vote for only one slate.
9.9 - The Board of Directors shall be elected as specified below:
a) four fifths of the directors to be elected shall be chosen from the slate that obtainsthe majority of the votes cast by the shareholders, in the order in which they arelisted on the slate; in the event of a fractional number, it shall be rounded down tothe nearest whole number;
b) the remaining directors shall be taken from the other slates; to that end, the votesobtained by the various slates shall be divided successively by whole numbers fromone up to the number of directors to be chosen. The quotients thus obtained shall beassigned to the candidates on each slate in the order specified thereon. On the basisof the quotients assigned, the candidates on the various slates shall be arranged in asingle decreasing ranking. Those who have obtained the highest quotients shall beelected.
If more than one candidate obtains the same quotient, the candidate from the slatethat has not yet elected any director or that has elected the smallest number ofdirectors shall be elected.
If none of such slates has yet elected a director or all of them have elected the samenumber of directors, the candidate from the slate that obtained the largest numberof votes shall be elected. If the different slates have received the same number ofvotes and their candidates have been assigned the same quotients, a new vote shallbe held by the entire Shareholders’ Meeting and the candidate obtaining the simplemajority of the votes shall be elected.
9.10 - In appointing directors who for any reason have not been appointed pursuant tothe procedure specified above, the Shareholders’ Meeting shall vote on the basis of themajorities required by law.
�� 6

TELECOM ITALIA • BYLAWS
9.11 - If in the course of the fiscal year one or more vacancies occur on the Board, theprocedure specified in Article 2386 of the Civil Code shall be followed.
9.12 - Should a majority of the seats on the Board of Directors become vacant for anycause or reason, the remaining directors shall be deemed to have resigned and they shallcease to hold office from the time the Board of Directors has been reconstituted bypersons appointed by the Shareholders’ Meeting.
Article 10
10.1 - The Board of Directors shall elect a Chairman from among its member — if theShareholders’ Meeting has not already done so — and may also appoint one or moreDeputy Chairmen.
10.2 - If the Chairman is absent or unable to act, the senior Deputy Chairman by age, ifappointed, shall take his/her place or, in the absence of a Deputy Chairman, the mostsenior director by age.
10.3 - The Board of Directors may elect a Secretary who need not be a director.
Article 11
11.1 - The Chairman or his/her substitute shall call meetings of the Board of Directors atthe Company’s registered office or elsewhere, on his/her own initiative and whenever he/she receives a written request to do so from at least one fifth of the directors holdingoffice or from the members of the Board of Auditors. The Chairman shall give advancenotice of the matters to be discussed in Board meetings and arrange for adequateinformation on the questions to be examined to be provided to all the Directors, takingaccount of the circumstances of each case.
11.2 - Meetings shall be called, using suitable means in relation to the notice to be given,normally at least five days prior to the date thereof, except in urgent cases, when at leasttwelve hours’ notice must in any case be given.
11.3 - Notice shall be given to the Board of Auditors within the same time limits.
11.4 - Participation in Board meetings may – if the Chairman or his/her substitute verifiesthe necessity – be by means of telecommunication techniques that permit participation inthe discussion and informational equality for all those taking part.
Article 12
12.1 - The Board of Directors shall be responsible for running the Company, since allmatters not expressly reserved to the Shareholders’ Meeting by law or these bylaws arewithin its jurisdiction.
12.2 - Within the limits established by law, the Board of Directors shall be entrusted withdeciding on the merger into Telecom Italia and the spin-off in favour of Telecom Italia ofcompanies of which Telecom Italia owns at least 90% of the shares or capital parts, thereduction of the share capital in the event of the withdrawal of shareholders, the revisionof the bylaws to conform with statutory provisions, the relocation of the Company’sregistered office within Italy, and the opening and closing of secondary offices.
Article 13
13.1 - To implement its own resolutions and manage the Company, the Board ofDirectors, subject to the limits provided for by law, may:
- create an Executive Committee, establishing its powers and the number of members;
7 ��

TELECOM ITALIA • BYLAWS
- delegate suitable powers, establishing the limits thereof, to one or more directors,possibly with the title of Chief Executive Officer;
- appoint one or more General Managers, establishing their powers and duties;
- appoint attorneys, who may be members of the Board of Directors, for specifictransactions and for a limited period of time.
13.2 - The Board of Directors may set up committees from among its members chargedwith giving advice and making proposals and shall establish their powers and duties.
13.3 - The Board of Directors shall appoint the manager responsible for preparing theCompany’s financial reports after consulting the Board of Auditors. Unless revoked forgood cause after consulting the Board of Auditors, the appointment shall terminatetogether with that of the Board of Directors that made it.
13.4 - The manager responsible for preparing the Company’s financial reports must be anexpert in the fields of administration, finance and control and satisfy the integrityrequirements established for directors. Subsequent failure to satisfy these requirementsshall entail disqualification from the position, which must be announced by the Board ofDirectors within thirty days of its learning of the failure.
Article 14
14.1 - Persons with delegated powers shall report to the Board of Directors and the Boardof Auditors on the activities carried out, the general results of operations and theirforeseeable development, and the transactions of greatest economic, financial or balancesheet significance concluded by the Company or its subsidiaries; in particular, they shallreport on transactions in which they have an interest, directly or on behalf of third parties,or that are influenced by the person, if any, who performs the activity of direction andcoordination. Such reports shall be made promptly, and at least once in each quarter, inmeetings or in writing.
14.2 - In accordance with the times and procedures for disclosing information to themarket, the representative of the holders of savings shares must be informed by theBoard of Directors or the persons delegated to that end of any corporate events thatmight affect the price of the shares of that class.
Article 15
15.1 - The representation of the Company vis-à-vis third parties and in legal proceedingsshall pertain to the Chairman or if he/she is absent or unable to act, the DeputyChairman, if one is appointed; it shall also pertain severally to each of the Chief ExecutiveOfficers.
Article 16
16.1 - The directors shall be entitled to the reimbursement of expenses incurred in theperformance of their duties. The Ordinary Shareholders’ Meeting shall also decide theannual remuneration payable to the Board of Directors. Once fixed, this remunerationshall remain unchanged until a different amount is established.
BOARD OF AUDITORS
Article 17
17.1 - The Board of Auditors shall consist of five auditors. The Shareholders’ Meeting shallalso appoint two alternates.
17.2 - For the purposes of Articles 1(2)(b) and 1(2)(c) of the regulation referred to inJustice Minister Decree 162/2000, the following sectors of activity and matters shall be
�� 8
TELECOM ITALIA • BYLAWS
considered closely linked to those of the Company: telecommunications, informationtechnology, online systems, electronics and multimedia technology, and matters relatedto private and administrative law, economics and business administration.
17.3 - The appointment of the Board of Auditors shall be based on slates presented byshareholders, filed at the Company’s registered office and published at the expense of theshareholders who present them in at least one daily newspaper with national circulationat least fifteen days prior to the date set for the Shareholders’ Meeting on the first call.
17.4 - Each shareholder may present or participate in the presentation of only one slateand each candidate may appear on only one slate on pain of ineligibility.
17.5 - Only shareholders who alone or together with other shareholders hold a totalnumber of shares representing at least 1% (or less, according to Consob regulations forthe appointment of the Board of Directors) of the voting share capital, may submit slates,subject to their proving ownership of the number of shares needed for the presentation ofslates at least two days prior to the date set for the Shareholders’ Meeting at the first callon pain of nullity.
17.6 - Together with each slate, it is necessary to file individual candidates’ acceptancesof their candidacy and declarations in which they attest, on their own responsibility, thatthere are no grounds for ineligibility or incompatibility, and that they meet therequirements as well as any other piece of information requested by applicable law orregulation or the bylaws.
17.7 - Together with the declarations, a curriculum vitae for each candidate shall be filedsetting out their main personal and professional data with an indication of the positionsheld in management and control bodies of other companies. Any changes that occur up tothe day the Shareholders’ Meeting is held must be notified to the Company.
17.8 - The slates shall be divided into two sections: one for candidates to the position ofauditor and the other for candidates to the position of alternate. The first candidate ineach section shall be selected from among persons entered in the register of auditors whohave worked on statutory audits for a period of not less than three years.
17.9 - Each person entitled to vote may vote for only one slate.
17.10 - The Board of Auditors shall be elected as specified below:
a) from the slate that obtains the majority of the votes cast by the shareholders (theMajority Slate) one alternate and three auditors shall be chosen in the order in whichthey are listed on the slate;
b) two auditors shall be chosen from the other slates (the Minority Slates);
To this end the votes obtained by the various slates shall be divided first by one andthen by two. The quotients thus obtained shall be assigned to the candidate auditorson each slate in the order specified thereon. On the basis of the quotients assigned,the candidates on the various slates shall be arranged in a single decreasing rankingand those who have obtained the highest quotients shall be elected.
If more than one candidate obtains the same quotient, the candidate from the slatethat has not yet elected an auditor shall be elected or, subordinately, there shall be atiebreaker vote by the entire Shareholders’ Meeting and the candidate who obtainsthe simple majority of the votes shall be elected.
c) one alternate auditor shall be chosen from the Minority Slate that obtained thelargest number of votes.
In the event of a tie, there shall be a tiebreaker vote by the entire Shareholders’Meeting and the candidate who obtains the simple majority of the votes shall beelected.
9 ��

TELECOM ITALIA • BYLAWS
17.11 - The Shareholders’ Meeting shall appoint the Chairman of the Board of Auditorsfrom among the auditors elected from Minority Slates.
17.12 - In appointing auditors who for any reason have not been appointed pursuant tothe procedure specified above, the Shareholders’ Meeting shall vote on the basis of themajorities required by law.
17.13 - In the event of the termination of the appointment of an auditor chosen from theMajority Slate or one of the Minority Slates, the alternate chosen respectively from theMajority Slate or the Minority Slates shall take his/her place. Appointments to fillvacancies on the Board of Auditors pursuant to Article 2401 of the Civil Code shall bemade by the Shareholders’ Meeting on the basis of the majorities required by law.
17.14 - After notifying the Chairman of the Board of Directors, the Board of Auditors, maycall, as provided for by law, a Shareholders’ Meeting or a meeting of the Board ofDirectors or the Executive Committee. This power to call meetings may be exercisedindividually by each auditor, except for the power to call a Shareholders’ Meeting, whichmust be exercised by at least two auditors.
17.15 - Participation in the meetings of the Board of Auditors may – if the Chairmanverifies the necessity – be by means of telecommunication techniques that permitparticipation in the discussion and informational equality for all those taking part.
17.16 - If the Chairman is absent or unable to act, the other auditor elected from theMinority Slates shall take his/her place.
SHAREHOLDERS’ MEETING
Article 18
18.1 - An Ordinary Shareholders’ Meeting must be called within 120 days or, wherespecial circumstances make this necessary, within 180 days of the end of the fiscal year; ifthe meeting is called within 180 days, the Directors shall give the reasons for the delay inthe report on operations included in the annual report.
18.2 - An Extraordinary Shareholders’ Meeting shall be called whenever it is deemeddesirable by the Board of Directors and when it is required in accordance with the law. Ifthe quorum is not reached at the second call, there may be a third call.
18.3 - Special meetings of savings shareholders shall be called by the commonrepresentative of the savings shareholders or by the Company’s Board of Directorswhenever they deem this to be desirable or when requested in accordance with the law.
18.4 - Requests by shareholders to add items to the agenda of a Shareholders’ Meeting inaccordance with the law must be accompanied by a report, to be filed at the Company’sregistered office in time to be made available to shareholders at least 10 days prior to thedate set for the meeting on the first call.
18.5 - Ordinary and Extraordinary Shareholders’ Meetings and special meetings of savingsshareholders may be held in a place other than the registered office, provided it is in Italy.
Article 19
19.1 - Shareholders are entitled to attend a Shareholders’ Meeting when the Company hasreceived the documentation for them pursuant to Article 2370, second paragraph of theCivil Code, at least two days prior to the date set for each meeting.
19.2 - Ordinary shareholders may exercise their right to vote by mail in accordance withthe applicable law.
�� 10

TELECOM ITALIA • BYLAWS
19.3 - Every shareholder entitled to attend may be represented at the Shareholders’Meeting by giving a proxy to an individual or legal entity, subject to the restrictionsestablished by law.
19.4 - In order to facilitate the collection of proxies among employees of the Company orits subsidiaries who hold ordinary shares of the Company and belong to shareholderassociations satisfying the requirements established by law, special areas shall be madeavailable in accordance with the procedures and time limits established by the Board ofDirectors either directly or through its agents where information can be provided andproxy forms collected.
Article 20
20.1 - The Chairman of the Board of Directors or his/her substitute shall chair Ordinary andExtraordinary Shareholders’ Meeting and govern its proceedings; the same function shall beperformed by the common representative in special meetings of savings shareholders. Inthe absence respectively of the Chairman of the Board of Directors (and his/her substitute)and of the common representative, the meeting shall be chaired by the person elected withthe favourable vote of the majority of the capital represented at the meeting.
20.2 - The Chairman of the meeting shall, amongst other things, verify its regularity,ascertain the identity and right to attend of those present, direct the business, includingby establishing a different order for the discussion of the items indicated in the noticeconvening the meeting. The Chairman shall take appropriate measures to ensure theorderly conduct of the discussion and polls; he shall establish how each poll is to beconducted and verify the results; he may choose two or more scrutineers from amongthose present.
20.3 - The Secretary shall be appointed with the favourable vote of the majority of thecapital represented at the meeting and a person who is not a shareholder may beselected.
20.4 - Shareholders’ meetings shall be governed by the law, these bylaws and, exclusivelyfor Ordinary an Extraordinary Shareholders’ Meetings, the Rules of Proceeding approvedby the Ordinary Shareholders’ Meeting.
FISCAL YEAR - DIVIDENDS
Article 21
21.1 - The fiscal year shall end on December 31 of each year.
21.2 - From the net profit reported in the annual accounts, 5% shall be allocated to thelegal reserve until this reaches an amount equal to one-fifth of the share capital.
21.3 - The remainder shall be used to pay the dividend determined by the Shareholders’Meeting, and for such other purposes as the Shareholders’ Meeting deems mostappropriate or necessary.
21.4 - During the course of the fiscal year, the Board of Directors may distribute interimdividends to the shareholders.
11 ��
TELECOM ITALIA • BYLAWS
SPECIAL POWERS
Article 22
22.1 - Pursuant to Article 2(1) of Decree Law 332/1994, ratified with amendments by Law474/1994, as replaced by Article 4(227) of Law 350/2003, the Minister for the Economyand Finance, in agreement with the Minister for Productive Activities, shall have thefollowing special powers:
a) to oppose the acquisition by parties subject to the limitations on share ownershipreferred to in Article 3 of Decree Law 332/1994, ratified with amendments by Law474/1994, of major holdings, taken to mean holdings that, as specified by TreasuryMinister Decree of 24 March 1997, are equal to at least 3% of the share capitalrepresented by shares with a right to vote in ordinary shareholder’s meetings. Theobjection must be made within ten days of the date of the communication that thedirectors must send at the time of the application for entry in the shareholders’register if the Minister deems that the transaction is prejudicial to the vital interestsof the state. During the interval for the exercise of the right of objection the votingrights and any rights other than the property rights attaching to the shares thatrepresent the major holding shall be suspended. In the event of the exercise of theright of objection, by means of a measure giving the reasons in relation to the actualprejudice caused by the transaction to the vital interests of the state, the transfereemay not exercise the voting rights or any rights other than the property rightsattaching to the shares that represent the major holding and must sell the shareswithin one year. If this is not done, the Court, at the request of the Minister for theEconomy and Finance, shall order the sale of the shares representing the majorholding pursuant to the procedures established in Article 2359-ter of the Civil Code.The objection may be appealed within sixty days by the transferee before the LazioRegional Administrative Court;
b) to veto, giving the reasons in relation to the actual prejudice caused to the vitalinterests of the state, the adoption of resolutions to dissolve the Company, transferthe business, merge or divide the Company, transfer the registered office outsideItaly, change the corporate object, or amend these bylaws with a view to eliminatingor modifying the powers specified in this article. The veto may be appealed withinsixty days by the transferee before the Lazio Regional Administrative Court.
22.2 - The right of objection referred to in subparagraph a) may be exercised withreference to the cases specified in Article 4(228) of Law 350/2003. The special powersreferred to in subparagraphs a) and b) shall be exercised in conformity with the criteriaestablished by the decree issued by the President of the Council of Ministers on 10 June2004.
�� 12

EXHIBIT 12(a)
Certification by the Executive Deputy Chairman of Telecom Italia S.p.A., pursuantto Section 302 of the Sarbanes-Oxley Act of 2002
I, certify that:
1. I have reviewed this annual report on Form 20-F of Telecom Italia S.p.A.;
2. Based on my knowledge, this annual report does not contain any untrue statement of a material fact oromit to state a material fact necessary to make the statements made, in light of the circumstancesunder which such statements were made, not misleading with respect to the period covered by thisannual report;
3. Based on my knowledge, the financial statements, and other financial information included in thisannual report, fairly present in all material respects the financial condition, results of operations andcash flows of the registrants as of, and for, the periods presented in this annual report;
4. The company’s other certifying officers and I are responsible for establishing and maintaining disclosurecontrols and procedures (as defined in Exchange Act Rules 13a-15(e) and 15d-15(e)) and internalcontrol over financial reporting (as defined in Exchange Act Rules 13a-15(f) and 15d-15(f) for theregistrant and we have:
(a) designed such disclosure controls and procedures, or caused such disclosure controls andprocedures to be designed under our supervision to ensure that material information relating tothe registrant, including its consolidated subsidiaries, is made known to us by others within thoseentities, particularly during the period in which this annual report is being prepared;
(b) designed such internal control over financial reporting, or caused such internal control overfinancial reporting to be designed under our supervision, to provide reasonable assuranceregarding the reliability of financial reporting and the preparation of financial statements forexternal purposes in accordance with generally accepted accounting principles;
(c) evaluated the effectiveness of the company’s disclosure controls and procedures and presented inthis report our conclusions about the effectiveness of the disclosure controls and procedures, as ofthe end of the period covered by this report based on such evaluation; and
(d) disclosed in this report any change in the company’s internal control over financial reporting thatoccurred during the period covered by the annual report that has materially affected, or isreasonably likely to materially affect, the company’s internal control over financial reporting; and
5. The company’s other certifying officers and I have disclosed, based on our most recent evaluation ofinternal control over financial reporting, to the company’s auditors and the audit committee ofcompany’s board of directors (or persons performing the equivalent function):
(a) all significant deficiencies in the design or operation of internal control over financial reportingwhich are reasonably likely to adversely affect the company’s ability to record, process, summarizeand report financial data and have identified for the company’s auditors any material weaknessesin internal controls; and
(b) any fraud, whether or not material, that involves management or other employees who have asignificant role in the company’s internal control over financial reporting.
By: /s/ CARLO ORAZIO BUORA
Name: Carlo Orazio BuoraTitle: Executive Deputy Chairman
June 21, 2007

EXHIBIT 12(b)
Certification by the Chief Executive Officer of Telecom Italia S.p.A., pursuantto Section 302 of the Sarbanes-Oxley Act of 2002
I, certify that:
1. I have reviewed this annual report on Form 20-F of Telecom Italia S.p.A.;
2. Based on my knowledge, this annual report does not contain any untrue statement of a material fact oromit to state a material fact necessary to make the statements made, in light of the circumstancesunder which such statements were made, not misleading with respect to the period covered by thisannual report;
3. Based on my knowledge, the financial statements, and other financial information included in thisannual report, fairly present in all material respects the financial condition, results of operations andcash flows of the registrants as of, and for, the periods presented in this annual report;
4. The company’s other certifying officers and I are responsible for establishing and maintaining disclosurecontrols and procedures (as defined in Exchange Act Rules 13a-15(e) and 15d-15(e)) and internalcontrol over financial reporting (as defined in Exchange Act Rules 13a-15(f) and 15d-15(f) for theregistrant and we have:
(a) designed such disclosure controls and procedures, or caused such disclosure controls andprocedures to be designed under our supervision to ensure that material information relating tothe registrant, including its consolidated subsidiaries, is made known to us by others within thoseentities, particularly during the period in which this annual report is being prepared;
(b) designed such internal control over financial reporting, or caused such internal control overfinancial reporting to be designed under our supervision, to provide reasonable assuranceregarding the reliability of financial reporting and the preparation of financial statements forexternal purposes in accordance with generally accepted accounting principles;
(c) evaluated the effectiveness of the company’s disclosure controls and procedures and presented inthis report our conclusions about the effectiveness of the disclosure controls and procedures, as ofthe end of the period covered by this report based on such evaluation; and
(d) disclosed in this report any change in the company’s internal control over financial reporting thatoccurred during the period covered by the annual report that has materially affected, or isreasonably likely to materially affect, the company’s internal control over financial reporting; and
5. The company’s other certifying officers and I have disclosed, based on our most recent evaluation ofinternal control over financial reporting, to the company’s auditors and the audit committee ofcompany’s board of directors (or persons performing the equivalent function):
(a) all significant deficiencies in the design or operation of internal control over financial reportingwhich are reasonably likely to adversely affect the company’s ability to record, process, summarizeand report financial data and have identified for the company’s auditors any material weaknessesin internal controls; and
(b) any fraud, whether or not material, that involves management or other employees who have asignificant role in the company’s internal control over financial reporting.
By: /s/ RICCARDO RUGGIERO
Name: Riccardo RuggieroTitle: Chief Executive Officer
June 21, 2007

EXHIBIT 12(c)
Certification by the Head of Finance, Administration and Control of Telecom Italia S.p.A., pursuantto Section 302 of the Sarbanes-Oxley Act of 2002
I, certify that:
1. I have reviewed this annual report on Form 20-F of Telecom Italia S.p.A.;
2. Based on my knowledge, this annual report does not contain any untrue statement of a material fact oromit to state a material fact necessary to make the statements made, in light of the circumstancesunder which such statements were made, not misleading with respect to the period covered by thisannual report;
3. Based on my knowledge, the financial statements, and other financial information included in thisannual report, fairly present in all material respects the financial condition, results of operations andcash flows of the registrants as of, and for, the periods presented in this annual report;
4. The company’s other certifying officers and I are responsible for establishing and maintaining disclosurecontrols and procedures (as defined in Exchange Act Rules 13a-15(e) and 15d-15(e)) and internalcontrol over financial reporting (as defined in Exchange Act Rules 13a-15(f) and 15d-15(f) for theregistrant and we have:
(a) designed such disclosure controls and procedures, or caused such disclosure controls andprocedures to be designed under our supervision to ensure that material information relating tothe registrant, including its consolidated subsidiaries, is made known to us by others within thoseentities, particularly during the period in which this annual report is being prepared;
(b) designed such internal control over financial reporting, or caused such internal control overfinancial reporting to be designed under our supervision, to provide reasonable assuranceregarding the reliability of financial reporting and the preparation of financial statements forexternal purposes in accordance with generally accepted accounting principles;
(c) evaluated the effectiveness of the company’s disclosure controls and procedures and presented inthis report our conclusions about the effectiveness of the disclosure controls and procedures, as ofthe end of the period covered by this report based on such evaluation; and
(d) disclosed in this report any change in the company’s internal control over financial reporting thatoccurred during the period covered by the annual report that has materially affected, or isreasonably likely to materially affect, the company’s internal control over financial reporting; and
5. The company’s other certifying officers and I have disclosed, based on our most recent evaluation ofinternal control over financial reporting, to the company’s auditors and the audit committee ofcompany’s board of directors (or persons performing the equivalent function):
(a) all significant deficiencies in the design or operation of internal control over financial reportingwhich are reasonably likely to adversely affect the company’s ability to record, process, summarizeand report financial data and have identified for the company’s auditors any material weaknessesin internal controls; and
(b) any fraud, whether or not material, that involves management or other employees who have asignificant role in the company’s internal control over financial reporting.
By: /s/ ENRICO PARAZZINI
Name: Enrico ParazziniTitle: Chief Financial Officer
June 21, 2007

EXHIBIT 13.1
Certification pursuant to 18 U.S.C. Section 1350, as adopted pursuant to Section 906of the Sarbanes-Oxley Act of 2002
June 21, 2007
Securities and Exchange Commission450 Fifth Street, N.WWashington, D.C. 20549
Ladies and Gentlemen:
The certification set forth below is being submitted in connection with the Telecom Italia S.p.A. AnnualReport on Form 20-F for the year ended December 31, 2006, (the “Report”) for the purpose of complying withRule 13a-14(b) or Rule 15d-14(b) of the Securities Exchange Act of 1934 (the “Exchange Act”) and Section 1350of Chapter 63 of Title 18 of the United States Code.
Carlo Orazio Buora, the Executive Deputy Chairman and Riccardo Ruggiero, the Chief Executive Officer, andEnrico Parazzini, the Chief Financial Officer, of Telecom Italia S.p.A., each certifies that, to the best of hisknowledge:
1. the Report fully complies with the requirements of Section 13(a) or 15(d) of the Exchange Act; and
2. the information contained in the Report fairly presents, in all material respects, the financialcondition and results of operations of Telecom Italia S.p.A.
/s/ CARLO ORAZIO BUORA
Name: Carlo Orazio BuoraExecutive Deputy Chairman
/s/ RICCARDO RUGGIERO
Name: Riccardo RuggieroChief Executive Officer
/s/ ENRICO PARAZZINI
Name: Enrico ParazziniChief Financial Officer