taxi and private hire vehicle statistics: england 2020 - gov.uk
TRANSCRIPT
Statistical Release 16 December 2020
Taxi and Private Hire Vehicle Statistics, England: 2020
Responsible Statistician: Julie Sullivan Email: [email protected]
Further Information: Media: 020 7944 3066 Public: 020 7944 3077
About this releaseThis statistical release presents information on taxis and private hire vehicles in England as at 31 March 2020. This includes PHV operators and enlisted drivers who use app-based technology. However, we are not able to disaggregate which drivers are using these apps in the figures presented.
Figures are updated every year through surveying each licensing authority (a unitary or lower tier authority) in England and Wales.
This release refers to England only but data for Wales can be found online here.
In this publication
Factsheet 2
Summary table 3
Licensed vehicles 4
Licensed taxi and PHV drivers 7
Licensed PHV operators 8
Accessibility 9
Policies 10
Taxi drivers 12
Taxi passengers 14
Passenger satisfaction 17
Background notes 18
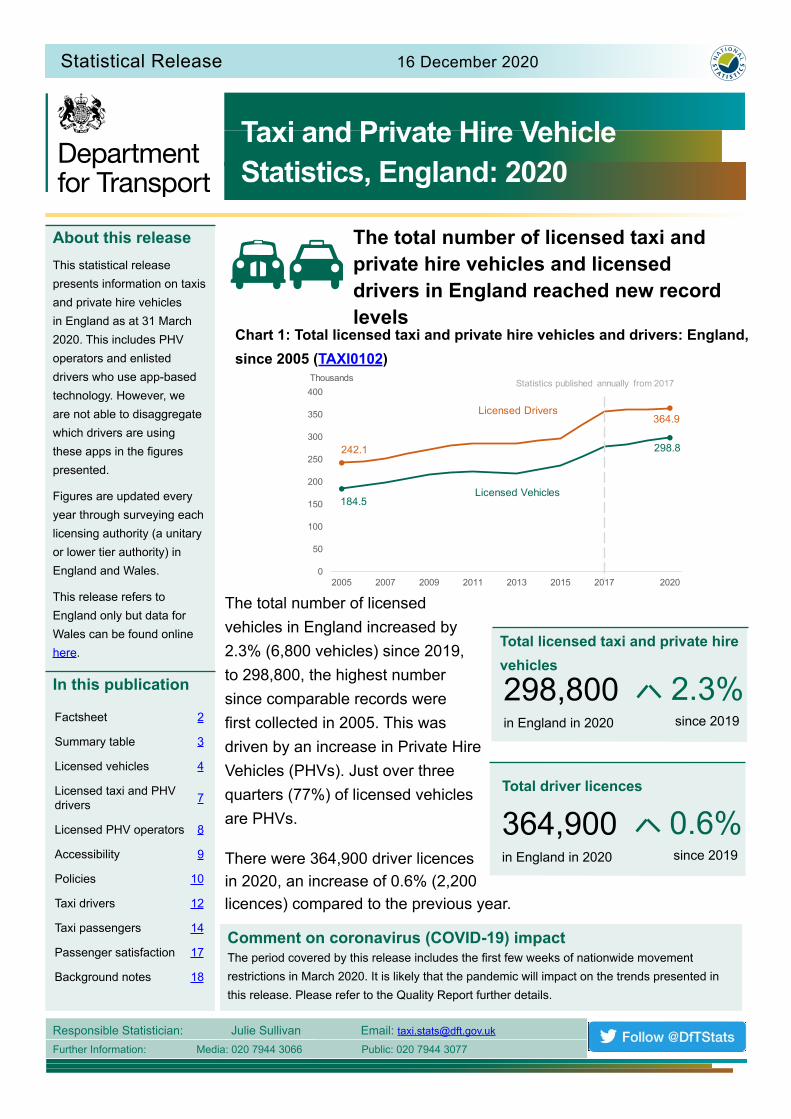
The total number of licensed taxi and private hire vehicles and licensed drivers in England reached new record levels
Chart 1: Total licensed taxi and private hire vehicles and drivers: England, since 2005 (TAXI0102)
242.1
364.9
184.5
298.8
0
50
100
150
200
250
300
350
400
2005 2007 2009 2011 2013 2015 2017 2020
Thousands Statistics published annually from 2017
Licensed Vehicles
Licensed Drivers
The total number of licensed vehicles in England increased by 2.3% (6,800 vehicles) since 2019, to 298,800, the highest number since comparable records were first collected in 2005. This was driven by an increase in Private Hire Vehicles (PHVs). Just over three quarters (77%) of licensed vehicles are PHVs.
in England in 2020
298,800 2.3%since 2019
Total licensed taxi and private hirevehicles
There were 364,900 driver licences in 2020, an increase of 0.6% (2,200 licences) compared to the previous year.
in England in 2020
364,900 0.6%since 2019
Total driver licences
Comment on coronavirus (COVID-19) impact The period covered by this release includes the first few weeks of nationwide movement restrictions in March 2020. It is likely that the pandemic will impact on the trends presented in this release. Please refer to the Quality Report further details.
Taxi and Private Hire Vehicle Statistics: England 2020 - Page 2
Licensed Vehicles
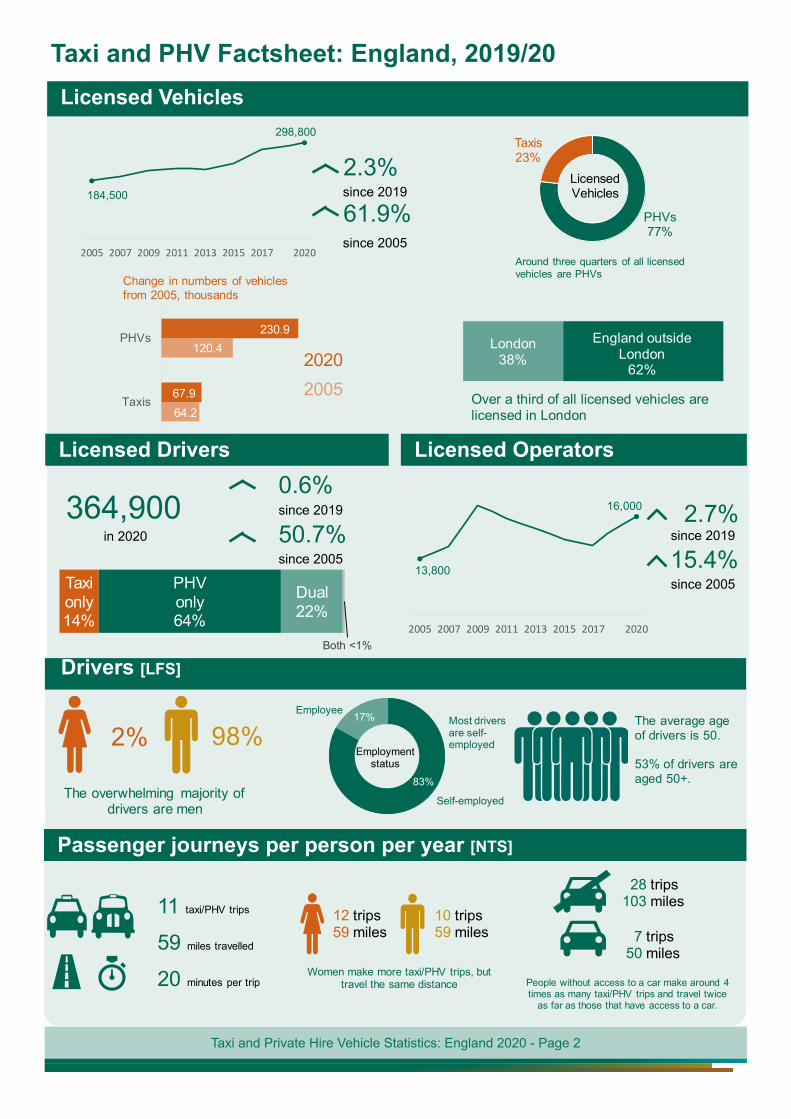
Taxi and PHV Factsheet: England, 2019/20
2005 2007 2009 2011 2013 2015 2017 2020
298,800
184,500
2.3%since 2019
since 2005
61.9% PHVs77%
Taxis23%
Licensed Vehicles
Around three quarters of all licensed vehicles are PHVs
64.2
120.4
67.9
230.9
Taxis
PHVs
Change in numbers of vehicles from 2005, thousands
20202005
London38%
England outside London
62%
Over a third of all licensed vehicles are licensed in London
Passenger journeys per person per year [NTS]
11 taxi/PHV trips
59 miles travelled
20 minutes per trip
10 trips59 miles
12 trips59 miles
Women make more taxi/PHV trips, but travel the same distance
28 trips103 miles
7 trips50 miles
People without access to a car make around 4 times as many taxi/PHV trips and travel twice
as far as those that have access to a car.
98%2%
The overwhelming majority of drivers are men
83%
17%
Self-employed
Employee
Employment status
Most drivers are self-employed
The average age of drivers is 50.
53% of drivers are aged 50+.
Licensed Drivers
since 2005in 2020
since 20190.6%
50.7%364,900
Drivers [LFS]
Taxi only14%
PHV only64%
Dual22%
Both <1%
Licensed Operators
2005 2007 2009 2011 2013 2015 2017 2020
16,000
13,800
2.7%
15.4%since 2019
since 2005
Taxi and Private Hire Vehicle Statistics: England 2020 - Page 3
Thousands
Total licensed vehicles 114.9 6.2% 183.9 0.1% 298.8 2.3%Taxis 19.0 -5.8% 48.9 -3.1% 67.9 -3.9%
wheelchair accessible taxis 19.0 -5.8% 20.0 -5.1% 38.9 -5.5%Private Hire Vehicles (PHVs) 96.0 8.9% 135.0 1.2% 230.9 4.3%
wheelchair accessible PHVs 0.6 3.1% 4.1 -1.8% 4.7 -1.2%Licensed PHV operators 2.1 -3.7% 13.8 3.8% 16.0 2.7%Total licensed drivers 134.0 3.1% 230.9 -0.8% 364.9 0.6%
Taxi only licences 22.4 -3.2% 27.5 -9.4% 49.9 -6.7%PHV-only licences 111.6 4.5% 121.9 1.6% 233.5 3.0%Dual licences 0.0 0.0% 79.0 -4.1% 79.0 -4.1%Both Taxi and PHV licences 0.0 .. .. 2.6 .. .. 2.6 .. ..
.. Not available prior to 2020
London England outside London EnglandMarch 2020 figure and percentage change compared to March 2019
Long term taxi trends
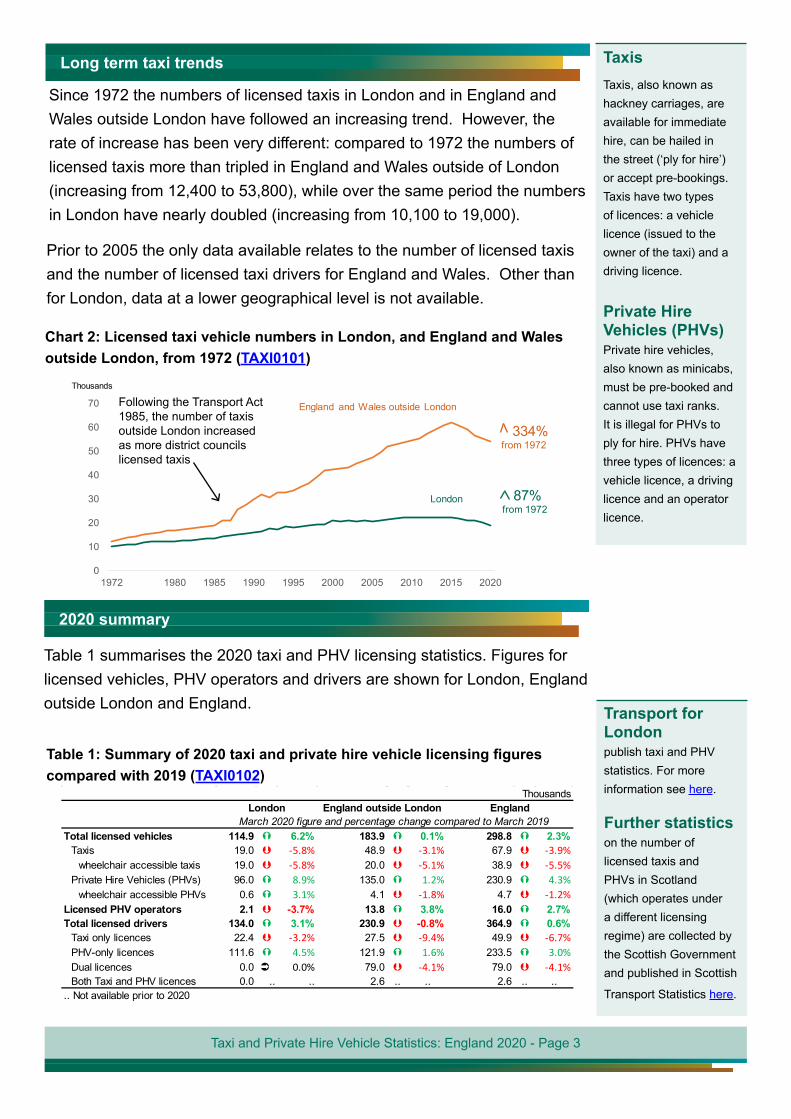
Since 1972 the numbers of licensed taxis in London and in England and Wales outside London have followed an increasing trend. However, the rate of increase has been very different: compared to 1972 the numbers of licensed taxis more than tripled in England and Wales outside of London (increasing from 12,400 to 53,800), while over the same period the numbers in London have nearly doubled (increasing from 10,100 to 19,000).
Prior to 2005 the only data available relates to the number of licensed taxis and the number of licensed taxi drivers for England and Wales. Other than for London, data at a lower geographical level is not available.
Chart 2: Licensed taxi vehicle numbers in London, and England and Wales outside London, from 1972 (TAXI0101)
Following the Transport Act 1985, the number of taxis outside London increased as more district councils licensed taxis
0
10
20
30
40
50
60
70
1972 1980 1985 1990 1995 2000 2005 2010 2015 2020
Thousands
London
334%from 1972
87%from 1972
England and Wales outside London
TaxisTaxis, also known as hackney carriages, are available for immediate hire, can be hailed in the street (‘ply for hire’) or accept pre-bookings. Taxis have two types of licences: a vehicle licence (issued to the owner of the taxi) and a driving licence.
Private Hire Vehicles (PHVs) Private hire vehicles, also known as minicabs, must be pre-booked and cannot use taxi ranks. It is illegal for PHVs to ply for hire. PHVs have three types of licences: a vehicle licence, a driving licence and an operator licence.
2020 summary
Table 1 summarises the 2020 taxi and PHV licensing statistics. Figures for licensed vehicles, PHV operators and drivers are shown for London, England outside London and England. Transport for
LondonTable 1: Summary of 2020 taxi and private hire vehicle licensing figures compared with 2019 (TAXI0102)
publish taxi and PHV statistics. For more information see here.
Further statisticson the number of licensed taxis and PHVs in Scotland (which operates under a different licensing regime) are collected by the Scottish Government and published in Scottish
Transport Statistics here.
Taxi and Private Hire Vehicle Statistics: England 2020 - Page 4
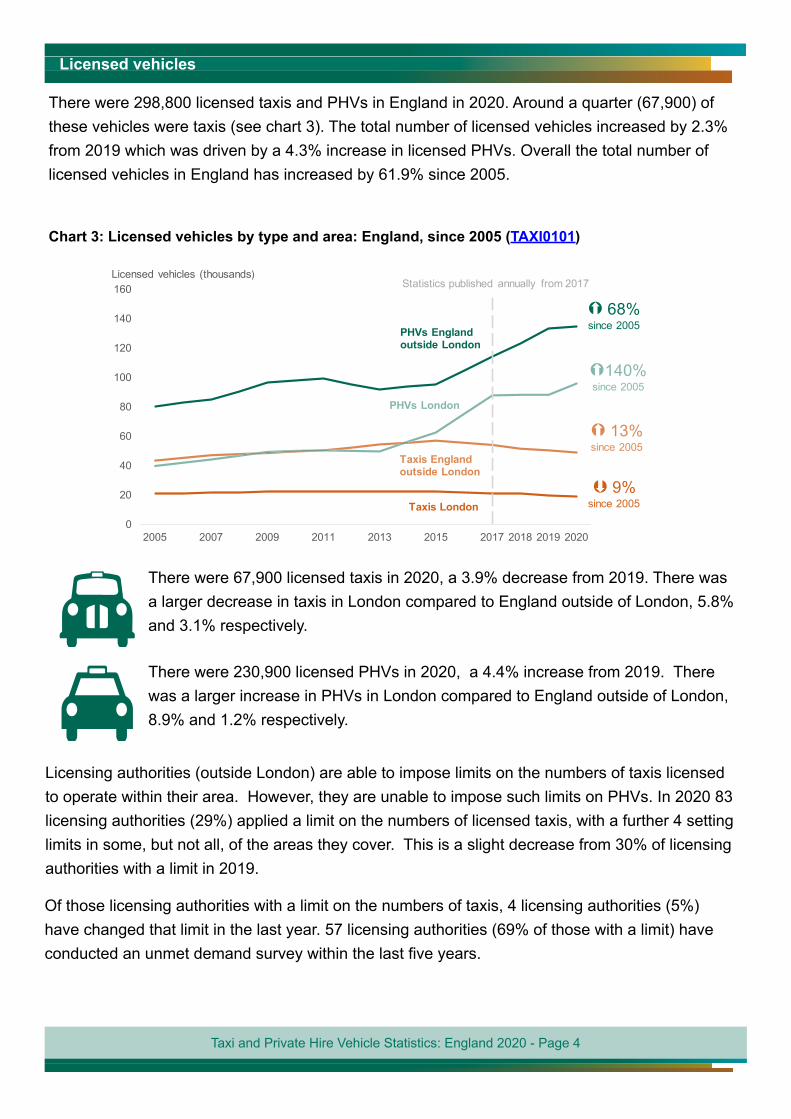
Licensed vehicles
There were 298,800 licensed taxis and PHVs in England in 2020. Around a quarter (67,900) of these vehicles were taxis (see chart 3). The total number of licensed vehicles increased by 2.3% from 2019 which was driven by a 4.3% increase in licensed PHVs. Overall the total number of licensed vehicles in England has increased by 61.9% since 2005.
Chart 3: Licensed vehicles by type and area: England, since 2005 (TAXI0101)
0
20
40
60
80
100
120
140
160
2005 2007 2009 2011 2013 2015 2017 2018 2019 2020
Licensed vehicles (thousands)
PHVs England outside London
Taxis London
68%since 2005
9%since 2005
Statistics published annually from 2017
There were 67,900 licensed taxis in 2020, a 3.9% decrease from 2019. There was a larger decrease in taxis in London compared to England outside of London, 5.8% and 3.1% respectively.
There were 230,900 licensed PHVs in 2020, a 4.4% increase from 2019. There was a larger increase in PHVs in London compared to England outside of London, 8.9% and 1.2% respectively.
Licensing authorities (outside London) are able to impose limits on the numbers of taxis licensed to operate within their area. However, they are unable to impose such limits on PHVs. In 2020 83 licensing authorities (29%) applied a limit on the numbers of licensed taxis, with a further 4 setting limits in some, but not all, of the areas they cover. This is a slight decrease from 30% of licensing authorities with a limit in 2019.
Of those licensing authorities with a limit on the numbers of taxis, 4 licensing authorities (5%) have changed that limit in the last year. 57 licensing authorities (69% of those with a limit) have conducted an unmet demand survey within the last five years.
Taxi and Private Hire Vehicle Statistics: England 2020 - Page 5
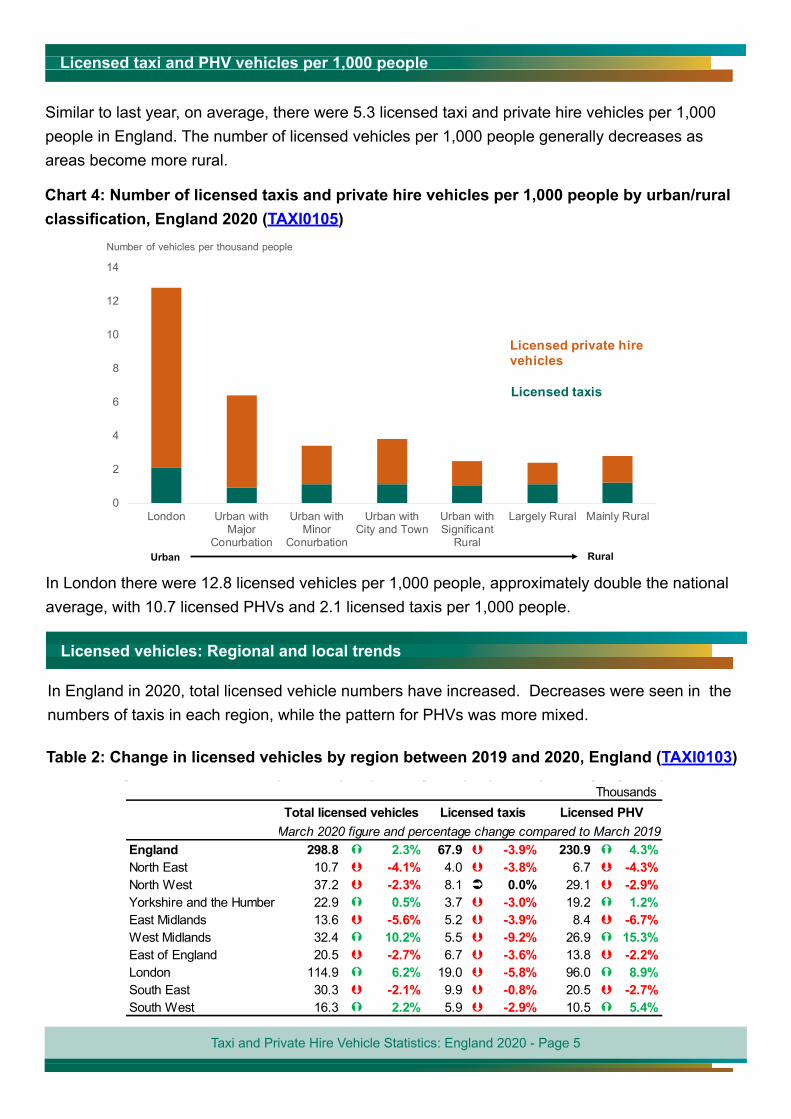
Licensed taxi and PHV vehicles per 1,000 people
Similar to last year, on average, there were 5.3 licensed taxi and private hire vehicles per 1,000 people in England. The number of licensed vehicles per 1,000 people generally decreases as areas become more rural.
Chart 4: Number of licensed taxis and private hire vehicles per 1,000 people by urban/rural classification, England 2020 (TAXI0105)
0
2
4
6
8
10
12
14
London Urban withMajor
Conurbation
Urban withMinor
Conurbation
Urban withCity and Town
Urban withSignificant
Rural
Largely Rural Mainly Rural
Number of vehicles per thousand people
Urban Rural
Licensed taxis
Licensed private hire vehicles
In London there were 12.8 licensed vehicles per 1,000 people, approximately double the national average, with 10.7 licensed PHVs and 2.1 licensed taxis per 1,000 people.
Licensed vehicles: Regional and local trends
In England in 2020, total licensed vehicle numbers have increased. Decreases were seen in the numbers of taxis in each region, while the pattern for PHVs was more mixed.
Table 2: Change in licensed vehicles by region between 2019 and 2020, England (TAXI0103)
Thousands
England 298.8 2.3% 67.9 -3.9% 230.9 4.3%North East 10.7 -4.1% 4.0 -3.8% 6.7 -4.3%North West 37.2 -2.3% 8.1 0.0% 29.1 -2.9%Yorkshire and the Humber 22.9 0.5% 3.7 -3.0% 19.2 1.2%East Midlands 13.6 -5.6% 5.2 -3.9% 8.4 -6.7%West Midlands 32.4 10.2% 5.5 -9.2% 26.9 15.3%East of England 20.5 -2.7% 6.7 -3.6% 13.8 -2.2%London 114.9 6.2% 19.0 -5.8% 96.0 8.9%South East 30.3 -2.1% 9.9 -0.8% 20.5 -2.7%South West 16.3 2.2% 5.9 -2.9% 10.5 5.4%
Licensed PHVMarch 2020 figure and percentage change compared to March 2019Total licensed vehicles Licensed taxis
Taxi and Private Hire Vehicle Statistics: England 2020 - Page 6
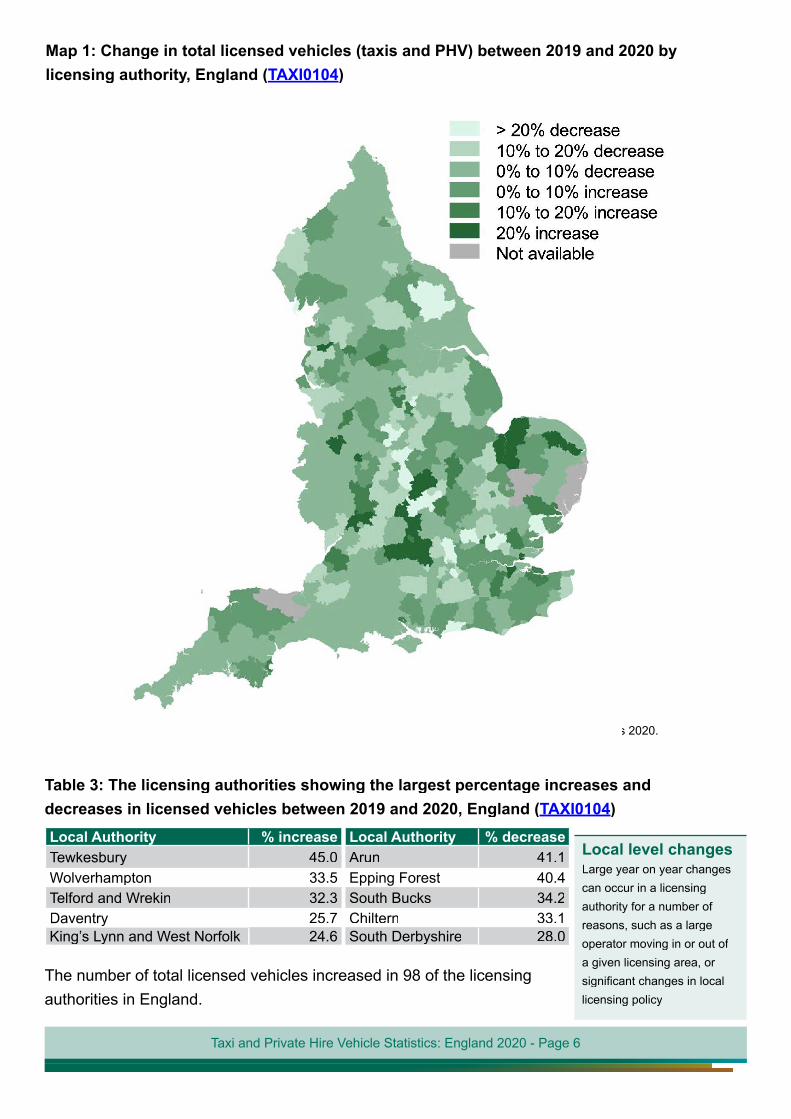
Map 1: Change in total licensed vehicles (taxis and PHV) between 2019 and 2020 by licensing authority, England (TAXI0104)
Contains Ordnance Survey Data © Crown Copyright and database rights 2020. Contains Ordnance Survey Data © Crown Copyright and database rights 2020. Contains Ordnance Survey Data © Crown Copyright and database rights 2020. Ordnance Survey Licence Number 100039241Ordnance Survey Licence Number 100039241
Table 3: The licensing authorities showing the largest percentage increases and decreases in licensed vehicles between 2019 and 2020, England (TAXI0104)Local Authority % increase Local Authority % decreaseTewkesbury 45.0 Arun45.0 Arun 41.1Wolverhampton 33.5 Epping Forest33.5 Epping Forest 40.4Telford and Wrekin 32.3 South Bucks32.3 South Bucks 34.2Daventry 25.7 Chiltern25.7 Chiltern 33.1King’s Lynn and West Norfolk 24.6 South DerbyshireKing’s Lynn and West Norfolk 24.6 South DerbyshireKing’s Lynn and West Norfolk 24.6 South Derbyshire 28.0
The number of total licensed vehicles increased in 98 of the licensing authorities in England.
Local level changes Large year on year changes can occur in a licensing authority for a number of reasons, such as a large operator moving in or out of a given licensing area, or significant changes in local licensing policy
Taxi and Private Hire Vehicle Statistics: England 2020 - Page 7
Thousands
England 364.9 0.6% 49.9 -6.7% 233.5 3.0% 79.0 -4.1%North East 13.3 -7.8% 3.4 -0.6% 6.9 -10.5% 2.9 -12.3%North West 47.8 -2.0% 8.5 -14.9% 30.1 -0.7% 7.7 -8.5%Yorkshire and the Humber 28.7 -3.2% 2.3 -13.9% 15.6 -3.3% 10.2 -5.4%East Midlands 17.7 1.2% 1.0 -8.7% 4.0 -2.2% 12.8 3.1%West Midlands 42.4 9.1% 3.2 -6.9% 29.4 15.9% 9.8 -2.4%East of England 23.7 -5.2% 1.7 -8.0% 7.8 -3.4% 14.2 -5.8%London 134.0 3.1% 22.4 -3.2% 111.6 4.5% 0.0 0.0%South East 38.2 -3.0% 4.1 -5.4% 19.2 -1.6% 14.8 -4.6%South West 19.0 -0.4% 3.3 -7.3% 8.8 1.2% 6.6 -2.9%1. The components may not sum to the total as this table excludes the numbers holding both a taxi and PHV licence
March 2020 figure and percentage change compared to March 2019Total driver licences1 Taxi driver licences PHV driver licences Dual driver licences
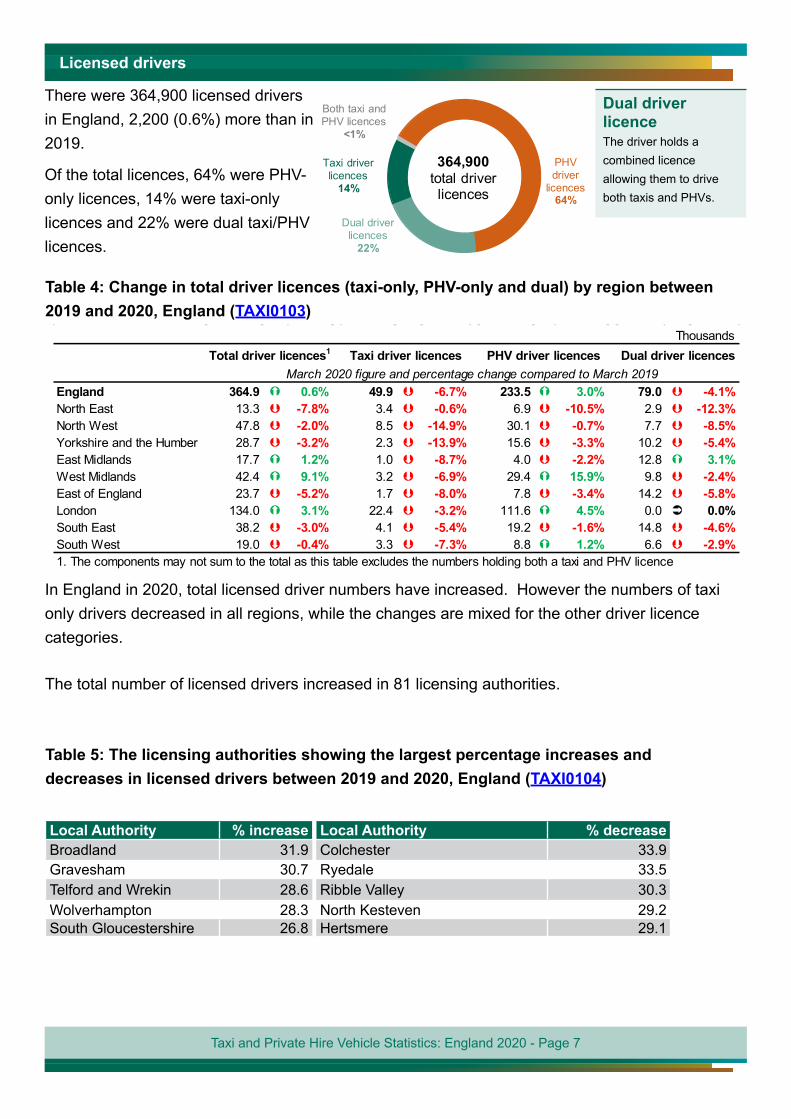
There were 364,900 licensed drivers in England, 2,200 (0.6%) more than in 2019.
Of the total licences, 64% were PHV-only licences, 14% were taxi-only licences and 22% were dual taxi/PHV licences.
Licensed drivers
Table 4: Change in total driver licences (taxi-only, PHV-only and dual) by region between 2019 and 2020, England (TAXI0103)
Dual driver licence The driver holds a combined licence allowing them to drive both taxis and PHVs.
364,900total driver licences
PHV driver
licences 64%
Taxi driver licences
14%
Both taxi and PHV licences
<1%
In England in 2020, total licensed driver numbers have increased. However the numbers of taxi only drivers decreased in all regions, while the changes are mixed for the other driver licence categories.
The total number of licensed drivers increased in 81 licensing authorities.
Table 5: The licensing authorities showing the largest percentage increases and decreases in licensed drivers between 2019 and 2020, England (TAXI0104)
Local Authority % increase Local Authority % decreaseBroadland 31.9 Colchester 33.9Gravesham 30.7 Ryedale 33.5Telford and Wrekin 28.6 Ribble Valley 30.3Wolverhampton 28.3 North Kesteven 29.2South Gloucestershire 26.8 Hertsmere 29.1
Taxi and Private Hire Vehicle Statistics: England 2020 - Page 8
Licensed PHV operators
The number of licensed PHV operators increased by 2.7% to 16,000 from the previous year. This was still 3.3% lower than the peak in PHV operators at 16,500 in 2009. PHV operators declined by 3.7% to 2,100 operators in London and increased by 3.8% to 13,800 operators in England outside London.
Private Hire Vehicle operators accept bookings and they are the company with whom the customer makes a contract for carriage.
in 202013,800 3.8%
since 2019
Total licensed PHV operators in England outside London
in 20202,100 3.7%
since 2019
Total licensed PHV operators in London
In the year ending 31 March 2020, 2,100 applications were made by new PHV operators (either new companies, or existing operators not already licensed by that licensing authority).
Table 6: Summary of PHV operator applications in the year ending 31 March 2020 (TAXI0111)
Number of new operator applications
Number of renewal operator
applications Number of operator applications refused
as at 31 March 2020
England 15,966 2,139 4,669 19 8 68London 2,124 202 283 6 0 49England outside of London 13,842 1,937 4,386 13 8 19
Operator applications
in the year ending 31 March 2020
Total number of operator licences
Number of operator licences
suspended
Number of operator licences revoked
In the year ending 31 March 2020, across all of England 68 operator licences were revoked, 8 were suspended, and 19 applications were refused.
Taxi and Private Hire Vehicle Statistics: England 2020 - Page 9
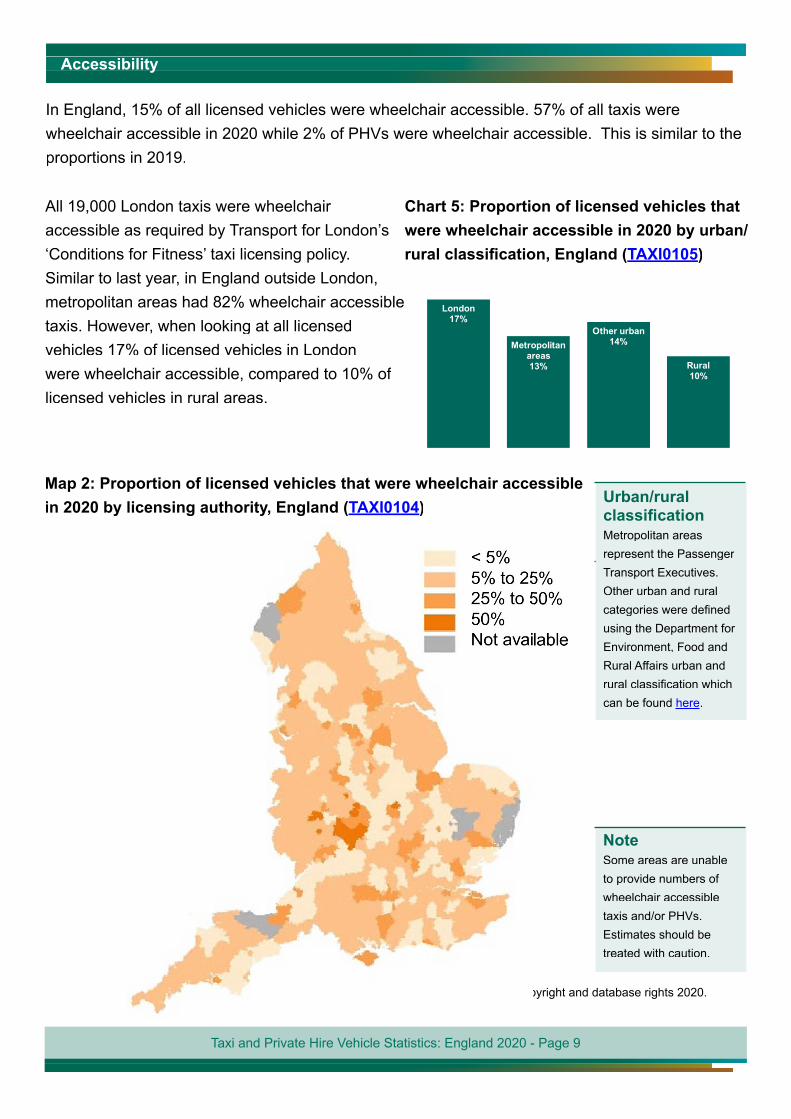
Accessibility
In England, 15% of all licensed vehicles were wheelchair accessible. 57% of all taxis were wheelchair accessible in 2020 while 2% of PHVs were wheelchair accessible. This is similar to the proportions in 2019.
All 19,000 London taxis were wheelchair accessible as required by Transport for London’s ‘Conditions for Fitness’ taxi licensing policy. Similar to last year, in England outside London, metropolitan areas had 82% wheelchair accessible taxis. However, when looking at all licensed vehicles 17% of licensed vehicles in London were wheelchair accessible, compared to 10% of licensed vehicles in rural areas.
Chart 5: Proportion of licensed vehicles that were wheelchair accessible in 2020 by urban/rural classification, England (TAXI0105)
London17%
Metropolitan areas13%
Other urban14%
Rural10%
Map 2: Proportion of licensed vehicles that were wheelchair accessible in 2020 by licensing authority, England (TAXI0104) Urban/rural
classificationMetropolitan areas represent the Passenger Transport Executives. Other urban and rural categories were defined using the Department for Environment, Food and Rural Affairs urban and rural classification which can be found here.
NoteSome areas are unable to provide numbers of wheelchair accessible taxis and/or PHVs. Estimates should be treated with caution.
Contains Ordnance Survey Data © Crown Copyright and database rights 2020.Contains Ordnance Survey Data © Crown Copyright and database rights 2020.Ordnance Survey Licence Number 100039241
Taxi and Private Hire Vehicle Statistics: England 2020 - Page 10
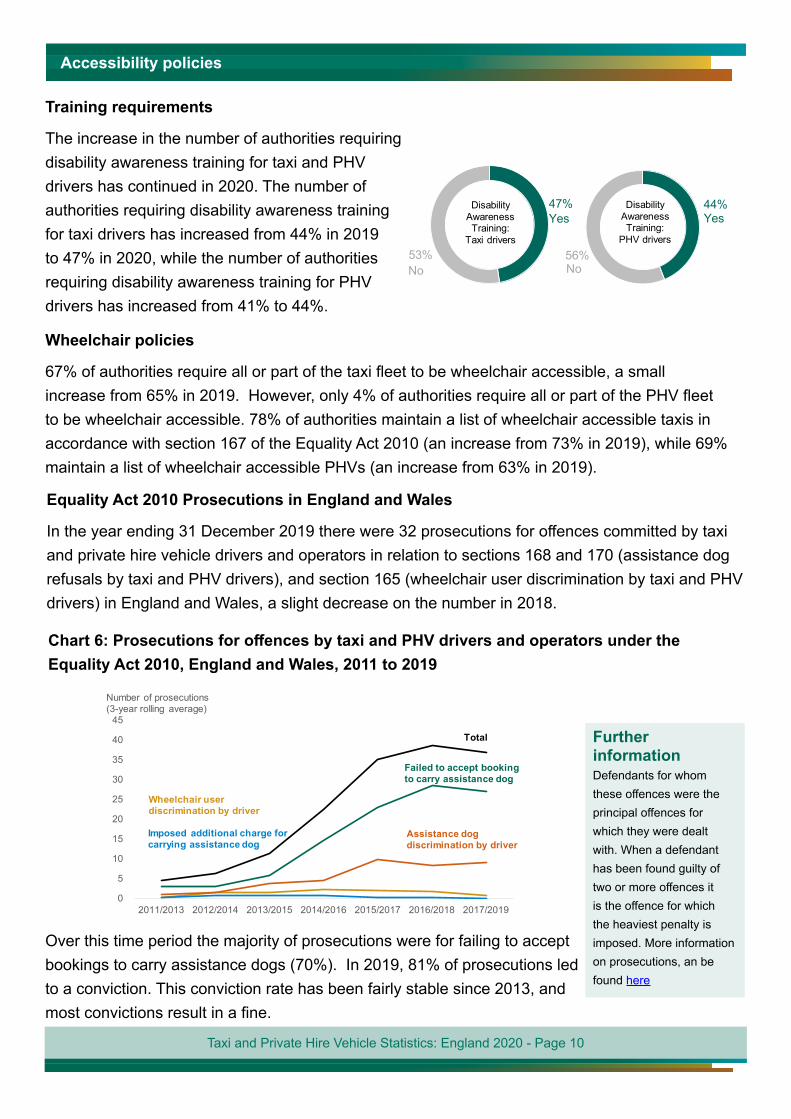
Accessibility policies
Training requirements
The increase in the number of authorities requiring disability awareness training for taxi and PHV drivers has continued in 2020. The number of authorities requiring disability awareness training for taxi drivers has increased from 44% in 2019 to 47% in 2020, while the number of authorities requiring disability awareness training for PHV drivers has increased from 41% to 44%.
44%
56%
Disability Awareness Training:
PHV drivers
47%
53%
Disability Awareness Training:
Taxi drivers
No
Yes
No
Yes
Wheelchair policies
67% of authorities require all or part of the taxi fleet to be wheelchair accessible, a small increase from 65% in 2019. However, only 4% of authorities require all or part of the PHV fleet to be wheelchair accessible. 78% of authorities maintain a list of wheelchair accessible taxis in accordance with section 167 of the Equality Act 2010 (an increase from 73% in 2019), while 69% maintain a list of wheelchair accessible PHVs (an increase from 63% in 2019).
Equality Act 2010 Prosecutions in England and Wales
In the year ending 31 December 2019 there were 32 prosecutions for offences committed by taxi and private hire vehicle drivers and operators in relation to sections 168 and 170 (assistance dog refusals by taxi and PHV drivers), and section 165 (wheelchair user discrimination by taxi and PHV drivers) in England and Wales, a slight decrease on the number in 2018.
Chart 6: Prosecutions for offences by taxi and PHV drivers and operators under the Equality Act 2010, England and Wales, 2011 to 2019
0
5
10
15
20
25
30
35
40
45
2011/2013 2012/2014 2013/2015 2014/2016 2015/2017 2016/2018 2017/2019
Failed to accept booking to carry assistance dog
Assistance dog discrimination by driver
Wheelchair user discrimination by driver
Imposed additional charge for carrying assistance dog
Number of prosecutions(3-year rolling average)
Total
Over this time period the majority of prosecutions were for failing to accept bookings to carry assistance dogs (70%). In 2019, 81% of prosecutions led to a conviction. This conviction rate has been fairly stable since 2013, and most convictions result in a fine.
Further informationDefendants for whom these offences were the principal offences for which they were dealt with. When a defendant has been found guilty of two or more offences it is the offence for which the heaviest penalty is imposed. More information on prosecutions, an be found here
Taxi and Private Hire Vehicle Statistics: England 2020 - Page 11
Safeguarding policies
Over three quarters of authorities required taxi drivers (83% or 234 out of 282) and PHV drivers (83% or 236 out of 284) to complete child sexual abuse (CSA) or child sexual exploitation (CSE) training. These proportions have increased from 78% in 2019 and 71% in 2018. 43% of licensing authorities require both CSA/CSE training and county lines training.
Chart 7: Number of authorities requiring child sexual abuse/child sexual awareness training and county lines training, England 2020 (TAXI0109)
0
20
40
60
80
100
120
140
Both CSA/CSE only No safeguarding
Taxi drivers
PHV drivers
Further information The total number of English licensing authorities may not always be 284 as some authorities were not required to provide a response or did not answer the question.
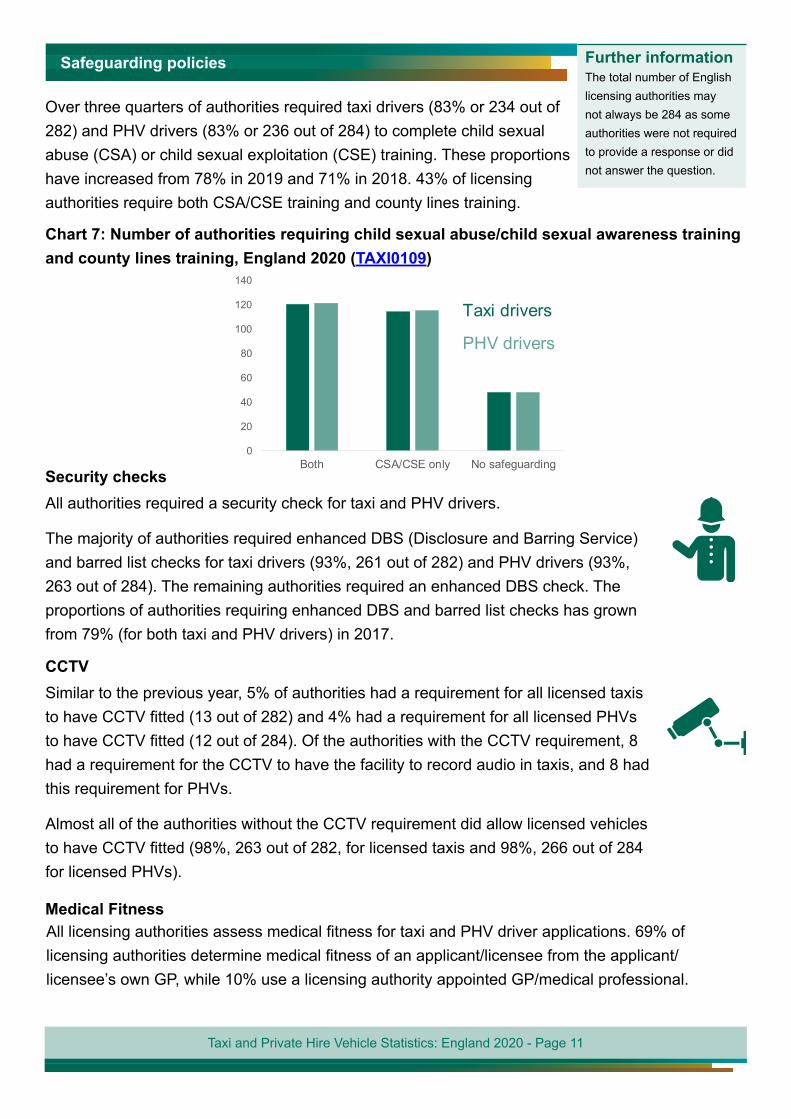
Security checks All authorities required a security check for taxi and PHV drivers.
The majority of authorities required enhanced DBS (Disclosure and Barring Service) and barred list checks for taxi drivers (93%, 261 out of 282) and PHV drivers (93%, 263 out of 284). The remaining authorities required an enhanced DBS check. The proportions of authorities requiring enhanced DBS and barred list checks has grown from 79% (for both taxi and PHV drivers) in 2017.
CCTVSimilar to the previous year, 5% of authorities had a requirement for all licensed taxis to have CCTV fitted (13 out of 282) and 4% had a requirement for all licensed PHVs to have CCTV fitted (12 out of 284). Of the authorities with the CCTV requirement, 8 had a requirement for the CCTV to have the facility to record audio in taxis, and 8 had this requirement for PHVs.
Almost all of the authorities without the CCTV requirement did allow licensed vehicles to have CCTV fitted (98%, 263 out of 282, for licensed taxis and 98%, 266 out of 284 for licensed PHVs).
Medical FitnessAll licensing authorities assess medical fitness for taxi and PHV driver applications. 69% of licensing authorities determine medical fitness of an applicant/licensee from the applicant/licensee’s own GP, while 10% use a licensing authority appointed GP/medical professional.
Taxi and Private Hire Vehicle Statistics: England 2020 - Page 12
Taxi drivers
The Labour Force Survey collects information about individuals in the labour market. The data can be used to provide insight into taxi and PHV drivers.
Labour Force Survey The Labour Force Survey (LFS) is a large study of the employment circumstances of the UK population, run by the Office for National Statistics (ONS). More information can be found here.
Licences vs. drivers The majority of this release talks about licences held, rather than drivers. Since the respondent self-reports their current occupation, it is possible for a person to hold a licence and not work as a driver, or for a person to not hold a licence but still claim to work as a driver.
There were an estimated 171,000 drivers operating in England during 2019/20, which is 20% lower than 2018/19 (214,000) and 12.0% lower than ten years ago (194,000 in 2009/10).
Chart 9: Number of “Taxi and cab drivers and chauffeurs”, England, 2008/09 to 2019/20 (Labour Force Survey)
0
50,000
100,000
150,000
200,000
250,000
2009 2010 2011 2012 2013 2014 2015 2016 2017 2018 2019 2020
Who drives taxis?The majority of drivers were male (98%) in 2019/20. These proportions are similar to the previous year.
2%98%
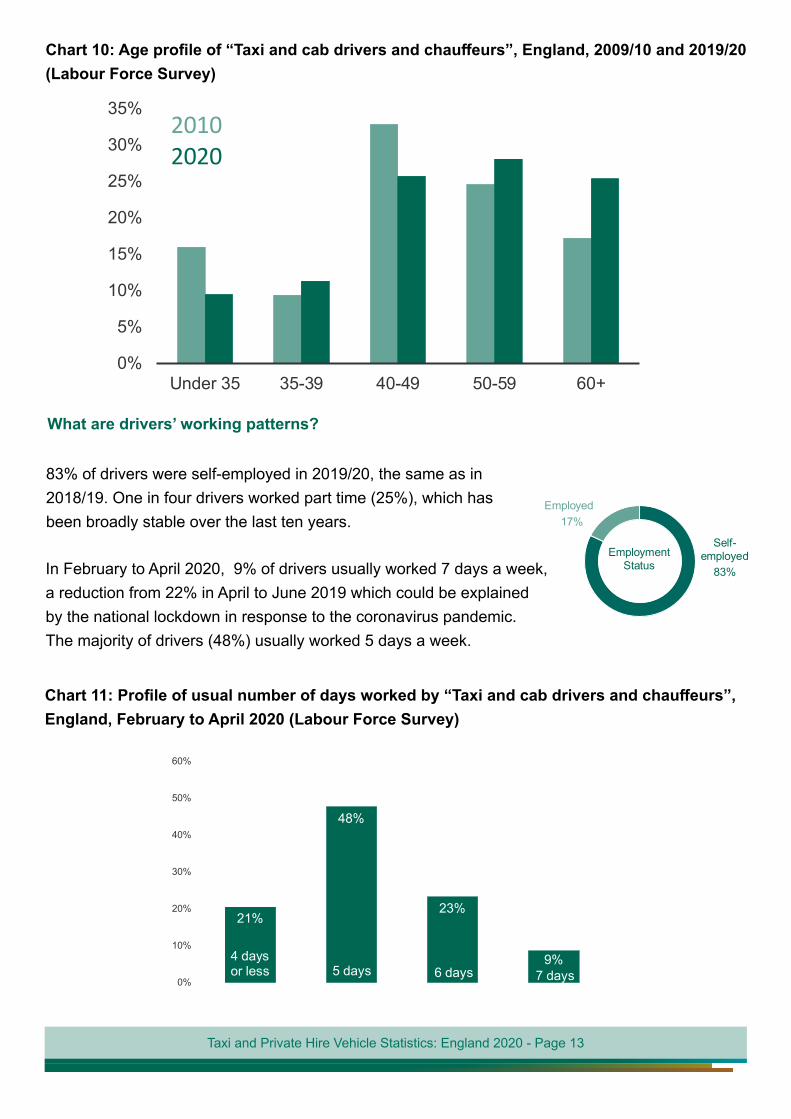
Similar to last year, the average age of a driver was 50 years old, with 21% of drivers being aged under 40. Those aged 60 or over made up 25% of drivers. There has been a slight shift in the age profile of drivers over the past ten years, with a slightly smaller proportion of younger drivers and a slightly larger proportion of older drivers.
The two main ethnic groups of drivers were White and Asian or Asian British in 2019/20, making up 52% and 37% of drivers respectively. This compares to 63% and 29% respectively in 2009/10. There was an increase in the proportion of non-UK nationals working as drivers in England, rising from 13% in 2009/10 to 26% in 2019/20.
Drivers The drivers in this section are defined using the Standard occupational classification system, SOC 2010, as “Taxi and cab drivers and chauffeurs” (code 8214), which will contain taxi drivers, PHV drivers and chauffeurs. The respondent reports their occupation to the interviewer and is then classified in this way during the interview, so the exact occupation of each respondent cannot be determined.
Taxi and Private Hire Vehicle Statistics: England 2020 - Page 13
Chart 10: Age profile of “Taxi and cab drivers and chauffeurs”, England, 2009/10 and 2019/20 (Labour Force Survey)
0%
5%
10%
15%
20%
25%
30%
35%
Under 35 35-39 40-49 50-59 60+
20102020
What are drivers’ working patterns?
83% of drivers were self-employed in 2019/20, the same as in 2018/19. One in four drivers worked part time (25%), which has been broadly stable over the last ten years.
In February to April 2020, 9% of drivers usually worked 7 days a week, a reduction from 22% in April to June 2019 which could be explained by the national lockdown in response to the coronavirus pandemic. The majority of drivers (48%) usually worked 5 days a week.
83%
17%
Employment Status
Employed
Self-employed
Chart 11: Profile of usual number of days worked by “Taxi and cab drivers and chauffeurs”, England, February to April 2020 (Labour Force Survey)
21%
48%
23%
9%0%
10%
20%
30%
40%
50%
60%
4 days or less 5 days 6 days 7 days
Taxi and Private Hire Vehicle Statistics: England 2020 - Page 14
Taxi passengers
The National Travel Survey (NTS) gathers data on personal travel behaviour across England. Data from the NTS can be used to analyse the users of taxis and PHVs. Note that exploring the specific use of either taxis or PHVs, or the use of any app-based technology to enlist drivers, will be not be possible from this data source.
National Travel SurveyThe National Travel Survey is a household survey carried out on over 16,000 individuals in England every year. The results in this release will be based on the 2019 results. For more information see here.
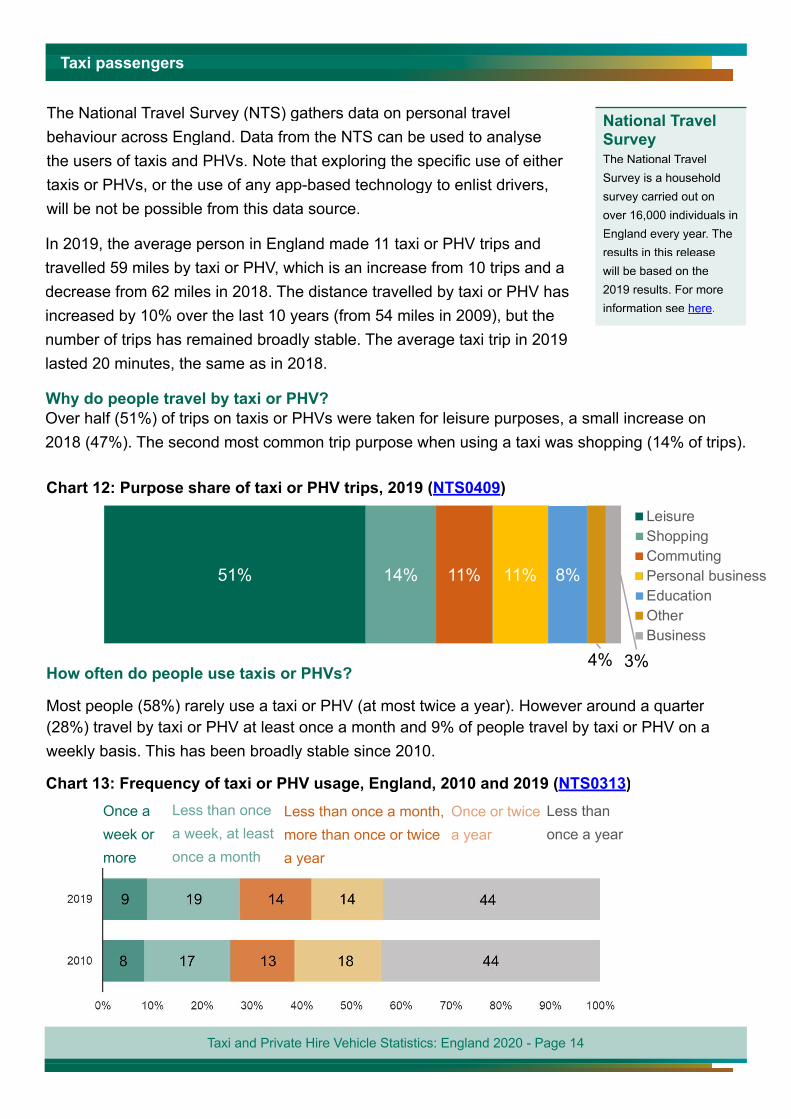
In 2019, the average person in England made 11 taxi or PHV trips and travelled 59 miles by taxi or PHV, which is an increase from 10 trips and a decrease from 62 miles in 2018. The distance travelled by taxi or PHV has increased by 10% over the last 10 years (from 54 miles in 2009), but the number of trips has remained broadly stable. The average taxi trip in 2019 lasted 20 minutes, the same as in 2018.
Why do people travel by taxi or PHV?Over half (51%) of trips on taxis or PHVs were taken for leisure purposes, a small increase on 2018 (47%). The second most common trip purpose when using a taxi was shopping (14% of trips).
Chart 12: Purpose share of taxi or PHV trips, 2019 (NTS0409)
51% 14% 11% 11% 8%
4% 3%
LeisureShoppingCommutingPersonal businessEducationOtherBusiness
How often do people use taxis or PHVs?
Most people (58%) rarely use a taxi or PHV (at most twice a year). However around a quarter (28%) travel by taxi or PHV at least once a month and 9% of people travel by taxi or PHV on a weekly basis. This has been broadly stable since 2010.
Chart 13: Frequency of taxi or PHV usage, England, 2010 and 2019 (NTS0313)
week or more
a week, at least once a month
more than once or twice a year
a year once a yearOnce a Less than once Less than once a month, Once or twice Less than
Taxi and Private Hire Vehicle Statistics: England 2020 - Page 15
Who uses taxis?
Mobility difficulties
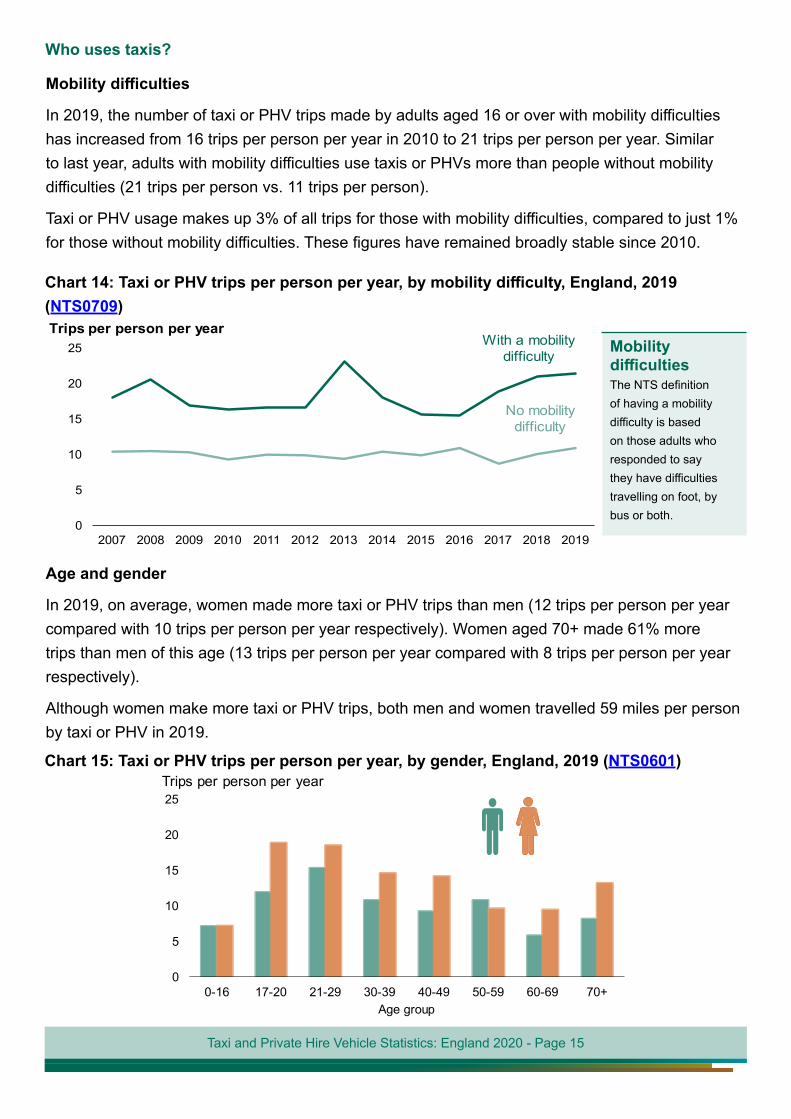
In 2019, the number of taxi or PHV trips made by adults aged 16 or over with mobility difficulties has increased from 16 trips per person per year in 2010 to 21 trips per person per year. Similar to last year, adults with mobility difficulties use taxis or PHVs more than people without mobility difficulties (21 trips per person vs. 11 trips per person).
Taxi or PHV usage makes up 3% of all trips for those with mobility difficulties, compared to just 1% for those without mobility difficulties. These figures have remained broadly stable since 2010.
Mobility difficultiesThe NTS definition of having a mobility difficulty is based on those adults who responded to say they have difficulties travelling on foot, by bus or both.
Chart 14: Taxi or PHV trips per person per year, by mobility difficulty, England, 2019 (NTS0709)
2007 2008 2009 2010 2011 2012 2013 2014 2015 2016 2017 2018 20190
5
10
15
20
25Trips per person per year
With a mobility difficulty
No mobility difficulty
Age and gender
In 2019, on average, women made more taxi or PHV trips than men (12 trips per person per year compared with 10 trips per person per year respectively). Women aged 70+ made 61% more trips than men of this age (13 trips per person per year compared with 8 trips per person per year respectively).
Although women make more taxi or PHV trips, both men and women travelled 59 miles per person by taxi or PHV in 2019.
Chart 15: Taxi or PHV trips per person per year, by gender, England, 2019 (NTS0601)
0-16 17-20 21-29 30-39 40-49 50-59 60-69 70+0
5
10
15
20
25
Age group
Trips per person per year
Taxi and Private Hire Vehicle Statistics: England 2020 - Page 16
Car access
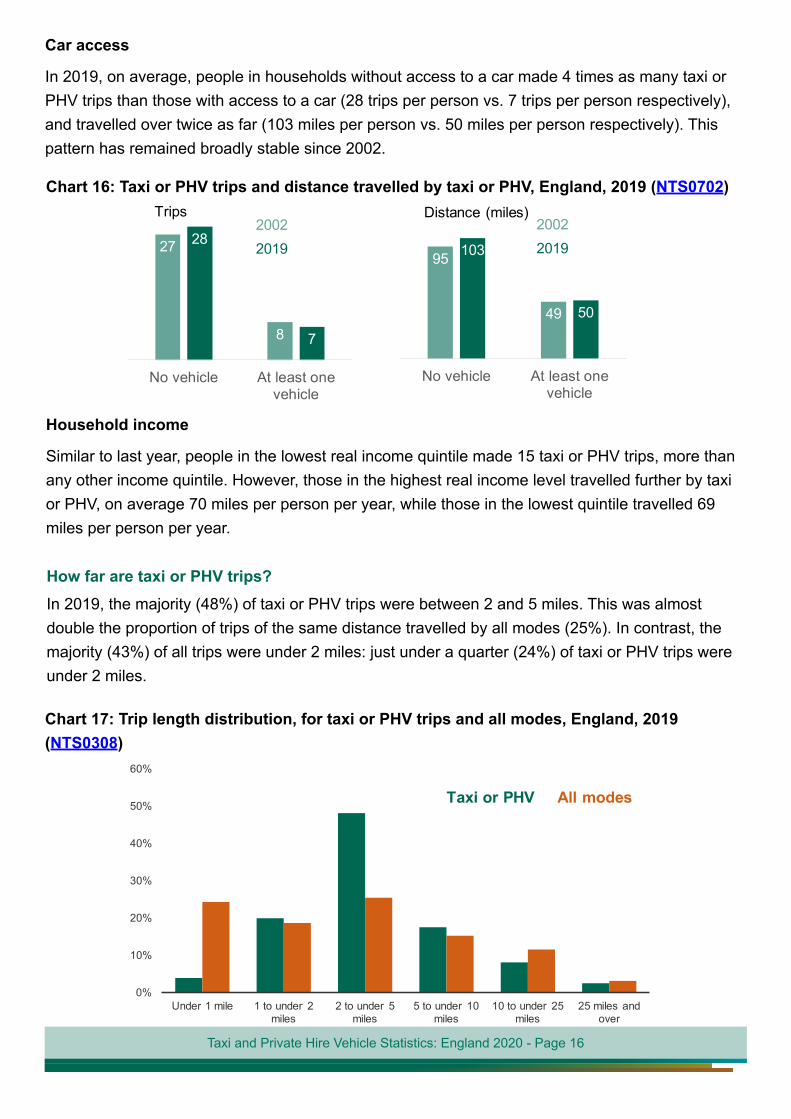
In 2019, on average, people in households without access to a car made 4 times as many taxi or PHV trips than those with access to a car (28 trips per person vs. 7 trips per person respectively), and travelled over twice as far (103 miles per person vs. 50 miles per person respectively). This pattern has remained broadly stable since 2002.
Chart 16: Taxi or PHV trips and distance travelled by taxi or PHV, England, 2019 (NTS0702)
27
8
28
7
No vehicle At least onevehicle
20022019
95
49
103
50
No vehicle At least onevehicle
20022019
Trips Distance (miles)
Household income
Similar to last year, people in the lowest real income quintile made 15 taxi or PHV trips, more than any other income quintile. However, those in the highest real income level travelled further by taxi or PHV, on average 70 miles per person per year, while those in the lowest quintile travelled 69 miles per person per year.
How far are taxi or PHV trips?In 2019, the majority (48%) of taxi or PHV trips were between 2 and 5 miles. This was almost double the proportion of trips of the same distance travelled by all modes (25%). In contrast, the majority (43%) of all trips were under 2 miles: just under a quarter (24%) of taxi or PHV trips were under 2 miles.
Chart 17: Trip length distribution, for taxi or PHV trips and all modes, England, 2019 (NTS0308)
Under 1 mile 1 to under 2 miles
2 to under 5 miles
5 to under 10 miles
10 to under 25 miles
25 miles and over
0%
10%
20%
30%
40%
50%
60%
Taxi or PHV All modes
Taxi and Private Hire Vehicle Statistics: England 2020 - Page 17
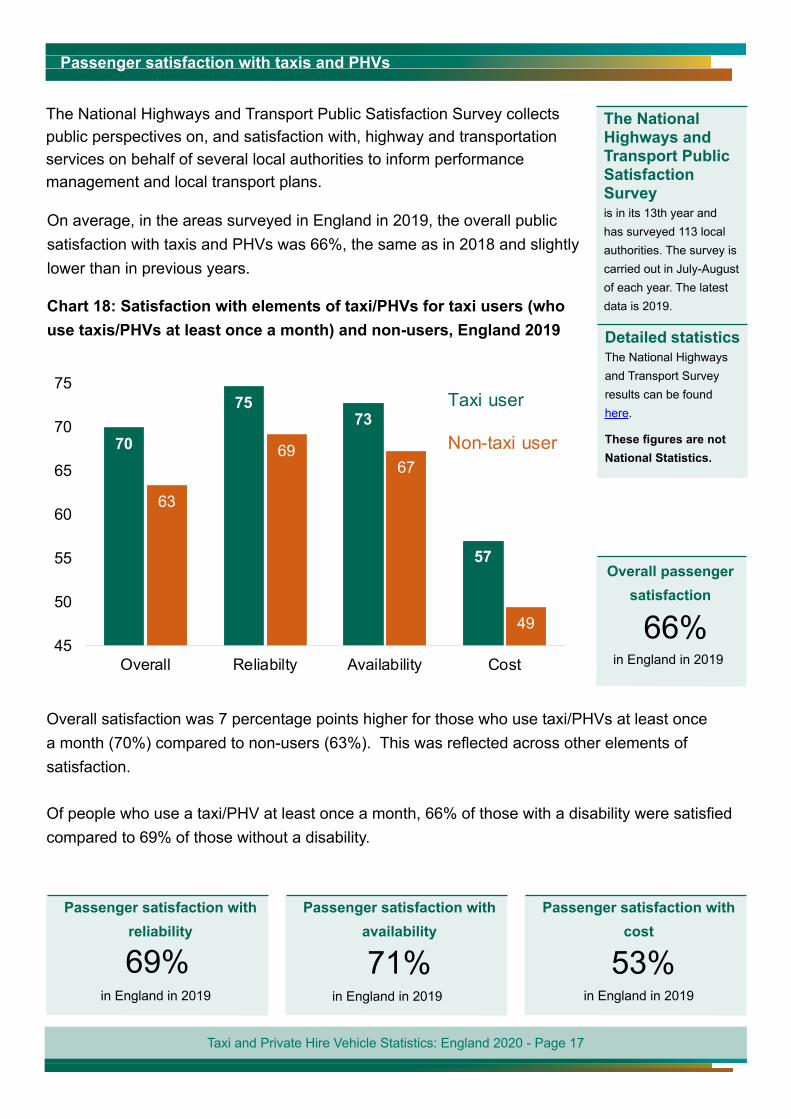
Passenger satisfaction with taxis and PHVs
The National Highways and Transport Public Satisfaction Survey collects public perspectives on, and satisfaction with, highway and transportation services on behalf of several local authorities to inform performance management and local transport plans.
The National Highways and Transport Public Satisfaction Surveyis in its 13th year and has surveyed 113 local authorities. The survey is carried out in July-August of each year. The latest data is 2019.
Detailed statisticsThe National Highways and Transport Survey results can be found here.
These figures are not National Statistics.
On average, in the areas surveyed in England in 2019, the overall public satisfaction with taxis and PHVs was 66%, the same as in 2018 and slightly lower than in previous years.
Chart 18: Satisfaction with elements of taxi/PHVs for taxi users (who use taxis/PHVs at least once a month) and non-users, England 2019
70
7573
57
63
6967
4945
50
55
60
65
70
75
Overall Reliabilty Availability Cost
Taxi user
Non-taxi user
in England in 2019
66%
Overall passenger satisfaction
Overall satisfaction was 7 percentage points higher for those who use taxi/PHVs at least once a month (70%) compared to non-users (63%). This was reflected across other elements of satisfaction.
Of people who use a taxi/PHV at least once a month, 66% of those with a disability were satisfied compared to 69% of those without a disability.
in England in 2019
69%
Passenger satisfaction with reliability
in England in 2019
71%
Passenger satisfaction with availability
in England in 2019
53%
Passenger satisfaction with cost

Taxi and Private Hire Vehicle Statistics: England 2020 - Page 18
Background information
Users and uses of these statisticsThese statistics are used within DfT to inform the development and monitoring of policy relating to taxis and PHVs (for example monitoring how many taxis and PHVs are wheelchair accessible) and for ministerial briefing or to answer public enquires. Outside DfT, the statistics are of interest to various industry bodies and provide information for licensing authorities to compare themselves with other areas.
Strengths and weaknesses of the dataThese statistics are collected through a survey of the 306 licensing authorities in England and Wales (the lower tier and unitary licensing authorities, and TfL for London). In 2020, full responses were received from all 306 areas, covering 100 per cent of licensed vehicles. Data returns are validated by comparing with previous figures and querying cases that are outside set validation thresholds. This can result in revisions to previous years’ figures, though these are typically minor.
The data collected will cover PHV operators and enlisted drivers who use app-based technology, such as Uber. However, we are not able to disaggregate which drivers are using these apps in the figures presented.
Licensing authorities use their own administrative data to monitor vehicles and drivers. This is used to provide figures to DfT in their survey responses. As some authorities use a live reporting system, figures may not always refer to the specified date requested (31 March). In general this is thought unlikely to have an impact on the regional and national figures to any great degree. However, the delay to the data collection for 2020 from April/May to September due to the COVID-19 pandemic may have increased the impact in this report but it is not possible to estimate the size of any effects.
More information can be found in the Background Quality Report.
National Statistics
The continued designation of these statistics as National Statistics was confirmed in February 2013. National Statistics are produced to high professional standards set out in the National Statistics Code of Practice. They undergo regular quality assurance reviews to ensure they meet customer needs. For details of ministers and officials who receive pre-release access to these statistics up to 24 hours before release: https://www.gov.uk/government/publications/taxis-statistics-pre-release-access-list
Next ReleaseThe next taxi and private hire vehicle statistics release is due to be published in 2021.
To hear more about DfT statistics publications as they are released please follow us on Twitter via our @DfTstats account. TWITTER, TWEET, RETWEET and the Twitter logo are trademarks of Twitter, Inc. or its affiliates