appendices - gov.uk
TRANSCRIPT
Appendices
Appendices
Appendix A: the relevant legal framework
Appendix B: a summary of the responses to our statement of scope
Appendix C: market outcomes
Appendix D: financial analysis of Apple’s and Google’s mobile ecosystems
Appendix E: Google’s agreements with device manufacturers and app developers
Appendix F: understanding the role of browser engines
Appendix G: pre-installation, default settings, and choice architecture for mobile browsers
Appendix H: in-app purchase rules in Apple’s and Google’s app stores
Appendix I: considering the design and impacts on competition of Apple’s ATT framework
Appendix J: Barriers to switching
A1
Appendix A: the relevant legal framework
Introduction
1. In this appendix we will describe at a high level the legislative and regulatory landscape relevant to our consideration of mobile ecosystems in the UK. This is intended as a brief, factual description of the key applicable frameworks rather than a substantive assessment of the extent to which those laws and regulations apply in mobile ecosystem markets.
2. This appendix is structured in the following thematic way:
• first, we provide an overview of sector-specific legislation and regulation currently in force that we consider to be most relevant to mobile ecosystems;
• second, we set out a broad summary of generally-applicable laws of relevance, including laws on data protection and privacy, competition, and consumer protection;
• third, we briefly describe the role of standard setting and self-regulation, where relevant to this study; and
• finally, we provide a brief update on various proposed changes to the legal and regulatory landscape (relevant to mobile ecosystems) that we anticipate coming into force within the next few years.
Specific legislation and regulation relevant to mobile ecosystems
3. This section summarises some of the relevant legislation and regulations relevant to the operation of mobile ecosystems.
Platform to Business Regulation
4. On 12 July 2020, the EU Regulation on platform-to-business relations (the P2B Regulation)1 on promoting fairness and transparency for business users of online platforms and search engines became directly applicable in EU Member States (including in the UK, as part of the Transition Period following the UK’s exit from the EU).2 When the Transition Period ended on 31
1 Regulation (EU) 2019/1150 of the European Parliament and of the Council of 20 June 2019 on promoting fairness and transparency for business users of online intermediation services. 2 The P2B Regulations also impose certain obligation on providers of Online Search Engines; however, those provisions are of less direct relevance to the main matters considered in this study.
A2
December 2020, the EU law version of the P2B Regulation was retained in UK law, with limited amendments largely to make it UK-centric.
5. The P2B Regulation applies to online intermediation service (OIS) providers – that is, services which connect businesses to their consumers, such as online search engines, consumer marketplaces and social media platforms.3 The key requirements of the P2B Regulation include obliging platform providers to:
• ensure terms and conditions are transparent; business users of the OIS are given sufficient notice of any changes and can terminate their contract;
• tell business users at or before they are delisted, suspended or terminated from the service and the reasons why;
• inform business users in advance of the main parameters used to determine ranking, their relative importance, as well as any action businesses can take to influence the ranking, such as remuneration or accepting additional obligations;
• act in a transparent manner and set out the considerations for any differential treatment the provider might give in respect of goods and services it offers compared to those offered by the business users;
• provide business users with a description of the scope, nature and conditions of their access to and use of certain categories of data, for example online reviews and ratings; and
• explain the legal, economic or commercial grounds for any restrictions imposed by the OIS on the ability of business users to offer goods or services to consumers under more favourable conditions through other sales channels.
6. The P2B Regulation is also supported with mechanisms for dispute resolution. It aims to create a fair, transparent and predictable business environment for businesses and traders when using online platforms to offer services to consumers. In order to give effect to these dispute resolution mechanisms, the UK government made the Online Intermediation Services for Business Users (Enforcement) Regulations 2020 (the Enforcement Regulations) (which also came into force on 12 July 2020).4 The Enforcement Regulations provide
3 However, an ‘ad exchange’, ie a business selling to other businesses, would not be within scope as it is not a platform which allows business users to offer direct transactions to consumers. 4 The Online Intermediation Services for Business Users (Enforcement) Regulations 2020, SI 2020/609.
A3
that a failure of a provider of OIS to comply with Article 3 (terms and conditions), Article 4 (restriction, suspension and termination) or Article 8 (specific contractual terms) of the P2B Regulation is a breach of an obligation owed to a business user, such that, where loss or damage is caused to the business user, it may bring a civil action against the OIS provider in respect of that loss or damage.5 The Enforcement Regulations also set out the powers of the court in relation to an application for an appropriate remedy.
UK cybersecurity laws
7. This section provides a brief overview of the key cybersecurity laws in the UK. These are:
• The Computer Misuse Act 1990: this legislation creates various cyber offences relating to computers, such as criminalising unauthorised access to computer material with or without intent to commit further offences; unauthorised acts with intent to impair the operation of a computer; and unauthorised acts causing or creating the risk of serious damage. However, unlike what follows below, the 1990 Act does not inherently create security obligations on businesses.
• The Communications Act 2003: this seeks to ensure the security and integrity of the public electronic communications networks (PECN) and public electronic communications services (PECS) by requiring providers to take appropriate technical and organisational measures to manage risks to the security of PECN and PECS, including measures to prevent or minimise the impact of security incidents on end users and on the interconnection of PECN. It creates further obligations on PECN and PECS providers to notify Ofcom of security breaches with a significant impact. Where providers contravene the requirements of the 2003 Act, Ofcom may take enforcement action which can result in the imposition of a penalty not exceeding £2 million.
• The Telecommunications (Security) Act 2021: this amends the Communications Act 2003 by establishing a new security framework, including new security duties on PECN and PECS providers and new powers for the Secretary of State to make regulations and issue codes of practice. It includes provisions strengthening Ofcom’s regulatory powers, allowing them to enforce the new framework. In particular, the new framework increases the maximum penalty amount to 10% of turnover.
5 The Enforcement Regulations also provide that qualifying organisations and associations (as defined in Article 14(1) of the P2B Regulation) may bring court proceedings for an appropriate remedy to secure compliance by OIS providers with relevant requirements of the P2B Regulation.
A4
The 2021 Act also introduces new national security powers for the Government to impose, monitor and enforce controls on PECN and PECS providers’ use of designated vendors’ goods, services and facilities.
• The Privacy and Electronic Communications (EC Directive) Regulations 2003 (the PECR, implementing ePrivacy Directive 2002/58/EC): the PECR include security obligations in respect of personal data that apply to PECS providers. The PECR require PECS providers to take technical and organisational measures to ensure the security of their services by restricting who can access personal data and protect the way it is stored or transmitted. The measures taken by PECS providers can be audited by the Information Commissioner’s Office (ICO) and, where contraventions are discovered, providers can be subject to monetary penalties. Further details on the PECR are provided later in this Appendix.
• The Network and Information Systems Regulations 2018 (NIS Regulations) implemented the EU Network and Information Systems Directive into UK law, imposing obligations on operators of essential services (OES) and relevant digital service providers (RDSPs):
- OES covers organisations operating services deemed critical to the economy and wider society including energy, water, healthcare and digital infrastructure;
- RDSPs includes those providing search engines, online marketplaces or cloud computing services (regulation 8).
The NIS Regulations require OES and RDSPs to take appropriate and proportionate technical and organisational measures to manage risks and to prevent the data they hold or the services they provide being compromised. The measures taken and level of security must be appropriate to the risk posed. Compliance with the NIS Regulations is monitored through inspections conducted or arranged by designated competent authorities/the ICO. Regulation 18(6) details the maximum financial penalties, based on the materiality of the breach.
• The Data Protection Act 2018: also contains important elements relating to cybersecurity. These are covered in more detail below.
General law
8. This section provides a brief description of the legal frameworks of general application relevant to this study. It also provides a broad overview of certain
A5
changes made to the UK’s legal landscape due to the UK’s withdrawal from the European Union (Brexit).
Data protection and ePrivacy
UK GDPR and DPA 2018
9. This sub-section covers, in brief, aspects of UK data protection legislation of most relevance to the scope of this market study.
10. The UK GDPR is the retained EU law version of the General Data Protection Regulation ((EU) 2016/679) (the EU GDPR)). The Data Protection Act 2018 (the DPA 2018) sets out the broader data protection framework in the UK and sits alongside the UK GDPR.
11. The ICO has published detailed guidance on the application of the UK GDPR and DPA 2018, which we do not attempt to replicate here.6 That guidance includes an explanation of the main definitions, the fundamental data protection principles (including the lawful bases for processing personal data), individual rights, and key accountability and governance obligations.
Data protection principles
12. Controllers must be able to demonstrate compliance with the following principles under article 5 UK GDPR:
• ‘lawfulness, fairness and transparency’; personal data must be processed lawfully, fairly and in a transparent manner in relation to the data subject;
• ‘purpose limitation’; personal data must be collected for specified, explicit and legitimate purposes and not further processed in a manner that is incompatible with those purposes;
• ‘data minimisation’; personal data must be adequate, relevant and limited to what is necessary in relation to the purposes for which they are processed;
• ‘accuracy’; personal data must be accurate and, where necessary, kept up to date; every reasonable step must be taken to ensure that personal data that are inaccurate, having regard to the purposes for which they are processed, are erased or rectified without delay;
6 Guide to the UK General Data Protection Regulation (UK GDPR), and Introduction to data protection.
A6
• ‘storage limitation’; personal data must be kept in a form which permits identification of data subjects for no longer than is necessary for the purposes for which the personal data are processed; and
• ‘integrity and confidentiality’; personal data must be processed in a manner that ensures appropriate security of the personal data, including protection against unauthorised or unlawful processing and against accidental loss, destruction or damage, using appropriate technical or organisational measures.
Lawful bases for processing
13. The processing of personal data shall be lawful only if and to the extent that at least one of the following lawful bases applies under article 6 UK GDPR:
• 'consent'; the data subject has given consent to the processing of his or her personal data for one or more specific purposes;
• 'contract'; processing is necessary for the performance of a contract to which the data subject is party or in order to take steps at the request of the data subject prior to entering into a contract;
• 'legal obligation'; processing is necessary for compliance with a legal obligation to which the controller is subject;
• 'vital interests'; processing is necessary in order to protect the vital interests of the data subject or of another natural person;
• 'public task'; processing is necessary for the performance of a task carried out in the public interest or in the exercise of official authority vested in the controller; and
• 'legitimate interests'; processing is necessary for the purposes of the legitimate interests pursued by the controller or by a third party, except where such interests are overridden by the interests or fundamental rights and freedoms of the data subject which require protection of personal data, in particular where the data subject is a child.
14. 'Consent', 'contract' and 'legitimate interests' are the lawful bases most likely to be relevant in the context of mobile ecosystems. The ICO has published more detailed guidance on consent7 and legitimate interests8, while the European Data Protection Board (EDPB) has adopted final guidelines on
7 ICO detailed guidance – consent. 8 ICO detailed guidance – legitimate interests.
A7
processing personal data on the basis of contract in the context of online services.9 EDPB guidelines are no longer directly relevant to the UK regime and are not binding under the UK regime. However, they may still provide helpful guidance on certain issues.
Codes of practice
15. The ICO is required to produce various statutory codes of practice under the DPA 2018 including the Data Sharing code and the Children’s code. In accordance with section 127 of the DPA 2018, the ICO must take the codes into account when considering whether a controller has complied with their data protection obligations.10
16. The Data Sharing code11 is a practical guide for organisations about how to share personal data in compliance with data protection law, in particular sharing information in a fair and proportionate manner.
17. The Children’s code12 (or Age appropriate design code) is a data protection code of practice for online services, such as apps, online games, and web and social media sites, likely to be accessed by children. It contains 15 standards of age appropriate design reflecting a risk-based approach. The focus is on providing default settings which ensure that children have the best possible access to online services whilst minimising data collection and use, by default.13
PECR
18. The PECR sit alongside the UK GDPR and DPA 2018. They give people specific privacy rights in relation to electronic communications. The PECR implement EU Directive 2002/58/EC, also known as ‘the e-privacy Directive’.14 The ICO has published detailed guidance on the PECR and its application.15
19. The PECR provide specific rules on: marketing by electronic means, including marketing calls, emails, texts and faxes; storage of information (and access to information stored) in users devices, including the use of cookies and similar
9 EDPB final guidelines – contract. 10 The codes can also be used in evidence in court proceedings, and the courts must take their provisions into account wherever relevant. 11 ICO Data Sharing code of practice. 12 ICO Children’s code. 13 The government recently consulted on proposals to reform UK data protection laws, see Data: a new direction (September 2021). The CMA has submitted a response to the consultation. 14 The EU is in the process of replacing the current e-privacy law with a new e-privacy Regulation (ePR), to sit alongside the EU version of the GDPR. However, the ePR will not automatically form part of UK law, or sit alongside the UK GDPR, as the UK has left the EU. 15 ICO Guidance to PECR.
A8
technologies; keeping communications services secure; and customer privacy as regards traffic and location data, itemised billing, line identification, and directory listings.
20. Due to the prevalence of cookies and similar technologies in mobile ecosystems, the main relevance of the PECR to this study is the requirement that they specify the basic rules as to how these technologies can be used.
21. Regulation 6 of the PECR says that storage of information (or access to information stored) is prohibited unless the subscriber or user is provided with clear and comprehensive information about the purposes of that storage or access, and has given their consent. This consent must be of the UK GDPR standard.16 This applies to anyone who undertakes these activities, by any method. It covers cookies as well as similar technologies – ie any technique that results in this storage or access.
22. For example, this means that where a cookie is not essential to provide the service, an organisation must:
• tell users the cookies are there;
• explain what the cookies are doing and why; and
• get the user's consent to store a cookie on their device.
23. In addition to its general guidance on the PECR, the ICO has produced detailed guidance on the use of cookies and similar technologies.17
Joint statement between the CMA and the ICO
24. The CMA and the ICO have recently published a joint statement (the Joint Statement) that sets out their shared views on the relationship between competition and data protection in the digital economy.18 The statement sets out:
• the important role that data, including personal data, plays within the digital economy;
• the strong synergies that exist between the aims of competition and data protection;
16 ICO Guide to the GDPR – Lawful Basis for Processing: Consent 17 ICO guidance on the use of cookies and similar technologies. 18 Competition and data protection in digital markets joint statement (May 2021).
A9
• the ways that the two regulators will work collaboratively together to overcome any perceived tensions between their objectives; and
• practical examples of how the two organisations are already working together to deliver positive outcomes for consumers.
25. Of particular importance in the Joint Statement is the acknowledgement of the risk that data protection law could, in certain circumstances, be interpreted by large integrated digital businesses in a way that could lead to negative outcomes in respect of competition (for example, by unduly favouring large, integrated platforms over smaller, non-integrated suppliers).19 At the same time, some forms of data related interventions that seek to improve competition (as well as consumer choice and control) could pose data protection and privacy risks if not carefully designed.
26. The Joint Statement provides clarification that data sharing between unconnected businesses and internal data sharing within large, integrated businesses must comply with the same data protection principles, requirements and objectives; and that neither competition nor data protection regulation allows for a 'rule of thumb' approach, where intra-group transfers of personal data are permitted while extra-group transfers are not.
Competition law
27. Below we provide a brief description of the enforcement of the prohibitions against agreements that restrict competition and the abuse of a dominant position; the review of mergers; and the market investigation regime.
28. The UK has an established set of rules to govern how the competitive process should operate to promote the economic benefits that competition between different businesses can bring for consumers, businesses, and markets. These are set out in the Competition Act 1998 (CA98) and the Enterprise Act 2002 (EA02). Public enforcement of UK competition law is the responsibility of the CMA and various ‘concurrent’ regulators having authority for antitrust enforcement in specific sectors of the economy alongside the CMA.20
19 Such risks could arise, for example, from an interpretation of data protection law in which transfers of personal data between different businesses owned by a single corporate entity, such as a large platform company, are in principle viewed as acceptable from a privacy perspective. While transfers of personal data between independently-owned businesses are not, even if these businesses are functionally equivalent to those of the platform and the data is processed on the same basis and according to the same standards. For further detail see paragraphs 76 to 83 of the Joint Statement. 20 For simplicity, this Appendix refers only to the CMA as the UK enforcer of competition, but this should be taken to include the concurrent regulators, as appropriate.
A10
Enforcement (antitrust)
29. Competition law protects businesses and consumers against anti-competitive agreements or behaviours. The enforcement of this body of law is sometimes described as antitrust, with enforcement and the imposition of penalties and remedies where businesses are found to have infringed the law, having an important role to deter anti-competitive behaviour.
30. Chapter I of the CA98 prohibits, in certain circumstances, agreements and concerted conduct which have the purpose or effect of preventing, restricting or distorting competition in the UK. While Chapter II of the CA98 prohibits conduct which constitutes an abuse of a dominant position affecting trade within the UK.
31. More information on the laws on anti-competitive behaviour is available in the quick guide ‘Competing Fairly’ (OFT447)21 and in the more detailed guidance on Agreements and Concerted Practices (OFT401)22 and Abuse of a dominant position (OFT402).23
32. Where anti-competitive behaviour may affect trade between EU member states, it is also prohibited by Articles 101 and 102 of the Treaty on the Functioning of the European Union (TFEU). These prohibitions, which are effectively the same as those contained within Chapters I and II CA98, are enforced by the European Commission. Although Articles 101 and 102 are no longer of ongoing application in the UK following Brexit, decisions under those provisions adopted by the European Commission before 31 December 2020 remain binding on and in the UK.24
33. The European Commission has found a number infringements (and continues to bring cases) concerning digital platforms where the key issues identified concern dominant platforms shielding themselves from competition through anti-competitive restrictions in contracts, and/or leveraging their market power into related markets through the tying of particular goods/services. Of particular relevance to this study are:
• AT.39740 - Google Search (Shopping): in June 2017, the European Commission imposed a fine of €2.42bn on Google for giving favourable
21 Competing fairly and the application of competition law: OFT447 - GOV.UK (www.gov.uk). 22 Agreements and concerted practices: OFT401 - GOV.UK (www.gov.uk). 23 Abuse of a dominant position: OFT402 - GOV.UK (www.gov.uk). 24 In accordance with the Agreement on the Withdrawal of the United Kingdom of Great Britain and Northern Ireland from the European Union and the European Atomic Energy Community (the Withdrawal Agreement) Decisions adopted after 31 December 2020 remain binding where they relate to the limited number of cases over which the European Commission retains ‘continued competence’ under the Withdrawal Agreement.
A11
treatment to its comparison shopping service in its search results.25 According to the European Commission, this practice had resulted in increased traffic to Google’s comparison shopping service, to the detriment of competing comparison shopping services that would have otherwise benefited from this traffic. The European Commission held that Google had abused its dominant position by (i) leveraging its dominant position on the markets for general search to the markets for comparison shopping services; and (ii) protecting its dominant position on the general search markets. In November 2021, the General Court of the European Court of Justice confirmed in principal part the European Commission’s decision, confirming in particular that ‘self-preferencing’ can (for now) be considered a potential abuse by an undertaking deemed to be dominant.26
• AT.40099 - Google Android: in July 2018, the European Commission fined Google €4.34 billion in relation to conduct concerning certain conditions in Google’s agreements associated with the use of Android, and certain proprietary apps and services.27 In particular, the Commission concluded that Google:
- required manufacturers to pre-install the Google Search app and browser app (Chrome), as a condition for licensing Google's app store (the Play Store);
- made payments to certain large manufacturers and mobile network operators on condition that they exclusively pre-installed the Google Search app on their devices; and
- prevented manufacturers wishing to pre-install Google apps from selling even a single smart mobile device running on Android forks (ie, alternative versions of Android that were not approved by Google).28
• AT.40411 - Google Search (AdSense): in March 2019, the European Commission announced its decision to fine Google €1.49 billion for breaching Article 102 TFEU, concluding that Google had abused its dominant position in the online search advertising intermediation market by imposing a number of restrictive clauses in contracts with third-party
25 European Commission decision of 27.06.2017 - Case AT.39740 - Google Search (Shopping) 26 Google and Alphabet v Commission (Google Shopping) - Case T-612/17 - GC Judgment. It is not yet clear whether Google and Alphabet will appeal the General Court’s decision. 27 European Commission decision of 18.07.2018 - Case AT.40099 - Google Android 28 Google and Alphabet have appealed the European Commission’s decision to the General Court (Case T-604/18 – Google and Alphabet v Commission).
A12
websites which prevented Google's rivals from placing their search adverts on these websites.29
Merger control
34. The UK merger regime is set out in the EA02. UK merger control law does not require that a qualifying merger be notified to the CMA, but the CMA may choose to review any qualifying merger. The assessment of mergers in the UK is conducted as a two-phase process, with both anticipated and completed mergers being covered by EA02.
35. The CMA assesses whether a merger will lead to a ‘substantial lessening of competition’ (SLC). The CMA’s Merger Assessment Guidelines provide that the CMA views competition as a process of rivalry and that a merger may give rise to an SLC where it reduces levels of rivalry between firms, to the detriment of customers.30
36. Under the UK’s two-phase merger control regime, the CMA applies different thresholds: a ‘realistic prospect’ threshold for a SLC in its Phase 1 initial assessment, and a ‘balance of probabilities’ threshold at Phase 2 (ie, is it more likely than not that an SLC will result due to the merger). If it identifies an SLC at Phase 2, the CMA decides upon the remedies required. Such remedies may include prohibiting the merger or requiring the divestiture (sale) of parts of the business.
37. The CMA’s approach to mergers is set out in guidance, ‘Mergers – the CMA’s jurisdiction and procedure: CMA2’31 and ‘Merger assessment guidelines:CMA129.32 The CMA recently updated its Merger Assessment Guidelines (in March 2021) in order to, among other things, provide for a more dynamic approach to assessing mergers, to place more emphasis on non-price factors of competition (eg quality and innovation), and to make clear that uncertainty will not in itself prevent the CMA from finding a competition concern. This followed the CMA’s call for views, in June 2019, on our approach to the assessment of digital mergers.33
38. The CMA has also benefited from the large number of expert reports and academic literature that has been produced in recent years, including ‘Unlocking digital competition, the Report of the Digital Competition Expert
29 European Commission decision of 20.03.2019 - Case AT.40411 - Google Search (AdSense). Google and Alphabet have appealed the European Commission's decision to the General Court (Case T-334/19 - Google and Alphabet v Commission). 30 Merger Assessment Guidelines (CMA129), 2.1-2.9. 31 Mergers: Guidance on the CMA's jurisdiction and procedure (2020 - revised guidance) 32 Merger Assessment Guidelines (CMA129). 33 CMA call for information: digital mergers, 3 June 2019.
A13
Panel’ (March 2019);34 and the ‘Ex-post Assessment of Merger Control Decisions in Digital Markets, Final Report’, an independent review of past digital mergers published in May 2019 (the LEAR Report).35 A theme in each of these reports is the risk of under-enforcement, particularly in relation to mergers in digital markets (including the loss of potential competition in these markets), by competition authorities such as the CMA.
39. The LEAR Report included a review of the mergers in Facebook/Instagram (cleared by the OFT in August 2012);36 Google/Waze (cleared by the OFT in November 2013);37 and Amazon/The Book Depository (cleared by the OFT in October 2011).38 Other recent CMA merger assessments involving digital markets include:
• Facebook/Kustomer (2021) – relating to the supply of customer relationship management software;39
• viagogo/StubHub (2021) – relating to the supply of online secondary ticketing;40
• Amazon/Deliveroo (2020) – relating to online platforms that offer restaurant and grocery delivery services;41
• Taboola/Outbrain (2020) – a proposed acquisition (subsequently abandoned) involving the supply of digital advertising services (including content recommendation);42
• Sabre/Farelogix (2020) – relating to the supply of several software solutions which help airlines to sell flights via travel agents;43
• Visa/Plaid (2020) – relating to the supply of technology platforms that enable digital applications to connect with bank accounts;44
• Google/Looker (2020) – relating to the supply of business intelligence tools;45 and
34 Unlocking digital competition: Report from the Digital Competition Expert Panel (March 2019) (The Furman Report) 35 LEAR Report - Ex-post Assessment of Merger Control Decisions in Digital Markets, 9 May 2019. 36 Facebook / Instagram Inc. 37 Motorola Mobility Holding / Waze Mobile Ltd. 38 Amazon.com, Inc / The Book Depository International Ltd. 39 Facebook, Inc./ Kustomer, Inc. 40 viagogo / StubHub merger inquiry. 41 Amazon / Deliveroo merger inquiry 42 Taboola / Outbrain merger inquiry 43 Sabre / Farelogix merger inquiry 44 Visa International Service Association / Plaid Inc. merger inquiry 45 Google LLC / Looker Data Sciences, Inc merger inquiry
A14
• Facebook (now Meta Platforms)/Giphy (2021) – relating to the supply of display advertising and of social media.46
Market investigation regime
40. A longstanding feature of the UK competition regime is the ability to investigate the operation of markets as a whole, as reflected in the work of this market study. The CMA may investigate to assess if a market operates in a manner which works well for consumers, and if not, may make proposals or adopt measures (remedies) so they might be made to work better.
41. Like the process described above for mergers, there is typically a two-phase process for the CMA’. The ‘Phase 1’ process – the market study – is used to determine whether there is a case for a more detailed examination during the ‘Phase 2’ process, the Market Investigation. This is achieved through the CMA making a ‘market investigation reference’. The Market Investigation seeks to determine if features of the market have an adverse effect on competition (the ‘AEC test’), and if so the CMA decides what remedial action, if any, is appropriate for it using its own order making powers,47 or for others to take following a CMA recommendation. Though markets remedies are binding on businesses, in contrast to CA98 and consumer law enforcement cases, market studies and market investigations do not involve decisions as to whether or not a party has violated the relevant provisions of competition or consumer protection law. Rather, the focus of any market investigation is upon the effects on competition of possible features of the market (whether through coordinated conduct or otherwise).
42. Like in mergers, markets remedies are conventionally classified as either structural or behavioural. Structural remedies (such as a requirement to sell or separate part of a business) are generally one-off measures that seek, in market investigations, to increase competition by altering the competitive structure of the market. Behavioural remedies are generally ongoing measures that are designed to regulate or constrain the behaviour of parties in a market and/or empower customers to make effective choices.
Consumer law
43. The following paragraphs provide a non-exhaustive description of the consumer law most directly relevant to this study. The main focus is on Part 2 of the Consumer Rights Act 2015 and the Consumer Protection from Unfair
46 Facebook, Inc (now Meta Platforms, Inc) / Giphy, Inc merger inquiry. 47 The CMA may also accept binding undertakings from market participants.
A15
Trading Regulations 2008, although other consumer protection legislation may apply.
The Consumer Rights Act 2015 (CRA) – Part 2
44. Part 2 of the CRA implements the Unfair Contract Terms Directive 93/13/EEC into UK law.48
45. Part 2 of the CRA applies to both consumer contracts and consumer notices49 and requires the terms in such contracts and notices to be fair and, if written, transparent (that is, they must be legible and expressed in plain, intelligible language).
46. A term in a consumer contract or consumer notice is unfair if, contrary to the requirement of good faith, it causes a significant imbalance in the parties’ rights and obligations under the contract, to the detriment of the consumer (the ‘fairness test’).
47. The ‘fairness test’ starts by asking whether the wording of a term tilts the rights and responsibilities between the consumer and business too much in favour of the business. The test is applied by looking how that wording could be used. It takes into consideration what is being provided, how a term relates to other terms in the contract, and all the circumstances at the time the term was agreed.
48. Some terms may be exempt from the ‘fairness test’ – namely those describing the main subject matter and those setting the price – provided that they are transparent and prominent. There is also an exemption for wording that reflects mandatory legislative or regulatory provisions, for example, words that legally have to be used.
49. The CRA illustrates what ‘unfairness’ means by listing some types of terms that may be unfair in Schedule 2 to the CRA (the ‘Grey List’). These terms are not automatically unfair, but are indicative of the types of term which may be considered potentially unfair. The Grey List is not exhaustive and so terms that do not appear on it may still be unfair.
50. Transparency, as well as being a specific requirement for written terms, is also relevant to the fairness test’s consideration of ‘good faith’.
48 Council Directive 93/13/EEC of 5 April 1993 on unfair terms in consumer contracts. 49 A consumer notice is wording that may not form part of a contract but which relates to the same kind of issues that would be dealt with in a contract – for instance the rights or obligations between a business and a consumer.
A16
51. To achieve the openness required by good faith, terms should be expressed fully and clearly so consumers can make informed choices about whether or not to enter the contract. Terms that might disadvantage the consumer should be given appropriate prominence. Contracts should not contain concealed pitfalls or traps.
The Consumer Protection from Unfair Trading Regulations 2008 (SI 2008/1277) (the CPRs)
52. The CPRs implement into UK law the EU Unfair Commercial Practices Directive50 (UCPD).
53. Broadly speaking, the CPRs prevent businesses (which it describes as ‘traders’) from treating consumers unfairly.
54. The CPRs apply to a wide range of commercial practices which might affect consumers. Commercial practices may include matters such as advertising, marketing, sales, supplies and after-sales services. A commercial practice is governed by the CPRs if it is directly connected with the promotion, sale or supply of ‘products’ – which includes goods, services or digital content51 – to consumers. Businesses are also responsible for the commercial practices of anyone who acts on their behalf or in their name. Both the business and those acting on their behalf may be held liable for breaches of the CPRs.
55. The broad scope of the CPRs means that businesses may still have to comply even when they are not selling directly to consumers themselves or are not advertising their own products.
56. There are currently 31 practices listed in Schedule 1 to the CPRs, which because of their inherently unfair nature, are prohibited in all circumstances.
57. Regulations 3, and 5 to 7 of the CPRs, also prohibit unfair practices. To be in breach of these Regulations the business must both exhibit the conduct specified in the prohibition and the practice must have, or be likely to have, an effect on the transactional decisions of the average consumer. In summary the CPRs prohibit the following conduct, where it affects consumers decisions:
50 Directive 2005/29/EC of the European Parliament and of the Council of 11 May 2005 concerning unfair business-to-consumer practices in the internal market. 51 ‘Digital content’ refers to data produced and supplied in digital form.
A17
• Regulation 3 contains a general prohibition on unfair commercial practices, ie, those which contravene the requirements of professional diligence.52
• Regulation 5 prohibits misleading actions, which occur when a business gives consumers false information (about a wide range of things listed in the CPRs), or is deceptive in the presentation of that information even if it is factually correct.
• Regulation 6 prohibits misleading omissions, which occur when businesses fail to give consumers the information that they need to make an informed choice in relation to a product. This includes hiding such information or providing it in an unclear, unintelligible, ambiguous or untimely manner.
• Regulation 7 prohibits aggressive commercial practices. These are practices that, in the context of the particular circumstances, put unfair pressure on consumers, restricting their ability to make free or informed decisions.
58. The average consumer is generally assumed to be reasonably well informed and reasonably observant and circumspect. Average does not mean a statistically average consumer. Where a commercial practice is targeted at a particular group or it is reasonably foreseeable that a group of consumers will be particularly vulnerable to that practice, then the average consumer refers to the average member of that group.
59. The CPRs prohibit unfair practices which affect a wide range of decisions taken by consumers in relation to products before, during or after a commercial transaction (if any). This is not simply confined to a consumer's decision whether or not to purchase a particular product but could also include, for example, a consumer's decision to view a product on a website, contact a business or visit a shop, as well as a decision not to purchase a particular product or to exercise a contractual right.
What about ‘free’ services?
60. The overarching intention of consumer law is to protect consumer’s economic interests. However, that does not necessarily mean that contracts involving non-monetary consideration will fall outside its scope entirely. Courts in various international jurisdictions have accepted that a consumer’s personal
52 This is defined as meaning the standard of special and care which a trader may reasonably be expected to exercise towards consumers which is commensurate with honest market practice or good faith in their field of activity.
A18
data, preferences and user-generated content can have an economic value53
and are each a valid form of consideration in return for a service.
Post-Brexit changes
61. Following the UK’s exit from the European Union (‘Brexit’) on 31 January 2020, and the subsequent end of the ‘Transition Period’54 on 31 December 2020, a number of changes to the UK’s legal landscape – including to the competition and consumer regimes – have come into force. In particular, and in order to provide a level of continuity following the end of the Transition Period, the government legislated to preserve in domestic law, as far as possible, the legal position applicable immediately before the end of the Transition Period.
Post-Brexit changes relevant to competition enforcement
62. Prior to the end of the Transition Period, section 60 of the CA98 had provided that, so far as possible, the CMA, concurrent regulators and the UK courts were to interpret the Chapter I and II prohibitions in a manner consistent with the principles of the TFEU and the decisions and principles laid down by the EU Court of Justice (CJEU) in relation to the EU competition law prohibitions (Article 101 and 102 TFEU). Regard was also to be had to any ‘relevant decision or statement’ of the European Commission.
63. To reflect the UK’s withdrawal from the EU, the government legislated to repeal section 60 CA98 and replaced it with a new provision, section 60A CA98. Under section 60A, the default position remains that the CMA, concurrent regulators and the UK courts must act with a view to securing that there is no inconsistency between:
• the principles that they apply, and the decisions they reach, in determining a question arising under Part 1 of CA98 (which includes the Chapter I and Chapter II prohibitions) in relation to competition within the UK; and
• the principles laid down by the TFEU and the CJEU before the end of the Transition Period, and any relevant decision made by that Court before the end of the Transition Period, so far as applicable immediately before
53 The EU Commission stated: “personal data, consumer preferences and other user generated content have a “de facto” economic value …” European Commission, Commission Staff Working Document: Guidance on the implementation / application of Directive 2005/29/EC on Unfair Commercial Practices (SWD(2016) 163 final), p 25. 54 Provided for by Article 126 of the Withdrawal Agreement.
A19
the end of the Transition Period in determining any corresponding question arising in EU law.
64. However, section 60A allows the CMA, concurrent regulators and the UK courts to depart from the principles of the TFEU and CJEU case law pre-dating the end of the Transition Period where they consider it ‘appropriate’ to do so, in light of a number of prescribed factors.55 In addition, the CMA, concurrent regulators and the UK courts will not be required to act with a view to securing that there is no inconsistency between the principles they apply or decisions they reach and any TFEU or CJEU principles or decisions pre-dating the end of the Transition Period, where they are bound by a principle or decision of a court or tribunal in England and Wales, Scotland or Northern Ireland that requires them to act otherwise.
65. Section 60A applies to all competition enforcement actions from 31 December 2020 onwards (including any CMA or concurrent regulator investigations or UK court cases which are ‘live’ on that date) and, extends in such cases to facts pre-dating 31 December 2020.
66. Further details regarding the changes to the UK’s competition and consumer regimes following Brexit are set out in the CMA’s Guidance on the functions of the CMA after the end of the Transition Period.
Non-legislative framework(s)
67. The development of the internet and internet-enabled businesses has been enabled by effective non-legislative standard setting, as has been the case in the wider information technology space. While it is beyond the scope of this Appendix to cover this in detail, certain material matters of relevance to mobile ecosystems are described briefly below.
Tech standards and standard setting bodies
68. The Internet Society is a supervisory organisation comprising individuals, corporations, non-profit organisations and government agencies from the internet community. It provides the administrative home for:
• the Internet Engineering Task Force (IETF), a loosely self-organised group who contribute to the engineering and evolution of Internet technologies by producing relevant technical and engineering documents (including protocol standards and best current practices documents) that
55 See Guidance on the functions of the CMA after the end of the Transition Period.
A20
influence the way people design, use, and manage the Internet.56 It aims to support the evolution of the internet and maintain the smooth running of the internet as a whole, by developing and maintaining the Request For Comment documents that define the open standards by which the internet is managed. These open standards are developed via rough consensus; and,
• the Internet Architecture Board, responsible for defining the overall architecture of the internet, and providing advice, guidance and broad direction to the IETF. It also provides oversight of:
- the Internet Corporation for Assigned Names and Numbers (ICANN), primarily responsible for assigning domain names and considering the introduction of new generic top level domains; and,
- the Internet Assigned Numbers Authority, operated by ICANN and is primarily responsible for assigning IP addresses.
69. The World Wide Web Consortium (W3C)57 develops Web standards via its international community of Member organisations, a full-time staff, and the public. W3C's primary activity is to develop protocols and guidelines that aim to ensure long-term growth for the Web. The W3C adopts a process58 to get to a ‘W3C Recommendation’ or ‘standard’, via workshops, activity proposals, and working groups (by which specifications and guidelines are reviewed and revised).
70. There is also a wider range of more formal standard setting organisations which adopt relevant standards, such as the International Telecommunication Union, International Electrotechnical Commission, and the Institute of Electrical and Electronics Engineers.
Potential changes to the legal or regulatory landscape
71. In addition to the existing legal regime, there are various plans for new legislation in the UK relating to digital markets and online content. While these new rules remain at a reasonably early stage and are yet to be scrutinised by Parliament, we have summarised below those that are most relevant to the issues under consideration in the market study.
56 RFC 3935, 4677 etc. 57 http://www.w3.org. 58 W3C Process.
A21
The DMU and the new pro-competitive regime for digital markets
72. As set out in Chapter 8 of the main report, the government is proposing to establish a new pro-competition statutory regime which will proactively shape the behaviour of digital firms with significant and far-reaching market power, by making clear how they are expected to behave. The regime is intended to boost competition and innovation by tackling the sources of existing and future strategic market power. The regime will be implemented and enforced by a dedicated body, the DMU, whose core purpose is presently proposed to be ‘to promote competition by addressing both the sources of market power and the economic harms that result from the exercise of market power.’59
73. The DMU was launched earlier this year in ‘shadow form’ (ie non-statutory form) within the CMA, awaiting statutory powers and objectives. The government launched a consultation in August 2021 setting out its proposals for the new regime.60 The government’s consultation followed and built on recommendations by the Digital Competition Expert Panel, and advice from the Digital Markets Taskforce. The CMA published its response to the government’s consultation on 29 September 2021, noting its strong support for the government’s proposals.61
74. The DMU’s proposed powers and responsibilities (for example, regarding Strategic Market Status designations; codes of conduct; and pro-competitive interventions) are explained in detail in Chapter 8 of the main report.
Online Safety Bill
75. The UK government's draft Online Safety Bill (OSB)62 was published in May 2021. The OSB aims to protect the UK population from illegal or harmful online content, by making digital platform operators (Regulated Providers) responsible for swiftly removing such content.
76. The OSB will apply to ‘regulated services’, which are either user-to-user services, such as those internet services that host user-generated content or facilitate online interaction between users, or search services (ie, search engines).
77. The companies affected will be those providing the above services that have a significant number of UK users, where the UK forms a target market for the service or where there is a material risk of significant harm to individuals in the
59 A new pro-competition regime for digital markets – Consultation document (August 2021). 60 The consultation closed on 1 October 2021, and the feedback to it is currently being considered by the Government. 61 CMA response to the government's consultation 'A new pro-competition regime for digital markets. 62 Draft Online Safety Bill.
A22
UK using the service. Given the wide scope of the OSB, this will include certain mobile phone apps. The Bill will impose a duty of care on the affected companies to take proportionate measures to minimise the spread of illegal online content or activities and ensure that users are not exposed to harmful content.
78. Compliance with the OSB will be overseen by Ofcom, who will classify the online companies as Category 1, 2A or 2B services (based on thresholds set by the Secretary of State), to help determine the obligations they are under. Category 1 will be used for those services with greater users and functionality, and thereby subject to additional duties. Ofcom will also have a range of sanctions, including the ability to impose fines of up to the greater of £18 million or 10% of a Regulated Provider's qualifying worldwide revenue.
The Product Security and Telecommunications Infrastructure Bill
79. The UK government introduced the Product Security and Telecommunications Infrastructure Bill (the PSTI Bill) in November 2021.63 The PSTI Bill supports the rollout of future-proof, gigabit-capable broadband and 5G networks, and better protects citizens, networks and infrastructure against the harms enabled through insecure consumer connectable products.
80. The bill has two main parts, covering:
• Product Security measures (Part 1); and
• Telecommunications Infrastructure measures (Part 2).
81. The Product Security measures, which may be of most relevance to the topics under consideration in this market study, are designed to:
• ensure that consumer connectable products, such as smartphones, smart TVs, internet-connectable cameras and speakers, are more secure against cyber attacks, protecting individual privacy and security;
• require manufacturers, importers and distributors to comply with new security requirements relating to consumer connectable products; and
• create an enforcement regime with civil and criminal sanctions aimed at preventing insecure products being made available on the UK market.
82. The product security measures follow extensive engagement with the National Cyber Security Centre, tech and retail industry stakeholders, consumer
63 Product Security and Telecommunications Infrastructure Bill - Parliamentary Bills - UK Parliament.
A23
groups and academia. The government also held a consultation on this topic in 2019,64 and issued a call for views last year65 (the response to which was published in April 2021).66
64 Consultation on regulatory proposals on consumer IoT security - GOV.UK (www.gov.uk). 65 Policy paper overview: Proposals for regulating consumer smart product cyber security - call for views - GOV.UK (www.gov.uk). 66 Regulating consumer smart product cyber security - government response - GOV.UK (www.gov.uk).
B1
Appendix B: a summary of the responses to our statement of scope
Introduction
1. On 15 June 2021, we published our statement of scope document alongside a notice for a market study into mobile ecosystems. It set out the intended scope of the study – which includes the supply of mobile devices and operating systems, app stores and browsers – while also highlighting a number of issues that would not be a primary focus of our work. It also explained the main competition concerns that we would be investigating, set out under the following four themes:
• competition in the supply of mobile devices and operating systems;
• competition in the distribution of mobile apps;
• competition in the supply of mobile browsers and browser engines; and
• the role of Apple and Google in competition between app developers.
2. We invited comments and views from stakeholders on the following areas:
• Our description of the sector, and whether this is broadly accurate.
• The proposed scope of the market study, including whether there are areas we should particularly focus on, and whether there are important areas we have missed. In particular, we invited views on whether we should focus on desktop browsers, alongside mobile browsers, within the study.
• The four themes identified, including views on the potential concerns we are considering.
• The range of potential remedies, including whether they would be appropriate, proportionate, and effective, and whether there are other potential remedies we should consider.
• Our proposed approach to evidence gathering.
3. We received 53 responses from a variety of stakeholders, including 26 written responses, and 27 responses to our online questionnaire for app developers. The written responses came from a broad spectrum of stakeholders, including Apple and Google, app developers, technology firms, news media
B2
organisations, telecoms, industry associations, and academics.1 We have published these written responses on our case page.2
4. This document summarises the key messages and common themes emerging under each of the five areas above. We have provided a short response to the key points at the end of each section.
Our description of the sector
5. Only a small number of respondents addressed this question directly, with some of those offering brief supportive statements to say that they broadly agreed with our description of the sector. Some also welcomed our recognition of the interconnectedness of markets, and agreed with the identification of Apple and Google as ‘gatekeepers’ within mobile ecosystems.
6. A small subset of respondents who addressed the issue offered some challenge to our description. In particular, one response suggested that we should consider the App Store and the Play Store as separate markets, while another highlighted a few areas for us to consider, including the suggestion that any separation of markets for devices, operating systems and app stores would be artificial. Another highlighted the importance of the role of Apple and Google as ‘stewards’ of the mobile ecosystem.
The proposed scope of the market study
7. Around three quarters of respondents provided some feedback on the scope of the study, with the majority being supportive of our proposed approach. Several offered strong overarching support for the holistic approach we have taken, recognising that this is necessary to properly understand business models and to identify issues that cut across a range of interconnected products and services.
1 See Annex A to this appendix for a full list of respondents. 2 Mobile ecosystems market study - GOV.UK (www.gov.uk).
CMA Response:
• We have taken on board much of this feedback in our approach in the first half of the market study. This is reflected in our assessment of the competition faced by Apple and Google in different activities within their ecosystems.
B3
8. The more detailed or specific feedback on the scope of the study generally fell into two categories. The first includes those responses that were broadly supportive of the scope and framework for the study but were urging us to place greater emphasis on particular areas where they highlighted concerns, or to bring them more explicitly within our scope. These included:
• several calls for an increased focus in the study on a range of devices and technology that connect to or can be controlled by mobile devices, such as wearables, voice assistants, TV operating systems, and connected vehicles and operating systems;
• a suggestion that the CMA be alert to emerging technologies in the sector (such as e-SIMs), in order to help future-proof the design of the new regulatory regime; and
• a few responses that believed that the role and importance of data was not adequately reflected in the scope of the study, with one response highlighting in particular the importance of the CMA working closely with the Information Commissioner’s Office (ICO) on this issue.
9. The second group were three respondents who offered the strongest challenge to the proposed scope. In each case, this challenge appeared to be set on the basis that we have not taken a sufficiently broad or holistic view of mobile ecosystems, such that we had failed to recognise the fierce competition that exists in certain markets, or the benefits that current market dynamics deliver for consumers and other market participants. These respondents encouraged us to:
• look even more broadly at the sector to fully understand current competitive dynamics, noting in particular that several operating systems were in use across smart speakers, security systems and wearables;
• recognise that more competition in some areas of the ecosystem will come with trade-offs in others, potentially resulting in higher costs and reduced innovation elsewhere;
• consider the benefits that come from existing market dynamics, highlighted in particular the role of Apple and Google acting as ‘ecosystem stewards’, which they considered resulted in more stable ecosystems, to the benefit of developers.
B4
Theme 1: competition in the supply of mobile devices and operating systems
Overview
10. Though not a universally held view, there was a general recognition from most respondents that users of mobile operating systems face limited choice, and that there are various barriers to entry and expansion into this market.
11. However, some respondents did present an alternative perspective. One highlighted the benefits to developers of the status quo, and suggested app developers can ‘multi-home’ on multiple operating systems and still have many options for developing software and applications.
CMA Response:
• When determining the scope of this market study, we recognised the need to balance the extent to which we explore numerous interconnected issues across the digital sector with the need to ensure the market study was of manageable scale and sufficiently focused on detail and evidence. The feedback we received, and our work to date, gives us confidence we have struck broadly the right balance in this regard.
• As indicated in our statement of scope, technologies such as wearables and voice assistants are within scope of our study, and we have been considering the part they may play in locking consumers into a single mobile ecosystem.
• Data – and in many cases the processing of personal data – is a key part of our thinking that runs through many aspects of our study. We have sought to be as clear as possible about this in our interim report. We have continued our close working relationship with the ICO throughout this study, including engaging with them on a number of key issues discussed in this report.
• We have been mindful not to overlook the benefits that devices and software within mobile ecosystems have brought consumers, or the market opportunities that they have created for app developers and other businesses.
B5
Barriers to entry and expansion in the supply of mobile devices and operating systems
12. There was general agreement amongst most respondents that barriers to entry, economies of scale, and network effects were present in the provision of mobile operating systems.
13. In addition, there were several suggestions for how both Apple and Google might be influencing these conditions to their advantage, for instance through their ability to dictate the terms of contracts and agreements with device manufacturers, and the introduction of special features and default settings, which they used to enhance network effects and limit competition.
14. However, several respondents felt that more consideration of the benefits provided by the current mobile ecosystems was needed. These respondents also highlighted that there could be varying effects across different parts of the market if any existing dynamics (ie structural, commercial, etc.) were altered. For example, one response highlighted that while limited interoperability may constrain competition, it may also bring a variety of benefits for users. It argued that while there could be benefits for competition from lowering barriers to entry, such as improved interoperability resulting from the greater ease with which consumers could switch between operating systems or devices, this could also increase costs to app developers.
Areas for further consideration in Theme 1
15. In addition to the above comments, we received a number of suggestions from respondents about areas that needed further consideration within this theme, including:
• the importance of understanding the differing business models of Apple and Google, how these differ from traditional models, and the implications of this for their incentives and competition;
• the history of operating systems in the UK and how this compared with the rest of Europe;
• emerging trends and disruptive technologies such as cloud-based services and consider whether Apple or Google could prevent such disruption; and
• Google’s agreements with third-party device manufacturers and whether device manufacturers are subject to coercive commercial pressure from Google.
B6
16. We also received suggestions that there would be value in the CMA gathering evidence on the following policy areas that could further enhance competition:
• promoting active consumer choice, including on understanding the behavioural evidence around choice architecture;
• promoting users’ ability to switch between operating systems and on understanding how greater interoperability affects switching; and
• promoting consultation with affected businesses in advance of any major product changes by operating system providers.
Theme 2: competition in the distribution of mobile apps
Overview
17. Several respondents referred to the presence of barriers to entry, economies of scale and network effects in the distribution of mobile apps. In addition, there was concern that Apple and Google were taking advantage of their position within the market, by making potentiality exploitative agreements with app developers (in the case of Apple and Google) and device manufacturers (in the case of Google).
18. Some responses also raised concerns about how Apple and Google’s actions enhanced consumer lock-in, for example through their in-app purchase requirements. These respondents suggested that there should be greater focus within the market study on understanding how Apple’s and Google’s actions contribute to consumer lock-in.
CMA Response:
• We have noted suggestions for areas to focus on within this theme, and these are reflected in our interim report. For instance, Chapter 2 sets out our understanding of Apple’s and Google’s business models, and how these affects their incentives, while Chapter 3 and Appendix E set out in substantial detail our understanding of Google’s agreements with device manufacturers.
• We have also taken note of the points made which highlighted the many benefits of the current mobile ecosystems, and the potential trade-offs and risks that may result from substantially altering the competitive dynamics within and between mobile ecosystems.
B7
19. However, others pointed to the benefits of the way in which ecosystems currently operate. In particular, one respondent argued that the indirect network effects are beneficial to developers, as the platforms have the incentive to invest in the service to attract more developers.
20. Another also argued that the absence of new app store market entrants was not a source of concern, given the high levels of innovation in the market as a whole. Rather than new app stores, it argued that investment and innovation was focused on the next technology that would become popularised on smartphones.
Alternatives to distributing native apps within the device
21. A small number of respondents commented directly on the viability of alternatives to the App Store and Play Store, and on the extent to which they act as a competitive constraint on Apple and Google.
22. Several respondents noted the availability of alternatives on Android devices, such as alternative app stores, sideloading and access to web apps and web pages. Google noted that it was possible to access app stores on other devices, such as games on traditional games consoles (eg Xbox, PlayStation) and handheld consoles (eg Nintendo Switch), or video streaming services via smart TVs.
23. Google also said that pre-installation agreements between device manufacturers and individual app developers offers another viable alternative to distributing native apps through app stores or sideloading apps. It cited Facebook, Spotify, and Microsoft as examples of apps that were pre-installed on certain manufacturers’ devices. Other respondents also cited the benefits of pre-installed native apps, highlighting the convenience from a consumer’s perspective and alignment with consumer expectations.
24. However, several respondents noted that while there were alternatives available to Google’s app store, many of these alternatives faced other limitations. For instance, that alternative app stores faced technical challenges not faced by Google’s app store, such as not being able to automatically update apps (although it was also noted that the forthcoming Android 12 operating system may solve this limitation). Several respondents, including both Apple and Google, highlighted that sideloading carries additional security risks (with Apple citing security as one of the main reasons it does not allow sideloading onto its devices).
B8
25. Furthermore, while some parties highlighted the benefits of web apps over native apps for developers,3 a number of parties stated that web apps are presently not effective substitutes for native apps. Several respondents highlighted that the limitations of web apps were due at least in part to restrictions imposed by design.
Apple and Google in-app purchase requirements
26. Several responses raised concerns about the impact of Apple’s and Google’s
requirements on developers to use their in-app purchase systems. Concerns raised regarding in-app purchase requirements included:
• platform operators using their control of platforms to require the use of their in-app payment services, extracting high levels of fees from other companies (for example, a 30% commission on in-app purchases), impacting developer margins, and potentially disincentivising new developer entry into the market;
• negative effects on competition in the mobile payments market and, more generally, the payment systems market, as a result of only one payment method for in-app purchases of digital goods being available on the App Store and Play Store;
• consumers potentially being deprived of the innovation and flexibility offered by other payment systems and having better after-sale services (including discounts, special offers, etc); and
• Apple and Google getting preferential access to key commercial information such as app developer customer lists, purchasing activities, and the success of subscriptions and in-app products – thereby gaining valuable insights to assist the development of their own proprietary apps.
27. However, one response made the argument that payment processing was just one aspect of the various services provided by software platforms (in addition to access to users, marketing, privacy and security), and that complaints were primarily being brought by a small number of large developers with global brands.
28. While Google did not comment on this issue in its response, Apple explained that its in-app payment system is a mechanism for Apple to charge a
3 In particular, it was highlighted that web apps would allow developers to create one universal app, which could be updated more easily, for instance reducing the risk of bugs.
B9
commission for the sale of digital content through the App Store, which is how Apple earns a return on its investment.
Theme 3: competition in the supply of mobile browsers and browser engines
Overview
29. Several respondents provided comments on the browser market and raised concerns about effective competition in this area. Many of these related to concerns around the way in which Apple and Google appear to have control over the way browser engines and the user interface (the browsers) operate on iOS and Android.
30. There were several suggestions that many users were not aware of alternative choices of browser; and that those that were aware of alternatives may not be able effectively to choose between browsers due to a general lack of awareness of other restrictions applied to browsers. For instance:
• Several respondents commented on the impact of default settings and pre-installation of browsers on consumer choice.
• Respondents also raised concerns around Apple’s WebKit restriction on iOS, which limited the underlying browser engine on Apple phones to WebKit, even though it appeared to offer a choice of overlying browser. Respondents argued this gave a false illusion of consumer choice, while also restricting browsers on Apple phones to the functionality of Safari. Some highlighted that as a consequence of Apple’s restriction, it had
CMA Response:
• We note that there were mixed views on a variety of issues within this theme, including on the viability of the various potential substitutes to Apple’s and Google’s app stores. The extent of competitive constraints relating to app distribution is considered in Chapter 4. The impact of in-app purchase requirements is also discussed in Chapters 4 and 6.
• Through the first half of the study, we have sought to gain further evidence regarding any potential limitations or security concerns regarding alternatives to app stores such as sideloading and web apps. These factors are discussed in Chapter 4 of our interim report, and also feature in our identification of potential interventions in Chapter 7, where we invite further views on such issues.
B10
further power to limit the functionality and viability of progressive web apps as an alternative to native apps.
• Respondents also highlighted the links between browsers and general search functions and the potential for leveraging from browsers into other markets.
• Some respondents also suggested that Apple and Google have an overall incentive to limit the usability of web apps compared to mobile apps, as they each operate proprietary app stores from which they take a percentage cut of payments taken.
31. However, Google’s response offered a defence of its position in respect of enabling competition between browsers on its Android platform, highlighting that users had a choice of browsers and browser engines on Android, and that device manufacturers could pre-install rival browsers.
32. Looking further ahead, one respondent also said that significant changes were likely to emerge in the market for browsers and browser engines, as a result of disruptive innovations around voice, virtualisation, and natural language search systems.
Theme 4: the role of Apple and Google in competition between app developers
Overview
33. We received several responses that highlighted concerns over ways in which Apple and Google can influence competition between app developers. These included concerns about:
CMA Response:
• In light of the responses received, a key focus of our work in the first half of our study has been to better understand the impacts that Apple’s restrictions on alternative web browsers and browser engines have on competition and consumer choice. We have also sought to understand Apple’s rationale for these restrictions in as much detail as possible.
• In addition, we have sought to understand the real-world impact of changes Google has made that ought in principle to promote greater competition and choice, such as the choice screen for setting the default browser on Android devices that it is now required to offer following action by the European Commission.
B11
• Apple and Google’s ability to influence competitive outcomes and distort consumer choice through the algorithms they use which determine how particular apps are featured, displayed, or ranked through the ‘search’ functionality on their app stores.
• the ability for Apple and Google to provide their own apps with a competitive advantage, by having them pre-installed (and sometimes undeletable) and/or setting them as the default on their respective operating systems. In addition, it was noted that Apple’s own apps cannot be rated by users and that this may protect them from user criticism.
• A lack of transparency around the app review process and subsequent decision-making.
34. Multiple respondents also raised strong concerns with us that Apple’s and Google’s access to commercially sensitive data, through the operation of their app stores, provided them with a competitive advantage by allowing them valuable insight into the performance of various apps on their ecosystems, which is not available to third-party developers. Respondents claimed that this also gives Apple and Google access to information in relation to innovative products and services, enabling them to develop their own, similar products. Some of these respondents went on to argue that these dynamics may ultimately harm consumers insofar as they reduce developers’ incentives to innovate.
35. However, others offered alternative views to the above. In particular, we heard that:
• Apple and Google have strong incentives to provide high quality search services to users of their app stores;
• pre-installed or default apps can provide high value to users of mobile devices, in particular in terms of convenience; and
• the app review processes are important for smaller and less well-known developers to obtain the trust of consumers that an app is safe to download and free of viruses, malware, or illegal content.
36. Both Apple and Google made the case that they each support app developers, and that their incentives are strongly aligned with positive consumer outcomes in this regard:
• Apple explained that it ‘depends on innovation by third-party app developers to compete, as the App Store is a key feature of iPhone’ and
B12
that its ‘incentives are to give consumers choice, while ensuring that its consumers are not exploited’.
• Google noted that it has ‘introduced a wide range of measures to keep distribution costs in Play low, deliver tools and services that add value for developers, and treat developers equitably’. It also said that ‘Play ranks Google-owned and third-party apps consistently. The fact that we develop an app does not change the position in which it appears in response to a query in Play.’
Apple’s ATT changes
37. In addition to the above, and specific to Apple, we received a range of views and concerns on the way that it has implemented its App Tracking Transparency (ATT) changes. These changes, introduced in April 2021 on iOS 14 devices, give users a choice to ‘opt-in’ to allow developers to track their activity across different platforms. A number of respondents expressed concern that Apple is able to ‘self-preference’ its own advertising services by impairing advertising on iOS via ATT while at the same time expanding its own advertising.
38. We also heard concerns that Apple’s ATT changes will substantially reduce revenues for those app developers whose business model relies on advertising rather than, for example, subscriptions. A couple of respondents highlighted that opt-in rates to allow ‘tracking’ are even lower than was initially expected.
39. Apple explained in its response to our Statement of Scope that the protection of its users’ privacy is highly important to it. With respect to ATT, Apple made the point that these changes empower consumers to make decisions about their own privacy. Furthermore, Apple said that it holds its own service to the same data protection and user privacy standards as it requires from third-party app developers.
CMA Response:
• It was noted that under this theme a variety of views were presented on each of the main issues raised in our Statement of Scope. Apple’s and Google’s influence over competition between app developers is considered further in Chapter 6.
B13
The range of potential remedies
Overview
40. The majority of respondents commented directly on potential remedies. Of those who did, most agreed that the range of remedies being considered by the CMA was appropriate. Several respondents also stressed the importance of effective enforcement of remedies. It was also suggested that where issues cut across different sectors, the CMA should collaborate with sector-specific regulators on solutions.
41. Some respondents highlighted the work taking place in other jurisdictions in this space. For example, one response said it would be useful to collate lessons from other regulatory decisions against Google and Apple, to consider whether such findings could be applied elsewhere.
42. Some respondents recommended going further than the remedies outlined by the CMA, including one that argued that the CMA should consider whether mobile platforms should be regulated as utilities, given the importance of these platforms to the modern economy. On the other hand, a few respondents stressed that remedies should not be decided before a market assessment had concluded that competition issues were present. They argued that remedies could have knock-on consequences that would be detrimental to the ecosystem as a whole and could harm consumer choice.
Comments on remedies relating to limiting platforms’ ability to exercise market power
43. There was general support for remedies aimed at Apple’s and Google’s ability to exploit market power. This included support for: requirements on fair and reasonable terms and conditions; requirements on transparency and data sharing, including increased transparency of decision making; and limiting the ability of platforms to self-preference their own services.
44. Several respondents also gave explicit support to requirements on platform operators to allow access to other services through their platforms (such as through allowing alternative app stores or payment mechanisms, a choice of browsers, or improved access to web apps).
45. Several respondents specifically supported remedies aimed at increasing transparency around how platforms operate and make decisions. This included support for transparency on how services were bundled, as well as fair and transparent processes for resolving disputes.
B14
46. In addition, one respondent said that future codes of conduct developed by the Digital Markets Unit should be designed with flexibility to be able to capture future technological developments, such as e-SIMs, to ensure that unfair terms and conditions are not imposed in new markets linked to existing mobile ecosystems.
47. A few respondents argued that there should be remedies aimed at strengthening intellectual property rights. One said that inventors’ patent rights needed to be enforced, including by increasing the penalties for infringements.
48. Some responses indicated that that exploitation of market power could already be tackled under existing powers. One pointed to several, potentially unlawful anti-competitive practices which warranted further research by the CMA, including not allowing competing app stores on devices, and the misappropriation of innovative technology.
49. Apple, however, argued that it was already operating under similar terms and conditions as others on their store and said that it already applied the same standards, for instance on privacy and ATT, to itself as it did to others. Apple also argued that allowing some potential solutions, ie sideloading, would weaken security in the app store.
Comments on remedies relating to interventions to promote interoperability and common standards
50. A number of respondents felt that remedies to promote interoperability and common standards could be useful. One highlighted the importance of data portability, and said that interoperability and data portability would spur competition and innovation.
51. On the other hand, another response argued that enforcing interoperability standards was likely to reduce competition. Another suggested that, given the rapidly evolving nature of tech, it would be challenging to see interoperability remedies work effectively. Instead, their view was that platforms would be able to frustrate regulation by renaming existing products or deploying new ones.
Comments on consumer choice interventions
52. There was general support for remedies aimed at promoting consumer choice. In particular, there was support for consumers being given increased choice over the use of their data. There was also support for the CMA gathering behavioural evidence on choice architecture.
53. However, one response said that consumer choice remedies may not be sufficient if they focus solely on increasing consumer awareness, due to the
B15
market power of platform providers. While it argued that the CMA was right to focus on consumer choice architecture and defaults presented to consumers, it said that such remedies needed to be accompanied by forced liberalisation of the market.
54. Another respondent also pointed to the importance of developers owning the direct relationship with consumers and said that developers should be able to communicate directly with their users through their apps, while another said the CMA should consider whether remedies were needed to address Apple’s and Google’s position between users and suppliers.
55. We also received views that despite the impact on competition, there should not be a ban on pre-installation of apps due to the social welfare benefit that this practice can offer.
Comments on separation remedies
56. Several respondents commented that separation remedies should not be ruled out. In particular, one said that separation remedies could create a more robust market, lead to enhanced competition, spur innovation and increase consumer choice, adding that if Android were separated it could allow for non-discrimination in the treatment of apps, and true open access for developers. The same response also said that structural separation would be easier for regulators to manage and would be less easy for its targets to manipulate than behavioural remedies.
57. We heard in another response that separation remedies presented credible solutions to inherent conflicts of interest in mobile ecosystems, suggesting three potential separation remedies which could help establish a functioning competitive marketplace:
• separation of provision of in-app payment processing services from operation of app store platforms;
• separation of app quality review function from the operation of app store platforms and provision of operating systems; and
• separation of operation of app stores from mobile operating system development.
58. However, support for separation remedies was not universal, with a few respondents making the following points:
B16
• while separation remedies could help promote competition and lower prices, they could also have unintended consequences, including by stagnating innovation; and
• that separation remedies may not necessarily solve competition problems within mobile ecosystems, and that in some cases behavioural remedies would be more appropriate.
Our proposed approach to evidence gathering
59. Most responses that commented on this issue were in agreement with our proposed approach to evidence gathering. There were some suggestions of potential additional steps that we should take, including:
• requesting further information from small and micro-enterprises;
• drawing on previous research undertaken by the CMA and international counterparts in similar investigations;
• requesting non-public documentation, witness statements and evidence from US and EU proceedings where possible; and
CMA Response:
• We have considered all views and recommendations on responses carefully when assessing which remedies to examine in further detail in the event that we identified potential issues in the market.
• In particular, as raised by several respondents, we are aware of the need for any interventions to be designed in a way that is effective, enforceable, and future-proofed, while also seeking to limit unintended consequences.
B17
• supplementing any data the CMA is able to gather from Apple and Google with research from other sources such as consumer studies.
Views on a market investigation reference
60. In our market study notice we invited representations on whether to make a market investigation reference under section 131 of the Enterprise Act 2002.
61. We have not received any representations to make a market investigation reference in any of the responses we received nor during any separate engagement with stakeholders in the first half of our study.
62. In Chapter 9 of this interim report, we explain why we do not propose to make a market investigation reference at this time.
CMA Response:
• Our evidence gathering throughout the first half of our study has been expansive, including making strong use of our powers to request information from parties.
• However, we have sought to minimise burdens on businesses where possible, including by drawing from existing research and gaining insights from relevant work carried out in other jurisdictions around the world.
• We have highlighted a number of areas within our interim report that we will focus on in the second half of our study in order to strengthen our understanding of competition in these markets.
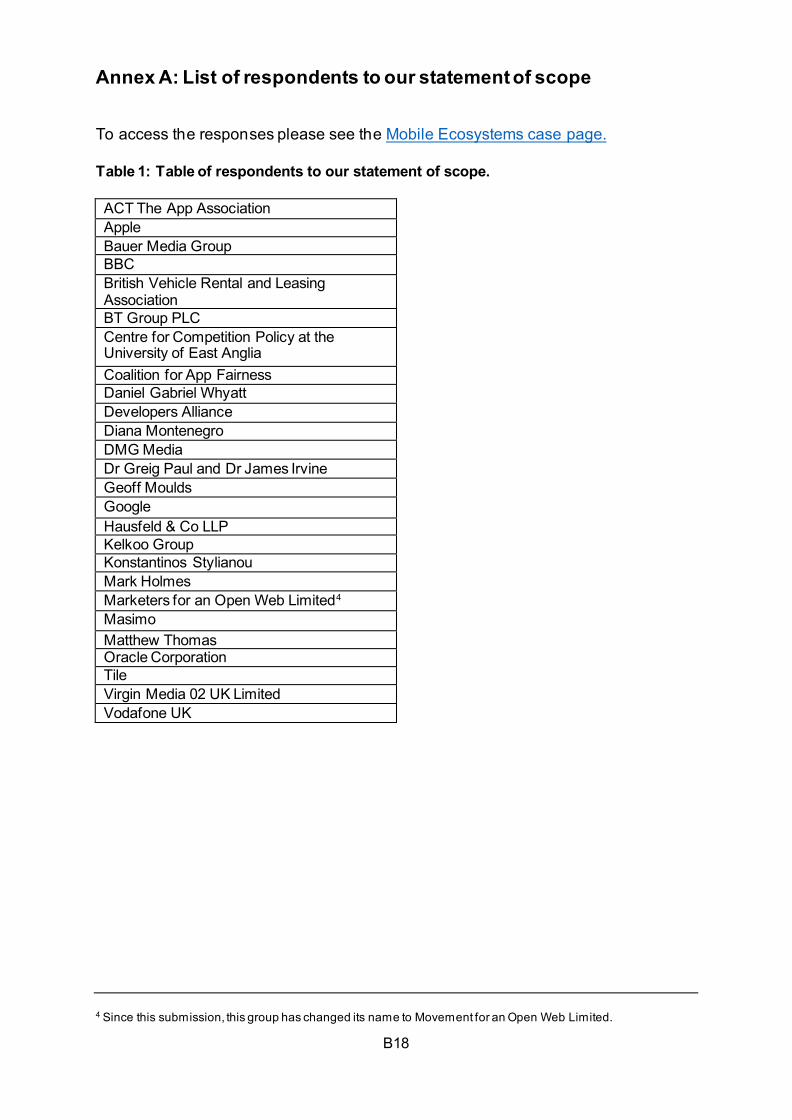
B18
Annex A: List of respondents to our statement of scope
To access the responses please see the Mobile Ecosystems case page.
Table 1: Table of respondents to our statement of scope.
ACT The App Association Apple Bauer Media Group BBC British Vehicle Rental and Leasing Association BT Group PLC Centre for Competition Policy at the University of East Anglia Coalition for App Fairness Daniel Gabriel Whyatt Developers Alliance Diana Montenegro DMG Media Dr Greig Paul and Dr James Irvine Geoff Moulds Google Hausfeld & Co LLP Kelkoo Group Konstantinos Stylianou Mark Holmes Marketers for an Open Web Limited4 Masimo Matthew Thomas Oracle Corporation Tile Virgin Media 02 UK Limited Vodafone UK
4 Since this submission, this group has changed its name to Movement for an Open Web Limited.
C1
Appendix C: market outcomes
Introduction
1. This appendix presents data on market outcomes. We first present data on outcomes relating to mobile devices and operating systems including shares of supply and the prices of mobile devices. We then set out outcomes relating to app distribution. Finally, we present data on outcomes relating to mobile browsers.
Mobile devices and operating systems outcomes
2. In this section we present an analysis of:
• shares of supply in mobile devices;
• the prices of mobile devices including how they have changed over time and differ between mobile devices using different operating systems; and
• shares of supply in mobile operating systems.
Mobile device shares of supply
Source of data
3. The data underlying this analysis comes from market participants and Statcounter.1 We first explain the nature of the data from market participants and then from Statcounter.
4. We received yearly data on the volume of sales of mobile devices from Amazon, Apple, Google, Huawei and Samsung. Each party’s description of the data provided is listed below:
• Google: provided, in response to a formal CMA request, the number of Android device activations. Google explained that it does not have internal data on the number of third-party Android devices sold and device activations are a reliable proxy for the number of Android devices sold. Google also provided the number of Pixel smartphones that were activated in each year [].
1 We also received volumes data from IDC (International Data Corporation). As set out below, this data related to the number of units shipped into the UK rather than the volume of units sold. Therefore, while we have used it for our assessment of prices, we have not used it to estimate shares of supply.
C2
• Apple: provided the number of devices sold net of the number of devices returned/traded-in.
• Amazon: provided the number of Fire OS tablets purchased in each year.
• Huawei: provided the number of devices purchased in each year.
• Samsung: provided the number of devices purchased in each year.
5. In addition, we received yearly data from the same market participants relating to active devices. Each party’s description of the data provided is listed below:
• Google: provided, in response to a formal CMA request, separately the number of active Android smartphones,2 the number of active Android tablets and the number of active Pixel smartphones for the UK in each year. [].
• Apple: provided the number of transacting accounts. Apple defined this as an account that performed a purchase (free or paid app, paid in-app, subscription) on a particular device/platform across all Apple services during the relevant period. The variable only includes transacting accounts as performed on the relevant device.
• Amazon: provided the number of active Fire OS tablets in each year.
• Huawei: provided the number of active devices in each year.
• Samsung: provided the number of active devices in each year.
6. While we only requested data from a limited number of manufacturers, the data provided covered the four main operating systems available on mobile devices in the UK. Namely, it included data from Apple on all iOS mobile devices, Google on all Android devices, data from Amazon on all its Fire OS tablets and data from Huawei on all its HMS devices.3 As such we were able to estimate the total market size in terms of new sales using this data and then estimate shares of supply for the five manufacturers identified above.
7. We have also been able to source data from Statcounter. Statcounter is a web analytics service which uses tracking code to record page views to its
2 The term ‘active devices’ differs from ‘devices activated’. This is because the number of active devices covers all devices being used by users in that year which includes devices that may have been activated by users in previous years. 3 Huawei’s HMS devices are a version of Android that meets Google’s compatibility requirements but uses Huawei Mobile Services instead of Google Mobile Services.
C3
‘member sites’, numbering over two million websites globally. Using the data generated, Statcounter publishes its Global Stats. These include shares of supply for mobile devices based on active devices.4
8. We consider the possible limitations to Statcounter’s methodology may include:
• The ‘member sites’ for which Statcounter records data may not be representative of the population of websites. Statcounter does not reweight its data to correct for any potential issues.
• It is possible that some consumers’ adblockers and browser preferences may prevent data on consumers from being sent to Statcounter.
9. Statcounter does not currently produce material assessing the extent of measurement error in its data. Further, we have heard concerns from Apple that because shares are extrapolated from internet usage rather than being based on the actual number of active devices, this ‘tends to overestimate Apple’s mobile device share for a number of reasons, including that Apple users tend to interact with their devices more frequently than other users.’
10. Therefore, for the purpose of mobile devices we have primarily relied on the data provided by market participants, but use Statcounter data as a check for our data on active devices and also because its data is available over a longer period (in some cases as far as 2009) letting us look at historic trends.
Smartphones
11. In this section we set out:
• shares of supply by manufacturer based on new smartphones data provided by market participants;
• shares of supply by manufacturer based on active smartphones data provided by market participants; and
• shares of supply by manufacturer based on active smartphones data from Statcounter.
4 For more detail see FAQ | Statcounter Global Stats, Mobile Vendor Market Share United Kingdom | Statcounter Global Stats and Tablet Vendor Market Share United Kingdom | Statcounter Global Stats.
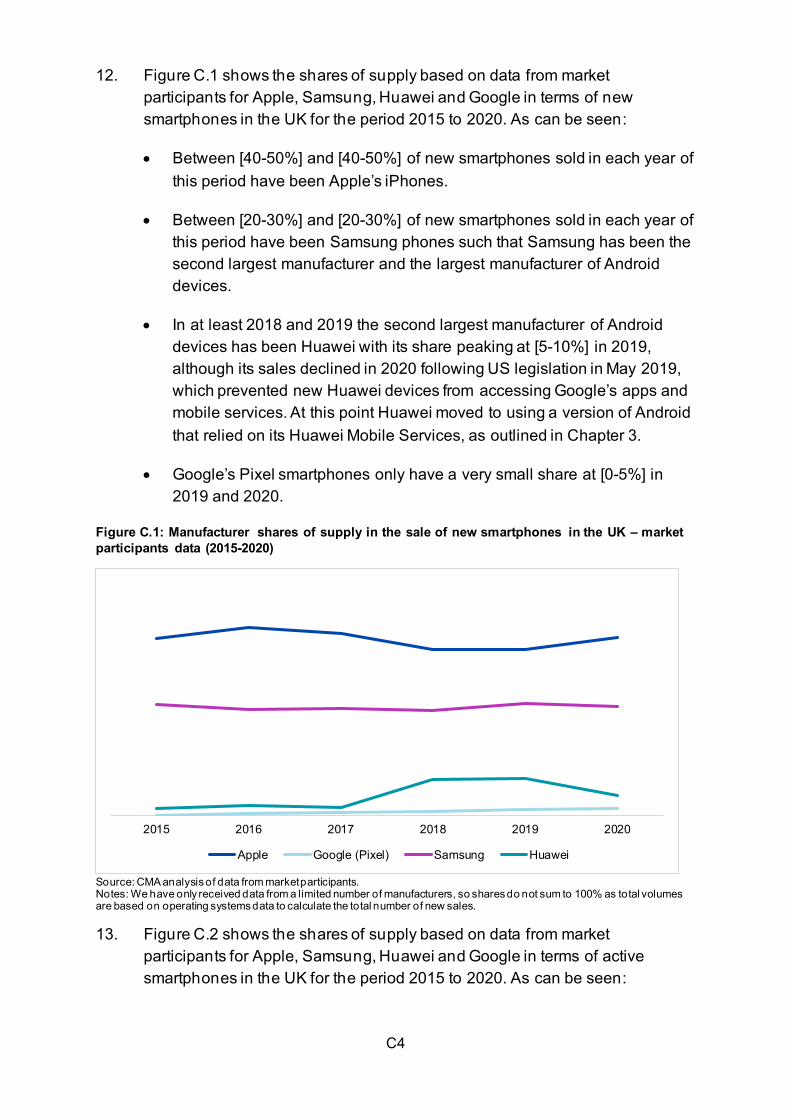
C4
12. Figure C.1 shows the shares of supply based on data from market participants for Apple, Samsung, Huawei and Google in terms of new smartphones in the UK for the period 2015 to 2020. As can be seen:
• Between [40-50%] and [40-50%] of new smartphones sold in each year of this period have been Apple’s iPhones.
• Between [20-30%] and [20-30%] of new smartphones sold in each year of this period have been Samsung phones such that Samsung has been the second largest manufacturer and the largest manufacturer of Android devices.
• In at least 2018 and 2019 the second largest manufacturer of Android devices has been Huawei with its share peaking at [5-10%] in 2019, although its sales declined in 2020 following US legislation in May 2019, which prevented new Huawei devices from accessing Google’s apps and mobile services. At this point Huawei moved to using a version of Android that relied on its Huawei Mobile Services, as outlined in Chapter 3.
• Google’s Pixel smartphones only have a very small share at [0-5%] in 2019 and 2020.
Figure C.1: Manufacturer shares of supply in the sale of new smartphones in the UK – market participants data (2015-2020)
Source: CMA analysis of data from market participants. Notes: We have only received data from a limited number of manufacturers, so shares do not sum to 100% as total volumes are based on operating systems data to calculate the total number of new sales. 13. Figure C.2 shows the shares of supply based on data from market
participants for Apple, Samsung, Huawei and Google in terms of active smartphones in the UK for the period 2015 to 2020. As can be seen:
2015 2016 2017 2018 2019 2020
Apple Google (Pixel) Samsung Huawei
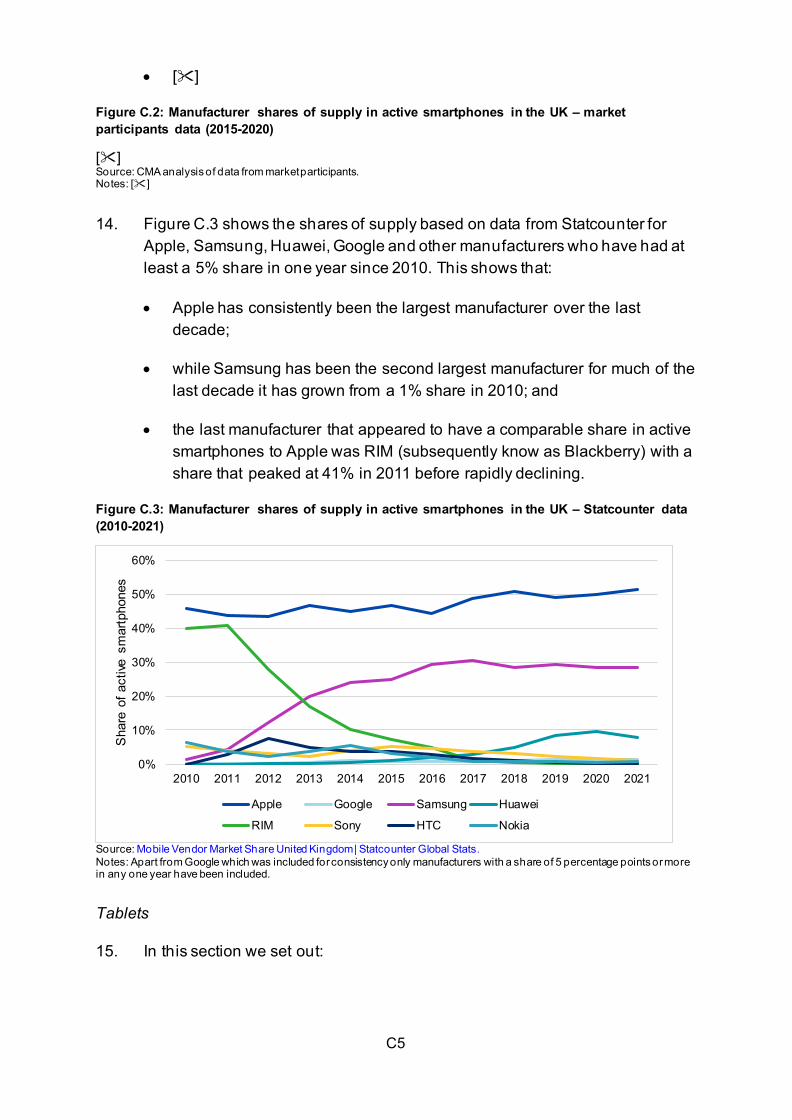
C5
• []
Figure C.2: Manufacturer shares of supply in active smartphones in the UK – market participants data (2015-2020)
[] Source: CMA analysis of data from market participants. Notes: [] 14. Figure C.3 shows the shares of supply based on data from Statcounter for
Apple, Samsung, Huawei, Google and other manufacturers who have had at least a 5% share in one year since 2010. This shows that:
• Apple has consistently been the largest manufacturer over the last decade;
• while Samsung has been the second largest manufacturer for much of the last decade it has grown from a 1% share in 2010; and
• the last manufacturer that appeared to have a comparable share in active smartphones to Apple was RIM (subsequently know as Blackberry) with a share that peaked at 41% in 2011 before rapidly declining.
Figure C.3: Manufacturer shares of supply in active smartphones in the UK – Statcounter data (2010-2021)
0%
10%
20%
30%
40%
50%
60%
2010 2011 2012 2013 2014 2015 2016 2017 2018 2019 2020 2021
Sha
re o
f act
ive s
mar
tpho
nes
Apple Google Samsung Huawei
RIM Sony HTC Nokia
Source: Mobile Vendor Market Share United Kingdom | Statcounter Global Stats. Notes: Apart from Google which was included for consistency only manufacturers with a share of 5 percentage points or more in any one year have been included.
Tablets
15. In this section we set out:
C6
• shares of supply by manufacturer based on new tablets data provided by market participants;
• shares of supply by manufacturer based on active tablets data provided by market participants; and
• shares of supply by manufacturer based on active tablets data from Statcounter.
16. Figure C.4 shows the shares of supply based on data from market participants for Apple, Amazon, Samsung, Huawei and Google in terms of new tablets in the UK for the period 2015 to 2020. As can be seen:
• Apple has consistently been the largest tablet manufacturer although Apple’s share has fluctuated starting at [40-50%] in 2015, before falling to [30-40%] in 2017 and then rising again to [30-40%] in 2020.
• Amazon’s Fire OS is only available on its own Fire tablets, so Amazon’s share of tablets mirrors its share of tablet operating systems. It has been the second largest tablet manufacturer for most of the period considered with Amazon’s share of new tablets growing materially from [10-20%] in 2015 to [30-40%] in 2017 before declining to [20-30%] in 2020.
• As with smartphones, the share of Google’s Pixel tablet is very small – [0-5%] of new tablets in 2020 in the UK – with most Android tablets being manufactured by third parties.
• Samsung has consistently been the largest manufacturer of Android tablets and the third largest tablet manufacturer for most of the period considered. Samsung’s share of new tablets has been fairly consistent ranging between [10-20%] and [10-20%] of new tablets.
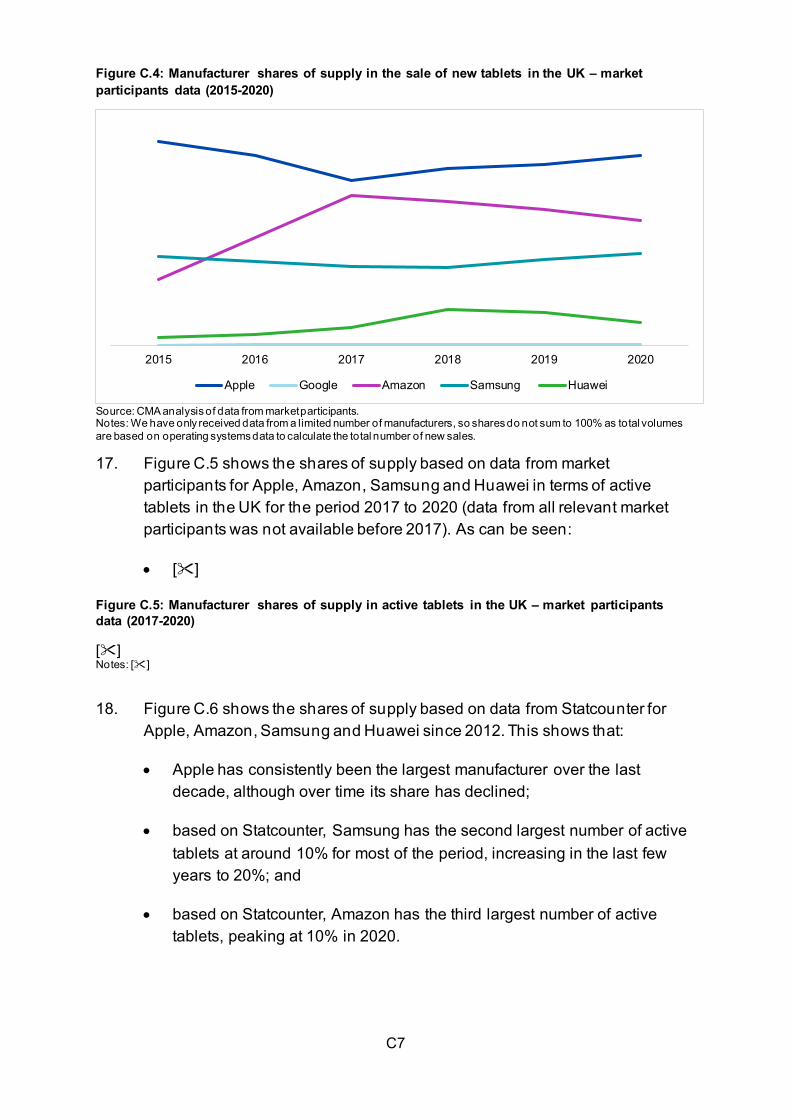
C7
Figure C.4: Manufacturer shares of supply in the sale of new tablets in the UK – market participants data (2015-2020)
2015 2016 2017 2018 2019 2020
Apple Google Amazon Samsung Huawei
Source: CMA analysis of data from market participants. Notes: We have only received data from a limited number of manufacturers, so shares do not sum to 100% as total volumes are based on operating systems data to calculate the total number of new sales. 17. Figure C.5 shows the shares of supply based on data from market
participants for Apple, Amazon, Samsung and Huawei in terms of active tablets in the UK for the period 2017 to 2020 (data from all relevant market participants was not available before 2017). As can be seen:
• []
Figure C.5: Manufacturer shares of supply in active tablets in the UK – market participants data (2017-2020)
[] Notes: [] 18. Figure C.6 shows the shares of supply based on data from Statcounter for
Apple, Amazon, Samsung and Huawei since 2012. This shows that:
• Apple has consistently been the largest manufacturer over the last decade, although over time its share has declined;
• based on Statcounter, Samsung has the second largest number of active tablets at around 10% for most of the period, increasing in the last few years to 20%; and
• based on Statcounter, Amazon has the third largest number of active tablets, peaking at 10% in 2020.
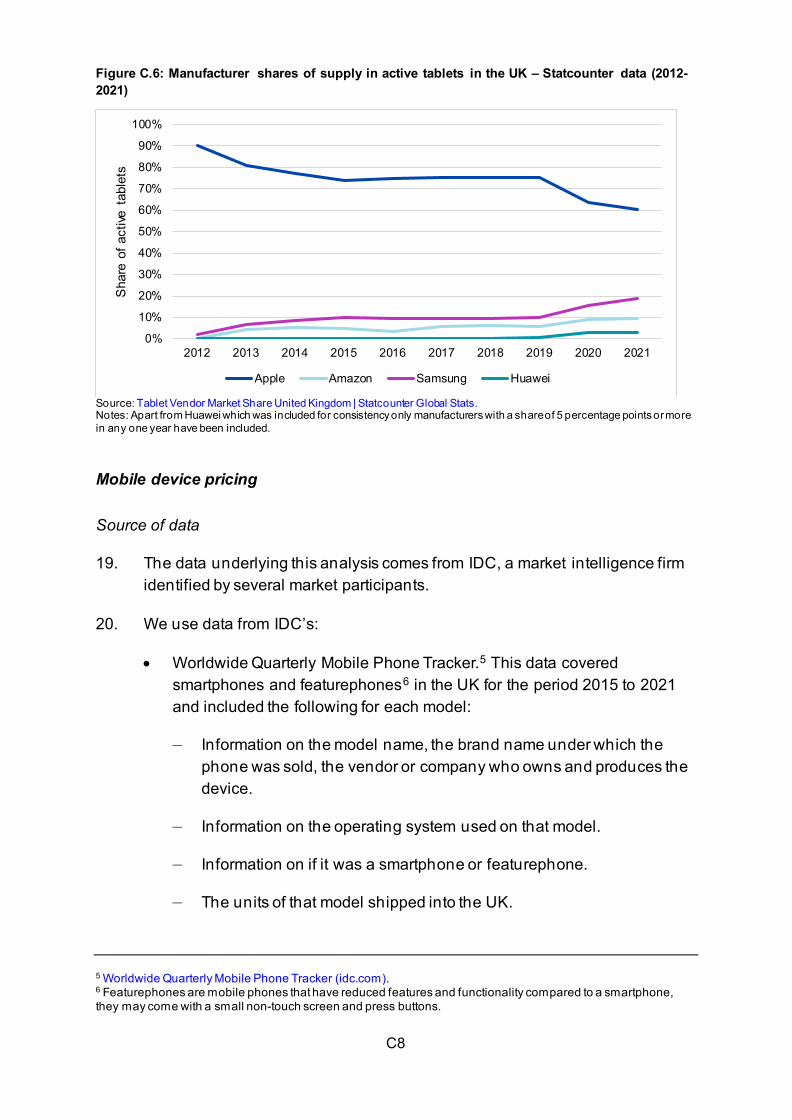
C8
Figure C.6: Manufacturer shares of supply in active tablets in the UK – Statcounter data (2012-2021)
0%
10%
20%
30%
40%
50%
60%
70%
80%
90%
100%
2012 2013 2014 2015 2016 2017 2018 2019 2020 2021
Sha
re o
f act
ive t
able
ts
Apple Amazon Samsung Huawei
Source: Tablet Vendor Market Share United Kingdom | Statcounter Global Stats. Notes: Apart from Huawei which was included for consistency only manufacturers with a share of 5 percentage points or more in any one year have been included.
Mobile device pricing
Source of data
19. The data underlying this analysis comes from IDC, a market intelligence firm identified by several market participants.
20. We use data from IDC’s:
• Worldwide Quarterly Mobile Phone Tracker.5 This data covered smartphones and featurephones6 in the UK for the period 2015 to 2021 and included the following for each model:
— Information on the model name, the brand name under which the phone was sold, the vendor or company who owns and produces the device.
— Information on the operating system used on that model.
— Information on if it was a smartphone or featurephone.
— The units of that model shipped into the UK.
5 Worldwide Quarterly Mobile Phone Tracker (idc.com). 6 Featurephones are mobile phones that have reduced features and functionality compared to a smartphone, they may come with a small non-touch screen and press buttons.
C9
— The value of those units based on UK selling prices collected from channel and supply sources across the business to business (B2B) and business to consumer (B2C) markets.
• Worldwide Quarterly Personal Computing Device Tracker.7 This data covered tablets in the UK for the period 2015 to 2021 and included the following for each model:
— Information on the model name, the brand name under which the phone was sold, the vendor or company who owns and produces the device.
— Information on the operating system used on that model.
— Information on if it was a slate tablet or a detachable tablet.
— The units of that model shipped into the UK.
— The value of those units based on UK selling prices collected from channel and supply sources across the business to business (B2B) and business to consumer (B2C) markets.
21. IDC volume data is based on Unit shipments. Unit shipments are a measure of the number of new mobile phones (branded or unbranded) shipped by a vendor to all distribution channels or directly to end users. Units are counted as the title (ie ownership) is transferred from the vendor to a channel or customer and in doing so IDC seeks to address any potential double counting. A ‘shipment’ corresponds to the sale of a complete system8 into the channel within the country of final use, or directly to an end user in a given period. Products sold through a channel in one country, but for final use in another country, are only counted in the country of final use.
22. IDC’s tracking methodology is based on a combined sell-in and sell-out approach which may lead to some differences when comparing to sell-out data only on a monthly or quarterly basis due to the time gap and inventory management.9
23. By comparing IDC data with data from market participants, the differences in volumes for smartphones appear to be more limited for the period 2017 to 2020 and this is therefore the period in which we have focused our analysis
7 Worldwide Quarterly Personal Computing Device Tracker (idc.com). 8 A complete system refers to having a product that is fully equipped to function. That is, not missing parts such as the operating system, keyboard when sold together, etc. 9 This only relates to indirect sales, as direct sales to customers are sell-out.
C10
for smartphones.10 In relation to tablets we restricted our analysis to just 2019 and 2020.11 Differences between market data sources can be related to several factors – definitions, segmentation, data sources, geography and time capture at supplier or channel level which can lead to differences on volume or revenue measurement in a given market segment, geography and period. Such differences are only likely to bias the results of the analysis set out below if there is a systematic difference between how this affects iOS devices and Android devices.
24. IDC pricing data reflects the end-user price level, and the value calculations are the result of unit shipments multiplied by ASPs. The Average selling price (ASP) is the average end-user (street) price paid for a typically configured mobile phone or tablet and based on the product specifications. The ASP includes all freight, insurance, and other shipping and handling fees, such as taxes (import/export) and tariffs, that are included in vendor or channel pricing. Point-of-sale taxes (eg value-added tax (VAT) or sales tax) are generally excluded. Subsidies offered by mobile operators are also not factored into this price. Pricing is collected across several direct and indirect channels, and while specific purchasing conditions or channel rebates are not taken into account, volume purchases by a retailer or large businesses buying in larger volumes will weigh into the average selling prices of devices.
25. Despite these potential limitations with the data, we understand that IDC’s data is widely used within the industry we are examining, and that IDC itself conducts and provides to clients an analysis based on price bands that is similar to the one we have conducted.
Smartphones
26. In this section we set out:12
• The proportion of smartphones shipped into the UK by £100 price bands for iOS smartphones and Android smartphones respectively.
• The average price, excluding VAT, of smartphones shipped into the UK for iOS smartphones and Android smartphones respectively.
27. In order to assess the proportion of smartphones shipped into the UK by £100 price bands for iOS smartphones and Android smartphones the average selling price for each model and specification was calculated. Based on this,
10 In these years the difference was less than 20% in relation to Android and iOS smartphones. 11 In these years the difference was less than 20% in relation to Android and iOS tablets. 12 For the purposes of this analysis we have not split out Huawei’s HMS devices.
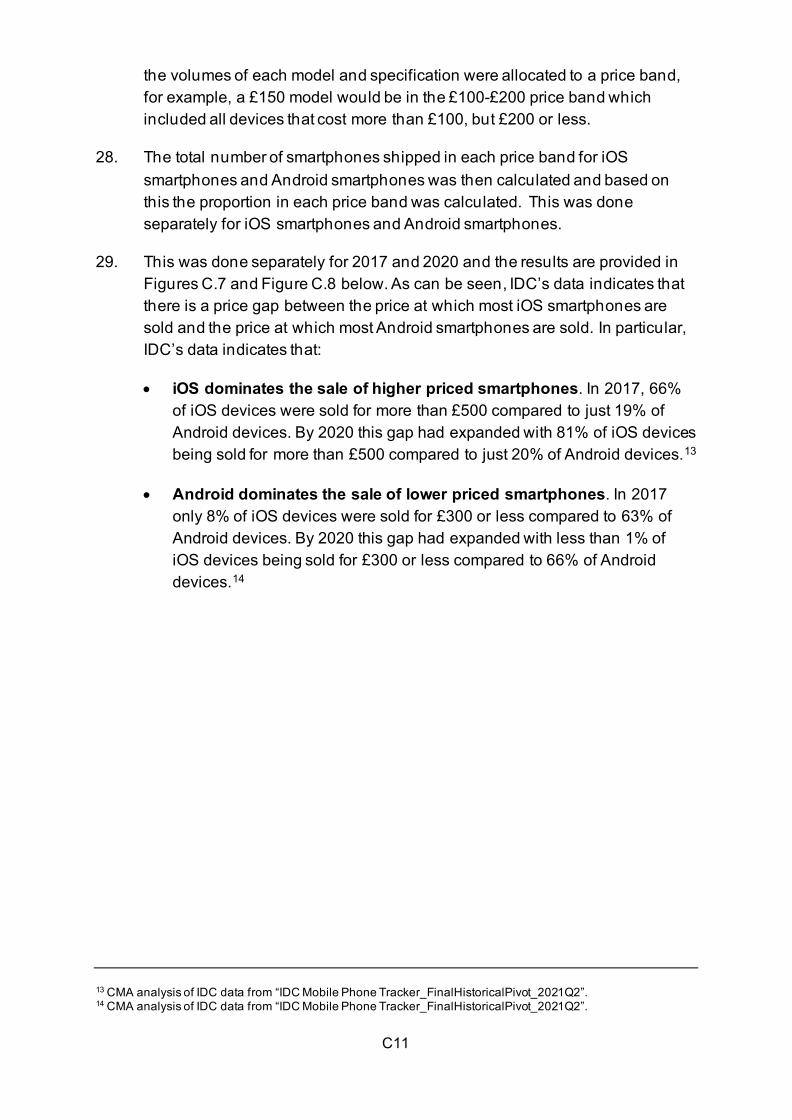
C11
the volumes of each model and specification were allocated to a price band, for example, a £150 model would be in the £100-£200 price band which included all devices that cost more than £100, but £200 or less.
28. The total number of smartphones shipped in each price band for iOS smartphones and Android smartphones was then calculated and based on this the proportion in each price band was calculated. This was done separately for iOS smartphones and Android smartphones.
29. This was done separately for 2017 and 2020 and the results are provided in Figures C.7 and Figure C.8 below. As can be seen, IDC’s data indicates that there is a price gap between the price at which most iOS smartphones are sold and the price at which most Android smartphones are sold. In particular, IDC’s data indicates that:
• iOS dominates the sale of higher priced smartphones. In 2017, 66% of iOS devices were sold for more than £500 compared to just 19% of Android devices. By 2020 this gap had expanded with 81% of iOS devices being sold for more than £500 compared to just 20% of Android devices.13
• Android dominates the sale of lower priced smartphones. In 2017 only 8% of iOS devices were sold for £300 or less compared to 63% of Android devices. By 2020 this gap had expanded with less than 1% of iOS devices being sold for £300 or less compared to 66% of Android devices.14
13 CMA analysis of IDC data from “IDC Mobile Phone Tracker_FinalHistoricalPivot_2021Q2”. 14 CMA analysis of IDC data from “IDC Mobile Phone Tracker_FinalHistoricalPivot_2021Q2”.
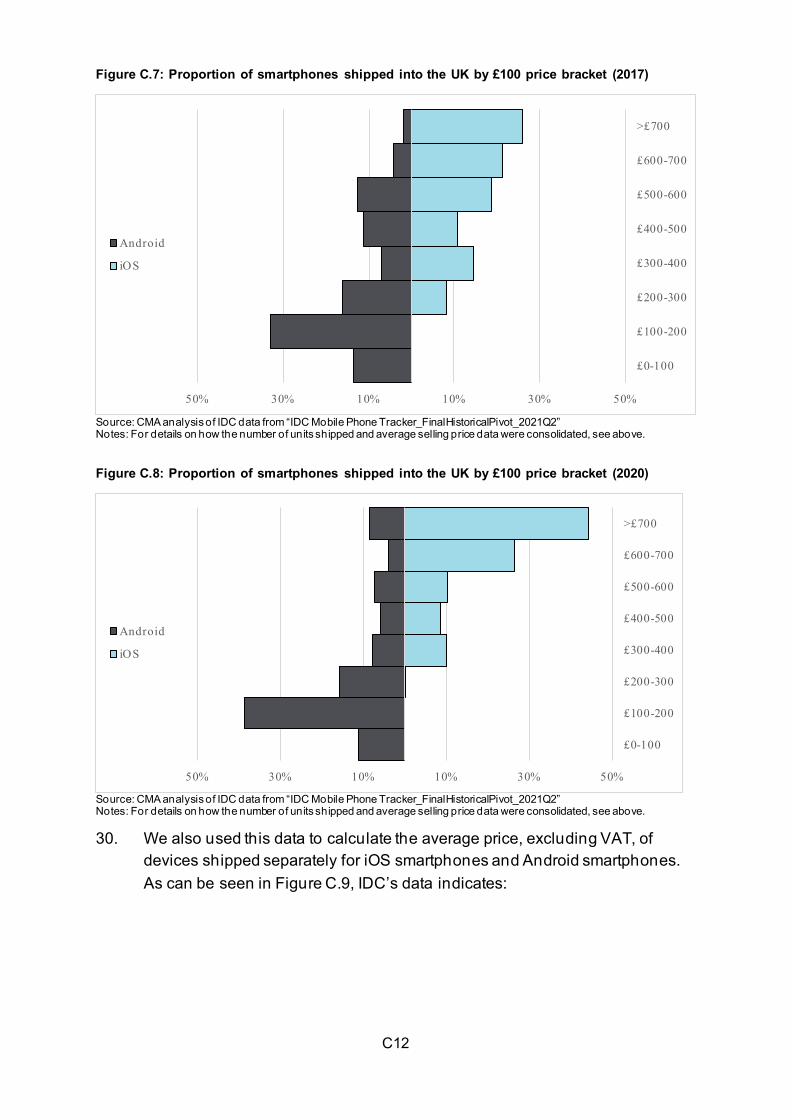
C12
Figure C.7: Proportion of smartphones shipped into the UK by £100 price bracket (2017)
50% 30% 10% 10% 30% 50%
£0-100
£100-200
£200-300
£300-400
£400-500
£500-600
£600-700
>£700
Android
iOS
Source: CMA analysis of IDC data from “IDC Mobile Phone Tracker_FinalHistoricalPivot_2021Q2” Notes: For details on how the number of units shipped and average selling price data were consolidated, see above. Figure C.8: Proportion of smartphones shipped into the UK by £100 price bracket (2020)
50% 30% 10% 10% 30% 50%
£0-100
£100-200
£200-300
£300-400
£400-500
£500-600
£600-700
>£700
Android
iOS
Source: CMA analysis of IDC data from “IDC Mobile Phone Tracker_FinalHistoricalPivot_2021Q2” Notes: For details on how the number of units shipped and average selling price data were consolidated, see above. 30. We also used this data to calculate the average price, excluding VAT, of
devices shipped separately for iOS smartphones and Android smartphones. As can be seen in Figure C.9, IDC’s data indicates:
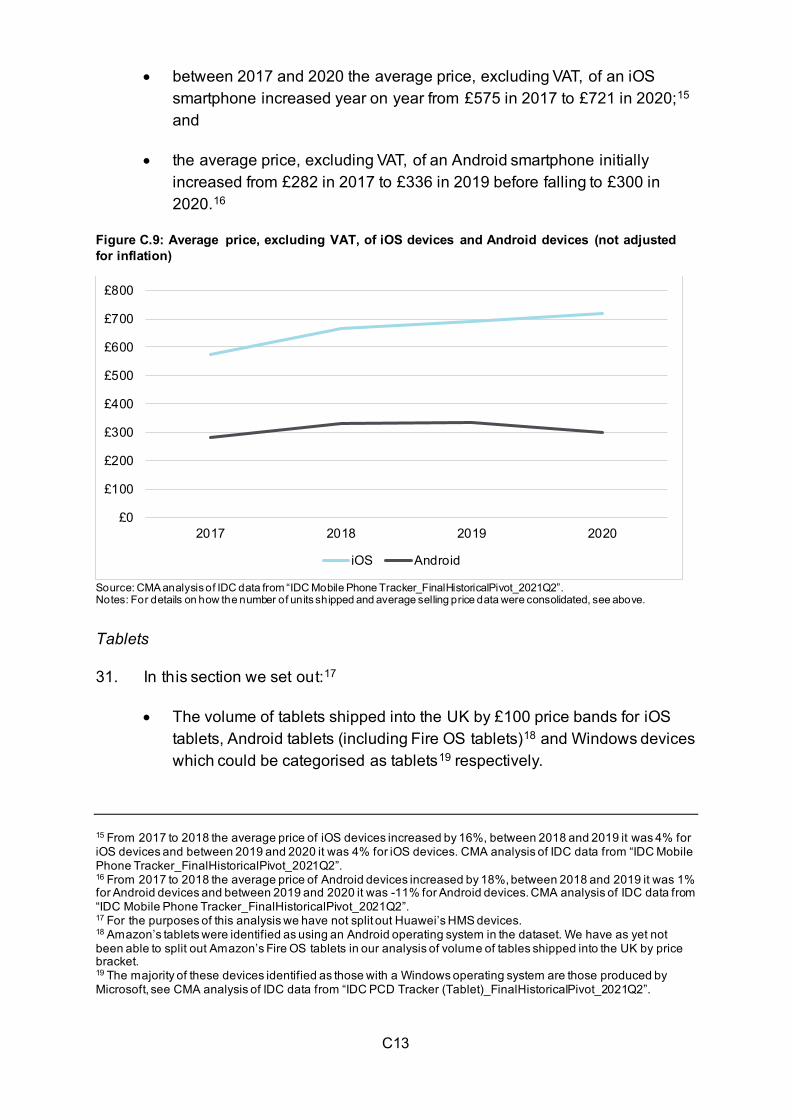
C13
• between 2017 and 2020 the average price, excluding VAT, of an iOS smartphone increased year on year from £575 in 2017 to £721 in 2020;15 and
• the average price, excluding VAT, of an Android smartphone initially increased from £282 in 2017 to £336 in 2019 before falling to £300 in 2020.16
Figure C.9: Average price, excluding VAT, of iOS devices and Android devices (not adjusted for inflation)
£0
£100
£200
£300
£400
£500
£600
£700
£800
2017 2018 2019 2020
iOS Android
Source: CMA analysis of IDC data from “IDC Mobile Phone Tracker_FinalHistoricalPivot_2021Q2”. Notes: For details on how the number of units shipped and average selling price data were consolidated, see above.
Tablets
31. In this section we set out:17
• The volume of tablets shipped into the UK by £100 price bands for iOS tablets, Android tablets (including Fire OS tablets)18 and Windows devices which could be categorised as tablets19 respectively.
15 From 2017 to 2018 the average price of iOS devices increased by 16%, between 2018 and 2019 it was 4% for iOS devices and between 2019 and 2020 it was 4% for iOS devices. CMA analysis of IDC data from “IDC Mobile Phone Tracker_FinalHistoricalPivot_2021Q2”. 16 From 2017 to 2018 the average price of Android devices increased by 18%, between 2018 and 2019 it was 1% for Android devices and between 2019 and 2020 it was -11% for Android devices. CMA analysis of IDC data from “IDC Mobile Phone Tracker_FinalHistoricalPivot_2021Q2”. 17 For the purposes of this analysis we have not split out Huawei’s HMS devices. 18 Amazon’s tablets were identified as using an Android operating system in the dataset. We have as yet not been able to split out Amazon’s Fire OS tablets in our analysis of volume of tables shipped into the UK by price bracket. 19 The majority of these devices identified as those with a Windows operating system are those produced by Microsoft, see CMA analysis of IDC data from “IDC PCD Tracker (Tablet)_FinalHistoricalPivot_2021Q2”.
C14
• The average price, excluding VAT, of tablets shipped into the UK for iOS tablets, Android tablets (excluding Fire OS tablets),20 Fire OS tablets and Windows devices which could be categorised as tablets respectively.
32. In order to assess the volume of tablets shipped into the UK by £100 price bands for each operating system the average selling price for each model and specification was calculated. Based on this, the volumes of each model and specification were allocated to a price brand, for example, a £150 model would be in the £100-£200 price band which included all devices that cost more than £100, but £200 or less.
33. The total number of tablets shipped in each price band by operating system was then calculated.
34. This was done separately for 2019 and 2020 and the results are provided in Figures C.10 and Figure C.11 below. As can be seen, IDC’s data indicates that there is a price gap between the price at which most iOS tablets are sold and the price at which most other tablets are sold. For example, IDC’s data indicates that, in 2020:
• the majority of Android tablets (including Fire OS tablets) (83%) were sold for £200 of less, whereas the data indicates that no Apple tablets were sold for £200 or less in 2020;21
• all iOS tablets were sold for £200 or more, while only 26% of rival devices were sold at that price range;22 and
• the majority of Windows devices in the data were sold for more than £700 and Apple’s tablets in the same price bracket only account for 9% of its sales.23
Microsoft explained that it offers Surface devices that run Windows but does not offer any tablets running a mobile operating system. However, Microsoft also explained that certain devices such as its Surface laptop face competition from Apple’s high-end iPad Pro. 20 While we have as yet not been able to split out Amazon’s Fire OS tablets in our analysis of volume of tables shipped into the UK by price bracket, we were able to calculate the average price of Fire OS tablets in 2019 and 2020. Our findings are presented below. 21 CMA analysis of IDC data from “IDC PCD Tracker (Tablet)_FinalHistoricalPivot_2021Q2”. 22 This includes both Windows devices and Android devices (including Fire OS tablets). CMA analysis of IDC data from “IDC PCD Tracker (Tablet)_FinalHistoricalPivot_2021Q2”. 23 CMA analysis of IDC data from “IDC PCD Tracker (Tablet)_FinalHistoricalPivot_2021Q2”.
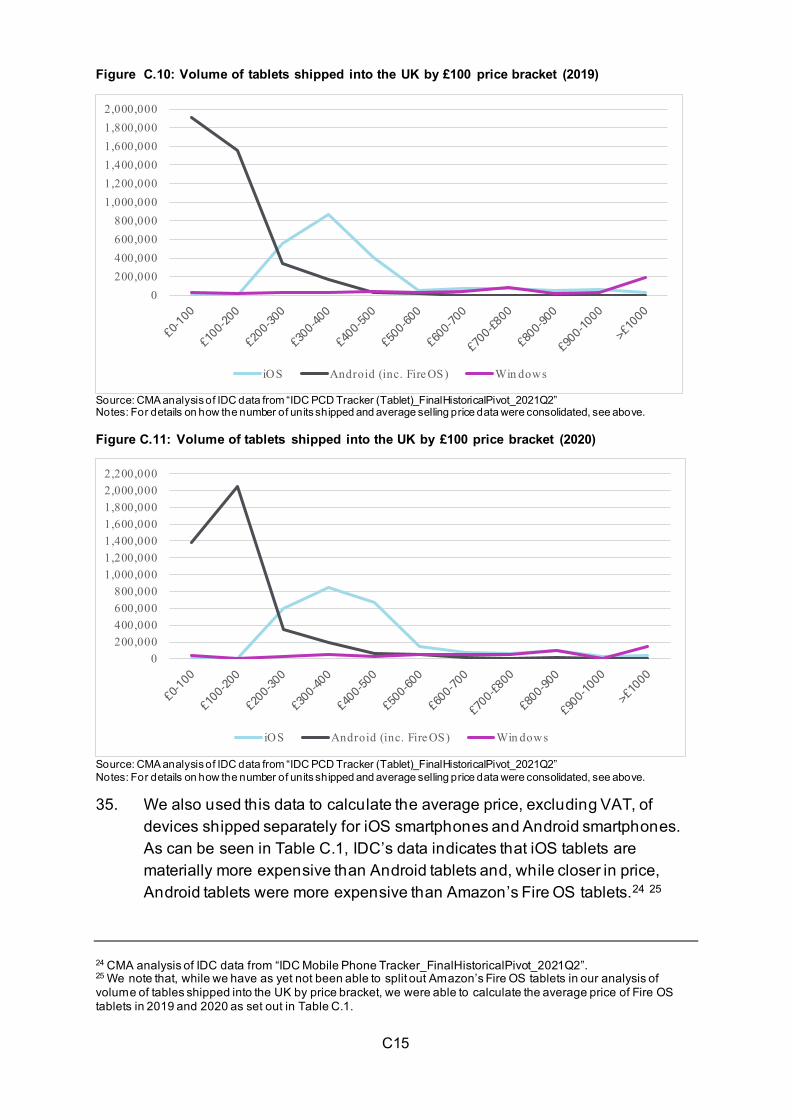
C15
Figure C.10: Volume of tablets shipped into the UK by £100 price bracket (2019)
0200,000400,000600,000800,000
1,000,0001,200,0001,400,0001,600,0001,800,0002,000,000
iOS Android (inc. Fire OS) Win dows
Source: CMA analysis of IDC data from “IDC PCD Tracker (Tablet)_FinalHistoricalPivot_2021Q2” Notes: For details on how the number of units shipped and average selling price data were consolidated, see above. Figure C.11: Volume of tablets shipped into the UK by £100 price bracket (2020)
0200,000400,000600,000800,000
1,000,0001,200,0001,400,0001,600,0001,800,0002,000,0002,200,000
iOS Android (inc. Fire OS) Win dows
Source: CMA analysis of IDC data from “IDC PCD Tracker (Tablet)_FinalHistoricalPivot_2021Q2” Notes: For details on how the number of units shipped and average selling price data were consolidated, see above. 35. We also used this data to calculate the average price, excluding VAT, of
devices shipped separately for iOS smartphones and Android smartphones. As can be seen in Table C.1, IDC’s data indicates that iOS tablets are materially more expensive than Android tablets and, while closer in price, Android tablets were more expensive than Amazon’s Fire OS tablets.24 25
24 CMA analysis of IDC data from “IDC Mobile Phone Tracker_FinalHistoricalPivot_2021Q2”. 25 We note that, while we have as yet not been able to split out Amazon’s Fire OS tablets in our analysis of volume of tables shipped into the UK by price bracket, we were able to calculate the average price of Fire OS tablets in 2019 and 2020 as set out in Table C.1.
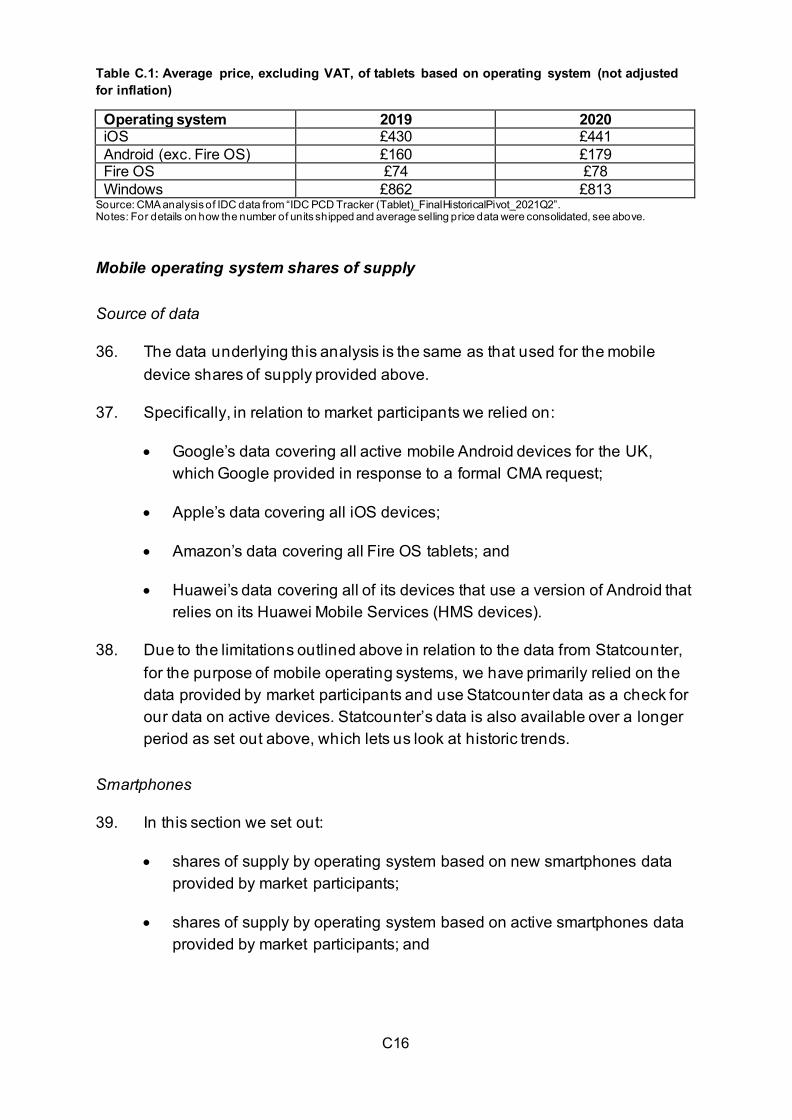
C16
Table C.1: Average price, excluding VAT, of tablets based on operating system (not adjusted for inflation)
Operating system 2019 2020 iOS £430 £441 Android (exc. Fire OS) £160 £179 Fire OS £74 £78 Windows £862 £813
Source: CMA analysis of IDC data from “IDC PCD Tracker (Tablet)_FinalHistoricalPivot_2021Q2”. Notes: For details on how the number of units shipped and average selling price data were consolidated, see above.
Mobile operating system shares of supply
Source of data
36. The data underlying this analysis is the same as that used for the mobile device shares of supply provided above.
37. Specifically, in relation to market participants we relied on:
• Google’s data covering all active mobile Android devices for the UK, which Google provided in response to a formal CMA request;
• Apple’s data covering all iOS devices;
• Amazon’s data covering all Fire OS tablets; and
• Huawei’s data covering all of its devices that use a version of Android that relies on its Huawei Mobile Services (HMS devices).
38. Due to the limitations outlined above in relation to the data from Statcounter, for the purpose of mobile operating systems, we have primarily relied on the data provided by market participants and use Statcounter data as a check for our data on active devices. Statcounter’s data is also available over a longer period as set out above, which lets us look at historic trends.
Smartphones
39. In this section we set out:
• shares of supply by operating system based on new smartphones data provided by market participants;
• shares of supply by operating system based on active smartphones data provided by market participants; and
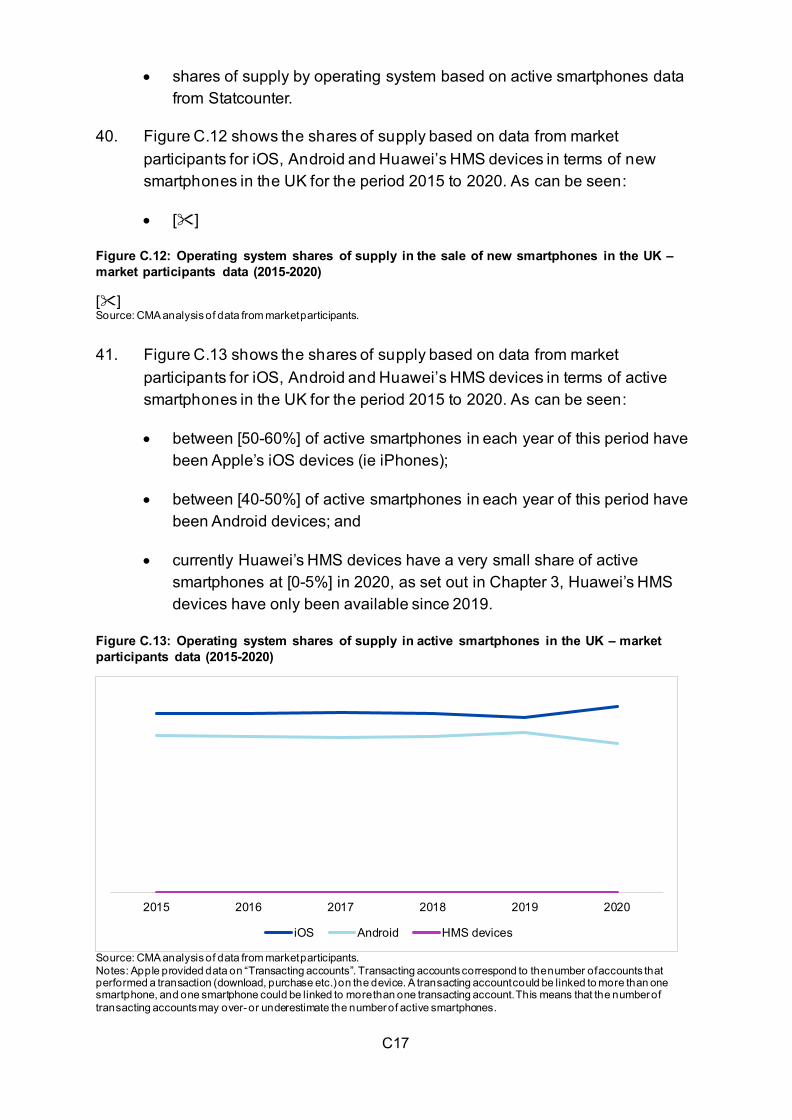
C17
• shares of supply by operating system based on active smartphones data from Statcounter.
40. Figure C.12 shows the shares of supply based on data from market participants for iOS, Android and Huawei’s HMS devices in terms of new smartphones in the UK for the period 2015 to 2020. As can be seen:
• []
Figure C.12: Operating system shares of supply in the sale of new smartphones in the UK – market participants data (2015-2020)
[] Source: CMA analysis of data from market participants. 41. Figure C.13 shows the shares of supply based on data from market
participants for iOS, Android and Huawei’s HMS devices in terms of active smartphones in the UK for the period 2015 to 2020. As can be seen:
• between [50-60%] of active smartphones in each year of this period have been Apple’s iOS devices (ie iPhones);
• between [40-50%] of active smartphones in each year of this period have been Android devices; and
• currently Huawei’s HMS devices have a very small share of active smartphones at [0-5%] in 2020, as set out in Chapter 3, Huawei’s HMS devices have only been available since 2019.
Figure C.13: Operating system shares of supply in active smartphones in the UK – market participants data (2015-2020)
2015 2016 2017 2018 2019 2020
iOS Android HMS devices
Source: CMA analysis of data from market participants. Notes: Apple provided data on “Transacting accounts”. Transacting accounts correspond to the number of accounts that performed a transaction (download, purchase etc.) on the device. A transacting account could be linked to more than one smartphone, and one smartphone could be linked to more than one transacting account. This means that the number of transacting accounts may over- or underestimate the number of active smartphones.
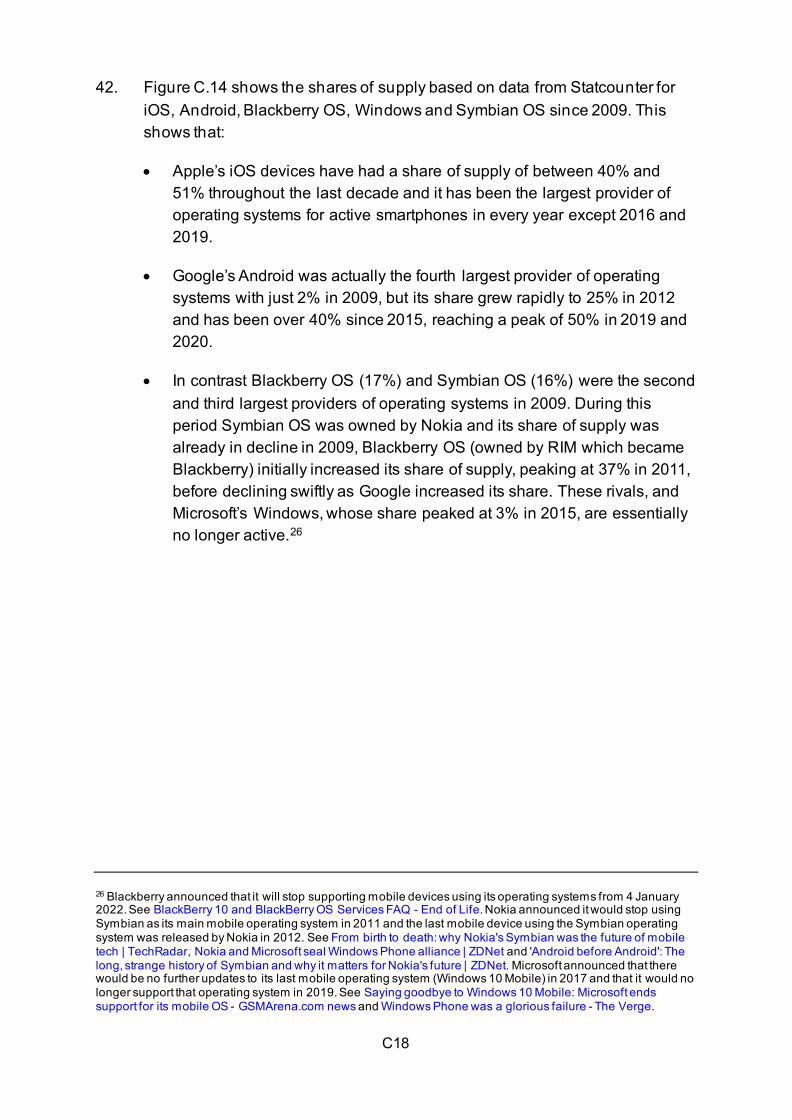
C18
42. Figure C.14 shows the shares of supply based on data from Statcounter for
iOS, Android, Blackberry OS, Windows and Symbian OS since 2009. This shows that:
• Apple’s iOS devices have had a share of supply of between 40% and 51% throughout the last decade and it has been the largest provider of operating systems for active smartphones in every year except 2016 and 2019.
• Google’s Android was actually the fourth largest provider of operating systems with just 2% in 2009, but its share grew rapidly to 25% in 2012 and has been over 40% since 2015, reaching a peak of 50% in 2019 and 2020.
• In contrast Blackberry OS (17%) and Symbian OS (16%) were the second and third largest providers of operating systems in 2009. During this period Symbian OS was owned by Nokia and its share of supply was already in decline in 2009, Blackberry OS (owned by RIM which became Blackberry) initially increased its share of supply, peaking at 37% in 2011, before declining swiftly as Google increased its share. These rivals, and Microsoft’s Windows, whose share peaked at 3% in 2015, are essentially no longer active.26
26 Blackberry announced that it will stop supporting mobile devices using its operating systems from 4 January 2022. See BlackBerry 10 and BlackBerry OS Services FAQ - End of Life. Nokia announced it would stop using Symbian as its main mobile operating system in 2011 and the last mobile device using the Symbian operating system was released by Nokia in 2012. See From birth to death: why Nokia's Symbian was the future of mobile tech | TechRadar, Nokia and Microsoft seal Windows Phone alliance | ZDNet and 'Android before Android': The long, strange history of Symbian and why it matters for Nokia's future | ZDNet. Microsoft announced that there would be no further updates to its last mobile operating system (Windows 10 Mobile) in 2017 and that it would no longer support that operating system in 2019. See Saying goodbye to Windows 10 Mobile: Microsoft ends support for its mobile OS - GSMArena.com news and Windows Phone was a glorious failure - The Verge.
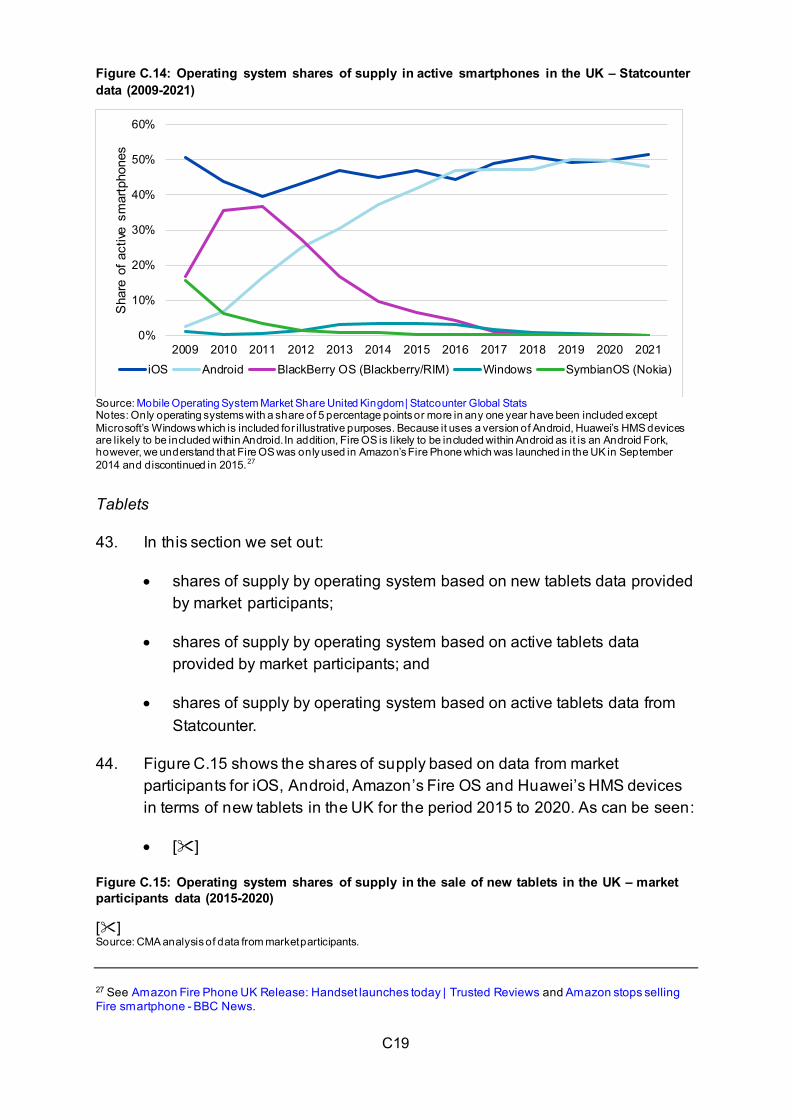
C19
Figure C.14: Operating system shares of supply in active smartphones in the UK – Statcounter data (2009-2021)
0%
10%
20%
30%
40%
50%
60%
2009 2010 2011 2012 2013 2014 2015 2016 2017 2018 2019 2020 2021
Sha
re o
f act
ive s
mar
tpho
nes
iOS Android BlackBerry OS (Blackberry/RIM) Windows SymbianOS (Nokia)
Source: Mobile Operating System Market Share United Kingdom | Statcounter Global Stats Notes: Only operating systems with a share of 5 percentage points or more in any one year have been included except Microsoft’s Windows which is included for illustrative purposes. Because it uses a version of Android, Huawei’s HMS devices are likely to be included within Android. In addition, Fire OS is likely to be included within Android as it is an Android Fork, however, we understand that Fire OS was only used in Amazon’s Fire Phone which was launched in the UK in September 2014 and discontinued in 2015.27
Tablets
43. In this section we set out:
• shares of supply by operating system based on new tablets data provided by market participants;
• shares of supply by operating system based on active tablets data provided by market participants; and
• shares of supply by operating system based on active tablets data from Statcounter.
44. Figure C.15 shows the shares of supply based on data from market participants for iOS, Android, Amazon’s Fire OS and Huawei’s HMS devices in terms of new tablets in the UK for the period 2015 to 2020. As can be seen:
• []
Figure C.15: Operating system shares of supply in the sale of new tablets in the UK – market participants data (2015-2020)
[] Source: CMA analysis of data from market participants. 27 See Amazon Fire Phone UK Release: Handset launches today | Trusted Reviews and Amazon stops selling Fire smartphone - BBC News.
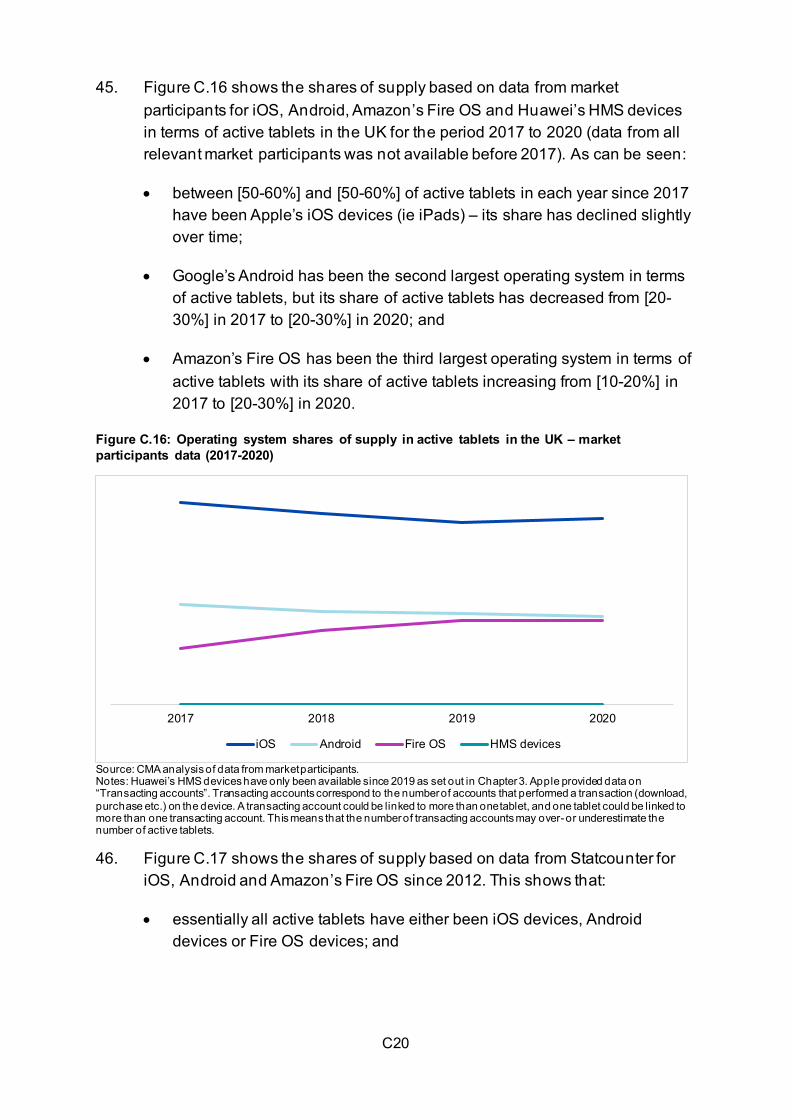
C20
45. Figure C.16 shows the shares of supply based on data from market
participants for iOS, Android, Amazon’s Fire OS and Huawei’s HMS devices in terms of active tablets in the UK for the period 2017 to 2020 (data from all relevant market participants was not available before 2017). As can be seen:
• between [50-60%] and [50-60%] of active tablets in each year since 2017 have been Apple’s iOS devices (ie iPads) – its share has declined slightly over time;
• Google’s Android has been the second largest operating system in terms of active tablets, but its share of active tablets has decreased from [20-30%] in 2017 to [20-30%] in 2020; and
• Amazon’s Fire OS has been the third largest operating system in terms of active tablets with its share of active tablets increasing from [10-20%] in 2017 to [20-30%] in 2020.
Figure C.16: Operating system shares of supply in active tablets in the UK – market participants data (2017-2020)
2017 2018 2019 2020
iOS Android Fire OS HMS devices
Source: CMA analysis of data from market participants. Notes: Huawei’s HMS devices have only been available since 2019 as set out in Chapter 3. Apple provided data on “Transacting accounts”. Transacting accounts correspond to the number of accounts that performed a transaction (download, purchase etc.) on the device. A transacting account could be linked to more than one tablet, and one tablet could be linked to more than one transacting account. This means that the number of transacting accounts may over- or underestimate the number of active tablets. 46. Figure C.17 shows the shares of supply based on data from Statcounter for
iOS, Android and Amazon’s Fire OS since 2012. This shows that:
• essentially all active tablets have either been iOS devices, Android devices or Fire OS devices; and
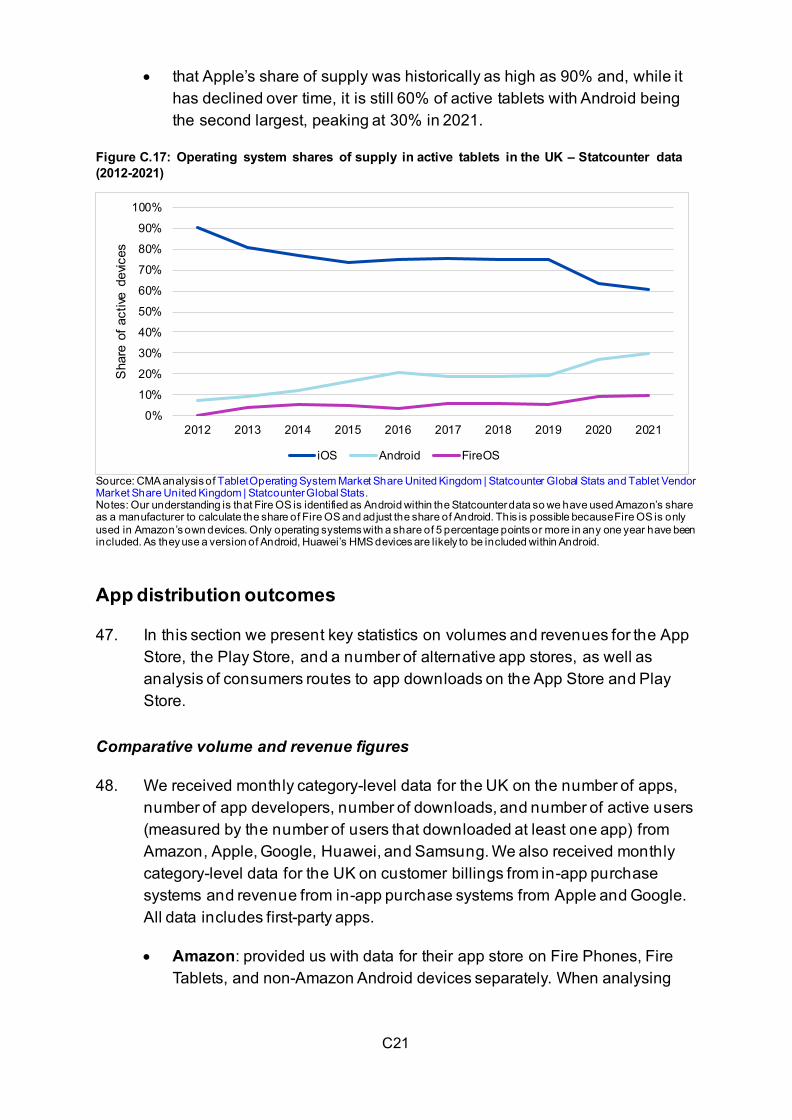
C21
• that Apple’s share of supply was historically as high as 90% and, while it has declined over time, it is still 60% of active tablets with Android being the second largest, peaking at 30% in 2021.
Figure C.17: Operating system shares of supply in active tablets in the UK – Statcounter data (2012-2021)
0%
10%
20%
30%
40%
50%
60%
70%
80%
90%
100%
2012 2013 2014 2015 2016 2017 2018 2019 2020 2021
Sha
re o
f act
ive d
evic
es
iOS Android FireOS
Source: CMA analysis of Tablet Operating System Market Share United Kingdom | Statcounter Global Stats and Tablet Vendor Market Share United Kingdom | Statcounter Global Stats. Notes: Our understanding is that Fire OS is identified as Android within the Statcounter data so we have used Amazon’s share as a manufacturer to calculate the share of Fire OS and adjust the share of Android. This is possible because Fire OS is only used in Amazon’s own devices. Only operating systems with a share of 5 percentage points or more in any one year have been included. As they use a version of Android, Huawei’s HMS devices are likely to be included within Android.
App distribution outcomes
47. In this section we present key statistics on volumes and revenues for the App Store, the Play Store, and a number of alternative app stores, as well as analysis of consumers routes to app downloads on the App Store and Play Store.
Comparative volume and revenue figures
48. We received monthly category-level data for the UK on the number of apps, number of app developers, number of downloads, and number of active users (measured by the number of users that downloaded at least one app) from Amazon, Apple, Google, Huawei, and Samsung. We also received monthly category-level data for the UK on customer billings from in-app purchase systems and revenue from in-app purchase systems from Apple and Google. All data includes first-party apps.
• Amazon: provided us with data for their app store on Fire Phones, Fire Tablets, and non-Amazon Android devices separately. When analysing
C22
the number of downloads and the number of active users, we summed the figures from these app stores together. [].
• Apple: due to limitations in the datasets held by Apple, Apple provided us with data for June 2019 to December 2020 for the number of apps and number of app developers. For all the other metrics, they provided us with data for the period from June 2010 to the end of 2020.
• Google: for the number of apps and number of app developers, in response to a formal CMA request, Google provided us with data for the UK from March 2013 and June 2017, respectively, until July 2021. For the number of app downloads, Google provided us with data from July 2016 to September 2021. For the number of active users, it provided us daily data covering [a short period in 2021]. For customer billings and revenue from their in-app purchase system they provided us with data from January 2012 to December 2020.
• Huawei: the metrics Huawei provided us with cover the period from May 2018 (Huawei’s app store, AppGallery, launched in the UK in 2018) until July 2021.
• Samsung: For the number of apps and number of developers, Samsung provided us with yearly data from 2009 until 2020. For the number of downloads and number of active users, it provided us with monthly data from January 2014 until December 2020.
49. The following figures show how these figures have changed over time for the different app stores.
Figure C.18: Number of apps in each app store for the UK over time (yearly averages of monthly data)
[] Source: CMA analysis of the parties’ data Notes: []
Figure C.19: Number of app developers in each app store for the UK over time (yearly averages of monthly data)
[] Source: CMA analysis of the parties’ data Notes: []
Figure C.20: Number of app downloads in each app store for the UK over time (yearly sums of monthly data)
[] Source: CMA analysis of the parties’ data
C23
Figure C.21: Number of active users in each app store for the UK over time (yearly averages of monthly data) (Google provided daily data on the number of active users and so this is not comparable)
[] Source: CMA analysis of the parties’ data
App Store and Play Store statistics
50. We received data on monthly app-level consumer spend, revenue and first-time downloads from Google and Apple. Spend and revenue were split between billings from:
• in-app purchases, excluding subscriptions;
• subscriptions; and
• payments to download apps.
51. A description of the data provided by each party is listed below:
• Google: provided, in response to a formal CMA request, monthly data on the level of consumer spend and Google revenue for apps (including Play pass) in the UK Play Store between []. The equivalent data was also provided for the global Play Store, but this data was not used in the analysis. []. In addition to the above, Google also provided, in response to a formal CMA request, a dataset of all apps available in the UK Play Store during 2020. It includes basic information about each app and its payment settings (ie whether it has a purchase price, whether in-app purchases are enabled and whether subscriptions are enabled). In response to a further CMA request, Google provided a complete summary of first-time downloads to the Play Store for the UK in 2020.
• Apple: provided monthly data on the level of consumer spend, amounts retained by Apple and first-time downloads for apps in the UK App Store between January 2016 and May 2021. Apple does not maintain data on the number of active users.
52. We received detailed data on the source of individual first-time downloads for the Google Play Store and Apple App Store, in response to a formal CMA request. The source includes whether the download originated from search, browse or referral as well as details of specific referrers, browse pages etc. We requested that this data cover the full year period to 31 May 2021. A description of the data provided by each party is listed below:
C24
• Google: provided details of the source of all first-time downloads from the UK Play Store from [].
• Apple: provided details of the source of all first-time downloads from the UK App Store covering the period from 1 June 2020 to 31 May 2021.
53. The following tables provide key metrics for the App Store and Play Store in 2020.
Table C.2: Summary of Google Play Store in 2020 in the UK
[]
Source: CMA analysis of Google's data Table C.3: Summary of Apple App Store in 2020 in the UK
[]
Source: CMA analysis of Apple's data, received 4 August 2021 54. The figures below show how Apple and Google’s revenues from different
types of payments made through their app stores (payments for app downloads, for in-app purchases and for subscriptions) have evolved over time.
Figure C.22: Google revenues on apps (including Play pass) from the Play Store in the UK, by revenue type, 2016 to 2020
[]
Source: CMA analysis of Google's data,
55. []
Figure C.23: Apple retained amounts from the App Store, by transaction type, 2016 to 2020 in the UK
[]
Source: CMA analysis of Apple's data 56. []
57. The figures below show how both revenues and downloads from Apple and Google’s app stores are distributed between categories of apps.
C25
Figure C.24: Share of Google Play Store revenues between app categories in 2020 in the UK
[]
Source: CMA analysis of Google's data. Higher level groupings of categories were done by the CMA for illustrative purposes.
Figure C.25: Share of Google Play Store downloads between app categories in 2020 in the UK
[]
Source: CMA analysis of Google’s data. Higher level groupings of categories were done by the CMA for illustrative purposes.
58. []
Figure C.26: Share of Apple App Store retained amounts between app categories in 2020 in the UK
[]
Source: CMA analysis of Apple's data. Higher level groupings of categories were done by the CMA for illustrative purposes.
Figure C.27: Share of Apple App Store downloads between app categories in 2020 in the UK
[]
Source: CMA analysis of Apple's data. Higher level groupings of categories were done by the CMA for illustrative purposes.
59. []
60. The figures below show how Apple and Google’s revenues from apps
categorised as games have evolved over time relative to revenues from other categories of app.
Figure C.28: Google Play Store revenues from apps (including Play pass) in “Games” categories versus other categories for the UK, 2016 to 2020
[]
Source: CMA analysis of Google's data. Figure C.29: Apple retained amounts from apps in “Games” categories versus other categories, 2016 to 2020 in the UK
[]
Source: CMA analysis of Apple's data.
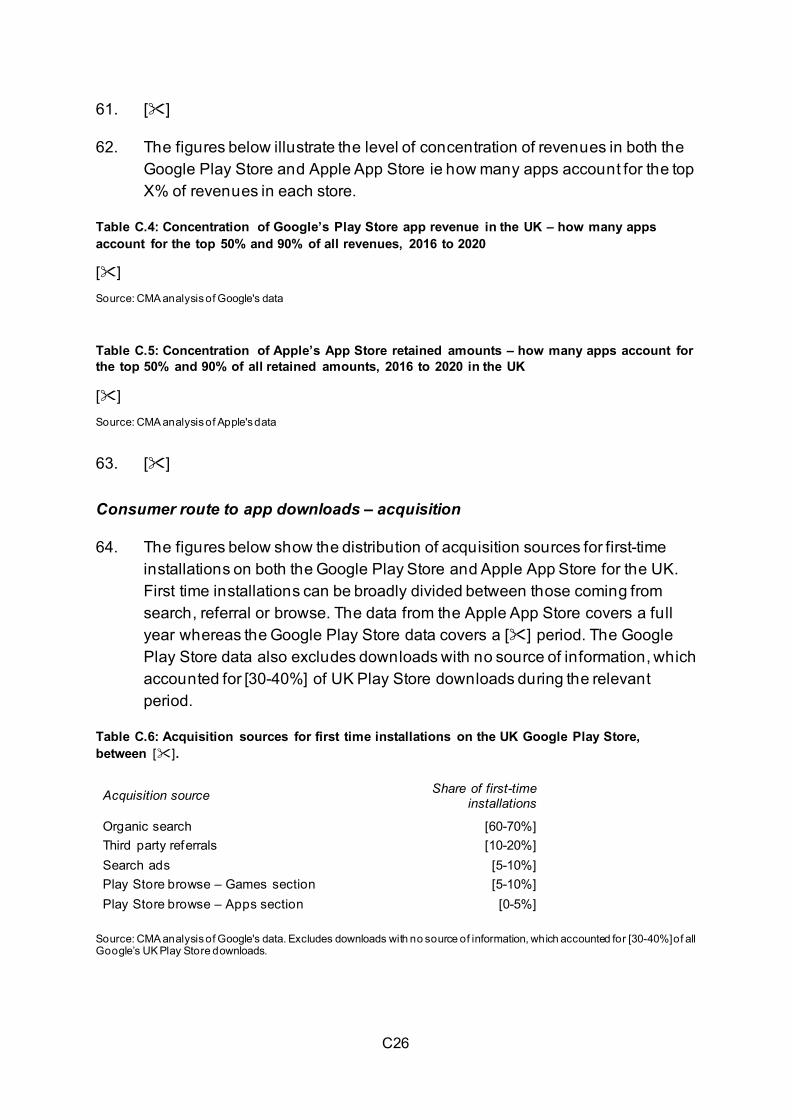
C26
61. []
62. The figures below illustrate the level of concentration of revenues in both the Google Play Store and Apple App Store ie how many apps account for the top X% of revenues in each store.
Table C.4: Concentration of Google’s Play Store app revenue in the UK – how many apps account for the top 50% and 90% of all revenues, 2016 to 2020
[] Source: CMA analysis of Google's data
Table C.5: Concentration of Apple’s App Store retained amounts – how many apps account for the top 50% and 90% of all retained amounts, 2016 to 2020 in the UK
[] Source: CMA analysis of Apple's data
63. []
Consumer route to app downloads – acquisition
64. The figures below show the distribution of acquisition sources for first-time installations on both the Google Play Store and Apple App Store for the UK. First time installations can be broadly divided between those coming from search, referral or browse. The data from the Apple App Store covers a full year whereas the Google Play Store data covers a [] period. The Google Play Store data also excludes downloads with no source of information, which accounted for [30-40%] of UK Play Store downloads during the relevant period.
Table C.6: Acquisition sources for first time installations on the UK Google Play Store, between [].
Acquisition source Share of first-time installations
Organic search [60-70%] Third party referrals [10-20%] Search ads [5-10%] Play Store browse – Games section [5-10%] Play Store browse – Apps section [0-5%]
Source: CMA analysis of Google's data. Excludes downloads with no source of information, which accounted for [30-40%] of all Google’s UK Play Store downloads.
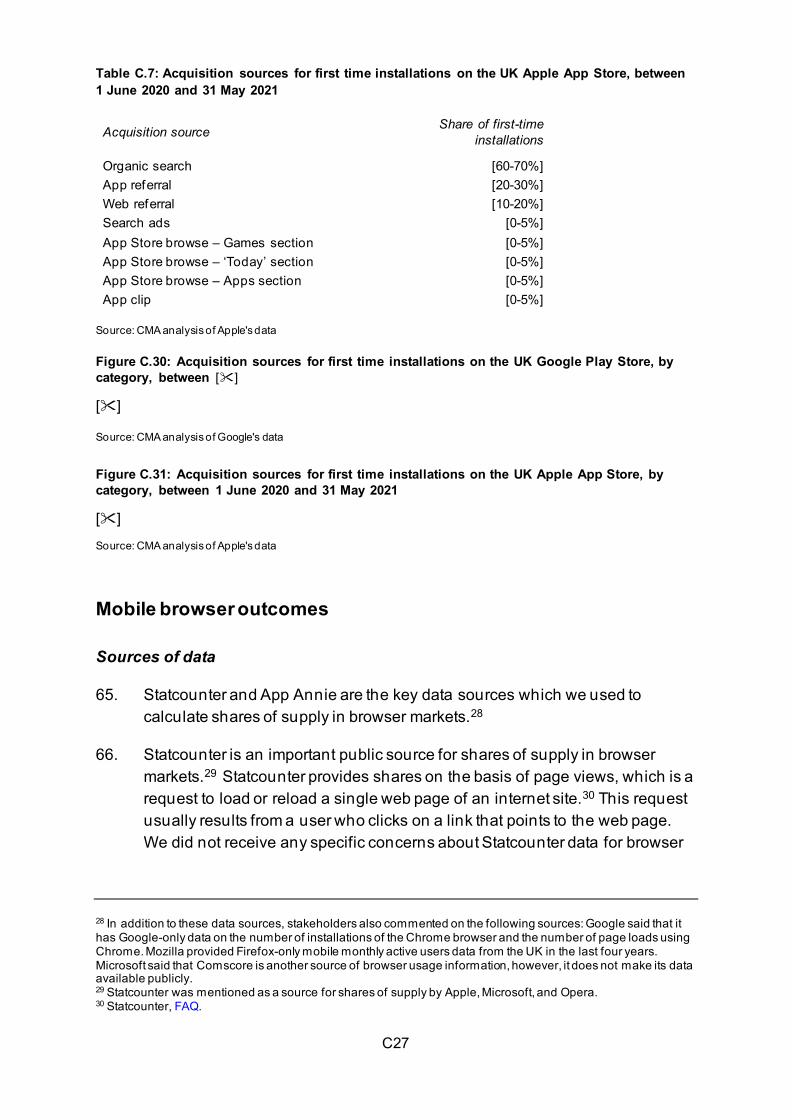
C27
Table C.7: Acquisition sources for first time installations on the UK Apple App Store, between 1 June 2020 and 31 May 2021
Acquisition source Share of first-time installations
Organic search [60-70%] App referral [20-30%] Web referral [10-20%] Search ads [0-5%] App Store browse – Games section [0-5%] App Store browse – ‘Today’ section [0-5%] App Store browse – Apps section [0-5%] App clip [0-5%]
Source: CMA analysis of Apple's data Figure C.30: Acquisition sources for first time installations on the UK Google Play Store, by category, between []
[] Source: CMA analysis of Google's data Figure C.31: Acquisition sources for first time installations on the UK Apple App Store, by category, between 1 June 2020 and 31 May 2021
[] Source: CMA analysis of Apple's data
Mobile browser outcomes
Sources of data
65. Statcounter and App Annie are the key data sources which we used to calculate shares of supply in browser markets.28
66. Statcounter is an important public source for shares of supply in browser markets.29 Statcounter provides shares on the basis of page views, which is a request to load or reload a single web page of an internet site.30 This request usually results from a user who clicks on a link that points to the web page. We did not receive any specific concerns about Statcounter data for browser
28 In addition to these data sources, stakeholders also commented on the following sources: Google said that it has Google-only data on the number of installations of the Chrome browser and the number of page loads using Chrome. Mozilla provided Firefox-only mobile monthly active users data from the UK in the last four years. Microsoft said that Comscore is another source of browser usage information, however, it does not make its data available publicly. 29 Statcounter was mentioned as a source for shares of supply by Apple, Microsoft, and Opera. 30 Statcounter, FAQ.
C28
shares,31 although we note the possible limitations to Statcounter’s methodology, discussed above, regarding representativeness of the population of websites and consumers’ adblockers and browser preferences.
67. App Annie is a data source Google referred to for shares of supply in browser markets. App Annie measures shares according to usage in minutes.32 An advantage of App Annie’s data is that it provides shares of supply per mobile operating system, and not in an aggregated form as is the case with Statcounter.
Mobile browsers: shares of supply
68. Both globally and at the UK level, Apple’s Safari and Google’s Chrome browser are the largest browsers on mobile devices.33
69. Figure C.28 below shows the evolution of shares of supply for browsers on mobile devices in the UK from 2012 until 2021.34 In particular:
• Currently, Safari and Chrome are the largest browsers. In 2020, their combined share of supply amounted to almost 90%, with Safari accounting for 48% and Chrome for 40%.
• Over time, Safari’s share of supply has been relatively stable, although it has decreased slightly since 2012. In contrast, Chrome’s share of supply increased substantially, from 2% in 2012 to 40% in 2021.
• Samsung Internet is the only other browser with a market share above 5%. It gained share significantly in 2016 and has remained at around 6% to 8% since.
• While BlackBerry used to be the third largest mobile browser in the UK (15% in 2012), it has had virtually no presence (<1%) since 2017.
31 Opera told us that Statcounter is not entirely accurate. 32 Although Google told us that it does not verify or endorse the accuracy of App Annie data. 33 We have assessed shares of supply using two different metrics: (i) page views (ie the total number of pages loaded or reloaded in a browser); and (ii) usage, measured in minutes. 34 Statcounter, Mobile browser share of supply UK 2012-2021. Share of supply calculated based on usage minutes data submitted by Google confirm that Chrome and Safari have been holding a joint share of supply of over 80% in the last few years, and that Samsung Internet is the largest competitor in the mobile browser market. App Annie browser usage data.
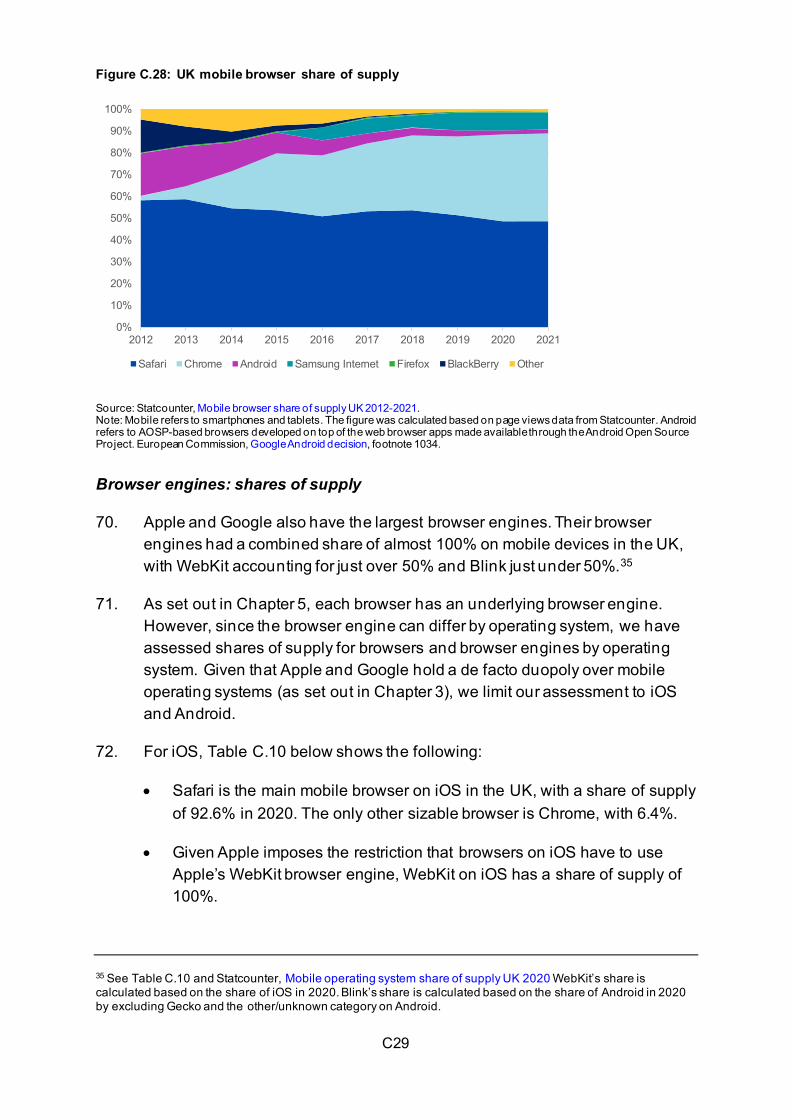
C29
Figure C.28: UK mobile browser share of supply
0%
10%
20%
30%
40%
50%
60%
70%
80%
90%
100%
2012 2013 2014 2015 2016 2017 2018 2019 2020 2021
Safari Chrome Android Samsung Internet Firefox BlackBerry Other
Source: Statcounter, Mobile browser share of supply UK 2012-2021. Note: Mobile refers to smartphones and tablets. The figure was calculated based on page views data from Statcounter. Android refers to AOSP-based browsers developed on top of the web browser apps made available through the Android Open Source Project. European Commission, Google Android decision, footnote 1034.
Browser engines: shares of supply
70. Apple and Google also have the largest browser engines. Their browser engines had a combined share of almost 100% on mobile devices in the UK, with WebKit accounting for just over 50% and Blink just under 50%.35
71. As set out in Chapter 5, each browser has an underlying browser engine. However, since the browser engine can differ by operating system, we have assessed shares of supply for browsers and browser engines by operating system. Given that Apple and Google hold a de facto duopoly over mobile operating systems (as set out in Chapter 3), we limit our assessment to iOS and Android.
72. For iOS, Table C.10 below shows the following:
• Safari is the main mobile browser on iOS in the UK, with a share of supply of 92.6% in 2020. The only other sizable browser is Chrome, with 6.4%.
• Given Apple imposes the restriction that browsers on iOS have to use Apple’s WebKit browser engine, WebKit on iOS has a share of supply of 100%.
35 See Table C.10 and Statcounter, Mobile operating system share of supply UK 2020 WebKit’s share is calculated based on the share of iOS in 2020. Blink’s share is calculated based on the share of Android in 2020 by excluding Gecko and the other/unknown category on Android.
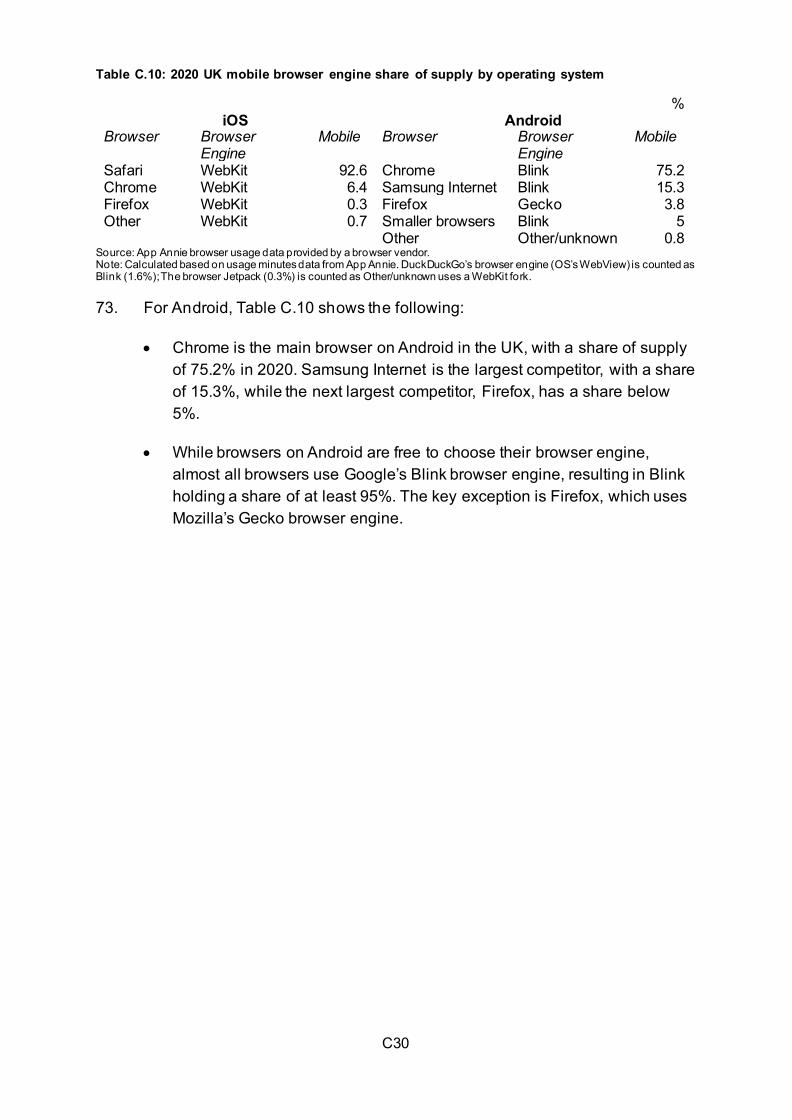
C30
Table C.10: 2020 UK mobile browser engine share of supply by operating system
% iOS Android
Browser Browser Engine
Mobile Browser Browser Engine
Mobile
Safari WebKit 92.6 Chrome Blink 75.2 Chrome WebKit 6.4 Samsung Internet Blink 15.3 Firefox WebKit 0.3 Firefox Gecko 3.8 Other WebKit 0.7 Smaller browsers Blink 5 Other Other/unknown 0.8
Source: App Annie browser usage data provided by a browser vendor. Note: Calculated based on usage minutes data from App Annie. DuckDuckGo’s browser engine (OS’s WebView) is counted as Blink (1.6%); The browser Jetpack (0.3%) is counted as Other/unknown uses a WebKit fork.
73. For Android, Table C.10 shows the following:
• Chrome is the main browser on Android in the UK, with a share of supply of 75.2% in 2020. Samsung Internet is the largest competitor, with a share of 15.3%, while the next largest competitor, Firefox, has a share below 5%.
• While browsers on Android are free to choose their browser engine, almost all browsers use Google’s Blink browser engine, resulting in Blink holding a share of at least 95%. The key exception is Firefox, which uses Mozilla’s Gecko browser engine.
D1
Appendix D: financial analysis of Apple’s and Google’s mobile ecosystems
Introduction
1. As part of the market study, we have undertaken analysis of the financial performance of Apple and Google with respect to their mobile ecosystems.
2. This financial analysis is an important part of our evidence base as it supports our understanding of the two companies’ incentives and strategies in relation to particular products and services. This financial analysis should be read alongside our economic analysis of the barriers to entry and expansion across the four themes of our study. It supports our understanding of where Apple and Google have been able to generate returns persistently higher than might be expected in a competitive market.
3. This appendix sets out:
• our analysis of the sources of each company’s reported revenues and profits, with a particular focus on the contribution made by the products and services within the scope of the market study;
• an assessment of the financial performance of their respective app stores; and
• estimates of the companies’ return on their investments, with a particular focus on Apple’s ‘Return on Capital Employed’ (ROCE).
4. We have considered the two companies’ financial performance separately, starting with Apple. For each party we have analysed financial performance at a global level, and also at the UK level where possible. We have also sought to understand any trends or relationships between UK and global financial performance.
Apple
5. This section sets out our analysis of the financial performance of Apple. It is based on public data obtained from Apple’s published financial reporting, which includes the most recent financial year ending 25 September 2021, as well as information obtained from Apple using our information gathering powers, covering periods up to December 2020.
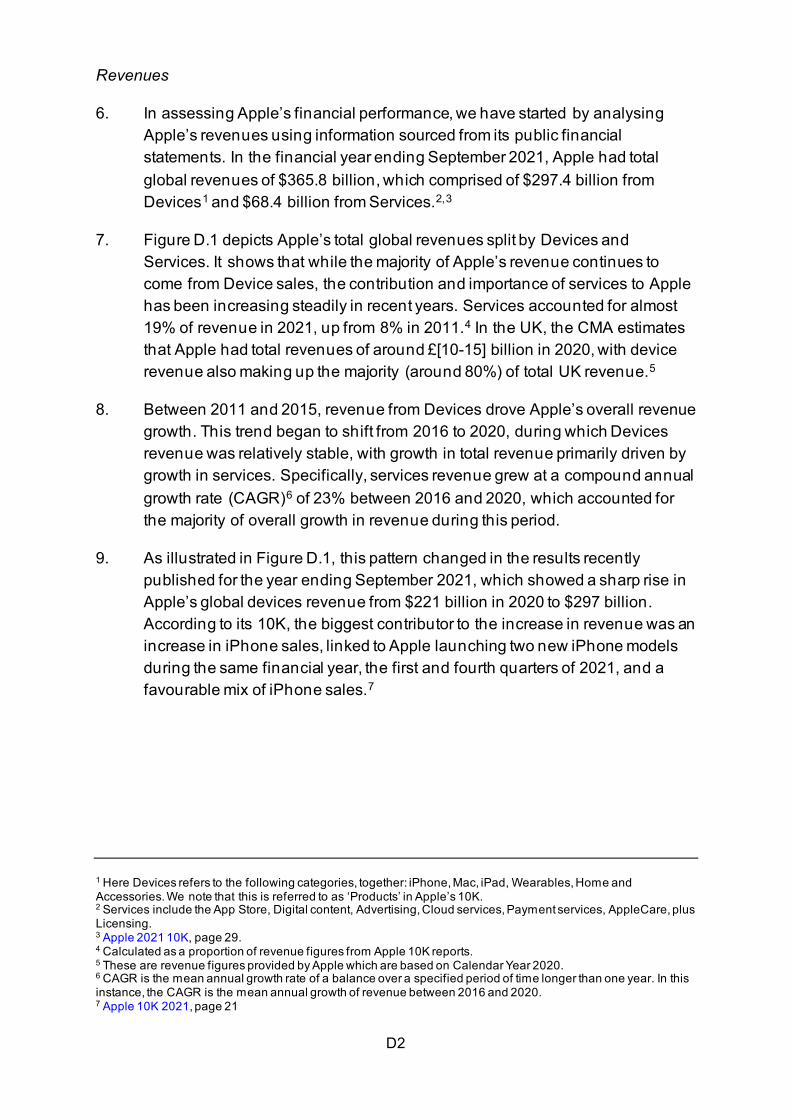
D2
Revenues
6. In assessing Apple’s financial performance, we have started by analysing Apple’s revenues using information sourced from its public financial statements. In the financial year ending September 2021, Apple had total global revenues of $365.8 billion, which comprised of $297.4 billion from Devices1 and $68.4 billion from Services.2,3
7. Figure D.1 depicts Apple’s total global revenues split by Devices and Services. It shows that while the majority of Apple’s revenue continues to come from Device sales, the contribution and importance of services to Apple has been increasing steadily in recent years. Services accounted for almost 19% of revenue in 2021, up from 8% in 2011.4 In the UK, the CMA estimates that Apple had total revenues of around £[10-15] billion in 2020, with device revenue also making up the majority (around 80%) of total UK revenue.5
8. Between 2011 and 2015, revenue from Devices drove Apple’s overall revenue growth. This trend began to shift from 2016 to 2020, during which Devices revenue was relatively stable, with growth in total revenue primarily driven by growth in services. Specifically, services revenue grew at a compound annual growth rate (CAGR)6 of 23% between 2016 and 2020, which accounted for the majority of overall growth in revenue during this period.
9. As illustrated in Figure D.1, this pattern changed in the results recently published for the year ending September 2021, which showed a sharp rise in Apple’s global devices revenue from $221 billion in 2020 to $297 billion. According to its 10K, the biggest contributor to the increase in revenue was an increase in iPhone sales, linked to Apple launching two new iPhone models during the same financial year, the first and fourth quarters of 2021, and a favourable mix of iPhone sales.7
1 Here Devices refers to the following categories, together: iPhone, Mac, iPad, Wearables, Home and Accessories. We note that this is referred to as ‘Products’ in Apple’s 10K. 2 Services include the App Store, Digital content, Advertising, Cloud services, Payment services, AppleCare, plus Licensing. 3 Apple 2021 10K, page 29. 4 Calculated as a proportion of revenue figures from Apple 10K reports. 5 These are revenue figures provided by Apple which are based on Calendar Year 2020. 6 CAGR is the mean annual growth rate of a balance over a specified period of time longer than one year. In this instance, the CAGR is the mean annual growth of revenue between 2016 and 2020. 7 Apple 10K 2021, page 21
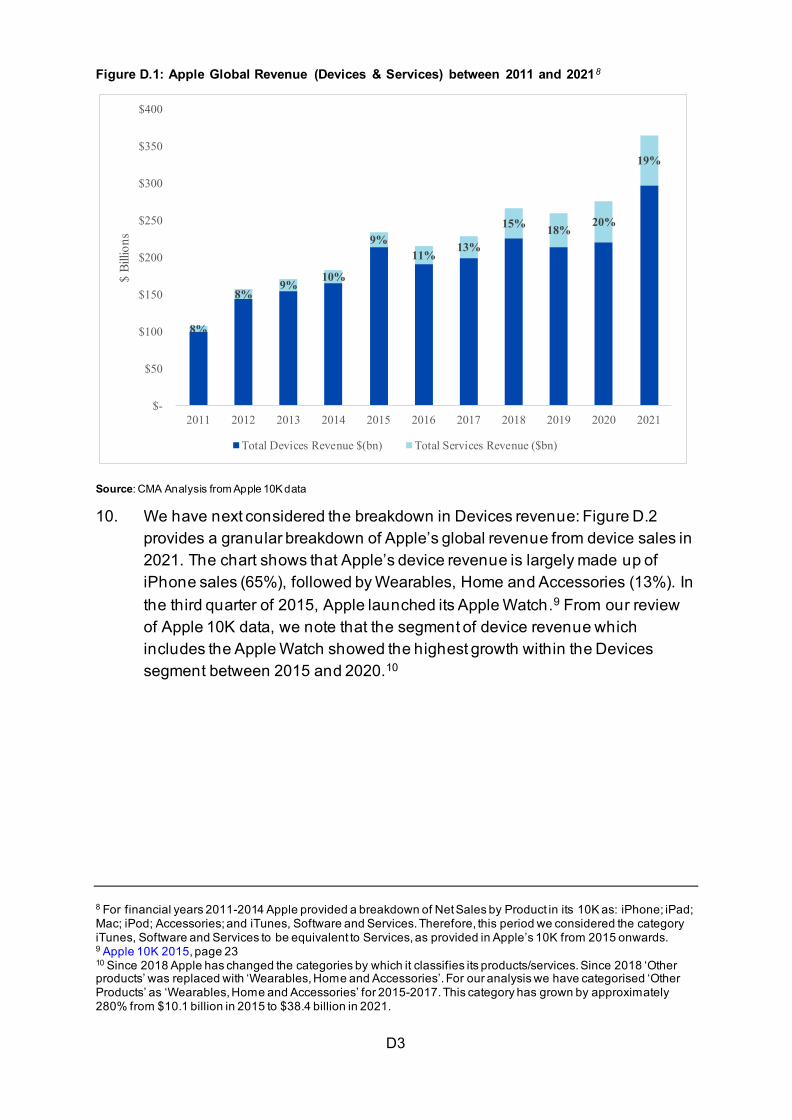
D3
Figure D.1: Apple Global Revenue (Devices & Services) between 2011 and 20218
8%
8%9%
10%
9%11%
13%
15% 18%20%
19%
$-
$50
$100
$150
$200
$250
$300
$350
$400
2011 2012 2013 2014 2015 2016 2017 2018 2019 2020 2021
$ Bi
llion
s
Total Devices Revenue $(bn) Total Services Revenue ($bn) Source: CMA Analysis from Apple 10K data 10. We have next considered the breakdown in Devices revenue: Figure D.2
provides a granular breakdown of Apple’s global revenue from device sales in 2021. The chart shows that Apple’s device revenue is largely made up of iPhone sales (65%), followed by Wearables, Home and Accessories (13%). In the third quarter of 2015, Apple launched its Apple Watch.9 From our review of Apple 10K data, we note that the segment of device revenue which includes the Apple Watch showed the highest growth within the Devices segment between 2015 and 2020.10
8 For financial years 2011-2014 Apple provided a breakdown of Net Sales by Product in its 10K as: iPhone; iPad; Mac; iPod; Accessories; and iTunes, Software and Services. Therefore, this period we considered the category iTunes, Software and Services to be equivalent to Services, as provided in Apple’s 10K from 2015 onwards. 9 Apple 10K 2015, page 23 10 Since 2018 Apple has changed the categories by which it classifies its products/services. Since 2018 ‘Other products’ was replaced with ‘Wearables, Home and Accessories’. For our analysis we have categorised ‘Other Products’ as ‘Wearables, Home and Accessories’ for 2015-2017. This category has grown by approximately 280% from $10.1 billion in 2015 to $38.4 billion in 2021.
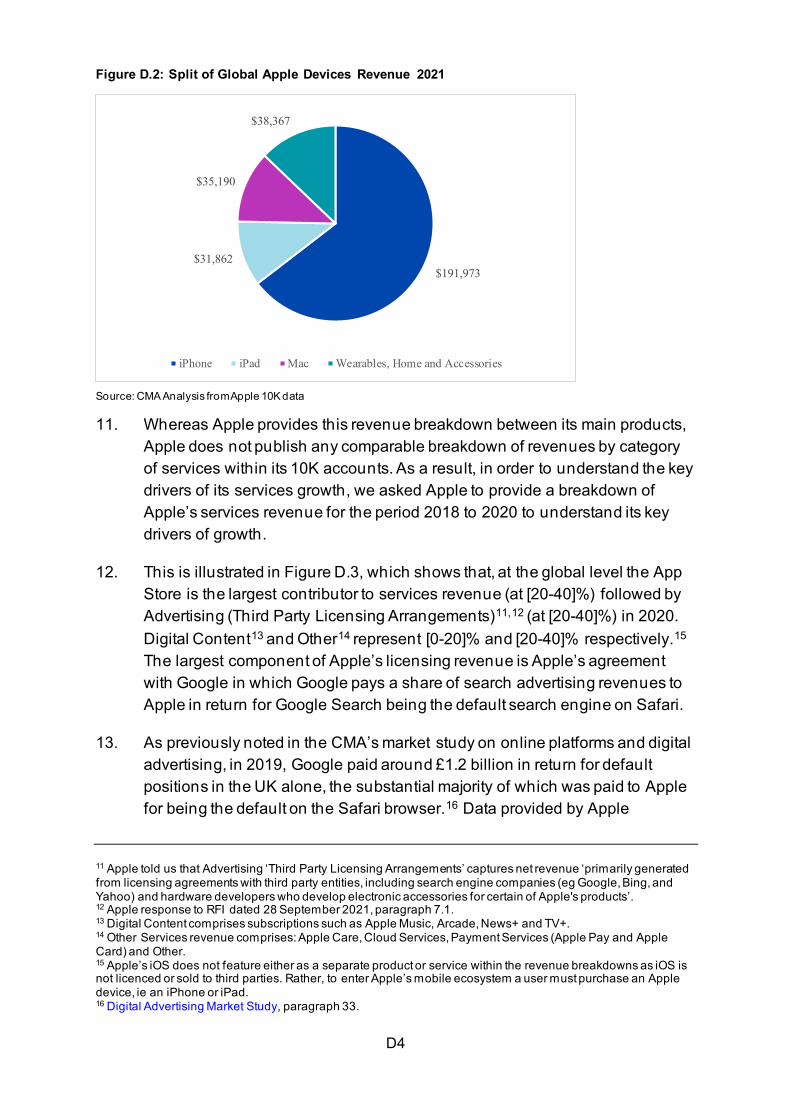
D4
Figure D.2: Split of Global Apple Devices Revenue 2021
$191,973 $31,862
$35,190
$38,367
iPhone iPad Mac Wearables, Home and Accessories
Source: CMA Analysis from Apple 10K data 11. Whereas Apple provides this revenue breakdown between its main products,
Apple does not publish any comparable breakdown of revenues by category of services within its 10K accounts. As a result, in order to understand the key drivers of its services growth, we asked Apple to provide a breakdown of Apple’s services revenue for the period 2018 to 2020 to understand its key drivers of growth.
12. This is illustrated in Figure D.3, which shows that, at the global level the App Store is the largest contributor to services revenue (at [20-40]%) followed by Advertising (Third Party Licensing Arrangements)11,12 (at [20-40]%) in 2020. Digital Content13 and Other14 represent [0-20]% and [20-40]% respectively.15 The largest component of Apple’s licensing revenue is Apple’s agreement with Google in which Google pays a share of search advertising revenues to Apple in return for Google Search being the default search engine on Safari.
13. As previously noted in the CMA’s market study on online platforms and digital advertising, in 2019, Google paid around £1.2 billion in return for default positions in the UK alone, the substantial majority of which was paid to Apple for being the default on the Safari browser.16 Data provided by Apple
11 Apple told us that Advertising ‘Third Party Licensing Arrangements’ captures net revenue ‘primarily generated from licensing agreements with third party entities, including search engine companies (eg Google, Bing, and Yahoo) and hardware developers who develop electronic accessories for certain of Apple's products’. 12 Apple response to RFI dated 28 September 2021, paragraph 7.1. 13 Digital Content comprises subscriptions such as Apple Music, Arcade, News+ and TV+. 14 Other Services revenue comprises: Apple Care, Cloud Services, Payment Services (Apple Pay and Apple Card) and Other. 15 Apple’s iOS does not feature either as a separate product or service within the revenue breakdowns as iOS is not licenced or sold to third parties. Rather, to enter Apple’s mobile ecosystem a user must purchase an Apple device, ie an iPhone or iPad. 16 Digital Advertising Market Study, paragraph 33.
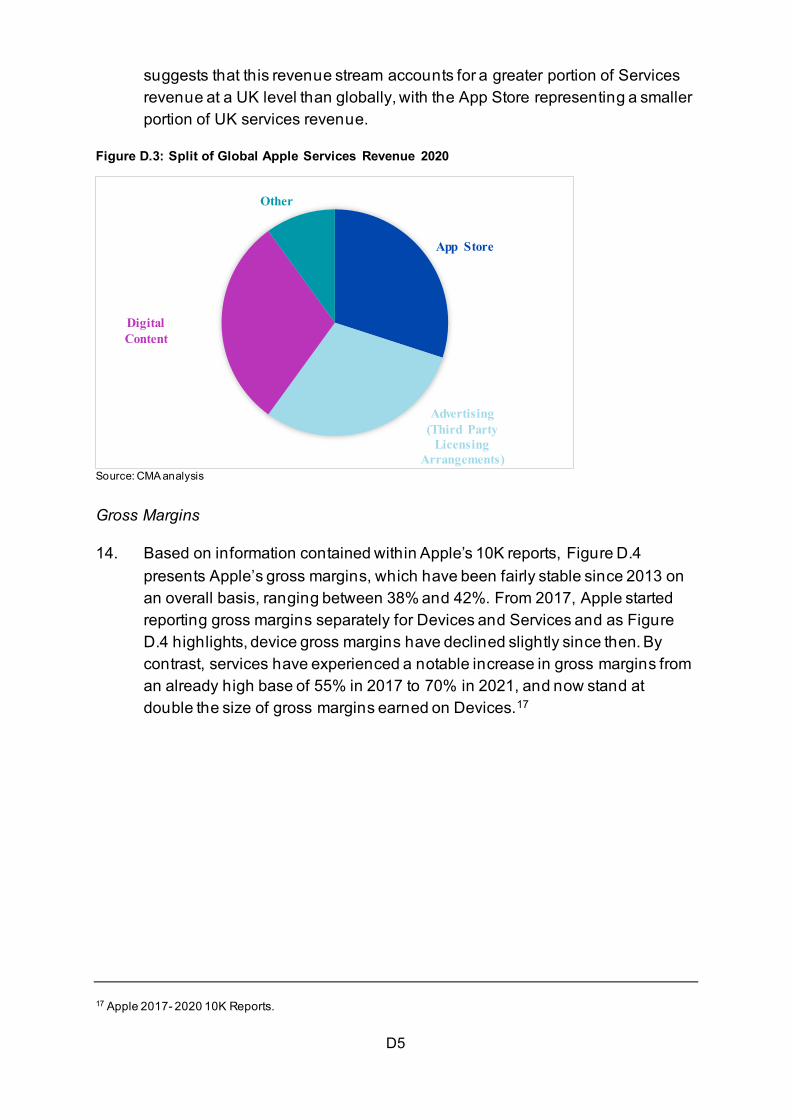
D5
suggests that this revenue stream accounts for a greater portion of Services revenue at a UK level than globally, with the App Store representing a smaller portion of UK services revenue.
Figure D.3: Split of Global Apple Services Revenue 2020
App Store
Advertising (Third Party
Licensing Arrangements)
Digital Content
Other
Source: CMA analysis
Gross Margins
14. Based on information contained within Apple’s 10K reports, Figure D.4 presents Apple’s gross margins, which have been fairly stable since 2013 on an overall basis, ranging between 38% and 42%. From 2017, Apple started reporting gross margins separately for Devices and Services and as Figure D.4 highlights, device gross margins have declined slightly since then. By contrast, services have experienced a notable increase in gross margins from an already high base of 55% in 2017 to 70% in 2021, and now stand at double the size of gross margins earned on Devices.17
17 Apple 2017- 2020 10K Reports.
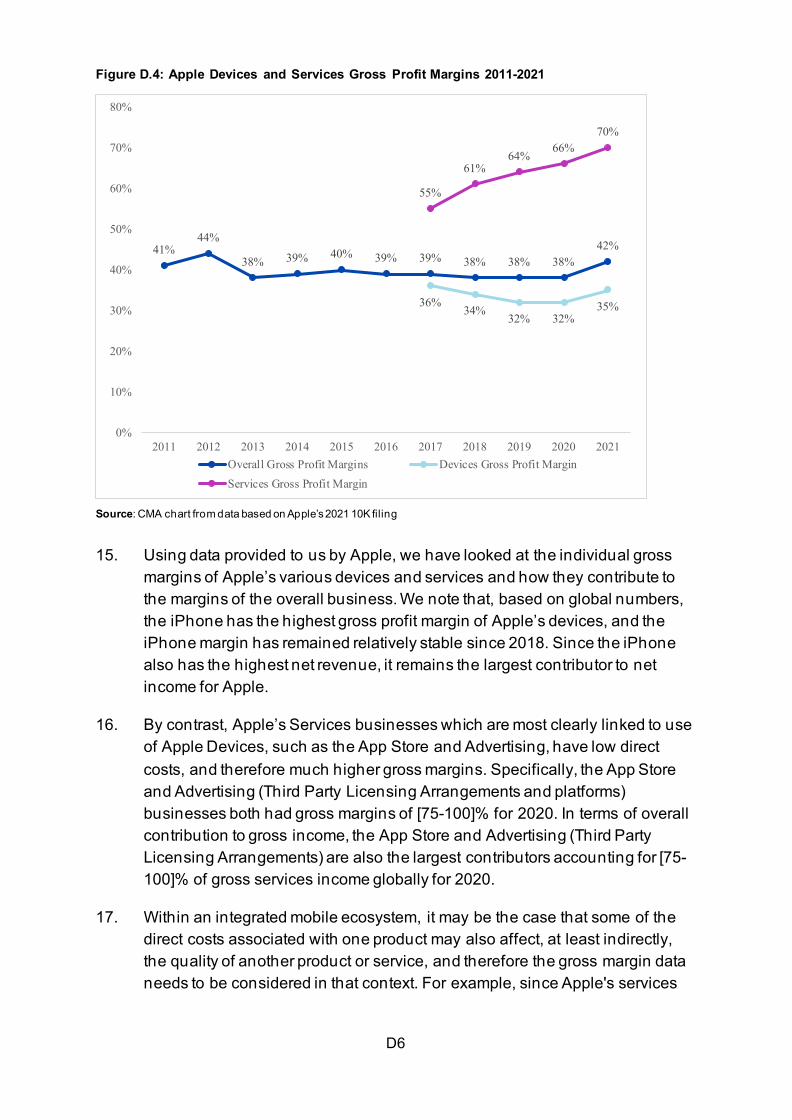
D6
Figure D.4: Apple Devices and Services Gross Profit Margins 2011-2021
41%44%
38% 39% 40% 39% 39% 38% 38% 38%42%
36%34%
32% 32%35%
55%
61%64%
66%70%
0%
10%
20%
30%
40%
50%
60%
70%
80%
2011 2012 2013 2014 2015 2016 2017 2018 2019 2020 2021Overall Gross Profit Margins Devices Gross Profit MarginServices Gross Profit Margin
Source: CMA chart from data based on Apple’s 2021 10K filing
15. Using data provided to us by Apple, we have looked at the individual gross margins of Apple’s various devices and services and how they contribute to the margins of the overall business. We note that, based on global numbers, the iPhone has the highest gross profit margin of Apple’s devices, and the iPhone margin has remained relatively stable since 2018. Since the iPhone also has the highest net revenue, it remains the largest contributor to net income for Apple.
16. By contrast, Apple’s Services businesses which are most clearly linked to use of Apple Devices, such as the App Store and Advertising, have low direct costs, and therefore much higher gross margins. Specifically, the App Store and Advertising (Third Party Licensing Arrangements and platforms) businesses both had gross margins of [75-100]% for 2020. In terms of overall contribution to gross income, the App Store and Advertising (Third Party Licensing Arrangements) are also the largest contributors accounting for [75-100]% of gross services income globally for 2020.
17. Within an integrated mobile ecosystem, it may be the case that some of the direct costs associated with one product may also affect, at least indirectly, the quality of another product or service, and therefore the gross margin data needs to be considered in that context. For example, since Apple's services
D7
revenue and profit rely on users purchasing an iPhone, the overall assessment of profitability should consider both separately, and also the interaction between the two.
18. This was a point raised in submissions by Apple. Apple told us that, while it attributes direct costs for accounting purposes, some of these direct costs, such as the iPhone camera, can be relevant to the ability to earn revenues for more than one business area. As such, Apple did not consider it relevant or appropriate to consider the gross profit margin of the App store in isolation from other aspects of its ecosystem.
19. We recognise that the profits earned on one product or service should not necessarily be considered in isolation from the other products and services within the same ecosystem. Nevertheless, it is helpful to understand the extent to which distinct business activities are able to generate revenues over and above their directly attributable costs. This can be informative where they operate under different competitive conditions, as demonstrated by our competitive assessments in Chapter 3 - 6.
20. In the next section, we consider the profits earned by the App Store, which is an important part of this study. This analysis is largely based on information provided to Apple in respect to information requests by the CMA.
App Store
21. Globally, the App Store represents the largest segment within Apple’s service business, comprising [20-40]% of total services revenue. In the UK in 2020, the App Store generated $[400-600] million revenue. By ‘revenue’ for the App Store, we refer to net billings, ie the amount that Apple charges as commission on the App Store. Apple records as revenue the level of gross billings paid by consumers for purchases in the App Store after subtracting the share paid to app developers, which we describe as net revenue.
22. Figure D.5 shows net revenue for the App Store in the UK and globally between 2018 and 2020, highlighting strong growth over the period. Net revenue increased by approximately [40-60]% on a global basis, and within the UK, between 2018 and 2020. We also note the average ratio between net revenue and gross billings (ie, what Apple does not pass on to developers divided by the total revenue Apple obtains from selling digital content) over this period has been [20-40%] on a global basis, which is reflective of Apple’s commission structure.
D8
Figure D.5: UK and Global Net Revenue App Store 2018-2020
[] Source: CMA analysis 23. As described above, we estimated the App Store’s gross profit margins to be
[75-100]% for 2020.
24. We also considered Apple’s operating margin for the App Store. Operating margins can provide a more complete picture of a product or service’s profitability than gross margins because they account for operating expenses that were necessarily incurred in order to supply the product or service. We asked Apple to provide any existing analysis of operating margins for the App Store.
25. Apple submitted that any P&L documents prepared on an ad hoc basis with respect to the App Store are not maintained as profit and loss statements. According to Apple such ad hoc exercises would not account for all costs that are attributable to the App Store and would be allocated to the App Store if Apple attempted to compare relative profitability at the product and service level. Apple also noted that such exercises do not reflect fully burdened profitability.
26. However, we note that in the recent Epic Games Inc vs Apple Inc litigation, the United States district court found that Apple calculated a fully burdened operating margin for the App Store as part of its normal business operations and that this calculation was largely consistent with Epic’s expert witness’s estimates of operating margins to be over 75% for both fiscal years 2018 and 2019.18 In our view, this measure of profitability can therefore provide useful insights into the App Store’s profitability and is consistent with the profit measure used to present the Play Store’s profitability below.
27. The operating profits associated with the App Store should also be seen in the context of Apple’s overall return on capital invested in its business. Apple will need to earn sufficient returns to cover its investment into its mobile ecosystem from a combination of its mobile devices revenues and the
18 United States District Court, Case No. 4:20-cv-05640-YGR – ‘Apple counters that it does not maintain profit and loss statements for individual divisions and that Mr. Barnes’ analysis is inaccurate. The Court disagrees with the latter. Mr. Barnes made appropriate adjustments based on sound economic principles to reach his conclusions. Apple’s protestations to the contrary, notwithstanding the evidence, shows that Apple has calculated a fully burdened operating margin for the App Store as part of their normal business operations. Apple’s financial planning and analysis team are tracking revenues, fixed and variable operating costs, and allocation of IT, Research & Development, and corporate overheads to an App Store P&L statement. The team’s calculation was largely consistent with that of Mr. Barnes. Although there are multiple ways to account for shared costs in a business unit, the consistency between Mr. Barnes’ analysis and Apple’s own internal documents suggest that Mr. Barnes’ analysis is a reasonable assessment of the App Store’s operating margin.’
D9
revenues from the associated services businesses. We next consider Apple’s return on capital (ROCE).
Return on Capital Employed (ROCE)
Introduction: Why we use ROCE as a measure of profit
28. As set out in our Guidelines for market investigations19 we normally measure profitability using rates of Return on Capital Employed (ROCE), derived using accounting profits which are then adjusted to arrive at an ‘economically meaningful measure of profitability’. In a competitive market we would expect firms to ‘earn no more than a “normal” rate of profit’, at least on average over time. ROCE is calculated by dividing earnings before interest and tax (EBIT), by the value of capital that is employed in the relevant business. For our purposes, we consider the actual investment in capital (ie the cash spent on buying assets used to generate revenue).
29. ROCE is a good measure to test where profits for a particular firm or sector are high, because it can be compared against an objective benchmark, the weighted average cost of capital (WACC). Another way of looking at this is that while all companies need to earn positive margins to be sustainable, margins themselves need to be considered alongside other measures in understanding whether a market is working well: some sectors with high asset investment and low operating costs will tend to have high margins, and in these circumstances would not necessarily equate to high economic profitability.
30. A finding that ROCE is higher than the WACC is not in itself indicative of a competition problem. A firm that innovates and gains a competitive advantage may earn higher ROCE for the period that it is able to sustain that competitive advantage. In a market characterised by effective competition, any excess of returns above the WACC would then be expected to be eroded over time, as competitors would see an opportunity to enter and earn high returns on capital. However, our guidance indicates that a finding that ‘profitability of firms which represent a substantial part of the market has exceeded the cost of capital over a sustained period could be an indication of limitations in the competitive process’.20
31. We determine ROCE using EBIT (operating profits) as the measure of return, divided by the value of capital employed (calculated as total assets minus current liabilities) in the relevant business. The general principle is that all
19 Market investigation Guidelines, (CC3 Revised), parag.115, Annex A paragraph 9. 20 Market investigation Guidelines, (CC3 Revised), paragraph 118.
D10
revenues, costs, assets and liabilities necessarily arising from the operation of the business to supply the relevant activities should be included. In practice this means the following items should be excluded:
• financing costs both of a profit and loss and balance sheet nature (eg cash, interest and sources of finance), regardless of whether they are short- or long-term; and
• taxation on income and any associated corporation tax or deferred tax assets and liabilities.
32. Our Guidelines also set out that, in industries with a relatively low level of tangible assets, such as service and knowledge-based industries, the book value of capital employed may bear little relationship to the economic value because of the presence of significant intangible assets.21 In digital markets, this is particularly the case where there is internal investment in intangible assets such as intellectual property (IP), R&D and patents, rather than acquisition of technology from third parties. We have considered the need to include intangible assets in the form of R&D in Apple’s asset base below.
Actual ROCE of Apple’s overall business
33. We have analysed Apple’s financial results over an 11-year timescale including results in 2021 where available, which we view as a sufficiently long period to capture a full business cycle, such that the reflection of profitability levels is not distorted by unusual macroeconomic conditions or one-off events.
34. The trends in revenue and gross margin indicate that the last few years can be seen generally to represent a ‘maturity’ rather than ‘growth’ phase for Apple’s devices business. In particular, we note that revenue growth slowed, with the exception of 2021. Many of the features originally designed by Apple have now been replicated by third parties offering smartphones, largely on Android. In that context, we would normally expect that Apple’s margins would start to reduce towards the cost of capital. However, Apple’s ROCE has remained very high. Figure D.6 illustrates Apple’s ROCE, based on its published data.
21 Market investigation Guidelines, (CC3 Revised), paragraph 12.
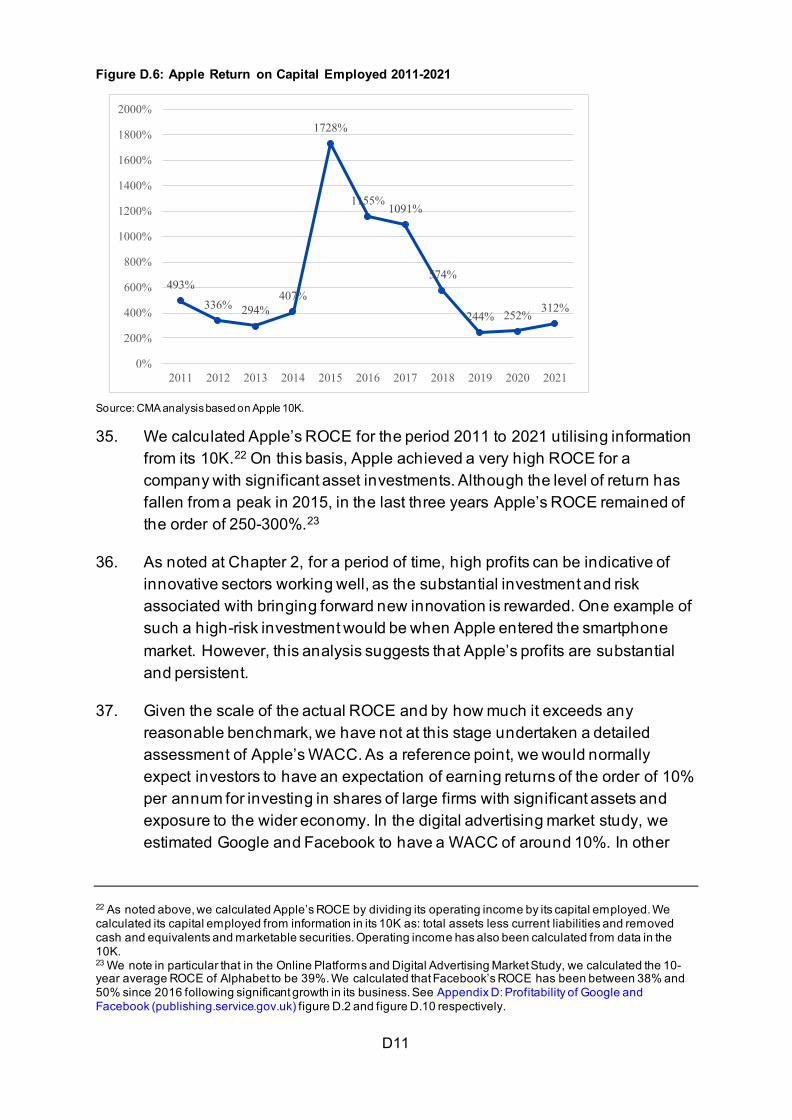
D11
Figure D.6: Apple Return on Capital Employed 2011-2021
493%
336% 294%407%
1728%
1155%1091%
574%
244% 252% 312%
0%
200%
400%
600%
800%
1000%
1200%
1400%
1600%
1800%
2000%
2011 2012 2013 2014 2015 2016 2017 2018 2019 2020 2021
Source: CMA analysis based on Apple 10K. 35. We calculated Apple’s ROCE for the period 2011 to 2021 utilising information
from its 10K.22 On this basis, Apple achieved a very high ROCE for a company with significant asset investments. Although the level of return has fallen from a peak in 2015, in the last three years Apple’s ROCE remained of the order of 250-300%.23
36. As noted at Chapter 2, for a period of time, high profits can be indicative of innovative sectors working well, as the substantial investment and risk associated with bringing forward new innovation is rewarded. One example of such a high-risk investment would be when Apple entered the smartphone market. However, this analysis suggests that Apple’s profits are substantial and persistent.
37. Given the scale of the actual ROCE and by how much it exceeds any reasonable benchmark, we have not at this stage undertaken a detailed assessment of Apple’s WACC. As a reference point, we would normally expect investors to have an expectation of earning returns of the order of 10% per annum for investing in shares of large firms with significant assets and exposure to the wider economy. In the digital advertising market study, we estimated Google and Facebook to have a WACC of around 10%. In other
22 As noted above, we calculated Apple’s ROCE by dividing its operating income by its capital employed. We calculated its capital employed from information in its 10K as: total assets less current liabilities and removed cash and equivalents and marketable securities. Operating income has also been calculated from data in the 10K. 23 We note in particular that in the Online Platforms and Digital Advertising Market Study, we calculated the 10-year average ROCE of Alphabet to be 39%. We calculated that Facebook’s ROCE has been between 38% and 50% since 2016 following significant growth in its business. See Appendix D: Profitability of Google and Facebook (publishing.service.gov.uk) figure D.2 and figure D.10 respectively.
D12
words, a ROCE above 10% is indicative of Apple making higher returns on its invested capital than normally required by investors in the shares of comparable companies.
Sensitivities to our ROCE analysis
38. We have considered possible sensitivities to assess the extent to which adopting different assumptions would materially affect out findings. In particular, we considered the three following sensitivities:
• we considered the possibility that Apple’s asset base (the ‘CE’ in ROCE) might be understated, due to the inclusion of liabilities not related to the core business on its balance sheet;
• we considered separating out the ROCE of Apple’s Devices business to understand its profitability as a standalone business and whether Apple is earning sufficient returns in Devices to cover the cost of its overall investments; and
• we considered whether it would be appropriate to include any sensitivities associated with intangible assets that might not be recorded on the balance sheet.
Sensitivities to the size of Apple’s asset base
39. One objective of a ROCE analysis is to assess how actual returns on investment compare to the level of returns on investment in competitive markets. To achieve this objective, the level of assets should represent a reasonable estimate of what it would cost for a competitor to replicate the operational assets of the firm being analysed. As noted above, only assets and liabilities necessarily arising from the operation of the business to supply the relevant business activities should be included in the measure of Capital Employed used to calculate ROCE.
40. Excluding cash, Apple also has a significant net current liability balance, which reduces the level of capital employed by Apple. Although we would expect firms to accumulate liabilities during their ordinary course of business, it is possible that some of these liabilities are not directly linked to the relevant business activities and that a competitor would not be able to replicate this net liability position. As a result, we have considered a sensitivity which excludes Apple’s net current liability position, which has the effect of increasing capital employed and reducing Apple’s ROCE.
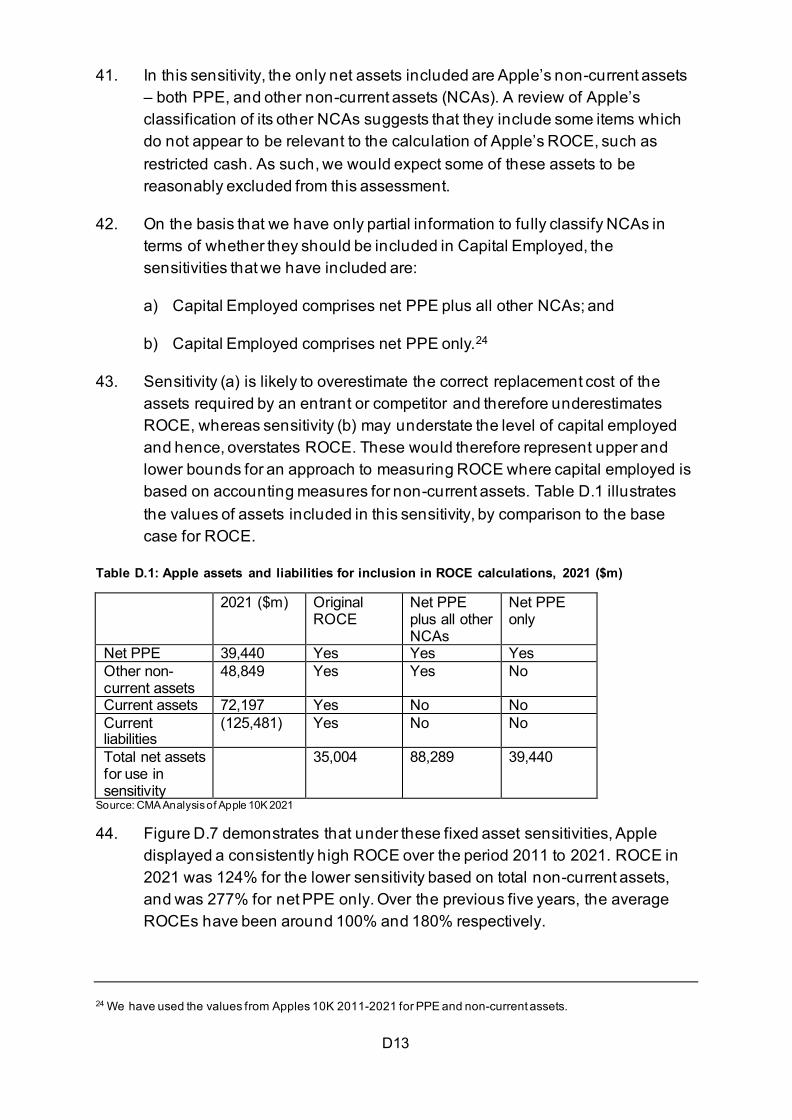
D13
41. In this sensitivity, the only net assets included are Apple’s non-current assets – both PPE, and other non-current assets (NCAs). A review of Apple’s classification of its other NCAs suggests that they include some items which do not appear to be relevant to the calculation of Apple’s ROCE, such as restricted cash. As such, we would expect some of these assets to be reasonably excluded from this assessment.
42. On the basis that we have only partial information to fully classify NCAs in terms of whether they should be included in Capital Employed, the sensitivities that we have included are:
a) Capital Employed comprises net PPE plus all other NCAs; and
b) Capital Employed comprises net PPE only.24
43. Sensitivity (a) is likely to overestimate the correct replacement cost of the assets required by an entrant or competitor and therefore underestimates ROCE, whereas sensitivity (b) may understate the level of capital employed and hence, overstates ROCE. These would therefore represent upper and lower bounds for an approach to measuring ROCE where capital employed is based on accounting measures for non-current assets. Table D.1 illustrates the values of assets included in this sensitivity, by comparison to the base case for ROCE.
Table D.1: Apple assets and liabilities for inclusion in ROCE calculations, 2021 ($m)
2021 ($m)
Original ROCE
Net PPE plus all other NCAs
Net PPE only
Net PPE 39,440 Yes Yes Yes Other non-current assets
48,849 Yes Yes No
Current assets 72,197 Yes No No Current liabilities
(125,481) Yes No No
Total net assets for use in sensitivity
35,004 88,289 39,440
Source: CMA Analysis of Apple 10K 2021 44. Figure D.7 demonstrates that under these fixed asset sensitivities, Apple
displayed a consistently high ROCE over the period 2011 to 2021. ROCE in 2021 was 124% for the lower sensitivity based on total non-current assets, and was 277% for net PPE only. Over the previous five years, the average ROCEs have been around 100% and 180% respectively.
24 We have used the values from Apples 10K 2011-2021 for PPE and non-current assets.
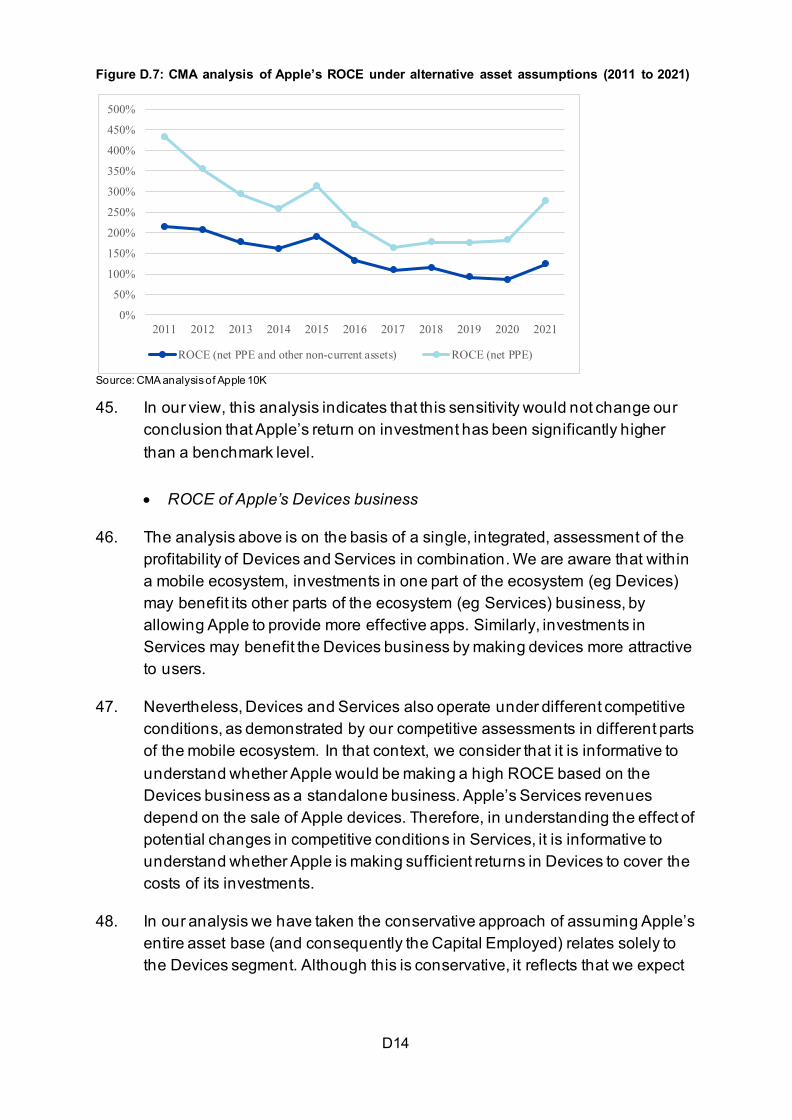
D14
Figure D.7: CMA analysis of Apple’s ROCE under alternative asset assumptions (2011 to 2021)
0%
50%
100%
150%
200%
250%
300%
350%
400%
450%
500%
2011 2012 2013 2014 2015 2016 2017 2018 2019 2020 2021
ROCE (net PPE and other non-current assets) ROCE (net PPE) Source: CMA analysis of Apple 10K 45. In our view, this analysis indicates that this sensitivity would not change our
conclusion that Apple’s return on investment has been significantly higher than a benchmark level.
• ROCE of Apple’s Devices business
46. The analysis above is on the basis of a single, integrated, assessment of the profitability of Devices and Services in combination. We are aware that within a mobile ecosystem, investments in one part of the ecosystem (eg Devices) may benefit its other parts of the ecosystem (eg Services) business, by allowing Apple to provide more effective apps. Similarly, investments in Services may benefit the Devices business by making devices more attractive to users.
47. Nevertheless, Devices and Services also operate under different competitive conditions, as demonstrated by our competitive assessments in different parts of the mobile ecosystem. In that context, we consider that it is informative to understand whether Apple would be making a high ROCE based on the Devices business as a standalone business. Apple’s Services revenues depend on the sale of Apple devices. Therefore, in understanding the effect of potential changes in competitive conditions in Services, it is informative to understand whether Apple is making sufficient returns in Devices to cover the costs of its investments.
48. In our analysis we have taken the conservative approach of assuming Apple’s entire asset base (and consequently the Capital Employed) relates solely to the Devices segment. Although this is conservative, it reflects that we expect
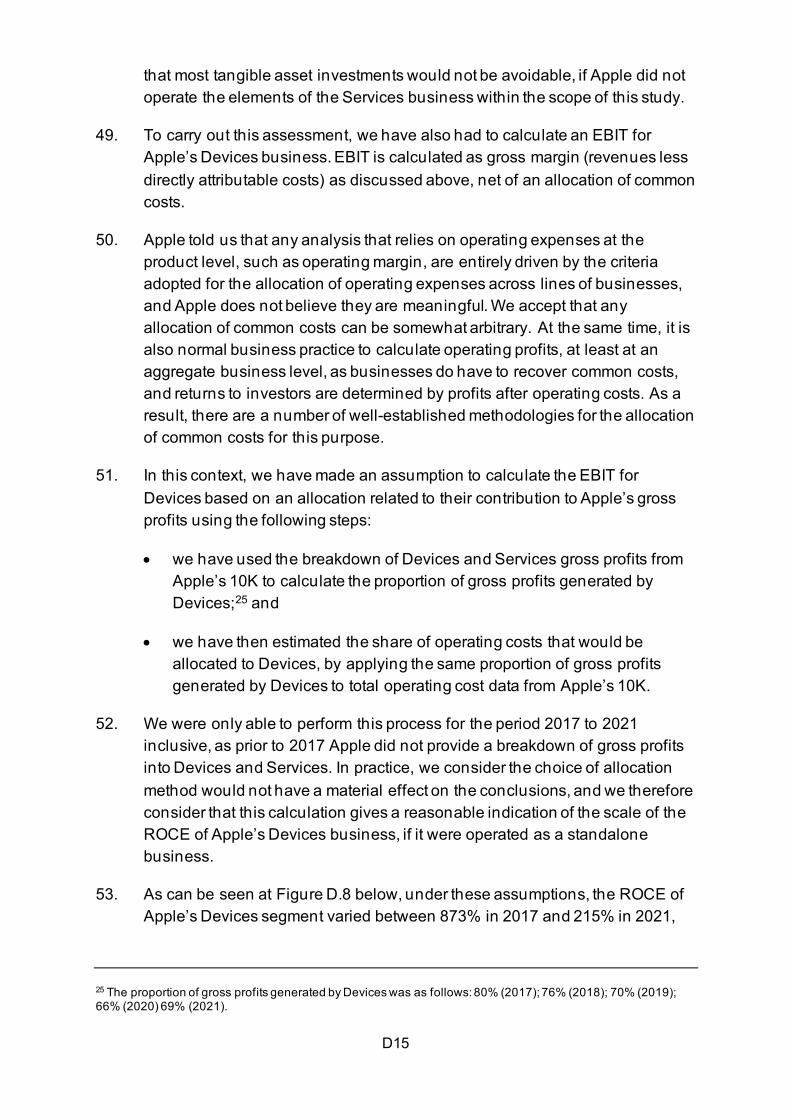
D15
that most tangible asset investments would not be avoidable, if Apple did not operate the elements of the Services business within the scope of this study.
49. To carry out this assessment, we have also had to calculate an EBIT for Apple’s Devices business. EBIT is calculated as gross margin (revenues less directly attributable costs) as discussed above, net of an allocation of common costs.
50. Apple told us that any analysis that relies on operating expenses at the product level, such as operating margin, are entirely driven by the criteria adopted for the allocation of operating expenses across lines of businesses, and Apple does not believe they are meaningful. We accept that any allocation of common costs can be somewhat arbitrary. At the same time, it is also normal business practice to calculate operating profits, at least at an aggregate business level, as businesses do have to recover common costs, and returns to investors are determined by profits after operating costs. As a result, there are a number of well-established methodologies for the allocation of common costs for this purpose.
51. In this context, we have made an assumption to calculate the EBIT for Devices based on an allocation related to their contribution to Apple’s gross profits using the following steps:
• we have used the breakdown of Devices and Services gross profits from Apple’s 10K to calculate the proportion of gross profits generated by Devices;25 and
• we have then estimated the share of operating costs that would be allocated to Devices, by applying the same proportion of gross profits generated by Devices to total operating cost data from Apple’s 10K.
52. We were only able to perform this process for the period 2017 to 2021 inclusive, as prior to 2017 Apple did not provide a breakdown of gross profits into Devices and Services. In practice, we consider the choice of allocation method would not have a material effect on the conclusions, and we therefore consider that this calculation gives a reasonable indication of the scale of the ROCE of Apple’s Devices business, if it were operated as a standalone business.
53. As can be seen at Figure D.8 below, under these assumptions, the ROCE of Apple’s Devices segment varied between 873% in 2017 and 215% in 2021,
25 The proportion of gross profits generated by Devices was as follows: 80% (2017); 76% (2018); 70% (2019); 66% (2020) 69% (2021).
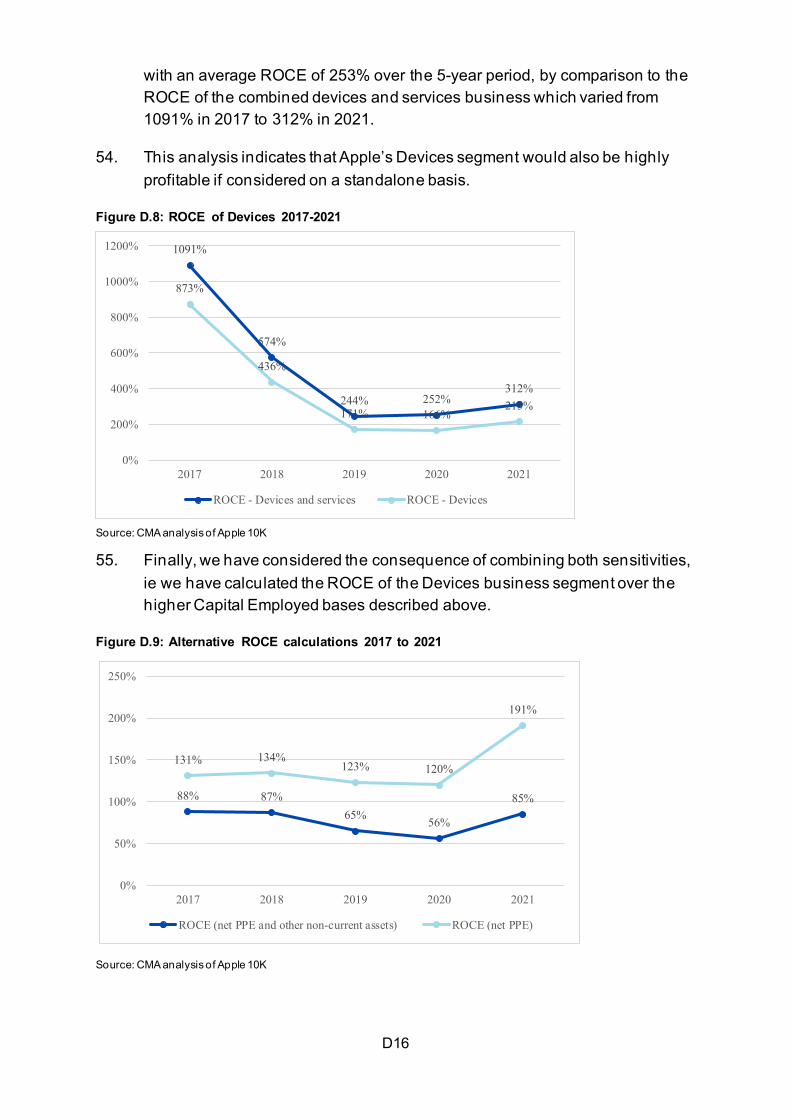
D16
with an average ROCE of 253% over the 5-year period, by comparison to the ROCE of the combined devices and services business which varied from 1091% in 2017 to 312% in 2021.
54. This analysis indicates that Apple’s Devices segment would also be highly profitable if considered on a standalone basis.
Figure D.8: ROCE of Devices 2017-2021
1091%
574%
244% 252%312%
873%
436%
171% 166%215%
0%
200%
400%
600%
800%
1000%
1200%
2017 2018 2019 2020 2021
ROCE - Devices and services ROCE - Devices
Source: CMA analysis of Apple 10K 55. Finally, we have considered the consequence of combining both sensitivities,
ie we have calculated the ROCE of the Devices business segment over the higher Capital Employed bases described above.
Figure D.9: Alternative ROCE calculations 2017 to 2021
88% 87%65% 56%
85%
131% 134%123% 120%
191%
0%
50%
100%
150%
200%
250%
2017 2018 2019 2020 2021
ROCE (net PPE and other non-current assets) ROCE (net PPE)
Source: CMA analysis of Apple 10K
D17
56. Our analysis indicates that, under this combination of sensitivities, the analysis still shows a consistently high estimate of Apple’s ROCE. The average ROCE for the Devices business for the period 2017 to 2021 was:
• 73% for net PPE plus all other NCAs; and
• 143% for net PPE only.
57. In our view, this analysis illustrates that Apple’s actual ROCE for Devices would be consistently very high and well above any reasonable benchmark return on capital, even if Apple operated the Devices business as a separate, standalone business.
• R&D
58. We note that Apple has been increasing its annual expenditure in R&D on an absolute basis, exceeding $20 billion in 2020, and that the percentage of R&D spend relative to sales has also increased, from 2.2% in 2011 to almost 6% for 2021. Under accounting principles, R&D is typically treated as an expense and accounted for in the firm’s profit and loss account. However, there may be circumstances where this expenditure leads to the creation of an asset that will provide future economic benefits and therefore represents capital investment from an economic perspective. In these circumstances, the level of capital employed recorded on a firm’s balance sheet may be understated.
59. One potential approach to ROCE for a firm investing in long-term assets through R&D is to adjust the capital employed to include that part of the firm’s R&D expenditure, ie rto assume it creates an intangible asset. Such a change would have two offsetting effects on the calculation of ROCE. In addition to increasing the firm’s level of capital employed by moving expenses into its capital base, the firm’s EBIT will also increase since it removes some of its operating expenses out of its cost base. In other words, both profit and capital employed will increase. As a result, while this could change the percentage ROCE, it will not change the finding that returns are high.
60. More detailed information than is publicly available is required to carry out an accurate adjustment for Apple’s ROCE calculation. We would normally expect that much of a firm’s R&D investment would relate either to expansion into new business ventures outside the scope of current businesses, or to incremental improvement to products which might be correctly treated as current costs. Nonetheless, our initial estimates indicate that even if an approach was taken that would have the greatest effect on the size of the capital base, for instance all R&D was capitalised and amortised over a long
D18
period, Apple’s ROCE would continue to be substantially higher than a reasonable benchmark.
61. We have therefore maintained our standard approach of assuming R&D to be within current costs in our analysis, both on the basis that any alternative treatment would not change our conclusions, and also that we have not seen evidence that Apple’s R&D meets the criteria that would support capitalisation. We welcome any further evidence from Apple or other stakeholders on the approach to profitability analysis, and whether there are examples of R&D investment which would be appropriate for capitalisation in this calculation.
Summary of findings on Apple’s financial performance
62. Based on the analysis above, we find that:
• Apple was highly profitable through the last 10 years, making high profits and a high return on capital. Although Apple has historically been a devices business, its business model is evolving, and the share of profits attributable to its services business was rapidly increasing from 2016 to 2020;
• This is driven by commission levels which result in revenues well above cost on App Store, and the fees earned by Apple from what it calls ‘Advertising (Third Party Licensing Arrangements)’, ie its share of revenue from Google acting as the default search engine on Safari;
• Apple’s profitability, when measured as a return on capital, is high, at over 100% ROCE per annum for Apple even on most sensitised measures. If Apple’s Devices business was considered as a separate, standalone, business, and all the assets of the integrated devices and services business were allocated to Devices, the standalone Devices business would still earn well above any normal benchmark ROCE level, before any incremental operating profits from services are included.
D19
Revenues
63. In assessing Google’s financial performance in respect of the markets in this study, we have started with Alphabet Inc’s group financial statements which break down reporting into three main segments: 26
• Google Services includes products and services such as ads, Android, Chrome, hardware, Google Maps, Google Play, Search, and YouTube.
• Google Cloud includes Google’s infrastructure and data analytics platforms, collaboration tools, and other services for enterprise customers.
• Other Bets which Google refer to as a combination of multiple operating segments that are not individually material. These businesses are generally not directly related to Google’s core businesses.
64. All the revenues within the scope of this study sit within Google Services.27 As with Apple, Google does not provide any revenue breakdown between its main products, Google does not publish any comparable breakdown of revenues by category of services within its 10K accounts. As a result, in order to understand the key drivers of its Google Services growth, we asked Google to provide a breakdown of Google’s services revenue for the period 2018 to 2020.
65. The revenue breakdown we received from Google included revenue from the following, at both a UK and a global level: search advertising; YouTube advertising; Play Store; Gmail; in app advertising; operating systems; browsers and Google maps. The information provided by Google covers the markets in the scope of this study, but does not cover all Google Services revenue, as reported in Google’s 10K.28 The total revenue figures presented in this section include each of the revenue categories broken down above, but not include revenue from other businesses, either Google’s other Google Services businesses, or the Cloud and Other Bets businesses. On this basis, total UK revenues in 2020 were £[5-10] billion, which grew by [0-20]% between 2019 and 2020.29
26 Alphabet Inc 2020 10K Report 27 We note that Google’s definition of Google Services includes hardware, whereas Apple separates Devices from Services in its reporting. 28 Google told us that: ‘The data available is stored in different systems and on different bases, which means that it is not possible to provide a coherent and consistent dataset according to the precise breakdowns requested by the CMA. For this reason, Google cannot provide “Other” revenues or “Total” revenues that provide a consistent view of Google’s revenue globally or for users in the UK.’ 29 Global revenue, as defined above amounted to $[160-170] billion for 2020.
D20
66. For the purposes of our market study, we also asked Google to separate out revenues which are earned using a mobile device (including tablets) from those which are earned through other non-mobile devices.30 This analysis showed that the majority of Google's UK revenue (around [60-80]% for 2020) relates to its services being consumed on a mobile device. This is similar to the split for Google's global revenues (around [60-80]% for 2020) and has remained at a similar ratio between 2019 and 2020.
67. Google’s revenue analysis suggests that, within the mobile ecosystem, there are some differences between the share of revenues generated from different business areas in the UK versus globally. The largest proportion of global revenue relating to mobile devices in 2020, representing [40-60]% of all mobile revenues, is generated within mobile search advertising, followed by YouTube advertising (at [0-20]%) and revenues generated from the Play Store (at [0-20]%). By contrast, Google generates a significantly larger proportion of its UK mobile revenues, [60-80%], from search advertising.
Profit Margins
68. In our assessment of Google’s profit margins, we started with information contained within Alphabet Inc’s financial statements. Using Google’s measure of ‘cost of revenues’ within its 10K report,31 we calculated that Alphabet Inc had a gross margin if 53.6% in 2020. In the same year, its operating margin was 23%.
69. As described above, the business units in the scope of this study sit within the Google Services segment. Google also provides revenue and operating income data for this segment, which showed that Google Services is the most profitable segment within Alphabet Inc, with an operating margin of 32% in 2020, as illustrated in Figure D.10. The size of the published profit margins for Google is not directly comparable to the size of the margins in the analysis for Apple above, as Apple publishes gross margins, which are calculated before an allocation of operating costs.
30 Google notes that in compiling this data, several finance and engineering data systems had to be used which may not be used for financial reporting purposes. The revenue data does not include accounting adjustments (such as exchange rate impacts and discounts), are not US GAAP compliant, and may differ from publicly reported revenue. Furthermore, while we requested this data for 2018, 2019, and 2020, Google noted it could only provide data in this form for 2019 and 2020 except for UK data for Google Play store and Chrome and global data for Google Play store, Google One and Chrome, which was provided for the full period requested. 31 Google states that its ‘cost of revenues’ includes TAC (traffic acquisition costs); content acquisition costs; expenses included with data centres and inventory related costs for hardware. See Alphabet Inc 2020 10K Report page 38.
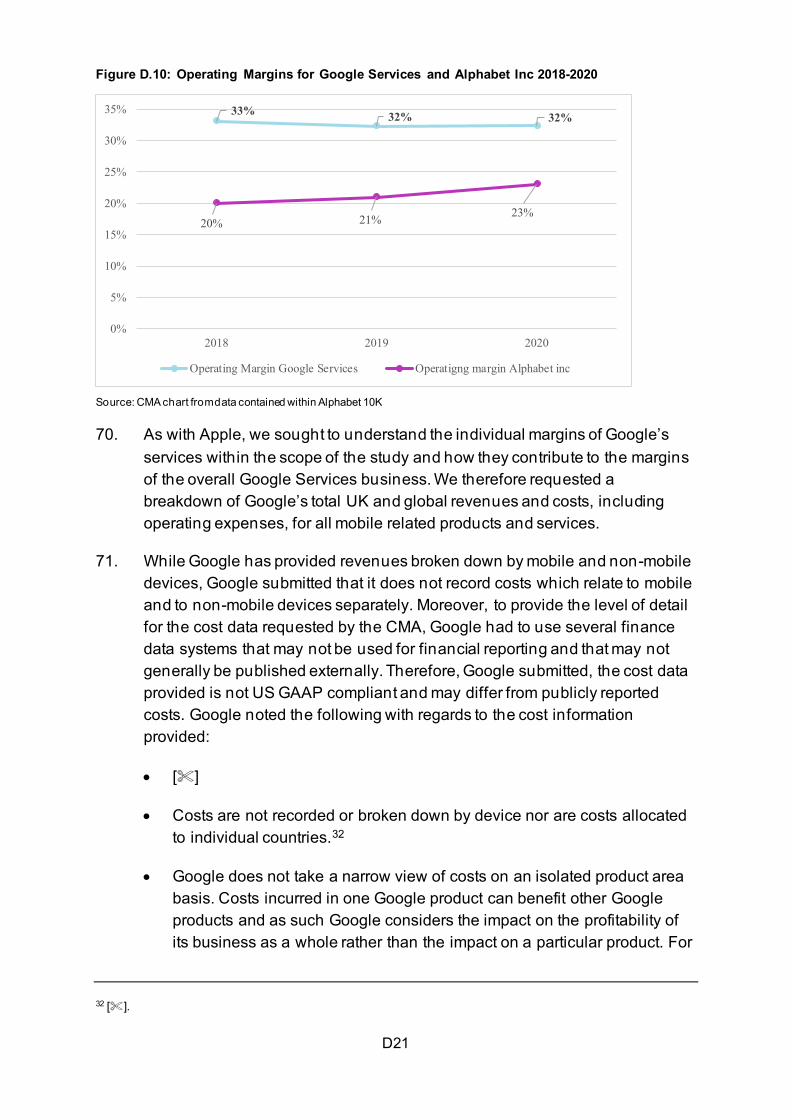
D21
Figure D.10: Operating Margins for Google Services and Alphabet Inc 2018-2020
33% 32% 32%
20% 21% 23%
0%
5%
10%
15%
20%
25%
30%
35%
2018 2019 2020
Operating Margin Google Services Operatigng margin Alphabet inc
Source: CMA chart from data contained within Alphabet 10K 70. As with Apple, we sought to understand the individual margins of Google’s
services within the scope of the study and how they contribute to the margins of the overall Google Services business. We therefore requested a breakdown of Google’s total UK and global revenues and costs, including operating expenses, for all mobile related products and services.
71. While Google has provided revenues broken down by mobile and non-mobile devices, Google submitted that it does not record costs which relate to mobile and to non-mobile devices separately. Moreover, to provide the level of detail for the cost data requested by the CMA, Google had to use several finance data systems that may not be used for financial reporting and that may not generally be published externally. Therefore, Google submitted, the cost data provided is not US GAAP compliant and may differ from publicly reported costs. Google noted the following with regards to the cost information provided:
• []
• Costs are not recorded or broken down by device nor are costs allocated to individual countries.32
• Google does not take a narrow view of costs on an isolated product area basis. Costs incurred in one Google product can benefit other Google products and as such Google considers the impact on the profitability of its business as a whole rather than the impact on a particular product. For
32 [].
D22
example, costs related to Android can benefit Google Play, and broader research efforts, similarly so.
• Data provided with regards to search includes both the revenue-generating advertising business and the free search organic business. Google also notes the cost data provided represents a best effort view of the costs associated with Search, although not all costs associated with Search can be identified.
72. We have taken a number of steps to address Google’s concerns. For instance, we aggregated revenue and cost data between non-mobile and mobile categories and conducted our analysis on a global basis, to reflect the fact that costs are not recorded by device or allocated to individual countries. We also conducted certain sensitivities, for instance in relation to the allocation of Android’s costs, as explained below. Therefore, whilst there may be some limitations associated with the data provided by Google, we are nonetheless of the view that it provides a reasonable guide to the scale of the relative profitability of Google’s products.
73. As described above, Google's overall services global operating margin in 2020 was 32.4%. The segments with the highest operating margins were Search advertising with operating margins of [50-75]% and Play Store, with operating margins of [50-75]%.33 On an absolute basis Search Advertising was the largest contributor to operating income followed by the Play Store. In respect of the other markets within this study, we note that YouTube Other (ie non-advertising) and Google One had negative global operating margins in 2020 and that mobile operating systems and browsers are not directly monetised.
74. We have considered Google’s monetisation strategy with regards to the costs related to Android and browsers, and as such we have assessed the consequence for margins if these costs are allocated to the Total Play Store (including advertising) and Search advertising, respectively. Adopting this approach, the impact on Search advertising global operating margins is very small. However, The Play Store Total global operating margin reduced materially when Android’s total costs of $[1-5] billion for 2020 were factored in. We have considered this in more detail below.
33 This includes both Play Store advertising and non-advertising. Play Store revenues include both revenues earned by the app store from app developers from the consumption and hosting of apps, which are the revenues directly in scope of this study, and also revenues from advertising on the Play Store.
D23
Play Store
75. As described in the preceding paragraphs, the Play Store represents the second largest component of operating income within Google Services. As this is an area of particular focus within the present market study, we have analysed the performance of the Play Store in more depth.
76. As shown in Figure D.11, UK Play Store (non-advertising) revenues for 2020 were $[200-400] million, which represented a very low proportion of the global Play Store (non-advertising) revenues of $[10-15] billion for 2020. However UK revenues have grown at a faster rate than global Play Store (non-advertising) revenues since 2018, by [10-20]%.
Figure D.11: UK and Global Revenue Play Store (excluding Advertising) 2018-2020
[]
77. As depicted in Figure D.12, global Play Store (non-advertising) gross
margins34 on a global basis have increased slightly by [0-10] percentage points between 2018 and 2020. Global operating margins have also shown a small but steady increase, rising by [0-10] percentage points between 2018 and 2020. As described above, global Play Store operating margins were [50-75]% in 2020.
Figure D.12: Global Play Store Gross and Operating Margins 2018-2020
[]
78. Operating income earned from the Play Store (including advertising) more
than covered Android's total costs for 2020. If these costs were attributed in whole to the Play Store, this would still leave Google with a relatively high global operating margin in 2020.35,36
79. Finally, we note that Google also records revenue for advertising within the Play Store separately. We note this category of revenue is growing at a fast rate.37 Figure D.13 depicts the relative contribution of advertising towards the total Play Store revenue. Based on internal documents, we understand that
34 Excluding Android costs. 35 The total of Play Store advertising and non-advertising. 36 CMA analysis. 37 We note that Google submitted with regards to Play Store Advertising that it does not include all the costs that Play Store advertising would face if it were run as a standalone business (e.g. Android distribution costs, R&D costs and other investment costs).
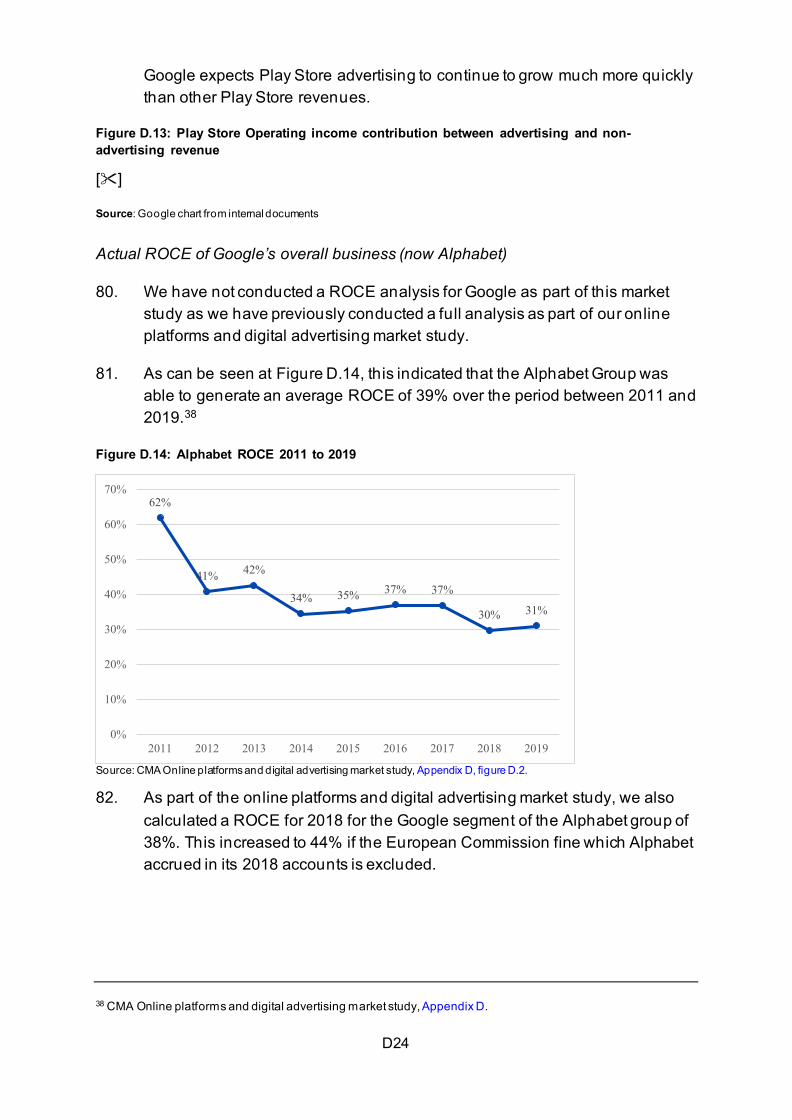
D24
Google expects Play Store advertising to continue to grow much more quickly than other Play Store revenues.
Figure D.13: Play Store Operating income contribution between advertising and non-advertising revenue
[]
Source: Google chart from internal documents
Actual ROCE of Google’s overall business (now Alphabet)
80. We have not conducted a ROCE analysis for Google as part of this market study as we have previously conducted a full analysis as part of our online platforms and digital advertising market study.
81. As can be seen at Figure D.14, this indicated that the Alphabet Group was able to generate an average ROCE of 39% over the period between 2011 and 2019.38
Figure D.14: Alphabet ROCE 2011 to 2019
62%
41% 42%
34% 35% 37% 37%
30% 31%
0%
10%
20%
30%
40%
50%
60%
70%
2011 2012 2013 2014 2015 2016 2017 2018 2019
Source: CMA Online platforms and digital advertising market study, Appendix D, figure D.2. 82. As part of the online platforms and digital advertising market study, we also
calculated a ROCE for 2018 for the Google segment of the Alphabet group of 38%. This increased to 44% if the European Commission fine which Alphabet accrued in its 2018 accounts is excluded.
38 CMA Online platforms and digital advertising market study, Appendix D.
D25
Summary of findings on Google’s financial performance
83. Based on the analysis above, we find:
• Google was highly profitable through the last 10 years, making high profits and a high return on capital;
• Although most of its operating income comes from Search advertising in absolute terms, the Play Store has become an increasingly important source of revenue for Google and represents the second largest component of operating income within Google Services;
• This is driven by commission levels which result in revenues well above direct and operating costs for the Play Store, and this would still be the case if the costs of Android were allocated in full to the Play Store.
E1
Appendix E: Google’s agreements with device manufacturers and app developers
Introduction
1. Chapters 3 and 4 of our interim report set out at a high-level various information and concerns we have identified regarding Google’s agreements with device manufacturers – or Original Equipment Manufacturers (‘OEMs’) – and a recent initiative aimed at app developers. This appendix provides a greater level of detail and explanation to support those findings. This introduction provides a brief overview of the different agreements and how they interrelate, before we discuss each in turn in more detail.
2. Most Android devices are manufactured by third-party manufacturers who license the ‘Android’ trademarks from Google, provided that they meet certain compatibility criteria (as explained in further detail below). As explained in Chapter 3, Google’s Pixel range of mobile devices only accounts for [0-5]% of new smartphones in 2020 and [0-5]% of new tablets in the same year.
3. The Android operating system is based on open-source software and was originally developed by the Open Handset Alliance, a consortium of 84 technology companies with the objective of developing open standards for mobile devices.1 Android is currently commercially sponsored by Google, which licenses the Android name and logo to manufacturers that enter the Android Compatibility Program.2
4. As further detailed below, Android manufacturers that also want to license Google’s apps and services, including Google’s proprietary application programming interfaces (APIs), are required by Google to enter an agreement called the Android Compatibility Commitment (ACC) under which they agree to maintain compatibility with a baseline version of Android as set out in the Compatibility Definition Document (CDD).
5. Manufacturers that have entered the ACC and thus meet the terms of the CDD, meaning they use a Google-compatible version of Android on their devices, can then enter the European Mobile Application Distribution Agreement (EMADA) under which they pay Google a per-device licence fee to license a collection of Google apps and services, named Google Mobile Services (GMS).
1 Open Handset Alliance. 2 See Android Brand guidelines and Android Compatibility Program Overview | Android Open Source Project.
E2
6. GMS (or the ‘GMS suite’) includes popular Google apps such as Gmail, Maps, YouTube and the Play Store, as well as Google APIs (or Google Play Services). As further explained below, we understand that these APIs may allow third-party developers to make use of basic features and functionalities such as push notifications or to communicate with Google’s services (such as Maps, Search, Gmail, and Translate on Android) and create rich features compatible with Android. The EMADA does not include licences for the Google Search app or Google’s Chrome browser, which are distributed under separate licence agreements to manufacturers. However, licensing Google Search and Chrome is conditional on a manufacturer entering the EMADA (or being an ‘EMADA partner’).
7. Google offers EMADA partners payments, both fixed payments per activated device and revenue shares. These payments are conditional on the manufacturer entering the EMADA (and thus the ACC) and compliance with certain requirements in relation to Google apps such as Google Search, Google Chrome and (in some cases) the Play Store. Payments from Google to device manufacturers are made through the following agreements:
• Placement agreements (PAs): these are per-device ‘activation payments’ for each device on which manufacturers pre-install either the Google Search app or the Google Search and Chrome apps and satisfy certain placement obligations for either Google Search or both;
• Revenue sharing agreements (RSAs): pursuant to these agreements:
— Google shares a proportion of net advertising revenue from specific search access points on manufacturers’ devices in return for meeting a number of placement and promotion requirements relating to Google’s apps including Google Search and Google Assistant such as setting the Google Search app as the default search engine on all preloaded manufacturer browsers.3 The proportion of revenue shared with the manufacturer increases with the more requirements met by a device;
— Google shares a proportion of net revenue from Play Store transactions where devices meet certain additional requirements in relation to the Play Store, namely setting the Play Store as the default
3 Google told us that third-party browsers (as opposed to manufacturer browsers) can have non-Google search services set as default instead, provided that they are not placed on the default home screen (unless in a folder) or the minus one screen. Google also told us that after the EC’s decision in Google Android the default search service in Chrome is set according to the Android choice screen mechanism that applies in the UK and EEA.
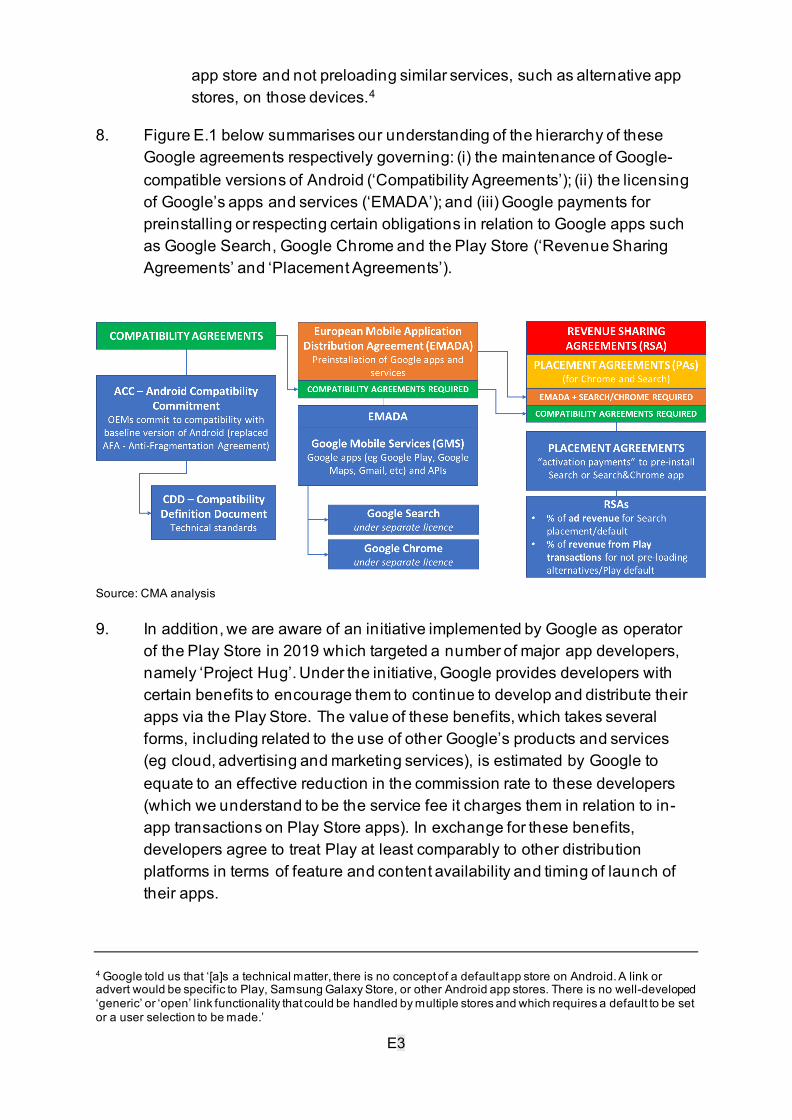
E3
app store and not preloading similar services, such as alternative app stores, on those devices.4
8. Figure E.1 below summarises our understanding of the hierarchy of these Google agreements respectively governing: (i) the maintenance of Google-compatible versions of Android (‘Compatibility Agreements’); (ii) the licensing of Google’s apps and services (‘EMADA’); and (iii) Google payments for preinstalling or respecting certain obligations in relation to Google apps such as Google Search, Google Chrome and the Play Store (‘Revenue Sharing Agreements’ and ‘Placement Agreements’).
Source: CMA analysis
9. In addition, we are aware of an initiative implemented by Google as operator of the Play Store in 2019 which targeted a number of major app developers, namely ‘Project Hug’. Under the initiative, Google provides developers with certain benefits to encourage them to continue to develop and distribute their apps via the Play Store. The value of these benefits, which takes several forms, including related to the use of other Google’s products and services (eg cloud, advertising and marketing services), is estimated by Google to equate to an effective reduction in the commission rate to these developers (which we understand to be the service fee it charges them in relation to in-app transactions on Play Store apps). In exchange for these benefits, developers agree to treat Play at least comparably to other distribution platforms in terms of feature and content availability and timing of launch of their apps.
4 Google told us that ‘[a]s a technical matter, there is no concept of a default app store on Android. A link or advert would be specific to Play, Samsung Galaxy Store, or other Android app stores. There is no well-developed ‘generic’ or ‘open’ link functionality that could be handled by multiple stores and which requires a default to be set or a user selection to be made.’
E4
10. We consider Google’s agreements with manufacturers and Project Hug to be relevant for multiple areas of our assessment, including competition in the provision of mobile devices and operating systems (Chapter 3), competition in app distribution (Chapter 4), competition in the provision of browsers (Chapter 5) and competition in the provision of apps in general (Chapter 6). We further consider that they allow Google to use its market power in search to protect its position in mobile operating systems and native app distribution. This in turn allows it to reinforce its position in search. In particular:
• The revenue sharing agreements are conditional on manufacturers using a compatible version of Android and licensing Google’s apps and APIs included in GMS (including the Play Store) which are important for ensuring that many native Android apps operate as they should. This ensures that manufacturers only receive a portion of Google’s revenue if they use Google’s version of Android and a core set of Google’s apps (including the Play Store and all the other apps included in GMS)5 are pre-installed on their devices.
• Google’s extensive pre-installation and default positions for GMS apps as well as Google Search and Google Chrome (including via placement agreements and revenue sharing agreements), act as a significant barrier to expansion for rival search engines, by limiting their ability to access consumers, build their scale and grow into stronger competitors over time, as set out in the CMA’s market study into online platforms and digital advertising.6
• The revenue sharing agreements also reinforce Google’s position in search advertising. This is because manufacturers’ use of Android allows Google to access extensive first-party data which is likely to give it a substantial advantage over smaller rivals in advertising, creating a barrier to entry and expansion as set out in the CMA’s market study into online platforms and digital advertising.7
• Given that rivals are unlikely to be able to replicate the payments Google makes to manufacturers, switching away from Android would entail manufacturers missing out on significant financial benefits that are paid for pre-installing or meeting certain requirements in relation to Google’s apps
5 As detailed below, these GMS apps include apps such as Gmail, Maps and YouTube. 6 See CMA (2020), Market Study into Online Platforms and Digital Advertising, Final Report, paragraph 3.149. 7 For example, Google can access extensive data on user location, including through Android smartphones, on which half to two thirds of users have location services activated; this allows search advertising to be more effectively targeted based on location. See CMA (2020), Market Study into Online Platforms and Digital Advertising, Final Report, paragraph 5.60.
E5
such as Google Maps, Gmail, YouTube, Google Search, Google Chrome and the Play Store, which are all very popular with users.8
• Google has the ability to target major app developers with incentives and other complementary products. These may offer benefits to such developers in the short term, but we are concerned that in the long term they could represent a barrier to emerging competition from other distribution channels, including other app stores.
11. In the remainder of this appendix, we cover in detail all the agreements mentioned above in the following sections:
• some background information on the Android Open Source Project and the Android Compatibility Program;
• Google’s licensing of Google’s apps and services, including GMS and Google APIs (or Google Play Services), under the EMADA;
• Google’s payments to manufacturers for pre-installing Google Search and Chrome apps and for respecting certain placement and promotion requirements in relation to apps such as Google Search, Google Assistant, Google Chrome and (in some cases) the Play Store.
• Google’s initiative targeting major game developers, also known as ‘Project Hug’.
Android Open Source Project (AOSP)
12. As noted above, Android is currently commercially sponsored by Google, which retains the ‘Android’ trademarks and licenses the Android name and logo to manufacturers that meet certain compatibility criteria. More specifically, to license the Android name and logo, manufacturers need to enter the Android Compatibility Program,9 under which Google also provides them with tools that ensure Android apps run smoothly on their devices.10
13. In this appendix, we use the term ‘Android’ to describe all versions of the Android mobile operating system which enter the Android Compatibility
8 As detailed in this appendix, Google provides manufacturers with: (i) per-device activation payments for the pre-installation of Google Search and Chrome; (ii) a share of its ad revenue for respecting certain placement and promotion requirements, such as setting Google Search as the default search engine on all pre-loaded manufacturer browsers (although third-party browsers could have non-Google search services set as default, if not placed on the default home screen or the ‘minus one’ screen); and (iii) a share of Play Store transaction revenue for setting the Play Store as the default app store and not pre-loading any similar services on the device. 9 Android Compatibility Program Overview | Android Open Source Project. 10 We understand this includes Android Software Development Kits meaning the software development tools used to produce Android apps which provides built-in tools for developers to clearly state the device features required by their applications. See Android Compatibility Program Overview | Android Open Source Project.
E6
Program. We use ‘Android Forks’ instead to refer to versions which are outside Google’s Android Compatibility Program and whose development is not generally subject to the monitoring and control of Google – this does not include Huawei’s HMS devices which, as set out in Chapter 3, use a version of Android that falls within Google’s compatibility requirements, but relies on Huawei’s Huawei Mobile Services.
Android Compatibility Program
14. The Android Compatibility Program defines technical details of the Android platform and provides tools for manufacturers to ensure developer applications developed for the Android operating system run smoothly on a variety of devices. The Program consists of three key components:
• the Android Open Source Project source code;
• the CDD, which sets out the requirements that must be met in order for devices to be compatible with the latest version of Android; and11
• the Compatibility Test Suite (CTS) which is a free online tool that Android partners can download from the Android website and use to detect major CDD compatibility issues in a device.12
15. To build an Android compatible device and thus ensure Android apps work on their devices as they should, manufacturers must comply with the technical specification contained in the Android CDD and pass the tests contained in the CTS.13
16. Android manufacturers that also want to license Google’s apps and services, including Google proprietary APIs, are required by Google to enter the ACC (formerly called the Anti-Fragmentation Agreement (AFA)). Under the ACC, Google’s Android partners agree to maintain compatibility with a baseline version of Android as set out in the CDD. 14 In Figure E.2 below, we refer to the ACC and the CDD together as ‘Compatibility Agreements’, meaning those governing the maintenance of Google-compatible versions of Android.
11 Android 12 Compatibility Definition. 12 Compatibility Test Suite. 13 Android Compatibility Program Overview | Android Open Source Project. 14 Although after the European Commission’s 2018 Google Android decision the ACC allows manufacturers to distribute incompatible Android variants on smartphones and tablets supplied into the EEA and the UK, alongside compatible versions, subject to Android branding requirements.
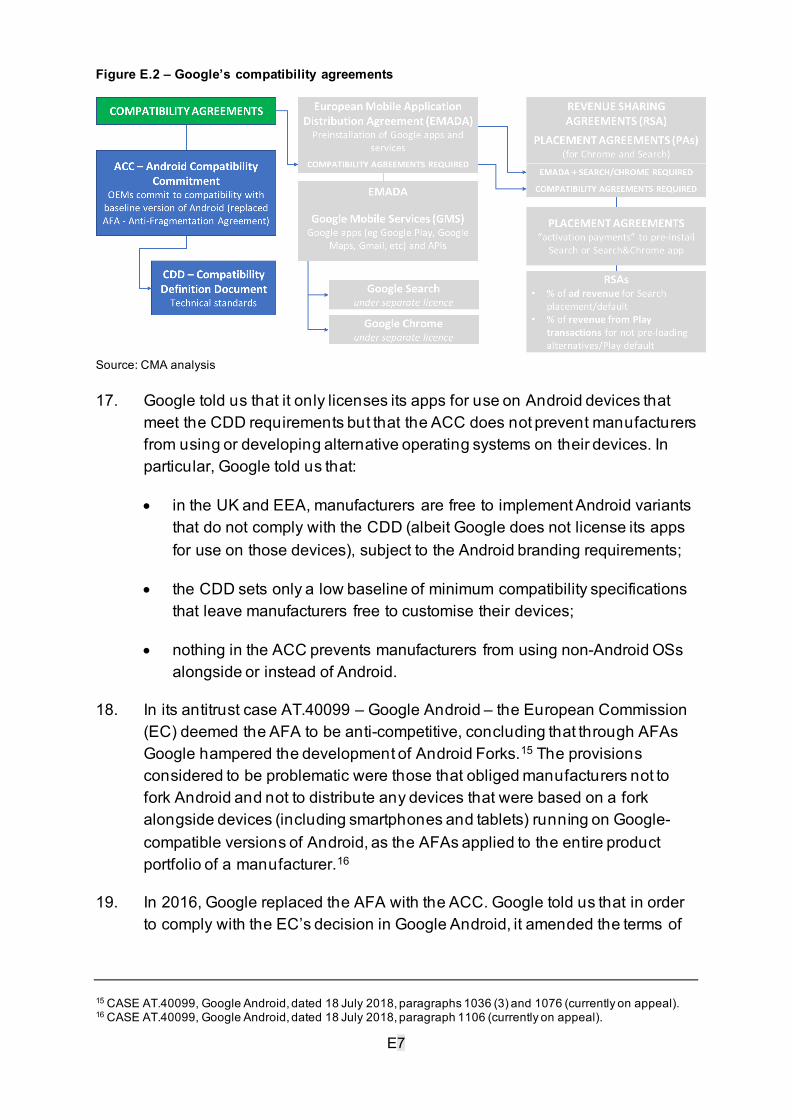
E7
Figure E.2 – Google’s compatibility agreements
Source: CMA analysis
17. Google told us that it only licenses its apps for use on Android devices that meet the CDD requirements but that the ACC does not prevent manufacturers from using or developing alternative operating systems on their devices. In particular, Google told us that:
• in the UK and EEA, manufacturers are free to implement Android variants that do not comply with the CDD (albeit Google does not license its apps for use on those devices), subject to the Android branding requirements;
• the CDD sets only a low baseline of minimum compatibility specifications that leave manufacturers free to customise their devices;
• nothing in the ACC prevents manufacturers from using non-Android OSs alongside or instead of Android.
18. In its antitrust case AT.40099 – Google Android – the European Commission (EC) deemed the AFA to be anti-competitive, concluding that through AFAs Google hampered the development of Android Forks.15 The provisions considered to be problematic were those that obliged manufacturers not to fork Android and not to distribute any devices that were based on a fork alongside devices (including smartphones and tablets) running on Google-compatible versions of Android, as the AFAs applied to the entire product portfolio of a manufacturer.16
19. In 2016, Google replaced the AFA with the ACC. Google told us that in order to comply with the EC’s decision in Google Android, it amended the terms of
15 CASE AT.40099, Google Android, dated 18 July 2018, paragraphs 1036 (3) and 1076 (currently on appeal). 16 CASE AT.40099, Google Android, dated 18 July 2018, paragraph 1106 (currently on appeal).
E8
the ACC to remove compatibility obligations in respect of smartphone or tablet devices supplied into the UK and the European Economic Area (EEA).
20. Following these changes manufacturers can distribute incompatible Android variants on mobile devices supplied into the EEA and the UK, alongside compatible versions, subject to certain branding requirements.17 However, as already noted above, Google does not license its proprietary apps and APIs for use on such devices.
Google’s rationale for the Android Compatibility Program
21. Google told us that the AFA was its response to the threat of incompatibility or ‘fragmentation’ to Android. Incompatibility or fragmentation occurs where there are multiple different versions of the same operating system and those differences are such that apps developed for that operating system do not work properly on every version. Google explained that such incompatibility would increase costs to developers (who would need to develop multiple versions of their app to access all of the operating systems users) and confuse consumers (if apps for that operating system did not work on the version on their device), ‘making the platform less attractive to all’.
22. Indeed, Google told us that ensuring compatibility across Android devices not only promotes developer interest in Android, but also ensure consumers’ favourite apps will be available and function properly if they purchase a new Android device or switch Android devices.
23. Google identified ‘prior open source mobile platforms like Symbian, Linux Mobile, and Java Mobile’ that failed because of incompatibility issues. For instance, according to Google ‘Symbian was the leading platform in 2007 with an estimated 73% share of mobile [operating systems]’ but ‘had almost entirely disappeared’ by 2013 as Symbian’s owners ‘failed to define a single set of standards for apps to rely on’. As a result, the platform fragmented into numerous incompatible variants, creating significant costs for developers, reluctant to write apps for multiple incompatible versions.
24. Google told us that it ‘sought compatibility commitments when Android was nascent and had no assurance of any success and against the backdrop of Symbian and other open-source platforms that succumbed to fragmentation’. Google told us that the CDD's baseline compatibility requirement incentivised developers to write apps for Android, improved the availability and reliability of
17 The ACC requires manufacturers to comply with Google’s branding guidelines. These guidelines state that only compatible Android devices can use the term ‘Android’ and other Google trademarks and brands, and also reserve the right for Google to require that compatible devices display ‘Android’ or other Google brands.
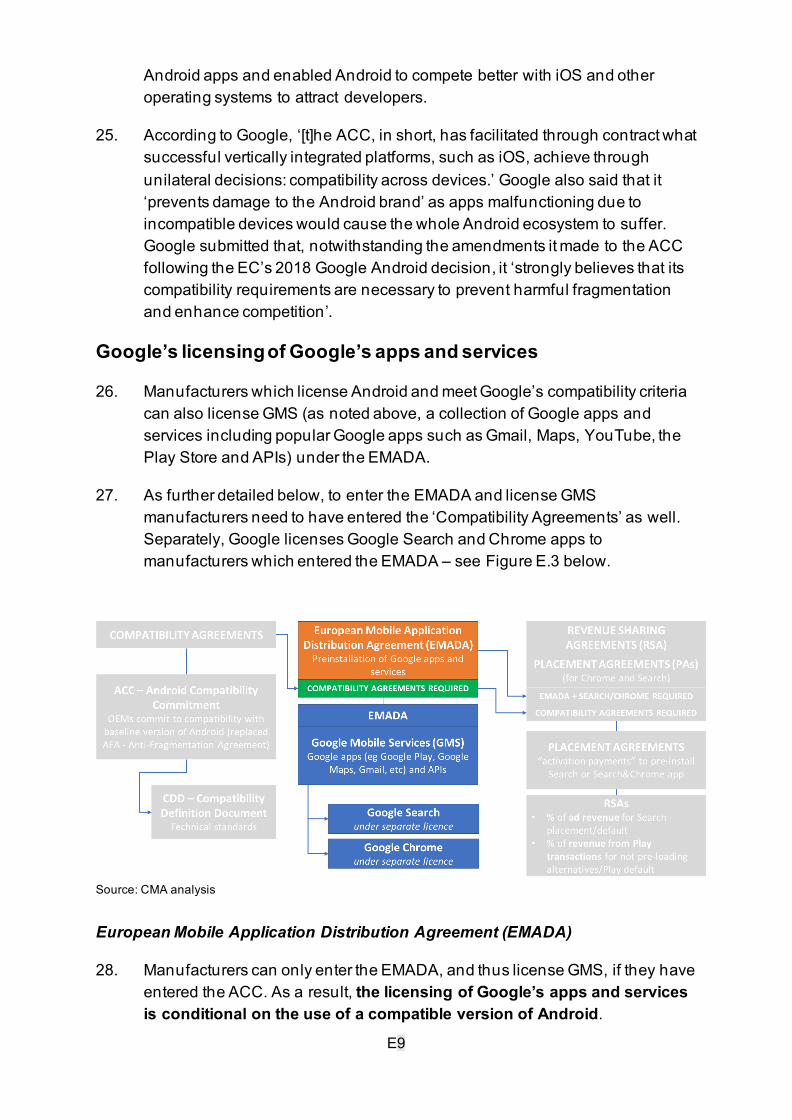
E9
Android apps and enabled Android to compete better with iOS and other operating systems to attract developers.
25. According to Google, ‘[t]he ACC, in short, has facilitated through contract what successful vertically integrated platforms, such as iOS, achieve through unilateral decisions: compatibility across devices.’ Google also said that it ‘prevents damage to the Android brand’ as apps malfunctioning due to incompatible devices would cause the whole Android ecosystem to suffer. Google submitted that, notwithstanding the amendments it made to the ACC following the EC’s 2018 Google Android decision, it ‘strongly believes that its compatibility requirements are necessary to prevent harmful fragmentation and enhance competition’.
Google’s licensing of Google’s apps and services
26. Manufacturers which license Android and meet Google’s compatibility criteria can also license GMS (as noted above, a collection of Google apps and services including popular Google apps such as Gmail, Maps, YouTube, the Play Store and APIs) under the EMADA.
27. As further detailed below, to enter the EMADA and license GMS manufacturers need to have entered the ‘Compatibility Agreements’ as well. Separately, Google licenses Google Search and Chrome apps to manufacturers which entered the EMADA – see Figure E.3 below.
Source: CMA analysis
European Mobile Application Distribution Agreement (EMADA)
28. Manufacturers can only enter the EMADA, and thus license GMS, if they have entered the ACC. As a result, the licensing of Google’s apps and services is conditional on the use of a compatible version of Android.
E10
29. Under the EMADA, Google licenses the GMS suite (containing the Play Store and a set of other Google apps and services but excluding the Google Search app and Chrome) to manufacturers. If a manufacturer wants to preload one of the apps contained in the GMS suite on its device, it has to preload the full suite and place all of the following on the default home screen on the device:
• the Play Store icon; and
• a folder labelled ‘Google’ that contains all the remaining Google apps.
30. As mentioned above, the EMADA does not include licences to the Google Search app or Chrome, which are distributed under separate licences agreements to manufacturers, provided they entered the EMADA.
31. Google generates revenue from manufacturers entering the EMADA, which pay Google a licence fee per activated device, depending on device type, certain device characteristics and activation location [].
Figure E.4 – []
32. In the section below, we explain in further detail what GMS includes.
Google Mobile Services (GMS)
33. Google told us that GMS is a proprietary collection of Google’s apps and services ‘that supports functionality across devices with the aim of providing a user-friendly out of the box experience’ and that providing it ‘ensures an attractive look and feel and a seamless integration of the apps’.
34. As mentioned above, this collection includes popular Google apps such as Gmail, Maps, YouTube, the Play Store, and also a selection of Google proprietary APIs which enable third-party apps and services to communicate with Google’s services (such as Maps, Search, Gmail, and Translate on Android) and create feature-rich apps. More specifically, GMS includes:
• apps which must be preloaded on the system partition of the device18 and thus cannot be deleted but only disabled by the user.19 In the UK, these include Gmail, Maps, YouTube and the Play Store. []
18 Any computer device’s storage is usually divided into separate ‘partitions’. An Android device’s ‘system partition’ contains the operating system, including the device’s user interface and preinstalled apps that cannot be deleted. 19 Disabling one of these apps prevents it from performing any function on the device, while also ensuring the app can be easily re-enabled by the user.
E11
• apps which must be made available to end users as pre-loaded apps on the device when the device is turned on for the first time, but users are able to subsequently delete them. []
• Google Play Services (GPS) which is a software layer that houses Google proprietary APIs and works in the background of Android to enable device functionality for GMS devices and enable developers to use the continually updated set of APIs. Google told us that it regularly updates Google Play Services with new innovative APIs, Software Development Kit (SDKs), and features.
35. Google told us that it ‘does not require OEMs or developers that use it [Android] to license Google’s GMS suite of apps or any other apps’ and that ‘[t]he GMS licensing arrangements are therefore not linked to the licensing of Android or the Android Open Source Project’. It also told us that ‘GMS is not compulsory and including it or not does not alter the availability of Android or any of its features’.
36. However, we understand from Google and others that having GMS installed on a given mobile device, which is conditional on using a compatible version of Android, is needed to ensure that many third-party Android apps work properly on that device.20 This is because many such Android apps rely on functionality included in GMS.
37. Indeed, Google told us that:
• ‘some third-party applications also integrate with one or more Google applications, and thus require the Google application(s) to be installed on the device in order to work appropriately’;
• ‘[t]hird-party developers can more easily design applications for Android phones if they can anticipate the package of Google applications that also will be installed’;
• ‘[w]here a developer uses Google proprietary APIs for its app(s), the proper functioning of the app can only be guaranteed if the device also runs Google Play Services (though some Google proprietary APIs may function without Google Play Services)’; and
• [].
20 See Chapter 3 on importance of GMS both in terms of the popularity of the apps included and potential implications on functionality of the device. On the latter, see also Complaint filed by the Department of Justice against Google, paragraphs 73 to 75 and More Competitive Search Through Regulation, Policy Discussion Paper No. 2, May 2021.
E12
38. As detailed in Chapter 3, GMS and the APIs it includes are important to give access to developers to the mobile device’s hardware features or to particular services and other apps installed on the device. As a result, no access to GMS, for instance for devices running on versions of Android that do not use Google Mobile Services such as Android Forks, means that these features and functionality do not work properly on those devices.
39. Moreover, we are concerned by claims that over time Google has chosen to include important features and functionality in GMS rather than the open-source Android code. For example, a complaint filed by the Department of Justice in the US says that the APIs allowing basic push notifications are included in GMS rather than the open-source Android code.21 To the extent that more features and functionalities are included in GMS this increases the reliance of native Android apps on Google Mobile Services making it more difficult to port them to Android Forks or other versions of Android not using Google Mobile Services.22
40. Google told us that housing such APIs which enable third-party services to communicate with Google’s services (eg Google Maps) and create feature-rich apps in GMS allows Android devices to have the most up to date version of these APIs, ensuring apps relying on these APIs work on all Android devices, even when the manufacturer does not update the underlying Android operating system version.
41. In relation to where these APIs are placed, Google submitted there are reasons for including an API in GMS and not in open-source Android code, including the extent to which the technology they use is proprietary to Google, the frequency of updates they need, etc. More specifically, Google submitted that [].
42. We will consider these concerns and the reasons why Google includes APIs in either GMS or the open-source Android code further in the second half of our market study.
Google Search and Chrome Apps Licence Agreements
43. Google offers separate licences to EMADA partners to distribute the Google Search and Chrome apps on compatible Android devices in the EEA and UK. Under these separate licence agreements, the Google Search app and
21 For example, see the Complaint filed by the Department of Justice against Google, paragraphs 73-75. 22 As set out in Chapter 3, Huawei currently uses a version of Android that falls within Google’s compatibility requirements but relies on Huawei’s Huawei Mobile Services instead of Google Mobile Services.
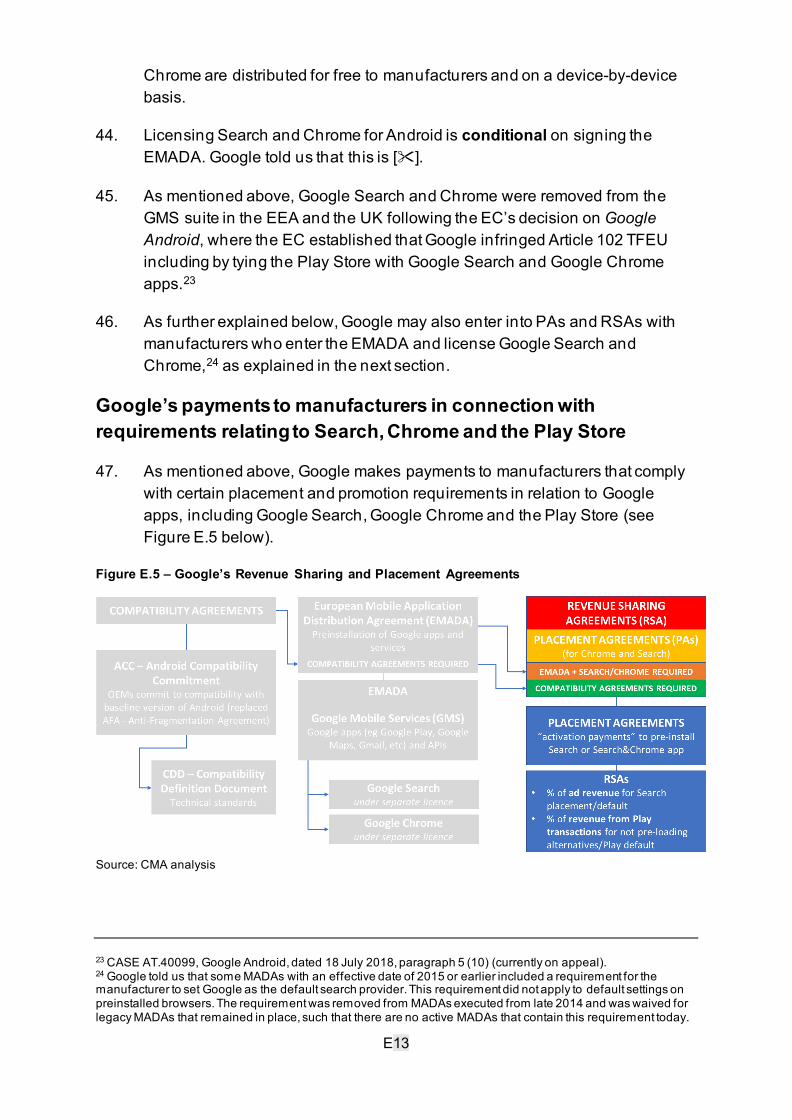
E13
Chrome are distributed for free to manufacturers and on a device-by-device basis.
44. Licensing Search and Chrome for Android is conditional on signing the EMADA. Google told us that this is [].
45. As mentioned above, Google Search and Chrome were removed from the GMS suite in the EEA and the UK following the EC’s decision on Google Android, where the EC established that Google infringed Article 102 TFEU including by tying the Play Store with Google Search and Google Chrome apps.23
46. As further explained below, Google may also enter into PAs and RSAs with manufacturers who enter the EMADA and license Google Search and Chrome,24 as explained in the next section.
Google’s payments to manufacturers in connection with requirements relating to Search, Chrome and the Play Store
47. As mentioned above, Google makes payments to manufacturers that comply with certain placement and promotion requirements in relation to Google apps, including Google Search, Google Chrome and the Play Store (see Figure E.5 below).
Figure E.5 – Google’s Revenue Sharing and Placement Agreements
Source: CMA analysis
23 CASE AT.40099, Google Android, dated 18 July 2018, paragraph 5 (10) (currently on appeal). 24 Google told us that some MADAs with an effective date of 2015 or earlier included a requirement for the manufacturer to set Google as the default search provider. This requirement did not apply to default settings on preinstalled browsers. The requirement was removed from MADAs executed from late 2014 and was waived for legacy MADAs that remained in place, such that there are no active MADAs that contain this requirement today.
E14
48. Google has in place with certain Android manufacturers in respect of UK devices voluntary commercial agreements. For example, it has PAs in place with certain manufacturers regarding the placement of the Google Search app and Chrome on Android devices and RSAs for respecting a number of placement and promotion requirements with respect to certain Google apps, including Google Search, Google Assistant and in some cases the Play Store. Both the PAs and the RSAs are only available to EMADA partners. More specifically
• Under the PAs, Google pays manufacturers ‘activation payments’ for each device on which they pre-install the Google Search or Google Search and Chrome apps and satisfy certain placement obligations for either (i) the Google Search app, or (ii) the Google Search and Chrome apps. Google told us that the placement obligations in the Placement Agreements are non-exclusive, and do not prevent rivals from being pre-installed or displayed prominently on the device. []
• Under its RSAs, Google pays some manufacturers a proportion of its net ad revenue from specific search access points on their devices in return for meeting a number of placement and promotion requirements, such as setting the Google Search app as the default search engine on all preloaded manufacturer browsers;25 and
• In addition, under the RSAs, some manufacturers may receive a proportion of Google’s net revenue from the Play Store’s transactions for setting the Play Store as the default app store on their devices and not pre-loading on their devices any similar services to the Play Store, such as alternative app stores. We understand this was introduced in the most recent RSA contract framework (‘RSA 3.0’) and that under the previous RSA, no payments for Play Store revenues were made to manufacturers by Google.
49. Google told us that its RSAs give manufacturers a choice as to how they configure their devices [].
50. Google also told us that its commercial arrangements for placement of Search/Chrome and RSAs are voluntary agreements, and manufacturers are free to opt into most of the requirements in those agreements for some of their devices.
25 Google told us that third-party browsers (as opposed to manufacturer browsers) can have non-Google search services set as default instead, provided that they are not placed on the default home screen (unless in a folder) or the minus one screen. Google also told is that after the EC’s decision in Google Android the default search service in Chrome is set according to the Android choice screen mechanism that applies in the UK and EEA.
E15
51. However, we consider that these agreements create significant financial incentives for manufacturers not only to pre-install Google Search and Chrome, but also to grant those apps alongside the Play Store, prominent placement, a default status and, in some cases, ensuring that no similar services are preloaded on the device. For instance, all RSAs include setting Google Search as the default search engine on various access points on the device as a requirement while certain RSAs include setting the Play Store as the default app store on the device as well as not preloading any similar services, including alternative app stores, as a requirement.
52. In the sections below we explain in more details what provisions are included in the PAs and RSAs.
Placement Agreements (PAs)
53. Google offers manufacturers the possibility to enter PAs in relation to the Google Search and Chrome apps conditional on the manufacturer using a compatible version of Android, having licensed the GMS suite and, under separate licences, Google Search and Chrome apps.
54. [].
55. This means that manufacturers have a financial incentive to pre-install Google Search and Google Chrome on their devices, which we consider relevant for our assessment of competition in supply of browsers (Chapter 5).
Size of Google’s payments under PAs
56. Google provided aggregate figures for payments it made under PAs to the top five third-party Android manufacturers shipping devices into the UK, according to Statcounter.26 According to Google, the remaining third-party Android manufacturers account for under 6% of mobile devices sold in the UK.
57. Google paid these Android manufacturers approximately $[1-1.5] billion in Search and Search/Chrome Activation Payments under PAs covering the UK, EEA and Turkey in 2020. Most of that figure was paid to Samsung [].
58. We have heard that PAs more than outweigh the EEA licence fees manufacturers incur when entering the EMADA, which means that Google ends up not charging manufacturers at all for licensing its proprietary apps. While the figures reported above appear to show that the licence fee per EEA device is greater than the per-device ‘Search/Chrome Activation payments’, Google told us that it ‘generates licensing revenue for Android from the
26 Mobile Vendor Market Share United Kingdom | Statcounter Global Stats.
E16
European Mobile Application Distribution Agreement (EMADA)’ and ‘incurs costs under the Placement Agreement’ and that ‘these sources of revenues and costs together represent a net cost’.
59. Google told us that the placement obligations contained in the PAs are non-exclusive and do not prevent rivals from being pre-installed or displayed prominently on the device []. However, Google rewards manufacturers for granting Google’s apps default positions and respecting some placement and promotion requirements for certain apps, as covered in the section below.
Revenue Sharing Agreements (RSAs)
60. Google offers manufacturers the possibility to enter RSAs conditional on the manufacturer using a compatible version of Android, having licensed the GMS suite under the EMADA and Google Search and Chrome apps under separate licence agreements. Google told us that it currently has RSAs with a range of manufacturers and mobile network operators. It is unclear to what extent RSAs between Google and manufacturers are personalised or tailored to the specific manufacturers and we intend to investigate this further in the second half of our study.
61. As mentioned above, under its RSAs, Google pays some manufacturers a proportion of its net ad revenue from specific search access points on their devices in return for meeting a number of placement and promotion requirements in relation to Google Search, Google Assistant and in some cases the Play Store, such as setting the Google Search app as the default search engine on all preloaded manufacturer browsers.
62. We understand that after the EC’s decision in Google Android, RSAs are now available only on a per device basis in the EEA and UK. This means that Google’s RSAs cannot apply automatically to the manufacturers’ whole portfolio of devices but need to allow them to select the ones for which they want to opt in.27
63. Google told us that ‘the obligations in Google’s RSAs may differ depending on the negotiated terms of each RSA.’ The revenue share a manufacturer may get increases with the number of obligations they meet for their devices. For instance [].
27 In particular, the EC’s decision concluded that Google abused its dominant position in the national markets for general search services by granting portfolio-based revenue share payments conditional on the pre-installation of no competing general search service. See CASE AT.40099, Google Android, dated 18 July 2018, paragraph 5 (12) (currently on appeal).
E17
The Play Store component in Google RSAs
64. As mentioned above, Google provides manufacturers respecting certain additional requirements in relation to the Play Store with an additional revenue share from Play Store transactions. In exchange, manufacturers agree to set the Play Store as the default app store and are prohibited from preloading similar services to the Play Store, including alternative app stores.
65. Google told us that it introduced the latest version of its RSAs, meaning the ‘RSA 3.0 contract framework’ in late 2019 and implemented it with some manufacturers in the course of 2020. Under the previous RSA version, no payments for Play Store revenue were made to manufacturers. [].
66. Google told us that Play transaction revenue is only shared in respect of devices that meet certain additional requirements in relation to the Play Store []. For those manufacturers whose RSAs entail the possibility to earn a share of revenue from Play transactions, Google told us that the precise level of the shared revenues can vary, with manufacturers getting between [] and [].
67. Google told us that ‘[i]t is important to note that RSAs are voluntary agreements’, [].
68. According to Google, ‘RSAs reflect the normal competition that takes place between apps (and app stores) to seek promotion on OEMs’ devices’ and this competition better enables manufacturers to ‘monetise the screen space on their devices, which in turn leaves them with more funds to invest in new and improved handsets (or to facilitate lower prices)’ and to ‘offer a user interface that competes closely with Apple’s ‘clean’ out-of-the-box set-up’.
Figures for Google payments under RSAs
69. Google provided aggregate figures for payments it made to the top five third-party Android manufacturers shipping devices into the UK, according to Statcounter.28 According to Google, the remaining third-party Android manufacturers account for under 6% of mobile devices sold in the UK.
70. Google paid these manufacturers approximately $[1.5-2] billion in ad and Play Store transactions revenue from their devices under worldwide RSAs in 2020. Most of that figure was paid to Samsung, [].
28 Mobile Vendor Market Share United Kingdom | Statcounter Global Stats.
E18
Google’s agreements with developers
Project Hug
71. Project Hug is an initiative implemented in 2019 by Google and targeting a number of major app developers, and particularly game developers, aimed at ensuring their presence on the Play Store and thus mitigating the risk to the Play Store from alternative distribution channels.
72. In particular, under Project Hug Google provides developers with certain benefits, including commercial benefits which relate to other Google’s complementary products and services, in exchange for treating the Play Store at least comparably to other distribution platforms in terms of feature and content availability and timing of launch of their apps.
73. Project Hug is referred to in two complaints made in the US, namely a complaint filed by a coalition of 39 attorneys general in the United States District Court, Northern District of California (‘the Utah Complaint’)29 and a complaint filed by Epic Games against Google in the same court (‘the Epic Complaint’).30 According to the two complaints:
• Google feared that key app developers might have a strong enough relationship with customers and enough brand recognition to bypass the Play Store, either by launching their services on competing app stores or by accessing consumers through sideloading.31 As a result, Google ‘bought off key app developers’ to deter them from distributing their apps outside the Play Store.32
• Google introduced Project Hug in direct response to Epic’s 2018 decision to launch the popular game Fortnite off the Play Store33 and it ‘anticipated that the potential concentration of a few top app developers could create disintermediation threats to Google Play and Android’.34
29 See State of Utah et al v. Google LLC et al, Case Number 3:2021cv05227. First amended complaint filed 1 November 2021 available at State of Utah et al v. Google LLC et al, 3:21-cv-05227. 30 See Epic Games, Inc. v. Google LLC et al, Case Number 3:2020cv05671. Updated complaint filed 19 August 2021, available at Epic v. Google unredacted complaint - DocumentCloud. 31 Sideloading refers to users directly downloading apps without using an app store. 32 See Utah complaint, paragraph 147. 33 Epic Games’ Fortnite operated outside of the Play Store for 18 months, app was not available on the Play Store until April 2020 when it became available via the Play Store again. See Fortnite owner gives up battle against Google Play store | Google | The Guardian. 34 See Utah complaint, paragraph 150 and Epic complaint, paragraph 128.
E19
• Google quantified the downstream impact of Epic’s decision as $550m or up to $3.6bn potential revenue loss if ‘contagion’ to other developers would follow.35
• The programme was successful in keeping other major app developers, such as Riot, from following Epic’s example.36
74. Based on Google’s documentary evidence and the two complaints discussed above, we understand this initiative to be part of a number of related initiatives targeting several stakeholders participating in Google’s ecosystem, namely app developers (and particularly games) and manufacturers, including alternative app store providers.37 Based on the two complaints we further understand that another of these initiatives by Google is Project Banyan (later renamed Project Agave), which targeted Samsung and its Galaxy Store specifically, although it was never implemented by Google and Samsung.38
75. More specifically, based on Google’s internal documents in relation to Project Hug, it appears that the aim of this initiative is to ensure the presence of important developers on the Play Store and to encourage them to use other Google services.
76. In particular, the key aims of Project Hug are to:
• Encourage relevant developers to continue to distribute their native apps via the Play Store. This was in the face of app developers establishing exclusive distribution relationships with alternative distribution channels and app stores, which is what Epic Games did in 2018 with the Samsung’s Galaxy Store and, based on the Utah complaint, Samsung was pursuing with other popular app developers as well.39
• Discourage relevant developers from co-listing on other app stores in addition to the Play Store – with the view that this would create a cycle for the Play Store whereby alternative app stores would have less top titles and in turn less users, which in turn would reduce smaller developers’ incentive to co-list on several app stores.
35 See Utah complaint, paragraph 150. 36 See Utah complaint, paragraph 153. 37 See Utah complaint, paragraph 152. 38 See Utah Complaint, paragraphs 139-146 and Epic Complaint, paragraphs 119-121. 39 According to the Utah complaint, in 2018, Samsung partnered directly with top game developer Epic to launch the mobile version of Epic’s game Fortnite exclusively on the Samsung Galaxy Store. According to the same complaint, Samsung also pursued exclusive deals with other popular app developers such as Riot Games, Activision, and Blizzard and indicated its intent to place the Galaxy Store on the home screen of its next Generation devices. See Utah complaint, paragraphs 137-138.
E20
• Encourage developers’ adoption of other complementary products and services offered by Google (as outlined below the initiative included value for developers in the form of Google’s cloud, advertising and marketing services) and thus deepen its relationship with such developers.
77. As detailed in Chapter 4, even though Project Hug may offer benefits to certain app developers in the short term, we are concerned that it may create a barrier to emerging competition from other distribution channels, including other app stores, in the longer term.
Google’s submission to the CMA in relation to Project Hug
78. Project Hug was implemented by Google from 2019 and targeted at a number of major developers to encourage developers to continue to develop and distribute their apps via Play. [].
79. Google told us that the value it provides to developers under Project Hug comes in several forms, including in relation to the use of other Google’s products and services such as Google’s cloud, advertising and marketing services. In particular, [].
80. We understand from Google that, in exchange for the benefits listed above, developers agree to treat Play at least comparably to other distribution platforms in terms of feature and content availability and timing of launch of their apps. In particular, developers agree to [].
Google’s internal documents provided to the CMA in relation to Project Hug
81. We have received documentary evidence from Google in relation to Project Hug. In summary, Google’s internal documents in relation to Project Hug show that:
• Google considered the Play Store faced increased risk from alternative app distribution channels in 2019.
• Google targeted certain important game developers.
• Project Hug included a range of commercial proposals which were expected to deliver significant value to developers, equivalent to an effective reduction in the commission rate to those developers.
• Google identified that Project Hug might create a cycle whereby top developers would not co-list on third-party stores (such as the Galaxy Store), which would translate into fewer apps on such stores and thus fewer users of them. This would in turn lead to fewer smaller developers

E21
co-listing and hence reduce the risk of spending being diverted away from Play to alternative stores. We consider this shows that Google was seeking to strengthen the impact of indirect network effects which as set out in Chapter 4 are inherent in the provision of app stores.
• Project Hug is one of a number of strategic initiatives by Google aimed at mitigating the risk to the Play Store from alternative distribution channels.
• Google considered that Project Hug would encourage developers’ adoption of other complementary products and services offered by Google and thus deepen Google’s relationship with such developers.
F1
Appendix F: understanding the role of browser engines
Introduction
1. As discussed in Chapter 5, a browser engine is a key part of a browser, and its role is to transform web page source code into web pages (or web apps) that people can see and engage with on mobile devices.
2. In this appendix, we first discuss the history of browser engines. We then provide additional technical details on two key topics that are discussed in Chapter 5, namely:
• web compatibility (which is primarily determined by the browser engine); and
• Apple requiring browsers on iOS to use its WebKit browser engine (the ‘WebKit restriction’).
3. As discussed in Chapter 5, web compatibility is a key barrier to competition in browser engines, while the requirement to use WebKit on iOS limits the extent to which competing browsers can differentiate themselves from and exert a competitive constraint on Apple’s Safari browser and further limits the support for web apps on iOS.
History of browser engines
4. Every web browser requires a browser engine for layout and rendering. Below, we set out the dates at which new browser engines were created and discontinued, and when browsers switched to and away from those browser engines.
Early proprietary browser engines
5. Browser engines surfaced when the first two commercial-like browsers started competing with each other for popularity. Netscape Navigator (Netscape) and Internet Explorer (IE) both featured proprietary browser engines designed for desktop computers.
6. The intense competition between Netscape and Microsoft in the development of their browser engines led to rapid but incompatible implementations of new
F2
technologies, forcing developers to duplicate their efforts and develop content targeting each browser separately.1
7. Netscape was the most popular web browser prior to IE’s rise, peaking in 1995 at 83% market share.2 However, from 1995 onwards, Microsoft invested heavily in IE, spending over $100 million each year on development, distributing it for free and bundling it with its Windows operating system.3 By 2002, Microsoft had achieved over 90% share of supply in browsers.4
8. Netscape did not label its original browser engine separately from the browsers in which it was embedded. In 2000, it replaced its original browser engine with a new browser engine called Gecko.
9. Microsoft initially licenced the Spyglass engine for use in IE,5 but debuted its own browser engine Trident with the release of IE 4 in 1997. Since then, Microsoft has used Trident in all versions of IE for Windows. Trident is a proprietary browser engine. However, Microsoft permits the development of so-called Trident shells, which are essentially expansions of IE with added functionality.6,7
Modern browser engines
10. Most modern browser engines are open-source. This means that their code is available at no cost to be reviewed, copied, modified and used. A key advantage of open-source development is that many contributors can submit proposed changes, including features and bug fixes. However, a ‘steward’ is ultimately in control of which changes are accepted.
11. We discuss below the three main modern browser engines that are under active ongoing development – Gecko, WebKit, and Blink – in the order they were established.
Gecko
12. Netscape announced Gecko as an open-source browser engine project in 1998.8 However, Netscape Navigator version 6.0, which was released in 2000 using Gecko, failed to outcompete Microsoft’s IE, and in 2003 AOL (which had
1 Web Design in a Nutshell, Niederst Robbins, 2001, page 4. 2 History of Web Browser Engines 1990-2020 (eylenburg.github.io). 3 U.S. V. Microsoft: Court's Findings Of Fact (justice.gov), findings of fact 135 and 136. 4 TheCounter.com: The Full-Featured Web Counter with Graphic Reports and Detailed Information (archive.org). 5 Memoirs From the Browser Wars (ericsink.com). 6 Hosting and Reuse (Internet Explorer) | Microsoft Docs. 7 Examples of Trident shells include AOL Explorer, which is now discontinued, and MSN Explorer. 8 Levitt, Jason (April 20, 1998). ‘Netscape releases the source’. InformationWeek (678). pp. 85–90. ISSN 8750-6874.
F3
acquired Netscape) created the non-profit Mozilla Foundation and made it the steward of Gecko.9
13. Gecko benefited from open-source contributions from many organisations, including Google, and by 2009, the Gecko-based Firefox browser had over 25% share of browser usage across all devices.10 However, Gecko’s share of browser usage has declined since, and Gecko-based browsers have never been popular on mobile devices; they had a share of browser usage of less than 1% on mobile devices in 2020.11
14. In 2016, Mozilla announced Quantum as an effort to build the next-generation browser engine for Firefox users based on Gecko. This involved merging stable portions of Mozilla’s experimental browser engine Servo to Gecko to improve Firefox stability and performance.12 However, the improvement of Gecko using Servo code did not reverse the decline in Gecko’s market share.
WebKit
15. Apple created the WebKit browser engine in 2001 by forking the existing KHTML and KJS libraries from the Unix based K Desktop Environment (KDE), an early open-source project.13 In 2005, Apple released WebKit as open-source software.14 Apple told us that while it ‘has provided guidance, input, and leadership, WebKit is the result of a massive, industry-wide effort. Since its inception, WebKit has had approximately 2,000 individuals who have contributed code, including employees of organisations such as Google, Adobe, Igalia, Samsung, Intel, and Sony’.
16. WebKit was initially adopted by other browsers, including Google Chrome at Chrome’s release in 2008. Apple requires that web browsers use WebKit on iOS.15
Blink
17. Google created Blink in 2013 by forking WebKit. Its stated reason for doing so was that its Chromium browser project (which is the basis for Google Chrome) ‘uses a different multi-process architecture than other WebKit-based
9 IFIP AICT 404 - Identifying Success Factors for the Mozilla Project (springer.com). 10 Statcounter. 11 See shares of supply in Chapter 5. 12 Quantum - MozillaWiki. 13 Don Melton on Twitter: "ATTENTION INTERNETS! WebKit is not 10 years old today. That happened on June 25. I know the date because that's when I started the project." / Twitter. 14 Molkentin, Daniel (June 7, 2005). "Apple Opens WebKit CVS and Bug Database". KDE News. Archived from the original on July 15, 2009. 15 We assess the impacts of this restriction in Chapter 5 of our interim report.
F4
browsers, and supporting multiple architectures over the years has led to increasing complexity for both the WebKit and Chromium projects. This has slowed down the collective pace of innovation’.16 One commentator at the time noted that Google had been participating more actively than Apple in developing WebKit, by some measures.17
18. Like Gecko and WebKit, Blink today benefits from open-source contributions from many organisations. Major contributors include Microsoft, Opera, Facebook, Adobe, Intel, IBM and Samsung.18 Moreover, Blink is popular with browser vendors. Since Chrome’s switch to Blink, many other browsers have followed suit or adopted the engine upon entry to the browser market, including Opera, Yandex, Samsung Internet, Brave, Vivaldi and Edge.19
EdgeHTML
19. When it launched its new Edge browser in 2015 – a replacement for IE – Microsoft forked its proprietary Trident browser engine to create EdgeHTML.20 One of Microsoft’s main motivations for forking Trident was to make it easier to ensure web compatibility.21 However, Microsoft ultimately decided that replacing EdgeHTML with Blink would best ensure web compatibility, and in 2020 it switched to using Blink as its browser engine for Edge.22
Presto
20. Opera originally used its own proprietary browser engine, Presto, which debuted in 2003.23 However, in 2013 Opera switched to using Blink.24
Others
21. As discussed above, most browsers are now powered by Google’s browser engine Blink and the supply of browser engines is highly concentrated (as discussed in Chapter 5 in the section on shares of supply).
16 Blink: A rendering engine for the Chromium project | Google Open Source Blog (googleblog.com). 17 Hypercritical: Code Hard or Go Home. 18 AUTHORS - chromium/src.git - Git at Google (googlesource.com). 19 See Opera Confirms It Will Follow Google, Ditch WebKit for Blink (thenextweb.com); Yandex Signs Google Agreement for Submitting Contributions to the Chromium Project Alongside Nvidia, Opera (thenextweb.com); What’s The Deal With The Samsung Internet Browser? An Interview With Jungkee Song — Smashing Magazine; How Vivaldi browser is different from Google Chrome; Brave Unveils Development Plans for Upcoming 1.0 Browser Release, Including Transition to Chromium Front-End | Brave Browser. 20 A break from the past: the birth of Microsoft's new web rendering engine - Microsoft Edge Blog (windows.com). 21 Building a more interoperable Web with Microsoft Edge - Microsoft Edge Blog (windows.com). 22 Microsoft Edge: Making the web better through more open source collaboration | Windows Experience Blog. 23 Dev.Opera — Opera Mini server upgrade. 24 Dev.Opera — A First Peek at Opera 15 for Computers.
F5
22. There have been a limited number of entrants over the past decade, including:
• The open-source browser engine Goanna, a fork of Gecko which is stewarded by Moonchild Productions. Officially launched in 2015, Goanna powers both of Moonchild Productions’ open-source web browsers, PaleMoon and Basilisk.25 The browser engine has also been adopted by K-Meleon and Mypal.26,27
• The proprietary browser engine Flow, launched by UK-based developer Ekioh in its browser (also called Flow) in late 2020.28 Unlike most browser engines, Flow is not a fork of a previous browser engine codebase. Ekioh is aiming to differentiate Flow from Blink by building a browser for uses where a new browser engine would have clear benefits, such as better performance.29,30
23. To date, these browser engines have attracted very limited usage.
24. Figure F.1 sets out the timeline of modern browser engine development, illustrating that WebKit, Blink and Gecko are the only three major browser engines that continue to be under active development.
25 Pale Moon adopts new Goanna browser engine, fine-tunes interface (betanews.com) 26 K-Meleon (kmeleonbrowser.org) 27 Mypal - Official Website (mypal-browser.org) 28 Unlike many other modern browser engines, Flow is not a fork of an existing codebase. 29 Flow Browser | The parallel, multithreaded HTML browser (ekioh.com) 30 Flow: A lightweight browser with a new rendering engine (fastcompany.com)
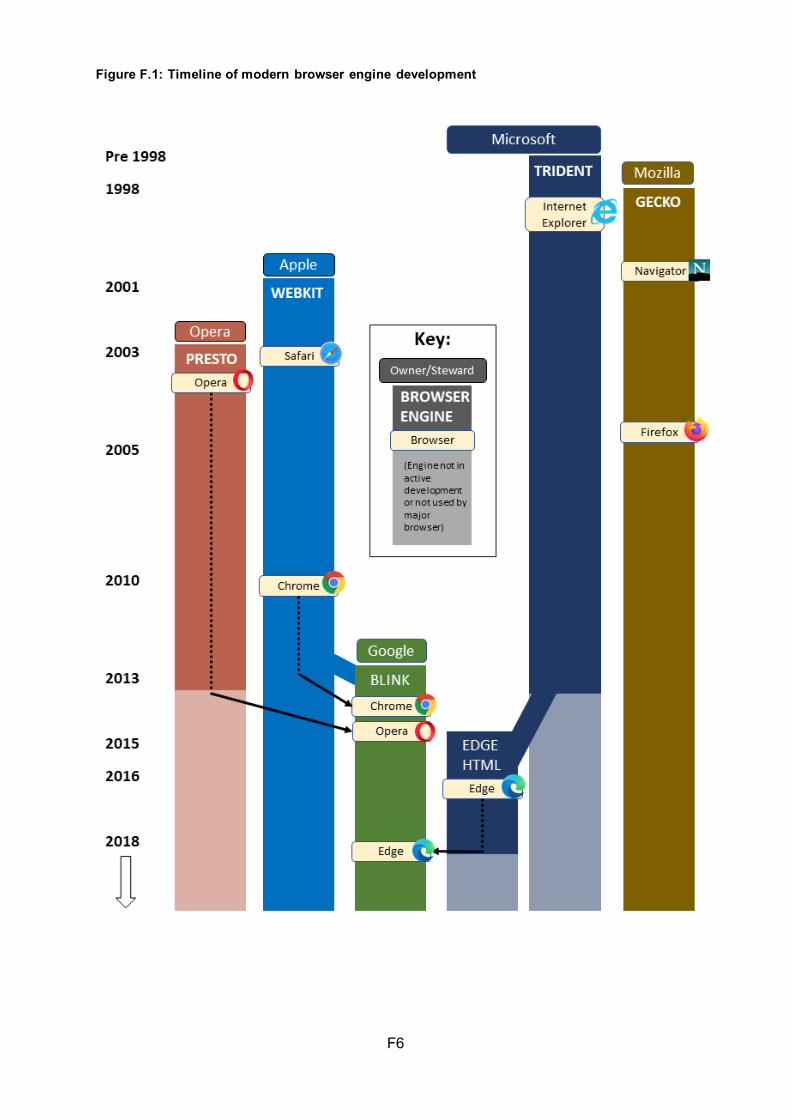
F6
Figure F.1: Timeline of modern browser engine development
F7
Web compatibility
25. The type of content which can be created by online content providers and accessed by users depends on the capabilities which have been implemented by browser engines. If the browser engine in a user’s browser does not have a particular capability, then a user will be unable to properly engage with the relevant web content. For example, if a user’s browser engine lacks the ability to process a particular video format, the user will not be able to watch a video using that format which has been uploaded to a web page.
26. In general, online content providers try to ensure that their content is compatible with multiple browser engines so that it reaches as many consumers as possible. However, where browser engines’ capabilities differ, online content providers may choose to produce content which is not supported by all browser engines. There is an inherent tension between compatibility and competition between browser engines to provide new capabilities, as any novel capability provided by a browser engine will not be present in other browser engines. A small browser engine which adds a novel capability cannot expect this to be used extensively by online content providers, given the small audience it commands. A capability implemented by a widely used browser engine, on the other hand, is more likely to be adopted. Once a critical mass of online content providers has implemented content using a novel capability, other browser engines may feel pressure to replicate it as their users increasingly encounter web pages which use the new capability (and as a result of the standards-setting work described below).
27. Compatibility is not ‘all or nothing’, and web developers have adopted a range of strategies to manage compatibility issues. A popular approach is ‘progressive enhancement’, where web content is structured to be available to as wide a variety of browser engines as possible, but enhanced by newer functionality where a user’s browser permits.31 If a capability is sufficiently important, online content providers can resort to telling users to use a specific browser to access their content.
28. At times, online content providers have found it very difficult to ensure that their content is compatible with multiple browser engines (such as the browser engines in the early versions of Netscape and Internet Explorer). To avoid this, and to maximise compatibility, institutions have been created through
31 Progressive Enhancement and the Future of Web Design - hesketh.com.
F8
which they can coordinate around novel browser engine capabilities through web standards.
29. Key standards development organisations include:
• The Internet Engineering Task Force (IETF):32 a loosely self-organised group that contributes to the engineering and evolution of Internet technologies, via producing high quality, relevant technical and engineering documents (such as protocol standards and best current practices documents) that influence the way people design, use, and manage the Internet. It aims to support the evolution of the internet and maintaining the smooth running of the internet as a whole, via developing and maintaining the Request For Comment (RFC) documents that define the open standards by which the internet is managed. These open standards are developed via rough consensus.
• The World Wide Web Consortium (W3C):33 which develops web standards via its international community of member organisations, a full-time staff, and the public. W3C's primary activity is to develop protocols and guidelines that aim to ensure long-term growth for the web. The W3C adopts a process to get to a ‘W3C Recommendation’ or ‘standard’,34 via workshop, activity proposal and working group, by which specifications and guidelines are reviewed and revised.
30. As a result of work by standards development organisations, there are a series of open standards that should address concerns of web compatibility. However, in practice, compatibility and standards-setting issues remain. In particular:
• Mozilla submitted that dominant players, and in particular Google, can distort markets due to not committing to final standard and/or not respecting the agreed timelines to deploy or deprecate relevant technologies. By way of example, Mozilla told us that in video conferencing services ‘this is the implementation of WebRTC in browsers, where premature deployment of a non-standard interface in Chromium resulted in over half a decade of compatibility problems between websites and other browsers’.35
32 IETF | Internet Engineering Task Force. 33 http://www.w3.org/. 34 https://www.w3.org/Consortium/Process/. 35 Mozilla’s Response to the Public Consultation on Google's Privacy Sandbox Commitments at Page 7, dated 8 July 2021.
F9
• Apple submitted that with respect to G Suite, which is a suite of web applications created by Google for businesses (now called Google Workspace), users in browsers based on WebKit are unable to access documents offline or voice typing. Apple submitted that it understands that rather than using web standard functionality, G Suite depends on a browser extension that ships with Chrome and is not available on other browsers.
• One browser vendor submitted that website developers do not always develop sites against the standards and instead develop sites using development tools (often provided by browser makers) and test those sites against the web browsers they want to make sure they support. Similarly, an internal document from Microsoft states that ‘web developers are explicitly coding first and foremost to Chrome’ and that this means that ‘in most cases developers are not even consulting web standards or testing on other browsers’.
• One market participant submitted that the strength of Chrome has given Google ‘control’ over standards bodies, allowing it to push its preferred specifications which must then be implemented by its competitors.
• Although online content providers largely told us that they ensure web compatibility with all major browsers, there are certain exceptions. Out of the 33 online content providers that commented on web compatibility, seven did not list the Firefox mobile browser as a browser for which they ensure compatibility.36 Additionally, it is unclear which level of support the online content providers considered when answering this question.
31. A group of technical experts told us that they estimated that supporting all browsers costs around 130-160% of the initial implementation cost of a webpage or web app if standards have been followed correctly, compared to a 300-500% cost (in addition to substantial ongoing maintenance) to support multiple platforms for web, Android, iOS and desktop.
Browser engine restriction on iOS
32. As discussed in Chapter 5, Apple requires all browsers on iOS to use WebKit as their browser engine. With respect to this restriction, we below set out: (i) details on the specific security rationale provided by Apple with respect to this
36 Of these seven, three did not list Firefox at all, while the remaining four only listed the Firefox desktop browser. One respondent submitted that the latest version of Firefox was partially supported.
F10
restriction; and (ii) evidence on the comparison of browser engine performance and feature support.
Specific security claims made by Apple with respect to the WebKit restriction
33. Apple submitted that one of the main reasons for the WebKit restriction is security. In particular, Apple told us the following:
• Modern websites are dynamic applications (in the sense that they can change their behaviour/functionality over time), and websites run a lot of software from third party developers. Modern browsers run Just-In-Time compiling (JIT), such that, with each time the website is compiled, it is slightly different in behaviour. This dynamic behaviour on websites is known as an ‘attack surface’. Through loading webpages users are running software that has the ability to ‘attack’ the iPhone’s security.
• iOS has been programmed to have multiple layers of defence, meaning that in order to successfully attack the iPhone, an attacker would need to chain attacks through multiple layers. The attacker’s end goal is to access the full phone, and ultimately get the phone’s compiler to run the attacker’s own code giving them Remote Code Execution (RCE). One method through which an attacker does this is through the JIT compiling.
• WebKit is the only engine on iOS that can access JIT, thereby allowing Apple to concentrate its security resources and auditing on one target. By mandating the WebKit restriction, Apple can rapidly fix any vulnerability for all apps across the iOS ecosystem.
• There are thousands of non-browser apps using WebKit to render webpages (in-app browsing or some in-app advertisements, for example). If instead apps used a non-WebKit browser engine and it were to require an update, Apple would also have to require thousands of developers to update their own app. This could cause some vulnerabilities to persist for months, if not years.
• WebKit is tightly integrated with device hardware and the iOS operating system to deliver substantial security protections, and third-party browser engines lack important features that Apple harnesses via tight integration between WebKit and iOS device hardware and software.37
37 For example, Apple noted that WebKit benefits from Pointer Authentication Codes engineered into Apple Silicon chips that defeat a major hacking technique and a hardened sandbox profile designed specifically to protect against web-based attacks.
F11
• Apple’s own opinion is that WebKit offers a better security level than Blink and Gecko.
34. Apple further submitted that there were privacy reasons for the WebKit restriction as removing the WebKit requirement would allow individual apps to become ‘dynamic’ and change their behaviour or functionality after app review.
Evidence comparing browser engine feature support and performance
35. We engaged with various stakeholders on test suites that compare WebKit to other browser engines. Several stakeholders proposed measures that assess compatibility and feature support. For example, in response to our request for information, such measures were proposed by Google and several technical experts. Mozilla submitted that while measures that assess feature support may be useful to assess interoperability issues, it listed other factors such as performance and standards compliance as also relevant. Apple submitted that a focus on compatibility or web standards compliance does not adequately reflect attributes of browser engine quality, including quality, performance, stability and privacy, and Apple explained that, in the normal course of business, it tests web app responsiveness, JavaScript performance and graphics performance.
36. On the basis of these submissions, we consider that while a variety of measures are likely to be relevant, compatibility and feature support appear to be particularly important. We have therefore focused on these measures, although we have also considered other measures.
Compatibility and feature support
37. In the below, we present the test suites that were recommended to us and further discuss stakeholders’ views on them.
Recommended test suites
38. In response to our request for information, Google as well as several technical experts endorsed a test suite measuring compatibility and feature support called the Web Platform Test (WPT) Dashboard, also referred to as wpt.fyi.38,39 This project runs tests for various browser technologies and, on
38 See web-platform-tests dashboard (wpt.fyi) 39 The Web Platform Test Project is also discussed in blog posts by Alex Russell (Progress Delayed Is Progress Denied - Infrequently Noted) and Tim Perry (Safari isn't protecting the web, it's killing it | HTTP Toolkit). Mozilla submitted that the Web Platform Test Project is useful to gauge interoperability issues, but that it looks at just one facet of how browser engines operate and implement certain web standards.
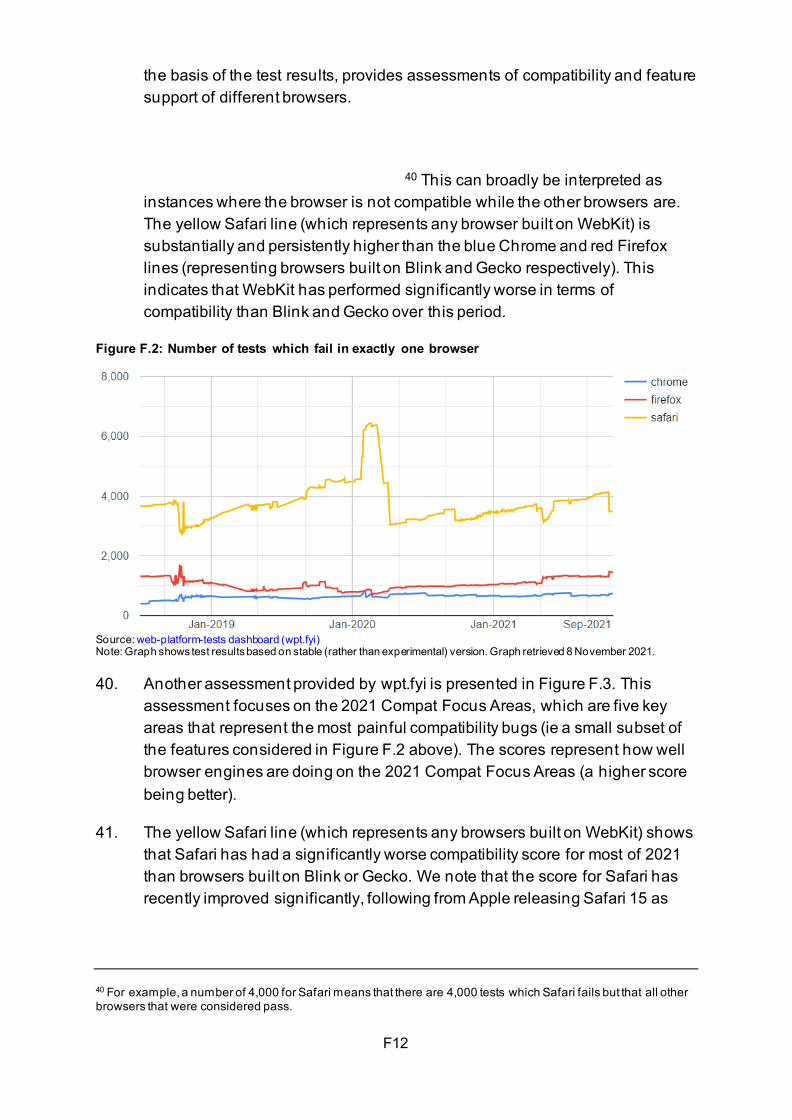
F12
the basis of the test results, provides assessments of compatibility and feature support of different browsers.
40 This can broadly be interpreted as instances where the browser is not compatible while the other browsers are. The yellow Safari line (which represents any browser built on WebKit) is substantially and persistently higher than the blue Chrome and red Firefox lines (representing browsers built on Blink and Gecko respectively). This indicates that WebKit has performed significantly worse in terms of compatibility than Blink and Gecko over this period.
Figure F.2: Number of tests which fail in exactly one browser
Source: web-platform-tests dashboard (wpt.fyi) Note: Graph shows test results based on stable (rather than experimental) version. Graph retrieved 8 November 2021. 40. Another assessment provided by wpt.fyi is presented in Figure F.3. This
assessment focuses on the 2021 Compat Focus Areas, which are five key areas that represent the most painful compatibility bugs (ie a small subset of the features considered in Figure F.2 above). The scores represent how well browser engines are doing on the 2021 Compat Focus Areas (a higher score being better).
41. The yellow Safari line (which represents any browsers built on WebKit) shows that Safari has had a significantly worse compatibility score for most of 2021 than browsers built on Blink or Gecko. We note that the score for Safari has recently improved significantly, following from Apple releasing Safari 15 as
40 For example, a number of 4,000 for Safari means that there are 4,000 tests which Safari fails but that all other browsers that were considered pass.
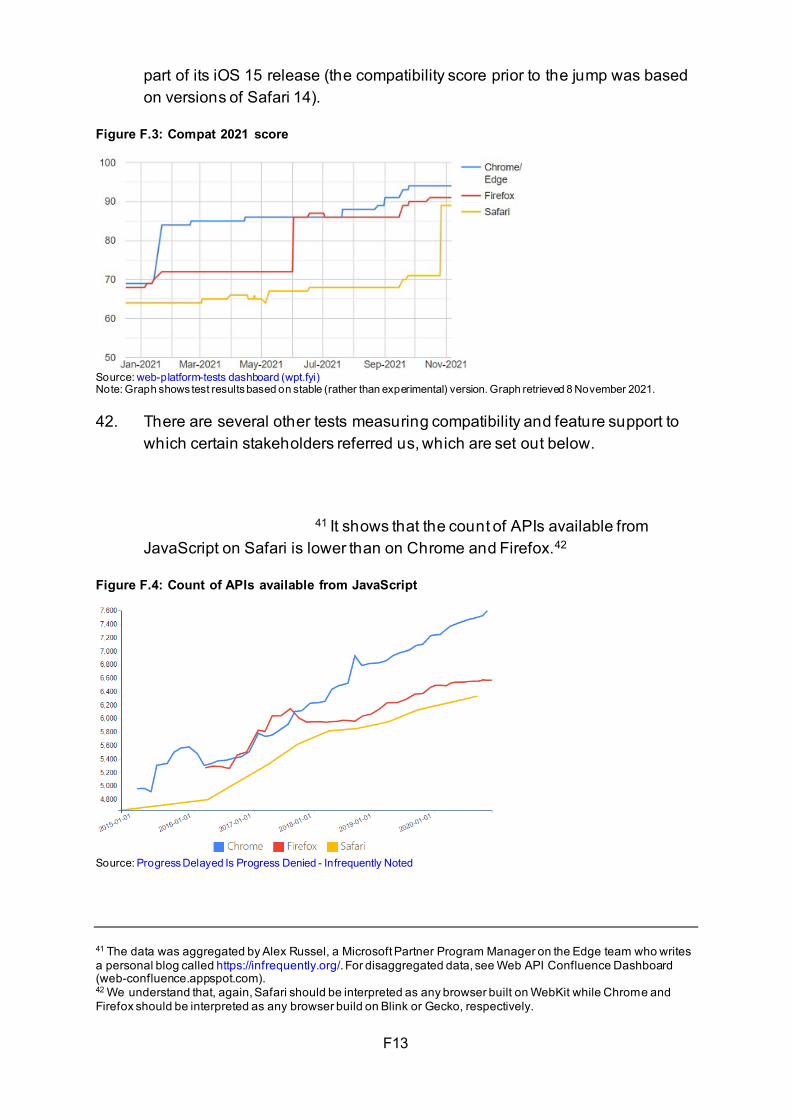
F13
part of its iOS 15 release (the compatibility score prior to the jump was based on versions of Safari 14).
Figure F.3: Compat 2021 score
Source: web-platform-tests dashboard (wpt.fyi) Note: Graph shows test results based on stable (rather than experimental) version. Graph retrieved 8 November 2021. 42. There are several other tests measuring compatibility and feature support to
which certain stakeholders referred us, which are set out below.
41 It shows that the count of APIs available from JavaScript on Safari is lower than on Chrome and Firefox.42
Figure F.4: Count of APIs available from JavaScript
Source: Progress Delayed Is Progress Denied - Infrequently Noted
41 The data was aggregated by Alex Russel, a Microsoft Partner Program Manager on the Edge team who writes a personal blog called https://infrequently.org/. For disaggregated data, see Web API Confluence Dashboard (web-confluence.appspot.com). 42 We understand that, again, Safari should be interpreted as any browser built on WebKit while Chrome and Firefox should be interpreted as any browser build on Blink or Gecko, respectively.
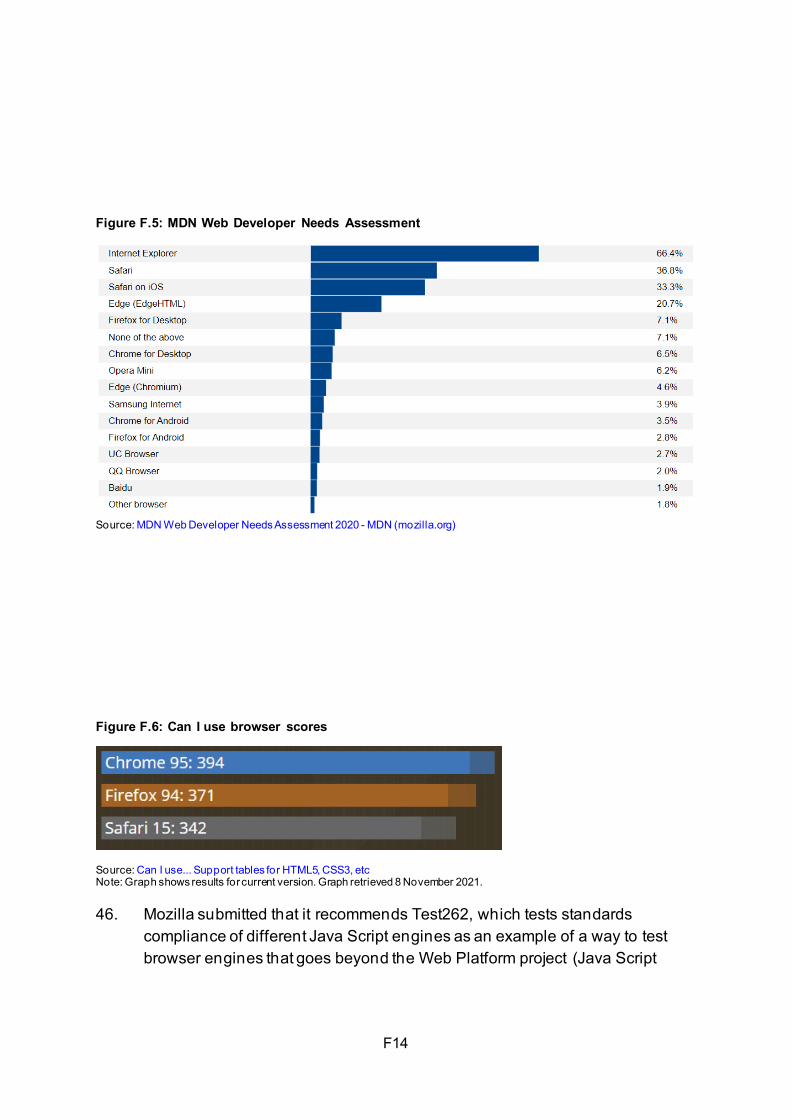
F14
Figure F.5: MDN Web Developer Needs Assessment
Source: MDN Web Developer Needs Assessment 2020 - MDN (mozilla.org)
Figure F.6: Can I use browser scores
Source: Can I use... Support tables for HTML5, CSS3, etc Note: Graph shows results for current version. Graph retrieved 8 November 2021. 46. Mozilla submitted that it recommends Test262, which tests standards
compliance of different Java Script engines as an example of a way to test browser engines that goes beyond the Web Platform project (Java Script
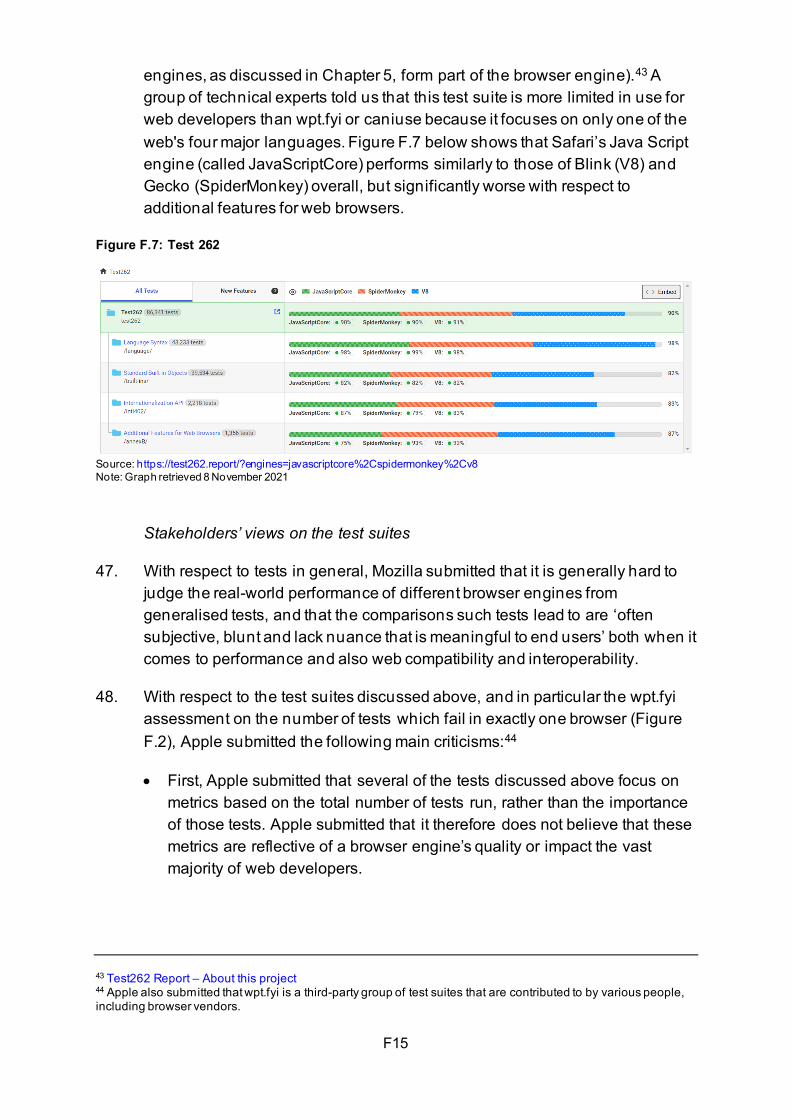
F15
engines, as discussed in Chapter 5, form part of the browser engine).43 A group of technical experts told us that this test suite is more limited in use for web developers than wpt.fyi or caniuse because it focuses on only one of the web's four major languages. Figure F.7 below shows that Safari’s Java Script engine (called JavaScriptCore) performs similarly to those of Blink (V8) and Gecko (SpiderMonkey) overall, but significantly worse with respect to additional features for web browsers.
Figure F.7: Test 262
Source: https://test262.report/?engines=javascriptcore%2Cspidermonkey%2Cv8 Note: Graph retrieved 8 November 2021
Stakeholders’ views on the test suites
47. With respect to tests in general, Mozilla submitted that it is generally hard to judge the real-world performance of different browser engines from generalised tests, and that the comparisons such tests lead to are ‘often subjective, blunt and lack nuance that is meaningful to end users’ both when it comes to performance and also web compatibility and interoperability.
48. With respect to the test suites discussed above, and in particular the wpt.fyi assessment on the number of tests which fail in exactly one browser (Figure F.2), Apple submitted the following main criticisms:44
• First, Apple submitted that several of the tests discussed above focus on metrics based on the total number of tests run, rather than the importance of those tests. Apple submitted that it therefore does not believe that these metrics are reflective of a browser engine’s quality or impact the vast majority of web developers.
43 Test262 Report – About this project 44 Apple also submitted that wpt.fyi is a third-party group of test suites that are contributed to by various people, including browser vendors.
F16
• Second, Apple submitted that many tests run by wpt.fyi turn out to be mistaken, or to support single-browser non-standard features, which Apple does not believe is helpful. Apple also noted that, since tests are contributed by third parties, the test quality is inconsistent, and vulnerable to gaming by browser vendors.
• Third, Apple submitted that wpt.fyi is configured in a way that distorts the actual performance of Safari. In this regard, Apple submitted that (i) wpt.fyi compares an old beta version of Safari with newer versions of other browsers,45 (ii) wpt.fyi runs tests in private browsing mode (which leads to many of the compatibility failures that are being reported) and (iii) a substantial portion of the reported test failures can be attributed to Safari’s lack of support for the web specification ‘SharedWorkers’, for which Apple removed support due to its low adoption.
49. With respect to Apple’s first point, Google told us that it considers measures on overall API support (such as the graph on the number of tests which fail in exactly one browser in presented in Figure F.2 and the graph on the count of APIs available from JavaScript presented in Figure F.4) are simple and objective measures. Google also submitted that it considers these tests to be quite comprehensive and cover a wide range of APIs.
50. We also note that one of the assessments (Figure F.3) focuses on the five key areas that represent the most painful compatibility bugs. Even on the basis of this narrower set of features, Safari was performing significantly worse than Blink and Gecko based browsers until very recently and still has a slightly lower score.
51. With respect to Apple’s second and third point, Google told us that the tests are developed with and shared with the community. Google also told us that it considers the comparison to be fair and conducted on equivalent terms. In particular, it told us that it does not think that the test results are reliant on enabling a special mode and that it would expect that the graphs would, independent of which mode is selected, show a similar pattern.
52. We also note that, as set out above, the wpt.fyi assessments were endorsed by several stakeholders, which calls into question the quality concerns raised by Apple.
53. Overall, we acknowledge that there are certain limitations to the test suites discussed above. With respect to the wpt.fyi assessment on the number of
45 In particular, Apple submitted that wpt.fyi uses Safari Technical Preview (STP), a months-old beta version of potential future iterations of Safari for a technical audience.
F17
tests which fail in exactly one browser, we consider that it is a meaningful indicator of the relative feature support of WebKit compared to other browser engines. We also note that a number of other test suites show similar patterns with respect to WebKit’s feature support.
Other measures
54. Apple submitted that it uses test providers to test web app responsiveness, JavaScript performance and graphics performance. Apple further submitted that, on these tests, WebKit-based Safari on iOS outperforms competing browsers based on competing engines on Android devices. However, Apple only provided us with the test results for desktop browsers, rather than for browsers on mobile operating systems.
55. Apple further submitted that it believes that power efficiency (particularly in mobile applications), page load speed and memory use are good metrics to compare browser engine performance. While Apple submitted that there are no third-party test suites that measure these metrics across browsers, it submitted internal tests showing that WebKit-based browsers perform better on page loading and power efficiency than competing browsers based on other browser engines.
G1
Appendix G: pre-installation, default settings and choice architecture for mobile browsers
Introduction
1. As discussed in Chapter 5, Apple and Google influence user behaviour in terms of the mobile browser they use through choice architecture,1 including in particular pre-installation and default settings (default in this regard means that the browser automatically opens and renders a webpage upon a user clicking a link to a website, for example, in an email, without the user needing to select the browser manually).
2. In this appendix, we provide additional details on the following topics that are discussed in Chapter 5, namely:
• the current agreements for pre-installation and default settings on mobile devices;
• the impact of pre-installation and default settings on user behaviour; and
• the impact of the choice architecture of the different routes available to users for switching their default browsers.
Current agreements
iOS devices
3. Since the launch of the iPhone in 2007 Safari is the only browser pre-installed on iOS devices. Apple submitted that the pre-installation and integration of Safari on its devices gives users a ‘premium out-of-the-box experience’.
4. Safari is also set as the default browser on iOS devices. Since September 2020 users can change the default browser in their device’s settings. To change the default a user needs to first download the browser they wish to set as the default as there are no other browsers pre-installed on iOS devices.
5. Apple has agreements with search engine providers, under which it receives a share of search advertising revenue where that search engine is set as the
1 Choice architecture describes the contexts in which users make decisions and how choices are presented to them. In online or digital settings, choice architecture refers to the environment in which users make choices, including the presentation and placement of choices, and the design of user interfaces. Examples of choice architecture are the ordering of options available to users, the user interface design for changing default settings, presentation of search results etc. See Thaler, R. H., Sunstein, C. R., & Balz, J. P. (2013). Choice Architecture. In E. Shafir (Ed.), The Behavioral Foundations of Public Policy (pp. 428-439). Princeton University Press for details on choice architecture.
G2
default on Safari.2 Under Apple’s agreement with Google, Google Search is set as the primary default on iOS devices. Bing and DuckDuckGo hold agreements regarding their inclusion as a secondary option that users can select from a menu in the device settings.3
Android devices
6. Google has a network of agreements with device manufacturers to pre-install its apps – including Chrome and Google Search – and set them as the default.4
7. In 2018, the European Commission found in its Google Android investigation that Google had engaged in practices that aimed at cementing its dominant position in general internet search.5 Prior to the Google Android case, Google licenced Chrome to device manufacturers free of charge as part of a suite of 11 applications and services named Google Mobile Services (GMS). It was not possible for device manufacturers to pre-install only a subset of apps. In particular, that meant that if a device manufacturer wanted to pre-install Google Play, Chrome (and Google Search) also had to be pre-installed.
8. As a result of the Google Android case, Google reduced the number of applications in GMS by removing Chrome and Google Search. Device manufacturers that license GMS can now license Chrome (and Google Search) separately at no cost with no placement or default requirements.6,7 However, Google also adopted a paid licensing structure for GMS, which previously had been free.
9. Licensing of GMS is governed by the European Mobile Application Distribution Agreement (EMADA). Google generates revenue from
2 For further detail see, CMA (2020), Online Platforms and Digital Advertising Market Study, Final Report, Appendix H, paragraph 28. 3 Browsers and devices generally allow consumers to change the initial default search engine through a settings menu. Within these settings, consumers may be presented with several alternative options. Unless otherwise stated, we use the term ‘default’ to refer to the initial or primary default on a browser or device and the term 'secondary option' to describe the set of alternative search engines that are offered to consumers within the settings menu of a device or browser. 4 See Appendix E for detail on the agreements Google enters with device manufacturers. 5 Case AT.40099 – Google Android, European Commission, Decisions of 18 July 2018 relating to proceedings under Article 102 of the Treaty of the Functioning of the European Union and Article 54 of the EEA Agreement, C(2018)4761 final. The European Commission found that Google had been (i) tying Google Search with the Play Store; (ii) tying Chrome, with the Play Store and Google Search ; (iii) making the licensing of the Play Store and Google Search conditional on agreements that contain anti-fragmentation obligations; and (iv) granting revenue share payments to device manufacturers and mobile network operators on condition that they pre-install no competing general search service on any device within an agreed portfolio. 6 As a result of the Google Android case, Google also no longer sets Google Search as the default search engine in Chrome. 7 We note that it is still a prerequisite for device manufacturers to have licensed GMS to enter into the separate Chrome and Google Search agreements. However, device manufacturers now have the option to license GMS without Chrome and/or Google Search.
G3
manufacturers entering the EMADA, which pay Google a license fee per activated device, depending on device type, certain device characteristics and activation location [].8
10. Device manufacturers have the option to compensate for the cost of the EMADA by entering into a Placement Agreement (PA) and/or a Revenue Share Agreement (RSA) with Google.
• Under the PAs, device manufacturers receive a per device activation payment when they pre-install Chrome and satisfy specific placement obligations. The PA is non-exclusive and does not prevent other browsers being displayed prominently.
• Under its RSAs, Google pays a proportion of advertising revenue generated from specific Google Search and Google Assistant access points to device manufacturers in return for placement and promotion.9 RSAs typically apply to all devices in a territory, though variations are possible. The placement obligations include obligations for Chrome and require Google Search be set as default in any pre-installed manufacturer browser.10
11. Google provided aggregate figures for payments it made as part of its PAs and RSAs to the top five third-party Android manufacturers shipping devices into the UK, according to Statcounter. Google paid these manufacturers approximately $[1-1.5] billion in Search and Search/Chrome Activation Payments under PAs covering the UK, EEA and Turkey in 2020. Most of that figure was paid to Samsung, []. Google paid these top five third-party Android manufacturers approximately $[1.5-2] billion in ad and Play transactions revenue from their devices under worldwide Revenue Share Agreements in 2020. Most of that figure was paid to Samsung, [].
Impact of pre-installation and default settings on consumer behaviour
12. We consider below evidence regarding the impact that pre-installation and default settings have on consumer behaviour with respect to browser choice.
8 For further detail on the EMADA, see Appendix E. 9 Google Assistant is Google’s voice assistant. For further detail, see https://assistant.google.com/ 10 Google told us that third-party browsers (as opposed to manufacturer browsers) can have non-Google search services set as default instead, provided that they are not placed on the default home screen (unless in a folder) or the minus one screen. Google also told is that after the European Commission’s Google Android decision, the default search service in Chrome is set according to the Android choice screen mechanism that applies in the UK and EEA.
G4
Stakeholder submissions
13. Apple and Google both submitted that pre-installed and pre-set default browser apps on mobile devices can be beneficial as they provide users with a seamless and superior out-of-the-box experience.
14. However, we heard views from a number of parties which indicated that pre-installation and default settings also significantly influence which browser users use. For example:
• Microsoft submitted that pre-installation and default settings drive mobile browsers’ usage shares, while Samsung submitted that pre-installation and default settings may provide an advantage in competition for users because of user inertia and their willingness to use the option provided to them out-of-the box.
• [One browser vendor] submitted that users are more likely to find and use a browser if it is available on the home screen (which we understand is where the main pre-installed browser is typically located).
• Moonchild Productions submitted that users would only switch if there were significant issues with the pre-installed or default browser.
15. Browser vendors further highlighted the importance of ease of switching. For example:
• Mozilla submitted that design choices with respect to user experience and the user interface (UI) make it difficult or impossible to delete pre-installed software or to pin alternative software and make it the default.
• Yandex submitted that the effects of pre-installation and default settings could depend on how time consuming it is to install or set another browser as the default.
• Brave submitted that a lack of awareness of existing defaults and/or an inability to set an alternative third-party browser as a default browser restricts user choice. Brave further submitted that competition may be encouraged if users were to receive a notice advising that they can change their default browser.
Correlation between pre-installed browsers and shares of supply
16. There is a strong correlation between the browsers that are pre-installed and/or set as defaults on mobile devices and their usage (as measured by their share of supply). In particular, as Figure G.1 shows:
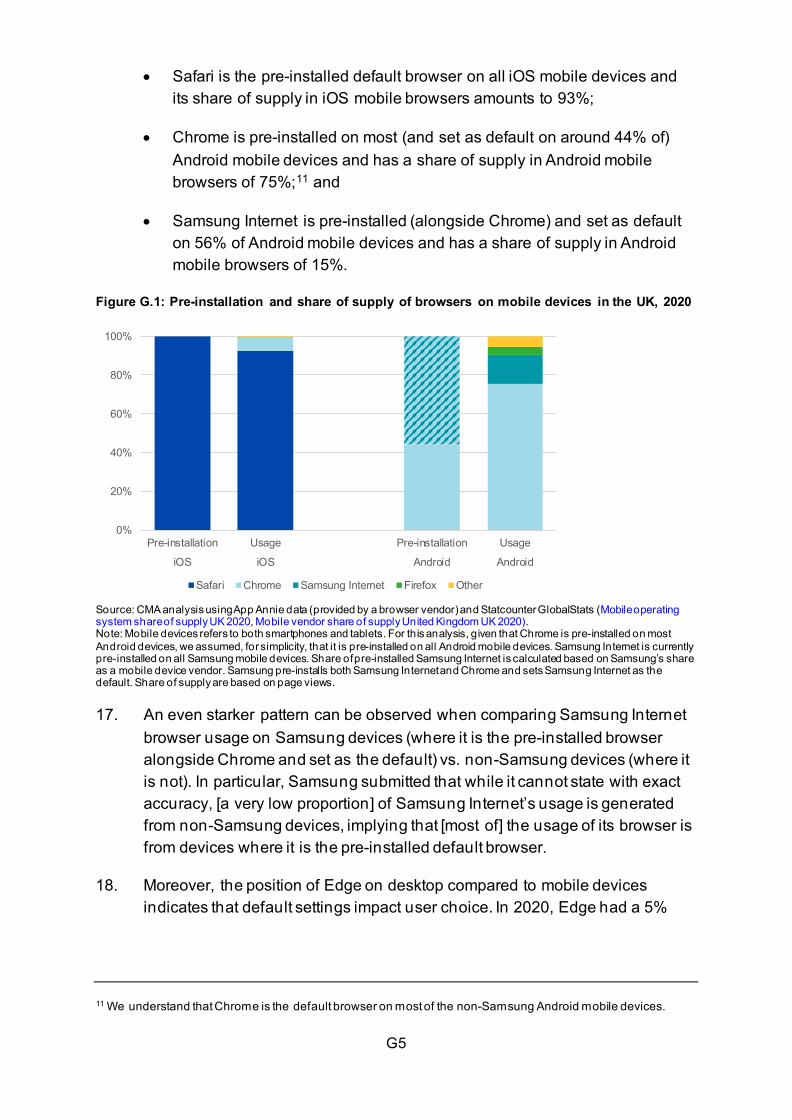
G5
• Safari is the pre-installed default browser on all iOS mobile devices and its share of supply in iOS mobile browsers amounts to 93%;
• Chrome is pre-installed on most (and set as default on around 44% of) Android mobile devices and has a share of supply in Android mobile browsers of 75%;11 and
• Samsung Internet is pre-installed (alongside Chrome) and set as default on 56% of Android mobile devices and has a share of supply in Android mobile browsers of 15%.
Figure G.1: Pre-installation and share of supply of browsers on mobile devices in the UK, 2020
0%
20%
40%
60%
80%
100%
Pre-installation Usage Pre-installation Usage
iOS iOS Android Android
Safari Chrome Samsung Internet Firefox Other
Source: CMA analysis using App Annie data (provided by a browser vendor) and Statcounter GlobalStats (Mobile operating system share of supply UK 2020, Mobile vendor share of supply United Kingdom UK 2020). Note: Mobile devices refers to both smartphones and tablets. For this analysis, given that Chrome is pre-installed on most Android devices, we assumed, for simplicity, that it is pre-installed on all Android mobile devices. Samsung Internet is currently pre-installed on all Samsung mobile devices. Share of pre-installed Samsung Internet is calculated based on Samsung’s share as a mobile device vendor. Samsung pre-installs both Samsung Internet and Chrome and sets Samsung Internet as the default. Share of supply are based on page views. 17. An even starker pattern can be observed when comparing Samsung Internet
browser usage on Samsung devices (where it is the pre-installed browser alongside Chrome and set as the default) vs. non-Samsung devices (where it is not). In particular, Samsung submitted that while it cannot state with exact accuracy, [a very low proportion] of Samsung Internet’s usage is generated from non-Samsung devices, implying that [most of] the usage of its browser is from devices where it is the pre-installed default browser.
18. Moreover, the position of Edge on desktop compared to mobile devices indicates that default settings impact user choice. In 2020, Edge had a 5%
11 We understand that Chrome is the default browser on most of the non-Samsung Android mobile devices.
G6
share of desktop (where it is the pre-installed default browser) but no material share of mobile (where it is not).12
Data on actual user switching
19. We have asked Apple and Google for data on the proportion of users that have downloaded additional browsers or changed their default browser on iOS and Android devices, respectively.
20. With respect to installing additional browsers:
• data received from Apple suggests that, since 2015, [20-30%] of users in the UK installed additional browsers or search-enabled apps on their iPhone and iPad devices, although Apple submitted that it anticipates this number to likely be even higher, as the percentage is based on downloads from only twenty popular browser and search apps available on the UK App Store;13 and
• Google submitted that it does not hold data on the proportion of users that have installed an additional browser on their Android mobile device.
21. With respect to changing the default browser:
• Apple submitted that it does not maintain data on the proportion of current iOS users that have changed their default browser on their current iOS device; and
• Google submitted that it does not hold data on the proportion of users that changed their default browser. Google submitted data on the proportion of Chrome user sessions on Android mobile devices where the user’s default browser is different from the pre-installed default. There are certain limitations associated with this data which we will need to understand further before drawing conclusions on what this data indicates with respect to the impact of default settings.
12 In 2020, Edge Legacy had a 6% share of supply on desktop devices and 0.2% share of supply on mobile devices. Microsoft ended its support for Edge Legacy on 9 March 2021. Statcounter, Desktop browser share of supply UK 2020, Mobile browser share of supply UK 2020. Microsoft, New Microsoft Edge to replace Microsoft Edge Legacy with April’s Windows 10 Update Tuesday release 13 Apple submitted that it anticipates this number to likely be even higher, as the percentage is based on downloads from only twenty popular browser and search apps available on the UK App Store.
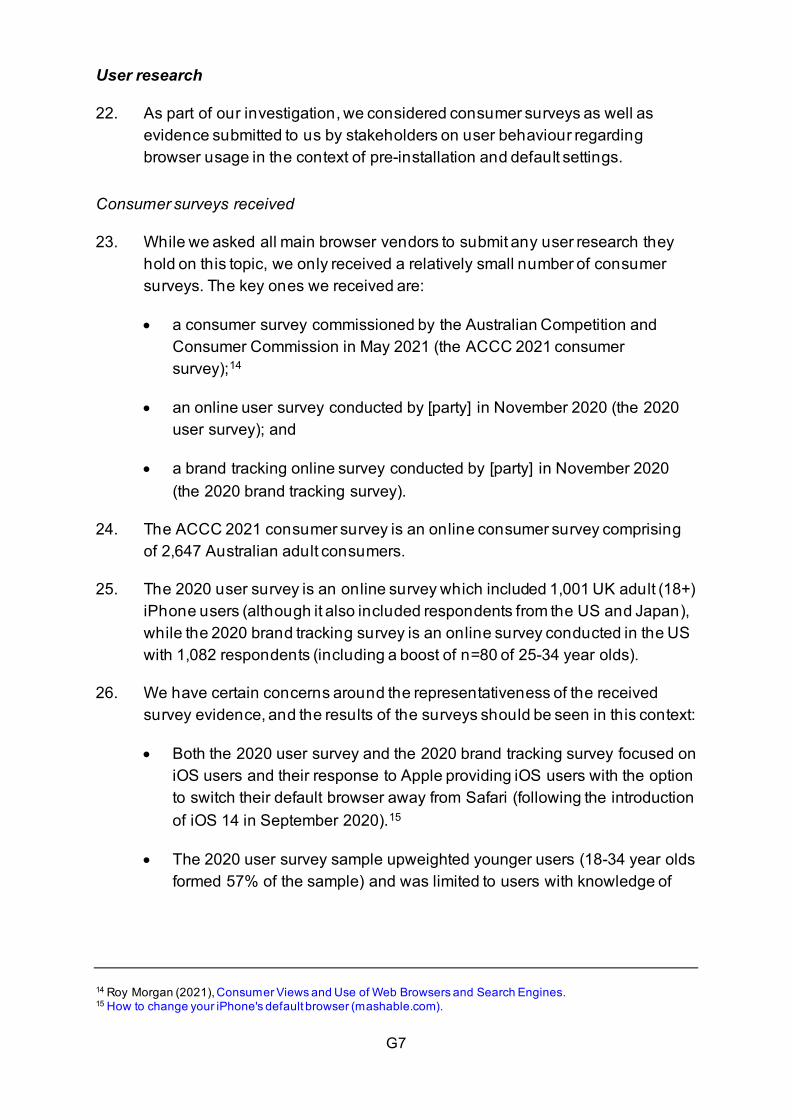
G7
User research
22. As part of our investigation, we considered consumer surveys as well as evidence submitted to us by stakeholders on user behaviour regarding browser usage in the context of pre-installation and default settings.
Consumer surveys received
23. While we asked all main browser vendors to submit any user research they hold on this topic, we only received a relatively small number of consumer surveys. The key ones we received are:
• a consumer survey commissioned by the Australian Competition and Consumer Commission in May 2021 (the ACCC 2021 consumer survey);14
• an online user survey conducted by [party] in November 2020 (the 2020 user survey); and
• a brand tracking online survey conducted by [party] in November 2020 (the 2020 brand tracking survey).
24. The ACCC 2021 consumer survey is an online consumer survey comprising of 2,647 Australian adult consumers.
25. The 2020 user survey is an online survey which included 1,001 UK adult (18+) iPhone users (although it also included respondents from the US and Japan), while the 2020 brand tracking survey is an online survey conducted in the US with 1,082 respondents (including a boost of n=80 of 25-34 year olds).
26. We have certain concerns around the representativeness of the received survey evidence, and the results of the surveys should be seen in this context:
• Both the 2020 user survey and the 2020 brand tracking survey focused on iOS users and their response to Apple providing iOS users with the option to switch their default browser away from Safari (following the introduction of iOS 14 in September 2020).15
• The 2020 user survey sample upweighted younger users (18-34 year olds formed 57% of the sample) and was limited to users with knowledge of
14 Roy Morgan (2021), Consumer Views and Use of Web Browsers and Search Engines. 15 How to change your iPhone's default browser (mashable.com).
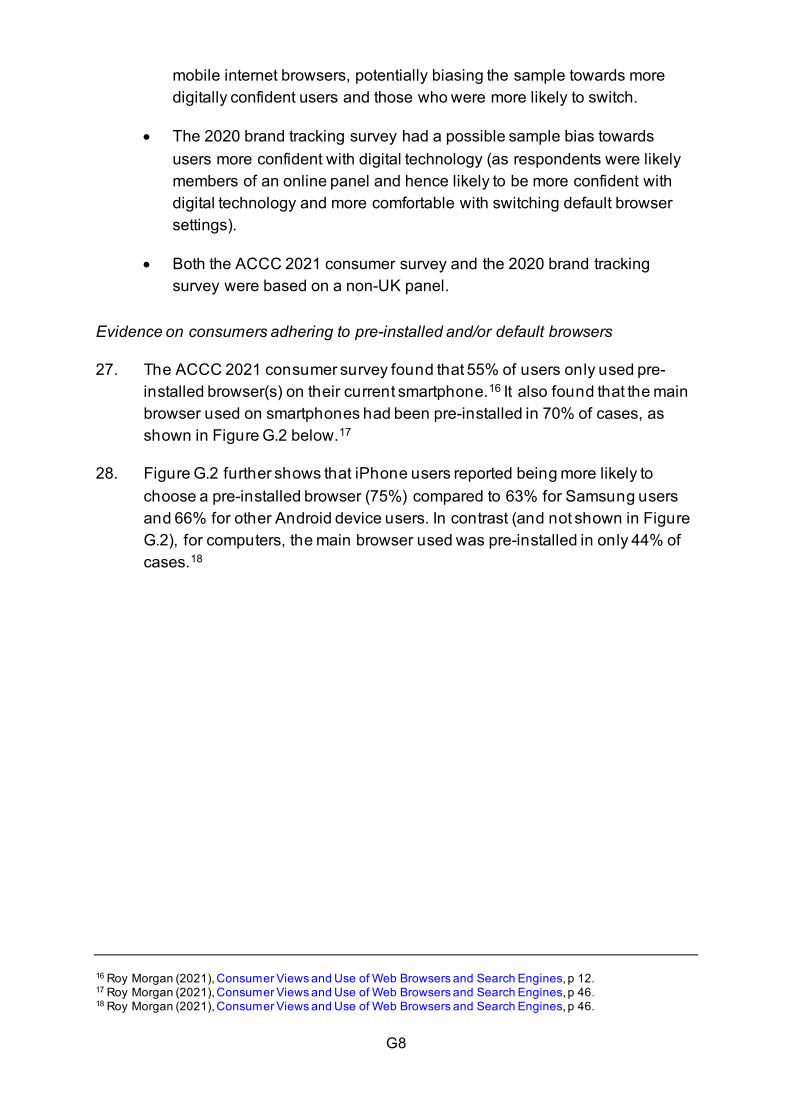
G8
mobile internet browsers, potentially biasing the sample towards more digitally confident users and those who were more likely to switch.
• The 2020 brand tracking survey had a possible sample bias towards users more confident with digital technology (as respondents were likely members of an online panel and hence likely to be more confident with digital technology and more comfortable with switching default browser settings).
• Both the ACCC 2021 consumer survey and the 2020 brand tracking survey were based on a non-UK panel.
Evidence on consumers adhering to pre-installed and/or default browsers
27. The ACCC 2021 consumer survey found that 55% of users only used pre-installed browser(s) on their current smartphone.16 It also found that the main browser used on smartphones had been pre-installed in 70% of cases, as shown in Figure G.2 below.17
28. Figure G.2 further shows that iPhone users reported being more likely to choose a pre-installed browser (75%) compared to 63% for Samsung users and 66% for other Android device users. In contrast (and not shown in Figure G.2), for computers, the main browser used was pre-installed in only 44% of cases.18
16 Roy Morgan (2021), Consumer Views and Use of Web Browsers and Search Engines, p 12. 17 Roy Morgan (2021), Consumer Views and Use of Web Browsers and Search Engines, p 46. 18 Roy Morgan (2021), Consumer Views and Use of Web Browsers and Search Engines, p 46.
G9
Figure G.2: Participant response to survey question about how the primary browser on their phone was installed by device type
Source: Roy Morgan (2021), Consumer Views and Use of Web Browsers and Search Engines, p 46 (redrawn). 29. The ACCC 2021 consumer survey further found that only around one in three
(36%) of respondents said that they had ever changed the default browser on their smartphone.19
30. The 2020 user survey, which included 1,001 UK adult (18+) iPhone users, found that 43% of UK iPhone users were likely to update their settings to a different default browser, whilst 28% of users were unlikely to update their default browser settings in this way (with 18% stating that they were ‘somewhat unlikely’ and 10% stating they were ‘very unlikely’ to do so). A further 29% stated they were neither likely nor unlikely to do so (see Figure G.3). Younger users (between 18-34 years) were more likely to update their default browser. As noted above, these survey results were collected in the context of iOS users’ response to Apple providing iOS users with the option to switch their default browser away from Safari (following the introduction of iOS 14 in September 2020).
19 Roy Morgan (2021), Consumer Views and Use of Web Browsers and Search Engines, p 54.
G10
Figure G.3: Participant response to survey question 'How likely are you to update your settings to a different default browser?'
Source: 2020 user survey. Note: Sample included participants from Japan (n=601), UK (n=1001) and US (n=1020). 31. The 2020 brand tracking survey, which included 1,082 US iPhone users,
found that, following the release of iOS 14, around four in ten iPhone users reported having updated their default browser settings, with less tech savvy users lagging behind. This implies that around 60% of users did not update their default browser setting, a percentage which may be even higher for users who are less technically confident.
32. This evidence on consumers sticking to pre-installed and/or default browsers is consistent with the final report of the CMA’s market study into online platforms and digital advertising, which noted that mobile defaults can be more powerful than desktop defaults, in part because consumers are less likely to change default settings on a smaller screen.20
Reasons for consumers sticking to pre-installed and default browsers
33. As we set out in further detail below, there appear to be a number of reasons why consumers do not switch to a different browser: while the survey evidence indicates that users have a preference for maintaining the status quo with respect to browser choice (ie despite being able to switch, they are biased towards continuing to use the browser that is pre-installed and/or set as default), it also shows that some users do not know how to change their default browser. Additionally, however, the survey evidence also indicates that users stick with the pre-installed and/or default browser because it is their preferred browser.
20 CMA (2020), Online Platforms and Digital Advertising Market Study, Final Report, Appendix V, p V7.
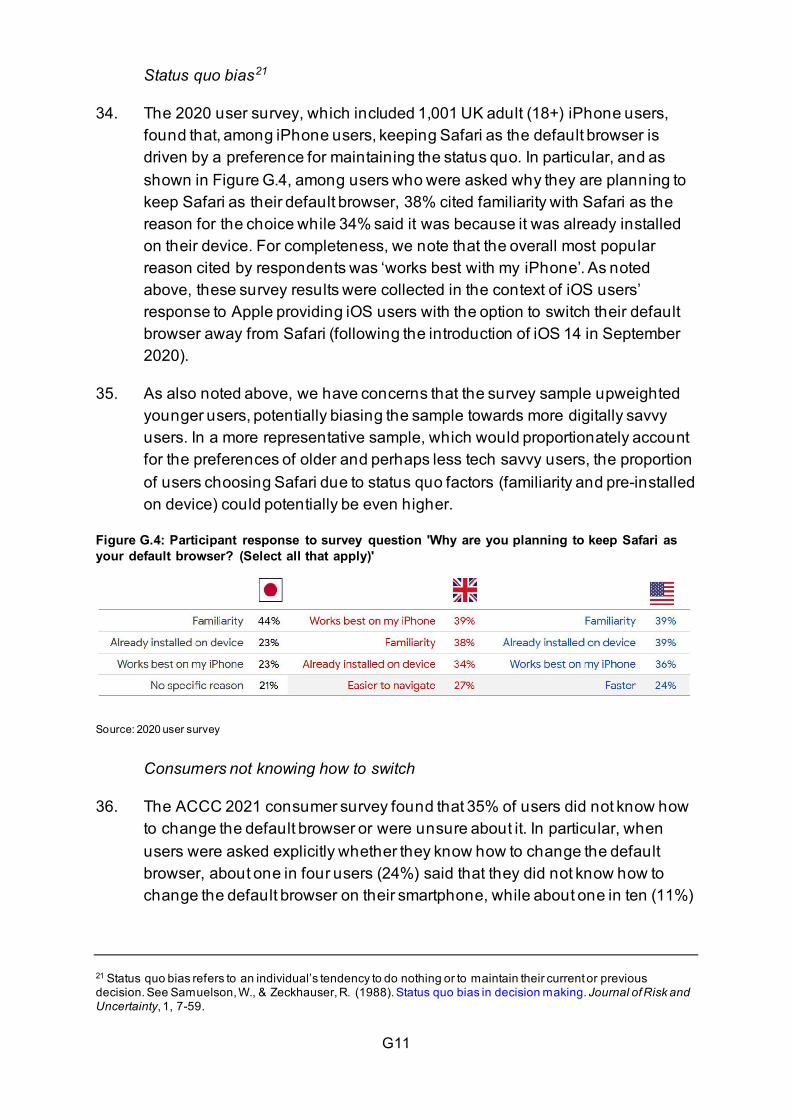
G11
Status quo bias21
34. The 2020 user survey, which included 1,001 UK adult (18+) iPhone users, found that, among iPhone users, keeping Safari as the default browser is driven by a preference for maintaining the status quo. In particular, and as shown in Figure G.4, among users who were asked why they are planning to keep Safari as their default browser, 38% cited familiarity with Safari as the reason for the choice while 34% said it was because it was already installed on their device. For completeness, we note that the overall most popular reason cited by respondents was ‘works best with my iPhone’. As noted above, these survey results were collected in the context of iOS users’ response to Apple providing iOS users with the option to switch their default browser away from Safari (following the introduction of iOS 14 in September 2020).
35. As also noted above, we have concerns that the survey sample upweighted younger users, potentially biasing the sample towards more digitally savvy users. In a more representative sample, which would proportionately account for the preferences of older and perhaps less tech savvy users, the proportion of users choosing Safari due to status quo factors (familiarity and pre-installed on device) could potentially be even higher.
Figure G.4: Participant response to survey question 'Why are you planning to keep Safari as your default browser? (Select all that apply)'
Source: 2020 user survey
Consumers not knowing how to switch
36. The ACCC 2021 consumer survey found that 35% of users did not know how to change the default browser or were unsure about it. In particular, when users were asked explicitly whether they know how to change the default browser, about one in four users (24%) said that they did not know how to change the default browser on their smartphone, while about one in ten (11%)
21 Status quo bias refers to an individual’s tendency to do nothing or to maintain their current or previous decision. See Samuelson, W., & Zeckhauser, R. (1988). Status quo bias in decision making. Journal of Risk and Uncertainty, 1, 7-59.
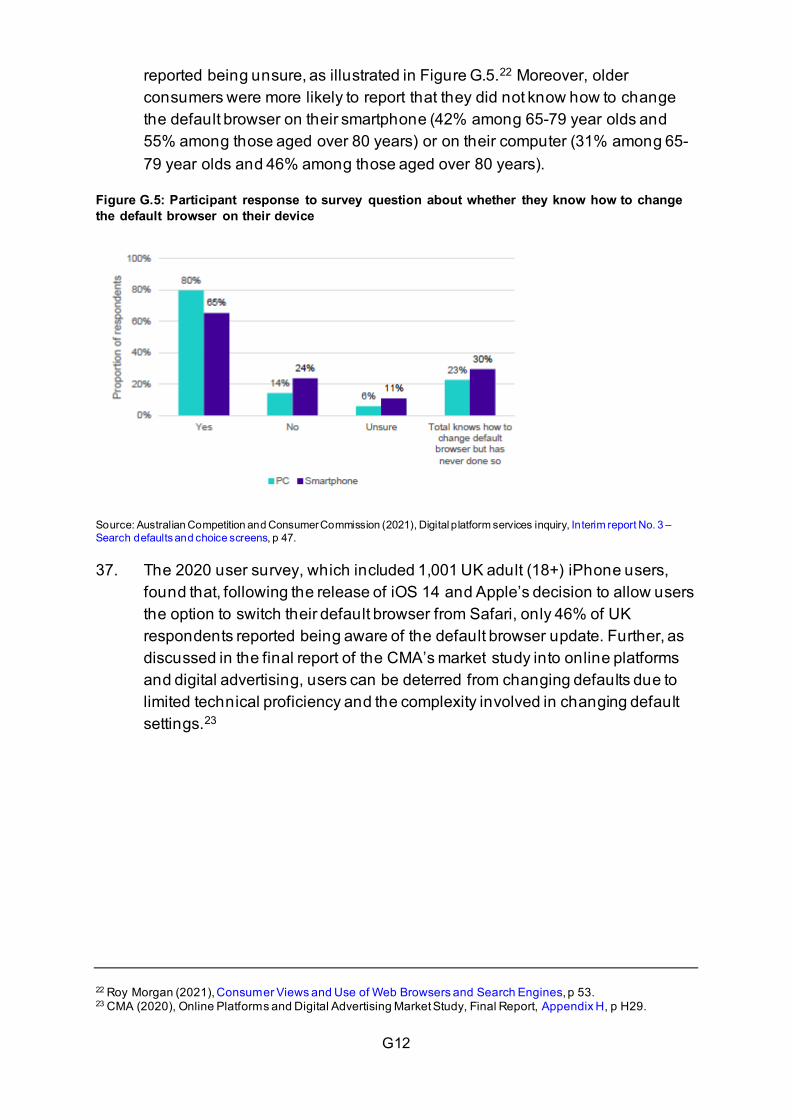
G12
reported being unsure, as illustrated in Figure G.5.22 Moreover, older consumers were more likely to report that they did not know how to change the default browser on their smartphone (42% among 65-79 year olds and 55% among those aged over 80 years) or on their computer (31% among 65-79 year olds and 46% among those aged over 80 years).
Figure G.5: Participant response to survey question about whether they know how to change the default browser on their device
Source: Australian Competition and Consumer Commission (2021), Digital platform services inquiry, Interim report No. 3 – Search defaults and choice screens, p 47. 37. The 2020 user survey, which included 1,001 UK adult (18+) iPhone users,
found that, following the release of iOS 14 and Apple’s decision to allow users the option to switch their default browser from Safari, only 46% of UK respondents reported being aware of the default browser update. Further, as discussed in the final report of the CMA’s market study into online platforms and digital advertising, users can be deterred from changing defaults due to limited technical proficiency and the complexity involved in changing default settings.23
22 Roy Morgan (2021), Consumer Views and Use of Web Browsers and Search Engines, p 53. 23 CMA (2020), Online Platforms and Digital Advertising Market Study, Final Report, Appendix H, p H29.
G13
Pre-installed and/or default browsers coinciding with preferred browser
38. The ACCC 2021 consumer survey found that 42% of users said the main reason for using their primary (or only) browser was that it was their preferred product.24 25 This proportion is even higher for Chrome, at 57%.26
Why pre-installation and defaults impact user behaviour – evidence from the behavioural literature
39. Along with reasons that users can self-identify when asked in surveys, the behavioural literature also identifies underlying factors consumers may be less aware of influencing their choices.
40. Defaults have had a powerful impact in influencing decision-making across a wide range of behaviours including enrolment into pension savings,27 organ donation 28 and selecting features in smartphone apps.29 A meta-analysis of default studies observed a strong impact of defaults on behaviour with the majority of the studies finding a positive effect of default choices on decision-making.30 These effects are underpinned by status quo bias, ie an individual’s tendency to do nothing or to maintain their current or previous decision.31 Thus, when it comes to the choice of browsers, users are likely to display a propensity for sticking with the default browser.
41. Other relevant behavioural mechanisms underpinning the impact of defaults on user choice include:32
• Inertia: due to user inertia and a tendency to procrastinate, users may prefer maintaining the status quo by retaining the default browser in order to reduce the cognitive effort of having to explore other browsers and
24 Roy Morgan (2021), Consumer Views and Use of Web Browsers and Search Engines, p 40. 25 Further, we note that 52% of users said that the reason behind their choice of primary browser was that it was already installed on their smartphone and they had no reason to use another browser. The survey report notes that it is unclear how this should be interpreted. On the one hand, this may indicate that users have not felt the need to actively choose their browser. On the other hand, it may imply a genuine choice from user to stick with the installed browser. See Roy Morgan (2021), Consumer Views and Use of Web Browsers and Search Engines, p 11. 26 Roy Morgan (2021), Consumer Views and Use of Web Browsers and Search Engines, p 42. 27 Madrian, B. C., & Shea, D. F. (2001). The Power of Suggestion: Inertia in 401(k) Participation and Savings Behavior. The Quarterly Journal of Economics, 116(4), 1149–1187. 28 Johnson, E. J., & Goldstein, D. (2003). Do Defaults Save Lives? Science, 302(5649), 1338-1339. 29 Joeckel, S., & Dogruel, L. (2020). Default effects in app selection: German adolescents’ tendency to adhere to privacy or social relatedness features in smartphone apps. Mobile Media & Communication, 8(1), 22-41. 30 Jachimowicz, J., Duncan, S., Weber, E., & Johnson, E. (2019). When and why defaults influence decisions: A meta-analysis of default effects. Behavioural Public Policy, 3(2), 159-186. 31 Samuelson, W., & Zeckhauser, R. (1988). Status quo bias in decision making. Journal of Risk and Uncertainty, 1, 7-59. 32 Sunstein, C. R. (2013). Deciding by Default. University of Pennsylvania Law Review, 162(1).
G14
change the default browser settings. As noted above, Samsung mentioned this in its submission.
• Implicit endorsement: users may choose the default browser perceiving it to be an implicit endorsement or recommendation from the device manufacturer. The value of this recommended option can be especially high when users lack adequate information about alternative browser choices.
• Reference point and loss aversion: the default browser can serve as the users’ reference point for decisions related to browsers. This can result in other browsers being evaluated against this reference. Since people dislike losses more than they like corresponding gains (loss aversion), users might be less inclined to shift away from the default browser and risk loss of browser features.
Routes for users to switch their browser
42. The ease of switching was highlighted by several browser vendors as playing an important role in how important pre-installation and default settings are.
43. Additionally, the user research discussed above indicates that, for some users, the reason for not switching away from their default browser is not knowing how to change their default browser.
44. In line with this, the final report of CMA’s market study into online platforms and digital advertising notes that users can be dissuaded from changing defaults due to limited technical proficiency and the complexity involved in changing default settings (we note that these findings were made in the context of changing the default search engine rather than the default browser).33
45. Below, we consider evidence regarding the routes available to users for switching their browsers.
User journey for changing the default browser
46. Several browser vendors have highlighted that it is difficult for users to switch browsers.
47. The user journey for changing default browser on both iOS and Android devices involves a number of potentially complex steps. Additionally, the
33 CMA (2020), Online Platforms and Digital Advertising Market Study, Final Report, Appendix H, p H29.
G15
relevant option in device settings for switching defaults may not always have intuitive text labels, making it harder for users to search for them. Figure G.6 and Figure G.7 provide an illustration for changing default browser settings on an iPhone and an Android smartphone, respectively. Both user journeys involve downloading an additional browser from the App Store or Play Store and navigating to the relevant option on device settings to choose the preferred browser. Changing default browser settings can take around six steps on iPhones and around seven steps on Android devices, including scrolling (depending on device type/ manufacturer). With respect to iOS, Yandex submitted that it takes four additional steps to unpin Safari from the quick access panel and pin another browser.
48. The multiple steps and additional effort involved in this process could possibly dissuade users from changing default browser via device settings. Further, limited technical abilities can be another deterrent to users changing their default browser using device settings.
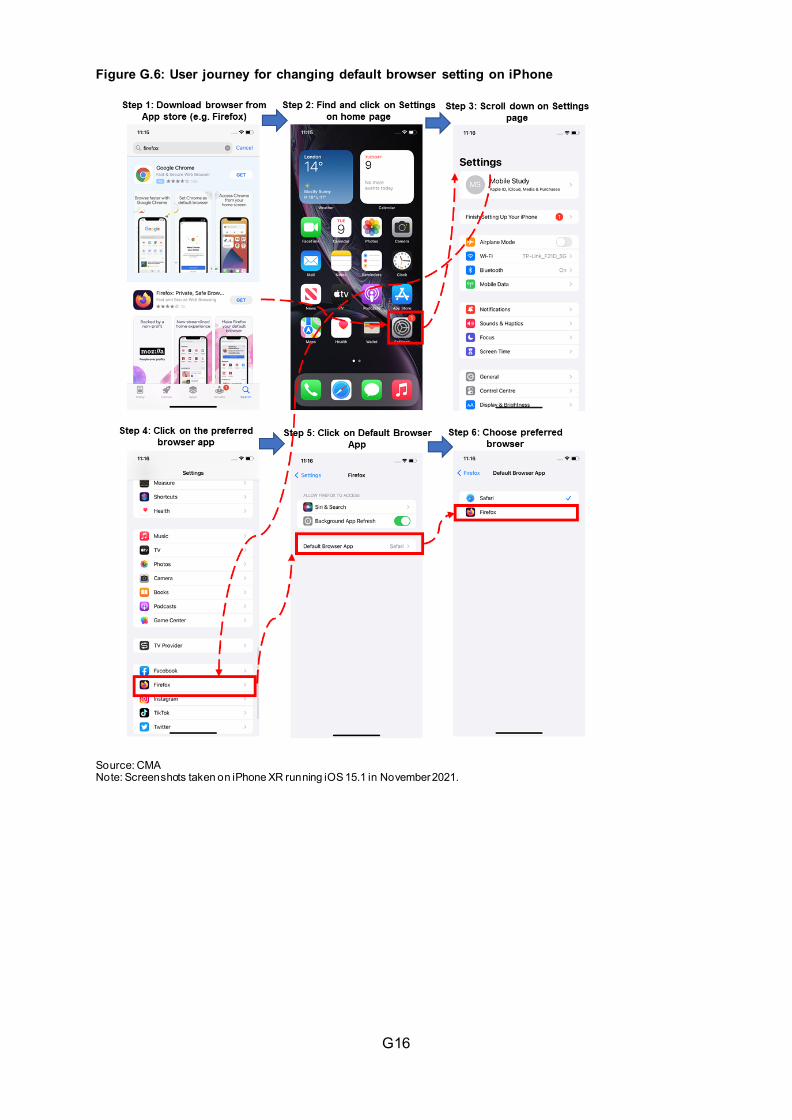
G16
Figure G.6: User journey for changing default browser setting on iPhone
Source: CMA Note: Screenshots taken on iPhone XR running iOS 15.1 in November 2021.
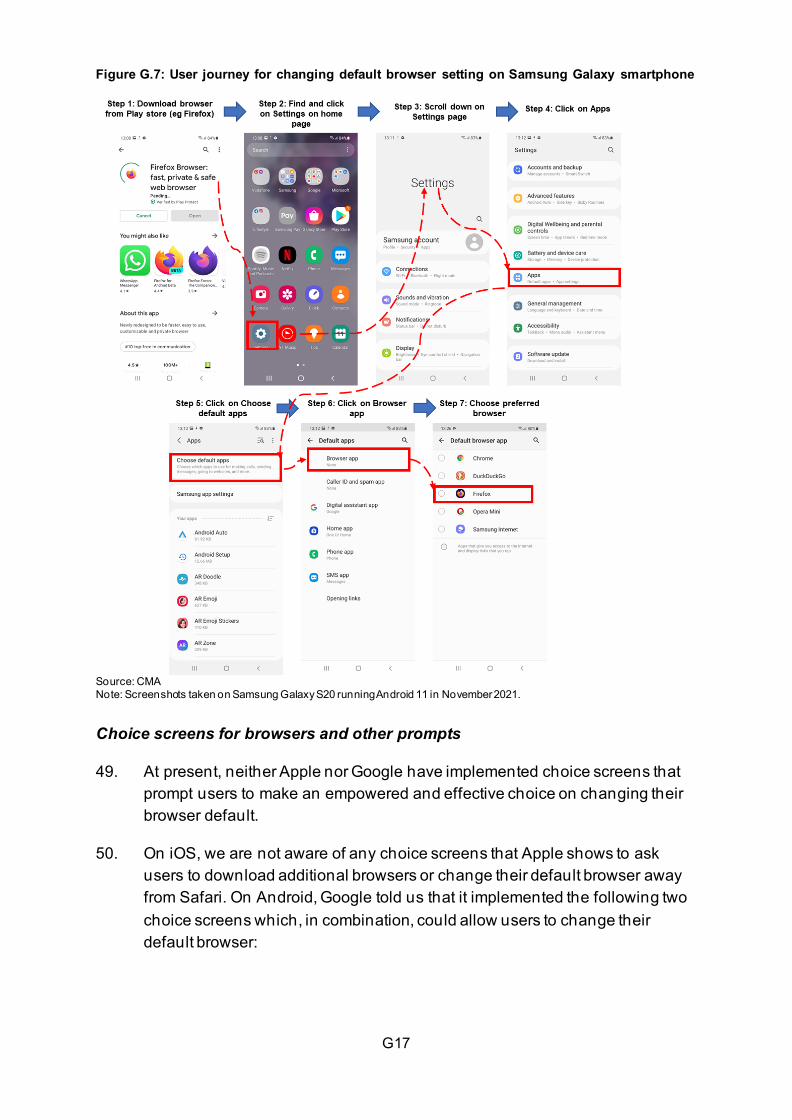
G17
Figure G.7: User journey for changing default browser setting on Samsung Galaxy smartphone
Source: CMA Note: Screenshots taken on Samsung Galaxy S20 running Android 11 in November 2021.
Choice screens for browsers and other prompts
49. At present, neither Apple nor Google have implemented choice screens that prompt users to make an empowered and effective choice on changing their browser default.
50. On iOS, we are not aware of any choice screens that Apple shows to ask users to download additional browsers or change their default browser away from Safari. On Android, Google told us that it implemented the following two choice screens which, in combination, could allow users to change their default browser:
G18
• a Play choice screen for browsers that prompts new users to consider downloading additional browsers, but which does not allow users to change their default browser; and
• a ‘disambiguation box’ that asks users to a set a default browser.
51. In addition, on both iOS and Android, browser vendors and websites are, at least in certain circumstances, able to display prompts asking users if they want to switch their default browser.
52. We welcome Google’s proactive introduction of the choice screens. However, Google has removed the disambiguation box that asks users to set a default browser from the latest Android version (ie Android 12). Additionally, we have concerns that:
• the Play choice screen for browsers is only shown to a subset of users setting up a new device;
• the choice architecture of the Play choice screens for browsers and the disambiguation box may be suboptimal and not sufficiently effective in empowering consumers to make choices about defaults; and
• while browser vendors can display prompts asking the user if they want to switch their default browser, browser vendors are only able to show such prompts to a limited population of users (namely those that already have the respective browser installed on their device) and they also may not have access to the relevant API that allows them to launch shortcuts for changing the default browser settings.
53. Overall, and as discussed in further detail below, we do not consider that Google’s choice screens, as currently implemented, adequately empower users to make a choice about their browser default
Play choice screen for browsers (Android only)
54. Google told us that, in April 2019, it implemented a choice screen which is displayed the first time a user opens the Play Store on EMADA devices that preload the Google Search app and/or Chrome.34,35
34 For further details on EMADA, see Appendix E. 35 Google told us that when introduced in April 2019, the Play choice screen displayed choice screens for both browsers and search apps, see Presenting search app and browser options to Android users in Europe (blog.google). However, as agreed with the European Commission, Google introduced a separate choice screen for search services in March 2020, to be displayed during the set-up process of newly activated EMADA devices that preload Google Search app. Hence, users of newly activated EMADA devices since March 2020 only see the choice screen for browsers when the Play Store is opened for the first time.
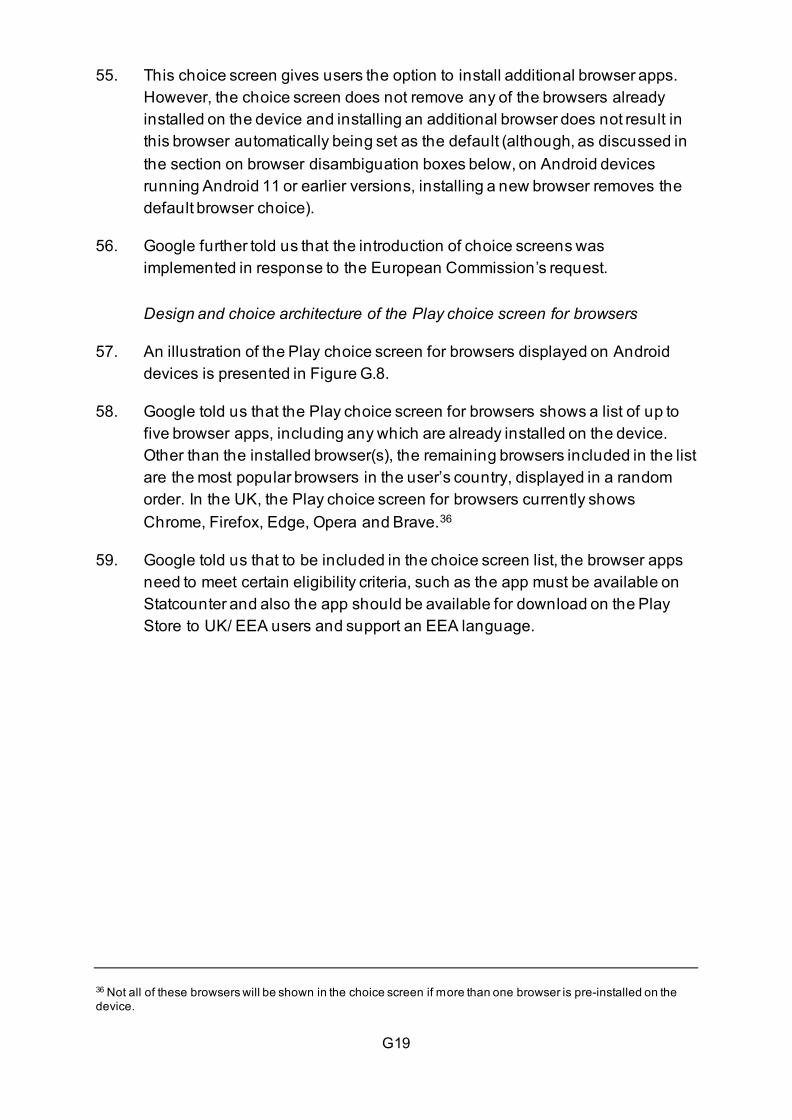
G19
55. This choice screen gives users the option to install additional browser apps. However, the choice screen does not remove any of the browsers already installed on the device and installing an additional browser does not result in this browser automatically being set as the default (although, as discussed in the section on browser disambiguation boxes below, on Android devices running Android 11 or earlier versions, installing a new browser removes the default browser choice).
56. Google further told us that the introduction of choice screens was implemented in response to the European Commission’s request.
Design and choice architecture of the Play choice screen for browsers
57. An illustration of the Play choice screen for browsers displayed on Android devices is presented in Figure G.8.
58. Google told us that the Play choice screen for browsers shows a list of up to five browser apps, including any which are already installed on the device. Other than the installed browser(s), the remaining browsers included in the list are the most popular browsers in the user’s country, displayed in a random order. In the UK, the Play choice screen for browsers currently shows Chrome, Firefox, Edge, Opera and Brave.36
59. Google told us that to be included in the choice screen list, the browser apps need to meet certain eligibility criteria, such as the app must be available on Statcounter and also the app should be available for download on the Play Store to UK/ EEA users and support an EEA language.
36 Not all of these browsers will be shown in the choice screen if more than one browser is pre-installed on the device.
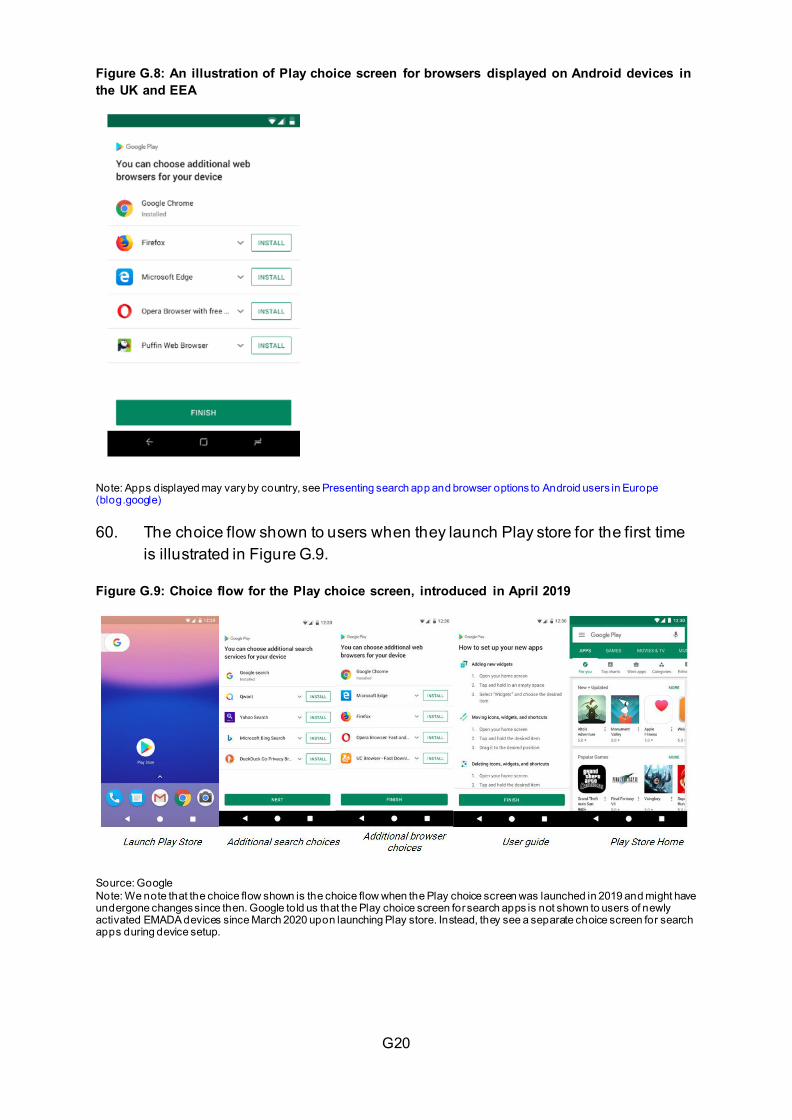
G20
Figure G.8: An illustration of Play choice screen for browsers displayed on Android devices in the UK and EEA
Note: Apps displayed may vary by country, see Presenting search app and browser options to Android users in Europe (blog.google) 60. The choice flow shown to users when they launch Play store for the first time
is illustrated in Figure G.9.
Figure G.9: Choice flow for the Play choice screen, introduced in April 2019
Source: Google Note: We note that the choice flow shown is the choice flow when the Play choice screen was launched in 2019 and might have undergone changes since then. Google told us that the Play choice screen for search apps is not shown to users of newly activated EMADA devices since March 2020 upon launching Play store. Instead, they see a separate choice screen for search apps during device setup.
G21
61. Google suggested that the principles used for designing effective user choice or UI can include proportionality, comprehension and context,37 and that defaults are an inherent part of UI design. []. Further, Google told us that, in this instance, atypically, the choice screens introduced in response to the European Commission’s request were largely determined by discussions with the European Commission and others rather than through iterative testing.
62. The choice architecture of the current version of the Play choice screen for browsers has some features we have identified that could have implications for user behaviour:
• Positioning of installed browsers:
— The choice screen consists of a vertical list of browsers, where browsers already installed on the device are presented first, followed by other browsers ordered in a randomised fashion. Thus, the greater the number of browsers already installed on the device, the lower the number of available slots for additional browsers to be displayed to users. Therefore, where, for example, a device manufacturer has pre-installed a browser, there is less space to display alternative browsers and users will see fewer new browsers to download. With regard to displaying the browsers already installed on the device at the top of the Play choice screen for browsers, Google told us that it did not want to reduce the visibility of any browsers which have, for example, paid to be pre-installed on the device. In addition, Google told us that it would also be confusing to show installed and non-installed apps in a mixed list.
— Pre-installed browsers are presented first at the top of the screen, and there is a possibility of users’ attention therefore being drawn away from the list of additional browsers to download which is displayed below.38
• Choice placement, timing and frequency: the choice screen is shown only once per account when the user opens the Play Store for the first time:
— The placement of the choice screen on first use of the Play Store may be suboptimal. DuckDuckGo told us that users are less likely to
37 Proportionality means that the friction from implementing any choice should be proportionate to how relevant the choice is to maximising user welfare. Comprehension means choice options should be designed to maximise user comprehension by being ‘well-structured, clearly described, and not overwhelming’. Context means that choices should be relevant to the user’s current task and goals. 38 This is owing to primacy effects, ie, user’s tendency to pay more attention to information presented first. See Feenberg, D., Ganguli, I., Gaulé, P., & Gruber, J. (2017). It’s Good to Be First: Order Bias in Reading and Citing NBER Working Papers. The Review of Economics and Statistics, 99(1), 32-39 for details on primacy effects.
G22
engage with choice screens during the device set up process as they are focused on getting through the process quickly. According to DuckDuckGo, users are more likely to explore alternative search services or browsers at a later stage, when they are using the device.
— As discussed in Chapter 7, we are seeking views on potential choice architecture principles for browser default choice screens which could empower consumers to make effective choices.
Effectiveness of the Play choice screen for browsers
63. The Play choice screen for browsers is only shown to a subset of users setting up a new device: Google submitted that the Play choice screen (for both browsers and search engines) is displayed once per Google account, the first time a user opens Google Play store. Google further explained that users who have encountered the choice screen on a previous device will not be shown the screen again if they change their device (while continuing to use the same Google account).39
64. Based on Google’s recent data in the UK, around [] Android mobile devices were activated per month, while the Play choice screen for browsers was shown on around [] Android mobile devices per month.40 This implies that the Play choice screen for browsers was shown on approximately [a relatively large proportion] of recently activated Android mobile devices. In addition, Google said that, after its introduction in 2019, the Play choice screen for browsers was displayed to active users the first time a user opened Google Play after receiving an update.41
65. While Google told us that it does not record the number of devices on which the Play choice screen for browsers is used to download additional browsers, Google does record the number of browser downloads from the use of the Play choice screen for browsers (ie if a user chooses to download three browsers from the choice screen on a device, this would be counted as three downloads even though they came from a single device). Google submitted that in the UK from 1 September 2021 to 21 October 2021, the Play choice screen for browsers was shown on [] Android mobile devices and there were [] browser downloads from the use of the Play choice screen for
39 Google told us that the reason behind showing the Play choice screen (for both browsers and search engines) just once per account, and not when the users say buy a new device, is because of backup and restore. When users transfer to a new device all installed browser apps on the old device will automatically get installed on the new one, limiting the need to remind users about installing additional browsers. 40 Google submitted that in the UK from 1 September 2020 to 31 August 2021 [] Android mobile devices were activated. It said that in the UK from 1 September 2021 to 21 October 2021 the Play choice screen for browsers was shown on [] Android mobile devices. 41 Google, 2019, Presenting search app and browser options to Android users in Europe (blog.google)
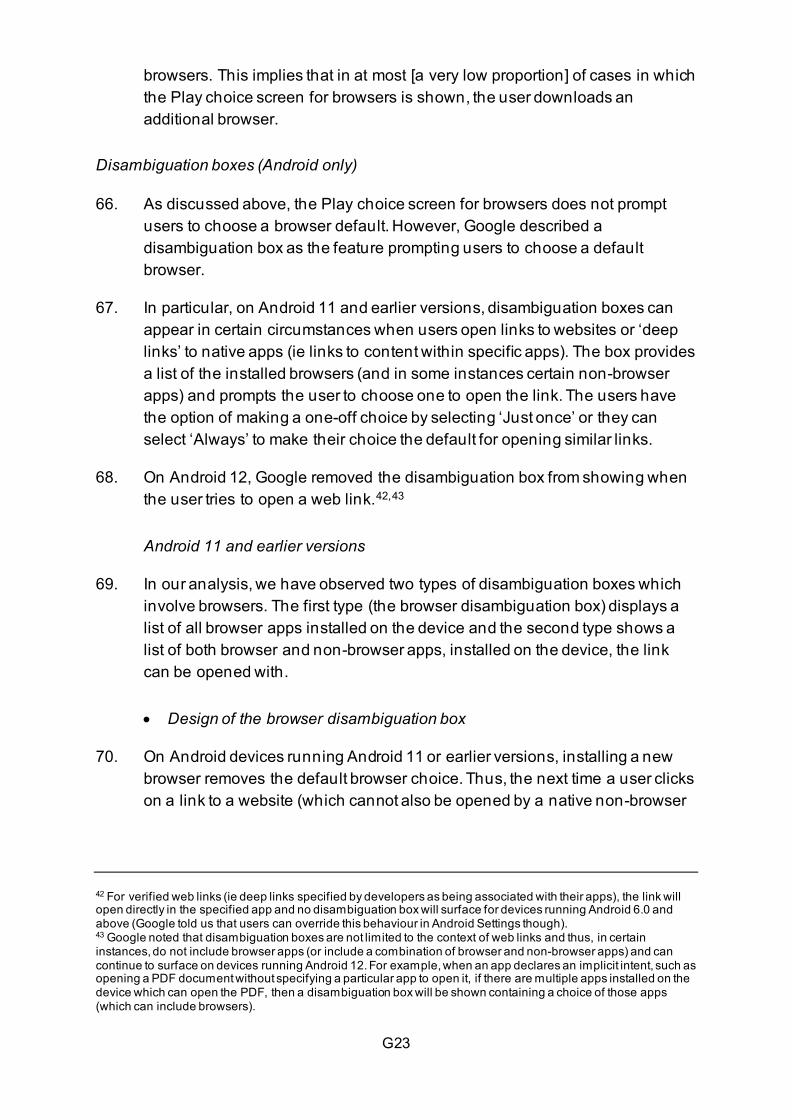
G23
browsers. This implies that in at most [a very low proportion] of cases in which the Play choice screen for browsers is shown, the user downloads an additional browser.
Disambiguation boxes (Android only)
66. As discussed above, the Play choice screen for browsers does not prompt users to choose a browser default. However, Google described a disambiguation box as the feature prompting users to choose a default browser.
67. In particular, on Android 11 and earlier versions, disambiguation boxes can appear in certain circumstances when users open links to websites or ‘deep links’ to native apps (ie links to content within specific apps). The box provides a list of the installed browsers (and in some instances certain non-browser apps) and prompts the user to choose one to open the link. The users have the option of making a one-off choice by selecting ‘Just once’ or they can select ‘Always’ to make their choice the default for opening similar links.
68. On Android 12, Google removed the disambiguation box from showing when the user tries to open a web link.42,43
Android 11 and earlier versions
69. In our analysis, we have observed two types of disambiguation boxes which involve browsers. The first type (the browser disambiguation box) displays a list of all browser apps installed on the device and the second type shows a list of both browser and non-browser apps, installed on the device, the link can be opened with.
• Design of the browser disambiguation box
70. On Android devices running Android 11 or earlier versions, installing a new browser removes the default browser choice. Thus, the next time a user clicks on a link to a website (which cannot also be opened by a native non-browser
42 For verified web links (ie deep links specified by developers as being associated with their apps), the link will open directly in the specified app and no disambiguation box will surface for devices running Android 6.0 and above (Google told us that users can override this behaviour in Android Settings though). 43 Google noted that disambiguation boxes are not limited to the context of web links and thus, in certain instances, do not include browser apps (or include a combination of browser and non-browser apps) and can continue to surface on devices running Android 12. For example, when an app declares an implicit intent, such as opening a PDF document without specifying a particular app to open it, if there are multiple apps installed on the device which can open the PDF, then a disambiguation box will be shown containing a choice of those apps (which can include browsers).
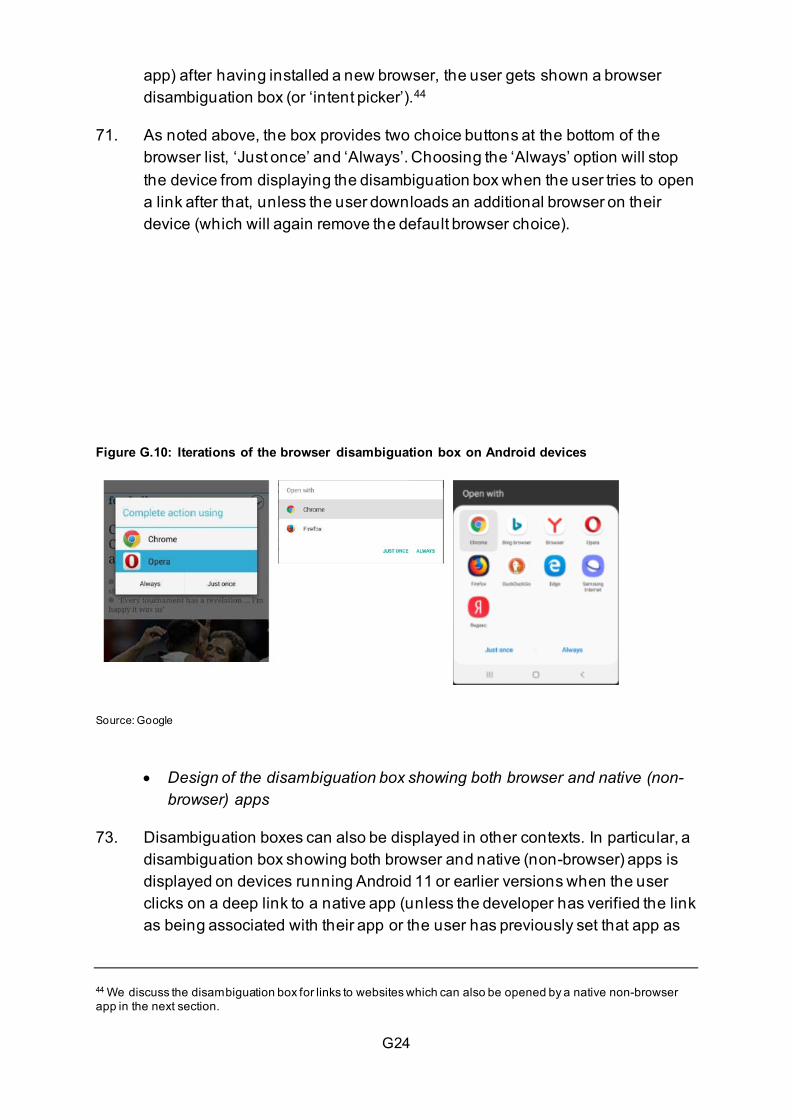
G24
app) after having installed a new browser, the user gets shown a browser disambiguation box (or ‘intent picker’).44
71. As noted above, the box provides two choice buttons at the bottom of the browser list, ‘Just once’ and ‘Always’. Choosing the ‘Always’ option will stop the device from displaying the disambiguation box when the user tries to open a link after that, unless the user downloads an additional browser on their device (which will again remove the default browser choice).
Figure G.10: Iterations of the browser disambiguation box on Android devices
Source: Google
• Design of the disambiguation box showing both browser and native (non-browser) apps
73. Disambiguation boxes can also be displayed in other contexts. In particular, a disambiguation box showing both browser and native (non-browser) apps is displayed on devices running Android 11 or earlier versions when the user clicks on a deep link to a native app (unless the developer has verified the link as being associated with their app or the user has previously set that app as
44 We discuss the disambiguation box for links to websites which can also be opened by a native non-browser app in the next section.
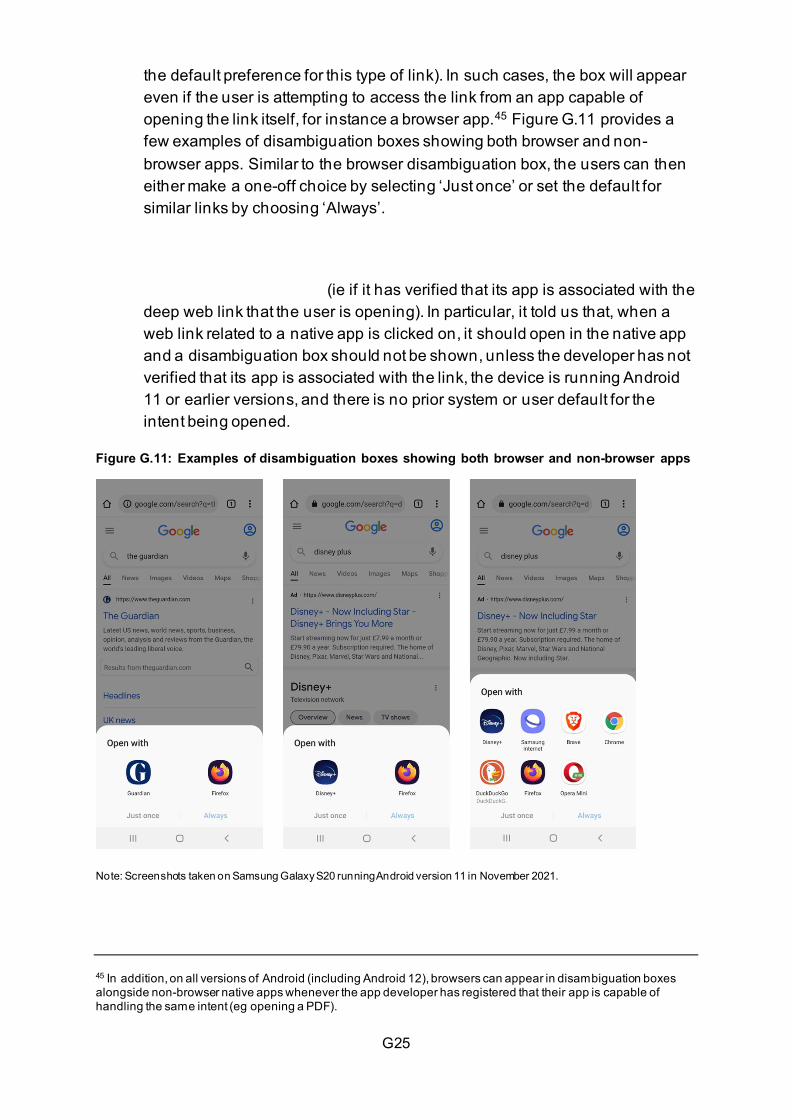
G25
the default preference for this type of link). In such cases, the box will appear even if the user is attempting to access the link from an app capable of opening the link itself, for instance a browser app.45 Figure G.11 provides a few examples of disambiguation boxes showing both browser and non-browser apps. Similar to the browser disambiguation box, the users can then either make a one-off choice by selecting ‘Just once’ or set the default for similar links by choosing ‘Always’.
(ie if it has verified that its app is associated with the deep web link that the user is opening). In particular, it told us that, when a web link related to a native app is clicked on, it should open in the native app and a disambiguation box should not be shown, unless the developer has not verified that its app is associated with the link, the device is running Android 11 or earlier versions, and there is no prior system or user default for the intent being opened.
Figure G.11: Examples of disambiguation boxes showing both browser and non-browser apps
Note: Screenshots taken on Samsung Galaxy S20 running Android version 11 in November 2021.
45 In addition, on all versions of Android (including Android 12), browsers can appear in disambiguation boxes alongside non-browser native apps whenever the app developer has registered that their app is capable of handling the same intent (eg opening a PDF).
G26
• Choice architecture considerations regarding disambiguation boxes
75. While the disambiguation box provides users with an opportunity to change their default browser without accessing device settings, the choice architecture of the box could have the following implications for user behaviour:
• Ordering of apps: The disambiguation box generally presents a horizontal list of apps which can be split over multiple lines to incorporate all the browser and other relevant apps installed on the Android device. The order of presentation could impact users’ behaviour by drawing their attention to the options presented first due to primacy effects.
• Choice buttons: Users are provided with two choice buttons at the bottom of the disambiguation box, ‘Just once’ followed by ‘Always’, placed side-by-side. We are concerned that users might be discouraged from choosing ‘Always’ if they are unaware or unsure of the process to reverse this decision in device settings. This risk would be magnified if native app disambiguation boxes are also being shown to them frequently.
• Highlighted or pre-selected app: As shown in Figure G.10, illustrating the different iterations of the disambiguation box, Chrome appears to be pre-selected or highlighted in certain scenarios. Pre-selecting or highlighting Chrome (or any other app) could enhance the likelihood of users selecting it, as it might appear to be the recommended choice and also because it looks like the more salient.
Android 12
76. Google removed the disambiguation box from showing when the user tries to open a web link in Android 12 (which was released in October 2021).46 This is because installing a new browser does not remove the default browser setting on Android 12. Accordingly, if a user installs a new browser, links will still open in the user’s default browser and the disambiguation box will not surface.47 Table G.1 summarises the changes to the disambiguation box comparing Android 12 with previous releases.
77. []
46 We note that the change only applies to devices where Android 12 is the operating system; on devices where Android 11 or earlier versions are the operating system, the disambiguation box still surfaces. 47 However, the disambiguation box is still shown, and can include browsers, for other intents (eg opening a PDF).
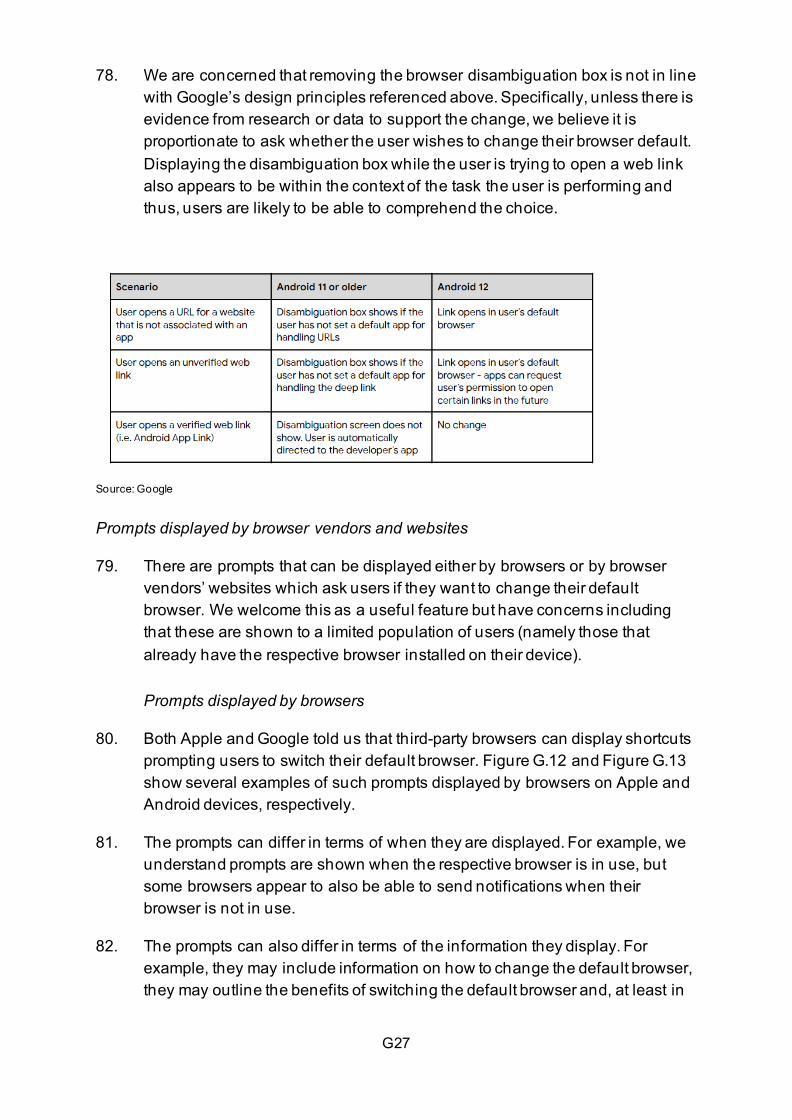
G27
78. We are concerned that removing the browser disambiguation box is not in line with Google’s design principles referenced above. Specifically, unless there is evidence from research or data to support the change, we believe it is proportionate to ask whether the user wishes to change their browser default. Displaying the disambiguation box while the user is trying to open a web link also appears to be within the context of the task the user is performing and thus, users are likely to be able to comprehend the choice.
Source: Google
Prompts displayed by browser vendors and websites
79. There are prompts that can be displayed either by browsers or by browser vendors’ websites which ask users if they want to change their default browser. We welcome this as a useful feature but have concerns including that these are shown to a limited population of users (namely those that already have the respective browser installed on their device).
Prompts displayed by browsers
80. Both Apple and Google told us that third-party browsers can display shortcuts prompting users to switch their default browser. Figure G.12 and Figure G.13 show several examples of such prompts displayed by browsers on Apple and Android devices, respectively.
81. The prompts can differ in terms of when they are displayed. For example, we understand prompts are shown when the respective browser is in use, but some browsers appear to also be able to send notifications when their browser is not in use.
82. The prompts can also differ in terms of the information they display. For example, they may include information on how to change the default browser, they may outline the benefits of switching the default browser and, at least in
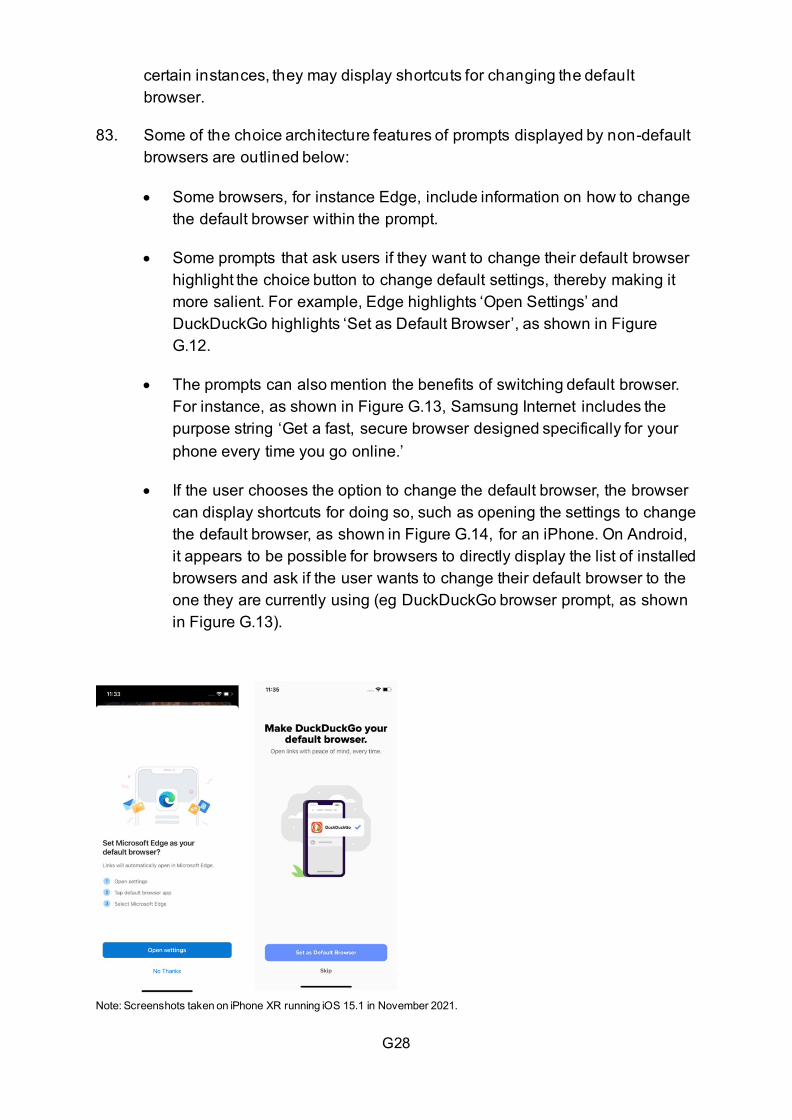
G28
certain instances, they may display shortcuts for changing the default browser.
83. Some of the choice architecture features of prompts displayed by non-default browsers are outlined below:
• Some browsers, for instance Edge, include information on how to change the default browser within the prompt.
• Some prompts that ask users if they want to change their default browser highlight the choice button to change default settings, thereby making it more salient. For example, Edge highlights ‘Open Settings’ and DuckDuckGo highlights ‘Set as Default Browser’, as shown in Figure G.12.
• The prompts can also mention the benefits of switching default browser. For instance, as shown in Figure G.13, Samsung Internet includes the purpose string ‘Get a fast, secure browser designed specifically for your phone every time you go online.’
• If the user chooses the option to change the default browser, the browser can display shortcuts for doing so, such as opening the settings to change the default browser, as shown in Figure G.14, for an iPhone. On Android, it appears to be possible for browsers to directly display the list of installed browsers and ask if the user wants to change their default browser to the one they are currently using (eg DuckDuckGo browser prompt, as shown in Figure G.13).
Note: Screenshots taken on iPhone XR running iOS 15.1 in November 2021.
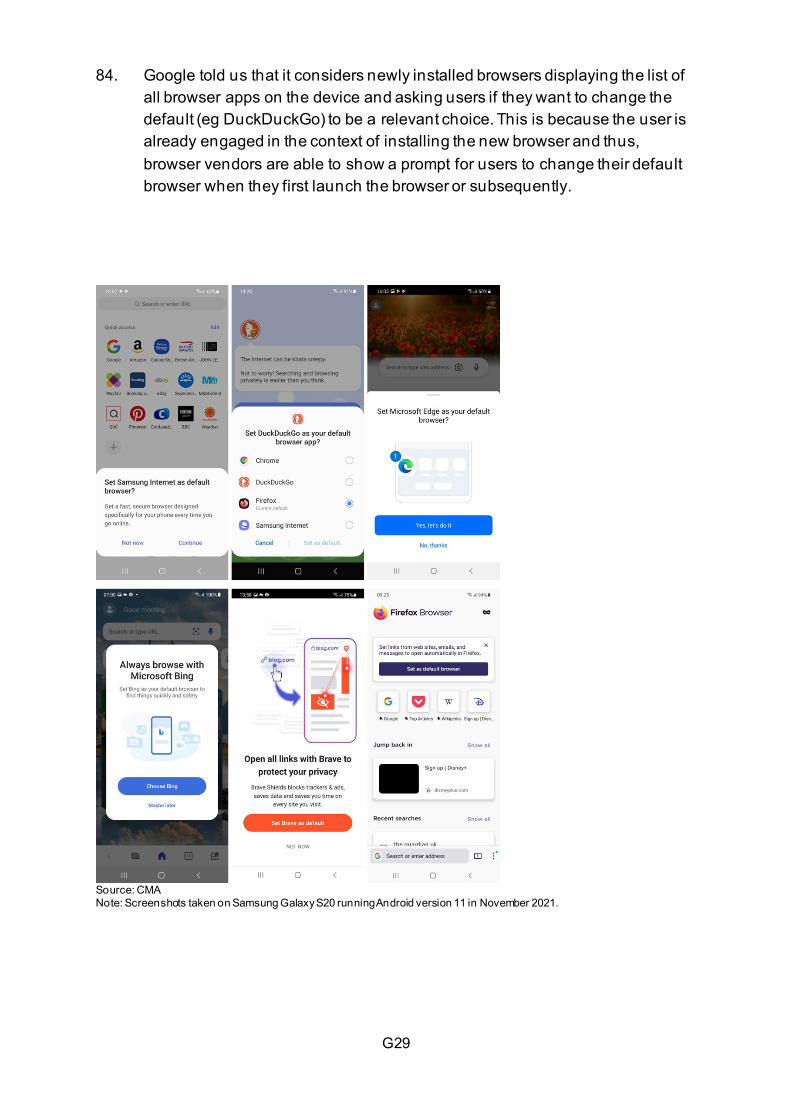
G29
84. Google told us that it considers newly installed browsers displaying the list of all browser apps on the device and asking users if they want to change the default (eg DuckDuckGo) to be a relevant choice. This is because the user is already engaged in the context of installing the new browser and thus, browser vendors are able to show a prompt for users to change their default browser when they first launch the browser or subsequently.
Source: CMA Note: Screenshots taken on Samsung Galaxy S20 running Android version 11 in November 2021.
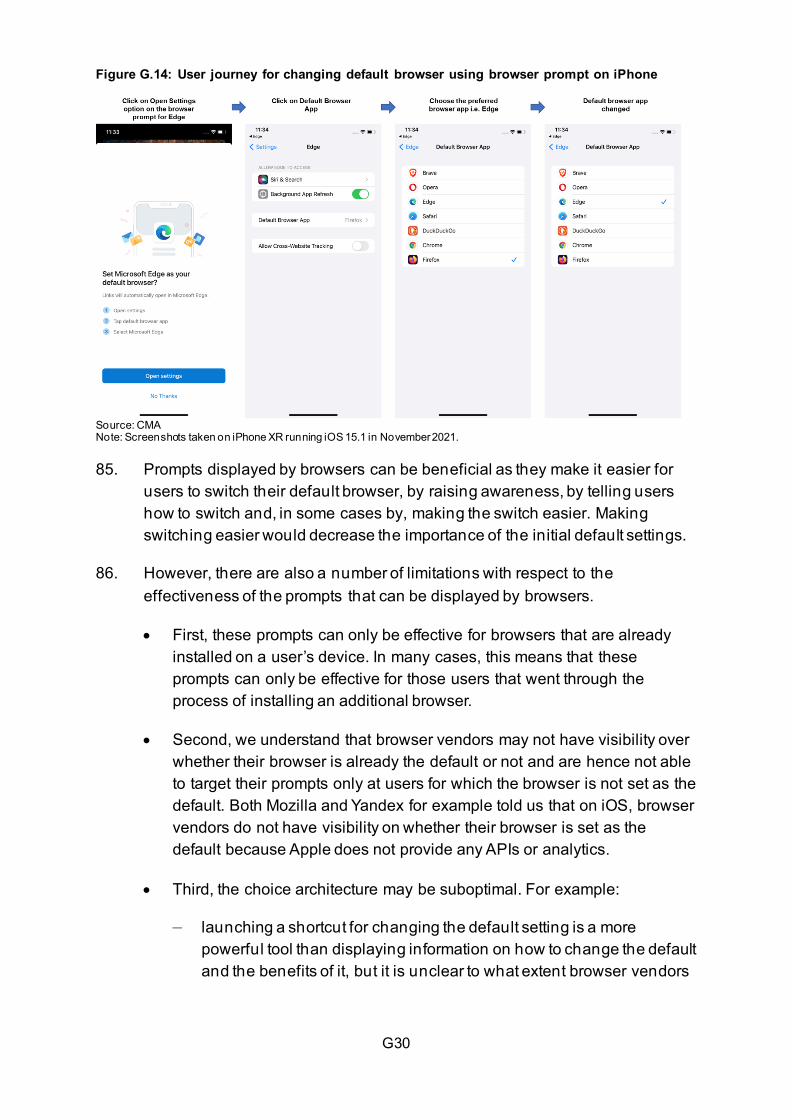
G30
Figure G.14: User journey for changing default browser using browser prompt on iPhone
Source: CMA Note: Screenshots taken on iPhone XR running iOS 15.1 in November 2021. 85. Prompts displayed by browsers can be beneficial as they make it easier for
users to switch their default browser, by raising awareness, by telling users how to switch and, in some cases by, making the switch easier. Making switching easier would decrease the importance of the initial default settings.
86. However, there are also a number of limitations with respect to the effectiveness of the prompts that can be displayed by browsers.
• First, these prompts can only be effective for browsers that are already installed on a user’s device. In many cases, this means that these prompts can only be effective for those users that went through the process of installing an additional browser.
• Second, we understand that browser vendors may not have visibility over whether their browser is already the default or not and are hence not able to target their prompts only at users for which the browser is not set as the default. Both Mozilla and Yandex for example told us that on iOS, browser vendors do not have visibility on whether their browser is set as the default because Apple does not provide any APIs or analytics.
• Third, the choice architecture may be suboptimal. For example:
— launching a shortcut for changing the default setting is a more powerful tool than displaying information on how to change the default and the benefits of it, but it is unclear to what extent browser vendors
G31
have access to the respective API that lets them launch such a shortcut; and
— users that do not actually want to change their default are (potentially repeatedly) shown these prompts. This could increase the burden on them, reduce their engagement with the prompts and result in the degradation of their browsing experience.
Prompts displayed by websites
87. Several respondents raised concerns with respect to Google websites prompting users to download Chrome and/or change their default to Chrome.
• One of the Statement of Scope responses noted that Google advertises Chrome to users that visit Google’s homepage and encourages them to switch.48 According to a linked blogpost, the notification appears every single time the user visits Google’s home page in a browser that is not Chrome.49
• Microsoft submitted that YouTube, Google.com and other Google web properties prompt users to switch to Chrome.
88. Similar to prompts displayed by browsers, these prompts can, in principle, facilitate switching. However, given that Google has a much wider web presence than other browser vendors (most notably through its position in Google Search), these prompts primarily benefit Google. As such, these prompts do not reduce barriers for smaller browser vendors, but instead raise them – as even those users that decided to switch to an alternative browser are prompted to switch back to Chrome.
89. In addition, Google’s prompts could increase the burden on users and possibly reduce their engagement with the prompts. We also note that there is a question as to whether continual prompts across the Google eco-system fit with Google’s stated design principles described above, including proportionality.
48 Statement of Scope response from Dr Greig Paul and Dr James Irvine. 49 How to block the "Switch to Chrome" notification on Google.com : AdBlock Help (getadblock.com).
H1
Appendix H: in-app purchase rules applied by Apple and Google to app developers distributing apps through Apple’s and Google’s app stores
Introduction
1. As noted in Chapter 6 of our interim report, both Apple and Google require that certain in-app payments must be processed through their respective in-app payment systems. This appendix sets out their respective rules in greater detail.
Apple’s in-app purchase rules
Apple’s rules relating to in-app purchase of digital content
2. App developers with apps on the App Store must adhere to the terms and conditions set out in Apple’s Developer Program License Agreement (‘DPLA’)1 and Apple’s App Store Review Guidelines (the ‘Guidelines’).2 Apple retains the unilateral power to decide whether an app may be distributed via the App Store and whether any amendments to an app are acceptable on the basis of its interpretation of the Guidelines.
3. The following paragraphs describe the key rules set by Apple which govern the way in which in-app payments can be offered within apps.
4. Both the DPLA and Guidelines distinguish between apps which allow goods and services to be consumed outside of an app (for example, Amazon selling physical goods, Deliveroo providing food delivery, or Uber providing taxis) and those apps, defined in the Guidelines, as allowing users ‘to unlock features or functionality within your app, (by way of example: subscriptions, in-game currencies, game levels, access to premium content, or unlocking a full version)’ (referred to, for these purposes, as ‘digital content’).
Commercial terms applicable
5. The DPLA is a limited license allowing app developers to use Apple software to develop one or more native apps to be made available on Apple-branded products. Apps meeting Apple’s documentation and program requirements (as set out under the DPLA) may then be submitted to Apple to be reviewed
1 Publicly available on Apple’s website here and here. Last accessed on 9 December 2021. 2 Publicly available on Apple’s website App Store Review Guidelines - Apple Developer (October 22, 2021 Update). Last accessed on 9 December 2021.
H2
and for beta-testing. The DPLA also contains details regarding use of each of Apple’s Application Programming Interfaces (APIs) and the functionality of apps within the App Store.3 The DPLA specifies that all use of ‘In-App Purchase APIs’ by app developers must be in accordance with the terms of the DPLA.4
6. Attachment 2 to the DPLA contains ‘Additional Terms for Use of the In-App Purchase API’ and sets out rules which apply to apps containing digital content or functionality. For example:5
• Use of the In-App Purchase API: In-app purchase may only be used to enable end-users to access or receive content, functionality, or services made available for use within an app (eg digital books, additional game levels, access to a turn-by-turn map service). It may not be used to offer goods or services to be used outside of the app. App developers must submit to Apple for review and approval all content, functionality, or services that app developers plan to provide through the use of the In-App Purchase API.
• Additional restrictions on use include:
— App developers are prohibited from using Apple’s in-app purchase system to enable an end-user to set up a pre-paid account to be used for subsequent purchases of content, functionality, or services, or otherwise create balances or credits that end-users can redeem or use to make purchases at a later time.
— App developers are prohibited from issuing any refunds to end-users of apps, and app developers agree that Apple may issue refunds to end-users in accordance with the terms of Schedule 2.
7. The DPLA requires app developers to enter into an additional agreement, ‘Schedule 2’, with Apple if making available apps that charge iOS users a fee of any kind for the app or within the app through the use of the In-App Purchase API.6 Under the terms of Schedule 2, app developers must appoint
3 Section 3.3.3 provides: ‘Without Apple’s prior written approval or as permitted under Section 3.3.25 (In-App Purchase API), an Application may not provide, unlock or enable additional features or functionality through distribution mechanisms other than the App Store, Custom App Distribution or TestFlight.’ Publicly available on Apple's website. Last accessed on 9 December 2021 4 As set out in section 3.3.25 and further terms contained in Attachment 2 to the DPLA. Publicly available on Apple's website. Last accessed on 9 December 2021 5 Publicly available on Apple’s website here and here. Last accessed on 9 December 2021. 6 Section 7.2 of the DPLA provides: ‘If Your Application qualifies as a Licensed Application and You intend to charge end-users a fee of any kind for Your Licensed Application or within Your Licensed Application through the use of the In-App Purchase API, You must enter into a separate agreement (Schedule 2) with Apple and/or an Apple Subsidiary before any such commercial distribution of Your Licensed Application may take place via the
H3
Apple Distribution International Limited as their commissionaire for the distribution of apps and pay a commission fee to Apple on each app sale, annual subscription and in-app purchase involving digital paid content collected via Apple’s in-app purchase system (‘Apple IAP’). We understand that being commissionaire means that Apple is the merchant of record for the relevant transaction (as further explained below).7
8. In addition to the contractual terms contained in the DPLA and Schedule 2, app developers must also adhere to the rules set out in the Guidelines. In particular, Apple mandates that app developers making available digital content are obliged to use only Apple IAP for all transactions within the app.
• Section 3.1.1 and 3.1.3 of the Guidelines contain specific rules regarding apps as follows:
— Apps offering digital content must exclusively use Apple IAP for app-related payments.
— Payments made using Apple IAP are subject to a 30% commission – unless a particular exemption or reduced rate of 15% applies. Over time, Apple has introduced and extended the application of its exemptions and the apps which benefit from the reduced rate.
— Apple also restricts app developers offering digital apps from informing iOS customers within an app about payment options for paid digital content outside of an app. Again, these restrictions have changed over time, with a number of recent amendments and some still to be implemented.
9. Apple has explained that it ‘monitors compliance with Section 3.1.1 and 3.1.3 through the app review process’.8 The terms of the DPLA list the scenarios which require an app developer to request that Apple reviews the app, each of which provides an opportunity for Apple to assess whether the app continues to comply with Apple’s contractual terms contained within the DPLA and the Guidelines.9
App Store or before any such commercial delivery of additional content, functionality or services for which You charge end-users a fee may be authorized through the use of the In-App Purchase API in Your Licensed Application.’ Publicly available on Apple’s website here and here. Last accessed on 9 December 2021. 7 Publicly available on Apple’s website here and here. Last accessed on 9 December 2021. 8 Chapter 6 of our interim report provides a detailed explanation of Apple’s app review process. 9 Section 6.1 of the DPLA stipulates that any changes made by an app developer to an app, ‘including to any functionality made available through use of the In-App Purchase API’ after the initial submission to Apple require the app developer to re-submit the app for review. Similarly, all bug fixes, updates, upgrades, modifications, enhancements, supplements to, revisions, new releases and new versions of an app must be submitted to Apple for review in order for them to be considered for distribution via the App Store. Publicly available on Apple’s website here and here. Last accessed on 9 December 2021.
H4
10. Further practical information relevant for app developers using Apple’s IAP is made available via the Apple Store Connect tool. For example, the Apple Store Connect tool contains information on the price tiers available for app developers to charge for in-app purchases (subject to change by Apple from time to time). App developers can also access data concerning their app’s financial performance and user engagement using App Analytics, Sales and Trends, and Payments and Financial Reports.10
Payment processing under Apple IAP
11. Apple acts as the merchant of record11 for Apple IAP transactions: this effectively means that Apple is the direct seller in the transaction and has the contractual relationship with the user buying content. Apple issues a digital receipt to the app developer, after which point the app developer unlocks purchasable functionality. As Apple is the seller, it is liable for refunds and customer support and also has valuable billings data in relation to the user’s purchase.
12. Apple has indicated that the billings data is processed by a dedicated team within Apple which forms part of the App Store, and is not shared with any other business units within Apple. App developers have indicated that limited information is passed on to them beyond a receipt from Apple stating that a transaction has taken place and, subsequently, the remitted proportion of funds due to them. Some app developers told the CMA that data in relation to the customer (for example, the iOS user’s full name, email address and credit card details) is retained by Apple and is not passed on to the app developer. Apple has submitted that transaction-specific data includes the date of the transaction, the price paid, and the content sold, etc.
13. Conversely, apps which allow Apple users to purchase physical goods and services (which Apple determines are consumed by users outside of the app) cannot use Apple IAP and must use other payment methods. Guideline 3.1.3(e) provides: ‘If your app enables people to purchase physical goods or services that will be consumed outside of the app, you must use purchase methods other than in-app purchase to collect those payments, such as Apple Pay or traditional credit card entry.’ Furthermore, Guideline 3.1.3(d) specifies that apps that enable the purchase of real-time person-to-person services
10 Exhibit F of Schedule 2 provides that app developers ‘can obtain all of Your Licensed Application’s financial results for individual app sales and in-app purchases (including subscriptions) in Sales and Trends, or download the data from Financial Reports; and You can view App Analytics for non-personally identifiable data that allows You to understand how consumers engage with your Licensed Applications. More information can be found at https://developer.apple.com/app-store/measuring-app-performance/’. Publicly available on Apple’s website here and here Last accessed on 9 December 2021. 11 For these purposes ‘merchant of record’ means the business accepting a payment and the party selling goods or services to a cardholder and to whom the cardholder owes payment for such goods and services.
H5
between two individuals (for example tutoring students, medical consultations, real estate tours, or fitness training) may use purchase methods other than Apple IAP.
14. Therefore, where goods and services are consumed by users outside of an app, the app developer has a choice as to how it collects money from the user and, as a result, the user may also choose between available purchase options. For example, the user may enter their card details with the app developer directly, while an acquirer such as Worldpay or Chase is used to process the payment (in a similar way to Apple); or the developer may use vertically integrated payment service providers (PSPs) such as Adyen or Stripe who process the payment as well as offering a payment gateway at the point of purchase. In effect, Apple places itself between the iOS app developer and the iOS user: taking on responsibility for all billing and related communications.
The Apple IAP requirement does not apply to certain types of digital content apps
15. Some types of app developers choose to develop or modify apps not to offer paid features, content or subscriptions in-app, thereby avoiding Apple IAP and the associated commission.12 App developers may instead take payments on a related website, and users are then able to access features, content or subscription options when they log in to the relevant app on iOS.
16. Currently, Apple permits the following types of apps to provide consumers with access to digital content without using Apple IAP and paying the associated commission, in the following limited circumstances:
• Reader apps: under Guideline 3.1.3(a), Reader apps are those which ‘allow a user to access previously purchased content or content subscriptions (specifically: magazines, newspapers, books, audio, music, and video). Reader apps may offer account creation for free tiers, and account management functionality for existing customers.’ (the ‘Reader Rule’). In effect, Apple permits Reader apps to avoid Apple IAP if offering content which has been previously purchased outside of the App Store iOS app.
• Multiplatform apps: Under Guideline 3.1.3(b), Multiplatform Service apps – those ‘that operate across multiple platforms’ – are permitted to allow users to access content, subscriptions, or features they have acquired in an app on other platforms or an app developer’s website, including
12 For example, Spotify modified its business model in 2016, effectively disabling Apple IAP so that it could fall within the Reader Rule exemption explained below.
H6
consumable items in multi-platform games, provided those items are also available as Apple IAP purchases within the App Store iOS app.
• Enterprise Service apps: Guideline 3.1.3(c) defines Enterprise Service apps as those ‘only sold directly by [the app developer] to organizations or groups for their employees or students (for example professional databases and classroom management tools)’. In this case app developers are permitted to allow enterprise users to access previously purchased content or subscriptions. However, consumer, single-user, or family sales must use Apple IAP.
• Person-to-Person Services apps: Under Guideline 3.1.3(d), a Person-to-Person Services app as one which ‘enables the purchase of real-time person-to-person services between two individuals (for example tutoring students, medical consultations, real estate tours, or fitness training), you may use purchase methods other than in-app purchase to collect those payments’. However, ‘one-to-few’ and ‘one-to-many real-time services’ must use Apple IAP, subject to a temporary deferral by Apple of this rule.13
• Free Stand-alone apps: Such apps are defined under Guideline 3.1.3(f) as those apps ‘acting as a stand-alone companion to a paid web-based tool (eg VOIP, Cloud Storage, Email Services, Web Hosting)’ These apps ‘do not need to use Apple IAP, provided there is no purchasing inside the app, or calls to action for purchase outside of the app’.
17. Apple explained that it created the Reader Rule as it ‘facilitated access to content within the app that was purchased outside the app’. As described more fully below, for app developers benefitting from the Reader Rule, the application of Apple’s anti-steering rules means that publishers could no longer provide links in their apps (to a website, for example) which would allow a customer to purchase content or subscriptions outside of the app.
18. Apple has submitted that ‘the Reader Rule came about as a result of the evolution of the way users used Amazon’s Kindle Reader app as users were beginning to read books on their iOS devices. The rationale for the Reader Rule was therefore to allow the types of digital content that users might typically purchase access to or subscribe to outside of an app, or already
13 Note that in 2020, as a result of the COVID-19 pandemic, Apple temporarily deferred the requirement to offer paid online group events through Apple IAP only. In November 2020 Apple extended that deadline to June 2021, and in April 2021 Apple extended it again to 31 December 2021. Apple has explained that apps offering real-time person-to-person services between two individuals (for example, tutoring students, medical consultations, real estate tours, or fitness training) can continue using purchase methods other than in-app purchase. See Online group event in-app purchase requirement reminder - News - Apple Developer.
H7
have an existing subscription for, to be read in an iOS app even if that content was purchased elsewhere. This included books, magazines and newspapers.’
19. The Reader Rule was subsequently used by other content companies, such as Netflix and Hulu, to permit users to watch video content in the app based on a video subscription that had been purchased on a user’s computer. In June 2011, the Guidelines were updated to reflect that Reader apps without an in-app subscription did not need to use Apple IAP but could still use the Reader Rule to play content purchased outside of the app.
20. The Reader Rule has also been modified to include different categories of content subscription and, in some cases, Apple has subsequently created separate categories of apps which are not required to use Apple IAP. The main changes include the following:
• In 2012 cloud storage was added to the content categories eligible for the Reader Rule, although later this content type became covered under the Free Stand-alone Apps Rule.
• In 2013 Apple ‘clarifie[d] that Enterprise apps intended for use by company employees do not need to use IAP, and may support login for accounts created by the company’. In 2020 Apple created the Enterprise Services, Free Stand-alone Apps, and Person-to-Person Experiences exceptions to facilitate access to content, further limiting the scope of apps subject to a commission.
• In 2016 access to professional databases, VoIP, and approved services such as educational apps that manage student grades and schedules were added to the content categories eligible to benefit from the Reader Rule, although later these content types were covered under the Free Stand-alone Apps rule.
• In 2017 Apple modified the Reader Rule to allow users to access consumable items in multiplatform games. Apple explained that ‘this change allows, for example, digital currency purchased within a game on another platform (eg Android, PC, Xbox etc.) to be available if the user accesses the same game on iOS.’ In 2018, Apple created a new sub-category of exemption for Multiplatform Service apps, codifying this rule.
21. In terms of the rationale for both the Reader Rule and the Multiplatform Service apps exemption, Apple submitted that it ‘has long recognised that developers may acquire customers outside the apps and their customers may access the developer’s content on multiple devices; in these instances, Apple does not collect a commission. If, however, the customer is acquired through
H8
the App Store (in the developer’s iOS app), then Apple earns a commission on sales of digital content.’
Commission for the use of Apple’s In-App Purchase system
22. The commission deducted by Apple from every payment for digital content collected by Apple using Apple IAP is 30% except in the limited circumstances where Apple has determined that a lower commission rate of 15% will apply, as explained below.
23. In terms of the rationale for Apple initially choosing the 30% commission rate, Apple has explained that when it launched the App Store in 2008, Apple chose 30% and submitted to us that this was ‘set to be substantially less than the 50% or 70% industry revenue standard charged in traditional physical retail channels that dominated software distribution at that time.’
24. In 2009, Apple introduced in-app purchase and payment functionality that allowed developers to sell additional digital content and features from within an app, by releasing the In-App Purchasing API in iOS 3.0. Later in 2009 Apple also introduced a contractual obligation that app developers offering digital goods and services must use Apple IAP to complete such a process and thereby pay Apple a 30% commission fee in relation to all sales of digital content made via an app, including free apps.
25. On 15 February 2011, the 30% commission fee was extended to include subscriptions to access content-based apps such as magazines, newspapers, video and music. Apple issued a press release at the time, which quoted Steve Jobs, Apple’s CEO, as saying: ‘Our philosophy is simple – when Apple brings a new subscriber to the app, Apple earns a 30 per cent share; when the publisher brings an existing or new subscriber to the app, the publisher keeps 100 per cent and Apple earns nothing … All we require is that, if a publisher is making a subscription offer outside of the app, the same (or better) offer be made inside the app, so that customers can easily subscribe with one-click right in the app. We believe that this innovative subscription service will provide publishers with a brand new opportunity to expand digital access to their content onto the iPad, iPod touch and iPhone, delighting both new and existing subscribers.’14
26. Apple applies a lower commission of 15% in the following limited circumstances and to qualify for this lower rate app developers must
14 Apple press release dated 15 February 2011: Apple Launches Subscriptions on the App Store.
H9
demonstrate in advance that they meet the relevant criteria before Apple approves that it will apply:
• Subscriptions after the first year: for auto-renewing subscription purchases made by customers who have accrued greater than one year of paid subscription service, Apple’s commission rate is reduced to 15% for all prices payable for each subsequent renewal (as set out in Section 3.4 of Schedule 2 to the DPLA).15
• Video Partner Program: the program is available for apps featured in the Apple TV app and approved partners pay a 15% commission to Apple when users sign up using Apple IAP. Subscribers acquired via another platform, such as a developer’s website, can use payment methods other than Apple IAP. As of autumn 2020, over 130 premium subscription video entertainment providers had been approved to participate in this program, including Amazon Prime Video and Disney+.16
• Small Business Program: app developers that earned no more than $1 million in developers’ earnings (ie the amount after the deduction of the commission fee) on all of their apps in total in each of the previous year and the current calendar year and app developers new to the App Store can qualify for the program and a reduced commission of 15%. If a participating developer surpasses the $1 million threshold, the standard commission rate will apply to future sales. If a developer’s proceeds fall below the $1 million threshold in a future calendar year, they can re-qualify for the 15% commission the year after. 17
• News Partner Program: app developers which are subscription news publications providing their content to Apple News in Apple News Format may qualify for the 15% commission rate on ‘qualifying in-app purchase subscriptions.’ To be eligible: (a) app developers must maintain a robust Apple news channel in Australia, Canada, the United States and the United Kingdom, and publish all content to that channel in Apple News Format; (b) the primary function of the app must be to deliver original, professionally-authored news content; (c) the app must be available on the App Store and allow users to purchase auto-renewable subscriptions
15 See Auto-renewable Subscriptions - App Store - Apple Developer. This subscription renewal reduced rate has applied since 2016. 16 See Apple Video Partner Program - Apple Developer. The Video Partner Program has been effective since 2016. 17 See App Store Small Business Program - Apple Developer. The Small Business Program has been effective since 1 January 2021. In August 2021 pursuant to the settlement in Cameron et al v. Apple Inc., Apple agreed to maintain the program in its current structure for at least the next three years.
H10
through Apple IAP; and (d) the app developer must agree to a separate addendum to the DPLA.18
27. App developers cannot automatically benefit from the reduced 15% commission rate ‘programs’. App developers must apply to Apple in advance and demonstrate that they meet the relevant eligibility criteria. Apple subsequently determines whether they are permitted to join the program and will review the app developers’ compliance with the program.
28. In relation to the Small Business Program, Apple has submitted that it has ‘also structured eligibility requirements to minimize fraud. To be eligible developers must identify all associated developer accounts and compute their net revenue based on the sum of revenues from all associated accounts. This approach to eligibility prevents fraudulent accounting by ineligible developers.’ Apple’s press release on launching the Small Business Program indicated that the ‘vast majority’ of developers who sell digital content within their apps are eligible to apply for the program.19
Apple’s anti-steering rules
Current anti-steering rules, including recent amendments
29. The current wording contained in the Guidelines is:
‘3.1.1: […] Apps and their metadata may not include buttons, external links, or other calls to action that direct customers to purchasing mechanisms other than in-app purchase’;
‘3.1.3: […] Apps in this section [ie which are permitted not to use Apple IAP or – in the case of apps offering goods and services outside the app –are prohibited from using it] cannot, within the app, encourage users to use a purchasing method other than in-app purchase. Developers can send communications outside of the app to their user base about purchasing methods other than in-app purchase.’20
30. These rules, referred to in this appendix and our interim report as ‘Apple’s anti-steering rules’ mean that it is not possible to encourage users – within the app – to pay through other ways, for example through a website, or to inform users whether alternative ways to pay would be cheaper. Apple has applied
18 See News Partner Program - Apple Developer. The News Partner Program was launched on 26 August 2021. 19 See Apple press release: https://www.apple.com/uk/newsroom/2020/11/apple-announces-app-store-small-business-program/ 20 Guideline 3.1.3 includes a list of seven examples of ‘dos’ and ‘don’ts’. This list has grown over time and reflects new functionality available within apps.
H11
the anti-steering rules since the introduction of Apple IAP in 2009 and they apply on a worldwide basis.
31. Apple submitted that: ‘The corollary to this ‘free-of-charge’ approach is that developers should not free-ride on Apple’s investments by deliberately encouraging customers to circumvent Apple IAP. Section 3.1.3. has long included language that prohibits developers from acquiring a customer via the App Store but then encouraging the customer to purchase digital content elsewhere. Section 3.1.3 is designed to ensure that developers do not encourage actual or potential users to (i) download an app through the App Store, (ii) and purchase the content elsewhere, before (iii) transferring this paid content onto the app distributed through the App Store. The sole purpose of such a scheme would be to free-ride on Apple’s investments by circumventing Apple IAP, which would be inappropriate.’
32. Apple’s anti-steering rules are particularly relevant to apps where off-app payment features, content or subscriptions are available: namely apps that are available on multiple platforms and Reader Rule apps. App developers can contact individual users (whether their contact details have been gathered from within or outside an app) to communicate to them that purchasing methods, other than Apple IAP, are available. However, Apple does not allow an app to include a link (button or other click-through method) within the app which would allow a user to make an out of app purchase.
33. Although the main principle that app developers must not promote or direct customers to other forms of payment (available outside of the app) from within an app has not changed, Apple has made a number of amendments to Apple’s anti-steering rules over time. In June 2021 Apple amended Guideline 3.1.3 stating that this ‘clarified the email communication policy for apps that are permitted to use purchase methods other than in-app purchase.’21 At that time Guidelines 3.1.3 was amended as follows (new text is indicated in bold and deleted text is indicated with strike through):
‘3.1.3 Other Purchase Methods: The following apps may use purchase methods other than in-app purchase. Apps in this section cannot, either within the app or through communications sent to points of contact obtained from account registration within the app (like email or text), encourage users to use a purchasing method other than in-app purchase. Developers cannot use information obtained within the app to target individual users outside of the app to use purchasing methods other than in-app purchase (such as sending
21 App Store Review Guideline updates now available - News - Apple Developer
H12
an individual user an email about other purchasing methods after that individual signs up for an account within the app). Developers can send communications outside of the app to their user base about purchasing methods other than in-app purchase.’
34. On 21 October 2021 Apple deleted the following text from Guidelines 3.1.3, which had been inserted into the same Guideline in June 2021: ‘Developers cannot use information obtained within the app to target individual users outside of the app to use purchasing methods other than in-app purchase (such as sending an individual user an email about other purchasing methods after that individual signs up for an account within the app).’
35. This October 2021 amendment reflects modifications to Apple’s anti-steering rules announced by Apple on 26 August 2021 in the context of a settlement in a US developer class action.22 Apple has stated that the deletion of the text clarifies that app developers may use communications, such as email, to share information about payment methods outside of their iOS apps. In essence the change means that, in addition to allowing app developers to email their user base about alternative purchasing methods outside of the app, app developers may now also target individual users to tell them about alternative purchase methods, for example immediately after they have signed up for an account within the app.
36. The amendment implemented as a result of the US class action settlement is primarily focussed on ‘out of app’ communications and does not change the ability for app developers to offer a link to a different purchase option from with an app.
The possibility of future amendments to Apple’s in-app purchase rules
37. There are several active competition authority investigations in relation to Apple’s App Store rules, including specifically the in-app purchase and anti-steering rules, as well as private litigation in the US and UK courts which concerns the application of Apple’s policies and the Guidelines.
22 The terms of the settlement in the Cameron et al v. Apple Inc. litigation are referred to in the following Apple press release: Apple, US developers agree to App Store updates - Apple (UK) The settlement covered a range of issues in addition to the amendments to the anti-steering rules, some specific to US based app developers only, and included Apple agreeing to add content to the Apple’s App Review website to help developers understand how the appeals process works.
H13
Japan Fair Trade Commission – changes to communication for subscription management of Reader apps
38. Apple announced changes to the Guidelines on 1 September 2021 pursuant to a settlement offered by Apple to close an antitrust investigation by the Japan Fair Trade Commission.23 The update will allow developers of Reader apps to include an in-app link to their website for users to open a new account or manage an existing account. Apple’s press notice announcing the change to the anti-steering rule indicates that it will come into effect in ‘early 2022’ and will be given global effect. This means that any app that falls within the scope of the Reader Rule would be able to provide a link to the developer’s website, from which they can sell a subscription to the individual user. As the sale takes place outside of the app, it will not trigger the use of Apple IAP or the payment of any commission to Apple.
Epic Games litigation injunction
39. In August 2020 Epic Games Inc. brought a claim alleging violations of federal and state antitrust laws against Apple Inc. in the US District Court of the Northern District of California challenging Apple’s App Store rules and Apple’s decision to block Epic’s apps from the App Store after Epic had allowed users of its Fortnite game to use alternative payment methods to Apple IAP.
40. Following a trial in May 2021, judgment was issued on 10 September 2021 finding in favour of Apple on all counts except with respect to Apple’s anti-steering rules, which the judge found to violate California’s Unfair Competition Law.24 The judge imposed a permanent injunction which prevents Apple from enforcing these provisions and found that the anti-steering provisions could be removed by Apple without any fundamental change to its ecosystem:25
‘Apple Inc. and its officers, agents, servants, employees, and any person in active concert or participation with them (“Apple”), are hereby permanently restrained and enjoined from prohibiting developers from (i) including in their apps and their metadata buttons, external links, or other calls to action that direct customers to purchasing mechanisms, in addition to In-App Purchasing and (ii) communicating with customers through points of contact obtained voluntarily from customers through account registration within the app.’
23 Japan Fair Trade Commission closes App Store investigation - Apple 24 Epic Games Inc. v Apple Inc., Case No. 4:20-cv-05640-YGR Microsoft Word - Draft Final Order - Master Document 9_9.docx (courtlistener.com) 25 Microsoft Word - 20-5640 - Epic Games - Permanent Injunction.docx (courtlistener.com) Injunction issued on 10 September 2021.
H14
41. The precise scope of the injunction has been the subject of some debate. However, it appears on its face to require Apple to allow app developers to provide a link within an app to a website which offers an alternative payment method, but seemingly does not require Apple to allow alternative payment options within an app itself.
42. In October 2021 Apple filed a notice of appeal requesting a stay on the injunction pending an appeal of the September 2021 judgment. Apple had until 9 December 2021 to implement the injunction (ie to make changes to its anti-circumvention provisions) but on 8 December 2021 the US Ninth Circuit Court of Appeals granted Apple’s request to stay the order pending the appeal of the September 2021 judgement.
Changes to payment processing following South Korean legislation
43. On 31 August 2021 the Korean National Assembly passed legislation prohibiting Apple (as well as Google and other app store operators) from requiring users to pay for apps using only their own in-app purchasing systems and therefore paying commission associated with the use of the in-app purchasing system. It also bans app stores from delaying approvals of apps or inappropriately removing them from their app stores, and from insisting on exclusivity with app developers. This legislation only applies to South Korea and will be enforced by the Korean Communications Commission (KCC). If the KCC finds than an operator is forcing an app to choose a specific payment method and to pay unreasonable fees it can open an investigation into the platform’s practices.
44. It was reported in October 2021 that Apple has indicated to the KCC that it considers that its existing payments policy complies with the new law and that it would therefore not be changing its app store policy.26
Google Play’s billing system rules
Google’s rules relating to purchases of digital content
45. The Play Store is Google’s proprietary app store.27 It is typically pre-installed on Android devices. As noted in Chapter 4, app developers who want to distribute apps on the Play Store must accept the Google Play Developer
26 See Reuters report dated 15 October 2021, S.Korea targets Apple over new app store regulation | Reuters. 27 It was initially launched as Android Market in 2008. Google recasts Android Market with new name | Reuters.
H15
Distribution Agreement and comply with Google’s Developer Program Policies.28
46. Google Play’s Payments policy, which is part of Google’s Developer Program Policies,29 sets out specific rules in relation to ‘Play-distributed apps requiring or accepting payment for access to in-app features or services, including any app functionality, digital content or goods’ (eg digital items such as virtual currencies; subscription services; app functionality or content, such as an ad-free version of an app; and cloud software and services):30
• Those apps are required to use Google Play’s billing system as the method of payment for those transactions (unless Sections 3 or 8 apply – both described below).31 This also applies to payments for developers charging for apps and app downloads on the Play Store.
• They may not use Play,32 Play-distributed apps, or content within Play-distributed apps to steer consumers to make purchases from other sources instead of Play. The rules do not, however, prevent app developers from using other channels – outside of Play – to let users know how they can purchase the developer’s apps or in-app content.33 These rules are referred to below and in our interim report as ‘Google’s anti-steering rules’.34
47. In addition to the rules set out above, apps and in-app products sold through the Play Store are subject to a ‘service fee’ – referred to throughout our interim report as a commission – of 30%, unless a reduced rate applies.35 Over time, Google has introduced and extended the application of reduced rates.
28 Google Play Developer Distribution Agreement publicly available on Google’s website Google Play and Google Developer Program Policies available Developer Policy Center (google.com). Last accessed on 13 December 2021. 29 See also Monetisation and ads - Play Console Help (google.com). 30 Sections 1 and 2 of Google Play’s Payments policy available at Payments - Play Console Help (google.com) last accessed on 9 December 2021. 31 Sections 1 and 2 of Google Play’s Payments policy available at Payments - Play Console Help (google.com) last accessed on 9 December 2021. 32 For the purposes of this appendix, the term 'Google Play', as used in Google Play’s Payments policy, can be read as synonymous with the term ‘the Play Store’ used elsewhere in this appendix and in our interim report. 33 Section 3 of Google Play’s Payments policy. This applies to apps other than those described in 2(b) of the Google Play payment policy. Google Play’s Payments policy is available at Payments - Play Console Help (google.com) last accessed on 9 December 2021. 34 Google submitted that it does not agree with the characterisation of clause 3 of the Google Play’s Payments policy as an ‘anti-circumvention restriction’ and that it would be more accurately characterised as an ‘anti-free riding’ policy. 35 Section 3.4 of the Google Play Developer Distribution Agreement. See also Service fees - Play Console Help (google.com).
H16
48. Google monitors compliance with the Developer Program Policies through a review process.36 When submitting an app for review, app developers have to specify to Google whether they offer in-app purchases.
Commercial terms applicable
49. Developers are required to use Google Play’s billing system for the sale of apps (ie apps for which consumers have to pay) and in-app purchases (including subscriptions) of digital goods and services that can be used within the Google Play ecosystem. This means that developers are not required to use Google Play’s billing system for:
• Purchases of physical goods or digital goods or services that can only be consumed outside of an app and cannot be accessed in an app (eg ringtones, content that can only be accessed on a website; and apps that manage cloud service platforms but do not provide access to that cloud storage in-app).37
• Consumption only38 (or reader) apps, even if it is part of a paid service. Google explained that a user could login when the app opens and the user could access content paid for somewhere else.39
50. Some apps are prohibited from using Google Play’s billing system (eg where payment is primarily for the purchase or rental of physical goods or the purchase of physical services).
51. Google revised Google Play’s Payments policy40 in September 2020 to remove an exception to the requirement to use Google Play’s billing system in relation to some purchases of digital content.
52. Google Play’s Payments policy currently provides that:41
‘1. Developers charging for app downloads from Google Play must use Google Play's billing system as the method of payment for those transactions.
2. Play-distributed apps requiring or accepting payment for access to in-app features or services, including any app functionality, digital content or
36 Chapter 6 of our interim report provides an explanation of Google’s app review process. 37 Understanding Google Play’s payments policy - Play Console Help 38 Consumption-only apps refer to apps that do not enable users to purchase access to digital goods or services from within the app. See Understanding Google Play’s payments policy - Play Console Help. 39 Understanding Google Play’s payments policy - Play Console Help 40 Payments - Play Console Help (google.com) last accessed on 9 December 2021. 41 Payments - Play Console Help (google.com) (sections 1 – 3) last accessed on 9 December 2021.
H17
goods (collectively ‘in-app purchases’), must use Google Play's billing system for those transactions unless Section 3 or Section 8 applies.
Examples of app features or services requiring use of Google Play’s billing system include, but are not limited to, in-app purchases of:
• Items (such as virtual currencies, extra lives, additional playtime, add-on items, characters and avatars);
• subscription services (such as fitness, game, dating, education, music, video, and other content subscription services);
• app functionality or content (such as an ad-free version of an app or new features not available in the free version); and
• cloud software and services (such as data storage services, business productivity software, and financial management software).
3. Google Play's billing system must not be used in cases where:
a. payment is primarily:
• for the purchase or rental of physical goods (such as groceries, clothing, household goods, electronics);
• for the purchase of physical services (such as transport services, cleaning services, airfares, gym memberships, food delivery, tickets for live events); or
• […].’
(emphasis in original)
53. Unlike Google Play’s billing system, Google Pay may be used for apps selling physical goods and/or services.42 Google described Google Pay as a standalone mobile wallet that enables users to make payments online, in certain apps, and in physical stores. Merchants may offer Google Pay as one of several payment methods in their checkout. The merchant would engage a third party to process payments. Google does not charge merchants a commission for using Google Pay.43
Recent update regarding the requirement to use Google Play’s billing system
54. Google submitted that it has always required developers to use Google Play’s billing system in respect of sales of apps and in-app purchases.44
42 See Google Play’s Payments policy and the Google Pay developer page last accessed on 9 December 2021. 43 For more information, see the Google Pay developer page. 44 Google made this statement publicly as part of an announcement regarding the update of its Google Play Payments policy in September 2020. Android Developers Blog: Listening to Developer Feedback to Improve Google Play (googleblog.com).
H18
55. Google submitted that the main change to the scope of the Google Play Payments policy relates to the removal in September 2020 of an exception for purchases of digital content that may be consumed outside of an app itself, (eg songs that can be played on other music players, such as mp3 players), referred to as the ‘Digital Content Exception’.
56. Google submitted that the rationale for the Digital Content Exception was to cover the situation where users purchased and downloaded music in the form of digital files to play outside the app itself. Google found that with changes in technology and markets developments, the Digital Content Exception became less relevant. In addition, Google stated that this exception created confusion among developers, as some understood the Digital Content Exception to mean that they did not need to comply with Google Play’s Payments policy when selling access to in-app content (eg webtoons, web novels, or music) on Google Play, even though their paid content was consumable within the Play-distributed app.
57. The announcement of the change to Google Play’s Payments policy was made in a blog on 28 September 2020: Google stated that it was updating its Payments policy ‘to be more explicit that all developers selling digital goods in their apps are required to use Google Play’s billing system.’ 45 In the announcement, it explained that this followed feedback from app developers that its policy language could be more clear regarding which types of transactions require the use of Google Play’s billing system, and that the language used was creating confusion.
58. Google set out a timeline for compliance with the updated policy:
• All new apps submitted after 20 January 2021 would need to comply with the new Payments policy to be approved for distribution on the Play Store.
• Existing apps that were using an alternative billing system would need to remove it to comply with Google’s update. Google allowed those app developers that already had an app on the Play Store, and would require ‘technical work to integrate’ Google Play’s billing system, a year to comply, giving a deadline of 30 September 2021.46
• In July 2021, Google announced that it was offering app developers who required longer than the 30 September 2021 deadline to comply with the changes to Google’s Payments policy, an option to request a 6-month
45 Android Developers Blog: Listening to Developer Feedback to Improve Google Play (googleblog.com) and https://support.google.com/googleplay/android-developer/answer/9876714 46 Understanding Google Play’s payments policy - Play Console Help. Last accessed on 9 December 2021. Android Developers Blog: Listening to Developer Feedback to Improve Google Play (googleblog.com)
H19
extension to no later than 31 March 2022.47 Google noted that requests for an extension would be evaluated on an app-by-app basis.48
Payment processing under Google Play’s billing system
59. Under the terms of the Google Play Developer Distribution Agreement, Google is the ‘merchant of record’49 for products sold or made available to users’ in the UK.50 Google Payment Limited handles third-party payments between consumers and app developers in the UK.
60. Developers distributing paid apps or using Google Play’s billing features also agree to the Google Payments Seller Terms of Service.51 Google does not process payments through its own billing systems and instead uses a third-party processor and acquirer in the collection of all funds.
61. App developers can see orders, issue refunds and manage subscription cancellations for items that users have purchased, via the Play Console website and app.52 Google may also refund orders to users (eg if the user returns a paid app and/or requests a refund, or for unauthorised or accidental purchases). Under the Google Play Developer Distribution Agreement, developers are required to authorise Google to give users refunds in accordance with the Google Play refund policies.53
62. Google submitted that when a user makes a purchase, Google collects information necessary to process the purchase and uses that information to provide necessary customer support. Google may additionally use certain data to provide users with a personalised experience on the Play Store or may use data, typically in aggregate form, to improve its services and maintain the quality of the Play Store. Google also provides some data to developers. For example, developers are provided transaction-level data for each transaction related to their app and the ability to provide refunds to users if needed, as well as a variety of metrics data including subscriptions performance and peer benchmarks.54
47 Android Developers Blog: Allowing developers to apply for more time to comply with Play Payments Policy (googleblog.com) 48 Understanding Google Play’s payments policy - Play Console Help 49 Merchant of Record - Play Console Help (google.com) 50 The Google Play Developer Distribution Agreement sets out a number of requirements in order for developers to charge a fee for their products and to be paid for products distributed via Google Play, see eg section 3.2. 51 For the UK, see Google Payments Seller Terms of Service 52 See Manage your app’s orders and issue refunds - Play Console Help (google.com), last accessed on 9 December 2021. 53 Google Play Developer Distribution Agreement, section 3.8. 54 See also Data Access - Play Console Help (google.com).
H20
Commission for the use of Google Play’s billing system
63. Google charges developers a service fee (ie a commission), based on a percentage of the purchase price or digital purchases in their app.55
64. Google’s service fee (as of 1 July 2021) is described at the following standard rates:
• A 30% service fee applies for earnings in excess of $1 million each year. 56 From 1 July 2021 Google lowered the service fee to 15% for the first $1 million of earnings for all app developers enrolled in the 15% service fee tier.57 For developers not enrolled in the 15% service fee tier by 1 July 2021, the service fee of 30% applies until enrolment has occurred.58
• From 1 January 2018, Google lowered its fee for subscriptions to 15% for subscribers who maintained a subscription service for more than 12 months. This will change from 1 January 2022 – Google has announced that from this date the service fee for all subscription products will be 15%.59
65. Google also announced changes to its ‘Play Media Experience Program’. Developers may be eligible for a reduced fee based on high content costs.60 A service fee of 15% would apply for apps primarily offering video, audio, or books in which users pay to consume content, and which meet the requirements of the program.61 Ebooks and on-demand music streaming services would be eligible for a service fee of 10%.62
66. Google submitted that the service fee charged regarding the use of the Play Store reflects a number of factors, which we have set out in further detail in Chapter 6 of our interim report.63
55 See Understanding Google Play's service fee - Play Console Help. 56 Understanding Google Play's Service Fee - Play Console Help 57 Changes to Google Play's service fee in 2021 - Play Console Help and Android Developers Blog: Boosting developer success on Google Play (googleblog.com) 58 See also Changes to Google Play's service fee in 2021 - Play Console Help 59 This was announced on 21 October 2021, see Android Developers Blog: Evolving our business model to address developer needs (googleblog.com) 60 Understanding Google Play's service fee - Play Console Help 61 In June 2021, Google reduced its commission to 15% for apps primarily offering video, audio, or books in which users pay to consume content, as part of the Play Media Experience Program. See Android Developers Blog: Continuing to boost developer success on Google Play (googleblog.com) and Play Media Experience Program | Google Play Console 62 Android Developers Blog: Evolving our business model to address developer needs (googleblog.com) 63 See also Understanding Google Play's service fee - Play Console Help.
H21
67. Developers are not required to pay a service fee for:
• Apps distributed via a consumption-only model (ie apps that do not enable users to purchase access to digital goods or services from within the app), also referred to as ‘reader apps’. These developers can sell content outside of the Play Store.
• Apps that monetise through other means, such as advertising or sales of physical goods or services.
Google’s anti-steering rules
68. Google makes a distinction between communications with customers about payment methods other than Google Play’s billing system:
• within the app on the Play Store: developers may not lead users to a payment method other than Google Play’s billing system within an app distributed on Google Play.64 In particular, app developers cannot, within an app, provide users with a direct link to a webpage containing an alternative payment method or use language that encourages a user to purchase the digital item outside of the app.65
• using other channels: app developers can use other channels outside of the Play Store to let users know how they can purchase the developer’s apps or in-app content. For example, app developers are free to advertise alternative purchase locations on their websites, social media feeds, adverts, or via direct messaging to consumers.66
69. Google Play’s Payments policy provides that:67
‘4. Other than the conditions described in Section 3 and Section 8, apps other than those described in 2(b) may not lead users to a payment method other than Google Play's billing system. This prohibition includes, but is not limited to, leading users to other payment methods via:
• An app’s listing in Google Play;
64 Google Play’s Payments policy, section3. See also Google’s Play Console Help page 65 Understanding Google Play’s payments policy - Play Console Help, see Frequently asked questions and in particular ‘Can I communicate with my users about alternative ways to pay?’. 66 See Google’s Play Console Help page and in particular the responses to the questions ‘Can I communicate with my users about alternative ways to pay?’ and ‘Can I communicate with my users about promotion on other platforms?’ 67 Section 4 of Google Play’s Payments policy, Payments - Play Console Help (google.com). ‘Section 3’ for these purposes is the section quoted earlier in this appendix detailing situations in which Google Play’s billing system must not be used. ‘Section 8’ refers to a new section of the policy introduced following the coming into effect of the new South Korean laws and Google’s announced changes to its policies in order to comply with that law, as quoted below.
H22
• In-app promotions related to purchasable content; • In-app webviews, buttons, links, messaging, advertisements or
other calls to action; and • In-app user interface flows, including account creation or sign-up
flows, that lead users from an app to a payment method other than Google Play's billing system as part of those flows.’
70. App developers can also email or otherwise communicate outside of the app information about promotions or offerings on other platforms, even if they are different from offerings on the Play Store.68 Google states that it does not require parity across platforms.69
71. For services and products that are consumption-only (or reader apps), developers may choose to provide additional information about purchasing options, without direct links. 70
72. Google submitted that it has always prohibited the use of communication within the Play Store to steer consumers to other channels for making purchases. Google submitted that it clarified its policy in Google’s September 2020 policy statement: ‘developers have asked whether they can communicate with their customers directly about pricing, offers, and alternative ways to pay beyond their app via email and other channels. To clarify, Google Play does not have any limitations here on this kind of communication outside of a developer’s app’.71
Future changes to Google’s in-app purchase rules
Recent announcements made by Google about changes to its in-app purchase rules
73. From 31 March 2022, all developers selling digital goods in their apps that can be used within the Google Play ecosystem will be required to use Google Play’s billing system.
74. In relation to the commission charged by Google, from 1 January 2022, the condition that the subscription be maintained for more than 12 months will no longer apply: the service fee for all app subscriptions on Google Play will be reduced from 30% to 15%.72
68 See Google’s Play Console Help page. 69 See Google’s Play Console Help page. 70 See Google’s Play Console Help page 71 Android Developers Blog: Listening to Developer Feedback to Improve Google Play (googleblog.com), 28 September 2020. 72 This was announced on 21 October 2021, see Android Developers Blog: Evolving our business model to address developer needs (googleblog.com)
H23
Changes to payment processing following South Korean legislation
75. In response to the recent law passed by the Korean National Assembly, discussed above, Google announced on 4 November 2021 that it plans to give developers that sell in-app digital goods and services the option to add an alternative in-app billing system alongside Google Play’s billing system for their users in South Korea. 73 Users would be able to choose which billing system to use at checkout.74
76. Google said that when a user selects alternative billing, it would reduce the developer’s service fee by 4%. For example, for developers that pay 15% for transactions through Google Play’s billing system, their service fee for transactions through an alternative billing system would be 11%.75
77. On 18 November 2021 Google added Section 8 to its Payments Policy (these changes will become effective from 18 December 2021). Section 8 provides as follows: ‘Unless the conditions described in Section 3 apply [cases where Google Play’s billing system must not be used], developers of Play-distributed apps on mobile phones and tablets requiring or accepting payment from users in South Korea for access to in-app purchases may offer users an in-app billing system in addition to Google Play's billing system for those transactions if they successfully complete the additional in-app billing system declaration form and agree to the additional terms and program requirements included therein.’.76
73 Google Developers Korea Blog: Enabling alternative billing systems for users in South Korea (googleblog.com). See also Google to allow third party app payments for first time in S.Korea | Reuters. 74 Google Developers Korea Blog: Enabling alternative billing systems for users in South Korea (googleblog.com). 75 Google Developers Korea Blog: Enabling alternative billing systems for users in South Korea (googleblog.com). 76 Payments - Play Console Help (google.com).
I1
Appendix I: considering the design and impacts on competition of Apple’s ATT changes
Introduction
1. This appendix provides additional background information to the section of Chapter 6 of our interim report which considers the impact of Apple’s recently introduced App Tracking Transparency (ATT) privacy policy. This policy requires apps to show a specific prompt (the ATT prompt) to request users’ permission for the app to ‘track’ them. The appendix explores the effect of the ATT policy on the targeting and measurement of personalised advertising on mobile devices, and how this has impacted the mobile advertising sector and in particular the ability of app developers to acquire new users and to monetise their apps. It also analyses the choice architecture1 of the ATT prompt screen.
2. The appendix first provides an overview of how mobile advertising works, focusing on the Apple iOS ecosystem. It then explains the means Apple and third parties have to personalise ads and monitor how effective they are. Finally, it describes the changes brought about by the introduction of the ATT policy and the implications for the overall mobile advertising sector (particularly for app developers).
3. The final section of the appendix analyses the choice architecture of the prompt Apple requires third-party developers to display to users and compares it with the prompt Apple uses to request consumers’ consent to be served with Apple’s personalised advertising within Apple-owned apps, including the App Store and Apple News and Stocks (the Personalised Ads prompt). It describes our concerns regarding the differences between the two, which could result in contrasting implications for user data privacy decisions.
4. We do not consider in this appendix the potential impacts on consumers of the ATT framework – either positive or negative – which are discussed in Chapter 6 of out interim report. However, we note again here that Apple’s stated rationale for implementing the ATT framework is consistent with the shared view of the CMA and the ICO that more competitive markets will deliver the outcomes that consumers care about most, which increasingly
1 Choice architecture describes the contexts in which users make decisions and how choices are presented to them. In online or digital settings, choice architecture refers to the environment in which users make choices, including the presentation and placement of choices, and the design of user interfaces. Examples of choice architecture are the ordering of options available to users, the user interface design for changing default settings, presentation of search results etc. See Thaler, R. H., Sunstein, C. R., & Balz, J. P. (2013). Choice Architecture. In E. Shafir (Ed.), The Behavioral Foundations of Public Policy (pp. 428-439). Princeton University Press for details on choice architecture.
I2
include enhanced privacy and greater control over personal data. We recognise that there are benefits to consumers as a result of ATT in relation to privacy and personal data protection, and our primary concerns relate to the specific design and implementation of the framework by Apple.
Mobile advertising sector and changes brought by ATT
5. This section provides a brief overview of mobile advertising and the actors in the mobile advertising sector. It then describes how personalised mobile advertising works.
Advertising on mobile devices2
6. On mobile devices, advertisers can reach users with a variety of types of advertising through browsers, app stores and apps. In this section we describe the two key aspects of digital advertising on mobile devices, namely targeting and attribution and the different media where mobile ads can be placed (ie browsers, apps and app stores).
Targeting and attribution
7. Targeting and attribution are two key building blocks of advertising of the mobile advertising sector. With targeting, advertisers use information on a user’s activity to target (or tailor) the ads served to them, while via attribution, advertisers measure the effectiveness of ads by linking users’ actions from viewing or clicking on an ad to taking certain actions in response, eg downloading an app or making a purchase within an app.
8. There are various types of targeting, meaning that digital advertising can be targeted to mobile device users in several ways. These include:
• contextual: the targeting of the advertisement is driven by the surrounding content, including the nature of the medium and the user’s activity at the time of seeing the ad (for example, advertising for sports equipment served on sports-related applications);
• intent-driven: the advertisement is targeted based on the user’s action indicating an intent or interest (for example in response to a user’s query in an app); and
2 For further detail on advertising services on mobile, see CMA (2020), Online Platform and Digital Advertising Market Study, Final Report, Appendix G.
I3
• personalised (or behavioural): the advertisement is based on the information known about the user or device to which the advertisement is served, individually or as part of an aggregate group.
9. As mentioned above, attribution is the process of determining the user actions that led to the desired outcome, establishing a causal link between an ‘impression’ (ie ad view), or a click on an ad (ie ad click), and a ‘conversion’.3 Examples of what may qualify as a conversion are an app install, adding an item to the shopping basket and making an in-app purchase. Attribution is needed for advertisers to measure the effectiveness of their ads, as this allows them to optimise their spending on a given ad campaign. Moreover, being able to observe the actions taken by a user as a result of seeing an ad further enriches the information which can be used for targeting, thus improving the targeting accuracy and in turn the ad’s effectiveness.
10. Attribution is particularly important for ‘direct response advertising’, which is the type of advertising designed to get an instant response by encouraging users to take a specific action and whose payoff comes as a result of that action taken directly in response to an ad. This is different from ‘brand advertising’ which is aimed at establishing brand recognition and longer-term relationships with consumers.4
Advertising via browsers, apps and app stores
11. Ads can be served on different media on mobile devices, namely web browsers, apps and app stores.
12. In browsers, there are two main types of web advertising: search advertising and display advertising.5 Search ads rely only in a limited way on personalisation,6 rather they are primarily targeted to match key search terms entered on search engines (ie the ‘search query’), which typically provides most of the information needed to serve a relevant ad. Display ads are served on a publisher’s webpage, for example as a banner, and often involve personalised targeting.
13. In apps, ads can promote products and services including other apps. As discussed in Chapter 6, for app developers mobile advertising serves two broad purposes:
3 CMA (2020), Online Platform and Digital Advertising Market Study, Final Report, Appendix O. 4 See What Is Brand Advertising & Why Should You Use it? and Snap Earnings, Attribution and Targeting, The Supply Chain – Stratechery by Ben Thompson. 5 CMA (2020), Online Platform and Digital Advertising Market Study, Final Report. 6 Search ads shown to a consumer may be influenced by some limited personal data such as their location at the time of the search.
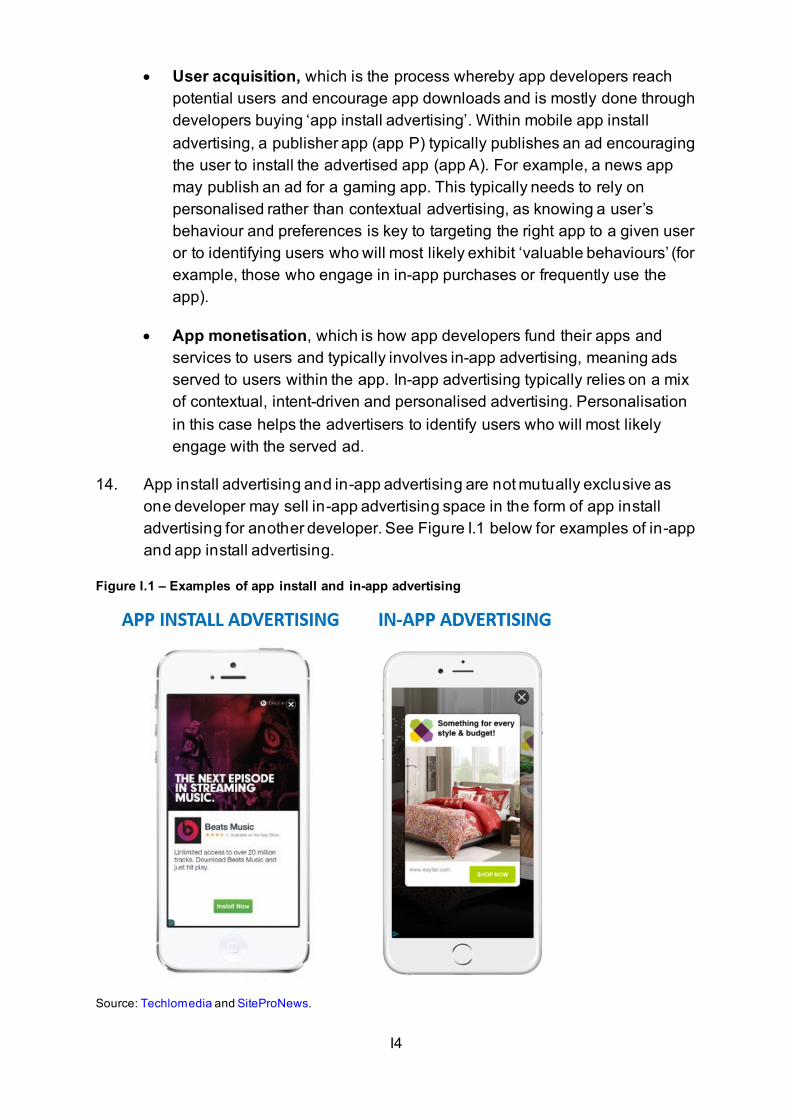
I4
• User acquisition, which is the process whereby app developers reach potential users and encourage app downloads and is mostly done through developers buying ‘app install advertising’. Within mobile app install advertising, a publisher app (app P) typically publishes an ad encouraging the user to install the advertised app (app A). For example, a news app may publish an ad for a gaming app. This typically needs to rely on personalised rather than contextual advertising, as knowing a user’s behaviour and preferences is key to targeting the right app to a given user or to identifying users who will most likely exhibit ‘valuable behaviours’ (for example, those who engage in in-app purchases or frequently use the app).
• App monetisation, which is how app developers fund their apps and services to users and typically involves in-app advertising, meaning ads served to users within the app. In-app advertising typically relies on a mix of contextual, intent-driven and personalised advertising. Personalisation in this case helps the advertisers to identify users who will most likely engage with the served ad.
14. App install advertising and in-app advertising are not mutually exclusive as one developer may sell in-app advertising space in the form of app install advertising for another developer. See Figure I.1 below for examples of in-app and app install advertising.
Figure I.1 – Examples of app install and in-app advertising
Source: Techlomedia and SiteProNews.
I5
15. On app stores, there are typically two broad types of ad placements, usually assigned to specific apps through a bid auction mechanism:
• Search ads, which are ads served in response to key words entered by a user to search for apps. For instance, Apple sells search ads that are served along with organic search results when users search in the App Store, as part of its Apple Search Ads (ASA) offering.
• Ads for ‘suggested’ or ‘featured’ apps, which are ads displayed on the search tab or on the app store home page before a user searches for any key words.
Mobile advertising sector
16. With the term ‘mobile advertising sector’ we refer to the collection of businesses which facilitate advertising on mobile devices. The sector is roughly divided into three sets of participants: publishers who want to sell advertising space, advertisers who want to buy that space, and a range of ad tech businesses in the middle, facilitating the process of buying and selling advertisements.
17. Advertisers often outsource the advertising process to mobile ad networks that develop and run the ad campaigns for them. They may also employ independent Mobile Measurement Partners (MMPs) to manage, analyse, and report on ad attribution data to ‘validate’ the work of the ad network (thus acting like a trusted and impartial referee).7 For example, Meta points its ad network users to MMPs that can provide independent performance metrics (including attribution) and aggregate measurements across several ad networks.8 In the case of app-install advertising, a third-party MMP will usually be responsible for tracking user conversions from seeing the ad to installing and using the advertised app.
18. On mobile devices this user-level tracking is largely facilitated by software development kits (SDKs). Third-party SDKs refer to third-party code that developers can choose to embed in their apps.9 As such, SDKs are packages of development tools which can be added to apps to enable specific functionality. For example, apps might embed analytics SDKs (eg Google Analytics) or user authentication SDKs (eg Facebook login). The mobile advertising sector depends on advertising and analytics SDKs to run ads within apps and to measure their performance.
7 AppsFlyer, MMP (Mobile measurement partner) | AppsFlyer mobile glossary. 8 Facebook for Developers, FAQ - Facebook App Ads. 9 CMA (2020), Online Platform and Digital Advertising Market Study, Final Report, Appendix G.
I6
19. The CMA found in its market study into online platforms and digital advertising that 85% of the most popular apps on the Google Play Store used SDKs provided by Google and 40% had Facebook SDKs.10 As Meta and Google have ad-based business models, their SDKs are largely focused on providing support to app developers for advertising and analytics.11 In this context, an SDK will track a user’s behaviour within the app where the SDK is installed.
20. To link user-level data between SDKs and across apps and to aggregate it as data related to the same user, mobile advertisers require some form of user-level identification.12 Typically, mobile advertisers use the mobile advertising identification number (MAID) which is unique to each mobile device. This is known as the ID for Advertisers (IDFA) on iOS, and Android Advertising ID (AdID) on Android.13
Personalised advertising on mobile devices
21. This section includes a description of both: (i) how personalised advertising worked before the introduction of the ATT policy by Apple; and (ii) what the IDFA is and what its main use cases are.
Ad targeting and attribution via the IDFA
22. Before the introduction of the ATT policy by Apple, it was by default possible for mobile advertisers (including app developers) on iOS to access the unique device identifier (IDFA) for each user. The IDFA could then be shared with advertising networks and used to match the same user across multiple apps. In this way, developers could combine information collected from apps owned by different companies and use it to target ads to users, to personalise them with that information and to measure their effectiveness by tracing what users who were shown those ads did afterwards.
23. The IDFA and AdID identifiers are used by advertisers to individually identify a user, follow their behaviour on the device and match the same user across multiple apps without using personal information such as their name, email address, or phone number to do so.
24. This appendix will focus on Apple iOS and the IDFA to understand the impact of Apple’s new privacy policy ATT on mobile advertising and, in particular, on app developers using mobile advertising for user acquisition and
10 CMA (2020), Online Platform and Digital Advertising Market Study, Final Report, Appendix F. 11 See Facebook Developer Docs | Facebook APIs, SDKs & Guides and Android Developers. 12 For clarity, the term advertisers here refers to those parties responsible for placing and measuring ad campaigns. This includes third-party intermediaries such as ad networks and MMPs. 13 This is also known as Google Advertising ID (GAID).
I7
monetisation. However, the overall description of the role of the IDFA will largely also apply to Android and AdID.
25. It could be argued that the IDFA has given mobile advertising an advantage over other digital advertising as it provides a more accurate identification of individual users than is technically possible on a desktop or laptop. Compared to mechanisms in use in desktop or laptop settings, the IDFA improves accuracy and efficiency for three key stages of mobile advertising: (i) user-level targeting; (ii) aggregating ‘events’, meaning user interactions generated by users across apps (ie ‘events attribution’); and (iii) linking a specific ad campaign with a resulting app install (ie ‘install attribution’).14
26. First, as with the wider digital advertising sector, mobile advertising uses behavioural targeting to target individual users with ads determined to be especially relevant to them based on their previous behaviours. These previous behaviours could be purchases on other apps, clicks on ads, etc. As mobile phones are predominantly used by a single person, the IDFA allows for accurate targeting of individual users.
27. Second, the IDFA allows advertisers to build a profile of a user based on their behaviour within and across different apps. This detailed behavioural profile can be used to improve the targeting of ads and measure their effectiveness. For example, when a user is shown an ad for app A in app P, the advertiser can access data collected by SDKs in those apps, use the IDFA to check that the data is from the same user, and follow the user’s journey from encountering the ad in app P, through installing and downloading app A and even observing how the user interacts with app A. The availability of the IDFA at every stage of the process allows the advertiser to accurately follow the behaviour of the user across a range of third-party apps.
28. A final key impact of the IDFA for advertisers is that it allows direct access to the data described above in real time. Within a matter of hours, the advertiser can target a user with a specific ad creative, which is the format of the ad served to users (eg images, videos, audio, etc), observe to what extent the user engages with the ad, and optimise and potentially re-deploy the ad to improve its efficacy. Such real-time optimisation of ad campaigns is only possible because advertisers, or the ad networks representing them, can combine data from a range of third-party sources with minimal time delay via the IDFA.
14 Mobile Dev Memo (2020), IDFA deprecation: winners and losers | Mobile Dev Memo by Eric Seufert.
I8
User controls regarding IDFA
29. Prior to the ATT’s introduction, and since 2012, iOS users who were aware and wanted to turn off ‘third-party tracking’, meaning advertisers accessing their IDFA, could do so by turning on ‘Limit Ad Tracking’ which sets the IDFA to a string of zeros (thus rendering it non-unique). This, in practice, turned off personalised advertising across all third-party apps. Before the introduction of ATT, users were by default opted into personalised advertising across all apps and had to go to the centralised iOS settings to opt out of allowing app developers to access their IDFA by turning on the ‘Limit Ad Tracking’ option. It has been reported that roughly 20% of iOS users could not be tracked using the IDFA because they had enabled Limit Ad Tracking.15
30. Google has announced that as part of the Google Play services update in late 2021, users could use a central setting to instruct apps not to use the AdID to build profiles or show personalised ads to them.16 In particular, in case a user opts out of interest-based advertising or ads personalisation, any attempts to access the AdID will receive a string of zeros instead of the identifier. This Google Play services phased rollout will affect apps starting in late 2021 and will expand to affect apps running on all devices that support Google Play in early 2022. Google has also said it will provide an alternative solution to support essential use cases such as analytics and fraud prevention.
31. Before this change Android users did not have an option to set the AdID to a string of zeros. Instead, Android let them reset their AdID to a new value, which remained unique.17 As a result, unless a user refreshed their AdID regularly, it could still be used to target ads at them and measure ad effectiveness.
Ad targeting and attribution via the IDFV
32. Apple provides each third-party company engaging in mobile advertising within iOS, namely a ‘vendor’, an Identifier for Vendor (IDFV). This can be used by the relevant vendor (or app developer), to monitor a user’s behaviour and activity across the apps owned by that same vendor.
33. Therefore, the IDFV is to data owned by the same corporate entity (first-party data) what the IDFA is to data collected across distinct apps and services owned by different companies (third-party data). Any developer operating multiple apps can use the IDFV to monitor the actions of a user across its own apps, combine information from these different apps and use it to serve
15 Adjust, What is an Apple IDFA? Why is the IDFA important? | Adjust. 16 Google, Advertising ID - Play Console Help (google.com). 17 CMA (2020), Online Platforms and Digital Advertising Market Study, Final Report, Appendix G.
I9
personalised ads to users and measure ads effectiveness. For example, Meta could do so across its family of apps, ie Facebook, Instagram, Messenger and WhatsApp.
Apple’s advertising
34. This section describes Apple’s advertising services, comprising of its search advertising services within the App Store, Apple Search Ads (ASA) and its display advertising services within Apple News and Stocks. It also discusses how Apple conducts its personalised advertising, including using its first-party data, and how this is served to Apple users.
Apple’s advertising services to third parties
35. As covered in Chapter 6, Apple’s advertising business generated 2020 revenues of approximately $[1.5-2] billion globally and $[150-200] million in the UK and is primarily made up of search ads that are served along with organic search results when users search in the App Store.18 Apple also offers display advertising in its News and Stocks apps, which typically takes the form of ads that appear around or within news articles or other content accessed through those apps.
Apple’s Search Ads
36. Apple Search Ads (ASA) allows advertisers to promote their apps directly within the App Store via placement on either the search tab or at the top of search results.19 The ASA service is offered exclusively to developers of apps distributing via the App Store.
37. Apple makes use of its users’ personal data for targeting its search ads. Apple told us that its ASA offering does not engage in micro-targeting of users, but instead relies on a ‘privacy-by-design’ solution that only uses a limited number of first-party data points to group users into segments of at least 5,000 users and display ads to them in the App Store. Advertisements may then be displayed based on these segments, to protect against an advertiser's ability to target or identify an individual user.
38. To assign users to segments, Apple said it uses random, scoped identifiers, and leverages an ‘on-device protocol’ that is designed to prevent any ‘server-
18 [over 90%] of Apple’s advertising revenue in the UK and worldwide came from search ads. 19 Apple’s website, Apple Search Ads.
I10
side link’ between the identity of a user and the random, scoped identifiers.20 Apple told us that this is done in a manner that is not visible to Apple and is protected by end-to-end encryption technology. Apple said it does not know what ads an individual consumer receives.
39. To group users into segments, Apple uses data such as account information (eg birth year, gender, location), app and content downloads and purchases (eg from Apple Music, Apple TV, Apple Books and App Store’s app categories) and the types of news stories they read on Apple News. Apple told us that ads on the App Store do not access consumer data from other Apple services like Apple Pay, Maps, Siri, iMessage, and iCloud or data from devices through services and functions such as the Health app, HomeKit, email, contacts, or call history.
40. Apple also said a number of its apps implement ‘differential privacy’,21 a technique that protects personal privacy while allowing Apple to gain insight into user behaviour at an aggregate level. Via differential privacy, Apple told us that Apple apps remove device identifiers before the data leaves the user’s device encrypted. In a second step the anonymized data for different users is collected, metadata removed and characteristics permuted among the different users to make it impossible for Apple to track individuals. This anonymised data is then used to compute summary statistics, and only those statistics are shared with Apple teams to preserve user privacy.
41. For campaigns run through ASA, advertisers can use the Apple Ads Attribution API22 which allows advertisers purchasing search advertising from Apple to measure the number of app installs for the App Store and attribute them to specific Search Ads campaigns.23 The Apple Ads Attribution API includes granular install attribution data that is not available through attribution tools for campaigns happening outside the App Store on iOS such as SKAdNetwork API (SKAN). This is discussed in further detail below.
Apple’s display advertising
42. Apple also offers display advertising services on Apple News and Stock, albeit these account for a much smaller share of Apple’s advertising revenue. Ads
20 We understand this to mean that the assignment of a user to a targeting segment is done on a user’s device, so that more granular identifiers, that could potentially be linked to the identity of a user, are not shared with an Apple server. 21 Differential privacy is a ‘security definition which means that, when a statistic is released, it should not give much more information about a particular individual than if that individual had not been included in the dataset. The differential privacy definition allows one to reason about how much privacy is lost over multiple queries.’ See Royal Society (2019) Protecting privacy in practice: the current use, development and limits of Privacy Enhancing Technologies in data analysis. 22 Apple Ads Attribution API was introduced with iOS 14.3 and supersedes Apple Search Ads Attribution API. 23 Apple’s website, Attribution API - Help - Apple Search Ads.
I11
on these Apple apps come in different forms including display ads or banners, video, and ‘native ads’ (namely ads that match the appearance of the media in which they are displayed, such as ads looking like news articles).
43. Apple’s advertising platform can be used to place ads on Apple’s first-party News and Stocks apps. To personalise such ads, Apple uses a range of user information such as the types of contents people consume on News and Stocks, App Store activity, Apple account information, and device location, provided the ‘Location Services’ setting is enabled and the user has granted permission to the App Store or Apple News apps to access their location.24 Apple also uses the music, movies, books, TV shows and apps a user downloads, as well as any in-app purchases and subscriptions. However, Apple says it does not allow targeting based on downloads of a specific app or purchases within a specific app (including subscriptions) from the App Store, unless the targeting is done by that app’s developer.25
44. Since September 2021, Apple controls users’ opt-in to Apple’s own personalised advertising services via the Apple’s Personalised Ads prompt.26 Prior to this, Apple’s ad personalisation was enabled by default and a user had to navigate the device Privacy Settings to disable it. We analyse Apple’s Personalised Ads prompt and how it compares with the ATT prompt from a choice architecture point of view in the final section of this appendix.
45. The effectiveness of app install ads running on Apple News and Stocks can be measured using Apple Ads Attribution API.27
Apple’s definition of tracking
46. This section covers Apple’s definition of ‘tracking’ and its approach to personalised advertising within Apple-owned apps, including the App Store.
47. Apple defines tracking as ‘the act of linking user or device data collected from your app with user or device data collected from other companies’ apps, websites, or offline properties for targeted advertising or advertising measurement purposes. Tracking also refers to sharing user or device data with data brokers.’28 As mentioned in Chapter 6, Apple’s definition distinguishes between collection of data within first-party and third-party properties, with these distinctions seemingly based on corporate ownership of the data or the property where the data comes from. A recent opinion
24 Apple’s website, Legal - Apple Advertising & Privacy - Apple. 25 Apple’s website, Legal - Apple Advertising & Privacy - Apple. 26 Benjamin Mayo, iOS 15 now prompts users if they want to enable Apple personalized ads, after it was previously on by default - 9to5Mac. 27 Apple’s website, AdServices | Apple Developer Documentation. 28 Apple’s website, User Privacy and Data Use - App Store - Apple Developer.
I12
published by the UK Information Commissioner, on the other hand, confirmed that ‘data protection law does not inherently favour the concept of a first party over that of a third party within the meanings web standards bodies or data categorisations given to those terms.’29
48. Consistent with its definition of tracking, Apple told us that it does not:
• engage in ‘tracking’ – ie it does not link user or device data collected from one developer with user or device data collected from other companies’ apps, websites, or offline properties – for targeted advertising or advertising measurement purposes;
• use the IDFA for targeting and measurement purposes;
• buy consumers’ personal data from, or share its consumers’ personal data with, other companies; or
• share its user or device data with data brokers.
49. As mentioned above, Apple does, however, use its first-party data from across multiple Apple apps for advertising purposes. For instance, Apple processes a user’s App Store purchase history, together with other demographics, to personalise App Store Search Ads and advertising displayed in the News and Stocks apps.30 Apple told us that, like Apple, every other developer may use first-party data across their properties to provide personalised ads through their apps and, indeed, Apple provides the IDFV to developers to facilitate this.
50. In Chapter 6 we cover Apple’s definition of ‘tracking’ and the extent to which it may favour certain providers over others.
Changes introduced by ATT
51. ATT is Apple’s new privacy policy enforced on iOS 14.5 in April 2021. The ATT framework requires apps to show a specific prompt (the ATT prompt) to request users’ permission for the app to ‘track’ them, meaning to access app-related data, including the IDFA, to follow a user’s activity across apps and websites owned by other companies.31 As a result, a user on version iOS 14.5 or higher can no longer be served personalised ads in one app based on their behaviour in another unrelated app until they have explicitly opted in to ‘tracking’ for both apps.
29 ICO (2021), Data protection and privacy expectations for online advertising proposals. 30 Apple’s website, Legal - Apple Advertising & Privacy - Apple. 31 Apple’s website, App Tracking Transparency | Apple Developer Documentation.
I13
52. From a technical perspective, without consumers opting into this prompt, developers cannot access their IDFA which as noted above is typically used to monitor users’ activity across apps. Apple’s App Review Guidelines also state that app developers should not engage in any other form of 'tracking’ if users do not opt in when shown the ATT prompt.32 As further detailed below, users can also opt-out of being shown ATT prompts centrally, by disabling ‘Allow Apps to Request to Track’ in the device privacy settings to stop developers from surfacing the ATT prompt.
53. Apple has provided a replacement for IDFA-based attribution and measurement in the form of SKAdNetwork API, a free tool Apple makes available to developers and ad networks. We describe SKAdNetwork and how it compares to Apple Ads Attribution API in more detail below.
Apple’s stated rationale for ATT
54. Apple told us that ‘the goal of ATT is to empower consumers by giving them greater transparency and ability to control the sharing of their own data. When a user is tracked, her data very often ends up in the hands of other companies without the user knowing. Apple believes users should be aware of this practice and should be able to choose whether their data is used and shared in this manner.’
55. According to Apple, ATT strengthens this ability by giving users the choice, on a developer-by-developer basis, of whether to allow developers to ‘track’ them across other companies’ apps, websites or offline properties using users’ IDFA. Apple also mentioned several stakeholders, including consumer protection associations and privacy advocates, which welcomed ATT as a positive development for the industry. For instance, Apple submitted that:
• Amnesty International, Human Rights Watch and the Electronic Frontier Foundation openly supported and advocated for the ATT changes;
• Privacy International and The Center for Democracy and Technology respectively described the change as helping people ‘assert control over the invisible leakage of their data’ and ‘rebalance the ecosystem’; and
• Mozilla ‘applauded’ Apple’s decision and publicly campaigned to discourage delay of ATT implementation.
56. We share the view of the ICO that developments that empower individuals and enable them to have meaningful control over the use of their personal
32 App Store Review Guidelines, 5.1.2 (i)-(iii).
I14
data can bring about positive change, both for consumers and competition more broadly. ATT has clearly introduced a greater degree of choice and control to users than they were afforded previously over whether and how their personal data is used for personalised advertising. To this extent we consider that ATT will have some benefits to consumers with regard to their privacy.
Apple’s enforcement of ATT
57. Apple told us that there are two primary methods of enforcement of the ATT framework. First, if a developer has not received permission from the user through the ATT prompt to enable third-party tracking, then the developer will not receive the IDFA if they request it. Second, developers must adhere to Apple’s App Store Review Guidelines, as they participate in Apple’s App Review process. The app must always respect the user’s response to the ATT prompt under Guideline 5.1.1(iv), which states: ‘Apps must respect the user’s permission settings and not attempt to manipulate, trick, or force people to consent to unnecessary data access.’ In other words, developers cannot afford to attempt to go around the users’ preference, as apps or app updates that do not adhere to the Guidelines can be rejected from the App Store.
58. It has been reported that it may be difficult for Apple to fully enforce this policy. In particular, we understand that there are no obvious technical means for Apple to know what data ad tech companies use (apart from the IDFA that it does not provide), whether they might be doing ‘fingerprinting’,33 and what new technical workarounds they might find in the absence of IDFA.34 Indeed, a study by privacy software developer Lockdown found evidence of a number of apps that seemed to continue to engage in third-party tracking when users opted out from the ATT prompt.35
59. Apple told us that developers must embed their custom messaging on ATT, as well as the purpose string in the ATT prompt, in the binary that they submit to App Review (typically during initial app submission and subsequent app updates). With respect to whether a developer could be tracking a user even though the user has asked the developer not to track them, Apple said that developers are responsible for ensuring they comply with the user’s choices.
33 Fingerprinting refers to a process that advertisers may use to gather information about users who have interacted with their ads to identify their unique device. It works by combining certain publicly available attributes of a user’s device, location, and more to create a unique identifier or ‘fingerprint’ of their device. The attributes that are collected to identify a user’s device may include their computer or mobile hardware, operating system, IP address, web browser, and more. See What is fingerprinting? 34 The New York Times (2021), To Be Tracked or Not? Apple Is Now Giving Us the Choice. - The New York Times (nytimes.com). 35 The Washington Post (2021), iPhone apps can track you even after you tell them not to - The Washington Post.
I15
Apple said that it is also possible that violations may come to App Review’s attention, such as complaints by other developers, by users, by privacy advocates, etc.
60. We note that, as mentioned above, under ATT, developers will be able to continue following users across their own first-party apps, as apps from the same company can still share information about the user via Apple’s Identifier for Vendors (IDFV).
Actual opt-in rates
61. Given the recent introduction of the ATT prompt and the potentially different methodologies to calculate opt-in rates, we have received a relatively wide range of estimates for opt-in rates from Apple, ad networks and app developers. Most of the estimates we received were based on an only partial adoption of iOS 14.5 where ATT prompt was rolled out and therefore might not be representative of longer-term rates.
62. Apple told us that it does not have user level opt-in data due to privacy protections. Based on Apple’s internal assessment conducted at the prompt-level [] [a significant number] of the ATT prompts displayed were accepted by users to allow third-party tracking, based on data from users who opt in to share analytics data with Apple. Given this estimate is based on users who have already opted into sharing analytics data with Apple, meaning users who have shown they are willing to share data with Apple, we consider that the estimate may overestimate the actual opt-in rate across all users.36
63. Early estimates of opt-in rates we received from app developers are fairly varied, with several ranging around 20-30%. For instance:
• [It has been estimated in response to CMA questions] that approximately 20% of iOS users in the UK that have updated their devices to iOS 14.5 have chosen to allow third-party tracking under the ATT framework. Based on an internal assessment submitted in response to CMA questions, opt in rates vary by region and app publisher’s app category (eg with disallowed being higher for Fitness than for Shopping apps).
36 Consistent with this, Apple told us that data from an opt-in population may be 'subject to substantial selection effects' (with those most likely to be comfortable and frequent users of Apple’s products and services being the most likely to opt-in to the data collection) which 'render it unsuitable as a dataset from which to draw any conclusions regarding aggregate population usage’, and when asked Apple agreed that its ATT opt-in estimates may also be subject to similar biases.
I16
• Meta told us that the opt-in rate of users of iOS 14.5 or above versions on the apps of the Meta family that showed the ATT prompt was [],37 a [] decline from opt-out figures pre-ATT (ie using Apple's ‘Limit Ad Tracking’ feature). Meta told us that for it to be able to share data to enable ads personalisation and measurement, users need to opt in on eg both the Facebook app and any third-party app which advertises on the Facebook app. As a result, the actual percentage of consumers who have opted-in twice could be even lower.
• [An app developer] told us that the opt-in rate for ATT on its app is 27%.
• [Another app developer] told us it assumed opt-in between 10% and 30%.
• McDonald’s told us it has seen opt-in rates between 20–30% globally.
• Duolingo told us that as of the date they submitted information to us (September 6, 2021) approximately 34% of users who are shown the ATT permission prompt choose to ‘Allow Tracking’ and that approximately 30% of users are not eligible to be prompted by the ATT framework, as they have already disabled third-party tracking in their system settings.
• [One developer] provided a third-party assessment of the ATT implementation which assumed an opt-in rate of approximately 14% coming from multiplying the opt-in rate in benchmark apps (around 33%) and opt-in rate in ad platforms (around 42%) given that attribution requires the user to opt in on both the publisher and the advertiser side.
• A preliminary analysis of [one app developer]'s brands currently suggests that the consent/opt-in rates for ATT are between 25-30%.
64. Others provided very low early figures. For instance:
• [One developer] told us that early testing indicated an opt-in range under 5%; and
• Microsoft told us that it is not yet certain of the impact of ATT changes but that data it has reviewed so far indicates that ‘the vast majority of users’ of its apps have denied permission.
65. We note that public estimates of opt-in rates are also varied. For instance, estimates from AppsFlyer suggest that, as of 23rd November 2021, 46% of users globally who have seen the ATT prompt opted in.38 Differently,
37 According to Meta, this figure is lower compared to the actual number of users of iOS 14.5 or above versions who were shown the prompt on Meta apps and opted in [] due to a []. 38 See iOS 14 & ATT benchmarks [Report] | AppsFlyer. Based on 80% iOS 14.5 user adoption rate.
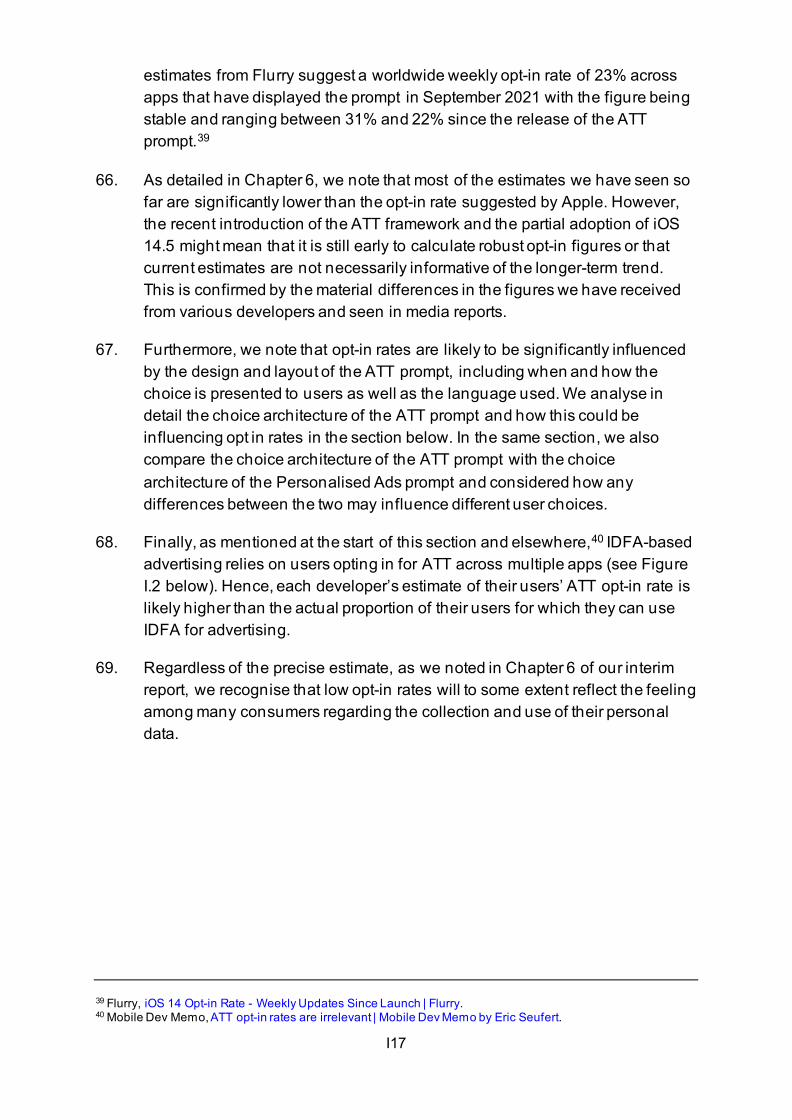
I17
estimates from Flurry suggest a worldwide weekly opt-in rate of 23% across apps that have displayed the prompt in September 2021 with the figure being stable and ranging between 31% and 22% since the release of the ATT prompt.39
66. As detailed in Chapter 6, we note that most of the estimates we have seen so far are significantly lower than the opt-in rate suggested by Apple. However, the recent introduction of the ATT framework and the partial adoption of iOS 14.5 might mean that it is still early to calculate robust opt-in figures or that current estimates are not necessarily informative of the longer-term trend. This is confirmed by the material differences in the figures we have received from various developers and seen in media reports.
67. Furthermore, we note that opt-in rates are likely to be significantly influenced by the design and layout of the ATT prompt, including when and how the choice is presented to users as well as the language used. We analyse in detail the choice architecture of the ATT prompt and how this could be influencing opt in rates in the section below. In the same section, we also compare the choice architecture of the ATT prompt with the choice architecture of the Personalised Ads prompt and considered how any differences between the two may influence different user choices.
68. Finally, as mentioned at the start of this section and elsewhere,40 IDFA-based advertising relies on users opting in for ATT across multiple apps (see Figure I.2 below). Hence, each developer’s estimate of their users’ ATT opt-in rate is likely higher than the actual proportion of their users for which they can use IDFA for advertising.
69. Regardless of the precise estimate, as we noted in Chapter 6 of our interim report, we recognise that low opt-in rates will to some extent reflect the feeling among many consumers regarding the collection and use of their personal data.
39 Flurry, iOS 14 Opt-in Rate - Weekly Updates Since Launch | Flurry. 40 Mobile Dev Memo, ATT opt-in rates are irrelevant | Mobile Dev Memo by Eric Seufert.
I18
Figure I.2: IDFA-based advertising relies on users opting in for ATT across apps
Source: ATT opt-in rates are irrelevant.
Impact of ATT mobile advertising and app developers
70. The ATT framework is likely to impact app developers engaging in mobile advertising in two main ways:
• by undermining developers’ ability to acquire users through buying app install advertising; and
• by undermining developers’ ability to monetise their app through selling in-app advertising.
71. In particular, by restricting developers’ ability to personalise ads for both app install advertising and in-app advertising, ATT makes both user acquisition and monetisation less effective.
72. Moreover, ATT also disrupts attribution, which further reinforces the two impacts above.
Impact on app install advertising
73. As explained above, app install advertising is used by app developers as a way to acquire users for their apps.
74. No access to the IDFA means companies cannot rely on IDFA-based industry standards for mobile advertising, both in terms of personalising advertising and measuring its effectiveness via attribution.
75. Without the IDFA, app install advertising has less information on the user to perform ad targeting as it cannot follow users and their activity across apps,
I19
websites and offline properties. This means that app install advertising cannot, beyond a developer’s first-party apps and properties, identify users who are likely to show ‘valuable behaviours’ such as engaging in in-app purchases, using the app a lot, etc. This limitation on ad targeting of ‘valuable users’ thus translates into less effective and remunerative user acquisition.
76. Meta told us that for advertisers the costs per impression (CPMs)41 for users on iOS 14.5+ were on average []% higher than CPMs for users on iOS 14.4 or below (pre-ATT). When considering CPMs for app install campaigns alone, the increase reaches []%. This illustrates that ATT particularly impacted app install advertising, and that developers have had to pay higher costs to advertise their apps.
Impact on in-app advertising
77. In-app advertising is similarly impacted if the IDFA cannot be used.
78. As with app install advertising, the impact concerns both targeting and attribution. Similar to the mechanism outlined above, no access to the IDFA means that ad network operators cannot follow users and their activity across apps, websites and offline properties and therefore have less information on the user that they can use to personalise advertising.
79. This means that app developers monetising via in-app advertising cannot use information gathered across third parties’ properties to refine the ad personalisation and can only rely on consumers’ activity in their own properties for this. This is particularly problematic for small developers with a limited or niche audience. As a result, developers monetising via in-app advertising generate lower revenue from advertising, which might push them to consider alternative monetisation models.
Impact on attribution
80. As mentioned above, attribution is needed for measuring the effectiveness of an ad and thus for developers to efficiently allocate budget to both app install advertising and in-app advertising. In particular, without the IDFA, ad network operators can no longer attribute conversion events to a specific ad. This in turn means that advertisers cannot accurately measure the performance of their ad campaigns and ad formats, nor optimise their budgets against their expected returns.
41 Cost per impression, often abbreviated as CPMs standing for cost per mille, corresponds to the cost incurred by an advertiser for a thousand ad views.
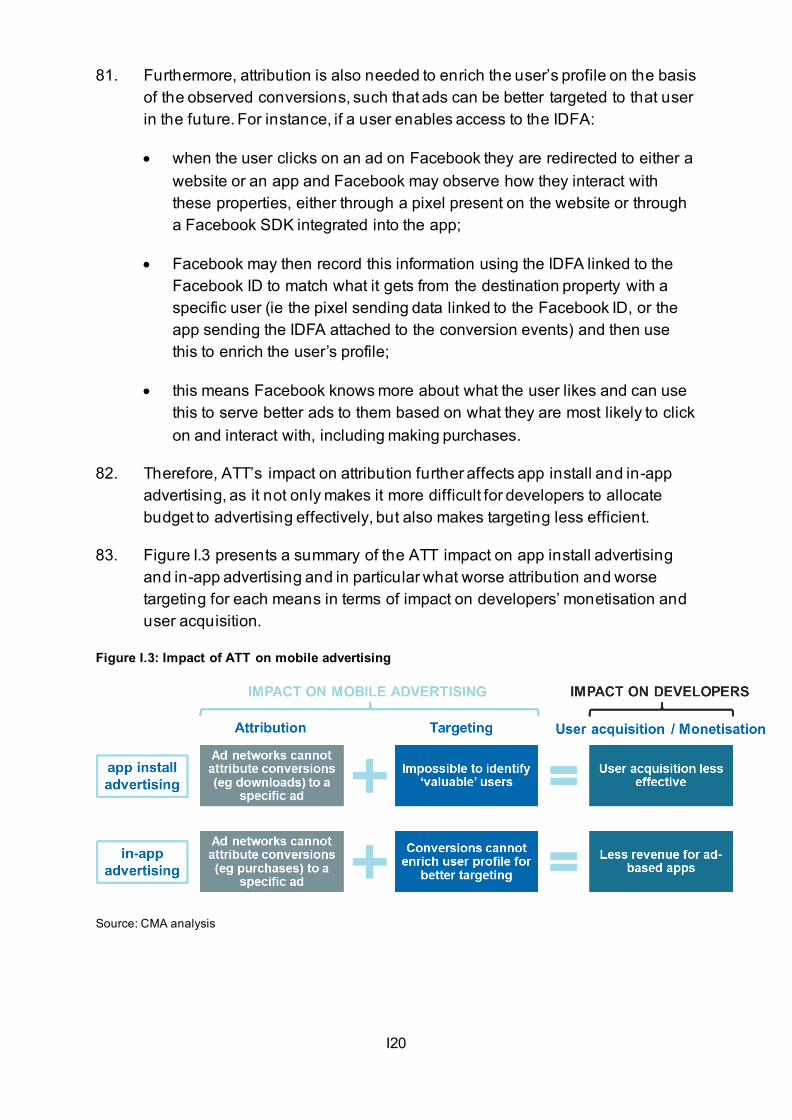
I20
81. Furthermore, attribution is also needed to enrich the user’s profile on the basis of the observed conversions, such that ads can be better targeted to that user in the future. For instance, if a user enables access to the IDFA:
• when the user clicks on an ad on Facebook they are redirected to either a website or an app and Facebook may observe how they interact with these properties, either through a pixel present on the website or through a Facebook SDK integrated into the app;
• Facebook may then record this information using the IDFA linked to the Facebook ID to match what it gets from the destination property with a specific user (ie the pixel sending data linked to the Facebook ID, or the app sending the IDFA attached to the conversion events) and then use this to enrich the user’s profile;
• this means Facebook knows more about what the user likes and can use this to serve better ads to them based on what they are most likely to click on and interact with, including making purchases.
82. Therefore, ATT’s impact on attribution further affects app install and in-app advertising, as it not only makes it more difficult for developers to allocate budget to advertising effectively, but also makes targeting less efficient.
83. Figure I.3 presents a summary of the ATT impact on app install advertising and in-app advertising and in particular what worse attribution and worse targeting for each means in terms of impact on developers’ monetisation and user acquisition.
Figure I.3: Impact of ATT on mobile advertising
Source: CMA analysis
I21
Impact on ad networks (Facebook’s example)
84. The major ad platforms are ‘self-attributing networks’ (SANs), meaning networks that own the inventory they sell so can attribute their traffic themselves without third-party mobile measurement partner. Meta, Twitter, Snapchat, and YouTube are examples of SANs.
85. After the introduction of ATT, ad networks are restrained in their ability to offer effective personalised ad serving or meaningful campaign analytics to developers and advertisers on iOS devices (see Box I.1: Example of Meta Audience Network below).42 For instance, Meta submitted that ad tech service providers will no longer be able to:
• rely on activity data to build consumer profiles to improve ad personalisation;
• produce analytics and machine learning models to help advertisers improve their ad campaigns; and
• provide effective ad attribution and report to advertisers on conversion rates.
86. Meta also told us that, while advertisers used to pass conversion events to their technological partners through the partner’s SDK for all users, it is now possible only for users that have been shown the ATT prompt and have opted in.
87. The impact of ATT on Meta Audience Network is described in Box I.1 below. Meta has been serving the ATT prompt to its users on its family of apps.
42 Stratechery,
I22
Alternatives to IDFA for attribution and measurement on iOS: SKAdNetwork
88. Without users opting into allowing developers to use their IDFA to link information on their activity across apps and websites, developers can only use their own first-party data and contextual information to perform ad targeting and personalisation. Apple does not provide them with alternative ways of doing so. However, as mentioned above, Apple has provided a replacement for IDFA-based attribution and measurement in the form of
Box I.1 – Impact of ATT on Meta Audience Network (MAN)
When Facebook (now Meta) initially entered the mobile advertising sector it was a leading publisher app. Because of its user reach it was an ideal place for advertisers to place their ads and Meta leveraged the large amount of behavioural data it held on users to provide cutting edge user-level targeting. To grow the amount of ad inventory it could publish ads on, Meta developed into a quasi-ad network by introducing Facebook Audience Network (now Meta Audience Network, MAN), which enables advertisers to extend their Facebook ad campaigns to third-party apps and websites.[1] MAN is a specific type of ad network called a Demand Side Platform (DSP) as it allows advertisers to buy ad inventory from a range of publishers.
MAN is supported by Facebook’s SDKs, which we have seen are found in around 40% of Android apps. [2] These in-app SDKs allow Meta to place ads on third-party apps which it does not own as well as to track user behaviour on those apps more generally. Using the IDFA to identify a unique user, Meta could build a profile of the user across all apps containing a Facebook SDK. This meant that, pre-ATT, Meta could follow a user who clicked on an ad on Facebook, Instagram, or any third-party MAN participating app, then directly see how they behaved on the advertised app or website.
ATT breaks that event stream data by preventing Meta from tracking third-party events unless the user has opted in to tracking for both Facebook and the third-party app.
Meta can still track opted-out users across its own first-party apps (including the main Facebook app, Instagram, WhatsApp, and Facebook Messenger) however it will not have access to the IDFA to facilitate such tracking, but only to the IDFV. Commentators have pointed out that if ad-driven platforms like Facebook cannot track how people interact with other apps, they would work to keep people on their apps as much as possible, especially for activities like shopping, and ensure remunerative interactions happen on their platform.[3] [4]
[1] Business Insider, What Is Facebook Audience Network and Why Does It Matter (businessinsider.com) [2] CMA (2020), Appendix F, Online Platforms and Digital Advertising Market Study. [3] PayPal + Pinterest would create a formidable Content Fortress | Mobile Dev Memo by Eric Seufert. [4] The Verge, Super apps are coming, and they’ll never let you go - The Verge.
I23
SKAdNetwork (SKAN),43 a free tool Apple makes available to developers and ad networks.
89. A very first version of SKAN (1.0) with limited functionality was introduced in March 2018 as a privacy-enhancing API for the measurement of mobile ad campaigns for iOS apps.44 Apple told us that SKAN APIs hold advertising data on-device separate from apps, allowing advertising conversion measurement to be reported without users being tracked. Indeed, SKAN API only sends limited data on app installations and ad conversions to the ad network attributed to an ad campaign.
90. At the time SKAN was first introduced, and even when SKAN 2.0 was released in September 2020, there was limited incentive for its use over other third-party attribution systems, such as those using Google or Meta SDKs. However, given the limitation introduced by the ATT rollout to third-party attribution systems, more market participants are now using SKAN.
91. Adoption of new SKAN versions is becoming an increasingly important factor as Apple has been adding more and more features in each new release.45,46 Indeed, Apple told us that it has heard various external feedback from developers and ad players on SKAN APIs and has responded to such feedback introducing major advancements for SKAN. These include:
• View-through attribution, which allows the distinction between view-through impressions and click-through impressions, meaning respectively impressions which are only viewed by a user and impressions on which the user actually clicks; This is only supported starting from version 2.2, while version 3.0 also supports multi-touch attribution47 (versions respectively used by 27% and 14% of networks and publishers implementing SKAN as of September 2021).48
• Private Click Measurement, an iOS feature separate from SKAN which allows ad networks to measure the effectiveness of advertisement clicks within iOS or iPadOS apps that navigate to a website.49
• Multiple postbacks, which are the signals coming from an advertiser telling an ad network and developer whether a conversion was
43 The ‘SK’ refers to StoreKit, a set of developer tools to support in-app purchases and interactions with Apple’s App Store. 44 Dataseat, The Evolution of SKAdNetwork – Dataseat Ltd. 45 AppsFlyer, iOS 14 & ATT benchmarks [Report] | AppsFlyer. 46 Dataseat, The Evolution of SKAdNetwork – Dataseat Ltd. 47 Multi-touch attribution involves monitoring multiple touchpoints (as opposed to eg the last click) in a user’s journey to a conversion, with a view to characterising which touchpoint was determinant in leading to the conversion. 48 AppsFlyer, iOS 14 & ATT benchmarks [Report] | AppsFlyer. 49 GitHub, privacycg/private-click-measurement: Private Click Measurement (github.com).
I24
successful. Postbacks can now be sent to up to six ad networks (a ‘winning’ network and five unsuccessful ones).
• Starting from iOS 15, developers of advertised apps can opt-in to get copies of the winning postbacks that represent successful ad conversions for their app.50
92. To use SKAN, the advertised app, ad network, and publisher app must all be registered with Apple.51 SKAN provides campaign-level data. When an app is installed and opened for the first time (if this happens within 60 days of installation) SKAN sends the ad network information in the form of an ‘install postback’:
• This includes data on the source of the app install (eg the ID of the publisher app),52 the associated ad campaign, the IDFA on opted-in users, and some limited information about how the user interacted with the app the first time they opened it (ie one specific action captured as a single ‘conversion value’).53
• The postback does not include any personal data, user-level attribution data, or any post-install metrics on how a user engages with the app after the first time they opened it. It also does not contain ad creative54 IDs, which forces ad networks to use different campaign IDs instead, if they want to measure the impact of ad format (within a limit of 100 campaigns per app per ad network).55
93. SKAN does not support web attribution (ie attribution to an ad displayed on the web), although it was reported nearly 10% of app installs are preceded by a visit to a brand’s website.56 However, as mentioned above, Apple introduced Private Click Measurement as a means to address app-to-web and web-to-web traffic.57
94. SKAN has different timeframe settings compared to pre-ATT measurement tools. In particular, with third-party attribution systems using IDFAs and SDKs,
50 Apple referred to some stakeholders praising particularly this last advancement. 51 Apple, Registering an Ad Network | Apple Developer Documentation. 52 It has been reported that this App ID makes it possible to determine which app categories (eg gaming) advertises most and with what kind of publishers. See Inside SKAN: SKAdNetwork insights [Guide] | AppsFlyer. 53 AppsFlyer, What is SKAdNetwork? | AppsFlyer mobile glossary. 54 The creative is the format of the ad served to users on a webpage, app, or other digital environment. It can be images, videos, audio, etc. 55 Stratechery, An Interview with Eric Seufert about the Impact of ATT – Stratechery by Ben Thompson. 56 AppsFlyer, iOS 14, winds of 2020 and the web comeback | AppsFlyer. 57 For app-to-web and web-to-web campaigns Apple has introduced Private Click Measurement (PCM) for attribution and tracking. PCM mirrors SKAN in that it aims to replace pre-ATT real-time user-level tracking with more limited and time-delayed attribution data. PCM does not just apply to advertising but also covers any form of tracking and click attribution between websites. (for more detail, see Introducing Private Click Measurement, PCM | WebKit).
I25
an ad network could determine what maximum period of time between an ad view and app install counted as a conversion. By contrast, SKAN sets fixed time limits on what is considered a conversion based on the time between the user interacting with an ad, installing the app, and opening the app for the first time. The time limits depend on the level of interaction with the ad:58
• If a user views the ad for a minimum of 3 seconds it is considered a ‘view through ad’. If the user then installs the app within 24 hours of seeing the view through ad, and also opens the app within 60 days, an install validation postback is sent to the ad network.
• Alternatively, if the user clicks on the ad through to the App Store it is considered a ‘StoreKit rendered ad’. If the user then installs the app within 30 days and also opens it within 60 days, a postback is sent to the ad network.
• In all other scenarios, such as if a user downloads an app 25 hours after viewing an ad displayed in another app, and then opens the advertised app, no install validation data is ever sent to the ad network.
95. In addition, with SKAN, the install validation postback is not sent in real-time, as it was possible pre-ATT, but between 24 to 48 hours after the app is opened.59 It has been reported that this delay makes it difficult to understand if an ad is performing well or not.60
Evidence from market participants on SKAdNetwork
96. As mentioned in Chapter 6, we have heard concerns from app developers, ad networks and industry commentators that SKAdNetwork is an inferior alternative – with regards to attribution effectiveness – not only to IDFA-based attribution and measurement but also to the Apple Search Ads Attribution API Apple makes available to users of its own advertising services. This is because it gives developers less granular data and sends them information on conversions with a delay. These concerns are summarised below, and key differences in output from the two APIs are summarised in Table I.1.
58 Apple, Receiving Ad Attributions and Postbacks | Apple Developer Documentation. 59 Apple, Receiving Ad Attributions and Postbacks | Apple Developer Documentation. 60 Stratechery,
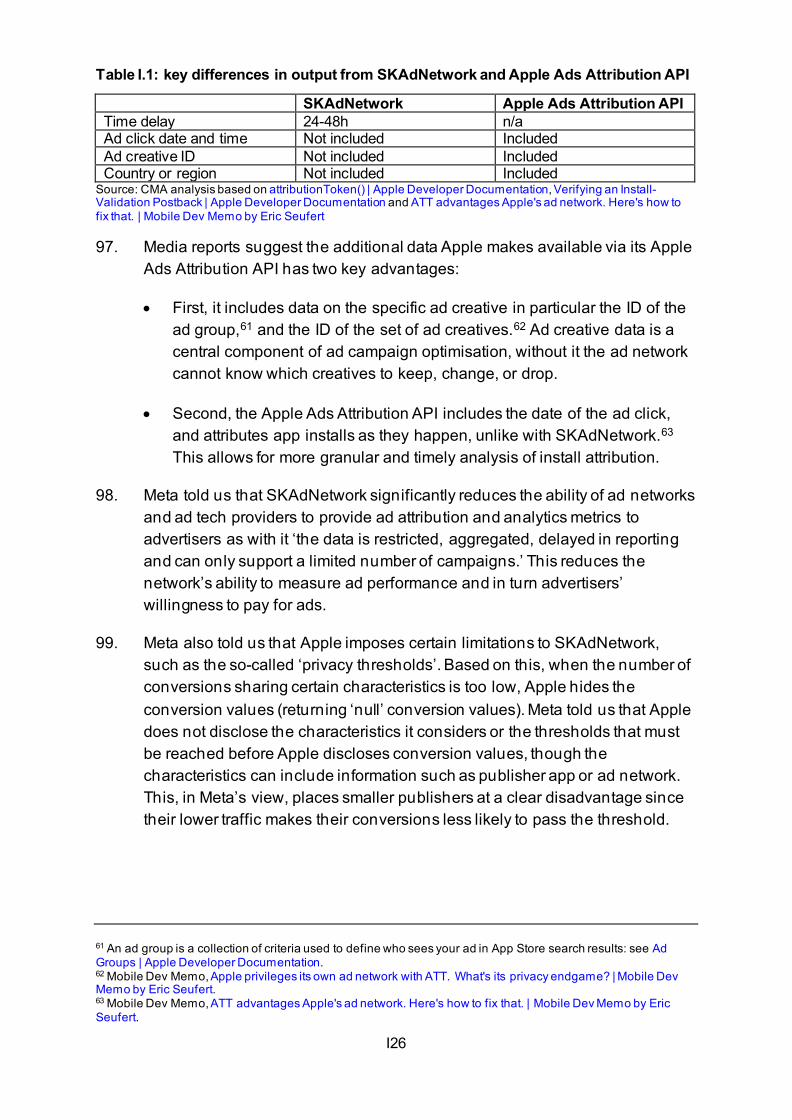
I26
Table I.1: key differences in output from SKAdNetwork and Apple Ads Attribution API
SKAdNetwork Apple Ads Attribution API Time delay 24-48h n/a Ad click date and time Not included Included Ad creative ID Not included Included Country or region Not included Included
Source: CMA analysis based on attributionToken() | Apple Developer Documentation, Verifying an Install-Validation Postback | Apple Developer Documentation and ATT advantages Apple's ad network. Here's how to fix that. | Mobile Dev Memo by Eric Seufert 97. Media reports suggest the additional data Apple makes available via its Apple
Ads Attribution API has two key advantages:
• First, it includes data on the specific ad creative in particular the ID of the ad group,61 and the ID of the set of ad creatives.62 Ad creative data is a central component of ad campaign optimisation, without it the ad network cannot know which creatives to keep, change, or drop.
• Second, the Apple Ads Attribution API includes the date of the ad click, and attributes app installs as they happen, unlike with SKAdNetwork.63 This allows for more granular and timely analysis of install attribution.
98. Meta told us that SKAdNetwork significantly reduces the ability of ad networks and ad tech providers to provide ad attribution and analytics metrics to advertisers as with it ‘the data is restricted, aggregated, delayed in reporting and can only support a limited number of campaigns.’ This reduces the network’s ability to measure ad performance and in turn advertisers’ willingness to pay for ads.
99. Meta also told us that Apple imposes certain limitations to SKAdNetwork, such as the so-called ‘privacy thresholds’. Based on this, when the number of conversions sharing certain characteristics is too low, Apple hides the conversion values (returning ‘null’ conversion values). Meta told us that Apple does not disclose the characteristics it considers or the thresholds that must be reached before Apple discloses conversion values, though the characteristics can include information such as publisher app or ad network. This, in Meta’s view, places smaller publishers at a clear disadvantage since their lower traffic makes their conversions less likely to pass the threshold.
61 An ad group is a collection of criteria used to define who sees your ad in App Store search results: see Ad Groups | Apple Developer Documentation. 62 Mobile Dev Memo, Apple privileges its own ad network with ATT. What's its privacy endgame? | Mobile Dev Memo by Eric Seufert. 63 Mobile Dev Memo, ATT advantages Apple's ad network. Here's how to fix that. | Mobile Dev Memo by Eric Seufert.
I27
100. It has been reported that changes implemented by Apple mean the share of null can increase suddenly (and differently depending on SKAN versions), creating data losses and uncertainty for advertisers.64
101. Meta told us the ad tech industry uses machine learning models to decide which ads to show to a user. For example, these models are trained on a user’s past behaviour (they installed Candy Crush Soda Saga from an ad) to predict future behaviour (they might be interested to install Candy Crush Jelly Saga from an ad as well). Because SKAN conversions are not directly linked to a click or an impression, technological partners are unable to use them directly in their training data to link historical impressions to conversions. They can continue to use them at an aggregate level to correct the calibration of models.
102. Snapchat reported lower than expected revenue in an earning call for third quarter of 2021 because of Apple’s ATT changes.65 In the same earning call, Snapchat said that SKAdNetwork, Apple’s free replacement for IDFA-based tracking of conversions, worked less well than expected.66
103. [In response to CMA questions, we heard] that SKAdNetwork does not report user level data, but only the aggregate number of installs that occur after a click, within a set timeframe. We were also told that both SKAdNetwork and the Apple Ads Attribution API provide less granularity than is otherwise possible (for example, on Android devices or in circumstances where users have agreed to provide authorisation for third-party tracking).
How does ATT influence opt-in to data sharing – the choice architecture of the ATT prompt
104. Choice architecture refers to the contexts in which users make decisions and how choices are presented to them. The literature on behavioural economics and psychology provides extensive evidence supporting the strong impact of choice architecture elements such as framing, pre-set defaults and ordering of options on an individual’s decision-making.67 Specifically, with regards to data
64 See Inside SKAN: SKAdNetwork insights [Guide] | AppsFlyer and iOS 14 & ATT benchmarks [Report] | AppsFlyer. 65 The Wall Street Journal (2021), Snap’s Stock Plummets as It Blames Apple’s Privacy Changes for Hurting Its Ad Business - WSJ. 66 Seeking Alpha, Snap Inc. (SNAP) CEO Evan Spiegel on Q3 2021 Results - Earning Call Transcript | Seeking Alpha. 67 See Szaszi, B., Palinkas, A., Palfi, B., Szollosi, A., and Aczel, B. (2018) A Systematic Scoping Review of the Choice Architecture Movement: Toward Understanding When and Why Nudges Work. Journal of Behavioral Decision Making, 31: 355– 366 for a review of empirical evidence on choice architecture interventions.
I28
privacy, there is empirical evidence supporting the role of choice architecture in influencing users’ privacy choices.68
105. The CMA’s final report on the online platforms and digital advertising market study, discussed the importance of the choice architecture of data privacy choice screens and the underlying psychological mechanisms which influence user behaviour.69 The CMA also proposed certain choice architecture principles (‘Fairness by Design’) for the design of choice related to users’ personal data by digital advertising platforms with strategic market status, to enhance user control over their data.
106. Since the CMA published its digital advertising market study report, others have conducted work considering how data privacy choices can be presented to consumers. For example, a set of experiments conducted by the Behavioural Insights Team (BIT) and Centre for Data Ethics and Innovation (CDEI) tested different ways of presenting privacy and personalisation settings in online contexts.70 Those experiments found that varying choice architecture elements could substantially impact users’ comprehension of consequences and feelings of control.
107. The combined empirical evidence on the impact of choice architecture as well as CMA’s past work into data privacy choices strongly suggest that the choice architecture of prompts, including the ATT and Apple’s Personalised Ads prompts, can influence user behaviour and thereby opt-in rates to personalised advertising.
108. In this section of the appendix we:
• describe the choice architecture of the ATT prompt and concerns about its potential influence on user decision-making;
• set out the alternative designs and choice architecture for the ATT prompt considered by Apple;
• illustrate the use and choice architecture of pre-prompt screens by third-party app developers that could also influence user decision-making;
68 See Adjerid, I., Acquisti, A., & Loewenstein, G. (2019) Choice Architecture, Framing, and Cascaded Privacy Choices. Management Science 65(5):2267-2290 and Ioannou, A., Tussyadiah, I., Miller, G., Li, S., Weick, M. (2021) Privacy nudges for disclosure of personal information: A systematic literature review and meta-analysis. PLoS ONE 16(8): e0256822. 69 CMA (2020), Online Platform and Digital Advertising Market Study, Final Report, Appendix Y. 70 Behavioural Insights Team (2021) Active Online Choices: Designing to Empower Users.
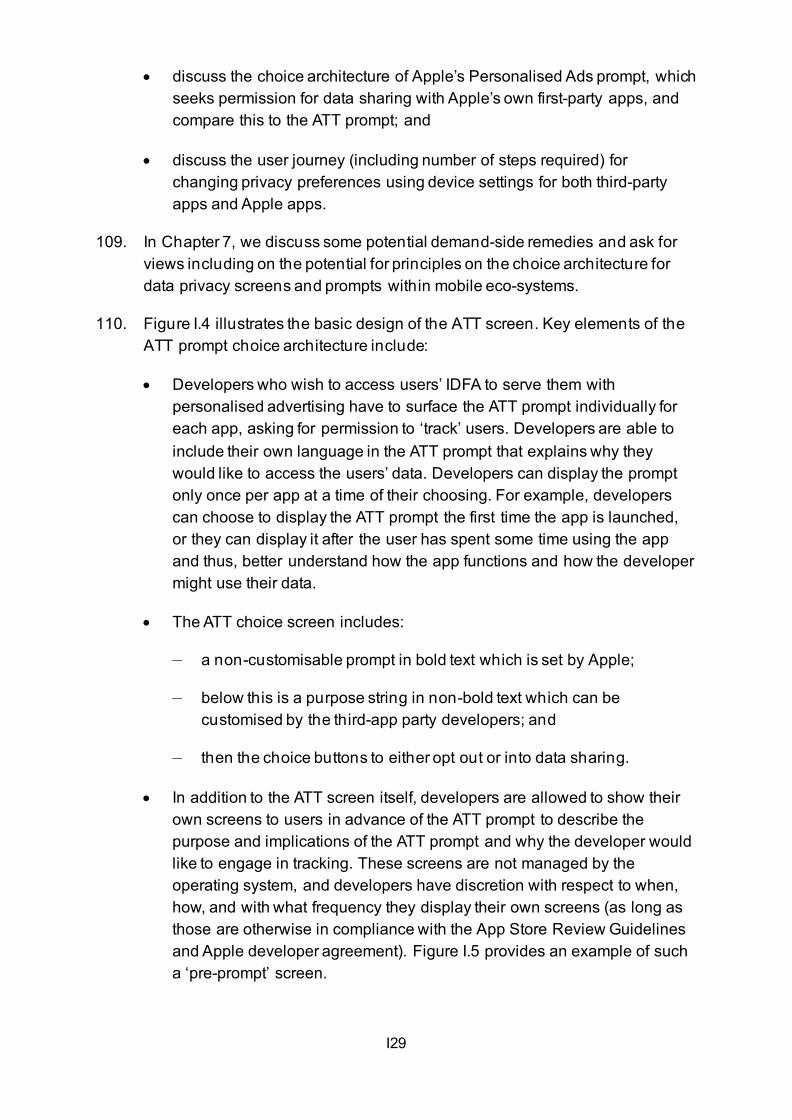
I29
• discuss the choice architecture of Apple’s Personalised Ads prompt, which seeks permission for data sharing with Apple’s own first-party apps, and compare this to the ATT prompt; and
• discuss the user journey (including number of steps required) for changing privacy preferences using device settings for both third-party apps and Apple apps.
109. In Chapter 7, we discuss some potential demand-side remedies and ask for views including on the potential for principles on the choice architecture for data privacy screens and prompts within mobile eco-systems.
110. Figure I.4 illustrates the basic design of the ATT screen. Key elements of the ATT prompt choice architecture include:
• Developers who wish to access users’ IDFA to serve them with personalised advertising have to surface the ATT prompt individually for each app, asking for permission to ‘track’ users. Developers are able to include their own language in the ATT prompt that explains why they would like to access the users’ data. Developers can display the prompt only once per app at a time of their choosing. For example, developers can choose to display the ATT prompt the first time the app is launched, or they can display it after the user has spent some time using the app and thus, better understand how the app functions and how the developer might use their data.
• The ATT choice screen includes:
— a non-customisable prompt in bold text which is set by Apple;
— below this is a purpose string in non-bold text which can be customised by the third-app party developers; and
— then the choice buttons to either opt out or into data sharing.
• In addition to the ATT screen itself, developers are allowed to show their own screens to users in advance of the ATT prompt to describe the purpose and implications of the ATT prompt and why the developer would like to engage in tracking. These screens are not managed by the operating system, and developers have discretion with respect to when, how, and with what frequency they display their own screens (as long as those are otherwise in compliance with the App Store Review Guidelines and Apple developer agreement). Figure I.5 provides an example of such a ‘pre-prompt’ screen.
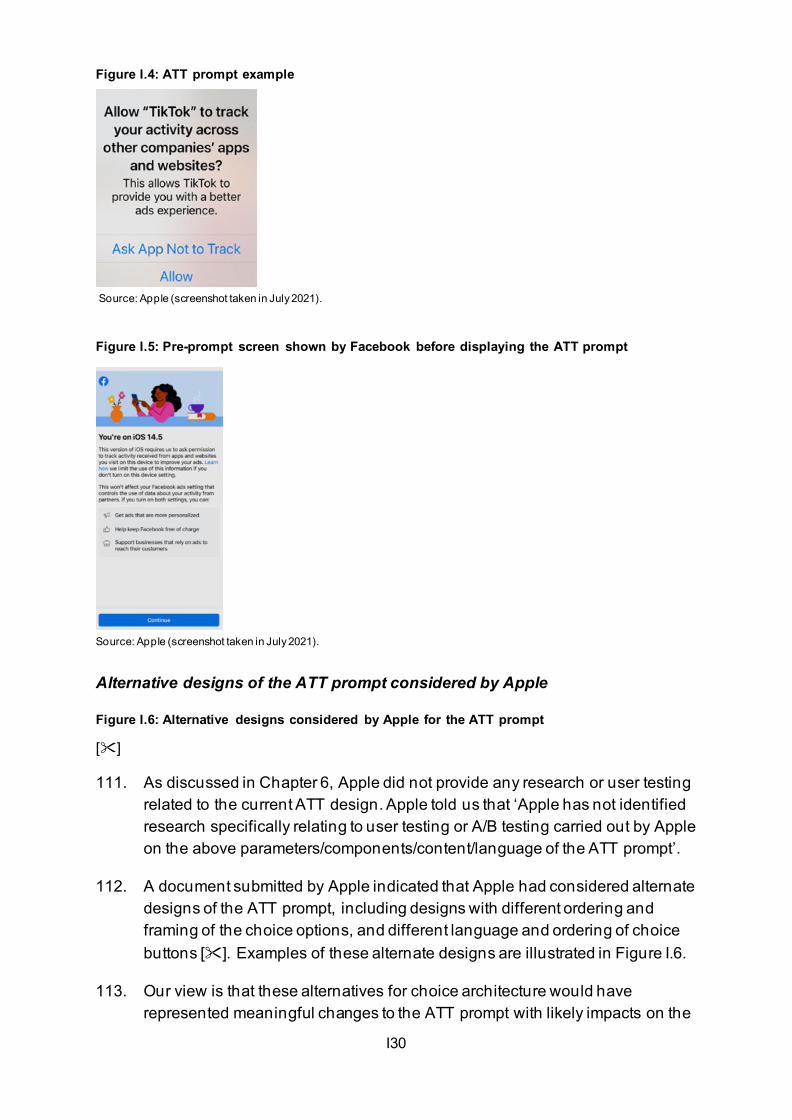
I30
Figure I.4: ATT prompt example
Source: Apple (screenshot taken in July 2021).
Figure I.5: Pre-prompt screen shown by Facebook before displaying the ATT prompt
Source: Apple (screenshot taken in July 2021).
Alternative designs of the ATT prompt considered by Apple
Figure I.6: Alternative designs considered by Apple for the ATT prompt
[] 111. As discussed in Chapter 6, Apple did not provide any research or user testing
related to the current ATT design. Apple told us that ‘Apple has not identified research specifically relating to user testing or A/B testing carried out by Apple on the above parameters/components/content/language of the ATT prompt’.
112. A document submitted by Apple indicated that Apple had considered alternate designs of the ATT prompt, including designs with different ordering and framing of the choice options, and different language and ordering of choice buttons []. Examples of these alternate designs are illustrated in Figure I.6.
113. Our view is that these alternatives for choice architecture would have represented meaningful changes to the ATT prompt with likely impacts on the
I31
opt-in rate for personalised advertising. Some of the options considered by Apple would alleviate potential concerns about the ATT prompt as discussed in our analysis of the present ATT prompt format.
Design and choice architecture of the ATT prompt
114. In our discussion of the ATT choice architecture, we have considered the evidence submitted, and literature on behavioural science and psychological mechanisms. From these sources we have pulled the key areas where we have concerns that the current choice architecture chosen for the ATT prompt by Apple may not empower users to make effective decisions, and could be designed specifically to influence consumers to opt-out.
115. Below we offer an examination of the choice architecture of the ATT prompt, including the language employed in the prompt and the ordering of the choice options. We also explore the potential influence of the pre-prompt screen on user decision-making.
116. As discussed in Chapter 6, in addition, we have a specific concern that third-party developers cannot offer incentives to users in return for opting into sharing their data including in the ATT prompt.71
• Given that developers benefit from users opting-in as it increases the effectiveness of their user acquisition and monetisation, allowing them to offer incentives would enable them to share some of that value with users. This would potentially benefit both users and developers, without restricting user choice. However, as the ICO’s guidance makes clear that providing consent to tracking should not be a condition of general access to content, organisations must be careful to ensure that offering incentives to consent does not cross the line into penalising those who do not consent to tracking.72
• Apple told us that the reason for this restriction was that ‘gating’ functionality in this way could be seen as contradicting various privacy guidance around the world.73
ATT Prompt Language
117. As was described by the CMA’s market study into online platforms and digital advertising, the language and description provided are highly relevant
71 As per App Store Review Guidelines, 3.2.2 (vi). 72 ICO, What is valid consent? 73 It cited in particular European Data Protection Board guidance on GDPR and a statement by the Dutch data protection agency on ‘cookie walls’.
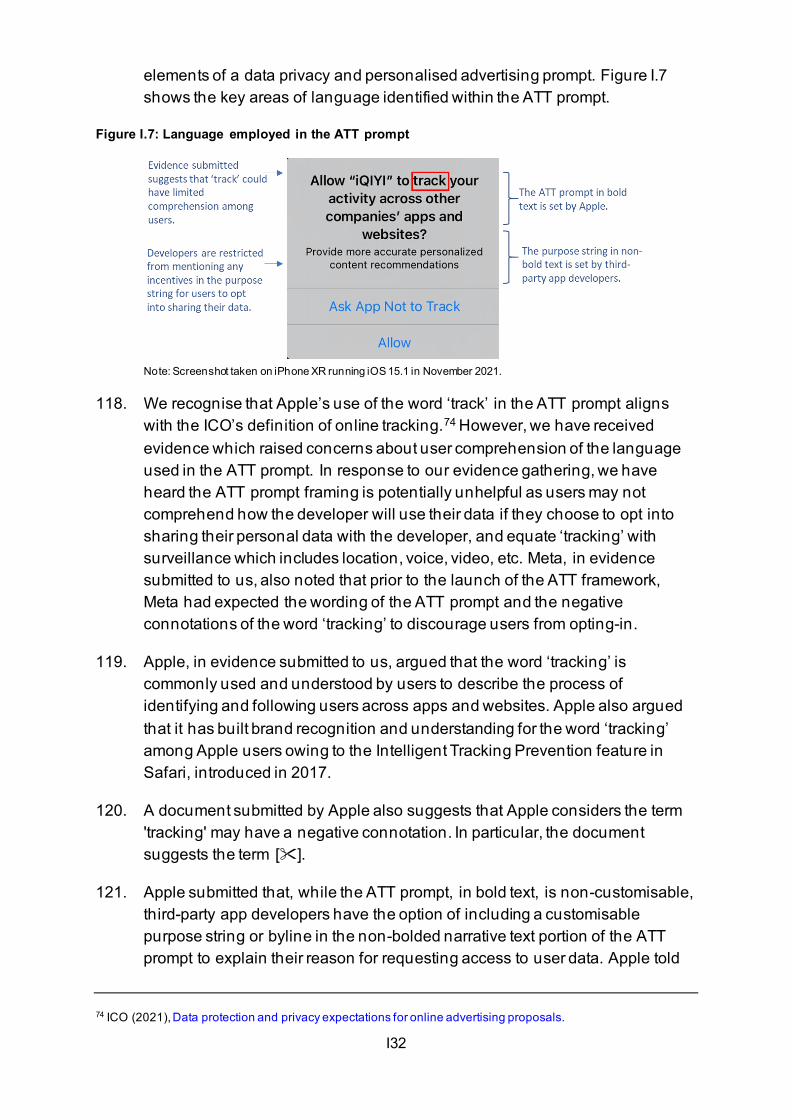
I32
elements of a data privacy and personalised advertising prompt. Figure I.7 shows the key areas of language identified within the ATT prompt.
Figure I.7: Language employed in the ATT prompt
Note: Screenshot taken on iPhone XR running iOS 15.1 in November 2021.
118. We recognise that Apple’s use of the word ‘track’ in the ATT prompt aligns with the ICO’s definition of online tracking.74 However, we have received evidence which raised concerns about user comprehension of the language used in the ATT prompt. In response to our evidence gathering, we have heard the ATT prompt framing is potentially unhelpful as users may not comprehend how the developer will use their data if they choose to opt into sharing their personal data with the developer, and equate ‘tracking’ with surveillance which includes location, voice, video, etc. Meta, in evidence submitted to us, also noted that prior to the launch of the ATT framework, Meta had expected the wording of the ATT prompt and the negative connotations of the word ‘tracking’ to discourage users from opting-in.
119. Apple, in evidence submitted to us, argued that the word ‘tracking’ is commonly used and understood by users to describe the process of identifying and following users across apps and websites. Apple also argued that it has built brand recognition and understanding for the word ‘tracking’ among Apple users owing to the Intelligent Tracking Prevention feature in Safari, introduced in 2017.
120. A document submitted by Apple also suggests that Apple considers the term 'tracking' may have a negative connotation. In particular, the document suggests the term [].
121. Apple submitted that, while the ATT prompt, in bold text, is non-customisable, third-party app developers have the option of including a customisable purpose string or byline in the non-bolded narrative text portion of the ATT prompt to explain their reason for requesting access to user data. Apple told
74 ICO (2021), Data protection and privacy expectations for online advertising proposals.
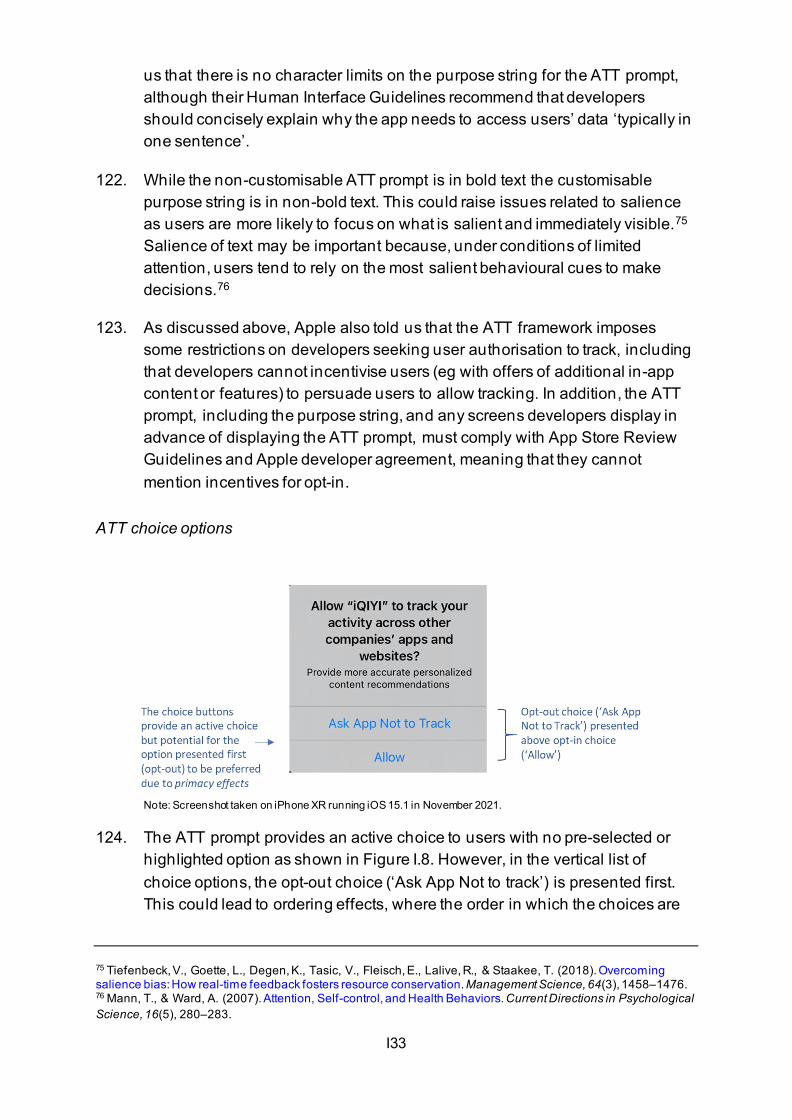
I33
us that there is no character limits on the purpose string for the ATT prompt, although their Human Interface Guidelines recommend that developers should concisely explain why the app needs to access users’ data ‘typically in one sentence’.
122. While the non-customisable ATT prompt is in bold text the customisable purpose string is in non-bold text. This could raise issues related to salience as users are more likely to focus on what is salient and immediately visible.75 Salience of text may be important because, under conditions of limited attention, users tend to rely on the most salient behavioural cues to make decisions.76
123. As discussed above, Apple also told us that the ATT framework imposes some restrictions on developers seeking user authorisation to track, including that developers cannot incentivise users (eg with offers of additional in-app content or features) to persuade users to allow tracking. In addition, the ATT prompt, including the purpose string, and any screens developers display in advance of displaying the ATT prompt, must comply with App Store Review Guidelines and Apple developer agreement, meaning that they cannot mention incentives for opt-in.
ATT choice options
Note: Screenshot taken on iPhone XR running iOS 15.1 in November 2021.
124. The ATT prompt provides an active choice to users with no pre-selected or highlighted option as shown in Figure I.8. However, in the vertical list of choice options, the opt-out choice (‘Ask App Not to track’) is presented first. This could lead to ordering effects, where the order in which the choices are
75 Tiefenbeck, V., Goette, L., Degen, K., Tasic, V., Fleisch, E., Lalive, R., & Staakee, T. (2018). Overcoming salience bias: How real-time feedback fosters resource conservation. Management Science, 64(3), 1458–1476. 76 Mann, T., & Ward, A. (2007). Attention, Self-control, and Health Behaviors. Current Directions in Psychological Science, 16(5), 280–283.
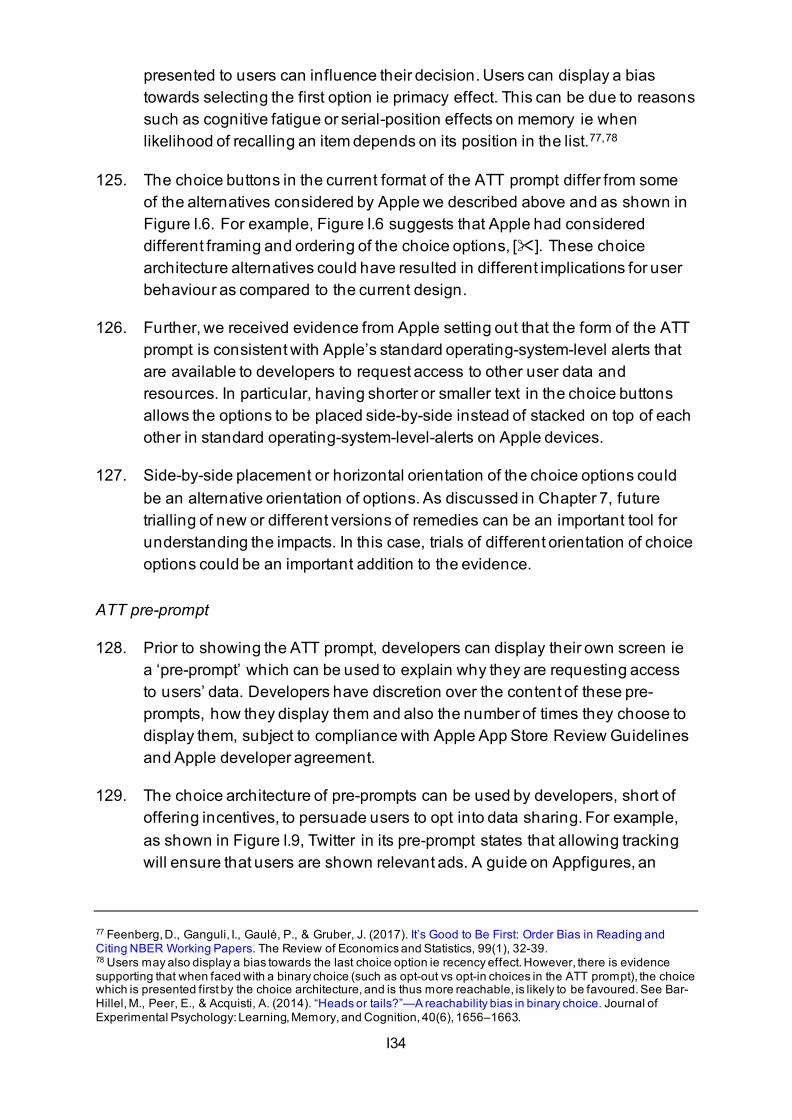
I34
presented to users can influence their decision. Users can display a bias towards selecting the first option ie primacy effect. This can be due to reasons such as cognitive fatigue or serial-position effects on memory ie when likelihood of recalling an item depends on its position in the list.77,78
125. The choice buttons in the current format of the ATT prompt differ from some of the alternatives considered by Apple we described above and as shown in Figure I.6. For example, Figure I.6 suggests that Apple had considered different framing and ordering of the choice options, []. These choice architecture alternatives could have resulted in different implications for user behaviour as compared to the current design.
126. Further, we received evidence from Apple setting out that the form of the ATT prompt is consistent with Apple’s standard operating-system-level alerts that are available to developers to request access to other user data and resources. In particular, having shorter or smaller text in the choice buttons allows the options to be placed side-by-side instead of stacked on top of each other in standard operating-system-level-alerts on Apple devices.
127. Side-by-side placement or horizontal orientation of the choice options could be an alternative orientation of options. As discussed in Chapter 7, future trialling of new or different versions of remedies can be an important tool for understanding the impacts. In this case, trials of different orientation of choice options could be an important addition to the evidence.
ATT pre-prompt
128. Prior to showing the ATT prompt, developers can display their own screen ie a ‘pre-prompt’ which can be used to explain why they are requesting access to users’ data. Developers have discretion over the content of these pre-prompts, how they display them and also the number of times they choose to display them, subject to compliance with Apple App Store Review Guidelines and Apple developer agreement.
129. The choice architecture of pre-prompts can be used by developers, short of offering incentives, to persuade users to opt into data sharing. For example, as shown in Figure I.9, Twitter in its pre-prompt states that allowing tracking will ensure that users are shown relevant ads. A guide on Appfigures, an
77 Feenberg, D., Ganguli, I., Gaulé, P., & Gruber, J. (2017). It’s Good to Be First: Order Bias in Reading and Citing NBER Working Papers. The Review of Economics and Statistics, 99(1), 32-39. 78 Users may also display a bias towards the last choice option ie recency effect. However, there is evidence supporting that when faced with a binary choice (such as opt-out vs opt-in choices in the ATT prompt), the choice which is presented first by the choice architecture, and is thus more reachable, is likely to be favoured. See Bar-Hillel, M., Peer, E., & Acquisti, A. (2014). “Heads or tails?”—A reachability bias in binary choice. Journal of Experimental Psychology: Learning, Memory, and Cognition, 40(6), 1656–1663.
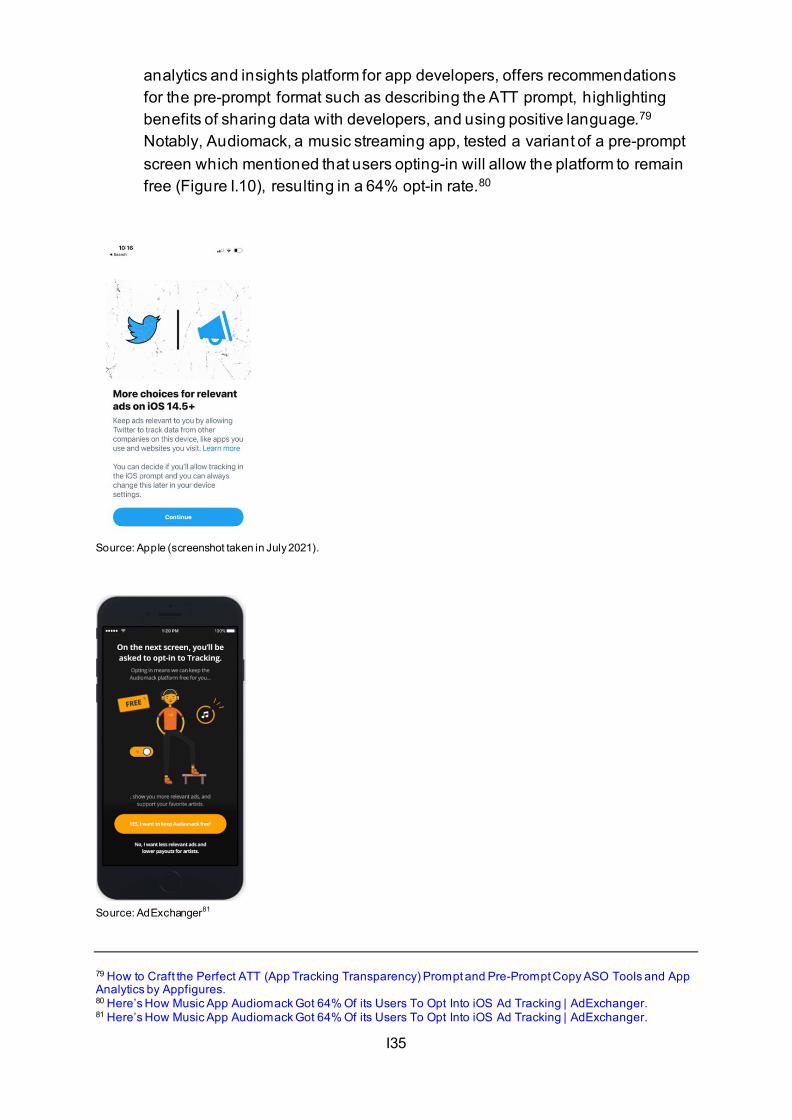
I35
analytics and insights platform for app developers, offers recommendations for the pre-prompt format such as describing the ATT prompt, highlighting benefits of sharing data with developers, and using positive language.79 Notably, Audiomack, a music streaming app, tested a variant of a pre-prompt screen which mentioned that users opting-in will allow the platform to remain free (Figure I.10), resulting in a 64% opt-in rate.80
Source: Apple (screenshot taken in July 2021).
Source: AdExchanger81
79 How to Craft the Perfect ATT (App Tracking Transparency) Prompt and Pre-Prompt Copy ASO Tools and App Analytics by Appfigures. 80 Here’s How Music App Audiomack Got 64% Of its Users To Opt Into iOS Ad Tracking | AdExchanger. 81 Here’s How Music App Audiomack Got 64% Of its Users To Opt Into iOS Ad Tracking | AdExchanger.
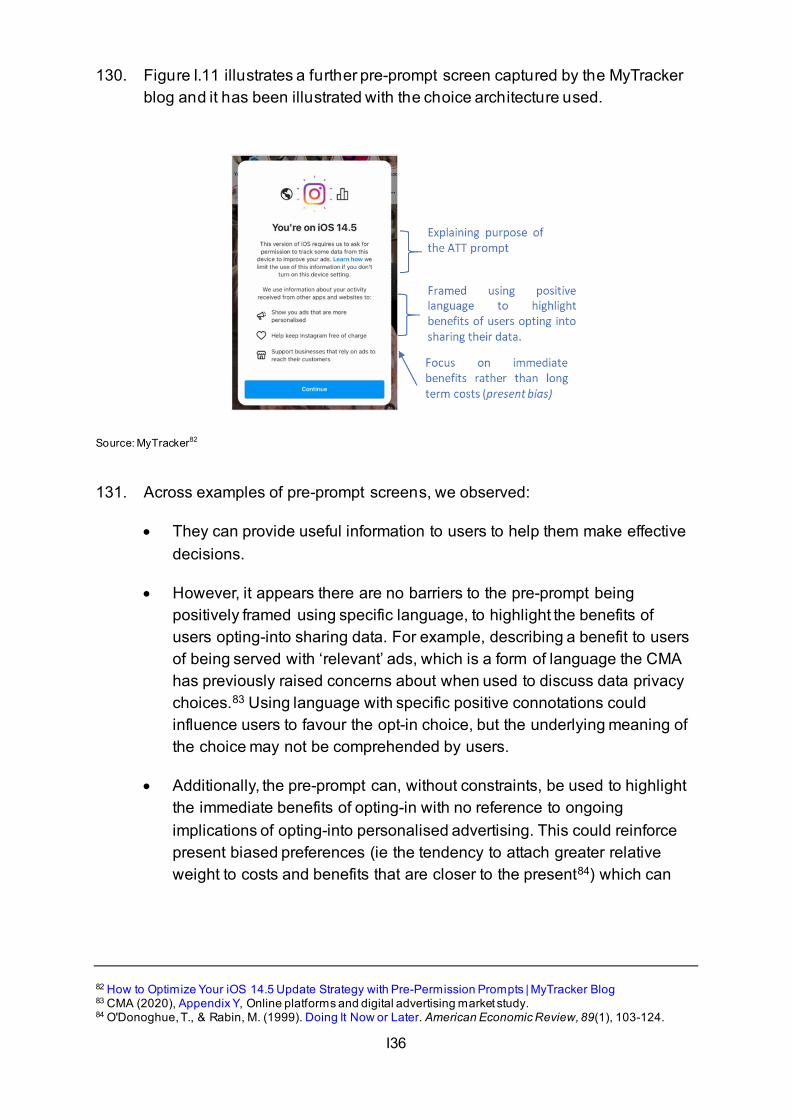
I36
130. Figure I.11 illustrates a further pre-prompt screen captured by the MyTracker blog and it has been illustrated with the choice architecture used.
Source: MyTracker82
131. Across examples of pre-prompt screens, we observed:
• They can provide useful information to users to help them make effective decisions.
• However, it appears there are no barriers to the pre-prompt being positively framed using specific language, to highlight the benefits of users opting-into sharing data. For example, describing a benefit to users of being served with ‘relevant’ ads, which is a form of language the CMA has previously raised concerns about when used to discuss data privacy choices.83 Using language with specific positive connotations could influence users to favour the opt-in choice, but the underlying meaning of the choice may not be comprehended by users.
• Additionally, the pre-prompt can, without constraints, be used to highlight the immediate benefits of opting-in with no reference to ongoing implications of opting-into personalised advertising. This could reinforce present biased preferences (ie the tendency to attach greater relative weight to costs and benefits that are closer to the present84) which can
82 How to Optimize Your iOS 14.5 Update Strategy with Pre-Permission Prompts | MyTracker Blog 83 CMA (2020), Appendix Y, Online platforms and digital advertising market study. 84 O'Donoghue, T., & Rabin, M. (1999). Doing It Now or Later. American Economic Review, 89(1), 103-124.
I37
then cause users to focus on the immediate benefits of divulging data and overlook any future implications.85
Recommendation for alternative ATT prompt design
Figure I.12: [Alternative wording for] the ATT prompt
[]
132. In response to CMA questions, alternative wording utilising plain language techniques was recommended.86 For instance it was suggested to replace the word 'track' with 'use' and add 'to optimize your experience' as a purpose string displayed below the prompt.
133. However, we have received a document from Apple that raised concerns that ‘optimize’ wouldn’t be comprehended by users as meaning their personal data being linked and applied to serve them with personalised advertising. Apple also noted that []. The CMA in its online markets and digital advertising market study final report raised concerns about the use of unrelated positive descriptions of sharing data (eg being served with ‘relevant’ advertising).87
User journey for centrally disabling or enabling apps from showing the ATT prompt
134. Some users may have a strong preference on data privacy and wish to stop an ATT prompt being shown for every app they visit. Other users may want to revisit their previous choice and want to switch their preference subsequently.
135. Users of Apple devices have the option to stop third-party app developers from showing the ATT prompt by disabling ‘Allow Apps to Request to Track’ in Privacy Settings under Tracking. Or alternatively, users can enable this setting to allow apps to request permission for tracking.
136. ‘Allow Apps to Request to Track’ is enabled by default for new users and for existing users who had Limit Ad Tracking disabled before iOS 14.
• If the user disables ‘Allow Apps to Request to Track’ then any app that attempts to surface the ATT prompt will be blocked from doing so and will be informed that the user has requested not to be tracked.
85 John, L. (2015). The Consumer Psychology of Online Privacy: Insights and Opportunities from Behavioral Decision Theory. In M. Norton, D. Rucker, & C. Lamberton (Eds.), The Cambridge Handbook of Consumer Psychology (Cambridge Handbooks in Psychology, pp. 619-646). 86 Plain language (or plain writing or Plain English) is communication which users can understand the first time they read or hear it. See What is plain language? | plainlanguage.gov. 87 CMA (2020), Appendix Y, Online platforms and digital advertising market study.
I38
• Disabling ‘Allow Apps to Request to Track’ stops all apps, other than the ones the user has previously given permission to track, from accessing the device’s IDFA.
• The user journey for disabling ‘Allow Apps to Request to Track’ is illustrated in Figure I.13. If the user has given permission to track to any app through the ATT prompt, and then afterwards disabled ‘Allow Apps to Request to Track’, the user will be able to select either ‘Allow Apps to Continue Tracking’ or ‘Ask Apps to Stop Tracking’ for those apps as shown in Figure I.13.
• The journey for users to centrally disable apps from asking permission to track involves a process with around six steps, including scrolling. We are concerned that the additional effort involved could discourage users from engaging with the centralised control. Apple told us that they did not commission any research on expected user engagement with the centralised control for disabling app developers from showing the ATT prompt.
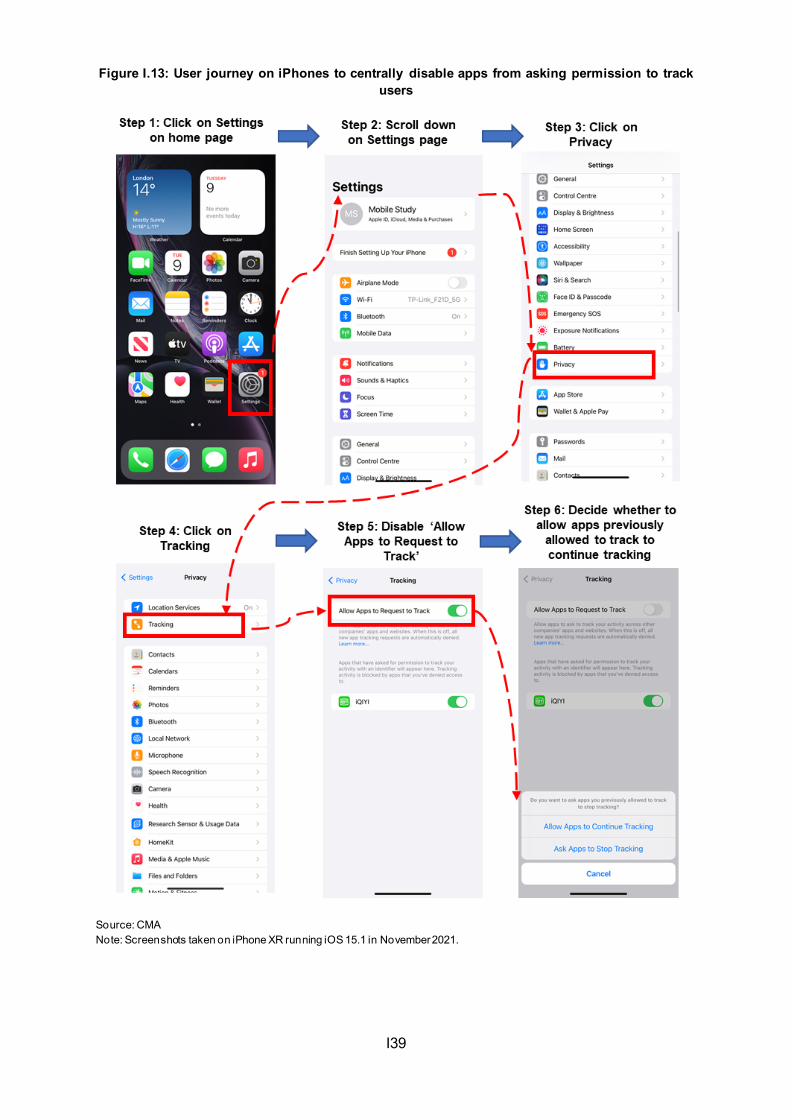
I39
Figure I.13: User journey on iPhones to centrally disable apps from asking permission to track users
Source: CMA Note: Screenshots taken on iPhone XR running iOS 15.1 in November 2021.
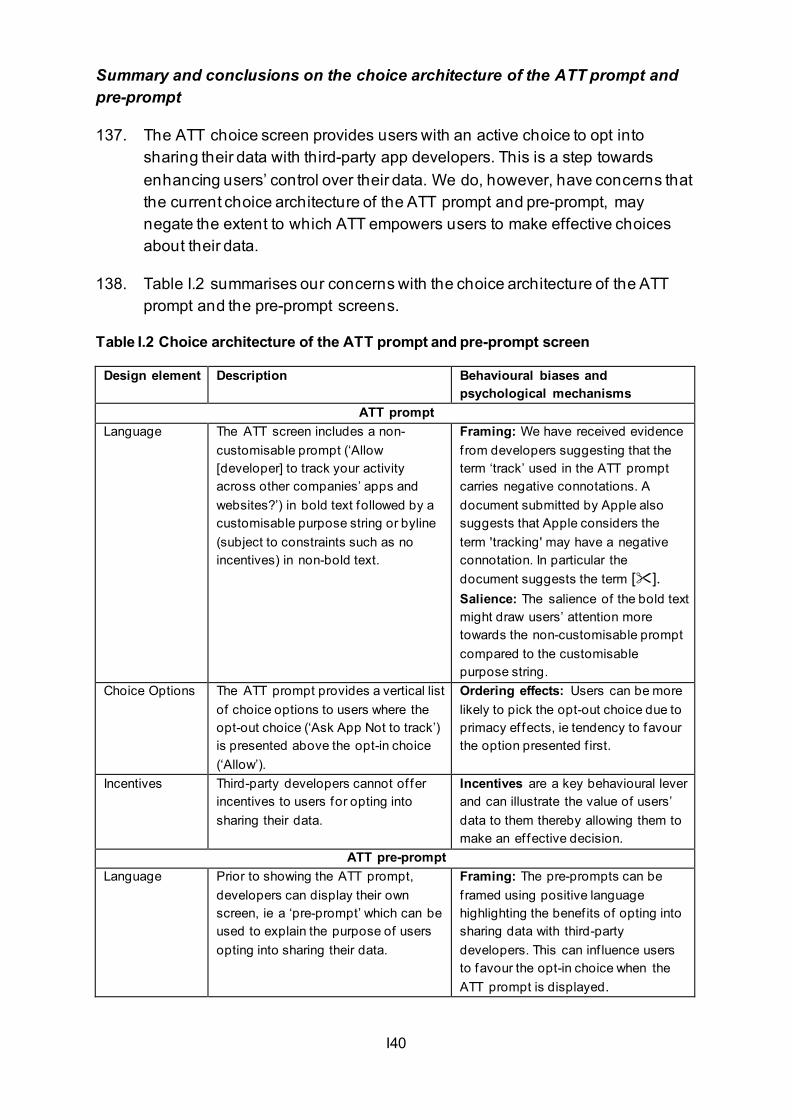
I40
Summary and conclusions on the choice architecture of the ATT prompt and pre-prompt
137. The ATT choice screen provides users with an active choice to opt into sharing their data with third-party app developers. This is a step towards enhancing users’ control over their data. We do, however, have concerns that the current choice architecture of the ATT prompt and pre-prompt, may negate the extent to which ATT empowers users to make effective choices about their data.
138. Table I.2 summarises our concerns with the choice architecture of the ATT prompt and the pre-prompt screens.
Table I.2 Choice architecture of the ATT prompt and pre-prompt screen
Design element Description Behavioural biases and psychological mechanisms
ATT prompt Language The ATT screen includes a non-
customisable prompt (‘Allow [developer] to track your activity across other companies’ apps and websites?’) in bold text followed by a customisable purpose string or byline (subject to constraints such as no incentives) in non-bold text.
Framing: We have received evidence f rom developers suggesting that the term ‘track’ used in the ATT prompt carries negative connotations. A document submitted by Apple also suggests that Apple considers the term 'tracking' may have a negative connotation. In particular the document suggests the term []. Salience: The salience of the bold text might draw users’ attention more towards the non-customisable prompt compared to the customisable purpose string.
Choice Options The ATT prompt provides a vertical list of choice options to users where the opt-out choice (‘Ask App Not to track’) is presented above the opt-in choice (‘Allow’).
Ordering effects: Users can be more likely to pick the opt-out choice due to primacy ef fects, ie tendency to favour the option presented f irst.
Incentives Third-party developers cannot of fer incentives to users for opting into sharing their data.
Incentives are a key behavioural lever and can illustrate the value of users’ data to them thereby allowing them to make an ef fective decision.
ATT pre-prompt Language Prior to showing the ATT prompt,
developers can display their own screen, ie a ‘pre-prompt’ which can be used to explain the purpose of users opting into sharing their data.
Framing: The pre-prompts can be f ramed using positive language highlighting the benef its of opting into sharing data with third-party developers. This can inf luence users to favour the opt-in choice when the ATT prompt is displayed.
I41
Present bias: The pre-prompt language can be used to focus users’ attention on immediate benef its of sharing data such as relevant ads and overlook any future costs, a phenomenon called present bias, ie user tendency to assign greater relevant weight to benef its and costs that are closer to the present.
139. We also note that the user journey for centrally disabling (or enabling) apps from showing the ATT prompt involves multiple steps, potentially creating unnecessary barriers and deterring users from changing the default setting.
Choice architecture of Apple’s Personalised Ads prompt and comparison with ATT prompt
140. As discussed above, with the launch of iOS 15, Apple has started surfacing a choice screen to users asking permission to enable personalised ads for their Apple ID.88 Opting into personalised ads will allow Apple to show personalised advertising in the Apple App store as well as Apple News and Stocks apps. Personalised ads was previously enabled by default for Apple owned apps, unless the user had enabled Limit Ad Tracking before iOS 14.
141. Starting with devices running iOS 15, the Personalised Ads prompt is displayed to new users when the App Store is launched for the first time. For existing users, whose devices is set to personalised ads on, the prompt is displayed when App Store is launched after updating their device to iOS 15. In later iOS 15 releases, the Personalised Ads prompt will surface upon first launch of the News or Stock apps, if the user has not launched App Store before that.
142. The Personalised Ads prompt consists of a heading (‘Personalised Ads’) in bold text, followed by information on personalised advertising in non-bold text, and finally the choice buttons ‘Turn on Personalised Ads’ and ‘Turn off Personalised Ads’. An illustration of the Personalised Ads prompt is provided in Figure I.14.
143. We welcome Apple’s introduction of the personalised ads screen as potentially empowering users to make choices on data privacy. We, however, have four specific concerns:
88 iOS 15 now prompts users if they want to enable Apple personalized ads, after it was previously on by default - 9to5Mac.
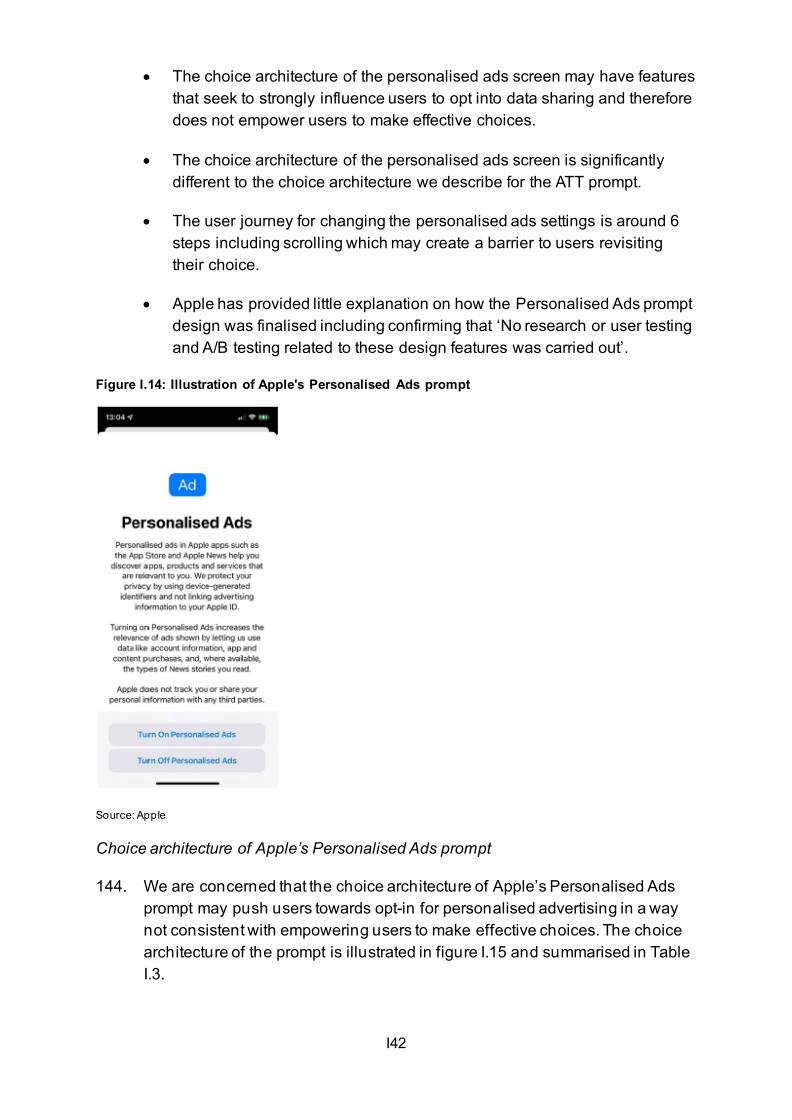
I42
• The choice architecture of the personalised ads screen may have features that seek to strongly influence users to opt into data sharing and therefore does not empower users to make effective choices.
• The choice architecture of the personalised ads screen is significantly different to the choice architecture we describe for the ATT prompt.
• The user journey for changing the personalised ads settings is around 6 steps including scrolling which may create a barrier to users revisiting their choice.
• Apple has provided little explanation on how the Personalised Ads prompt design was finalised including confirming that ‘No research or user testing and A/B testing related to these design features was carried out’.
Figure I.14: Illustration of Apple's Personalised Ads prompt
Source: Apple
Choice architecture of Apple’s Personalised Ads prompt
144. We are concerned that the choice architecture of Apple’s Personalised Ads prompt may push users towards opt-in for personalised advertising in a way not consistent with empowering users to make effective choices. The choice architecture of the prompt is illustrated in figure I.15 and summarised in Table I.3.

I43
145. Our primary concern is that the ordering of the opt-in choice first, vertically above the opt-out choice, could result in users favouring the opt-in choice over the opt-out choice. In addition, found that the text description in the prompt is framed entirely positively about the benefits of opting into data sharing which may not empower users to makeeffective choices.
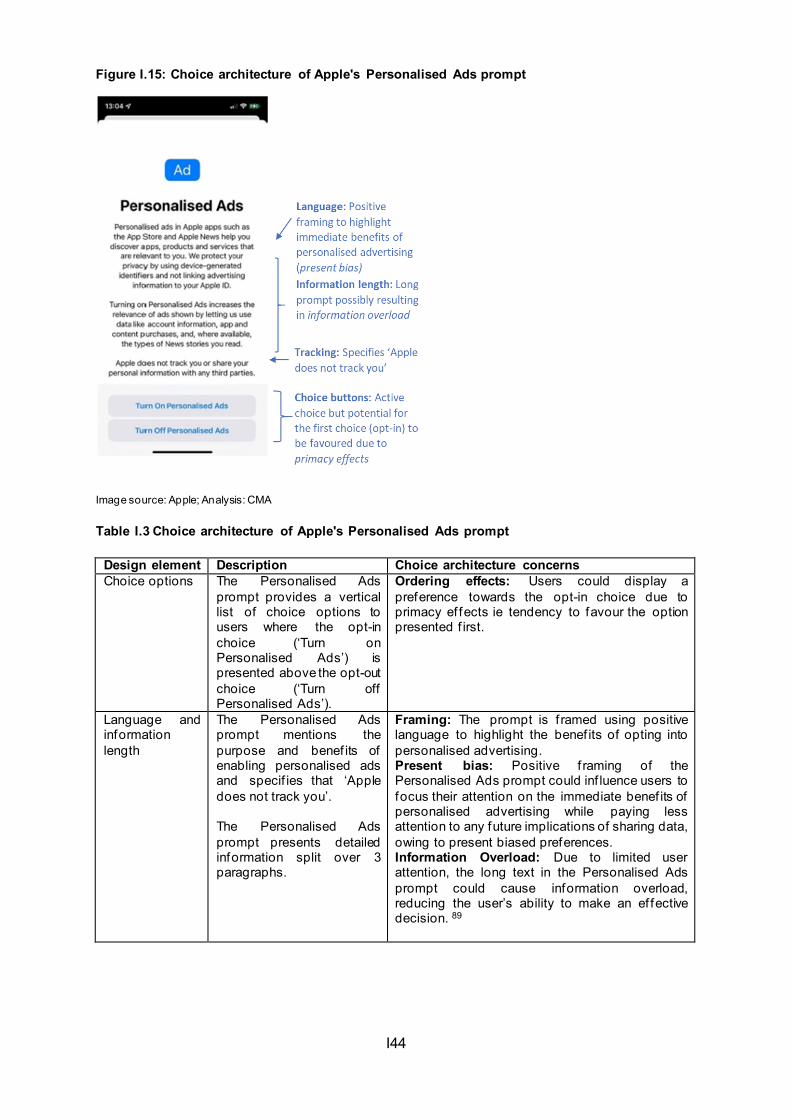
I44
Figure I.15: Choice architecture of Apple's Personalised Ads prompt
Image source: Apple; Analysis: CMA
Table I.3 Choice architecture of Apple's Personalised Ads prompt
Design element Description Choice architecture concerns Choice options The Personalised Ads
prompt provides a vertical list of choice options to users where the opt-in choice (‘Turn on Personalised Ads’) is presented above the opt-out choice (‘Turn off Personalised Ads’).
Ordering effects: Users could display a preference towards the opt-in choice due to primacy ef fects ie tendency to favour the option presented f irst.
Language and information length
The Personalised Ads prompt mentions the purpose and benef its of enabling personalised ads and specif ies that ‘Apple does not track you’. The Personalised Ads prompt presents detailed information split over 3 paragraphs.
Framing: The prompt is f ramed using positive language to highlight the benef its of opting into personalised advertising. Present bias: Positive f raming of the Personalised Ads prompt could inf luence users to focus their attention on the immediate benef its of personalised advertising while paying less attention to any future implications of sharing data, owing to present biased preferences. Information Overload: Due to limited user attention, the long text in the Personalised Ads prompt could cause information overload, reducing the user’s ability to make an ef fective decision. 89
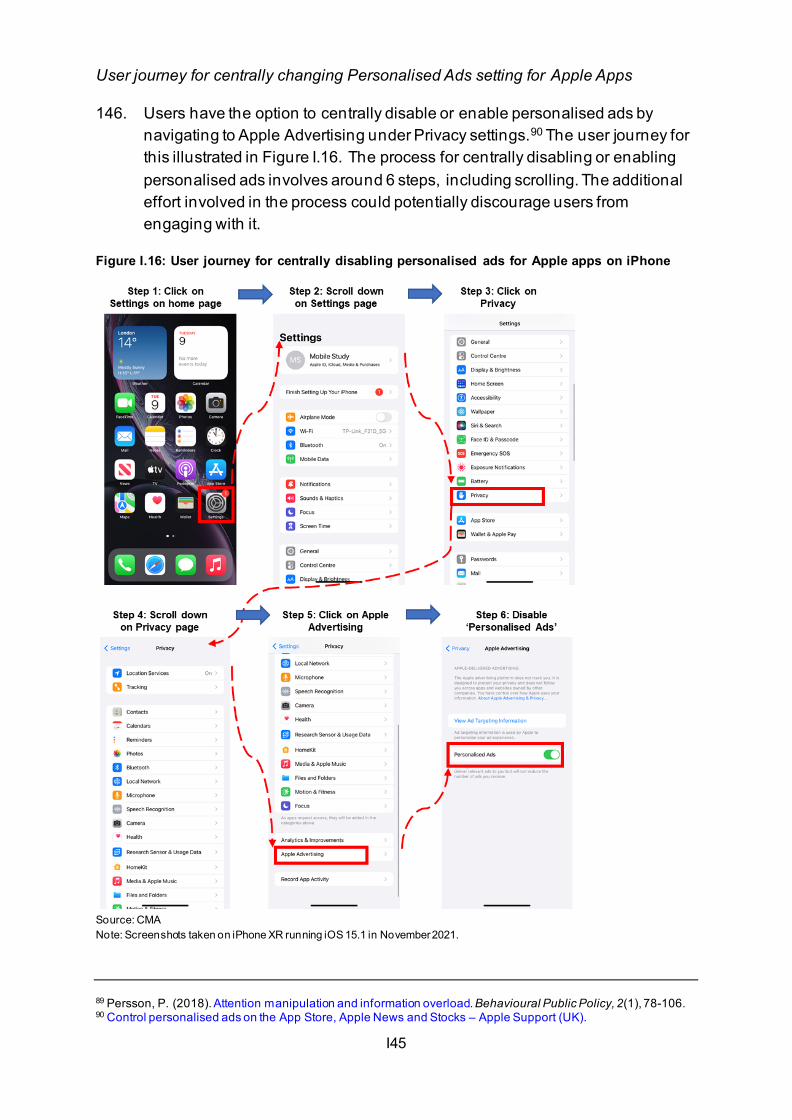
I45
User journey for centrally changing Personalised Ads setting for Apple Apps
146. Users have the option to centrally disable or enable personalised ads by navigating to Apple Advertising under Privacy settings.90 The user journey for this illustrated in Figure I.16. The process for centrally disabling or enabling personalised ads involves around 6 steps, including scrolling. The additional effort involved in the process could potentially discourage users from engaging with it.
Figure I.16: User journey for centrally disabling personalised ads for Apple apps on iPhone
Source: CMA Note: Screenshots taken on iPhone XR running iOS 15.1 in November 2021.
89 Persson, P. (2018). Attention manipulation and information overload. Behavioural Public Policy, 2(1), 78-106. 90 Control personalised ads on the App Store, Apple News and Stocks – Apple Support (UK).
I46
Differences between ATT and Apple’s Personalised Ads prompt
147. Apple’s Personalised Ads prompt employs a different choice architecture compared to the ATT prompt. Apple told us that ‘The Personalized Ads prompt does not look like the ATT prompt because Apple does not engage in tracking to deliver Personalised Ads’.
148. We highlight below the differences in choice architecture between the ATT and Apple’s Personalised Ads prompts. Specifically, we identify choice architecture differences which could influence users to opt-in to sharing data for Apple’s own apps whilst potentially influencing users to opt-out from sharing data within the ATT prompt.
149. Our concerns about the differences in choice architecture and thereby potential impact on opt-in/opt-out choices are primarily:
• The ordering of options in the two privacy prompts differ from each other. In the ATT prompt, the option to opt-out from personalised advertising is presented at the top vertically. In Apple’s Personalised Ads prompt, the option to opt-in to personalised advertising is presented at the top vertically. As discussed above, primacy effects suggest that the option presented at the top may be favoured by users.
• The format and content of the text shown in the prompts are unlike each other and these differences may materially influence choice.
150. Table I.4 summarises the choice architecture concerns and behavioural mechanisms underpinning these. The sections above provide further detail and references for each mechanism.
151. As discussed in Chapter 7, we are seeking views on whether there are principles for the choice architecture of data privacy prompts and choice screens that should be applied across mobile ecosystems.
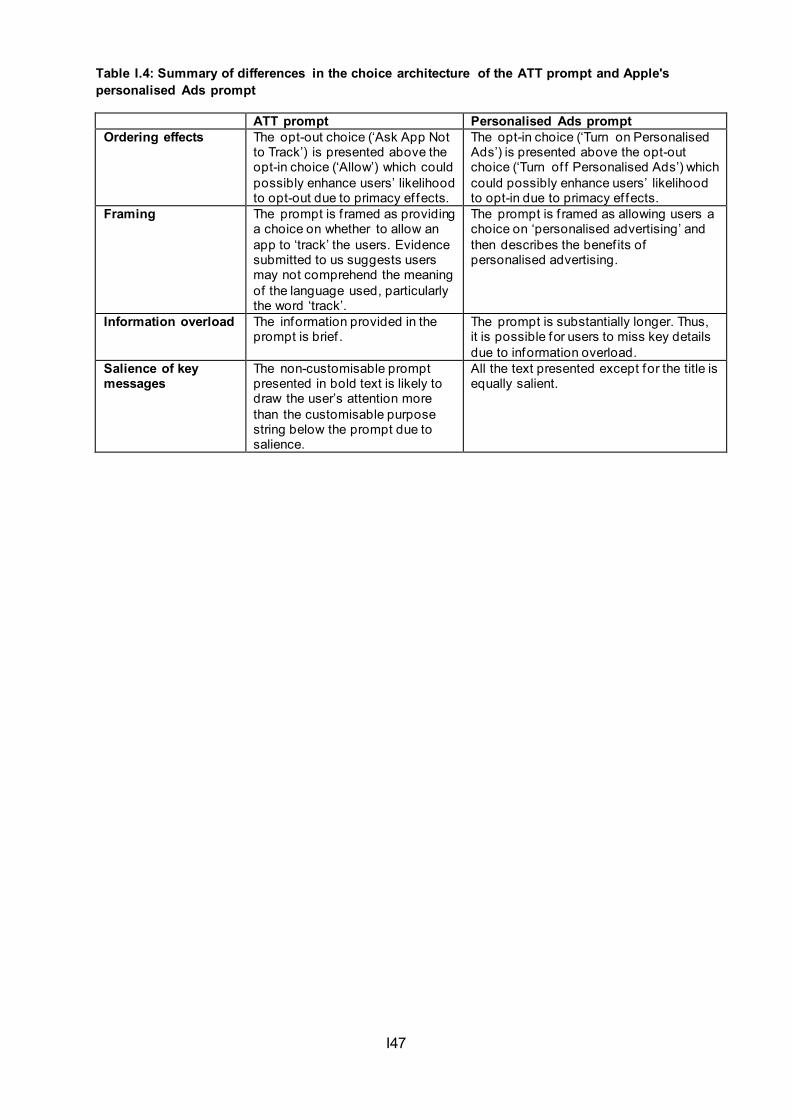
I47
Table I.4: Summary of differences in the choice architecture of the ATT prompt and Apple's personalised Ads prompt
ATT prompt Personalised Ads prompt Ordering effects The opt-out choice (‘Ask App Not
to Track’) is presented above the opt-in choice (‘Allow’) which could possibly enhance users’ likelihood to opt-out due to primacy ef fects.
The opt-in choice (‘Turn on Personalised Ads’) is presented above the opt-out choice (‘Turn of f Personalised Ads’) which could possibly enhance users’ likelihood to opt-in due to primacy ef fects.
Framing The prompt is f ramed as providing a choice on whether to allow an app to ‘track’ the users. Evidence submitted to us suggests users may not comprehend the meaning of the language used, particularly the word ‘track’.
The prompt is f ramed as allowing users a choice on ‘personalised advertising’ and then describes the benef its of personalised advertising.
Information overload The information provided in the prompt is brief .
The prompt is substantially longer. Thus, it is possible for users to miss key details due to information overload.
Salience of key messages
The non-customisable prompt presented in bold text is likely to draw the user’s attention more than the customisable purpose string below the prompt due to salience.
All the text presented except for the title is equally salient.
Appendix J: Barriers to switching between mobile operating systems
Introduction
1. As set out in Chapter 3, only a small proportion of mobile device purchasersswitch between mobile devices with different operating systems each year.This proportion is smaller among Apple iOS purchasers than Android. In2020/21, between [0-10]% of users who purchased an Android device hadswitched from an iOS device each quarter. Between [10-20]% of users whopurchased an Apple device switched from an Android device.
2. In this appendix, we first consider what factors may affect levels of switchingbetween mobile operating systems, including inertia, brand loyalty, andsatisfaction. We then examine evidence that some factors act as barriers toswitching, for example if they could:
• cause users to perceive switching to be difficult or costly (eg because theywould pose a ‘hassle’), discouraging potential switchers; and
• impose actual costs on users that do switch (eg financial costs, time costsor learning costs).
3. Perceived barriers to switching, which discourage switching, may have agreater direct impact on switching rates than some actual costs for users thatdo switch. However, it is relevant to consider actual costs because they arelikely to reinforce perceived barriers to switching if or when users learn ofthem, from personal or second-hand experience.
4. Taken together, these barriers may reduce the threat to Apple and Googlethat users may switch mobile ecosystem, for example to make savings oraccess new features. This may lessen the competitive constraints that applyto them.
5. Respondents suggested that users face three categories of potential barriersto switching between mobile devices with different operating systems:
• learning costs associated with switching mobile ecosystem;
• transferring data, apps and managing subscriptions across devices; and
J2
• the availability and characteristics of Apple’s and Google’s first-party (ie developed and operated by Apple and Google) apps, services, and connected devices.
6. In each case we assess whether these factors could act as a perceived barrier to switching and if they could constitute a barrier by imposing actual costs on users who do switch. We also consider whether potential barriers may have asymmetrical effects: for example, by discouraging switching from Android to iOS but not vice versa.
7. It is difficult to assess the individual impact of each of these factors on users’ propensity to switch between mobile devices with different operating systems. However we consider that, in the round, they pose material barriers to switching. To some extent these barriers apply to switching both to iOS and Android, although several appear more significant with respect to switching from iOS to Android:
• We consider that the learning costs associated with switching mobile ecosystems create perceived barriers to switching and impose actual costs on switchers. Survey evidence suggests that this perception affects both Android and iOS users, but is more widespread among iOS users.
• Transferring data, apps and managing subscriptions across devices may impose significant time and financial costs on switchers:
— Respondents raised questions about the reliability of the guidance, switching apps and tools intended to enable users to transfer data to new Android or iOS devices. Survey evidence suggests that concerns around losing access to data affect users of both ecosystems but are more widespread among iOS users. It appears that Android APIs makes information available to switching apps about, for example, the apps the user has downloaded, whereas equivalent information is not available to switching apps on iOS.
— Apple’s policies in relation to in-app purchases prevent developers from requiring users to link their developer accounts to their Apple account. This makes it more likely that users will be unable to recover paid-for apps and in-app content after switching from iOS to Android or vice versa, posing time and financial costs on switchers. As set out in Chapter 4 and Appendix H, users may have little or no alternative to using Apple’s in-app payments system. Google Play’s billing system policies do not appear to pose this restriction on developers.
— Switchers cannot manage (eg upgrade or cancel) subscriptions to paid-for apps or in-app content made on their prior operating system using a
J3
different operating system (whether Android or iOS). Users must cancel subscriptions before switching and repurchase them to be able to manage them from their new device, posing time and financial costs for switchers.
• The availability and characteristics of Apple’s first-party apps, services and connected devices pose significant barriers to switching to Android. By way of example, the features of iMessage can create problems for switchers to new Android devices, while Apple’s approach of not adopting further potential interoperability with number-based messaging on Android devices could also diminish the experience of switchers to Android.
8. Given the ubiquity of mobile devices and heterogeneity of mobile users (including with respect to confidence to resolve problems arising and broader digital literacy), each of the barriers to switching are likely to have material effects on significant numbers of users.
9. We recognise that barriers to switching may, in some cases, be natural to any process of switching mobile device and ecosystem. Some barriers may also be the result of competitive differentiation between mobile ecosystems or of enhancements to devices. However, in other cases barriers to switching may have no such justification.
10. The findings in this appendix are relevant to our conclusion, set out in Chapter 2, that Apple and Google have different incentives with respect to retaining users within their ecosystems. At a high level, Apple’s strong incentives to encourage users to purchase Apple devices generate further incentives to raise barriers to switching away from iOS. Google’s incentives to establish barriers to switching mobile ecosystem may be less strong overall, given its strategic focus on online services available across mobile ecosystems and devices.
11. This appendix draws on submissions, survey evidence and internal documents from market participants, as well as other evidence.
Factors that may affect levels of switching between mobile operating systems
12. As set out above, only a small proportion of users switch mobile ecosystem each year. A larger proportion of mobile users appear to switch provider of
J4
mobile connectivity than mobile ecosystem: in 2021, 16% of UK mobile users had switched mobile network operator in the past twelve months.1
13. There is no recognised ‘optimal’ level of switching that, if met, would demonstrate that competition between Apple’s and Google’s mobile ecosystems is effective. However, we are concerned that barriers to switching may help drive prevailing low switching rates, alongside consumer inertia and motivations to remain within a mobile ecosystem.
14. We consider that mobile users have reason to consider switching when purchasing a new device. Apple and Google’s responses help inform this view:
• Apple stated that levels of switching between mobile operating systems are significant, considered that there is competition among device manufacturers for switching customers: for example, the iPhone SE was intended to attract Android users. It noted that some manufacturers offer discounts for those trading in devices made by another manufacturer.2
• Google noted that UK users replace their smartphones approximately every two years, creating regular moments at which they may consider switching.3 Users may consider the different characteristics of devices when deciding which to purchase, such as new hardware, features and functions, improvements to operating systems that enhance the user’s experience, and offers of discounted content services. Google argued that competing Android and iOS devices are available in all ‘mid-to-high’ price segments.
15. However, across markets, many consumers choose not to engage or consider switching provider where doing so is straightforward, offers clear benefits, and where there is relatively little product differentiation by comparison with mobile devices and ecosystems, so that price comparison might be highly relevant to most people. Consumers may not perceive sufficient benefits to justify the time costs of engaging with the market and switching provider. When making
1 Ofcom (2021), Core switcher tracker study, Table 119. 2 Apple also cited analysis by the Progressive Policy Institute, which suggested that switching costs from iPhone to Samsung in the US and EU amount to one-time costs of $16 and €18 respectively, including the opportunity cost of time spent switching. However, we note that this study did not assess factors such as learning costs, loss of some types of data (focusing on photos, videos and contacts, but not other data) or paid-for apps (all apps included were free apps), transferring the management of subscriptions made through Apple’s in-app purchase or Google Play billing, or the costs of losing access to Apple’s first-party apps and services (only noting that there are apps providing similar services on Android devices). 3 A respondent presented evidence suggesting that the average duration of ownership of a smartphone increased by three months between 2015 and 2018.
J5
mobile device purchasing decisions, users may perceive product differentiation to be significant and the benefits of switching difficult to assess.
16. Different factors may motivate users to remain within their prior mobile ecosystem when they purchase a new device. Respondents suggested that factors that encourage users to remain within a mobile ecosystem include:
• Satisfaction with the characteristics of Android and iOS devices: in an online quantitative survey in the UK in January 2021 of 1,925 purchasers and 1,896 intenders,4 63% of UK iOS users who were extremely unlikely to buy an Android device stated that they would not switch because they prefer the design and features of iPhones. 53% of UK Android users who were extremely unlikely to buy an iOS device stated that this was because they preferred Android’s design and features.
• Brand loyalty: survey evidence submitted to us showed the importance of previous experience with a particular brand on subsequent UK smartphone purchasing decisions (relevant to 35% of purchasers). Getting a good deal on the price of the smartphone was relevant to 46% of purchasers. [Parties] cited users’ brand loyalty (in particular to Apple) as an important factor in device purchasing decisions.
17. However, inertia, brand loyalty and user satisfaction may co-exist with barriers to switching. As set out above, barriers to switching may diminish the competitive constraints that apply to Apple and Google.
18. In response to the CMA’s questions, [a party] also told us that barriers to switching are asymmetrical, deterring switching from iOS to Android (and thus lessening the competitive constraints that apply to Apple) rather than vice versa.
19. Below we consider whether learning costs associated with switching mobile ecosystem, transferring data, apps and managing subscriptions, or the availability and characteristics of first-party apps, services and devices, pose barriers to switching and to what extent. We also consider whether such barriers apply more strongly to switching from Android to iOS or vice versa.
4 ‘Purchasers’ defined as respondents shopping for a smartphone for personal use and ‘intenders’ defined as respondents planning to purchase smartphone in the next six months.
J6
Potential barriers to switching: learning costs associated with switching mobile ecosystem.
Potential to act as a barrier to switching
20. Users may need to adapt to different controls, functionality, and features if they switch to a different operating system. Users considering switching may perceive this as a ‘hassle’ that would discourage them, while users who switch may incur time costs learning to adapt to a different device.5
Respondents’ views and evidence
21. Several respondents considered that learning costs are a perceived barrier to switching and affect those who do switch. They agreed with Microsoft’s view that operating systems differ in terms of their physical features, design, controls, and functions and that this can be time-consuming and burdensome.
22. Apple stated that, while users may need to learn about different settings and button uses on different operating systems, such learning costs ‘would appear to be moderate’ due to the ‘high availability of video tutorials’ and because apps have versions on both Android and iOS.
23. As set out in Chapter 3, in 2017 [20-30]% of UK iOS users would have been concerned about finding it difficult to learn to use a new brand of device or operating system. [10-20]% of Android users felt this way.
24. In Q3 2020, [60-70]% of UK iOS users considered ‘Know[ing] how to use their phone’ as an important influence on their purchasing decision (the most important factor for iOS users). In contrast, [40-50]% of Samsung users rated this factor as important and just [10-20]% of Huawei users.
Conclusions
25. The available evidence suggests that the learning costs associated with adapting to the different controls, functionality and features of an operating system could create perceived barriers to switching and impose time costs on switchers. Survey evidence suggests that these barriers are perceived more widely among iOS than Android users.
5 Learning costs were also identified as a barrier to switching in the following enforcement decisions and market studies: European Commission, Commission Decision of 18 July 2018: Google Android, recitals 523, 524, 527; the Netherlands Authority for Consumers & Markets, Market study into mobile app stores, p. 55; Australian Competition & Consumer Commission, Digital platform services inquiry, Interim report No. 2 – App marketplaces, p. 38.
J7
26. The extent to which learning costs may deter switching may depend on, for example, users’ confidence in drawing on available tutorial information and their broader digital literacy. Some users may not consider learning costs a deterrent to switching, while they may be a significant deterrent to those least confident in their ability to adapt to a new device.
Potential barriers to switching: transferring data, apps and managing subscriptions across devices
Potential to act as a barrier to switching 27. As detailed below, multiple respondents set out views on whether challenges
to transferring data, apps and managing subscriptions could constitute barriers to switching between iOS and Android or vice versa. They commented on whether:
• Data held by apps and services (such as contacts, text messages and in-game progress), and data about which apps a user had installed on their prior device, may be unavailable to users after switching devices. While guidance, switching apps and tools are available to help switchers transfer their data between devices from different mobile ecosystems, respondents set out different views about how far users can rely on them.
• Preferred third-party apps may not be available to users on another mobile operating system.
• Users may have to repurchase or resubscribe to paid-for apps and in-app content if they cannot recover their pre-existing accounts after switching to a new ecosystem.
• Users may not be able to manage pre-existing subscriptions to paid-for apps and in-app content after switching to a device that uses a different operating system.
28. A further related barrier to switching may be that most of Apple’s first-party apps and services are not available on Android – we consider this in the section below on the availability and characteristics of first-party apps, services and connected devices.
Respondents’ views and evidence
29. Respondents commented on each of these factors:
• Respondents, including several app developers, suggested that users may find they are unable to transfer data from their prior devices to a
J8
different operating system or may find the process difficult. They noted that, while guidance, switching apps and tools are available to enable users to transfer their data, these options may not be effective in all cases. For example, [a party] stated that in-built systems for switching data to a new device may work best when switching between devices from the same manufacturer or that use the same operating system. Microsoft considered that some users remain within the same ecosystem to ensure they do not lose data or have to make complicated data transfers. It stated that switchers may need to invest time in re-entering information on a new device, such as sign-in details, passwords, and contacts.
• With respect to whether users can access preferred third-party apps after switching: several app developers stated that they make their apps available to users of Android, iOS mobile ecosystems and on other platforms (in Chapter 4 we note that most popular third-party apps are available on both Android and iOS).
• With respect to whether users may have to repurchase or resubscribe to paid-for apps and in-app content after switching: app developers indicated that Apple’s policies in relation to In-App Purchases (IAP) prevent developers from requiring users to link developer accounts to their Apple ID. While app developers can prompt users to link their accounts, the European Publishers Council stated that, if users choose not to do so, developers have no means to know whether switchers to Android have paid for a subscription on iOS. As set out in Appendix H, users have no alternative to Apple IAP for purchasing apps and in-app content.
• Google stated that Google Play’s billing system policies do not constrain developers from requiring app users to link their Android app to a developer account, which they could access from an iOS device if they choose to switch. However, it considered that, for users of most apps, there is no risk of losing access for paid-for content after switching, as 97% of apps on Android do not offer paid downloads, in-app content, or subscription sales.
• Multiple app developers noted that users who have active subscriptions bought on the Apple App Store cannot manage these subscriptions on a device that uses a different mobile operating system. As such, to be able to manage their subscriptions on a new operating system, a user would need to cancel subscriptions on their prior device before switching and re-purchasing them. [One developer] stated that some users may be charged for subscriptions they cannot use if they switch from an iOS to an Android device before cancelling or managing through Apple a
J9
subscription they have bought through Apple IAP. Epic Games noted that switchers may have, for example, multiple annual subscriptions bought on iOS that expire at different times, necessitating their cancellation and re-purchase because they would not be manageable on Android.
• As set out below, Apple stated that switchers from Android to iOS would also find that they are unable to manage subscriptions bought via Google Play on an iOS device.
30. Apple considered that any barriers to switching arising from the transfer of data, apps or managing subscriptions are limited:
• Apple stated that multiple apps are available on the App Store to transfer users’ data to a new device (including data about which apps they had installed on their prior device), such as Huawei’s Phone Clone and Copy My Data. It stated that these make transferring data from iOS to other platforms ‘seamless and easy’. It also noted that the Google Drive app, available on the App Store, can be used to back up photos, contacts and calendar appointments and facilitate the transfer of data from Apple’s Photos, Calendar and Contacts apps to Android devices.6 Apple also referred to reports that Google plans to release an app for iOS called Switch to Android. It stated that, although Google has not yet submitted the app for its review, [].
• Apple noted that most popular apps are available on both Android and iOS. As such, it considered that the availability of apps to users after switching should not be an issue for switchers.
• With respect to managing subscriptions across devices, Apple stated that neither subscriptions bought through Apple IAP, nor Google Play, can be transferred to the other company’s billing management system after switching. It considered that users would understand the need to cancel their current subscriptions and re-subscribe through another provider. However, it noted that some users may wish to continue paying for a subscription through their prior payment method (linked to their Apple ID) and to access the paid-for app or in-app content via the web or an Android app.
31. In response to our requests for information on this issue, [a party] informed us that Apple offers the Move to iOS app on Android, which can transfer users’ data to an iOS device, including data about which apps were installed on the
6 Apple also stated that, where data that Apple collects is linked to a user’s Apple ID, it is available to the user in a machine-readable and portable format from Apple’s website.
J10
user’s Android device (accessible via an Android API). However, there does not appear to be a mechanism through which a third-party switching app can reliably obtain data on which apps a user has installed on their iOS device. We have also heard that, under Apple’s App store policies that preclude references to other mobile platforms, names such as Move to Android may not be permitted.
32. [A party] provided us with survey evidence that loss of access to data and to apps may deter switching, in particular to Android:
• in 2017, [20-30]% of iOS users would be concerned about losing the data on their phone. [10-20]% of Android users agreed; and
• in the same 2017 survey, [20-30]% of UK iOS users stated that they would be concerned about losing access to apps and features if they switched mobile operating system. The proportion of Android users who agreed was lower ([10-20]%).
Conclusions
33. We consider that several of the factors above pose barriers to switching that may affect a significant number of users, by causing them to perceive switching to be difficult or by imposing costs on switchers. In the round the barriers apply to both switching to Android and iOS, but fall more heavily on switching to Android:
• On balance it appears likely that a significant number of users could find it – or be concerned that it may be – difficult or impossible to transfer data such as contacts, messages, and passwords to a new device. While some users may feel confident using guidance, switching apps and tools to manage this process, others will not and may find that these approaches do not transfer all the data that they require to their new device reliably. This may discourage switching or impose eg time costs on switchers as they resolve any resulting issues. Survey data indicates that both Android and iOS users perceive that switching could impose such costs. However, as set out above, this perception is more widespread among iOS users.
• Android and iOS offer cloud-based tools to transfer the user’s apps and data to a new device of the same ecosystem reliably and quickly, so that users may perceive this to be an easier alternative than switching to a device with a different operating system.
• It appears that third-party switching apps on iOS devices are unable to access data on which apps a user has installed, while this information is
J11
available to Apple’s Switch to iOS app on Android via APIs. Restrictions on the functionality of data transfer apps on iOS suggest that switchers to Android cannot make use of switching apps and tools in the same way as switchers to iOS. We will continue to explore the implications of this for switching.
• With respect to whether users may lose access to preferred third-party apps after switching, we consider that the availability of most popular apps on both Android and iOS ecosystems makes this unlikely to act as a significant barrier to switching.
• With respect to whether having to repurchase or resubscribe to paid-for apps or in-app content after switching may be a barrier to switching: responses suggested that Apple’s policies in relation to IAP (which prevent developers from requiring users to link developer accounts with their Apple ID) contribute to the likelihood that switchers will be unable recover their paid-for apps and content. As set out in Chapter 4 and Appendix H, iOS users may have little or no alternative to using Apple IAP to purchase paid-for apps or in-app content.
• It appears that Google Play billing’s policies do not constrain developers from requiring users to link their Android apps to developer accounts, so that users can more easily recover paid-for apps and in-app content after switching.
• The characteristics of both Apple IAP and Google Play’s billing system cause switchers to lose a significant degree of control over the ability to manage subscriptions bought on another mobile ecosystem. This could impose significant time costs for some users as they migrate subscriptions to their new device, plus financial costs where this process requires them to re-purchase eg annual subscriptions.
34. As discussed in detail in Chapter 6, Apple’s restrictions on cloud gaming services may help to maintain some of these barriers to switching. Cloud gaming services work across platforms and involve streaming games from the cloud to users’ devices, rather than relying on the processing power or storage of the device to run games. This means that a user of such services who switched from a high-end iPhone to a low-end Android phone would be able to access the same games at the same quality before and after switching. By restricting the availability of these services on its App Store, Apple may be obstructing a development in how users can access games, which could make switching from iOS to Android devices easier.
J12
Potential barriers to switching: the availability and characteristics of first-party apps, services and connected devices
Potential to act as a barrier to switching 35. Apple and Google make first-party apps and services available to users of
their mobile operating systems. Many are pre-installed on devices. First-party apps and services may offer, for example, functionality that users expect from the device or additional in-app content: examples include Apple’s iMessage and Apple Music and Google’s Chrome browser and Google Maps app. Apple makes a small number of first-party apps and services available on Android devices, while Google makes most of its core apps and services available on iOS devices (we discuss the firms’ different approaches below).
36. Google and Apple also sell other first-party connected devices, which purchasers may use in conjunction with mobile devices (for example, by operating it via their mobile phone or tablet) or which may share integrated functionality with mobile devices. Examples include the Apple Watch, AirPod headphones and Google’s Nest smart speakers, cameras and thermostats. iOS users may be able to use their mobile device in conjunction with a Google-manufactured connected device and vice versa.
37. As detailed below, respondents set out different views on whether the availability and characteristics of first-party apps, services and devices may pose barriers to switching:
• if preferred first-party apps and services would be unavailable to users after switching;
• if users may lose access to shared functionality between first-party apps, services and connected devices; and
• if users would have a worse experience of interacting with friends’ and family’s devices after switching.
Respondents’ views and evidence
38. Various respondents considered that the availability and characteristics of Apple’s first-party apps, services and devices constituted a barrier to switching from iOS to Android. No equivalent concerns were raised about barriers to switching from Android to iOS.
39. Respondents noted that:
J13
• Almost all of Apple’s first-party apps and services are unavailable on Android devices.7 Thus iOS users would lose access to them on their mobile device if they switch to Android.
• Users of multiple Apple devices may lose access to shared functionality between first-party apps, services and connected devices if they switch mobile operating system. This could worsen their quality of experience when using other Apple devices. For example:
— Some first-party connected devices cannot be used in conjunction with Android devices (eg Apple Watch).
— Some apps and connected devices offer limited functionality when used on or with Android devices (eg AirPods).
— Users may no longer be able to use the same first-party apps on their choice of devices (eg they may no longer be able to use their preferred messaging app on their mobile, tablet and laptop8). There is evidence of high levels of ownership of Apple products and connected devices among UK iPhone owners: [60-70]% own an iPad, [20-30]% own an Apple Mac and [10-20]% own an Apple Watch.
• Users may take account of how Apple devices may offer a better quality of experience than Android devices when interacting with Apple devices owned by friends or family. The features of iMessage may also make using a new Android device harder. Examples include:
— Android users sending number-based interpersonal messages to iOS users will reach the iOS device via Short Message Service (SMS) / Multimedia Messaging Service (MMS) technology, because Apple has not adopted the Rich Communications Standards (RCS) protocol for iMessage. By contrast, iOS users may send number-based messages to other iOS users via a faster, encrypted iMessage service that permits functionality (eg message effects and group chat functions) unavailable when communicating with an Android user. In response to the CMA’s questions, we heard that Apple’s practices impair
7 Apple stated that only Apple Music, Apple TV+, DarkSky Weather and Shazam are available as apps across a range of non-iOS devices (however we note that DarkSky Weather is not available on Android). Apple stated that it makes Apple TV+ and Apple Music available across a range of non-iOS devices because users expect them to be available in this way. iOS apps and services not available on Android (alongside DarkSky Weather) include the App Store, Apple Arcade, Apple Books, Apple Pay, Apple News+, iTunes Store and iMessage. 8 For example, iMessage can be accessed on iPhones and MacBooks.
J14
communications sent between non-iOS device users and iMessage users via SMS / MMS.9
— iOS users may need to manually disable iMessage, via their iOS device or online, to be able to receive messages sent to their number on an Android device.10
40. Apple stated that:
• With respect to the availability of its first-party apps and services: investing in developing these only for Apple’s own products enables it to offer a better user experience.11 It stated that its devices achieve unmatched levels of performance, privacy and security because of this tight integration. The availability of Apple’s apps and services solely on Apple’s products serves to differentiate them in the competitive device market. Apple also stated that they may generate no revenue in themselves, so that it would be irrational to offer them on competing mobile devices.
• Further, Apple stated that its survey data does not indicate that the use of certain products or services prior to switching is significant to mobile switching decisions.
• With respect to potential loss of access to shared functionality between first-party apps, services and connected devices: Apple stated that its connected devices offer interoperability with third-party devices and services to the extent possible and are operable on a standalone basis. In the case of the Apple Watch, Apple stated that it would be constrained technically from enabling users to access the Apple Watch’s full functionality from a third-party device. For example, it stated that the watch’s battery life relies on the use of proprietary technologies to pair with an iPhone for network connectivity and tasks such as receiving calls on the same number.
• With respect to the quality of experience of Android devices when interacting with others’ Apple devices: Apple suggested that it has not
9 We heard that Apple’s practices affect iOS and Android users’ ability to communicate vis SMS / MMS in several ways: messages are delivered slowly and less reliably; users cannot include high-quality images and videos; certain features are hidden or not available (such as location and read receipts); group chat functionality is limited; and users often pay cellular network charges. 10 Dr Greig Paul and Dr James Irvine, Response to the Statement of Scope, 25 July 2021, p.5-6. 11 We note that evidence was cited in a case brought by Epic Games against Apple (Epic Games, Inc. v Apple Inc., United States District Court, Northern District of California, Case No. 4:20-cv-05640-YGR-TSH), relating to practices on Apple’s App Store, which suggested that some Apple employees considered that the non-availability of iMessage on Android would discourage switching away from Apple’s ecosystem. See Epic Games, Inc vs Apple Inc, Findings of Fact and Conclusions of Law Proposed by Epic Games, 2021, paragraph 58, p. 15.
J15
adopted the RCS protocol for number-based messaging because RCS is a new technology and that it is unclear how effective it will be. Apple also noted that alternative third-party messaging services are available on Android and iOS.
41. Respondents provided survey evidence suggesting that a significant minority of users consider access to Apple’s first-party apps and the compatibility of iOS devices with other Apple devices when making purchasing decisions:
• In a 2020 survey submitted to us by [a party], [30-40]% of UK iPhone buyers surveyed considered that access to Apple’s built-in apps was very important to their mobile device purchasing decision.
• In the same survey, [40-50]% of UK iPhone buyers surveyed reported that it was extremely important to their smartphone purchasing decision that Apple products work well with other Apple products.
• In 2021, [30-40]% of UK iPhone users stated that the device working with their other devices was a reason to choose iOS.
• In a 2019 survey submitted by [a party], [60-70]% of UK iPad owners stated that access to Apple’s built-in apps was very important to their purchasing decision.
• In the same survey [70-80]% of UK iPad owners considered that the iPad working well with other Apple products and services was very important to their tablet purchasing decision.
42. Survey evidence submitted to us shows US iPhone users attributed substantial value to iMessage and FaceTime.
43. A significant minority of iOS mobile users consider that switching would mean losing access to services (which could include first-party services) and that switching would affect their quality of experience when using other devices:
• As set out above, in 2017, [20-30]% of UK iOS users stated that they would be concerned about losing access to apps and features if they switched mobile operating system. The proportion of Android users who agreed was lower ([10-20%]).
• 40% of UK iOS users who considered that they were unlikely to buy a smartphone with a different OS stated that they would not switch because their friends and family use iOS. 34% stated that they would not switch because it would mean losing compatibility with other devices they already own.
J16
44. As set out above, respondents did not raise equivalent concerns about Google’s first-party apps, services and devices acting as a barrier to switching from Android to iOS. Many of Google’s core first-party apps and services are available on iOS and its connected devices can be used in conjunction with iOS devices via apps. However, Huawei stated that, because of limits on the availability of certain Google first-party apps and services on its Android operating system, Huawei’s mobile devices may be less attractive to users.
45. Google stated that it does not license its apps for mobile devices that are based on Android but which do not meet the requirements of Android’s Compatibility Definition Document,12 given the risk that they would not function properly, which could harm Google’s reputation. It noted that its apps are available via browser. We understand US sanctions may prevent the licensing of Google’s apps to Huawei’s Harmony OS.
Conclusions
46. In the round, we consider that these factors pose barriers to switching from iOS to Android, which may cause many iOS users to perceive switching to be difficult or impose costs on switchers:
• The limited availability of Apple’s first-party apps and services on Android is likely to make switching less attractive to many iOS users. Broadly we do not consider that this is, for example, also likely to make switching appear difficult or imposes costs on switchers. However, the unavailability of apps such as iMessage on other operating systems is likely to contribute to other barriers to switching, set out below.
• Losing access to shared functionality between first-party apps, services and connected devices poses a barrier to switching for users who own multiple Apple devices and would, for example, no longer be able to use an iWatch or lose access to AirPods functionality (in some cases this may be the result of technical constraints on rolling out functionality interoperable with Android devices). Given the high proportion of iOS users that own multiple Apple devices and the potential replacement cost of devices such as smart watches, this barrier is likely to affect significant numbers of users.
• The diminished experience of interacting with friends and family’s Apple devices after switching – and features of iMessage in particular – also pose barriers to switching. The potential for users who do not disable their iMessage account to have difficulties using a new device for number-
12 https://source.android.com/compatibility/cdd
J17
based messaging is a significant barrier. Apple’s approach of not adopting further potential interoperability with number-based messaging on Android devices (which iOS users may wish to receive) could also diminish the experience of switchers to Android.
47. Limits on the availability of Google’s first-party apps, services and connected devices on Amazon and Huawei’s Android operating systems could act as a disincentive to Android and iOS users from switching to Amazon and Huawei’s devices. This may stymie the expansion of alternative mobile ecosystems, insulating Apple and Google from greater competition. However, these factors would not act as a barrier to Android users switching to iOS.