tacr: bangladesh: city region development project
TRANSCRIPT

Project Number: 39298 September 2010
Bangladesh: City Region Development Project
Technical Assistance Consultant’s Report

TA 7231‐BAN: City Region Development Project
Final Report
September 2010 Chapter 1‐1
Sub-Project: 1
ECONOMIC REVITALISATION – URBAN RENEWAL (SHAKHARI BAZAAR, OLD DHAKA, DHAKA CITY CORPORATION)

TA 7231‐BAN: City Region Development Project
Final Report
September 2010 Chapter 1‐2
Table of Contents
1. Preamble – Economic Revitalisation and Conservation ..............................................................3
2. Purpose and Background .................................................................................................................3
3. The Policy Context.............................................................................................................................5
4. Situation Analysis...............................................................................................................................6
5. Project Vision and Objectives ..........................................................................................................8
6. The Proposal – Description ..............................................................................................................9
6.1 Characteristics............................................................................................................................9
6.2 Philosophy................................................................................................................................ 10
6.3 Activities ................................................................................................................................... 10
6.4 Community and Business Dislocation ................................................................................. 14
7. The Sub-Project Costs ................................................................................................................... 16
8. Benefits............................................................................................................................................. 17
9. Scope for Replication ..................................................................................................................... 17
Annex A-Detailed Base Cost Estimates .............................................................................................. 18

TA 7231‐BAN: City Region Development Project
Final Report
September 2010 Chapter 1‐3
1. Preamble – Economic Revitalisation and Conservation
Urban revitalisation is a process which addresses the multiple and complex problems of urban obsolescence through a process of economic and social investment – characterised by urban redevelopment, rehabilitation and infrastructure upgrading. Typically, it is a process which unlocks the potential of rising land values and provides opportunities for the private sector and communities to invest in the revitalisation process.
The urban revitalisation process is relevant to sustaining a city’s heritage, by conserving its historic buildings and spaces in a sustainable environment that stimulates economic activity and retains employment opportunities. Increased tourism, for instance, often plays a strong role in a sustainable economy for heritage areas.
The potential contribution of heritage areas to the culture and the economy of Asian cities (and elsewhere) is now widely understood, first through the protection of outstanding buildings and monuments, and later through the conservation of whole areas, including residential and commercial streets. Prior to revitalisation these areas were often in poor physical condition and lacking basic amenities, similar in nature to the conditions now found in Shakhari Bazaar (and much of Puran Dhaka in general).
Perhaps the most famous Asian examples of urban revitalisation and conservation are in Singapore, where Government led initiatives have resulted in new economic vitality through the restoration of vernacular architecture at the Boat Quay, Clarke Quay, ‘Chinatown’ and ‘Little India’. In developing countries revitalisation projects are often assisted by international agencies, such as the United Nations Educational, Scientific and Cultural Organisation (UNESCO) and the World Bank (WB), which have sponsored projects in the People’s Republic of China (PRC), Argentina, Brazil, Ecuador, Jordan and Russia. FIGURE1 shows some pictorial examples of successful revitalisation and conservation overseas and in Bangladesh.
The ADB recognises the importance of the historic urban cores of Asia’s cities and has included urban revitalisation in its Urban Development Strategy, adopted earlier.1 The ADB has also published a report titled Revitalisation of Historic Inner City Areas,2 which established a range of generic principles as a context for the design and implementation of revitalisation and conservation projects.
2. Purpose and Background This Sub-Project provides a technical assessment for the economic revitalisation of the Shakhari Bazaar Area in Old Dhaka, within the DCC area. The assessment has been prepared following discussions with representatives of Dhaka City Corporation, the Heritage Committee, the Department of Architecture in the Ministry of Housing and Public Works (MoHPW) and key stakeholders, including the Urban Study Group, all of which have expressed support in principle for the Project Component.3
1 Urban Development Strategy – ADB 2005 2 Revitalisation of Historic Inner‐City Areas – ADB 2008 (Urban Development Series) 3 The Urban Study Group is a voluntary research group supporting heritage conservation
objectives in Dhaka. Including the ’Campaign for Heritage Conservation (Bangladesh)’.

TA 7231‐BAN: City Region Development Project
Final Report
September 2010 Chapter 1‐4
Figure 1:TOWNSCAPES RESTORED AT HOME AND ABROAD
1.1: Club Street in Singapore provides a fine example of historic buildings carefully restored to near-original condition.
1.2: The Temple of the Town God in Shanghai was badly damaged in the 1960s Cultural Revolution. The building is more of a 1990s reconstruction than a Ming Dynasty original.
1.3: This colonial-era house in Khulna has been painstakingly restored and is now used as the headquarters of a food company.
1.4 and 1.5: Two beautifully restored shop houses in Club Street, Singapore.

TA 7231‐BAN: City Region Development Project
Final Report
September 2010 Chapter 1‐5
Broadly, the Sub-Project is intended to achieve the economic revitalisation of Shakhari Bazaar through a series of activities to: (i) conserve the area’s architectural and historic heritage; (ii) upgrade the public realm; (iii) provide utility infrastructure services; and (iv) to ensure its economic vitality as a centre for traditional businesses and as an attraction for tourists.
It is proposed that the Sub-Project will be designed and implemented over a five year period.
3. The Policy Context The future of Shakhari Bazaar and its surroundings was initially in doubt following the collapse of a building in 2004, which resulted in the death of several people. Following this unfortunate event, there was concern that the area would be demolished. Preliminary visual surveys suggested a range of structural risks for some of the buildings and a GoB scheme was prepared showing redevelopment of the area as a series of apartment blocks. It is understood from the consultant team’s discussions with representatives of DCC that this insensitive scheme is no longer being pursued.
In more recent times the historic and cultural value of Shakhari Bazaar has been more widely recognised and the area now enjoys status as a part of the wider Puran (Old) Dhaka Heritage Area. In this context the Campaign for the Conservation of Historic Areas and Heritage Properties, supported by the Urban Study Group4, worked closely with Government in establishing Heritage Area status for Puran Dhaka. The Shakhari Bazaar Area is an important element of Puran Dhaka.
Coordination of policy and proposals in the Heritage Area now rests with a Heritage Committee5, which reports directly to Government’s Urban Development Committee. The Committee consists of representatives from GoB and other stakeholder groups, including the Campaign for the Conservation of Historic Areas and Heritage Properties.
It is understood that, in the absence of comprehensive legislative conservation policy and practice in Bangladesh, the Heritage Area has been realised within the terms of the Building Construction Act 1952 (as amended under the Dhaka Metropolitan Building Construction Rules, 2007): nonetheless, these are largely inappropriate regulatory tools in the modern-day context.6 Additionally the Antiquities Act has provided a context for the identification of several streets and 93 buildings for heritage conservation in the Puran Dhaka area. Some of these buildings are located within Shakhari Bazaar.
Despite these measures, the Heritage Area concept in Shakhari Bazaar (and more generally within Puran Dhaka) remains vulnerable, and will remain so if designation is not matched by a properly-financed and managed programme of conservation area
4 The Urban Study Group is a research group supporting heritage conservation objectives in Dhaka, including the Campaign for Heritage Conservation. (Bangladesh). The Urban Study Group have carried out extensive works in: (i) surveying properties in Shakhari Bazaar and establishing the extent and approximate costs for building restoration; (ii) preparing building restoration schemes for selected heritage sites in Shakhari Bazaar; and (iii) carrying out extensive community consultations and awareness campaign in Shakhari Bazaar. 5 The Heritage Committee membership includes: Convenor: Mr A S M Ismail Chief Architect, Department of Architecture (MOHPW). Twelve Members: Mr Ahmed Kamal, Prof of History Dhaka University; MrFaruk A U Khan, Prof of Architecture BUET; MrRabiul Islam Prof Fine Arts Faculty Dhaka University; Dr.A S M Ahmed, Institute of Architects Bangladesh; Mr.K M AnsarHossain, Institute of Planners; Dr. AKM GolamRabbani, Asiatic Society Bangladesh; Mr.AKhaleq, Regional Director, Department of Archeology; Mr. Sirajul Islam, Chief Town Planner, DCC; Mr.Taimur Islam, CEO Urban Study Group; Deputy Secretary, Ministry of Tourism; Director Department of Environment; Executive Engineer Project Division 4 (PWD).
6The Dhaka Metropolitan Building Construction Rules 2007 includes reference to: “Improvement of urban environment may be ensured by the following, including reference to preserving historical and places of special importance”.

TA 7231‐BAN: City Region Development Project
Final Report
September 2010 Chapter 1‐6
works and building restoration. In this regard some the Heritage Buildings are also listed as being structurally unsound.
Nevertheless, progress has been made, and some buildings of architectural and historic interest have been prevented from being demolished. Significantly, a grant has been provided by the American Ambassador’s Fund for Cultural Preservation (2009) for the restoration of No. 10 Shakhari Bazaar, which is a vested property (section 4 below refers). The Project cost is around USD 52,000 and it is hoped the work will start shortly. On completion, the stakeholders anticipate No. 10 will provide confidence to the local community for the conservation of Shakhari Bazaar, and that it will act as a catalyst for more widespread financing and private sector investment in restoration and improvement works as learnt from overseas experience.
It is intended this Sub-Project builds on the example of No10 Shakhari Bazaar, through the restoration of further heritage buildings, which will provide confidence to the local community for the conservation of Shakhari Bazaar, and that it will act as a catalyst for more widespread financing and private sector investment in restoration and improvement works. This would be typical in the context of the overseas experience.
4. Situation Analysis Shakhari Bazaar is part of a wider area of three streets which provided the foundations for the development of urban Dhaka and dates from the pre-Mughal period (as early as the 16th century).7 This mahalla (traditional neighbourhood) developed over the Mughal period and through the early colonial period as the urban core of Dhaka.
The three streets have differing cultural backgrounds. Shakhari Bazaar has a strong Hindu tradition and is founded on houses and small businesses specialising in decorated bangles, paper crafts, ceremonial accessories for Hindu weddings, time-honouredmusical instruments and traditional Hindu sculptures. Many of these small businesses date back to the Mughal period, such that there are strong family ties to the area. Streetswhich run parallel to Shakhari Bazaar have a primarily Islamic culture and are also characterised by long-standing small businesses, including goldsmiths.
Shakhari Bazaar comprises a street over 1,000 feet (300 metres) in length, lined by shop houses, many of which are still occupied by traditional craft workshops. The traditional buildings are typically two or three storeys tall, mostly around 100 to 200 years old, with a few even older. Many of the ground floors are older, between 200 to 300 years and were built in the Mughal period. The inner parts of the ground and upper floors are mainly residential, although in some buildings the rear parts of the ground floors are also used for craftwork. Typically, the traditional houses are long and narrow and may contain courtyards opening onto open top-floors. The original Mughal architecture is often embellished by surface decorations and carvings.
Over time the traditional Mughal architecture was influenced by colonial architecture, usually extensions built in British-style colonial style architecture and construction, plus other European influences, all of which add to the unique character of the area.
Unfortunately the environment has deteriorated dramatically in recent years, and it is now blighted by a high degree of building obsolescence and disruption in the public realm. The majority of the remaining buildings of architectural and historic interest are at risk through neglect. In spite of this Shakhari Bazaar (and the adjoining streets) remains remarkably vibrant.
Shakhari Bazaar is not yet a major tourist attraction, but within the context of current tourist numbers to Bangladesh, the area regularly attracts visitors. The area is identified
7 The name of Shakhari Bazaar is derived from the decorated bangle crafted from conch shells, which has religious importance to the Hindu Community.

TA 7231‐BAN: City Region Development Project
Final Report
September 2010 Chapter 1‐7
as an attraction in many of the international tourism publications about Bangladesh. Therefore, the conservation and restoration of Shakhari Bazaar would enhance visitor potential, as borne out by overseas experience.
The ownership situation in Shakhari Bazaar is complex (but perhaps little different to other parts of Dhaka), and there are three main types:
• Vested Properties – these are properties in the ownership of absentee landlords, whilst their ongoing administration is exercised by GoB, which has let the buildings by various leasehold and rental formulae. There may be several leases and tenancies within each building: it is understood that the vested properties make up around 60 per cent of the buildings in Shakhari Bazaar. It is also understood that GoB is now reviewing the status of the vested properties, with the possibility of returning them to the original owners.
• Endowed Properties – these properties are properties given over by Hindu religious interests for individual/family occupancy; and
• Private Ownership – private ownership properties are typically occupied by various family interests, such that they may be divided up amongst an extended family and ownership may extend across more than one building.
From the evidence of discussions and a site visit with representatives of DCC Corporation and the Urban Study Group, the lack of public and private investment in the area and uncertainty concerning its future have led to the following significant problems, which are also illustrated by FIGURE2:
• The loss of buildings of architectural and historic importance to redevelopment, which is incompatible in nature, scale, detailing and use of materials with the original vernacular architecture and the public realm in general. In this regard the desire of extended families to remain in Shakhari Bazaar has increased the pressure for buildings of six storeys or more (often illegal), which is out of keeping with the traditional two- to three-storey form of the original buildings;
• A lack of building maintenance by both GoB and the private sector, leading to buildings of architectural and historic significance being in a poor state of repair, and which to varying degrees may be structurally unsound. To this extent there have been previous surveys of structural condition, the most recent of which identified some 12 buildings in Shakhari Bazaar as structurally unsound;
• Buildings of architectural and historic significance where the original exteriors, internal layout and decoration have been badly affected by poorly designed and constructed extensions;
• Complex ownership situations acting as a constraint to public and private investment in revitalising the area;
• The lack of basic services, including public water supply and effective sewerage, in many of the properties. It is understood this is at least partly due to a lack of clarity regarding ownership issues;
• The potentially attractive appearance of the public realm (street) is damaged by a multitude of power cables and telecommunications wires attached to the buildings, solid waste dumped at the street edge and unattractive street surfacing; and
• The vitality and potential attraction of a predominantly pedestrian environment is damaged by the excessive penetration by rickshaws and motorcycles, the

TA 7231‐BAN: City Region Development Project
Final Report
September 2010 Chapter 1‐8
majority of which do not appear to have an origin or destination in Shakhari Bazaar.
5. Project Vision and Objectives Our vision for Shakhari Bazaar is to ensure its long-term sustainability, its culture and its history through a range of actions to upgrade its buildings and spaces, optimising the potential for the partnership(s) between Government, the community and the private sector.
FIGURE 2: SHAKHARI BAZAAR
2.1: An historic façade near the eastern end of Shakhari Bazaar, evidently in need of renovation.
2.2: Shakhari Bazaar is a narrow street congested with rickshaws and darkened by tangles of telecom and electric wires.
2.3: A characteristic balcony on a traditional shop house.
2.4: Interesting ornamentation on this building deserves detailed restoration.
2.5: This crumbling façade at the west end of the Bazaar warrants urgent treatment. The wires should be ‘undergrounded’ too.
2.6: A roof courtyard at No. 10 Shakhari Bazaar.

TA 7231‐BAN: City Region Development Project
Final Report
September 2010 Chapter 1‐9
2.7: Pilaster details in a rooftop temple in Shakhari Bazaar. Details such as this weather away to nothing unless co-ordinated action is taken to conserve the Bazaar.
To achieve this Vision the following four objectives are proposed to ensure:
• The retention of the area’s historically-important buildings and to improve the appearance of adjacent buildings (which do not blend well with the nature and scale of traditional architectural forms);
• Improvements to the visual appearance and pedestrian environment of the street/public realm for the enjoyment of visitors and the local community;
• The needs and aspirations of the community affected by the Sub-Project should be incorporated into the proposed revitalisation of Shakhari Bazaar; and
• That the economic value of Shakhari Bazaar should be optimised as an attractive environment for private sector investment in the area’s conservation.
6. The Proposal – Description
6.1 Characteristics The Sub-Project covers the whole of Shakhari Bazaar and the associated parking and servicing area immediately to its east.
There are over 100 buildings (covering 142 building lots),8 including several vacant lots where buildings have been demolished. Lots are typically long and narrow, with widths mainly between three and four metres. Storey heights vary between two and six storeys, but with most between three and four storeys (72 per cent). Some 79 per cent of the buildings were built before 1900 and very few buildings have been completed in recent years. FIGURE3 illustrates the pattern of old and new buildings.
Shakhari Bazaar has been the subject of several surveys, variously into building characteristics, socio-economic characteristics, ownership and structural condition, which provide a good appreciation of the existing situation. Unfortunately there appear to be some of the information is not entirely accurate and some re-survey is necessary.
Land values are around 40 to 50 lakh per katha.Approximately 2,500 people live in the area and average building occupancy is around 27 persons, reflecting a traditional pattern of multiple-occupancy by extended families. The majority of the owners are over 50 years old and there is also much multiple ownership. Most buildings (including the vested properties) are split between two owners (54 per cent), and single-ownership buildings account for only about 25 per cent of the total. The remainder are in multiple-ownership with between three and six owners per property.
8 Information contained in Section 6.1 has been provided by Dhaka City Corporation.

TA 7231‐BAN: City Region Development Project
Final Report
September 2010 Chapter 1‐10
6.2 Philosophy It is proposed to implement restoration works for buildings with heritage status through a Demonstration Project for five properties, which will: (i) improve the conservation status and appearance of Shakhari Bazaar; (ii) act as a confidence builder in the conservation process for the project affected community and the institutional stakeholders; and (iii) act as a catalyst to attract funding from other agencies familiar with the funding of conservation projects.
The selection of the five buildings will reflect pre-agreed criteria, which respond to the priorities in architectural and historic terms, priorities to rescue buildings at risk and the need for the restoration to be achievable within the three year timeframe set aside for implementation of this Sub-Project, which is essential.
Selection Criteria to assist the process of identifying the five heritage buildings to be included in the Sub-Project are:
Best case demonstrations of the architectural and historic context of Shakhari Bazaar, which demonstrate the process of comprehensive building restoration, including dismantling, retrofitting and stabilisation, restoration of interiors and exteriors, including detailing and provision of basic utilities;
Saving architecturally and historically important priority heritage buildings currently at risk from structural defects;
Being part of group context for conservation, which will optimise the townscape of Shakhari Bazaar;
Minimising the dis-location of owners, businesses and tenants, where the inclusion of at least 1 vacant building in the Sub-Project would be advantageous; and
Optimising ease of implementation in building restoration, through cooperation with owners sympathetic to building restoration in Shakhari Bazaar.
6.3 Activities The following activities will be required to secure the design and implementation of this Project Component.
1) Detailed Design and Project Preparation
This will cover all the detailed design and project preparation activities required to progress the implementation of this Project Component, and will include:
GENERAL
• Review the heritage status of Shakhari Bazaar and heritage buildings, including adjustments and additions to the list of heritage Buildings, and where appropriate making recommendations to amend the regulatory context for the conservation of architecturally and historically important buildings and spaces in the area;
• Identify additional sources of funding for the conservation of Shakhari Bazaar and its heritage buildings from relevant conservation related agencies, such as UNESCO;
• Review the details of funding mechanisms and financial and other incentives to secure the active participation of the community and private investors in the conservation of Shakhari Bazaar; and

TA 7231‐BAN: City Region Development Project
Final Report
September 2010 Chapter 1‐11
• Review the details of the socio-economic status of Shakhari Bazaar, including active small-scale businesses.
FIGURE 3: SHAKHARI BAZAAR, OLD AND NEW BUILDINGS
This plan shows the buildings of Shakhari Bazaar. Those shown in red are traditional buildings, whereas those shaded in blue are of recent construction.
BUILDINGS
• Review the validity and results of previous structural surveys of buildings in Shakhari Bazaar in the context of the conservation objectives for the area;
• Apply the selection criteria, identify and agree the five selected buildings for investment in building restoration as a component of the Sub-Project;
• Prepare detailed designs and costs for the restoration of the five selected heritage buildings, (including the provision of utilities services) to be included as part of this Sub-Project Component; and
• Prepare a set of Design Guidelines and Restoration Advice for use by government agencies, property owners, advisory groups and those members of the community likely to be affected by the Sub-Project through the restoration and upgrading of buildings and the construction of new buildings in Shakhari Bazaar.
PUBLIC REALM
• Review the status and condition of utility services (covering water supply, sewerage, power and telecommunications) in Shakhari Bazaar and prepare detailed designs for their upgrading and/or replacement;
• Prepare detailed designs for the re-surfacing of the public realm/street, in materials appropriate to the conservation context of Shakhari Bazaar; and
• Prepare detailed designs and a management plan to control access by motorised transport and rickshaws into Shakhari Bazaar in order to enable a sustainable pedestrian environment. This should include consideration of access-time restrictions, except for emergency purposes.

TA 7231‐BAN: City Region Development Project
Final Report
September 2010 Chapter 1‐12
2) Upgrading the Public Realm
UPGRADING THE PUBLIC REALM – RECONSTRUCTION AND RE-LOCATION OF UTILITIES SERVICES
This activity will include opening the surface of the public realm in Shakhari Bazaar for the placement of new utilities services and (where required) the removal of the existing utilities services. The work will include the provision of connections to the adjoining properties. It will also include the underground re-location within impermeable conduits of all the overhead power and telecommunication equipment currently situated in the public realm.
UPGRADING THE PUBLIC REALM – RE-SURFACING OF THE STREET (AND PARKING AREA IMMEDIATELY TO THE EAST OF SHAKHARI BAZAAR)
On completing the reconstruction and re-location of the utilities services the street will need to be re-surfaced in materials appropriate to the environment of the Heritage Area, along with any additional hard and soft street furniture and lighting. Here the parking area immediately to the east of Shakhari Bazaar lends itself to the use of soft landscaping to frame the entrance to the Heritage Area. The new surfacing should be to standards capable of accommodating emergency vehicles.
UPGRADING THE PUBLIC REALM – TRAFFIC MANAGEMENT
Access controls on motorised vehicles and rickshaws at specified periods of the day would be enforced by adjustable traffic barriers and blocks, to be installed during the re-surfacing activity.
3) Upgrading the Building Fabric
RESTORATION OF BUILDINGS WITH HERITAGE STATUS
• Restoration works will vary in accordance with the conditions of those buildings with Heritage Status and through agreement with owners and occupiers. In most cases the internal layouts will remain intact and the restoration works will respect this. However, where the structural condition is particularly bad, the building frontage will be restored but the interiors will be re-built and alternative internal layouts can be considered;
• Restoration may include: (i) structural improvements; (ii) provision of basic amenities such as toilets; (iii) restoration of significant features (such internal courtyards, building façades and detailing); and (iv) other cosmetic improvements, such as new internal plastering; and
• Existing building surveys and the additional surveys proposed in the design and preparation stage of this Project will be used to identify the extent of restoration works appropriate to each property.

TA 7231‐BAN: City Region Development Project
Final Report
September 2010 Chapter 1‐13
FIGURE 4: HOLDINGS 62 AND 63 IN SHAKHARI BAZAAR
An elevation of holdings Nos. 62 and 63 in Shakhari Bazaar, illustrating the potential architectural quality of these two buildings.
UPGRADING THE DESIGN AND PROVISION OF UTILITIES TO OTHER BUILDINGS
• For buildings which do not have Heritage Status the emphasis will be on providing technical guidance and incentives to secure: (i) improvements to building façades such that they are more in keeping with the traditional architecture of Shakhari Bazaar; and (ii) provision of basic amenities, such as toilets.
• The proposed Design Guidelines and Restoration Advice (see above) will serve as a context for action in the restoration of all buildings in Shakhari Bazaar, and in particular for action to improve and/or redevelop private property.

TA 7231‐BAN: City Region Development Project
Final Report
September 2010 Chapter 1‐14
6.4 Community and Business Dislocation It is proposed that building restoration will (as far as possible within the timeframe for implementing the Project Component) be sequential and wherever possible avoid dislocating residents and businesses. The extent of restoration will be the main determining factor regarding dislocation, such that – where only minor restoration is required – residents may not be required to relocate and/or may be able to relocate within the building they already occupy. Where the extent of restoration requires residents to temporarily relocate, it should be possible to restrict the relocation to three months at most and ideally only 27 residents (the average building occupancy per building) and one business would be affected at any one time during the implementation of the Sub-Project.
There should be no need for any permanent resettlement as a result of this Sub-Project Component’s implementation.
It is proposed that all temporary relocation will be in the locality of Shakhari Bazaar by using alternative rental premises nearby. One possibility would be to use one of the restored buildings (which had been previously vacant) for this purpose, such as No 10 Shakhari Bazaar. This building is now vacant and once the proposed restoration is complete can be used to accommodate residents who may need to be temporarily re-located.
It is proposed that all dislocation costs would be borne by the Implementing Agency for the Sub-Project and would include any additional rental implications.

TA 7231‐BAN: City Region Development Project
Final Report
September 2010 Chapter 1‐15
FIGURE 5: HOLDINGS 10 AND 11 IN SHAKHARI BAZAAR
An elevation of holdings Nos. 11 (left) and 10 (right) in Shakhari Bazaar. Upgrading of No. 10 has been agreed in principle. When completed it could be used as temporary accommodation for residents displaced from their homes by restoration work.

TA 7231‐BAN: City Region Development Project
Final Report
September 2010 Chapter 1‐16
7. The Sub-Project Costs
The estimated costs for this Sub-Project (Excluding Detail Design, Study and Capacity Building) are estimated to be in the order of USD 911,580. Preliminary capital cost estimates for the restoration of the 5 Phase 1 Heritage Buildings are around USD 569,675 and for the upgrading of the Public Realm the estimate is around USD 102,979.
If all the buildings with heritage status were fully restored then the cost estimate is in the order of USD 6,860,507.
As stated above the costs of building restoration will vary from building to building according to the nature and scale of restoration works that are required. In this context each of the buildings with heritage status (the old buildings) has been assessed to identify the most appropriate level restoration works and the potential costs of the works9.
Five broad levels of restoration works are identified:
(i) Dismantling of old buildings and buildings with horizontal and vertical extensions as necessary – 83 affected buildings with a total cost of USD195,652;
(ii) Retrofitting and Stabilisation of all old structures – 33 affected buildings with a total cost of USD1,141,304;
(iii) Restoration of old buildings – 83 affected buildings with a total cost of USD3,423,913;
(iv) Upgrading of Utilities – 83 affected buildings with a total cost of USD786,232; and
(v) Renovation of Modified Parts of old buildings – 50 affected buildings with a total cost of USD1,313,406.
In this context average building restoration costs are some USD 81,475, but for the purposes of this Sub-Project a higher cost per building of USD 100,000 is assumed to allow for a worst case scenario.
9 Urban Study Group Survey ‐
Table 1: Sub-Project Cost Estimates
Project Activity Cost (USD) million
1 Upgrading the Public Realm and Utilities Provision 102,979
2 Restoration of Buildings with Heritage Status. 569,675
3 Contingencies 238,925
Total Cost 911,580

TA 7231‐BAN: City Region Development Project
Final Report
September 2010 Chapter 1‐17
8. Benefits The following benefits will accrue from the conservation and enhancement of the Shakhari Bazaar Heritage Area and associated heritage buildings:
• Improved visitor/tourist potential, providing an enhanced business environment for local businesses and investment;
• Improved operational conditions for local businesses through improvements in the public realm;
• Improved living and working conditions for the residents, through building restoration and the provision of enhanced basic amenities (for example, clean water supply);
• Improved capacity in the local community to meet collective needs and aspirations;
• Greater certainty in the future of the Shakhari Bazaar, thus providing the confidence for private-sector investment in building restoration and/or sustainable building redevelopment, and to realise the benefits of increasing land values; and
• Improved and sustainable environmental conditions in the public realm and through building restoration.
9. Scope for Replication The results and lessons learned from this Sub-Project will lay the foundations for replication in the wider area of Puran Dhaka and elsewhere in Bangladesh, where consideration can be given to the potential for the historic buildings to be included in the 2nd Phase of CRDP.

TA 7231‐BAN: City Region Development Project
Final Report
September 2010 Chapter 1‐18
Annex A-Detailed Base Cost Estimates Cpt. Unit Totals No. Description Unit Quantity Rate (US$) (US$) (inc tax) PROJECT PREPARTION
1 Detailed Design LS 1 1,466,600 1,466,6002 Capacity Building LS 1 250,000 250,000
Sub Total 1,716,600 BUILDING RESTORATION
3 Dismantling Old Buildings sqf 18,072 0.65 11,7864 Retrofitting and Stabilisation sqf 26,515 6.52 172,9255 Restoration sqf 21,084 9.78 206,2606 Upgrading of Utilities (internal) sqf 21,084 2.25 47,3637 Renovation of Modified Building Parts sqf 12,500 10.51 131,341
Sub Total 569,675 PUBLIC REALM
8 Construction of Main Road m 299 108.70 32,5009 Side Road Resurfacing m 245 36.23 8,877
10 Utilties Upgrading and Replacement Sewer Line m 299 26.09 7,800 Water Supply Main m 608 26.09 15,861 Power and Telecommunications m 299 26.09 7,800 House Connections No 142 17.39 2,470
11 Earth Works Excavation ‐ sewer line & water supply main cum 894 11.59 10,362 Excavation ‐ water line & other utlities cum 365 11.59 4,229 Shoring Works m 598 7.25 4,333
12 Upgrading of Parking Area sqm 920 9.51 8,748 Sub Total 102,979 TOTAL COSTS 2,389,254 Contingency 10% 238,925 COSTS + CONTINGENCY 2,628,180 Assumed Exchange Rate USD = BDT 69 No = Number cum = Cubic Meter sqm = Square Meter sqf = Square Foot m = Meter kg = Kilo Gram LS = Lump Sum km = Kilo Meter

TA 7231-BAN: City Region Development Project Final Report
September 2010 Chapter 5-1
Sub-Project: 2
ECONOMIC REVITALISATION – REGIONAL RIVER PORT, NOAPARA (JESSORE DISTRICT)

TA 7231-BAN: City Region Development Project Final Report
September 2010 Chapter 5-2
Table of Contents
1. Purpose and Background......................................................................................................3
2. The Policy Context ................................................................................................................4
3. Situation Analysis..................................................................................................................4
4. Project Vision and Objectives ...............................................................................................7
5. Regional River Port – Phased Development.........................................................................7
6. The Proposal – Description...................................................................................................8
6.1 Detailed Design and Project Preparation.......................................................................8
6.2 Implementation ..............................................................................................................9
7. Land Ownership ..................................................................................................................13
8. The Sub-Project Costs ........................................................................................................13
9. Benefits ...............................................................................................................................14
10. Scope for Replication ......................................................................................................14
11. Economic Assessment ....................................................................................................15
10.1 Methodology and Assumptions....................................................................................15
10.2 Economic Benefits .......................................................................................................15
10.3 Economic Analysis and Sustainability..........................................................................16
12. Financial Assessment......................................................................................................17
11.1 Methodology and Assumptions....................................................................................17
11.2 Financial Analysis and Sustainability ...........................................................................17
Annex A-Detailed Base Cost Estimate.......................................................................................20

TA 7231-BAN: City Region Development Project Final Report
September 2010 Chapter 5-3
1. Purpose and Background This Sub-Project provides a Feasibility Assessment (the ‘Assessment’) for the economic revitalisation of the Regional River Port Area in Noapara, part of Jessore District. The Assessment has been prepared following discussions with representatives of the Bangladesh Inland Water Transport Authority (BIWTA), the Mayor of Noapara Pourashava and key professional officers, together with representatives of the port users, all of which have expressed in-principle support for this Project Component.
In this context there were three joint meetings between the ADB Consultant’s team and representatives from BIWTA and Noapara Pourashava, plus further separate meetings with both agencies1.
The Sub-Project is intended to achieve the upgrading and expansion of the Regional River Port and the associated port back-up facilities. This will be focused on: (i) strengthening the docking facilities for river craft; (ii) providing improved road access to the docking facilities; (iii) providing centralised storage, customs, office and vehicle parking facilities and (iii) dredging the Bhairab River to allow 24-hour docking. The Component also includes improved road access to the upgraded river port area. The river port operations are entirely for freight traffic.
It is proposed the Sub-Project will be designed and implemented over a three-year period.
It should be noted that this sub-project would not be included within the first batch of sub-projects earmarked for implementation under the ADB loan program. During the appraisal of the sub-project, several issues remained unresolved.
(i) The proposed design of the sub-project requires substantial land acquisition and impacts on the existing go-downs and other structures along the river bank to build a service road. The proposed design is not fully supported by the local community and the pourashava;
(ii) The Pourashava has proposed alternatives to those documented in this report, which essentially makes the service road narrower to minimize the impacts on the existing structures, and include additional access roads from the highway to the service road in order to compensate the reduced traffic capacity along the service road.
(iii) Pourashava also proposed that the service road and the access roads would be implemented by pourashava to facilitate the consultation with the community.
(iv) The proposal of the pourashava is not supported by BIWTA, another significant stakeholder of the project.
Because of the above issues it is concluded that the subproject would only be financed and implemented when the stakeholders reach agreements and consensus with regard to (i) the method of land acquisition; (ii) the appropriate design of the project, and (iii) implementation arrangement.
1 Note that Noapara may alternatively be transliterated as ‘Noapara’ or ‘Nowapara’. Noapara Pourashava prefers the latter transliteration and this convention is respected here when references are made to the Pourashava.

TA 7231-BAN: City Region Development Project Final Report
September 2010 Chapter 5-4
2. The Policy Context Noapara is contained within the boundaries of the Khulna Structure Plan, which provides a broad context for the planning of the area during the period from 2001 to 2020. The Structure Plan assumes phased urban development in and around Noapara over the plan period, although it is not clear how this will be achieved. The Plan also proposes a new town centre for Noapara, which is intended to de-congest the existing town centre by developing land between the railway line and the planned Noapara by-pass, although again it is not clear how and when it will be implemented.
The Structure Plan is not specific regarding the use of the River Bhairab for commercial and port uses, but, KDA (in discussion with representatives of LGED, ADB and the Consultant) have not expressed any opposition to the proposed river port at Noapara.
More detailed planning is contained in the Noapara Municipal Development Plan (MDP) prepared by the Pourashava under the guidance of the UGIIP-1 Project. The proposals contained in the MDP are complementary to the proposed Regional River Port.
Noapara was declared a river port in 2004 and the foreshore was formally handed over to BIWTA in 2007. Investment in the river port facilities has so far been constrained and limited to a small and inadequate jetty. More recently BIWTA has prepared a project proposal for the establishment and improvement of the Regional River Port facilities at three locations, including Noapara2. The proposed project at Noapara includes a section of river dredging, new berthing facilities, an approach road and a terminal/operations building. The estimated cost of these proposals as shown in BIWTA’s project proposal report is approximately USD 8 million.
LGED is proposing to build a road bridge connecting the west and east sides of the Bhairab River, which will cater for vehicular access from the Khulna-Jessore highway on the west side of the river. This in turn may provide the opportunity for further Regional River Port expansion and development.
3. Situation Analysis Noapara has a long history of being a commercial and trading centre and in the 1960s several traditional industries were established, including jute. Although the jute industry subsequently declined Noapara has successfully established a modern industrial estate, which includes a privately-owned and prosperous jute mill and a large food and beverage factory. Industrial development was reflected by the growth in the use of the Bhairab River as a trading port, based on its relationship with local and regional industry and transport links by road and rail with both the south and northern parts of Bangladesh, with India and with the ports of Chittagong and Mongla (the last-mentioned by road only to the south of Khulna).
The population of the Pourashava is estimated to be 86,000 and is forecast to reach 117,000 by 2020. There are approximately 22,000 persons working in local industry and commerce, of whom some 5,000 work in loading and unloading activities, mostly connected with the river port. The industrial/commercial sector includes some8businesses, comprising jute mills, textile mills (cotton), cement factories, fertiliser factories, cotton ginning and the second largest rice mill in Bangladesh.
The river port has expanded over time, such that the port limit is for 12.35 kilometres of river stretching both north and south of the main built-up area of Noapara. Total individual cargoes are estimated at between 700 and 800 per year. Use of the port
2 Development Project Proposal for Establishment of River Port at Nowapara, Bhairab‐Ashuganj and Barguna (BIWTA‐March 2008)

TA 7231-BAN: City Region Development Project Final Report
September 2010 Chapter 5-5
varies in accordance with the yearly agricultural cycle and peak periods are from January to March. The primary import/export items include cement, fertiliser, clinker and coal, stone chips, sand and chemicals. Estimated annual earnings from the regional port currently stand at approximately 570,000 USD3.
The majority of trade at the port is through a number of private port and industrial operators who have direct access to the Bhairab River along 12 kilometres of port frontage. This is far from satisfactory because vessels have to unload on to the river foreshore. Loading/unloading is mainly by head-porterage, usually across gang-planks between vessels and the foreshore; this is slow and inefficient. Vehicular access to these foreshore areas is via a series of largely un-made standard private roads or tracks from the Khulna-Jessore highway. The private berthing facilities are supplemented by the public loading/unloading jetty, which is situated at the northern end of the built-up area of Noapara Pourashava. This area has both road and rail access, but these and other port back-up facilities are inadequate to cater for regular loading and unloading operations, particularly during peak operational periods. Again there are no cranes and/or mechanised loading/unloading facilities. From the information provided by BIWTA it is apparent that the water depth does not allow the free passage of ships during low-tides, which again reduces the efficiency of port operations.
3 Development Project Proposal for Establishment of River Port at Nowapara, Bhairab‐Asuganj and Baranga (BIWTA‐March 2008) BIWTA Reports

TA 7231-BAN: City Region Development Project Final Report
September 2010 Chapter 5-6
FIGURE 1: NOAPARA PORT AND TOWN
1.1: The MV New Sonali rests against the river bank in the present-day Noapara Port.
1.2: Stevedores carry fertiliser sacks on their heads as they unload a ship at the port.
1.3: Road and rail facilities at Noapara Port. Both could benefit from upgrading.
1.4: A general view of the Bhairab River and the port at Noapara.
1.5: The busy main street of Noapara. Port expansion must not burden this street with significant extra traffic.
1.6: Passengers cross the river on small ferries. The east bank (in the background) could also become a port.
From the evidence of the discussions and site visits with representatives of BIWTA, Noapara Pourashava and the port users, the restricted nature of public and private investment in the Regional River Port has constrained its operations and its potential for further development and expansion. There are several significant problems (FIGURE 1 refers):
• There is insufficient draught at low tides to allow the passage of many of the port users’ vessels;
• The pattern of individual jetties, mainly in private ownership, restricts the number of vessels that can load and unload at any one time, thus leading to queuing during peak operating periods;

TA 7231-BAN: City Region Development Project Final Report
September 2010 Chapter 5-7
There are no ‘hard edge’ docking facilities that allow vessels to load/unload directly into trucks and/or rail wagons and there are no cranes or other forms of mechanisation to assist the loading and unloading of vessels;
• There is insufficient provision of port back-up facilities, including parking areas, hard-standing and storage areas, and railway sidings to support loading and unloading operations, particularly in the public loading and unloading area. The potential to use railway access into the port area is not properly realised;
• Access into the port back-up areas is generally poor and the existing access point into the public area is inconvenient and likely to cause local traffic congestion;
• There are conflicts between port usage and the main built-up area of Noapara, where urban development restricts access to the foreshore in parts of the port area, as well as the potential to use rail access;
• There are no properly-planned port office/administration facilities or port customs facilities; and
• Port traffic uses the Khulna-Jessore highway, which traverses the commercial and retail centre of Noapara, causing traffic congestion and conflict, creating air pollution and contributing to a poor pedestrian environment.
4. Project Vision and Objectives Our vision is to optimise the economic potential of the Regional River Port to the benefit of the port users and traders, local businesses and to the benefit of Noapara residents and the surrounding area as a whole.
To achieve this vision the following five objectives are proposed to ensure:
• 24-hour usage of the Regional River Port docking facilities by all vessels, by increasing water depths;
• Improved docking and port back facilities facilitating efficient and cost-effective port operations, which are accessible to all port users and which will result in increased port usage and trading;
• Increased employment opportunities through increased port usage and trading; and
• Increased economic activity and spin-off business development in Noapara and the surrounding area as a whole.
5. Regional River Port – Phased Development The proposals are prepared in the context of expectations of increased economic activity as a result of Regional River Port development and upgrading. At present it is clear from the evidence of the Consultant’s discussions and site visits that the present port operations are constrained, as described in Section 3 above. If these constraints are addressed there is the potential for increased economic efficiency of the existing port and thus expansion in usage. In particular, this would be the case if there is an improved public port facility incorporating comprehensively-designed back-up facilities.
In the longer term the regional economic indicators suggest the need for further expansion matching the rapid economic growth, which potentially may occur in the Khulna-Jessore region once the essential strategic road, rail and infrastructure networks are in place. It is not yet clear what the nature and scale of the demands for further expansion of the Regional River Port facilities will be if such longer-term growth occurs. This requires further study in the context of an emerging regional development framework and plan.

TA 7231-BAN: City Region Development Project Final Report
September 2010 Chapter 5-8
For the longer term, one option would be to develop facilities on the eastern bank of the Bhairab River opposite the existing Port area. There is ample largely-undeveloped land for a new port and port back-up facilities, but development will depend on bridging the Bhairab River with a fixed-crossing capable of withstanding heavy goods traffic.
It is therefore recommended to take a cautious approach to investment in Regional River Port facilities in Noapara, through at least two phases of development, where this Sub-Project will only be concerned with financing of Phase 1 (below).
• Phase 1 – Upgrading of the Existing Regional River Port, including upgraded public port facilities and port back-up up facilities and better port facilities for private users.
• Phase 2 – Expansion of the Regional River Port, including new port facilities and port back-up facilities on the eastern bank of the Bhairab River.
6. The Proposal – Description The following activities will be required to secure the design and implementation of this Project Component:
6.1 Detailed Design and Project Preparation This will cover all the detailed design and project preparation activities required to progress the implementation of this Project Component, covering:
• Bhairab River investigations, including: (i) flow monitoring and depth profiling; and(ii) geotechnical investigations, including foreshore areas;
• The design of river-dredging operations;
• The design of river bank docking structures, and loading/unloading facilities;
• The design of public port back-up facilities, including operational parking and servicing areas, godowns, office accommodation, customs facilities; and
• The design of a truck terminal to assist in serving the needs of the Regional River Port.
It is also proposed to carry out an Economic and Planning Study of the Regional River Port to establish a scenario (or scenarios) for future river traffic and cargo demand levels. This would provide essential guidance for the planning of the river port and its longer term development potential.

TA 7231-BAN: City Region Development Project Final Report
September 2010 Chapter 5-9
6.2 Implementation River Dredging
Existing depths in the Bhairab River suggest average depths of between 2 and 2.5 metres. Dredging should secure a minimum depth of four metres in accordance with the requirements of BIWTA. Dredging is required for a minimum distance of 16 kilometres, and this should permit use of the river by vessels at all tide conditions.
FIGURE 2: THE REGIONAL RIVER PORT (CONCEPT)
Concept drawing showing proposed service road, docking facility and public port/port back-up area.
The Port Facility
The river banks will be re-constructed as a port facility for a distance of six kilometres along the western foreshore of the Bhairab River and this is shown in FIGURE 2 above. A hard surface vertical docking wall will be constructed to facilitate direct loading/unloading in the proposed public port area and from/to hard-standing area walkway.

TA 7231-BAN: City Region Development Project Final Report
September 2010 Chapter 5-10
Following extensive discussions with representatives of Noapara Pourashava and the port users the hard standing walkway will run parallel and to the edge of the dock and will be capable of accommodating direct unloading/loading from and into the private port users facilities which are spread along the river frontage. The hard standing will be constructed to a minimum width of 13 ft, to avoid incursion into private land holdings and to reduce dislocation and compensation issues. Where conflicts with existing land uses will not occur the hard standing will be designed to be wider, up to a design maximum of 50ft. The minimum width of 13 ft is sufficient to accommodate most trucks (on a one way flow basis).
The hard-standing will have restricted access for the private port users only and will not be publicly accessible by vehicles (except for emergency and maintenance purposes). Access to the national highway will be via the existing private access roads and tracks, which will continue to be maintained by the private port users.
FIGURE 3 illustrates a typical profile and plan for the vertical docking wall and hard standing walkway.
The current intention is that the port facility and hard standing walkway will run 3 kms north and south of the proposed public port-back up area, but this will be the subject of further discussion with the key stakeholders, particularly the port users. Adjustments may be made as appropriate during the design and preparation stage of the Sub-Project, such that there could be an emphasis on a southerly or a northerly direction depending on the detailed on-ground situation.
The design for the hard standing is not ideal and further consideration may still be given to a wider service road capable of accommodating continuous traffic flows and a loading/unloading area, immediately adjacent to the dock. This is preferred from the highways and operational viewpoint. FIGURE 4 illustrates this alternative.

TA 7231-BAN: City Region Development Project Final Report
September 2010 Chapter 5-11
Figure 4: Plan and Section of the Port Service Road (example)
The Port Back-Up Area
The port back-up area is proposed to be on land surrounding the existing public jetty constructed by BIWTA at the northern edge of the main built-up area of Noapara. The area will be hard-surfaced and include the operational parking/servicing, offices, customs facilities and godown(s). Vehicular access into the port back-up area will be improved and it is also proposed to re-align the railway siding to enable direct loading and unloading between railway wagons and river craft. The rails will be sunk into the hard standing within the port back-up area, to minimise conflict with road vehicles. To be clear, it is not proposed to run the railway along the whole length of the port facility. This facility is only proposed to be available in the port back-up area. FIGURE 4 illustrates a potential conceptual layout and access arrangements for the port back-up area.

TA 7231-BAN: City Region Development Project Final Report
September 2010 Chapter 5-12
FIGURE 5: PORT BACK-UP AREA
Concept drawing providing outline of the proposals for the Port Back-up Area..
It is proposed that the port back up area will be operated as a public facility. This may be through BIWTA or through a PPP arrangement (Sub-section 10.2 refers).
Uses in the proposed port back-up area include a passenger and vehicular ferry service from a landing point close to the public jetty to the eastern foreshore of the Bhairab River. It is intended that these services will be retained at least until such time as the proposed bridge across the river is constructed.
The Truck Terminal
It is also proposed to construct a public Truck Terminal, which will facilitate dedicated truck parking for the port and for the general needs of the Noapara commercial sector. The facility will contain a hard surfaced area for the parking of trucks, together with office and toilet facilities etc.
The site of three acres is on Government land and is situated south of the main built up area of Noapara, situated between the national highway and the Bhairab River.
Community and Business Dislocation
Dislocation and disruption of the residents and businesses affected by the project will be minimised during the course of port development and construction, although it is anticipated that, inevitably, there will be some disruption.
It is understood that land 50 feet (15 metres) back from the Bhairab foreshore is legally GoB land. The majority of the proposed port facilities and the service road can therefore

TA 7231-BAN: City Region Development Project Final Report
September 2010 Chapter 5-13
be constructed without the need for private land. It is noted that there are some sections of the foreshore where various building uses are situated partly within this GoB area, particularly in the vicinity of the commercial heart of Noapara. In a worst case scenario a number of buildings may be affected by the proposed new port facility and service road (i.e. within the 50-feet foreshore area). Of these some are residential properties, but they are understood to be illegal and temporary structures. In technical terms it is possible to avoid at least some of the buildings by constructing the port further into the Bhairab River and this option will be examined. This may occur in a situation where a full service road and dedicated loading/unloading facilities are constructed immediately adjacent to the dock/river edge as illustrated in figure 4.
Should the currently proposed option based on a minimum 13 feet hard standing/ walkway be implemented then the number and scale of dislocation will be minimised. Any sections where the hard standing is significantly more than 13ft would be in areas where private property will not be affected.
The Port Back-up area includes some buildings in private ownership, including several godowns close to the foreshore and which would obstruct good loading and un-loading operations. Consideration will be given in conjunction with the owners to re-location elsewhere on-site or off-site.
Should any residential and business property be cleared to implement the port proposals, then a compensation package will be offered in accordance with ADB guidelines and practice.
7. Land Ownership Implementation of the Regional River Port upgrading will incorporate land in private ownership, including parcels of land within the proposed Port Back-Up area. It is also noted that the Bangladesh Railway holds land within the Port Back-up area.
This land can be programmed for purchase/compulsory purchase by GoB in line with the timing for the implementation of this Sub-Project. Alternatively, and where it is in the interest of both the public good and private landowners, legal agreements should be sought with private owners to allow the incorporation of private land holdings into the Sub-Project Proposals. This might be through long-term leasing, a variety of GoB agreements, such as rights-of-way, or even land swapping. Representatives of the port users/land owners have expressed an ‘in principle willingness’ to co-operate with GoB agencies to facilitate the use of private landholdings as part of the Port Upgrading under agreement, rather than through land sales. This view was put forward by the port users at a meeting with representatives of BIWTA, Noapara Pourashava, and the Consultant’s team in Noapara and is also preferred by the consultant team.
It is assumed that similar agreements can be reached with the Bangladesh Railway for incorporation of partly-redundant railway land into the Port Back-up area. This will be to the benefit of the Bangladesh Railway because it is proposed to re-align the railway siding alongside the proposed dock.
8. The Sub-Project Costs The estimated costs for this Sub-Project are in the order of USD 25.93 million, as shown in TABLE 1 below.
The first phase implementation of the new port facility and service road should be restricted to a total of six kilometres out of a total port length of 12 kilometres. The reason for this is mainly in the interest of saving costs, whereby the Consultant has restricted the percentage take from the total Project Loan amount to 15 per cent in order to facilitate financing of other proposed Sub-Projects. Implementation of the port facility

TA 7231-BAN: City Region Development Project Final Report
September 2010 Chapter 5-14
and service road for the whole 12 kilometres would bring the cost to over USD 40 million.
TABLE 1: SUB-PROJECT COST ESTIMATES
Project Activity Cost (USD) million
1 River dredging 6,782,609
2 The port facilities, port backup-area, service road, off-site access and utilities infrastructure 16,377,267
5 Re-location/construction of go downs 579,710
6 Truck Terminal 960,000
7 Contingencies @ 5% 1,234,979
Total Cost 25,934,565
9. Benefits The following benefits will accrue from Regional River Port Upgrading at Noapara:
• More efficient and cost-effective port operations for all port users, including quicker loading and unloading (turn-round times) times, thus reducing operation costs and reducing queuing in operational periods, thereby creating additional port capacity;
• Improved financial viability for the port operator(s), including BIWTA as an outcome of the port upgrading and expansion;
• Increased employment opportunity at the Regional River Port resulting from the upgrading and expansion of port operations;
• Increased employment opportunity through spin-off and linked employment activities in Noapara and the surrounding area, resulting from the upgrading and expansion of port operations;
• Improved traffic flows and safer conditions as a result of the proposals for revised access into the port and port back-up area;
• Phase 1 of the Regional River Port Upgrading may act as a catalyst for increasing and sustaining port expansion over a longer time period, thus triggering the need to implement a Phase 2 programme of River Port development (Section 5 refers).
10. Scope for Replication The results and lessons learned from this Sub-Project will lay the foundations for replication for other ports similarly proposed for upgrading by BIWTA, including Bhairab-Ashuganj and Barguna.

TA 7231-BAN: City Region Development Project Final Report
September 2010 Chapter 5-15
11. Economic Assessment
10.1 Methodology and Assumptions Economic analysis has been conducted in accordance with the ADB’s Guidelines for the Economic Analysis of Projects (1997) and the Framework for the Economic and Financial Appraisal of Urban Development Sector Projects (January 1994).
The following approach and assumptions have been used in the analysis:
All prices are expressed in 2010 prices and economic analysis is conducted at 2010 constant price;
An average exchange rate of Taka 69 per US$1.00 is employed when converting foreign exchange costs to local currency equivalent;
Economic prices of capital works and annual operation and maintenance are calculated from the financial cost estimates of the technical team, adjusted to allow for transfer payments and to correct for any other market distortions;
Price contingencies and interest during construction (as a result of any debt financing) are excluded in the calculation of economic internal rate of return (EIRR) but physical contingencies are included because they represent real consumption of resources;
Taxes and duties are excluded because they represent transfer payments;
All costs are valued using the domestic price numeraire; tradable inputs, net of duties and taxes, are adjusted by the shadow exchange rate factor of 1.13 while non-tradable inputs (except for unskilled labor), net of taxes and duties, are adjusted by a conversion factor of 0.9; unskilled labor is adjusted by a conversion factor of 0.7 of the market wage rate to estimate the shadow wage rate;4
The economic opportunity cost of capital (EOCC) is assumed at 12% in real terms; and
Project component is assumed to have useful economic life of 25 years; equipment portion of the component is assumed to have useful economic life of 7 years.
10.2 Economic Benefits The project component will upgrade and expand the Regional River Port in Noapara and the associated port-back facilities. It will strengthen the docking facilities for river craft; improve road access to the docking facilities; provide centralised storage, customs, office and vehicle parking facilities and dredge the Bhairab River to allow 24 hour docking. It will also improve road access to the upgraded river port area.
The improvements in the river port area will increase the use of the Bhairab river as a trading port, based on its relationship with local and regional industry and transportation links by road and rail with both the south and northern parts of Bangladesh, with India and with Chittagong and Mongla ports. The river port operations are entirely for freight traffic. Economic benefits therefore are quantified in terms of increase in cargo vessels berthed and cargoes handled in the port. At present, 12 vessels on average take berth in the port each day. Average daily volume of cargoes handled consist of 3,900 metric tons of bulk cargoes5 and 23,600 cubic feet
4 Conversion factors for economic shadow pricing are based on recently approved ADB projects in Bangladesh. 5 Includes jute, clinker, coal, food grains, poultry food, fertilizer, fly ash, oil (soya bean), firewood, etc.

TA 7231-BAN: City Region Development Project Final Report
September 2010 Chapter 5-16
of sand and stone chips.6 After project completion, it is assumed that the volume would increase at least 6 times7. It also assumed that the volume will increase thereafter in line with GDP growth assumed at 5% per annum. The incremental economic benefits are valued in terms of current landing shipping charge and berthing charge8.
Other benefits which are not easily quantifiable or could result to double counting and hence not accounted for in the analysis include: increase in jobs, increase in commercial activities and spin-off of business activities in Noapara and surrounding areas as a whole.
10.3 Economic Analysis and Sustainability The purpose of the economic analysis is to determine if the component’s EIRR exceeds its EOCC, in real terms. If the component’s EIRR exceeds its EOCC, it can be concluded that the component is economically viable.
Sensitivity analyses have been undertaken in order to test the robustness of the economic results to adverse changes in conditions. The following adverse changes have been analyzed:
A capital cost overrun of 10%;
An increase in the O&M cost by 10%;
A reduction in the benefits by 10%; and
Project component benefits delayed by one year.
The results of the economic and sensitivity analysis are shown below.
EIRR and Sensitivity Analyses
Scenario NPV / 1
(‘000 Taka) EIRR (%) SI / 2 SV / 3 % Change
Base Case 648,208 16.88% 10% Increase in Capital Costs 530,218 15.73% 2.37 42% 10% 10% Increase in O&M Costs 600,406 16.52% 0.74 135% 10% 10% Decrease in Benefits 417,596 15.24% 3.37 30% 10% Project Benefits Delayed by One Year 364,948 14.59% 1/ NPV = Net Present Value discounted at EOCC 2/ SI = Sensitivity Indicator (ratio of % change in EIRR above the cut-off rate of EOCC to % change in a variable) 3/ SV = Switching Value (% change in a variable to reduce the EIRR to the cut-off rate of EOCC) Source: Consultant’s calculation
Based on the results above, it can be concluded that the proposed component is economically viable under the base case scenario and also under adverse changes in conditions. The sensitivity analysis indicates that the proposed component is most sensitive to delay in project benefits and reduction in benefits, but remains well above the EOCC.
The economic sustainability of the proposed component largely depends on the implementing agency’s capability to operate and maintain the infrastructure facilities sustainably. Unless the infrastructure facilities can be operated and maintained sustainably, the economic benefits assumed in the analysis will not materialize. The projected income statement and cash flow statement (see section on Financial Assessment) of the project component in the long term show that adequate funds will be available to operate and maintain the infrastructure facilities sustainably.
6 Source: BIWTA survey conducted from 4 to 10 September 2006. 7 BIWTA estimates increase of 10 to 15 times. 8 Bulk cargo at Taka 30 per metric ton; sand and stone at Taka 0.22 per cubic feet; berthing charge at Taka 200 per
vessel per day.

TA 7231-BAN: City Region Development Project Final Report
September 2010 Chapter 5-17
12. Financial Assessment
11.1 Methodology and Assumptions Financial analysis has been undertaken in accordance with the ADB's Framework for the Economic and Financial Appraisal of Urban Development Sector Projects (January 1994) and the Guidelines on the Financial Governance and Management of Investment Projects Financed by the ADB (January 2002).
The following approach and assumptions have been used in the analysis:
After project completion, the average volume of cargo vessels berthed and cargoes handled in the port would increase 6 times;
Landing shipping charge for bulk cargo is at Taka 30 per metric ton while sand and stone at Taka 0.22 per cubic feet; berthing charge is at Taka 200 per vessel per day;
All prices are expressed in 2010 prices and calculation of financial internal rate of return (FIRR) is conducted at 2010 constant price;
An average exchange rate of Taka 69 per US$1.00 is employed when converting foreign exchange costs to local currency equivalent;
Financial prices of capital works and annual operation and maintenance are based on the financial cost estimates of the technical team;
Price contingencies and interest during construction (as a result of any debt financing) are excluded in the calculation of FIRR but physical contingencies are included because they represent real consumption of resources;
Project component is assumed to be financed by 50% grant and 50% subsidiary loan in local currency from the central government to the implementing agency; subsidiary loan is assumed to have a repayment period of 25 years, inclusive of a 3 year grace period, at an interest rate of 5% per annum;
The financial opportunity cost of capital (FOCC) of the grant is assumed at 10% per annum9;
Local inflation factor is assumed at 6.5% in 2010 and 6% thereafter10; foreign inflation factor is assumed at 1.5% in 2010, 0.7% in 2011 and 0.5% thereafter
Financial projections of income statement and cash flow statement are done and presented on current price basis applying the assumed inflation factors.
11.2 Financial Analysis and Sustainability The purpose of the financial analysis is to determine if the component’s FIRR exceeds its FOCC in real terms. If the component’s FIRR exceeds its FOCC, it can be concluded that the component is financially viable.
The Weighted Average Cost of Capital (WACC) of the component in real terms is used as proxy for the FOCC. The WACC represents the cost incurred by the entity in raising the capital necessary to implement the project component. The WACC therefore is the benchmark to assess the financial viability of the project component. The WACC of the project component is 1.4% as calculated below.
9 Approximated by interest rate of 10‐year national government bond. 10 ADB estimated inflation factors for Bangladesh.

TA 7231-BAN: City Region Development Project Final Report
September 2010 Chapter 5-18
Weighted Average Cost of Capital
Particulars Sub-Loan Grant Equity Total
Weight (%) 50.0% 50.0% 0.0% 100.0% Nominal Cost (%) 5.0% 10.0% 0.0% Tax Rate (%) 0.0% 0.0% 0.0% Tax Adjusted Nominal Cost (%) 5.0% 10.0% 0.0% Inflation Rate (%) 6.0% 6.0% 6.0% Real Cost (%) -0.9% 3.8% 0.0% Weighted Component of WACC (%) -0.5% 1.9% 0.0% Weighted Average Cost of Capital (Real Terms) 1.4% Source: Consultant’s calculation
Sensitivity analyses have been undertaken in order to test the robustness of the financial results to adverse changes in conditions. The following adverse changes have been analyzed:
A capital cost overrun of 10%;
An increase in the O&M cost by 10%;
A reduction in revenues by 10%; and
Project component delayed by one year.
The results of the FIRR calculation and sensitivity analysis for the project component are shown below.
FIRR and Sensitivity Analyses
Scenario NPV / 1
(‘000 Taka) FIRR (%) SI / 2 SV / 3 % Change
Base Case 7,355,236 13.47% 10% Increase in Capital Costs 7,165,571 12.50% 0.77 129% 10% 10% Increase in O&M Costs 7,114,646 13.07% 0.32 314% 10% 10% Decrease in Revenues 6,189,458 11.99% 1.18 85% 10% Project Component Delayed by One Year 6,509,264 11.67% 1/ NPV = Net Present Value discounted at WACC 2/ SI = Sensitivity Indicator (ratio of % change in FIRR above the cut-off rate of WACC to % change in a variable) 3/ SV = Switching Value (% change in a variable to reduce the FIRR to the cut-off rate of WACC) Source: Consultant’s calculation
Based on the results above, it can be concluded that the proposed component is financially viable under the base case scenario and also under adverse changes in conditions. The sensitivity analysis indicates that the proposed component is most sensitive to delay in project and reduction in revenues, but remains well above the WACC.
The financial sustainability of the proposed component largely depends on the adequacy of funds of the implementing agency to operate and maintain the infrastructure facilities. The projected income statement and cash flow statement (see table below) of the project component in the long term show that adequate funds will be available to operate and maintain the infrastructure facilities sustainably. Operating ratio is below 1.00 throughout the projection period which indicates good financial health. Debt service coverage ratio of the project component is above 1.2, the minimum ADB requirement, throughout the projection period. After project completion, all revenues earned at Noapara port shall be ring-fenced in a separate bank account and used exclusively for the operation and maintenance of Noapara port facilities. These requirements shall be part of the financial covenants in the project loan agreement between ADB and the GOB.

TA 7231-BAN: City Region Development Project Final Report
September 2010 Chapter 5-19
Projected Financial Statements
(Million Taka, Current Price) 2010 2011 2012 2013 2014 2015 2016 2017 2018 2019 2020 2021 2022 2023 2024 2025
Income StatementTotal Revenues 0 0 0 0 329 367 409 456 506 562 623 690 763 843 931 1,027Expenses
Operating Expenses 0 0 0 0 130 138 145 153 161 169 177 186 194 204 213 223Depreciation 83 83 83 83 83 83 83 83 83 83 83 83Interest Expense 0 0 0 0 53 51 48 46 43 41 39 36 34 31 29 27
Total Expenses 0 0 0 0 266 271 276 281 287 293 298 305 311 318 325 332Income before Tax 0 0 0 0 62 96 133 174 220 270 325 385 452 525 606 694Income TaxNet Income 0 0 0 0 62 96 133 174 220 270 325 385 452 525 606 694
Cash Flow StatementSources of FundsNet Income 0 0 0 0 62 96 133 174 220 270 325 385 452 525 606 694Add: Depreciation 0 0 0 0 83 83 83 83 83 83 83 83 83 83 83 83
Interest Expense 0 0 0 0 53 51 48 46 43 41 39 36 34 31 29 27Gross Internal Cash Generation 0 0 0 0 198 229 264 303 346 393 446 504 569 640 718 804Government Grant 0 193 410 433Subsidiary Loan 0 193 410 433Total Sources of Funds 0 386 819 867 198 229 264 303 346 393 446 504 569 640 718 804
Application of FundsProject Capital Expenditure 0 386 819 867 0 0 0 0 0 0 66 0 0 0 0 0Debt Service Payment:
Principal 48 48 48 48 48 48 48 48 48 48 48 48Interest 53 51 48 46 43 41 39 36 34 31 29 27
Total Debt Service Payment 101 99 96 94 92 89 87 84 82 80 77 75Total Application of Funds 0 386 819 867 101 99 96 94 92 89 153 84 82 80 77 75Cash Increase (Decrease) 0 0 0 0 97 131 168 209 254 304 293 420 487 560 641 729Cumulative Cash Balance 0 0 0 0 97 228 395 604 858 1,162 1,456 1,876 2,362 2,922 3,563 4,292Operating Ratio 0.65 0.60 0.56 0.52 0.48 0.45 0.42 0.39 0.36 0.34 0.32 0.30Debt Service Coverage Ratio 1.96 2.32 2.74 3.22 3.77 4.41 5.14 5.98 6.94 8.04 9.30 10.75 Source: Consultant’s calculation

TA 7231-BAN: City Region Development Project Final Report
September 2010 Chapter 5-20
Annex A-Detailed Base Cost Estimate
Cpt. No
Description Unit Quantity Unit Rate US$
Totals (inc tax) US$
1 Dredging Work 1.1 Dredging Work from Khulna to Noapara cum 2,600,000 3 6,782,609
TOTAL FOR COMPONENT 1 6,782,6092 Constructions/Relocations
2.1 Construction of Quay Wall 2.1.1 Pile load test LS 1 36,232 36,2322.1.2 Pile cap RCC work 1:1.5:3 cum 5,250 103 540,1412.1.3 Drilling/ Boring for cast‐in‐situ pile No 120,000 11 1,311,3042.1.4 Pile casting RCC work No 4,000 580 2,318,8412.1.5 RCC work for quay wall with shuttering cum 8,160 109 886,9572.1.6 MS work with 60 grade deform bar(1.25% of the
total RCC work) Ton 6,000 1,130 6,782,609
Sub‐Total 11,876,0832.2 Construction of Service Road and Access Road sqm 60,976 22 1,343,2312.3 Construction of Solid surface for Truck Parking &
Loading/Unloading and in the Public Port Area sqm 65,528 22 1,443,523
2.4 Construction/Re‐location of Godowns LS 1 579,710 579,7102.5 Relocation of Existing Railway LS 1 72,464 72,464
TOTAL FOR COMPONENT 2 15,315,0113 Office Facilities for River Port and Customs
3.1 2 Storied Office building(2 units) sqm 1,487 130 193,9843.2 Officer's quarter(4 units) sqm 1,487 145 215,5383.3 Staff quarter(6 units) sqm 1,004 145 145,488
TOTAL FOR COMPONENT 3 555,0104 Drainage
4.1 Drainage with cover slab(along access roads) km 2 181,159 362,319
TOTAL FOR COMPONENT 4 362,3195 Equipment
5.1 Crawler crane (30‐40 Tons) No 2 289,855 579,710
TOTAL FOR COMPONENT 5 579,7106 Tree Plantation
6.1 Tree Plantation No 20,000 7 144,928
TOTAL FOR COMPONENT 6 144,9287 Truck Terminal
7.1 Truck Terminal LS 1 960,000 960,000
TOTAL FOR COMPONENT 7 960,000 TOTAL COSTS 24,699,585 Contingency 5% 1,234,979 COSTS + CONTINGENCY 25,934,565
Assumed Exchange Rate USD = BDT 69 Note: cum = Cubic Meter, LS = Lump Sum, sqm = Square Meter, km =Kilo Meter

TA 7231-BAN: City Region Development Project Final Report
September 2010 Chapter 6-1
Sub-Project: 3
ECONOMIC EFFICIENCY – INTEGRATED TRAFFIC MANAGEMENT IN BANANI (DHAKA CITY CORPORATION)

TA 7231-BAN: City Region Development Project Final Report
September 2010 Chapter 6-2
Table of Content 1. Introduction.......................................................................................................................... 3
2. Purpose and Background.................................................................................................... 5
2.1 Overview ........................................................................................................................5
2.2 Selection of the Sub-Project Area..................................................................................7
3. The Policy Context .............................................................................................................. 8
4. Situation Analysis ................................................................................................................ 9
5. Project Vision and Objectives............................................................................................ 11
6. The Proposal Described .................................................................................................... 11
6.1 Characteristics .............................................................................................................11
6.2 Activities.......................................................................................................................14
6.3 Community and Business Dislocation..........................................................................15
6.4 Preliminary Integrated Traffic Management Plan.........................................................16
7. The Sub-Project Costs ...................................................................................................... 20
8. Benefits.............................................................................................................................. 23
9. Scope for Replication ........................................................................................................ 24
10. Economic Assessment ...................................................................................................... 26
10.1 Methodology and Assumptions....................................................................................26
10.2 Economic Benefits .......................................................................................................26
10.3 Economic Analysis and Sustainability..........................................................................27
Annex A - Detailed Base Cost Estimates ................................................................................... 28

TA 7231-BAN: City Region Development Project Final Report
September 2010 Chapter 6-3
1. Introduction In its traditional sense, traffic management is the science of extracting maximum capacity from existing roads. Roads and streets, particularly in urban areas, suffer from numerous inhibiting factors that constrain their efficiency as traffic routes. Hence, the imposition of measures such as stopping and parking restrictions, junction-signalisation and the prohibition of particular traffic movements can increase traffic capacity and improve efficiency. Faster and more fluid traffic movement also saves costs, both in terms of the direct costs of running vehicles and the value of time to road users. Anything that makes roads safer to use also reduces the costs of injuries and deaths. Although this purist view of traffic management still has its disciples, the notion of ‘integrated traffic management’, as defined for the purpose of this Sub-Project, embraces wider objectives. Whereas the narrow interpretation of traffic management primarily considers vehicular movement, any integrated interpretation of traffic management should give proper attention to the needs of pedestrians. In many towns and cities walking accounts for a surprisingly large proportion of trips: indeed, it must be realised that most journeys by mechanical transport begin and/or end on foot: in Dhaka many trips are made entirely on foot. Thus pedestrian movement must be given due consideration – indeed priority – in any traffic management scheme. But the concept of integrated traffic management should not be confined to vehicular and pedestrian movement. Recent decades have witnessed increasing recognition of traffic’s environmental impact: just as roads have a theoretical traffic capacity, so too do they have an environmental capacity. This may be quantified in terms of acceptable maximum levels of pedestrian delay, noise, traffic vibration and local pollution. Whereas the precise derivation of environmental capacities involves sophisticated surveys, a toolbox of readily-applicable environmental techniques is ever-growing and includes various traffic-calming measures, as well as means of giving priority to public transport vehicles. In parallel with the vogue for traffic calming is the emergence of travel demand management (TDM), whereby the volume of traffic in a particular district is controlled by the application of strategies and policies to reduce travel demand (especially travel in single-occupancy private vehicles), or to redistribute such demand in space or in time. In transport, as in any network, managing demand can be a cost-effective alternative to increasing capacity. A demand management approach to transport also has the potential to deliver superior environmental outcomes, improved public health and stronger communities – and more prosperous and liveable cities. In summary, integrated traffic management comprises the application of various techniques to make the best use of any given network of roads and streets in terms of balancing the needs of traffic flow,1 pedestrian activity and the environmental needs people living, working or playing alongside streets – or otherwise exposed to traffic in them. Hence the philosophy has evolved a long way from the time when traffic management was regarded as the means to channel the maximum feasible number of vehicles (primarily private cars) along any particular road network. Certainly, an integrated traffic management scheme can improve economic efficiency by eliminating or reducing time lost in traffic, but it can make urban places safer and more liveable, which are surely measures of efficiency in any civilised society.
1 The Consultant uses the words ‘road’ and ‘street’ interchangeably. However, contemporary usage defines a ‘street’ as part of the ‘urban realm’ rather than merely as a traffic artery. Within the Banani area that forms the topic of this Component every artery is called a ‘road’, but by contemporary definition nearly all are ‘streets’. The urban realm is defined in footnote 5.

TA 7231-BAN: City Region Development Project Final Report
September 2010 Chapter 6-4
FIGURE 1: TRAFFIC CONDITIONS ABROAD – ROAD BUILDING, CAPACITY ENHANCEMENT, TRAFFIC CALMING AND CAPACITY CONSTRAINT
.1: “Balanced transportation . . . half concrete, half asphalt”. The California 91 Freeway in Los Angeles.
1.2: Queen’s Road Central in Hong Kong benefits from a variety of traditional traffic management tools to ensure that maximum traffic capacity is offered at all times.
.3: A traffic management variant to assist public transport. London’s ‘Red Routes’ prohibit stopping at any time along many kilometres of bus routes.
1.4: Traffic calming in a London suburb, where ‘chokers’ restrict the width of vehicles that can enter a residential area and also serve to reduce the speed of all traffic.
1.5: The centre of Freiburg im Breisgau in south-western Germany is restricted wholly to pedestrians, cyclists and public transport. Freiburg is often cited as one of Europe’s most ‘liveable’ cities.
1.6: An essential –and early – example of containing the private car. The ‘canal city’ of Venice has long featured this immense car park at the end of the access road in Santa Lucia, whence all motorists must park and change to waterborne transport.

TA 7231-BAN: City Region Development Project Final Report
September 2010 Chapter 6-5
Despite their logic, these ideas may seem inapplicable in a city such as Dhaka – where many people resignedly accept that motor traffic must inevitably move noisily and incoherently from one snarl to the next. The Consultant has received a firm impression that transport solutions are seen by many Government of Bengal stakeholders in terms of increasing road space, both by enhancing the capacity of existing roads and by building new ones. Whereas it is easy to criticise the ‘pro-road’ attitude in Dhaka, it is regrettably an opinion that is still widely held, even in advanced economies.2 Nonetheless, more enlightened attitudes are increasingly accepted, and many alternative solutions are appearing in northern Europe and Britain, and are emerging in both Asia (for example in Hong Kong and Japan) and North America. In other words, the traditional philosophy of ‘predict (more traffic) and provide’ (more road space) is giving way to alternative (and more sustainable) methods of dealing with movement demand.
A question that may be asked is whether it is actually possible to upgrade Banani into a well-ordered community. Whereas the precedents are not encouraging, there is one that can be found within a short walk of Banani itself. Dhaka’s Cantonment (military quarters) area is a model of a well-ordered community, with sidewalks, road markings, traffic signs and other representatives of the type of proposal made in this report (see FIGURE 1). The Cantonment precedent indicates that the combination of pride in one’s community and the threat of sanctions can do wonders in maintaining a neat and orderly community.
2. Purpose and Background
2.1 Overview This Sub-Project provides a technical assessment of integrated traffic management in the Banani area of Dhaka’s Ward 19. The assessment has been prepared following discussions with representatives of Dhaka City Corporation (DCC), which expressed support for better traffic management across the City, to help alleviate traffic congestion, provide safer pedestrian conditions and better vehicle parking.
The consultant team discussed a range of traffic management improvements with DCC, including strategic junction improvements3 and comprehensive traffic management at district level. It was concluded that a Sub-Project demonstrating the design and implementation of a District Traffic Management scheme would best address the acute traffic problems of Dhaka in the CRDP context.
District Traffic Management schemes can compliment strategic transport policy, but are capable of implementation in the short-term and evolution over time to match changing strategic planning initiatives. For instance a short-term traffic management scheme, which concentrates on better traffic flows, may later be adapted to give priority to better public transport. Within the context of CRDP District Traffic Management is affordable, and does not require high levels of capital investment and resources to implement a scheme and maintain it. District Traffic Management will also go some way towards
2 Within recent memory such attitudes were satirised by the former Mayor of Milwaukee, John Norquist, who famously quipped that "Balanced transportation in Wisconsin is half concrete, half asphalt."
3 The World Bank Case Project will promote improvements to strategic road junctions in the DCC area. Additionally DCC promoted further priority junction improvements for consideration under CRDP. For a number of reasons, including cost, it is not possible to include these proposed junction improvements under CRDP. The consultant team has separately reported on this to the ADB.

TA 7231-BAN: City Region Development Project Final Report
September 2010 Chapter 6-6
meeting public demand (expressed through the media and from the consultant team’s stakeholder discussions) for immediate action to relieve traffic congestion in Dhaka.
FIGURE 2: AN EXEMPLAR FOR DHAKA: THE CANTONMENT
2.1: A street in Dhaka’s cantonment, showing sidewalks and road markings, both immaculately maintained. Note also the absence of litter, refuse and parked cars.
2.2: Another scene from the Cantonment, showing properly deployed road markings and traffic signs, and a sidewalk protected by a pedestrian barrier.
Discussion with representatives of DCC4 suggested the consultant team look at one of the following areas:
• Gulshan 1;
• Gulshan 2;
• Banani; and
• Dhanmondi.
In promoting these areas to the consultant team, DCC were mindful of the fact that areas, which might be considered more congested that Gulshan and Dhanmondi and therefore a greater priority are already being studied under other donor agency projects. In this context the consultant team understand that priority is being given areas such as Old Dhaka under the World Bank funded “Case Project”. The consultant team therefore consider any of the districts proposed by DCC are appropriate as “pilots” for the application of a District Traffic Management scheme. These areas are discrete, and lend themselves to integrated planning, within the context of the surrounding strategic highways network. All the areas are the subject of heavy mixed road traffic flows, with high proportions of motor cars, vehicular parking problems and a very uncomfortable pedestrian environment. Residents in these area are high income bearing such that vehicular penetration is increasing over time and the environment consequently deteriorating, a situation exacerbated by the redevelopment process (Section 4 refers). To this extent the DCC recommendation is fully supported as a priority for application of District Traffic Management and as an example, which contrast with areas, such as Old Dhaka, where the transport and socio-economic characteristics differ.
4 DCC – Meeting with representatives of the Town Planning Division and the consultant team on 21/03/10.

TA 7231-BAN: City Region Development Project Final Report
September 2010 Chapter 6-7
2.2 Selection of the Sub-Project Area The Sub-Project is focused on central Banani, comprising streets within an area defined by New Airport Road to the west, Banani Lake to the east, Kamal Ataturk Avenue to the north and Banani Road 11 to the south (Figure 3 refers).
Selection of central Banani for a “pilot” District Traffic Management scheme (from the four areas listed above) responds to a number of factors/problems which can be ameliorated as a result of comprehensive and integrated planning and investment: They are:
• Serious and increasing levels of traffic congestion in a largely uncontrolled environment;
• Largely uncontrolled road junctions and cross roads, resulting in significant traffic delays and occasional grid-locking;
• Degraded road surfaces restricting road traffic flows; • Uncontrolled and haphazard vehicular parking, adding to traffic congestion and
pedestrian hazards; • Arrogant and uncontrolled driver behaviour adding to levels of traffic
congestion and pedestrian hazards, particularly at road junctions; • The lack of a pedestrian footpaths and facilities (eg pedestrian crossings)
resulting in very uncomfortable and hazardous pedestrian environment; • Largely uncontrolled use of the area by through traffic adding to the levels of
traffic congestion and resulting in the deterioration of the predominantly residential environment;
• Increasing building densities and largely uncontrolled commercial uses are exacerbating unsustainable levels of traffic congestion in the area; and
• Significant deterioration of the landscaped residential environment. The character of the land uses and the traffic in central Banani are representative of the rest of the Banani area, the whole of the Gulshan 1 and 2 areas and Dhanmondi. To this extent the pilot scheme proposals can be applied in a District Traffic Management scheme within central Banani will be readily transferable across all four areas and in other similar districts elsewhere in the Dhaka City Region, such as Uttara. In selecting central Banani, the close links between the area and the rest of Gulshan are such that the Banani scheme could be the first part of a Traffic Management Master Plan for whole Gulshan (1 and 2) and Banani. This would not only benefit residents and businesses over a wide area, it would also facilitate an approach to transport planning and traffic management, which would facilitate the wider application of the principles for multi-modal contained in the Dhaka Strategic Transport Plan (see below). For instance the medium-long term potential to introduce mass-transit systems into the area will facilitate better local public transport feeding into mass transit hubs, and the opportunity to reduce the scale of private transport in residential streets, thus leading to a more sustainable environment. To this extent the adaptability and flexibility in the detailed design of the “pilot” scheme for central Banani is important. Many of the principles to be used in a District Traffic Management scheme for central Banani would also be capable of being adapted in areas, which may have different land use and traffic characteristics, be they in the Dhaka City Region or elsewhere. For instance the need for transport planning measures to prevent unnecessary through traffic and the need to provide better pedestrian segregation will be constants in most districts. It is proposed that the Sub-Project will be designed and implemented over a maximum four year period.

TA 7231-BAN: City Region Development Project Final Report
September 2010 Chapter 6-8
FIGURE 3: THE BANANI STUDY AREA
The Study Area is highlighted on this map, as a part of Dhaka’s Ward 19.
The extent of proposed Sub-Project area is reflective of the scale of the capital investment and the resources that can be made available under the CRDP Project Loan.
3. The Policy Context Traffic management of one type or another has featured in several published reports
and policy documents about Dhaka. Hence Phase 1 of the Dhaka Urban Transport Project recommended various traffic management measures to deal with junction improvements, to create separate networks for non-motorised vehicles, to improve sidewalks and to provide pedestrian zones in the Old City. The 2005 Strategic Transport Plan for Dhaka emphasised the role of traffic management, and its report on Urban Transport Policy referred to several ‘key policy issues’ relating to integrated traffic management, including:
• Pedestrians; • Non-Motorised Transport; • Travel Demand Management; • Traffic Management; • Parking; and • The Environment. Clearly this list is more comprehensive than the topic of traffic management alone, but all of the above items contribute to the notion of integrated traffic management as defined in this Chapter.

TA 7231-BAN: City Region Development Project Final Report
September 2010 Chapter 6-9
Of particular interest in the September 2005 Urban Transport Policy is the ‘Pedestrians First’ policy that sought to construct properly designed and continuous footpaths and to launch a pedestrian awareness programme within a road safety programme.5 In summary, every plan and policy for transport in Dhaka within the last decade has referred to the need to apply traffic management techniques, to improve the pedestrian-environment and to manage travel demand. Hence there are solid policy precedents for the proposals outlined here. The proposed “pilot” District Traffic Management scheme at Banani should therefore be regarded as a direct action orientated interpretation of national policy and the proposals contained in the Strategic Transport Plan.
4. Situation Analysis Banani is a mainly residential area of north Dhaka, clearly bounded to its west by the busy dual-four lane New Airport Road. Banani Lake defines its eastern border, whilst the area itself is bisected by two east-west roads that effectively split it into three ‘character areas’. The most capacious of these roads is Kamal Ataturk Avenue, a divided highway that connects New Airport Road with the district centre of Gulshan 2 Circle. Banani Road 11 provides the other east-west route. Until quite recently this road terminated eastwards at the edge of Banani Lake, but the construction of the Gulshan-Banani Bridge and its link roads on the Gulshan side have transformed Banani Road 11 into a heavily-trafficked thoroughfare.
The ‘Sub-Project Area’ comprises the centremost, busiest and densest of Banani’s three character areas, situated between Kamal Ataturk Avenue and Road 11. On first acquaintance, this locality (the ‘Study Area’) gives a favourable impression of tree-lined avenues. The main development type is residential flats, typically rising to the maximum permitted six storeys (although this limit now appears to have been relaxed to eight storeys). Commercial premises now dominate Road 11, whilst along the Study Area’s northern edge several buildings reach as high as 20 storeys –, lining the southern side of Kamal Ataturk Avenue and two parallel streets, both known as Road 17.6 Of these, Road 17(2) is flanked by high-rise buildings to either side. These premises accommodate several universities, corporate offices and one substantial hotel. The overall width of Road 17(2) is generous, but much is lost to such functions as right-angled car parking, construction material dumps and food stalls. Other roads in the north also serve commercial functions, including the whole southern side of Kamal Ataturk Avenue.
Thorough inspection reveals barely-concealed vices all over the Study Area. Everywhere, it is apparent that redevelopment is advancing vigorously. Flats have almost entirely replaced single-family houses, whilst apartment blocks are themselves being demolished to make way for alternatives with greater earning-potential (typically by making replacements taller, increasing their plot ratio or changing their use to commercial or mixed developments). Indeed, non-residential uses are scattered everywhere, with educational and medical premises being particularly commonplace. Shops, boutiques, and guest houses are also spread throughout the area.
5 Dhaka Transport Co‐ordination Board (2005). Urban Transport Policy Final Report. Dhaka, The Louis Berger Group, Inc. and Bangladesh Consultants Ltd.
6 A particularly confusing feature of Banani (and other areas of Dhaka) is that several streets can have the same name. This appears to be attributable to the combination of streets and blocks for identity purposes.

TA 7231-BAN: City Region Development Project Final Report
September 2010 Chapter 6-10
In the south of the Study Area, Road 11 is largely commercialised, with shops, banks, restaurants and a hotel. Traffic is particular intense along this road, not only because it is used as a through-route but also because of numerous parking and ‘un-parking’ activities and a tendency for vehicles to make three-point turns in the road. The road must once have been a quiet local distributor, but it was transformed into a major through-route when the Gulshan-Banani Bridge was opened. The result of this (doubtlessly well-intentioned) innovation is an overwhelming traffic environment where pedestrians cross the road at great peril and where the cacophony of horns and rickshaw bells persists throughout day and late into the night. Impenetrable vehicular congestion often blights the road as through-traffic contests its right of passage with cars trying to reverse from angle-parked positions on shop and restaurant forecourts. The road is a source of stress to its users, signified by the eruption of unpleasant episodes amongst drivers, rickshaw pullers and pedestrians.
The Study Area is no haven for the urban poor, although there is a noteworthy slum on the west bank of Banani Lake, near the Gulshan-Banani Bridge. Even so, many poor people throng Banani’s streets, and there is an undeniable fusion of private affluence and public squalor. The superficially-attractive tree-lined avenues are thronged with cars, vans and rickshaws, whilst their surfaces are often rutted. Every street was once pucca (metalled) but incessant traffic and erosion by monsoon rains have stripped several sections of their black-top layer. Hence some street-sections are semi-pucca (with crushed brick surfaces) and others are merely katcha (earth surfaced). There are few sidewalks, and where they survive, most are unusable because of uneven surfaces and such obstacles as hawker stalls, heaps of construction materials and discarded refuse and vegetation. At the time of writing Road 11 revealed the impact of sewer works, with open gullies and innumerable holes puncturing its residual sidewalks. Pedestrian conditions are very bad: most access roads within the Study Area lack any form of sidewalk. Indeed, the most common form of street comprises a narrow central strip of pucca road bordered to either side by katcha ‘sidewalks’ that suffer from numerous obstructions. Walking in the Study Area reveals that the pedestrian is regarded with contempt by every type of mechanised road user, leading at best to prolonged delays and at worst to an omnipresent risk of injury. Additional perils emerge after sunset: street lighting is variously inadequate, switched off, or absent altogether. Traffic conditions vary by street and time of day. Some streets are thronged by rickshaws, both moving and congregated by the dozen in the hope of winning customers. Rickshaws are permitted on all streets except Kamal Ataturk Avenue, although this stricture does not necessarily mean that they cannot be found there. Motor vehicles are commonplace, and the Study Area’s general income level indicates that car ownership may be several times greater than in Dhaka generally. The only road in the Study Area that carries recognisable public buses is Kamal Ataturk Avenue, although the service is infrequent compared with that on New Airport Road and some other bus corridors. There is a general absence of the traffic signs, road markings and street furniture that could otherwise guide, warn or control traffic. Apart from traffic signals at the junction of Kamal Ataturk Avenue and New Airport Road, there are no traffic signals within the Study Area. Likewise, there are no Give Way lines or lane-divider markings. One junction, namely at roads 10 and 11, regularly benefits from a traffic policeman, whilst elsewhere doormen (who are employed by hotels and businesses) venture into the traffic to assist pedestrians and customers trying to park or unpark their cars. Other than a few businesses and apartment blocks that benefit from dedicated car parks, there is no formal parking provision within the Study Area. Cars may be parked randomly at the roadside, but the most common arrangement is right-angle parking, which both reduces the available road width for traffic and impedes pedestrian movement.

TA 7231-BAN: City Region Development Project Final Report
September 2010 Chapter 6-11
TABLE 6.1 summarises the Study Area’s streets. Linear dimensions were measured from a map, whilst widths were carefully assessed on-site by the Consultant. Where two or more streets have the same name, they have been distinguished by adding suffixes (thus 17(0), 17(1), 17(2) etc.). Two street widths are provided, comprising the metalled or semi-pucca width available to vehicles and the total width between frontage lines: thus widths are given in the form 7/16 and so forth. All road widths are given in metres, to the nearest half metre. The Consultant has a photographic record of every road in the area.
5. Project Vision and Objectives
The Consultant’s vision for the Study Area is to apply integrated traffic management to achieve a major upgrade of the public realm and achieve a pleasant, safe, calm and shady place in which to live and do business.7 Whereas this will require a major initiative by DCC, residents’ and business associations should be encouraged to share the vision and to provide appropriate moral, professional and financial support to secure its realisation.
To achieve this vision the following objectives are proposed to ensure that:
• The pedestrian environment is equal to the best international standards; • Traffic calming is applied by appropriate traffic and environmental
management measures; • Traffic conflicts are resolved by the application of traffic signs, road markings,
traffic signals and one-way streets; • Random parking is disciplined by the provision of dedicated parallel parking
along local distributor roads; • People who live and work in the Study Area are brought into the decision-
making process; and • The economic value of the Study Area is optimised to make it sufficiently
attractive for private-sector investment in the area.
6. The Proposal Described
6.1 Characteristics
The Sub-Project covers the Central Banani area. Every road is listed in TABLE 1, which includes basic information on its characteristics. The traffic and pedestrian conditions in Central Banani are shown in Figure 4.
7 The public realm may be defined as places (whether publicly‐ or privately‐owned) that everyone can see and use at any time without charge, such as streets and parks.

TA 7231-BAN: City Region Development Project Final Report
September 2010 Chapter 6-12
TABLE 1: BANANI STUDY AREA ROAD INFORMATION Road Length (m) Width (m) Remarks KAA 933 2 x
(12/14) District distributor, dual carriageway, commercial frontages.
4 322 4.5/7.5 Narrow road used as N-S local distributor, commercial frontages. Some katcha surface.
6(0) 322 6/15 Relatively narrow road used as N-S local distributor. Some katcha surface. 6(1) 144 6/12 Residential E-W access road.
6(12) 122 5.5/7.5 Residential minor N-S access road, residential. 6(2) 144 5.5/8.5 Residential E-W access road.
6(21) 122 5.5/7.5 Residential minor N-S access road, residential. Some katcha surface. 8 233 7.5/15 N-S local distributor, commercial frontages.
10 322 6/15 N-S local distributor, mixed (shop house) frontages. Katcha surface at southern end 11 1172 9/21 E-W local distributor used as district distributor. Worst pedestrian and traffic conditions
of any road in Banani. 12 322 6/18 N-S local distributor, commercial frontages.
13(0) 389 4.5/9 Residential E-W access road, narrow usable carriageway. 13(1) 194 4.5/7.5 Residential E-W access road, narrow usable carriageway. 13(2) 128 5.5/12 Residential E-W access road, narrow usable carriageway. 13(3) 161 5.5/14 Residential N-S access road, narrow usable carriageway. 13(4) 100 5.5/14 Residential N-S access road, narrow usable carriageway.
13/A(1) 266 4.5/10.5 Residential E-W access road, narrow usable carriageway. Some katcha surface.
13/A(2) 128 4.5/7.5 Residential N-S access road, narrow usable carriageway. 13/A(3) 67 7.5/10.5 Residential N-S access road, reasonably wide carriageway.
13/B 194 4.5/12 Residential E-W access road, narrow usable carriageway, semi-pacca and katcha surface.
13/C(1) 200 6/20 Residential E-W access road, reasonably wide carriageway. 13/C(2) 122 5.5/12 Residential E-W access road, reasonably wide carriageway. 13/C(3) 61 3.5/10.5 Residential N-S access road, very narrow usable carriageway. 15(1) 266 7.5/18 Residential E-W access road, reasonably wide carriageway. 15(2) 233 9/18 Residential N-S access road, wide carriageway. 17(1) 144 10.5/17 E-W access road, educational activity, many pedestrians, wide carriageway. 17(2) 305 12/24.5 E-W access road, canyon-like street between tall buildings (commercial, educational,
hotel). Seriously degraded street. 17(3) 389 7.5/21 E-W access road, tall buildings to north (commercial, educational, hotel). Seriously
degraded street: just over a third of its width is available for traffic. 17(4) 200 7.5/15 E-W access road, mainly commercial to north side. 17(5) 111 4.5/17 Residential E-W access road, narrow usable carriageway.
17/A(1) 194 7.5/18 Residential E-W access road, reasonably wide carriageway. 17/A(2) 117 3/7.5 Residential E-W access road, very narrow carriageway.
19/A 339 6/14 Residential N-S access road, narrow usable carriageway. Blockaded during site visit because of construction works.
UNR(1) 83 15/24.5 Short, relatively wide N-S commercial connector. UNR(2) 111 12/17 Shopping street with tall frontages to both sides; heavily trafficked. UNR(3) 56 12/17 Very wide N-S connector alongside open air car park. UNR(4) 44 7.5/9 Short, relatively wide N-S residential connector.
Notes: KAA = Kamal Ataturk Avenue. UNR = un-named road (at least no name is given on the source map). N-S = north-south, E-W = east-west. In the width column the first width is that of the carriageway and the second is the frontage-to-frontage
width.

TA 7231-BAN: City Region Development Project Final Report
September 2010 Chapter 6-13
The Study Area covers 32 ha and contains 8.76 km of roads (including the bordering roads of Kamal Ataturk Avenue and Road 11). Roads were originally set out in a hierarchical fashion. Kamal Ataturk Avenue is a district distributor, whilst Road 11 has assumed a similar role, despite being totally unsuited to such a function.8 Several north-south roads serve as local distributors, even though the available carriageway widths are quite inadequate for the task. All east-west roads (other than Kamal Ataturk Avenue and Road 11) are local access roads: some are very narrow and several lack metalled surfaces.
Traffic mainly comprises cycle-rickshaws, pedal-cycles, saloon cars and 4WD vehicles. Private vehicles are numerous because many local residents and visitors can afford to own and use them. Buses, personnel carriers and motor cycles are rare and lorries only appear at night (unless they are employed on construction projects). Pedestrian activity is quite intense, and comprises residents, workers, shoppers, students, pedlars, beggars and the homeless.
FIGURE 4: TRAFFIC AND PEDESTRIAN CONDITIONS IN THE BANANI STUDY AREA
4.1: Appearances can deceive. Road 13(2) looked pleasant and tranquil early on 14 April 2010, the morning of Pahela Baishakh.
4.2: Banani Road 11 in the early evening displays a typically anarchic mixtureof vehicles and pedestrians jostling for supremacy.
4.3: Most roads lack sidewalks and open cess gullies feature along several of them, as seen here in Road 13(3).
4.4: Untidy food stalls infest Road 17(2) where they cater for customers from its high rise offices and educational institutions.
8 These road classifications reflect British practice. Footnote 8 provides equivalent Bangladesh terminology.

TA 7231-BAN: City Region Development Project Final Report
September 2010 Chapter 6-14
4.5: Builder’s materials force pedestrians into Road 11. So much building is now taking place that scenes such as this are commonplace throughout the Study Area.
4.6: A katcha (earth) surface in Road 13/A(1) which is blighted by a large puddle that hints at conditions to come later in the year, when the monsoon rains set in.
6.2 Activities Several activities will be required to secure the design and implementation of this Sub-Project, as set out below.
Detailed Design and Project Preparation
This activity will cover all the detailed design and project preparation necessary to advance the Sub-Project to implementation, including (but not necessarily limited to):
• Making detailed situation reports for the entire internal road network, including –
information on representative traffic flows,
interview data on travel origins and destinations,
inventories of vehicles based within the Study Area,
an appraisal of street lengths, widths and conditions,
surface and sub-surface drainage arrangements, and
an assessment of utilities equipment (mains, sewers, gas supply and power cables and telecommunications wires);
• Developing a Traffic Management Master Plan; • Designing requisite infrastructure to incorporate all relevant proposals for
subsurface drainage and utility provisions, surface drainage, sidewalks, road reconstruction and surfacing, car parking provision, and any other appropriate requirements;
• Devising suitable traffic management measures to improve traffic flow by the use of one-way streets, junction improvements, parking restrictions, road markings, traffic signs, traffic signals and other relevant techniques;
• Giving particular consideration to the present incompatible ‘vehicle mix’ to identify dedicated routes for rickshaws and the best role that thelas might play in freight distribution within the traffic management task. This exercise should also review the contribution made by public buses and determine the scope for better services on Kamal Ataturk Avenue, plus a possible new service of small buses along Road 11 after its refurbishment;
• Developing solutions that would give particular help to pedestrians, such as the provision of decent sidewalks, the identification of preferred pedestrian routes,

TA 7231-BAN: City Region Development Project Final Report
September 2010 Chapter 6-15
pedestrian crossings along roads and at intersections, and pedestrian-only streets and shared surfaces;
• Identifying the scope for travel demand management (TDM) to reduce vehicular travel within the Study Area, with special regard to discouraging the use of local roads as ‘rat runs’ and to reduce the traffic overload on Road 11;
• Examining development controls within town planning practice to establish whether they are sufficiently robust or suitably applied to prevent the ‘overdevelopment’ of streets within the Study Area. Given the potential for a surfeit of traffic to be generated by ‘overheated’ development, developers in future should be required to submit traffic impact assessments (TIAs) from reputable and authorised traffic consultants;
• Seeking the views of local residents and business people about the proposed integrated traffic management scheme, and incorporating their opinions as appropriate; and
• Developing a participatory environment to enable local residents and business people to be active in the implementation and ongoing monitoring and enforcement of the proposed District Traffic Management scheme.
Upgrading the Public Realm
When the integrated traffic management scheme is implemented, the public realm will be primarily affected. Activities will necessarily include:
• Preparing a Landscape Master Plan to support improvements to the public realm, including the provision of identity and visual quality, and specifying locations for hard and soft landscaping;
• Designing a ‘toolbox’ of measures to assist pedestrians including: (i) discrete pedestrian footpaths and other areas, physically separated and protected from road vehicles; (ii) traffic calming in support of pedestrian comfort; and (iii) landscape and shade in the pedestrian environment;
• Specifying that road openings for the reconstruction and relocation of utility services must include replacement (subsurface) drains and connections to properties, plus (ideally) the ‘undergrounding’ of telecom wires and power cables that currently sag into the public realm;
• Fully rehabilitating the streets within the Study Area, using materials appropriate to the intended function of the street (black-top asphalt would not be appropriate – for example – in a pedestrian zone); and
• Providing traffic signs, road markings and other traffic management aids, together with street lighting and other street furniture and landscaping, both hard and soft.
6.3 Community and Business Dislocation Any scheme that seeks to rehabilitate 8.76 km of roads within the confines of a 32 ha residential area will inevitably cause dislocation. However, it would be essential to ensure that:
• Nothing in the scheme would involve the acquisition of private land or buildings and that all works are confined within existing street (frontage-to-frontage) widths.
• All works are carried out according to a schedule that would minimise disruption and dislocation to businesses and residents;
• Suitable access arrangements are maintained at all times;

TA 7231-BAN: City Region Development Project Final Report
September 2010 Chapter 6-16
• The agency responsible for managing the contractor(s) should develop, and be ready to apply, sanctions for failing to follow the implementation schedule without reasonable cause;
• Consideration may be given to compensating frontagers who are unduly inconvenienced by any works that continue for longer than their scheduled duration; and
• It should not be necessary for anybody living or trading from permanent premises in the Study Area, whether a resident or trader, to relocate. However;
• Hawkers would have to be relocated, either temporarily or permanently. Consideration could be given to the provision of purpose-built hawker bazaars at appropriate locations where hawkers could rent space at moderate cost, and in which they would be required to maintain defined standards of hygiene and cleanliness as a condition of tenancy.9 It is recommended that no hawker should be allowed to trade other than in such a ‘permitted place’ or bazaar. If this proved not to be possible then an appropriate compensation rate could be established for their removal as part of the Sub-Project. Here there are precedence cases, in the ADB funded Dhaka Water Supply Sector Program for instance.
The last bullet point is important because Asian Development Bank policy requires that measures should be taken to ensure that hawkers (and suchlike persons) are able to recover their previous standard of living when affected by its projects. Hence compensation will have to be paid for loss of livelihood and for structures and other fixed assets that have to be acquired to facilitate the project.
6.4 Preliminary Integrated Traffic Management Plan The preliminary District Traffic Management scheme for central Banani is specified in TABLE 2 and is illustrated diagrammatically by FIGURE 4. It may be noted that all but two of the major and minor roads have been made into one-way streets. All but three of the local distributors have also been made one-way, the exceptions being Roads 8, 10 and 11. However, Road 11 has a one-way eastbound section towards its western end to discourage through traffic, in combination with the prohibition of the right-turn northbound from New Airport Road. Vehicular access has been maintained in Road 11 for the benefit of frontage traders, but consideration could be given to pedestrianising the central section of Road 11 between its junctions with Roads 6(0) and 10. However, it is proposed to wholly pedestrianise one street (Road 17(1)), which serves university premises and which is heavily thronged with pedestrians at most times.
The internal one-way system has been proposed because it will make the roads safer for vehicles and pedestrians and it will also lengthen journey times within the Study Area, thereby discouraging drivers seeking short-cuts and rat-runs. Consideration was given to converting some streets into culs de sac. However, this would require them to be wide enough to carry two-way traffic and to accommodate turning circles or hammer heads at their sealed ends. Whereas such possibilities could be considered if this Project Component is advanced to detailed design, they have not been defined here.
Careful attention has been given to road and footway widths. Reference was made to contemporary British standards for local distributors and major and minor access roads. However, whilst the British terminology has been retained in TABLES 2 and 3,
9 Although this suggestion is based on practice in Singapore, it is understood that something similar has also been introduced locally, in Gulistan, where there is a hawkers’ market.

TA 7231-BAN: City Region Development Project Final Report
September 2010 Chapter 6-17
compromises have been made with the dimensions. It should be appreciated that the British standards are relatively generous, and apply to ‘new build’ roads in residential areas.10 In the case of the Study Area, the roads already exist, and it was considered essential to accommodate the reconstruction works within the existing boundary lines set by building frontages. Bearing this stricture in mind, road widths were developed on the assumption that a one-way lane should be able to accommodate a lorry 2.8 metres wide (over rear-view mirrors) plus a rickshaw with a width of about 1.2 metres: thus the minimum width for a lane designed to cope with both lorries and rickshaws would be 4.0 metres, which is wider than the international standard of 3.5 metres (or 3.0 metres in constricted situations). However, the Consultant recognises that in some situations there would not be space to accommodate 4.0-metre lanes, and that in any case the widest vehicles (lorries) are time-restricted, whilst few rickshaws would be running during lorry-operating hours. Bearing such considerations in mind, the width requirements shown in TABLE 2 were developed for guidance purposes.
TABLE 2: PROPOSED ROAD AND FOOTWAY WIDTHS
Road classification Width Remarks Local distributor (two-way) 8.5 m May be reduced to 7.0 m if wide vehicles or
rickshaws are prohibited. Local distributor (one-way) 4.5 m May be reduced to 4.0 m where frontage
constraints apply. Major access road (two-way) 7.0 m Scope for reduction not recommended. Major access road (one-way) 4.0 m May be reduced to 3.5 m in extreme situations.
Minor access road (two-way) 7.0 m Possible scope for reduction to 6.0 m in constrained situations.
Minor access road (one-way) 3.5 m May be reduced to 3.0 m in extreme situations. Sidewalk (commercial and other high-activity streets)
3.0 m each side
May be expanded to 4.0 m or more where activity levels are high or where frontage positions allow.
Sidewalk (other streets) 2.0 m each side
May be reduced to 1.5 m where necessary, or a single 3.0 m sidewalk may be provided on one side of the road only.
Car parking bay (parallel to the carriageway) 3.0 m May be reduced to 2.5 m in constrained situations.
Rickshaw ‘station’ 3.0 m
Depending on space available, may be considered on north-south local distributor or major access roads at junction approaches with KAA and Road 11.
TABLE 3 shows that most local access roads in the Study Area would be narrower than they are now. However, much potential space is currently lost to side friction and unused space. A narrower, safer road with proper sidewalks, planned on-street parking would greatly improve the character and operations in the Study Area. Redundant space could be properly landscaped, rather than becoming a dump for refuse and
10 The traditional British terminology has been adapted and updated over the years, and other countries have their own equivalents. In Bangladesh roads are classified as follows: Primary, Secondary, Connector, Local and Narrow. Approximate equivalents for these classifications would be: narrow road = minor access road; local road = major access road and; connector = local distributor. Notwithstanding these comparisons, there would be some blurring in the definitions of local and connector roads in terms of the definitions used in TABLE 2.

TA 7231-BAN: City Region Development Project Final Report
September 2010 Chapter 6-18
construction materials. Obviously, it will be important to enlist the co-operation of residents and business tenants to ensure that standards are maintained.

TA 7231-BAN: City Region Development Project Final Report
September 2010 Chapter 6-19
TABLE 3: BANANI STUDY AREA TRAFFIC MANAGEMENT PROPOSALS
Road Length (m) Width (m) Remarks KAA 933 2 x (12/14) As now, but with rebuilt sidewalks
4 322 4.5/7.5 Minor access road, one-way northbound. Sidewalk to one side only. 6(0) 322 4.5/8.5 Local distributor, one-way southbound. 6(1) 144 4.0/7.5 Major access road, one-way westbound.
6(12) 122 3.0/7.5 Minor access road, one-way northbound. 6(2) 144 4.0/7.5 Major access road, one-way eastbound.
6(21) 122 3.0/7.5 Minor access road, one-way southbound.
8 233 8.5/14.5 Local distributor, two-way, signals at junction with Road 11. Parallel parking can be permitted in bays 2.5 m wide.
10 322 8.5/14.5 Local distributor, two-way, signals at junction with Road 11 and KAA. Parallel parking can be permitted in bays 2.5 m wide.
11 1172 8.5/14.5 Local distributor, two-way, signals at junctions with Roads 8 and 10 and New Airport Road. One-way eastbound between Roads 6 and 10.
12 322 4.5/10.5 Local distributor, one-way, signals at junction with KAA, no right turn from Road 11 westbound. Parallel parking can be permitted in bays 2.5 m wide.
13(0) 389 4.5/9 Major access road, one-way eastbound. 13(1) 194 3.5/7.5 Minor access road, one-way westbound. 13(2) 128 3.5/7.5 Minor access road, one-way westbound. 13(3) 161 3.5/7.5 Minor access road, one-way eastbound. 13(4) 100 3.5/7.5 Minor access road, one-way southbound.
13/A(1) 266 3.5/7.5 Minor access road, one-way westbound. 13/A(2) 128 3.5/7.5 Minor access road, one-way northbound. 13/A(3) 67 3.5/7.5 Minor access road, one-way southbound.
13/B 194 3.5/7.5 Minor access road, one-way eastbound. 13/C(1) 200 3.5/7.5 Minor access road, one-way westbound. 13/C(2) 122 3.5/7.5 Minor access road, one-way westbound. 13/C(3) 61 3.5/7.5 Minor access road, one-way northbound. 15(1) 266 3.5/7.5 Minor access road, one-way eastbound. 15(2) 233 3.5/7.5 Minor access road, one-way southbound.
17(1) 144 15/15 Pedestrian street, shared surface type with block or sett surface dressing, residents’ access only.
17(2) 305 4.0/24 Major access road, one-way eastbound, parallel parking can be permitted in bays 2.5 m wide. Remaining width to be pedestrianised..
17(3) 389 4.0/20 Major access road, one-way westbound, parallel parking can be permitted in bays 2.5 m wide. Remaining width to be pedestrianised.
17(4) 200 4.0/8.0 Major access road, one-way westbound. 17(5) 111 4.5/17 Minor access road, one-way westbound.
17/A(1) 194 7.5/18 Minor access road, one-way eastbound. 17/A(2) 117 3.5/7.5 Minor access road, one-way eastbound.
19/A 339 4.0/8.0 Major access road, one-way southbound, no right turn at Road 11. UNR(1) 83 7.0/13.0 Major access road, two-way. UNR(2) 111 4.0/7.5 Major access road, one-way eastbound. UNR(3) 56 7.0/13.0 Major access road, two-way. UNR(4) 44 3.5/7.5 Minor access road, one-way southbound.
Notes: KAA = Kamal Ataturk Avenue UNR = un-named road (at least no name is given on the source map) In the width column the first width is that of the carriageway and the second is the aggregate road
plus sidewalk width (combined sidewalk widths for each side of the road). All recommended widths fit within frontage-to-frontage widths given in TABLE 6.1. Extra width left over after rebuilding the roads and footways can be used for landscaping or parallel parking bays

TA 7231-BAN: City Region Development Project Final Report
September 2010 Chapter 6-20
FIGURE 4: TRAFFIC MANAGEMENT DIAGRAM FOR THE BANANI STUDY AREA
Key: District distributor road Local distributor road Major access road Minor access road
Pedestrian street
7. The Sub-Project Costs The Sub-Project Costs provided in this Section have largely beendeveloped from LGED’s 2009 Schedule of Rates, although other sources have been used where necessary.11
TABLE 4 sets out the assumed unit costs. It should be emphasised that if this Sub-Project is carried forward, much more detailed costs will have to be made.
The overall costs for this Sub-Project (Excluding Detail Design, Study and Capacity Building) are set out in TABLES 5A and 5B and are estimated to be about USD 7.2 million. Street lighting is proposed along every road, but it could be controversial because the Dhaka City Corporation has the right to add three per cent to the city tax paid by households and businesses to meet the costs of street lighting. Hence some local people may prefer dark streets to extra city taxation. On the other hand, this is not a poor area by Bangladesh standards, so most people living or operating businesses in the area would probably accept the extra charges without protest if they could make their local streets safer, easier and more pleasant to use.
11 Local Government Engineering Department (2009). Schedule of Rates: Dhaka Region. Dhaka, LGED.
6(1)66
6(2)66
6(12)6 6(21)
15(1)11
13/A(2)11
13(0)11
13/A(1)44
4(0)11
17(1)NN New Airport RoadKK
Kamal Ataturk Avenue11
17(2)11
17(3)UU
UNR(1)11
1011
1111 1111
1911
13(4)11
13(2)11 13(1)11
13(B)11
13(3)11
13/C(1)11
13/C(2)KK
Kamal Ataturk Avenue11
17/A(2)11
17(5)11
1211
17/A(1)11
13/A(3)1113/C(3)UU
UNR(4)11
17(4)UU
UNR(2)UU UNR(3)11
15(2)11
11NN
No right turn from NAR

TA 7231-BAN: City Region Development Project Final Report
September 2010 Chapter 6-21
TABLE 4: INDICATIVE UNIT COSTS (US DOLLARS)
Item Cost (USD) Remarks Water mains reconstruction (1) 32/m Assumes one linear water main per carriageway with
200 mm diameter PVC pipe
32.5/m Assumes a 400 mm diameter pipe Sewer reconstruction (1)
29.4/m Assumes a 200 mm diameter pipe
Surface drainage (2) 197/m Assumes one linear drain on access roads and two on all higher order roads
9.5 m2 Assumes full rehabilitation (not new construction) with four layers of surface dressing
Road (full) rehabilitation (1) 0.80/m ‘Brick on end edge’, assumes USD1.60 for a double-
sided road
21.3m2 Assumes full foundation work and interlocking block paving Sidewalk (1)
4.5/m Kerb
Road markings: white/yellow lines (thermoplastic) (1) 34.9/m Cost assumes three lines per linear metre of road, but
eight lines on Kamal Ataturk Avenue
Traffic signs (1) 65.2 each Assume four per junction and ten per km of road.
Traffic signals (3) 15,000/junction Assume four sets per signalised junction
27.8/m Costs are for providing trench and conduit only Relocation of telecom wires to impermeable conduit (4) (10%) Add 10% to construction cost for wire relocation
27.8/m Costs are for providing trench and conduit only Relocation of power cables to impermeable conduit (4) (10%) Add 10% to construction cost for cable relocation
Street lighting (5) 33.2/m
Based on costs for 31 ft high (9.45 m) columns spaced at 90 ft/27.4 m intervals on one side of a road. Double-sided lighting assumed for local distributor roads and those of higher importance.
Planning and design Assumed to be 10 per cent of construction costs (construction costs x 0.10).
Landscaping costs Assumed to be 5 per cent of construction costs (construction costs x 0.05).
Contingency costs Assumed to be 10 per cent of construction costs (construction costs x 0.10).
Notes: USD 1 (one dollar) is taken to equal BDT 69 (sixty-nine taka).
Kamal Ataturk Avenue is not given the full treatment. Improvements only affect sidewalks, road markings and telecom wire/electricity cable relocation.
(1) Data developed from: LGED (2009). Schedule of Rates, 2009.
(2) Dhaka Water Supply and Sanitation Authority (2010). Personal communication to Eng. Asif Hosain Khan.
(3) Data on traffic signal costs derived from: The Independent (2010). 750 auto traffic signals lights in Chittagong become dysfunctional. The Independent, 13 April 2010.
(4) Notional costs based on use of PVC conduit laid in a trench, plus 10% for the cost of removing relocating wires.
(5) Dhaka City Corporation (2010). Personal communication to Eng. Asif Hosain Khan.

TA 7231-BAN: City Region Development Project Final Report
September 2010 Chapter 6-22
TABLE 5A: BANANI STUDY AREA TRAFFIC MANAGEMENT INDICATIVE COSTS PER ROAD (USD)
Road Length (m) Width (m) Mains, USD
Sewers, USD
Drains, USD
Roads, USD
Sidewalks, USD
KAA 933 2 x (12/14) — — — — 79,492 4 322 4.5/7.5 10,304 9,467 63,434 13,766 20,576
6(0) 322 4.5/8.5 10,304 10,465 126,868 13,766 27,434 6(1) 144 4.0/7.5 4,608 4,234 28,368 5,472 10,735
6(12) 122 3.0/7.5 3,904 3,587 24,034 3,477 11,694 6(2) 144 4.0/7.5 4,608 4,234 28,368 5,472 10,735
6(21) 122 3.0/7.5 3,904 3,587 24,034 3,477 11,694 8 233 8.5/14.5 7,456 7,573 91,802 18,815 19,660
10 322 8.5/14.5 10,304 10,465 126,868 26,001 31,034 11 1172 8.5/14.5 43,904 38,090 461,768 94,639 112,507 12 322 4.5/10.5 10,304 10,465 126,868 13,766 31,034
13(0) 389 4.5/9 12,448 11,437 76,633 16,630 37,286 13(1) 194 3.5/7.5 6,208 5,704 38,218 6,451 16,529 13(2) 128 3.5/7.5 4,096 3,763 25,216 4,256 10,906 13(3) 161 3.5/7.5 5,152 4,733 31,717 5,353 13,717 13(4) 100 3.5/7.5 3,200 2,940 19,700 3,325 8,520
13/A(1) 266 3.5/7.5 8,512 7,820 52,402 8,845 22,663 13/A(2) 128 3.5/7.5 4,096 3,763 25,216 4,256 10,906 13/A(3) 67 3.5/7.5 2,144 1,970 13,199 2,228 5,708
13/B 194 3.5/7.5 6,208 5,704 38,218 6,451 16,529 13/C(1) 200 3.5/7.5 6,400 5,880 39,400 6,650 17040 13/C(2) 122 3.5/7.5 3,904 3,587 24,034 4,057 10,394 13/C(3) 61 3.5/7.5 1,952 1,793 12,017 2,028 5,197 15(1) 266 3.5/7.5 8,512 7,820 52,402 8,845 22,663 15(2) 233 3.5/7.5 7,456 6,850 45,901 7,747 19,852 17(1) 144 15/15 4,608 4,234 28,368 — 46,008 17(2) 305 4.0/24 9,760 9,913 120,170 11,590 120,984 17(3) 389 4.0/20 12,448 12,643 153,266 14,782 120,324 17(4) 200 4.0/8.0 6,400 6,500 78,800 7,600 17,040 17(5) 111 4.5/17 3,552 3,263 21,867 4,745 29,554
17/A(1) 194 7.5/18 6,208 5,704 38,218 13,823 43,388 17/A(2) 117 3.5/7.5 3,744 3,440 23,049 3,890 9,968
19/A 339 4.0/8.0 10,848 9,967 66,783 12,882 28,883 UNR(1) 83 7.0/13.0 2,556 2,698 32,702 5,520 10,607 UNR(2) 111 4.0/7.5 3,552 3,608 43,734 4,218 8,275 UNR(3) 56 7.0/13.0 1,792 1,820 22,064 3,724 7,157 UNR(4) 44 3.5/7.5 1,408 1,294 8,668 1,463 3,749
Item totals (8,760 m) — 256,764 241,015 2,187,672 370,010 1,030,442 Subtotal (1) 4,085,903

TA 7231-BAN: City Region Development Project Final Report
September 2010 Chapter 6-23
TABLE 5B: BANANI STUDY AREA TRAFFIC MANAGEMENT INDICATIVE EXTRA COSTS AND TOTAL COSTS
Subtotal (1) from TABLE 6.5A 4,085,903 Extras: Traffic signs 351 signs 22,885
Traffic signals 6 installations 90,000 Parking bays, parallel (1,680 m) 4,200m2 39,900 Thermoplastic lines (3 nos per road) 7,827 m 217,591 Thermoplastic lines, KAA 933 m 86,769 Telecom wires, relocation 8,760 m 267,881 Electrical wires,. relocation 8,760 m 267,881 Street lighting, provision 11,342 m 376,554 Kerbs 8,616 m 77,544 ROAD brick on end edge 2 x 8616 13,786
Sub-total (2) (All construction/installation costs) 5,546,692 Landscaping 5 per cent of sub-total (2) 277,335
Sub-total (3) 5,824,027 Contingency 690,573
TOTAL 6,514,600
FIGURE 6 CONCEPTUAL FUTURE RESIDENTIAL ROAD CROSS-SECTION IN BANANI
Figure 6.6 illustrates a cross-section of a typical residential street in Banani as it might appear after upgrading as part of the integrated traffic management Component.
8. Benefits If fully implemented and properly maintained, an integrated traffic management scheme for central Banani would generate many benefits, including (but not limited to): • A much safer pedestrian environment with proper sidewalks and other facilities
that would favour pedestrians, including –
o The elimination of open cess ditches alongside, and open holes in, sidewalks;
o A prohibition on the use of sidewalks as storage sites for construction materials and for vehicular parking;
o The elimination of unlicensed hawker stalls from roadsides and sidewalks in favour of purpose-built hawker bazaars; and
RoadSSSidewalkSSSidewalkFF
FaçadeFaçade

TA 7231-BAN: City Region Development Project Final Report
September 2010 Chapter 6-24
o Sanctions against the throwing of refuse onto sidewalks. • Quieter streets where through- and rat-running traffic would be discouraged by
a one-way traffic system; • More fluid traffic flows; • Cleaner air quality resulting from fewer motor vehicles and less stop-start
operation; • A marked improvement in the environment of the ‘new university’ zone to the
north of the Study Area (along Road 17(2)); • A more attractive environment for people living and working in the area,
thereby raising standards and property values alike; and • A better environment for people shopping in the area, thereby improving the
area’s economic performance.
FIGURE 8 provides some idea of the benefits of an integrated traffic management scheme.
9. Scope for Replication Lessons from this Project Component should enable replication elsewhere in Banani and in nearby Gulshan 1 and Gulshan 2. Suitably adapted, the principles adopted in the Study Area could be applied to other parts of Dhaka (such as Dhanmondi), and elsewhere in urban areas with poor traffic and pedestrian conditions.

TA 7231-BAN: City Region Development Project Final Report
September 2010 Chapter 6-25
FIGURE 8: CONTRASTING CONDITIONS IN BANANI AND ENGLISH TOWNS
8.1: A residential street in Banani, displaying a typical mixture of rutted katcha surfaces, builders’ materials, a large puddle and casual parking.
8.2: A residential street at Epsom Downs in southern England. Note the pucca road surface, road markings and the separate sidewalks for pedestrians.
8.3: Pedestrians face risks when crossing the roads in Banani, especially on shopping streets, such as Road 11 shown here. .
8.4: A pedestrianised street in a city in southern England. For shoppers and pedestrians this provides a stress-free and pleasant place in the absence of vehicles.
8.5: Pedal power and motor vehicles are randomly mixed in Banani. Separate lanes for pedal-powered vehicles should be given serious consideration.
8.6: Separate provision for cyclists on a road in London. This idea could be adapted for cycles and rickshaws in Banani.

TA 7231-BAN: City Region Development Project Final Report
September 2010 Chapter 6-26
10. Economic Assessment
10.1 Methodology and Assumptions Economic analysis has been conducted in accordance with the ADB’s Guidelines for the Economic Analysis of Projects (1997) and the Framework for the Economic and Financial Appraisal of Urban Development Sector Projects (January 1994).
The following approach and assumptions have been used in the analysis:
All prices are expressed in 2010 prices and economic analysis is conducted at 2010 constant price;
An average exchange rate of Taka 69 per US$1.00 is employed when converting foreign exchange costs to local currency equivalent;
Economic prices of capital works and annual operation and maintenance are calculated from the financial cost estimates of the technical team, adjusted to allow for transfer payments and to correct for any other market distortions;
Price contingencies and interest during construction (as a result of any debt financing) are excluded in the calculation of economic internal rate of return (EIRR) but physical contingencies are included because they represent real consumption of resources;
Taxes and duties are excluded because they represent transfer payments;
All costs are valued using the domestic price numeraire; tradable inputs, net of duties and taxes, are adjusted by the shadow exchange rate factor of 1.13 while non-tradable inputs (except for unskilled labor), net of duties and taxes, are adjusted by a conversion factor of 0.9; unskilled labor is adjusted by a conversion factor of 0.7 of the market wage rate to estimate the shadow wage rate;12
The economic opportunity cost of capital (EOCC) is assumed at 12% in real terms; and
Project component is assumed to have useful economic life of 10 years.
10.2 Economic Benefits The project component involves an integrated traffic management in the project area. It will provide a much safer pedestrian environment in the area with proper sidewalks and other facilities that would favour pedestrians. It will eliminate open cess ditches alongside and open holes in sidewalks. It will prohibit the use of sidewalks as storage sites for construction materials and for vehicular parking. It will eliminate unlicensed hawker stalls from roadsides and sidewalks in favour of purpose-built hawker bazaars. The traffic flows in the area will be more fluid and thus the streets will be quieter. The area will have cleaner air quality resulting from fewer motor vehicles and less stop-start operation. The project component will provide a more attractive environment for people living, shopping and working in the area.
The improvement in the environmental and living conditions and enhancement of economic potential of the project area could be reflected in the amounts people are willing to pay for properties either in terms of rent or the purchase price of properties in the area. Economic benefits therefore are quantified in terms of increase in property values. Prevailing land value in the area is about Taka 18 million per katha13. It is assumed that property values will increase by 15% after project completion.The increase in property values is annualized using an annual rent to capital value ratio assumed at 12%.
12 Conversion factors for economic shadow pricing are based on recently approved ADB projects in Bangladesh. 1313 One katha is equivalent to 66.9 sq.m..

TA 7231-BAN: City Region Development Project Final Report
September 2010 Chapter 6-27
10.3 Economic Analysis and Sustainability The purpose of the economic analysis is to determine if the component’s EIRR exceeds its EOCC, in real terms. If the component’s EIRR exceeds its EOCC, it can be concluded that the component is economically viable.
Sensitivity analyses have been undertaken in order to test the robustness of the economic results to adverse changes in conditions. The following adverse changes have been analyzed:
A capital cost overrun of 10%;
An increase in the O&M cost by 10%;
A reduction in the benefits by 10%; and
Project component benefits delayed by one year.
The results of the economic and sensitivity analysis are shown below.
EIRR and Sensitivity Analyses
Scenario NPV / 1
(‘000 Taka) EIRR (%) SI / 2 SV / 3 % Change
Base Case 826,120 52.92% 10% Increase in Capital Costs 791,321 48.32% 1.13 89% 10% 10% Increase in O&M Costs 821,267 52.77% 0.04 2,606% 10% 10% Decrease in Benefits 703,856 47.69% 1.28 78% 10% Project Benefits Delayed by One Year 642,270 37.67% 1/ NPV = Net Present Value discounted at EOCC 2/ SI = Sensitivity Indicator (ratio of % change in EIRR above the cut-off rate of EOCC to % change in a variable) 3/ SV = Switching Value (% change in a variable to reduce the EIRR to the cut-off rate of EOCC) Source: Consultant’s calculation
Based on the results above, it can be concluded that the proposed component is economically viable under the base case scenario and also under adverse changes in conditions. The sensitivity analysis indicates that the proposed component is most sensitive to delay in project benefits and reduction in benefits, but remains well above the EOCC.
The economic sustainability of the proposed component largely depends on the adequate maintenance of the facilities. Unless the facilities can be maintained adequately, the economic benefits assumed in the analysis will not materialize. The projected financial performance14 of the implementing agency in the long term shows that funds will be available to maintain the facilities adequately. However, availability of funds of the implementing agency would require that the LGD of the Ministry of LGRDC periodically review and update the model tax schedule which regulates the taxes and fees that municipalities can levy and collect to keep pace with the rising costs of municipal administration and services and maintenance of facilities.
14 Detailed financial performance of implementing agencies is discussed in a separate report called “Financial Performance Assessment”.

TA 7231-BAN: City Region Development Project Final Report
September 2010 Chapter 6-28
Annex A - Detailed Base Cost Estimates Cpt. Unit Totals
No. Description Unit Quantity Rate (US$)
(US$) (inc tax) 1 Project Preparation
1.1 Design and Planning LS 1 581,700 581,700
1.2 Capacity Building and Training LS 1 500,000 500,000
TOTAL FOR COMPONENT 1 1,081,700
2 Roads, Drains, Sewer,Water Mains and Sidewalk 2.1 Roads
2.1.1 Full Rehabilation with Four Layers of Surface sqm 38,948 10 370,010
2.1.2 Road brick on end edge m 17,232 0.80 13,786
Sub‐Total 383,796
2.2 Drains
2.2.1 Surface Drainage m 11,105 197 2,187,672
Sub‐Total 2,187,672
2.3 Sewer
2.3.1 Reconstruction of Sewer in Narrow Roads m 3,619 29 106,399
2.3.2 Reconstruction of Sewer in Wide Roads m 4,142 33 134,615
Sub‐Total 241,014
2.4 Water Mains
2.4.1 Water mains Reconstruction m 8,024 32 256,764
Sub‐Total 256,764
2.5 Sidewalk
2.5.1 Full Foundation Work and Interlocking Block Paving
sqm 48,378 21 1,030,442
2.5.2 Kerbs m 17,232 5 77,544
Sub‐Total 1,107,986
TOTAL FOR COMPONENT 2 4,177,231
3 Traffic Components
3.1 Traffic signs Signs 351 65 22,885
3.2 Traffic signals Installations 6 15,000 90,000
3.2 Parking bays, parallel (1,680 m) sqm 4,200 10 39,900
3.3 Thermoplastic lines (3 nos per road) m 7,827 28 217,591
3.4 Thermoplastic lines, KAA (8 nos) m 933 93 86,769
TOTAL FOR COMPONENT 3 457,145
4 Relocation of Wires and Street Lighting
4.1.1 Telecom wires, relocation (Including 10% construction cost)
m 8,760 31 267,881
4.1.2 Electrical wires, relocation (Including 10% construction cost)
m 8,760 31 267,881
4.1.3 Street lighting, provision m 11,342 33 376,554
TOTAL FOR COMPONENT 4 912,316

TA 7231-BAN: City Region Development Project Final Report
September 2010 Chapter 6-29
5 Landscaping 5.1 Landscaping LS 1 277,335 277,335
TOTAL FOR COMPONENT 5 277,335
TOTAL COSTS 6,905,727
Contingency 10% 690,573
COSTS + CONTINGENCY 7,596,300
Assumed Exchange Rate 1 USD = 69 BDT
Note:
LS = Lump Sum
sqm = Square Meter
m = Meter

TA 7231-BAN: City Region Development Project Final Report
September 2010 Chapter 7-1
Sub-Project: 4
ECONOMIC EFFICIENCY – ENERGY CONSERVATION AND SUSTAINABILITY IN THE PUBLIC SECTOR (TONGI POURASHAVA)

TA 7231-BAN: City Region Development Project Final Report
September 2010 Chapter 7-2
Table of Content 1. Purpose and Background .......................................................................................... 3
2. The Policy Context..................................................................................................... 3
3. Situation Analysis....................................................................................................... 5
3.1 The Case Study Pourashava of Tongi ...........................................................................5
3.2 Water Pumps .................................................................................................................6
3.3 Street Lights...................................................................................................................8
3.4 Tongi PourashavaOffice ..............................................................................................10
3.5 Replacing Existing Lamps with Higher Efficiency Lamps ............................................11
4. Project Vision and Objectives.................................................................................. 13
5. Energy Sustainability and Efficiency........................................................................ 14
5.1 The Project...................................................................................................................14
5.2 Project Descriptions and Scope...................................................................................15
6. Project Component Costs........................................................................................ 19
7. Benefits .................................................................................................................... 20
8. Economic Assessment ............................................................................................ 21
8.1 Methodology and Assumptions....................................................................................21
8.2 Economic Benefits .......................................................................................................22
8.3 Economic Analysis and Sustainability..........................................................................23
9. Financial Assessment.............................................................................................. 24
9.1 Methodology and Assumptions....................................................................................24
9.2 Financial Analysis and Sustainability ...........................................................................25
Annex A - Detailed Base Cost Estimates....................................................................... 29

TA 7231-BAN: City Region Development Project Final Report
September 2010 Chapter 7-3
1. Purpose and Background
This Project Component outlines a proposal for improved and efficient use of energy and energy conservation by the public sector. The proposal actually comprises three energy efficient and conservation Components within Tongi Pourashava, each designed to ensure sustainability and scope for replication within other public sector organisations. The proposal has been prepared following extensive discussions with representatives of the Tongi Pourashava, especially with the Mayor and senior management, all of whom have expressed ‘support inprinciple’ for this project component. In this context there were four joint meetings between the Consultant’s team and the management of Tongi Pourashava, whilst further consultations were held with the Dhaka Electric Supply Company Limited (DESCO), private-sector representatives, and other relevant stakeholders.
The project component is intended to achieve improved and efficient use of energy by focusing on: (i) energy conservation and efficiency in the local water pumping system; (ii) improving the energy efficiency in Tongi Pourashava’s office; (iii) designing an appropriate solar-based street lighting system for Tongi Pourashava; and (iv) improving the street lighting system by replacing the existing tube lights with more energy-efficient tubes. The Component also includes capacity-building within the Tongi Pourashava to address, implement, and disseminate best practices.
It is proposed that the initial pilot project will be designed and implemented over a one-year period.
2. The Policy Context The Government established a Bangladesh Energy Regulatory Commission (BERC) in March 2003 to enforce fiscal discipline in the energy sector and to rationalise energy (gas, power and petroleum products) tariffs.1 In 2004, the Bangladesh Government set out a ‘road map’ for energy in its National Energy Policy (2004) and prepared a draft Energy Conservation Act in 2008, which is yet to be approved. In the context of the national energy crisis and significant energy inefficiency, the scope and coverage of the draft Energy Conservation Act needs to be reviewed and made a priority. To make this act more effective and comprehensive, much can be drawn from the experience and scope of Energy Conservation Act 2001 of the Government of India.2 The Indian ECA has provided the foundation for capacity and institutional building for a range of energy efficiency measures, including: (i) mandatory periodic energy audits in industrial and commercial establishments; ((ii) Energy Star Ratings (ranging from a minimum of one star, to five stars for the best) for all energy driven domestic appliances (such as air-conditioners, fans, refrigerators, and stoves); (iii) continuous training and development; (iv) documentation and the publication of best practice manuals and successful case studies for energy efficiency improvement in various industries; and (v) awareness programmes for schools and colleges.3
Both the usage of renewable energy sources and improving energy efficiency are priority areas for the Clean Development Mechanism (CDM) under the United Nations’ Framework Convention on Climate Change (UNFCCC) and can qualify to earn carbon
1 http://www.berc.org.bd
2 www.bee-india.nic.in Energy Conservation Act 2001
3 www.energymanagertraining.com

TA 7231-BAN: City Region Development Project Final Report
September 2010 Chapter 7-4
credits.4 The Government has already announced its Renewable Energy Policy of Bangladesh (2008) to encourage the use of renewable energy sources, such as solar, wind, biomass, and hydro-electricity, and is planning to form a separate entity to look after renewable energy promotion and energy-efficiency under a Sustainable Energy Development Agency (SEDA).5 The Ministry of Environment and Forest has approved the Bangladesh Climate Change Strategy and Action Plan 2009. This identifies improved energy efficiency in the production and consumption of energy as a long-term strategy for mitigation and low-carbon development. The Government, in co-operation with the German Technical Co-operation (Deutsche GesellschaftfürTechnischeZusammenarbeit orGTZ) has already undertaken free distribution of energy efficient compact fluorescent lamps (CFLs) to many households and offices.6
It is unfortunate that despite the critical energy situation, the Energy Conservation Act has not been approved by the Government to ensure the best levels of energy efficiency in all sectors. It is estimated that in the commercial and industrial sectors, which together account for over 50 per cent of energy consumed, a substantial amount (around 15 to 30 per cent) of energy can be saved by adopting energy-efficient improvement measures. Within the commercial and industrial sectors alone the adoption of attractive investments in technology and systems could yield a 10 per cent level of energy conservation and a reduction of almost 250 MW of power by reducing wastage: moreover, this would offer attractive payback periods. Furthermore, such measures can be implemented within a short period of time. Thus, for a capital-starved economy like Bangladesh, improvement of energy efficiency in the present system offers the best option for securingrapid relief from the energy crisis. It is significant that an improvement in energy efficiency is just not a one-time benefit, but provides savings throughout future operations.
The Bangladesh Climate Change Strategy and Action Plan 2009 (BCCSAP) has also proposed, inter alia, under its Theme Programme for Mitigation and Low Carbon Development to take-up improved energy efficiency in the production and consumption of energy, renewable energy development, and energy and water efficiency in order to address environmental concerns.
In the context of the low-energy efficiency in Bangladesh, and given global pressure to mitigate climate change impacts and to promote cleaner and sustainable development, the notion of ‘Negawatts’ provides a means of providing a degree of relief more rapidly and with much less investment.7 Energy efficiency improvements in Government and the private-sector (industrial and commercial) are of particular importance because they would demonstrate both a commitment to energy-efficiency improvements and to promoting sustainable development. Government has the potential to improve energy
4 http://unfccc.int/2860.php
5 http://www.reein.org/policy/index.htm
6 www.energybangla.com/index.php
7 ‘Negawatts’is a term coined by the scientist Amory Lovins to denote electricity saved to reduce demand. Since then it has been used to denote energy saved by energy efficiency improvements at the user end. It also signifies that one unit of electricity saved at the user end is much more than the electricity generated at power plant once distribution and equipment inefficiencies – including the transmission and distribution losses and the losses in motors, cables and power equipment – are taken into account. As rule of thumb in developing countries where the transmission and distribution losses are very high and the equipment and motor efficiencies are low, one Negawatt (one megawatt of electricity saved at user end) may be equivalent to three Megawatts of electricity generated at the power plant.

TA 7231-BAN: City Region Development Project Final Report
September 2010 Chapter 7-5
efficiency (both energy and water use) in the generation, transmission, distribution, and usage in Government buildings. There is also a need to create mass awareness about energy efficiency through various means, including: legislative support, tariff rationalisation; teaching about energy and environment in schools and colleges; and raising public awareness through campaigns (because the domestic sector accounts for a significant share of energy consumption). Clearly, for developing economies such as Bangladesh, the Negawatts concept is strategically important because it releases wasteful energy at much lower capital costs, and more rapidly, compared with a new ‘Megawatts power plant’. Negawatts also have a positive contribution to make in mitigating climate change and promoting a cleaner environment, as well as qualifying for carbon credits. The expeditious implementation of the initiatives for reducing losses, applying more energy efficient technologies, and adopting clean energy (such as solar energy) would have a visible impact on the industrial and commercial sectors,and the population generally.
3. Situation Analysis The Dhaka and Khulna city regions jointly consume about 40 per cent of the total power in Bangladesh. Whilst street lighting and water supply form less than one per cent of total power demand, it is important to mount a demonstration project which is highly visible to the public, which can be immediately implemented, which is sustainable, and which can draw from the available pool of carbon mitigation funds. Moreover, applications such as office lighting, fans and air-conditioners have significant scope for replication, not only in government establishments but also across the commercial and domestic sectors. Although there are many pourashavas in the greater Dhaka and Khulna city regions, the Consultant has takenTongi as a pilot case, because it is a relatively young community and provides a wide spectrum of services – including (inter alia) water supply, street lighting, offices, a veterinary hospital, a slaughter house and a town hall. . This diversity provides wide opportunities to replicate the benefits of energy savings, not only in other pourashavas, but also for the Water and Sewerage Authority (WASA), which is responsible for water supply in the Dhaka and Khulna city regions.Experience and improvements of Tongi could be shared as case studies with other pourashavas and WASA to make their street lighting, water supplies and offices more energy-efficient.
3.1 The Case Study Pourashava of Tongi Tongi was created as a pourashava in 1974 and has established itself as an important industrial town. It is neither a district nor a thana headquarter, but comes under the control of the Gazipur District Office. Tongi is a ‘Special Category Pourashava’; it is part of the Greater Dhaka Metropolitan Area and is within RAJUK’s Greater Dhaka Structure Plan area. Tongi is located 15 km north of Dhaka and is located on the southern flank of the Bhawal Tracts. Rapid urbanisation over the last two decades, along with a failure to control over urban growth and a lack of financial and institutional resources, has adversely affected development and environmental conditions, resulting in undue pressure on the Pourashava’surban services and infrastructure. Relevant statistics about Tongi Pourashava are as follows:
• Area: 32.36 km2. (with a core area of 19.41 km2 and a fringe area of 12.95 km2); • Established: 23 March 1974 (at present Tongi is a ‘Special Category
Pourashava’);

TA 7231-BAN: City Region Development Project Final Report
September 2010 Chapter 7-6
• Population: 281,928 at the 2001 Population Census. The present population is approximately 650,000;
• Pre-primary satellite schools: nine (9); • Veterinary hospital, slaughter house and community hall: one of each; • Number of holdings: 19,100 (Government: 66, private 19,034); • Number of street lights: 1,570 (40-Watt fluorescent tubes installed on DESCO
utility poles); and • Water supply:
o Total length of distributor water pipes : 100 km o Number of house connections 8,495 o Production of water per day : 674,0000 gallons o Total coverage : 63 per cent of the population o Deep tube wells : 22 o Overhead tanks : 1 o Hand tube wells : 475
Pourashava’s energy consumption comprises both electric energy and fossil fuels. Electric energy consumption is distributed as follows: • Water pumps – 95 per cent; • Street lighting – 3 per cent; • Offices – one per cent; and • Other – one per cent.
Fossil fuels (primarily petroleum and compressed natural gas) are used for generator sets and in motor vehicles.
The Tongi Pourashava mainly consumes electricity in water supply (22 tube wells), streetlights (1,570 40-Watt, four-foot. fluorescent tube lights), offices (lights, fans, air conditioners and computers) and various other consumers, such as the veterinary hospital (lights and fans), the slaughter house (lights, fans and equipment), schools, and the community hall (lights, plus occasional use of fans). In the last quarter of 2009 the combined electric power consumption for the Tongi Pourashavaaveragedabout 204,147 kWh/month from October to December.The monthly consumption of the electric energy by different categories is shown in TABLE 1.
Unfortunately, there is very little awareness about the concepts, products and technology that could improve energy efficiency in Tongi Pourashava. Even the metering and monitoring of energy is negligible, and there is no consumption analysis. This will require massive capacity-building if the Pourashava is to sustain the benefits of energy efficiency improvement projects.
3.2 Water Pumps
The water pumping system is the most significant energy consumer (95per cent of the total) in Tongi Pourashava. However, because of political pressures, the unavailability of power and uncertainty in supply due to a receding water table, the Tongi Pourashava is not charging any tax on account of water. Under the municipal tax law, water tax is the largest single element of local taxation that a pourashava can raise (at 10 per cent of the assessed value). However, Tongi Pourashava receives no taxes under this head. Thus, it is very important to have a project that improves water pumping energy efficiency. This could have significant impact on the financial performance. Improvements in Tongi could easily be replicated by other organisations, such as the Dhaka and Khulna water supply

TA 7231-BAN: City Region Development Project Final Report
September 2010 Chapter 7-7
and sewerage authorities, other pourashavas, plus those industries and private commercial complexes that have their own groundwater pumping systems.
At present, the water is supplied to about 8,500 consumers (variously household, commercial and industrial) provided through a network of underground pipes approximately 100 kilometres long; these are fed through 22 tube well pumps of varying capacities, installed between 1994 and 2004.
The pumps were located without any prior technicalinvestigationsof the areas under Tongi Pourashava’s control. The underground water pipe network was laid from 1994 onwards by DPHE and was handed over to Tongi Pourashava for operations and maintenance. No water-flow meters are installed in the circuit and most of the rated data about pumps andmotors (including their characteristic efficiency curves) is not available at Tongi Pourashava.
Of the twenty-twodeep tube wells, two have already collapsed or otherwise become choked, and have had to be abandoned. The Tongi Pourashava has prepared a proposal for 12 new tube well pumps (five being replacement pumps and the othersevenbeing new ones); this is being submitted to BMDF for approval.
Informal discussions between the Consultant and WASA have revealed that pump efficiency, even at WASA groundwater pumps, ranges from a mere 25 per cent to 40 per cent. Pump efficiencies fluctuate according to: the discharge pressure; flow rate; the state of the pumps, pipes and electrical network;the effect of leakages on water level;the number of consumers;the groundwater level; pump efficiencies; and the number of stages and resistance within the pipe network. The discharge pressure fluctuations range from 3.5 kg/cm3 to 7.8 kg/cm3 in certain installations. Pumping power is directly proportional to the discharge pressures, but no control is exercised because all operations are manual and operators keep the discharge valves fully open. How many of these valves actually work is not known; presumptions are made from visual inspection of the spindle positions to determine whether valves are open or closed.
There is only one overhead tank of 100,000gallons capacity. This is only used for three days each year during the holy festival of BishwaIstjema. During these days the supply from theBishwaIstjema field pump is diverted to fill the overhead tank, but during the rest of the year it feeds water to the pipe network. The pump discharge pressure is kept at around 5 kg/cm3. The pumps operate for almost 18 to 20 hours a day and the water supply to different segments of network is regulated by opening and closing the segment valves. Not all pumps have a working pressure gauge, and none has any water flow meter. The pumps have differently rated capacities ranging between 36 m3/hrand 136 m3/hr.
Although Tongi Pourashava does not charge water fees, a review of its total monthly power bill of taka 8.62 lakh(approximately USD 12,500) per month indicates that almost 95 per cent is due to water pumps. Thus, it is proposed to mount a comprehensive energy audit to improve the energy efficiency of the existing water pumping system and to significantly reduce the energy cost to Tongi Pourashava.

TA 7231-BAN: City Region Development Project Final Report
September 2010 Chapter 7-8
TABLE 1: RECENT ENERGY CONSUMPTION IN TONGI POURASHAVA OCTOBER 2009 TO DECEMBER 2009
Item Consumer Unit 2009-10 2009-11 2009-12 Three-month average
kWh 170,397 211,809 199,738 193,981 Water pumping
Taka 713,783 868,790 832,633 805,069
Rate Taka/kWh 4.19 4.10 4.17 4.15 1
Percentage of total 94.3 95.2 95.5 95.0
kWh 2,718 2,229 1,791 2,246 Offices
Taka 11039 9,088 7,341 9,156
Rate Taka/kWh 4.06 4.08 4.10 4.08 3
Percentage of total 1.5 1.0 0.9 1.1
kWh 1,231 2,387 2,071 1,896 Others
Taka 7,035 12,478 10,408 9,974
Rate Taka/kWh 5.71 5.23 5.03 5.26 4
Percentage of total 0.7 1.1 1.0 0.9
kWh 10,354 10,748 9,416 10,173 Other than water Taka 54,754 69,639 48,125 57,506
Rate Taka/kWh 5.29 6.48 5.11 5.65
5
Percentage of total 5.7 4.8 4.5 5.0
kWh 180,751 222,557 209,154 204,154 Total Tongi Energy* Taka 768,537 938,429 880,758 862,575
6
Rate Taka/kWh 4.25 4.22 4.21 4.23
* Potential power consumption would have been greater if there had not been power cuts during the relevant months. Power generated privately by 4.5 kVA and 6 kVA generator sets is not included in these figures.
3.3 Street Lights
Tongi’s second largest form of power consumptioncomprisesstreetlights, which consume three per cent of the Pourashava’stotal energy. The power cost of street lighting accounts for only taka72,360 (approximately USD 1,050) per annum, whilst the annual tax revenue from streetlights is taka 2.8 million (USD 40,580). Obviously, this becomes an excellent investment proposition because the return is almost 3,900 per cent on the meagre costs of street lighting power and maintenance.At present, only 30 per cent of the roads and streets are lit. Clearly, it would be financially prudent for Tongi Pourashava to invest in streetlightsfor all its roads and streets so as substantially to raise its revenue.
Tongi Pourashavacurrently has 1,570 streetlights equipped with 40-Watt four-foot(1,219 mm) single fluorescent tubes installed on utility poles owned by the Dhaka Electricity Supply Company (FIGURE 1), situated at 40 metre-intervals. Tongi Pourashava does not provide its own poles.

TA 7231-BAN: City Region Development Project Final Report
September 2010 Chapter 7-9
FIGURE 1 TONGI AND ITS STREET LIGHTS
1.1 (above): A view of Tongi town centre, photographed on the Dhaka-Mymensing Road.
1.2 (right): An enlargement of 1.1 showing a four-foot fluorescent tube light attached to a DESCO utility pole.
According to the prevailing Municipal Taxation Law(1960), the Model Tax Schedule(1985) and AdarshKortabba(2003), a tax collection ceiling has been fixed at 27 per cent of the assessed value of a holding against different tax collection heads, as shown in TABLE 2.
TABLE 2: SOURCES OF TAX REVENUE IN TONGI POURASHAVA
Tax head Maximum limit as a
percentage of assessed value
Tongi Pourashava current percentage
Holding tax 7 7
Conservancy tax 7 4
Water tax 10 0
Street light tax* 3 3
Total tax 27 14
Total collection/year taka 28 million (USD 405,800)
Street light tax collection at three per cent (from 30 per cent of the holdings) *
2.8 million taka/annum
* Only from 30 per cent of holdings within a 300 ft. radius of any street light

TA 7231-BAN: City Region Development Project Final Report
September 2010 Chapter 7-10
At present, the tax revenue collection of Tongi Pourashava is about taka 28 million per annum at 14 per centmaximum tax. Of this, three per cent is collected by way of street lighting tax, but only from about 30 per cent of all holdings, amounting to about taka 2.8 million per annum (USD 40,580).
If additional streetlights are erectedalong 200 km of roads (excluding katcha roads) at 40-metre intervals,there would be 5,000 streetlights altogether. Presently, Tongi has only 1,570 lights (or about 30 per cent of the proposed number). After installing nearly 3,500 more street lights, tax revenue would rise to taka 9.3 million per annum (nearly USD 135,000). Additionally, a revised property valuation is likely to be announced within the next year, which is expected to increase tax collection by 20 per cent. With this increase, the street lighting revenuewould increase to taka 11.2 million (9.3 x 1.2 million taka), or an increase of taka 8.4 million per annum.
This project could be transformed from ‘business as usual’ into a ‘lower carbon’ option by deploying stand-alone solar-panel based street lights. Whereas there is always the possibility of battery and solar panelthefts, appropriate measures could minimise these risks. For example, maintenance-free batteries could be mounted on top of the poles or be sealed underground (albeit with breather pipes to vent gas). Furthermore, all accessories could be welded onto well-grouted poles. It is well established that better streetlightingbrings social benefits, such as less night crime, better security surveillance, fewer road accidents and an improved confidence and sense of security amongst local residents. If promoted as a lower carbon project, there could be improved funding possibilities, especially if it qualifies for a carbon credit under UNFCCC.
3.4 Tongi PourashavaOffice
Data show that the third most important energy consumer is the Tongi Pourashava establishment. However, there are no reliable records ofadditional energy consumed by the generator sets; indeed, if electricity and fossil fuel are taken together, the Pourashava’s office may be the second largest consumer of electricity in Tongi.
The Tongi Pourashava office premises have a connected load of about 27 kW, although the potential power bill would have been higher without power cuts. During breaks in the electricity supply, the Pourashava uses two of its three small capacity (4,500 and 6,000 kVA) high-octane petrol generator sets. Since there are no separate records either of the number of units generated, or of the fuel consumed in standby generator sets, it is hard to ascertain the actual power consumption of Tongi Pourashava. However, estimates from the connected lights, fans, computers and other electrical items indicate a figure which could possibly be at least three to four times higher than the consumption shown on electricity bills.
An initial assessment was conducted at the Tongi Pourashava office to identify the scope for energy efficiency improvements. Observations arising from this assessment were that:
1. Most lights are conventional 40-Wattfour-footfluorescent tubes with conventional electromagnetic-ballast chokes: they have no reflectors. In some places there are 23-wattcompact fluorescent light bulbs which are not used;
2. Fans have electronic regulators but fan efficiency (air-flow CFM/Watt) is not known;
3. The lighting arrangement in rooms was not effective; 4. Lighting locations were remote from executive desks and concentrated on
visitors’ areas;

TA 7231-BAN: City Region Development Project Final Report
September 2010 Chapter 7-11
5. Air-conditioned cubicles have high ceilingsand proportionately large unusable areasrelative to the rooms’ sizes and seating layouts;
6. The air-conditioned rooms lack effective sealing in their doors and windows, and cool-air leakage was observed;
7. The window-type air-conditionersare not properly installed, and they leak; 8. The COP/star rating, or efficiency, of air-conditioners was not known; 9. There were three standby generatorsets, which run on high-octane petrol during
grid power failures. However, no record is kept of the electrical units generated, or of fuel consumed;
10. Some light diffusers aredirty, thereby blocking much of the light emitted by the luminaire; and
11. The employees of the Pourashavashow hardly any awareness about energy conservation, green buildings and low-carbon buildings.
3.5 Replacing Existing Lamps with Higher Efficiency Lamps The street lighting load in Tongi Pourashava is only about three per cent of the total electric-load. However, if other lighting loads are added, lighting probably accounts for about five per cent of the Pourashava’stotal load.
The lighting load distribution based on the types of light source at Tongi Pourashavacomprises:
1. 1,570 40-Watt four-foot conventional fluorescent tubes for street lights (85 per cent of the total load);
2. Two-hundred and thirty-three 40-Watt four-foot conventional fluorescent tubes used for other purposes(12.5 per cent of the total load);
3. Forty compact fluorescent 23-Watt light bulbs(one per cent per cent of the total load); and
4. Fifteen 100-Watt incandescent bulbs (1.5 per cent of the total load).
Two distinct possibilities exist for the Tongi Office:(i) to change all conventional fluorescent and incandescent lights by energy-efficient retrofits such as the T5 type (with electronic ballast and mirror optic reflectors), or (ii) replace the existing tubes with LED (light emitting diode) four-foot retrofit tubes to conserve power and also reduce maintenance requirements.Moreover, T5 and LED lights havea longer lives than conventional fluorescent tubes: a T5 tube has an estimated life is 18,000 hours, whilsta LED has a life of about 50,000 hours. Both the options have been evaluated, from which it appears that the T5-based retrofit option is rather more attractive because it has a shorter payback period whilst the initial investments are also less, compared with LED-based tube lights. The T5 retrofit tube lights provide about a 50 per cent energy saving, whilst LED tubes offer 68 per cent energy reduction compared with the present 40-Wattfour-foot tube lights. Energy savingsfor replacing the 100-watt incandescent bulbswould be about 72 per cent when replaced with a T5-based system, and almost 82 per cent when replaced with LED-based 18-Watt tube lights. Thus, almost 50 per cent of the lighting energy can be saved without affecting the lux levels at all the 1,800 locations where conventional 40-Watt four foot tube lights are currently installed.
There is a necessity to integrate energy efficiency improvement in all sectors. This starts from electricity generation, which should emphasise tri-generation, co-generation and combined-cycle plants. Furthermore, transmission and distribution efficiency can

TA 7231-BAN: City Region Development Project Final Report
September 2010 Chapter 7-12
be improved through higher voltages, energy efficient transformers, optimally-loaded cables and the maintenance of a power factor close to unity in the grid. Efficient generation should be supported by efficient consumption that can be achieved by using energy-efficient technologies and systems, including industrial machinery and domestic equipment. For all industrial and domestic applications, there should be aggressive encouragement of the abundantly-available cleaner renewable energies,such as solar, wind, nuclear and biomass energy. The Consultant’s investigations and discussions confirm that the main energy issues are: • Frequent power failures, load-shedding and poor power quality, all of which have
become a regular feature, particularly in the fast-expanding urban areas of Dhaka and Khulna, where the energy demand is rapidly outgrowing supply;
• Energy inefficiency in both the public and private sectors is further exacerbating already-limited power supply; and
• A lack of awareness about energy efficiency amongst the public- and private-sectors, and amongst the public generally.
With a very low per capita power generation (165 kWh in 2008), Bangladesh is facing a serious energy crisis with shortages leading to frequent load-shedding and poor power quality.8This badly affects all sectors of the economy and is jeopardising economic growth potentials. With projections of an annual eight per cent rise in energy demand, there is an urgent need to address energy issues, specifically in the short-term to address improved energy use, consumption, and conservation. The energy crisis results from three factors: (a) Accelerated growth in energy demand that is resulting from increasing economic
growth, population growth (especially in urban areas) and comparatively significant changes in patterns of energy consumption;
(b) Insufficient public and private sector investment in the gas, power, coal and renewable energy sectors; and
(c) Inefficient usage of energy in all sectors, including Government, agriculture, domestic and (surprisingly) even in private-sector industries and commercial complexes.
The distribution of electricity consumption by sector in the Dhaka City Region (for consumers of both the Dhaka Power Distribution Company and Dhaka Electricity Supply Company) is as follows: (i) Domestic –40 to 45 per cent; (ii) Industrial (low tensionandhigh tension bulk) –40 to 50 per cent; (iii) Commercial sector –10 to 13 per cent; (iv) Street lights andwater –0.3 to 0.5 per cent; (v) Mosques –0.8 to 1.3 per cent; and (vi) Others –four to six per cent.
In the domestic, commercial and industrial sectors, which constitute the major consumers of power, there is very little awareness or concern about energy conservation, mainly because of the low energy tariffs. Hence there islittle inclination to invest in sustainable and high-efficiency technology, equipment and systems.
8 ADBCountry partnership strategy mid-term review. August 2009 (2006-2010)

TA 7231-BAN: City Region Development Project Final Report
September 2010 Chapter 7-13
Whilst there is no substitute for long-term energy planning and the search for national energy-independence, there is a pressing need to undertake some measures that could bring immediate relief from the looming energy crisis. Energy conservation is one such strategy, but hitherto this has not been pursued aggressively. That said, there was an attempt to do so early in 2004 when a draft energy conservation act was prepared. However, it has yet to be enacted– although much remains to be done to make it comprehensive and sustainable. A huge untapped energy potential could be released (in the form of Negawatts) by improving the energy efficiency of existing systems. It is generally accepted that Negawatts‘generation’ is economical, fast and sustainable – besides making a positive contribution to climate change. The Government has already introduced a renewable energy act, whereby some incentives such asthe duty-free import of solar photo-voltaic panels and VAT-free energy production have been introduced. However, because of the very high cost of the technology and equipment, there are few buyers for such clean energy. With the availability of carbon mitigation funds and the Clean Development Mechanism benefit, the Government should try to consolidate all such applications, at least within its ownfacilities. The Government should also seek clean energy development funds and the Clean Development Mechanism benefit under the UNFCCC. Any effort to reduce energy consumption by improving the efficiency of applianceswould benefit all sectors. Thus it would be prudent to select an establishment which has all of the above applications and which could also demonstrate a clear improvement in energy efficiency.
4. Project Vision and Objectives The project vision is to develop an integrated approach to energy efficiency improvement in local government/pourashavas, and to strengthen their capacity for sustainable energy use and consumption. To achieve this vision the following objectives are proposed to: 1) Develop a mechanism for continuous improvement, sharing lessons of a pilot
project through replication to create healthy competition amongst all pourashavas(possibly by offering an attractive reward and giving recognition to the pourashavathat best achieves sustainable energy efficiency improvements);
2) Improve the water pumping systems in Tongi Pourashava and to write a Best Practice Manual that can be used by other pourashavas, the Water Supply and Sewerage Authority (WASA), the Public Health Engineering Department (PHED) and LGED;
3) Evolve a responsibility matrix to ensure that the proposed Best Practice Manualis regularly updated through a case study-based approach to ensure continuous improvement;
4) Improve energy efficiency amongst all Tongi Pourashava office energy consumers to create a ‘model energy-efficient pourashava’,so that the experience can be shared with others through workshops;
5) Improve the energy efficiency of streetlights in Tongi Pourashava through the introduction and installation of solar-based street lighting systems; and
6) Replacethe existing fluorescentstreet lights with energy-efficient tubes to reduce power consumption and to extend the longevity of individual luminaires.

TA 7231-BAN: City Region Development Project Final Report
September 2010 Chapter 7-14
5. Energy Sustainability and Efficiency
5.1 The Project The energy sustainability and efficiency project will comprise three Components. They are described below.
Component 1 – Energy efficiency improvements in Tongi’s water supply system and the Pourashava offices Sub-component 1.1 – Energy efficiency improvements in Tongi Pourashava’s water supply system This Sub-component will assist the Pourashava to: (i) undertake an energy audit of the existing water pumping system and analyse data to determine energy-efficient opportunities, including measures for improvements; (ii) prepare a Best Practice Manual by setting out detailed guidelines for improved and efficient energy use in one new pump, and by improving one inefficient existing pump (as identified from an energy audit); (iii) fine-tune the Best Practice Manualfrom these experiences to confirm the Manual’s guidelines; and (iv) increase the capacity of the Pourashava to deliver high-quality water supply (plus increased geographical coverage) by focusing on sustainable and energy-efficient water pumping systems. Sub-component 1.2 – Improving energy efficiency and reducing energy costs in the Tongi Pourashava offices This Sub-component will conduct a detailed energy audit of the Tongi Pourashava offices and recommend a feasible techno-commercial approach to improve energy efficiency by reducing energy costs of fans, air-conditioners, computers, generator sets and vehicles. There should be recommendations for regular metering and monitoring,plusa management information system for reporting and sustaining the improvements. Knowledge of these improvements should be disseminated across consumers in all pourashavas, and throughout Government and private-sector enterprises.
Component 2 – Introduction of a solar-based lighting system This Component will undertake the detailed study and design of a suitable street lighting installation for Tongi Pourashava. It will explore different solar photovoltaic systems and compare LED-based, CFL, metal-halide and T5-based street lights and their operating mechanisms (variously photo-cell based, timer-based, GIS-based and so forth). Other matters to be considered include: the type of luminaire, ingress protection (IP) designation for weather proofing, prismatic, diffused and other types of reflector; types and capacities of batteries; types of controller and inverter; servicing intervals; the security and safety of panels and batteries; mounting pole heights and bracket arrangements; and lux levels (using the 9 or 12 point method). Furthermore, costs and benefits should be analysed by comparing initial and operating costs per kilometre of road of given widths. The project will install sets of two shortlisted products, which will be compared on site in technical and commercial terms: the comparison should enable the most suitable product to be selected for general application. The outcome should include a detailed technical tender specification with performance evaluation criteria for the recommended system.
Component 3 – Energy efficiency improvement in the lighting requirements of Tongi Pourashava This Component will replace all existing 40-Watt four-foot tube lights with retrofit T5 four-foot tube lights fitted with electronic choke and mirror optic reflectors. These lights

TA 7231-BAN: City Region Development Project Final Report
September 2010 Chapter 7-15
consume only 28 watts and provide energy savings of some 50 per cent. These new tube lights would replace thefluorescent tube lights in al of Tongi’s 1,570 streetlight installations, plus the 233 similar tube lights in the offices and other premises under the Pourashava’s control.It is also proposed to prohibit the procurement of energy-inefficient incandescent bulbs: these will be replaced by 23-Watt compact fluorescent light bulbs.
5.2 Project Descriptions and Scope
Component 1 – Energy efficiency Improvements in the water supply system and at Tongi Pourashava offices Sub-Component 1.1 – Energy efficiency improvements in the water supply system in Tongi Pourashava The first Sub-component will treat energy efficiency improvement in the water supply system by taking up two pilot schemes – one to comprise a new tube well and the other to renovate an inefficient existing pump. The project will investigate the overall efficiency of water sourcing, system design, installation, operation and maintenance, plus metering and monitoring. With the completion of the pilot scheme all pumps of Tongi Pourashava would be replaced or refurbished to ensure achievement of similar energy efficiency gains as in the pilot schemes. Tongi Pourashava currently has 22 installed pumps. Annex A provides details of the 22 pumps and in locations they are currently based. Majority of the pumps are 15 to 10 years old and are in poor operating conditions. They are proposed to be replaced. Only a few could be kept in operation with refurbishments. The PPTA team has carried out a preliminary energy audit and established that net gains in energy savings from improved overall efficiency of water sourcing, system design, installation, operation and maintenance are high. Table 3 below shows the annual energy savings established by replacing an existing pump with a new pump. The proposed replacement of all 22 Tongi water pumps brings about a substantial net gain in terms of energy savings and energy bill for the pourashava. The economic assessment in Section provides further details on the benefits arising from energy efficiency improvements in water pumps systems.
Table 3: Annual Energy Savings
Unit Quantity BDT USD
Existing pump consumption kWh/hr 48 0.695
Replacement Pump consumption kWh/hr 22 0.319
Energy Savings per pump kWh/hr 27 0.391
Running time per day hr 20
Energy savings per pump kWh/day 532
Average electricity cost Tk/kWh 4.30 .0623.
Monthly energy savings per pump Tk 2,285 33.12
Annual energy savings per pump Tk 27,425 3,296.15

TA 7231-BAN: City Region Development Project Final Report
September 2010 Chapter 7-16
Best Practice Manual The investigation should lead to the development of a Best Practice Manual, which would be validated and fine-tuned through implementation of the selected system. The scope will include a detailed energy audit of the existing water pumping system in Tongi Pourashava, leading to the preparation of theBest Practice Manual for the underground water pumping system that is referred to above. Amongst other things, the detailed energy audit will aim to: 1. Reduce the system leakages byundertaking a water balance andidentifying all
leakages in the distribution network. Leaks shall be plugged because it is more effective to pump less water than to increase pump efficiency;
2. Optimise the discharge pressure, which will automatically reduce the leakage losses;
3. Determine the energy-efficiency of all existing pumps and recommend how to improve the system’s efficiency by selective replacement, plus maintenance and refurbishment of other pumps by coating their casings impellers and optimising the number of stages;
4. Determine the energy efficiency of all existing motors and explore the scope to replace them with more efficient motors;
5. Assess the pressure drop in the pipelines and explore the possibility of replacing bad or damaged segments, as well as establishing a system for periodic cleaning of pipes and treating them with anti-corrosion coatings;
6. Evaluate the techno-economics of replacing all or some segments with new pipelines using new synthetic anti-corrosive materials which can also reduce frictional losses;
7. Maintain time-logs of performance parameters such as flow, discharge pressure, power consumption, and voltage, to explore possibilities of installing closed-loop variable speed drives (VFD/VSD) to save power by controlling discharge pressure (which varies according to consumer numbers and the underground water level);
8. Investigate whether water supply can be staggered over time by controlling the supply to different localities and thereby controlling the peak load as well with the aim to reduce the power bill by not pumping during peak tariff hours;
9. Explore the technical and economic feasibility of continuous pressure-controlled pumping or constant head supply through overhead tanks and establish the requisite capacity of overhead tanks; and
10. Propose the optimum solution for a given situation in terms of actual water levels, operating conditions and practices.
The Best Practice Manual will cover all aspects of underground water pumping and water distribution, and will include at least the design, site selection, and hardware specifications of pumps, pipes, valves, screens, meters, motors, drives and gauges), plus details of tube well bore depths and diameters, casing pipes, rain water harvesting and bore well recharging, operating pressures, water balance, and storage facilities – including the operating and maintenance practices for optimising performance and achieving the highest energy efficiency and lowest life-cycle cost. The Best Practice Manual will itemise tender rates for all civil, mechanical and electrical, instrumentation and surveys, and performance testing of all components,such as pumps, motors, pipe work, leakage identification, leakage plugging, pipe-cleaning, instrument calibration, condition-based monitoring and component-related maintenance activities, water analysis, and calibration. The Best Practice Manual may be developed as three volumes covering such aspects as civil, mechanical and electrical engineering, instrumentation, pipe work, hydrology and automation.

TA 7231-BAN: City Region Development Project Final Report
September 2010 Chapter 7-17
Sub-component 1.2 –Improvement of energy efficiency and reduction in the energy bill of Tongi Pourashava’s office This Sub-component will undertake a detailed energy audit of Tongi Pourashava’s office and implement suggestions to turn it into an energy efficient model pourashava office that could act as an exemplar for other undertakings. The scope would be to:
• Study and measure the present energy consumption trends for both electricity and liquid fuels to identify opportunities for energy efficiency;
• Collect data on electricity bills and other energy-related data for the preceding 12 months;
• Draw a single line diagram (SLD) for electric power supply and analyse its distribution and recommend improvements, including load-balancing if necessary;
• Measure all electric parameters by logging the voltage, current-draw, power factor, kWh, frequencies and harmonics at the Tongi office. Data for work days shall comprise at least 72 hours, whilst off-days shall also be measured for at least 48 hours;
• Measure the fuel consumed in thegenerator sets and determine the trend of specific energy consumption in terms of kWh generated per litre of fuel. Data should also be gathered on fuel consumed in the Pourashava’s vehicle fleet. An action plan should be prepared to improve maintenance and reduce maintenance;
• Prepare a detailed plan of existing lighting fixtureslocations and to measure lux levels at critical locations. There should also be data on electricity consumed by the relevant lights and a lux distribution diagram should be developed, using the US Department of Energy’s ‘Di-lux’ software. A revised layout for T5 fixtures should be developed to gain maximum benefit from them;
• Measure air flow and power consumption by fans in functional areas and compare specific power consumption with energy efficient 5-star rated fans and document technical and commercial recommendations and quantify relevant energy savings;
• Evaluate the specific power consumption as TR/kW for all air-conditioners, quantify leakages from openings, doors and windows and recommend means to improve the energy efficiency of the air conditioners including evaporative cooling of condensers, the application of thermo-conductive booster fluid to purge evaporator tubes and to remove any accumulated dirt and burnt oil particles that could impede heat transfer in air-conditioners over two years old;
• Analyse the existing power consumption, annual hours run and investment requirements to improving the air conditioners’ performance, plus technical and commercial evaluations of the recommendations;
• Evaluate the most effective ways to meter and monitor major energy consumers. At the very least there should be a monthly spreadsheet and management information system (MIS) on energy and energy efficiency for Pourashava as a whole; and
• The report should develop benchmark energy consumption levels in terms of kWh per square metrefor both air-conditioned and non air-conditioned areas. This should enable the evolution of indices for inter-pourashava comparisons.
All data and analysis will be documented in a final energy audit report with proposals to recommend suppliers of energy efficient equipment for offices, MIS for implementing and monitoring energy consumption and sustainable energy efficiency. It will provide a technical and commercial evaluation for all recommendations and include an

TA 7231-BAN: City Region Development Project Final Report
September 2010 Chapter 7-18
implementation schedule that should be prepared in co-ordination with the management of Tongi Pourashava. The auditor will also prepare guidelines for the Pourashava on how to become and remain most energy-efficient office. The proposal should include an index-based mechanism for an inter-pourashavacompetition to identify the most energy-efficient Pourashava. It may be worthwhile to consider linking the amount of grants awarded to a pourashavaon the basis of its performance.
Component 2 – Introduction of a solar-based lighting system
This Component will evaluate various solar-based street lighting systems and conduct a pilot installation of two preselected typesof light prior to making a final choice. The scope of this Technical Assistance project would be: • To study and design an appropriate street light system, based on solar photo-
voltaic and other techniques, plus all ancillary details such as switch controls, physical design and everything relevant to energy efficiency.
Under this Technical Assistance the scope of work will cover the following: 1. The study of all energy-efficient street lighting options, including solar and solar-
wind hybrid technology; 2. Short listing of at least three configurations based on the survey, followed by the
installation of a pair of sample lights which shall be subjected to an energy audit (including lux measurements using the nine point method); and
3. Based on the technical and economic evaluations, the most suitable light will be identified and procured.
The expected additional revenue by providing 3500 additional lights will be as follows: Present revenue from 30% coverage = Taka 2.8 Million per year Proposed revenue from100% coverage = Taka (2.8/0.3) = Taka 9.3 Million per year Additional revenue generation = (9.3-2.8) = Taka 6.5 Million per year As the periodic valuation of holdings in Tongi area is due shortly and it is expected to increase by 20% due to land cost escalation, the likely revenue earning with increased valuation will be 6.5 x 1.2 = Taka 7.8 million per annum. Thus, the additional recovery by providing 3500 streetlights will be US$ 0.11 Million per year It should be noted that the investment in conventional or solar systems are almost same besides the solar street lights have an added advantage of US$ 0.05 Million per annum energy saving from implementing the solar-LED based street lighting system.
Total savings with recovery of additional revenue will be US$ 0.16 Million per annum
This has to be taken as a carbon mitigation project by using renewable solar energy against the case-as-usual of using 40W streetlights at Tongi Pourashava. Subsequently all Pourashavas can be clubbed to claim carbon credit is.
Component 3 – Energy efficiency improvement in the lighting load at Tongi Pourashava. This Component covers the replacement of conventional 40-Watt fluorescent tables by T5 retrofit tubes.These are of the ‘fix and forget’ type, and can be inserted within

TA 7231-BAN: City Region Development Project Final Report
September 2010 Chapter 7-19
existing fixtures. After installation, a report should be written to detail the performance of the replacement tubes. It should also propose workshops to disseminate success of the project.
The existing 40-Watt tubes consume about 56 watts, including 16 Watts consumption in the electromagnetic chokes, which is about 16 watts. Compared with the existing lights, the recommended T5 retrofit has electronic chokes and consumes only 50 per cent (28 Watts) of power at slightly better lux/Watt levels.It also enjoys three times the working life of the existing tubes.
• Up to 50 per cent power savings; • Improved power factor (from 0.5 to over 0.95 lagging at the source) which
achieves‘reactive power compensation’ savings; • Reduced kVA demand, and hence less distribution loss in the system; • Improved overall power quality and lux output; • Flicker-free starting and illumination; and • Easy installation. Assessment indicates that both the Retrofit (T5 based or LED based) are viable but the T5 based project is financially more attractive and hence recommended for implementation in Tongi Pourashava. The assessment was based on a total replacement of 1800 numbers of T5 retrofit or with T12 size LED based tube lights which can be installed in existing holder with some rewiring and removal of choke. The analysis clearly suggests that T5 retrofit is a better option in terms of the investment and payback periods. Besides, T5 based retrofits are easy to implement as there is no additional work of rewiring etc.
6. Project Component Costs The estimated cost of this Project Component (Excluding Detail Design, Study and Capacity Building)is about USD 5.14 million. TABLE4 states the costs of each sub-component.
TABLE4: Project Component Costs
Project Activity Cost (USD)
A Component 1– Energy Efficiency Improvements in the Water Supply System and Tongi Pourashava office 1,007,076
A1 New tubewell and pump house 91,676
A2 Water pumps including instrumentations 915,400
B Component 2 – Introduction of solar-based lighting system 3,535,000B1 Equipment 3,535,000
C Component 3 – Energy efficiency improvement in lighting load at Tongi Pourashava 63,000
C1 Equipment 63,000 Contingency 538,412
TOTAL COST 5,143,488

TA 7231-BAN: City Region Development Project Final Report
September 2010 Chapter 7-20
7. Benefits
The projects will have many benefits, as follows: 1. An energy efficiency improvement of at least 20 per cent in Tongi Pourashava’s
water supply, by 50 per cent in street lighting and about 30 per cent in officesand other establishments;
2. Energy cost savings could be reinvested in further energy and cost saving measures;
3. The Government can combine all such projects and could claim a substantial carbon credit under UNFCCC;
4. Improved water supply to the consumers, improved street lights and reduced incidences of accidents and thefts;
5. Improved capability within the Pourashava because of capacity-building and training;
6. The scheme meets with the Government’s commitment for mitigation and low carbon development under its BCCSAP 2009 plan;
7. Water conservation due to elimination of leakages and increased coverage bya given volume of water;
8. Proper water supply scheduling also contributes better demand management; 9. The Best Practice Manual for energy-efficient underground water pumping can
be widely disseminated in the public and private sectors; and 10. Reduced transmission and distribution losses in the system as the T5 lights have
power factor of over 0.95 against about 0.7 for conventional chokes, so less reactive power is needed.
The specific benefit is from each of the projects are listed as follows.
Component 1 1) Makes Tongi Pourashava financially stronger, as it saves running costs; 2) Creates a mechanism to share knowledge with others; 3) Strong capacity-building potential through the medium of the Best Practice
Manual; 4) Increased productivity of all assets; 5) Leakage reduction provides more coverage for less energy; 6) Better governance at pourashavalevel arising from the new management
information system and the prospect of an inter-pourashava energy-efficiency competition;
7) Better metering and performance; and 8) Better demand management and the scheduling of pump operation outside peak
demand hours would reduce electricity costs and would also relieve the peak demand crisis in the national grid.
Component 2
1) Street lighting coverage rises from 30 per cent to 100 per cent; 2) The annual street light tax revenue increases from taka2.8 million to over taka10
million; 3) Reduce it is recurring cost in inefficient lighting system;

TA 7231-BAN: City Region Development Project Final Report
September 2010 Chapter 7-21
4) Help ease the national energy crisis by not drawing any further power, assuming the use of solar powered street lights;
5) Help peak load management as street lights are put on during evening peak hours
6) Helps carbon mitigation by becoming environmentally-friendly; 7) Provides excellent opportunities for capacity-building; 8) Provides potential employment opportunities for operation and maintenance
engineers; 9) The Component is a potential candidate for earning carbon credit;
10) Creates and promotes healthy competition and sustainability in Governance 11) Empowers pourashavas to provide better quality and service coverage.
Component 3 1) Reduced energy consumption and cost reduction for Tongi Pourashava; 2) Improved financial strength as relative office lighting costs are reduced by half; 3) Capacity building through energy efficiency improvement projects; 4) Reduced load on national grid contributes towards relieving energy crisis; 5) Reduced operation and management costs due to better technology; and 6) Potential candidate for earning carbon credit Sustainability
The project offers wide scope for replication amongst all the agencies dealing in groundwater pumping, such as WASA, other pourashavas and the private sector. Similarly, the ‘T5 retrofit’ Technical Assistance could be replicated nationwide and could even be made mandatory.
Furthermore, the Technical Assistance project outcome on solar or solar-wind hybrid streetlights (and possibly solar power plants for small offices) may be recommended for all existing and remotely-located offices where the economics would make a good case for renewable energy.
All those organisations and individuals who need underground water pumping can adopt Best Practice Manual guidelines toimprove their energy efficiency.Similarly, local governments could adopt street light energy-saving options to suit their requirements.
Wide media coverage should also be given to energy efficiency measures via the press, TV and radio to demonstrate the Government’s commitment to energy saving and energy efficiency.
8. Economic Assessment
8.1 Methodology and Assumptions
Economic analysis has been conducted in accordance with the ADB’s Guidelines for the Economic Analysis of Projects (1997) and the Framework for the Economic and Financial Appraisal of Urban Development Sector Projects (January 1994).
The project component is intended to achieve improved and efficient use of energy by focusing on: (i) energy conservation and efficiency in the local water pumping system and at the office; (ii) designing and installing an appropriate solar-based street lighting

TA 7231-BAN: City Region Development Project Final Report
September 2010 Chapter 7-22
system; and (iii) improving the street lighting system by replacing the existing tube lights with more energy-efficient tubes.
The following approach and assumptions have been used in the analysis:
All prices are expressed in 2010 prices and economic analysis is conducted at 2010 constant price;
An average exchange rate of Taka 69 per US$1.00 is employed when converting foreign exchange costs to local currency equivalent;
Economic prices of capital works and annual operation and maintenance are calculated from the financial cost estimates of the technical team, adjusted to allow for transfer payments and to correct for any other market distortions;
Price contingencies and interest during construction (as a result of any debt financing) are excluded in the calculation of economic internal rate of return (EIRR) but physical contingencies are included because they represent real consumption of resources;
Taxes and duties are excluded because they represent transfer payments;
All costs are valued using the domestic price numeraire; tradable inputs, net of duties and taxes, are adjusted by the shadow exchange rate factor of 1.13 while non-tradable inputs (except for unskilled labor), net of taxes and duties, are adjusted by a conversion factor of 0.9; unskilled labor is adjusted by a conversion factor of 0.7 of the market wage rate to estimate the shadow wage rate;9
The economic opportunity cost of capital (EOCC) is assumed at 12% in real terms; and
Project sub-component for the street lighting system is assumed to have useful economic life of 25 years; project sub-component for the water pumping system is assumed to have useful economic life of 7 years.
8.2 Economic Benefits
Water Pumping System
The economic benefits of this sub-component have been quantified in terms of the following:
Energy savings estimated at 50% of power consumption of existing pumps valued at the current power cost of Taka 4.30/kWh and adjusted into economic price;10 and
Resource cost savings from the replacement of existing pumps valued at Taka 3.17 million per unit of installed pump and adjusted into economic price.11
Other benefits which could result to double counting and hence not accounted for in the analysis include: contribution towards relieving the national energy crisis.
9 Conversion factors for economic shadow pricing are based on recently approved ADB projects in Bangladesh. 10 Existing pump consumption is estimated at 403 gWh/year/pump while replacement pump consumption is estimated at 180 gWh/year/pump.
11 Existing pumps are all due for replacement even without the proposed sub-component.

TA 7231-BAN: City Region Development Project Final Report
September 2010 Chapter 7-23
Street Lighting System
The economic benefits of this sub-component have been quantified in terms of the following:
Energy savings estimated based on 12 hours daily running time of a 40W tube light and valued at the economic price of current power cost;
Resource cost savings from the installation of a 40W tube street light valued at Taka 69 thousand per unit of installed street light and adjusted into economic price;12
Resource cost savings from the replacement of a 40W tube light, assumed at twice a year, valued at Taka 600 per unit of installed 40W tube light and adjusted into economic price; and
Incremental street light revenue as a result of the sub-component is estimated at Taka 8.4 million annually.
Other benefits which are not easily quantifiable or could result to double counting and hence not accounted for in the analysis include: social benefits such as less night crime, better security surveillance, fewer road accidents and improved sense of security amongst local residents due to availability of street lights, contribution towards relieving the national energy crisis, and potential candidate for earning carbon credit.
8.3 Economic Analysis and Sustainability
The purpose of the economic analysis is to determine if the component’s EIRR exceeds its EOCC, in real terms. If the component’s EIRR exceeds its EOCC, it can be concluded that the component is economically viable.
Sensitivity analyses have been undertaken in order to test the robustness of the economic results to adverse changes in conditions. The following adverse changes have been analyzed:
A capital cost overrun of 10%;
An increase in the O&M cost by 10%;
A reduction in the benefits by 10%; and
Project component benefits delayed by one year. The results of the economic and sensitivity analysis are shown below.
12 Street light similar to the existing 40W tube street light will be installed instead if not a solar-based street light.

TA 7231-BAN: City Region Development Project Final Report
September 2010 Chapter 7-24
EIRR and Sensitivity Analyses
Scenario NPV / 1
(‘000 Taka) EIRR (%) SI / 2 SV / 3 % Change
Water Pumping System Base Case 35,694 7.92% 10% Increase in Capital Costs 24,906 5.48% 3.09 32% 10% 10% Increase in O&M Costs 35,694 7.92% 5.68 18% 10% 10% Decrease in Benefits 21,337 5.23% 2.82 35% 10% Project Benefits Delayed by One Year 17,152 4.03% Solar-based Street Light System Base Case 49,479 2.57% 10% Increase in Capital Costs 18,967 1.53% -1.10 -91% 10% 10% Increase in O&M Costs 49,479 2.57% 0.00 0% 10% 10% Decrease in Benefits 14,020 1.42% -1.22 -82% 10% Project Benefits Delayed by One Year 33,640 2.00% 1/ NPV = Net Present Value discounted at EOCC 2/ SI = Sensitivity Indicator (ratio of % change in EIRR above the cut-off rate of EOCC to % change in a variable) 3/ SV = Switching Value (% change in a variable to reduce the EIRR to the cut-off rate of EOCC) Source: Consultant’s calculation
Based on the results above, it can be concluded that the proposed component is economically viable under the base case scenario and also under adverse changes in conditions. The sensitivity analysis indicates that the proposed component is most sensitive to delay in project benefits and reduction in benefits, but remains well above the EOCC.
The economic sustainability of the proposed component largely depends on the adequate maintenance of the facilities. Unless the facilities can be maintained adequately, the economic benefits assumed in the analysis will not materialize. The projected financial performance13 of the implementing agency in the long term shows that funds will be available to maintain the facilities adequately. However, availability of funds of the implementing agency would require that the LGD of the Ministry of LGRDC periodically review and update the model tax schedule which regulates the taxes and fees that municipalities can levy and collect to keep pace with the rising costs of municipal administration and services and maintenance of facilities.
9. Financial Assessment
9.1 Methodology and Assumptions
Financial analysis has been undertaken in accordance with the ADB's Framework for the Economic and Financial Appraisal of Urban Development Sector Projects (January 1994) and the Guidelines on the Financial Governance and Management of Investment Projects Financed by the ADB (January 2002). Under the ADB guidelines, financial internal rate of return (FIRR) calculations should be carried out for revenue generating subprojects.14 For non-revenue generating subprojects, such as the water pumping system sub-component, financial internal rate of return (FIRR) calculations are not
13 Detailed financial performance of implementing agencies are discussed in a separate report called “Financial
Performance Assessment”. 14 Examples are: water supply, environmental sanitation and low-income housing.

TA 7231-BAN: City Region Development Project Final Report
September 2010 Chapter 7-25
required, though economic analysis is undertaken. The solar-based street light sub-component, on the other hand, is considered a revenue generating subproject. Street light tax, an element of the property tax, is levied by municipalities from properties within a 300 feet radius of any street light.
The following approach and assumptions have been used in the analysis:
Incremental street light revenue as a result of the sub-component is estimated at Taka 8.4 million annually;
All prices are expressed in 2010 prices and calculation of financial internal rate of return (FIRR) is conducted at 2010 constant price;
An average exchange rate of Taka 69 per US$1.00 is employed when converting foreign exchange costs to local currency equivalent;
Financial prices of capital works and annual operation and maintenance are based on the financial cost estimates of the technical team;
Price contingencies and interest during construction (as a result of any debt financing) are excluded in the calculation of FIRR but physical contingencies are included because they represent real consumption of resources;
Project component is assumed to be financed by 50% grant and 50% subsidiary loan in local currency from the central government to the implementing agency; subsidiary loan is assumed to have a repayment period of 25 years, inclusive of a 3 year grace period, at an interest rate of 5% per annum;
The financial opportunity cost of capital (FOCC) of the grant is assumed at 10% per annum15;
Local inflation factor is assumed at 6.5% in 2010 and 6% thereafter16; foreign inflation factor is assumed at 1.5% in 2010, 0.7% in 2011 and 0.5% thereafter
Projected fiscal condition of the implementing agency is done and presented on current price basis applying the assumed inflation factors.
9.2 Financial Analysis and Sustainability
The purpose of the financial analysis is to determine if the component’s FIRR exceeds its FOCC in real terms. If the component’s FIRR exceeds its FOCC, it can be concluded that the component is financially viable.
The Weighted Average Cost of Capital (WACC) of the component in real terms is used as proxy for the FOCC. The WACC represents the cost incurred by the entity in raising the capital necessary to implement the project component. The WACC therefore is the benchmark to assess the financial viability of the project component. The WACC of the project component is 1.4% as calculated below.
15Approximated by interest rate of 10-year national government bond. 16 ADB estimated inflation factors for Bangladesh.

TA 7231-BAN: City Region Development Project Final Report
September 2010 Chapter 7-26
Weighted Average Cost of Capital
Particulars Sub-Loan Grant Equity Total
Weight (%) 50.0% 50.0% 0.0% 100.0% Nominal Cost (%) 5.0% 10.0% 0.0% Tax Rate (%) 0.0% 0.0% 0.0% Tax Adjusted Nominal Cost (%) 5.0% 10.0% 0.0% Inflation Rate (%) 6.0% 6.0% 6.0% Real Cost (%) -0.9% 3.8% 0.0% Weighted Component of WACC (%) -0.5% 1.9% 0.0% Weighted Average Cost of Capital (Real Terms) 1.4% Source: Consultant’s calculation
Sensitivity analyses have been undertaken in order to test the robustness of the financial results to adverse changes in conditions. The following adverse changes have been analyzed:
A capital cost overrun of 10%;
An increase in the O&M cost by 10%;
A reduction in revenues by 10%; and
Project component delayed by one year. The results of the FIRR calculation and sensitivity analysis for the street light sub-component are shown below.
FIRR and Sensitivity Analyses- Solar bases Street Lighting
Scenario NPV / 1
(‘000 Taka) FIRR (%) SI / 2 SV / 3 % Change
Base Case 59,361 2.87% 10% Increase in Capital Costs 28,633 1.82% 5.48 18% 10% 10% Increase in O&M Costs 40,980 2.30% 2.98 34% 10% 10% Decrease in Revenues 41,078 2.30% 2.97 34% 10% Project Component Delayed by One Year 51,194 2.57% 1/ NPV = Net Present Value discounted at WACC 2/ SI = Sensitivity Indicator (ratio of % change in FIRR above the cut-off rate of WACC to % change in a variable) 3/ SV = Switching Value (% change in a variable to reduce the FIRR to the cut-off rate of WACC) Source: Consultant’s calculation
Based on the results above, it can be concluded that the proposed sub-component is financially viable under the base case scenario and also under adverse changes in conditions. The sensitivity analysis indicates that the proposed sub-component is most sensitive to increase in capital costs and reduction in revenues, but remains well above the WACC.
The financial sustainability of the proposed component largely depends on the adequacy of funds of the implementing agency to operate and maintain the infrastructure facilities. The fiscal condition of the agency in the long term has been projected based on the following factors: growth trends over the past 5 year period,

TA 7231-BAN: City Region Development Project Final Report
September 2010 Chapter 7-27
assumed annual inflation rate, on-going and planned development programs, future improvement action plans, and consultant’s own estimates.
The forecasted fiscal condition (see table below) shows that the agency has the ability to generate funds to maintain adequately the project component’s and other municipal services’ facilities, and meet the entity’s financial obligations, including debt service payments. Adequate funds will be available to operate and maintain the infrastructure facilities sustainably. However, availability of funds of the implementing agency would require that the LGD of the Ministry of LGRDC periodically review and update the model tax schedule which regulates the taxes and fees that municipalities can levy and collect to keep pace with the rising costs of municipal administration and services and maintenance of facilities.
The main risks associated with the project related to financial aspects are: i) low collection efficiency of local taxes and fees; ii) uncertainty regarding adjustment of local taxes and fees by the LGD necessary to ensure financial sustainability of the project component and other municipal services; and iii) inadequate funding of the right level of operations and maintenance of the project component and other municipal services. The risks will be mitigated through a periodic review of tax collection and other financial performance, budget monitoring and variance analysis, and formulation of improvement action plan as a result of the periodic review and analysis.

TA 7231-BAN: City Region Development Project Final Report
September 2010 Chapter 7-28
Tongi Pourashava Projected Fiscal Condition
Yr 1 Yr 2 Yr 3 Yr 4 Yr 5 Yr 6 Yr 7 Yr 8 Yr 9 Yr 10 Yr 11 Yr 12 Yr 13 Yr 14 Yr 15RevenueOwn-Source Revenue
i) Property taxes and rates 40,484,748 52,630,173 63,767,983 67,594,062 71,649,706 75,948,688 98,733,295 104,657,292 110,936,730 117,592,934 124,648,510 162,043,063 171,765,646 182,071,585 192,995,880ii) Tax on transfer of immovable property ownership 42,285,702 50,742,843 60,891,411 73,069,694 87,683,632 105,220,359 126,264,430 151,517,317 181,820,780 218,184,936 261,821,923 314,186,308 377,023,569 452,428,283 542,913,939iii) Business and other (non-property) taxes 20,753,008 24,903,609 29,884,331 35,861,197 43,033,437 51,640,124 61,968,149 74,361,778 89,234,134 107,080,961 128,497,153 154,196,584 185,035,900 222,043,080 266,451,697iv) Fees, rents and other income 29,608,136 31,384,624 33,267,701 35,263,764 37,379,589 39,622,365 41,999,707 44,519,689 47,190,870 50,022,323 53,023,662 56,205,082 59,577,387 63,152,030 66,941,152
Sub-Total Own-Source Revenue 133,131,594 159,661,249 187,811,427 211,788,716 239,746,364 272,431,535 328,965,580 375,056,076 429,182,514 492,881,153 567,991,248 686,631,035 793,402,502 919,694,978 1,069,302,668Non-Development Grants 1,000,000 1,060,000 1,123,600 1,191,016 1,262,477 1,338,226 1,418,519 1,503,630 1,593,848 1,689,479 1,790,848 1,898,299 2,012,196 2,132,928 2,260,904Sub-Total Recurrent Revenue 134,131,594 160,721,249 188,935,027 212,979,732 241,008,841 273,769,761 330,384,099 376,559,706 430,776,362 494,570,632 569,782,095 688,529,334 795,414,699 921,827,906 1,071,563,572Development Grants 15,000,000 195,863,500 16,854,000 17,865,240 18,937,154 20,073,384 21,277,787 22,554,454 23,907,721 25,342,184 26,862,715 28,474,478 30,182,947 31,993,924 33,913,559Loan and Other Receipts 0 179,963,500 0 0 0 0 0 0 0 0 0 0 0 0 0Total Revenue 149,131,594 536,548,249 205,789,027 230,844,972 259,945,995 293,843,145 351,661,886 399,114,160 454,684,083 519,912,816 596,644,811 717,003,812 825,597,646 953,821,830 1,105,477,131ExpendituresRecurrent Expenditure
i) Personnel costs 30,523,283 32,354,680 34,295,960 36,353,718 38,534,941 40,847,038 43,297,860 45,895,731 48,649,475 51,568,444 54,662,550 57,942,304 61,418,842 65,103,972 69,010,211ii) Other recurrent expenditures 21,769,827 26,123,792 31,348,551 37,618,261 45,141,913 54,170,295 65,004,354 78,005,225 93,606,270 112,327,524 134,793,029 161,751,635 194,101,962 232,922,355 279,506,825
Sub-Total Recurrent Expenditures 52,293,109 58,478,472 65,644,511 73,971,979 83,676,854 95,017,333 108,302,214 123,900,957 142,255,746 163,895,968 189,455,580 219,693,939 255,520,804 298,026,327 348,517,036Development Expendtures 50,000,000 434,927,000 100,000,000 125,000,000 150,000,000 160,000,000 210,000,000 250,000,000 280,000,000 330,000,000 380,000,000 430,000,000 480,000,000 530,000,000 630,000,000Loan Repayment and Other Disbursements 1,004,846 974,550 9,932,329 18,060,727 17,577,242 16,764,285 15,951,310 15,542,302 15,133,294 14,724,286 14,315,278 13,906,270 13,497,263 13,088,255 12,679,247Total Expenditures 103,297,955 494,380,022 175,576,840 217,032,706 251,254,096 271,781,618 334,253,524 389,443,259 437,389,040 508,620,255 583,770,858 663,600,209 749,018,066 841,114,581 991,196,283Revenue Surplus (Deficit) 45,833,639 42,168,227 30,212,187 13,812,267 8,691,899 22,061,527 17,408,362 9,670,901 17,295,043 11,292,562 12,873,953 53,403,603 76,579,579 112,707,249 114,280,848Opening Balance 92,968,682 138,802,321 180,970,548 211,182,735 224,995,001 233,686,901 255,748,427 273,156,789 282,827,690 300,122,734 311,415,295 324,289,248 377,692,851 454,272,430 566,979,679Closing Balance 138,802,321 180,970,548 211,182,735 224,995,001 233,686,901 255,748,427 273,156,789 282,827,690 300,122,734 311,415,295 324,289,248 377,692,851 454,272,430 566,979,679 681,260,528
Financial Ratios and IndicatorsProperty Tax Collection Efficiency (%) 95% 95% 95% 95% 95% 95% 95% 95% 95% 95% 95% 95% 95% 95% 95%Operating Ratio /1 0.39 0.36 0.35 0.35 0.35 0.35 0.33 0.33 0.33 0.33 0.33 0.32 0.32 0.32 0.33Total Revenue - Year on Year Growth (%) -3% 260% -62% 12% 13% 13% 20% 13% 14% 14% 15% 20% 15% 16% 16%Total Expenditures - Year on Year Growth (%) -27% 379% -64% 24% 16% 8% 23% 17% 12% 16% 15% 14% 13% 12% 18%Own-Source Revenue - Year on Year Growth (%) 17% 20% 18% 13% 13% 14% 21% 14% 14% 15% 15% 21% 16% 16% 16%Share to Total Revenue (%):
Total own-source revenue 89% 30% 91% 92% 92% 93% 94% 94% 94% 95% 95% 96% 96% 96% 97%Non-development grants 1% 0% 1% 1% 0% 0% 0% 0% 0% 0% 0% 0% 0% 0% 0%Development grants 10% 37% 8% 8% 7% 7% 6% 6% 5% 5% 5% 4% 4% 3% 3%Loan and other receipts 0% 34% 0% 0% 0% 0% 0% 0% 0% 0% 0% 0% 0% 0% 0%
Property Taxes to Total Own-Source Revenue (%) 30% 33% 34% 32% 30% 28% 30% 28% 26% 24% 22% 24% 22% 20% 18%Share to Total Expenditures (%):
Personnel costs 30% 7% 20% 17% 15% 15% 13% 12% 11% 10% 9% 9% 8% 8% 7%Other recurrent expenditures 21% 5% 18% 17% 18% 20% 19% 20% 21% 22% 23% 24% 26% 28% 28%Development expenditures 48% 88% 57% 58% 60% 59% 63% 64% 64% 65% 65% 65% 64% 63% 64%Loan repayment and other disbursements 1% 0% 6% 8% 7% 6% 5% 4% 3% 3% 2% 2% 2% 2% 1%
Personnel to Total Recurrent Expenditures (%) 58% 55% 52% 49% 46% 43% 40% 37% 34% 31% 29% 26% 24% 22% 20%1/ Operating Ratio = Recurrent Expenditures divided by Recurrent Revenues
Revenue and Expenditure Statement (in Taka) <========== Projection ==========>
Source: Consultant’s Estimates

TA 7231-BAN: City Region Development Project Final Report
September 2010 Chapter 7-29
Annex A - Detailed Base Cost Estimates Cpt. Unit Totals No. Description Unit Quantity Rate (US$) (US$) (inc tax)
1 Energy Efficiency Improvements in Water Pumps and Office 1.1 Energy Audit and Best Practice Manual Preparation LS 1 472,500 472,5001.2 New tubewell and pump house LS 1 91,676 91,6761.3 Water pumps including instrumentations No 23 39,800 915,400
Sub Total 1,479,576
2 Introduction of Solar‐based Street Lighting System 2.1 Study, evaluation and design of suitable solar‐based system LS 1 306,540 306,5402.2 Purchase and installation of solar‐based street lights system No 3,535 1,000 3,535,000
Sub Total 38415403 Replacement of present 40W tube light
3.1 Purchase of retrofit T5 tubes No 1,800 35 63,000 Sub Total 63000 TOTAL COSTS 5,384,116 Contingency 10% 538,412 COSTS + CONTINGENCY 5,922,528 Assumed Exchange Rate USD = BDT 69 No = Number cum = Cubic Meter sqm = Square Meter sqf = Square Foot m = Meter kg = Kilo Gram LS = Lump Sum km = Kilo Meter

TA 7231-BAN: City Region Development Project Final Report
September 2010 Chapter 8-1
Sub-Project: 5
ECONOMIC DEVELOPMENT – IMPROVED SERVICE DELIVERY/WATER SUPPLY AND SANITATION (GAZIPUR POURASHAVA)
TA 7231-BAN: City Region Development Project Final Report
September 2010 Chapter 8-2
Table of Contents
1. Purpose and Background ........................................................................................ 3
2. The Policy Context .................................................................................................. 3
3. Situation Analysis .................................................................................................... 43.1 General ...................................................................................................................... 4
3.2 Water Supply ............................................................................................................. 5
3.3 Sanitation ................................................................................................................. 11
3.4 Fringe Areas and Informal Housing (Water Supply and Sanitation) .......................... 14
3.5 Strategic Planning – Regional Context ..................................................................... 14
4. Project Vision and Objectives ................................................................................ 15
5. The Proposal – Description ................................................................................... 16
6. Component 1 - Water Supply ................................................................................ 166.1 Phase 1 - Preparatory Studies ................................................................................. 16
6.2 Phase 2 – Implementation Works ............................................................................ 19
7. Component 2 - Sanitation ...................................................................................... 227.1 Phase 1- Preparatory Studies .................................................................................. 22
7.2 Phase 2 – Implementation Works ............................................................................ 23
8. The Sub-Project Costs .......................................................................................... 24
9. Benefits ................................................................................................................. 25
10. Scope for Replication ......................................................................................... 25
11. Economic Assessment ...................................................................................... 2611.1 Methodology and Assumptions ................................................................................ 26
11.2 Economic Benefits ................................................................................................... 27
11.3 Economic Analysis and Sustainability ...................................................................... 27
12. Financial Assessment ........................................................................................ 2812.1 Methodology and Assumptions ................................................................................ 28
12.2 Tariff and Affordability .............................................................................................. 29
12.3 Financial Analysis and Sustainability ........................................................................ 30
Annex A – Detailed Base Cost Estimates ..................................................................... 33
Annex B – Gazipur Population Census by Pourashava ............................................... 35

TA 7231-BAN: City Region Development Project Final Report
September 2010 Chapter 8-3
1. Purpose and Background
This Sub-Project provides a Feasibility Assessment (the ‘Assessment’) for the improved service delivery in water supply and sanitation (WSS) for Gazipur Pourashava . The Assessment has been prepared following discussions with the Mayor of Gazipur Pourashava and key professional officers, together with representatives of other related agencies including LGED and the Department of Public Health Engineering (DPHE), who have all expressed in-principle support for this Sub-Project. The purpose of this Sub-Project is to: (i) Improve and expand the water supply system in Gazipur; and (ii) improve and expand the sanitation arrangements in Gazipur. To this extent the Sub-Project has two distinct Components; first water supply and second sanitation.
Gazipur Pourashava is a local government administrative area located some 40 km north of the Capital, Dhaka. It is designated as a Class ‘A’ municipality based on population numbers and income. Gazipur Pourashava is the district headquarters of the larger administrative District of Gazipur. It is also understood from discussions with representatives from Rajuk, that Gazipur District will be a location for the long-term development of a Satellite City.
Significantly the proposed Sub-Project does not include detailed consideration of WSS in relation to the industrial sector, although this matter is recommended for further study as part of the proposed Sub-Project.
It is proposed the Sub-Project will be designed and implemented over a five year period.
2. The Policy Context
The WSS in Bangladesh is fashioned by a number of strategic national policies and goals.
The National Water Policy 1998 is the most significant policy for the sector. This details service delivery arrangements for the sector and outlines the roles for the Department of Public Health Engineering (DPHE) and the Local Government Division (LGD) as well as recognising the important roles of the non-government organisations (NGOs) and the private sector in service development and delivery. Other frameworks and strategies include the:
(i) Sector Development Framework (SDF), 2004; (ii) National Sanitation Strategy, 2005; (iii) National Water Management Plan (NWMP), 2004; (iv) National Policy for Arsenic Mitigation 2004; and (v) The Pro-Poor Strategy 2005.
These further define and complement the WSS Policy of 1998. The Arsenic Policy 2004 addresses widespread ground water contamination problems.
Bangladesh is also committed to achieving the targets of the Millennium Development Goals (MDG). Included in the NWMP of 2004 are targets and timescales covering water supply and sanitation. The plan aims to achieve 100% provision of water supply and sanitation services in towns and rural areas, over the ten years followings its

TA 7231-BAN: City Region Development Project Final Report
September 2010 Chapter 8-4
introduction. Somewhat confusingly, staged targets are also included for 2010 and 2015 which set targets for piped water supply in urban areas at 70% and 90%, and for piped water supply in rural areas at 10% and 40% respectively.
In the case of basic sanitation facilities, it aims to achieve 100% coverage by 2010 in both urban and rural areas. It also aims for 30% coverage of sewerage systems in urban areas by 2010.
The MDG sets the target of halving the percentage of people without safe water and basic sanitation by the year 2015. However, targets within the NWMP effectively supersede these.
A Sector Development Programme Report (SDP) formulating a comprehensive development plan for the water supply and sanitation sector of Bangladesh over a ten year period was prepared by Danish consultants in December 2005 with backing from the Danish Government. This, amongst other specific objectives, aimed to ensure that the basic minimum needs relating to WSS were met by the year 2010 with improved levels thereafter. Included were details of a transition plan to realise recommended sector reforms and sector capacity building requirements to achieve the desired WSS coverage and performance levels.
3. Situation Analysis
3.1 General Area
Gazipur Pourashava covers an area of 48.5 km2. In line with the approach used in WSS planning at Gazipur the pourashava is sub divided into a core area, covering 16 km2
around the middle of the pourashava, and a fringe area, covering the remaining 32.5 km2
Population Growth Pattern and Projections
. Map 1 refers and broadly illustrates the extent of the core area.
The highest population densities are found towards the centre of the core area but rural or semi rural enclaves are found around the periphery. There is some industrial clustering and unplanned urban residential and other urban fringe land uses scattered across the rural hinterland. Agriculture and other related uses are under pressure from unplanned urban development. As such the rural hinterland increasingly houses a large migrant population.
Population estimates and projections are difficult to estimate for the pourashava due to significant urban migration to the area. Current population numbers and population densities are also unavailable for the Pourashava as a whole and within the core areas in particular, although population by ward is available for 2005 and is shown as Appendix A.
According to Census of 2001, the population of Gazipur Pourashava was 128,429. Gazipur Pourashava carried out a further population count in the year 2005 and the total population of that time was estimated at 300,112 among which 156,586 were male and 143,526 were female. A copy of the population survey information is attached in the Appendix A. The large proportional increase of population is due mainly to migration attracted to employment opportunities provided by the expansion of commercial and industrial activities in the pourashava.

TA 7231-BAN: City Region Development Project Final Report
September 2010 Chapter 8-5
Based on the national average growth rate of 3.3%, a conservative population estimate for 2010 is some 353,008 persons and projected to rise to 371,380 and 422,530 in 2015 and 2020 respectively. The current expectation is however, that the growth will continue to be greater than the national average and the population of Gazipur may exceed 500,000 over the next ten years (2020).
3.2 Water Supply Sources and Production
Gazipur Pourashava is entirely dependent on ground water for its water supply, through means of production (tube) wells. Only eight production wells are currently working and they are located at ‘Rajbari water works compound’, ‘Boruda’, ‘Madhovbari water works compound’, ‘Joorpukur’, ‘Madhapara near mondhir’, ‘Bazar water works compound’ and North bilashpur, Laxmipura water works compound’
Shallow production wells employing mechanical or hand pumps are also widespread in central Gazipur as households cannot depend on the irregular piped supply.
Recently four new production wells have been completed but not yet commissioned. The locations of these production wells are ‘East chandana near graveyard’, ‘LaxmipuraTalukderpara’, ‘Niamatsharak’ and ‘HajibaghBhora’. It is expected that these production wells will be commissioned soon. DPHE checked the performance of the existing eight production wells in the month of October, 2009 under a well monitoring and regeneration project. The production capacities furnished in Table 1 show the results of the project. Total production capacity was 7,867 cum/day. On average each pump is operated for 11hours/ day. The pumps are not operated for 24 hours/ day due to the intermittent supply of electricity and inadequate storage capacity.
Groundwater Levels
As with the Region in general, the Gazipur Pourashava is suffering from a serious decline in ground water levels. Figures reveal that the static ground water level has declined by approximately 7 to 8 metres in the last eight years since 2001, which represents an average fall of around 1m annually. The reduction is particularly acute during the dry season when water demand is high and levels become even lower as a result of high drawdown.
Apart from seasonal affects, the decline is having a year-on-year effect on water yield from the production wells. Data suggests that there has been an overall 12% reduction in yield since the production wells were originally installed (table 1 refers). Other factors possibly affecting yield, including incorrect construction or strainer blockages, require assessment under this project component.
Shallow production wells in the rural and semi rural areas are also being heavily affected by the decline in groundwater levels with wells drying up periodically.

TA 7231-BAN: City Region Development Project Final Report
September 2010 Chapter 8-6
Table 1: Water Supply Production (Yield) Details
No Location Water Levels (m) Production Capacity
(m3/h) Operating Period (hrs)
Total Product-ion
(m3/d) Static Pump-ed
Draw- down
When Installed Current
1. Rajbari 15.75 20.25 5.5 120 99 19 1,881
2. Boruda 18.75 24.15 5.88 84.3 77.7 10.3 800
3. Madhovbari 21.28 27.52 6.28 100 75.4 10 754
4. Bazar 19.50 24.50 5.00 104 101.6 11 1,118
5. N. Bilashpur 24.40 28.18 6.78 127 80 10 800
6. Laxmipura 20.10 24.72 4.62 130.5 128 8 1024
7. East Chandana 20.30 25.50 5.20 101 99.8 8 798
8. Talukdarpara 21.95 27.30 5.35 100 98.9 7 692
Totals 866.8 760.4 7,867
Ground Water Levels
The ground water level of Gazipur Pourashava is depleting at up to of 1m/ year. This is revealed from the from the water table data of two areas. In the Chhayabithi area the static water level was 12.44m in 1997, but in 2009 it is 19.63m, a difference of 7.19 m in twelve years. In the Bazar area the static water level was 10.8 m in 1997, but in 2009 it is 18.85m a difference of 8.05m in 12 years. The difference between 2008 and 2009 is alarming, suggesting a 2m depletion in 1 year only. More detailed statistics are shown below in table 2. Table 2: Water Table Data
Water Table Data (Chayabithi Area)
Year SWL (m) PWL (m) DD (m) 1997 12.44 18.73 6.29 1999 14.04 10.12 4.08 2001 13.74 17.95 4.21 2003 14.05 19.10 5.05 2005 14.96 20.84 5.90 2006 17.12 27.00 9.88 2007 17.80 27.10 9.30 2008 17.34 38.76 21.02 2009 19.63 41.29 21.16

TA 7231-BAN: City Region Development Project Final Report
September 2010 Chapter 8-7
Water Table Data (Bazar Area)
Year SWL (m) PWL (m) DD (m) 1997 10.80 15.14 4.34 1999 14.34 18.52 4.18 2001 13.18 19.15 5.97 2003 12.34 18.36 6.02 2005 17.25 20.20 5.96 2006 10.00 20.80 4.80 2007 17.47 21.30 3.90 2008 17.10 24.80 3.85 2009 18.85 24.80 4.95
SWL-Static water level PWL-Pumped water level D.D-Draw down Water Quality Water quality monitoring surveys show that iron and arsenic in the groundwater is below the WHO and National standards for consumption. The laboratory test results of two test boring wells, one located near HaziYounus Ali NiamatSarak and the other at Jorpukurpar (near Mandir) are furnished below in table 3. Table 3: Water Quality
Water Quality Parameters
Bangladesh Standard
WHO International Standard
Present Concentration
Desirable Level
Highest Permissible Level
Site A Site B
pH 6.5- 8.5 7.0 to 8.5 6.5 to 9.2 7.3 6.9
Conductivity ----- ----- ----- 380µs/cum 397µs/cum
Alkalinity (HCO3
----- )
----- ----- 192 mg/l 195 mg/l
Hardness (AsCaCO3
200-500 mg/l )
100 mg/l 500 mg/l 78mg/l 76mg/l
Chloride
150-600 mg/l
200 mg/l 600 mg/l 35 mg/l 32 mg/l
Arsenic .05mg/l (50ppb)
.01mg/l .05 mg/l 2 ppb 2 ppb
Boron 1 mg/l ----- ----- <0.4 mg/l 0.52mg/l
Barium .01 mg/l ----- ----- 47.44 ppb 54.50 ppb
Iron 0.3-1 mg/l 0.1 mg/l 1 mg/l 0.63 mg/l 0.73 mg/l
Magnesium 0.1 mg/l < 30 mg/l 150 mg/l 0.1mg/l 0.1mg/l

TA 7231-BAN: City Region Development Project Final Report
September 2010 Chapter 8-8
Water Demand
Current water demand in the area is uncertain due to the conflicting production well data, but at rates of 7,867 m3/ and with estimated losses of some 40%, the net amount of water available to 100,000 piped consumers in central Gazipur is around 50 litres per capita per day (lpcd) which is very low but well above the National Pro-Poor WSS Strategy (2005) figures.
At production rates of 4,496m3
Distribution System
/d and again accounting for leakage, the net amount of water available is around 27 lpcd which is which is just 7 litres above the minimum defined in the National Pro-Poor WSS Strategy. The water demand or consumption outside of the piped supply network and in the Fringe Areas is unknown.
The pourashava quotes per capita consumption figures per day of 42.55 litres but the exact reasoning behind this figure was not discovered. The pourashava considers the normal per capita demand to be 100 lpcd.
Central Gazipur is served by eight piped distribution systems each supplied by the eight operational production wells. The total length of the distribution system is some 28.25kms and supplies water to around 34% of the population of the pourashava or some 100,000 people. These figures appear mismatched but it is not possible to confirm the accuracy of this information at this stage. According to the Authorities, there are 2,385 connections to individual premises with 2,299 being residential and the remainder non-residential or industrial. Map 2 illustrates the broad extent of the existing distribution network.
Some 1.75 km are of 200 mm dia pipe, 12.75 km are of 150 mm dia pipe and 13.75 km are of 100 mm dia pipe. The details are shown in map-1 and Table 4.PVC pipes are generally used as water mains in water supply systems in Bangladesh. However G.I pipes are used for the over and under crossings for both roads and culverts. This practice is adopted in ‘Secondary Towns Water Supply and Sanitation Sector Project’ funded by ADB. Water meters for service connections are not used in most of the pourashavas, but in this Sub-Project complete metering systems are included. The distribution pipe lines are interconnected but arrangements are available for isolating parts of the system if required. Here, occasional adjustments of flow in the distribution main for instance are required in case of low yield of a certain production well.
There are two overhead storage tanks of 50,000 gallons each (225 m3
Operation and maintenance practice is generally poor and reactive. At present there are only 14 water supply staff; 1Water Superintendent; 1 Head of Technical Unit; 1 Bill Collector; 1 Production Well Mechanic and 10 Pump Drivers. There is no system of
) associated with the network. Water is mainly supplied directly into each network at low pressure during the predetermined supply hours. Pipes are generally plastic but metal is used for road crossing or vehicle access routes. The increase in special pipe fittings substantially increases construction cost and a rationalisation review of traditional design methods is proposed under this sub-project. Meters are present at each of the production well locations but not at house connections or storage tanks.
Unaccounted-for water is estimated by the Pourashava at 40%. Leakage is likely to be greater due to poor construction standards or from bad jointing associated with illegal connections.

TA 7231-BAN: City Region Development Project Final Report
September 2010 Chapter 8-9
condition assessment or regular equipment maintenance. Despite the formation of a leakage control team (in 2005), leakage control measures seem absent as do measures for addressing the problem of illegal connections which could account for well over 50% of ‘water loss’ from the system.
The practice of eradicating leakage and maintaining pressure in the large majority of the distribution system at any one time is an effective means of avoiding ingress of contaminated water into the mains at times of low or fluctuating pressures and thus maintaining a potable water quality in the system. The practice is cost effective against the provision of new boreholes to cover the deficiencies in current levels of service and cost effective against the provision of water treatment plant in regard to anticipated improvements in water quality through proposed measures.
Unfortunately detailed maps of the water supply system are not available, nor are maps indicating individual dwellings with service connections and this has restricted the degree of detailed understanding of the distribution system during the course of preparing this Technical Assessment.

TA 7231-BAN: City Region Development Project Final Report
September 2010 Chapter 8-10
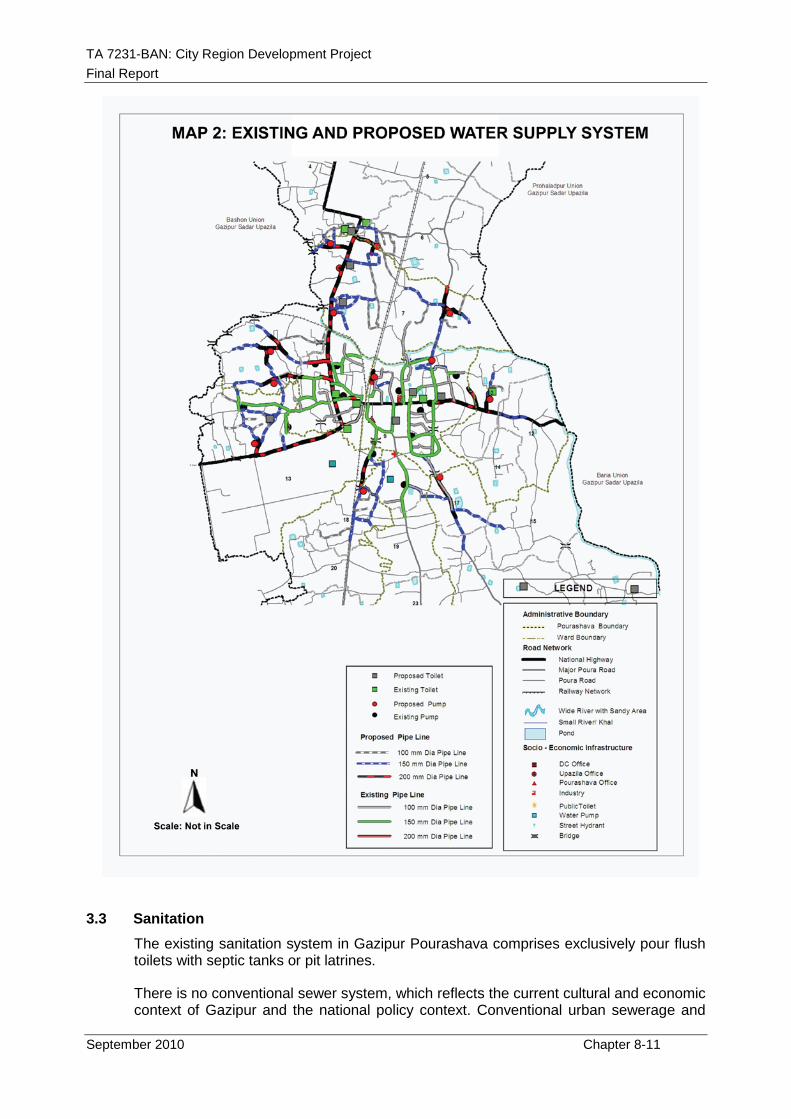
TA 7231-BAN: City Region Development Project Final Report
September 2010 Chapter 8-11
3.3 Sanitation The existing sanitation system in Gazipur Pourashava comprises exclusively pour flush toilets with septic tanks or pit latrines.
There is no conventional sewer system, which reflects the current cultural and economic context of Gazipur and the national policy context. Conventional urban sewerage and

TA 7231-BAN: City Region Development Project Final Report
September 2010 Chapter 8-12
treatment plants would prove to be expensive and very unlikely to achieve the minimum conditions of cost-recovery. They may also prove to be difficult to maintain and require skilled personal, not currently available in the pourashava. This option is not therefore considered in the development of this Sub-Project.
Sanitation is the responsibility of the Health and Sanitation Department of Gazipur Pourashava, but it currently does not have the organization or capacity to carry out its role, with unsatisfactory consequences.
Sanitation Options
The full range of sanitation options in Gazipur includes; (i) Individual Pit Latrines; (ii) Individual Septic Tanks; (iii) Communal Sanitation (eg serving government buildings); and (iv) Public Toilets.
In the context of Gazipur individual Pit Latrines are the most common and simplest form of excreta disposal, which are accepted in rural areas and used in low-income urban communities in Bangladesh. This is reflected by the National Policy context as set out in the National Policy for Safe Water Supply and Sanitation (1998). In a general context the baseline survey of the National Sanitation Campaign in October 2003 found that coverage with sanitary latrines in pourashavas was 53% and in the City Corporations 70%. By June 2005, these figures had increased to about 74% in pourashavas. Official figures give the current number of pit latrines in the Gazipur as 34,912.
To be clear a pit latrine consists of a manually dug or bored hole into the ground, an appropriate seat or squatting slab, and a superstructure erected over it. The pit is simply a hole in the ground into which excreta fall. Urine and other liquids soak into the ground and solid materials are retained and decomposed in the pit. After each use, the latrine is manually pour-flushed through the pan and trap with about 2-3 litres of water. Some of the clean flush water remains in the trap and maintains the water seal, thus providing the barrier against odours and insects. From excreta and flush water around 5-10 litres per day of waste water enter the pit. The pit has to provide sufficient volume for solids storage, as well as sufficient area for the waste water to infiltrate into the soil, which requires that the soil has sufficient long-term infiltrative capacity. Further description on the types of pit latrines is included in Table 4. To ensure the pit latrines are regularly emptied, householders tend to construct outlet pipes, which convey the raw sewage into local drains or open areas, or they pay for private ‘sweepers’ to manually collect and remove the contents. Effectively the result of manual collection is much the same (as the outlet pipes) as there are no designated areas within the pourashava for the sanitary disposal, and again the contents end up in drains or are tipped onto open land.
If pit latrines are not regularly maintained they tend to become fouled and pour flush bowls may block-up. Water seals often break down, garbage is sometimes thrown into the pan block of latrines causing blockages and malfunction, particularly in the case of twin latrines, where the Y junction is vulnerable.
Table 4 Pit Latrine Types Home-made latrines - Simple pit latrines often called home-made as family members can construct them, though not fully sanitary are sometimes used in order to discourage open defection and other unsanitary practices. This latrine consists of a squat hole on a bamboo/wooden platform placed over a pit.

TA 7231-BAN: City Region Development Project Final Report
September 2010 Chapter 8-13
Disadvantages are odour, fly and mosquito nuisance. Single Pit Pour Flush Latrine - A further improvement to the pit latrine can be obtained with a water seal. Water seal is U-pipe filled with water, attached below the squatting pan that completes prevents passage of flies and odour. The water seal is only 15-25 mm deep and latrine can be flushed by hand using 1.5 to 2.00 litres of water. Twin Pit Pour Flush Latrine - A twin pit pour flash latrine comprises of squatting pan, two leach pits and a Y-junction for directing excreta from squatting pan to either of the two leach pits. A siphon is fitted to pan which maintains at least 20 mm water seal to prevent passage of gas and insects from pits into the latrine. The pits are used alternatively and at any given time only one pit is in use. When first pit is full, the flow of excreta is directed to the second pit through Y-junction and contents of the first pit are left to decompose.
It is understood, from information provided by Gazipur Pourashava that the number of unhygienic latrines is around 5,310, such that there are significant health risks. A significant number of households also have no latrine. Typically the reasons for quoted for not having a latrine are that there is no money to build one and/or no space to build one. The National Sanitation Campaign Survey suggests that up to 80% of those not having a pit latrine cannot afford to provide one.
In conclusion, it is considered that pour flush latrines may be used by low cost urban communities provided they are: (i) appropriately designed for flushing and the water seal is maintained; (ii) they are properly maintained and emptied; and (iii) there is properly planned provision for septage disposal and management. Single pit latrines may be appropriate in urban areas if they can be de-sludged mechanically by a vacuum tanker, since their contents are not pathogen free. Twin-pits can be used if the pits are to be de-sludged manually as the resting period ensures that contents to be removed are substantially free of excreted pathogens.
Septic Tanks are widely used within the urban areas of central Gazipur and the surrounding area, although the exact number is not known. They are built and paid for by individual householders.
Though currently the ‘best’ means of sanitation available, the use of septic tanks may not be the most appropriate solution for all parts of Gazipur. They are generally more costly than pit latrines and require more on-site space and more space for de-sludging and general maintenance. To this extent they are more difficult to use in high density informal housing areas, where pit latrines and/or communal facilities will be more appropriate.
Septic tanks have had problems in that traditional designs provide systems that are considered too small and ill-designed to effectively retain solids. Equally, ‘soakaways’ comprise a 1m diameter underground chamber which is similarly too small to achieve adequate percolation if serving large families. Percolation into the ground also pollutes the local groundwater abstracted for domestic use from shallow wells. To this extent it is essential that septic tank provision in Gazipur (and elsewhere) meets the requirements of the buildings they will serve and to this extent improved advice and information to households and others is essential.
De-sludging of the septic tanks is also a particular problem, where over time they fill up and eventually overflow or block drains, again resulting in unhygienic conditions and health risks. Normally de-sludging is required at least once a year. Septic tank maintenance also requires a de-sludging service, by tankers, which may not always be available. Often the septic tanks are found in locations, which are not readily accessible to the de-sludging vehicles and/or residents are reluctant to pay the de-sludging charge.

TA 7231-BAN: City Region Development Project Final Report
September 2010 Chapter 8-14
As for pit latrines the sustainability of septic tanks is also dependent on the availability of a septage disposal area.
Communal Facilities are usually provided to serve major public and private facilities (eg government buildings) and generally to serve multi-storey buildings. They may also be provided in situations where individual sanitation systems are not possible, and may consist of either toilet facilities or be combined with shower and laundry facilities.
3.4 Fringe Areas and Informal Housing (Water Supply and Sanitation) The fringe area covers about two thirds of the area (32 sq km) of Gazipur Pourashava. The current population is estimated to be about 75,000.00 persons. In general water supply is provided to the fringe area by street hydrants where a water pipe line is available and in absence of pipeline, by the installation of well points. Many of the fringe areas are home to pockets of informal housing inhabited by the urban poor. DPHE is primarily responsible for distribution of sanitary latrines (pit and pour flush) to the informal housing areas and the pourashava and NGOs facilitate the formation of user groups.
In 2005 a survey was carried out by Gazipur Pourashava to identify very poor people and they identified fifty eight places and 2,387 families. Field survey was carried out to examine the economic condition of the 1,810 families out of 2,387 families. As a result some 900 families are included in the UGIIP (Urban Governance Infrastructure Improvement Project). This part of the UGIIP project is being implemented in three phases (300 families in each phase) and implementation period is 2006-2010. It includes the installation of 33 hand production wells, 179 twin pit pour flush latrines, 1,800 meter footpaths and 1,345 meter drainage. The twin pit latrines are provided with shelter. The design of these pit latrines is attached in Appendix C. The cost is about tk.16,000 (USD 230) and beneficiaries contribute 10% of the total construction cost. Each latrine is provided for five families (Source of information: Bashti Development officer, Gazipur Pourashava ).
Water supply & sanitation is also provided in the informal housing areas, through the Secondary Towns Water Supply and Sanitation Sector Project funded by ADB Loan - 2265 BAN (SF). However the above project does not cover GazipurPourshava. Within the CRDP context through this sub-project some 2,000pit pour flush latrines are included for the informal housing areas. Slab and concrete rings will be supplied, but the super-structure will be built by the beneficiaries, thus reducing the costs to the beneficiaries. The Pourashava or NGO will facilitate for formation of user groups for the operation & maintenance of the pit latrines.
3.5 Strategic Planning – Regional Context This Sub-Project is a direct response to the urgent need for better delivery of WSS services in the short-term and the objectives and proposals for both the water supply and sanitation Components reflect this.
However the consultant team are very aware of the need for a more sustainable and cost-effective approach to WSS service delivery that crosses local government boundaries and reflects interlinked nature of the urban areas that make up the Dhaka City Region (and other City Regions).
Urban water supply and sanitation services in the Pourashava, and in Bangladesh, are carried out by a number of overlapping authorities. In respect to Gazipur, the DPHE mainly implements new water supply systems which, on completion, are then handed

TA 7231-BAN: City Region Development Project Final Report
September 2010 Chapter 8-15
over to the LGUs for operation and maintenance. The Pourashava Water Supply Section (PWSS), under the Engineering Department of the Pourashavas is responsible for running the water supply systems in Gazipur. It is assisted by the DPHE whose regional office is also in the Pourashava.
It is evident from numerous reviews and from the study supporting this Project Component, that the existing organisational and administrative structure including the overly established system of ‘top down’ project delivery has suppressed the development of the WSS sector in a number of critical respects. Numerous large and generally unaccountable committees, at every level, stifle the decision-making processes and inhibit strategic thinking, co-ordinated planning and crucial development as well as delaying projects and escalating costs.
Reforms in the urban and rural water and sanitation sectors are long overdue and the general belief of all observers is that the slow, uncoordinated and wasteful approach to WSS will remain until sector reform is enacted. In this regard there is a need identified by the consultant team’s research to consider merging the various administrations currently providing water and sanitation infrastructure services into a fully coordinated body that has the ability to strategically plan and prioritise the Regions water resources, water supply and sewerage provisions.
Reforms outlined in the Sector Development Programme Report of 2005 remain applicable to the current situation which has not altered since the report was first published, with the notable exception that the institutional proposals require updating and greater involvement needs to be made of the private sector to facilitate and speed up provision of WSS services.
In this regard, administrative and legislative reforms are the key to any improvement. An in-depth evaluation of the Administrations ability to instigate the necessary reforms would be worthwhile. Two positions would need to be assessed; one of allowing and encouraging strategic private sector involvement and the other of reforming current Institutions into a viable water sector delivery and management service. The conclusions would effectively characterise the speed and direction in which the water supply sector will likely proceed in the short and medium term future. At the very least services should be provided on a higher regional or district basis to realise better levels of strategy planning, access to a greater resource base and achieving economies of scale.
4. Project Vision and Objectives
This Sub-Project centres on providing a sustainable framework in which WSS improvements may be delivered more effectively by incorporating and optimising existing systems, not normally considered in current development planning.
At the same time, the Sub-Project seeks to mitigate as far as practicable, the current depletion of groundwater resources by substantially reducing wastage in water delivery and use. Here it is an aim for water to be produced and delivered more effectively and to improve energy efficiency and reduce power consumption.
The proposals set out in this Sub-Project are intended to promote a collaborative framework where water is provided, managed, maintained and used efficiently by planners, managers, operators and consumers. The bottom-up methodology of empowering the community in the design, maintain and supervise of the systems is recommended to maintain the assets and prevent misuse of the service.

TA 7231-BAN: City Region Development Project Final Report
September 2010 Chapter 8-16
The specific Objectives of this Sub-Project are to:
Rehabilitate the existing water supply sources, including the production (tube) wells and the distribution system in the core area of Gazipur;
Expand the sources of water supply, including new production (tube) wells in the core and fringe areas of Gazipur;
Increase the per capita consumption of the population from its current low level;
Increase the coverage of safe water supply services and to reduce the incident of water borne diseases by providing piped water supply;
Improve the institutional structures of the Pourashava and the way water sector improvements are planned and delivered;
Improve the sanitation services in the Pourashava and improve health and sanitary conditions;
Improve the financial standing of WSS services by the introduction of modern accounting, billing and revenue collection procedures thereby achieving full cost recovery.
5. The Proposal – Description
Due to the many unknowns that currently exist in regard to the existing water supply and sanitation systems in Gazipur, a number of preparatory studies are required before the extent of improvement works may be more accurately defined as a context for detailed design. In view of the uncertainties, allowances have been included in the Sub-Project costs for construction or refurbishment works, which may require amendment in line with the study findings.
In view of the need for preparatory studies, it is proposed that the Sub-project will be carried out in two phases. Phase 1 will be concentrated on Preparatory Studies to provide better definition of the activities and the capital investment works to be designed and implemented under Phase 2, the Implementation Phase.
6. Component 1 - Water Supply
The Water Supply Component in the Core Area will include the following activities, the main features of which are described below.
6.1 Phase 1 - Preparatory Studies Baseline Map
Development of Baseline Map using GIS applications for the Gazipur core area to at least: (i) define in detail, the boundary between the core and fringe areas; and (ii) identify and depict roads in an appropriate scale for locating and depicting production wells, pipelines, valves, valve chambers, washouts, meters, household connections etc.
Household and Population Estimates

TA 7231-BAN: City Region Development Project Final Report
September 2010 Chapter 8-17
A survey of population numbers in the core and fringe areas. Survey as necessary to estimate future growth or demand areas and to target new supply. A base map indicating population densities is to be prepared.
Condition and Operability Survey This activity is to include the preparation of an asset identification and condition survey to identify, locate and establish the condition of all mechanical and electrical equipment plus pipes and fittings. The survey should aim to should result in a clear identification of where replacement or refurbishment is required. It should also identify major leaks and illegal connections in the distribution system.
Hydrogeological Assessment A hydrogeological study represents best design practice and is required to provide greater precision in regard to existing and future requirements. The study should aim to:
(i) Map the underlying aquifer and accurately define, as far as practicable, aquifer depths throughout the Pourashava;
(ii) Avoid the need for individual test wells at each new production (tube) well site;
(iii) Collect details on existing tube well construction and depths;
(iv) Assess the reliable yield of the existing production wells ;
(v) Assess whether redevelopment of the existing well would yield benefits;
(vi) Determine the individual size/yield availability from of new production wells ;
(vii) Locate the new production wells as currently proposed for Phase 2;
(viii) Provide detailed assessment of potential yield from deeper aquifers.
The Assessment should include the drilling of test wells for the exploration of yield from deeper aquifers.
Managed Aquifer Recharge (MAR) Due to the declining groundwater levels and its impending scarcity, it is proposed that a desk study is carried out into the feasibility of Aquifer Recharge in the pourashava. This should include use of a groundwater simulation model.
The study would seek to assess the several factors that influence the MAR potential of the pourashava. Climatic conditions and the catchment characteristics are considered to be the most important.
The physical effectiveness of MAR interventions would need to be assessed for both Urban and Rural areas in terms of:
(i) What is the availability of water for recharge
(ii) How much water was actually recharged by the structures in comparison to natural recharge
(iii) The factors that influence how much water can be recharged through collection structures
(iv) The way groundwater recharged by the structures is distributed in the local aquifer
(v) What impacts does managed recharge have on the quality of groundwater; and

TA 7231-BAN: City Region Development Project Final Report
September 2010 Chapter 8-18
(vi) How much affect will MAR have on groundwater levels in the pourashava.
Study on Water Supply Options. The Study should be concentrated of a technical assessment with costs, of obtaining water by the alternative means of abstraction, including rain water harvesting from the nearest practical surface water source. The study should assess source water availability throughout the year, and address treatment and bulk water transfer requirements. Suitable locations should be identified for abstraction point(s) in addition to treatment plant.
Assessment should be made of trans-boundary issues and co-operation potential between pourashavas of unitary or inter Regional scheme as appropriate (section 3. 5 refers).
The outputs of this Study should be realistic taking full account of the on-ground situation of Gazipur and related parts of the Dhaka City Region (and beyond if appropriate). The outputs of the Study should confirm the feasibility of other water supply options and the potential nature, scale and location of any such resources. The Study should be concise and pragmatic, concentrating on real opportunities and to this extent it should rule out other resources, which are likely to be impractical as early as possible, utilisation of river water for instance.
Water Quality Water quality monitoring will be carried out under the project to assess the microbiological quality of the groundwater and to determine levels of iron and arsenic amongst other parameters.
Network Analysis Hydraulic simulation software is in widespread use within the water industry for strategic supply analysis, design of control strategies and network extensions and maintenance planning.
Network analysis represents best practice approach of analysing the operational characteristics of the existing supply networks and determining the optimum means by which interlinking of the current networks may be achieved. The study will be used also to design and map new supply areas.
The approach represents a shift to a more proactive management and design strategy that aims to optimise the use of existing assets.
Analysis to initially identify best means of interconnecting existing network to allow interconnection works to be carried out. Actual best means of proving new extension works to be identified and costed. In addition, network analysis would also identify:
(i) The best and most efficient means of extending the network within current service areas to serve those without a piped supply;
(ii) The best and most efficient means of extending the distribution network to outlying areas using the existing production wells ;
(iii) Additional resource requirements to serve outlying areas in addition to the existing production wells , and
(iv) Effective enhancements in network design to improve operational management of the system.

TA 7231-BAN: City Region Development Project Final Report
September 2010 Chapter 8-19
It is also envisaged that the network models will assist in leakage management and control, specifically in allowing the design of distribution networks in discrete systems, termed District Metered Areas (DMAs). The modelling will also be used in the location of substantial leaks during model calibration exercises. The technique requires the installation of flow meters at strategic points throughout the distribution system, each recording flows to a discrete district that has a defined and permanent boundary - the DMA.
Review of Existing Water Supply Facilities in Fringe Areas A brief study to review the system of water supply provision in Fringe Areas, through which to identify gaps in provision or other problem issues. The study should also review the suitability of current delivery and maintenance provision and, where appropriate, advise on means of improvement.
The study is to be used to efficiently and effectively target the resources available under this Sub-Project.
Review of Water Requirements for Industry
The preparatory studies will also include a preliminary study on water supply for industry, and including: (i) identification of the nature, scale and location of industrial water supply demands; (ii) techniques to access water and affects on groundwater supplies and environmental issues generally; (iii) approaches to ensuring sustainable water supplies for industry.
Reporting Reports are to be prepared on all the Phase 1 studies carried out. A final report is to be prepared summarising findings and compliance with performance criteria for proceeding to Phase 2. Cost estimates, where applicable are to be included.
The final report illustrating the results of Phase 1 should also to include assessments in the following areas
(i) Environmental Impact Issues; (ii) Social Development and Inclusion, including the Urban Poor; (iii) Gender Issues; and (iv) Involuntary Resettlement Issues (where appropriate)
Contracts are to be prepared for Phase 2 construction work and tendering procedures enacted. Tender Assessment Reports to be prepared for submission to the supervisory Project Management Unit (PMU).
6.2 Phase 2 – Implementation Works Rehabilitation of Existing Production (tube) Wells
The yield of the existing production wells has declined since construction with one now having been taken out of service. The reduction in yield may be due to the decline in groundwater levels but there are other factors that may be affecting production.
Production wells used for water supply require periodic rehabilitation to improve their performance. The proposed rehabilitation de-silts the production well, opens up the pores of the screen and re-establishes the parameters of the tube well.
It is envisaged that this part of Component 1 will be aimed at the target of achieving production well operation over 24 hours per day in an effort to double

TA 7231-BAN: City Region Development Project Final Report
September 2010 Chapter 8-20
the current daily water yield. The Sub-Project should therefore comprise the following principal parts:
(i) Collection of information on the borehole design; (ii) Inspection by closed-circuit television (CCTV); (iii) Breaking-up of clogging deposits; (iv) Removal of silt and debris by surging and airlift clearance pumping; (v) Borehole disinfection; and (vi) Step-drawdown test
Actual requirements are to be based on findings of the preparatory hydrogeological study, but are expected to cover the eight production wells, which are still active.
Refurbishment of Existing Water Supply Network The water supply network in Gazipur Pourashava consists of 28 km of mainly PVC pipelines of 100 to 200 mm diameter. Experience in other pourashavas suggests the network suffers from significant leakage rates due to badly constructed joints and illegal connections. In addition, the accumulation of sand from pumping sandy water is a problem in some areas.
Based on the Condition and Operability Survey it is proposed to refurbish parts of the network where leakage or breakages have been identified. Activities include:
(i) Removing and replacing broken or leaking pipes; (ii) Installing washout valves; (iii) Flushing of pipes to remove sand (iv) Replacing illegal connection with new metered service connections.
The work will be carried out to the existing distribution systems and located in the area shown in figure 1. The actual length of pipe to be refurbished will depend on findings of the Condition and Operability Survey, network modelling calibration and leakage detection findings. For costing purposes, it is assumed that it will only be necessary to replace the oldest part of the distribution network, amounting to some 5kms out of the total of 28kms. Installation of new meters will be carried out under a budget allocation for new meters connections.
Interconnection of Existing Networks The Central Gazipur area is served by eight small scale, individual distribution networks each supplied by the eight operational production wells. One system is currently inoperative. A system of interconnection will be designed as part of the network analysis carried out in Phase 1. The general area of the proposed interconnections is shown in Map 2.
It is envisaged that significant operational efficiencies may be realised by the interlinking of the networks especially in regard to proposed network extensions and the provision a continuous 24 hrs supply.
Extension of Distribution Network Expansion of transmission, distribution pipelines and water storage of is required in conjunction with the construction of new production wells to increase the supply area.

TA 7231-BAN: City Region Development Project Final Report
September 2010 Chapter 8-21
New supply areas will be subject to finalisation during Phase 1 and take account of the findings of population surveys in order to best target those areas benefiting from a piped water supply and offering a greater economic rate of return regarding cost recovery. Areas designated by Gazipur Pourashava for proposed network extensions are again shown on Map 2. Estimates of length are given in Table 4 (below).
Table 4: Proposed Pipeline Network Extensions
Pipe Diameter Existing pipeline
(km) Proposed Extension Length
(km) 200 mm 1.75 20 150 mm 12.75 15 100 mm 13.75 15
Total 28.25 50
Installation of water meters at consumer premises and production wells are proposed as a part of this Sub-Project Component. Allowance has been made for the installation of 1,000 new meters with valved service connections for isolation of the property, if or when required.
Water quality testing is also included in Component 1 to monitor the quality of water at the point of consumption following completion of the extensions.
It is aimed to increase a piped supply from 34% to over 65% of the Gazipur population taking those served to an estimated 200,000 from the 100,000 currently served within the core area.
Development of New Production (Tube) Wells The development of new production wells will be minimised, taking into account the results of the proposed studies of the potential MAR interventions and other water supply options.
In a worse case scenario, where the preparatory studies show that other water supply interventions such as MAR are not practical then there is a requirement for the drilling of 12 new production wells to provide additional water corresponding with the expansion of the water supply network. It is envisaged that a minimum of 8 new production wells will be drilled under Component 1. The drilling of a further 4 production wells has been allocated under this Component to replace existing production wells, if they are found to be economically unproductive based on the findings of hydrological survey carried out in Phase 1.
The allocation of 8 new production wells is based on supplying 25,000 m3/d of water to an estimated total of 200,000 consumers at a per capita consumption of 100 l/d and with a leakage rate of 25%, which is the rate used in the ADB funded Secondary Towns Water Supply and Sanitation Project, at Narsingdi for instance. The calculation also assumes the realisation of approximately 2,000 m3/d from each new well and a total of 9,000 m3
/d from the existing wells and the four contingency wells combined. Improved yields from the existing production wells from redevelopment would reduce the number of new production wells required. The actual requirements will be established under Phase 1, although the current proposed locations for the new production wells is shown in Map 2.

TA 7231-BAN: City Region Development Project Final Report
September 2010 Chapter 8-22
Water Provision in Informal Housing Areas The Sub-Project will provide new production wells, hand pumps and drainage facilities in areas where gaps in provision have been identified under the Preparatory Studies, including informal housing areas and in rural development clusters.
The Sub-Project also aims to refurbish and replace, if necessary, existing production wells or other supply works as identified as being beneficial to the community under the Preparatory Studies. This may be considered as differing from current GoB, but nevertheless beneficial should the need be identified. It is envisaged that this activity will involve close liaison with NGOs and CBOs.
Rainwater Harvesting – Pilot Building/Area
In line with national policy this Component will also include rainwater harvesting for a government building/hard surfaced area, which will be established as a pilot project in the pourashava.
Should it prove to be successful it is proposed to extend the concept to other municipal buildings in Gazipur Pourashava within the life cycle of the CRDP Project Loan. In this situation would also be proposed to liaise and coordinate with the private sector to encourage similar investment in rain water harvesting.
7. Component 2 - Sanitation
The Sanitation Component will include the following activities.
7.1 Phase 1- Preparatory Studies The primary task in Phase 1 will be to prepare an Action Plan for Integrated Sanitation System Development and Management in Gazipur. The Action Plan should include the following main parts:
(i) Review of the Design of Sanitation Facilities (technological options), particularly pit latrines and septic tanks (including communal tanks) options in the Gazipur context and making recommendations on the nature, scale and location of facilities in the context of this review, through an integrated plan. This review should include recommendations on new standard septic tank and pit latrine design standards;
(ii) Design of an Operation and Management Plan to secure sustainable sanitation in Gazipur Pourashava, including the de-sludging and general management of pit latrines, septic tanks and communal tanks;
(iii) Providing additional Advisory Services, through Gazipur Pourashava and an associated Environmental Awareness Campaign for the communities affected by the Sub-Project, including a Design and Operation Management Users Manual and other educational related material as appropriate;
(iv) Defining opportunities for sustainable practices in Sludge Disposal, including after-use potential and allocating a sludge disposal area as appropriate;
(v) Defining Equipment Requirements for de-sludging and general management of pit latrines, septic tanks and communal sanitation facilities;

TA 7231-BAN: City Region Development Project Final Report
September 2010 Chapter 8-23
(vi) Prepare an Asset Identification and Condition Survey to determine the extent and condition of public and community toilets and sanitary facilities, including: (i) schools and other education institutions; (ii) public toilets; and (iii) other sanitary facilities owned and/or managed by the pourashava. The survey should identify the current condition of the sanitary facilities, determine where replacement or refurbishment is required and specify sustainable sanitation provision in the form of communal facilities and operations and maintenance programmes;
(vii) Specify opportunities and formats for Private Sector Participation in the sanitation process, the provision of sanitation equipment and facilities and in operation and maintenance of septic tanks and pit latrines and in septage collection, disposal and re-use, although initially it is anticipated this will be carried out by the pourashava;
(viii) Specify capacity building and training requirements to support the private sector, NGOs and CBOs in the implementation of the Action Plan; and
(ix) Develop and establish a comprehensive monitoring and evaluation system to support implementation of the Action Plan.
7.2 Phase 2 – Implementation Works The Action Plan will specify and cost the activities and capital investment for implementation in Phase 2 and will include:
Sanitation – Core Area and Fringe Areas It is noted that other funding initiatives will make provision for the supply of new pit latrines in Gazipur Pourashava. It is not therefore intended to include an allocation for the provision of household pit latrines (or septic tanks) in the Sub-Project in advance of the Action Plan.
However Phase 1 will review planned and committed levels of provision of sanitation services in the Core Area and the Fringe Areas of Gazipur and the Action Plan will specify and cost any supplementary provision of latrines and septic tanks for consideration with the context of the Sub-Project.
Community Facilities There are a number of Government Educational and Health Facilities in the pourashava where the consultant team were advised as having very unhygienic facilities, including a lack of water supply. The situation will be reviewed in more detail in the Action Plan and facilities upgraded to ensure safe hygienic facilities for both genders.
Public toilets are very limited in the core area and this Component allows for the construction of 10 new Public Toilets and wash facilities. Facilities are to be provided with piped water supply and drainage system with suitably designed soakaways. It is envisaged public toilets will be located in easily accessible public areas within the core area (Map 2 refers). The prospect of employing a public attendant, to be paid out of a small entry fee, will be assessed to help ensure that the facilities are maintained in good order.
Contrary to current practice, facilities identified under the Condition and Operability Survey will be considered for repair and refurbishment, where it is shown to be financially advantageous. In this regard and in dialogue with representatives of the pourashava consideration will be given to the refurbishment of the 10 existing public toilet facilities to bring them up to the standard of the proposed new facilities.

TA 7231-BAN: City Region Development Project Final Report
September 2010 Chapter 8-24
Operation and Maintenance - Domestic Sanitation Facilities In accordance with recommendations to be contained in the Action Plan, this Component will include introduce a septic tank and public latrine maintenance system in the core area and where there are other significant urban clusters.
In particular regular De-sludging will be introduced for pit latrines and septic tanks across the pourashava, particularly in the Core Area. A De-sludging Site will be developed, which is proposed to be on 2 acres of land at the existing solid waste disposal area. These activities are included in the Sub-Project Cost estimates below.
8. The Sub-Project Costs
The estimated costs for this Sub-Project (Excluding Detail Design, Study and Capacity Building) are in the order of USD 4.46 million, as shown in Table 5 below.
Table 5: Sub-Project Costs – Capital Investment
Table 1: Sub-Project Cost Estimates
Project Activity Cost (USD) million
1 Refurbishment,Rehabilitation and Replacement of production wells, tank and pipelines 255,072
2 New Test wells, Tubewells, Pumphouses, Pipelines and House Connections 3,215,942
3 Sanitation 365,942 4 Office equipment, furniture, transport and software 123,188 5 Contingency 504,550 Total Cost 4,464,695

TA 7231-BAN: City Region Development Project Final Report
September 2010 Chapter 8-25
9. Benefits
The primary benefit of the Sub-Project is to improve the living conditions and health standards in Gazipur Pourashava by providing more sustainable access to clean water and better sanitation facilities.
The following benefits will accrue from the implementation of the proposed improvements to WSS service provision in Gazipur Pourashava : (i) Improved health benefits through improvements in quantity, quality and
coverage of piped water supply services. The target of piped water supply coverage is 70% of the population of the core area that is about 140,000 of the total of 200,000 (present coverage is around 62,000 persons or 31%).
(ii) Improved health and conservation benefits through improvements in sanitation provision. The preliminary target coverage of the proposed Sanitation system, pending the results of the Sanitation Action Plan will be 95% for the whole of Gazipur Pourashava;
(iii) Improved water conservation through leakage control and water use awareness;
(iv) Reduction in groundwater pollution and the pollution of watercourses;
(v) Improvement in Institutional Capacity of Gazipur Pourashava (and DPHE/LGED) in the effective management and operation of WSS services;
(vi) Minimum of full cost recovery for WSS service provision in Gazipur Pourashava;
(vii) Enhanced opportunities for private sector participation in the provision, operation and maintenance of WSS service provision; and
(viii) Increased community awareness of the importance of sustainable practices in the use of water and the need for better provision, operation and maintenance of sanitation facilities.
10. Scope for Replication
The Sub-Project has good potential for replication, especially with regard to the inclusion and optimisation of existing water supply assets and their integration in the expansion of service levels. Current supply planning takes little or no account of existing assets. Historically, there has been a strong tendency for provision of new facilities in any new WSS project with existing assets effectively written off.
There is considerable scope throughout Bangladesh to review all existing water supply systems, including recent provisions, to ensure that the water supply and sanitation systems are being used to their full effect. Account needs to be taken of these assets in regard to the least cost means of increasing per capita provision, reducing leakage and illegal connections, increasing operational efficiencies and reducing costs. Full cost recovery should be the minimum to be achieved. Here the scope for replication in a wider context of more optimal regional, sub-regional planning and institutional development should be explored as a financial catalyst for attracting private sector investment and participation in the WSS sector (section 3.5 refers).
In the shorter-term, opportunities for replication of both Components 1 and 2 of the Sub-Project as part of the Project Loan will be explored and naturally will reflect areas not currently covered by DWASA and KWASA or by existing projects, such as the ADB’s Secondary Towns Water Supply and Sanitation Project.

TA 7231-BAN: City Region Development Project Final Report
September 2010 Chapter 8-26
Specifically regarding water supply there are a number of pourashavas in the Dhaka City Region, where it is intended to implement water supply improvement schemes, Tongi and Savar for instance. Should any of these schemes not go ahead and/or be financed then further consideration can be given to their inclusion in CRDP, along with other pourashavas, which have yet to be included in a water supply improvement programme, Ashulia for instance. The situation is similar in the Khulna City Region, where it is appropriate to consider the inclusion of those pourashavas and urban growth centres not currently part of the GoB water supply programme or a donor agency funded project. Here Noapara Pourashava can be considered.
Regarding investment in improved sanitation the same process of selection can be applied to ensure no duplication of investment with GoB or other donor agencies. For sanitation, it is understood the level of existing investment is significantly less compared to water supply, such that the replication potential may cover an extensive range of pourashavas in the urban areas of both City Regions.
11. Economic Assessment
11.1 Methodology and Assumptions Economic analysis has been conducted in accordance with the ADB’s Guidelines for the Economic Analysis of Projects (1997) and the Framework for the Economic and Financial Appraisal of Urban Development Sector Projects (January 1994). The following approach and assumptions have been used in the analysis: All prices are expressed in 2010 prices and economic analysis is conducted at 2010
constant price;
An average exchange rate of Taka 69 per US$1.00 is employed when converting foreign exchange costs to local currency equivalent;
Economic prices of capital works and annual operation and maintenance are calculated from the financial cost estimates of the technical team, adjusted to allow for transfer payments and to correct for any other market distortions;
Price contingencies and interest during construction (as a result of any debt financing) are excluded in the calculation of economic internal rate of return (EIRR) but physical contingencies are included because they represent real consumption of resources;
Taxes and duties are excluded because they represent transfer payments;
All costs are valued using the domestic price numeraire; tradable inputs, net of duties and taxes, are adjusted by the shadow exchange rate factor of 1.13 while non-tradable inputs (except for unskilled labor), net of taxes and duties, are adjusted by a conversion factor of 0.9; unskilled labor is adjusted by a conversion factor of 0.7 of the market wage rate to estimate the shadow wage rate;1
The economic opportunity cost of capital (EOCC) is assumed at 12% in real terms; and
1 Conversion factors for economic shadow pricing are based on recently approved ADB projects in Bangladesh.

TA 7231-BAN: City Region Development Project Final Report
September 2010 Chapter 8-27
Project component is assumed to have useful economic life of 25 years; equipment portion of the component is assumed to have useful economic life of 7 years.
11.2 Economic Benefits The project component will improve the water supply service to those already served by a piped distribution as well as extend the network to a greater number of the population. At the same time, the project component will mitigate the current depletion of groundwater resources by reducing the amount of water being wasted. The principal benefits that would be derived include improved accessibility, convenience and reliability of water supply, as well as increased quantities of water and improved water quality. Health benefits will result from the provision of safe water and improved household sanitation conditions that reduce the incidence of diarrhoea, dysentery and other water-borne illness. The benefits of the project component therefore have been quantified in terms of: Resource cost savings associated with the replacement of non-incremental water
consumed previously obtained from non-piped alternative sources with those from the piped water supply system, valued in terms of the average supply price from existing non-piped water sources estimated at about Taka 20/m3;
Consumer satisfaction, reflected in the incremental water consumed, valued in terms of the average demand price of water (i.e. the average of existing non-piped water supply price of Taka 20/m3 and piped water supply tariff of Taka 10/m3 [refer to section on Financial Assessment]); per capita water consumption is expected to increase from an average of 43 lpcd to 100 lpcd due primarily to (i) the reduced cost of acquiring water, (ii) improved water quality, and (iii) greater convenience and reliability of the piped water supply system;
Incremental water consumed but not billed (non-technical losses), valued in terms of the average demand price of water; non-revenue water (NRW) is expected to decrease from 43% to 25% (20% non-technical and 5% technical) due to metering of all consumers, and the rehabilitation and improvement of the distribution system;
Consumers’ contribution in the form of new connection fee (refer to section on Financial Assessment).
Health benefits, likely to occur provided that the adverse health impacts of an increased volume of wastewater can be minimized, have not been quantified and included in the analysis due to lack of reliable data.
11.3 Economic Analysis and Sustainability The purpose of the economic analysis is to determine if the component’s EIRR exceeds its EOCC, in real terms. If the component’s EIRR exceeds its EOCC, it can be concluded that the component is economically viable. Sensitivity analyses have been undertaken in order to test the robustness of the economic results to adverse changes in conditions. The following adverse changes have been analyzed: A capital cost overrun of 10%;
An increase in the O&M cost by 10%;
A reduction in the benefits by 10%; and
Project component benefits delayed by one year. The results of the economic and sensitivity analysis are shown below.
EIRR and Sensitivity Analyses

TA 7231-BAN: City Region Development Project Final Report
September 2010 Chapter 8-28
Scenario NPV EIRR (%) / 1
(‘000 Taka) SI SV / 2 % Change
/ 3
Base Case 56,316 14.94% 10% Increase in Capital Costs 29,200 13.42% 5.18 19% 10% 10% Increase in O&M Costs 53,080 14.78% 0.55 181% 10% 10% Decrease in Benefits 20,332 13.09% 6.29 16% 10% Project Benefits Delayed by One Year 15,352 12.73% 1/ NPV = Net Present Value discounted at EOCC 2/ SI = Sensitivity Indicator (ratio of % change in EIRR above the cut-off rate of EOCC to % change in a variable) 3/ SV = Switching Value (% change in a variable to reduce the EIRR to the cut-off rate of EOCC) Source: Consultant’s calculation
Based on the results above, it can be concluded that the proposed component is economically viable under the base case scenario and also under adverse changes in conditions. The sensitivity analysis indicates that the proposed component is most sensitive to delay in project benefits and reduction in benefits, but remains well above the EOCC. The economic sustainability of the proposed component largely depends on the implementing agency’s capability to operate and maintain the infrastructure facilities sustainably. Unless the infrastructure facilities can be operated and maintained sustainably, the economic benefits assumed in the analysis will not materialize. The projected income statement and cash flow statement (see section on Financial Assessment) of the project component in the long term show that adequate funds will be available to operate and maintain the infrastructure facilities sustainably.
12. Financial Assessment
12.1 Methodology and Assumptions Financial analysis has been undertaken in accordance with the ADB's Framework for the Economic and Financial Appraisal of Urban Development Sector Projects (January 1994) and the Guidelines on the Financial Governance and Management of Investment Projects Financed by the ADB (January 2002). The following approach and assumptions have been used in the analysis: All prices are expressed in 2010 prices and calculation of financial internal rate of return
(FIRR) is conducted at 2010 constant price;
An average exchange rate of Taka 69 per US$1.00 is employed when converting foreign exchange costs to local currency equivalent;
Financial prices of capital works and annual operation and maintenance are based on the financial cost estimates of the technical team;
Price contingencies and interest during construction (as a result of any debt financing) are excluded in the calculation of FIRR but physical contingencies are included because they represent real consumption of resources;

TA 7231-BAN: City Region Development Project Final Report
September 2010 Chapter 8-29
Project component is assumed to be financed by 50% grant and 50% subsidiary loan in local currency from the central government to the implementing agency; subsidiary loan is assumed to have a repayment period of 25 years, inclusive of a 3 year grace period, at an interest rate of 5% per annum;
The financial opportunity cost of capital (FOCC) of the grant is assumed at 10% per annum2
Local inflation factor is assumed at 6.5% in 2010 and 6% thereafter
; 3
Financial projections of income statement and cash flow statement are done and presented on current price basis applying the assumed inflation factors.
; foreign inflation factor is assumed at 1.5% in 2010, 0.7% in 2011 and 0.5% thereafter
12.2 Tariff and Affordability All customers are currently not metered. Existing water tariffs are monthly flat rates depending on the diameter size of piped connections. Below are the existing water tariffs and connection fees by customer category which took effect on July 2008.
Existing Water Tariffs and Connection Fees
Diameter size
Monthly Flat Fee
Connection Fee Domestic Non-
Domestic Domestic Non-
Domestic ½inch 140 280 1,000 2,000 ¾ inch 200 350 1,500 3,000 1 inch 500 700 2,000 4,000 1.5 inch 1,000 1,500 4,000 8,000.
Source: Pourashava Water Supply
The project component will install meters to all new water connections as well as the old ones. It is proposed that with the installation of water meters, the water tariffs will become volumetric. In calculating the proposed water tariffs, the following financial objectives have been considered: i) fully recover the operation and maintenance (O&M) costs; ii) recover the debt service; iii) maintain a debt service ratio of at least 1.2; and iv) recover annual depreciation expense to accumulate enough funds for future fixed asset replacement. To meet the financial objectives, the proposed water tariffs are calculated to be Taka 10/m3 for domestic and Taka 14/m3 for non-domestic. An affordability analysis has been undertaken to ensure that domestic consumers, particularly those in the low-income group, can afford the proposed water tariffs that meet the financial objectives. Based on generally accepted principle that the expenditure on water should not exceed 5% of household income, the proposed water tariffs are considered affordable as shown below.
Water Tariff Affordability Test
2Approximated by interest rate of 10-year national government bond. 3 ADB estimated inflation factors for Bangladesh.

TA 7231-BAN: City Region Development Project Final Report
September 2010 Chapter 8-30
Item Average HH
Low Income
Average Consumption (lpcd) 100 100 Average Household Size (person) 5 5 Average Monthly Household Consumption (m3) 15 15 Monthly Charge for Water (Taka), 2010 Real Price 150 150 Average Monthly Household Income (Taka) 15,000 1 8,000 % of Monthly Household Income Spent on Water 1.0% 1.9% 1/ Monthly household incomes are based on results from the household survey Source: Consultant’s calculation
The connection fees for new customers are assumed to remain the same to be affordable and encourage residents with no existing piped water connections to connect as soon as the project component is completed. Costs of water connections are fully recovered partly through a one-time connection fee and partly through water tariffs. Water tariffs have been calculated to recover capital costs, which include the costs of water connections.
12.3 Financial Analysis and Sustainability The purpose of the financial analysis is to determine if the component’s FIRR exceeds its FOCC in real terms. If the component’s FIRR exceeds its FOCC, it can be concluded that the component is financially viable. The Weighted Average Cost of Capital (WACC) of the component in real terms is used as proxy for the FOCC. The WACC represents the cost incurred by the entity in raising the capital necessary to implement the project component. The WACC therefore is the benchmark to assess the financial viability of the project component. The WACC of the project component is 1.4% as calculated below.
Weighted Average Cost of Capital
Particulars Sub-Loan Grant Equit
y Total
Weight (%) 50.0% 50.0% 0.0% 100.0
% Nominal Cost (%) 5.0% 10.0% 0.0% Tax Rate (%) 0.0% 0.0% 0.0% Tax Adjusted Nominal Cost (%) 5.0% 10.0% 0.0% Inflation Rate (%) 6.0% 6.0% 6.0% Real Cost (%) -0.9% 3.8% 0.0% Weighted Component of WACC (%) -0.5% 1.9% 0.0% Weighted Average Cost of Capital (Real Terms) 1.4% Source: Consultant’s calculation
Sensitivity analyses have been undertaken in order to test the robustness of the financial results to adverse changes in conditions. The following adverse changes have been analyzed: A capital cost overrun of 10%;
An increase in the O&M cost by 10%;

TA 7231-BAN: City Region Development Project Final Report
September 2010 Chapter 8-31
A reduction in revenues by 10%; and
Project component delayed by one year. The results of the FIRR calculation and sensitivity analysis for the project component are shown below.
FIRR and Sensitivity Analyses
Scenario NPV FIRR (%) / 1
(‘000 Taka) SI SV / 2 % Change
/ 3
Base Case 249,830 5.42% 10% Increase in Capital Costs 197,529 4.28% 2.53 39% 10% 10% Increase in O&M Costs 233,680 5.16% 0.57 177% 10% 10% Decrease in Revenues 156,397 3.89% 3.40 29% 10% Project Component Delayed by One Year 208,254 4.46% 1/ NPV = Net Present Value discounted at WACC 2/ SI = Sensitivity Indicator (ratio of % change in FIRR above the cut-off rate of WACC to % change in a variable) 3/ SV = Switching Value (% change in a variable to reduce the FIRR to the cut-off rate of WACC)
Based on the results above, it can be concluded that the proposed component is financially viable under the base case scenario and also under adverse changes in conditions. The sensitivity analysis indicates that the proposed component is most sensitive to reduction in revenues and delay in the project, but remains well above the WACC. The financial sustainability of the proposed component largely depends on the adequacy of funds of the implementing agency to operate and maintain the infrastructure facilities. The projected income statement and cash flow statement (see table below) of the project component in the long term show that adequate funds will be available to operate and maintain the infrastructure facilities sustainably. Operating ratio is below 1.00 throughout the projection period which indicates good financial health. Debt service coverage ratio of the project component is above 1.2, the minimum ADB requirement, throughout the projection period.

TA 7231-BAN: City Region Development Project Final Report
September 2010 Chapter 8-32
Projected Financial Statements
(Million Taka, Current Price)
Source: Consultant’s calculation
2010 2011 2012 2013 2014 2015 2016 2017 2018 2019 2020 2021 2022 2023 2024 2025Income Statement
Total Revenues 0 0 0 0 71 69 73 76 80 84 89 93 97 102 107 111Expenses
Operating Expenses 0 0 0 0 9 9 10 10 11 11 12 13 13 14 14 15Depreciation 15 15 15 15 15 15 15 15 15 15 15 15Interest Expense 0 0 0 0 9 9 9 8 8 7 7 6 6 6 5 5
Total Expenses 0 0 0 0 33 33 33 33 33 33 33 34 34 34 34 34Income before Tax 0 0 0 0 38 36 40 43 47 51 55 59 64 68 72 77Income TaxNet Income 0 0 0 0 38 36 40 43 47 51 55 59 64 68 72 77
Cash Flow StatementSources of FundsNet Income 0 0 0 0 38 36 40 43 47 51 55 59 64 68 72 77Add: Depreciation 0 0 0 0 15 15 15 15 15 15 15 15 15 15 15 15
Interest Expense 0 0 0 0 9 9 9 8 8 7 7 6 6 6 5 5Gross Internal Cash Generation 0 0 0 0 62 60 63 66 69 73 77 80 84 88 92 96Government Grant 0 34 72 77Subsidiary Loan 0 34 72 77Total Sources of Funds 0 68 145 153 62 60 63 66 69 73 77 80 84 88 92 96
Application of FundsProject Capital Expenditure 0 68 145 153 0 0 0 0 0 0 96 0 0 0 0 0Debt Service Payment:
Principal 9 9 9 9 9 9 9 9 9 9 9 9Interest 9 9 9 8 8 7 7 6 6 6 5 5
Total Debt Service Payment 18 17 17 17 16 16 15 15 14 14 14 13Total Application of Funds 0 68 145 153 18 17 17 17 16 16 111 15 14 14 14 13Cash Increase (Decrease) 0 0 0 0 44 42 46 49 53 57 (34) 65 70 74 79 83Cumulative Cash Balance 0 0 0 0 44 86 132 181 235 292 258 323 393 467 545 629Operating Ratio 0.33 0.35 0.34 0.33 0.32 0.31 0.30 0.29 0.29 0.28 0.27 0.27Debt Service Coverage Ratio 3.47 3.41 3.68 3.98 4.29 4.63 5.00 5.39 5.81 6.27 6.77 7.30

TA 7231-BAN: City Region Development Project Final Report
September 2010 Chapter 8-33
Annex A – Detailed Base Cost Estimates
Cpt. Unit Totals No. Description Unit Quantity Rate (US$)
(US$) (inc tax) 1 Project Preparation
1.1 Detailed Design and Engineering LS 1 889700 889,700 1.2 Capacity Building ,Training and Awareness LS 1 195652.2 195,652
TOTAL FOR COMPONENT 1 1,085,352
2 Water Supply
2.1 Refurbishment,Rehabilitation and Replacement of production wells, tank and pipelines
2.1.1 Refurbishment of production wells No 5 28985.51 144,928 2.1.2 Overhead tank rehabilitation No 2 7246.377 14,493 2.1.3 Pipe line replacement 2.1.3.1 a. Upvc Class c 200 mm Km 1 26086.96 26,087 2.1.3.2 b. Upvc Class c 150 mm Km 2 20289.86 40,580 2.1.3.3 c. Upvc Class c 100 mm Km 2 14492.75 28,986 Sub-Total Pipeline Replacement 95,652 Sub-Total for Component 2.1 255,072
2.2 New Test wells, Tubewells, Pumphouses, Pipelines and House Connections
2.2.1 Test tube wells No 12 1449.275 17,391 2.2.2 Production tube wells (new) No 12 43478.26 521,739 2.2.3 Pump house No 12 11594.2 139,130 2.2.4 Pump & accessories (including electrification) No 12 26086.96 313,044 2.2.5 Electrical Sub-station No 17 21739.13 369,565 2.2.6 Pipe line new 2.2.6.1 a. Upvc Class c 200 mm Km 15 26086.96 391,304 2.2.6.2 b. Upvc Class c 150 mm Km 20 20289.86 405,797 2.2.6.3 c. Upvc Class c 100 mm Km 15 14492.75 217,391
Sub-Total Pipeline New 1,014,493 2.2.7 House connection No 3000 86.95652 260,870 2.2.8 Supply of water meter No 6000 72.46377 434,783 2.2.9 Land development LS. 1 144927.5 144,928 Sub-Total for Component 2.2 3,215,942
TOTAL FOR COMPONENT 2 3,471,015

TA 7231-BAN: City Region Development Project Final Report
September 2010 Chapter 8-34
3 Sanitation 3.1 Public toilet No 10 14492.75 144,928 3.2 Renovation of existing public toilets No 9 3623.188 32,609 3.3 Collection of septic tank & pit latrine sludge
(purchase of one number dump truck with vacuum tank).
LS 1 115942 115,942
3.4 Site development for disposal of septic tank & pit latrine sludge
LS 1 72463.77 72,464
TOTAL FOR COMPONENT 3 365,942 4 Office equipment, furniture, transport and
software
4.1 Office equipment and furniture LS 1 28985.51 28,986 4.2 Transport LS 1 72463.77 72,464 4.3 Customized software for computerized billing
system LS 1 21739.13 21,739
TOTAL FOR COMPONENT 4 123,188 TOTAL COSTS 5,045,497 Contingency 10% 504,550 COSTS + CONTINGENCY 5,550,047 Assumed Exchange Rate USD = BDT 69 Note: LS = Lump Sum km = Kilo Meter

TA 7231-BAN: City Region Development Project Final Report
September 2010 Chapter 8-35
Annex B – Gazipur Population Census by Pourashava
Population of Gazipur Pourashava 2005
No Ward No. Name of Village Population Female Male Total
1 1 Bhurulia 8430 9500 17930 2 2 Pazualia 1619 1820 3439 3 2 Vanua 1701 1838 3539 4 2 Faokal 895 1017 1912 5 2 Chapulia 5448 5708 11156 6 2 Chotor 10067 12132 22199 7 2 BOF 6751 7013 13764 8 2 BDP 349 380 729 9 2 Takshal 2266 2507 4773 10 2 Machine Tools 100 108 208 11 3 Mariali 3220 3409 6629 12 3 Tekvararia 708 815 1523 13 3 West Joydebpur 6907 7306 14213 14 3 Munsipara 2143 2315 4458 15 3 Bilaspur 10602 12832 23434 16 4 East Joydebpur 17991 19503 37494 17 4 Boruda 3687 3906 7593 18 5 Bhora 3109 3217 6326 19 5 Cha Bagan 769 805 1574 20 5 Harinal 3557 3769 7326 21 5 Noangao 2216 2306 4522 22 5 lagalia 1175 1290 2465 23 6 Baluchakuli 1200 1307 2507 24 6 Bangalgach 1600 1713 3313 25 6 Niler Para 4700 4823 9523 26 6 Kanaia 4200 4315 8515 27 7 Laksmipur 5892 5990 11882 28 7 BRRI 3197 3560 6757 29 7 SARDI 1233 1380 2613 30 7 BARI 4775 5008 9783 31 7 East Chandona 2756 2980 5736 32 8 Chhotodeora 3602 3770 7372 33 8 Samantopur 1817 1992 3809 34 8 Adaboi 1398 1507 2905 35 8 Torotpara 1110 1230 2340 36 8 Chaitanyapur 404 470 874 37 8 Dhirashrom west 2721 2918 5639 38 9 Vararul 3008 3376 6384 39 9 Rahapara 1192 1305 2497 40 9 Pakoirdeshi 617 712 1329 41 9 Tekipara 110 123 233 42 9 Dakhin khan 1962 2108 4070 43 9 Dhirashrom east 2322 2503 4825
Total= 143,526 156,586 300112

TA 7231-BAN: City Region Development Project Final Report
September 2010 Chapter 9-1
Sub-Project 6
SOLID WASTE MANAGEMENT– NARAYANGANGJ AND SURROUNDING LOCAL GOVERNMENT UNITS (LGUs)

TA 7231-BAN: City Region Development Project Final Report
September 2010 Chapter 9-2
Table of Contents
1. Preamble .......................................................................................................................................... 3
2. Purpose and Background .............................................................................................................. 4
3. Policy Context ................................................................................................................................. 6
4. Situation Analysis ........................................................................................................................... 6
5. Project Vision and Objectives ..................................................................................................... 12
6. Solid Waste Management – Phased Development ................................................................ 12
7. The Proposal – Description......................................................................................................... 13
7.1 Detailed Design and Project Preparation................................................................................. 13
7.2 Implementation ....................................................................................................................... 14
8. Land Ownership ............................................................................................................................ 21
9. Reduction – Re-Use – Recycling and the Community ........................................................... 21
10. The Sub-Project Costs................................................................................................................. 22
11. Benefits........................................................................................................................................... 23
12. Replication ..................................................................................................................................... 23
13. Economic Assessment................................................................................................................. 24
13.1 Methodology and Assumptions ............................................................................................... 24
13.2 Economic Benefits.................................................................................................................... 24
13.3 Economic Analysis and Sustainibiity ........................................................................................ 25
14. Financial Assessment .................................................................................................................. 26
14.1 Methodology and Assumptions ............................................................................................... 26
14.2 Financial Analysis and Sustainability........................................................................................ 26
Annex A - Detailed Base Cost Estimates......................................................................................... 29

TA 7231-BAN: City Region Development Project Final Report
September 2010 Chapter 9-3
1. Preamble Solid waste includes all the wastes arising from human and animal activities that are discarded as useless or unwanted. Households, commercial and industrial development are the primary sources of solid waste and typically includes, food wastes, paper wastes, glass, metal, plastic, rubber, leather, wood, and other miscellaneous materials.
Poorly managed solid waste is an important factor affecting public health, and where up to 22 human diseases have been linked to improper management of solid waste. Diseases associated with solid waste handling include diarrhoea, parasite infestation, eye infection, respiratory infection, and skin disease. Handling solid waste may lead to birth defect and infant mortality. Contamination of air and water and subsequent inhalation and ingestion leads to infectious diseases as well.
Solid waste, which is not properly collected and/or is dumped, provides breeding grounds for disease vectors like flies, mosquitoes and rodents. This may include, poorly managed municipal dumps and a variety of unofficial and illegal dumping grounds, which may be adjacent to residential areas and close to or even dumped in watercourses, where it eventually leaks into and blocks drainage systems. Sources of unofficial and illegal dumping include the residential, commercial and industrial sectors and even from some irresponsible arms of GoB.
Specific environmental effects from poorly managed municipal dumps and from dumping include (i) contamination of surface and groundwater with hazardous leachate; (ii) toxic gas emissions from the burning of solid waste; (iii) bio-degradation of organic waste generating methane – a harmful greenhouse gas; (iv) unstable of piling of solid waste exposing operators, garbage pickers and others to risk; is also a concern; and (v) exposure to excessive noise, vibration and air borne particulates associated with solid waste handling causing environmental pollution.
Solid Waste Management (SWM) is an important function of any local government unti (LGU). It is an essential service that should be carried out on a daily basis, and where even short-term disruption to the services can result in both public health and environmental risks. In most LGUs SWM consumes a large portion of the local budget and employs the largest number of workers and vehicles. Narayanganj Pourashava has a total of some 376 conservancy employees (Road sweepers – 155, Drain cleaners – 65, Truck drivers – 10, Truck labourers – 58, Trolley men – 75 and supervising staff – 13) to provide SWM services.
Unfortunately in the Bangladesh context this important service has not functioned well in most urban areas, where there are at least three significant constraints: (i) financial constraints in preventing local government investment in SWM; (ii) resource constraints in developing integrated approaches to SWM, which acknowledge the opportunities for private sector investment; and (iii) lack of inclusion of the commercial and industrial sector in comprehensive planning for SWM.
Historically, both in Bangladesh and overseas solid waste has been seen as a nuisance to be disposed of in a series of landfills or through other techniques such as incineration. In more recent times concern for the environment and the costs of handling ever increasing amounts of solid waste and non-bio-degradable waste have resulted in changes in the way that societies and governments handle SWM. Interestingly, the urban poor have understood the value of the waste as a resource for a long time through the processes of waste picking for instance.

TA 7231-BAN: City Region Development Project Final Report
September 2010 Chapter 9-4
At the core of these changes is an understanding that solid waste is a resource and has a value, which can be optimised through the introduction of integrated SWM systems. This can lessen the financial burden of waste collection and disposal and minimise the environmental impact and associated risks. Central to this understanding in the environment of developing countries is the application of two key principles:
Reduction/Re-Use and Re-cycling Strategies, which collectively optimise the economic value of solid waste and reduce the amount of waste in conventional landfill sites; and
Optimising the role and responsibilities of urban communities in solid waste collection and disposal.
Many developing countries in Asia have made remarkable progress in the implementation of integrated and sustainable approaches to SWM. There are a number of excellent examples in Vietnam for instance, which relate well to the Bangladesh situation. Bangladesh is generally not as advanced as many of its neighbours, but recent initiatives in Dhaka, where JICA have acted in a consultant capacity and from non-government organisations, such as Waste Concern and BRAC show increasing awareness of the need to take action.
It is in this context that this Sub-Project has been developed, within the context of achieving social acceptability, technical feasibility, financial viability, and environmental sustainability.
2. Purpose and Background This Sub-Project provides a technical assessment of proposals for the introduction of an Integrated SWM System for Narayanganj and a number of surrounding LGUs, namely Shidhirgonj, Tarabo, Kanchan, Araihazar and Sonargon. A survey of solid waste management in Narayanganj has been carried out providing information and data on the SWM process.The technical assessment has been prepared following discussions with the mayor of Narayanganj Pourashava and key staff, together with Shidhirgonj, Tarabo and Kanchan, all of which have expressed support in principle for the Project Component. Map1 illustrates the Sub-Project area.
The primary purpose of the SWM Sub-Project is to improve public health and the urban environment through integrated SWM in a sub-regional frame. The entire scope of SWM, that is, primary collection, secondary collection, transportation, treatment and final disposal of solid waste, including application of Reduction, Re-use and Re-cycling and technologies appropriate to the circumstances of the on-ground situation and resources have been assessed and proposed for improvements. Reduce-Reuse-Recycle principles are strongly advocated letting only the minimum residual waste to go to the landfill(s).
Investigation of establishing a sub-regional landfill will be carried out so that the participating pourashavas and the LGUs can share this facility. As this site has yet to be identified, it is proposed this Sub-Project will be designed and implemented in two phases over a five-year period. The 1st phase will be concentrated in Narayanganj, utilising an identified landfill resource and the 2nd phase will expand the Sub-Project into the other LGUs (Section 9.6 refers).

TA 7231-BAN: City Region Development Project Final Report
September 2010 Chapter 9-5
Map 1 The Sub-Project Area

TA 7231-BAN: City Region Development Project Final Report
September 2010 Chapter 9-6
3. Policy Context It is understood there is not yet a dedicated Waste Management Act or regulations in Bangladesh. The Environment Conservation Act (1995) provides for the conservation of the environment, improvement of environmental standards and control and mitigation of environmental pollution. This includes waste covering any solid, liquid or gaseous discharge, disposal and dumping of which may cause harm to the environment. The Act comes under the Department of Environment, Ministry of Environment and Forests. SWM is addressed in a number of national policy documents. The ‘National Strategy for Accelerated Poverty Reduction (2009-11)’ intended actions and strategies for SWM include: (i) Multi-agency involvement; (ii) Government-NGO partnerships for waste disposal for slum dwellers; and (iii) Promoting waste composting through NGOs-Primary Voluntary Organisations. The ‘National Clean Development Mechanism (CDM) Strategy’ (2004) has identified waste as one of the potential sectors in attracting CDM finance (including landfill gas recovery and composting); the ‘Draft National Urban Policy’ (2006) also encourages the recycling of waste and application of the CDM.
The ‘National Safe Water and Sanitation Policy’ (1998) states recycling of waste should be pursued as much as possible and organic waste should be used for composting and bio-gas generation. The ‘Urban Management Policy Statement’ (1998) encourages pourashavas to privatise urban services as well as give priority to providing services, including SWM services, to slum dwellers.
Several recent draft national policies by the Department of Environment (Ministry of Environment and Forests) address SWM specifically. The ‘Draft National Solid Waste Management and Handling Rules’ (2010) covers the: (i) Reduction of solid waste generation; (ii) House-to-house collection of waste; (iii) Effective transfer of primary and secondary waste; (iv) Treatment of organic waste by composting or bio-methanation; (v) Reduction of all but residual waste going to landfill; and (vi) Raising of public awareness and citizens’ participation in SWM. A ‘Draft National 3R Strategy’ (2009) encourages the: (i) Segregation of waste at source wherever possible; (ii) Establishment of the ‘polluter pays’ principle; (iii) Support for the informal recycling sector; and (iv) Development of public-private partnership for recycling.
The legal framework of waste management is established in the Local Government (Pourashava) Ordinance (2009). This Ordinance assigns pourashavas with the responsibility for the removal, collection and disposal of refuse, wastes and rubbish.
The provisions of the above policy guidelines and the legal framework have been considered in preparing this Sub-Project.
4. Situation Analysis A – NARAYANGANJ
Population and Population Growth
Narayanganj Pourashava is located 17 km southeast of Dhaka City at the confluence of Sitalakhya and Buriganga rivers. It is an important river port and commercial hub. It has an area of 10.40 km2 and a current population of around 254,000.
The 2001 census population was 230,294. During the period 1991 and 2001 population of Narayanganj Pourashava grew only 0.99% per annum, in comparison to the national trend of

TA 7231-BAN: City Region Development Project Final Report
September 2010 Chapter 9-7
3.27%. In order to project the population for 2015 and 2020 we could use a low and high growth rate of 0.99% (the trend observed in Narayanganj) and 3.3% per annum (used as the assumed growth rate elsewhere in CRDP). Table 1 indicates the projected population for the period 2015 and 2020 under the two growth rates.
Table 1 Estimated Population - Narayanganj Pourashava
Year Low growth rate (0.99%) High growth rate (3.3%) 2010 254,136 318,629 2015 266,967 374,790 2020 280,447 440,842
The PPTA team undertook a sample survey of two wards in Narayanganj (Wards 4 and 7) in order to understand the current situation regarding the waste generation, physical composition of waste, and the existing SWM process.The survey assessed the community needs in different household income areas and recorded the views of pourashava staff, private sector operators and management representatives of industries and health care organisations. The team also held discussions with pourashava officials and undertook a visual survey of pourashavas adjacent to Narayanganj. Detailed findings from the above are presented below.
Waste Generation
Based on the results of the sample survey, Table 2 indicates the waste generation rate per capita per day. The results closely resemble the characteristics of a previous larger survey carried out by Waste Concern a non government organisation (NGO) with Dutch origins1. It is also noted that in India the waste generation rate typically stands at around 0.19kg/capita/day.
Table 2 Waste Generation Rates in Narayanganj
Income Strata Waste generation rate (kg/capita/day)
Low income area 0.097 Middle income area 0.174 High income area 0.280
Average 0.184
Utilising the average waste generation rate of 0.184kg/capita/day Narayanganj Pourashava domestic waste currently generation isbetween 46to 56 tons per day (utilising low and high population estimates) Based on the population projections shown in Table 1, waste generation in 2015 and 2020 would be 48 tons per day and 50 tons per day under low population growth rate and 67 tons per day and 79 tons per day under high population growth rate.For the purposes of the Sub-Project a mid range figure of 55 tons per day is assumed for 2015.
1 Feasibility Study for Employment and Income Generating Activity Through Solid Waste Collection, Composting and Recycling, Narayanganj 2005

TA 7231-BAN: City Region Development Project Final Report
September 2010 Chapter 9-8
Waste Composition
The consultant team have estimated that around 89 percent of all domestic waste is currently organic and 11 percent is inorganic and recyclable (and goes into the recycling stream) of which a small percentage is inert and requires disposal in a sanitary or controlled landfill site. Currently waste is not segregated, such that a significant amount isdelivered to the primary collectors in a mixed form.Much of the inorganic and recyclable wastes are glass, plastics, which are sold by the primary collectors to shops/businesses for reuse.Again there is consistency with surveys carried out by Waste Concern,which estimate some 92% of waste in Narayanganj as being organic.
Table 3 Waste Composition in Narayanganj Pourashava
Household Income Strata
Average amount of organic waste (kg/HH/day)
%
Average amount ofinorganic waste (kg/HH/day)
%
Amount of total waste generation (kg/HH/day
Low income
0.513 kg 91.5% 0.048 kg 8.5% 0.559 kg
Middle income
0.937 kg 94.5% 0.057 kg 5.5% 1.044 kg
High income
1.020 kg 79.6% 0.261 kg 20.4% 1.281 kg
Average 0.820 kg 88.53% 0.122.kg 11.47% 0.961 kg
Average waste generation is therefore approximately 0.96kgs per household per day, of which 0.82 kgs are organic and 0,12 inorganic. Table 3 above refers.
Industrial Waste
There are some 50 large, 200 medium, and 2,000 small industries operating in Narayanganj Pourashava. These industries generate significant quantities of waste, including large quantities of inorganic waste, but it is understood the vast majority of this inorganic material has a financial value and is sold off by the industrial operators. The PPTA team conducted a sample survey of several industries2 and observed that these industries are generating various types of waste, but major portionsare sold for re-cycling or re-use. To this extent it is not anticipated that where industry uses a public landfill site the quantity of non-organic waste involved will significantly affect the estimates provide here for land fill requirements.
Organic wastes generated by industries are disposed in the municipal bins where domestic wastes are also disposed. The volumes of organic waste from industry are generally insignificant in relation to the total organic waste load. There is no separate collection and
2(Samrat & Co. Pvt. Limited Knit Industry, Samrat Yarn Dyeing Ltd, Jamal Soap Factory, Elite Chemical Industry, Almas Flour Mill and Pubali Salt Industry)

TA 7231-BAN: City Region Development Project Final Report
September 2010 Chapter 9-9
management system for industrial organic wastes. In discussion with industrial operators, there was interestin improved management of waste, including the possibility of increases in the collection charges, if appropriate initiatives are taken by the pourashava.
Health Care Waste
There are approximately 53 health care establishments (HCEs) inNarayangonj Pourashava including government hospitals and private clinics. A sample survey was conducted to understand the waste management situation of the HCEs.3All these HCEs are generating a variety of hazardous and non-hazardous wastes including infectious waste, hazardous waste, plastics and food waste. Again volumes, are however thought to be small in comparison with the total domestic load.
Narayangonj Pourashava provides waste collection services to the HCEs at a monthly expenditure of Tk.16,000, which includes transportation and labour costs. The Clinic Association pay Tk.8,000 monthly to the Pourashava for clinical solid waste management, and the Pourashava bears the remaining costs which comes to around Tk.8000. A private company named, AED Bangladesh, is also providing HCE waste collection services for 1 or 2 clinics after due permission from Narayangonj Pourashava.In discussion with management representatives of the HCEs, they showed interest in a better service, including a higherservice charge. One private clinic Medistar informed the consultant team they paid Tk1,500 monthly to the pourashava for health care waste management services and Tk1500 – 2000 to three cleaners for health care waste management work.
Collection and Transportation
Primary Collection - Domestic waste generation accounts for approximately three-quarters of total waste generated in Narayanganj Pourashava.4This estimation reflects national trends identified through the Bangladesh Demographic and Health Survey (2007) and Urban Health Survey (2006).5 The current solid waste management system in Narayangonj Pourashava is crude, where the numbers of bins and equipment for waste collection are inadequate. Some primary house-to-house collection services are being provided by a private company (named AED Bangaldesh), non-government organizations (NGOs), and community based organizations (CBOs). AED Bangladesh, a registered joint stock company was established in the year of 2002 and works with a number of pourashavas and union parishads.6 It also operates in the two wards of Dhaka City Corporation. It is currently providing SWM services to 9,385 households in
3NarayangonjCity (Sadar) Hospital, 200 bed hospital, khanpur, Medistar general hospital, Narayangonj Poly clinic, Maa Medical Services
4Estimated provided by Narayanganj Pourashava to the consultant team. 5 These surveys indicate that more than two-thirds of urban non-slum households dispose their garbage through door-to-door collection (41%) or in a bin outside their dwellings (27%). Thirty-nine percent of urban slum households also use door-to-door collection (22%) or dispose of waste in a bin outside their dwelling (17%). However, slum households (58%) mostly dispose of waste in open space outside their dwellings. 6 (Narayangonjand, Sidhirgonj and Kadamrasul pourashavas; Fatullah and Enayet Nagar union parishads)

TA 7231-BAN: City Region Development Project Final Report
September 2010 Chapter 9-10
Narayangonj Pourashava mainly in wards 2, 3, and 4 operating with 29 vans. Additionally,primary house-to-house collection of waste is also provided by a UPPRP supported Community Development Committee (CDC) and an NGO - Green Peace. Primary collection through these organizations covers all the wards of the Pourashava, but in part only. Where there is a service it is observed to be well-organised. CDCs are providing community waste collection services in wards 1, 2, 5,7,8 and 9 with 22 tri-cycle vans. Green Peace also operates in ward 4 with a tri-cycle vans. Afee of monthly USD 0.50 is charged to households. The estimated population covered by these primary waste collection services is about 60,000 to 75,000 persons. Initially funds have been raised for equipment and maintenance costs and the wage bill of waste collectors are paid from a monthly fees paid by householders.7 Cost recovery of the collection service through user charges is encouraging and the consultant team has been informed that AED for instance operates profitably with about Taka 500 – 700 net profit per van (each van can cover an estimated 1,200 – 1,500 persons).
Under and agreement between Narayangonj Pourashava and Waste Concern, between six and eight tons of organic waste goes daily to a compost plant at Bhulta operated by the Waste Concern.Waste Concern pays BDT 400/ton to the pourashava for the wastes. The waste is not segregated, but more than 90% waste is organic as it is supplied from market kitchens, it is therefore already suitable for composting.Waste from households, is not supplied to Waste Concern as there is currently very little segregation and where organic and inorganic wastes are mixed, such that it is nor suitable for composting.
Secondary Collection- There are an estimated 25 Secondary Transfer Points in Narayanganj Pourashava where primary waste is dumped prior to collection by pourashava truck and transported to final dump site. The secondary transfer points are unmanaged sites that are generally located by the roadside. Concrete transfer dustbins are used, which are either in poor repair or do not exist and open land is used. The frequency of collection from the transfer points varies depending on whether they are in areas of high commercial activity or not. The waste is manually loaded from the transfer point onto trucks.
Final Disposal- The dumpsite for Narayanganj Pourashava,known as Ponchoboti, which is located about 2.5 km from the town centre. Largely uncontrolled dumping is practiced in a situation where the site is located close to residential and commercial areas, and in proximity to water bodies. It is therefore a threat to public health and a source of environmental pollution. Until recently the site was 3.6 hectares, but part of this site is now earmarked for an alternative commercial use. It is understood the area remaining for use as disposal site is around 2 acres, which is not large enough for long-term use or to serve other LGUs, where a new and larger dedicated landfill is required. It will however be adequate for a first phase where focus will be to improve the SWM process and create awareness for primary and secondary collection systems/procedures in Narayanganj Pourashava.
7 United Nations Development Programme / Department for International Development ‘Urban Partnership for Poverty Reduction Programme’.

TA 7231-BAN: City Region Development Project Final Report
September 2010 Chapter 9-11
In summary, although there are some primary solid waste collection services, they do not reaching 100% of the population in Narayanganj Pourashava and are not always fully functioning. Solid waste transfer facilities are poor and largely without management. The principles of Reduction-Re-use and Re-cycling are generally not practised and so far the intervention to improve this situation through composting (Waste Concern Project) only affect a small percentage of the total daily organic waste production from the market kitchens.
B - Adjacent Pourashavas and UpaZillas
Narayanganj Pourasahava is part of a wider area where there is significant and largely unplanned urbanisation, including industrial development.As stated above, phase 2 of the Sub-Project will extend an integrated SWM process into a further five LGUs:Araihazar, Kanchan, Shidhirgonj, Sonargaon and Tarabo. The current estimated population in these areas and the forecast for 2015 and 2020 is shown in Table 4 below.
Table 4 Projected Population Growth in Surrounding LGUs
Population Census
2001
Projected Population Growth8 Pourashava/ Growth Centre
2010 2015 2020 Shidhirgonj 96,222 133,131 156,595 184,196 Tarabo 91,131 126,087
148,310 174,451
Kanchan 71,530 95,135 110,832 129,119 Araihazar 12,532 16,668 19,418 22,622 Sonargaon 4,702 6,254 6,460 6,673 Total 179,895 377,275 441,615 517,061
From the evidence of the consultant team’s discussions with stakeholders so far, it is understood that comprehensive and integrated SWM systems are non-existent. There is little or no primary collection, there are no designated dump sites and final disposal consists of mainly uncontrolled open dumping. This represents a serious and accelerating environmental health problem with waste dumped on low lying land, close to water bodies and potentially causing surface and groundwater pollution through toxic leachates.The challenge for the sub-region is already significant, where the existing demand level for domestic waste is estimated at a total of 68 tons per day. This will rise to over 80 tons per day in the year 2015 and 93 tons per day by the year 2020. Table 5 refers.
8Assumption: 3.3% growth per year

TA 7231-BAN: City Region Development Project Final Report
September 2010 Chapter 9-12
Table 5 Waste Generation – Surrounding LGUs
Project Waste Generation (tons per day)9 LGU/
Growth Centre 2010 2015 2020
Narayanganj Pourashava 45 55 75 Adjacent Areas 68 80 93 Total 113 135 168
5. Project Vision and Objectives Our vision for this Sub-Project is to ensure that the collection and disposal of solid waste is sustainable, protects public health and results in improved environmental conditions and practices.
To achieve this Vision the following four Objectives are proposed to ensure:
The achievement of 100 per cent solid waste collection for households and other land uses in Narayanganj and the surrounding LGUs of Shidhirgonj, Tarabo, Kanchan, Araihazar and Sonargon;
Realisation of the value of solid waste as a resource, through optimal implementation of reduce, re-use and re-cycling principles (the 3R Strategy of GoB);
Optimisation of the potential of SWM as an income generating activity, for the project affected communities, the private sector and GoB stakeholders; and
Optimisation opportunities for cooperation across local government boundaries to achieve better SWM and economies of scale.
6. Solid Waste Management – Phased Development It is recommended that the Sub-Project is implemented in two interlinked phases:
Phase 1 – Upgrading and extending SWM practices in Narayanganj; and
Phase 2 – Extending Integrated SWM practices incrementally into the areas of the adjoining Local Government Units and developing a Sub-Regional Landfill Site.
The reason for the two phase approach is to respond to both land and resource issues. At the time of writing it has not been possible to identify land for a sub-regional landfill site, and until this has been found then it will not be possible to develop a “fully fledged” sub-regional approach to SWM. It is therefore recommended to commence with Phase 1 in Narayanganj, where the existing dumpsite can be extended and properly managed as a composting and landfill area for Narayangani in the short-term to serve the pourashava.Should the position of
9 Based on the aassumption of 0.18 kg/capita/day waste generation

TA 7231-BAN: City Region Development Project Final Report
September 2010 Chapter 9-13
the search for a Sub-regional landfill site be resolved in the short-term then it may be possible to avoid the need for a short-term landfill in Narayanganj.
7. The Proposal – Description The following activities will be required to secure the design and implementation of this Sub-Project.
7.1 Detailed Design and Project Preparation This will cover all the detailed design and project preparation activities required to progress the implementation of this Project Component.
The detailed design will be based on a Comprehensive Baseline Study, which will include: (i) detailed identification of the socio-economic conditions of the project affected communities; (ii) detailed specification of the nature, scale and location solid waste in the project affected area(s) and the key issues surrounding the existing situation; (iii) detailed specification of the existing initiatives in solid waste management in Narayanganj and the lessons learned; (iv) community response and needs and aspirations in SWM practice; and (v) defining in detail the SWM requirements of the HCEs and the commercial/industrial sectors.
The Comprehensive Baseline Study will be built around recognised secondary data from previous studies and be supplemented by survey sampling from project affected households and from the HCEs and the commercial/industrial sectors. This will include assessment of householders reactions to the current SWM schemes in Narayanganj and establishing key indicators regarding willingness to participate and to pay for solid waste collection services.
At this stage it will be important to enter into discussions with the operators/managers of the existing SWM schemes in Narayanganj, to ensure the initiatives proposed in the Sub-Project compliment the existing schemes, Here it may be possible to establish links between the schemes and achieve good integration. This can include considering the potential for the extension of the Waste Concern composting scheme into household collection, assuming the sorting at source proposals for the Sub-Project.
The Comprehensive Baseline Study will also take account of the good practice in SWM being developed in the Dhaka City Region; through the JICA supported project in the Dhaka City Corporation for instance and through the NGOs such as Waste Concern.
The Comprehensive Baseline Study will provide the foundations for preparation of a Solid Waste Management Action Plan (Action Plan), which will propose in detail the comprehensive and integrated series of activities required to implement the Sub-Project. This will include:
Design of the solid waste collection systems, including nature, scale and locational aspects and including specification of the collection routes and taking into account existing SWM arrangements in Narayanganj;
Design of the solid waste disposal facilities and the arrangements for re-use and recycling;
Investigation of design options and feasibility of the proposed arrangements for Reduction, Re-use and Recycling, including composting techniques and other interventions to maximise the after-use value of solid waste;

TA 7231-BAN: City Region Development Project Final Report
September 2010 Chapter 9-14
Validation of the recommended structure of primary and secondary collection as proposed below and the potential for composting through established private sector initiatives in the area (eg Waste Concern);
Specifying in detail the opportunities and roles for the private sector and the project affected communities to participate in the proposed SWM process and in particular any proposed PPP arrangements;
Detailed specification of the arrangements for community participation in the implementation of the proposed SWM process and in a proposed Community Awareness Programme;
Review operational practices and management of the Narayanganj dumpsite, recommend measures to ameliorate environmental impacts and define the measures required for restoration and after-use of the dumpsite;
Specifying generally the operational and maintenance requirements following implementation of the proposed SWM process, including, primary and secondary collection services, solid waste transfer stations, the landfill and the composting plants;
Confirmation of the equipment requirements specified for Phase 1 implementation and subsequently for Phase 2; and
Specifying the detailed programming arrangements for implementation of Phase 1 implementation and subsequently Phase 2, including definition of a pilot area(s).
In the current situation it is proposed the Design and Preparation Activities should reflect the two phased approach to be adopted for this Sub-Project. Thus there will be two Action Plans; initially for Phase 1 at Narayanganj and subsequently for the sub-regional component in Phase 2.
7.2 Implementation PHASE 1 - NARAYANGANJ
Primary Collection
House-to-house primary collection will be implemented in Narayanganj Pourashava, geared to collecting up to 55 tons of domestic waste per day from all households, using a simple sourcing at source approach. Private sector operators, licensed by the pourashava, will collect waste from house-to-house using tricycle vans. Based on existing practice, about 200 tricycle vans would be needed to provide the waste collection services. Already 52 vans are in operation. An additional 150 vans would be required to cover the solid waste generated in Narayanganj Pourashava. Typically each tricycle van will have six plastic bins with lid to collect the refuse, which will be separated at source and divided into organic and non-organic waste. Based on the existing pattern of waste content it is anticipated that five of these will be filled with organic waste, and one will be used to collect recyclable items. The inorganic waste will continue to be collected by the waste pickers/rag pickers, who sell to shops and businesses who then sell onto to the recycling industry.
It is proposed that people will pay a monthly service charge directly to the operator and here experience elsewhere in Bangladesh (eg Dhaka, Khulna and Rajshahi) shows that people (including the informal housing areas) are willing to pay for refuse collection provided the service quality is good and the service charges are affordable. In this regard other projects

TA 7231-BAN: City Region Development Project Final Report
September 2010 Chapter 9-15
including UPPR in Barisal and WaterAid in Dhaka have successfully extended SWM services to slum areas.
The household service will be extended to the whole of Narayanganj Pourashava and including the markets and other commercial and community facilities (ieHCEs) and as stated above there will be an objective for 100 per cent coverage of the Naraynagnj at the end of Phase 1 implementation.
It is anticipated the private sector operators will be mainly local CBOs and other local entrepreneurs, who will be licensed by the LGU and will pay a fee to the pourashava as operators. This would have the benefit of protecting the LGU from the risks associated with potential operational losses and subsidies. The principle role for the pourashava will therefore be to monitor and regulate the service standards of primary collectors, and provide administrative support such as approval for reasonable collecting service charges. Private companies such as AED, CDCs and NGOs are currently operating satisfactorily in primary collection services. These organizations and other private sector entities should be encouraged to participate in the expanded primary collection process in order to scale up the services to the remaining areas.
Due regard will be given to the social dimension in the design of the Primary SWM process to ensure that the existing scavengers/collectors who operate unofficially in most areas of Narayanganj remain as beneficiaries of the implementation of an integrated SWM Plan. In this regard it is anticipated most of the materials that can be recycled will be extracted from the solid waste management process at source, as for current practice.
Although the emphasis of this Sub-Project is on non-industrial solid waste, it is proposed that industrial solid waste within Narayanganj Pourashava will be brought to the secondary transfer stations, properly segregated and will be transferred to the planned landfill site. The responsibility for transportation will rest with the industrial operators and/or they can reach agreement(s) with the primary collection service provider(s) to do this for a fee. Where there are large amounts of solid waste, then industry will be expected to directly carry the waste to the landfill site.
Solid Waste Transfer Stations
Primary collectors will bring the pre-sorted solid waste to a number of Solid Waste Transfer Stations, where the waste will be transferred from the tricycles vans to conventional trucks, after which the trucks will transfer the waste to the planned landfill site. This will provide the means to achieve the transfer efficiently and without significant environmental impact.
The Solid Waste Transfer Stations are recommended in order to minimise journey times by the primary collection operators, and each Transfer Station will be located within a comfortable driving distance for local tricycles, typically used by CBOs to the furthest source of the solid waste. When use of the landfill at Narayanganj is replaced by a new sub-regional landfill as proposed under Phase 2) then distances will be significantly increased such that it would not be generally feasible for localised tricycle vans to travel such distances. The Solid Waste Transfer Stations will also ensure that the landfill is fed by a relatively small number of large trucks rather than many tricycle vans, which may prove to be operationally cumbersome.
Altogether eight Solid Waste Transfer Stations are recommended to serve the whole of Narayanganj Pourashava. Each Transfer Station will require a dedicated land area of 30 -50 feet in length and 20-30 feet in width and located to minimise nuisance to residential and other

TA 7231-BAN: City Region Development Project Final Report
September 2010 Chapter 9-16
sensitive environments. Table 6 below provides further information in solid waste transfer stations
Table 6 Solid Waste Transfer Stations – Characteristics
STS no. Area Name (population coverage) Ward
no. Type Amt.of waste (est:0.18/ward/day)
1 ACI More 1 Needs construction 2931.3
2 M.Circus More 2 Needs construction 5169.42
3 (Infront of) Khampur Hospital More 3 Needs construction 9267.66
4 Hawker's Market More 4 Mobile 7990.56
5 Ukil Para More 5 Mobile 3591.54
6 Gulshan Cinema Hall More 6,7 Mobile 14785.56
7 Paikpara-Jollarpar 8 Needs construction 6201
8 Nitaiganj More 9 Needs construction 5340.96
TOTAL (amount of waste) 55278
The eight transfer stations points, the existing dump site and the final disposal site are indicated in Map 2.
Secondary Collection and Transport
The design and preparation work regarding the most cost-effective collection routes will be fed into the implementation of the secondary collection and transport system, where there will be operational options, including: (i) Operation and management by Narayanganj Pourashava, or (ii) Contracting out to the private sector, either as an independent operation, or as part of a larger public-private partnership including landfill operations and Solid Waste Transfer Station operations.

TA 7231-BAN: City Region Development Project Final Report
September 2010 Chapter 9-17
Map 2 Proposed Land Fill Site and Refuse Transfer Stations

TA 7231-BAN: City Region Development Project Final Report
September 2010 Chapter 9-18
Landfill at Narayanganj
During the Phase 1 period maximum use will be made of vacant land at the existing dump site in Narayanganj for composting and landfill. A detailed description of the proposed composting and landfill is provided below in Table 7.
Table 7 Landfill Characteristics (Narayanganj – New Site)
Total Area of the Land Fill Site = 86,400 sqft (2 acres)
Total Areas for Various Uses Area (square feet)
1 Control Building with Weigh Bridge 500
2 Road Passage 3,400
3 Surface Drain 1,800
4 Unloading Platform (concrete) 2,500
5 Leachate Pond 1,600
6 Composting Plant 36,000
Total 45,800
Remaining Areas for Landfill 40,600
1 Landfill – Up to 15ft high (ie 40,600 sqft x 5) 609,000
2 Land for Slope 10,000
3 Land Available for Conventional Landfill 599,000 (19,999 cu metres
4 Capacity (assuming 500 kgs of waste per cubic metre) 9,983 tons (9,983,333kgs).
It is estimated that Narayangnaj Pourashava is generating 55 tons of waste/day, where 48 tons of waste is organic (Section 9.4 refers). It is estimated that 50% of the inorganic waste will be collected by the waste collectors and recycled. So, remaining 4 tons will be managed in the landfill site in a controlled manner and 40 tons will be composted.
The landfill site is approximately 2 acres and can accommodate a total approximately 9,985 tons of waste. As per the estimate, 4 tons will be filled everyday, such that the landfill site can be used for up to 1,663 days or around 4.5 years at existing use rates. However the site will also include land set aside for composting, which will effectively reduce the area and therefore the lifespan of the land fill to around XX years. A sketch layout of the proposed landfill site is shown as figure 1 below.

TA 7231-BAN: City Region Development Project Final Report
September 2010 Chapter 9-19
Figure 1Narayanganj- Conceptual Layout for Proposed Landfill (Phase 1 – Temporary). D
ump-site Restoration
During the course of Phase 1, it is also proposed to review the operation of the existing dump site, with a view to stabilising any adverse environmental impacts. The dump site will be fully restored to cater for appropriate after use, potentially as part of a recreation facility proposed by Naraynaganj Pourashava.
Once the Phase 2 Sub-Regional Landfill is operative then the Phase 1 landfill will also be closed and fully restored. This too can be incorporated into the proposed recreation facility.
Piloting
Based on the implementation programme to be specified as part of the Phase 1 Action Plan, it is proposed to identify a Pilot Area, to demonstrate the proposals for an integrated SWM process in Narayanganj, incorporating collection, disposal, and optimisation of Reduction - Re-Use and Recycling. The pilot area will provide the opportunity to monitor and test the operational efficiency of the detailed proposals contained in the Action Plan and their workability for the project affected community. In response, amendments can then be made to the design and implementation of remaining parts of the Naraynaganj SWM process.
PHASE 2 – SUB REGIONAL DEVELOPMENT
Expansion of Primary and Secondary Collection Services
Phase 2 will see the expansion of integrated solid waste collection services into the other five LGUs.

TA 7231-BAN: City Region Development Project Final Report
September 2010 Chapter 9-20
It is proposed to implement integrated SWM systems in the other five LGUs using the experience of Narayanganj as the model. Assuming commencement of Narayanganj in year 1 then two more LGUs would be commenced in year 2, two more in year 3 and final area in year 4. The rationale for this approach is to ensure: (i) that there is a practical approach to the design and implementation of integrated SWM across all of the LGUs, which reflects the resources that will be available for design and implementation; and (ii) Through experience over time, the later SWM schemes can benefit from the lessons learned from the earlier schemes. Should Phase 1 of this Sub-Project not be required then (section 9.6 refers), it will be possible to start year 1 with two LGUs, thus reducing the total overall commencement time period to 3 years instead of four. The priorities for which LGUS will come first will be defined in the design stage, once the sub-regional landfill site is identified and where it is anticipated that those LGUs closest to the landfill would be prioritised
In the design and implementation of these integrated SWM systems, opportunity will be sought for cross-boundary approaches between LGUs and the private sector to provide economies of scale, particularly in relation to secondary collection. This will be particularly advantageous for the relatively small LGUs; Araihazar, and Sonargaon.
It is anticipated that all five LGUs will follow the Narayanganj model, although in practice it is recognised there may be variations, which will be developed in the Design and Preparation stage of this Project Component. For the time being, the Narayanganj model has been used in making assumptions regarding the number of required solid waste transfer stations and for the vehicles and other equipment required to support solid waste collection at both primary and secondary levels.
Sub-Regional Landfill
The total area of the Sub-Regional Landfill site will require some 10 acres of land. Some 6 acres will be used for conventional land filling and will accommodate the non-organic waste, that cannot be re-used or recycled. The consultant team’s estimates, for 2010 suggest a need to accommodate some 54 tons of refuse daily in the conventional landfill. Some 6 acres of the total site will be set aside for this, providing a life span for the site of up to 11 years, based on 2015 demands and a maximum deposit level of 15 metres. This also assumes that final waste sorting at the sub-regional landfill site will extract another 10% solid waste for re-use and recycling (ie 31 tons per day).
The other principle uses at the sub-regional landfill will include: (i) 2 acres for composting; and (ii) 1 acre for other operational uses, including office building, weighbridge, truck washing facilities, maintenance and guard sheds. Consideration will also be given to the need for an area to cater for the management of hospital waste, through treatment and subsequent disposal. It proposed the design of the sub-regional landfill, should initially reserve a nominal area of 1 acre for this purpose.
The organic waste, which will be composted can be introduced through a number of low to high technologies. This can include simple open organic composting, which is low technology and easy to apply, in situations, where extensive capacity building and community awareness is required. This is considered to be appropriate to the current situation in Bangladesh, particularly in circumstances where the landfill operations are to be the sole responsibility of the LGUs.
However it is acknowledged there are more sophisticated options, including the use of bio-methanation, which is used in overseas environments, and which offers a greater level of efficiency and after-use, including bio-gas and fertilizer. The option of a bio-methanation plant

TA 7231-BAN: City Region Development Project Final Report
September 2010 Chapter 9-21
maybe more naturally suited to private sector investment. This matter may be further considered, once the sub-regional landfill site is identified, but for the time being it is not included in the Sub-Project costs.
The search for the Sub-Regional Landfill site will be initially concentrated on areas of land with good accessibility and which are not prone to flooding. The site should also be separate from sensitive land uses, including residential development and major watercourses. To that extent the Shidhirganj area, close to the Chittagong highway and with direct highway links to Narayanganj and the other LGUs to potentially use the Sub-Regional Landfill is favoured.
8. Land Ownership Use of government land is preferred for the provision of both the sub-regional landfill and the solid waste transfer stations. Where government land is not available, then it will be necessary for GoB to acquire the necessary land and/or reach agreement with private landowners for long-term leasing.
9. Reduction – Re-Use – Recycling and the Community The proposals for an integrated SWM process for Narayanganj and the surrounding LGUs places emphasis on an approach built around application of “Reduction – ReUse – Recycle”. To this extent the proposed arrangements for, including composting techniques and other interventions to maximise the after-use value of solid waste will be defined in the Action Plan.
Sustainable practice in SWM starts with the user at home or in the work place, where good practice in waste minimisation and re-use will be an essential part of an integrated SWM system. Facilitation will be achieved through a Community Awareness Programme aimed at the project affected communities and at schools.
The Community Awareness Programme will be formulated in the Design and Preparation phase of the Project (as part of the Action Plan) and will include:
Community awareness in environmental responsibility with particular emphasis on good SWM practice, including Reduction – Re-Use – Recycle;
Practical guidance in implementing sustainable SWM processes as part of the implementation plan for SWM;
Identifying the resource value of solid waste and finding ways for communities to financially exploit this potential;
Using the potential of schools, schoolchildren and youth organisations/clubs in the promotion of sustainable SWM and as active participants in its implementation; and
Using the potential of corporate social responsibility from the private business sectors to assist in the promotion of awareness and social responsibility in SWM.
Designing and implementing a Community Awareness Programme across up to 6 LGUs, will have major resource and professional implications for the proposed Project Implementation Unit (PIU), such that the risks of failure are significant. It is therefore proposed that the Community Awareness Programme be designed and implemented by a separate media/public relations agency skilled in community participation techniques, who will work alongside the consultant team and report to the proposed PIU.This agency would work on a local area basis with the project affected communities and on a broader pourashava level utilising mass media modes, including the press, radio and a web-site and through various meetings, workshops

TA 7231-BAN: City Region Development Project Final Report
September 2010 Chapter 9-22
and a training programme(s). Training would address the project affected communities, and schools, schoolchildren and youth organisations/clubs.
It is anticipated the Community Awareness Programme will be designed to compliment the existing informal arrangements for sorting at source, whereby selected non-organic waste, which is suitable for recycling, including glass, plastics and paper is (extracted by “pickers”), batched together and sold on to companies in the recycling market. This private sector intervention in the market place has both social and environmental credibility, and will be accounted for in the Detailed Design and Preparation Stage of this Project Component.
This informal approach to separating out the materials capable of re-cycling will be supported by second stage sorting of the non-organic waste at the proposed sub-regional landfill, thus optimising waste reduction and recycling opportunities.
The nature of the waste stream will change over time, such that there is a general expectation of gradually increasing quantities on non-organic waste. Here it is hoped that in the wider spectrum of national policy, GoB will place an emphasis on the use of recyclables in the market place, thus reducing the need for conventional landfill and increasing the resource and financial values of waste.
However, there is an expectation that organic waste will continue to make up the majority of the solid waste load. It is therefore essential that opportunities for reuse and recycling organic waste are maximised. At the minimum this will include simple open composting and at best may include technologically more advanced waste to energy facilities. In considering these options important issues include: (i) optimising financial viability in integrated SWM and ensuring the best cost-benefit ratios; and (ii) ensuring local resource capacity will match the technological operation and maintenance requirements. To this extent there maybe merits in an incremental approach, moving over time from low technology to high technology solutions. Composting is the starting point.
10. The Sub-Project Costs The estimated costs for this Sub-Project (Excluding Detail Design, Study and Capacity Building) are in the order of USD 8,914,731f which some USD 1,716,969 are attributable to Phase 1. Phase 2 costs, which are preliminary at this stage account for the remaining USD 7,197,762 for Phase 2. These costs include all capital works, equipment, capacity building and training and the proposed community awareness programme.
A summary breakdown of the investment costs of Phase 1 is shown below in Table 8.
Table 8: Sub-Project Cost Estimates
Project Activity Cost (USD) million
1 Controlled Landfill and Compost Plant 1,260,870
2 Primary Collection 168,916
3 Secondary Collection 181,159
4 Contingencies 106,024
Total Cost 1,716,969

TA 7231-BAN: City Region Development Project Final Report
September 2010 Chapter 9-23
11. Benefits The following benefits will accrue from the implementation of an Integrated SWM System for Narayanganj and the surrounding LGUs:
Meeting the objective of 100% collection of domestic waste (and improved collection of other commercial and industrial waste) in Phase 1 for Narayanganj Pourashava, with a 2015 population of up to 375,000 persons.
Meeting the broader objective of improved collection of domestic waste (and improved collection of other commercial and industrial waste) at sub-regional level in Phase 2 for an additional 400,000 persons within the 5 year Sub-Project implementation period.
Reduced environmental pollution risks throughout an integrated and comprehensive cycle of solid waste collection and disposal and through the use of Reduce-Reuse-Recycle principles;
Reduced exposure to public health risks for the project affected persons and communities in general;
Full realisation of the resource value of solid waste and its associated economic and financial values;
Increased economic and financial performance at sub-regional level through economies of scale; and
Reduced land requirements (and potential acquisition costs) through minimising the scale of landfill requirements.
12. Replication The results and lessons learned from this Sub-Project will lay the foundations for replication in the wider area of the Dhaka sub-region and other city regions.
In particular it is relevant to consider a similar cross-boundary approach to integrated SWM for the Tongi – Gazipur – Savar areas, together with some of the intervening unplanned areas, such as Ashulia. All three LGUs have expressed their concerns on the need to improve SWM services and it is believed would support an initiative of this type within the Project Loan. Subject to further investigation there would be a need to identify an area(s) for a landfill site to serve all three LGUs and the unplanned areas.
Similarly it may be possible to look at replication in the Khulna city region, whereby some of the surrounding smaller LGUs would look to Khulna to be the centre for re-use and recycling facilities and for their general landfill needs. Noapara and Mongla Pourashavas for instance would benefit from this approach.
It is relevant to consider both of these opportunities within the Sector Loan context for this proposed Project.

TA 7231-BAN: City Region Development Project Final Report
September 2010 Chapter 9-24
13. Economic Assessment
13.1 Methodology and Assumptions Economic analysis has been conductedin accordance with the ADB’s Guidelines for the Economic Analysis of Projects (1997) and the Framework for the Economic and Financial Appraisal of Urban Development Sector Projects (January 1994).
The Sub-Project will upgrade and expand priority urban services in: i) water supply and sanitation; and ii) roads and drainage.
The following approach and assumptions have been used in the analysis:
All prices are expressed in 2010 prices and economic analysis is conducted at 2010 constant price;
An average exchange rate of Taka69 per US$1.00 is employed when converting foreign exchange costs to local currency equivalent;
Economic prices of capital works and annual operation and maintenance are calculated from the financial cost estimates of the technical team, adjusted to allow for transfer payments and to correct for any other market distortions;
Price contingencies and interest during construction (as a result of any debt financing) are excluded in the calculation of economic internal rate of return (EIRR) but physical contingencies are included because they represent real consumption of resources;
Taxes and duties are excluded because they represent transfer payments;
All costs are valued using the domestic price numeraire; tradable inputs, net of duties and taxes, are adjusted by the shadow exchange rate factor of 1.13 while non-tradable inputs (except for unskilled labor), net of taxes and duties, are adjusted by a conversion factor of 0.9; unskilled labor is adjusted by a conversion factor of 0.7 of the market wage rate to estimate the shadow wage rate;10
The economic opportunity cost of capital (EOCC) is assumed at 12% in real terms; and
Project sub-component for water supply and sanitation is assumed to have useful economic life of 25 years; project sub-component for roads and drainage is assumed to have useful economic life of 15 years.
13.2 Economic Benefits The project component will increase the coverage of wastes collected in the community to 100% from the current 50% of wastes generated. In addition, a sanitary landfill that is operated and maintained in accordance with the best principles of public health and environmental protection will be provided. The project component will bring about quality improvements in public health and environment. Benefits will accrue to the community as a whole, both poor and the rich, and not only to the direct beneficiaries of the waste collection services as the project interventions are public good.
10 Conversion factors for economic shadow pricing are based on recently approved ADB projects in Bangladesh.

TA 7231-BAN: City Region Development Project Final Report
September 2010 Chapter 9-25
The improvements in public health and environment may be reflected in two quantifiable benefit streams, namely: i) productivity gains; and ii) resource cost savings on health care. As a result of public health and environmental improvements, it is assumed that productivity gains equivalent to 1% of annual workdays of an income earner in each household served could be realized.11 The improvements are also assumed to result in health care cost savings due to reduction of outpatient visits, treatments and prescriptions. It is estimated that annual per capita spending on health care is about USD15.12 Savings in health care is assumed at 1% of annual spending.
Other benefits which are not easily quantifiable or could result to double counting and hence not accounted for in the analysis include: reduction in mortality and morbidity patterns resulting from communicable diseases; and reduced environmental degradation.
13.3 Economic Analysis and Sustainibiity The purpose of the economic analysis is to determine if the component’s EIRR exceeds its EOCC, in real terms. If the component’s EIRR exceeds its EOCC, it can be concluded that the component is economically viable. Sensitivity analyses have been undertaken in order to test the robustness of the economic results to adverse changes in conditions. The following adverse changes have been analyzed:
A capital cost overrun of 10%;
An increase in the O&M cost by 10%;
A reduction in the benefits by 10%; and
Project component benefits delayed by one year. The results of the economic and sensitivity analysis are shown below.
EIRR and Sensitivity Analyses
Scenario NPV / 1
(‘000 Taka) EIRR (%)
SI / 2 SV / 3 %
Change
Base Case 1,223,379 88.17% 10% Increase in Capital Costs 1,192,269 81.81% 0.83 120% 10% 10% Increase in O&M Costs 1,216,168 87.80% 0.05 2088% 10% 10% Decrease in Benefits 1,062,720 80.79% 0.97 103% 10% Project Benefits Delayed by One Year 1,041,529 59.12%
1/ NPV = Net Present Value discounted at EOCC 2/ SI = Sensitivity Indicator (ratio of % change in EIRR above the cut‐off rate of EOCC to % change in a variable) 3/ SV = Switching Value (% change in a variable to reduce the EIRR to the cut‐off rate of EOCC) Source: Consultant’s calculation
Based on the results above, it can be concluded that the proposed component is economically viable under the base case scenario and also under adverse changes in conditions. The
11 Each household served is assumed to have one income earner; income is assumed at an average rate of Taka 300/day;3 sick days annually are assumed to be avoidedequivalent to 1% of assumed annual workdays of 300.
12 Source: 2007 Health, Nutrition and Population Statistics for Bangladesh, World Bank website.

TA 7231-BAN: City Region Development Project Final Report
September 2010 Chapter 9-26
sensitivity analysis indicates that the proposed component is most sensitive to delay in project benefits and reduction in benefits, but remains well above the EOCC.
14. Financial Assessment
14.1 Methodology and Assumptions Financial analysis hasbeen undertaken in accordance with the ADB's Framework for the Economic and Financial Appraisal of Urban Development Sector Projects (January 1994) and the Guidelines on the Financial Governance and Management of Investment Projects Financed by the ADB (January 2002). Under the ADB guidelines, financial internal rate of return (FIRR) calculations should be carried out for revenue generating subprojects.13 For non-revenue generating subprojects, such as the roads and drainage sub-component, financial internal rate of return (FIRR) calculations are not required, though economic analysis is undertaken.
The following approach and assumptions have been used in the analysis: All prices are expressed in 2010 prices and calculation of financial internal rate of return (FIRR) is conducted at 2010 constant price; An average exchange rate of Taka69 per US$1.00 is employed when converting foreign exchange costs to local currency equivalent; Financial prices of capital works and annual operation and maintenance are based on the financial cost estimates of the technical team; Price contingencies and interest during construction (as a result of any debt financing) are excluded in the calculation of FIRR but physical contingencies are included because they represent real consumption of resources; Project sub-component for water supply and sanitation is assumed to be financed by 50% grant and 50% subsidiary loan in local currency from the central government to the implementing agency; roads and drainage sub-component is assumed to be financed by 100% grant from the central government; subsidiary loan is assumed to have a repayment period of 25 years, inclusive of a 3 year grace period, at an interest rate of 5% per annum; The financial opportunity cost of capital (FOCC) of the grant is assumed at 10% per annum14; Local inflation factor is assumed at 6.5% in 2010 and 6% thereafter15; foreign inflation factor is assumed at 1.5% in 2010, 0.7% in 2011 and 0.5% thereafter Financial projections of income statement and cash flow statement are done and presented on current price basis applying the assumed inflation factors.
14.2 Financial Analysis and Sustainability Solid waste management service is considered a revenue generating service. However, solid waste management service of the municipality is presently paid for through the conservancy element of the property tax levied by the municipality. All property owners are liable to pay the
13 Examples are: water supply, environmental sanitation and low‐income housing. 14 Approximated by interest rate of 10‐year national government bond. 15 ADB estimated inflation factors for Bangladesh.

TA 7231-BAN: City Region Development Project Final Report
September 2010 Chapter 9-27
conservancy element of the property tax even without the project component. With no incremental revenue that accrues as a result of the project component, no FIRR can be calculated.
Revenues earned from the conservancy element of property tax are not ring-fenced to be spent specifically for solid waste management expenditures only. All forms of taxes and fees collected by the municipality form part of the general fund which will be used to pay all of the municipality’s recurring and capital expenditures. The financial analysis then is on the implementing agency’s ability to generate funds to maintain adequately the project component’s and other municipal services’ facilities, and meet the municipality’s financial obligations, including debt service payments.
Project component segment of primary collection, secondary collection and transport of wastes collected is assumed to be financed by 50% grant and 50% subsidiary loan in local currency from the central government to the implementing agency. Subsidiary loan is assumed to have a repayment period of 10 years, inclusive of a 3 year grace period, at an interest rate of 5% per annum. Sanitary landfill portion is assumed to be financed by 100% grant from the central government.
The analysis of the implementing agency’s financial performance comprises review of past fiscal condition (FY2005 to FY2009) and the forecast of fiscal condition of the agency in the long term.16The fiscal condition of the agency in the long term has been projected based on the following factors: growth trends over the past 5 year period, assumed annual inflation rate, on-going and planned development programs, future improvement action plans, and consultant’s own estimates.
The forecasted fiscal condition (see table below) shows that the agency has the ability to generate funds to maintain adequately the project component’s and other municipal services’ facilities, and meet the entity’s financial obligations, including debt service payments. Adequate funds will be available to operate and maintain the infrastructure facilities sustainably. However, availability of funds of the implementing agency would require that the LGD of the Ministry of LGRDC periodically review and update the model tax schedule which regulates the taxes and fees that municipalities can levy and collect to keep pace with the rising costs of municipal administration and services and maintenance of facilities.
The main risks associated with the project related to financial aspects are: i) low collection efficiency of local taxes and fees; ii) uncertainty regarding adjustment of local taxes and fees by the LGD necessary to ensure financial sustainability of the project component and other municipal services; and iii) inadequate funding of the right level of operations and maintenance of the project component and other municipal services. The risks will be mitigated through a periodic review of tax collection and other financial performance, budget monitoring and variance analysis, and formulation of improvement action plan as a result of the periodic review and analysis.
16 Detailed financial performance of implementing agencies are discussed in a separate report called “Financial Performance Assessment”.

TA 7231-BAN: City Region Development Project Final Report
September 2010 Chapter 9-28
Narayanganj Pourashava Projected Fiscal Condition
Yr 1 Yr 2 Yr 3 Yr 4 Yr 5 Yr 6 Yr 7 Yr 8 Yr 9 Yr 10 Yr 11 Yr 12 Yr 13 Yr 14 Yr 15RevenueOwn-Source Revenue
i) Property taxes and rates 32,596,602 42,880,054 45,987,596 49,313,676 52,873,330 56,682,613 74,515,345 79,863,891 85,586,007 91,707,267 98,254,969 129,090,305 136,835,723 145,045,867 153,748,619ii) Tax on transfer of immovable property ownership 8,938,615 9,832,477 10,815,725 11,897,297 13,087,027 14,395,729 15,835,302 17,418,833 19,160,716 21,076,788 23,184,466 25,502,913 28,053,204 30,858,525 33,944,377iii) Business and other (non-property) taxes 16,594,820 19,084,043 21,946,649 25,238,646 29,024,443 33,378,110 38,384,826 44,142,550 50,763,933 58,378,523 67,135,301 77,205,596 88,786,436 102,104,401 117,420,061iv) Fees, rents and other income 83,480,777 96,002,894 110,403,328 126,963,827 146,008,401 167,909,661 193,096,110 222,060,526 255,369,605 293,675,046 337,726,303 388,385,249 446,643,036 513,639,491 590,685,415
Sub-Total Own-Source Revenue 141,610,814 167,799,467 189,153,298 213,413,446 240,993,201 272,366,113 321,831,584 363,485,801 410,880,262 464,837,624 526,301,040 620,184,063 700,318,400 791,648,284 895,798,472Non-Development Grants 2,000,000 2,120,000 2,247,200 2,382,032 2,524,954 2,676,451 2,837,038 3,007,261 3,187,696 3,378,958 3,581,695 3,796,597 4,024,393 4,265,857 4,521,808Sub-Total Recurrent Revenue 143,610,814 169,919,467 191,400,498 215,795,478 243,518,155 275,042,564 324,668,622 366,493,061 414,067,958 468,216,582 529,882,735 623,980,660 704,342,792 795,914,141 900,320,280Development Grants 13,000,000 52,515,282 14,606,800 15,483,208 16,412,200 17,396,933 18,440,748 19,547,193 20,720,025 21,963,226 23,281,020 24,677,881 26,158,554 27,728,067 29,391,751Loan and Other Receipts 0 38,735,282 0 0 0 0 0 0 0 0 0 0 0 0 0Total Revenue 156,610,814 261,170,032 206,007,298 231,278,686 259,930,355 292,439,497 343,109,371 386,040,255 434,787,983 490,179,808 553,163,755 648,658,542 730,501,347 823,642,208 929,712,032ExpendituresRecurrent Expenditure
i) Personnel costs 20,918,016 22,173,097 23,503,482 24,913,691 26,408,513 27,993,024 29,672,605 31,452,961 33,340,139 35,340,547 37,460,980 39,708,639 42,091,157 44,616,627 47,293,624ii) Other recurrent expenditures 20,953,013 29,017,144 34,278,278 40,559,102 48,061,601 57,028,041 67,749,016 80,573,107 95,918,474 114,286,759 136,279,777 162,619,538 194,172,280 231,977,300 277,281,558
Sub-Total Recurrent Expenditures 41,871,028 51,190,240 57,781,761 65,472,794 74,470,114 85,021,065 97,421,620 112,026,068 129,258,613 149,627,307 173,740,757 202,328,177 236,263,437 276,593,927 324,575,182Development Expendtures 100,000,000 202,470,565 140,000,000 155,000,000 170,000,000 170,000,000 170,000,000 170,000,000 291,502,271 260,000,000 360,000,000 410,000,000 460,000,000 510,000,000 560,000,000Loan Repayment and Other Disbursements 2,700,000 0 1,936,764 7,470,376 7,193,695 6,917,015 6,640,334 6,363,654 6,086,973 5,810,292 0 0 0 0 0Total Expenditures 144,571,028 253,660,805 199,718,525 227,943,170 251,663,810 261,938,079 274,061,955 288,389,722 426,847,857 415,437,599 533,740,757 612,328,177 696,263,437 786,593,927 884,575,182Revenue Surplus (Deficit) 12,039,786 7,509,227 6,288,773 3,335,517 8,266,546 30,501,418 69,047,416 97,650,533 7,940,126 74,742,209 19,422,998 36,330,364 34,237,909 37,048,281 45,136,849Opening Balance 50,471,004 62,510,790 70,020,016 76,308,789 79,644,306 87,910,852 118,412,269 187,459,686 285,110,218 293,050,344 367,792,554 387,215,552 423,545,916 457,783,826 494,832,107Closing Balance 62,510,790 70,020,016 76,308,789 79,644,306 87,910,852 118,412,269 187,459,686 285,110,218 293,050,344 367,792,554 387,215,552 423,545,916 457,783,826 494,832,107 539,968,957
Financial Ratios and IndicatorsProperty Tax Collection Efficiency (%) 84% 85% 86% 87% 88% 89% 90% 91% 92% 93% 94% 95% 95% 95% 95%Operating Ratio /1 0.29 0.30 0.30 0.30 0.31 0.31 0.30 0.31 0.31 0.32 0.33 0.32 0.34 0.35 0.36Total Revenue - Year on Year Growth (%) 20% 67% -21% 12% 12% 13% 17% 13% 13% 13% 13% 17% 13% 13% 13%Total Expenditures - Year on Year Growth (%) -15% 75% -21% 14% 10% 4% 5% 5% 48% -3% 28% 15% 14% 13% 12%Own-Source Revenue - Year on Year Growth (%) 16% 18% 13% 13% 13% 13% 18% 13% 13% 13% 13% 18% 13% 13% 13%Share to Total Revenue (%):
Total own-source revenue 90% 64% 92% 92% 93% 93% 94% 94% 95% 95% 95% 96% 96% 96% 96%Non-development grants 1% 1% 1% 1% 1% 1% 1% 1% 1% 1% 1% 1% 1% 1% 0%Development grants 8% 20% 7% 7% 6% 6% 5% 5% 5% 4% 4% 4% 4% 3% 3%Loan and other receipts 0% 15% 0% 0% 0% 0% 0% 0% 0% 0% 0% 0% 0% 0% 0%
Property Taxes to Total Own-Source Revenue (%) 23% 26% 24% 23% 22% 21% 23% 22% 21% 20% 19% 21% 20% 18% 17%Share to Total Expenditures (%):
Personnel costs 14% 9% 12% 11% 10% 11% 11% 11% 8% 9% 7% 6% 6% 6% 5%Other recurrent expenditures 14% 11% 17% 18% 19% 22% 25% 28% 22% 28% 26% 27% 28% 29% 31%Development expenditures 69% 80% 70% 68% 68% 65% 62% 59% 68% 63% 67% 67% 66% 65% 63%Loan repayment and other disbursements 2% 0% 1% 3% 3% 3% 2% 2% 1% 1% 0% 0% 0% 0% 0%
Personnel to Total Recurrent Expenditures (%) 50% 43% 41% 38% 35% 33% 30% 28% 26% 24% 22% 20% 18% 16% 15%1/ Operating Ratio = Recurrent Expenditures divided by Recurrent Revenues
Revenue and Expenditure Statement (in Taka) <========== Projection ==========>
Source: Consultant’s Estimates

TA 7231-BAN: City Region Development Project Final Report
September 2010 Chapter 9-29
Annex A - Detailed Base Cost Estimates Cpt. Unit Totals No. Description Unit Quantity Rate (US$)
(US$) (inc tax) 1 Project Preparation 1.1 Detailed Design and Preparation LS 1 396,500 396,500 1.2 Capacity Building, Training and Awareness LS 1 113,043 113,043 TOTAL FOR COMPONENT 1 509,543 2 Controlled Landfill and Compost Plant 2.1 Construction of Controlled Landfill LS 1 507,246.38 507,246 2.2 Construction of Compost Plant LS 1 217,391.30 217,391 2.3 Survey and Soil Investigation LS 1 7,246.38 7,246 2.4 Equipments 2.4.1 Excavator No 1 253,623.19 253,623 2.4.2 Bulldozer No 1 253,623.19 253,623 2.4.3 Weigh Bridge No 1 21,739.13 21,739 Sub‐Total 528,986 TOTAL FOR COMPONENT 2 1260870 3 Primary Collection 3.1 Trolley for road sweeping No 161.658 115.94 18,743 3.2 Trolley for drain cleaning No 107.772 115.94 12,495 3.3 Vans for primary collection No 150 362.32 54,348 3.4 Household bins No 64663.2 1.09 70,286 3.5 Van bins No 900 14.49 13,043 TOTAL FOR COMPONENT 3 168,916 4 Secondary Collection 4.1 Trucks No 5 36,231.88 181,159 4.2 Small Transfer Station No 6 14,492.75 86,957 TOTAL FOR COMPONENT 4 181,159 TOTAL COSTS 2120488 Contingency 5% 106024 COSTS + CONTINGENCY 2226512 Assumed Exchange Rate USD = BDT 69 Note:
LS = Lump Sum

TA 7231-BAN: City Region Development Project Final Report
September 2010 Chapter 10-1
Sub-Project: 7
ECONOMIC EFFICIENCY – DRAINAGE UPGRADING AND FLOOD MANAGEMENT (KHULNA CITY CORPORATION)

TA 7231-BAN: City Region Development Project Final Report
September 2010 Chapter 10-2
Table of Contents 1. Purpose and Background ......................................................................................... 3
2. The Policy Context ................................................................................................... 3
3. Situation Analysis: .................................................................................................... 5 3.1 General ........................................................................................................................ 5 3.2 Drainage and Flood Management ................................................................................ 6
4. Recent and Current Studies: .................................................................................. 18 4.1 CDIA – Support for Khulna City Corporation .............................................................. 18 4.2 Strengthening the Resilience of the Water Sector in Khulna to Climate Change (SRWS) ................................................................................................................................ 19 4.3 Development of Infrastructure Facilities, Drainage Network System and Water Supply System for Khulna City. ........................................................................................................ 19
5. Project Vision and Objectives ................................................................................. 19
6. The Proposal – Description .................................................................................... 20 6.1 General ...................................................................................................................... 20 6.2 Detailed Design and Project Preparation.................................................................... 24 6.3 Implementation .......................................................................................................... 24 6.4 Community and Business Dislocation ........................................................................ 26
7. The Project Component Costs ............................................................................... 26
8. Benefits .................................................................................................................. 27
9. Replication ............................................................................................................. 27
10. Economic Assessment ........................................................................................... 27 10.1 Methodology and Assumptions ............................................................................... 27 10.2 Economic Benefits .................................................................................................. 28 10.3 Economic Analysis and Sustainability ..................................................................... 28
11. Financial Assessment ............................................................................................ 29 11.1 Methodology and Assumptions ............................................................................... 29 11.2 Financial Analysis and Sustainability ...................................................................... 30
Annex A – Cities Development Initiative For Asia (CDIA) - Summary Of Recommendations For Local Drainage Upgrading Works ............................................ 32
Annex B - Typical Drainage Profile and Other Works ................................................... 34
Annex C- Detailed Base Cost Estimates ....................................................................... 45
Annex D - List of Drainage Improvement by KCC ......................................................... 48

TA 7231-BAN: City Region Development Project Final Report
September 2010 Chapter 10-3
1. Purpose and Background This Sub-Project provides a Feasibility Assessment (Assessment) for drainage upgrading and flood management improvements in the Khulna City area. The Assessment has been prepared following discussions with the representatives of Khulna City Corporation (KCC) and the Bangladesh Water Development Board (BWDB), who are the official management authority for primary watercourses, including the River Mayur and River Hatia.Both KCC and BWDB have expressed in principle support for the Sub-Project. KCC regard better flood drainage and flood management as a municipal priority There were a number of meetings between the ADB consultant team and the Mayor and other representatives from KCC. Professional officers from the KCC have also worked closely with the ADB consultant team in reviewing drainage and flood management issues in the City and in the design of the proposed improvement measures. The Project Component is intended to improve flood management Khulna City, through a comprehensive plan to improve the drainage arrangements with the City area and the related watercourses, including: (i) Improving and laying new local drainage channels within the City area and their connections into the River Mayur; (ii) Improving the profile of the River Mayur; and (iii) Improving river flow management, through better control structures (eg sluice gates). The proposals contained in this Sub-Project build on the outputs from previous and current studies into drainage upgrading and flood management, particularly: (i) Cities Development Initiative for Asia (CDIA) – Support for Khulna City Corporation; and (ii) Strengthening the Resilience of the Water Sector in Khulna to Climate Change (ADB – Technical Assistance). Section 4 refers in detail. It is intended the Sub-Project will be designed and implemented over a fouryear period.
2. The Policy Context
Drainage and Flood Management is governed by a number of strategic national policies. The national policy context expressed at a local level in the KCC area is interpreted through Ordinance number 16, 2008: Existing rules and regulations regarding City Corporation. (Gazette Notification, dated 14th May, 2008)
The main principles relevant to drainage are:
� The corporation will manage sufficient drainage system for discharge of drain water;
� The corporation will construct, operate, maintain and clean the drains for the betterment of health and welfare of city dwellers; and
� The corporation can plan and execute the drainage project if they consider necessary or upon government’s instruction, either from government funds or non-government funds for disposal of drainage water.
At City Region level the Khulna Structure Plan, provides a broad context for the planning of the area of the period 2001 to 2020. The Structure Plan promotes phased urban development in and around Khulna City and its surroundings, together with the upgrading of the existing urban fabric. It is in this context, the Structure Plan acknowledges the importance of better drainage and flood management as a context for new urban development and improved living and working conditions in the existing

TA 7231-BAN: City Region Development Project Final Report
September 2010 Chapter 10-4
urban area. Selected policies and recommendations related to drainage upgrading and flood management from the Structure Plan are shown in Table 1 below. Table 1: Khulna Structure Plan – Policies and Proposals related to Drainage
and Flood Management
Policies and Proposals � Outline of Proposed Drainage Improvement Plan and Formulation of Storm Water
Drainage Improvement Plan; � Conceptual Plan for Phased Implementation of Drainage Improvement Plan; � Improvement Policy and Proposals through Improved Drainage System; � Policies for complementary non-structural measures to protect right of ways for drainage
channels and other aspects; and � Policies for complementary measures for improved Operation and Maintenance of
Drainage System. Proposals � Proposed drainage system should be designed to discharge most of the storm run off by
gravity flow. Pumping only where necessary; � Future drainage system for most areas will be westwards form the main urban area (and
towards the Khulna-Jessore Drainage Rehabilitation Project area; � Priority programme should be recommended for implementation to reduce suffering for
residents and to mitigate major drainage problems in the core and semi core urban areas where there are the highest population densities;
� A high degree of close coordination with Department of Public Health Engineering (DPHE), BWDB and LGED and other utility organizations should be maintained during the project implementation stages so that disruptions to services are minimised; and
� For improvement to the present drainage situation was proposed to take up the following improvement works: a) Construction of additional drainage sluices at Tootpara and Halatola. b) Construction of new drains in Boyra, Rayermohol, nodal point of Khan Jahan Ali and KDA avenue, end point of Daulatpur, Torun Sena Sarak, Kha para, Anjuman road, Dattabari slum, Mistrypar c) Cleaning and maintenance of all existing drains.
The national policy, context expressed at a strategic level, is through BWDB, whose mandate covers strategic planning and management of the primary watercourses in Bangladesh. In particular BWDB are responsible for major development programmes inflood control, drainage and irrigation, which include large scale works involving construction of dams, barrages, river embankments, strategic drainage systems and irrigation canals. BWDB have local representation in Khulna with an office of some 53 professionals and 150 non-technical staff.
Unfortunately interpretation of the national and local policy context through an integrated approach to improvements to the drainage system in the Khulna City has been held back by resource and financial constraints. To this extent BWDB have concentrated their improvement and maintenance programme on the primary watercourses, where the potential flooding problems are more acute. The mandate of KCC, includes for local drainage1 (as specified above)and related sectors, such as public health, where it is responsible for health management of the City. Again resource and financial constraints have held back KCC’s capacity to carry
1 Khulna Municipal Ordinance (1984) prescribes the mandate of the KCC, including responsibilities for local drainage and public health.

TA 7231-BAN: City Region Development Project Final Report
September 2010 Chapter 10-5
out a comprehensive programme of local drainage improvements, although it is noted that KCC is currently improving the local drainage network through a project entitled “Development of Infrastructure Facilities, Drainage Network System and Water Supply System for Khulna City”. The project is funded by the Government of Bangladesh (GoB) with a total value of USD7.22 million of which some 20.90% (USD1.51 million) is allocated for local drainage improvements (Section 4.3 also refers).
3. Situation Analysis:
3.1 General
Khulna is the third largest City in Bangladesh and covers an area of covers an area of 45sq kms which includes the thanas of Daulatpur, Khalispur, Sonadanga and Khulna Sadar. The built up area consists of approximately 46% residential housing, 5% industrial land and 5% commercial area. The remaining built up land includes roads and transport facilities, government and community uses, parks and open space and defence land/facilities. KCC have submitted a formal proposal to the GoB extend the City boundaries to match the entire area included in the Khulna Master Plan area located to the West of the Rupsha River, up to the by-pass road. At the 2001 census the recorded population for Khulna City was 770,498. The current population is estimated to be nearly 1 million and this is expected to grow to sum 1,11 million 2015 and 1.24 million by 20202. This assumes a conservative annual growth rate of 2.35% per year. In the event that the regional growth potential of the area can be achieved (Chapter 2 refers), then it is plausible that the growth rate would be significantly higher. In 2005, the population in informal housing was estimated at just under 189,000 (37,800 households). This equates to approximately 20% of total Khulna population. Informal housing densities are very high at around 132,000 persons per sq km. Over 90% of the informal housing population experience room occupancies of 4 or 5 persons. Some 14% of the informal housing areas work in local industries The main industrial areas are Daulatpur, Khalispur, Rupsha Stand Road and the Labonchara area. Large and medium scale industries include jute manufacture and jute goods, hard board, food and beverage, brick manufacturing, and metal fabricating. The Daulatpur industrial belt is an old industrial area, where industries mostly jute and jute bailing and a number of wire making houses were developed in early 1960’s, but currently many are closed down and industrial activity in the area is in decline. The Khalishpur industrial area accommodates four jute and jute based industries and one hard board mill as well as a number of food processing and chemical industries. Rupsha Stand Road and the Labonchara area include the Khulna Shipyard, the Bangladesh
2Population estimates based on BBS,2008 Statistical Pocket book of Bangladesh and key indicators sample vital registration system (SVRS), www.bbs.gov.bd

TA 7231-BAN: City Region Development Project Final Report
September 2010 Chapter 10-6
Oxygen Factory and number of food and fish (non-shrimp) processing plan, as well as brick manufacturing plants.
The most important business area lies in the central area of the city extending from the Hadis park area in the east up to the railway land on the west, the River Bhairab in the north and up to Khan A Sabur Road and Khan Jahan Ali Road in the south. Large commercial establishments of different categories are concentrated in this area of 70 acres.3 Other large commercial concentrations are at Rupsha. There are also extensive ribbon commercial and retail developments along the principle roads, together with an extensive range of retail and wholesale markets spread across the urban area. The majority of these residential, industrial and commercial land uses are vulnerable to varying degrees of flooding.
3.2 Drainage and Flood Management
Khulna City has developed in a linear pattern running north-south and parallel to the rivers running parallel to the main built-up areas. The largest watercourse is the River Rupsha to the west of the main built-up area. Its tributary the River is also to the west. To the east are the River Mayur/Hatia and the smaller Khudi Khai. The City is built on low lying land, with an average level of 2.5 meters above sea level. A long narrow strip of land drains into the River Rupsha, but most of the urban land slopes gently from west to east into the River Mayur. Levels at the outfalls into the River Mayur are around 1.52meters above sea level. The City’s local drainage system totals 420kms of which 45kms are main drain, 290kms are concrete secondary and tertiary drains, 34kms of semi-pucca drains and 51 kms are earthen. Generally the City is built on low lying area and is therefore vulnerable to both local inundation, during periods of heavy rainfall and risks from overflow from the adjacent rivers, particularly along its western edge. Risks are clearly heightened when high tides coincide with periods of rainfall intensity. Poor maintenance of some parts of the primary watercourse system, particularly the River Mayur have exacerbated the risks of inundation. The local drainage network in Khulna City has largely been developed in an incremental manner responding to local needs, rather than as part of a comprehensive and integrated plan. At the same time maintenance has generally failed to keep pace with needs and blockages are frequent, thus leading to regular local flooding problems. The local drainage system accommodates liquid wastewater from a full range of land uses, including residential, commercial and industrial development. It is understood that much of this waste is untreated; particularly from the informal housing areas and from
3 Business survey in Khulna carried out by PPTA indicates some 200 manufacturing establishments with more than 10 employees in Khulna city, i.e. 20% of the total industries listed in greater Khulna and Jessore. Along Khan Jahan Ali Road some 85 manufacturing establishments are concentrated.

TA 7231-BAN: City Region Development Project Final Report
September 2010 Chapter 10-7
illegal industrial discharges. This results in a public health risk, a risk which is seriously exacerbated during periods of inundation from flood water. Flood inundation is occurring due to localized storm rainfall affecting drainage system. The main areas affected by inundation are: (i) Natun Bazar; (ii) Rupsha; (iii) Tutpara; (iv) The Shipyards; (v) East Bania Khamar; (vi) Boyra; (vii) Rayer Mahal; (viii) Khan A Sabur Road; (ix) Nodal point of Jhan Jahan Ali Road and KDA Avenue; (x) Samsur Rahman Road; (xi) Ahsan Ahmed Road; (xii) The Picture Palace area; (xiii) Fulbari Gate; and (xiv) Taligati. Figure 1 illustrates the location of these areas and Figure 2 provides some supporting photographic evidence of flooding in Khulna City.

TA 7231-BAN: City Region Development Project Final Report
September 2010 Chapter 10-8
Figure 1 – Existing Flood Conditions

TA 7231-BAN: City Region Development ProjectFinal Report Figure 2 – These photographs illustrates some of the problems that have been caused through lack of systematic design and maintenance programme for the primary water courses and the local drainage system and extent of flood in KCC area
Figure 2.1 - Siltation of the Mayur River (source: CDIA report)
The Mayur River (known as Khudi Khal in its northern section) is 15km long, 27m wide and 10m deep; it is situated to the west of Khulna City. This river is connected to many drainage outlets and canals that receive water from different parts of city by drains.The river has now largely lost its flow due tosiltation, encroachment and man-made obstructions. Moreover, the connecting natural canals passing through the outskirt of the city have been occupied in many placedue to urban development in the recent years. As a result, water logging is inevitable due to heavy monsoon rains. The river needs very strong and collective initiatives with support from all levels for mass re-excavation and rehabilitation.
Project
These photographs illustrates some of the problems that have been caused through lack of systematic design and maintenance programme for the primary water courses and the local drainage system and extent of flood in KCC area
he Mayur River (source: CDIA report)
The Mayur River (known as Khudi Khal in its northern section) is 15km long, 27m wide and 10m deep; it is situated to the west of Khulna City. This river is connected to many drainage outlets and canals that
water from different parts of city by drains. due tosiltation,
. Moreover, the connecting natural canals passing through the outskirt of the city have been occupied in many places due to urban development in the recent years. As a result, water logging is inevitable due to heavy
The river needs very strong and collective initiatives excavation and
These photographs illustrates some of the problems that have been caused through lack of systematic design and maintenance programme for the primary water courses and the local

TA 7231-BAN: City Region Development Project Final Report
September 2010 Chapter 10-10
Figure 2.2 - Existing situation of Sluices and Rupsha River Outfalls (source: CDIA report)
Siltation, mal-functioning sluice gates and encroachment has seriously affected the effectiveness of the Rupsha River outfalls which drain much of the main commercial area.
1 no. Custom Ghat
2 no. Custom Ghat
A Fish Ltd.
Rupsha Ghat
Motia khali
Labonchura

TA 7231-BAN: City Region Development ProjectFinal Report
Figure 2.3 - Poor Design of Drainage System (source: CDIA report)
Poor design of drainage channels.
Some drains in the city areas are not well connected to major drains. As a result, these drains are unable to drain the collected water to the designated outlet. So water logging occurs even for heavy rains for short period. There is thus no integrated drainage system.
Due to poor workmanship and lack of monitoring, some drains do not maintain the necessary grade even from the beginning, as a result required flow can not be ensured, which entails accelerated siltation.
Lack of lining resulting in a continuous process of degradation.
Project
Poor Design of Drainage System (source: CDIA report)
Some drains in the city areas are not well connected to major drains. As a result, these drains are unable to drain the collected water to the designated outlet. So water logging occurs even for heavy rains for short period. There is
Due to poor workmanship and lack of monitoring, some drains do not maintain the necessary grade even from the beginning, as a result required flow can not be ensured, which entails
inuous process of

TA 7231-BAN: City Region Development Project Final Report
September 2010 Chapter 10-12
Figure 2.4 - Obstruction to the Smooth Flow of Existing Drains (source: CDIA report)
Drains are often obstructed by:
- Extension of Boundary walls, buildings and other infrastructures
- Electrical Light Post
- T & T Cables
- Water pipes
- Ramp for personal use
- Temporary and permanent structures on the drain
- The indiscriminate disposal of household waste.

TA 7231-BAN: City Region Development Project Final Report
September 2010 Chapter 10-13
Figure 2.5 - Poor Maintenance of Drains (source: CDIA report)
Due to the covering of drains with heavy stabs, their cleaning for routine maintenance in many places is next to impossible with the present logistics available to KCC.
During the last decade, some drains were not cleaned, as a results these drains already lost the functional utility due to siltation.
The mismanagement of solid waste and lack of people awareness and commitment, the wastes just thrown away in the nearby drains, which blocks the natural water flow of drain. Allied to the lack of routine maintenance, drains become completely clogged.
The sludge removed from the drains is often deposited at the side of the drains - some portion of which returns to the drain before its removal.

TA 7231-BAN: City Region Development Project Final Report
Figure 2.6 - Flooding in Khulna (source: CDIA report)
Ahsan Ahmed road, ward no. 23 Boyra, ward no 16

TA 7231-BAN: City Region Development Project Final Report
Picture palace/Dakbangla area Khan A Sabur road

TA 7231-BAN: City Region Development Project Final Report
The lack of a comprehensive and integrated approach to drainage and flood management in Khulna City and the other urban areas within the catchment area of the Rupsa-Bhairab-Mayur-Haitariver systems has led to large parts of Khulna being susceptible to regular flooding. This includes most of the built-up area, sandwiched
Nodal point of Khan Jahan Ali road & KDA Avenue Rupsha area, ward no. 29

TA 7231-BAN: City Region Development Project Final Report
September 2010 Chapter 10-17
between the Rivers Rupsha and Mayur, including much of the commercial core, and many of the residential areas, which experience regular and extensive flooding during the monsoon season. Altogether some 70% of the city is identified as prone to flooding and around 9% being flooded more than 10 times every year4. The Khulna Master Plan identifies the entire Khulna Sadar and large parts of Khalispur Thana as being prone to regular flooding, with almost two thirds of households having no proper drainage in and around their premises. Additionally it is noted that approximately 40% of informal housing area households experienced severe and/or regular flooding5. It is inevitable the situation will worsen as a result of further urbanization in the absence of a comprehensive drainage and flood management plan. Without such a plan and the investment to go with it climate change influences will also worsen the situation over time6. This is confirmed by the research contained in the Strengthening the Resilience of the Water Sector in Khulna to Climate Change Study, which shows that some 22% of Khulna is under harmful flood depth (ie greater than 30cms) utilising a 10 year return period event factor. This increases to 30% for 2030 and 54% for 2050. Key Drainage and Flood Management Problems
From the evidence of the discussions and site visits with representatives of KCC and BWDB, together with site visits and photographic records it is clear that there is an urgent need for a comprehensive plan and investment in better drainage facilities and flood management in Khulna City and the surrounding primary watercourses. The justification for this investment is to prevent the detrimental economic, social and environmental impacts of severe and recurrent flooding, including: (i) Damage to property and household assets, together with degraded living conditions; (ii) Loss of income for workers affected by floods and/or temporary employment closures; (iv) Increased public health risks from polluted water in flooded area; (ii) Economic damage to businesses which may be inundated and/or may not be able to use the surrounding road system; and (v) Premature deterioration of road and footpath networks. Typically it will be the urban poor/informal housing areas that are worst affected by impacts (i) (ii) and (iii) above. In summary there are a number of significant drainage and flood protectionproblems to be addressed by this Sub-Project (Figures 1 and 2 refer). They are:
� Siltation and encroachment of the River Mayur which prevents it from
accommodating run off from the urban area. This includes: (i) Evidence of illegal dumping; (ii) Illegal occupation of the natural river bed area for residential development and other land uses (Section 6.4 refers in detail); and (iii) Uncontrolled vegetation growth;
� The inadequate operation of sluice gates (and closure of these gates at high tides), which fail to prevent backing up of flood waters during high tides;
� The absence of properly constructed outfalls from the local drainage system into the River Mayur (and other primary watercourses), which it is understood are
4Secondary Towns Integrated Flood Protection Project 5 Slums of Urban Bangladesh - Mapping and Census 2005 6 Strengthening the Resilience of the Water Sector in Khulna to Climate Change (ADB TA – 2010).

TA 7231-BAN: City Region Development Project Final Report
September 2010 Chapter 10-18
occasionally set at lower levels to the primary watercourse (ie River Mayur) thus causing water to back-up in the local drainage system;
� General under-sizing of local drainage channel design and the absence of culverts at key locations resulting in regular incidence of flooding within the built-up areas, particularly during periods of high rainfall;
� The absence of an integrated design for the local drainage system, such that the connections between tertiary, secondary and primary drains are inadequate, restricting the ability of the system to discharge flood waters, again resulting in regular incidence of flooding within the built-up areas;
� The shortage of resources and finance for operation and maintenance of the existing drainage systems, exacerbating the capacity of the primary watercourses and the local drainage system to accommodate flows, particularly during periods of high rainfall;
� The public health risks caused by the discharge of domestic, commercial and industrial liquid waste into the local drainage channels are significantly increased during periods of flood inundation, when polluted water may directly affect homes, particularly the informal housing areas.
4. Recent and Current Studies:
As stated in Section 1, the proposals contained in this Sub-Project build on the outputs from previous and current studies into drainage upgrading and flood management, particularly: (i) Cities Development Initiative for Asia (CDIA) – Support for Khulna City Corporation; and (ii) Strengthening the Resilience of the Water Sector in Khulna to Climate Change (ADB – Technical Assistance). The consultant team have also taken account of the KCC initiative for improving the local drainage network under the project entitled “Development of Infrastructure Facilities, Drainage Network System and Water Supply System for Khulna City”.
4.1 CDIA – Support for Khulna City Corporation
This Cities Development Initiative Asia (CDIA) Study was undertaken in 2009 by a team of international and national consultants appointed directly by the ADB and who worked closely with a team of engineers and other officials form KCC. The Study identified problems of the existing local drainage system, causes of flooding and there detrimental impacts on the population of Khulna city and recommend measures for the improvement of drainage system. Notably the Study did not consider the outfall channels into the Rivers Mayur and Hatia and the Khudi Khal. The Study proposals were concentrated in five areas: (i) The Old Commercial Area; (ii) The New Commercial Area; (iii) The Boyra Area; (iv) The Khalispur-Mujgunni-Bastahara Area; and (v) The Telgati Area7 (including Khulna University of Engineering Technology and the Khulna Technical Training College), which collectively covered a large proportion of the City. This included improved drainage provision for some of the City’s low cost/informal housing areas (Wards 10,11 and 12). Estimates in the CDIA Study suggest some 720,000 persons and most of the City’s commercial and industrial areas will benefit from the local drainage proposals. Summary descriptions of the proposed improvement works for each of the five areas are shown at Annex A.
7 Parts of the Telgati Area are located north of the KCC area, but included within the proposed KCC extension area.

TA 7231-BAN: City Region Development Project Final Report
September 2010 Chapter 10-19
The proposed local drainage improvements included a range of improvements to the existing drainage channels/watercourses, new culverts, sluice gate repairs and new sluice gates, improvements into the River Rupsha, construction of new drains and repairs to existing drains. The outputs and recommendations of the CDIA Study have been taken into account by the consultant team and where appropriate included in the proposed local drainage improvements and the improvements to be included in the Sub-Project. The total cost for design and implementation of the proposals was estimated at some USD11.23 million. The proposals have not yet been implemented, although some aspects are included in the local drainage improvements being managed separately by KCC (Section 4.3 refers).
4.2 Strengthening the Resilience of the Water Sector in Khulna to Climate Change (SRWS)
The SRWS Study assesses the flooding and water logging conditions of Khulna City and the effects of climate change through mathematical modelling and makes recommendations for flood management improvements. The Study describes the current flood inundation situation makes forecasts for the years 2030 and 2050 (Section 3 refers), taking into account climate change impacts. In a worse case scenario the Study shows that some 54% of the Khulna City, in the year 2050, would be affected by “harmful flooding” (ie over 30cms in depth). The Study further describes and costs a range of structural measures that would be required to ensure that a minimum 80% of the City remains flood free, in with and without a climate change scenarios. Costs, taking into account climate change for the year 2050 vary between USD17 million (5 year return period) and USD 21 million (10 year return period). The proposed structural measures include the following: (i) culvert reconstruction; (ii) re-excavation of existing drains and channel reconstruction; and (iii) sluice gate regulation and new construction. Significantly the structural measures include for dredging of the River Haita and the River Mayur (northern section), but do not include similar proposals for the River Mayur (southern section) and the Khudi Khal. A full list of the various proposals set out in the Study is shown at Annex B.
4.3 Development of Infrastructure Facilities, Drainage Network System and Water Supply System for Khulna City.
The local drainage improvement project managed by KCC comprises of 22.70 kms construction of new and mostly secondary drains in all the 31 wards of KCC area. This also includes secondary drains in low cost housing areas, within Ward nos 10, 11 and 12, which were recommended in CDIA report (Section 4.1 refers). Further details of KCC’s drainage improvement project are shown in Appendix F. The consultant team has taken account of these committed local drainage improvements, when determining the proposed drainage upgrading and flood management improvements for inclusion in this Sub-Project.
5. Project Vision and Objectives Our vision for this Sub-Project is to provide a sustainable framework for land drainage and flood management in Khulna City, which supports: (i) Better living and working conditions for the project affected community; (ii) Continuity of business operations,

TA 7231-BAN: City Region Development Project Final Report
September 2010 Chapter 10-20
particularly in the commercial and industrial sectors; and (iii) better environmental and public health conditions across the Khulna City area. The vision incorporates a collaborative framework which empowers the community to participate in the design, implementation and monitoring of the proposed improvements and to ensure proper operations and maintenance.
The specific Objectives of this Sub-Project are to:
� Ensure the existing and proposed built-up areas in Khulna City (including the proposed extension areas) incorporate a Comprehensive Drainage System, which is designed and constructed to meet sustainable standards of flood management, taking into account the forecast effects of climate change;
� Ensure that operation and management of the Comprehensive Drainage System ensures that its capacity and its ability to meet sustainable standards of provision is maintained over time;
� Ensure, through regular monitoring that illegal activities which would risk reductions to the capacity of the system to meet sustainable standards of provision are prevented and enforced with particular reference to: (i) illegal dumping in the local drainage channels and watercourses; and (ii) illegal occupation by permanent structures, informal housing and other temporary uses. Implement a fines system to support this objective;
� Coordinate regular monitoring activities with pollution control monitoring, particularly in the commercial and industrial sector to help reduce the scale of illegal wastewater discharges into the local drainage channels and the watercourses;
� Optimise the potential provided by the proposed flood management measures to the primary watercourses, in particular the River Mayur to include recreational river bank walkways as a design feature;
� Establish institutional structures and provide the trained resource and financial means to ensure the operation, management and monitoring activities can be achieved and maintained over time;
� Provide the opportunity for the needs and aspirations of the project affected communities to be met in the design, operation and management of the proposed Comprehensive Drainage System and in particular implement a Community Awareness component in the Sub-Project, which will facilitate this opportunity and provide a resource to assist KCC in monitoring and enforcement; l
6. The Proposal – Description
6.1 General The Sub-Project will have four integrated Components:
a) Dredging, Re-excavation and Lining of Major Outlet Channels, including the River Mayur;
b) Re-excavation and Lining of the Major Link Canals (Khals) to the Primary Watercourses, including the Rivers Mayur and Rupsha;
c) New and Improvements to the Flow Control Structures/Sluice Gates at Primary Watercourses; and
d) Repair, Reconstruction and New Local Drainage Provision.

TA 7231-BAN: City Region Development Project Final Report
September 2010 Chapter 10-21
The activities related to each of the four Components are described below and the spatial context shown on Figure 3. Typical drainage channel profiles other proposed works are shown at Annex B.
Figure 3: Proposed Drainage Upgrading and Flood Management Measures

TA 7231-BAN: City Region Development Project Final Report
September 2010 Chapter 10-22

TA 7231-BAN: City Region Development Project Final Report
September 2010 Chapter 10-23

TA 7231-BAN: City Region Development Project Final Report
September 2010 Chapter 10-24
6.2 Detailed Design and Project Preparation This will include all the detailed design and project preparation activities required to progress implementation of the Sub-Project including: � Supplementary Hydrological Modelling (optional and under discussion with SRWS
consultant team). � Preparation of a Comprehensive Master Plan, illustrating the proposals for a
Comprehensive Drainage System and Flood Management Plan for Khulna City;
� Detailed design of the physical works covering the four main Sub-Project Components listed above (a-d) and to meet the flood management standards defined above;
� Detailed design of the proposed institutional arrangements, including the operation,
maintenance and monitoring procedures;
� Preparation of a Stakeholder Consultation Plan and Community Awareness Programme;
� Specify and prepare detailed designs for recreation walkways and other areas with
recreation potential, where appropriate,
6.3 Implementation This will include the following activities: � Dredging, Re-excavation and Lining of Major Outlet Channels, including the
River Mayur - This includes: (i) Dredging of 6kms of the River Haita; (ii) Dredging, Re-excavation of 15 kms of the River Mayur; and (iii) Re-excavation of 6 kms of Khudi Khal. The works will include treatment of the heavily silted sections of the watercourses, removal of illegally dumped materials, removal of dense surface and underwater vegetation and removal/re-location of illegal land uses.
Figure 4 shows a typical profile for the re-excavation and upgrading of the River Mayur, which includes provisions for improved embankments and walkway. The walkway will serve as a recreation facility and also serve as a maintenance work access.

TA 7231-BAN: City Region Development ProjectFinal Report
� Re-excavation and Lining of the Major Link Canals (Khals) to the Primary Watercourses - This Component will the local drainage system are provided, through a process of relining of the major link canals and watercourses. New drains and culverts will be constructed, where they are necessary. Again thillegally dumped materials, removal of dense surface and underwater vegetation and removal/re-location of illegal land uses.
Project
excavation and Lining of the Major Link Canals (Khals) to the Primary This Component will ensure that essential drainage links between
the local drainage system are provided, through a process of re-excavation and relining of the major link canals and watercourses. New drains and culverts will be constructed, where they are necessary. Again the activities will include removal of illegally dumped materials, removal of dense surface and underwater vegetation and
location of illegal land uses.
excavation and Lining of the Major Link Canals (Khals) to the Primary
ensure that essential drainage links between excavation and re-
lining of the major link canals and watercourses. New drains and culverts will be e activities will include removal of
illegally dumped materials, removal of dense surface and underwater vegetation and

TA 7231-BAN: City Region Development Project Final Report
September 2010 Chapter 10-26
Altogether 12 Khals will be upgraded, with links mainly to the River Mayur and the River Rupsha.
� Upgrading and New Flow Control Structures/Sluice Gates – This Component will be concentrated at the outfalls (entry points) of the Khals when they join the primary watercourses. Works will include the repair of existing sluice gates and sluice valves, new shutters to the slice gates and other associated improvements to the outlets channels, including pump stations.
Altogether it is proposed to upgrade 9 control structures and sluice gates, which are mainly at the entry points to the River Rupsha, including the connection from the River Haita.
� Repair, Reconstruction and New Local Drainage Provision – This Component
which is concentrated on improvements to the local drainage network, will cover a wide range of works, including construction of new drains, reconstruction and repair of existing drainage, network junction improvements, new culverts and a sluice gate. Much of the new construction has direct outfalls into the River Rupsha, the remainder connecting to the existing drainage network or directly into the Khals.
The proposed improvements to the local drainage system are spread across Khulna City, but with concentrations in: (i) Wards 7-8 and 10-13, where it will serve significant areas of low cost housing and industrial development; and (ii) Wards 21-23 and 29. where it will serve a variety of land uses, including residential and commercial uses.
The proposed Community Awareness Programme will also be implemented in association with the above construction activities.
6.4 Community and Business Dislocation Where, residential and business property has to be cleared to implement the drainage upgrading and flood management works then a compensation package will be offered in accordance with ADB guidelines and practice.
7. The Project Component Costs
The total costs for this Project Component (Excluding Detail Design, Study and Capacity Building) are estimated to be in the order of USD 28.56 million. The cost includes implementation of the four construction led Component.Table 2 (below) provides summary cost estimates for this Sub-Project. Table 2 The Sub-Project Cost Estimates
No Components
Cost USD$ (million)
1 Dredging, Re-excavation and Lining of Primary Watercourses (eg River Mayur)
3.14
2 Re-excavation and Lining of Existing Link Canals (Khals) 14.20 3 Upgrading and New Control Structures/Sluice Gates 1.84 4 Repair Reconstruction and New Construction of Local
Drainage 6.75
5 Contingency 2.62 Total Cost 28.56 Nb: Cost Estimate Assumptions

TA 7231-BAN: City Region Development Project Final Report
September 2010 Chapter 10-27
1. All the item wise rates for the project component cost estimates are collected from the current rate schedule of LGED, Khulna.
2. All the drawings to support the assessment of costs are attached as Annex C. 3. Measurements of major channels, canals, sluice gates etc are taken from in the field visits and KCC documents. 4. No costs are so far included for supplementary hydrological modelling as listed in Section 6.2 (Design and
Preparation). This will be determined following further discussions with the ADB Climate Moderation TA Team.
8. Benefits
The following benefits will be accrued from implementation of the Drainage Upgrading and Flood Management Sub-Project in Khulna City, where reduced incidence of flooding will result in: � Better living and working conditions for over 700,000 residents of Khulna City and
others from outside the City (eg people travelling to Khulna for employment); � Potential for improved economic efficiency (and reduction in the loss of business
income) in the commercial and industrial sectors; � Reduced damage to property, infrastructure and other assets; � Reduced exposure to public health risks and environmental pollution during periods
of flood inundation; and � Short-term employment opportunities in construction work during the period of Sub-
Project implementation.
9. Replication
The results and lessons learned from this Sub-Project will lay the foundations for replication for other urban communities, where comprehensive planning and works programmes are required to achieve better land drainage and flood management.
10. Economic Assessment
10.1 Methodology and Assumptions Economic analysis has been conducted in accordance with the ADB’s Guidelines for the Economic Analysis of Projects (1997) and the Framework for the Economic and Financial Appraisal of Urban Development Sector Projects (January 1994). The following approach and assumptions have been used in the analysis: � All prices are expressed in 2010 prices and economic analysis is conducted at 2010
constant price;
� An average exchange rate of Taka 69 per US$1.00 is employed when converting foreign exchange costs to local currency equivalent;
� Economic prices of capital works and annual operation and maintenance are calculated from the financial cost estimates of the technical team, adjusted to allow for transfer payments and to correct for any other market distortions;
� Price contingencies and interest during construction (as a result of any debt financing) are excluded in the calculation of economic internal rate of return (EIRR) but physical contingencies are included because they represent real consumption of resources;

TA 7231-BAN: City Region Development Project Final Report
September 2010 Chapter 10-28
� Taxes and duties are excluded because they represent transfer payments;
� All costs are valued using the domestic price numeraire; tradable inputs, net of duties and taxes, are adjusted by the shadow exchange rate factor of 1.13 while non-tradable inputs (except for unskilled labor), net of duties and taxes, are adjusted by a conversion factor of 0.9; unskilled labor is adjusted by a conversion factor of 0.7 of the market wage rate to estimate the shadow wage rate;8
� The economic opportunity cost of capital (EOCC) is assumed at 12% in real terms; and
� Project component is assumed to have useful economic life of 15 years.
10.2 Economic Benefits The project component will improve the drainage system, reduce flooding and thereby improve the environmental and living conditions and public health in the project area. The improvements may be reflected in three quantifiable benefit streams, namely: i) increased property values; ii) avoided flood damages; and iii) avoided economic disruption. The improvement in the environmental and living conditions may be realized in the amounts people are willing to pay for property either in terms of rent or the purchase price of the property in the project area.9 Property values are assumed to increase by 5% after project completion. The increase in property value is annualized using an annual rent to capital value ratio assumed at 10%. The improvement in the drainage system is assumed to result in avoided property damage assumed conservatively at Taka 500 per household in the project area due to flooding. As a result of the project component, it is also assumed that economic disruption equivalent to an average of one annual productive day of an average head of household could be avoided.10 Other benefits which are not easily quantifiable or could result to double counting and hence not accounted for in the analysis include: health benefits due to reduced water logging from rainwater (the stagnant and contaminated water becomes the source of mosquito breeding), reduced environmental degradation, reduced damage to roads and avoided disruption of commercial and business activities in the project area.
10.3 Economic Analysis and Sustainability The purpose of the economic analysis is to determine if the component’s EIRR exceeds its EOCC, in real terms. If the component’s EIRR exceeds its EOCC, it can be concluded that the component is economically viable. Sensitivity analyses have been undertaken in order to test the robustness of the economic results to adverse changes in conditions. The following adverse changes have been analyzed: � A capital cost overrun of 10%;
� An increase in the O&M cost by 10%;
� A reduction in the benefits by 10%; and
8 Conversion factors for economic shadow pricing are based on recently approved ADB projects in
Bangladesh. 9 Current average land value in the area is estimated at Taka 500,000/katha. One katha is equivalent to
66.9 sq.m.. 10 Income of an average head of household is assumed at an average rate of Taka 230/day.

TA 7231-BAN: City Region Development Project Final Report
September 2010 Chapter 10-29
� Project component benefits delayed by one year.
The results of the economic and sensitivity analysis are shown below. EIRR and Sensitivity Analyses – Drainage and Flood Protection
Scenario NPV / 1
(‘000Taka) EIRR (%) SI / 2 SV / 3 % Change
Base Case 15,814,231 84.53% 10% Increase in Capital Costs 15,672,490 79.98% 0.63 160% 10% 10% Increase in O&M Costs 15,790,955 84.46% 0.01 11033% 10% 10% Decrease in Benefits 14,067,791 79.44% 0.70 143% 10% Project Benefits Delayed by One Year 13,524,769 62.77% 1/ NPV = Net Present Value discounted at EOCC 2/ SI = Sensitivity Indicator (ratio of % change in EIRR above the cut-off rate of EOCC to % change in a variable) 3/ SV = Switching Value (% change in a variable to reduce the EIRR to the cut-off rate of EOCC) Source: Consultant’s calculation
Based on the results above, it can be concluded that the proposed component is economically viable under the base case scenario and also under adverse changes in conditions. The sensitivity analysis indicates that the proposed component is most sensitive to delay in project benefits and reduction in benefits, but remains well above the EOCC. The economic sustainability of the proposed component largely depends on the adequate maintenance of the facilities. Unless the facilities can be maintained adequately, the economic benefits assumed in the analysis will not materialize. The projected financial performance11 of the implementing agency in the long term shows that funds will be available to maintain the facilities adequately. However, availability of funds of the implementing agency would require that the LGD of the Ministry of LGRDC periodically review and update the model tax schedule which regulates the taxes and fees that municipalities can levy and collect to keep pace with the rising costs of municipal administration and services and maintenance of facilities.
11. Financial Assessment
11.1 Methodology and Assumptions Financial analysis has been undertaken in accordance with the ADB's Framework for the Economic and Financial Appraisal of Urban Development Sector Projects (January 1994) and the Guidelines on the Financial Governance and Management of Investment Projects Financed by the ADB (January 2002). Under the ADB guidelines, financial internal rate of return (FIRR) calculations should be carried out for revenue generating subprojects.12 For non-revenue generating subprojects, financial internal rate of return (FIRR) calculations are not required, though economic analysis is undertaken. The project component is considered a non-revenue generating subproject and FIRR is not calculated. The financial analysis then is on the implementing agency’s ability to generate funds to maintain adequately the project component’s and other municipal services’ facilities, and meet the entity’s financial obligations, including debt service payments. The following assumptions have been used in the analysis:
11 Detailed financial performance of implementing agencies are discussed in a separate report called
“Financial Performance Assessment”. 12 Examples are: water supply, environmental sanitation and low-income housing.

TA 7231-BAN: City Region Development Project Final Report
September 2010 Chapter 10-30
� The financial analysis is conducted at current prices; local inflation factor is assumed at 6.5% in 2010 and 6% thereafter13; foreign inflation factor is assumed at 1.5% in 2010, 0.7% in 2011 and 0.5% thereafter;
� An average exchange rate of Taka 69 per US$1.00 is employed when converting foreign exchange costs to local currency equivalent;
� Financial prices of capital works and annual operation and maintenance are based on the financial cost estimates of the technical team;
� Costs for the project component are assumed to be provided as 100% grant to the implementing agency by the central government.
11.2 Financial Analysis and Sustainability The analysis of the implementing agency’s financial performance comprises review of past fiscal condition (FY2005 to FY2009) and the forecast of fiscal condition of the agency in the long term.14The fiscal condition of the agency in the long term has been projected based on the following factors: growth trends over the past 5 year period, assumed annual inflation rate, on-going and planned development programs, future improvement action plans, and consultant’s own estimates. The forecasted fiscal condition (see table below) shows that the agency has the ability to generate funds to maintain adequately the project component’s and other municipal services’ facilities, and meet the entity’s financial obligations, including debt service payments. Adequate funds will be available to operate and maintain the infrastructure facilities sustainably. However, availability of funds of the implementing agency would require that the LGD of the Ministry of LGRDC periodically review and update the model tax schedule which regulates the taxes and fees that municipalities can levy and collect to keep pace with the rising costs of municipal administration and services and maintenance of facilities. The main risks associated with the project related to financial aspects are: i) low collection efficiency of local taxes and fees; ii) uncertainty regarding adjustment of local taxes and fees by the LGD necessary to ensure financial sustainability of the project component and other municipal services; and iii) inadequate funding of the right level of operations and maintenance of the project component and other municipal services. The risks will be mitigated through a periodic review of tax collection and other financial performance, budget monitoring and variance analysis, and formulation of improvement action plan as a result of the periodic review and analysis. .
13 ADB estimated inflation factors for Bangladesh. 14 Detailed financial performance of implementing agencies are discussed in a separate report called
“Financial Performance Assessment”.

TA 7
231-
BA
N: C
ity R
egio
n D
evel
opm
ent P
roje
ct
Fina
l Rep
ort
Sep
tem
ber 2
010
C
hapt
er 1
0-31
K
CC
Pro
ject
ed F
isca
l Con
ditio
n
Sou
rce:
Con
sulta
nt’s
Est
imat
es
Yr 1
Yr 2
Yr
3Y
r 4
Yr 5
Yr 6
Yr
7Y
r 8
Yr 9
Yr 1
0Y
r 11
Yr
12Y
r 13
Yr 1
4Y
r 15
Rev
enue
Ow
n-S
ourc
e R
even
uei)
Pro
pert
y ra
tes
and
taxe
s21
3,30
0,95
036
9,72
1,64
645
7,22
2,43
655
3,89
2,32
266
0,51
6,59
473
9,04
4,67
896
0,75
8,08
21,
018,
403,
567
1,07
9,50
7,78
11,
144,
278,
248
1,21
2,93
4,94
21,
576,
815,
425
1,67
1,42
4,35
11,
771,
709,
812
1,87
8,01
2,40
0ii)
Tax
on
tran
sfer
of i
mm
ovab
le p
rope
rty o
wne
rshi
p12
,610
,029
14,5
01,5
3316
,676
,763
19,1
78,2
7722
,055
,019
25,3
63,2
7229
,167
,763
33,5
42,9
2738
,574
,366
44,3
60,5
2151
,014
,599
58,6
66,7
8967
,466
,808
77,5
86,8
2989
,224
,853
iii)
Bus
ines
s an
d ot
her
(non
-pro
pert
y) ta
xes
15,0
43,2
1616
,547
,538
18,2
02,2
9120
,022
,521
22,0
24,7
7324
,227
,250
26,6
49,9
7529
,314
,972
32,2
46,4
7035
,471
,117
39,0
18,2
2842
,920
,051
47,2
12,0
5651
,933
,262
57,1
26,5
88iv
) Fe
es, r
ents
and
oth
er in
com
e11
8,32
4,86
713
0,15
7,35
314
3,17
3,08
915
7,49
0,39
817
3,23
9,43
719
0,56
3,38
120
9,61
9,71
923
0,58
1,69
125
3,63
9,86
027
9,00
3,84
630
6,90
4,23
133
7,59
4,65
437
1,35
4,12
040
8,48
9,53
244
9,33
8,48
5S
ub-T
otal
Ow
n-S
ourc
e R
even
ue35
9,27
9,06
153
0,92
8,07
063
5,27
4,57
975
0,58
3,51
887
7,83
5,82
497
9,19
8,58
11,
226,
195,
539
1,31
1,84
3,15
81,
403,
968,
477
1,50
3,11
3,73
21,
609,
872,
001
2,01
5,99
6,92
02,
157,
457,
334
2,30
9,71
9,43
42,
473,
702,
326
Non
-Dev
elop
men
t Gra
nts
3,50
0,00
03,
710,
000
3,93
2,60
04,
168,
556
4,41
8,66
94,
683,
790
4,96
4,81
75,
262,
706
5,57
8,46
85,
913,
176
6,26
7,96
76,
644,
045
7,04
2,68
87,
465,
249
7,91
3,16
4S
ub-T
otal
Rec
urre
nt R
even
ue36
2,77
9,06
153
4,63
8,07
063
9,20
7,17
975
4,75
2,07
488
2,25
4,49
398
3,88
2,37
11,
231,
160,
356
1,31
7,10
5,86
41,
409,
546,
945
1,50
9,02
6,90
81,
616,
139,
968
2,02
2,64
0,96
52,
164,
500,
022
2,31
7,18
4,68
32,
481,
615,
490
Dev
elop
men
t Gra
nts
300,
000,
000
1,29
0,77
9,90
395
5,76
8,01
979
4,51
1,00
037
8,74
3,08
840
1,46
7,67
342
5,55
5,73
445
1,08
9,07
847
8,15
4,42
250
6,84
3,68
853
7,25
4,30
956
9,48
9,56
860
3,65
8,94
263
9,87
8,47
867
8,27
1,18
7Lo
an a
nd N
on-R
even
ue R
ecei
pts
15,0
00,0
0015
,900
,000
16,8
54,0
0017
,865
,240
18,9
37,1
5420
,073
,384
21,2
77,7
8722
,554
,454
23,9
07,7
2125
,342
,184
26,8
62,7
1528
,474
,478
30,1
82,9
4731
,993
,924
33,9
13,5
59T
otal
Rev
enue
677,
779,
061
1,84
1,31
7,97
41,
611,
829,
198
1,56
7,12
8,31
41,
279,
934,
735
1,40
5,42
3,42
81,
677,
993,
876
1,79
0,74
9,39
51,
911,
609,
089
2,04
1,21
2,78
02,
180,
256,
993
2,62
0,60
5,01
12,
798,
341,
911
2,98
9,05
7,08
53,
193,
800,
236
Exp
endi
ture
sR
ecur
rent
Exp
endi
ture
i) P
erso
nnel
cos
ts13
2,80
2,22
814
0,77
0,36
114
9,21
6,58
315
8,16
9,57
816
7,65
9,75
317
7,71
9,33
818
8,38
2,49
819
9,68
5,44
821
1,66
6,57
522
4,36
6,56
923
7,82
8,56
425
2,09
8,27
726
7,22
4,17
428
3,25
7,62
430
0,25
3,08
2ii)
Oth
er r
ecur
rent
exp
endi
ture
s61
,113
,136
73,3
35,7
6388
,002
,915
105,
603,
499
228,
157,
904
259,
588,
766
296,
453,
758
339,
788,
581
390,
833,
014
451,
071,
537
522,
282,
079
606,
594,
504
706,
560,
774
825,
239,
140
966,
295,
153
Sub
-Tot
al R
ecur
rent
Exp
endi
ture
s19
3,91
5,36
321
4,10
6,12
423
7,21
9,49
826
3,77
3,07
739
5,81
7,65
743
7,30
8,10
448
4,83
6,25
653
9,47
4,02
960
2,49
9,58
967
5,43
8,10
676
0,11
0,64
385
8,69
2,78
197
3,78
4,94
81,
108,
496,
765
1,26
6,54
8,23
5D
evel
opm
ent E
xpen
dtur
es45
0,00
0,00
01,
572,
779,
903
1,31
8,68
8,01
91,
237,
206,
200
800,
000,
000
900,
000,
000
1,10
0,00
0,00
01,
200,
000,
000
1,25
0,00
0,00
01,
300,
000,
000
1,35
0,00
0,00
01,
700,
000,
000
1,80
0,00
0,00
01,
850,
000,
000
1,90
0,00
0,00
0Lo
an R
epay
men
t and
Oth
er D
isbu
rsem
ents
00
00
00
00
00
00
00
0T
otal
Exp
endi
ture
s64
3,91
5,36
31,
786,
886,
028
1,55
5,90
7,51
71,
500,
979,
276
1,19
5,81
7,65
71,
337,
308,
104
1,58
4,83
6,25
61,
739,
474,
029
1,85
2,49
9,58
91,
975,
438,
106
2,11
0,11
0,64
32,
558,
692,
781
2,77
3,78
4,94
82,
958,
496,
765
3,16
6,54
8,23
5R
even
ue S
urpl
us (
Def
icit)
33,8
63,6
9854
,431
,946
55,9
21,6
8166
,149
,038
84,1
17,0
7868
,115
,324
93,1
57,6
2051
,275
,366
59,1
09,5
0065
,774
,674
70,1
46,3
5061
,912
,230
24,5
56,9
6330
,560
,320
27,2
52,0
02O
peni
ng B
alan
ce26
0,87
4,35
229
4,73
8,05
034
9,16
9,99
740
5,09
1,67
747
1,24
0,71
555
5,35
7,79
362
3,47
3,11
771
6,63
0,73
876
7,90
6,10
382
7,01
5,60
389
2,79
0,27
796
2,93
6,62
71,
024,
848,
856
1,04
9,40
5,81
91,
079,
966,
139
Clo
sing
Bal
ance
294,
738,
050
349,
169,
997
405,
091,
677
471,
240,
715
555,
357,
793
623,
473,
117
716,
630,
738
767,
906,
103
827,
015,
603
892,
790,
277
962,
936,
627
1,02
4,84
8,85
61,
049,
405,
819
1,07
9,96
6,13
91,
107,
218,
141
Fina
ncia
l Rat
ios
and
Indi
cato
rsP
rope
rty T
ax C
olle
ctio
n E
ffici
ency
(%
)45
%60
%70
%80
%90
%95
%95
%95
%95
%95
%95
%95
%95
%95
%95
%O
pera
ting
Rat
io /1
0.53
0.40
0.37
0.35
0.45
0.44
0.39
0.41
0.43
0.45
0.47
0.42
0.45
0.48
0.51
Tot
al R
even
ue -
Yea
r on
Yea
r G
row
th (
%)
18%
172%
-12%
-3%
-18%
10%
19%
7%7%
7%7%
20%
7%7%
7%T
otal
Exp
endi
ture
s -
Yea
r on
Yea
r G
row
th (%
)5%
178%
-13%
-4%
-20%
12%
19%
10%
6%7%
7%21
%8%
7%7%
Ow
n-S
ourc
e R
even
ue -
Yea
r on
Yea
r G
row
th (
%)
88%
48%
20%
18%
17%
12%
25%
7%7%
7%7%
25%
7%7%
7%S
hare
to T
otal
Rev
enue
(%
):T
otal
ow
n-so
urce
rev
enue
53%
29%
39%
48%
69%
70%
73%
73%
73%
74%
74%
77%
77%
77%
77%
Non
-dev
elop
men
t gra
nts
1%0%
0%0%
0%0%
0%0%
0%0%
0%0%
0%0%
0%D
evel
opm
ent g
rant
s44
%70
%59
%51
%30
%29
%25
%25
%25
%25
%25
%22
%22
%21
%21
%Lo
an a
nd n
on-r
even
ue r
ecei
pts
2%1%
1%1%
1%1%
1%1%
1%1%
1%1%
1%1%
1%P
rope
rty T
axes
to T
otal
Ow
n-S
ourc
e R
even
ue (
%)
59%
70%
72%
74%
75%
75%
78%
78%
77%
76%
75%
78%
77%
77%
76%
Sha
re to
Tot
al E
xpen
ditu
res
(%):
Per
sonn
el c
osts
21%
8%10
%11
%14
%13
%12
%11
%11
%11
%11
%10
%10
%10
%9%
Oth
er re
curr
ent e
xpen
ditu
res
9%4%
6%7%
19%
19%
19%
20%
21%
23%
25%
24%
25%
28%
31%
Dev
elop
men
t exp
endi
ture
s70
%88
%85
%82
%67
%67
%69
%69
%67
%66
%64
%66
%65
%63
%60
%Lo
an r
epay
men
t and
oth
er d
isbu
rsem
ents
0%0%
0%0%
0%0%
0%0%
0%0%
0%0%
0%0%
0%P
erso
nnel
to T
otal
Rec
urre
nt E
xpen
ditu
res
(%)
68%
66%
63%
60%
42%
41%
39%
37%
35%
33%
31%
29%
27%
26%
24%
1/ O
pera
ting
Rat
io =
Rec
urre
nt E
xpen
ditu
res
divi
ded
by R
ecur
rent
Rev
enue
s
Rev
enue
and
Exp
endi
ture
Sta
tem
ent (
in T
aka)
<===
====
===
Pro
ject
ion
====
====
==>

TA 7231-BAN: City Region Development Project Final Report
September 2010 Chapter 10-32
Annex A – Cities Development Initiative For Asia (CDIA) - Summary Of Recommendations For Local Drainage Upgrading Works
Recommendations: The Study identified five areas which are prone to severe and re-current flooding and proposed drainage improvements. The five areas are:
1) The Old Commercial Centre; 2) The New Commercial Centre and Surrounding Area (KDA Avenue); 3) Boyra; 4) Khalilpur – Mujgunni –Bastahara; and 5) Teligati –KUET-TTC.
Area 1 - The Old Commercial Centre The area contains the main market in the city, shops, business, offices and public hospital. The area drains directly to the Rupsha River via sluice gates and out let drains the proposal consists of repairing 6 numbers sluice gates, construction of one new sluice gate, construction on 3nos culverts, re-excavation and lining of out let canals (435 meter) construction of new drain (760 meters) replacement of concrete slab and construction of manholes, cleaning & repair of connecting drains. Estimated cost - Tk 50,80,0000. Beneficiaries - Residents (2015 estimates 155,000) employees and business in wards 21,22,23,29 & 30. Area 2 - The New Commercial Centre and Western Residential Areas This area covers the modern commercial area centered KDA Avenue as well as mixed income residential areas to the west located on either side of Sher-e-Bangla Road. The proposal consists of construction / reconstruction of primary drains in KDA Avenue, Sher-e-Bangla Road (Maylapota more to Gallamari Bridge and Mayur River, Farazipara lane, Deban Babu Road. Construction of 3.02km drains in KDA Avenue, including cleaning of sqm drains, rehabilitation of existing drain (2.9km) (Maylapota more to Tablig Masjid, Tablig Masjid to Mayur River West), construction of new drain (Tablig Masjid to Gallamari Bridge, construction of culvert at Farazi para square & repair & cleaning of drain). Estimated cost - Tk 120,600,000. Beneficiaries - Residents, employees and business in wards 18-20 and 23-26. Estimated number of residents in 2015: 190,000. Area 3 - Boyra This area covers the developing sub-centre of Boyra which contains several colleges commercial facilities and areas of high, middle and low income housing. The proposals involve the construction and rehabilitation of primary drain from the Jessore Road to the Moyur River. New drain construction from Jessore Road to Boyra Bazar through girls college (500 meter). Drain rehabilitation and new construction (college to Mayur River along Jalil Sarani Road) 1.7km. Estimate cost: Estimated cost - Tk 40,600,000. Beneficiaries - Residents of Boyra (wards 15 & 16) Estimate population in 2015: 45,000 Local employees & businesses and students of Girls College.

TA 7231-BAN: City Region Development Project Final Report
September 2010 Chapter 10-33
Area 4 - Khlispur –Mujgunni-Bastohara This area covers the majority of Khalispur thana which includes major concentrations of slum dwellers in the Bastohara, Mujgunni and ward 7 areas. It also includes several major employers: Jute mills, the paper factory, oil depots and the power station. The proposals are designed to improve the internal drainage in much of the thana and to upgrade the outlet canals to the Khudir Khal. The proposal consists of construction of 15.2km new Reinforced concrete drains, 5km construction of secondary drains in 3(three) low cost housing areas and re construction of 0.5km drain. It involves land acquisition of 4.76 areas of land. Estimated cost - Tk 508,950,000. Beneficiaries - Residents, employees and business in most of Khulispur thana (wards 6-13 and 15). Estimated number of residents in 2015: 300,000. Area 5: Teligati (north of KCC area) This Telegati area is located in the North of current KCC area in Daulatpur thana. Parts of the area lie outside the currant boundary although within the KCC’s proposed extension area. It is a developing commercial sub-centre of the city. Khulna University of Engineering of Technology (KUET), the Technical Training College (TTC), the Government laboratory and the Police Training Centre are all located in this area. The proposals are designed to improve drainage throughout the Teligati area by rehabilitating existing main outlet drains and canals. The proposal consists of: Rehabilitation of existing reinforced concrete drains canals, construction of new drain & culverts, cleaning & repair of connecting drains. Re-excavation of canals, (8.145km), rehabilitation of existing RCC drain, (2.16km) construction of new drain (0.556km) & construction of 2m culverts -2nos. Acquisition of land involves 2.40 acres. Estimated cost - Tk 42,377,500 Beneficiaries - Residents, employees, business and students in Teligati (wards 1 and 2 in KCC plus areas of Danlatpur and Khan Jahan Ali currently outside KCC area with an estimated number of residents in 2015 of 31,000.

TA 7231-BAN: City Region Development ProjectFinal Report
Annex B - Typical Drainage Profile and Other Works
Project
Typical Drainage Profile and Other Works

TA 7231-BAN: City Region Development ProjectFinal Report
Project

TA 7231-BAN: City Region Development ProjectFinal Report
Project

TA 7231-BAN: City Region Development ProjectFinal Report
Project

TA 7231-BAN: City Region Development ProjectFinal Report
Project

TA 7231-BAN: City Region Development ProjectFinal Report
Project

TA 7231-BAN: City Region Development ProjectFinal Report
Project

TA 7231-BAN: City Region Development Project Final Report
September 2010 Chapter 10-41

TA 7231-BAN: City Region Development ProjectFinal Report
Project

TA 7231-BAN: City Region Development ProjectFinal Report
Project

TA 7231-BAN: City Region Development Project Final Report
September 2010 Chapter 10-44
Plan of a Pumping Station

TA 7231-BAN: City Region Development Project Final Report
September 2010 Chapter 10-45
Annex C- Detailed Base Cost Estimates ����� �� �� �� �� ����� ���� ��
� �� �� �������� ����� � �������� ������� ��������
�� �� �� �� �������� ������������
�� ������������ �������������������� �����
� �������������
�� �� �� ��
���� �������������������� � � � ��
����� ���������� �� �� ���������������!�"#$�������!��
!���%$�������������&������'���� ��������
� �� ����� �� ��� �
��$� (()*#"� �����������������#�)+�� ���������(")'("+��
���,� -����������!�� ������ �� ��������� �������!� �.��
$���������.������$���
��$� �,(/�"� �����������������#�#(�� ��������������%'(,,��
�� �� �!����� � � � ���������"""#$%��
��&� � �'������������� �������� � � � ��
��,��� 0��� � �1�.������&���������� ���� ������ '�
����� ��������&�����
��$� �/*#� �����������������#�)+�� ���������������'/,#��
��,�,� 0��� � �1������$&���!� �� ������ ���2�������
���� �������!� �!�$�� ��.���!�� �� ����� ���
����� �������� �
��$� ,�(,+(� �������������������%(�� ���������",+')/"��
��,�"� 0��� �� �1�.��$���������.��� �� �� ����������
�����!�"#$�������!��!���%$�����������
��&������'���� ��������� �� ����� �� ��� �
��$� +%/�"� �������������������("�� ����������,,'/+���
��,�(� 0��� �� �1�.��$��������.�������$&����� ��
�� �.��� 2���������������� ������,##$$�
���� �����.�����������
��$� *+%/#(� �������������������("�� ���������)+,',(*��
��,�%� -����������!�� ����� ��$� "��/+"� �����������������#�#(�� ������������"'%%*��
�� �� �!����� � � � ������""(&)*��
��+� ,������,�������� �������� � � � ��
��"��� -����������!�� ������ �� ��������� �������!� �.��
$���������.������$���
��$� (*%###� �����������������#�)+�� ���������(%('(+/��
��"�,� ��������- �����������������������+%. ���������
�����*. �����������������������������
����- ��������/�����
��$� �#####� �����������������#�#(�� ��������������('"(+��
�� �� �!����� � � � ���������"*##+*��
��(� 3 ��1�� ��������4 �������&��� $� "####� ��������������,*�""�� ���������/)#'###��
�� !� !0��1� ���� � 2� 343!��� � � � �����+�"&()%��
&� ���� �������������������4 ��������5�
������
� � � ��
,����� ��5����&�����!�� ���� ����6 ��'�4 ����1 ����
6 ��'�7���������6 �������-��1�$����6 ���
$� *��#� ��������������,��#/�� ����������,+'/%"��
,���,� 8������!�6 ���1 ����6 ��'8.��� �������
�����������6 ��'8.��� ���,��� �����������
6 ��'�������6 ��'������6 �������-� � ����
6 ��'�0� ��� ������6 ���9�������
$� +,+#� ���������'*,*�#"�� ����"'(*"'%,#��
,���"� �������������$�:������6 ��'4 ������
1 ��';����$������� �6 ��'8.�� ���;���
6 ��'�����$ ��4 ��������6 ��'�����$ ��
-�:���6 ��'�8.�� ������ �6 ���
$� ,�"%� ������������,+*�*+�� ���������*�,'#*(��
�� !� !0��1� ���� � 2� 343!�&� � � � ����"&%"++)��

TA 7231-BAN: City Region Development Project Final Report
September 2010 Chapter 10-46
+� ������������������������6����� � � � ��
"����� < ������� �������������!��� ���������;��� 5���
���� �$�; ��'�,����� �$�; ��'=�>� �
8���'��� ��; ��'4 ����1 ���'8�.��� ��5
�'8�.��� ��5,'8�.��� ���-����.��������
=�������
$� +*#� ���������'*,*�#"�� ������'")+'"+%��
"���,� �#?�� ��������� 5������!��� ���������;��� 5���
���� �$�� ��'�,����� �$�� ��'���� ��
; ���'�8�.��� ��5,����������=�>� �8����
$� %##� ������������,+*�*+�� ����������("'"(���
"���"� 9�$� ����� �!����� ��; ����������;����
����=�������������;����
��$�� �,� �������#'+//�#"�� ����������"#'%,(��
"���(� �������!�,5&�����������;��� 5������ �$�
; ��',����� �$�; ��'�=�>� �
8���'4 ����1 ����
�� (� ��������('"(/�+"�� ������������/'")���
"���%� � �������������!�"5&����8�.��� ��5���������
;����
8�� �� ��������/',(*�"+�� ��������������/',(*��
"���*� ��� � �����������������!�,5&����
8�.��� ��5,��������;����
8�� �� �������#'�((�)"�� ������������#'�(%��
"���/� � ������>�������!���5&����8�.��� ���-�����
-�����������;����
8�� �� ��������('"(/�+"�� ��������������('"(+��
"���+� ,�&����0���� ��'�� �����������������9�� ����
!���#5&����=��������������;����
8�� �� �����,+'�#+�,%�� ����������,+'�#+��
�� !� !0��1� ���� � 2� 343!�+� � � � ������#+("#(��
"� �������������3 �- ���������������
��/�����������������
� � � ��
(����� �� ��������!���� ������#?�� ��������� �
!�$�8����� ����;����$����-�����'��� �
0� ��������-���������6�0�
-������'9�����8������8�.�������� ��
;����������-���������7��
-������'< ���@� �������
$� ,�+*� ������������,+*�*+�� ���������*,*'*+%��
(���,� �� ��������!���� ���������� ����������
- �.���=���'���������4 �����
��&��'-� � �����6 �����6 ��'�6 ��� ������
-� � ��'�������� �����=.���� ���
7 �����'�����!�$���$����������=2��
A���� �����'-A������'�6 ��� ���5����$�'�
6 ��� ���5,���$�'���� 1 �����������-8�
�������������- ����.���&���
$� �//*#� �������������)/�"*�� �����"'%#%'�%%��
(���"� ���� ��������!��#?�� ��������������!�$�
@� ���������-����-�:����� ��� �;��� B�
�������
$� %##� ������������,+*�*+�� ����������("'"(���
(���(� ���� ��������!����������9�������9������
=���'������� �������� ��������� ��5�5-������
���������'�8�!�� ����!�4 �C���������'=����
6�=�=&����'4 ��������4 �����.����4 � C���
����6 ��� ������-� � ���
$� +�/#� �������������)/�"*�� ������'*�,'(%#��

TA 7231-BAN: City Region Development Project Final Report
September 2010 Chapter 10-47
(���%� ���� ��������!�������!�$��� ��������$���
������D����'����������A���� ��������9 �����
4 �������D����'�@�.���-�$��- �.�����4 �C���
�����������>��.����;������� ����8�.������
�� ��
$� ""%#� ��������������("�%%�� ����������(%'+)%��
(���*� �������!�� 5������� �� ���� ��. ����9�������
9������=����
$� *##� �������������)/�"*�� �����������+'(�/��
(���/� �������!�� 5������� �� ���� ��. ����������
- �.���=���'�� ��505-���������� ����������
$� )##� ��������������("�%%�� �����������")'�)*��
(���+� ������&������������������������!�$�7��
.���������� �����&�������6�0�
$� (##� ������������,+*�*+�� �����������('*/,��
(���)� �� ��������!�-�����&��� ����9�������9������
=�����������������- �.���=����
� � "� ������"/'",��/(�� ������������')*%��
(����#� ���� ��������!�-�����&�������>���:��9����
�D�����
� � �� ������"/'",��/(�� �����������"/'",,��
(������ �� ��������!��5&�����������;�������
��$����������=2��A���� ��������- ����.�
��&���
8�� �� ��������+'*)%�*%�� ��������������+'*)*��
(����,� 8����=�D�� �����< &������ 8�� �� ����,+)'+%%�#/�� ���������,+)'+%%��
�� !� !0��1� ���� � 2� 343!�"� � � � �����$)*+$"(��
*� 2�������2��/������� � � � ��
%��� ���������-������������=� ����� � 8�� �� ����,")'###�##�� ���������,")'###��
�� !� !0��1� ���� � 2� 343!�*� � � � ���������&+(%%%��
�� !� !0���� �!��� � � � ���&$�)("""��
�� ����������� � � �����������������#��#�� �����,'*�/')((��
�� �� �!��7��� 3!83 643�9�� �� �� �� ���&#)()+#(��
� � � � � �
� = �$���0�� ��������������E�-��� *)� � � �
� � � � � �3 ���:�
� � � �
�
��$�E���.���4 �����
� � � �
�
$�E�4 �����
� � � �
�
8��E�8�$����$�
� � � �
�
D$�E��D�����4 �����
� � � �

TA 7231-BAN: City Region Development Project Final Report
September 2010 Chapter 10-48
Annex D - List of Drainage Improvement by KCC
Area SL No Name and location Length
m Width
m Amount (Lac BDT)
Type of improvement Remarks
Central Drain
01
Khalishpur low cost housing areas
drain(New colony of Word No 10, part of
Ka)
1350 1.19 54.00 New drain
5000m Mentioned
in CDIA report
02
Khalishpur low cost housing areas
drain(New colony of Word No 11, part of
Kha)
2297.53 1.17 56.00 New drain
03
Khalishpur low cost housing areas
drain(New colony of Word No 12, part of
Ga)
1461.84 1.19 57.00 New drain
04
Form north side of Sonadanga Bus
Terminal to Mayur River
520.00 2.59 178.80
New drain
05 Nobinagar to Gulam Muktadir Culvert 1082.04 2.43 70.00 New drain
06 From Platinum gate to Vairab River 213.35 1.77 15.00 New drain
1000m Mentioned
in CDIA report
07 East side drain of
Khalishpur TV station
393 0.45 13.00 New drain
Word No 01 08 Banikpara main
road side drain 300 1.00 15.00
Word No 02 09
SR Siraji road side drain (form
Fulbari gate Shahid Minar to TB
Hospital)
586.99 1.70 15.00 New drain
Word No 03 10
Mohesherpasha Maddhadanga main
road side drain ( 221m from
Dawlotpur Thana and 359m from Primary School)
580 1.50 15.00 New drain
Word No 04 11
Diana South Para Road side drain
(part), 550m from Hekmot Ali House
550 1.00 15.00 New drain
Word No 05 12
Pratapaditta road side drain & Diana boundary road side
drain
700 1.66 15.00 85% New drain
Word No 06 13 Kalamia bipas road
side drain, Sarif 500 1.00 13.00 New drain

TA 7231-BAN: City Region Development Project Final Report
September 2010 Chapter 10-49
Amzad road side drain and Rifle
School side drain (From Khan A
Sabur Road to Sarif Amzad Sarak, From Khan A Sabur Road
to Dawlutpur College & in front of
BDR Campus)
Word No 07 14
Padma road side drain (From rail line
to Kobar Khana Road Outlet drain)
400.20 1.80 20.00 70% New
drain
Word No 09
15
Mujgunni North para forest road side drain(from
Khan A Sabar road to Boyra Goalkhali
road) and Bastohara internal drain ( Bastohara
main road to internal mani road)
500 1.11 10.00 New drain
16 BDR School to Bastohara drain 150 2.00 3.00
Word No 13 17 East side of BIDC
road drain 201.19 1.43 15.00 New drain
Word No 14 18
Mojgunni Highway side drain( Police line to Bastohara
drain)
289.84 1.02 15.00 New drain
Word No 15 19
Maddapara road side drain (
Matobbar bari to Holding No 19)
300.00 0.80 6.00 New drain
Word No 16
20
Boyra market road side drain(Boyra
main road to Member bari, Prof.
Kalam house to Haji Foyaj Uddin
School)
500 1.00 13.00 New drain
21
Mosque bari road side drain ( Holding
No 12 to Boyra market road)
257.21 1.00 6.00 New drain
Word No 17
22
Sonadanga main road side drain
(Baitunnur mosque to Staff quarter)
415.00 0.83 15.00 80% New drain
23 Moggunni Highway side drain ( West
side of KMC) 70 0.81 2.00 New drain
24
Remaining part of Vanga pole khal
drain ( Highway of Mayur River)
65 2.74 10.00 New drain

TA 7231-BAN: City Region Development Project Final Report
September 2010 Chapter 10-50
Word No 18 25
West side of Outer bipass road side
drain (Sonadanga bus stand to track
turminal)
300 1.82 25.00 New drain
Word No 19
26
Hazi Ismail Road side drain ( Form KDA Avenue to
Electric staff quarter) & Sheik para cross road
side drain
600 1.03 15.00 80% New drain
570m mentioned
in CDIA report
27
Goborchaka Maddapara road
side drain ( Sheikpara Sardar
bari to Goborchaka main road)
400 1.25 5.00 90% New drain
Word No 20 28 BK Roy road side
drain 915 0.89 20.00 New drain
Word No 21 29
KD Ghosh road side drain (Klay
road to Dakbangloo)
650 1.50 20.00 60% New drain
Word No 22 30
Khan A Sabor road side drain (Hazi Mohsin road to Custom ghat)
550 1.34 20.00 65% New drain
Word No 23 31 Ahsan Ahmed road
side drain 500 1.28 20.00 60% New drain
Word No 24
32
Prantic & Nirala R/A inner side drain (
21No road to khal & main outlet)
500 2.00 20.00 New drain
33
Ohab Avenue road side drain ( Iqbal
nagar mosque road to KDA avenue)
200 0.77 8.00 8% New drain 450m
mentioned in CDIA report
34
Bagmara tatultola drain (Zhidur
Rahman road to Bagmara cross
road )
400 1.20 10.00 New drain
Word No 25 35
Sher-A-Bangla road side drain ( Lions Scool east side to
Najir ghat)
306.58 1.23 20.00 New drain mentioned
in CDIA report
Word No 26 36
Sher-A-Bangla road west side
drain(Election office to Najir ghat)
398.34 1.82 21.00 New drain
Word No 27
37 Mistripara road side drain 200 10.00 New drain
38 BK main road side drain 200 0.83 10.00 New drain
39 Islampur & Sultan Ahmed road side
drain 200 0.68 7.00 90% New
drain
Word No 40 Miapara main outlet 250 2.33 35.00 New drain

TA 7231-BAN: City Region Development Project Final Report
September 2010 Chapter 10-51
28 drain
Word No 29
41
TB Cross road side drain ( Khan Jahan Ali road to Sunflour
KG school)
225 1.88 20.00 50% New drain
42 Rupsha stand road side drain 300 1.90 20.00 New drain
Word No 30
43 Tutpara main road side drain 840 0.83 29.00 New drain
44 Shipyard road side drain 500 0.86 30.00 New drain
45 Chanmari approach road side drain 200 0.58 5.00 New drain
Word No 31
46 Dilkhola road side drain 183 0.83 5.00 New drain
47 Khan Jahan Ali
road side drain( PTI to Rupsha)
100 2.74 10.00 New drain
48
Shipyard Chowdhury para
drain( Shipyard to Matiakhali)
152.96 0.81 3.00 75% New drain
Total 22754.07 1034.8

TA 7231-BAN: City Region Development Project Final Report
September 2010 Chapter 14-1
Sub-Project: 8
STRENGTHENING ECONOMIC POTENTIAL OF URBAN CENTRES (ASHULIA INDUSTRIAL AND RESIDENTIAL CLUSTERS)

TA 7231-BAN: City Region Development Project Final Report
September 2010 Chapter 14-2
Table of Content
1. Introduction.......................................................................................................................... 3
2. Purpose and Background.................................................................................................... 3
3. Policy Context...................................................................................................................... 5
4. Situation Analysis ................................................................................................................ 5
5. Project Vision and Objectives.............................................................................................. 8
6. Phased Implementation....................................................................................................... 8
7. The Proposal – Description ................................................................................................. 9
7.1 Detailed Design and Project Preparation.......................................................................9
7.2 Implementation - Water Supply and Sanitation............................................................10
7.3 Implementation - Roads and Drains ............................................................................11
7.4 Comprehensive Master Planning and Investment Strategy.........................................15
8. Sub-Project Costs.............................................................................................................. 16
9. Benefits.............................................................................................................................. 17
10. Replication......................................................................................................................... 17
11. Economic Assessment ...................................................................................................... 18
11.1 Methodology and Assumptions....................................................................................18
11.2 Economic Benefits .......................................................................................................18
11.3 Economic Analysis.......................................................................................................19
12. Financial Assessment........................................................................................................ 20
12.1 Methodology and Assumptions....................................................................................20
12.2 Tariff and Affordability ..................................................................................................21
12.3 Financial Analysis and Sustainability ...........................................................................22
Annex A - Detailed Base Cost Estimates ................................................................................... 25
Annex B - Characteristics of Population Clusters....................................................................... 28

TA 7231-BAN: City Region Development Project Final Report
September 2010 Chapter 14-3
1. Introduction Urban Centres are urbanising areas in the city regions that are the focus of industrial activity and inward investment, together with unplanned residential development and other land uses. They are not yet classified as pourashavas. As a result of their location in areas of growth, urban centres can play a significant role in sub-regional and local economic development. To optimise their economic contribution it is necessary both to: (i) support an environment that is conducive to sustainable economic development through planned development and the provision of basic infrastructure and services; and (ii) enhance the organisational capacity of local government units and the technical support capacity of central government departments present in the upazilas.
To address these needs within the context of the CRDP Loan Project, it is proposed to supportthe potential urban centres (and pourashavas) in the Dhaka and Khulna City Regions, and support them with targeted interventions that support economic development, and strengthen the capacity of those local government units (LGUs). With this in mind, this case study component is prepared to demonstrate an example, capable of subsequent replication elsewhere.
2. Purpose and Background
The Sub-Project identifies targeted capital investments in the “Ashulia Industrial and Residential Cluster” (SavarUpazila), referred here as the Ashulia Cluster. These investments are high priority projects deemed necessary to support economic development based on the established criteria contained in the CRDP. The Cluster consists of three urban centres formed from the Ashulia, Yearpur and Damsona Unions (Map 1 refers). Ashulia is located next to Uttara (a residential model town) within Dhaka City Corporation (DCC) boundary, with Yearpur and Damsona. Due to its proximity to Dhaka, the cluster offers considerable potential location benefits for the establishment of industry. At the same time, rapid economic growth in the cluster and substantial in-migration of labour is placing the area under severe environmental and social stress. There is a major shortage of land and housing for low-income families.
The Sub-Project has been developed through a rapid assessment of the Cluster and working with SavarUpazilla LGED and DPHE staff and the elected chairman, members and secretaries of the Ashulia, Yearpur and Damsona Union Parishads. Field visits were accompanied by the Upazila Engineer and/or the respective Union representative(s) to jointly verify key problems, constraints and needs. SavarUpazila community representatives and other key stakeholders including Dhaka Export Processing Zone (DEPZ) in Damsona have expressed in principle support for the Sub-Project.
The package of target initiatives identified is intended to support economic growth and activity in the Cluster. More broadly, the Sub-Project is intended as: (i) a pilot demonstration as to how urban centres can address main problem areas through capital investment components and forward planning and programme development; and (ii) the preparation of urban centres for participation in a follow-on CRDP phase that will have more comprehensive and integrated initiatives focused on optimising the potential for sustainable economic growth.

TA 7231-BAN: City Region Development Project Final Report
September 2010 Chapter 14-4

TA 7231-BAN: City Region Development Project Final Report
September 2010 Chapter 14-5
3. Policy Context Urban Centres have been defined in the emerging draft National Urban Policy as part of the hierarchy or network of urban areas.1 In general, urban centres are anomalous in that, whilst displaying all the characteristics of rapidly urbanising areas, they are classified as rural local government. This is the case with SavarUpazila and three union parishads of Ashulia, Damsona and Yearpur. Upazila and union parishads are covered by separate local government legislation such as Union Parishad Act (2009), which establishes their mandate and functions.2 In recognition of the urbanising character of the three unions (Ashulia, Damsona and Yearpur) the consultant understands that the declaration of the urban centres as Ashulia Pourashava is being mooted by the local Member of the Parliament. If declared as such, the urban centres will be subject to the same policy regime as covers pourashavas nationally.
The Ashulia Cluster is located within the RAJUK boundary and is therefore guided by the Dhaka Metropolitan Development Plan 1995-2015 (DMDP) and the emerging Detailed Area Plan (DAP). Whilst a broad prescription for the development of the SavarUpazila (including the Ashulia Cluster) is included in the DMDP and DAP, in reality there is little control of development and this is evidenced by the mushrooming of unplanned private residential and industrial development throughout the Upazila. Moreover, an ‘Upazila Plan Book’ – a form of infrastructure development plan, does exist but is out of date and in need of revision.
4. Situation Analysis Ashulia, Damsona and Yearpur have been experiencing rapid industrial growth and urbanisation since the year 2000 (Table1 and Figure 1.0 refer). With the growth of industry and the demand for housing in the area, agricultural land has largely disappeared in the core industrial areas. The combined population of the three union parishads has increased from 166,514 in 2001 to an estimated 950,000 in 2010. Population is projected to reach 1,200,000by 2020. The number of industries located in the combined areas has increased from 54 to 694 over the same period. Currently it is estimated that a total of 125,000 persons are employed in industries at Damsona.
The locations of the major residential and industrial clusters are shown on Map 1 and a summary of the key population and infrastructure characteristics is shown at Annex A.
Rapid and sustained industrial growth is attributable to several mutually reinforcing factors:
The availability of elevated land compared to other areas around Dhaka.
The locational advantages of being close to Dhaka with comparatively good connections.
1 The draft National Urban Policy is currently awaiting approval from the Local Government Division, Ministry of Local Government, Rural Development and Cooperatives. 2The functions of upazilas and union parishads include: (i) carrying out development projects and development of local
resources; (ii) maintaining public property; (iii) reviewing development activities of national agencies; and (iv)encouraging
sanitation. Union parishads have the ability to raise taxes. UpazilasParishads have been re‐established as directly elected local government (with a Chairman) after an interregnum between 1991 and 2009.

TA 7231-BAN: City Region Development Project Final Report
September 2010 Chapter 14-6
The establishment in Damsona of the first Dhaka Export Processing Zone in 1993 and the second in 1997. The Consultants have confirmed through field survey the presence of many industries and businesses around DEPZ at Ganakbari, Sreepur, Baipile, Gazirchat, Palashbari and Dendabor.
The construction of the Tongi - EPZ Road via Ashulia in 1996.
Table 1 Population and Industry in the Cluster
Source: Population Census 2001, and SavarUpazila and Union Parishads Estimates 2010
However, so far development of the area has been unplanned, with an acute lack of basic infrastructure and wholly inadequate service provision: there is insufficient water supply, sanitation and drainage facilities are lacking and the road network is sub-standard. There are also severe problems of water logging and poor environmental standards (air and water quality). The main challenges are as follows:
Drainage and Flood Management A proper drainage system is absent which is resulting in local floods and water logging in the monsoon season. This is disrupting mobility in the urban centres including the movement of both workers and goods. Water logging is the single biggest problem in the area. This is exacerbated by the elevation of roadside development, which is high compared to the existing road without drainage with outfall. Most of the roads in the area become inundated by the rainwater and industrial wastewater, which causes damage to these road surfaces requiring significant resources for maintenance and repair each year.
Population Industry Urban Centres
2001 2010 2001 2010
Ashulia 64,000 250,000 2 230
Damsona 76,902 450,000 50 249
Yearpur 25,612 250,000 2 215
Total 166,514 950,000 54 694

TA 7231-BAN: City Region Development Project Final Report
September 2010 Chapter 14-7
Roads and Connectivity. As many industries and businesses are located along arterial roads in the urban centre, good connectivity and the effective movement of goods plays an important part in maintaining the economic attractiveness and competitiveness of the area. At present industries and businesses are connected to national and regional highways by sub-standard arterial roads, which are inadequate in width and are either in poor condition or katcha. The situation is exacerbated by the regular water logging of roads during the monsoon season which disrupts efficiency movement for up to four months. It is noted that traffic congestion is particularly severe on the double lane roads at Nabinagar, Chandra, Jerabo and Ashulia Bazar Area, and that the road surfaces in these locations are poor. Map 1 refers to the roads pattern in Ashulia.
Water Supply and Sanitation.
There is no piped water supply in Ashulia, Damsona or Yearpur and access to safe water is not assured. The static ground water level is very low at 18-24 meters; groundwater is not however afflicted by salinity or arsenic problems. As a result normal pumps are ineffective and Tara shallow pumps and submersible pumps are being used within housing premises to access drinking water; the cost of submergible water pumps is expensive (USD 1159 – 1449 per installation). At present there are 1041 hand tube-wells installed by the Department of Public Health Engineering (DPHE), which are mostly fitted with Taradev Hand pumps. In general, industries are using their own system of water supply through ground water extraction. Of the total population in the Cluster more than 50% are in-migrant workers who share water and latrines with others. Communities with a high concentration of lower middle class workers and residents need improved access to water and sanitation.
Solid Waste Management. There is no Solid Waste Management (SWM) in the Cluster and random dumping is practiced both for domestic and industrial waste. This is resulting in both land and water pollution. The problem caused by the SWM vacuum is well understood, but is exacerbated by limited suitable landfill site availability. Basic estimates suggest that a minimum of four transfer stations and at least one final disposal site are needed to manage the current volume of waste.3
Capacity Constraints.
As officially classified rural local government, the urban centre have been unable to participate in urban development focused projects (such as the ADB Urban Governance Infrastructure Improvement Project) and do not have access to the same level of funds, capacity building support or human resources as urban local government. Unlike pourashavas, upazilas and unions have minimal staff. The UpazillaParishadis headed by a directly elected Chairman with an executive UpazilaNirbahi Officer (UNO). There are no other Upazilla staff (such as urban planner in Paurashava), and technical capacity is provided through the presence of Ministry level staff (such as LGED and DPHE officers) responsible for designing, costing and implementing schemes. Union parishads are able to raise taxes (e.g. holding and land taxes), and rapid economic development in the Cluster has greatly enhanced the potential tax base.4Damsona Union reports that its tax collection has increased from Taka 50,000 (USD 725) in FY 2001/02 to Taka 974,000 (USD 14,116) in FY 2008/09.
3 Transfer stations would be required in Ashulia (1), Damsona (2) and Yearpur (1) Unions 4 After tax revenue has been ‘shared’, as is required by government regulation, union parishads are left with approximately 50% of the total revenue it generated.

TA 7231-BAN: City Region Development Project Final Report
September 2010 Chapter 14-8
5. Project Vision and Objectives Our Vision is to optimise the economic potential of the ‘Ashulia (Industrial and Residential) Cluster’ in a way that is sustainable and to the benefit of industrialists, traders, local businesses, residents and workers in the Cluster and the neighbouring area.
To achieve this Vision the following Objectives set the context for this Sub-Project:
A - Prioritise activities which will address the most acute needs for better urban services and which will result in improved economic activity across the Ashulia Cluster. This should include:
(i) Improving water supply and access to safe water in the Ashulia area, with a target of access to clean water for 100% of existing and future residents;
(ii) Ensuring 100% of residents have access to sustainable forms of sanitation; including septic tanks;
(iii) Ensuring the introduction of an integrated solid waste management system for the whole of the Ashulia area;
(iv) Constructing an improved drainage system, which prevents local flooding in residential and commercial/industrial areas and reduces damage to arterial roads and highways in general;
(v) Improving connectivity within the Ashulia Cluster and links to Dhaka-EPZ via Ashulia Highway;
(vi) Ensuring adequate provision of education and health facilities and other community facilities to meet the needs of the residents in the Ashulia area.
B – Design and implement a comprehensive and integrated planning context for the sustainable medium/long-term development and upgrading of the Ashulia area. This should include:
(i) Ensuring urban growth occurs in areas designated for such purposes in a Comprehensive Master Plan and Investment Strategy and in other existing plans and policies, such as the DAPs prepared by RAJUK;
(ii) Addressing other key economic and environmental issues in the Ashulia area, including: (a) environmental upgrading in the industrial and residential clusters; (b) better traffic management; (c) better public transport; and (d) providing serviced land to meet the needs of on-going in-migrant population.
(iii) Strengthening governance, such that it has the resources to manage the economic growth and urbanisation of the Ashulia area in a more sustainable way.
6. Phased Implementation The proposals, which make up this Sub-Project are identified taking into account the needs and aspirations of the principle stakeholders from the Government agencies, which have given direction to the consultant team. The views of the main stakeholders in the Ashulia Cluster have proved to be particularly important in identifying some of the most acute economic, social and environmental issues, relevant to this Sub-Project.
It is proposed to take a phased approach to strengthening economic potential in the Ashulia Cluster, through at least two phases of development, The proposals contained in this Sub-Project refer to Phase 1 only. The design and implementation of Phase 2 will be

TA 7231-BAN: City Region Development Project Final Report
September 2010 Chapter 14-9
dependent on the a 2nd Phase of CRDP and/or interest from and additional funding agency:
Phase 1 – Urban Services Upgrading and Comprehensive Master Planning,
This is geared to design and implementation of capital works in priority areas for: (i) water supply and sanitation; (ii) drainage and flood management and (iii) roads and highways. Phase 1 also includes preparation of a Comprehensive and Integrated Master Planning Context to guide Phase 2 implementation and to generally act as policy and programme context for the area.
It should be noted that GoB stakeholders did not prioritise SWM, which would therefore be a component of Phase 2.
Phase 2 – Comprehensive Planning and Investment
This will promote activities geared to further improving the economic potential and social and the environmental conditions in the Ashulia area, set within the context of the proposed Comprehensive and Integrated Master Planning Context (Phase 1). The activities are anticipated to include: (i) integrated solid waste management, urban sanitation and further extensions to water supply and for drainage improvements; (ii) comprehensive environmental upgrading in the industrial clusters; (iii) improved monitoring and enforcement of industrial wastewater discharges and waste disposal; (iv) integrated traffic management and pedestrian planning; and (v) comprehensive environmental upgrading and social development in informal housing areas
The proposals for Phase 2 are mainly concerned with activities which address the “enabling environment” necessary to secure sustainable economic growth and as such, it will be essential for design and implementation of the 2nd phase to be supported by a revised LGU mandate and resources capable of managing the process. In particular it is proposed that the status of SavarUpazila (including the Ashulia area) be upgraded as a Grade 1 Pourashava as soon as possible.
7. The Proposal – Description The activities proposed for inclusion in CRDP, directly reflect the needs and aspirations of GoB stakeholders and local union parishads’ representatives in the Ashulia area. However, at this point in time there was only marginal input from other stakeholders including commercial and industrial operators and the wider community.
7.1 Detailed Design and Project Preparation This will cover all the detailed design and project preparation activities required to progress the implementation of this Sub-Project and will include:
Water Supply and Sanitation
Review the existing sources of water, and water availability both in terms of quality and quantity in comparison to water demand, and recommendations for source development. This will also involve site investigation, preparation of preliminary and detail engineering design and preparation;
Review in detail the scope for participation of the community and private industry in the operation and maintenance of the water supply system; and

TA 7231-BAN: City Region Development Project Final Report
September 2010 Chapter 14-10
Survey the existing sanitation situation, and make recommendations for a sustainable sanitation system in the Ashulia area, including: (i) design aspects and choice of systems; (ii) system maintenance and (iii) nature, scale and location of new systems and system improvements.
Connectivity – Roads and Drainage
Identify the capacity and condition of the existing roads system;
Identify the capacity and condition of the associated drainage;
Survey traffic volumes and origin and destinations;
Prepare a broad concept plan for a roads system with the capacity to serve the Ashulia area, taking into account the potential for public transport operations;
Confirm the existing priorities for new road links and improvements and adjust as appropriate; and
Prepare detailed designs of priority road schemes and associated drainage requirements.
7.2 Implementation - Water Supply and Sanitation Based on the results of the consultant teams’ preliminary research and discussions with the responsible engineers, it is proposed to install five production/tube wells as a priority, together with 30 km of distribution pipelines serving a population of approximately 80,000 persons, with the assumption that one production well will serve about 15,000 or more.
The five priority production wells proposed under this Phase 1 are shown on Map 2. In selecting the sites for the five priority production wells, cluster communities with low-income residents living in sub-standard and informal housing have the highest priority.
GoB agencies will be responsible for implementation, operation and maintenance with technical support from DPHE and other relevant organisations. This is understood to be a pilot project for the area, which can be extended across the whole area over time, potentially as a Phase 2 activity. This should be subject to being set within the context of national water supply policy and concerns that groundwater depletion and other unsustainable practices should be minimised. To this extent a more expansive consultancy study should preferably precede any further financial commitments to expanding the network of tube wells.

TA 7231-BAN: City Region Development Project Final Report
September 2010 Chapter 14-11
7.3 Implementation - Roads and Drains Scope

TA 7231-BAN: City Region Development Project Final Report
September 2010 Chapter 14-12
This Phase 1 component will include construction of priority road improvements, promoted by local stakeholders. There are some 15 key road improvements, together with associated drainage upgrading, which are listed in Table 2 below.
Detailed design for each of the road improvements will be prepared in the Design and Preparation Phase of the Loan Project, but feasibility for three example road and drainage upgrading schemes are illustrated below and which form the foundations for the initial costing of all fifteen.
Examples
Drainage - Construction of Drainage in the Areas Affected by Water Logging - 6 km. These drains will be constructed along the roads (Items 1 and 3 Annex 2 – Proposals for Road Development) which become inundated by the rainwater and industrial waste water. Design of the drains will be prepared by the project consultant as part of the Design and Preparation work described above. A typical section of the proposed drains is given below:
Access Roads - Improvement of Access Roads – 7.50 km. A package of three Upazila roads (1, 2 and 3 in Annex 2 – Proposals for Road Development) is recommended for improvement as a priority together with the above drainage facilities. The routes of the proposed Access Roads are shown on Map1 and a typical cross-section is shown below.

TA 7231-BAN: City Region Development Project Final Report
September 2010 Chapter 14-13
These priority roads will make an important contribution to the economic development of the Cluster in the Ashulia area. Disruption will be ameliorated as a result of the proposed improvements. The nature of improvement will include widening, strengthening and resurfacing. Road safety measures will be integrated in the design to ensure safety to pedestrians.
Dhaka-Aricha (RHD) at 20 Mile-Jerabo Bazar Yearpur UP Road
The road length is 5.65 km and existing width is 6 m. This connects Dhaka-Aricha RHD National Highway at 20 Mile to Tongi-EPZ road at Jerabo Bazar. Large and medium industries like Incepta, DEKKO, Maskot Group and many others are located alongside the road. The condition in some parts of the road is poor and which requires immediate improvement. The Commercial Vehicles per day (CVD) in 2009 was 979. Due to movement of heavy traffic, the road is proposed to be strengthened up to 40 mm bituminous carpeting with the 6m double lane carriageway pavement (detailed design will be prepared at the implementation stage), and also to protect the road from inundation by the industrial waste water and rainwater, new drainage (4 km) alongside the road should be provided, which will include the length from Jirabo to Kondul Bag (1.5 km) and Koturia to Kondul Bag (2.5 km).

TA 7231-BAN: City Region Development Project Final Report
September 2010 Chapter 14-14
Dhaka-Aricha (RHD) – Ashulia GC Road (Anowar Jung Road)
The total road length is 7.20 km and existing width is 4.9 m. Of this length, 4.30 km is going to be upgraded under RTIP of LGED and 2 km is by RHD. The remaining 0.7 km is proposed under this project. This connects Tongi-EPZ regional road with Ashulia Growth Centre and Union Parishad. Large and medium industries like Landmark, Padma Spinning, Summit Power and Dipon CNG are located alongside the road. The condition in proposed section is poor, which require immediate improvement. The Commercial Vehicles per day (CVD) in 2009 was 665. Due to movement of heavy traffic, the road is proposed to be strengthen up to 40 mm bituminous carpeting with the 6m double lane carriageway pavement (detailed design will be prepared at the implementation stage).
Dhaka- Aricha Highway Ashulia GC Road (Anowar Jung Road)
Nabinagar-Kaliakoir (RHD) Road at Sreepur-Kashimpur GC Road The total road length is 6 km and existing width is 4.9 m. This connects Nabinagar-Kaliakoir RHD Road with Kashimpur GC, and Norsinghapur-Konabari RHD Road. Many large and medium industries like Samsher Knit, Square Textile, Mother Textile and the Atomic Energy Commission are located alongside the road. Of the length, 1.5 km up to Biman Poultry is proposed for inclusion as part of this Project Component. The Commercial Vehicles per day (CVD) in 2009 was 810. Due to movement of heavy traffic, the road is proposed to be strengthen up to 40 mm bituminous carpeting with the 6m double lane carriageway pavement (detailed

TA 7231-BAN: City Region Development Project Final Report
September 2010 Chapter 14-15
design will be prepared at the implementation stage), and also to protect the road from inundation by the industrial waste water and rainwater, drainage (2 km) along the proposed section will be constructed.
NabinagarKaliakoir RHD at Sreepur- Kashimpur GC Road
Other Road Improvements
A full list of other Union roads where improvements are proposed is given at Annex 1. Local communities are likely to derive significant benefits as a result of these roads improvement, and thus can be upgraded as Union Road Type 7 and 8 as per LGED Road Design Standard Manual (2005) provided that funds are available and these roads meet the CRDP criteria.
7.4 Comprehensive Master Planning and Investment Strategy This is a technical assistance component, which will be built around:
Comprehensive Master Plan, which will be set within the context of the DMDP, and set out a land use planning strategy for the area, together with a phased programme of urban development and upgrading and proposals to ensure further urban growth occurs in areas designated for such purposes.
An Economic Development Plan, including the serviced land for commercial and industrial development. Here consideration will be given to the demand for further industrial park and business park development;
A Social Development Framework, covering: (a) Comprehensive upgrading of informal housing areas; (b) Provision of serviced land for in-migration; and (c) Provision of community facilities and urban utilities in support of (a) and (b). .
Careful consideration of the relationship of the Ashulia Cluster to the proposed Satellite City at Savar will be an important consideration in preparing the Comprehensive Master Plan in Ashulia. The Comprehensive Master Plan will also be prepared taking into account the Detailed Area Plan, which covers this area, with specific reference to the zoning context. Here zoning contained in the Detailed Area Plan may be further clarified.

TA 7231-BAN: City Region Development Project Final Report
September 2010 Chapter 14-16
Table 2 Road and Drainage Priorities – Ashulia
8. Sub-Project Costs
SL.
Name of road Union ProposedLength (Km)
Condition Priority Remarks
1. Dhaka- Aricha (RHD) at 20 Mile- Jirabo Bazar Yearpur UP Road.
Ashulia &Yearpur
5.65 Poor/width 6m
1 4 km drainage needed
2. Dhaka- Aricha high way Ashulia GC Road (Anowar Jung road)
Ashulia 0.700 Poor/width 4.9m
1 -
3. Nabinagor- Kaliakor RHD at Sreepur- Kashimpur GC road.
Dhamsona 1.50 Poor/width 4.9m
1 2 km drainage needed
4. Kuturia- Bogabari Bazar Road. Ashulia &Dhamsona
4.80 Poor/width 3m
2 1.5 km drainage needed
5. Jamgora bazaar- Chitrachail- Kandail- Katgora bazaar road.
Ashulia &Yearpur
3.80 Partly katcha/wid
th 3m
3 -
6. JamgoraChowrasaBhadail via Bhadail Primary School road.
Yearpur&Dhamsona
2.60 Poor/width 3m
2 2.6 km drainage needed
7. BhadailChowrasa- Madar Textile via Anobic Shakti Commission
Dhamsona 2.00 Katcha 3 -
8. Dendabor (PBS)-GorapirMajar road.
Dhamsona 3.50 Poor/width 3m
3 2 km drainage needed
9. Nabinagor- Kaliakoir RHD road- Tongi EPZ road via Birds
Dhamsona 2.00 Poor/width 3m
2 2 km drainage needed
10. Kumkumary- Sadhupara road. Ashulia 2.20 Katcha 4 -
11. GazircharHoque Market- Noapara- Amtola road.
Ashulia 1.87 Katcha 4 -
12. Dhalpur-Katgora road. Ashulia 2.60 Katcha 4 -
13. AjisTextil- Faruknagar- Madhupur road.
Dhamsona 1.45 Katcha 4 -
14. Jamgora- Bhadail- Pobnertacke road.
Yearpur&Dhamsona
1.50 Katcha 4 -
15. Katgora (Alam Market) - Kandail road.
Ashulia 2.00 Katcha 4 -
38.17

TA 7231-BAN: City Region Development Project Final Report
September 2010 Chapter 14-17
The costs for this Sub-Project (Excluding Detail Design, Study and Capacity Building) are estimated to be in the order of USD 7.3 million. Table 3 (below) refers.
Table 3 Sub-Project Cost Estimates
Project Activity Cost (USD)
1 Road Improvements 2,765,942
2 Drainage Improvements 1,839,130
3 Water Supply and Sanitation 1,988,848
4 Contingencies @ 10% 1,988,848
Total Cost 7,253,312
9. Benefits The following benefits will be accrued from the implementation of this Sub-Project.
Improved operational conditions for local businesses and industry as a result of improvements to connectivity, by selective roads upgrading and local drainage rehabilitation;
Improved living and working conditions for the residents/workers through provision of enhanced basic amenities (e.g. safe water supply to 80,000 populations) and improved roads and local drainage;
Improved and more sustainable environmental conditions; and A context for the planned developed of the area ensured through implementation of
the proposed Comprehensive Master Plan.
10. Replication The results and lessons learned from this Sub-Project will lay the foundations for replication elsewhere in the Dhaka and Khulna city regions. This may include other Urban Centres of similar characteristics: such as Hemayetpur, Atipara, Uttar Khan, Dakkin Khan, ShanirAkra, Ghacha and Pubail.
Based on the lessons learned, some modification or adjustment may be necessary to ensure that selection of the activities to be included better reflect the overriding objective of improved economic activity as an essential project output. To this extent attention must be given to the strict application of the agreed selection criteria shown at Annex 1.

TA 7231-BAN: City Region Development Project Final Report
September 2010 Chapter 14-18
11. Economic Assessment
11.1 Methodology and Assumptions Economic analysis has been conductedin accordance with the ADB’s Guidelines for the Economic Analysis of Projects (1997) and the Framework for the Economic and Financial Appraisal of Urban Development Sector Projects (January 1994).
The Sub-Project will upgrade and expand priority urban services in: i) water supply and sanitation; and ii) roads and drainage.
The following approach and assumptions have been used in the analysis:
All prices are expressed in 2010 prices and economic analysis is conducted at 2010 constant price;
An average exchange rate of Taka69 per US$1.00 is employed when converting foreign exchange costs to local currency equivalent;
Economic prices of capital works and annual operation and maintenance are calculated from the financial cost estimates of the technical team, adjusted to allow for transfer payments and to correct for any other market distortions;
Price contingencies and interest during construction (as a result of any debt financing) are excluded in the calculation of economic internal rate of return (EIRR) but physical contingencies are included because they represent real consumption of resources;
Taxes and duties are excluded because they represent transfer payments;
All costs are valued using the domestic price numeraire; tradable inputs, net of duties and taxes, are adjusted by the shadow exchange rate factor of 1.13 while non-tradable inputs (except for unskilled labor), net of taxes and duties, are adjusted by a conversion factor of 0.9; unskilled labor is adjusted by a conversion factor of 0.7 of the market wage rate to estimate the shadow wage rate;5
The economic opportunity cost of capital (EOCC) is assumed at 12% in real terms; and
Project sub-component for water supply and sanitation is assumed to have useful economic life of 25 years; project sub-component for roads and drainage is assumed to have useful economic life of 15 years.
11.2 Economic Benefits
Water Supply and Sanitation
The project sub-component will provide piped water supply to a greater number of the population. The principal benefits that would be derived include improved accessibility, convenience and reliability of water supply, as well as increased quantities of water and improved water quality. Health benefits will result from the provision of safe water and improved household sanitation conditions that reduce the incidence of diarrhea, dysentery and other water-borne illness. The benefits of the projectsub-componenttherefore have been quantified in terms of:
5 Conversion factors for economic shadow pricing are based on recently approved ADB projects in Bangladesh.

TA 7231-BAN: City Region Development Project Final Report
September 2010 Chapter 14-19
Resource cost savings associated with the replacement of non-incremental water consumed previously obtained from non-piped alternative sources with those from the piped water supply system, valued in terms of the average supply price from existing non-piped water sources estimated at about Taka 20/m3;
Consumer satisfaction, reflected in the incremental water consumed, valued in terms of the average demand price of water (i.e. the average of existing non-piped water supply price of Taka 20/m3 and piped water supply tariff of Taka 10/m3 [refer to section on Financial Assessment]); per capita water consumption is expected to increase from an assumed average of 40 lpcd to 100 lpcd due primarily to (i) the reduced cost of acquiring water, (ii) improved water quality, and (iii) greater convenience and reliability of the piped water supply system;
Water consumed but not billed (non-technical losses6), valued in terms of the average demand price of water;
Consumers’ contribution in the form of new connection fee (refer to section on Financial Assessment).
Health benefits,likely to occur provided that the adverse health impacts of an increased volume of wastewater can be minimized, have not been quantified and included in the analysis due to lack of reliable data.
Roads and Drainage
The economic benefits of this sub-component have been quantified in terms of the following:
Increase in property values - The improvement in the road conditions and protection from inundation may be realized in the amounts people are willing to pay for property either in terms of rent or the purchase price of the property in the project area.7 Property values are assumed to increase by 5% after project completion. The increase in property value is annualized using an annual rent to capital value ratio assumed at 10%; and
The drainage system is assumed to result in savings of annual road maintenance assumed conservatively at 5% of road construction cost.
Other benefits which are not easily quantifiable or could result to double counting and hence not accounted for in the analysis include: improved vehicular travel time, savings in vehicle operating cost,healthbenefitsdue to reduced waterlogging from rainwater (thestagnant and contaminated water becomes the source of mosquito breeding), and reduced environmental degradation.
11.3 Economic Analysis The purpose of the economic analysis is to determine if the component’s EIRR exceeds its EOCC, in real terms. If the component’s EIRR exceeds its EOCC, it can be concluded that the component is economically viable.
Sensitivity analyses have been undertaken in order to test the robustness of the economic results to adverse changes in conditions. The following adverse changes have been analyzed:
A capital cost overrun of 10%;
6Non-technical losses is assumed at 10% and technical losses at 5% for a total NRW of 15%. 7 Current average land value in the area are: 20 Mile-Jerabo Bazar road at Taka 1 million/decimal; Ashulia Bazar
road at Taka 1.5 million/decimal and Sreepur-Kashimpur road at Taka 0.8 million/decimal. One decimal is equivalent to 40.46 sq.m..

TA 7231-BAN: City Region Development Project Final Report
September 2010 Chapter 14-20
An increase in the O&M cost by 10%;
A reduction in the benefits by 10%; and
Sub-Project benefits delayed by one year.
The results of the economic and sensitivity analysis are shown below.
EIRR and Sensitivity Analyses
Scenario NPV / 1
(‘000 Taka) EIRR (%) SI / 2 SV / 3 % Change
Water Supply and Sanitation Base Case 144,652 27.60% 10% Increase in Capital Costs 134,066 25.45% 1.38 73% 10% 10% Increase in O&M Costs 142,451 27.40% 0.13 764% 10% 10% Decrease in Benefits 117,400 25.02% 1.65 60% 10% Project Benefits Delayed by One Year 113,629 22.70% Roads and Drainage Base Case 312,992 30.10% 10% Increase in Capital Costs 290,551 27.67% 1.34 75% 10% 10% Increase in O&M Costs 309,092 29.91% 0.10 953% 10% 10% Decrease in Benefits 255,351 27.23% 1.59 63% 10% Project Benefits Delayed by One Year 237,429 24.13% 1/ NPV = Net Present Value discounted at EOCC 2/ SI = Sensitivity Indicator (ratio of % change in EIRR above the cut-off rate of EOCC to % change in a variable) 3/ SV = Switching Value (% change in a variable to reduce the EIRRto the cut-off rate of EOCC) Source: Consultant’s calculation
Based on the results above, it can be concluded that the proposed component is economically viable under the base case scenario and also under adverse changes in conditions. The sensitivity analysis indicates that the proposed component is most sensitive to delay in project benefits and reduction in benefits, but remains well above the EOCC.
12. Financial Assessment
12.1 Methodology and Assumptions Financial analysis hasbeen undertaken in accordance with the ADB's Framework for the Economic and Financial Appraisal of Urban Development Sector Projects (January 1994) and the Guidelines on the Financial Governance and Management of Investment Projects Financed by the ADB (January 2002). Under the ADB guidelines, financial internal rate of return (FIRR) calculations should be carried out for revenue generating subprojects.8 For non-revenue generating subprojects, such as the roads and drainage sub-component, financial internal rate of return (FIRR) calculations are not required, though economic analysis is undertaken.
The following approach and assumptions have been used in the analysis:
All prices are expressed in 2010 prices and calculation of financial internal rate of return (FIRR) is conducted at 2010 constant price;
An average exchange rate of Taka69 per US$1.00 is employed when converting foreign exchange costs to local currency equivalent;
Financial prices of capital works and annual operation and maintenance are based on the financial cost estimates of the technical team;
8 Examples are: water supply, environmental sanitation and low-income housing.

TA 7231-BAN: City Region Development Project Final Report
September 2010 Chapter 14-21
Price contingencies and interest during construction (as a result of any debt financing) are excluded in the calculation of FIRR but physical contingencies are included because they represent real consumption of resources;
Project sub-component for water supply and sanitation is assumed to be financed by 50% grant and 50% subsidiary loan in local currency from the central government to the implementing agency; roads and drainage sub-component is assumed to be financed by 100% grant from the central government; subsidiary loan is assumed to have a repayment period of 25 years, inclusive of a 3 year grace period, at an interest rate of 5% per annum;
The financial opportunity cost of capital (FOCC) of the grant is assumed at 10% per annum9;
Local inflation factor is assumed at 6.5% in 2010 and 6% thereafter10; foreign inflation factor is assumed at 1.5% in 2010, 0.7% in 2011 and 0.5% thereafter
Financial projections of income statement and cash flow statement are done and presented on current price basis applying the assumed inflation factors.
12.2 Tariff and Affordability The Sub-Project will install meters to all water connections. It is therefore proposed that water tariff will be volumetric. In calculating the proposed water tariff, the following financial objectives have been considered:i) fully recover the operation and maintenance (O&M) costs; ii) recover the debt service; iii) maintain a debt service ratio of at least 1.2; and iv) recover annual depreciation expense to accumulate enough funds for future fixed asset replacement. To meet the financial objectives, the proposed water tariff is calculated to be Taka 8/m3.
An affordability analysis has been undertaken to ensure that domestic consumers, particularly those in the low-income group, can afford the proposed water tariff that meet the financial objectives.Based on generally accepted principle that the expenditure on water should not exceed 5% of household income, the proposed water tariff is considered affordable as shown below.
Water Tariff Affordability Test
Item Average HH Low Income Average Consumption (lpcd) 100 100 Average Household Size (person) 5 5 Average Monthly Household Consumption (m3) 15 15 Monthly Charge for Water (Taka), 2010 Real Price 120 120 Average Monthly Household Income (Taka)1 15,000 8,000 % of Monthly Household Income Spent on Water 0.8% 1.5% 1/ Monthly household incomes are based on results from the household survey Source: Consultant’s calculation
The connection fee for customers is assumed at an affordable and subsidised rate of Taka 1,500 per connection. This affordable rate will encourage residents to connect as soon as the project sub-component is completed. Costs of water connections are fully recovered partly through a one-time connection fee and partly through water tariffs. Water tariffs have been calculated to recover capital costs, which include the costs of water connections.
9Approximated by interest rate of 10-year national government bond. 10 ADB estimated inflation factors for Bangladesh.

TA 7231-BAN: City Region Development Project Final Report
September 2010 Chapter 14-22
12.3 Financial Analysis and Sustainability The purpose of the financial analysis is to determine if the component’s FIRR exceeds its FOCC in real terms. If the component’s FIRR exceeds its FOCC, it can be concluded that the component is financially viable.
The Weighted Average Cost of Capital (WACC) of the component in real terms is used as proxy for the FOCC. The WACC represents the cost incurred by the entity in raising the capital necessary to implement the project component. The WACC therefore is the benchmark to assess the financial viability of the project component.The WACC of the Sub-Project is 1.4% as calculated below.
Weighted Average Cost of Capital
Particulars Sub-Loan Grant Equity Total
Weight (%) 50.0% 50.0% 0.0% 100.0% Nominal Cost (%) 5.0% 10.0% 0.0% Tax Rate (%) 0.0% 0.0% 0.0% Tax Adjusted Nominal Cost (%) 5.0% 10.0% 0.0% Inflation Rate (%) 6.0% 6.0% 6.0% Real Cost (%) -0.9% 3.8% 0.0% Weighted Component of WACC (%) -0.5% 1.9% 0.0% Weighted Average Cost of Capital (Real Terms) 1.4% Source: Consultant’s calculation
Sensitivity analyses have been undertaken in order to test the robustness of the financial results to adverse changes in conditions. The following adverse changes have been analyzed:
A capital cost overrun of 10%;
An increase in the O&M cost by 10%;
A reduction in revenues by 10%; and
Sub-Project delayed by one year.
The results of the FIRR calculation and sensitivity analysis for the Sub-Project are shown below.
FIRR and Sensitivity Analyses
Scenario NPV / 1
(‘000 Taka) FIRR (%) SI / 2 SV / 3 % Change
Base Case 207,115 9.10% 10% Increase in Capital Costs 188,081 7.92% 1.46 69% 10% 10% Increase in O&M Costs 196,225 8.75% 0.43 234% 10% 10% Decrease in Revenues 156,479 7.42% 2.06 49% 10% Project Component Delayed by One Year 184,589 7.69% 1/ NPV = Net Present Value discounted at WACC 2/ SI = Sensitivity Indicator (ratio of % change in FIRR above the cut-off rate of WACC to % change in a variable) 3/ SV = Switching Value (% change in a variable to reduce the FIRRto the cut-off rate of WACC) Source: Consultant’s calculation
Based on the results above, it can be concluded that the proposed sub-component is financially viable under the base case scenario and also under adverse changes in conditions. The sensitivity analysis indicates that the proposed sub-component is most sensitive to reduction in revenues and delay in the project, but remains well above the WACC.
The financial sustainability of the proposed sub-component largely depends on the adequacy of funds of the implementing agency to operate and maintain the infrastructure facilities. The

TA 7231-BAN: City Region Development Project Final Report
September 2010 Chapter 14-23
projected income statement and cash flow statement (see table below) of the project sub-component in the long term show that adequate funds will be available to operate and maintain the infrastructure facilities sustainably. Operating ratio is below 1.00 throughout the projection period which indicates good financial health. Debt service coverage ratio of the project component is above 1.2, the minimum ADB requirement, throughout the projection period.

TA 7231-BAN: City Region Development Project Final Report
September 2010 Chapter 14-24
Projected Financial Statements
(‘000 Taka, Current Price) 2010 2011 2012 2013 2014 2015 2016 2017 2018 2019 2020 2021 2022 2023 2024 2025
Income StatementTotal Revenues 0 0 0 0 35,385 33,863 35,691 37,574 39,513 41,510 43,568 45,687 47,870 50,118 52,433 54,818Expenses
Operating Expenses 0 0 0 0 8,514 8,985 9,470 9,970 10,484 11,014 11,560 12,123 12,702 13,298 13,913 14,545Depreciation 6,111 6,111 6,111 6,111 6,111 6,111 7,206 7,206 7,206 7,206 7,206 7,206Interest Expense 0 0 0 0 3,934 3,755 3,576 3,397 3,219 3,040 2,861 2,682 2,503 2,324 2,146 1,967
Total Expenses 0 0 0 0 18,559 18,852 19,158 19,479 19,814 20,165 21,627 22,010 22,411 22,828 23,264 23,718Income before Tax 0 0 0 0 16,826 15,011 16,533 18,095 19,699 21,345 21,941 23,677 25,459 27,289 29,169 31,100Income TaxNet Income 0 0 0 0 16,826 15,011 16,533 18,095 19,699 21,345 21,941 23,677 25,459 27,289 29,169 31,100
Cash Flow StatementSources of FundsNet Income 0 0 0 0 16,826 15,011 16,533 18,095 19,699 21,345 21,941 23,677 25,459 27,289 29,169 31,100Add: Depreciation 0 0 0 0 6,111 6,111 6,111 6,111 6,111 6,111 7,206 7,206 7,206 7,206 7,206 7,206
Interest Expense 0 0 0 0 3,934 3,755 3,576 3,397 3,219 3,040 2,861 2,682 2,503 2,324 2,146 1,967Gross Internal Cash Generation 0 0 0 0 26,871 24,878 26,221 27,604 29,029 30,496 32,008 33,564 35,168 36,820 38,521 40,273Government Grant 0 21,547 26,646 28,200Subsidiary Loan 0 21,547 26,646 28,200Total Sources of Funds 0 43,094 53,293 56,400 26,871 24,878 26,221 27,604 29,029 30,496 32,008 33,564 35,168 36,820 38,521 40,273
Application of FundsProject Capital Expenditure 0 43,094 53,293 56,400 0 0 0 0 0 0 27,354 0 0 0 0 0Debt Service Payment:
Principal 3,576 3,576 3,576 3,576 3,576 3,576 3,576 3,576 3,576 3,576 3,576 3,576Interest 3,934 3,755 3,576 3,397 3,219 3,040 2,861 2,682 2,503 2,324 2,146 1,967
Total Debt Service Payment 7,510 7,331 7,152 6,973 6,795 6,616 6,437 6,258 6,079 5,901 5,722 5,543Total Application of Funds 0 43,094 53,293 56,400 7,510 7,331 7,152 6,973 6,795 6,616 33,791 6,258 6,079 5,901 5,722 5,543Cash Increase (Decrease) 0 0 0 0 19,361 17,547 19,069 20,631 22,234 23,880 (1,784) 27,306 29,089 30,919 32,799 34,730Cumulative Cash Balance 0 0 0 0 19,361 36,908 55,976 76,607 98,841 122,721 120,937 148,244 177,332 208,251 241,050 275,780Operating Ratio 0.41 0.45 0.44 0.43 0.42 0.41 0.43 0.42 0.42 0.41 0.40 0.40Debt Service Coverage Ratio 3.58 3.39 3.67 3.96 4.27 4.61 4.97 5.36 5.78 6.24 6.73 7.27
Source: Consultant’s calculation

TA 7231-BAN: City Region Development Project Final Report
September 2010 Chapter 14-25
Annex A - Detailed Base Cost Estimates
Cpt. Unit Totals No. Description Unit Quantity Rate (US$)
(US$) (inc tax) 1 Roads and Drains
1.1 Roads 1.1.1 Dhaka‐ Aricha (RHD) at 20 Mile‐ Jirabo
Bazar Yearpur UP Road. km 5.65 72463.77 409,420
1.1.2 Dhaka‐ Aricha high way Ashulia GC Road (Anowar Jung road)
km 0.7 72463.77 50,725
1.1.3 Nabinagor‐ Kaliakor RHD at Sreepur‐ Kashimpur GC road.
km 1.5 72463.77 108,696
1.1.4 Kuturia‐ Bogabari Bazar Road. km 4.8 72463.77 347,826 1.1.5 Jamgora bazaar‐ Chitrachail‐ Kandail‐
Katgora bazaar road. km 3.8 72463.77 275,362
1.1.6 Jamgora Chowrasa Bhadail via Bhadail Primary School road.
km 2.6 72463.77 188,406
1.1.7 Bhadail Chowrasa‐ Madar Textile via Anobic Shakti Commission road
km 2 72463.77 144,928
1.1.8 Dendabor (PBS)‐ Gorapir Majar road. km 3.5 72463.77 253,623 1.1.9 Nabinagor‐ Kaliakoir RHD road‐ Tongi
EPZ road via Birds Garments & Gajirchat Aliya Madrasha.
km 2 72463.77 144,928
1.1.10 Kumkumary‐ Sadhupara road. km 2.2 72463.77 159,420 1.1.11 Gazirchar Hoque Market‐ Noapara‐
Amtola road. km 1.87 72463.77 135,507
1.1.12 Dhalpur‐Katgora road. km 2.6 72463.77 188,406 1.1.13 Ajis Textil‐ Faruknagar‐ Madhupur road. km 1.45 72463.77 105,072 1.1.14 Jamgora‐ Bhadail‐ Pobnertacke road. km 1.5 72463.77 108,696 1.1.15 Katgora (Alam Market) ‐ Kandail road. km 2 72463.77 144,928
Sub ‐Total 2,765,942 1.2 Drains
1.2.1 Dhaka‐ Aricha (RHD) at 20 Mile‐ Jirabo Bazar Yearpur UP Road.
km 4 130434.78 521,739
1.2.2 Nabinagor‐ Kaliakor RHD at Sreepur‐ Kashimpur GC road.
km 2 130434.78 260,870
1.2.3 Kuturia‐ Bogabari Bazar Road. km 1.5 130434.78 195,652 1.2.4 Jamgora Chowrasa Bhadail via Bhadail
Primary School road. km 2.6 130434.78 339,130
1.2.5 Dendabor (PBS)‐ Gorapir Majar road. km 2 130434.78 260,870 1.2.6 Nabinagor‐ Kaliakoir RHD road‐ Tongi
EPZ road via Birds km 2 130434.78 260,870
Sub‐Total 1,839,130 TOTAL FOR COMPONENT 1 4,605,072
2 Water Supply and Sanitation 2.1 Project Preparation for Water Supply
2.1.1 Supply and services LS 1 334500.00 334,500

TA 7231-BAN: City Region Development Project Final Report
September 2010 Chapter 14-26
2.1.2 Site investigations, Preliminery engineering detail design including GIS based mapping and construction and supervision
LS 1 115942.03 115,942
2.1.3 Training LS 1 5797.10 5,797 Sub‐Total 456,239
2.2 Wells, Pumps, Sub‐station and Connections
‐
2.2.1 Deep aquifer test wells No 10 1449.28 14,493 2.2.2 Production tubewells No 5 36231.88 181,159 2.2.3 Pump house No 5 11594.20 57,971 2.2.4 Pump & accessories (including
electrification) No 5 26086.96 130,435
2.2.5 Electrical Sub‐station No 5 21739.13 108,696 2.2.6 Civil House Connections No 1800 86.96 156,522 2.2.7 Supply of Water meters No 1800 72.46 130,435
Sub‐Total 779,710 2.3 New Pipelines ‐
2.3.1 Excavation and backfilling for 200mm dia pipe
Km 10 3188.41 31,884
2.3.2 Excavation and backfilling for 150mm dia pipe
Km 10 2608.70 26,087
2.3.3 Excavation and backfilling for 100mm dia pipe
Km 10 2173.91 21,739
2.3.4 Supply & installation of MS/GI pipes and fittings for 200 mm dia pipe
Km 1 42028.99 42,029
2.3.5 Supply & installation of MS/GI pipes and fittings for 150 mm dia pipe
Km 2 14492.75 28,986
2.3.6 Supply & installation of MS/GI pipes and fittings for 100 mm dia pipe
Km 1.5 13719.81 20,580
2.3.7 Installation of washout/sluice valves etc. for 200 mm dia pipe
LS 1 40579.71 40,580
2.3.8 Installation of washout/sluice valves etc. for 150 mm dia pipe
LS 1 30434.78 30,435
2.3.9 Installation of washout/sluice valves etc. for 100 mm dia pipe
LS 1 21739.13 21,739
2.3.10 Supply of UPVC Pipes for 200 dia mm pipe
Km 10 14637.68 146,377
2.3.11 Supply of UPVC Pipes for 150 dia mm pipe
Km 10 11739.13 117,391
2.3.12 Supply of UPVC Pipes for 100 dia mm pipe
Km 10 8086.96 80,870
Sub‐Total 608,696 2.4 O & M Equipment for Water Supply
2.4.1 Computer No 1 1449.28 1,449 2.4.2 Furniture LS 1 724.64 725 2.4.3 Customized Softwares for computerized
billing system LS 1 8695.65 8,696
Sub‐Total 10,870 2.5 Land Development and Land Acquisition

TA 7231-BAN: City Region Development Project Final Report
September 2010 Chapter 14-27
for Water Supply 2.5.1 Land Development sqm 404.6856 35.81 14,493
2.5.2 Land Acquisition sqm 242.81136 179.06 43,478 Sub‐Total 57,971
2.6 Sanitation ‐ 2.6.1 Public Toilet No 3 13043.48 39,130 2.6.2 Twin pit Latrine (1 m dia, .3 m Height, 12
Rings) No 1000 36.23 36,232
Sub‐Total 75,362 TOTAL FOR COMPONENT 2 1,988,848 TOTAL COSTS 6,593,920 Contingency 10% 659,392 COSTS + CONTINGENCY 7,253,312 Assumed Exchange Rate USD = BDT 69 No = Number cum = Cubic Meter sqm = Square Meter sqf = Square Foot m = Meter kg = Kilo Gram LS = Lump Sum km = Kilo Meter

TA 7231-BAN: City Region Development Project Final Report
September 2010 Chapter 14-28
Annex B - Characteristics of Population Clusters
MODHUPUR
DENDABAR BHADAIL
GAZIRCHAT
JAMGORA DHALPUR
DURGAPUR
GHOSHBAG
PARAGRAM DOSHAID
Population 27000 102000 110000 126000 103000 25000 35460 43000 20000 37500
Holdings 1405 4500 4950 5600 2100 1605 2635 1000 1200 2701
Water Supply 65% 74% 70% 75% 74% 87% 79% 77% 72% 80%
Sanitation 60% 72% 70% 73% 70% 80% 72% 89% 70% 88%
Drainage Bad Bad Bad Bad Bad Bad Bad Bad Bad Bad
Accessibility Bad Bad Bad Bad Bad Bad Bad Bad Bad Bad
Electricity 62% 95% 100% 90% 90% 80% 70% 69% 83% 70%
Solid Waste No No No No No No No No No No
Area (sq. km.) 2.32 2.3 3.5 3.3 3.1 3.12 2.87 3.36 1.92 3.82