an exploration of nitrate concentrations in groundwater aquifers of central-west region of...
TRANSCRIPT
Ao
Ra
b
c
K
a
ARRAA
KNDGAC
1
ASnot(sloal
eotTt
Sf
0d
Journal of Hazardous Materials 159 (2008) 536–543
Contents lists available at ScienceDirect
Journal of Hazardous Materials
journa l homepage: www.e lsev ier .com/ locate / jhazmat
n exploration of nitrate concentrations in groundwater aquifersf central-west region of Bangladesh
atan K. Majumdera, Mohammad A. Hasnatb,c,∗, Shahadat Hossaina, Keita Ikeuec, Masato Machidac
Bangladesh Atomic Energy Commission, Savar, GPO Box 3787, Dhaka 1000, BangladeshDepartment of Chemistry, Shahajalal University of Science and Technology, Sylhet 3114, BangladeshDepartment of Nano Science and Technology, Graduate School of Science and Technology, Kumamoto University, 2-39-1urokami, Kumamoto 860-8555, Japan
r t i c l e i n f o
rticle history:eceived 22 November 2007eceived in revised form 19 February 2008ccepted 19 February 2008
a b s t r a c t
Groundwater and river water samples were collected from the study area to investigate the spatial distri-bution of nitrate (NO3
−) in the central-west region of Bangladesh. The shallow and deep groundwaternitrate concentrations ranged from <0.10 to 75.12 and <0.10 to 40.78 mg/L, respectively. Major riverwater NO3
− concentrations were ranged from 0.98 to 2.32 mg/L with an average of 1.8 mg/L. The average
vailable online 6 March 2008eywords:itrateenitrification
Cl−/NO3− ratio (4.9) of major river water has been considered as reference point to delineate denitrification
processes. The alluvial fan, alluvial, deltaic and coastal deposits shallow groundwater having C1−/NO3−
values less than that of the average river water value (4.9), suggested denitrification processes within theaquifers. On the other hand, denitrification processes are insignificant in the Pleistocene terraces areaaquifers related to relatively higher concentrations of nitrate. Iron pyrite has been found as insignificant
c7cpe
mstfirnw
th
roundwaterquiferontamination
effect on denitrification.
. Introduction
Bangladesh is the most densely populated country in Southeastsia. Most of the population of Bangladesh lives on agriculture.ince agriculture is widely practiced in Bangladesh, potentialitrate pollution may appear in this country in near future. Becausef its large population, there has been a strongly increasing trendowards the growth of more crops to meet the demand. NitrateNO3
−) is the main form of N in groundwater which is usuallyeen as an agricultural pollutant that often arises from the use ofarge amounts of nitrogenous fertilizers. Non-agricultural sourcesf nitrogen, such as septic systems and leaking municipal sewers,re generally less significant regionally but may affect groundwaterocally [1].
Mineral fertilizers were introduced into Bangladesh during thearly 1950s as a supplemental source of plant nutrients. The use
f fertilizers increased rapidly from mid 1960s with the introduc-ion of modern varieties and development of irrigation facilities.he annual urea consumption in Bangladesh is about two millionons per year was in 1980s. From 1989/1990 to 1996/1997, urea∗ Corresponding author at: Department of Chemistry, Shahajalal University ofcience and Technology, Sylhet 3114, Bangladesh. Tel.: +81 96 342 3653;ax: +81 96 342 3653.
E-mail addresses: [email protected], [email protected] (M.A. Hasnat).
cobsalm
tp
304-3894/$ – see front matter © 2008 Elsevier B.V. All rights reserved.oi:10.1016/j.jhazmat.2008.02.110
© 2008 Elsevier B.V. All rights reserved.
onsumption grew rapidly registering an average growth rate of% per year [2]. Excessive N-fertilizer application is therefore veryommon, especially in intensive rice, wheat, beans and vegetableroducing areas so the occurrence of nitrate pollution might bexpected to groundwater.
Topsoil disturbance by cultivation increases the soil aeration andixes with the available carbon and nitrogen sources in presence of
oil micro-organisms. This process leads to nitrate accumulation inhe soil due to mineralization and nitrification processes. With suf-cient surface water infiltration, soluble nitrate can leach below theoot zone to underlying groundwater. Because of its anionic form,itrate is very mobile in groundwater and it moves in groundwaterith no transformation and little or no retardation [3].
Food that is rich in nitrogen compounds can reduce the oxygenransport to blood which may cause serious consequences both foruman and cattles. The uptake of high concentrations of nitrogenan cause problems in the thyroid gland and it can lead to shortagesf vitamin A. In the stomachs and intestines of animals, nitrates cane converted into nitrosamines, a dangerously carcinogenic kind ofubstance [4]. According to the World Health Organization (WHO)nd the European Community (EC), the maximum contaminant
evel (MCL) of nitrate is given to be 50 mg/L whereas European Com-unity (EC) describe the guide level (GL) of nitrate as 25 mg/L [5,6].Unfortunately, no significant research works have yet to be done
o get a proximate view of nitrate pollution in Bangladesh. The pur-ose of this study was (1) to determine the spatial distribution of
R.K. Majumder et al. / Journal of Hazardous Materials 159 (2008) 536–543 537
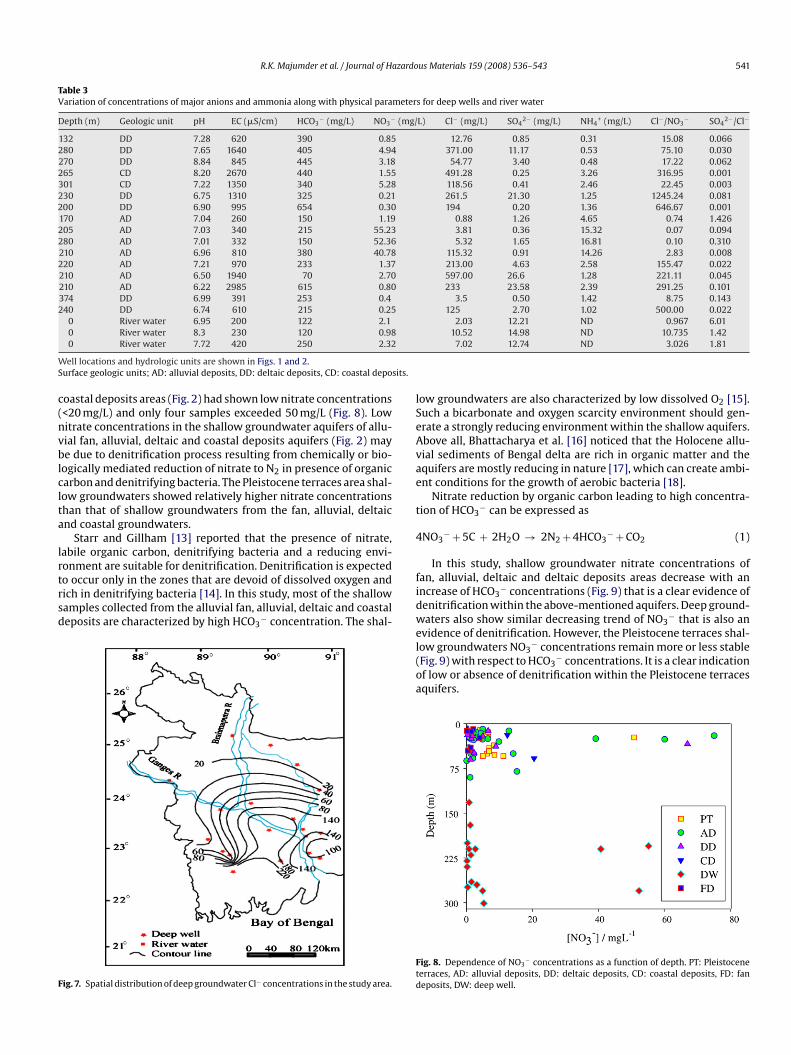
owing groundwater and river water sampling sites.
nucs
2
2
baodBuvPrtt
vThi(msart
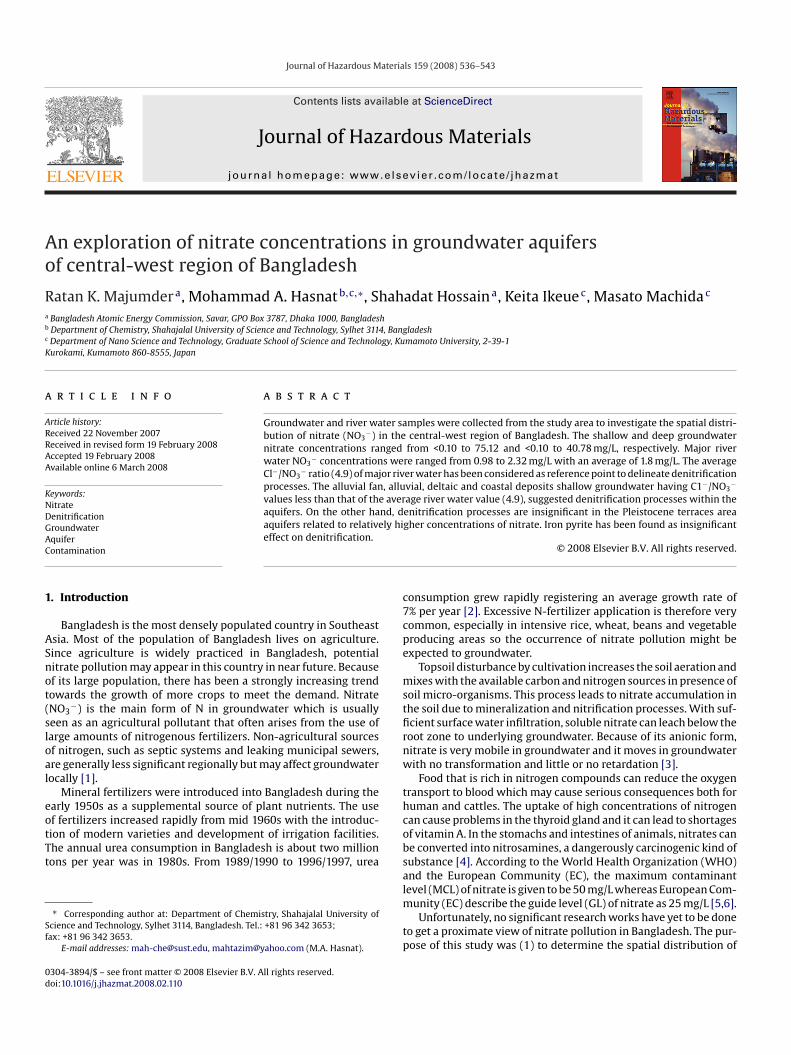
Fig. 1. Geographical map of the study area sh
itrate concentration, (2) to assess nitrate pollution, and (3) to eval-ate the probable cause(s) of groundwater nitrate variability in theentral-west region of Bangladesh based on early December 2005ampling data.
. Study area
.1. Geomorphology and climate
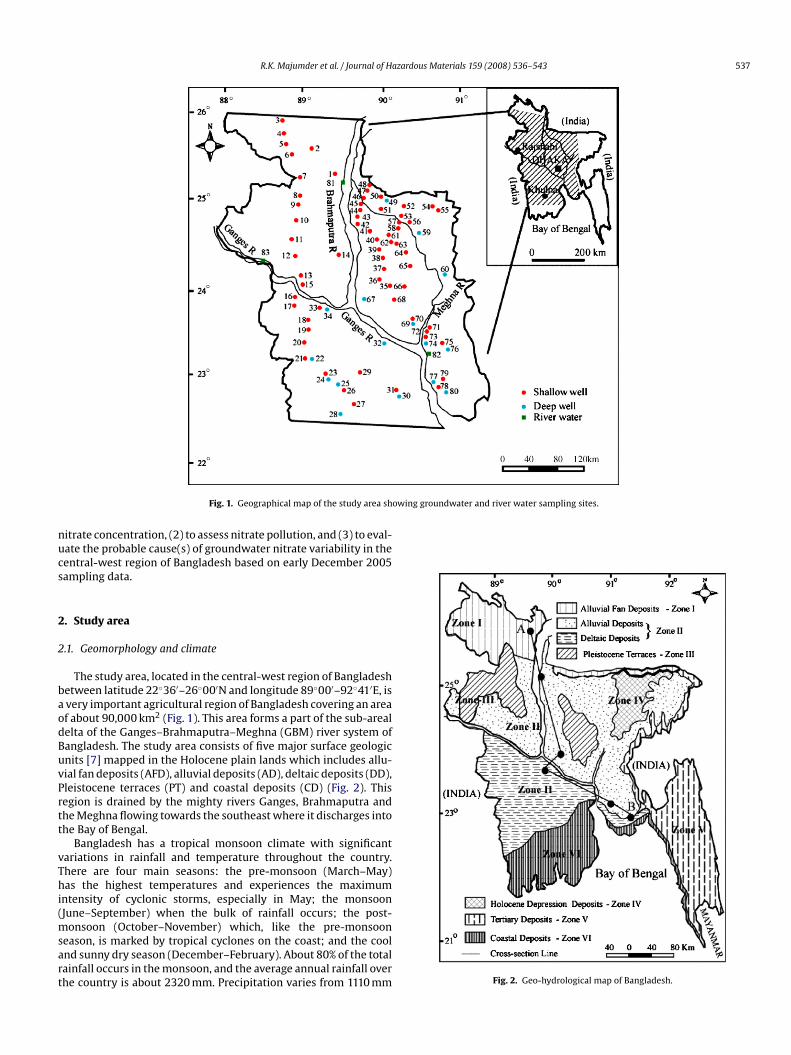
The study area, located in the central-west region of Bangladeshetween latitude 22◦36′–26◦00′N and longitude 89◦00′–92◦41′E, isvery important agricultural region of Bangladesh covering an areaf about 90,000 km2 (Fig. 1). This area forms a part of the sub-arealelta of the Ganges–Brahmaputra–Meghna (GBM) river system ofangladesh. The study area consists of five major surface geologicnits [7] mapped in the Holocene plain lands which includes allu-ial fan deposits (AFD), alluvial deposits (AD), deltaic deposits (DD),leistocene terraces (PT) and coastal deposits (CD) (Fig. 2). Thisegion is drained by the mighty rivers Ganges, Brahmaputra andhe Meghna flowing towards the southeast where it discharges intohe Bay of Bengal.
Bangladesh has a tropical monsoon climate with significantariations in rainfall and temperature throughout the country.here are four main seasons: the pre-monsoon (March–May)as the highest temperatures and experiences the maximum
ntensity of cyclonic storms, especially in May; the monsoonJune–September) when the bulk of rainfall occurs; the post-
onsoon (October–November) which, like the pre-monsooneason, is marked by tropical cyclones on the coast; and the coolnd sunny dry season (December–February). About 80% of the totalainfall occurs in the monsoon, and the average annual rainfall overhe country is about 2320 mm. Precipitation varies from 1110 mm Fig. 2. Geo-hydrological map of Bangladesh.
538 R.K. Majumder et al. / Journal of Hazardous Materials 159 (2008) 536–543
A–B in
ia
2
ihdtb(sPts
Fa
Dglass
fictgc
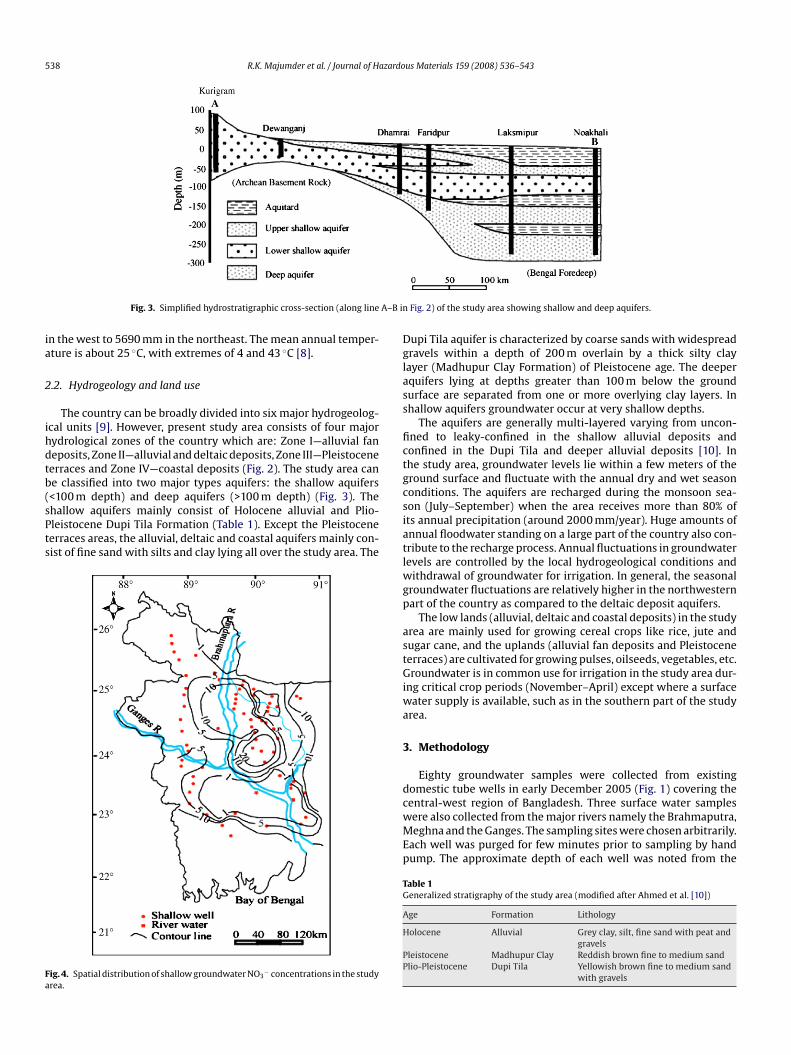
Fig. 3. Simplified hydrostratigraphic cross-section (along line
n the west to 5690 mm in the northeast. The mean annual temper-ture is about 25 ◦C, with extremes of 4 and 43 ◦C [8].
.2. Hydrogeology and land use
The country can be broadly divided into six major hydrogeolog-cal units [9]. However, present study area consists of four majorydrological zones of the country which are: Zone I—alluvial faneposits, Zone II—alluvial and deltaic deposits, Zone III—Pleistoceneerraces and Zone IV—coastal deposits (Fig. 2). The study area cane classified into two major types aquifers: the shallow aquifers<100 m depth) and deep aquifers (>100 m depth) (Fig. 3). The
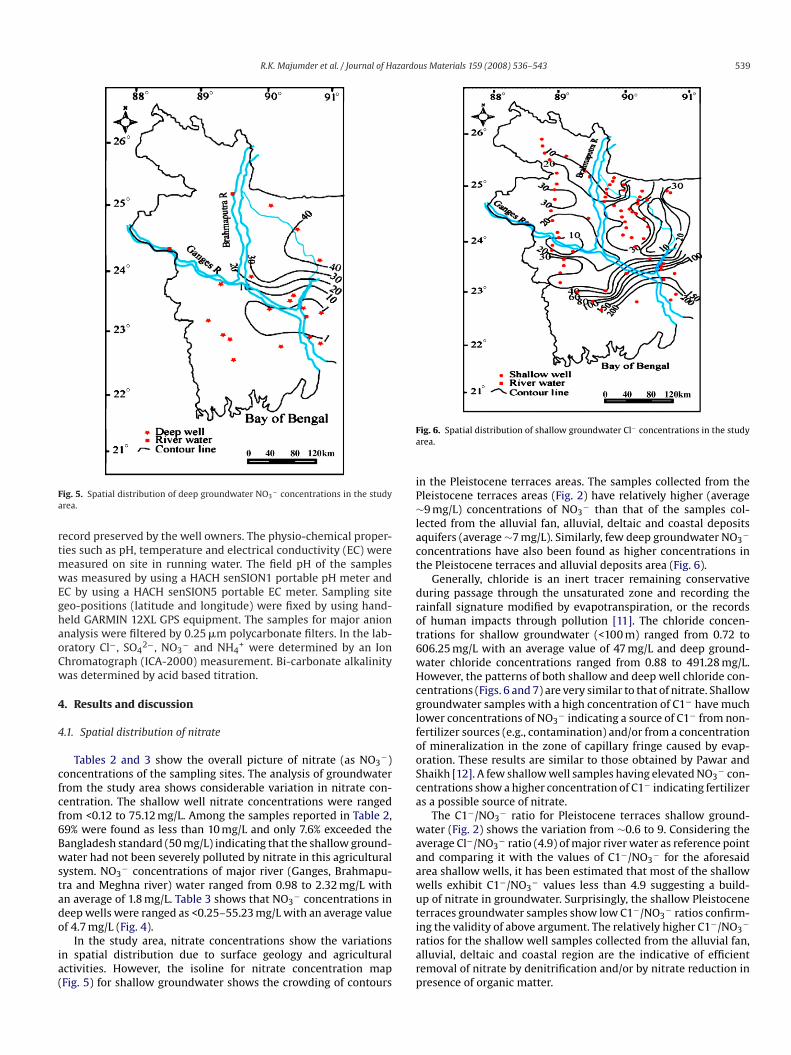
hallow aquifers mainly consist of Holocene alluvial and Plio-leistocene Dupi Tila Formation (Table 1). Except the Pleistoceneerraces areas, the alluvial, deltaic and coastal aquifers mainly con-ist of fine sand with silts and clay lying all over the study area. Theig. 4. Spatial distribution of shallow groundwater NO3− concentrations in the study
rea.
siatlwgp
astGiwa
3
dcwMEp
TG
A
H
PP
Fig. 2) of the study area showing shallow and deep aquifers.
upi Tila aquifer is characterized by coarse sands with widespreadravels within a depth of 200 m overlain by a thick silty clayayer (Madhupur Clay Formation) of Pleistocene age. The deeperquifers lying at depths greater than 100 m below the groundurface are separated from one or more overlying clay layers. Inhallow aquifers groundwater occur at very shallow depths.
The aquifers are generally multi-layered varying from uncon-ned to leaky-confined in the shallow alluvial deposits andonfined in the Dupi Tila and deeper alluvial deposits [10]. Inhe study area, groundwater levels lie within a few meters of theround surface and fluctuate with the annual dry and wet seasononditions. The aquifers are recharged during the monsoon sea-on (July–September) when the area receives more than 80% ofts annual precipitation (around 2000 mm/year). Huge amounts ofnnual floodwater standing on a large part of the country also con-ribute to the recharge process. Annual fluctuations in groundwaterevels are controlled by the local hydrogeological conditions and
ithdrawal of groundwater for irrigation. In general, the seasonalroundwater fluctuations are relatively higher in the northwesternart of the country as compared to the deltaic deposit aquifers.
The low lands (alluvial, deltaic and coastal deposits) in the studyrea are mainly used for growing cereal crops like rice, jute andugar cane, and the uplands (alluvial fan deposits and Pleistoceneerraces) are cultivated for growing pulses, oilseeds, vegetables, etc.roundwater is in common use for irrigation in the study area dur-
ng critical crop periods (November–April) except where a surfaceater supply is available, such as in the southern part of the study
rea.
. Methodology
Eighty groundwater samples were collected from existingomestic tube wells in early December 2005 (Fig. 1) covering theentral-west region of Bangladesh. Three surface water samples
ere also collected from the major rivers namely the Brahmaputra,eghna and the Ganges. The sampling sites were chosen arbitrarily.ach well was purged for few minutes prior to sampling by handump. The approximate depth of each well was noted from the
able 1eneralized stratigraphy of the study area (modified after Ahmed et al. [10])
ge Formation Lithology
olocene Alluvial Grey clay, silt, fine sand with peat andgravels
leistocene Madhupur Clay Reddish brown fine to medium sandlio-Pleistocene Dupi Tila Yellowish brown fine to medium sand
with gravels
R.K. Majumder et al. / Journal of Hazardous Materials 159 (2008) 536–543 539
Fa
rtmwEghaoCw
4
4
cfcf6Bwstado
ia(
Fa
iP∼lact
drot6wHcglfooSca
waaawut
ig. 5. Spatial distribution of deep groundwater NO3− concentrations in the study
rea.
ecord preserved by the well owners. The physio-chemical proper-ies such as pH, temperature and electrical conductivity (EC) were
easured on site in running water. The field pH of the samplesas measured by using a HACH senSION1 portable pH meter and
C by using a HACH senSION5 portable EC meter. Sampling siteeo-positions (latitude and longitude) were fixed by using hand-eld GARMIN 12XL GPS equipment. The samples for major anionnalysis were filtered by 0.25 �m polycarbonate filters. In the lab-ratory Cl−, SO4
2−, NO3− and NH4
+ were determined by an Ionhromatograph (ICA-2000) measurement. Bi-carbonate alkalinityas determined by acid based titration.
. Results and discussion
.1. Spatial distribution of nitrate
Tables 2 and 3 show the overall picture of nitrate (as NO3−)
oncentrations of the sampling sites. The analysis of groundwaterrom the study area shows considerable variation in nitrate con-entration. The shallow well nitrate concentrations were rangedrom <0.12 to 75.12 mg/L. Among the samples reported in Table 2,9% were found as less than 10 mg/L and only 7.6% exceeded theangladesh standard (50 mg/L) indicating that the shallow ground-ater had not been severely polluted by nitrate in this agricultural
ystem. NO3− concentrations of major river (Ganges, Brahmapu-
ra and Meghna river) water ranged from 0.98 to 2.32 mg/L withn average of 1.8 mg/L. Table 3 shows that NO3
− concentrations ineep wells were ranged as <0.25–55.23 mg/L with an average value
f 4.7 mg/L (Fig. 4).In the study area, nitrate concentrations show the variationsn spatial distribution due to surface geology and agriculturalctivities. However, the isoline for nitrate concentration mapFig. 5) for shallow groundwater shows the crowding of contours
irarp
ig. 6. Spatial distribution of shallow groundwater Cl− concentrations in the studyrea.
n the Pleistocene terraces areas. The samples collected from theleistocene terraces areas (Fig. 2) have relatively higher (average9 mg/L) concentrations of NO3
− than that of the samples col-ected from the alluvial fan, alluvial, deltaic and coastal depositsquifers (average ∼7 mg/L). Similarly, few deep groundwater NO3
−
oncentrations have also been found as higher concentrations inhe Pleistocene terraces and alluvial deposits area (Fig. 6).
Generally, chloride is an inert tracer remaining conservativeuring passage through the unsaturated zone and recording theainfall signature modified by evapotranspiration, or the recordsf human impacts through pollution [11]. The chloride concen-rations for shallow groundwater (<100 m) ranged from 0.72 to06.25 mg/L with an average value of 47 mg/L and deep ground-ater chloride concentrations ranged from 0.88 to 491.28 mg/L.owever, the patterns of both shallow and deep well chloride con-entrations (Figs. 6 and 7) are very similar to that of nitrate. Shallowroundwater samples with a high concentration of C1− have muchower concentrations of NO3
− indicating a source of C1− from non-ertilizer sources (e.g., contamination) and/or from a concentrationf mineralization in the zone of capillary fringe caused by evap-ration. These results are similar to those obtained by Pawar andhaikh [12]. A few shallow well samples having elevated NO3
− con-entrations show a higher concentration of C1− indicating fertilizers a possible source of nitrate.
The C1−/NO3− ratio for Pleistocene terraces shallow ground-
ater (Fig. 2) shows the variation from ∼0.6 to 9. Considering theverage Cl−/NO3
− ratio (4.9) of major river water as reference pointnd comparing it with the values of C1−/NO3
− for the aforesaidrea shallow wells, it has been estimated that most of the shallowells exhibit C1−/NO3
− values less than 4.9 suggesting a build-p of nitrate in groundwater. Surprisingly, the shallow Pleistoceneerraces groundwater samples show low C1−/NO3
− ratios confirm-
ng the validity of above argument. The relatively higher C1−/NO3−
atios for the shallow well samples collected from the alluvial fan,lluvial, deltaic and coastal region are the indicative of efficientemoval of nitrate by denitrification and/or by nitrate reduction inresence of organic matter.
540 R.K. Majumder et al. / Journal of Hazardous Materials 159 (2008) 536–543
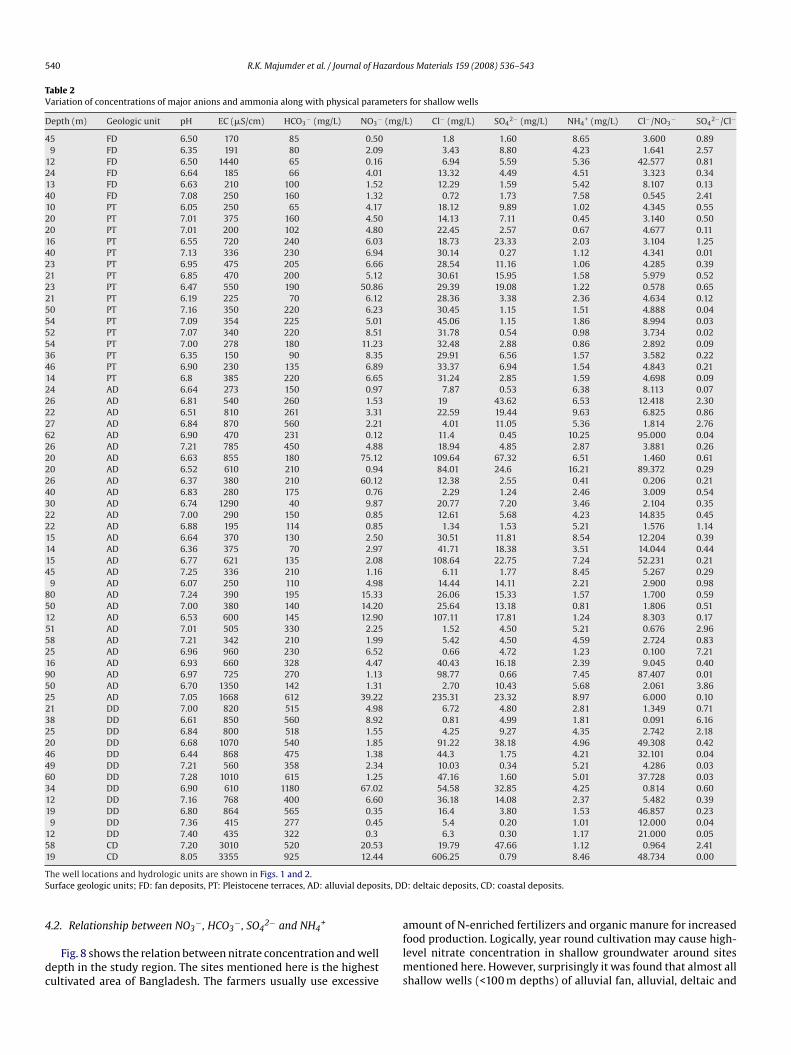
Table 2Variation of concentrations of major anions and ammonia along with physical parameters for shallow wells
Depth (m) Geologic unit pH EC (�S/cm) HCO3− (mg/L) NO3
− (mg/L) Cl− (mg/L) SO42− (mg/L) NH4
+ (mg/L) Cl−/NO3− SO4
2−/Cl−
45 FD 6.50 170 85 0.50 1.8 1.60 8.65 3.600 0.899 FD 6.35 191 80 2.09 3.43 8.80 4.23 1.641 2.57
12 FD 6.50 1440 65 0.16 6.94 5.59 5.36 42.577 0.8124 FD 6.64 185 66 4.01 13.32 4.49 4.51 3.323 0.3413 FD 6.63 210 100 1.52 12.29 1.59 5.42 8.107 0.1340 FD 7.08 250 160 1.32 0.72 1.73 7.58 0.545 2.4110 PT 6.05 250 65 4.17 18.12 9.89 1.02 4.345 0.5520 PT 7.01 375 160 4.50 14.13 7.11 0.45 3.140 0.5020 PT 7.01 200 102 4.80 22.45 2.57 0.67 4.677 0.1116 PT 6.55 720 240 6.03 18.73 23.33 2.03 3.104 1.2540 PT 7.13 336 230 6.94 30.14 0.27 1.12 4.341 0.0123 PT 6.95 475 205 6.66 28.54 11.16 1.06 4.285 0.3921 PT 6.85 470 200 5.12 30.61 15.95 1.58 5.979 0.5223 PT 6.47 550 190 50.86 29.39 19.08 1.22 0.578 0.6521 PT 6.19 225 70 6.12 28.36 3.38 2.36 4.634 0.1250 PT 7.16 350 220 6.23 30.45 1.15 1.51 4.888 0.0454 PT 7.09 354 225 5.01 45.06 1.15 1.86 8.994 0.0352 PT 7.07 340 220 8.51 31.78 0.54 0.98 3.734 0.0254 PT 7.00 278 180 11.23 32.48 2.88 0.86 2.892 0.0936 PT 6.35 150 90 8.35 29.91 6.56 1.57 3.582 0.2246 PT 6.90 230 135 6.89 33.37 6.94 1.54 4.843 0.2114 PT 6.8 385 220 6.65 31.24 2.85 1.59 4.698 0.0924 AD 6.64 273 150 0.97 7.87 0.53 6.38 8.113 0.0726 AD 6.81 540 260 1.53 19 43.62 6.53 12.418 2.3022 AD 6.51 810 261 3.31 22.59 19.44 9.63 6.825 0.8627 AD 6.84 870 560 2.21 4.01 11.05 5.36 1.814 2.7662 AD 6.90 470 231 0.12 11.4 0.45 10.25 95.000 0.0426 AD 7.21 785 450 4.88 18.94 4.85 2.87 3.881 0.2620 AD 6.63 855 180 75.12 109.64 67.32 6.51 1.460 0.6120 AD 6.52 610 210 0.94 84.01 24.6 16.21 89.372 0.2926 AD 6.37 380 210 60.12 12.38 2.55 0.41 0.206 0.2140 AD 6.83 280 175 0.76 2.29 1.24 2.46 3.009 0.5430 AD 6.74 1290 40 9.87 20.77 7.20 3.46 2.104 0.3522 AD 7.00 290 150 0.85 12.61 5.68 4.23 14.835 0.4522 AD 6.88 195 114 0.85 1.34 1.53 5.21 1.576 1.1415 AD 6.64 370 130 2.50 30.51 11.81 8.54 12.204 0.3914 AD 6.36 375 70 2.97 41.71 18.38 3.51 14.044 0.4415 AD 6.77 621 135 2.08 108.64 22.75 7.24 52.231 0.2145 AD 7.25 336 210 1.16 6.11 1.77 8.45 5.267 0.29
9 AD 6.07 250 110 4.98 14.44 14.11 2.21 2.900 0.9880 AD 7.24 390 195 15.33 26.06 15.33 1.57 1.700 0.5950 AD 7.00 380 140 14.20 25.64 13.18 0.81 1.806 0.5112 AD 6.53 600 145 12.90 107.11 17.81 1.24 8.303 0.1751 AD 7.01 505 330 2.25 1.52 4.50 5.21 0.676 2.9658 AD 7.21 342 210 1.99 5.42 4.50 4.59 2.724 0.8325 AD 6.96 960 230 6.52 0.66 4.72 1.23 0.100 7.2116 AD 6.93 660 328 4.47 40.43 16.18 2.39 9.045 0.4090 AD 6.97 725 270 1.13 98.77 0.66 7.45 87.407 0.0150 AD 6.70 1350 142 1.31 2.70 10.43 5.68 2.061 3.8625 AD 7.05 1668 612 39.22 235.31 23.32 8.97 6.000 0.1021 DD 7.00 820 515 4.98 6.72 4.80 2.81 1.349 0.7138 DD 6.61 850 560 8.92 0.81 4.99 1.81 0.091 6.1625 DD 6.84 800 518 1.55 4.25 9.27 4.35 2.742 2.1820 DD 6.68 1070 540 1.85 91.22 38.18 4.96 49.308 0.4246 DD 6.44 868 475 1.38 44.3 1.75 4.21 32.101 0.0449 DD 7.21 560 358 2.34 10.03 0.34 5.21 4.286 0.0360 DD 7.28 1010 615 1.25 47.16 1.60 5.01 37.728 0.0334 DD 6.90 610 1180 67.02 54.58 32.85 4.25 0.814 0.6012 DD 7.16 768 400 6.60 36.18 14.08 2.37 5.482 0.3919 DD 6.80 864 565 0.35 16.4 3.80 1.53 46.857 0.239 DD 7.36 415 277 0.45 5.4 0.20 1.01 12.000 0.04
12 DD 7.40 435 322 0.3 6.3 0.30 1.17 21.000 0.0558 CD 7.20 3010 520 20.53 19.79 47.66 1.12 0.964 2.41
TS its, DD
4
dc
19 CD 8.05 3355 925 12.44
he well locations and hydrologic units are shown in Figs. 1 and 2.urface geologic units; FD: fan deposits, PT: Pleistocene terraces, AD: alluvial depos
.2. Relationship between NO3−, HCO3
−, SO42− and NH4
+
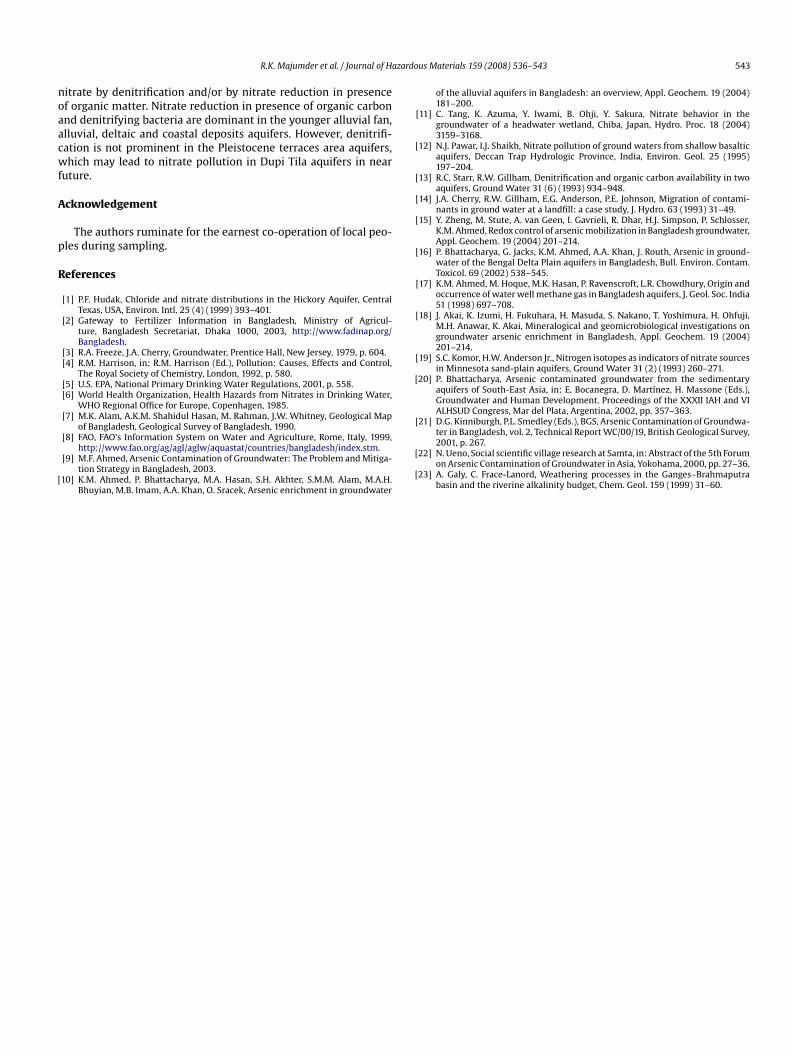
Fig. 8 shows the relation between nitrate concentration and wellepth in the study region. The sites mentioned here is the highestultivated area of Bangladesh. The farmers usually use excessive
aflms
606.25 0.79 8.46 48.734 0.00
: deltaic deposits, CD: coastal deposits.
mount of N-enriched fertilizers and organic manure for increasedood production. Logically, year round cultivation may cause high-evel nitrate concentration in shallow groundwater around sites
entioned here. However, surprisingly it was found that almost allhallow wells (<100 m depths) of alluvial fan, alluvial, deltaic and
R.K. Majumder et al. / Journal of Hazardous Materials 159 (2008) 536–543 541
Table 3Variation of concentrations of major anions and ammonia along with physical parameters for deep wells and river water
Depth (m) Geologic unit pH EC (�S/cm) HCO3− (mg/L) NO3
− (mg/L) Cl− (mg/L) SO42− (mg/L) NH4
+ (mg/L) Cl−/NO3− SO4
2−/Cl−
132 DD 7.28 620 390 0.85 12.76 0.85 0.31 15.08 0.066280 DD 7.65 1640 405 4.94 371.00 11.17 0.53 75.10 0.030270 DD 8.84 845 445 3.18 54.77 3.40 0.48 17.22 0.062265 CD 8.20 2670 440 1.55 491.28 0.25 3.26 316.95 0.001301 CD 7.22 1350 340 5.28 118.56 0.41 2.46 22.45 0.003230 DD 6.75 1310 325 0.21 261.5 21.30 1.25 1245.24 0.081200 DD 6.90 995 654 0.30 194 0.20 1.36 646.67 0.001170 AD 7.04 260 150 1.19 0.88 1.26 4.65 0.74 1.426205 AD 7.03 340 215 55.23 3.81 0.36 15.32 0.07 0.094280 AD 7.01 332 150 52.36 5.32 1.65 16.81 0.10 0.310210 AD 6.96 810 380 40.78 115.32 0.91 14.26 2.83 0.008220 AD 7.21 970 233 1.37 213.00 4.63 2.58 155.47 0.022210 AD 6.50 1940 70 2.70 597.00 26.6 1.28 221.11 0.045210 AD 6.22 2985 615 0.80 233 23.58 2.39 291.25 0.101374 DD 6.99 391 253 0.4 3.5 0.50 1.42 8.75 0.143240 DD 6.74 610 215 0.25 125 2.70 1.02 500.00 0.022
0 River water 6.95 200 122 2.1 2.03 12.21 ND 0.967 6.01
WS its.
c(nvblclta
lrtrsd
F
lSeAvae
t
4
0 River water 8.3 230 120 0.980 River water 7.72 420 250 2.32
ell locations and hydrologic units are shown in Figs. 1 and 2.urface geologic units; AD: alluvial deposits, DD: deltaic deposits, CD: coastal depos
oastal deposits areas (Fig. 2) had shown low nitrate concentrations<20 mg/L) and only four samples exceeded 50 mg/L (Fig. 8). Lowitrate concentrations in the shallow groundwater aquifers of allu-ial fan, alluvial, deltaic and coastal deposits aquifers (Fig. 2) maye due to denitrification process resulting from chemically or bio-
ogically mediated reduction of nitrate to N2 in presence of organicarbon and denitrifying bacteria. The Pleistocene terraces area shal-ow groundwaters showed relatively higher nitrate concentrationshan that of shallow groundwaters from the fan, alluvial, deltaicnd coastal groundwaters.
Starr and Gillham [13] reported that the presence of nitrate,abile organic carbon, denitrifying bacteria and a reducing envi-onment are suitable for denitrification. Denitrification is expected
o occur only in the zones that are devoid of dissolved oxygen andich in denitrifying bacteria [14]. In this study, most of the shallowamples collected from the alluvial fan, alluvial, deltaic and coastaleposits are characterized by high HCO3− concentration. The shal-
ig. 7. Spatial distribution of deep groundwater Cl− concentrations in the study area.
fidwel(oa
Ftd
10.52 14.98 ND 10.735 1.427.02 12.74 ND 3.026 1.81
ow groundwaters are also characterized by low dissolved O2 [15].uch a bicarbonate and oxygen scarcity environment should gen-rate a strongly reducing environment within the shallow aquifers.bove all, Bhattacharya et al. [16] noticed that the Holocene allu-ial sediments of Bengal delta are rich in organic matter and thequifers are mostly reducing in nature [17], which can create ambi-nt conditions for the growth of aerobic bacteria [18].
Nitrate reduction by organic carbon leading to high concentra-ion of HCO3
− can be expressed as
NO3− + 5C + 2H2O → 2N2 + 4HCO3
− + CO2 (1)
In this study, shallow groundwater nitrate concentrations ofan, alluvial, deltaic and deltaic deposits areas decrease with anncrease of HCO3
− concentrations (Fig. 9) that is a clear evidence ofenitrification within the above-mentioned aquifers. Deep ground-aters also show similar decreasing trend of NO3
− that is also anvidence of denitrification. However, the Pleistocene terraces shal-
ow groundwaters NO3− concentrations remain more or less stableFig. 9) with respect to HCO3
− concentrations. It is a clear indicationf low or absence of denitrification within the Pleistocene terracesquifers.
ig. 8. Dependence of NO3− concentrations as a function of depth. PT: Pleistocene
erraces, AD: alluvial deposits, DD: deltaic deposits, CD: coastal deposits, FD: faneposits, DW: deep well.

542 R.K. Majumder et al. / Journal of Hazardous Materials 159 (2008) 536–543
Fr
b
4
N
taaboTlNPldTi(wao
Fs
FN
oaaoatutgaa
ts
1
t
ig. 9. Relationship between HCO3− and NO3
− concentrations. PT: Pleistocene ter-aces, SW: shallow well, DW: deep well.
Denitrification is expected to occur in presence of denitrifyingacteria and can be summarized as [19];
NO3− + 5CH2O → 2N2 (gas) + 5HCO3
− (2)
O3− + H2O + CH2O → NH4
+ + 2HCO3− (3)
Fig. 10 shows the relation between NO3− and NH4
+ concen-rations. The presence of NH4
+ (ranging from 0.41 to 14.45 mg/L)nd high HCO3
− concentrations in shallow groundwaters (of fan,lluvial, deltaic and coastal deposits aquifers) suggest the possi-le bacterial denitrification as stated above. Microbial degradationf organic matter in those aquifers caused the reduction of NO3
−.he increasing concentrations of NH4
+ (up to 13.2 mg/L) in shal-ow groundwater were also observed by Bhattacharya [20]. LowerH4
+ concentrations (Fig. 10) were observed in groundwaters inleistocene terraces areas (Dupi Tila aquifers) compared to shal-ow aquifers of the study area which may be due to insignificantenitrification (both chemical and bacterial) processes in the Dupiila aquifers in the absence of sufficient organic carbon and den-
trifying bacteria. According to BGS [21] report, Dupi Tila aquifersTable 2) were thoroughly oxidized during its geological evolutionhich resulted a decrease in organic matter concentration in thequifers. In addition, Ueno [22] found that bacteria may consumerganic matters more easily from younger sediments than that
ig. 10. Dependency of NH4+ on NO3
− concentrations. PT: Pleistocene terraces, SW:hallow well.
NctodFiwn
5
tfooTwtvcdfd
ig. 11. Relationship between SO42− with NO3
− concentrations for shallow wells.umber of wells: 64, r2: 0.27.
f older sediments. Above observation also validates that the lownd/or absence of denitrification process within the older Dupi Tilaquifers which may allow a rise of relatively higher concentrationsf NO3
− in that aquifers. High nitrate concentration (>40 mg/L) waslso observed in alluvial deposits deep wells. The high concentra-ions of NO3
− in alluvial deposits deep wells may be due to excessivese of nitrogen fertilizers and animal waste leading to the percola-ion of NO3
− into the highly transmissive (2325 m2 d−1) [21] coarserained deeper aquifer materials. This NO3
− accumulation may bepossible evidence of nitrate pollution in deeper alluvial depositsquifers in near future.
Denitrification in presence of pyrite is also possible if genera-ion of high SO4
2− concentration occurs according to the followingcheme
4NO3− + 5FeS2 + 4H+ → 7N2 + 10SO4
2− + 5Fe2+ + 2H2O (4)
Most of the shallow groundwater shows low SO42− concen-
rations having no straight relationship (r2 = 0.27) with SO42−and
O3− (Fig. 11). In an addition, Ahmed et al. [10] found an insignifi-
ant amount of pyrite in shallow aquifer sediments of Bengal Deltahat might not be responsible for nitrate reduction. Therefore, ourbservation exhorts that denitrification in presence of pyrite is notominant within aquifers of the study area. In addition, Galy andrace-Lanord [23] reported that denitrification in presence pyrites related to high SO4
2−/Cl− ratio. In the present study, the ground-ater samples show low SO4
2−/Cl− ratio (Tables 2 and 3) which isot favorable for nitrate reduction in presence of pyrite.
. Conclusions
The results suggest that the NO3− concentrations of Pleistocene
erraces groundwater aquifers are relatively higher than the alluvialan, alluvial, deltaic and coastal deposits aquifer groundwater. Mostf the deep groundwaters have shown insignificant concentrationsf NO3
− having a few high concentrations in some pocket areas.he high NO3
− concentrations in alluvial deposits deep ground-ater may be due to infiltration of NO3
− into the deeper aquifershrough the highly transmissive (2325 m2 d−1) coarse-grained allu-
ial materials. Thus, the proper installation of deep wells andareful land-use planning may alleviate future contamination ofeep groundwater aquifers. The relatively higher C1−/NO3− ratiosor the shallow well samples collected from the alluvial fan, alluvial,eltaic and coastal region are the indicative of efficient removal of
zardo
noaacwf
A
p
R
[
[
[
[
[
[
[
[
[
[
[
[
R.K. Majumder et al. / Journal of Ha
itrate by denitrification and/or by nitrate reduction in presencef organic matter. Nitrate reduction in presence of organic carbonnd denitrifying bacteria are dominant in the younger alluvial fan,lluvial, deltaic and coastal deposits aquifers. However, denitrifi-ation is not prominent in the Pleistocene terraces area aquifers,hich may lead to nitrate pollution in Dupi Tila aquifers in near
uture.
cknowledgement
The authors ruminate for the earnest co-operation of local peo-les during sampling.
eferences
[1] P.F. Hudak, Chloride and nitrate distributions in the Hickory Aquifer, CentralTexas, USA, Environ. Intl. 25 (4) (1999) 393–401.
[2] Gateway to Fertilizer Information in Bangladesh, Ministry of Agricul-ture, Bangladesh Secretariat, Dhaka 1000, 2003, http://www.fadinap.org/Bangladesh.
[3] R.A. Freeze, J.A. Cherry, Groundwater, Prentice Hall, New Jersey, 1979, p. 604.[4] R.M. Harrison, in: R.M. Harrison (Ed.), Pollution: Causes, Effects and Control,
The Royal Society of Chemistry, London, 1992, p. 580.[5] U.S. EPA, National Primary Drinking Water Regulations, 2001, p. 558.[6] World Health Organization, Health Hazards from Nitrates in Drinking Water,
WHO Regional Office for Europe, Copenhagen, 1985.[7] M.K. Alam, A.K.M. Shahidul Hasan, M. Rahman, J.W. Whitney, Geological Map
of Bangladesh, Geological Survey of Bangladesh, 1990.
[8] FAO, FAO’s Information System on Water and Agriculture, Rome, Italy, 1999,http://www.fao.org/ag/agl/aglw/aquastat/countries/bangladesh/index.stm.[9] M.F. Ahmed, Arsenic Contamination of Groundwater: The Problem and Mitiga-
tion Strategy in Bangladesh, 2003.10] K.M. Ahmed, P. Bhattacharya, M.A. Hasan, S.H. Akhter, S.M.M. Alam, M.A.H.
Bhuyian, M.B. Imam, A.A. Khan, O. Sracek, Arsenic enrichment in groundwater
[
[
us Materials 159 (2008) 536–543 543
of the alluvial aquifers in Bangladesh: an overview, Appl. Geochem. 19 (2004)181–200.
11] C. Tang, K. Azuma, Y. Iwami, B. Ohji, Y. Sakura, Nitrate behavior in thegroundwater of a headwater wetland, Chiba, Japan, Hydro. Proc. 18 (2004)3159–3168.
12] N.J. Pawar, I.J. Shaikh, Nitrate pollution of ground waters from shallow basalticaquifers, Deccan Trap Hydrologic Province, India, Environ. Geol. 25 (1995)197–204.
13] R.C. Starr, R.W. Gillham, Denitrification and organic carbon availability in twoaquifers, Ground Water 31 (6) (1993) 934–948.
14] J.A. Cherry, R.W. Gillham, E.G. Anderson, P.E. Johnson, Migration of contami-nants in ground water at a landfill: a case study, J. Hydro. 63 (1993) 31–49.
15] Y. Zheng, M. Stute, A. van Geen, I. Gavrieli, R. Dhar, H.J. Simpson, P. Schlosser,K.M. Ahmed, Redox control of arsenic mobilization in Bangladesh groundwater,Appl. Geochem. 19 (2004) 201–214.
16] P. Bhattacharya, G. Jacks, K.M. Ahmed, A.A. Khan, J. Routh, Arsenic in ground-water of the Bengal Delta Plain aquifers in Bangladesh, Bull. Environ. Contam.Toxicol. 69 (2002) 538–545.
17] K.M. Ahmed, M. Hoque, M.K. Hasan, P. Ravenscroft, L.R. Chowdhury, Origin andoccurrence of water well methane gas in Bangladesh aquifers, J. Geol. Soc. India51 (1998) 697–708.
18] J. Akai, K. Izumi, H. Fukuhara, H. Masuda, S. Nakano, T. Yoshimura, H. Ohfuji,M.H. Anawar, K. Akai, Mineralogical and geomicrobiological investigations ongroundwater arsenic enrichment in Bangladesh, Appl. Geochem. 19 (2004)201–214.
19] S.C. Komor, H.W. Anderson Jr., Nitrogen isotopes as indicators of nitrate sourcesin Minnesota sand-plain aquifers, Ground Water 31 (2) (1993) 260–271.
20] P. Bhattacharya, Arsenic contaminated groundwater from the sedimentaryaquifers of South-East Asia, in: E. Bocanegra, D. Martı́nez, H. Massone (Eds.),Groundwater and Human Development. Proceedings of the XXXII IAH and VIALHSUD Congress, Mar del Plata, Argentina, 2002, pp. 357–363.
21] D.G. Kinniburgh, P.L. Smedley (Eds.), BGS, Arsenic Contamination of Groundwa-
ter in Bangladesh, vol. 2, Technical Report WC/00/19, British Geological Survey,2001, p. 267.22] N. Ueno, Social scientific village research at Samta, in: Abstract of the 5th Forumon Arsenic Contamination of Groundwater in Asia, Yokohama, 2000, pp. 27–36.
23] A. Galy, C. Frace-Lanord, Weathering processes in the Ganges–Brahmaputrabasin and the riverine alkalinity budget, Chem. Geol. 159 (1999) 31–60.