bangladesh - world bank documents
TRANSCRIPT
Report No- 7545-BD ,
Bangladesh: Public Expenditure ReviewPublic Resource Management Duringthe Fourth Five-Year Plan, FY91-95March 13,1989
Asia Country Department I
FOR OFFICIAL USE ONLY
- 5-
only in the performnce of their officil duties. its contets may n t otherwis
be disclosed withoutW orU~~~~~~~~~~~ .. . .~~~~~~~~~~~
, , i %, 7
...~~~~~~~~~~~~~~~~~~~~~~~~~~~~~~~~~~~~~~I.Document of the World Bank~~ .
Thi dcmnhaaretitddsrbtnanmabeuebyecpnsonly~ intepromneo hi fiildte.Iscnet a Q tews
be disclosed without Wqrld Bank authorization.~~~~~~~~~1
Pub
lic D
iscl
osur
e A
utho
rized
Pub
lic D
iscl
osur
e A
utho
rized
Pub
lic D
iscl
osur
e A
utho
rized
Pub
lic D
iscl
osur
e A
utho
rized
Pub
lic D
iscl
osur
e A
utho
rized
Pub
lic D
iscl
osur
e A
utho
rized
Pub
lic D
iscl
osur
e A
utho
rized
Pub
lic D
iscl
osur
e A
utho
rized
CURRENCY EQUIVALENTS
The external value of the Bangladesh Taka (Tk) is fixed in relation to a basketof reference currenries, with the US Dollar serving as the intervention currency.The official exchange rate on January 'I, 1989 was Tk 32.27 per US Dollar.
USS . = Tk 32.27Tk 1 = US$0.031
Following local convention, government expenditures and revenues are denominatedin units of crore (abbreviated Tk Cr), which are equal to 10 million taka. Atthe current official exchange rate, Tk Cr 1.0 = US$322,700.
In this report, US$ is sometimes abbreviated to $.
WEIGHTS AND MEASURES
1 acre = 0.405 hectare (ha)1 mscf = 1 million standard cubic feet1 tpy = 1 ton per year
FISCAL YEAR (FY)
July 1 - June 30
FOR OMCIAL USE ONLY
List of Abbreviation. and Aeronym Use
ADP - Annual Devolopmnt ProgramAMRF - Agricultural and Rural Guarantee Fund
MAc - Bangladh Agricultural Development CooperationBARC - Bangledeh Agricultural Reserch CouncilSI - Bangldesh Agricultural Research Institut.Be - Bangladesh BankBBS - Bangldesh Bur of StatisticsSCIC - Bangladesh Chwical Industries Corp-rvtionBFDC - Bangladesh Fishorl Developmnt CorporationBFIDC - Bangladesh Forest Industries Developmnt CorporatlonBIWlA - Bangladesh Inland Water Transport AuthorityBI" rc - Bangladesh Inland Water Transport CorporationBJv, - Bangladesh Jute CorporationBJIIC - Bangladesh Jute Mills CorporationBKB - Bangladesh Kriahi (Agriculture) BankBIR - Balancing, Modernization and RehabilitationBoGUC - Bangladesh Oil, Gas and Minorals CorporationBPC - Bangladesh Petroleum Corporation0PDB - Bangladesh Power Developmnt BoardBR - Bangladesh RailwaysBRAC - Bangladesh Rural Advancemnt CommitteeBROB - Bangladesh Rural Development BoardRRTC - Bangladesh Road Transport CorporationBSB - Bangladesh Shilpa BankBSC - Bangladeh Shipping CorporationBSCIC - Bangladesh Small and Cottage Industries CorporationBSEC - Bangladesh Steel and Engineering CorporationBSFIC - Bangladeslh Sugar and Food Industries CorporationBSRS - Bangladesh Shipa gin SangethaBTMC - Bangladesh Textile Mills CorporationOTTO - Bangladeh Telephone and Talegraph Board-BU8 - Bangladesh Water Development Board
CAO - Chiet Accounts OfticerCCIE - Chief Controller of Imports and Export.COST - Custowm Duties and Sales TaxCEM - Country Economic MemorandumCPA - Chittagong Port AuthorityCWASA - Chittagong Water Supply and Sewrage Authority
DAE - Department of Agricultural ExtensionDFI - Development Finance InstitutionDLS - Department of Livestock ServicesDOF - Departmnt of FishoriesDIW - D Op TubewellDWASA - Dhaka Water Supply and Swerage Authority
ERD - External Resources DepartmentERR - Economic Rate of Return
FCD - Flood Control and DrainageFCDI - Flood Control, Drainage and IrrigationFFW - Food For WorkFFYP - Fourth Five Yer PlanFRR - Financial Rate of ReturnFWA - Family Welfare Assistant
HBFC - Housx Building Finance CorporationHW - High Yielding Variety
This document has a restricted distribution and may be used by recipients only in the performanceof their official duties. Its contents may not otherwise be disclosed without World Bank authorization.
ICe - International Competitive BiddingICOR - Incremental Capital-Output RatioIDA - International Development AssociatlonIMED - Implementation Monitorlng and Evaluation DopartmentIMF - Internotlonal Monetary FundIWT - Inland Water Transport
KSS - Krilhak Samaboy Sanity (village cooperatives)
./C - Letter of CreditLCG - Local Consultations GroupLG0 - Local Government Enginoering BureauLLP - Low-Lift Pump
UCK - Maternal *ad Child HalthMFL - Ministry of Fisheries *nd LlvestockMIWDFC - Mil stry of Irrigation, Water Devvlopment and Flood ControlULOROC - Ministry of Local Government, Rural Development and CooperativemNS - Modifiod New ScaloMOA - Ministry of Agriculture and ForestMTFPP - Medium Term Foodgrain Production Plan
NCB - Notionalized Commercial BankMOO - Non-Oovernu nt OrganizationNIP - Now Industrial PolicyNW - National Water Plan
OhM - Operations and Maintenance
PBS - Palli Bidyat Samities (rural electrification cooperatives)PFDS - Public Food Distribution SystemPIP - Priority Investment PlanPourashava - urban government bodyPP - Pro ect ProformaPPP - Pr liminory Pro-ect ProformaPTI - Primary Teachors InstitutePWD - Public Works Department
REB - RuraP Eloectrification BoardRHD - Roa'4s and Highways DepartmntRIP - Reulsd Industrial Policy
SEM - Stcondary Foreign Exchange MarketSSC - Secondary School Cart0fleateSTW - Shallow Tubewell
TFYP - Third Five Yer PlanTIP - Trade and Industrial Policy StudyTk Cr - One Crore (10 million) Take
UHC - Upnzila Health CenterUHFWC - Union Health and Family Welfare ClinicULDC - Upezils Livestock Devolopment CenterUNDP - United Nations Development ProgramUpszila - rural government bodyUPE - Universal Primary Education
VGD - Vulnerable Group Development
TITLEs PUBLIC EXPENDITURE REVIEW: PUBLIC RESOURCE MANAGEMENT DURINGTHE FOURTH FIVE-YEAR PLAN, FY91-95
COUNTRY: BANGLADESH
REGION: ASIA COUNTRY DEPARTMENT I
SECTOR: COUNTRY ECONOMIC v
REPORT TYPE CLASSIF MNIYY LANGUAGES7545-BD CER Restricted 03 89 English
PUBDATE: 8903
ABSTRACT: Public revenues and expenditures have historically been low inBangladesh in comparison to other low income countrics. During the1980s, the government's primary objectives in fiscal policy havebeen to promote financial stability and subsequently to rehabilitatethe economy after a devastating sequence of natural disasters. Thetime is now apprupriate for the Government to adopt a more growth-oriented policy stance in order to reap the benefits from itsprogram of structural reforms. The public expefditure program canplay a major role in this direction by providing a stimulus todomestic demand anI by improving the infrastructure and publicservices needed to sustain growth in the medium term. This reportprovides an evaluation of the current public expenditure program andoffers concrete suggestions to improve the composition, performanceand resource mobilization potential of public programs. The reportis divided into two parts. Part I focuses on inter-sectoralexpenditure issues, including the macroeconomic framework for thepublic expenditure program, priorities for domestic resourcemobilization and reprioritization of the expenditure program,implementation issues, planning, budgeting, and expenditure control,and compensation and employment policies. Part II provides a moredetailed assessment of the public expenditure program in agricultureand water resources, industry, energy and natural resources,transportation and communications, education, health and familyplanning, and local infrastructure.
TABLE OF CONTENTS
BANGLADESH: PUBLIC EXPENDITURE REVIEW
PUBLIC RESOURCE MANAGEMENT DURING THE FOURTH FIVE-YEAR PLAN, FY91-95
COUNTRY DATA
EXECUTIVE SUMMARY
INTRODUCTION
PART I: INTER-SECTORAL EXPENDITURE ISSUES
Chapter Is Overview of the Public Expenditure Program . . . . . . . . . . . . 1A. The Structure of Public Expenditures ... . . . . . . . . . . .... 3
Total Revenues and Expenditures ... . . . . . . . . . . . . 3Functional Composition of the Expenditure Program . . . . . . 5Sources and Uses of Funds ... . . . . . . . . . . . . . .. 8Management of Public Expenditures . . . . . . . . . . . . . . 11Utilization of External Aid .... . . . . . . . . . . . . . 12
B. Priorities for Public Expenditure Reform . . . . . . . . . . . . . . 13
Chapter II: Financing the Public Expenditure Program . . . . . . . . . . . . . 17A. Increasing Economic Growth ..... .. . . . . ... ...... . 17B. Public Resource Mobilization . . . . . . . . . . . . . . . . . . . . 22
Tax Revenues ...... .. .. .. .. ......... . 22Non-tax Revenues . . . . . . . . . . . . . . . . . . . . . . 24Self-Generated Resources. . . . . . . . . . . . . . . . . . 31Deficit Financing ......... . .. .......... . 32External Donor Assistance ... . . . . . . ....... . . 32
C. Suummary .... . . . . . . . . . . . . . . . . ...... . . . . . 34
Chapter III: Sectoral Expenditure Progrdms . . . . . . . . . . . . .. . . . 35A. Inter-Sectoral Expenditure Issues .. .36B. Synopsis of Sectoral Expenditure Programs . . . . . . . . . . . . . . 43
Agriculture and Water Resources . . . . . . . . . . . . . . . 43Industry ... 48Energy and Natural Resources. .. . 49Transportation and Communications . . . . . . . . . . . . . . 52Education ... 55Health and Population Control . . . . . . . . . . . . . . . . 59Local Infrastructure ... . . . . . . . . ...... . . . 61
Chapter IVt Implementation of the Public Expenditure Program ... . . . . . . 65A. Project Implementation ... 65
The Core Investment Program .66Strengthening the Core Approach . . . . . . . . . . . . . . . 70Summary .73
Other Implementation Problems .74Procurement .74Recruitment and Staffing of Project Entities . . . . . . . . 75Technical Assistance .76Land Acquisition .78Project Monitoring .78
B. Commodity Aid Utilization .79
C. Operations and Maintenance .... . . . . . . . . . . . . . . . . . 83Flood Control, 'rainage _nd Irrigation (FCDI) . . . . . . . . 84Roads . . . . . . . . . . . . . . . . . . . . . . . . . . . . 85Recommendations .... . . . . . . . . . . . . . . . . . . . 87
Chapter Vs Management of the Public Expenditure Program . . . . . . . . . . . 91A. Plannisig, Budgeting and Expenditure Control . . . . . . . . . . . . . 91
Planning . . . . . . . . . . . . . . . . . . . . . . . . . . . . . 92Budgeting . . . . . . . . . . . . . . . . . . . . . . . . . . . . . . 96Accountisig and Expenditure Control ... . . . . . . . . . . . . . . 98Sunmary ............................. . 100
B. Employment and Compensation .................... . 100Employment Levels . . . . . . . . . . . . . . . . . . . . . . . . . 102Compensation Policy ....................... . 105Fringe Benefits . . . . . . . . . . . . . . . . . . . . . . . . . . 109Summary .... . . . . . . . . . . . . . . . . . . . . . . . . . . 112
PART II: SECTORAL EXPENDITURE PROGRAMS
Chapter VI: Agriculture and Water Resources . . . . . . . . . . . . . . . . 115Flood Rehabilitation .... . . . . . . . . . . . . . . . . 117
Expenditure Trends in Agriculture ... . . . . . . . . . . . . . . 117Detailed Expenditure Programs . . . . . . . . . . . . . . . . . . 122Crop Agriculture . . . . . . . . . . . . . . . . . . . . . . . . . 122
Agricultural Extension ... . . . . . . . . . . . . . . . . 122Agricultural Research ... . . . . . . . . . . . . . . . . . 124Input Supply .... . . . . . . . . . . . . . . . . . . . . 124Foodgrain Storage and Foodstock Management . . . . . . . . . 126Agricultural Credit ... . . . . . . . . . . . . . . . . . . 128Other Programs .... . . . . . . . . . . . . . . . . . . . 133
Water Resources . . . . . . . . . . . . . . . . . . . . . . . . . . 133Forest, Fisheries and Livestock .142
Forest .142Fisheries .143Livestock .144
Rural Development and Institutions .145Cooperatives . . . . . . . . . . . . . . . . . . . . . . . . 145Rural Infrastructure . 146
SuImmary . . . . . . . 146
Chapter VII: Industry . . . . . . . . . . . . . . . . . . . . . . . . . . . . 149Fertilizer . 155Other Chemical Industries . 159Jute . 160Textiles . 161Steel and Engineering . . . . . . . . . . . . . . . . . . . . 162Sugar Industries . 163Other Industries . . . . . . . . . . . . . . . . . . . . . . 163Industrial Development Term Lending . . .. . . . . . . 163Summary . . . . . . . . . . . . . . . . . . . . . . . . . . . 164
Chapter VIII: Energy and Natural Resources . . . . . . . . . . . . . . . . . . 165)etailed Expenditure Programs . 171
Power Development . 171Rural Electrification . 172Natural Gas . . . . . . . . . . . . . . . . . . . . . . . . . 172Petroleum . 173
Summary .174
iii
Chapter IX: Transportation and Communications . . . . . . . . . . . . . . . . 175Transportation Sector Priorities . . . . . . . . . . . . . . 177
Roads . . . . . . . . . . . . . . . . . . . . . . . . . . . . . . . 178Road Maintenance and Rehabilitation . . . . . . . . . . . . . 180Bridges . . . . . . . . . . . . . . . . . . . . . . . . . . . 182Road User Charges. . . . . . . . . . . . . . . . . . . . . . . 185Bangladesh Road Transport Corporation . . . . . . . . . . . . 186
Railroads. ................ 186Inland Water . . . . . . . . . . . . . . . . . . . . . . . . . . 191
BIWTA . . . . . . . . . . . . . . . . . . . . . . . . . . . . 191BIWTC . . . . . . . . . . . . . . . . . . . . . . . . . . . . 191
Marine . . . . . . . . . . . . . . . . . . . . . . . . . . . . . . 192Chittagong Port Authority . . . . . . . . . . . . . . . 192Shipping. ................ 192
Aviation. ................. 193Civil Aviation . . . . . . . . . . . . . . . . . . . . . . . 193Biman. ................ 193
Communications . . . . . . . . . . . . . . . . . . . . . . . . . . 194Bangladesh Telephone and Telegraph Board . . . . . . . . . . 194Post Office .. 195
Summary .. 195
Chapter X: Education .197Education Costs . . . . . . . . . . . . . . . . . . . . . . . . . . 199
Educational Wastage . . . . . . . . . . . . . . . . . . . . 199Unit Costs . . . . . . . . . . . . . . . . . . . . . . . . . 200Cost Containment . . . . . . . . . . . . . . . . . . . . . . 201
Fiscal Implications of Universal Primary Education . . . . . . . . 202Detailed Expenditure Programs . . . . . . . . . . . . . . . . . . . 205
Primary Education . . . . . . . . . . . . . . . . . . . . . . 205Secondary and Higher Education . . . . . . . . . . . . . . . 206Vocational and Technical Education . . . . . . . . . . . . . 207Universities . 207Cost Recovery . . . . . . . . . . . . . . . . . . . . . . . . 208
Summary . . . . . . . . . . . . . . . . . . . . . . . . . . . . . . 208
Chapter XI: Health and Population Control . . . . . . . . . . . . . . . . . . 211Flood Rehabilitation . . . . . . . . . . . . . . . . . . . . 214Donor Coordination . . . . . . . . . . . . . . . . . . . . . 214
Fiscal Implications of Current Health Programs . . . . . . . . . . 215Family Planning . . . . . . . . . . . . . . . . . . . . . . . z18
Summary . . . . . . . . . . . . . . . . . . . . . . . . . . . . . . 218
Chapter XII: Local Infrastructure . . . . . . . . . . . . . . . . . . . . . . 221Financial Management . . . . . . . . . . . . . . . . . . . . 224Local Revenues . . . . . . . . . . . . . . . . . . . . . . . 225Flood Rehabilitation . . . . . . . . . . . . . . . . . . . . 226
Urban Infrastructure . . . . . . . . . . . . . . . . . . . . . . . 226Rural Infrastructure . . . . . . . . . . . . . . . . . . . . . . . 227Water Supply and Sanitation . . . . . . . . . . . . . . . . . . . . 227
Dhaka .227Chittagong . . . . . . . . . . . . . . . . . . . . . . . . . 228Other . . . . . . . . . . . . . . . . . . . . . . . . 228
Public Housing and Other Government Buildings . . . . . . . . . . . 229Summary . . . . . . . . . . . . . . . . . . . . . . . . . . . . . . 229
ANNEX
MAP
Page 1 of 2
COUNTRY DAtA - BANGLADRSH
muI WCNlIJU2HD (1985) DENSITY (1985)143,998 km2 100.6 million 699 per km2 of total area
Rate of Growths 2.42 1,062 per Um2 of cultivable land
POPULATION CRARACTERISTlCS (1985) UAMrH LACrude Blrth Rate (per '000) 39.0 Population per physiLians 5,900
Crude Death Rate (p.r '000) 15.0 Population per hospital bed: 3.600
Infant Mortality (per '000 live births) 125.0
NCONE DISTlBlNnr0 (1982) DISTRIBUTIOd OF LAND L4NERSNIP (1978)
2 of zas.onal ineome, highest quintile: 42 X owned by top 102 of ownerst 49
X of national income, loawst qLintilei 12 X owned by smallest 102 of owners: 2
ACCESS TO PIPED VATER (1980) ACCESS TO ELECTRICITY (1980)
2 of population - urban: 26 2 of population - urban: 3.5
S of population - rural: 40 X of population - rural:
NUTRITION (1983) EDUCATlON
Calorie intake as Z of requirements: 84 Adult literacy rate (2) (1980181) 292
Per capita protein intake (Srams): 42 Primary school enrollment (2) (1985) 601
GNP PER CAPITA IN 1986: USS160 la
GROSS DOMESTIC PRODUCT (1987188) ANNUAL RATE OF GROWTH (2, constant prices)
mill. USS S P175-80 pY81-85 XYS6-SS
GOP at Market Prices 19,325 100 7.5 3.8 3.5
Gross Domestic Investment 2,319 12 0.1
Gross National Saving 1,217 ^
Current Account Balance -1,112 -6
Exports of Goods, fob 1,231 6 4.7 2.5 13.5
Imports of Goods, cif -2,9i7 -15 6.2 1.1 2.7
OUTPUT LABOR FORCE. AND PRODUCTIVITY IN 1987/88
Value Added lk Labor Force L V. A. Per Worker /d
r-til. USS I S il X US$
Agriculture 8,884 46.0 16.J 59 529 78
Industry 2,632 13.6 3.1 11 849 125
Services 7.809 40.4 8-6 30 908 134
Total/Average 19,325 100.0 28.5 100 678 100
CENTRAL GOVERNMENT FIiANCE to
(bill. Taka) X of GDPFY88 FEY FY88
Current Revenues 53.26 8.8 8.8
Current Expenditures 49.19 4.7 8 0
Current Surplus 4.07 4.1 0.8
Capital Expenditures 50.08 12.7 8.3
External Assistance (net) 44.22 7.6 7.2
/a World Bank Atlas methodology: base 1983-85.
Lk At market priees.la Civillan labor force, 1983/84 data Sectoral dlstributLon data shown are extrapolated from
available data on distribution of employed persons.
,d 1983184 data.le Provisional.
- Not available.
- Not applicable.
Page 2 of 2
COUNTRY DAT - BAUGLADESH
MONEY. CREDIT AND PRICES June 1980 JUre 1901 June 1982 Jun 1983 June 1984 Jun*LJ90 June 1985 June 1987 June 1988
(billton Taka outstanding, end of period)
Money and Quasi Money 34.3 41.3 45.5 59.0 83.9 105-3 123.4 138.5 164.1
Bank Credit to Public
Sector 25.4 36.9 43.9 44.4 50.0 55.7 65.1 64.0 65.1
Bank Credit to Private
Sector 14.3 17.6 23.6 31.0 49.1 68.9 83.6 89.6 108.9
(Percentages or Index Numbers)
Money and Quasi Money
as I of GDP 17.3 17.8 17.2 20.5 24.0 Z5.3 26.7 25.7 27.6
General Price Index
(1973174-100)a 226.6 255.0 296.5 325.9 357.5 396.6 436.0 481.2 536.0
Annual percentage
changes in
General Price Index la 18.5 12.5 16.3 9.9 9.7 10.9 9.9 10.4 11.4
Ba.k credit to Public
Sector 39.6 45.3 19.0 -1.1 12.6 11.4 16.9 -1.7 1.7
Bank credit to Private
Sector 30.0 23.1 34.0 31.3 58.4 40.3 21.3 7.2 21.5
BALANCE OF PAYMENTS MERCHANDISE EXPORTS (1987188)
(mill. US$)
V_80a81 1987188 mill. US,S
Exports of Goods, fob 711 1,231 Rat jute 81 7
Imports of Goods, cif -A.533 2.987 Jute goods 301 24
Trade Gap (deficit - -) -1,822 -1,756 Tea 39 3
Ron-factor services, net 38 -11 Leather 147 12
Workers' Remittances 379 788 Flsh 6 shrimps 145 12
Other Factor Payments (net) -23 -133 Garments 434 35
Current Account Balance -1,428 -1,112 Others 84 7
Direct Foreign Investment - - Total 1,231 100
Net MLT Borroving 502 621
(Disbursements) 584 S1S
(Amortization) 82 197 EXTERNAL DEBT, December 31. 1987
-bill, USSCapital Grants 563 823
IMF facilities, net 193 -18 Public Debt, nl. Guaranteed Private Debt 8.851
Other Capital, net 146 -170 Won-Guaranteed Private Debt
Total Outstanding & Disbursed 8,851
Change in Reserves (- - increase) 24 -144
DEBT SERVICE RATIO FOR 1987188
Gross Reserves (end of year) 251 896
Public Debt, mncl. Guaranteed Private Debt 16.5
RATE OF EXCHANGE (March 1, 1989) Non-Guaranteed Private Debt ____
Total 16.5
US$1.00 - Taka 32.27
IBRD/IDA LENDING. December 1987 (million US$)
LBRD DDA
Outstanding & Disbursed 70.2 2,985.5
Undisbursed - 1,534.1
Outstanding, macl. Undisbursed 70.2 4,519.6
- not available.
March 1989
EXECUTIVE SUMMARY
1. Public revenues and expenditures have historically been low inBangladesh in comparison to other low income countries. As a result, thereare substantial deficiencies in public infrastructure and services needed tosupport t e grouth of the economy. During the 1980s, the government's primaryobjectives it, fiscal policy have been to promote financial stability andsubsequently to rehabilitate the economy after an almost unprecedentedsequence of natural disasters. While flood rehabilitation is currentlyuppermost in the government's mind, attention needs to be given to medium-termpriorities for fiscal policy in support of improved economic growth. Thepurpose of this report is to sketch out a proposed framework for publicresource management during the Fourth Five Year Plan tFFYP) period, FY91-95.
The Structure of Public Expenditures
2. Public expenditures accounted for approximately 17.5Z of GDP duringthe period FY81-88. Public revenues have been roughly half this amount (8.8?cf GDP), with the remaining budget deficit financed through foreign aid anddomestic bo:rowing. Foreign aid has been the most buoyant source of fundingfor the public expenditure prog-am, increasing from 35Z to 44? of totalavailable resources during the FY81-88 period. This was offset by a declinein the government's net domestic borrowing, which decreased from 14? of totalresources in FY81 to 2X in PY88. Domestic revenues from tax and non-taxsources stayed roughly constant as a source of financing, increasing from 51?of total resources in FY81 to 54? in FY88. As a result of these changes,totai resources for the public expenditure program have grown at an averageannual rate of only 1.92 in real terms. Public expenditure growth has beenbelow the average growth rate of the economy (3.9?) and the rate of populationgrowth (2.6Z), leading to a declining share of public expenditures in theeconomy from 18.4Z of GDP in FY81 to 16.31 in FY88. This implies that thelarge increase in donor financing between FY81-88 served mainly to externalizethe budget deficit rather than supporting a significant increase in the levelof public expenditures. While this may have been an appropriate responseduring the mid-1980s in order to sustain public investment in the midst of afinancial stabilization program, the Government needs to reassess prioritiesfor increasing domestic savings in the coming period in order to support ahigher level of public expenditures and economic growth.
3. There have been a number of changes in the sectoral composition ofthe public expenditure program when examined on a multi-year basis. The majorchanges have been:
|i) Expansion of the social sectors. Poverty-oriented food reliefprograms increased significantly, reflecting an expansion of theFood for Work and Vulnerable Group Development programs (relyingprimarily on external funding sources). Education expendituresexpanded as a proportion of the budget, although much of theincrease was due to government subventions to private secondaryschools. Expenditures for health and population control also
- {i -
increased, although the quality of health services was constrainedby implementation constraints at the primary 'Level.
(ii) Declining shares for most economic services and infrastructure.Other than energy development, public exnenditures for most economicand infrasrructure sectors (including transportatiot., agricultureand water resources, communications, and physical planning) declinedin both real terms and as a share of total expenditures.Expenditures for agriculture and water resources received aparticularly sharp cutback, falling from 15.42 of the budget in FY83to 9.7Z in FY88, even after removing the effect of fertilizersubsidy reductions.
(iii) Increased expenditures for administration and overhead functions.Many of the sectors which registered the highest expenditure growthrates (such as local government, pension and retirement benefits,administration and common services, jtstice and law enforcement,foreign affairs and defense) are determined outside the government'snormal planning process and require a high proportion of local costfinancing. This trend contributed to a growing shortage of funds tosupport the Annual Development Program (ADP).
4. Recurrent expenditures grew much faster than the ADP in the FY81-88period, increasing from 30Z to 502 of total expenditures, although the overallshare of the recurrent budget remains relatively small in comparison to othercountries (612 in neighboring countries). Several factors have contributed tothis situation, including a large adjustment in the civil service payscructure which had been allowed to deteriorate significantly between FY78-85.A more detailed examination of the budget indicates that the growth inrecurrent expenditures has not been balanced, with categories such as localgovernment, administration and common services, wage increases for lower levelemployees, increases in the railway deficit, and subsidies to secondaryschools accounting for a large share of the observed increase. At the sametime, many parts of the recurrent budget continue to be seriously 1mderfunded,particule-vy operations and maintenance costs (O&M) and the social sectors.The governument's mixed performance in managing the growth of the recurrentbudget has placed serious constraints on its ability to maintain the growth ofpublic services and provide adequate funds to support project implementation.
5. During the FY81-88 period, the relative size of the ADP fell from10.22 to 6.72 of GDP. As a result of the rapid growth of the recurrent budgetrelative to domestic revenues, the ADP has become increasingly dependent onforeign financing, with project and commodity aid accounting for over 1002 ofADP financing in FY88 .Lnd FY89. The largest increase in resources has been inthe form of project aid, which increased from 362 of ADP financing in FY81 to542 in FY89. In part, this has reflected a willingness by the donors tofinance ; greater share of project costs, with the average donor contributionincreasing from 532 of project costs in FY81 to 692 in FY89. The overallproportion of the ADP committed to donor-financed projects (including bothforeign and local contributions) rose from 682 in FY81 to approximately 792 inFY89. At the same time, the Government has continued to include a large
- iii -
number of projects in the ADP that rely solely on local financing sources. Inthe FY89 ADP, only 542 of the available supply of local funds was allocated tosupport donor-financed projects. About one-third of the remaining local fundswas allocated to block grants for local development projects, while much ofthe rest was used to support a large number of small projects (314 out of 676projects in the ADP) which appear to reflect politically-mandated priorities.
6. These trends have lead to a serious imbalance in funding sources forthe ADP, particularly as regards the availability of local resources. Thishas several implications for the public expenditure program. First of all, ithas contributed to problems of project implementation because of under-budgeting of local cost contributions. Secondly, the ADP has less flexibilityto absorb funding shortfalls (because of natural disasters, increases infoodgrain imports, overestimation of revenues, etc.), so the ADP is oftenaffected by cut-backs in local funding during the budget year. Thirdly,pressures to increase local resources for the ADP have contributed toreductions in recurrent expenditures for O&M and a reluctance by the Ministryof Finance to sanction long-term funding commitments for the social sectors.The donors can help to offset these pressures by financing an increasing shareof incremental recu.rrent costs in the ADP. Nevertheless, increasedflexibility by the donors is unlikely to resolve this problem withoutcomplementary actions by the Government. Despite the increase in the share ofdonor financing since FY83, project implementation performance has remainedgenerally unsatisfactory except for capital-intensive projects such asbridges, power generation plants, and fertilizer factories. This indicatesthat the ADP has largely reached its effective capacity to absorb additionalcommitments of project aid unless they are funded alwost entirely fromexternal sources or can be accommodated within the limited amount of localfunding released from projects that are winding down. A significant increasein project aid commitments is likely to result in spreading the availablesupply of local funds even thinner, thereby contributing to a decline inproject implementation and providing little net change in the amount offoreign aid disbursed through the budget.
7. The Government needs to address the implications of these findings.Since FY81, increased inflows of foreign aid have provided a convenient methodfor the Government to finance its budget deficit without having to increasedomestic savings. In macroeconomic terms, however, the implications of thispolicy have become increasingly undesirable. Shifting the financing of thebudget deficit from domestic to foreign savings has resulted in little netchange in the resources available for investment, which have been stagnant atabout 122 of GDP throughout the FY83-88 period. Achieving a higher rate ofeconomic growth will require an increase in the level of savings andinvestment, as well as supportive actions in terms of policy reforms. Inaddition, the growing constraints on the availability of local funding havemade it increasingly difficult to expand Lhe flow of foreign resources intothe economy, which many donors have indicated would be available if thegovernment's absorptive capacity improves. In order to mobilize additionalresources for the public expenditure program, the Government will need toaddress two important requirements. First, the Government must enforce betterexpenditure control, particularly in the allocation of local funds for
- iv -
recurrent expenditures and the ADP, in order to ensure that the availableresources are used to support priority activities. Secondly, there must be anincrease in domestic resource mobilization, relying on both tax and non-taxinstruments and improvements in public pricing poiicies.
Public Resource Mobilization
8. Increases in tax revenues should be the primary mechanism forimproving domestic resource mobilization in the long run. However, it will bedifficult to achieve significant increases in tax revenues until economicgrowth improves and per-capita consumption levels increase. In addition, theGovernment needs to undertake structural improvements in the tax system toprovide a basis for sustained revenue growth in the medium term. As a result,the scope for increases in tax revenues ovef the next several years isexpected to be limited to about 2Z of GDPJ. In the near term, the Governmenthas sufficient opportunity for improving the availability of resources for thebudget through a broad range of measures, including expenditurereprioritization, increases in non-tax revenues, strengthening the self-financing capacity of autonomous and semi-autonomous boards and bodies, andimprovements in the utilization of foreign aid. Domestic borrowing can alsobe a realistic method for increasing public resources in the short term,provided the Government is prepared to take the necessary actions to stabilizethe budget deficit when macroeconomic conditions require it.
9. Reprioritization of the Expenditure Program. The best way to obtainan immediate improvement in the performance of the public expenditure programis to prune the budget of lower priority activities. There are a number ofareas in the recurrent budget that have been allowed to expand rapidly withlimited consideration being given to their impact on the availability of localfunds. While certain activities require a substantial increase in funding(especially O&M costs and funding for the social sectors), tighter expenditurecontrol should be exercised on administration and overhead functions, thecompensation of lower-level employees, and open-ended subsidy programs such asthe railway deficit and subventions to private secondary schools. As regardsthe public investment program, the ADP is substantially overcommitted relativeto the availability of local funding, so that a reduction in the projectportfolio can help to increase the average rate of project implementation byfocusing the available resources on the highest priority activities. In theinitial stage, the Government should focus on projects that are funded out oflocal resources. The Government needs to maintain a certain proportion oflocally-financed projects in the ADP in order to pursue its own priorities andsupport activities where donor funds are not readily available. Nevertheless,the current allocation of funding is inefficient, and a reallocation of localfunds to donor-financed projects could increase the total amount of resourcesflowing through the budget (reflecting the 30X70 average ratio for local toforeign financing in donor-assisted projects). The Government should
/ A suggested program of tax reform has been provided in 'Bangladesht AnAgenda for Tax Reform," World Bank Economic Report No. 7196-BD, May 1988(green cover).
establish an appropriate target for the allocation of funds to locally-financed projects, such as 25? of the local funds available to the ADP. Inorder to help achieve this objective, the Government should considerreductions in the large number of small locally-financed projects in the ADPthat represent a disproportionate use of funds in aggregate.
10. Several additional areas of potential cost savings should beexamined carefully. The block grants for local development activitiesrepresent the largest use of local funds in the ADP, and a number of questionshave been raised about their cost-effectiveness. The Government may wish torestructure the programs to leverage donor financing, while scaling back theamount of local funding for the construction of offices and staff housing inthe upazilas. The industry sector has a number of projects (roughly 10-15? ofthe sectoral allocation) that appear to have doubtful viability because ofinadequate supply of raw materials (sugar and paper mills), inadequatedomestic demand (diesel engine fa^tory) or excessive levels of domesticprotection (steel and glass manufacturing). Several other industrial projectscan be left to private investors in line with the Revised Industrial Policy of1986. The construction of government buildings (many of which involve donorfinancing) is annther area where significant reductions in unit costs can beachieved. Fina-.y, given that almust 80? of the ADP is committed to donor-financed projects, the Government will have to consider reductions in theportfolio of donor projects as well. Many of these projects are notnecessarily bad investments, but some of them may have to be given lowerpriority in view of the serious constraints on the supply of local funding. Amajor effort to reprioritize the ADP should therefore be the government'sfirst priority in undertaking a program of public expenditure reform.
11. Non-tax Revenues. Recent increases in non-tax revenues have notoccurred on a sustainable basis. Transfers of profits from public financialinstitutions (particularly Bangladesh Bank) have disguised a growing crisis inthe financial sector because of unsound lending practices, particularly withregard to directed credit programs. A reform program has recently beenproposed to restore the financial solvency of troubled lending institutionsand provide greater scope for the market determination of interest ratesincluding explicit recognition of interest rate subsidies in the budget.-P Interms of the prospects for the budget, increases in non-tax revenues as aresult of financial sector reforms (e.g., because of reductions inpreferential refinancing facilities through Bangladesh Bank) are likely to bemore than offset by explicit budgetary transfers for interest rate subsidiesand payments to resolve losses on directed credit programs.
12. Similarly, payments of dividends and profits from publicmanufacturing enterprises have tended to mask serious structural problems. Inmost cases, the enterprises are not in a position where they can transferprofits to the Government; for example, the Bangladesh Textile Mills
2/ See "Bangladesh: A Program for Financial Sector Reform,' World BankEconomic Report No. 6901-BD, December 1987 (green cover).
- vi -
Corporation transferred Tk Cr 14 3/ to the Government in FY87 despite lossesof Tk Cr 23 and significant cross-subsidies within the corporation to loss-making enterprises. In other cases, losses by the public enterprises tsvebeen covered by loans from public financial institutions, contributing, to theproblems of the financial sector; for example, between 1982-86. new loans inthe amount of Tk Cr 526 were provided to Bangladesh Jute Corporation andBangladesh Jute Mills Corporation to cover operating losses and wo-kingcapital requirements, very little of which is likely to bj repaid. A widevariety of implicit subsidies have bee- developed to support publicenterprises, including concessional lending terms, debt relief, andpreferential access to investment financing through the ADP. These subsidieshave reduced the resources available to support higher priority programsfunded through the budget, and they represent a substantial implicitexpenditure of public funds on activities that have largely escaped publicscrutiny through the budget process.
13. On the other hand, there are several areas where the Government canachieve significant increases in non-tax revenues without contributing todistortions in the economy. One area is improved debt managewent of internalloans. The monitoring of debt service payments by public corporations andother bodies has been very lax. It is estimated that better collection ofdebt service payments on IDA credits alone could contribute at least Tk Cr 225per year to the budget. This situation also contributes to an inefficient useof capital equipment, particularly a neglect of maintenance, becausereplacement equipment can be obtained on concessional terms.4/ Another areain which the Government can increase non-tax revenues is throughmiscellaneous fees and charges, many of which could be used for the funding ofoperations and maintenance costs. Finally, the Government needs to improvemechanisms for ensuring that funds advanced to public enterprises are actuallyspent. A recent survey by Bangladesh Bank indicated that a number of publicboards and bodies have built-up large cash reserves in separate bank accounts,part of which is attributable to delays in project implementation.
14. Self-Financing. Perhaps the most promising area where theGovernment can mobilize additional resources is by improving the self-finarncing capacity of non-manufacturing public corporations and other bodies.Public sector boards and bodies constitute a major net drain on governmentfunds, both through direct operating subsidies (e.g., Bangladesh Railways) andby the provision of local cost financing for investment projects in the ADP.It is estimated that autonomous public corporations undertook investments ofTk Cr 1748 in FY86, equal to 281 of gross investment in the economy, while
3/ Tk Cr is an abbreviation for one crore (10 million) taka, which isequivalent to US$322,700 at the official exchange rate prevailing a; ofJanuary 1, 1989.
4/ This is scmetimes referred to as the "disposable bus, problem becausesubsidizing investment can make it cheaper for an enterprise to scrapequipment prematurely (the standard example refers to bus operations)rather than investing in maintenance.
- vii -
their net savings available to finance inves fent (equal to retained earningsplus depreciation) was equal to Tk Cr -1.0.5 A suggested classification ofnon-manufacturing public enterprises in terms of their potential revenueearning capacity is provided in the main report (Table 3.1). Improvements inpublic resource mobilization on the order of Tk Cr 371 can be achieved byrequiring agencies such as Bangladesh Power Development Board, Chittagong PortAuthority, Bangladesh Telephone and Telegraph Board, and Dhaka and ChittagongWater Supply and Sewerage Authorities to self-finance the local cost componentof their investment program and by eliminating operating subsidies to agenciessuch as Bangladesh Railways and the Post Office." Of this amount, 43Z isattributable to local cost financing for power investments by Bangladesh PowerDevelopment Board (IPDB) and 382 is attributable to the operating deficit ofBangladesh Railways. Substantial progress in freeing up local resources cantherefore be achieved by improving the self-financing capacity of these twoenterprises alone.
15. Utilization of Foreign Aid. The final area in which the Governmentcan improve public resource mobilization is through better utilization offoreign aid. A recent study on project aid utilization has estimated thatimplementation delays increase the cost of projects by 35-402 on average(including implicit costs such as the opportunity cost of funds) and extendthe implementation period by 602 as compared to the time expected at projectapproval.7/ This is a substantial waste of public resources that could beused to support higher economic growth. Part of the solution will involveincreases in domestic revenues, but considerable improvements can be achievedthrough institutional changes as well. Procedural aspects that need to beaddressed include strengthening the "core" investment program and actions toimprove performance in procurement, the use of technical assistance, staffingof project entities, land acquisition and project monitoring. The Governmentshould also address institutional questions, such &a strengthening theplanning units of major sectoral ministries, makcing greater use of externalconsultants to develop an adequate pipeline of high priorit-; projects, andgreater emphasis by the Planning Commission on sectoral strategies rather thandetailed project reviews. Many of these measures have been addressed in thestudy referred to above, and the Government should develop proposals forimprovements in project aid utilization as part of its overall program ofpublic expenditure reform.
S/ This estimate includes public manufacturing enterprises.
6/ This estimate includes only direct transfers through the budget. Itwould be much higher if allowance is made for indirect transfers andsubsidies (e.g., loans to cover operating losses by the Bangladesh JuteCorporation).
7/ "The Utilization of Project Aid in Bangladesh,' Development AlternativesInc., January 1988.
- viii -
16. The Government can improve the utilization of commodity aid andfurther its objective of unifying foreign exchange management procedures byintegrating the disbursement of commodity aid programs into the secondaryforeign exchange market. This procedure has already been used successfully byseveral donors, and the Government should establish it as the preferred methodfor allocating commodity aid, except for highly restrictive programs.
17. Economic Growth. In the long run, increases in public expenditureswill have to be supported by higher economic growth. It is generally expectedthat the Bangladesh economy can achieve a higher rate of growth, on the orderof 5.5Z or more per year, with a continuation of appropriate macroeconomic andstructural policies. Public expenditure reform can help to achieve thisobjective by providing the public infrastructure and services needed toimprove the efficiency of private productive activities. The macroeconomicprojections contained in this report indicate that the fiscal policyobjectives recommended here for the FFYP period (i.e., an increase in domesticrevenue generation by 3% of GDP, additional recurrent expenditures for O&M andpublic services, and an increase in the availability of local funds for theADP) can be achieved in the context of higher economic growth. The increasein growth would also support improvements in private consumption andinvestment, while internal and external balance could be maintained withrealistic increases (52 per year) in foreign aid disbursements. Thus, theprogram of public expenditure reform described here represents a feasible, ifambitious, set of economic objectives for the Government. In order to achievethese objectives, a serious commitment to improvements in domestic resourcemobilization and restructuring of the public expenditure program will beessential.
Issues in Sectoral Expenditure Programs
18. The review of sectoral programs in Part II of this report hasidentified a large number of areas where increases in public expenditureswould be warranted. This is not surprising in view of the substantialrequirements for improved public infrastructure and services. Thegovernment's major problem will be in choosing priorities from among the manypressing demands on the budget, given that the resource mobilization targetsdescribed above will permit only selective increases in expenditure programs.This section summarizes some of the major issues that the Government willconfront in deciding on public expenditure priorities over the next severalyears.
19. Funding for the Social Sectors. The Government has undertakenambitious programs for the expansion of primary education and primary healthand family planning. With additional physical facilities now becomingavailable, the recurrent cost implications of these programs are beginning tohave an impact on the budget. Although the unit costs of primary educationand health services are relatively low, their overall cost requirements aresubstantial because of the large population to be served. It is estimatedthat the cost of achieving universal primary education will require an annualincrease of 7% in real terms in the budget for primary and secondary educationbetween now and the year 2000. Similarly, the current program for the
- ix -
expansion of upazila level health facilities will require an annual increasein the budget for health and population control of 8Z in real terms betweennow and FY95. The major cost components will be recurrent expenditures, suchas personnel and supplies, that will impact primarily on local fundingsources. Up to now, the donors have been willing to help finance theincremental recurrent costs of the programs (particularly for family planning)on the understanding that the Government would gradually expand itscontribution. This has not occurred, however, because of continuingconstraints on local funding.81 As indicated earlier, the availability oflocal funds affects almost all sectors, so the funding requirements of thesocial sectors cannot be looked at in isolation from the rest of the budget.Rough calculations indicate that the cost of the health and education programswill be affordable if economic growth improves as outlined above and theGovernment is willing to shift an increasing share of public resources to thesocial sectors. These are optimistic assumptions and raise the question ofwhether the Government will be able to support rapid growth in the provisionof social services if the economy does not perform at a high level.Alternatively, the donors need to decide whether they are willing to financean increasing share of recurrent expenditures for the social sectors, whichthe Government may have difficulty absorbing into its budget in the long term.
20. The converse requirement to rapid expansion of expenditures forprimary education and health is the need to control costs at higher levels ofthe education and health systems, so that the overall financial burden of thesocial sectors does not become unbearable. In many cases, this will requiredifficult political decisions. For example, subventions to private secondaryschools have been allowed to increase significantly in recent years, and theynow account for 24Z of the education budget. There are strong politicalpressures to increase the rate of subvention, and almost 1000 additionalschools have applied to be eligible to government funding. This largeincrease in expenditures has had little apparent impact on improvingeducational quality, while it has substantially constrained the scope forincreasing expenditures at the primary level. Similarly, there are strongpressures to expand university education (two new universities are underconstruction), although the unit cost of university education is very high(54sl in comparison to primary education, while the equivalent ratio for therest of South Asia is 15:l) and the capacity of the existing universitiescould be improved by reducing the average length of study. In the healthsector, the high demand for health care in secondary and tertiary facilitiesprovides an opportunity for the Government to increase cost recovery chargesthat would help pay for the health care system as well as redistribute demandto lower cost primary health centers. Given the substantial demand for higher
el For example, the Government agreed to take responsibility for thesalaries of 4,500 family welfare assistants recruited under an earlierproject. Due to funding constraints, however, the salaries of the staffhad to be rolled-over to the next project, and the inability of theGovernment to honor its commitment has placed doubts on whether it canabsorb an additional 10,000 family welfare assistants currently beingrecruited.
level health and education services, it would be unrealistic to proposereductions in existing programs. However, the government's ability to controlcosts at higher levels and increase resource flows to primary levels in thesocial sectors represents perhaps its most difficult challenge inrestructuring the public expenditure program.
21. Eneray Sector Investment Program. The rapid expansion of theexpenditure program in the energy sector during the past decade hashighlighted a number of issues that have only recently begun to be addressed.The issues are most apparent in the case of Bangladesh Power Development Board(BPDB). Donor preferences for financing thermal power generation facilitieshave led to a serious shortfall in transmission and distribution capacity,with consequent high power system losses because of the inabilit; of thenetwork to handle the increased load. A priority investment plan for BPDB hasbeen proposed to achieve a better balance in investment that takes intoaccount the likely availability of local resources. For the FY89-91 period,it has been suggested that all new start-ups for power generation projectsshould be eliminated and the available funds should be concentrated ontransmission and distribution projects and the completion of ongoinginvestments. As a result, BPDB may have to turn-down donor financing which isavailable for power generation projects in order to conserve local resourcesto support ongoing investments. These recommendations have confirmed the needfor a realistic projection of resources in order to prioritize projectselection, but they will be difficult concepts to maintain in the face ofpressures to increase donor commitments.
22. As part of the recently introduced energy sector reform program, theGovernment has established a timetable for the major entities in the sector totake over greater responsibility for self-financing their investmentprograms.9/ As recently as FY86, the average revenue earned by BPDB was about50: of t1 estimated economic cost of supply. While recent tariff increaseshave improved BPDB's financial position, continued progress in tariffrevisions, reductions in power system losses and improvements in collectionand billing practices will be necessary for BPDB to achieve a satisfactoryfinancial performance. The natural gas sub-sector, on the other hand, hasbecome a significant net contributor to the government badget, and areorganization of Bangladesh Oil, Gas and Minerals Corporation was recentlyapproved to give the natural gas companies greater autonomy to self-finance alarger share of their investment program, to be offset by reduced allocationsunder the ADP.
23. The greatest uncertainty in the energy program is the announcedintention of the Government to construct a nuclear power plant in the westzone. This would be a major deviation from the least cost investment programand would substantially compromise the plans for the development of the energysector. It also illustrates the difficulties in maintaining a consistentapproach to project selection in the presence of tied donor financing.
9/ Excluding the initial start-up costs of xural electrificationcooperatives.
- xi -
24. Transportation Investment Program. A long-term rehabilitationprogram was recently initiated for the major road network in order to improvethe standard of construction and overcome the backlog of repairs as a resultof inadequate maintenance and adverse weather conditions (e.g., the 1988floods alone are estimated to have caused $165 million in damages). There hasalso been increased interest among the donors in local and feeder roadconstruction to assist in rural development. These activities represent anambitious program for the road sector that will require major increases infunding allocations for a number of years. At the same time, the Governmenthas undertaken a large program (estimated to cost at least $1.0 billion) forthe construction of major bridges, of which approximately half is representedby the proposod Jamuna bridge. Over the past several years, bridgeconstruction has accounted for more than half of the increase in the budgetallocation for the rcad sector. This indicates a need to review priorities inthe road sector and establish guidelines for the allocation of funds betweenroad rehabilitation, maintenance and new construction. Given the financialrequirements for the proposed projects, there is serious doubt as to whetherthe entire investment program for roads and bridges can be accommodated withinthe limited amount of funding likely to be available in the ADP.
25. The Government has stated that its highest priority project in theinvestment program is the proposed multipurpose Jamuna bridge, which wouldprovide a direct linkage between the relatively isolated northwest region andthe more developed eastern zone which has substantial energy reserves and thebulk of industrial activity. In addition to a four-lane road, the bridgewould carry an east-west power interconnector, provide for possible inclusionof a gas pipeline and telecommunication links, and possibly carry a metergauge rail line. The overall economic rate of return for the bridge(including a four-lane road and power interconnector) has been estimated atabout 21-22? as compared to the present situation with no improvement. Inorder to arrive at a final decision on the bridge, the Government will need toaddress the macroeconomic implications of the project, including the need toreprioritize the public investment program in view of financial and managerialresource constraints, the possible impact of the external financing decision,and the economic and financial risks associated with the bridge.
26. The financial performance of Bangladesh Railways (BR) hasdeteriorated sharply since FY83, going from a breakeven position in terms ofnet operating income to an expected loss of Tk Cr 142 in the FY89 budget.Operating subsidies for BR constitute one of the largest net drains on thebudget for a public sector body. A number of studies have identified measuresto eliminate BR's operating deficit, including tariff increases and costreductions. Substantial improvement in BR's financial performance should be aprerequisite for further major investments in the rail sector, including thepossible inclusion of a rail link in the Jamuna bridge.
27. Agriculture. The sharp fall in public expenditures for agricultureduring FY81-88 has been a matter of concern to the Government because of theslow growth of agricultural production in recent years. A detailed review ofthe agriculture expenditure program indicates that other factors (such asweather, agricultural credit constraints, and input dirstribution policies)have probably been more important in explaining the low agricultural growthrate than the decline in public expenditures. In the long term, however,increases in public expenditures will be an important factor in improving
- xii -
agricultural growth. The most important component of the expenditure programwill be the 20-year investment plan laid out in the recently completed draftNational Water Plan (NWP) to develop 72Z of Bangladesh'n potential forirrigated agriculture, as compared to 26Z at present. T'he large cost of thisprogram (estimated at $7.9 billion, of which approximately half would bepublic expenditures and the other half private expenditures) will be a majorfactor in determining the resources available for other activities in thesector.
28. Despite its importance for long-term growth, the NWP involvesconsiderable institutional and financial risks. For surface waterdevelopment, the NWP would rely on the Bangladesh Water Development Board(BWDB) to implement a series of increasingly complex projects. BWDB'sDerformance in implementing such complex projects has not been satisfactory inthe past, and ex post project evaluations indicate that completed projectsgenerally fall short in achieving their expected benefits because of delays inimplem3ntation and inadequate operations and maintenance. Considerableinstitutional strengthening and a gradual introduction of cost recovery tocover O&M costs will be essential for BWDB to carry out its responsibilitiesunder the NWP. For ground water development, most of the potentialimprovement can be achieved with shallow tubewells (STWs). This technology iswell accepted in Bangladesh and would rely on the private sector fordistribution and maintenance, which would minimize demands on public sectormanagement and funding. As an alternative, the NWP suggests the widespreaduse of deep tubewells (DTWs), which have not achieved their intended benefitsin the past because of poor maint.-.ance and difficulties in mobilizing farmergroups. Because DTWs carry a subsidy of 70Z on their installation costs, theDTW option would require an 802 increase in public investment under the NWP inorder to achieve an incremental production gain of approximately 7Z. Giventhe demands on public resources from other sectors and the risk involved inrelying too heavily on public sector institutions, it is unrealistic tosubsidize investment in expensive DTW technology in areas suitable for STWs.Even if at some point in time, there is a need to convert to DTWs (which isunlikely for most areas), it would be cheaper and more efficient to providesupport for the conversion at the time that it is requaired, rather thanspending scarce resources now in anticipation of an event that may neveroccur.
29. Public expenditures in the agricultural sector are likely to risesignificantly in the future as unit costs increase (e.g., for more complexflood control, drainage and irrigation projects), additional activities areintroduced, and essential services are extended to a wider population. TheGovernment will therefore have to choose priorities carefully. Greaterattention should be given to agricultural support services needed to makeefficient use of NWP investments, such as research, extension, credit andrural infrastructure programs. To reduce the demand on public sector funds,increased involvement by the private sector should be encouraged whereverpossible, such as the distribution of fertilizer, distribution and maintenanceof irrigation equipment, seed production, fisheries and veterinary services.Input subsidies, which have been a ma!nr part of the government's program inthe past (e.g., fertilizer, irrigation equipment, seeds) should be generallydiscouraged on the grounds that the funds can be better employed in productiveinvestments such as the NWP program, while the impact of subsidies has oftenbeen to protect inefficient public sector agencies. Subsidies can be
- xiii -
justified in certain situations (e.g., programs targeted specifically to therural poor), but these programs should be subject to careful review in orderto control the demand on public expenditures.
30. Flood Rehabilitation. The floods in 1987 and 1988 caused seriousdamage to the economy, and preliminary estimates indicate that the cost of therehabilitation program will equal one to two year's normal public investmentin most sectors. Many donors have indicated their willingness to providesupport for flood rehabilitation. However, the flood rehabilitation programis likely to face the same constraints on the availability of local funds andimplementation capacity that affect the ongoing investment program. Thisimplies that expenditures for flood rehabilitation will largely displacepublic investments that would otherwise have taken place. The Government hasstarted to scale-back allocations in the ADP to release resources for floodrehabilitation during FY89. This i8s suitable as a short-term response, butgiven the extent of the damages, the Government will have to identifyadditional investments that can be postponed or dropped in order to releaseresources (particularly local funds) to support flood rehabilitation over thenext several years. The donors can assist in this effort by increasing theirshare of financing for flood rehabilitation and by reviewing design standardsand maintenance arrangements to reduce the cost of rehabilitation projects inthe future. At the same time, there are important parts of the proposed floodrehabilitation program that reflect longer-term investment proposals ratherthan immediate damage due to the flocls (such as the proposed upgrading ofChittagong Airport, the rehabilitation program for Bangladesh Telephone andTelegraph Board. and the flood protection embankments for Dhaka), which shouldbe scrutinized carefully before they are allowed to displace activities in theADP. Particular caution should be paid to the programs for major riverembankments and flood control measures that have been suggested recently. Asindicated below, the cost of providing basic improvements in publicinfrastructure and services (e.g., increases in primary health and education,extension of irrigated agriculture, road reconstruction and maintenance) willabsorb all of the additional resources that Bangladesh is likely to haveavailable during the FPYP period. Unless the donors are prepared to providemajor additional increases in concessional financing for the public investmentprogram (in excess of the 52 annual real increase already assumed in themacroeconomic projections), the proposals for new flood protection works arelikely to displace many of the basic programs required to sustain a higherrate of growth and poverty alleviation, with high cost to the Bangladesheconomy.
31. Operations and Maintenance. Operations and maintenance costs areseriously underfunded throughout the budget. In several cases examined in thereport (e.g., flood control and national highways), the extent of underfundingis about 40-50? of estimated requirements. In other sectors, the shortfall iseven worse; for example, the Ministry of Finance allocated only Tk Cr 0.85 tosupport the operating costs of the agricultural extension service in all 403rural upazilas in FY89. Donors have been assisting maintenance programs inrecent years, but progress has been very slow. In a number of instances, theGovernment has not provided the agreed increase in funding fo:. maintenanceactivities; for example, the allocation for road maintenance was cut in realterms in the FY89 budget, despite agreements calling for an 8? real increase.Underfunding of O&M is a problem in almost all countries, and there is no easysolution. In the near term, the Government should demonstrate its commitment
- -iv -
to improving O&M by providing the level of funding that has been agreed underdonor-financed maintenance projects. Further progress can be achieved byplacing greater emphasis on OEM in the development of sectoral strategies andby integrating the budgets for capital and recurrent expenditures. Thesechanges should be linked to long-term improvements in the planning andbudgeting system.
Public Expenditure Management
32. Planning, Budgeting and Expenditure Control. Despite tremendouisgrowth in the public expenditure program since independence, the managementprocedures for the budget have changed relatively little over time. TheGovernment has been able to maintain a reasonable degree of expenditurecontrol through a rigid system of line-item authorizations, and the proceduresfor screening investment projects have been relatively successful in reducingobviously non-viable projects in the ADP. However, these achievements havehad a high frictional cost in terms of slowing down the implementation of thepublic expenditure program. There are a number of areas where improvementsare clearly warranted, such as tracking the outcome of the expenditure programduring the fiscal year, improving the transparency of the budget in order tovinitor expenditure priorities, and improving the delegation of responsibilityand accountability to sectoral ministries and implementing agencies.
33. Planning for the public expenditure program is primarily focused onproject preparation and review activities, while responsibility for the annualbudget exercise is fragmented among several agencies and conducted largely onan incremental basis. Thfs system has a number of limitations. First ot all,the focus on project approvals ignores the potential impact of projects on thecomposition and performance of the investment program (such as the availabi-lity of local funds). Secondly, linkages between capital expenditures andrecurrent inputs are neglected, such as staffing and operational costs for thesocial sectors and maintenance costs for roads and water control projects.Finally, the highly centralized planning process and the fragmentation of thebudget discourages sectoral ministries from taking responsibility forstrategic planning and proposing changes in the composition of the expenditureprogram.
34. It is recommended that the Government should place greater emphasison using the annual budget exercise as the primary mechanism for monitoringthe composition of the public expenditure program over the medium term. Theproject review process should become a secondary (although still important)mechanism to review major investment decisions, while delegating greaterauthority to the sectoral ministries to develop expenditure programs that areconsistent with the likely availability of funds. In order to carry out thischange in emphasis, several actions will be required. First, the PlanningCommission should take responsibility for strengthening the planning units inthe sectoral ministries. Secondly, the Government needs to develop a greatercapacity for macroeconomic analysis and the preparation of sectoralstrategies, including the monitoring of structural reform programs. Thirdly,annual guidelines should be prepared for the budget which set policydirections for the allocation of public expenditures and provide greaterflexibility for the sectoral ministries to make choices about the directionand composition of their expenditure programs. Finally, it is recommendedthat the Planning Commission and the Ministry of Finance should work as a
-v -
joint team in reviewing the submissions of the sectoral ministries anddeciding on expenditure allocations. This approach would be facilitated byreclassifying the budget documents to combine allocations for recurrent andcapital expenditures under the same headings.
35. The suggested changes in planning and budgeting procedures aregenerally consistent with directions that have been identified by the PlanningCommission. Greater attention needs to be given, however, to improvements inthe accounting and expenditure control systems that are necessary to supportthe changes on a long-term basis. The Ministry of Finance initiated a programin FY83 to delegate greater authority for expenditure control and preparationof accounts to the sectoral ministries. This change has not been effective,however, because it did not provide for the introduction of modern dataprocessing equipment, and it was disrupted by the simultaneous decision of theGovernment to decentralize activities to the upazilas. Improvements in thepublic accounting system have been delayed far too long and will ultimatelyconstrain other actions to delegate responsibility and accountabil.ty to thesectoral mi-istries. It is suggested that the Government should *undertake adetailed study of the current accounting system to provide a framework fornecessary improvement-. In addition, the Government should simplify thesystem of accounts for the upazilas, which are overly complex and hinderexpenditure reporting and the delegation of authority.
36. Compensation and Employment. One of the most importantconsiderations for the long-term effectiveness of public programs is thecompetence of the civil service establishment. The sanctioned size of thecivil service in FY86 (including positions under the ADP but excludingemployees of public corporations) was about 950,000 employees. This is notexcessive by regional standards, although there are particular areac of thepablifc sector which are significantly overstaffed (including BangladeshRailways, Bangladesh Telephone and Telegraph Board, and administration andcommon services). A more important problem is the shortage of higher levelstaff. The vacancy rate for Class I and II officers is about 252, partlybecause of restricted hiring over time, while the vacancy rate for Class IIIand IV staff is about 10Z. The Government should consider increasing therecruit2ient of Class I and II officers on a phased basis to reduce staffshortages at the higher level. At the same time, the recruitment of Class IIIand IV employees should continue to be frozen, except for rapidly expandingservices such as family health workers and primary teachers. The Governmentmay also wish to consider measures to facilitate the redeployment of Class IIIand IV staff to address specific staffing problems, as well as earlysetirement programs to address areas of clear overstaffing.
37. The Government has followed a general policy of allowing civilservice compensation levels to deteriorate over time in real terms, offset bysporadic adjustments in allowances. This is damaging to the long-term moraleand recruitment prospects of the civil service, as well as inflicting sharpshocks on the budget when the pay structure is readjusted. In addition, theGovernment needs to address the structural changes in the compensation systemthat were introduced by the last National Pay Commission awards in FY85.While the compensation level for Class I and II officers was restored to theFY78 level in real terms, the compensation level for Class III and IV staffwas increased by 30-402 in real terms above the level prevailing in FY78.This resulted in a substantial increase in compensation costs for the budget,
Z xvi ^
and it compressed the overall pay structure for the civil service to a levelthat is considered to be undesirable in other countries. While thecompression of the pay structure is less severe when fringe benefits areincluded, this is inefficient and does not compensate for the compression incash compensation that occurred in FY85. The Government may therefore wiah toconsider the following changes. First, more freztieut reviews of thecompensation system should be introduced. Secondly, there is a need to adjustthe compensation of Class I and II officers to offset the deterioration thathas occurred since FY85. Pay increases for Class I-and II officers should bedelinked from the compensation for Class III and IV staff, which is stillsignificantly above the FY78 level. As part of this process, the Governmentshould consider replacing fringe benefits (particularly housing, automobile,and telephone) with cash payments in order to make the compensation systemmore equitable and transparent. Finally, the Governrent should complete theproposed Public Administration Efficiency Study to provide a long-term basisfor improving the efficiency and motivation of Class I officers.
Public Expenditure Reform in the FFYP Period
38. The attached table provides a suimnary of the proposed changes in thepublic expenditure program during the FFYP period. These recommendations arebased on the expected cost increases which are required to carry-out publicprograms that are already under implementation (e.g., agriculture, health,education, roads). Therefore, they provide an estimate of cost increases thatare already embedded in the government's expenditure program, rather than aredistribution of resources into new activities. The seven priority sectorsexamined in this report account for approximately 60Z of the publicexpenditure program in the FY89 budget. The changes in expenditureallocations s gested here would imply an increase in the budget for thesesectors on the order of 7? annually in real terms between now and FY95,representing a 50Z in:rease in overall resource flows.1 0 This large increasein expenditures would be affordable under the high growth scenario presentedin Chapter 2, under which GDP is assumed to increase at an average annual rateof 5.2? in real terms during the FFYP period and the share of publicexpenditures increases from 16.3Z of GDP in FY88 to 18.7? in FY95. Even inthis situation, the Government would have to exercise tight control on theremainder of the budget, as the share of expenditures allocated to thepriority sectors would increase from 60? to 63? of total public expenditures.On the other hand, if the economy continues to perform at the level observedduring the 1980s (identified in Table 1 as the low growth scenario, whichassumes GDP growth of 4? per annum and public expenditures remAining at 16.3?of GDP), the expenditure program described in Table 1 will not be sustainable.Expenditures for the priority sectors would consume 76Z of the budget by FY95under the low-growth scenario; alternatively, the Government would have toscale-back its objectives and settle for a lower rate of enpenditure growth.
10/ The detailed expenditure allocations in Table 1 should be interpreted inan indicative sense only. While the direction of changes in expenditurecategories is generally consistent with the recommendations in thereport, the magnitude of the required changes is often a matter ofconjecture. The overall amount of the required increase in publicexpenditures is felt to be reasonably accurate, however.
- xvii -
This would reinforce the trend to slower growth in the economy because of thelower rate of aggregate investment.
39. In terms of the sectoral composition of expenditures, Table 1suggests an increase in expenditures for agriculture and water resources from15X of the budget in FY89 to 172 in FY95 under the higher growth scenarioin order to eupport the National Water Plan, increase agricultural creditprograms, and strengthen agricultural research and extension, seed production,rural poverty programs and fisheries. Other sectors that would receive anincreased share of expenditures include education (from 1OZ of the budget inFY89 to l1? in FY95 for the expansion of primary education), health andpopulation control (from 62 in FY89 to 72 in FY95 for rural health and familyplanning programs) and local infrastructure (from 72 in FY89 to 8S in FY95 forwater supply and urban infrastructure projects targeted at lower incomegroups). The share of expenditures for energy and natural resources wouldremain roughly the same at about 92 of the budget, although the actual levelof investment would be higher due to an increase in self-financedcontributions from the sectora' agencies. Expenditures for industry andtransportation and communications would be reduced in relative terms (but notin absolute value), with industry falling from 42 of the budget in FY89 to 32in FY95 in line with the lower emphasis on direct public investment in theRevised Industrial Policy, and transportation and cemmunications falling from92 of the budget in FY89 to 82 in FY95 as a result of reduced subsidies tooperating agencies (particular Bangladesh Railways).
40. Perhaps the most important implication of Table 1 is that theGovernment has very limited flexibility in its public expenditure program ifit is going to achieve the improvements in basic infrastzucture and publicservices suggested here. The resources that are likely to be available to thepublic sector, even under a high rate of economic growth, will be sufficientto fund only the most basic improvements in essential public programs that areneeded to support higher economic growth and poverty alleviation. This shouldnot be surprising, particularly in view of the historic deficiencies in publicinfrastructure and services. Nevertheless, it emphasizes the need to maintainan appropriately modest set of expectations for the public expenditure programand the high priority that should be attached to realistic public investmentchoices and improvements in domestic resource mobilization.
41. Government Actions. In support of the program of public expenditurereform, the first area that should be addressed by the Government is toimprove its ability to prepare sectoral strategies and determine publicexpenditure priorities. Increases in expenditures will not be effective(indeed, they can be counter-productive by diverting funds from more importantuses) unless the Government has a clear idea of what it intends to accomplishwith public funds and undertakes complementary policy reforms andinstitutional changes to achieve these objectives. This is particularlyurgent in agriculture, which must be the major source of growth in theeconomy. Althoug1h the slowdown in foodgrain production started in FY84, theGovernment has still not developed a clear picture of the major constraints ongrowth and the actions that are needed to address them. Studies are currentlyongoing to address these issues, and the Government should use thisopportunity to develop a consensus with the donors on what should be done. Inother sectors such as education and health, while this report recognizes theneed to increase public expenditures as an important step in supporting the
- xviii -
expansion of social services, problems such as the low utilization rate forrural health facilities and the high dropout rate in primary educationindicate that important policy issues need to be addressed as well. Thesupply-based strategies pursued by the Government and the donors up to nowhave clear limitations, and these problems need to be recognized as part ofthe effort to increase public services.
42. The second area that the Government should address is domesticresource mobilization and improvements in expenditure control. Tax reformshould be an important part of the effort, and the report has identifiedadditional areas that need to be addressed, including public pricing policies,greater self-financing of investments by public sector corporations andbodies, and the settlement of inter-agency arrears. However, it makes littlesense to increase public revenues (which would have to come from privateconsumption and investment) unless the resources are used for productivepurposes. In this respect, the government's performance in the FY81-89 periodhas not been satisfactory. The large increase in recurrent expenditures hasnot been targeted to priority activities, and critical areas have remaine'dseriously underfunded (O&M, social sectors) while expenditures for lowerpriority activities have expanded rapidly. Similarly, the allocation of localfunds in the ADP has not matched the priorities established for the publicinvestment program, with, block grants and politically-mandated projectsconsuming a large share of the available funds. The donor community must bearan important part of the responsibility for expenditure rationalization aswell, as the current overcommitment of the ADP cannot be resolved withoutimportant cuts in the portfolio of donor-aided projects as well.
43. These considerations also confirm the close linkage between publicexpenditure reform and progress on financial sector issues and reform of thepublic enterprises. The current situation shows a striking imbalance betweenactivities funded through the budget, which are often subject to tight fiscalrestraints, and the large outflow of resources to public enterprises throughimplicit subsidies and directed credit programs. Reform programs in theseareas can increase the resources flowing to the budget over time and reduceeconomic efficiencies which are attributable to highly subsidized capitalinputs and poor control of recurrent costs (e.g., jute sector losses).
44. The remaining area that needs to be addressed by the Government isproject implementation. The slow pace of project preparation andimplementation represents a high cost for the economy, both in terms of costoverruns and delayed project benefits and because of reduced allocations ofdonor financing. The government's reluctance to utilize external technicalassistance to prepare a pipeline of high priority projects is very costly tothe economy in terms of lower commitments of foreign aid and an inability todirect the available resources to the highest priority projects. The causesof project delays have been extensively identified in various studies, butlittle progress has been made in addressing these issues in recent years. Amore aggressive posture on these matters is critical for the success of publicexpenditure reform.
45. Donor Actions. The most important action that the donors can takeis to continue their support for high priority activities in the budget. Thismay require that the donors increase their share of financing for projectcosts and take over responsibility for a share of incremental recurrent costs
- xix -
as well. In the long run, it is in the government's best interest to financethe recurrent costs of projects from domestic resources in order to use donorfunds to support a higher level of investment. This is a macroeconomic issue,however, and until the Government is able to mzake progress in domesticresource mobilizatior. and expenditure control, the donors should continue toensure that priority activities at the sectoral level are maintained. At thesame time, the donors should make a realistic assessment of the government'scapacity to absorb recurrent costs. The very rapid expansion plans for thesocial sectors are a case in point, as they have the potential for developinga recurrent cost burden that the Government (and the donors) may havedifficulty maintaining in the future. Similarly in the Infrastructuresectors, it may be necessary to concentrate on rehabilitation and maintenanceprojects for the foreseeable future rather than new construction, despite thefact that both types of expenditures are clearly neoded. Finally, the donorss1.ould be prepared to review their existing project portfolio with theGovernment to identify activities that no longer have high priority and can bescaled-back to release funds for other pu-:poses.
46. There has been a general increase in the level of foreign aidavailable in recent years, particularly for low income countries, andBangladesh has earned international respect and sympathy for its difficultdevelopment task. It would be unfortunate if constraints on absorptivecapacity limit the ability of Bangladesh to benefit from this assistance. Atthe same time, actions by the donors in trying to provide additional projectaid can accentuate already existing problems. There has been a tendency inrecent years for donors to pursue capital-ir.tensive projects that can beimplemented relatively efficiently (industrial plants, power generationfacilities, bridges, etc.). Each of these projects is undoubtedly justifiedon an isolated basis, given the very great need for additional investment inBangladesh. These projects have an impact, however, on the availability oflocal funds and project management skills needed to implement projects alreadyin the portfolio. The donors need to make an extra effort in working with theGovernment to ensure that investment programs are appropriately balanced andcan be implemented within the existing sources of local funding and managementcapacity, as was recently carried out for the energy sector.
47. The donors should also address the prospects for c-mmodity aid.Balance of payments support has been important in Bangladesh since indepen-dence in order to sustain economic growth. In recent years, however, thejustification for commodity aid has emphasized its role in generating localcounterpart funis to support the budget. This can be a realistic method ofsupporting public expenditures which involve a high proportion of local costs,but the relative benefits of this approach need to be evaluated vis-a-vis thebenefits obtainable from project aid. In this regard, the government'sperformance in allocating funds to the recurrent budget and the ADP does notdemonstrate that it has imposed a clear sense of priorities on the use oflocal funds. It may be more effective for the donors to increase their shareof financing for project aid, rather than commit additional amounts ofcommodity aid. In addition, several donors are beginning to insist on,earmarking" arrangements to ensure that local counterpart funds generatedfrom commodity aid are allocated to high priority projects. This approach isunderstandable, given the government's failure to maintain adequateallocations of local funds to donor-aided projects. Nevertheless, it may bemore effective in the long run to encourage the Government to demonstrate a
- xx -
clearer sense of priorities in allocating funds within the public investmentprogram in order to jvstify additional commitments of commodity aid, ratherthan imposing external constraints on the budget process.
48. Timing. Public expenditure reform is inevitably a multi-yearprocess. Many of the problems in the current structure of public expenditureshave risen from decisions that were taken without clear reference to 'ong-termobjectives for the budget. The current process of preparation for the FourthFive-Year Plan therefore providez a convenient opportunity for the Governmentto assess its priorities for public expenditure reform over the next severalyears. This process should make a realistic assessment of sectoral prioritiesand expenditure requirements (including both recurrent and capitalexpenditures), rather than concentrating on developing a project list whichhas been the outcome of the exercise In the past. The five-year plan shouldalso be seen as the first step in reviewing expenditure priorities on arolling basis during the coming plan period, rather than the static formatthat has been used in the past. Even in the immediate future, the Governmentcan begin to take important steps in public expenditure reform, particularlyby pruning the ADP of lower priority projects, better control of recurrentexpenditures, improvements in project implementation procedures, and publicpricing policies. Better management of the public expenditure programtypically involves a large number of small actions, rather than sweepingpolicy changes. The first critical step, however, is for the Government tomake a clear statement of its commitment to public expenditure reform.
Table 1: Summary of Proposed Changes in the Public Expenditure Program I/(Tk Cr; in FY89 constant prices)
FY89 Budget Allocation Indicative FY95 Budget Allocation
Revenuo As X of Revenue As % of As X of
Budget Tot I Budget TotaI Expend. TotaI Expend.
Program Basis for Recommendations plus ADP Expenditures plus ADP (High Growth) (Low Growth)
A. PRIORITY SECTORS
I. AGRICULTURE AND WATER RESOURCES
1. Surface Water Nationsl Water Plan and 682.7 6.2X S0o 4.9X 6.0%
D.velopnmnt improvents In O&M.
2. Agricultural Based on projected 164.8 1.51 400 2.4X 2.8X
Credit net disbursements.
8. Agricultural Consolidation of extension 190.4 1.8% 860 2.1X 2.04
Reserch and services In DAE and lncreas inExtension operating funds.
4. Seedb Iproved efficioncy by BAOC 41.6 0.4X 100 O.6 0.7X
5. Rural Poverty Establishment of Khudra Rin 76.6 0.7X 150 0.9X 1.lX1
Programs Foundation and reduction infinancial support to cooperatives.
6. Fisheries Shrimp culture and open water 78.8 0.7X 10 0.8X llX
stocking programs.
7. Other Program Foodttock management, ground water 521.5 4.6X 760 4.61 6.51
irrigation, forestry, livestock,specialized program (base ontrend line proj3etion).
Sub-Totel 1683.8 14.8X 2700 16.4% 19.61
II INDUSTRY
1. Fertilizer Based on joint venture with 98.0 0.81 200 1.2% 1.51
private Investors.
2. Dovelopment Donor financing for foreign 0.0 0.01 260 1.6X 1.8%
Finence portion of term leding.
8. Other Reduce In accordance with Revised 829.1 2.8X 100 0.6S 0.7X
Investents Industrisl Policy.
Sub-Total 421.1 3.71X 550 a.8 4.0X
III. ENERGY AND NATURAL RESOURCES
All Programs Bsed on trnd line, assuming 1042.9 90.8 1500 9.1% 11.0%self-financing of localinvestment costs.
IV. TRANSPORTATION AND COMNNICATIONS
1. Road and bridge Increase road rehabilitation 441.4 8.9X 600 4.86 6.9Xconstruction and and maintenance and prioritizemaitneence rIeaning investment program.
2. Bangladesh Eliminate operating deficit by 360.1 8.11 150 0.9 1 1.1XRailways FY95 and cale-back Investment
program.
S. Chittagong Port Improvomnt In proj3et 43.2 0.41 80 0.6X 0.61Authority Implementation performnec
essential.
4. Bangladesh Rehabilitation prorm, conditional 79.6 0.7X 150 0.9X 1.1lTelephone and on strengthening of BTTB.Telegraph
S. Bangladesh Improved maintenance of major 80.8 0.81 90 0.61 0.61Inland Water inland waterways.TransportAuthority.
6. Other Program Reductions In subsidies to public 126.8 1.1X 100 O.6X O.Xtransport companies.
Sub-Total 1072.9 9.61 1860 6.21 10.0O
V. EDUCATION
1. Primary Universal primary education 492.2 4.4X 860 5.2 6.21Education progrm.
2. Secondary Inerease in secondery enroll nte 420.8 8.7x 650 3 8.9x 4.61Education as a result of primary growth.
S. Vocatlonal Imwrovments In cost-efficincy. 179.1 1.6X 240 1.5X 1.81Education andUnierslties
Sub-Tote l 1092.1 9.7X 1740 10.61 12.6X
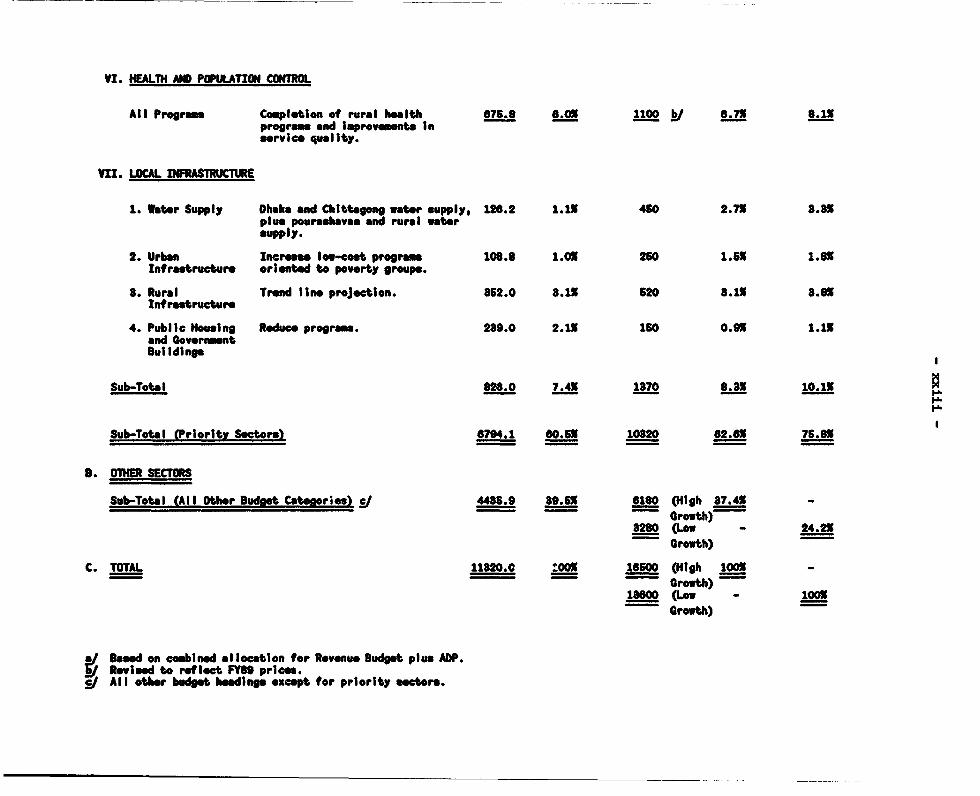
VI. HEALTH AND POPULAnON CONTROL
All Programs Complotion of rural health 875.8 8.0X 1100 6.75 8.1Xprogram and improvemnts Inservice quallty.
VIZ. LOCAL IISII
1. Water Supply Ohakl and Chittagoog water supply, 126.2 1.1X 460 2.7X 8.3aplus pourashavas and rural votersupply.
2. Urban Increas low-cost prorm 108.8 1.0X 250 1.5X 1.63
Infrastructur, oriented to poverty groups.
S. Rural Tren line projection. 862.0 8.1X 620 8.LX 8.83Infratructure
4. Public Housing Reduce program. 289.0 2.1X 1SO 0.9X 1.1X
and GovernmentBut Idingp
Sub-Total 826.0 7.4X 1870 8.3 10.1l
Sub-Total (Priority Sectorsl 6794.1 60.6X 10820 62.6X 76.83
S. OTHER SECTORS
Sub-Total (All Other Budoet Categories) 446.9 89.6x 6180 (High 87.4 -
Growth)a2s (Low - 24.23
Growth)
C. TOTAL 1182.0 .1003 16so (High 1003 -
- -OTAL 11J20 C OOX Growth)iAs (LOW - 100X
Growth)
*/ B on combined allocation for RevOnUo Budget plus ADP.Revise to reflect FY69 prices.
J All other budget headings except for priority setors.
Introduction
The purpose of this report is to provide an assessment of thecomposition and cost-effectiveness of the public expenditure program inBangladesh. Public expenditures are the most direct means by which theGovernment seeks to influence the direction and growth potential of theeconomy. Over the past several years, the Government has shown an increasedappreciation for indirect policy instruments, such as pricing, trade reforms,and institutional improvements, to encourage private participation in theeconomy and thereby supplant the naed for direct public expenditures. In manyimportant areas, however, such as the provision of an efficient transportationinfrastructure, the extension of agricultural services, and the development ofprimary education and health, the public sector has a direct role to play inmobilizing the necessary resources and ensuring that they are employed in acost-effective manner. While there are no widely-accepted norms available todetermine the adequacy and efficiency of a public expenditure program, theapplication of a range of tools, including macroeconomic analysis, comparativeexperience in other countries, and in-depth sectoral reviews can provide areasonable assessment of the major trends in the public expenditure programand areas for potential improvement.
The specific objectives of the study aret
(i) Evaluate the consistency of the public expenditure program withavailable macroeconomic resources and assess the need foradditional resources from both foreign and domestic sources;
(ii) Identify the major issues involving the cost-effectiveness ofsectoral expenditure programs and propose actions to improveefficiency and implementation capacity; and
(iii) Review the institutional process for planning, budgeting andexpenditure control and suggest measures to improve the managementof the public expenditure program.
Many readers will be interested in a fourth objective for this report;i.e., an evaluation of the impact of the public expenditure program on thepopulation living in poverty. Poverty alleviation is a major part of thepublic expenditure program, and the fiscal implications of poverty-relatedprograms (particularly primary health and education) are treated in detail inthis report. Nevertheless, it was felt that a full coverage of distributionalissues in the public expenditure program would require more detailed analysisthan would be possible in a report aimed primarily at macroeconomic aspects offiscal policy. For this reason, it was decided that poverty issues would beaddressed in greater depth in a separate report that is currently in theprocess of preparation.
The report is presented in two parts, with the first part focusing oninter-sectoral expenditure issues and the second part addressing sectoralexpenditure programs. The structure of Part I is the followings Chapter 1--areview of past trends in the public expenditure program; Chapter 2--priorities
- ii -
for public resource mobilization; Chapter 3--a summary of the sectoralexpenditure programs; Chapter 4--implementation issies, including projectimplementation, commodity aid utilization, and operations and maintenance; andChapter 5--institutional aspects of public expenditure management, includingplanning, budgeting and expenditure control, and public sector compensationand employment. Part II discusses the expenditure programs for seven majorsectots, including agriculture and water resources, industry, energy andnatural resources, transportation and communications, education, health andpopulation control, and local infrastructure.
The preparation of the report was greatly assisted by the activecooperation of the Government of Bangladesh. The authors would like toexpress their appreciation to officials in the Ministry of Finance, thePlanning Commission and many other departments and agencies for generouslysharing their time, insights, and data.
The report was prepared on the basis of a mission that visitedBangladesh in November 1987 and a follow-up mission in July 1988. The draftreport w'as discussed with the Government in February, 1989. The missionleader and principal author of the report was Richard Westin. The followingpersons provided submissions for the report: A. Agbonyitor, B. Buyck,C. Griffin, P. Hubbard, E. King, F. Mitchell, S. Nizamuddin, A. Rab,A. Ramuglia, P. Rashid, W. Roider, V. Shetty and F. Yagci. A number of otherpeople provided comments and/or other contributions which were incorporatedinto the final report. Ms. D. Sebastian and Mr. S. Khan were responsible forsecretarial and administrative assistance in Washington and Dhaka,respectively.
Note on Nomenclature: Following local convention,government expenditures and revenues are denominatedin units of crore (abbreviated Tk Cr), which are equalto 10 million taka. At the current official exchangerate, Tk Cr 1.0 = US$322,700.

PART I
INTER-SECTORAL EPENDITURE ISSUES
- 1 -
Chanter I
Overview of the Public Expenditure Program
1.1 The floods that struck Bangladesh during 1988 for the second year ina row have dealt a serious blow to an economy that was widely expected toresume higher growth. The high cost of reconstruction and rehabilitation,estimated by the Government at $285 million in FY88 and $1140 million for thethree year period beginning in FY89, will depress the economy for the nextseveral years and divert resources from productive investments needed tosupport long-term growth. As has become the pattern, the Government reactedpromptly to address the immediate needs of flood recovery, and theinternational donor community responded with relief assistance andrehabilitation aid. The floods have demonstrated again, nowever, thevulnerability of Bangladesh in establishing a long-term basis for sustained|economic growth.
1.2 The floods have also rekindled discussions about the relative costsand benefits of providing additional flood protection. This debate isconsistent with the central theme of this report, which is the rcle andrelative priorities for public expenditures in supporting economic growth andsocial equity. Bangladesh has historically had substantial deficiencies inalmost all areas of public services, including infrastructure development,human resource programs, and direct poverty alleviation. The Government hasbeen reasonably prudent in its macroeconomic conduct of fiscal policy sinceFY83, and it has demonstrated a general preference for restraining publicexpenditures rather than increasing taxes and reducing private consumption inorder to achieve fiscal balance in the economy. This approach isunderstandable, given low per-capita incomes and the past record of sloweconomic growth, such that it was only quite recently that average real wagerates regained their pre-independence levels. Several years of soundmacroeconomic policies and structural reforms at the sectoral level haveestablished an environment that, prior to the impact of two years ofdevastating floods, was generally considered to be conducive for improvedeconomic growth. Faster growth in the economy can provide flexibility forpublic expenditure choices that would be difficult or impossible to make in amore constrained fiscal situation. How the Government handles these choicesover the next several years, provided that natural forces and external eventsdo not interfere with economic recovery, will have an important bearing on thecountry's long-term ability to provide a better standard of living for itscitizens.
1.3 The floods have also reenforced the need for the Government toaddress some critical choices in its public expenditure program. Even withthe assistance of donors in the flood rehabilitation effort, there will stillbe internal constraints, such as the availability of local financing resourcesand the implementation performance of public sector agencies, that will placea limit on the amount of public expenditures that can be accomplished.Rehabilitation expenditures of the magnitude required by the recent floodswill mean that major investment choices may need to be postponed, a fact thatthe Government has not fully addressed in its budget planning.
-2 -
1.4 As economic growth recovers, the Government will need to make anumber of important choices about where to direct public resource flows. Inthe social sectors, particularly primary education and health, the Governmentand the donors have initiated programs with major long-term fundingrequirements. In other sectors such as agriculture, transportation andenergy, while there are unresolved questions concerning the policy andinstitutional framework for public expenditures, sectoral priorities indicatethat large increases in public expenditures are necessary and warranted tosupport economic growth. Funding these programs will require that a largershare of aggregate resources, on the order of 3? or more of GDP, be devoted tothe public sector. The Government has an opportunity to zchieve this shift inresource flows, provided that: (i) economic growth improves to a rate thatwill sustain increases in private consumption and investment while the publicsector is expanding its share of GDP; (ii) the Government undertakes measuresto mobilize additional public resources, particularly through tax reform,improved utilization of foreign assistance, and greater revenue mobilizationby public corporations and semi-autonomous bodies; and (iii) the cost-effectiveness of government operations is improved, so that the general publicbegins to see tangible results from increased resource flows in the form ofimproved public services. The increase in public expenditures recommended inthis report, if carried out over a period of five years, would allowBangladesh to begin making significant in-roads into its backlog of publicservices and infrastructure requirements and would provide a better base forthe growth of private sector activities in the productive sectors.
1.5 This scenario, while attractive from an historical perspective, alsocontains s,..gnificant risk elements. Increases in public expenditures withoutadditional resource mobilization measures could create problems of excessdemand and increasing inflation, which would require a return to stricterfiscal stabilization policies and a further postponement of efforts toaccelerate growth. The measures required to mobilize additional domesticrevenues will be contentious and technically difficult to implement quickly.The political resolution must be present to restrain expenditures on lowpriority programs. Finally, the additional fiscal iesources which are likelyto be available can support only selective increases in existing programs. Asevery budget director knows, it is difficult to relax fiscal constraints in aselective manner, and it is even more difficult to reduce programs at a laterdate that have been allowed to expand without adequate benefits beingachieved. This situation places increased priority on improvements in publicexpenditure management, particularly with respect to establishing realisticsectoral policy frameworks and investment programs. This combination ofimproved sectoral programs, increased public resource mobilization, andinstitutional reforms provides the agenda for the analysis of the publicexpenditure program.
- 3 -
A. The Structure of Public Expenditures
1.6 Total Revenues and Expenditures. Aggregate levels of publicrevenues and expenditures are low in comparison to Bangladesh's size andeconomic requirements (see Table 1.1).1V As a percentage of GDP, Bangladeshspends approximately 17-182 of its resources on public expenditurq s, as com-pared to 27Z for developing countries in the surrounding region.27 In part,this is due to the low level of per-capita income and the small size of themodern economy, which limits the amount of revenues that can be raised atreasonable cost. Even allowing for this situation, however, the current levelof domestic resource mobilization (8.7Z of GDP in FY88) is significantly belowthe level that the Government should expect to achieve. As a result, thegovernment budget and the balance of payments are dependent to a high degreeon an inflow of donor resources, representing almost one-half of the totalresource flow to the budget.
1.7 Fiscal policy during the 1980s has been dominated by financialstabilization objectives, particularly as Bangladesh adjusted to the secondoil shock in the late 1970s and t'.e collapse of international jute pricesduring t1i early 1980s. Between FY83-86, the Government reduced the budgetdeficit from 11.21 to 7.6Z of GDP, most of which was achieved throughrestraints on public expenditures. Tbis included cutting back a number of lowpriority areas in the budget. For exa mple, subsidies were eliminated on fer-tilizer and reduced on food distribution programs which served non-povertygroups. The Annual Development Program (ADP) was reduced in size, and aucore* investment program was introduced to facilitate the flow of funds topriority projects. The size of the civil service was restrained, althoughsalaries were raised to compensate for the erosion in. real compensation levelsthat had occurred over time. As result of these adjustments, continuedmaintenance of a fiscal deficit in the range of 7-82 of GDP (excluding theimpact of extraordinary events such as floods) is generally considered to besustainable in the medium term, provided that the economy resumes normalgrowth and foreign aid levels increase as recommended at recent Aid Groupmeetings.
/ Table 1.1 uses the IMF classification of revenues and expenditures. Theexpenditure tables in this report have been constructed from severalsources of data, which difter in terms of the classifications used, thedetail which is available, and the level of accuracy (e.g., budgetallocations versus revised budget estimates versus actual expenditures).An effort has been made to use the most accurate and appropriate data foreach table; this means, however, that the estimates in different tablesare not necessarily compatible.
2/ Low-income countries on a world-wide basis typically spind a smallerproportion of their national income on public expenditures, with a medianvalue in 1985 of 19.72 and a range of 12.5-32.6Z. (Source: Sample of 25low-income countries listed in the 1987 World Development Report.)
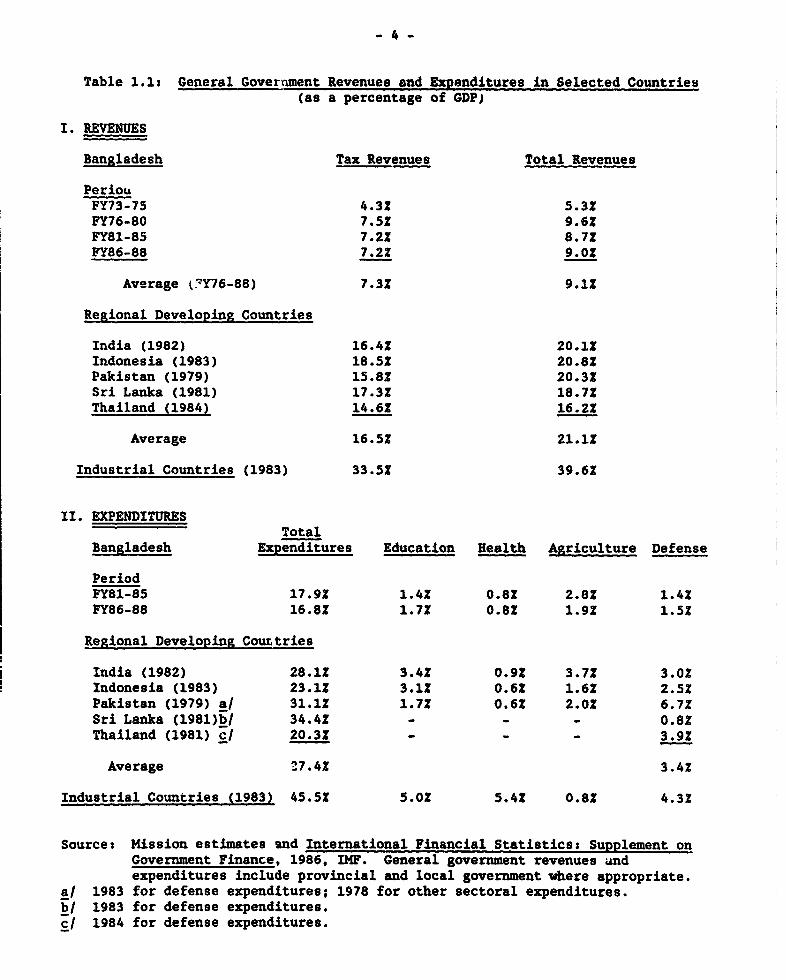
- 4 -
Table 1.1s General Goverxument Revenues and Expenditures in Selected Countries(as a percentage of GDP)
I. REVENUES
Bangladesh Tax Revenues Total Revenues
PeriouFY73-75 4.3Z 5.3ZPY76-80 7.5Z 9.62FY81-85 7.2Z 8.7?FP86-88 7.2Z 9.O0
Average (7Y76-88) 7.3Z 9.1Z
Regional Developing Countries
India (1982) 16.4? 20.1?Indonesia (1983) 18.52 20.82Pakistan (1979) 15.8? 20.3ZSri Lanka (1981) 17.3Z 18.7ZThailand (1984) 14.6Z 16.2Z
Average 16.5? 21.1Z
Industrial Countries (1983) 33.5? 39.6Z
II. EXPENDITURESTotal
Bangladesh ExDenditures Education Health Agriculture Defense
PeriodFY81-85 17.9Z 1.4? 0.8Z 2.8Z 1.42PY86-88 16.8? 1.7? 0.8? 1.9Z 1.5?
Regional Developing Courtries
India (1982) 28.1? 3.4? 0.9? 3.7Z 3.O0Indonesia (1983) 23.1Z 3.1? 0.62 1.6? 2.5ZPakistan (1979) a/ 31.1? 1.7? 0.6? 2.0? 6.7?Sri Lanka (1981)b/ 34.4Z - - _ 0.8ZThailand (1981) c/ 20.3? - - - 3.9?
Average 27.4? 3.4?
Industrial Countries (1983) 45.5? 5.02 5.4? 0.8? 4.3Z
Source: Mission estimates and International Financial Statistics: Supplement onGovernment Finance, 1986, IMF. General government revenues undexpenditures include provincial and local government where appropriate.
a/ 1983 for defense expenditures; 1978 for other sectoral expenditures.b/ 1983 for defense expenditures.c/ 1984 for defense expenditures.
- 5 -
1.8 Functional Composition of the Expenditure Program. As in manycountries, Bangladesh maintains a two-part budget framework that dividespubli. expenditures into a recurrent component (the "Revenue' or 'Non-Development" Budget) and a capital component (the 'Development' Budget orAnnual Development Program). This format is intended to distinguishexpenditures required for the normal operations and maintenane:e of government,which are expected to be financed from domestic revenues, f-om expenditureswhich expand the stock of public capital and financed at least partiallythrough domestic and foreign borrowing. In practice, this distinction hasbecome increasingly arbitrary, as the Government and donors have included alarger share of operating expenditures in the ADP in order to compensate forchronic underfunding of the Revenue Budget. It is generally recognized thatmany expenditures included in the Revenue Budget (e.g., for operations andmaintenance costs) make a very high contribution to development objectives.Therefore, this report will make use of an integrated budget format whichcombines both the Revenue Budget and ADP expenditures for various sectors.
1.9 There have been a number of marked changes in the composition of thepublic expcnditure program when examined on a multi-year basis(see Table 1.2).3/ The major 'winners' and "losers' in the budget aresummarized in Table 1.3 by order of their expenditure growth rates betweenFY83-88. These tables provide several conclusions about the implied patternof government preferences over the past several years:
(i) Expansion of the social sectors. Poverty-oriented food reliefprograms increased significancly in terms of total expenditures,reflecting an expansion of the FFW and VGD programs to provideincome support for rural landless households. Educationexpenditures increased as a proportion of the budget, although mostof the increase was due to a large increase in government subsidiesto private secondary schools rather than an improvement in services.Expenditures for health and population control also increased inrelative terms, although the quality of health services wasconstrained by implementation constraints at the primary level.
(ii) Declining shares for most economic services and infrastructure.Other than energy development, public expenditures for most economicand infrastructure sectors (including transport, agriculture andwater resources, communications, and physical planning) declined inboth real terms and as a share of total expenditures. Expendituresfor agriculture and water resources received a particularly sharpcutback, falling from 15.4Z of the budget in FY83 to 9.7? in FY88(even after removing the effect of fertilizer subsidy reductions),which the Government is currently reviewing in view of theunsatisfactory performance of the agriculture sector in recentyears.
3/ See Tables Al-A3 in the Annex for the breakdown of Table 1.2 into itsRevenue Budget and ADP components.
Table 1.2: CONSOLIDATED PUBLIC EXPENDITURES: FYSI-98(Tk Cr)
Percentage GrowthFY81 FY82 FY88 FY84 FY85 FY86 FY87 FY88 Share Rate
Actual Actual Actual Actual Actual Actual Actual Proy. FY83 FY88 FY8S-88
ADMINISTRATIVE SERVICES 711.8 684.7 792.7 949.7 1082.1 1884.2 1662.8 1768.6 14.6 16.6 17.4XAdmin. A Common Service 812.9 MT77. 1-.7 228.1 242.8 17.7 -71.9 -411.8 -Tr i3 25.68Justice A Law Enforcement 120.7 157.6 147.1 177.4 210.6 282.9 804.7 851.8 2.7 8.8 19.0XDefense 266.1 822.4 478.6 511.0 670.8 668.8 814.9 988.7 8.8 8.7 14.83Foreign Affairs 22.1 27.6 85.8 88.2 88.0 64.8 60.8 72.3 0.7 0.7 16.4X
ECONOMIC SERVICES 1102.9 1192.7 1168S. 1256.9 1183.8 1581.2 1908.6 1468.9 21.6 18.7 4.7tAgriculture A Water Res. 7I!.3 -789.5 8 211 -970.8 -8W48 !02 -91M.8 1741.4 16.4 T7 Ti4Industry 276.9 841.4 278.4 229.5 288.0 501.8 911.2 848.4 6.0 8.3 6.0XMiscellaneous Service. 88.1 61.8 68.9 66.8 49.8 66.8 86.7 72.1 1.1 0.7 4.1X
INFRASMRUCTURE 1109.4 1848.8 1228.9 1866.8 1618.8 1664.6 2228.3 2212.5 22.7 20.8 12.56Transport 626.7 684.9 41722 U9i.7 421.8 487.4 a88.8 i77 :i 8.7 7.2 10.43Energy 841.0 604.0 518.9 746.3 879.8 931.8 1,337.1 1132.2 9.6 10.6 17.13Co munications 84.7 122.6 108.8 99.8 91.4 60.8 69.9 98.8 2.0 0.9 (1.8e)Physical Planning 167.1 162.1 186.0 170.0 128.3 144.6 168.0 207.9 2.6 1.9 8.9X
SOCIAL SERVICES 677.8 769.5 888.2 1082.4 1412.3 1889.2 1892.0 2890.1 16.4 22.8 28.65Education TX816.1 827.6 399.7 517.9 -62.2 776.7 987.6 1071.5 7.4 10.0 21-.8Health a Population 211.9 232.6 248.1 286.0 297.9 408.8 401.4 518.9 4.5 4.8 16.33Relief (includes FFW) 116.2 188.2 157.1 218.2 420.2 484.7 492.8 718.6 2.9 6.7 8s.5xMiscellaneous Service. 88.6 41.2 33.8 46.8 52.0 46.6 70.7 83.2 0.6 0.8 20.1X
OTHER 848.0 649.6 1398.9 1606.4 2089.0 2580.9 2682.2 2878.7 25.8 26.9 16.6xGUT covornmont - 48.0 8930.W as.2 544.7 724.6 764.8 -W7-. T28 -T.1 4-2.0Subsidies 210.0 287.0 297.5 299.1 824.9 174.1 69.2 58.9 5.5 0.6 (29.91)Food Account Deficit 487.8 7.9 896.0 887.0 802.0 (4.0) 878.0 619.0 7.8 4.8 6.6xPension 18.6 19.3 40.2 41.2 60.7 76.6 90.0 187.0 0.7 1.3 27.8xDebt Service 146.6 262.2 480.2 407.8 591.4 1,098.3 902.1 1184.7 8.9 10.9 19.43Other 6.7 40.2 29.6 28.1 216.8 612.4 468.1 186.6 0.6 1.3 86.8x
TOTAL 4.444.9 4.640.1 6.414.2 6.129.7 7.216.6 8,760.0 10.243 10,718.0 100.0 100.0 141.631
Sourc: Combined expenditures under Rewvnue Budget and ADP, as defined In Table. A.1-A.8 In Annex.
- 7 -
Table 1.3: Ranking of Expendituro Growth Rates by Sector. FYS8-88
Sector. with Hiah Expenditure Growth Rate.
Sector Growth Rate1T.-Lcal Government 3/ 42.O2 Rellef (including FFW) 85.CWS. Pension and RettrEment Benefite 27.0S4. Ade1nistration and Common Services 2C.0W5. Educatton 21.8X6. Debt Service 19.4X
. Justice and Law Enforcement 19.0X8. Energy 17M1X9. Hbelth and Population Control 16.8510 Foreign Affairs 16.4X11. Defense 14.ax
Sectors with Low Expenditure Growth Rates
Sector Growth Rater7SubeIdi.s (28.9X)2. Comunications (1.65)8. Agriculture and Water Resources 4.654. Industry 5.OX6. Food Account Deficit 6.611S. Phyeical Planning, Water Supply and Housing 0.957. Transpot 10.4=
I/ Accounting for the Increase In local government expenditure ss a result of thedecentralization of political responsibilities to the upazila level In FY08 Is aparticularly difficult task, given the complex changes in the budget that were Involved.The large Increase In local government expenditure. between FYSS-86 Is partly attributableto a reclassification of certain sectoral development expenditure. (e.g., feder roa&d) toa block grant for upazila development; this change also account. for some of the decreaseIn the sectoral expenditure growth rates, particularly for the transport sector. Table 1.2has been adjusted to account for a roclassification of certain Items ln the Revenue Budget(particularly a block grant for wretained functions performed by upazilas) that weredisaggregatod to the budget. of sectoral ministries In FY96.
y/ The growth In debt service pyments was largely due to Increased external paymnt.,reflecting a 47X devaluation of the taka vis-a-vi thoe US dollar between FYS1-87, whichIncreased the cost of foreign paymnnts expressed In local currency terms.
(iii) Increased expenditures for administration and overhead functions.Many of the sectors which registered the highest expenditure growthrates (such as local government, pension and retirement benefits,administration and common services, justice and law enforcement,foreign affairs and defense) are determined outside the government'snormal planning process through the ADP and involve a high degree oflocal cost financing. This trend has contributed tr, the growingshortage of local funds to support project implementation in theADP.
1.10 Sources and Uses of Funds. The most buoyant source of funding forthe public expenditure program has been foreign aid, which increased from 352to 442 of total available resources between FY81-88 (see Table 1.4).41 Thisincrease offset a sharp drop in the government's net borrowing from thedomestic financial sector, which decreased from 14? of total funding sourcesin FY81 to 2? in FY88. Domestic revenues from tax and non-tax sources stayedroughly constant as a source of financing, increasing from 51? in FY81 to 54?in FY88, due to the low elasticity of the tax system and the government'sreluctance to increase tax revenues. As a result of the slow growth indomestic revenues, total sources of funding for the public expenditure programgrew at an average annual rate of only 1.9S in real terms. This wassignificantly below the average growth rate of the economy (3.9?) and led to adeclining share of public expenditures in the economy. These changes implythat the large increase in donor financing between FY81-88 served mainly toexternalize the budget deficit, rather than supporting a significant increasein the level of public expenditures. While this may have been appropriatewhile the economy was undergoing a difficu?t financial stabilization program,the Government needs to reassess priorities for increasing domestic savings iuthe coming period in order to support a higher level of public investment andeconomic growth.
1.11 The Revenue Budget grew much faster than the ADP in the FY81-88period, increasing from 30? to 50? of total expenditures, although the overallshare of recurrent expenditures in the budget remains relatively small incomparison to other countries (61? in neighboring countries; see Table 1.5).Several factors have contributed to this situation, including a largeadjustment in the civil service pay structure, which had been allowed todeteriorate significantly between FY78-85. A more detailed examination of theRevenue Budget indicates that the growth in expenditures has not beenbalanced, with highly visible categories such as local government,administration and common services, government buildings, increases in therailway deficit, and subventions to private secondary schools accounting formuch of the increase between FY83-88. At the same time, important parts ofthe Revenue Budget have remained seriously underfunded, particularlyoperations and maintenance costs (O&M) and funding for the social sectors. Inthe long run, the Levenue Budget should continue growing relative to the ADPin order to support public services (particularly health and education) andprovide operating funds for completed projects. However, the goverNment'smixed performance in managing the growth of the Revenue Budget up to now hascompromised its ability to support the future growth of essential services andprovide adequate funds to maintain project implementation in the ADP.
1.12 The two factors just noted, i.e., the growing share of the budgetfinanced from external sources (particularly project aid) and the rapid growthof recurrent expenditures relative to domestic revenues, have contributed to aserious problem in the availability of local currency resources for the ADP.
4/ Table 1.4 does not conform to the standard presentation of the budget.In the government's format, the primary focus is on the financingavailable for the ADP, which is defined as project and commodity aidplus net domestic financing plus the "revenue surplus" (defined asrevenues less recurrent expenditures plus an adjustment factor for allother items). Instead of this approach, a sources and uses of fundsformat is used in Table 1.4 in order to emphasis the fungibility betweenfinancing sources and types of expenditures at the margin.
Table 1.4: Source, and Uses of Funds for the Public Expenditure Program. FY8I-89(Tk Cr)
FY81 FY82 FY83 FY84 FY86 FY88 FY87 FY88 FY89 Percent of GrowthProy. Bud. Total Rote
FY81 FY88 FYBi-S8
SOURCES
Reve mm 2188 2840 2540 2860 8598 4228 4800 5306 6789 515 64X 18.53
Tax 17199 !im 2108 2-17-5 4817 Jil i? 4U J1 ii 1 81.x1
Non-tax 890 440 482 490 706 930 n23 1068 981 ox 1lX 15.01
Foreign Financing 1528 2020 2825 2787 2867 8151 4035 4422 4402 aI 443 16.43
Proj ct aid 15 Tii-f ID TMI Du17 1No1 flU 1515 iiN 1 WE9iCoNNdlty oId 564 760 900 s8 962 1164 1118 1512 1424 135 10X 15.1l
Fod aid 280 860 640 097 492 499 694 789 079 as 6N 16.05
Other A/ -121 -90 -59 -204 -27 -529 -786 -477 -681 -a8 -5X -21.61
DomeOtic Financing (net) 690 880 415 418 130 a86 468 179 1069 14X 23 -16.75
Total 4801 4690 5780 606m 690 7747 9808 M07 11230 1001 1001 12.73
USES
Recurrent Expendlture 1800 1400 1020 2a80 2661 8497 4159 494a 5420 801 sOX 21.01
ADP 2869 2680 2000 3011 8040 a865 4680 4027 515 n65 41X 7.0X
Food Account Oeficit 467 880 6e6 80, 426 10 e8 84 87670 llX O6 8.2x
of fhich, foodstock change 276 280 -8 27 1906 27 12 600 87 - - -
Other Expenditure and Net 160 200 224 871 468 482 501 848 119 43 ox 11.26
Lnding k
Total 4301 46090 6780 606 60690 7747 9808 9907 11230 1001 1003 12.7X
RATIOS
Recurrent Expanditure/ADP 66X 6WA 64X 70X 88X 06X 903 128X 1001Project Aid/ADP 84X 87x 465 44X 473 g6W 64x 6X 6ox
(Project + Comodity Aid)/ADP 583 O65 75 7 790 873 88S 102X 8s8
(In Percent of 0DP)
Total revenue 0.8 8.6 8.8 8.2 8.6 9.2 8.9 8.7 8.7
Tax revenue 7.7 7.0 7.8 6.8 6.9 7.1 7.2 7.0 7.2Non-tax rv nue 1.7 1.0 1.5 1.4 1.7 2.0 1.7 1.7 1.5
Total expenlture 18.4 17.8 19.9 17.8 15.8 16.8 17.8 16.2 17.0Recurrent expenditure 5.6 6.5 6.6 6.6 7.4 7.9 7.7 8.1 0.2ADP 10.2 9.9 18.8 8.6 7.8 7.9 8.6 8.6 8.1
OveralI budget deficit -9.1 -8.7 -11.2 -9.2 -7.2 -7.6 -8.4 -7.5 -8.8Excluding food stocking -10.2 -7.6 -11.2 -9.1 -0.7 -7.5 -8.4 -O.5 -8.2
I/E Equals coumrcial food borrowing minus debt amortization.Includes non-ADP projects FFm, miscellaneoun Investment (non-development), and not loans and advancee (not Including loans Included In the ADP).
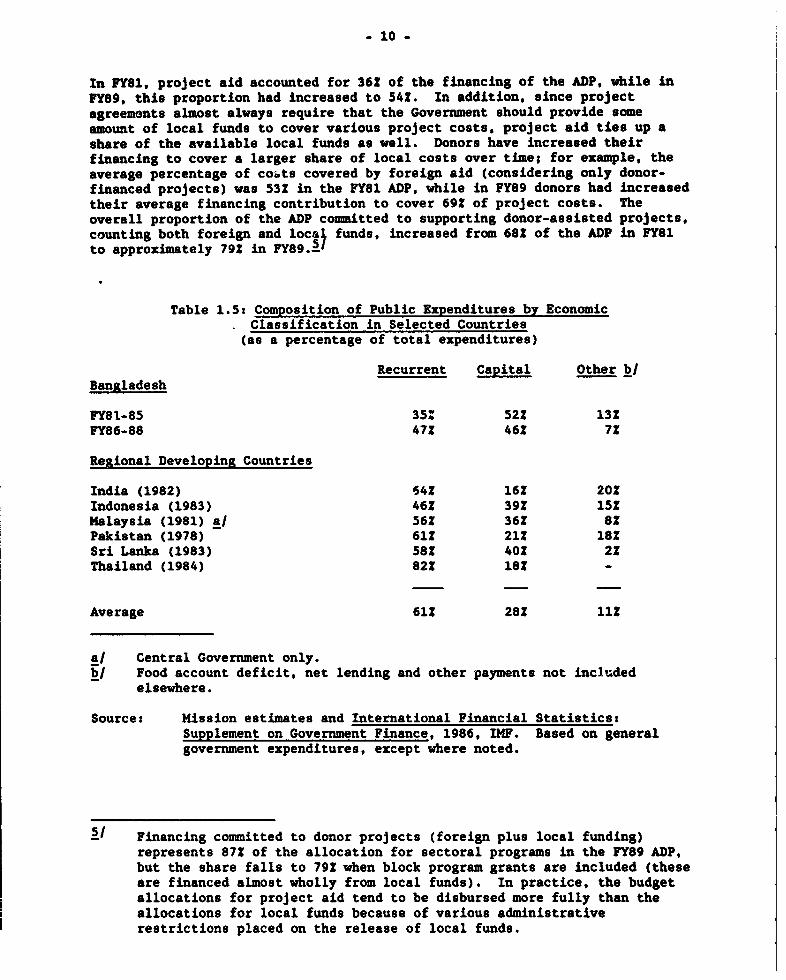
- 10 -
in FY81, project aid accounted for 362 of the financing of the ADP, while inFY89, this proportion had increased to 541. In addition, since projectagreements almost always require that the Government should provide someamount of local funds to cover various project costs, project aid ties up ashare of the available local funds as well. Donors have increased theirfinancing to cover a larger share of local costs over time; for example, theaverage percentage of coets covered by foreign aid (considering only donor-financed projects) was 531 in the PY81 ADP, while in FY89 donors had increasedtheir average financing contribution to cover 691 of project costs. Theoverall proportion of the ADP committed to supporting donor-assisted projects,counting both foreign and locar funds, increased from 68S of the ADP in FY81to approximately 79Z in FY89.5'
Table 1.5: Composition of Public Expenditures by EconomicClassification in Selected Countries
(as a percentage of total expenditures)
Recurrent Capital Other b/Bangladesh
FY8L-85 35; 52S 13SFY86-88 47Z 462 7S
Regional Developing Countries
India (1982) 641 162 201Indonesia (1983) 461 392 15lMalaysia (1981) a/ 56S 362 8SPakistan (1978) 61S 212 181Sri Lanka (1983) 581 401 21Thailand (1984) 822 18S -
Average 611 281 11l
a/ Central Government only.b/ Food account deficit, net lending and other payments not included
elsewhere.
Source: Mission estimates and International Financial Statistics:Supplement on Government Finance, 1986, IMF. Based on generalgovernment expenditures, except where noted.
S/ Financing committed to donor projects (foreign plus local funding)represents 87S of the allocation for sectoral programs in the FY89 ADP,but the share falls to 791 when block program grants are included (theseare financed almost wholly from local funds). In practice, the budgetallocations for project aid tend to be disbursed more fully than theallocations for local funds because of various administrativerestrictions placed on the release of local funds.
- 11 -
1.13 The declining share of so-called 'free funds (i.e., funds whichare not committed to specific donor projects) has several implications.First, the Government has less leeway to include projects in the ADP that arenot supported by donor financing. As indicated in Chapter 4, however, theGovernment has continued to include a .arge number of locally-financedprojects in the ADP (accounting for 462 of the total allocation of local fundsin the FY89 ADP), which has contributed significantly to shortfalls in thelocal funds required to support donor-assisted projects. Secondly, the shiftin financing sources has reduced the flexibility of the ADP to absorb fundingshortfalls (because of natural disasters, increases in foodgrain imports,over-estimation of revenues, etc.), so that projects are often affected bycut-backs in the availability of local funding during the budget year. Mostimportantly, the very high percentage of the ADP that is committed to donor-assisted projects implies that there is virtually no room left to include newproject aid commitments, unless they are financed entirely from external fundsor can be absorbed within the limited amount of local funding released fromprojects that are winding down. This implies that any significant increase inproject aid is likely to result in spreading local funds even thinner, therebycontributing to a decline in project implementation and causing little netchange in the amount of foreign resources flowing through the budget. Ineffect, the ADP has largely reached or exceeded its capacity to absorbadditional project aid until more local resources are made available to coverthe government's share of project costs. The implications of this conclusionfor the government's domestic financing requirements and the composition ofthe public expenditure program are discussed in Chaptere 2 and 3.
1.14 The final conclusion which comes from Table 1.4 is that theinclusion of the food account deficit in the budget introduces an importantsource of instability into the public expenditure program. Between FY8S-87,the change in the food account deficit was equal to 112 of the ADP. Since thedeficit is largely financed from local funds, it has a multiplied impact onthe public investment program due to changes in the availability of localfundinu. As discussed in Chapter 6, the Government may wish to considermeasures to reduce instability in the budget by managing the financing of thefood account deficit in a more flexible manner, including the use of domesticbank financing when appropriate on a macroeconomic basis.
1.15 Management of Public ExDenditures. Responsibility for themanagement of the public expenditure program is divided between twoministries, with duties that largely correspond to the division of the budgetinto recurrent and capital components. The Ministry of Planning, whichincludes the Planning Commission, the External Resources Division (ERD), andthe Implementation Monitoring and Evaluation Division (IMED\, is concernedwith the investment (or development) side of the budget.6) The Planning
61 The Ministry of Planning also includes the Bangladesh Bureau ofStatisties (BBS).
- 12 -
Comnission has the responsibility for preparing the ADP,71 which is intendedto be an annual time-sl ce of the investment program sanctioned in the FiveYear Development Plan.8f The ERD is responsible for donor coordination andexternal financing and therefore represents a critical agency for funding theADP. The IMED has responsibility for monitoring on-going projects.
1.16 Because planning of the expenditure program is considered to bethe function of the ADP, the Ministry of Finance has maintained a traditionalorientation toward government accounting and expenditure control (which is theresponsibility of the Finance Division) and the collection of governmentrevenues (which is the responsibility of the Internal Resources Division).The budget and expenditure control systems have evolved to only a limitedextent since independence, in spite of the enormous expansion of the publicexpenditure program during this period. Accounting procedures still relyalmost entirely on manual data processing techniques. The expenditure controlsystem is highly centralized, although a program was initiated in 1983 todelegate accounting and expenditure authorization functions to the operatingministries. Progress in this area has been delayed, however, by the virtuallysimultaneous decision of the Government to decentralize functions to theupazila level, a decision which has introduced substantial complications intothe government accounting framework that have yet to be adequately resolved.Information on the financial progress of the expenditure program is availableonly after considerable delays and with a large element of uncertainty.During the flacal year, the outturn of the expenditure program is monitoredthrough changes in the balance of the government's account in the BangladeshBank; more detailed expenditure monitoring by sector or agency is notavailable until well after the close of the fiscal year. Expenditure controlis therefore achieved through a rigid system of authorizations, which has ahigh frictional cost in terms of delaying the implementation of governmentprograms.
1.17 Utilization of External Aid. A major issue regarding the publicexpenditure program is the slow pace of project implementation and the limitedcapacity of the public sector to manage complex programs. Table 1.6 shows the
ii Technically speaking, the ADP is a planning document rather than abudget document. In order to authorize expenditures, the ADP must betranslated into a separate budget document (entitled "Demand for Grantsand Appropriations (Development)*) which reorders the sectoralallocations of the ADP into more conventional budget categories. Inthis regard, the ADP represents a rudimentary form of program budget.It has important limitations, however, because: (i) it does not includerecurrent expenditures; (ii) the ADP does not break down expenditurecategories below the sector/agency level, so that it is difficult tomeasure and evaluate program performance; and (iii) the lack of aconsistent classification system between the ADP and the budget createsdefinitional problems in the translation process.
!I Bangladesh is currently in the middle of the Third Five Year Plan(TFYP), which covers FY86-90. Preparation is now taking place for theFourth Five Year Plan (FFYP) to cover the years FY91-95.
- 13 -
disbursement performance of foreign-aided projects from FY72-88.91 Afterachieving an impressive average disbursement performance equal to 261 ofundisbursed commitments between FY78-82, disbursements fell in relative termsto 15t of the opening pipeline in FY83. Between FY83-85, the Government tooka number of actions to improve project implementation, including thedesignation of a 'core* investment program, streamlining the release of fundsfor priority projects, and establishment of a block account to pay customsduties on project imports. The response to these actions was generallypositive, with the aggregate disbursement ratio increasing to 212 in FY87,before falling to 19S in FY88 as a result of disruptions caused by floods andpolitical events. There are indications, however, that much of thisimprovement has been due to a number of large stand-alone projects in the ADP(e.g., bridges, power generation plants, fertilizer factories)i01 and aslowing-down in the rate of new commitments in other areas, rather than abalanced improvement in project implementation. The performance of the IDAproject portfolio, which is perhaps a better indication of project implementa-tion for many sectors, shows only a very slow improvement in the disbursementratio from FY83-86, with a sharp deterioration in FY87 and FY88 (the latteryear is the lowest since IDA began lending to Bangladesh). It is generallyagreed that a combination of problems, including growing constraints on localfunding and institutional bottlenecks such as procurement and technicalassistance, have been responsible for slow project implementation. This is acritical problem area which needs to be addressed as a matter of priority. Inorder to sustain a higher rate of economic growth, the economic scenario inChapter 2 indicates that the Government should aim for a balanced increase inthe aggregate disbursement ratio to at least 202 by FY91 and 22? by FY95.
B. Priorities for Public Expenditure Reform
1.18 The Government has been reasonably prudent in its macroeconomicconduct of fiscal policy over the past several years. This is consistent withthe government's general emphasis on the private sector as providing the majorstimulus for economic growth. At the beginning of the decade, Bangladeshstill relied on a high degree of public intervention and administrativecontrols to direct the course of economic activity. While the public sectorretains a substantial role in the economy, there has been a significant effortto strengthen the role of the private sector and introduce market-orientedmechanisms to guide decision making. The Government has implemented anextensive program of divestiture for public manufacturing enterprises, whichresulted in the transfer of approximately 650 industrial units to the privatesector between FY82-86. This reduced the management burden on the publicsector and shifted responsibility for investment financing from the ADP to thefinancial sector. The establishment of a realistic exchange rate policy and
9/ There is disagreement as to whether the disbursement ratio is a :eliableindicator of implementation performance. A number of factors (such asincreases it. the level of new commitments, exchange rate movements, andchanges in the composition of the project portfolio) can contribute tochanges in the disbursement ratio on a year-to-year basis.Nevertheless, on a long-term basis, the disbursement ratio is generallyaccepted as a useful measure of project performance.
0lo For example, the rapid increase in disbursements in FY87 was primarilydue to exceptionally large payments for the Chittagong Urea Piant andthe Bangladesh Power Development Board.
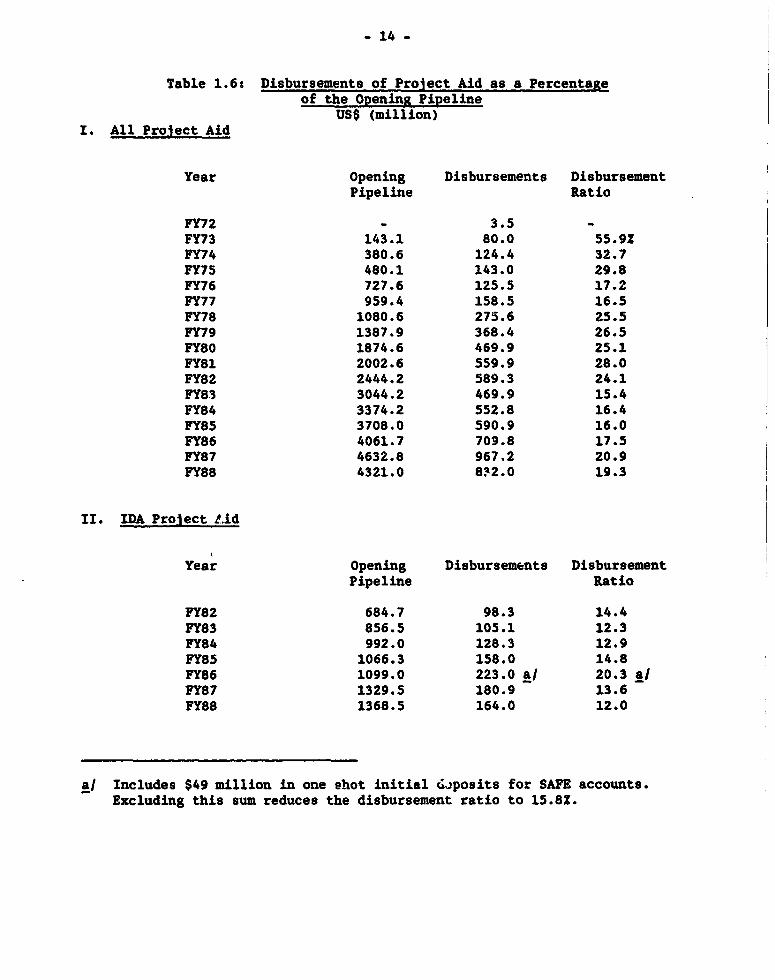
- 14 _
Table 1.6: Disbursements of Project Aid as a Percentageof the Opening PiPeline
US$ (million)I. All Proiect Aid
Year Opening Disbursements DisbursementPipeline Ratio
FY72 - 3.5FY73 143.1 80.0 55.9tFY74 380.6 124.4 32.7FY75 480.1 143.0 29.8FY76 727.6 125.5 17.2FY77 959.4 158.5 16.5FY78 1080.6 275.6 25.5FY79 1387.9 368.4 26.5FY80 1874.6 469.9 25.1FY81 2002.6 559.9 28.0FY82 2444.2 589.3 24.1FY83 3044.2 469.9 15.4FY84 3374.2 552.8 16.4FY85 3708.0 590.9 16.0FY86 4061.7 709.8 17.5FY87 4632.8 967.2 20.9FY88 4321.0 8W2.0 19.3
II. IDA Project L.id
Year Opening Disbursements DisbursementPipeline Ratio
FY82 684.7 98.3 14.4FY83 856.5 105.1 12.3FY84 992.0 128.3 12.9FY85 1066.3 158.0 14.8FY86 1099.0 223.0 a/ 20.3 a/FY87 1329.5 180.9 13.6FY88 1368.5 164.0 12.0
a/ Includes $49 million in one shot initial w posits for SAFE accounts.Excluding this sum reduces the disbursement ratio to 15.8Z.
- 15 -
promotional policies toward foreign private investment have helped to developa nascent export-oriented industrial capacity which has provided much of thedynamism in recent economic growth and augmented the country's foreignexchange earnings. The Government has also adopted a range of importliberalization measures and expanded the role of the secondary foreignexchange market, which has lessened the role of foreign exchange allocationprocedures in determining the direction of public and private sectoractivit^'s. Finally, in the Revised Industrial Policy of 1986, the Governmenthas spelled out guidelines which limit the role of the public sector in termsof future investments in directly productive activities.
1.19 This overall policy direction, which is still in the process ofimplementation, is basically sound and represents a clearer and more realisticvision of the relative advantages and areas of responsibility of the publicand private sectors. The experience of the past several years hasdemonstrated that the private sector can assume greater responsibility fordirectly proctuctive activities and will respond positively to marketincentives and a lessened degree of administrative control. The prospects forthe public expenditure program should therefore be framed in the context of apolicy etnvironment which continues the implementation of structural reforms,including greater reliance on the private sector. Even within this policyframework, however, there are serious concerns as to whether the publicexpenditure program is doing enough to support the expansion of the economy.Deficiencies in public services and infrastructure are a significantconstraint in many areas of the economy, and it is generally accepted thatl_ng-term growth will be imposs.ble without improvements in human resourcedevelopment and direct interventions to mitigate widespread poverty. Thepotential cost of providing these public services is immense, and improvementswill require the dedication of the Government and the donors to long-termdevelopment programs that will take years in order to achieve their fulleconomic benefits. In this context, it is crucial to make realistic judgmentsregarding the cost-efficiency, financing requirements, and developmentpriorities for a wide variety of public programs.
1.20 The following areas provide a guide to priorities in publicexpenditure reform over the next several years:
I: Increase public expenditures in selected activities. Increased publicinvestment and productivity improvements are an integral component ofeconomic growth, and public expenditure reform can be an importantmeans for achieving these objectives. There are a number of areaswhere greater public expenditures are justified in order to supportincreases in private production (e.g., water resource developmentprograms), improve the efficiency of domestic production activities(e.g., improvements in road transportation and communications) andprovide essential human resource development programs needed toutilize Bangladesh's economic potential more effectively (e.g., healthand education). At the same time, many existing public programs donot.represent an efficient use of public resources. Improved expendi-ture control in areas such as staffing, operating subsidies andadministration and overhead functions should be an important componentof public expenditure reform, and the Government needs to reexamineits priorities in the ADP to ensure that adequate funding is providedto high priority projects.
- 16 -
II: Increase domestic resource mobilization. The government's inabilityto increase domestic revenue mobilization has produced a seriousimbalance in funding resources for the public expenditure program. Asa result, the ADP has effectively reached its limit in terms of beingable to absorb additional project assistance without slowing down theimplementation of the rest of the portfolio. Donors can help easethis situation by greater flexibility in the use of project aid, butthis effort is likely to have diminishing benefits in the absence of astrong commitment to improved domestic resource mobilization. Publicexpenditure reform will therefore depend critically on the govern-mient's willingness to implement a phased program of tax reform. non-tax revenue measures, improvements in public pricing policies andgreater emphasis on self-financing of public investments.
III: Improvements in public sector management. Even if a consensus isdeveloped on priorities for public expenditu:e increases, deficienciesin public sector management can still constrain the scope forimprovements in the level and cost-effectiveness of public programs.Increases in foreign aid commitments are constrained by the lack of aproject pipeline, while the funds that are committed are often subjectto slow utilization. More importantly, the Government must enforcebetter control over the allocation of local funds within the RevenueBudget and the ADP in order to ensure that additional revenues areused for high priority activities. Improvements in planning,budgeting, and project implementation procedures are therefore thethird important element to be achieved as part of a program of publicexpenditure reform.
1.21 In the long term, sustained increases in public expenditures mustrely on economic growth in order to provide the necessary resources. TheGevernment has already gone a long way in this direction by recognizing thecontribution that the private sector can make to the economy and by beginningto restructure the division of responsibilities to provide more resources andgreater flexibility for private sector initiatives. What is needed now is anequally positive definition of the public sector's role in the economy.Public expenditure reform can help to achieve this objective by using thegovernment's command over resources to direct funds to activities which arebest suited for public sector involvement and which complement the activitiesof the private sector. In the remaining chapters, we will take a detailedlook at the actions that the Government can take to improve the impact of thepublic expenditure program.

- 17 -
Chapter II
Financing the Public Expenditur, Program
2.1 An increase in public expenditures requires, by definition, that alarger amount of resources be made available to the public sector. To theextent that economic growth improves, it will be easier for the Government tocapture additional resources from a growing pool. Even so, the pressingdemands of the public expenditure program and the low responsiveness of thetax system to economic growth require that the Government should takeadditional discretionary actions to claim a greater share of national income.This section will examine the range of actions available to the Government toincrease public resource mobilization and provide a preliminary assessment oftheir possible impact. Particular attention is paid to certain subjects, suchas financial sector reform, that play an important role in the subsequentdiscussion of the sectoral expenditure programs. In other cases, such as taxreform and the macroeconomic growth prospects of the economy, the discussionis briefer and reference is made to more detailed treatments in other reports.Section A will provide a brief summary of the macroeconomic growth prospectsfor the economy, while Section B will address the priorities for publicresource mobilization.
A. Increasing Economic Growth
2.2 The long-term prospects for public expenditure reform dependcritically on the government's ability to increase the rate of economicgrowth. The overall performance of the economy in the FY81-88 period has beenreasonably satisfactory. The economy was able to maintain an average growthrate of 3.92 despite a substantial fall in the price of the major exportcommodity (jute), the subsequent need to implement a rigorous stabilizationprogram to regain balance in the external and fiscal accounts, and the impactof several major natural disasters. Nevertheless, a more detailed examinationof the economy's performance shows that the pattern of growth has beenunbalanced, with agriculture and manufacturing performing significantly belowtheir potential, while growth has been concentrated in construction, servicesand energy, which are dominated by public sector initiatives. While growth isexpected to continue in the latter areas, sustained long-term growth can beachieved only if the performance of agriculture and manufacturing improvessignificantly.
2.3 In agriculture, growth will depend on further diffusion of moderntechnology and successful diversification of production into additional cropsas well as foodgrains. The potential for both is large, due to thesubstantial untapped capacity for water management programs, the scope forgreater application of HYV technologies, and the potential for improvements inagricultural practices. The Government has recently prepared a draft NationalWater Plan that outlines a twenty-year program of investment in watermanagement that would permit Bangladesh to tap approximately 722 of itspotential for irrigated agriculture, as compared to 26Z at present.Fertilizer usage is currently at less than half of its agronomic potential,while the country has been able to achieve a net export capacity in ureaproduction at current levels of demand. The scope for diversification intofisLeries is also substantial, as well as potential improvements in jute
- 18 -
production and vegetable crops. Given this favorable capacity for highergrowth, the Government is currently engaged in a review of policies todetermine the reasons for the sluggish performance of the agriculture sectorin recerat years. A number of factors appear to have been important indampening growth, including constraints on agricultural credit due to thecredit recovery drive, inconsistent government policies toward the role ofpublic and private agencies in the supply of agricultural inputs, and adverseweather conditions. As remedial actions are identified and implemented, it isexpected that the rate of agricultural growth can improve over the nextseveral years from the 2.2Z growth rate experienced in FY8i-87 to a range of3.0-3.52 in the medium term and 3.5-4.0 by the year 2000.
2.4 Sluggish growth in manufacturing has been due largely to weakdomestic demand, which is related to poor agricultural growth. In addition, anumber of structural problems remain unresolved, particularly with respect totraditional manufacturing activities. The government's divestiture programfor public sector enterprises in the FY83-86 period has not achieved many ofits potential benefits because of constraints placed on the actions of privateentrepreneurs, limited resources for term investment credits, and uncertain-ties about the prospects for several major industries (e.g., textiles, jute,sugar mills) due to the lack of a clear commitment to address problems ofexcess capacity and poor performance by the remaining public enterprises.With regard to export-oriented industries (e.g., ready-made garments) whichhave provided much of the recent improvement in industrial growth, there is aneed to tap additional markets and introduce new products, which will requirecontinuing efforts to attract foreign private investment. Thus, whileimprovements in agriculture growth and continuation of the favorable foreigntrade environment can help to revive growth in the manufacturing sector,greater progress in structural reform, including trade policies, publicenterprise restructuring and financial sector reform, will be important inorder to achieve significant growth in this sector.
2.5 The potential role of the public expenditure program in restoringgrowth in the agriculture and manufacturing sectors is complementary to theneed for continued policy reform. In agriculture, policy improvements inprice incentives, institutional reform of agricultural credit programs, andresolution of problems constraining the effective participation of the privatesector in input supply can lay the basis for quick-yielding improvements inthe fielding and utilization of irrigation equipment and the distribution offertilizer and quality seeds. This will need to be complemented by improve-ments in water resource management programs and strengthening of agriculturalservices such as extension and research, which will place increasing demandson the public expenditure program. In the industrial sector, the role ofdirect public investment is expected to be secondary to the need for continuedpolicy reform in line with the Revised Industrial Policy of 1986. However,major public investments in transportation, communications, energy developmentand local infrastructure can play an important role in lowering productioncosts and supporting efficient industrial growth. Finally, large publicexpenditures for human resource development programs, including health, familyplanning, education and targeted poverty interventions are essential tosupport long-term development objectives. While increased public expendituresare necessary to provide a suitable environment for improved economic growth,higher growth is also essential in order to provide the resources to firancethe programs. For example, universal primary education is an importantobjective in order to support long-term growth, but it will be financiallysustainable only if economic growth accelerates to the range of 5-5.52 in
- 19 -
order to provide the necessary public resources. Public expenditure reformcan help to realize the benefits of structural reform, therefore, but publicexpenditure reform cannot be successful without improvements in economicgrowth.
2.6 Recent country economic memoranda prepared for the Bangladesh AidGroup have described Ihe major actions needed to support economic growth inthe range of 5-5.52.1 These include: (i) sustained political comnitment toa stable macroeconomic environment as outlined in the government's PolicyFramework Paper (PFP) of November 1988; (ii) implementation of structuralreform programs in agriculture, industry, energy, the financial sector, andpublic enterprises; (iii) public expenditure reform, including rationalizationof sectoral expenditure programs, increased domestic resource mobilization andimproved public sector management; and (iv) increased inflows of externaldonor assistance sufficient to support higher growth and maintain balance ofpayments equilibrium. Table 2.1 presents the results of an economicprojection for the Fourth Five Year Plan period (FFYP; covering FY91-95) basedon this policy framework.2/ This scenario indicates that improvements inagricultural and industrial growth to 3.32 and 7.42 respectively could sustaina growth rate for the economy of about 5.2Z in real terms, with acceptableimplications for the fiscal and current account deficits (both in the range of7.0-7.5Z of GDP). The increase in economic growth would support significantimprovements in private consumption and investment, with average growth ratesof 4.42 and 7.42 respectively. At the same time, the Government would be able
1/ See Bangladesh: Promoting Higher Growth and Human Development, WorldBank Country Study (red cover), October, 1987; "Bangladesh: Adjustmentin the Eighties and Short-Term Prospects," World Bank Country EconomicMemorandum No. 7105-BD (grey cover), March 10, 1988; and 'Bangladesh:Recent Er-..omic Developments and Short-Term Prospects,' World BankCountry Economic Memorandum No. 7596-BD (grey cover), March 13, 1989.
2/ The results of this projection should be interpreted as providing aconsistency check on the assumptions included in the policy framework,rather than an actual forecast of growth during the five-year period.Given the vulnerability of the economy to external events and naturaldisasters, the Government would be wise to plan for a lower average rateof growth in practice. This would help avoid the situation faced duringthe Third Five Year Plan period when the economic projections proved tobe overlv optimistic and left the Government with an unsustainable publicinvestment program.
31 The growth scenario in Table 2.1 is based on a relatively optimisticassumption concerning the capital intensity of economic growth. Theimplied incremental capital-output ratio (ICOR) for the FY91-95 period isapproximately 2.5, as compared to an ICOR of 3.0 for the FY83-87 period.(Both ICORs are quite low by international standards, which is largelyattributable to underreporting in the estimates for gross investment.) Arelatively low ICOR may be achievable in the medium-term, given that theeconomy is currently operating at substantially below capacity, but it isnot a sustainable option in the long run. In preparation for the FFYP,the Planning Commission is carrying out an investigation of the relativecapital requirements for growth in various sectors. This work isexpected to make an important contribution to understanding the potentialsources of productivity improvements for the Bangladesh economy.
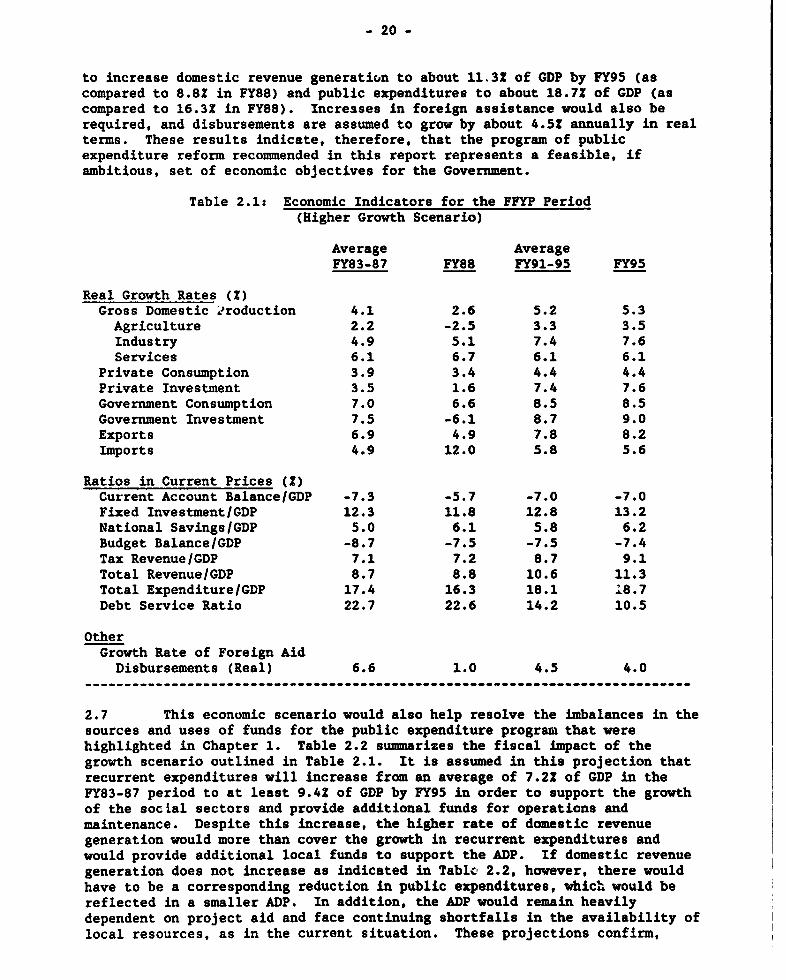
- 20 -
to increase domestic revenue generation to about 11.3Z of GDP by FY95 (ascompared to 8.8Z in FY88) and public expenditures to about 18.7Z of GDP (ascompared to 16.3? in FY88). Increases in foreign assistance would also berequired, and disbursements are assumed to grow by about 4.5Z annually in realterms. These results indicate, therefore, that the program of publicexpenditure reform recommended in this report represents a feasible, ifambitious, set of economic objectives for the Government.
Table 2.1: Economic Indicators for the FFYP Period(Higher Growth Scenario)
Average AverageFY83-87 FY88 FY91-95 FY95
Real Growth Rates (X)Gross Domestic Production 4.1 2.6 5.2 5.3Agriculture 2.2 -2.5 3.3 3.5Industry 4.9 5.1 7.4 7.6Services 6.1 6.7 6.1 6.1
Private Consumption 3.9 3.4 4.4 4.4Private Investment 3.5 1.6 7.4 7.6Government Consumption 7.0 6.6 8.5 8.5Government Investment 7.5 -6.1 8.7 9.0Exports 6.9 4.9 7.8 8.2Imports 4.9 12.0 5.8 5.6
Ratios in Current Prices ?Z)Current Account Balance/GDP -7.3 -5.7 -7.0 -7.0Fixed Investment/GDP 12.3 11.8 12.8 13.2National Savings/GDP 5.0 6.1 5.8 6.2Budget BalanceJGDP -8.7 -7.5 -7.5 -7.4Tax Revenue/GDP 7.1 7.2 8.7 9.1Total Revenue/GDP 8.7 8.8 10.6 11.3Total Expenditure/GDP 17.4 16.3 18.1 18.7Debt Service Ratio 22.7 22.6 14.2 10.5
OtherGrowth Rate of Foreign AidDisbursements (Real) 6.6 1.0 4.5 4.0
2.7 This economic scenario would also help resolve the imbalances in thesources and uses of funds for the public expenditure program that werehighlighted in Chapter 1. Table 2.2 summarizes the fiscal impact of thegrowth scenario outlined in Table 2.1. It is assumed in this projection thatrecurrent expenditures will increase from an average of 7.2? of GDP in theFY83-87 period to at least 9.42 of GDP by FY95 in order to support the growthof the social sectors and provide additional funds for operations andmaintenance. Despite this increase, the higher rate of domestic revenuegeneration would more than cover the growth in recurrent expenditures andwould provide additional local funds to support the ADP. If domestic revenuegeneration does not increase as indicated in Tabl; 2.2, however, there wouldhave to be a corresponding reduction in public expenditures, whicb would bereflected in a smaller ADP. In addition, the ADP would remain heavilydependent on project aid and face continuing shortfalls in the availability oflocal resources, as in the current situation. These projections confirm,
- 21 -
therefore, that improvements in domestic revenue generation are a keyrequirement for achieving an increase in public expenditures and betterutilization of foreign aid. On this basis, the next section will examine therange of actions available to the Government to increase domestic revenuegeneration over the next several years.
Table 2.2: Projected Sources and Uses of Funds for thePublic Expenditure Program, FY91-95
(as Z of GDP)
Average AverageFY83-87 FY88 FY91-95 FY95
SourcesRevenues 8.7 8.7 10.6 11.3Tax 7.1 7.0 8-7 9.1Non-tax 1.6 1.7 1.9 2.2
Foreign Financing 7.8 7.2 7.1 7.0Project Aid 4.4 4.2 4.5 4.6Commodity Aid 2.6 2.5 2.1 1.9Other a/ 0.8 0.5 0.5 0.5
Domestic Financing (Net) 0.9 0.3 0.4 0.4
Total 17.4 16.2 18.1 18.7
UsesRecurrent Expenditure 7.2 8.1 9.2 9.4ADP 9.1 6.6 8.4 8.8Other b/ 1.1 1.5 0.5 0.5
Total 17.4 16.2 18.1 18.7
RatiosRecurrent Exp./ADP 791 123Z 10OZ 107ZProject Aid/ADP 48Z 652 54Z 52Z(Project + Commodity Aid)/ADP 772 1022 79Z 742(Revenues less Recurrent
Expenditure)/ADP 162 -9Z 17Z 22Z…--------------------------------------------------------------------__-----
a/ Includes food aid.b/ Include food account deficit.
- 22 -
B. Public Resource Mobilization
2.8 The major categories of public resource mobilization that areaddressed in this section include:
($) tax revenues;(ii) non-tax revenues;(iii) self-generated resources;(iv) deficit financing; and(v) external donor assistance.
The discussion of tax reform will draw on material that is available in aseparate report, while the remaining material will draw on the detailedsectoral analysis which is available in Chapters 6-12. The purpose of thissection is to asseis the prospects and major issues underlying the possibilityfor increased public resource mobilization in each of these areas.
2.9 Tax Revenues. Tax revenues have remained in the vicinity of 7.0-7.5Z of GDP since FY83. The current tax structure has a number of inherentdisadvantages. First of all is the low responsiveness of tax revenues tochanges in GDP, so that the Government has to introduce annual increases intaxes just to maintain tax revenues as a relatively constant share of GDP. Asecond disadvantage is the large number of distortions and disincentives toefficient production decisions that have been built into the tax structureover time. As a result, the Government will need to balance competingobjectives for increasing tax revenues and making structural reforms in thetax system over the next several years. A comprehensive study was recentlyprepared to assist the Government in developing a program of tax reform.41The recommended reform program would include, inter aliat (i) for indirecttaxes, a shift in the point of taxation closer to the stage of final consump-tion rather than on intermediate goods in order to reduce distortions in thechoice of inputs and provide for a gradual broadening of the tax base as theshare of consumption goods distributed through the modern sector expands; and(ii) for direct taxes, a reduction in the large number of exemptions andallowances that current'ly erode the tax base. The net impact of thesemeasures over the next three to five years is expected to be on the order of21 of GDP, which would provide roughly a one-third improvement in the relativetax yield as compared to the FY81-88 period. In the longer term, the changesin the tax base would make revenues more responsive to increases in GDP, whichwould reduce the need for discretionary tax changes on a year-to-year basis.
41 See Bangladesh: An Agenda for Tax Reform,' World Bank Economic ReportNo. 7196-BD, May 1988 (green cover). The Government has introduced anumber of reforms in the tax system in recent years, including tariffreductions and rationalization of quantitative restrictions on imports,increases in excises and other taxes, and improvements in taxadministration. These actions have not yet generated a substantialincreaseb in revenues, however, primarily because of the slackperformance of the economy and imports in general.
Table 2.3: Central Government Revenues. FY88-8)(Tk Cr)
AnnuLPercentage PercentageDistribution Change
FY88 FY84 FY85 FY86 FY87 FY88 FY89 FY83 FY88 FY83-88
Actual Actual Actual Actual Actual Prov. Budget
TAX REVENUE 2107.6 2869.6 2887.2 8297.6 8878.6 4248.6 4758.0 83 81 15.1X
Custom duties 870.0 938.9 1188.1 1899.2 1646.6 1681.0 1748.0 34 al 18.41
Sales tax 297.7 350.4 445.6 460.6 640.4 586.9 612.0 12 10 12.5%
Income and profits tax 325.7 838.9 a86.8 462.1 661.1 609.6 780.0 18 12 1I.1X
Excise tax 497.6 697.0 691.9 72.4 918.2 1160.6 1246.0 19 22 18.31
Land tax 22.0 80.4 42.4 54.7 85.6 76.1 96.0 1 1 28.2x
Stomp tax 79.4 100.6 110.0 189.8 188.9 160.7 175.0 a 3 18.71
Other tax revenue /a 15.6 17.8 28.4 69.4 93.8 100.6 158.0 1 2 45.41
NON-TAX REVENUE /b 482.8 490.6 706.6 930.2 928.1 1057.7 981.0 17 19 10.61
Non-financial public enter-pris m-profit transfers 28.0 28.8 67.4 73.1 93.6 65.9 76.0 1 1 17. OX
Public financial lnstitu-tions-protit transfers 93.9 94.1 213.0 270.4 217.6 121.1 168.0 4 2 5.21
Interest recopt. 99.7 117.4 124.8 280.9 192.0 228.5 280.0 4 4 17.65
Reglstration fees 28.6 81.9 40.0 43.4 87.9 59.2 67.0 1 1 16.7X
Agriculture, nl. forest 28.0 83.7 45.8 60.6 69.4 66.7 84.0 1 1 19.01
Other 156.2 186.2 216.8 246.8 302.6 680.3 382.0 6 10 27.7X
TOTAL REVENUE 2640.1 2860.1 8692.8 4227.8 4799.Z s50.3 5789.0 100 100 16.91
PERCENTAGES -= == -
Total Revenue/QOP 8.8 8.2 8.8 9.1 8.9 8.7 8.7
Tax Revenue/GOP 7.3 6.8 8.9 7.1 7.2 7.0 7.2
Non-tax Revenue/GOP 1.5 1.4 1.7 2.0 1.7 1.7 1.6
/a Includes surcharge on lnterest Income levied for Jamuns Bridge starting In FY86./b Does not Include deficit/surplus of Bangladesh Railways and Post Office.
- 24 -
2.10 Non-tax revenues. Non-tax revenues have accounted for approximately1.5-2.02 of GDP during the FY83-88 period (see Table 2.3). These includeprofit transfers from public financial institutions (112 of non-tax revenuesin FY88, of which Bangladesh Bank provided the largest share), interestreceipts on loans to autonomous bodies and government boards (212 of non-taxrevenues in FY88), other revenues which cover a variety of fees and chargesfor government services (502 of non-tax revenues), profit transfers from non-financial public enterprises (52 of non-tax revenues), while the remainingshare consists of registration fees for public documents and revenues of theForest Department. As with tax revenues, the prospects for increases in non-tax receipts depend on a variety of other reform measures being considered bythe Government, particularly financial sector reform, public enterprisereform, and improvements in public sector debt management. The discussion inthis section will review each of these aspects. many of which are treated ingreater detail in the sectoral expenditure discussions in Part II of thereport.
2.11 Profits generated by the Bangladesh Bank arise from its statutorycontrol over the money supply and include interest on loans to commercialbanks, fees and commissions, and revenue accruing from the creation of newmoney as t.se economy expands. The latter receipts are sometimes referred toas an 'inflation tax," as higher inflation due to monetary expansion increasesthe revenues of the central bank and thereby results in a net transfer ofresources to the public sector. The Government has generally avoided thetemptation to finance the budget deficit through excessive money creation, andthe rate of inflation, while still uncomfortably high at 11.42 in FY88, hasbeen generally stable in the range of 10-112 since FY82. Further decreases inthe inflation rate are desirable in the medium term in order to reduce fric-tional costs due to price changes, but given the current situation of slackdemand in the economy, excessive fiscal restraint to bring down the inflationrate is not warranted at this time.
2.12 While profit transfers from the Bangladesh Bank represent animportant source of revenue for the budget, a large share of potential profitsare foregone in order to provide interest rate subsidies through preferentialrefinancing facilities. Currently some twelve credit programs provide loansat below market interest rates, generally through the nationalized commercialbanks (NCBs) and specialized institutions such as Bangladesh Krishi Bank(BKB). The cost of reduced interest rates is supposed to be reimbursed to thebanks by allowing them to refinance loans through Bangladesh Bank atpreferential rates. In fact, the spread provided on the refinancingfacilities is often inadequate to cover the full cost of the subsidies;moreover, the refinancing windows are not effective during periods when thebanking system has excess liquidity. Because of the complexity of the variousprograms, it is difficult to calculate the cost of all the various interestrate subsidies. However, an estimate based on four of the largestpreferential lending programs in 1985 (for agriculture, jute exports, otherexports and small and cottage industry term loans) indicated that the annualcost of interest rate subsidies was on the order of Tk Cr 115, of whichpreferential refinancing facilities through Bangladesh Bank reimbursed aboutTk Cr 20, while the remainder was absorbed by the NCBs against their profits
- 25 -
(which in turn reduced dividends and profit transfers from the NCBs to thebudget) .5
2.13 Interest rate subsidies are part of a larger system of implicitsubsidies through the financial system, most of which benefit publicenterprises. Other aspects which are addressed in Part II of the reportinclude loans to cover operating losses by public enterprises (particularlyfor jute and textile mills) and poor enforcement of credit recovery,particularly for agricultural and industrial loans. Many of these programshave resulted in large amounts of unrecoverable loans, which have yet to berecognized by Bangladesh Bank and the NCBs. The cost of continued creditundiscipline will ultimately fall on the budget through such avenues asreduced transfers of profits from Bangladesh Bank, reduced dividends and taxesfrom the NCBs, and financial transfers to the NCBs in the form of directsubsidies andlor recapitalization programs in order to restore their financialsolvency. A program of financial sector reform has been proposed to addressthis situation. One of the more important aspects of the program is thatsubsidies would no longer be hidden in the financial system but rather wouldbe made transparent in the form of direct financial transfers through thebudget. This would ensure that the cost of the subsidy programs (includingrecapitalization payments to address problems of poor loan recovery and baddebts) will be recognized in the budget process and subjected to continuedscrutiny. In terms of revenue prospects, however, any increases in non-taxrevenues due to financial sector reforms (e.g., because of reductions inpreferential refinancing facilities through Bangladesh Bank) are likely to bemore than offset by increased budgetary expenditures, such as direct paymentsfor interest rate subsidies and increased transfers to the NCBs to coverlosses on directed credit programs.
2.14 Just as non-tax revenues from public financial institutions havetended to mask underlying structural problems, the transfer of profits anddividends from non-financial public enterprises has taken place without acareful review of the financial capacity of the various enterprises. Thebasic principle underlying these payments is correct; the Government shouldreceive a financial return for the large amount of resources it has investedin public enterprises. In some cases, the Government has purposely set pricesto generate revenues for the budget, such as the transfer of Tk Cr 29.7 inFY87 from Bangladesh Petroleum Corporation to the budget because of aGovernment decision to maintain domestic petroleum prices above the level ofinternational prices. In most cases, however, many of the enterprises are notin a position where they can realistically transfer profits to the budget inthe near term. For example, in FY87, BCIC transferred Tk Cr 11.9 in profitsand dividends to the Government, despite the fact that it registered a netfinancial loss of Tk Cr 5.5 for the fiscal year, while BTMC transferredTk Cr 13.9 to the Government despite losses of Tk Cr 22.7. Problems in thedistribution of public enterprise revenues go substantially beyond thequestion of dividend payments; for example, many public corporations userevenues from profitable firms to cross-subsidize loss-making enterprises.These are issues that need to be addressed in the context of public enterprisereform. The Government has been experimenting with measures such as animproved performance monitoring system for public enterprises and partialprivatization schemes involving the sale of 492 of the stock in selected
S/ "Bangladesh: A Program for Financial Sector Reform,* World Bank EconomicReport No. 6901-BD, December 17, 1987 (green cover).
- 26 -
enterprises. These efforts have been limited in scale, however, while muchmore serious problems involving over-capacity and excessive staffing in thepublic enterprises (e.g., jute, textile and sugar mills) have goneunaddressed. In this context, the immediate prospects for increased revenuetransfers from public enterprises do not appear to be promising until aserious reform program has been introduced.
2.15 While expectations for additional non-tax revenues from dividendsand profit transfers do not appear to be favorable, there are several areas inwhich the Government can achieve significant increases in non-tax revenueswithout causing distortions in the economy. For example, the monitoring ofdebt service payments to the Government by public corporations and otherbodies has been very lax. The Finance Division enforces payments of interestand princip&l on foreign loans by withholding funds from fourth quarterallocations under the ADP. In most cases, however, the amount withheld coversonly the repayment obligation of the Government, which is generally onconcessional terms, rather than the loan repayment required under subsidiaryon-lending agreements between the Government and the borrower, which may be onsignificantly harder terms. It is estimated that the resulting loss to thebudget on IDA credits alone is at least Tk Cr 225 per year, which would almostdouble the annual revenue currently received in the form of interest payments.Stricter enforcement of repayments on local currency loans should also beconsidered. as many firms currently treat these loans as grants. Laxenforcement of loan repayments represents a substantial implicit subsidy topublic enterprises which encourages them to seek new investment rather thanmaintaining existing capacity, as well as disguising cost inefficiencies anddiscouraging competition by the private sector. Improvements in public sectordebt management would therefore promote the dual objectives of increasedrevenue mobilization and greater economic efficiency.
2.16 Another area where the Government can obtain increases in non-taxrevenues is miscellaneous fees and charges. Approximately Tk Cr 530.3 wasgenerated from this source in FY88, but in most cases the fees charged forpublic services are still significantly below their cost to the Government.6/Table 2.4 provides an estimate of the malor economic subsidies during FY87188,which amount to approximately 32 of GDP.±V About one-third of the subsidiesoccur in areas with direct relevance to the government's poverty alleviationobjectives, such as primary education, primary health programs and food relieforiented to the poor, and these programs should generally be extended and mademore efficient through selective targeting of subsidies. In other areas,increased user charges will have to be phased in as public services improveand operating agencies develop a technical capacity to administer suchcharges; irrigation fees are the major example in this regard. However, thereare a number of areas where public prices can be increased significantly withlittle distortion to the economy.
6/ For example, the FY88 budget includes miscellaneous non-tax revenue ofTk Cr 40 for the sale of ration goods to military personnel. It isestimated these commodities are distributed to military personnel at aprice which includes an 852 subsidy element. Another example is the rentalreceipts for government housing (Tk Cr 7.1 in PY88), which aresubstantially below the market value for such accommodations.
7/ A more detailed discussion of the various subsidies is provided in thesectoral chapters in Part II.
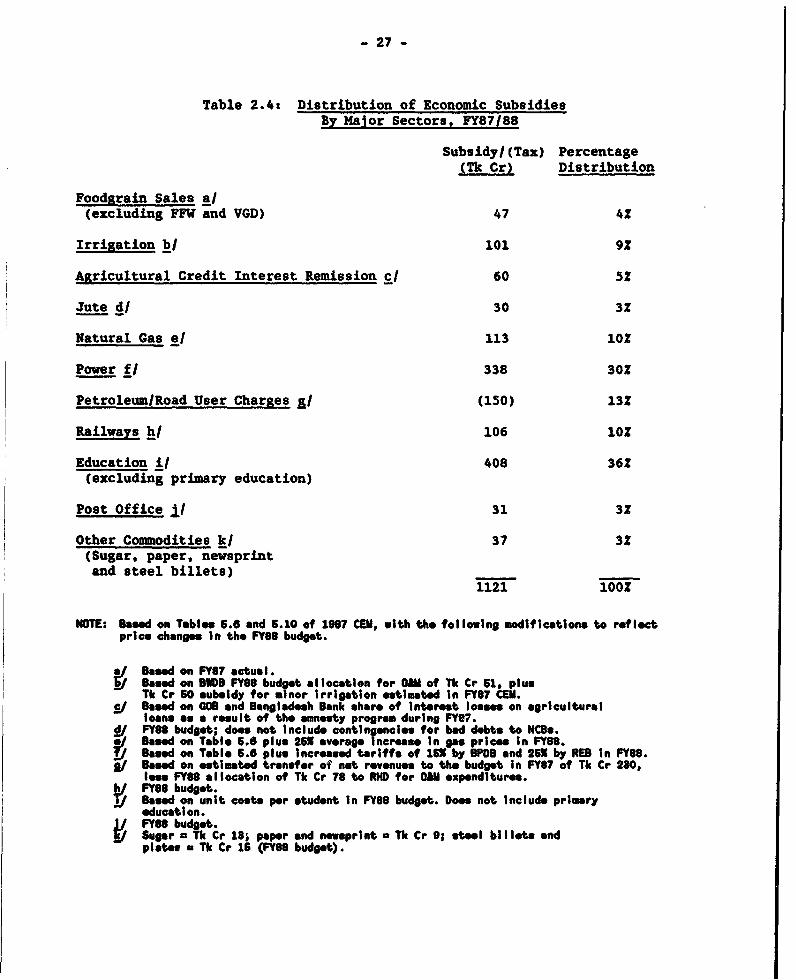
- 27 -
Table 2.4: Distribution of Economic SubsidiesBy Maior Sectors, FY87188
Subsidy/ (Tax) Percentage(Tk Cr) Distribution
Foodgrain Sales a/(excluding FFW and VGD) 47 4?
Irrigation bi 101 92
Agricultural Credit Interest Remission Cl 60 52
Jute di 30 3Z
Natural Gas eJ 113 102
Power f/ 338 302
Petroleum/Road User Charges jl (150) 132
Railways h/ 106 10o
Education il 408 362(excluding primary education)
Post Office Jj 31 3S
Other Commodities ki 37 3?(Sugar, paper, newsprintand steel billets) -
1121 100?
NOTE: B-ad on Tables 5.6 and 5.10 of 1987 CEM, with the following modifications to reflectprice changes In the F88 budget.
/ Based on FY87 actual.Boasd on BWDB FY88 budget allocation for OiM of Tk Cr 51, plusTk Cr 60 subsidy for minor Irrigatton estimated In FY87 CEM.8/ BseWd on 08 and Bangladesh Bank share of Interest loose on agriculturalloans as a result of the amnesty program during FY87.
i/ FY88 budget; does not Include contng ancies for bad dsbts to NCs./ Bsed on Tablo 6.6 plus 265 average Incroese In gas prices In FY80.
Based on Table 6.6 plus Increased tariffs of 156 by BPDO and 25X by REB In FY88.9/ Boad on estimated transfer of net revenues to the budget In FY87 of Tk Cr 230,
les FY88 allocation of Tk Cr 78 to RHD for OM e*xpenditures.h FY88 budget.
Baed on unit coste pr tudent in FY88 budget. Does not Include prlimryeducation.
1 FY88 budgt.i Sugar a Tk Cr 18; paper and newsprint a Tk Cr 9; steel billte and
plates a Tk Cr 16 (FY88 budget).

- 28 _
Table 2.5: Sumnnry of Recommendations for Public Pricing Policies
Short Term Medium Term Long-TormSECTOR FY89-90 FY91-96 FY96-FYOO
AORICULTUREFlooa-d-Con-trol, Establish O&C Cost Cell In Water rates to be levied Extend co'lection of waterDrinage and 8VDB. by BWDB on at lOast rates to remaining BWDBIrrigation 100 000 ha and adjusted Irrigation projects.
Establish procedures for periodically to cover saxcollection of water rates. of O&M costs In FY91, e8x
in FY93, and 100% InPrepare action plan for FY96.Improving reliability ofIrrigation services.
Minor Irrigation Complete privatization of P'ivatiz distributiondistribution and an,d maintenance of LUPsmaintenance for STWs. *nd ownership and
a lntenance of DTWs.
Agricultural Continue action plan for Reduce or eliminateCredit credit recoveries, Interest subsidlo.
Establish Interest ratszones for agriculturalcredit and provide abudget transfer to coverthe cost of interest ratesubsidies.
Fisheries Establish export tax of0.4-0.9X on value ofshrimp exports and annualcharges of Tk1500-3500/yoar on Improvedshrimp culture areas torecover costs of publicprograms.
Jute Red-co operational losse Establish export tax onoF BJMC and BJC. exports o raw Jute
(1. %) *nd jute goods(0.6%) to ftnance cost ofbuffer stock.
PFDS Adjust ration price of Phase out SR, MR, OP, LE,sugar to eliminate subsidy and FM ration channels.and/or drop sugar andedible oil from ration Include EP channel inquotas, budget of Ministry of
Defense.Incroese ration price ofwheat to reduce economicsutsidy.
INDUSTRY
Commodity Prices Decontrol price of paperand newsprint andeliminato subsidies.
Fertilizer Eliminate cross-subsidy on Complote privatization ofTSP and rationalize fertilizar marketing bydecision to Import or FY92 one set ex-factoryproduce locally. price of ferttilzer on
basis of export parity toregional markets.

- 29 -
ENERGY AND NATURALRESOURCES
Power Reduction of BPDB's powersystem losses to 82X byFY90.
Roduction of BPDB'aaccounts receivable to 8.5months billings or lose byFYO0.
Increase tariffs to earn Increase tariffs to earnrate of return of 4X on rate of return of 8X oncurrent value asste by current value assets byFY90. FY98.
Complet restructuring of0PDB tariffs.
Increase tariffs by RESand limit subsidies torural cooperatives to afive-year period.
Natural Gas Set gas prices so that Increaso proportion of"A:h gas company can *slf-financing to 401 byrocover its costs, FY93 and thereafter.Including depreciation,and cover 10X of Itsannual investment programfrom Internally generatedfunds by FY90.
Petroleum Maintain current weighted Set weighted averageaverage price level and product price, Includingrestructure prices, excise duties, to exced
border prices by at least20X.
TRANSPORT4TION ANDCOMMUNICATIONS
Railways 'ncrese tariffs for Eliminate operatlonalpassenger transport on the deficit by FY95.order of 10X annually Inreel term.
Reduce operational lossesby at 10et Tk Cr 80 byFY90.
Siman Carry out tariff study andIncrease fares fordomestic and regionalroutes substantially.Eliminate cross-subsidyfrom international routes.
Road User Charges Introduce tolls on allmajor bridges to cover 0AMcosts at minimum.Consider tolls for newhighway extensions.
Other Eliminate subsidles toBRTC and BSC byrationalizing operationsand/or privatization.Scale back operations ofBIWTC to thes with cloarpublic justification.
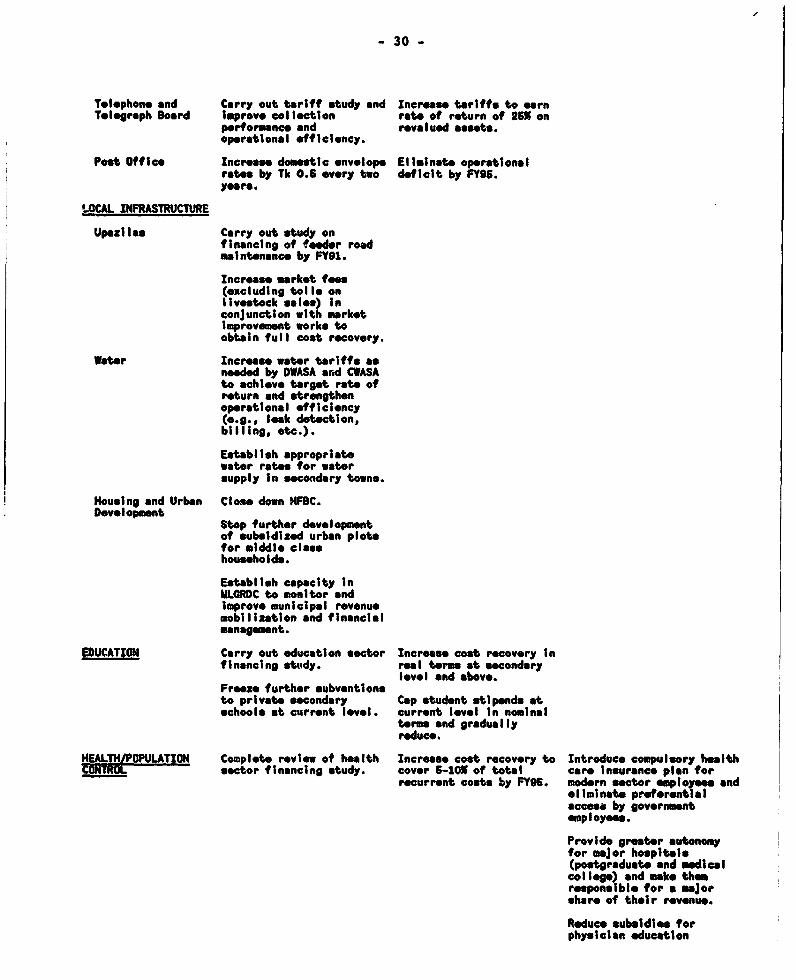
- 30 -
Tel-phone and Carry out tariff study and Increase tariffs to earnTelegraph Boord improve collection rate of return of 26X on
performance and revalued assets.operational effiieency.
Poet Office Increase domestic envelope Ellminate operationalrates by Tk 0.6 every two deficit by FY96.yers.
LOCAL INFRASTRUCTURE
Upazilas Carry out study onfinancing of feeder roadmaIntenance by FY91.
Increase morket fees(excluding tolle onlivestock sales) inconjunction with marketlmprovement works toobtain full cost recovery.
Wator Increase woter tariffs asneeded by DWASA and CWASAto achieve target rate ofreturn and strengthenoperational efficiency(e.g., look detection,billing, etc.).
Establish appropriatewater rates for watersupply In secondary towns.
Housing and Urban Close down NFBC.Devlopment
Stop further developmentof subsidized urban plotsfor mIddle classhouseholds.
Establish capacity in4LCRDC to monitor andlmprove municipal revenuomobillzation and financialmanagement.
EDUCATION Carry out education sector Increase cost recovery infinoncing study. real terms at secondary
level and above.Freze further subventionsto private secondary Cap student stipends atschools at current level, current level In nominal
term and graduallyreduce.
Al&TH/POPULATWOW Complete roview of health Increse cost recovery to Introduce compulsory helth-ONTRL sector financing study. cover 6-10% of total care insurance plan for
recurrent cost by FY95. modern sector employees andeliminate preferentialaccess by governmentemployoee.
Provide greater autonomyfor major hospitals(postgraduate and edicalcolleg ) and make themreponsible for a majorshare of their revenue.
Reduce subsidies forphystelan education
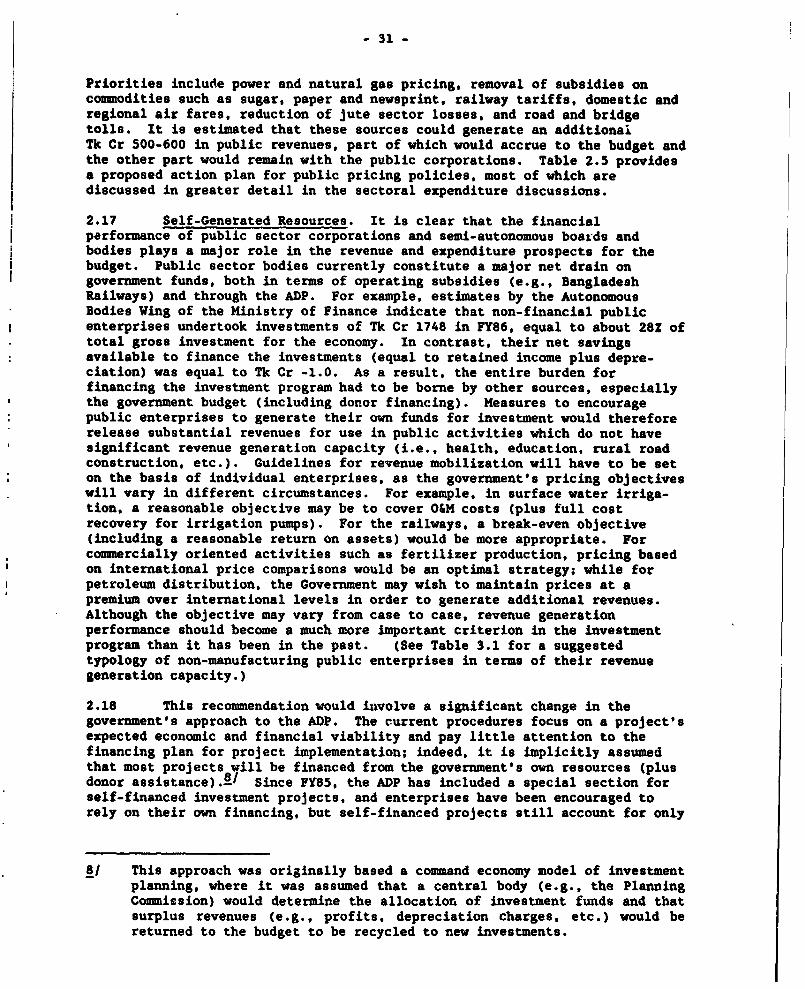
- 31 -
Priorities include power and natural gas pricing, removal of subsidies oncommodities such as sugar, paper and newsprint, railway tariffs, domestic andregional air fares, reduction of jute sector losses, and road and bridgetolls. It is estimated that these sources could generate an additionalTk Cr 500-600 in public revenues, part of which would accrue to the budget andthe other part would remain with the public corporations. Table 2.5 providesa proposed action plan for public pricing policies, most of which arediscussed in greater detail in the sectoral expenditure discussions.
2.17 Self-Generated Resources. It is clear that the financialperformance of public sector corporations and semi-autonomous boards andbodies plays a major role in the revenue and expenditure prospects for thebudget. Public sector bodies currently constitute a major net drain ongovernment funds, both in terms of operating subsidies (e.g., BangladeshRailways) and through the ADP. For example, estimates by the AutonomousBodies Wing of the Ministry of Finance indicate that non-financial publicenterprises undertook investments of Tk Cr 1748 in FY86, equal to about 28Z oftotal gross investment for the economy. In contrast, their net savingsavailable to finance the investments (equal to retained income plus depre-ciation) was equal to Tk Cr -1.0. As a result, the entire burden forfinancing the investment program had to be borne by other sources, especiallythe government budget (including donor financing). Measures to encouragepublic enterprises to generate their own funds for investment would thereforerelease substantial revenues for use in public activities which do not havesignificant revenue generation capacity (i.e., health, education, rural roadconstruction, etc.). Guidelines for revenue mobilization will have to be seton the basis of individual enterprises, as the government's pricing objectiveswill vary in different circumstances. For example, in surface water irriga-tion, a reasonable objecrive may be to cover O&M costs (plus full costrecovery for irrigation pumps). For the railways, a break-even objective(including a reasonable return on assets) would be more appropriate. Forcommercially oriented activities such as fertilizer production, pricing basedon international price comparisons would be an optimal strategy; while forpetroleum distribution, the Government may wish to maintain prices at apremium over international levels in order to generate additional revenues.Although the objective may vary from case to case, revenue generationperformance should become a much more important criterion in the investmentprogram than it has been in the past. (See Table 3.1 for a suggestedtypology of non-manufacturing public enterprises in terms of their revenuegeneration capacity.)
2.18 This recommendation would involve a significant change in thegovernment's approach to the ADP. The current procedures focus on a project'sexpected economic and financial viability and pay little attention to thefinancing plan for project implementation; indeed, it is implicitly assumedthat most projects will be financed from the government's own resources (plusdonor assistance).8/ Since FY85, the ADP has included a special section forself-financed investment projects, and enterprises have been encouraged torely on their own financing, but self-financed projects still account for only
8/ This approach was originally based a command economy model of investmentplanning, where it was assumed that a central body (e.g., the PlanningCommission) would determine the allocatior. of investment funds and thatsurplus revenues (e.g., profits, depreciation charges, etc.) would bereturned to the budget to be recycled to new investments.
- 32 -
61 of the ADP (FY89). It is recommended that in the future, sectors should beencouraged to set explicit guidelines for improving their self-financingcapacity, and investment decisions should be based to an important extent onthe sector's ability to meet the guidelines. This has been a major objectiveof the reform measurea included under the Energy Sector Credit (seeChapter 8), and this approach should be extended to cover a larger share ofthe investment program for industry, transportation, communications, and localinfrastructure (including housing and urban water supply). Revenueperformance should also become an important criterion for approvinginvestments in sectors where complete self-financing may not be feasible, suchas water resources (O&M costs), railways, mass media, and upazila developmentassistance.
2.19 Deficit Financing. Another way in which the Government can raiselocal funds is by increased borrowing from the domestic financial system;i.e., deficit financing. The perils o. this approach are well-known.Increased public expenditures financed by domestic borrowing can stimulate theeconomy and lead to a higher rate of growth. Unless tax revenues are highlyelastic (which is not the case in Bangladesh), government expenditures canrise faster than revenues, thereby increasing the budget deficit. In thissituation, the Government will ultimately have to reduce deficit financing asgrowth continues, or the economy will reach a position where inflationincreases and the balance of payments deteriorates, thereby necessitating apainful period of financial stabilization. Given the experience of the early1980s, the Government has generally limited its use of deficit financing.While this a prudent approach, it is not necessarily desirable in allsituations, particularly when (as at present) domestic demand is stagnant, theinflation rate is declining, the banking system has adequate liquidity, andthere are substantial donor resources available to assist in floodrehabilitation that are likely to be under-utilized because of shortages oflocal funds. In this situation, increased deficit financing can be helpful tothe economy, provided that thft Government is prepared to take subsequentmeasures to increase revenues and restrict expenditures so that the economydoes not overheat. While deficit financing can be a valuable tool, theGovernment will have to make a realistic judgement as to its capacity andflexibility to engage in short-term management of the economy.
2.20 External Donor Assistance. The final area for improvements inpublic resource mobilization is external donor assistance. Bangladesh hasenjoyed substantial financial support from foreign donors. It is generallyagreed that additional foreign assistance, particularly in the form of projectaid, would be available if sufficient opportunities could be identified tojustify the commitment of funds. Part of the difficulty in increasing projectaid is the slow pace of project preparation and implementation and the absenceof a realistic project pipeline, due to insufficient attention to forwardinvestment planning. On the other hand, it is doubtful that the ADP has thecapacity to absorb much more project aid, even if additional projects could beidentified, until the amount of local resources available for the ADP can beincreased. There are steps that can improve this situation somewhat. Donorscan increase their share of financing to cover additional local costs, andproject concepts should be redefined to include incremental recurrentexpenditures (such as O&M). More importantly, the Government needs to carryout a rigorous pruning of the Revenue Budget and the ADP (especially withregard to the large number of locally financed projects that have crept intothe ADF in recent years), and the core budgeting concept should be appliedmore consistently to ensure that funds are directed to the highest priority
- 33 -
activities. These are all necessary responses and should be undertaken as amatter of priority. Nevertheless, these actions will have only a limitedimpact until the Government decides to address the problem of domestic revenuemobilization in a serious manner.
2.21 The other way in which the donors can assist the Government isthrough commodity aid, which generates resources for the budget in the form oflocal receipts for imported commodities. Aid recommendations presented at theBangladesh Aid Group meetings over the past several years have stressed theneed to increase commodity aid in order to address tne local financingproblem. This recommendation has not been acted upon in a consistent manner,however. The trend in commitments of commodity aid has been essentiallystatic in dollar terms throughout the period FY82-88, although there have beenwide variations on a year-to-year basis.91 There are several reasons why theprospects for further increases in commodity aid may not be particularlyfavorable in the near term. First of all is the improved balance of paymentsposition. The rapid increase in export earnings from non-traditional exportsand slow growth in imports because of the stagnant domectic economy haveproduced a surplus in the balance of payments for the past few years. As aresult, gross foreign exchange reserves increased to $855 million at the endof FY88, equal to 3.4 months of import requirements. Another factorcontributing to a slowdown in commodity aid commitments is the government'sfaltering performance in the structural adjustment program. While the pasttwo years have been particularly difficult due to the occurrence of naturaldisasters, the Government has made slow progress in introducing new reformprograms for energy, the financial sector, tax reform, and industrial policy.Since commodity aid is increasingly tied to policy reforms (particularly bythe multilateral institutions but including many bilateral donors as well),this has resulted in a reduction in new commitments.
2.22 Finally, a number of donors have expressed reservations as towhether commitments of commodity aid are an effective instrument forincreasing public expenditures on -priority activities. The government's weakperformance in allocating locrl funds to high priority projects in the ADP, aswell as the unbalanced growth of recurrent expenditures described in Chapter1, tends to reenforce these concerns. In this situation, it may be moreeffective for the donors to increase their share of financing for project aid,rather than providing additional commitments of commodity aid. Several donorshave also begun to insist on various forms of "earmarking" arrangements toensure that the local funds generated by commodity aid are used to supportpriority projects. This approach is understandable, given the government'sfailure to maintain an adequate supply of local funding for dcnor-aidedinvestment projects. Nevertheless, it may be more effective in the long runto encourage the Government to demonstrate a clearer sense of priorities inthe allocation of funds to the public investment program in order to justifyadditional commitments of commodity aid, rather than imposing externalconstraints on the budget process.
9/ For example, commitments of commodity aid were $251 million in FY88 andhave been projected at $400 million in FY89, as compared to an average of$456 million in the FY82-87 period.
- 34 -
C. Summar
2.23 The Government has a large untapped capacity to increase domesticrevenue mobilization in order to support a higher level of publicexpenditures. The main measures identified in this chapter include taxreform, strengthening of non-tar revenue measures, and shifting part of thefinancial burden for the public investment program to autonomous andsemi-autonomous bodies and departments. On the basis of the estimatesprovided here, i. is projected that these measures could result in an increasein public revenues on the order of 3Z or more of GDP over the next five years,of which about two-thirds would come from increased tax revenues and theremainder from improvements in non-tax revenue sources.10 1 Allocating some ofthe funds to the ADP would have a multiplied impact on the government'sability to absorb new commitments of project aid (using the existing 30:70ratio of local to foreign funding), while the remaining funds should be usedto address chronic areas of underfunding in the Revenue Budget (particularlyO&H). The improved performance of the economy resulting from a boost inpublic expenditures would also provide a stronger case for increasedcommitments of commodity aid to cover increases in import demand, which wouldlikewise support the expansion of the public expenditure program through thegeneration of counterpart funds. Thus, the possibilities for increases in thepublic resource mobilization appear to be favorable on a macroeconomic basis.
2.24 The fact that must be faced by the Government and the donors is thatnone of the increases in domestic revenues will come easily. Almost all ofthe proposed increases impact on other areas of structural reform, such astrade policy, financial sector reform, and the performance of publicenterprises. This should not be surprising, as the Government has largelyexhausted the capacity of existing revenue instruments to generate additionalresources through the continuing sequence of discretionary increases that hasbeen necessary on a year-to-year basis. The time has therefore arrived forthe Government to adopt a fresh approach to domestic revenue generation, whichwould rely on a variety of instruments to generate additional resources forthe budget. The donors can help the Government in this effort throughtechnical support, increased commitments of commodity aid (provided betterexpenditure control is established for the use of local funds) and greaterflexibility in the use of project aid, particularly by covering additionallocal cost components. The potential for further commitments of aid by thedonors is becoming increasingly limited, however, until domestic revenuegeneration and expenditure control improve to support these efforts. Theburden is therefore on the Government to adopt a credible program to addressdomestic -esource mobilization over the next several years. Without thisbasis, public expenditure reform is unlikely to make much progress, as itwould be relegated to charges in budget allocations as a zero-sum game, ratherthan distributing new public resources to support the growing needs of theeconomy.
10/ Part of the non-tax revenue would be retained by the public enterprisesto finance their investment program and would not show up in the budget.For this reason, the projections shown in Tables 2.1 and 2.2 indicate anincrease in public revenues for the budget of about 2.5Z of GDP.
- 35 -
Char.ter III
Sectoral Expenditure Programs
3.1 The public expenditure review was based on a detailed examination ofthe expenditure programs in seven major sectors--agriculture and waterrescurces, industry, energy and natural resources, transportation andcommunications, education, health and population control, and localinfrastructure. The findings of the sectoral reviews are contained in Part IIof this report. Each chapter examines the expenditure program in terms of itsmajor components, with the discussion organized according to the followingformatt
(i) past trends in the sectoral expenditure program and theirconsistency with the government's stated policy objectives;
(ii) broader issues affecting the composition of the sectoral expenditureprogram, including a discussion of the estimated flood rehabilita-tion requirements for the 1988 floods;
(iii) a detailed examination of the expenditure program for each of themajor components, focusing on effectiveness in meeting statedobjectives, internal cost-efficiency, future funding requirements,and the potential for greater self-financing; and
(iv) a summary of recommendations for the sector, including a proposedaction program for public expenditure reform.
The approach adopted in the discussion is pragmatic and focuses primarily onissues of cost-effectiveness and the conservation of scarce public resources,rather than broad questions of development strategy. Wh.41e the government'ssectoral priorities may change in the future, they need to be rooted in aclear understanding of what can be accomplished through the use of publicexpenditures, which is the objective of this report.
3.2 The purpose of this chapter is to sketch out the major inter-sectoral issues identified from the review of the expenditure programs and toprovide a synopsis of the most important findings from the sectoral chapters.Certain issues appear repeatedly in the sectoral chapters, and the conclusionsprovided in Section A of this chapter summarize their implications for theconduct of fiscal policy over the next several years. For readers interestedin particular sectors, Section B provides a brief synopsis of the principalissues identified for each sectoral program, while the summary tables at theend of each section provide a guide to the recommendations for 44dividualcomponents contained in Part II of the report. Thus, the structure of thereport is designed to be accessible to readers with a variety of interests.The summaries in this chapter are not intended to substitute for the moredetailed discussions of expenditure issues .n Part II, however, and readersare encouraged to review at least selected parts of the sectoral chapters inorder to gain an appreciation for the analysis underlying the recommendations.
- 36 -
A. Inter-Sectoral Expenditure Issues
3.3 Several of the conclusions in this section echo themes that havealready been discussed in Chapters 1 and 2. They are reintroduced at thispoint to indicate the close relationship that exists between the macroeconomicconstraints identified in earlier chapters and the problems that affect theimplementation of the public expenditure program at the micro level. Thisshows that many of the issues identified in the context of the sectoralexpenditure programs are in fact reflections of broader inter-sectoral issuesthat need to be addressed on a wider basis.
3.4 Conclusion 1: There is substantial scope for increases in publicexpenditures that would support improved economic growth and povertyalleviation. This conclusion is hardly surprising, given the substantialrequirements for improved public services and infrastructure that have existedon a historical basis. Nevertheless, the conclusion confirms the need for arenewed commitment to a positive role for the public sector, which would focuson: (i) primary reliance on the private sector for directly productiveactivities; (ii) continued emphasis on structural policy reforms to promoteprivate sector initiatives, improve economic efficiency and promoteproductivity gains; (iii) a supportive role for the public expenditure programin providing the infrastructure and sorvices necessary to improve theproductivity of private sector activities; and (iv) direct interventions toaddress the needs of the most disadvantaged members of the society. A numberof areas where increased public expenditures are warranted have been identi-fied in the sectoral chapters, including agricultural services, development ofwater resources, energy, transportation, Irimary education, health servicesand local infrastructure. The government's main problem will be to choosepriorities from among the many pressing opportunities for public expendituresand ensure that its expenditure program is within the resource constraintsimposed on the budget.
3.5 Conclusion 2: One of the most binding constraints on the publicexpenditure program is the limited availability of local resources. This issimilar to the conclusion in Chapter 1, where it was derived from a macroeco-nomic analysis of the sources and uses of funds for the budget. Througboutthe analysis of sectoral expenditure programs in Part II, the limited avail-ability of local resources appears repeatedly as an important factor impedingimplementation, either because of shortfalls in the funding needed to supportdonor-assisted projects or because of inadequate operating funds for publicservices and maintenance activities. This confirms that a large part of thepublic expenditure problem is in fact a public revenue problem. In order toincrease public expenditures, the Government will have to place greateremphasis on choosing expenditure priorities and increasing domestic revenuegeneration in order to provide the local funds needed to leverage donorfinancing and support completed investments. The donors cam help theGovernrent in this effort by financing incremental recurrent expenditures andby increasing their contribution to project costs, thereby reducing thegovernment's need for local resources. However, long-term progress in publicexpenditure reform will have to be based on an increase in public resources,rather than a redistribution of expenditures from local to foreign sources.This implies that increased domestic resource mobilization should be a majorpart of public expenditure reform in order to provide sustainable benefits forthe economy.
- 37 -
3.6 One implication of this conclusion is that expenditures for floodrehabilitation will largely displace public investments that would otherwisehave taken place. The 1988 floods caused serious damage, and preliminaryestimates indicate that the cost of the rehabilitation program will equal one-to-two year's normal public investment in most sectors. Many donors haveconfirmed their willingness to provide support for flood rehabilitation(whether these resources are "additional' to normal aid inflows has not beenestablished). Unless the donors are willing to cover an exceptional highshare of the costs, however, the flood rehabilitation program will beconstrained by the same limitations on local funds and physical constraints onimplementation capacity that affect the ongoing investment program. TheGovernment will therefore have to face difficult decisions in deciding whichinvestments should be postponed or scaled-back in order to release localresources to support the flood rehabilitation program. At the same time, theinitial rehabilitation estimates need to be examined, as there are importantparts of the program that reflect longer-term investment proposals rather thanthe immediate damage due to floods, such as the proposed upgrading ofChittagong airport, the rehabilitation program for BTTB, and the floodprotection embankments for Dhaka.l/ These proposals should be reviewedcarefully before they are allowed to displace other activities in the ADP. Inthis regard, the Government and the donors should be particularly cautiousregarding the various schemes for major embankment works and flood protectionschemes that have been recently discussed. Such projects have the potentialfor displacing a large number of high priority activities in the publicexpenditure program that are necessary to support long-term economic growth,and the viability and affordability of such proposals should therefore be verycarefully scrutinized.
3.7 Conclusion 3: Proiect planning and foreign assistance reviewprocedures need to reflect the continuing presence of local fundingconstraints. Bangladesh is likely to have a surplus of foreign aid resourcesavailable to it for the next several years unless the Government makes aserious effort to improve project preparation and implementation. In thissituation, donor efforts to increase commitment levels can lead to a signifi-cant misalignment in the public expenditure program unless the impact offunding constraints is taken i.to consideration. For example, in the energysector, donor preferences for financing thermal power generation facilitieshave led to shortfalls in the funding for transmission and distributionprojects, with consequent high power system losses because of the inability ofthe network to handle the increased load. There are indications that asimilar misalignment of priorities is occurring in the transportation sector,where the implementation of an ongoing $1.0 billion program for bridgeconstruction will almost certainly impose constraints on the availability oflocal funding to support rehabilitation of the road and rail networks and
1/ The estimates of flood damage used in this report are based on the UnitedNations report, "The 1988 Floods in Bangladesh: Impact, Relief andRecovery" which was prepared for the Special Meeting on Assistance toBangladesh, November 16, 1988. More detailed reviews since thepreparation of the UN report have identified a number of areas whereflood rehabilitation costs may have been over-estimated, as well asseveral instances of under-estimation.
- 38 -
repair of flood damage. In order to address this issue, the Government needsto assess the impact of new projects on the availability of funds for thepublic investment program. This should begin with a detailed projection ofthe likely sources and uses of funds for the major implementing agencies, ashas recently been carried out for the energy sector priority investmentprogram.
3.8 Conclusion 4: There is substantial scope for increasing the self-financing capacity of the public expenditure program. Tax reform should havepriority as the government's primary mechanism for domestic revenuemobilization. However, the scope for increases in tax revenues is limited bythe small size of the modern economy and the need to implement structuralchanges in the tax system to improve incentives for domestic production. Inaddition. the stagnant performance of the economy in recent years has mtde itdifficult to enact major increases in tax revenues until per-capitaconsumption levels begin to improve. In the near term, the Government shouldplace emphasis on expenditure reprioritization and public pricing measures togenerate additional local resources. The analysis in this report indicatesthat autonomous and semi-autonomous bodies and government boards haveconsiderable oprortunity for taking over greater responsibility for financingtheir operating costs and, in many cases, their investment programs. On thisbasis, Table 3.1 presents a recommended typology of non-manufacturing publicenterprises and boards classified in terms of their potential revenue earningcapacity.2_
3.9 In order to achieve the suggested level of self-financing. thepublic enterprises will have to undertake a variety of measures, includingtariff increases, changes in collection and billing practices reductions inloss-making activities, and improvements in cost efficiency.31 Given that theactions will be politically unpopular, the Government will have to providesupport and encouragement for this approach to be successful. In addition,the Government will have to close-off indirect subsidies, such as access tocredit from the NCBs to cover operating losses and various other forms of debtrelief (formal or informal) unless explicitly justified in economic terms.This approach would represent a departure from past policies toward thefinancial performance of public enterprises, which have often focused onminimizing price increases and pursuing social objectives (such as theprovision of employment). The impact of these measures on reducing the demandfor local funds can be significanc. In the FY89 budget, the expected outflowof local funds to enterprises in Class II and III alone is expected to be TkCr 371, of which Tk Cr 206 represents local cost financing in the ADP forinvestments by Class II firms and Tk Cr 165 represents direct payments through
2/ Table 3.1 is limited to non-manufacturing public enterprises. Therevenue prospects for manufacturing enterprises are being addressed in aseparate study.
3/ It will also be necessary to address the prevailing problem of systemlosses that affect virtually all public utilities. While some of thisproblem is due to technical difficulties (e.g., the balance ofinvestments between generation and transmission capacity in the powersector), a significant part is due to unauthorized diversions of revenueand Eervices.
- 39 -
the Revenue Budget to cover the operating costs of Class III firms.41 This isequal to 172 of the local funds budgeted for the ADP, so that improving theself-financing capacity of public enterprises would make a major contributionto freeing up local resources for sectors such as agriculture, education androads. Of the total amount of Tk Cr 371, 43Z is attributable to local costfinancing of power sector investments by BPDB and 38Z is attributable to theoperating deficit of Bangladesh Railways. Thus, significant progress infreeing up local resources can be achieved by undertaking reform efforts forthese two enterprises alone.
3.10 In order to demonstrate a commitment to improving financialdiscipline by the public enterprises, one of the first actions should be is toclear up problems of interlocking arrears. Government arrears to BPDBcurrently amount to 35-402 of total accounts receivable, while governmentarrears to CWASA amount to eight months billing and account for almost 502 ofCWASA's accounts receivable. In some cases, this can lead to cascadingarrears, such as delayed payments by BPDB to BOGMC for natural gas. An effortto identify and eliminate excessive arrears between the Government and publicenterprises would send a clear signal regarding a renewed commitment tofinancial discipline. At the same time, the Government should begin enforcingdebt service payments unless there is a specific agreement on debt relief orrescheduling. As indicated in Chapter 2, the Government could raise at leastTk Cr 225 per year by enforcing agreements on debt service payments for IDAcredits alone, which would make a significant contribution to clearing uparrears with the public enterprises. Another action that the Governmentshould consider is better accounting for the use of funds that have beenadvanced to public enterprises in order to finance investments under the ADP.Information from Bangladesh Bank indicates that a number of public enterpriseshave built up large deposits in separate banking accounts because of slowproject implementation. Given the overall funding constraints on the publicsector, steps should be taken to identify instances w%ere public enterprisesare holding excess cash reserves, so that future allocations under the ADP canbe reduced or the funds can be recovered by the Ministry of Finance until theyare required for their agreed purpose.
4/ This figure does not include indirect subsidies to Class II and IIIenterprises, such as directed credit programs through the NCBs to coverthe operating losses of Bangladesh Jute Corporation.
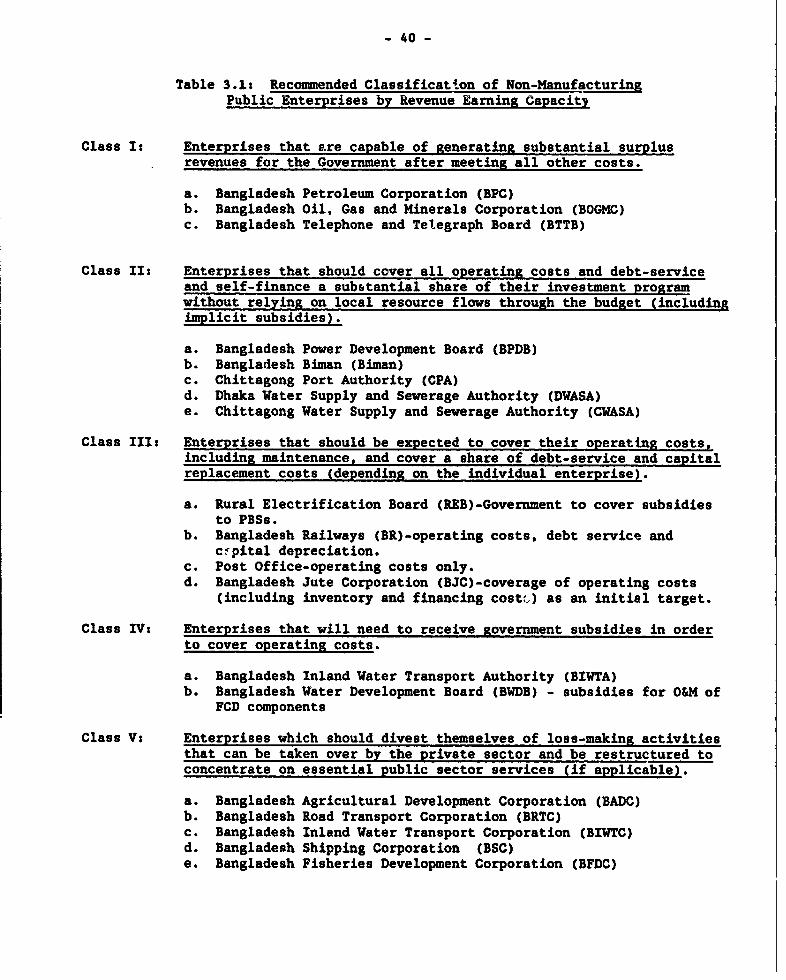
- 40 -
Table 3.1: Recommended Classificatton of Non-ManufacturingPublic Enterprises by Revenue Earning Capacity
Class It Enterprises that are capable of generating substantial surplusrevenues for the Government after meeting all other costs.
a. Bangladesh Petroleum Corporation (BPC)b. Bangladesh Oil, Gas and Minerals Corporation (BOGMC)c. Bangladesh Telephone and Telegraph Board (BTTB)
Class II: Enterprises that should cover all operating costs and debt-serviceand self-finance a substantial share of their investment programwithout relying on local resource flows through the budget (includinRimplicit subsidies).
a. Bangladesh Power Development Board (BPDB)b. Bangladesh Biman (Biman)c. Chittagong Port Authority (CPA)d. Dhaka Water Supply and Sewerage Authority (DWASA)e. Chittagong Water Supply and Sewerage Authority (CWASA)
Class III: Enterprises that should be expected to cover their operating costs,including maintenance, and cover a share of debt-service and capitalreplacement costs (depending on the individual enterprise).
a. Rural Electrification Board (REB)-Government to cover subsidiesto PBSs.
b. Bangladesh Railways (BR)-operating costs, debt service andcepital depreciation.
c. Post Office-operating costs only.d. Bangladesh Jute Corporation (BJC)-coverage of operating costs
(including inventory and financing cost-) as an initial target.
Class IV: Enterprises that will need to receive government subsidies in orderto cover operating costs.
a. Bangladesh Inland Water Transport Authority (BIWTA)b. Bangladesh Water Development Board (BWDB) - subsidies for O&M of
FCD components
Class Vs Enterprises which should divest themselves of loss-making activitiesthat can be taken over by the private sector and be restructured toconcentrate on essential public sector services (if applicable).
a. Bangladesh Agricultural Development Corporation (BADC)b. Bangladesh Road Transport Corporation (BRTC)c. Bangladesh Inland Water Transport Corporation (BIWTC)d. Bangladesh Shipping Corporation (BSC)e. Bangladesh Fisheries Development Corporation (BFDC)
- 41 -
3.11 Conclnsion 5. There is substantial scope for cost savings in thepublic expenditure program. Cost savings can release local resources for usein priority activities without requiring an increase in public revenues. Asindicated in Chapter 1, certain areas of the Revenue Budget (particularlyadministration and overhead functions) have been allowed to expand rapidlywith limited consideration being given to their impact on the overall budget.Elimination of lower priority projects can also have a significant impact onthe availability of funds; direct public investments in the industrial sectorand the large number of small locally-financed projects in the ADP should bereviewed carefully in this context. In other cases, the Government shouldconsider shifting programs from local to donor financing; the block grants forlocal infrastructure should be examined in this regard. Actions to achievedirect cost savings should include reductions in overstaffing, includingBangladesh Railways, BTTB, BJMC, and BTMC. There is also scope for costsavings by reducing public sector involvement in activities suited for privatesector participation, such as public transport operations (BRTC, BIWTC) andfertilizer distribution (BADC). Finally, the Government is supporting certainprograms that are not achieving their objectives (e.g. agriculturalcooperatives), and a reduction in exper4itures could help to improveefficiency as well as saving funds.57
3.12 Another area where the Government should review current expendi-tures is in the provision of subsidies. Subsidies can be a powerful tool inthe public expenditure program and are essential for achieving certaindevelopment objectives. A number of existing subsidy programs are reasonablywell-targeted (e.g. the Food for Work program) and constitute an importantmechanism for the Government to pursue its poverty alleviation goals.However, subsidy programs can also serve to protect public agencies fromprivate competition or maintain inefficient operations (e.g. BangladeshRailways), and these subsidies should be eliminated as a matter of priority.In some cases, the Government will face a particularly difficult choice indeciding whether a subsidy program represents the most efficient use of publicfunds. For example, some observers have call 4 for a restoration offertilizer subsidies in order to encourage t -ater fertilizer use, given thatcurrent application rates are significantly below their agronomic potential.However, in view of the serious constraints on local resources, such fundswould almost certainly be used more productively to support the National WaterPlan investment program in order to develop Bangladesh's water resourcepotential, which would promote fertilizer use by encouraging the spread of HYVcrops. In most cases of this type, a careful analysis will indicate that itis better to use public funds to increase productive investments rather thansubsidizing inputs. Another advantage of using local funds to increase
5/ An area where it is difficult to make general recommendations concerningpossible cost savings is the problem of design standards. For example, itis clear that design standards and maintenance procedures should incorporatea higher degree of natural risk rather than relying on frequent and costlyflood rehabilitation projects to make needed repairs. In many cases,however, this will imply a lower rate of physical investment; for example,a significant increase in unit costs for school construction (e.g. toprovide flood refuge centers) would mean that the rate of schoolconstruction needed to achieve a universal primary education would bedifficult to sustain.
- 42 -
investment is that the funds can be used to leverage donor financing, therebyexpanding the total amount of resources available for public sector programs.
3.13 Conclusion 6. Improvements in project implementation are essentialto increase the efficiency of public investment. Project implementationproblems, particularly in technical assistance and procurement, are endemic inthe public expenditure program. This can have very undesirable consequences,such as the three-year delay in cyclone protection improvements after the 1985cyclone because of disputes over the hiring of consultants. In other cases,it can lead to an unbalanced investment program and poor utilization of neededfacilities (e.g. two multi-purpose cargo berths at Chittagong Port have beeninoperable for three years due to delays in awerding contracts for supportingfacilities). Project implementation delays tie up local funds that havealready been allocated for projects, and they decrease the aggregateefficiency of public investment at a time when the low level of investment inthe economy is an area of major concern. They also contribute to needlessfi-ustration and conflict between government officials and donor agencies whenboth parties should be working to facilitate resource transfers intoBangladesh. A realistic program to reduce the incidence of delays andidentify means for resolving disputes would therefore have major benefits interms of improving resource flows.
3.14 Conclusion 7. A large increase in local resources is needed tosupport additional recurrent expenditures, particularly for the socialsectors. It is primarily in the area of public services (particularly healthand education) where the government's expenditure program has historicallybeen most deficient and where some of the largest requirements for additionalpublic funds are likely to occur. The implications of this have not beenadequately incorporated into the planning and budgeting system. Given thereluctance of the Ministry of Finance to sanction long-term expenditurecommitments, expenditure controls have generally been much tighter in theRevenue Budget than in the ADP, so that most recurrent operating costs (otherthan personnel costs and expenditures such as defense and debt service) havebeen squeezed out of the Revenue Budget over time. This has resulted inserious imbalances in funding allocations. For example, the delivery ofagricultural extension services has been hampered by the decision of theMinistry of Finance to provide only Tk Cr 0.85 in the FY89 budget to cover theoperating costs of the extension service for all 403 rural upazilas. This isnot an isolated example, as most government services and maintenanceactivities are severely constrained because of shortages in recurrentoperating funds.
3.15 The current and planned expansion programs for the education andhealth sectors will require very substantial increases in recurrent expendi-tures in order to achieve their objectives. For example, it is projected thatachievement of universal primary education will require arnual increases inthe budget for primary and secondary education of 7X in real terms between nowand the year 2000, while programs for rural health and family planning willrequire real increases in expenditures of around 82 per year between now andFY95. These are very substantial increases for any government to absorb intoits budget, let alone one that is already suffering serious constraints on theavailability of local resources. There are other areas of the Revenue Budgetthat need additional funding as well, such as O&M costs for road and floodcontrol projects which are currently underfunded by at least 40-502. Hence,
- 43 -
economic efficiency considerations and the government's poverty alleviationobjectives indicate that a large share of additional local resources should goto support recurrent expenditures.
3.16 This has several implications for the budget. First of all, theRevenue Budget will continue to grow relative to the ADP, and the Governmentmay wish to consider merging the two budgets (see Chapter 5). Secondly, inview of the very rapid increases required for the social sectors, theGovernment should explore long-term arrangements with the donors for fundingrecurrent expenditures in order to ensure that the programs can be maintained.The donors already assist in many cases by taking over the responsibility forincremental recurrent expenditures on a declining basis. However, thegovernment's performance in providing eiatching funds for recurrent costexpenditures has not been good; for example, the Government failed to coverthe salaries of family health assistants as originally agreed, and it has notmet its agreements to provide additional funding for road maintenance. In theabsence of a clear government commitment, many donors will be reluctant toundertake long-term obligations for recurrent cost financing. The willingnessof the Government to provide an increasing share of funding for the socialsectors is likely to be its most severe test in public expenditure managementfor the future.
3.17 Conclusion 8. Closer coordination between the Government and donoragencies in the development of expenditure programs would be desirable. Giventhat local resources rather than foreign aid are likely to be the bindingconstraint on the public expenditure program for some time, there are substan-tial benefits to be derived from closer involvement of donor agencies in thedevelopment of expenditure programs. The current pattern of public expendi-tures shows instances where a "capital bias* has been introduced into theinvestment process. Donor pressures have contributed to this by favoringinvestments which are discrete and easily managed, as well as being poli-tically visible and attractive to foreign suppliers. One method that hasworked reasonably well is for implementing agencies to work with one or twodonors that are able to take a sectoral perspective and provide guidance toother donors on priorities within the investment program.6/ The Governmenthas resisted this approach at times, feeling that it gives donors an undueinfluence in setting domestic policies. In practice, sectoral planning is aneffective tool for strengthening the technical competence and credibility ofthe implementing agencies, and it reduces the burden of dealing with a varietyof donors with differing priorities and requirements. This approach has beenintroduced for the energy and family planning programs, and it should beconsidered for extension to other sectors as well.
B. Synopsis of Sectoral Expenditure Programs
3.18 Agriculture and Water Resources. Long-term growth will require animprovement in the agricultural growth rate to 3.5-4.OZ per year, which would
6/ The experience of the Third Population and Family Health Project isparticularly instructive in terms of how the Governnent cau work with alarge number of donors to address the funding requirements of a programwith large recurrent cost elements and distribute the financingresponsibilities in a way that matches the interests of individual donors.
- 44 -
represent a significant improvement over the rate of 2.22 achieved during theperiod FY82-87. A factor tbat some observers have suggested may beresponsible for the low agr:.cultural growth rate is the decline in publicexpenditutres for agricult're, which fell by 272 in real terms during theperiod FY83-88 and declined in relative terms from 15.42 to 9.7Z of thecombined budget, even after removing the reduction in fertilizer subsidies. Amore detailed examination of the agricultural budget indicates thatapproximately 40? of the decline in expenditures was due to the reduction ofsubsidies and privatization of irrigation equipment distribution (particularlyshallow tubewells) and another 202 was due to reductions in construction offood storage facilities. Less than 102 of the decline in agriculturalexpenditures was due to the reduction in fertilizer subsidies. Since FY86,there has been a significant increase in expenditures for surface waterdevelopment, rural infrastructure, agricultural services, forestry, fisheriesand livestock. While changes in the public expenditure program may have hadsome impact on agricultural growth, it is likely that other factors have beenmore important, such as price incentives, constraints on agricultural credit,depressed consumer demand and variable weather conditions. In the longer run,however, increases in public expenditures will be an important factor inimproving agricultural growth.
3.19 It is generally agreed that growth in agriculture will depend onimprovements in water management to facilitate the wider adoption of HYVtechnologies and allow more intensive use of land through multiple croppingpatterns. The Government has recently completed a draft National Water Plan(NWP) which outlines a long-term investment program to develop almost theentire potential for agricultural growth based on current patterns of watermanagement, at an estimated cost of approximately $7.9 billion (of whichapproximately half would represent public expenditures and the other halfprivate expenditures). Given the size of the program, the investmentrequiLements of the NWP are likely to be the major factor in determining thefunding available for other activities in the sector.
3.20 Despite its importance to the sector, the NWP iuvolves considerableinstitutional and financial risks. The NWP would rely heavily on BWDB a-adpossibly BADC for its implementation, neither of which has been known forefficient project implementation in the past. BWDB would be responsible forthe implementation of increasingly complex surface water projects, includingflood control, drainage and irrigation projects involving land-based pumpingstations, improved water offtakes to augment the supply of smaller rivers andcanals where low-lift pumps can be used, and gravity-based irrigation schemeswhere economically justified. BWDB's past performance in implementing suchcomplex schemes has not been favorable, and it has a poor record in terms ofthe operations and maintenance of completed projects. Substantialinstitutional strengthening and a gradual introduction of cost recovery tocover O&M costs will therefore be essential for BWDB to carry out itsresponsibilities under the NWP.
3.21 As regards ground water development, the NWP presents severaloptions. One option would rely primarily on shallow tubewells (STWs), atechnology that is well accepted in Bangladesh and which relies primarily onthe private sector for distribution and maintenance. This approach would makerelatively few demands on public sector management and funding resources.Another suggested option, which would involve the extensive use of deeptubewells (DTWs), would place a heavy burden on public sector management and
- 45 -
funding resources. For example, based on the current rate of subsidy of 70?for DTWs, the NWP estimates that the DTW option would require an 802 increasein public investment in order to achieve an estimated 7Z incremental increasein agricultural production. In addition, the DTW option would rely largely onBADC for implementation, an organization that has proven to be overly bureau-cratic and inefficient in the past. Given the demands on public resourcesfrom other sectors and the risks involved in relying too heavily on publicsector institutions, the STW option therefore has a great deal to recommend itin practice. Even if at some point in time, there is a need to convert toDTWs (which is unlikely for most areas), it would be cheaper to providesupport for such conversions at the time that they are required, rather thanspending scarce resources now in anticipation of an event that may neveroccur. For the present time, DTWs should be limited to areas where existingground water resources cannot be utilized by STW technology.
3.22 Public expenditures in the agricultural sector are likely to risesubstantially in the future as unit costs increase (for more complex FCDIprojects), new activities are introduced (open water stocking of fisheries,expansion of rural poverty programs) and essential services are extended to awider population (agricultural credit and research and extension services).This has several implications for public expenditure policies. More attentionneeds to be given to improving support services needed to make efficient useof NWP investments. These include agricultural research and extension (whichhave been hobbled by shortages in recurrent operating funds and Jow internalefficiency), agricultural credit programs (which have been constrained by highimplicit subsidies on interest rates and poor credit recovery, which aresupposed to be addressed as part of the financial sector reform program),operations and maintenance of existing facilities (particularly for surface-water projects, but also addressing the poor maintenance of DTWs by BADC), andrural infrastructure (which has suffered from program fragmentation andneglect of operations and maintenance). In view of the heavy demands onpublic sector programs, the Government should try to involve the privatesector in the delivery of agricultural services wherever possible, includingfertilizer distribution, seed production, distribution and maintenance ofirrigation equipment, fisheries and veterinary services. The summary table(Table 3.2) at the end of this section outlines a number of recommendationsfor the agricultural expenditure program which are discussed in greater detailin Chapter 6.
3.23 The final issue is the food account deficit, which is an importantsource of instability in the budget. Until recently, the government's majorobjectives in foodstock management were to supply the Public Food DistributionSystem and stabilize consumer prices through open market sales. It has beensuggested that the Government should support producer prices more actively.In addition, the Government is considering an expansion of storage facilitiesto provide greater food security during natural disasters. These activitiesare likely to increase the variability of the food account in the future,which will make management of the ADP more difficult because of changes in theavailability of local funds. To offset this problem, the Government will needto be more flexible in reflecting changes in the food account deficit(particularly due to unexpected events such as natural disasters) in itsmonetary targets and domestic borrowing.
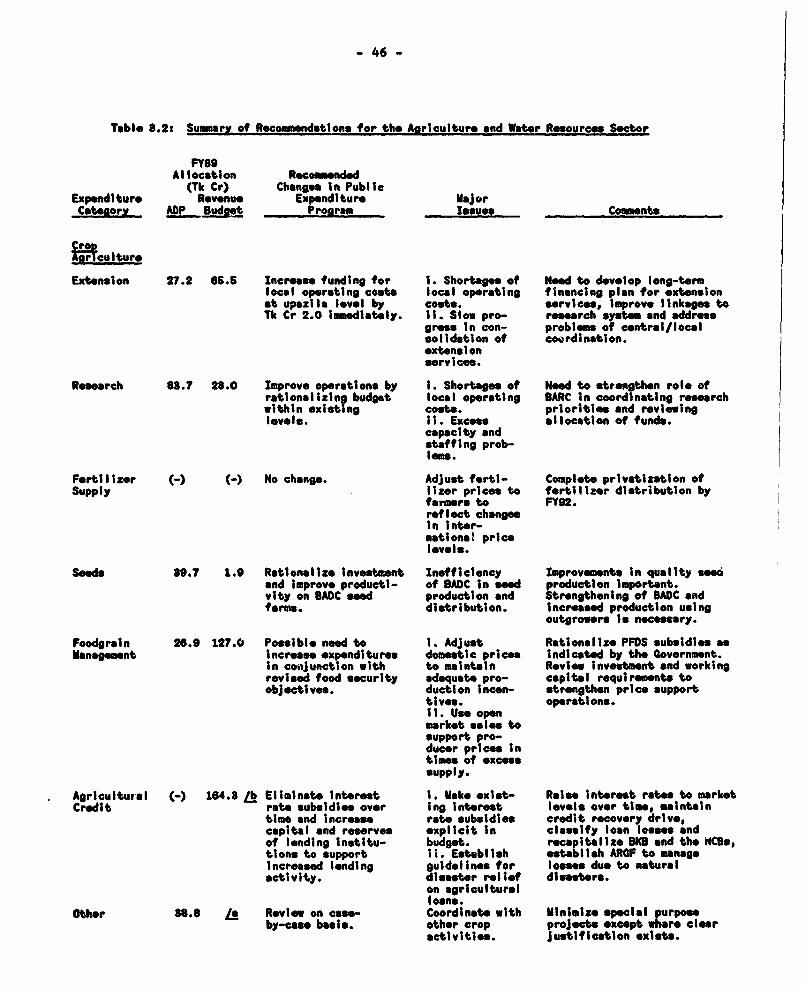
- 46 -
Tabl- 8.2: Summary of R.commendations for the Asriculture and Water Resources Secter
FY69Allocation Rec_mended(Tk Cr) Changen In Public
Expenditure Revenue Expenditure Major.Cateory AMP BudA t Pronram Issues Couments
Creellrculture
Extension 27.2 65.6 Increase funding for 1. Shortages of Ned to develop long-termlocal operating c6ste local operating financing plan for extensionat upazila level by costs. services, Improve linkages toTk Cr 2.0 immediately. II. Slow pro- reserch systm and addres
gress in con- problems of central/localsolidation of coordination.extensionservices.
Rsearch 8S.7 23.0 Improve operations by t. Shortages of Need to strengthen role ofrationalizing budget local operating 9ARC In coordinating researchwithin existing cota. priorities and reviewinglevels. II. Excesr allocation of funds.
capacity andstafing prob-lens.
Ferti Izer (-) t-) No change. Adjust ferti- Complete privatization ofSupply lizer prices to fertilizer distribution by
frmers to FY92.refloct changeIn lnter-nations! pricelevels.
Seds 89.7 1.9 Rationalize Investment Inefficiency Improvements In quality %segand improve producti- of BADC In see production Important.vtty on PADC seed production and Strengthening of EDC andforam. distribution. Increased production using
outgrowers Is necesary.
Foodgrain 26.9 127.0 Possible ned to i. Adjust Rationalize PFDS subsidies asManagment Increase expenditures domoetic prices Indicated by the Governoent.
In conjunction with to maintain Review investment and workingrevised food sccurity adequate pro- capital requirements toobjectives. duction incen- strengthen price support
tives. operationm.II. Use openmarket sales tosupport pro-ducer prices intimes of excesssupply.
Agricultural 164.3 8b Eliminate interest 1. Make exist- Raise Interest rates to marketCredit rate subsidies over tig Interest levels over time, maintain
time and Increase rate subsidies credit recovery drive,capital and reserves explicit In classify loan losses andof lending tnstitu- budget recapitaleK and the WCBs,tions to support ii Establish establish ARG to manageincresed lending guidelines for losse du, to naturalactivity, disaster reltef disasters.
on agriculturalloans.
Other 80.8 Is Review on case- Coordinate with Minimize special purposeby-case basis, other crop project. except where clear
activiti. justification exists.
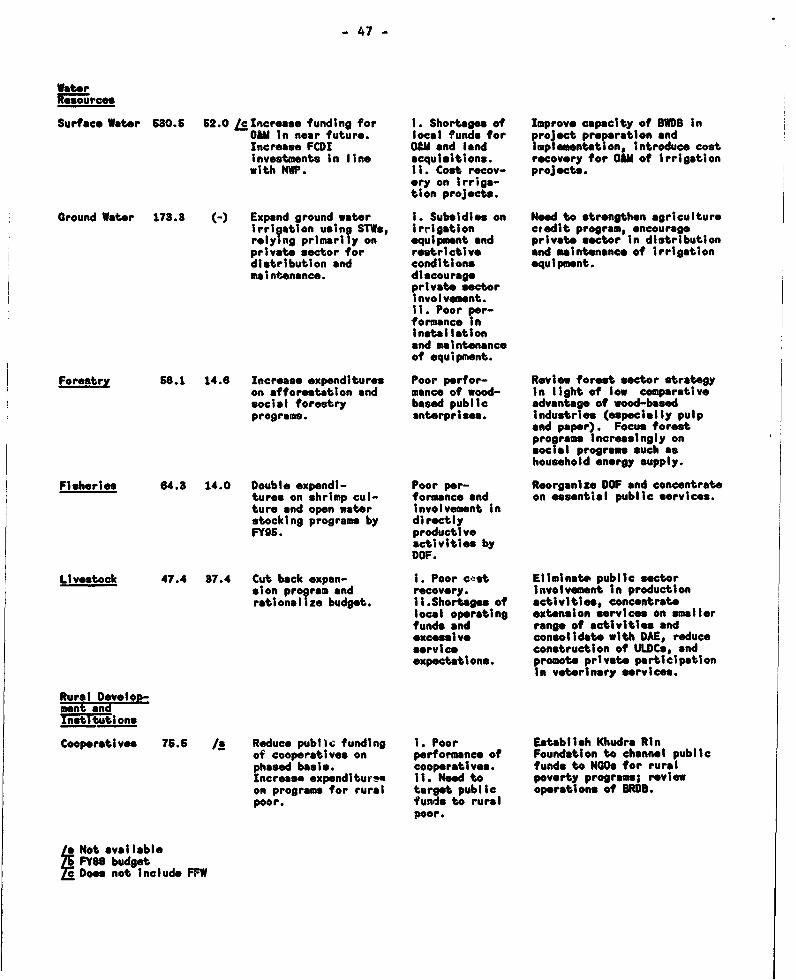
- 47 -
Waterhesources
Surfece Water 580.6 52.0 LeIncrease funding for T. Shortages of Improvo capacity of BWDB InOaU in noar future, local funds for project preparation andIncrease FCDI 0CA and land Implementation, Introduce costInvestments In line acquisitions, recovery for O&M of Irrigationwith NW. it. Cost recov- projects.
*ry on irriga-tion projects.
Ground Water 173.3 (-) Expand ground water T. Subsidies on Need to strengthen agricultureIrrigation using STWs, Irrigation c,edit program, *ncouragerelying primarily on equipment and private sector in distributionprivate sector for restrictive and maintenance of Irrigationdistribution and conditions equipment.maintenance, discourage
private sectorInvolvement.II. Poor per-formance InInstallationand maintenanceof equipment.
Forestry 66.1 14.6 Increase expenditures Poor perfor- Review forest sector strategyon afforestation and mance of wood- In light of low comparativesocial forestry based public advantage of wood-basedprograms. anterprisee. Industries (especially pulp
and paper). Focus forestprograms Increasingly onsocial programs such ashousehold energy supply.
Fisheries 64.8 14.0 Double expendi- Poor per- Reorganize DOF and concentratetures on shrimp cul- formance and on essential public services.ture and open water Involvement Instocking programs by directlyFY96. productive
activities byDOF.
Livestock 47.4 87.4 Cut back expan- i. Poor cc t Eliminate public sectorsion program and recovery. Involvement In productionrationalize budget. ii.Shortages of activities, concentrate
local operating extension services on smallerfunds and range of activities andexcessive consolidate with DAE, reduceservice construction of ULDCs, andexpectations. promote prtvate participation
In veterinary services.
Rural Develop-ment andInstitutions
Cooperatives 75.6 /x Reduce publie funding t. Poor Establish Khudrs Rinof cooperatives on performnce of Foundation to channel publicphased basis. cooperatives. funds to NGOs for ruralIncrease expenditur". Ii. Need to poverty programs; reviewon programs for rural target public operations of BROS.poor. funds to rural
poor.
/a Not availableFY86 budget
Zi Does not Include FFW
- 48 -
3.24 Industry. In accordance with the New Industrial Policy of 1982,the Government has gradually reduced public investment in the industrialsector by concentrating on fertilizer production and balancing, modernizationand rehabilitation investments for enterprises which remain in the publicsector. The promising start on policy reform in the industrial sector hasbeen compromised, however, by the declining financial performance of many ofthe remaining public (nterprises and the lack of a coherent policy toimplement needed structural reforms to deal with this problem. As a result,an extensive system of indirect subsidies has been established which hascompromised the integrity of the financial sector and which may have seriousramifications on the budget. Financial sector and public enterprise reformare therefore an important part of the public expenditure program for thissector.
3.25 For the fertilizer industry, there has been a recent change fromimport substitution to a situation where the industry is likely to have asubstantial export capacity for tVh -oreseeable future. Bangladesh appears tohave a comparative advantage in thi production of fertilizer for export to theregional market based on its reserves of low cost natural gas. This willexpose the fertilizer industry to greater commercial risk. In order toprepare for this opportunity, the Government needs to: (i) revise the pricingsystem for urea fertilizer to establish the ex-factory price on the basis ofexport parity to the surrounding Asian markets; (ii) take advantage of currentexcess capacity in urea to rationalize production facilities, particularlywith respect to the high cost Fenchuganj plant; (iii) complete the financialrestructuring of the fertilizer industry to recognize past losses; (iv) elimi-nate subsidies on TSP and MP products and obtain supplies on a least-costbasis (perhaps including intermittent operation of the Chittagong TSP plant);and (v) prepare for the liberalization of the domestic fertilizer distributionsystem in FY92 and establish domestic price stabilization procedures. In viewof the need to conserve local resources and acquire the technical expertise tooperate in a competitive export market situation, the construction of newfertilizer plants with export capacity should be undertaken on the basis ofjoint venture agreements with foreign investors, if possible.7/
3.26 Some of the most difficult problems the Government faces in theindustrial sector involve the need to reduce operating losses by the publicenterprises. For example, between 1982-86, the net amount of new loansadvanced to BJC and BJIMC to cover working capital and operating losses wasTk Cr 526, of which 98Z was provided by the NCBs. As both BJC and BJMC havenegative net worth and are losing money continuously, neither of them islikely to be able to repay the loans in the foreseeable future. TheGovernment has instructed the NCBs to segregate new loans to the twocorporations and has started to provide a budget transfer tn cover theinterest cost on the loans. This approach addresses only a small portion ofthe impending losses, however. The problems are similar for the textileindustry, where the losses of poorly performing mills are being covered bycross-subsidies within BTMC and by debt relief, which transfers the financial
7/ "Bangladesh: Fertilizer Sector Review," World Bank Economic ReportNo. 7145-BD (green cover), August 31. 1988.
- 49 -
burden to the budget. Actions to reduce operating losses, which will requirea hard look at the structural problems facing public manufacturingenterprises, should be an integral part of reducing this drain on publicresources.
3.27 A reestimation of the expected financial and economic rates ofreturn for industrial projects in the ADP indicates that the major share ofthe public investment program (85-90? in terms of total costs) is ofacceptable quality. However, the viability of the remaining '0-15? ofproposed projects is doubtful due to a variety of factors, such as inadequatesupply ef raw materials (sugar and paper mills), inadequate domestic demand(diesel engine factory) or excessive levels of domestic protection (steel andglass manufacturing). Despite government guidelines restricting the scope forpublic investments, several public enterprises are proceeding with investmentsto create additional capacity in industries which are experiencing structuralproblems (e.g., BSFIC recently announced that it intends to construct threenew sugar mills, two with bilateral financing and one using public resources).A careful review and pruning of the public investment program in industryshould therefore be considered. In the longer run, it would be better toconcentrate public resources on strengthening one of the two developmentfinance institutions (preferably Langladesh Shilpa Bank) and encouragingprivate commercial banks to increase term lending for industry. This efforts ehould be carried out in the context of the overall financial sector reformsto be successful.
3.28 Energy and Natural Resources. The Government has increased theallocation of public resources to the energy sector over the period FY81-89 inorder to reduce domestic dependence on imported petroleum and develop the useof Bangladesh's reserves of natural gas. While this effort has beenrelatively successful in achieving a rapid increase in the use of domesticenergy reserves, it has been accompanied by growing problems in terms ofinvestment planning and project implementation, the financing of investmentcosts (particularly with regard to locul resources), revenue generation andcollection, and the technical efficiency of energy sector investments. As aresult of these problems, the Government has undertaken an energy sectorreform program that has already introduced important improvements into theoperations of the sector. Among other objectives, the reform program seeks torationalize the pricing structure and improve the self-financing capacity ofthe major institutions in the sector, as well as prioritizing the investmentprogram on the basis of a rolling three-year plan with particular emphasis onthe first year of the plan period.
3.29 The largest enterprise in the energy sector is the Bangladesh PowerDevelopment Board (BPDB). In the past, BPDB's investment program has tendedto be donor driven, with emphasis on the construction of thermal power gene-ration facilities. The implementation of the investment program has beenconstrained by shortages of local resources, which has been exacerbated by lowpower tariffs, poor revenue collection and billing, and high power systemlosses. As a result, BPDB has been a major net user of public sectorresources rather than generating resources to self-finance its investments.Improvement of the financial performance of BPDB would be one of the mosteffective means available for releasing local resources for use in othersectors.

- 50 -
Table 8.82 Summary of Rco. ndatlone for the Industry Sector
FY89Allocation
Expenditure (Tb Cr) Recoinnded Changs In MajorCateoory ADP Investmnt Proram oes u- Coments
Fertilizer 93.0 1. Undertake net ex- 1. Fertillzr Beas ex-factory price ofport capacity by joint pricing and fertilizer on export parity toventure, If poessible. subsidle. Asian markets. CoupletIt. Financial restruc- II. Ration- liberalization of fertilizerturing to recognize alolz xisting morketing by FY92 andpeot losses In combi- facilities. estblish price stabilizationnation with pricing procedures. Review case forand institutional closing Fenchuganj andreform. Chittagong TSP plants or
operating on intermittentbasis as market condition,warrant.
Other Chemical 96.8 Reduce investment In Exeseslve pro- Deregulate pricing of paperIndustries activities with low or tection for and newsprint and elimlnate
negstive value added nowsprint, subsidies. Review investmntsIn economic terms, paper, sheet In paper and pulp manufactur-
glass, tc. Ing and sheet glass withregard to possible dtefrral ortermination.
Jute 65. No Investment Financing of A crisis *Itxation. Recognizejustified In current juto ector jute sctor losses in budgetcircumatances, loses through and take me-sures to reduce
banking system. losses throeigh Institutionaland policy rforms,particularly reduction of overcapacity In Jute mtiling.
Textiles 99.7 Viability of SUR Large losse by Reduce cost by rstructuringinvestuants dubiouo public sector and reduction of overwithout Institutional textile mills, ftaffIng.reform. financed
through bankingsystem andInternal cross-subsidle.
Steel end ao6. Restrict Investoent to I. Poor econo- Review BMR of Chittagong SteelEngineering activitie that are sic viability Mill for possible termination.
economically viable of steel pienr. Consider divestiture of otherand appropriate for iI. Rol- of now activities to privetepubilc sector public sector sectore.Involvement, in other
activities.
Sugar and Food 19.2 Reduce Investment In I. Economic Poor economic and financialIndustries BMR activitles and viability of viability limit scope for new
eliminate new Invest- large-scale investment In this *ector.ment in sugar mills. sugar Deregulate sugar and gur
production production and divest mills toiI. Exceive private sector.protection andsubsidies onsugarproduction.
Other 70.6 Reduce investment In Poor demand for Review assistance program forIndustrial industrial estates Industrial m aIl and cottage Industri e.Project. (other than Chittogong estates In
Export Processing *m I and urbanZone) aras.
Davelopment High priority for 1. Poor debt Ned to imple"mnt financialFinance Incrasend support If recovery, sector reforms and carry out
institutional t. Need to reforms to strengthen OSN.performance Improv-e. strengthen SSRS should be phased out.
lendThg Participation of private bankscriterio In Industrial term lending
should be encouraged.
- 51 -
3.30 A major objective in the development of a priority investmentprogram for BPDB has been to achieve a better balance in the choice ofinvestments, taking into account the likely availability of local resources.For the FY89-91 period, it has been suggested that this will require theelimination of all new start-ups for power generation projects, concentrationof the available funds on completion of generation projects already underconstruction and expansion of transmission facilities, and shifting part ofthe cost for distribution projects to foreign financing sources. As a result,BPDB may have to turn down donor resources for power generation investments inorder to conserve local resources for ongoing projects. This confirms theneed to give high priority to BPDB's program to increase tariffs, improverevenue collection, and reduce power system losses in order to improve itsself-financing capability.
3.31 As regards other agencies in the energy sector, Bangladesh Oil, Gasand Minerals Corporation (BOGMC) and Bangladesh Petroleum Corporation (BPC)generate substantial surplus revenues as a result of recent pricing decisions.The Government has claimed'the major share (90Z) of revenues generated fromgas price increases, so that BOGMC has continued to be dependent on the ADPfor investment resources, a situation that has led to substantial shortfallsin local cost financing. The Government has now agreed to a reorganization ofBOGMC that will give the gas companies greater financial autonomy and allowthem to self-finance a portion of their investment program, to be offset byreductions in allocations of funding through the ADP. The Government is alsoencouraging private sector participation in the energy sector for petroleumexploration and domestic LPG distribution.
3.32 The major uncertainty facing the investment program is thegovernment's announced intention to construct a nuclear power plant in thewest zone of Bangladesh. This action would be a major deviation from theleast-cost investment program and would substantially compromise the plans forthe development of the rest of the sector. There are a number of options formeeting the power requirements of the west bank that do not involve thefinancial and technical risk of a nuclear power generation plant (e.g.,transmission of power or gas across the Jamuna river, exploitation of coaldeposits, etc.). The Government should therefore carefully review theimplications of its decision before taking any further action on the nuclearpower plant. This situation also illustrates the problems involved inmaintaining a least-cost aRgroach to investment because of donor preferencesfor providing aid-in-kind.21 While tied projects can look attractive becauseof concessional financing arrangements, the benefits of the project oftenaccrue more to suppliers in the donor country than to the recipient country.The Government can help prevent this situation by using donor coordinationmeetings to encourage individual donors to work in the best interests ofBangladesh by financing projects which comprise part of the least-costexpansion program for the sector.
8/ There are a number of examples of distortions in the investment programbecause of aid-in-kind. For example, the variable operating costs of thePolash fertilizer plant, which was constructed with tied financing, areapproximately 502 higher than the Chittagong Urea plant, despite the factthat the plants were constructed at approximately the same time.
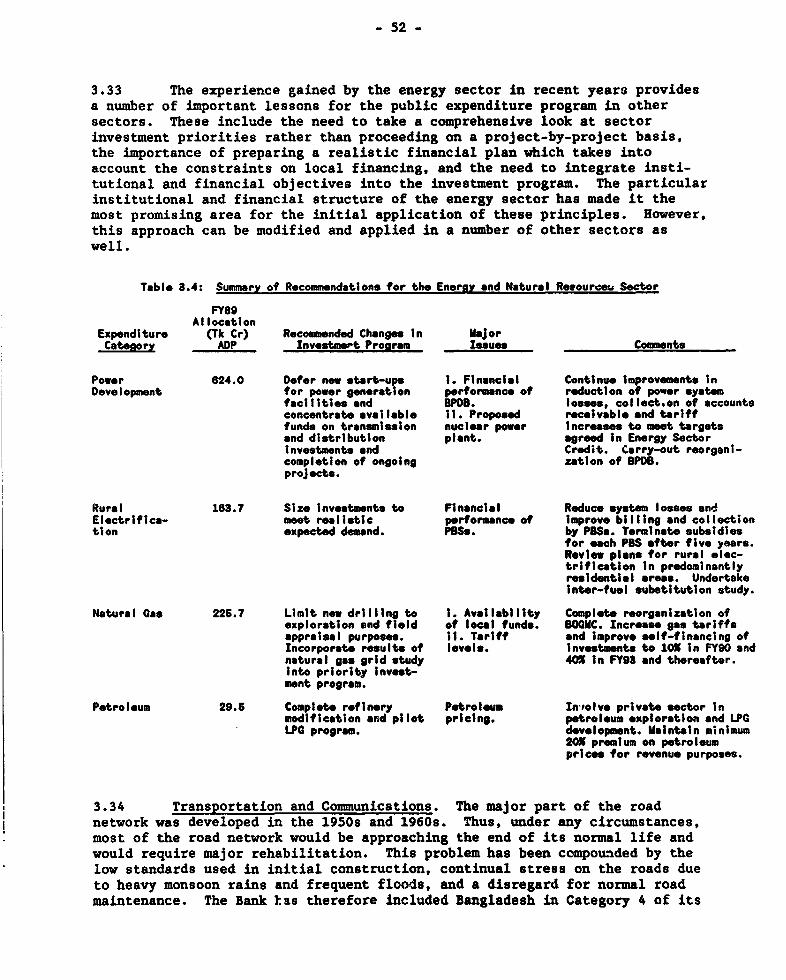
- 52 -
3.33 The experience gained by the energy sector in recent years providesa number of important lessons for the public expenditure program in othersectors. These include the need to take a comprehensive look at sectorinvestment priorities rather than proceeding on a project-by-project basis,the importance of preparing a realistic financial plan which takes intoaccount the constraints on local financing, and the need to integrate insti-tutional and financial objectives into the investment program. The particularinstitutional and financial structure of the energy sector has made it themost promising area for the initial application of these principles. However,this approach can be modified and applied in a number of other sectors aswell.
Table 8.4: Summary of Recommendations for the Eneroy and Natural Recoureou Sector
FY89Allocation
Expenditure (Tk Cr) Recomm nded Changes In MajorCatenory ADP Investmert Proaram Issues Comments
Power 624.0 Defer now start-ups t. Financial Continue improvement. InDevelopment for power generation performnce of reduction of power system
facilities and BPDB. losses, collect.on of accountsconcentrate available 1. Proposed receivable and tarifffunds on transmission nuclear power increases to meet targetsand distribution plant. agreed In Energy SectorInvestments and Credit. Carry-out reorgani-completion of ongoing zation of BPDB.projects.
Rural 163.7 Siz investments to Financial Reduce system losses andElectrifica- meet re li tic performanc of Improve billing and collectiontion expected demand. PBS.. by PBSs. Terminate subsidies
for each PBS after five years.Review plans for rural elec-trification In predominantlyresidential areas. UndertakeInter-fuel substitution study.
Natural Cas 226.7 Limit new drilling to i. Availability Complete reorganization ofexploration and field of local funds. BOGMC. Increse gas tariffsappraisal purposes. II. Tariff and improve self-financing ofIncorporate result. of levels, Investment. to OX In FY90 andnatural gas grid study 40X in FY93 and thereafter.Into priority Invest-ment program.
Petroleum 29.5 Complete refinery Petroleum In-tolve private sector Inmodification and pilot pricing. petroleum exploration and LPGLPG program. development. Maintain minimum
20X premium on petroleumprices for revenue purposes.
3.34 Transportation and Communications. The major part of the roadnetwork was developed in the 19508 and 1960s. Thus, under any circumstances,most of the road network would be approaching the end of its normal life andwould require major rehabilitation. This problem has been compounded by thelow standards used in initial construction, continual stress on the roads dueto heavy monsoon rains and frequent floods, and a disregard for normal roadmaintenance. The Bank tas therefore included Bangladesh in Category 4 of its
- 53 -
classification of road priorities, which means that road rehabilitation andmaintenance improvements should have priority over all other types ofinvestments in the road sector.
3.35 Agreement was recently reached with the donors on a program ofrehabilitation for the national road network. The donors have also shownrenewed interest in programs for local and feeder road construction. Inaddition, the Government has estimated the requirements for immediate andlong-term repair of the road network as a result of the 1988 floods asapproximately $165 million. These activities represent an ambitious programfor the road sector that will require a major increase in funding over anumber of years. At the same time, the Government is uadertaking a largeprogram for the construction of major bridges. One bridge was recentlycompleted, three more are starting or continuing construction in FY89, and atleast two more are in the advanced planning stages. The total cost of thebridge program is estimated to be on the order of at least $1.0 billion, ofwhich approximately half is represented by the proposed Jamuna bridge. Giventhe financial requirements of the proposed projects, it is doubtful that theentire investment program in roads and bridges can be accommodated within theamount of funding likely to be available in the ADP. Between FY86-89, bridgeconstruction accounted for 552 of the increase in the road budget, while therehabilitation program for the road network accounted for just 192 of theincrease in funding and flood -ehabilitation added another 7Z. This indicatesa need to review priorities in the road sector and establish guidelines forthe allocation of funds between rehabilitation, maintenance and newconstruction.
3.36 The Government has stated that its highest priority project in theinvestment program is the proposed multipurpose Jamuna bridge, which wouldprovide a direct linkage between the relatively isolated agriculturalnorthwest region and the more developed eastern zone which has substantialenergy reserves and the bulk of industrial activity. In addition to a four-lane road, the Jamuna bridge would carry an east-west power interconnector,provide for possible inclusion of a gas pipeline and telecommunication links,and possibly carry a meter gauge rail line. The preliminary economic analysisof the bridge (without the proposed rail link) indicates an overall econamicrate of return of about 21-22Z as compared to the current situation.9/ Inanticipation of the need to decide on the project, the Government shouldaddress the possible implications for the public investment program. TheJamuna bridge project is large enough to have a macroeconomic impact, so theanalysis of the bridge needs to go beyond standard cost/benefit methodology.The following concerns should be addressed by the Government in making itsfinal decision:
(i) Reprioritization of the public investment program. The Jamunabridge is a large lumpy investment project, the impact of which willbe accentuated by the ongoing program for road rehabilitation andbridge construction. The bridge will affect other projects in thepublic investment program through its impact on local funds and
9/ ThLe bridge would have an incremental economic rate of return on the orderof 16-18Z as compared to an intermediate solution of an improved ferryservice and a stand-alone power interconnector.
- 54 -
project management capacity. It is important that the Governmentexplicitly provide for this, rather than allowing the effects of thebridge to be absorbed through under-budgeting of local funds for theremaining project portfolio and delays in project implementation.Given the recent emergence of large financial requirements for floodrehabilitation and possible increases in project aid for activitiesidentified in this report, the Government will need to assess thepriority of the bridge carefully vis-a-vis other investments.
(ii) Financial implications of the bridge project. The -xternalfinancing required for the bridge could have an imrAct on theavailability of external resources for other purposcs, eitherthrough a reallocation of project and commodity aid to the bridgeor, if the financing sources are not on concessional terms, throughfuture debt-service obligations. The significance of these factorswill depend on whether financing for the bridge is 'additional" tothe amount that would be forthcoming from the donors in normalcircumstances and the terms on which it is provided.
(iii) Economic and financial risks. Besides the technical risks which arebeing addressed in the engineering studies, the bridge entailseconomic and financial risks because of the persistent occurrence ofimplementation delays in Bangladesh. Like most large projects, thescale of the bridge cannot be reduced if cost overruns and delaysoccur.
While there are obvious risks in implementing a project of such magnitude, thepriority being given to the Jamuna bridge by the Government is understandablein terms of its potential for regional integration and long-term developmentof markets and promotion of economic activity. Given its strategic role inthe transportation network, the bridge will undoubtedly be built at somepoint. The real question is whether the timing of the bridge is appropriatein view of the expected benefits and current resource constraints andexpenditure requirements, and what the appropriate scale of constructionshould be (e.g., the possible inclusion of a rail link).
3.37 The second largest share of the public investment program for trans-portation goes to Bangladesh Railways (BR). BR's financial performance hasdeteriorated drastically since FY83, going from approximately a break-evenposition in terms of net operating income to an expected loss of Tk Cr 142 inthe FY89 Revenue Budget. Despite this performance, BR has received a substan-tial increase in donor financing over the same period. In view of theconstraints on local funds, the poor financial performance of BR is a seriousproblem for the budget. Preliminary calculations imply that BR could elimi-nate its operating deficit through a combination of tariff increases, discon-tinuation of uneconomic services, improvements in revenue collection, andcost-saving measures (including staff reductions:. Substantial improvement inBR's financial performance should be a prerequisite for further majorinvestments in the rail sector, including the proposed inclusion of a raillink on the Jamuna bridge.
3.38 There are several other issues in the transport sector which need tobe addressed by the Government, including the poor performance of publicoperating companies (BRTC, BIWTC and BSC), the need for increased expenditures
- 55 -
for the maintenance of inland waterways, the cross-subsidization of domesticand regional air travel from international routes by Bangladesh Biman, and thepoor project implementation performance of Chittagong Port Authority. Theseproblems and the concerns raised above about the road and rail sub-sectorsindicate a need to strengthen sectoral planning and establish priorities forthe public expenditure program. An inter-ministerial transportation sectorstudy was recently initiated to provide a policy framework for the FFYPperiod, and this study should receive high priority.
3.39 As regards the communications sector, the flood rehabilitationprogram prepared by BTTB, which has an estimated cost of over $100 million,reflects long-term rehabilitaticn requirements because of inadequateoperations and maintenance and poor investment planning, rather than theimmediate impact of flood damage. BTTB's financial and operating performanceis poor, and substantial technical assistance is required to improve itsoperations before undertaking a major investment program. As such, the floodrehabilitation program (other than immediate repairs) should be deferred untila realistic assessment is prepared of BTTB's long-term investment requirementsand measures to improve its operating performance.
3.40 Education. The Government has adopted an ambitious xoal ofproviding universal primary education (UPE) by the year 2000.lug In additionto the physical requirements of this decision (more schools, teachers,supplies, etc), it will involve a major effort to upgrade the quality ofeducation and make it more relevant to the needs of society. UPE would alsorequire a substantial reallocation of public resources to the educationsector. In order to justify this increase, the education sector will have toaddress issues regarding internal cost-efficiency. The education systemcurrently suffers from high student drop-out and repeater rates at all levelsof the system, which represents a waste of resources by both the Governmentand the students. In addition, there are wide discrepancies in the unit costsof education at different levels, which indicate the need to redistributeresources within the education system. The ratio of the average cost perstudent in public secondary school as compared to primary education is 6:1(average of 2.2:1 for South Asia as a whole), while the average cost perstudent for university education as compared to primary education is 54:1(average of 15:i for South Asia as a whole). Perhaps the most difficult issuethat will have to be faced by the Government, however, is the rapid increasein subventions for teachers' salaries in private secondary schools, whichcurrently represents 242 of the education budget.
10/ Defined as a 902 enrollment rate as compared to 602 at present.
- 56 -
Table 8.6: Summary of Recommendations for the Traneortation and Communica ons Sectors
FY89 Allocation(Tk Cr) Recocamnded Change
Expenditure Revenue In PublicCategory ADP Budget Expenditure Prosrsm MaJor Issues Comments
Rood Transport
RHD Roads 224.4 81.6 Ned to reconsider i. Underfunding of Carry out review ofpriorities In maintenance financing requirementsinvestment program activltieos for lnvostment programIn relation to II. Invszeent before approving any newavailability of program unbalanced projects. Increselocal funds and with respect to mintonance funding Inrequiremente for new construction Revenue Budget by 8X InCAM and flood and availability real terms annually.rehabilitation, of local funds.
Bridge Con- 185.6 - Rationale for 31.0 1. Availability of Citrry out review ofstruction billion program for local financing investment priorities and
bridge construction for investment financing requirementsshould be justifted program. before undertaking newIn relation to 1. Priority of projects.other priorities in Jamuna bridgeroad sector, project.
Bangladesh 8.0 - No additional I. Poor financial Privatize or wind-downRoad Trans- investment and operational operations.port Corp. justified. performnce of
DRTC.II. Mandateoverlap. withprivate sector.
Railroads
Bangladesh 208.1 142.0 Implement program 1. Excsslve sub- Further Investment in BRRailways to eliminate opera- sidies. should be minimized until
ting subsidle. by II. Weak opera- major improvements can beFY95. Reduce in- tlonal perfor- achieved in financial andvestment program to mance. operational performance.focus on flood 111. Ned to Justification forrehabilitation and rationalize ope- Inclusion of rail link onpossible container rations and reduce Jamuna bridge doubtful intraffic Improve- cost, including this context.ments. overstaflng.
tv. Inclusion ofrail link onJamuna bridge.
Inland Water
SIVTA 22.5 7.8 Increase In expen- 1. Wek opera- Improve Institutionalditures warranted tional capacity, capacity of BIWTA andIf performance of It. Priority for undertake navigationBIWTA improve. mintennc drd- Improvement program aimed
ging not clear, at major inIand waterwaysand ports.
BIWTC 42.5 1.0 No further 1. Poor financial Rationalize or wind-downlnv.stment Is and operational with a view to possibleJustified in performance. privatization of mostcurrent situation. iI. Mandate functlons.
overlap. withprivate sector.
- 57 -
Marine
Chittagong 48.2 - Complete current Weak project Further lnvostmonts toPort Autho- Investment program. onagement. rely on self-generutedrity resources and donor
funding.
Mongla Port 4.7 - - Technical problem due toAuthority siltation.
Bangladesh 2.8 - Suspend purchaes Weak financial and Losses due primarily toShipping of addittonal operational operation of own vessels.Corporation v- sels, performance. Restrict DSC operations
to charter vessels andencourage private opera-tore.
Aviation
Civil 80.6 - Increased oxpendt- - Defer proposal forAviation ture expected for Improvement of Chittagong
flood rehabilita- Airport to Internationaltion of Zia Inter- standards due to fundingnational Airport. constraints.
Biman 2.8 - Expansion plans for t. Low fares and Noed to establishInternational high subsidies for International services asroutes need to be regional and commercial operationcarefully revioewd domestic routes. without access to budget.to se whether they tit Iplicit Provide direct subsidycan support pur- subsidies for debt for regional and domesticchase of wide-body service poyments services and Increaseaircraft. Elimi- on aircraft. fares significantly overnate cres- time.subsidization ofregional and domes-tic routes.
Communications
BT 8 79.6 (78.1) Proposed flood 1. Poor operating Substantial institutional(Surplus) rehabilitation efficiency. strengthening required
program largely II. Excessive to Improve BTTB'scovers long-term operting costs operations, reduce costsinvestment require- and poor revenue and formulate realisticmente. Need to collection. Investment program. Thisreview and priorl- Ill. Neglect of should take place beforetiz Investment operations and any further Investment byproposals. maintenance. BTTB.
Post Office 8.5 28.0 Eliminste operating i. Low postage Raise postage rates bydeficit by FY95. rates. Tk 0.6 every two yearsReview and ptiorl- II. Large ope- and reduce operatingtize Investment rating deficit. costs.program; reducestaff housingcomponent.
- 58 -
3.41 The cost implications of UPE depend on the extent to whichincreases in unit costs needed to achieve better educational quality (due tomore teacher training, improved facilities, better supplies, etc) can beoffset by cost savings through reductions in student wastage rates andinternal cost efficiencies. Under a reasonable set of assumptions, it isprojected that UPE will require annual increases in the budget for primary andsecondary education of 72 per year in real terms.11' While improvements inthe internal efficiency of the education system can help provide these funds,the major share will have to come from higher economic growth and areallocation of public resources to the education sector.
3.42 A detailed consideration of the physical implications of UPEindicates that it will be a very difficult target to achieve. The number ofstudents enrolled in primary school would increase by 852 between now and theyear 2000, and the construction program for new classrooms would have toincrease several-fold over the current rate. The budget for school repair andmaintenance would have to increase substantially, and the number of teacherstrained would have to increase by about 502 as compared to the present rate.Given the limitations on implementation capacity and the resistance of theteachers' unions to efficiency improvements, progress in achieving UPE targetsis likely to be slower than the schedule currently set. Nevertheless, it isimportant to keep an ambitious objective in mind, as it reenforces the needfor institutional strengthening and cost-efficiency if the objective is evergoing to be realized in the future.
3.43 In this regard, cost escalation at the secondary level couldseriously undermine the financial prospects of the UPE program. Governmentsubventions to cover the cost of teachers' salaries in private secondaryschools have increased three-fold in constant prices since FY83. It isgenerally agreed that this increase in government funding has bad littleimpact on educational quality. The Ministry of Education recently proposedplacing a cap on the current rate of government subventions for teachers'salaries, limiting the number of schools that qualify for the subvention, andimproving the accreditation process and inspection standards for secondaryschools so that government support is reflected in improved educationalquality. This represents a realistic set of proposals in order to containcost increases that would otherwise seriously compromise the education budget.
3.44 Efficiency improvements and cost reductions should have priorityover new investments for vocational and technical education, universities andspecialized technical institutions. A gradual increase in cost recovery andreductions in student stipends for higher levels of education is alsodesirable in order to address the large discrepancies in unit costs ntd equityproblems associated with the current system.
11/ This includes increases in secondary school enrollments as a result ofthe increased output from the primary system. Tha cost of maintainingprimary enrollment rates at the existing level of 60X is estimated torequire average annual increases in the education budget of 32 in realterms to cope with population growth and provide additional facilities asrequired. Thus, the net difference in costs between the UPE scenario andthe current situation is an additional 42 increase in real terms on anannual basis.
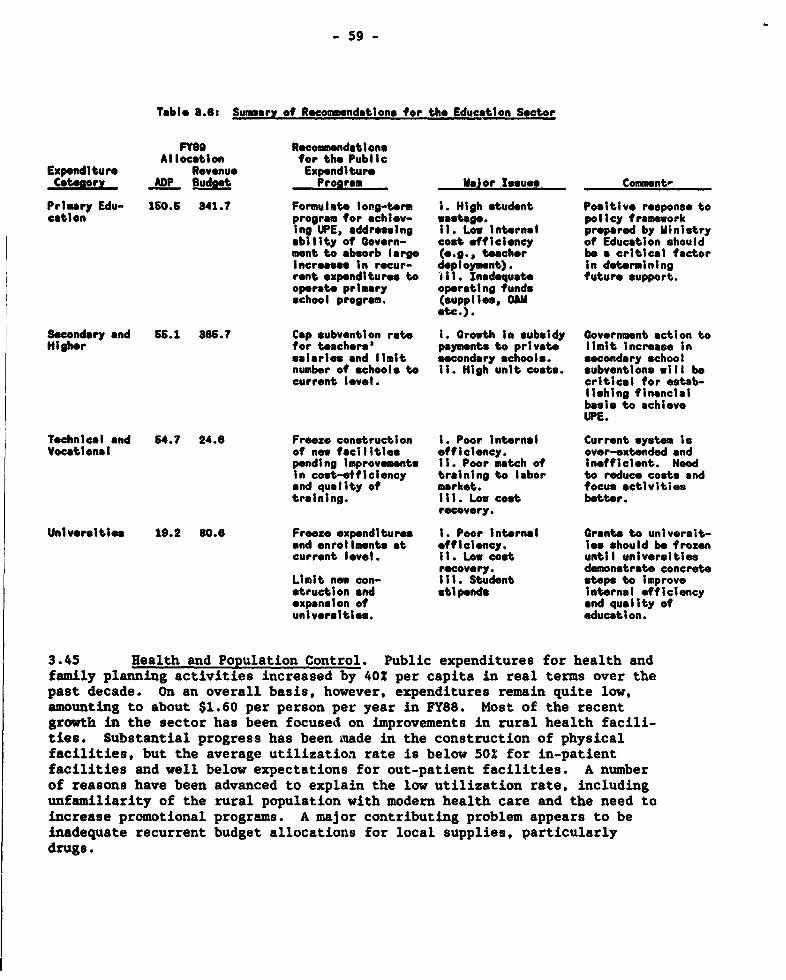
- 59 -
Table 8.6: Summary of Recommendattons for tho Education Sector
FY89 RecomendationsAllocation for the Public
Expendlture Revenue ExpenditureCategory ADP Budoet Program Major Issues Comment'
Primary Edu- 160.6 841.7 Formulate long-term i. High student Positive response tocation program for *chi-v- wastage. policy framework
ng UPE, addressing II. Low Internal prepared by Ministryability of Govern- cost efficiency of Education shouldment to absorb large (e.g., teacher be a critical factorIncreases In recur- deployment). In detrminingrent expenditures to ilt. Inadequate future support.operate primary operating fundsschool program. (supplies, Ohm
tec.).
Secondary and 65.1 385.7 Cap subvention rate 1. Growth In subsidy Government action toHigher for toechers' payments to private limit increase in
salaries and limit secondary schools. secondary schoolnumber of schools to II. High unit costs. subventions will becurrent level, critical for estab-
lishing financialbasis to achieveUPE.
Technical and 64.7 24.6 Freeze construction i. Poor Internal Current system IsVocational of now facilities efficiency. over-extended and
pending improvments it. Poor match of Inefficient. NeedIn cost-efficiency training to labor to reduce costs andand quality of market. focus activitiestraining. Itl. Low cost better.
rocovery.
Universities 19.2 80.6 Freez, expenditures i. Poor Internal Grants to universit-and enrollments at efficiency. ies should be frozencurrent level. iT. Low cost until universities
recovery. demonstrate concreteLimit new con- Il. Student *teps to Improvestruction and stipends Internal efficiencyexpansion of and quality ofuniversities, education.
3.45 Health and Population Control. Public expenditures for health andfamily planning activities increased by 402 per capita in real terms over thepast decade. On an overall basis, however, expenditures remain quite low,amounting to about $1.60 per person per year in FY88. Most of the recentgrowth in the sector has been focused on improvements in rural health facili-ties. Substantial progress has been miade in the construction of physicalfacilities, but the average utilization rate is below 50X for in-patientfacilities and well below expectations for out-patient facilities. A numberof reasons have been advanced to explain the low utilization rate, includingunfamiliarity of the rural population with modern health care and the need toincrease promotional programs. A major contributing problem appears to beinadequate recurrent budget allocations for local supplies, particularlydrugs.
- 60 -
3.46 An issue that has yet to be resolved by the Government and thedonors is how to finance the rapid increase in recurrent cost expenditures asthe physical facilities are completed. Based on current plans for thecompletion of facilities (taken to be FY95 for this analysis), it is estimatedthat the budget for the health sector will have to increase by about 5X inreal terms on an annual basis to maintain current levels of service quality.If budgets are increased to improve service quality in order to generatehigher demand, budget allocations will have to rise by over 82 in real termson an annual basis. It is unlikely that the Government can provide thisincrease in funding from local resources without causing major problemselsewhere in the budget.
3.47 Up to now, the donors have been willing to share the incrementalrecurrent costs of the health system on a declining basis. This has been madepossible by a high degree of coordination between the Government and thedonors, with a focuts on the total costs of the health care system rather thanjust the investment costs. Continued funding of recurrent cost activities bythe donors is likely to be required for a number of years in view of the rapidgrowth that has occurred in the sector and the Government's constraints onmobilizing local resources. For this effort to be sustainable, the Governmentshould begin to allocate additional domestic resources to the health sector aswell. Some of the additional funds should come from a gradual increase incost recovery, particularly for higher level health facilities where there isexcess demand. It is estimated that a realistic program of cost recoverycould eventually cover up to 20? of the health budget. The Government shouldalso encourage the growth of private medical services as an alternative to thepublic system. The most important factor in the immediate future, however,will be the willingness of the Government to reallocate resources from othersectors to support the requirements of the health sector.
3.48 The discussion of the expenditure prospects for the health andeducation sectors has implications that go beyond the cost requirements of thecurrent programs. Increases in social sector programs will be expensive, inspite of relatively low unit costs, because they serve a large population.Moreover, the major share of costs will consist of recurrent operatingexpenditures, particularly for personnel and supplies. This means that thesocial sector programs will impact heavily on the availability of local funds,which is the revenue source with the least in-built elasticity. It is notsurprising, therefore, that the Government is experiencing seriousdifficulties in providing the local resources needed to support the programsthat are already under implementation. Higher economic growth on the order of5.52 per year can help to provide the resources that are required in the longrun. However, rapid expansion of the social sectors between now and the year2000 may require that the Government shift resources out of other sectors.The Government should therefore address whether such a rapid expansion in thesocial sectors is sustainable and what actions will need to be taken tocontrol expenditures in other sectors in order to support the growth of sccialservices.
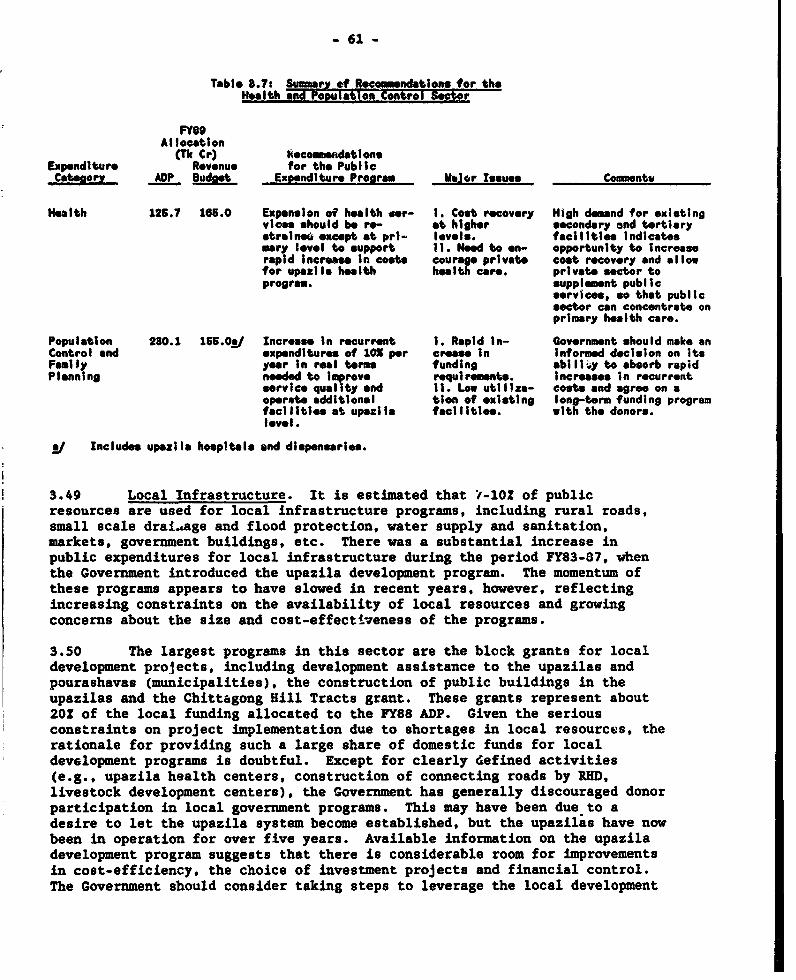
- 61 -
Table 8.7:S smav ot Recmmend tlong for theHealth and oulatlon control seeor
FY09Allocation
(Tk Cr) kecomandationeExpenditure Revenue tor the PublicC tqorz ADP Budo t Exienditure Prosram Mjor Iessue Coments
Health 125.7 165.0 Expanslon of health wer- i Coat recovery High d em nd for existingvices should be re- at higher secondary and tertlarystralnee except at pri- levels. facilities Indicatesmary level to support II. Need to en- opportunity to Increaserapid ineres" In costs courage private cost recovery and allowfor upazil health health care. private sector toprogrm. supplement public
services, so that publicsector can concentrate onprimary health care.
Population 230.1 165.0V/ Increase in recurrent t Rapid In- Government should make anControl and expenditures of 1OX per crease In Informed decision on itsFamily year In real terms funding abilt;y to absorb rapidPlanning needed to improv requirements. Increases In recurrent
service quality and II. Low utilize- costs and agree on aoperate additional tion of existing long-term funding programfacilities at upegila facilities, with the donors.level.
pj Includes upezila hospitls a*nd dispensaries.
3.49 Local Infrastructure. It is estimated that '-10Z of publicresources are used for local infrastructure programs, including rural roads,small scale drai.age and flood protection, water supply and sanitation,markets, government buildings, etc. There was a substantial increase inpublic expenditures for local infrastructure during the period FY83-87, whenthe Government introduced the upazila development program. The momentum ofthese programs appears to have slowed in recent years, however, reflectingincreasing constraints on the availability of local resources and growingconcerns about the size and cost-effectiveness of the programs.
3.50 The largest programs in this sector are the block grants for localdevelopment projects, including development assistance to the upazilas andpourashavas (municipalities), the construction of public buildings in theupazilas and the Chittagong Hill Tracts grant. These grants represent about20Z of the local funding allocated to the FY88 ADP. Given the seriousconstraints on project implementation due to shortages in local resources, therationale for providing such a large share of domestic funds for localdevelopment programs is doubtful. Except for clearly defined activities(e.g., upazila health centers, construction of connecting roads by RHD,livestock development centers), the Government has generally discouraged donorparticipation in local government programs. This may have been due to adesire to let the upazila system become established, but the upazilas have nowbeen in operation for over five years. Available information on the upaziladevelopment program suggests that there is considerable room for improvementsin cost-efficiency, the choice of investment projects and financial control.The Government should consider taking steps to leverage the local development
- 62 -
programs with donor resources and reduce their dependence on local funds.This may require that some programs currently included in the block grants bedisaggregated into sectoral programs in order to Improve their cost-efficiency. The use of general purpose grants should be aimed at a narrowerset of objectives (e.g., improvements in maintenance) and should be linked toimprovements in local revenue generation.
3.51 Urban growth, on the order of 72 per year, is one of the highestrates in the world. This trend is expected to continue in the future becauseof the limited capacity of the agricultural sector to absorb surplus labor.Investment planning in urban areas is poorly coordinated and is focused on adhoc projects (e.g., the Dhaka flood embankments) rather than a clearprioritization of needs. Given the high cost of urban infrastructure, majorinvestments will be possible only in Dhaka and Chittagong, and the Governmentshould insist on a high degree of self-financing, given that most modernsector activities are located in these cities. Outside Dhaka and Chittagong,low-cost investments aimed at lower income groups and improvements in O&Mshould have priority.
3.52 Major investments are anticipated during the FFYP period for watersupply in Dhaka (estimated investment cost on the order of $350 million) andChittagong (estimated investment cost on the order of $60-80 million). DWASAhas improved its financial and operating performance in order to generateresources to support the investment program during the FY91-95 period. Aswith many public utilities, bia.ling and collection is a problem area, andproject impleimentation is marred by procurement problems and delays intechnical assistance. The financial performance of CWASA, on the other hand,has been inadequate. Major improvements in tariff levels and operatingperformance are necessary for CWASA to self-finance its investment program andavoid placing a burden on local funds in the ADP.
3.53 Other issues that the Government should address include the need todeclare the House Building Finance Corporation (HBFC) bankrupt in order toavoid further losses due to poor collection performance and high overheadcosts, the need to reorient public housing policies to serve lower incomegroups, and the desirability of scaling back programs for the construction ofgovernment buildings and housing for civil servants in order to release localresources for higher priority activities.
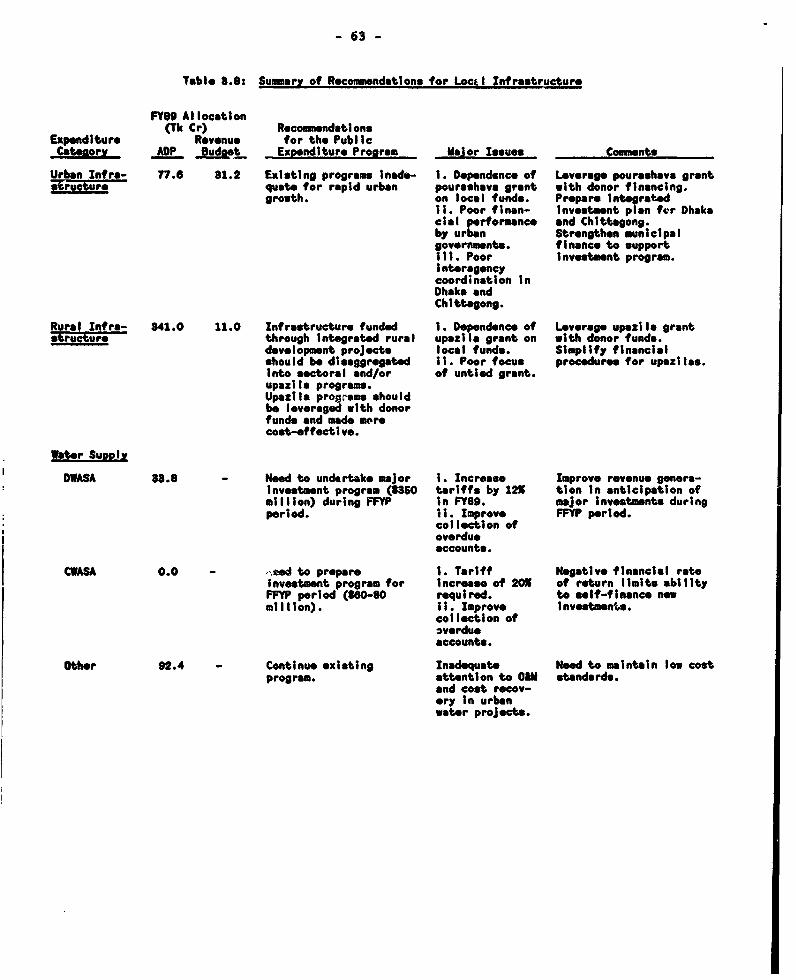
- 63 -
Table 3.8: Suamary of Recommendations for Locil Infrastructure
FY89 Allocation(Tk Cr) Recommendations
Espenditure Revenue for the PublicCategory ADP Budset Exoendtture Program Ma or Issues Comments
Urban Infra- 77.6 81.2 Existing programs Inade- 1. Dependence of Leverage pourashave grantstructur quote for rapid urban pourashavo grant with donor financing.
growth. on local funds. Prepare IntegratedII. Poor finan- Investment plan fvr Dhakaciel performance and Chittagong.by urban Strengthen municipalgovornmnts, finance to supportill. Poor Investment program.Interagencycoordination InDhaka andChittagong.
Rural Infra- 841.0 11.0 Infrastructure funded 1. Dependence of Leverage upazila grantitructure through Integrated rural upazilo grant on with donor funds.
development projects local funds. Simplify financialshould be disaggregated II. Poor focus procedures for upazilas.into soctoral and/or of untied grant.upazila programs.Upazila prog-asm shouldbe loveraged with donorfunds and made morecost-effective.
Water supply
DWASA 38.8 - Need to undertake major 1. Increase Improve revenue genera-investment program (3350 tariffs by 12X tion in anticipation ofmillion) during FFYP In FY89. major Investments duringperiod. II. Improve FFYP period.
collection ofoverdueaccounte.
CWASA 0.0 - .*d to prepare 1. Tariff Negativ financial rateInvestment program for increase of 205 of return limits abilityFFYP period (t80-80 required. to self-finance nowmillion). II Improve Investments.
collection ofoverdueaccounts.
Other 92.4 - Continue existing Inadequate Ned to maintain low costprogram. attention to 0AM standards.
and cost recov-ery In urbanwater projects.

- 64 -
Public Hous-
UUFer IFI Idoa.
Public - - Dissolve HDR. Poor loan HPBFC I bankrupt andHousing recovery. needs to be closd to
limit future louses.16.7 Refocus projects away 1. Poor cost Most public housing
from hounlng recovery. scheos serve middle andconstructlon toward II. Programs do upper Income with largeenvironmantal not ddress subsidls. There, Is aImprovements (drainage, appropriato noed to reorient housingwater eupply, low-cost incom group. polciles to addresssanitation, etc.) for problems of lower Incomelower Income groups. groups.
Government 222.3 - Stop construction of now Large implicit Current program too largeBldg.. civil servont housing In subsidies for In view of scarce local
urban areas. Scale down governuant resources.size of grant for public housing.buildings In upaillas.
- 65 -
Chapter TV
Implementation of the Public Expenditure Program
4.1 Implementation delays are a common feature of most sectoralexpenditure programs. To an extent, they are a product of the macroeconomicenvironment, particularly with respect to under-budgeting of local funds andshortages of higher level staff because of budgetary-induced constraints onhiring and compensation. These problems are compounded, however, by complexand often arbitrary bureaucratic procedures that cause frequent and lengthydelays in implementation. This section will address a number of these issues.under the headings of: (i) project implementation; (ii) commodity aidutil!zation; and (iii) operations and maintenance.
A. ProJect Implementatior
4.2 Project implementation is an important area of concern to theGovernment and the donors. A recent study on project aid utilization hasestimated that implementation delays increase the cost of projects by 35-40Zon average (including implicit costs such as the opportunity cost of funds)and extend the implementation period by 60Z as compared to the time expectedat project approval.l Thus, improvements in project implementation can beone of the most direct and effective methods for increasing ex post economicrates of return and improving the efficiency of public investment. Onpragmatic grounds as well, the Government is aware that project implementationis an important performance criterion for the donors, which therefore plays animportant role in determining the level of aid commitments. Projectimplementation concerns have also contributed to changes in the sectoralcomposition of expenditures. The large expansion of public expenditures forthe energy sector has been due in part to a recognition that projects will beimplemented relatively quickly, while the decline in expenditures foragriculture is partly attributable to concerns about the ability of publicsector agencies to implement projects efficiently, despite the acknowledgedimportance of the agricultural sector in the country's development strategy.
4.3 The Government took a number of steps in FY83 to address problems ofproject implementation. These actions removed many of the administrativebottlenecks that formerly impeded project implementation, such the payment ofcustoms duties on project imports and delays in the release of funds to
1/ Based on case studies of 33 projects included in a recent study entitled"The Utilization of Project Aid in Bangladesh," Development AlternativesInc., January 1988, which was prepared at the request of the BangladeshAid Group. The recommendations on project implementation provided hereare complementary to the coverage of implementation issues in this rcportand are intended to address areas where it is felt that the discussion inthe report needs further analysis and elaboration, particularly such asthe core investment program and procurement.
- 66 -
project agencies.21 An equally important measure was the designation of a*core* investment program. Prior to this action, the Planning Commissiongenerally imposed across-the-board cuts as a way of restraining expendituresin the ADP. As experience with the FY87 floods demonstrated, however, thePlanning Commission has become more cognizant of the need to focus expenditurecuts on lower priority activities and allow priority projects to continuewithin their approved budget allocations.
4.4 This section addresses project implementation in two parts. First,in view of macroeconomic constraints on the availability of local resources,the experience with the core investment program is reviewed and suggestionsare made on how to adapt it to the current situation. Secondly, a number ofspecific issues concerning project implementation are addressed, includingprecurement, recruitment and staffisig of project entilies, technicalaisistance, land acquisition and project monitoring..3
The Core Investment Program
4.5 The purpose of the core investment program as it was first proposedto the donors at the FY81 Aid Group meeting was to ensure that core projectshad adequate access to funds required for their implementation. However, whenthe core program was introduced in FY83, the concern had shifted to protectingprojects from cutbacks in the ADP because of the fiscal !tabilization program.Hence, the form in which the core program was implemented was designed more toinsulate priority projects from budget uncertainties, rather than taking astrongly promotional stance. The major benefits of the core program arespecified to be: (i) priority treatment in the allocation of funds (there areno guidelines, however, on how this is to be applied in practice); and (ii)protection from budget cutbacks during the budget revision process. Inaddition, core projects are permitted to draw their allocated release of localfunds for the first three quarters of the fiscal year at the beginning of thefirst quarter, rather than reqvtesting releases from the Ministry of Finance on
2/ Certain hitches remain, however. Project agencies state that it can takeup to two months at the beginning of the fiscal year to receive theirinitial release of funds. The problem arises because of delays inobtaining printed copies of the budget documents, which departments needto support their request for the release of funds. This appears to be anadministrative problem that can be resolved fairly easily. Anotherproblem is that the Ministry of Finance deducts arrears in debt servicepayments from fourth quarter releases. This is a useful incentive to getagencies to make their debt-service payments. However, for enterpriseswith chronic problems in servicing debt, it would be better to restrictaccess to new investment funds and require them to undertake costreductions and/or revenue increases as a condition for continued accessto funds.
3/ This selection of topics is based on a recent internal review of 36 IDA-financed projects under implementation, which gave a quantitative rankingof the reasons for delays.
- 67 -
a quarterly basis.41 For project agencies with independent control overexpenditures (e.g., BWDB), this has provided gneater flexibility in timingexpenditures during the first three quarters.- For operating departments inthe ministries, however, financial regulations have continued to restrictexpenditures to the amount authorized in each quarter.
4.6 Most officials in the Planning Commission and the Ministry ofFinance agree that the core concept has lost its importance as an investmentplanning tool over tiLe past several years. The positive lessons of theoriginal core concept have been largely incorporated into the government'splanning process, and as a result, the core designation now serves as a signalthat projects should receive special consideration during the budget exerciseand assures interested donors of the priority of their projects. Despite therelatively weak nature of the core program, there is evidence that the coreconcept has introduced a notion of prio:ities into the investment program. Arecent IMED study on the core program concluded that the allocation andrelease of funds for core projects improved significantly and the physicalprogress of the projects also improved.6/ On this basis, it was recommendedthat the core concept should be strengthened, a proposal that the PlanningCommission accepted in January 1988.
4.7 The criteria for the selection of Lore projects include proximity tocompletion, the production and employment potential of the project, the levelof donor support, a short gestation period, and beneficial linkages with otherprojects. In practice, donor support has played an important, although notexclusive, role in selecting core projects. Table 4.1 provides a breakdown ofthe FY89 ADP in terms of core and non-core projects, classified by source offunding (foreign aided versus locally financed). The core program accountedfor 272 of projects and 582 of funding in the FY89 ADP. Foreign-aidedprojects accounted for 772 of projects and 812 of the funding allocation inthe core program (the average allocation for foreign-aided core projects wasTk Cr 16.8, as compared to Tk Cr 12.9 for locally-funded core projects).Somewhat surprising, there were more foreign-aided projects in the non-corecategory than in the core program (182 in the non-core category as compared to138 in the core), and the non-core projects had a slightly higher percentageof project aid (732 of project costs) as compared to core projects (672 ofproject costs). Core projects tend to be larger than non-core projects,however (foreign-aided non-core projects had an average allocation ofTk Cr 8.5), so the major share of donor assistance (602) was allocated tosupport the core program.
41 This provision has since been extended to all projects in the ADP with anapproved Project Proforma (PP). All projects, regardless of theirapproval status, must petition for the release of funds for the fourthquarter when the revised budget estimates are prepared.
51 On the negative side, a recent review by Bangladesh Bank found that anumber of autonomous and semi-autonomous agencies have built up largecash reserves in separate checking accounts because they have not beenable to use all the funds provided to them. The Ministry of Financeshould consider measures to ensure that funds have actually been utilizedbefore they release additional funds for the next fiscal year.
6/ IMED study as summarized in the "Memorandum for the Bangladesh Aid Group,1988-89,' Government of Bangladesh, March 20, 1988.
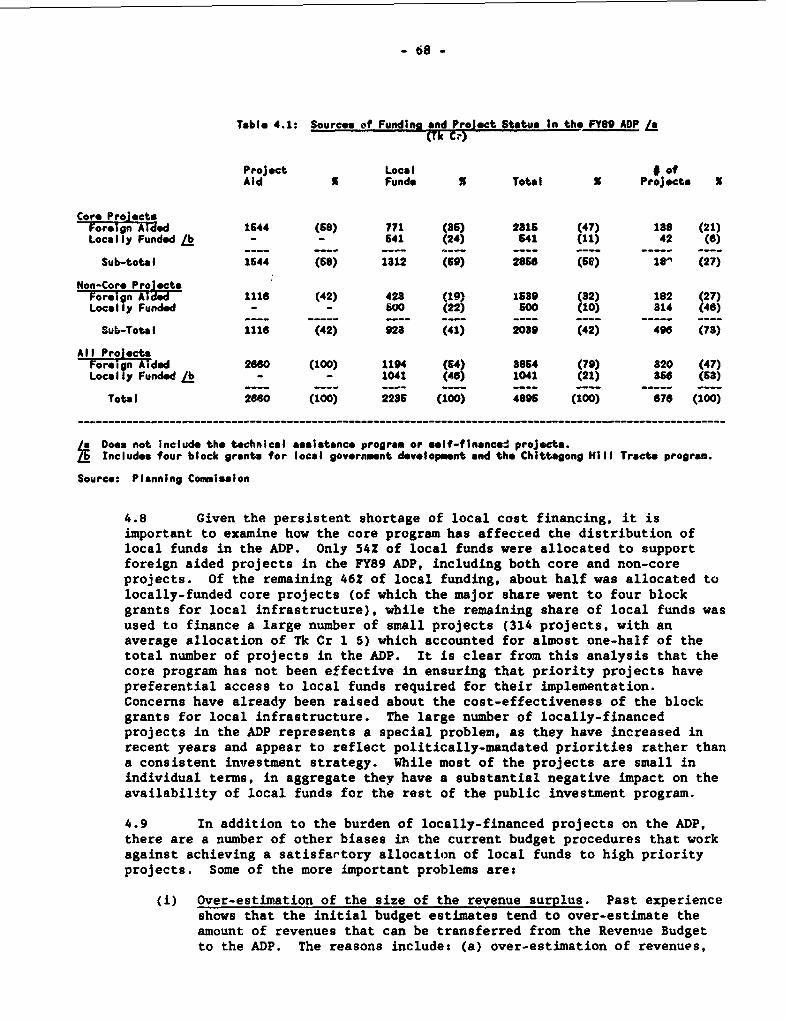
- 68 -
Table 4.1: Sourcs of Fundins and Prolect Status in the FY89 ADP /a(Tk C?)
Project Local o @fAid F funds % Total X Project. I
Core Prol ecteForein Aided 1644 (58) 771 (86 2815 (47) 188 (21)LocolIy Funded Lb - - 641 (24) 541 (11) 42 (6)
Sub-total 1644 (68) 1812 (69) 2865 (65) 18 (27)Non-Coro Prol etsForeign Aid d 1116 (42) 428 (19) 1659 (2) 182 (27)Locally Funded - - SO (22) 500 (10) 814 (46)
Sub-Tiotal 1116 (42) 928 (41) 2089 (42) 496 (73)
Al I ProetosForeign Aided 2660 (100) 1194 (64) 8864 (79) 820 (47)LocalIy Funded L - - 1041 (46) 1041 (21) 856 (53)
Total 2660 (100) 2285 (100) 4895 (100) 676 (100)
: Does not includo the tachnical assistance program or self-financej projects.9 Includes four block grants for local governmnt development and the Chittagong Hill Tract. program.Source: Planning Commission
4.8 Given the persistent shortage of local cost financing, it isimportant to examine how the core program has affected the distribution oflocal funds in the ADP. Only 54Z of local funds were allocated to supportforeign aided projects in che FY89 ADP, including both core and non-coreprojects. Of the remaining 462 of local funding, about half was allocated tolocally-funded core projects (of which the major share went to four blockgrants for local infrastructure), while the remaining share of local funds wasused to finance a large number of small projects (314 projects, with anaverage allocation of Tk Cr 1 6) which accounted for almost one-half of thetotal number of projects in the ADP. It is clear from this analysis that thecore program has not been effective in ensuring that priority projects havepreferential access to local funds required for their implementation.Concerns have already been raised about the cost-effectiveness of the blockgrants for local infrastructure. The large number of locally-financedprojects in the ADP represents a special problem, as they have increased inrecent years and appear to reflect politically-mandated priorities rather thana consistent investment strategy. While most of the projects are small inindividual terms, in aggregate they have a substantial negative impact on theavailability of local funds for the rest of the public investment program.
4.9 In addition to the burden of locally-financed projects on the ADP,there are a number of other biases in the current budget procedures that workagainst achieving a satisfartory allocation of local funds to high priorityprojects. Some of the more important problems are:
(i) Over-estimation of the size of the revenue surplus. Past experienceshows that the initial budget estimates tend to over-estimate theamount of revenues that can be transferred from the Revenue Budgetto the ADP. The reasons include: (a) over-estimation of revenues,
,rw,r- - 69 -
intensified in recent years by commitnents to show an increase indomestic revenue generation; and (b) under-estimation of recurrentexpenditures, reflectin.g such factors as wage adjustments grantedafter the presentation of the budget, rehabilitation expendituresrequired by frequent natural disasters, and inadequate expenditurecontrols (such as the railway deficit). As a result, there is ageneral expectation that allocations in the ADP will be cult backduring the budget revision process, and officials are reluctant toauthorize inr'-eases during the budget year in anticipation of theneed to make further cuts.
(ii) Pressure tp include new projects in the ADP. In theory, new proj-ects are 'ncluded in the ADP only after all ongoing projects areadequately budgeted. In practice, there is considerable pressure onthe Planning Commission to include new projects. This problem hasintensified in recent years due to the increase in the number ofpolitically-mandated projects.
(iii) General under-provisioning of budget allocations for ongoingprojects. Agreements on annual budget allocations for the ADP arecarried out in a routine fashion and with only limited discussion ofthe implementation status and priority of individual projects.'/While core status is supposed to figure into these discussions, inpractice the lack of clear guidelines reduces the impact of thisprovision. As a result of funding pressures, budget officials oftentend to cut budget requests, while project agencies inflate theirestimates to compensate for this process. While a certain amount ofbudgetary 'gamesmanship' is inevitable, the effect of reducedallocations is intensified by the unresponsive nature of the budgetrevision process. The budget revision is carried out quite late inthe fiscal year (generaily completed in May), and the delayed timingprovides littlie opportunity for spending additional funds that mightbe provided.
4.10 This discussion has identified three separate problems that the coreprogram will have to address in order to have a significant impact on projectimplementation. The first problem is the tendency to include too manyprojects in the ADP relative to the declining availability of local resources.At one extreme are the large, highly visible projects such as power generation
plancs and bridges that attract considerable donor attention and support,while at the other extreme are the small locally-financed projects where theGovernment wants quick approval and implementation in order to address aspecific need. In both of these cases, there is a tendency to consider theadditional funding requirements of the project to be 'marginal' and consistent
with the "priority" that should be attached to the project. The coreinvestment concel does not address this problem effective1', as it does not
7/ In many cases, the Planning Commission relies on outdated estimatescontained in the PP rather than assessing the current implementationstatus of the project. In a recent case in the FY89 ADP, the PlanningCommission authorized the equivalent of $1.9 million for the SecondExtension and Research Project (using an outdated PP which included$250,000 for project activities that had been discontinued), despite thefact that a joint Government/IDA project reformulation exercise hadestimated the required funds as $6.1 million.
- 70 -
allow decision makers to make an informed judgement about the impact of newprojects on the rest of the public investment program. This leads to thesecond problem, which is the tendency to under-budget ongoing projects. Thecore investment has had some success in this regard, as some ministriesindicate that they try to maintain funding requests for core projects,although they may be cut back during the review- stage. The situation is notuniform, hzwever, as there are also a number of instances where coreinvestment projects have been seriously under-budgeted, often because theagency in question has allowzd its project portfolio to expand too rapidly.Finally, there is the third problem of protecting priority projects duringbudget reductions, either because of overly optimistic budget estimates at thebeginning of the year or because of unforeseen events. The core investmentconcept should be most effective in this situation, as the Planning C-mmissionhas generally made a conscientious effort to focus expenditure cuts on lowerpriority projects. The core program is less effective, however, in ensuringthat priority projects have access to additional funds during the budget yearif they proceed better than expected.
4.11 Strengthening the Core Approach. These considerations indicate aneed to strengthen the core program concept. The fiscal situation in whichthe Planning Commission currently finds itself is significantly different thanthe situation in which the original core concept was introduced. Rather thana general requirement to cut government spending in line with fiscalstabilization targets, the current situation requires better informedbudgetary choices that balance the need to expand public expenditures againstthe serious constraints on the availability of local funds. This requires ageneral upgrading of the investment planning procedures used by the PlanningCommission. While Chapter 5 addresses overall priorities for improvements inplannit.g and budget procedures, the following suggestions are intended toaddress the immediate problems identified by the public expenditure review.
4.12 Suggestion 1: Introduce forward expenditure planning procedures inselected agencies. The priority investment program introduced for the energysector (see Chapter 8) is an example of a three year rolling investment planwhich has been used for the selection of new projects. The purpose of thisapproach is to forecast the financial requirements for both ongoing andproposed projects (broken down by local and foreign funds) and provide anassessment as to whether the additional requirements for funds are consistentwith their likely availability during the next few years. This approach isparticularly useful for large pro4ects that have a major financial impact intheir second or third year of implementation. Moreover, by separating thefunding requirements by local and foreign sources, this approach can address anumber of important issues, such as whether additional donor-financed projectscan be suppocted with the local resources likely to be available to thesector, whether revenue increases or postponement of lower priority projectsmay be needed to provide the local resources needed to support additionalinvestments, and whether some projects should be shifted from local to donorfinancing in order to achieve a better balance in the investment program.This approach allows the implementing agencies to take a more active role inbalancing their investment program, rather than letting the availability ofdonor financing drive the composition of the investment program as hassometimes happened in the past. At the same time, it makes agencies face theresponsibility for keeping their investment program within a sustainablerange, rather than shifting the blame to the Planning Commission for failingto provide adequate funds. This type of capital budge.ing approach is acommon tool in corporate investment planning, but it is less common in public
- 71 -
sector agencies that rely on government funding sources for their financing.Given that local financing is likely to be a major constraint on the ADP forthe foreseeable future, however, upgrading the financial planning capacity ofpublic sector agencies with major spending responsibilities should beconsidered at least on a selective basis.
4.13 This proposal would represent an important change in the approacji toinvestment planning from a project-based orientation to a program focus.! Assuch, it shoulo be undertaken initially by agencies with the technical capa-city to prepare the required analysis and which have a large enough investmentprogram to make tge effort worthwhile. Such agencies would include, bysector: agriculture (BWDB and possibly BADC), industry (BCIC), ez ergy (BPDB,REB, EOGHC), transportation (RHD, BR) and communications (BTTB).91 Inaddition, some elemeuts of a forward expenditure planning approach have beenintroduced for family planning programs (although the focus is on projectoased activities rather than the government's budget cycle), and such effortsshould be extended to cover primary education expenditures as well. Inworking with these agencies to develop a forward expenditure planningcapacity, the Planning Commission would need to shift its attention toensuring that the expenditvre program is consistent with tt1e macroeconomicprospects for the budget, while delegating greater responsibility to theagencies for project analysis and the preparation of a detailed financingplan. This is consistent with longer-term priorities for improvements in theplanning process, which are discussed in Cnapter 5.
4.14 Suggestion 2: Exercise greater control over the allocation of fundsto locally-financed projects in the ADP. The Government needs to maintain acertain number of locally-financed projects in the ADP in order to support itsown priorities, particularly ir. areas wkere donor financing may not be readilyavailable. However, the current situation, in which almost 50Z of local funds
8/ In FY86, the Planning Commission attempted to introduce forward budgetplanning by asking all agencies to prepare a "shadow ADP" for thefollowing two year period. This effort generated a large amount of data,much of it of dibious quality, which could not be effectively analyzedbecause of its lack of focus. This outcome is similar to the experienceof other developing countries that have tried to introduce forwardbudgeting on a premature basis and reenforces the suggestion made herefor a more selective and gradual approach.
9/ Preparing a three-year forward investment plan for each of these agencieswould not be technically difficult. For most agencies, no more than fiveto ten large projects account for the major share of the , restmentprogram, and these projects are generally monitored closely (oftenbecause they involve donor financing). The remaining projects in theiv-Dstment program can usually be included on a residual basis, ratherthan being analyzed separately (this is particularly true for RHD whichmaintains a large number of small road projects in its investment plan).Thus, the technical requirements for preparing a forward investment planshould not be onerous, particularly if the agencies involve theirprincipal donors in preparing the cost estimates. It may be somewhatmore difficult to provide cost estimates for projects that have not yetbeen approved, but this effort will encourage the agencies to begintaking a serious look at the'r project pipeline and the number of newprojects that they can support within available resources.
_ 72 -
are allocated to support locally-financed projects, while the much largerportfolio of donor-assisted project. is strapped for funds, does not representeither an appropriate or an efficient division of funding. The Governmentshould set a realistic target for the amount of funds to be allocated tosupport locally-financed projects (say 25? of the total allocation of localfunds for the ADP) and reduce the n9umber of locally-financed projects in theADP to remain within this limit._11 In many cases, the Planning Commissionmay be able to shift existing projects into do or-financed programs, so thatthe amount of funding would not be cut back.ll1 In other cases, however, thePlanning Commission would have to exercise much tighter contiol over thenumber of individual projects included in th3 ADP. While this may bepolitically painful, it will enforce a much better sense of discipline in thebudget process.
4.15 Suggestion 3: Provide additional funding to core -vestment projectson demand. Existing financed regulations specify that budget allocationsshould not be exceeded unless written agreement is obtained for an increase inthe allocation.121 This means that under-budgeting, particularly for localfunds, can place a significant constraint on project implementation. Alter-natively, the Planning Commission should consider allowing core projects tohave automatic access to additional funds required for their implement. ion,subject to normal requirements in terms of expenditure authorization.UI Thlsprovision would accomplish several objectives. First of all, it wouldencourage the Planning Commission to prepare more realistic budget estimatesfor core projects. Implementing agencies should understand that higherallocations for core projects will reduce the funding available for theirother projects, however, so they will have less incentive to overestimate the
10/ Based on the FY89 ADP, this target would release approximately Tk Cr 480in local funds to suppo' t donor-financed projects, which would leveragetotal public investment of about Tk Cr 1600, using the average ratio of30:70 for local/foreign funding in donor-assisted projects.
11/ As suggested earlier, the Government should give particular emphasis torevising the development programs for the upazilas and pourashavas inorder to mobilize donor assistance to replace the existing block grants.Another case in which locally-financed projects could be consolidatedinto donor-assisted programs is the large number of RHD road projects,many of which fit the criteria for the road rehabilitation program (infact, some of them have already been included in current rehabilitationprojects).
12/ This provision is enforced more strictly for projects implemented bygovernment departments than for semi-autonomous agencies, but allagencies must receive formal sanctions for budget overruns at the end ofthe fiscal year.
13/ Funds would have to be used for purposes specified in the PP, and theMinistry of Finance would need to make a formal provision for anyincreasfes in allocations in order to meet statutory requirements. ThePlanning Commission would also have to retain some flexibility forlimiting expenditures when macroeconomic conditions change significantly(such as a major natural disaster), but such controls should be appliedvery infrequently.
- 73 -
fundiug required for core prbjects.141 Project managers for core projectswould face fewer uncertainties in terms of funding allocations, so that theycan concentrate their attention on implementation of the project on schedule.Finally, the Planning Commission would have to be cautious in assigning corestatus to a project, as a large core l;ogram would make it more difficult tocontrol the overall size of the ADP.L' This could create conflicts withdonors who will be tempted to insist on core status for their projects, inwhich case the Planning Commission should be prepared to demonstrate a clearand consistent xationale to justify their decision.
4.16 Summary. The suggestions provided above would address the majorlimitations in the current approach to the core program; i.e., inadequateattention to analyzing the impact of additional projecti on the investmentprogram, excessive allocation of local funds to non-core projects, and theprevailing tendency to underbudget ongoing projects. In doing so, they wouldencourage the Planning Commission, the implementing agencies and the donors totake a more realistic view of the capacity of the ADP to support additionalprojects. These changes would also encourage a clearer definition ofpriorities in the public investment program, and in all likelihood they wouldimply a reduction in the number of projects in the ADP. Unlike the situationin FY83, however, when the ADP was reduced because of the need to cut totalexpenditures, the approach suggested here would focus on increasingexpenditures for the core investment program, with subsequent realignments ofthe ADP taking place as needed to support this basic approach. In practice,this approach is likely to result in an increase in the size of the publicinvestment program in financial terms (although not in the number of projects)by improving the implementation of the core program and by encouragingimplementing agencies to leverage projects with donor financing or shift themto the se'f-financed investment program. The most important aspect of thesechanges is that they would give a concrete expression to the meaning ofpriorities in the public investment program.
14/ A certain degree of monitoring would be essential in order to ensure thatthe initial budget estimates are realistic. Otherwise, this procedurewould run the danger of becoming an automatic escape clause, which wouldmake the problem of effective budgetary control more difficult.
15/ This approach would require some improvements in expenditure monitoringprocedures in order to avoid budget overruns. The best way to handlethis in the short term would be to rely on the Chief Accounts Officers(CAOs), which were established as part of the departmentalization programinitiated in FY83. With the approval of the Secretary of the Ministry,the CAO would be authorized to reallocate funding to core projects fromother projects under the Ministry's jurisdiction. If an increase in theoverall allocation for the Ministry was required, this would have to becleared with the Planning Commission. Regular financial reporting shouldbe required for the core program which would be easier to implement witha smaller number of projects. In the longer run, these changes wouldform the basis for wider improvements in the system for expendituremonitoring and control, which are discussed in Chapter 5.
- 74 -
Other Implementation Problems
4.17 Procurement. Procurement issues affect virtually all projects andare an important source of procedural delays. A large amount has been writtendescribing problems in the procurement process and offering suggestions forimprovements. 3owever, the Government has made relatively few changes inrecent years (an exception is the recent increase in contract approvallimits), and further progress should be an important feature of publicexpenditure reform. In approaching this subject, it is recognized that theissues involved are highly technical, and there is often no general agreementas to what constitutes 'best practice." Procurement reform should thereforebe a cooperative effort between the Government and the donors in whichadcquate allowance is made for local preferences and legal requirements. Thissaid, the following objectives should be achievable iu the near future:
(i) International bidding. In the case of international contractsfinanced with donor assistance, the Government generally follows theprocedures specified by the donor. These may range from differentforms of tied procurement to international competitive bidding(ICB). The donor community has not been able to agree onstandardized bidding procedures (e.g., the sample bidding documentsrecently prepared by the World Bank and the Asian Development Bankcontain a number of exceptions and variations to cover individualrequirements), and this situation will have to be accepted for thetime being. Improvements that can be achieved include:(a) training seminars in procurement procedures to be provided byvarious donors; (b) workshops to review and compare Government anddonor procurement requirements and identify discrepancies that mayneed to be resolved; and (c) at least for the major donors, agree-ment on standard bidding documents to be printed and distributed tothe implementing agencies which would apply to all projects fundedby that donor.
(ii) Local bidding procedures. Local bidding procedures have becomeircreasingly important as the donors provide financing for a largershar* of local project costs. The regulations governing localbidding for contracts involving donor financing are specified in amemorandum circulated by ERD in 1979. There are a number of pointsin this memorandum which are open to question, such as the numericallimit on the number of firms permitted to bid, the deposit ofearnest money, excessive discretionary power given to agencies inthe granting of preferences, use of 'brackets' relative to theengineer's estimate to determine the responsiveness of bids, andcriteria and procsdures for rebidding and negotiation with thebidders. As a result, it is standard practice for IDA projectsusing local competitive bidding procedures to require a long list ofspecial exceptions in order to bring the procedures into line withmininum acceptable criteria. While this approach may be adequate ona case-by-case basis, it is inefficient and can cause confusion forthe project agencies. Moreover, it indicates that there are anumber of issues that should be reviewed in order to improve localpractices and achieve better agreement on bidding procedures betweenthe Government and the donors. Therefore, it is recommended thatthe Government should: (a) form a working group with interesteddonors (perhaps in the context of the Local Consultations Group--
- 75 -
1.CG) to review the memorandum mentioned above and proposemodifications; and (b) subsequently revise the ERD memorandum andissue it as a handbook for use by the various project agencies.
(Lii) Delegation of authority for procurement review. In theory, thegovernment regulations on procurement delegate substantial authorityto the implementing agencies to make decisions. In practice, agreat deal of layering in decision making and multiple stages ofreview occur. For example, the 1979 ERD memorandum lists a numberof agencies that have been granted authority to make their ownpurchase decisions, such as BPDB In practice, BPDB cannot make adecision on short-listing consultants and suppliers withoutreferring the decision to the k.inistry of Energy and MineralResources for review. Another problem is the widespread disregardfor the maximum time limits on the various stages of decision making(which are described as 'obligatory' in the ERD memorandum), and thefrequent tendency for procurement decisions to be changed at variousstages of review, which calls into question the fairness andtransparency of the process. It is recommended that the specifiedtime limits and delegation of authority be included in the review ofthe ERD memorandum described above, and the Government should takeappropriate steps to ensure that all procurement for core projects(as an initial step) abides by the revised procedures as of FY90.Strengthening of project monitoring procedures to ensure that thisoccurs should be considered in this context.
4.18 Recruitment and Staffing of Proiect Entities. Recruitment andstaffing problems are another major source of implementation delays. To alarge extent, this is symptomatic of problems in civil service personnelpolicies which are described in Chapter 5. In general, there is no evidencethat development projects are discriminated against in terms of staffing. Forexample, a special survey in FY85 found that the vacancy ratio for ADPprojects was 27Z for Class I and II officers and 112 for Class III and IVstaff, which is close to the corresponding vacancy ratios of 241 and 91 forposts under the Revenue Budget. Therefore, it is likely that projects willhave to cope with high vacancy rates and skill shortages until the Governmenttakes actions to address the problem on a more systematic basis. There areseveral changes that can be made to ease the situation in the meantime:
(i) For core projects, recruitment for key positions should be initiatedat an earlier stage in the project preparation process. It iscommon practice that project directors are not appointed until afterthe Project Proforma (PP) is approved, which does not take placeuntil after donor funding is committed. It would be better in manycases to identify project 'irectors o7 the basis of an approvedPreliminary Project Proforma (PPP).161 so that he can take an activerole in the design and preparation of the project. Additional keystaff should be appointed as needed before project aoproval, so that
16/ This advantage could be reserved for core projects. In this case, itwould be necessary to change the procedure for designatlng core projects,which currently takes place after a PP is approved. A "conditionall coredesignation could be provided on the basis of an approved PPP, whichwould let start-up activities proceed for high priority projects.
- 76 -
implementation does not slow down while new staff gain familiaritywith the project design.
(ii) For core projects, greater use should be made of long-term localconsultants to fill staff positions when there is a general shortageof qualified aDplicants within the civil service (e.g., technicalstaff). The Ministry of Establishment would need to establishguidelines and approve compensation rates ii these cases.Widespread use of this option could create difficulties because ofinternal frictions caused by differences in compensation levels, butsome experimentation with key positions would be warranted.
(iii) There is a particular problem that occurs with projects that seek tocreate new staff positions on a permanent basis, particularly in thesocial sectors. Under existing regulations, such staff can be hiredonly under temporary contracts as long as their salaries arp paidunder the ADP. Employment in such positions is considered to beless desirable, and recruitment for the posts is more difficult thanif they were established on a permanent basis. The Ministry ofEstablishment estimates that 70-80Z of staff positions 'mder the ADPare eventually converted to permanent posts when the - :ojects arecompleted, and most of the remaining staff find positions underother projects. However, the Ministry of Finance prefers to retainthe option of reviewing the posts at the end of the project in orderto minimize long-term commitments on the Revenue Budget. Contraryto common belief, there are no regulations that prevent the creationof permanent posts under the ADP; the current practice of estab-lishing temporary posts is a convenience rather than a requirement.In general, it is a sound approach for many projects, given thelegitimate funding concerns of the Ministry of Finance. However,when the Government and the donors have agreed on a program of long-term financing for incremental staff positions, it is unfair tocreate needless uncertainties for the staff based on whether thefunding for their positions is obtained from local or donorresources. In these cases, agreement at the beginning of a projectto establish certain positions on a permanent basis would benefitproject implementation and demonstrate the commitment of theGovernment to long-term improvements in public services.
4.19 Technical Assistance. Beginning about two years ago, the ERD beganto implement government policies regarding the screening of technicalassistance more vigorously. This was in reaction to the widespread view amongpolicy makers that technical assistance was not cost-effective and was imposedby donors for their own purposes. Admittedly, it is not hard to find a numberof examples where technical assistance has not been effective. While thebenefits of technical assistance are highly variable, well-designed technicalassistance can be very beneficial and improve the performance of projectssignificantly. In many cases, the additional costs imposed on a projectbecause of long delays in the hiring of consultants more than offset anypossible cost savings from a reduction in consultancy requirements. Thechallenge therefore is to improve the screening of technical assistance inorder to meet the concerns of the Government while reducing unnecessary delaysin the preparation and implementation of projects.
4.20 In order to provide suggestions for improvements, a study oftechnical assistance utilization was recently carried out under the auspices
- 77 -
of the LCG. The Government expressed reservations about the issues andanalysis presented in the report and subsequently decided to carry out its ownstudy. In the meantime, the ERD has clarified its policies in order toaddress some short-term concerns of the donors, such as permitting the use ofloan funds for technical assistance if a reasonable search is made for grantfunds first. Until the government's study is available, it would be prematureto make detailed recommendations for changes in this area. However, severalcommento are appropriate based on the analysis carried out for this report:
(i) The contracting of technical assistance is often subject to the sametype of problems that affect other procurement decisions, includinglayering of decision making, disregard of time limits, anddisagreements on contract awards. The end result is detrimental toBangladesh, as consultants become hesitant about posting their beststaff and incorporate hidden costs into the contract price. Moreefficient procedures would therefore serve to reduce costs andimprove quality in the long run.
(ii) One of the areas where the Government has been most hesitant aboutaccepting consultants is il. the preparation of forward investmentprograms, as compared to detailed design work. However, one of themajor deficiencies in the project planning process is the lack of anadequate pipeline of projects. Greater use of consultants in thisarea woule pay off many-fold for Bangladesh in terms of increasedcommitmei..s of donor resources and more efficient sequencing ofinvestment projects.
(iii) A widespread complaint among donors involves delays in appointingcounterpart staff for technical assistance positions, particularlywhen on-the-job training is intended. However, as was notedpreviously, the vacancy rate for Class I and II officers in regularpositions is currently about 25Z of authorized positions. It is notsurprising, therefore, that the Government has difficulty inappointing staff to counterpart technical assistance positions, andthis problem is unlikely to improve within the foreseeable future.This means that technical assistance assignments, particularly thosethat require the transfer of technical krcXwledge to local staff,will have to be designed with this constraint in mind. This maylimit the scope of tasks that can be carried out. It may alsorequire that technical assistance assignments will have to beextended beyond the initial stage of technical development and coverthe first few years of implementation as well. This will add toproject costs, but it is essential in order to ensure that theimprovements are subsequently maintained.
(iv) One of the reasons frequently given by ERD for rejecting technicalassistance is that adequate local capacity is available. This isconsistent with the government's desire to encourage the localconsulting industry and reduce costs. However, the ERD has notspecified what type of actions would constitute a reasoLable searchfor local technical capacity, nor does it verify the availability ofsuch capacity in rejecting a proposal for external technicalassistance. Guidelines need to be agreed in this area. In addi-tion, donors may wish to improve their ability to search for localtechnical capacity. This may include the preparation of consultantrosters and/or encouragement of local firms to register their
- 78 -
capabilities at donor offices. More formal approaches are unlikelyto be successful in view of the need to maintain confidentialinformation. Nevertheless, such efforts can be initiated on avoluntary basis in order to demonstrate good faith in responding tothe government's concerns.
4.21 Land Acquisition. Land acquisition is an important source of e3layfor projects in the water resources, urban development, and road sub-se%tors.The legal framework for land acquisition (e.g., The Acquisition and Requisi-tion of Immovable Property Ordinance, 1982) appears to be adequate and pro-vides reasonable protection for the rights of the landowner and the interestsof the Government. The major problem involves procedural delays, especiallythe fact that the Government will not i..:tiate the process of land acquisitionuntil after a PP is approved. As donor financing must be committed prior tothe approval of a PP and the subsequent land acquisition process usually takessix to eighteen months, this means that a project requiring land acquisitionwill be automatically delayed for a substantial period. It is common in othercountries to require that land be made available prior to the approval ofprojects, and the Government and donors should consider adopting thispractice. For core projects, it should be possible to start the process ofland acquisition on the basis on an approved PPP, with the final acquisitioncompleted when the PP is approved and compensation funds become available.Another solution may be to experiment with voluntary leasehold agreements withlandowners that are willing to conclude an agreement immediately. In mostcases, the major problem is to nave local funds available for land acquisi-tion, and th' Government should consider establishing revolving funds (to berepaid out of subsequent budget allocations) in major agencies such as BWDB,RHD, etc.
4.22 Project Monitoring. An efficient system of project monitoring canmake an important contribution to project implementation. IMED conductsregular reviews on the implementation status of projects in the ADP based oninformation provided by project agencies and supplemented by on-siteinspections by IMED staff. These reviews include the assessment of con-straints and bottlenecks impeding project implementation and recommendationsfor overcoming them. The reports are distributed to Secretaries of concernedministries, heads of departments and semi-autonomous bodies, concerned projectdirectors, and Members of the Planning Commission. Since 1986, IMED has beenreporting to the Executive Committee o£ the National Economic Council on theimplementation performance of ADP projects for each ministry on a regularbasis. This arrangement has provided a forum for the review of implementationproblems at a high level in the Government. IMED is also developing acomputerized project monitoring system. While this approach is useful, itspotential impact is muted by the need to track all projects in the ADP. Asystem that focuses attention on the core investment program would be moreeffective in practice. Non-core projects could be monitored on the basis of asample of projects. There is also a need for regular project monitoring bymajor implementing agencies as part of their normal activities; BWDB, inparticular, has introduced an effective internal project monitoring system.IMED reports would be useful to donors in their portfolio implementationreviews, and it would be desirable to make the reports available to them on aregular basis.
- 79 -
B. Commodity Aid Utilization
4.23 Commodity aid plays an important role in the public expenditureprogram by providing a large share of the local funds required to support theADP.17 Commodity aid has been defined as balance of payments assistancewhich is neither project nor food aid (hence a residual category), and as suchit includes a wide variety of assistance ranging from direct contributions ofspecific goods (such as fertilizer) to balance of payments support with fewrestrictions on end-use or sources of supply (such as IDA or Japanese aid).181In FY87, commodity aid agreements represented 35Z of new foreign aidcommitments and 25S of total aid disbursements.
4.24 Commodity aid represents the largest category of foreign exchangereceipts allocated directly by the Government (excluding food and project-related imports) rather than relying on more flexible market-orientedprocedures. As such, it is subject to all the biases inherent in an
; administrative system; i.e., inflexible regulations as to eligible imports, abias toward public sector corporations, and a tendency to favor large ordersthat promote inventory build-ups. In addition, commodity aid suffers from avariety of restrictions imposed by the donors, includings
(i) Restrictions on Eligible Commodities. All commodity aid agreementsplace restrictions on the commodities that can be imported. In somecaseL, this may consist of a simple negative list prohibitingimports of items such as alcoholic beverages, gemstones andexpensive automobiles, or sensitive items such as military andpolice equipment and nuclear materials. In other cases, the listmay be quite explicit as to allowable commodities (such asfertilizer, specified raw materials or pharmaceuticals), and theGovernment may have limited authority to change the allocations oncethey are agreed.
(ii) Tying Restrictions on Source. Restrictions on thEe source of importsare also quite common, ranging from very general restrictions (e.g.,members of the World Bank plus Switzerland and Tailwan) torestrictions on sourcing from a particular country or group ofcountries.
(iii) Tying Restrictions on End-Use. Tying restrictions on end-use areless common than restrictions on commodities or sources, but donorssometimes require that imports be directed to particular uses suchas agricultural production.
17/ Commodity aid has been discus;vd in a companion study to the project aidreport ('Utilization of Commodity Aid in Bangladesh," Development Alter-natives, Inc., June 1988) that focuses mainly on the existing adminis-trative mechanisms for the allocation of commodity aid rights. As such,the study provides a complementary approach to the approach recommendedin this section.
18/ A sub-category of commodity aid includes barter and state tradingarrangements which are generally entered into with Eastern blockcountries. The contribution of such agreements to Bangladesh's importrequirements is currently quite limited.
- 80 -
(iv) Restrictions on Procurement. All agreements contain restrictions onprocurement in order to promote efficiency and avoid possiblemisuse. In some cases, these may consist of general procurementrequirements (such as the use of ICB for all orders above a certainlimit), while other donors may insist on handling all or part of theprocurement process themselves.
4.25 The ERD administers commodity aid programs and allocates the rightsto import commodities through different ministries. Depending on theapplicable restrictions, the private sector may obtain some of the rights toimport commodities through the allocation provided to the Chief Controller ofImports and Exports (CCIE). There is a widespread presumption that theallocation process tends to benefit the public sector, perhaps because many ofthe restrictions favor commodities which are used by public enterp:ises. Inorder for an importer to purchase imports under a commodity aid program, hemust have both an allocation of rights to utilize a particular commodity aidprogram as well as a passbook which permits him to import the commodities inquestion. In order to offset this inconvenience, the Government makescommodity aid available to importers at a preferential exchange rate (i.e.,the official exchange rate) as compared to the secondary exchange market (SEM)rate, where importers are only required to have a valid import passbook butnot a separate allocation of foreign exchange. As the difference between theofficial and the SEM4 exchange rates has narrowed (it is now less than 2Z),importers have increasingly chosen to fill all or part of their foreignexchange requirements through the SEM market rather than rely on commodityaid. In some cases. the Government has applied pressure on particularimporters (generally public enterprises) to ensure that commodity aid programsare fully utilized.
4.26 The major advantages of obtaining foreign exchange through the SEKinclude a wider choice of suppliers and more scope to obtain competitive bids.The issue of price competitiveness is one of the greatest sources ofcomplaints regarding commodity aid, as tying restrictions on allowablecommodities and sources can force importers to accept goods which are notcompetitively priced on an international basis or which do not meet technicalspecifications. Since commodity aid is often provided as a grant, it issometimes argued that the price paid to the exporting firm should not be amatter of contention. However, since commodity aid rights are sold and notgranted to domestic importers (both to maintain economic eff..ciency and toraise revenues for the Government), the price of imported goods is of vitalconcern to the recipient of commodity aid in Bangladesh. Most donors areaware of this problem and have instituted special procedures to ensure thatthe prices and quality of goods procured under commodity aid are competitive,but the loss of control in managing procurement can dissuade many importers,particularly small importers and those in private sector, from relying oncommodity aid.
4.27 The Government has stated that it intends to move gradually towardunification of the foreign exchange system. In this context, one of the majorsteps that the Government can take is to channel the disbursement of commodityaid programs through the SEM. The concept of using the SEM for commodity aidis not new and has been used by at least three donors, including IDA, Japan,and the Federal Republic of Germany. A recent review of IDA's experience inusing the SEM for disbursement of commodity aid indicates that this approachhas been efficient in several respects, as well as permitting rapid disburse-ment of commodity aid. For example, using the SEH facilitates the
- 81 -
participation of both private and public sector importers of all sizes, coversa wider range of imports, and allows importers to adapt the size of theirorders to a more economical lot size, thereby avoiding an excessive bu:ild-upof inventories.
4.28 The basic procedure for financing SEH imports with commodity aid isquite simple, although the process may vary in detail for different aidprograms. An importer initiates the process by opening a letter of credit(LIC) at a commercial bank, which advises Bangladesh Bank of the need forforeign exchange to cover the cost of the import. Bangladesh Bank screens theL/C and determines whether it meets the criteria to be eligible for financingthrough a commodity aid program. If it meets the criteria, Bangladesh Bankarranges for the disbursement of foreign exchange to cover the L/C in themanner agreed with the donor. In the case of IDA credits, IDA has establisheda Special Account with Bangladesh Bank that can be used to cover eligibleLIC's, and the account is replenished when the Government provides documenta-tion to IDA that the funds have been drawn for eligible imports. As analternative procedure (which is used by many bilateral donors), BangladeshBank may arrange for eligible L/C's to be paid directly by a foreign banknominated by the donor agency. Finally, Bangladesh Bank may choose to coveran import directly from its own reserves of foreign exchange and claimreimbursement retroactively from the donor.
4.29 It is not generally necessary that an importer using the SEM knowwhen his imports are being financed with commodity aid. This stage has notyet been reached, as even IDA credits are still allocated by the CCIE. Theprocess of allocating commodity aid through the CCIE's office is unnecessaryand should be dispensed with as part of the transfer of commodity aid programsto the SEH window. While the experience with the SEN process has been quitesuccessful to date, the Government has not sought to extend it to cover othercommodity aid programs in the belief that restrictive conditions limit theextent to which bilateral aid programs can be disbursed through the SEN.However, many bilateral aid programs have a substantial amount of unusedflexibility which would permit the transfer of the programs, either directlyor with some modifications, into the SEH process.
4.30 Most types of restrictions, such as limitations on sources ofsupply, types of commodities and end-uses of the imports, cam be handleddirectly through the SEH. For ecample, some bilateral aid programs specifythat only imports from the host country will be eligible for financing. Thiscan be accommodated by screening L/C's at Bangladesh Bank and sorting them bycountry of origin. Similarly, restrictions on commodity types or end-uses canbe handled by specifying in advance what imports are eligible under a givenaid program and screening LIC's to see whether they fit the agreed classifi-cation. In applying this system, Bangladesh Bank would first use the mostrestrictive commodity aid programs to cover SEN imports, then would use moreflexible programs such as IDA or Japanese aid, and finally would use its ownforeign exchange reserves to cover eligible imports. Clearly it is advisableto define restrictions as broadly as possible (for example by specifyingnegative rather than positive lists of aligible imports and by includingimports from developing countries within the eligible list), so thatBangladesh Bank has greater flexibility to disburse the commodity aid.
4.31 Restrictions on procurement are a bit more difficult to handlethrough the SEH, as they require direct involvement on the part of theimporter. Several steps can reduce this problem. First, the Government may
- 82 -
wish to review its procurement requirements for the SEM to see whether theycan accommodate a greater variety of aid programs. For example, it may bedesirable to establish an upper limit on import orders, above which theGovernment would have the right to require international competitive bidding.Secondly, the Government can advertise the availability of certain aidprograms more widely in order to encourage importers to direct their purchasesvoluntarily through these programs. In many cases, importers may prefer touse commodity aid programs to obtain specific advantages available throughthem, such as reduced L/C margin requirements, assistance in procurement, etc.For programs with persistent disbursement problems due to procurementrestrictions, the Government should reserve the right to make the commodityaid available to importers at a discount in local currency terms in order tocompensate importers for the inconvenience or cost involved in using theprogram. The extent to which discounts are needed can be minimized, however,by greater reliance on promotional activities as a first approach.
4.32 The SEK process would not be suitable for all types of commodity aidagreements, such as agreements that provide bulk commodities or specializedequipment going to designated enterprises, which should continue to beallocated on an administrative basis for the sake of convenience. In otherinstances, a donor country may not have sufficient imports going through theSEH to cover the amount of commodity aid which it agreed to make available.In this case, it may be possible to split the aid agreement into parts, withsome of the aid allocated directly for specified commodities (perhaps at adiscount) and another part available for general imports from the donorcountry through the SEH.19/ By a combination of such mechanisms, the SEN canbe established as the primary mechanism for the disbursement of commodity aidprograms, which would be a major step toward a unified foreign exchange system(essentially equivalent to an inter-bank auction arrangement). Expanding therole of the SEK will require that the Government take certain steps to ensurethat foreign exchange is available on a regular basis. An increase in theminimum prudent level of foreign exchange reserves may be required. Inaddition, better forecasting and monitoring of commodity aid agreements willbe necessary i avoid sharp disruptions in the availability of foreignexchange. These problems are manageable, however, and should not be seen as aserious impediment to greater reliance on the SEN.
19/ Another approach that has been suggested is to auction commodity aidentitlements that are not used within a specified time period. Thiswould have a number of disadvantages. There may not be enoughparticipants available to hold a competitive auction for highlyrestrictive aid programs, it would encourage importers to delay usingcommodity aid programs in anticipation of getting them cheaper throughthe auction, and it sets up a new allocation mechanism when thegovernment's announced intention is to unify the foreign exchange system.In view of the flexibility already available in the SEN process,introduction of an auction for commodity aid appears to be unnecessary.
d 83 -
C. Operations and Maintenance
4.33 The technAcal case for improved O&M has been extensively documentedin recent years.20 1 Routine maintenance expenditures have very high economicrates of return (generally in excess of lOOS for road maintenance) whichexceed in almost all cases the returns available from new investment. Despitethi3, almost all developing countries (and many developed ones as well) havewitnessed accelerated deterioration of the public capital stock :in recentyears as a result of fiscal restraints and inadequate funding of O&M programs.Experience has shown that this problem is difficult to resolve at the level ofoverall budget management. Useful changes can be made to focus greaterattention on O&M requirements--e.g., improvements in planning procedures toincorporate O0M as.an explicit sectoral objective, accounting changes toidentify O&M expenditures in the budget, and increases in fees and charges togenerate revenues for O&M support.21! However, the most critical decisioninvolves the willingness of operating agencies to trade-off new capitalinvestments for increased O0M. This implies that OM improvements will haveto be addressed on a sector-by-sector basis.
20/ It has become accepted in Bangladesh to refer to the '0M1 problem ingeneral terms. In practice, there is considerable variation as to whatis meant by OM in each of the sectors. To complicate the situation, theMinistry of Finance publishes a summary budget statement that includesmoperations and maintenance as a distinct category separate frompersonnel costs and other incidental expenses (such as rent, telephone,vehicle operating costs, and the wages of temporary staff). Anexamination of the OM category in the budget indicates that it haslimited operational significance, with over half of the total allocationgoing for non-wage defense expenditures, while the remainder includesexpenditures such as grants to semi-autonomous bodies, operating costs offoreign embassies and the police department, and gross maintenancecharges by the Telephone and Telegraph Board. Thus, while this reportfollows current practice by discussing OM expenditures in general terms,this concept does not correspond to the expenditure category in thebudget documents.
21/ Begiiaing in FY87, the Ministry of Finance began to include blockallocations for O&M under several budget heads (particularly education,population control, roads, irrigation and maintenance of non-residentialbuildings) at the behest of several donors. The allocations for theseaccounts, which amounted to less than 0.52 of the total Revenue Budget,were never fully spent and have not been an effective way of improvingmaintenance standards.
- 84 -
4.34 The estimation of O&M requirements is difficult for several reasons.First, th,ere a lack of agreed standards for estimating maintecanne require-ments.22/ Experience from other countries indicates that benchmark indicators(such as a percentage of revalued capital costs) provide only very generalguidelines for maintenance requirements, which must be adapted to fit localcircumstances and cost structures. A second problem is the need for informa-tion on the current condition of the capital stock and improvements requiredto restore it to acceptable standards. A third problem is the differingdefinition of O&M expenditures, which for the social sectors should includepersonnel and running costs (e.g., doctors, nurses, drugs, medical trans-portation, etc.), while for Infrastructure can focus on direct maintenanceexpenditures. As the need for recurrent cost financing for the social sectorswas highlighted in Chapter 3, the discussion in this section will focus onphysical maintenance, particula.rly in the context of water management and roadprojects.
4.35 Flood Control, Drainage and Irrigation (FCDI). The Bangladesh WaterDevelopment Board (BWDB) is responsible for over 400 completed projects.ranging in size from small single structure schemes to large multipurposeprojects.23/ A 1984 survey of BWDB's operations indicated that about one-halfof the existing projects were in need of rehabilitation. The reasons for thisinclude: (a) inadcquate funding for O&M; (b) weaknesses in BWDB's organiza-tional arrangements, O&M procedures and staff .-pabilities; and (c) insuffi-cient involvement of farmers in the planning of projects. This situation hasan important bearing on future priorities for the sector. The National WaterPlan has estimated potential ERRs for various types of water projects rangingfrom 30Z upwards. Nevertheless, actual experience with FCDI projects has notachieved this potential. Recent project completion reports on seven waterdevelopment projects indicate that reaLized rates of return are generally one-half or less of the expected value, with six of the projects having a revisedERR of 13Z or less. Much of the difference between expected and achievedbenefits has been due to inadequate O&M, with delays in project completion(often attributable to land acquisition problems and delays in procurement)and changes in output prices also being important factors.
221 The question of appropriate maintenance standards raises the relatedissue of initial design specifications. In many cases, higher initialdesign standards can reduce subsequent maintenance costs, and this needsto be investigated carefully in each case. (The appropriate criterion isdiscounted lifetime costs under reasonable assumptions about the abilityof the agency to maintain the investment.) The reverse situation canapply at times, in which high initial design standards can lead tounsustainable maintenance requirements. One of the most strikingexamples involves a donor-financed facility at a local university. Thebuilding was provided with central air conditioning, which proved to betoo expensive for the university to operate, while the climate controlaspects of the building design (sealed windows, etc.) made the buildingunusable without the air conditioning.
23/ O&M requirements for FCDI were previously discussed in the 1986 CountryEconomic Report--'Bangladesh: Recent Economic Developments and Medit'm-Term Prospects," World Bank Report No. 6049-BD, March 17, 1986.
- 85 -
4.36 According to BWDB's estimates, the shortfall in financing for O&Mrequirements during the last six years has been on the order of about US$10million per year (Tk Cr 30 in FY88 prices or about 402 of the fundingrequested by BWDB in the Revenue Budget..±) BWDB has recently agreed toestdblish an O&M cost cell to improve the accuracy of future requests for O&Mfinancing of completed projects. O&M requirements are expected to riserapidly as additional projects are completed and donor financing for initialstart-up costs lapses. In addition, the rehabilitation of projects allowed todeteriorate in the past may require an additional Tk Cr 300 or more over thenext several years. Thus, it is expected that BWDB's annual fundingrequirements for O&M and rehabilitation could amount to Tk Cr 150 million(FY88 constant prices), or approximately 301 of BWDB's combined FY88 budgetallocation (ADP plus Revenue Budget).
4.37 Increased financing for rehabilitation and O&M is expected to beprovided by: (i) improved cost recovery from beneficiaries, either as cash orin-kind; (ii) continued subventions from the Revenue Budget, particularly forprojects such as FCD improvements which do not lend themselves to direct costrecovery; and (iii) increased donor financing on a long-term declining basisto augment the funds available from the other two sources. BWDB made aninitial attempt to introduce cost recovery in FY84 in connection with the BWDBSmall Schemes Project. Choosing twelve gravity-fed irrigation schemes, BWDBundertook to set watet rates and Improve collection procedures with a goal ofachieving full cost recovery for O&M by FY91. The attempt failed, but it hasprevided valuable lessons for the future. The procedures chosen for theassessment of water rates were overly complex, and BWDB suffered from ashortage of assessment and collection staff due to hiring constraints imposedby the Ministry of Finance. The collection agencies chosen by BWDB (KSS, thevillage cooperative societies) did not work out due to inadequate incentivesto participate in the process. Finally, villagers resisted paying the waterrates because the supply of Irrigation water for many of the projects wasinsufficient or irregular. As a result, out of Tk Cr 3.4 in assessed waterrates in FY85, BWDB was able to collect only 4Z, while collections in subse-quent years have been negligible. As a result of this experience, it wasagreed that better technical preparation would be necessary in order to makefurther progress in this area, and a revised program is expected to start inFY91 to introduce cost recovery in connection with the BWDB SystemsRebabilitation Project.
4.38 Roads. The Roads and Highways Department (RHD) in the Ministry ofCommunication has responsibility for approximately 10,000 km of roads(including some 2000 bridges), of which 6200 km are paved (some one-lane
241 This estimate is based on requests prepared by BWDB's field divisions anddoes not draw on a uniform methodology for cost estimation. In additionto its allocation under the Revenue Budget, BWDB receives O&M funding inthe form of wheat for distribution through the FFW program (amounting t3US$14 million in FY87), of which approximately 901 is used to pay forrepair and maintenance work on earthwork structures in completedprojects. Smaller allocations for O&M are also provided under the ADPfor completed parts of projects still under construction and in BWDB'sforeign exchange cash budget for purchases of imported supplies andmaterials.
- 86 -
only).25/ In addition, there are over 125,000 km of feeder, farm-to-market,and tertiary roads under the responsibility of the upazilas. many of which arepassable for only a few months of the year and then only by four-wheel drivevehicles. All parts of the road network are in generally poor condition. Forthe major road retvork under RHD, recent studies have identified one-third ofexisting roads and bridges as urgently needing repair, while routine andperiodic maintenance on the remaining portion of the road network isconsidbred to be inadequate.
4.39 Lack of agreement between RHD and the donors on the priority to begiven to road maintenance held up funding for most major road projects forseveral years during the early 1980s. Funding for road projects has nowresumed with a greater emphasis being given to rehabilitation and maintenance.Given the general deterioration of the road network, priorities have had to beestablished for the various types of works. For example, in the northwestsection of Bangladesh, 305 km of roads are scheduled to receive a fullreconstruction, including strengthening of pavements, widening of roa,dembankments, and repair or reconstruction of bridges and culverts.2i Giventhe high cost of this work, which is almost as expensive as new construction,a further 335 km of roads will receive less intensive treatment (primarilysurface dressing and overlays) which should slow further deterioration untilrehabilitation becomes possible in several years. Finally, agreement has beenreached on annual increases in the Revenue Budget for RHD to carry out anadequate program of toad maintenance, from Tk Cr 53 in FY87 to Tk Cr 78 inFY88 (budget allocation), increasing to Tk Cr 101 in FY90 and Tk Cr 106 inFY92 (the latter estimates are in constant FY88 prices). Despite thisagreement, the allocation provided for RHD in the FY89 Revenue Budget shoved adecline in real terms.
4.40 In contrast to the situation with the main road network, agreementon a road maintenance progtam for local roads under t!e responsibility of RHDand the local governments is much less advanced. Hany of the roads started asearthwork embphkments constructed by hand labor under the FFW program.Although their length is impressive, their technical quality is rudimentary.Upgrading some of the roads to handle motorized traffic on an all-season basiswill require strengthening the existing earthworks, raising the road surfacesabove flood level, installation of bridges and culverts to provide drainage,and improved road surfacing. The potential benefits of such a program, whichvarious studies have indicated can be significant, are compromised by analmost total lack of maintenance at present. The costs of maintaining animproved local road network would be substantial. Considering only the feederroad type A program (which is intended to connect upazila headquarters to thearterial road network), the annual maintenance cost for such roads would be onthe order of Tk Cr 60 (FY88 prices) if they are upgraded to an all-weatherstandard. The estimated maintenance costs for the feeder road B network, ifthey are upgraded to brick surfaces in order to handle light trafficconditions, would be on the order of Tk Cr 85 (FY88 prices). This means thatroad maintenance costs alone could exhaust almost all of the funds currentlyprovided to the upazilas for local development projects. The guidelines
25/ This includes 4000 km of upazila feeder roads type A which RHD isresponsible for upgrading but the upazilas are expected to maintain.
26/ 'Bangladesh: Road Rehabilitation and Maintenance Project," World BankStaff Appraisal Report No. 6731-BD, Hay 26, 1987.
- 87 -
established by the Planning Commission for the upazila development grant,however, limit the use of the funds for road maintenance, and local sources ofrevenue are inadequate to absorb the cost of road maintenance. Until thissituation is resolved, the economic viability of improved feeder roads appearsto be doubtful.
4.41 Recommendations. On the basis of the case studies just presented,several conclusions can be drawn. First of all, the technical informationbase needed to justify O&M funding requests needs to be upgraded on a sector-by-sector basis. This is an important action, because in the absence of acompelling technical demonstration for O&M funding requirements, generaldiscussions of recurrent cost requirements will have little success in a tightbudget situation. Such studies should addresss (i) the preparation of aninventory for the capital stock to be maintained; (ii) the degree ofdeterioration of the capital stock; (iii) an assessment of whether repair orrehabilitation of the asset is economically justified; (iv) the managementcapacity of the concerned institution; and (v) the accounting changes neededto ensure that O&M expenditures are adequately identi.ied in the budget. Asecond conclusion relates to the relative magnitude of O&M fundingrequirements. In the two sectors just discussed, the shortfall in maintenancefunding appears to be on the order of 40-50Z of annual requirements (notincluding the upazila road maintenance needs). The required increase inannual funding, on the order of $l5-20 million for the road and water resourcesectors together, should be achievable over a five year period, given adequategrowth in the budget. The major problem is how to finance these requirementswhile simultaneously addressing the large backlog of deferred maintenance.
4.42 Experience in almost all countries demonstrates that providingadequate budgetary allocations for O&M expenditures is difficult to maintainand requires a determined effort at all levels of the Government in order toachieve progress. In the absence of quick fix" approaches, there are anumber of d'screte actions that can be taken to improve the situation. Thefollowing recommendations should be feasible objectives in the Bangladeshcontext for the near future:
Step One: Establish O&M as a priority activity. The Ministry of Financeand the Planning Commission need to send a clear signal to the operatingdepartments and semi-autonomous bodies that more efficient utilization ofexisting dssets is a priority of the Government. The most effective wayto achieve this is through the investment program. The PlanningCommission should establish a schedule by which major operatingdepartments and other agencies should have an approved action plan forO&M of existing facilities, as a condition for the inclusion of newprojects in the ADP. A critical part of such an action plan should be aspecific estimate of annual O&M requirements (covering the next 3-5years) and a monitorable financing plan showing how the funds will beprovided--i.e.. self-generated funds, R/venue Budget (which must beapproved by the Ministry of Finance) 271 ADP (including donor financingof O&M expenditures), FFW, etc. Such a plan has already been approvedfor road maintenance (although not yet enforced), and technical studiesare ongoing to prepare such a plan for FCDI under the BWDB Systems
27/ Given the complexity of the Revenue Budget, the financing plan shouldspecify which budget heads and sub-heads are included under the agreementand how the specified amounts compare to past allocations in the budget.
- 88 -
Rehabilitation Project. Other sectors where such plans should bedeveloped and the target dates for their initial inclusion in the budgetinclude: health and population control (based on the recently completedhealth financing study, with possible inclusion in FY90 budget);education (General Education Credit, FY90 budget); agricultural researchand extension (Agricultural Sapport Services Project, FY91 budget); andrural roads (Rural Roads and Markets Project, FY92 budget). The PlanningCommission should designate other priority sectors and establish atimetable for preparation of an O&M action plan in a similar fashion.
Step Two: "Projectise' the initial phase of O&M imQrovements. Theinitial phase of preparing O&M programs is likely to rely heavily ondonor input. Very few agencies have the technical capacity to prepareaction plans as required in Step One, and the Planning Commission needsto develop an internal capacity to review the plans as well. On theother hand, most agencies have experience with the project cycle,particularly if they have access to external financing. Approaching O&Mimprovements on a project basis has a number of advantages. First ofall, it provides access to technical experience and advice by donors inthe preparation of such plans. Studies required as a result of theexercise can be financed out of project preparation funds. Finally, thefinancing needed to support O&M programs can be shared with the donorsover a realistic time period.
Step Three: Shift increasingly to a medium-term expenditure planapproach to budgeting. The process suggested in Steps One and Tworepresent a "one-shot' approach to improving O&M programs. For thiseffort to be sustained, it will be necessary to institutionalize it inthe budgeting system. The present structure of the budget tends todiscriminate against funding for O&M. Personnel costs are largely fixedin the short term, so the only option available in the Revenue Budget toreduce costs 4 to cut O&M expenditures, which over time has resulted inserious shortfalls in funding. A prudent approach would trade-off O&Mrequirements against n;w investments. This can only be de-le in a budgetframework that addresses recurrent and capital expenditures jointly on asector-by-sector basis, an approach that is discussed in Chapter 5.
Step Four: Experiment with a variety of funding mechanisms for O&M.Even with institutional and procedural reforms to give priority to O&M,experience in other countries demonstrates that it is difficult tomaintain adequate budget allocations for maintenance activities on acontinuing basis. The most successful approaches include a specificsource of funding for O&M under the control of the operating agency,which is most feasible for the autonomous and semi-autonomous bodies.The Planning Commission has an important role to play in vetting requestsfor rehabilitation investments and insisting on cost control measuresand/or price increases to generate adequate revenues for O&H as anecessary condition for the approval of new investments. In addition,there is scope for the Ministry of Finance to experiment with allowingselected agencies to retain a portion of self-generated revenues for O&Mpurposes. At present, all revenues are surrendered to the Ministry ofFinance. This is a sound approach in general in order to preserveflexibility in the use of scarce local resources and maintain adequateaccounting controls. Nevertheless, experience shows that there is roomto encourage additional revenue collection in situations where localefforts can be seen to have a direct relationship to improved services.
-89 -
Examples include the promotion of parent groups to as6ist in themaintenance of primary schools (either through cash or in-kindcontributions), levying of nominal charges for drugs and out-patientvisits at rural health centers, levying tolls to pay for the maintenanceof bridges, and shifting responsibility for the land development tax tothe upazilas and the pourashavas. Such fees and charges can provide auseful supplement to direct budget allocations, which should be set on a'net of expected contribution" babis to encourage greater revenuecollections.
4.43 In many cases, it will be necessary for the donors and the Govern-ment to adopt a cooperative approach to recurrent cost financing. Adequateprecedents have been established for the donors to assist in strengtheningmaintenance programs and overcoming the backlog of rehabilitationrequirements. These efforts will need to be continued on a long-term basis,if only to break the cycle of rapid deterioration and expensive rehabilitationthat has characterized infrastructure programs in the past. At the same time,donor participation should not be seen as a panacea for domestic financing.Donor financing should complement measures to control costs and increaserevenue generation in order to assist the Government in taking over theresponsibility for financing O&H programs on a long-term basis.
- 91 -
Chapter V
Management of the Public Expenditure Program
5.1 Despite tremendous growth in the public expenditure program, theprocedures for managing the budget have changed relatively little sinceindependence. The present system achieves several important objectives. Thearrangements for screening investment projects and evaluating their financialand economic viability have been fairly successfal in reducing the occurrenceof obviously non-viable projects in the ADP. The budget systen has also beenable to maintain a reasonable degree of expenditure control despite severeshortages in qualified accountancy staff, an absence of modern e.ectronic dataprocessing equipment, and disruptions in financial reporting relationships asa result of two major changes in the accounting system which occurred almostsimultaneously.11 Despite these considerations, the current managementprocedures for the public expenditure program are deficient in several majorrespects. Expenditure control is maintained through a very rigid system ofline-item authorizations that have a high fr ctional cost in terms of slowingdown the implementation of public programs.21 The project planning frameworkfails to address a number of important issues, such as developing an adequateproject pipeline and evaluating the impact of funding constraints on theselection of new projects. The expenditure classification system for thebudget maintains an artificial division between recurrent and capitalexpenditures, which contributes to the neglect of O&M costs. Finally, thesystem of compensation review and recruitment fails to address many of themost critical manpower issues for the civil service. Section A of thischapter will discuss priorities for improvements in planning, budgeting andexpenditure control, and Section B will address public sector employment andcompensation issues.
A. Planning, Budgeting and Expenditure Control
5.2 Development of an effective management system for the publicexpenditure program involves a number of complex and highly technical issues.There are a variety of approaches which have been tried in other countries,and each of them would have advantages as well as disadvantages in Bangladesh.Rather than providing a detailed description of current procedures inBangladesh and the available options, this section will focus on defining themajor issues that a program of institutional reform should seek to address.While planning, budgeting and expenditure control will be discussedsequentially for the sake of clarity, the linkages between the activities are
1/ The changes were: (a) odepartmentalization,g which refers to thedelegation of pre-audit and expenditure authorization responsibilitiesto the operating ministries; and (b) 'decentralization,, which refers tothe delegation of various functions to the upazilas.
2/ A senior civil servant characterized the current system as 'You can'twaste what you can't get!". Despite this comment, he added thateffective expenditure control was breaking down in a number of areas.
- 92 -
critical for effective management of the public expenditure program. Thediscussion will therefore highlight these connections and provide guidelinesfor the sequencing of institutional reforms.
Planning
5.3 The role of economic planning has changed significantly in recentyears. First of all, it has been recognized that the public sector has alimited capacity to direct aggregate resource flows and that excessivereliance on discretionary actions can inhibit growth by restraining privatesector initiatives and encouraging wasteful rent-seeking activities. Hence,most countries place emphasis on policy reforms to provide a macroeconomicclimate which provides incentives for growth, while using detailed planningprocedures primarily for the public expenditure program. Bangladesh haslargely adopted this framework, although with a number of limitations. Thesecond change that has occurred in economic planning is a shift to shorter-term and more flexible approaches. Countries have recognized theirvulnerability to external and internal shocks and have taken steps to improvetheir ability to absorb short-term fluctuations and adjust their targets toincorporate changes in the economic environment. However, despite the factthat Bangladesh is one of the most susceptible countries in the world toeconomic shocks, the planning framework :ontinues to rely on a long-tsrmstatic perspective. Finally, as growth improves and economic managemencbecomes more complex, there is a need to decentralize the planning of thepublic expenditure program to utilize sector knowledge more effectively. Theplanning system used in Bangladesh, however, remains highly centralized, withall the attendant problems of inflexibility, poor responsiveness, and lowaccountability.
5.4 The first stage in public expenditure planning should be to preparea sound macroeconomic framework. In practice, this should have two ?arts.The first is a set of macroeconomic projections that are internally consistent(i.e., overall growth projections are linked to plausible expectations forsectoral growth rates, the current account and fiscal deficits, and monetarygrowth) and which provide a realistic estimate of public resource flows over atwo to three-year period (including tax and non-tax revenues, domestic andexternal borrowing and grants). The second part of the macroeconomicframework is a set of sectoral strategies and policy actions needed to achievethe projected targets. While public expenditures may be one aspect, it isimportant that the sectoral strategies cover the full range of actions neededto achieve the desirea objectives, including incentives for pzivate sectorinvolvement, institutional reforms, resource mobilization, and linkages toreform programs in other sectors. The strategy statements can help to achieveconsistency between macroeconomic targets and the prospects for individualsectors. They also serve to emphasize that public expenditures are only onepolicy instrument among several which may be needed to achieve a givenobjective.
5.5 The current expenditure planning system does not achieve theseobjectives. The macroeconomic model used for the five-year plan is complex
-93 -
and does not provide a flexible tool for medium-term economic forecasting.3/The five-year plan itself contains an extensive discussion of sectoralstrategies, but in practice the plan is used primarily to set allocations forthe ADP (which tend to remain fixed despite variations in the composition ofthe investment program) and provide a list of new projects to be included inthe ADP over the five-year planning horizon.4/ While the five-year planningcycle can be a useful framework for addressing certain longer-term aspects ofdevelopment strategy (e.g., do current water resource management programsachieve their anticipated objectives?), many countries find it necessary tosupplement this approach with more flexible tools for allocating publicresources on a medium-term basis. Various aspects of these procedures havebeen discussed already in this report, including the priority investmentprogram for the energy sector, the core investment program approach, and theanalysis of O&M budget procedures.
5.6 The annual budget exercise currently focuses more on revenuemobilization than on expenditure priorities. The Government relies on revenueestimates prepared by a Resources Committee including the Ministry of Finance,the Planning Commission and Bangladesh Bank. The estimates are not linked toa formal macroeconomic model, and the major objective of the exercise is todecide on the division of resources between t2ne Revenue Budget and the ADP.No further breakdown in resource allocations is provided, and sectoralallocations are determined largely on an incremental basis using the five-yearplan guidelines for the ADP and approved staffing and operating costrequirements for the Revenue Budget. Thus, the Government does not make useof the opportunity provided by the budget cycle to monitor decisions on publicresource flows to the various sectors, which constitutes the primary focus forexpenditure decision-making in most countries. Instead, the project approvalmechanism serves as the focus for determining public resource flows over themedium term. Project approval procedures are an important tool in publicexpenditure planning, and the Planning Commission has made a usefulcontribution by improving the standard of project preparation. Nevertheless,this approach has a number of limitations which were illustrated in precedingchapters, such as an emphasis on new projects rather than the implementationof the existing portfolio, a neglect of recurrent cost requirements, and atendency to focus on individual projects rather than sectoral investmentpriorities.
5.7 This discussion has set the framework for the program ofinstitutional reforms recommended in this section. It is suggested that theGovernment should place greater emphasis on using the annual budget cycle asthe primary tool for reviewing public resource flows to the various sectors.
3/ The TFYP used a 36 sector general equilibrium model.
4/ Many of the projects in the TFYP list were defined in little more thanname. New projects can be added to the list, and existing project namesare often adapted-to suit other purposes. The project list is also usedto prepare an annual document entitled "Aid Worthy Projects" which iscirculaced to the donors at the annual Aid Group meeting. Since theprojects are not prioritized, however, most donors ignore the list, andthe Government could easily discontinue it.
- 94 -
The project approval process should become a secondary (but still important)mechanism to screen new investments in support of sectoral priorities.Attention should also be given to delegating greater responsibility andaccountability to the sectoral agencies for the management of the expenditureprogram. These recommendations are generally consistent with the recentdecision of the Planning Commission to place greater emphasis on reviewingsectoral strategies and growth rates rather than project approvalprocedures.51 Host of the remaining recommendations in this section areintended to help the Government achieve this objective.
5.8 One of the first priorities is to strengthen the government'scapacity for macroeconomic analysis. This should include macroeconomicforecasting tools that can be updated frequently to incorperate newinformation. In addition, the Government should improve its capacity tomonitor and evaluate structural reform programs. This is a relatively newresponsibility that many countries have had to incorporate into their planningframework. By their nature, structural reform programs generally have cross-sectoral dimensions which require the participation of several governmentagencies, including the Ministry of Finance, the Planning Commission and thesectoral ministries responsible for implementing the reforms. The sectoralministries often do not have a staff of economists who are experienced inpreparing structural adjustment programs and assessing their macroeconomicimpact. Since reform programs have become a major part of economic policy forBangladesh, there is a need to develop a capacity for monitoring such programson an ongoing basis. The location of such responsibilities is less importantthan the fact that it should become an integral part of economic policymaking.
5.9 The next priority should be to improve the linkages between sectoralstrategies and the annual budget process. The first step is to establish aconnection between sectoral strategies and the allocation of funds in thebudget. This can be accomplished in a phased manner. Agencies that have alarge expenditure program should be required to prepare a medium-termexpenditure plan along the lines discussed in Chapter 4 for the coreinvestment program. The focus of the budget discussions should then be on theoverall amount of resources, particularly local funds, to be provided to theagency and the impact that this would have on the implementation of theexpenditure program. For ministries and departments with less extensiveexpenditure programs, the expenditure plan can be less formal and should focuson medium-term objectives and implementation problems. In both cases, budgetofficials (including both Ministry of Finance and Planning Commission staff)should meet jointly with the concerned ministry to review expenditureobjectives and agree on an allocation of funds for the coming year.
5.i;D In order to achieve this objective, it will be essential tostrcngthei, 'he planning capacity of the sectoral ministries. Planning unitshave been established in most ministries, but except for a few cases (e.g.,the Ministry of Education), these units have performed relatively low levelbudgeting and monitoring functions. In the planning structure suggested here,
5/ This change in emphasis was stated verbally by one of the Members of thePlanning Commission.
- 95 -
the ministries would take miore responsibility for preparing their budgetrequests, which will require an improvement in their planning units. Giventhat the Planning Commission has the most experience in this area, it shouldtake the responsibility for developing a program of staff training,secondments, and other techniques to improve the planning capability of thesectoral ministries on a phased basis.
5.11 In order to provide an incentive for the ministries to improve theirplanning capacity, the Planning Commission should decentralize authority forproject preparation and approval as soon as the sectoral ministries arecapable of handling the responsibility. At the current time, the PlanningCommission approves all projects exceeding Tk Cr 2.0, which is a strongdisincentive for ministries to develop an independent planning capacity. Thishas also placed a substantial burden on Planning Commission staff, which isreflected in long delays for project review and frequent revisions. Laboriousproject approval requirements have also discouraged ministries from developingan adequate pipeline of projects, which is essential in order to support anincrease in project aid in the longer term. The Planning Commission shouldtherefore increase the limit on project approvals substantially (to at leastTk Cr 20 or more) as soon as a ministry has developed sufficient technicalcapacity to perform this function. This step has been resisted in the pastbecause of concerns that it would lead to a proliferation of small locallyfinanced projects (see the discussion of this problem in Chapter 4). However,the Planning Commission can still exert adequate budgetary control byreviewing the allocation of local funds in the annual budget process, andministries should be aware that poor discipline in project selection canresult in budgetary cuts.
5.12 In order to strengthen the focus on the budget cycle, the Governmentmay wish to adopt an approach that has been used elsewhere. At present, theannual budget guidelines are a routine document that is used to adviseministries of the schedule for budget submissions. In other countries, thebudget guidelines have developed into a strategic document that outlines thegovernment's expenditure priorities for the coming year, advises ministries ofthe resource envelope within which to prepare their budget submissions, andprovides technical information to allow ministries to estimate their costs forthe coming year (e.g., the fill ratio for vacant positions, expected inflationrates for recurrent cost elements, etc.). This process accomplishes severalobjectivest
(i) it provides an opportunity for the political leadership to indicatepriorities for the public expenditure program before the budgetcycle begins, so that the final budget document reflects a sense ofdirection rather than representing a continuation of past trends;
(ii) it provides ministries with enough information so that they can makerealistic choices about the direction and composition of theexpenditure program, rather than defending their submission on thebasis of inputs (e.g., staffing ratios); and
(iii) it allows budget officials to establish guidelines that theministries should take into account in making their submission(e.g., full funding for core projects, adequate provision for O&M,etc.).
- 96 -
5.13 The Planning Commission should also strengthen its capacity toprovide assistance to implementing agencies in the preparation of sectoralstrategies and medium-term investment programs. In a number of sectors, theimplementing agencies are highly fragmented (e.g., agriculture) or orientedtoward operational concerns (e.g., transportation). In this situation, thePlanning Commission can oversee the development of sectoral strategies andassess intra-sectoral priorities for investment (e.g., the desirability ofrapid growth in road and bridge projects). For sectors where the operatingministries have developed their own capacity for preparing sectoral strategies(e.g., the recent policy proposals of the Ministry of Education), the PlanningCommission can assist by providing a macroeconomic analysis of the impact ofpolicy changes on the public expenditure program (e.g., the long-termbudgetary implications of rapid growth in recurrent expenditures for thesocial sectors). These questions will become increasingly important as thefocus of planning activities shifts to the annual budget, and the PlanningCommission will need to delegate its more routine tasks (e.g., project review)in order to take on greater responsibilities in this area.
Budgeting
5.14 The budget process has already been discussed in the context of theproposed integration of the planning and budgeting framework. This sectionwill mainly address procedural changes in the budget process. One of the mostimportant problems that has to be addressed is the fragmentation of budgetresponsibilities. The Planning Commission is presently responsible forsetting budget allocations for ongoing projects. As indicated previously,this process has been unsatisfactory, often relying on outdated cost estimatesin the PP rather than realistic estimates of current requirements. Inaddition, the Planning Commission's role overlaps with the Development Wing ofthe Ministry of Finance, which is responsible for translating the ADP into astatutory budget document (the Development Budget) and maintaining expenditurecontrol over the investment program. The Finance Division of the Ministry ofFinance also prepares the Revenue Budget and the Budget Summary Statements.The preparation of the Revenue Budget is done on an incremental basis, withthe Expenditure Control Wing scrutinizing the budget requests in detail.Since the objective is expenditure control rather than program performance,this process has contributed to a general decline in operating funds over anumber of years. Moreover, because of the fragmentation of responsibilitiesand differing objectives for each part of the budget process, the sectoralministries are discouraged from taking an active role in trying to influenceexpenditure priorities. This contributes to pressure on the PlanningCommission to include more projects in the ADP, which is virtually the onlyavailable mechanism (other than political means) for the sectoral ministriesto influence their expenditure allocations in the medium term.
5.15 Each of the major budget documents utilizes its own expenditureclassification system which is inconsistent with the other documents. Theexpenditure classification system for the Revenue Budget is based on the IMFclassification of public expenditures.61 The Development Budget, however,uses an obsolete classification of expenditures based on the old British
6/ An important advantage of this classification system is that it isunaffected by realignments in ministerial portfolios, which are a commonoccurrence.
- 97 -
system. Finally, the ADP (which contains the same information as theDevelopment Budget) uses a rudimentary program budget format. None of theexpenditure classification systems can be reconciled with the others withoutsubstantial effort and ambiguity. The result of this situation is to renderthe pattern of sectoral allocations opaque to all but experienced budgetaryofficials. This contributes to a situation where the budget process is viewedas a technical exercise rather than an important means for expressing thegovernment's priorities in the public expenditure program. Budget reclassi-ficatiorn can be an important tool, therefore, for opening-up the budgetprocess as a resource allocation mechanism.
5.16 Under the planning and budgeting system that is recommended here,the Ministry of Finance and the Planning Commission would jointly review andagree on allocations for both recurrent and capital expenditures with thesectoral ministries. Since the expenditure classification system used by theRevenue Budget is the miost appropriate for analytical purposes, the first stepshould be to revise the expenditure classification system for the DevelopmentBudget to be consistent with the Revenue Budget.71 As a second step, theGovernment should consider consolidating the Revenue and Development Budgetsinto a single budget document, with recurrent and capital expenditures groupedunder the same heading.8/ As regards the ADP, the sectoral classification forthe investment program has been used since independence and has become auseful tool for economic analysis. The Government should therefore retain thesectoral classification ror the ADP but simplify the presentation of the ADPand revise the project numbering system to gyovide easy translation betweenthe ADP and the statutory budget documents._7
5.17 While the expenditure reclassification process described above wouldsimplify the current budget documents substantially, the Government should
7/ This step is already under consideration by the Development Wing.
8/ This would considerably simplify the process of preparing and printingthe budget documents, as well as providing greater transparency in thebudget allocations. Statutory requirements for separate presentation ofrecurrent and capital expenditures can be handled by maintainingdistinct sub-headings. Besides the revisions in major budget headingsdescribed here, the Government may also wish to consider changes in theminor heads of expenditure and detailed expenditure; these topics areleft for a separate study.
9/ As mentioned earlier, the ADP is not a statutory budget document. Muchof the presentation in the ADP provides detailed budget information(part of which is obsolete) which is also reproduced in the DevelopmentBudget. The Planning Commission should therefore consider simplifyingthe ADP, so that it functions as a summary statement of the publicinvestment program rather than as a duplicate budget document. Somecountries have tried upgrading the ADP to become an Annual Plan, butthis has proved to be burdensome in practice and has been discontinuedin most cases. Revision of the project numbering systec- as suggestedhere would facilitate machine preparation of the budget documents, whichwould significantly simplify the preparation process.
- 98 -
look at this as only the first step in making the budget documents into a moreuseful and transparent management tool. In the longer run, the Governmentshould consider introducing a program bueget classificrtion that could buildon the current structure provided by tie ADP. This ch.nge would help toimprove the analysis of expenditure prograr.-; however, experience in othercountries indicates that it can be time-consuming to introduce. Given otherpriorities for institutional reform (particularly the improvements in theaccounting system described below), it is suggested that the Government shouldbegin with the relatively simple reclassification exercise described here andestablish a framework for eventual introduction of program budgeting duringthe study of the accounting system described below.
5.18 The expenditure classification issues discussed in this section area relatively arcane topic. Nevertheless, the substantive point of thisdiscussion is important, as it involves a decision by the Government toaddress recurrent and capital expenditures on an equal footing. This approachis consistent with the direction that budget systems have evolved in othercountries, and it should be looked upoII as a logical step for Bangladesh.While the budget process can operate without making these revisions, theGovernment will undoubtedly want to introduce them at some point; and it wouldbe easier and more beneficial to carry out the changes now. In contrast, thechanges in accounting and expenditure control described next have beenneglected too long, and improvements in this area should have the highestpriority of all the suggestions made in this section.
Accounting and Expenditure Control
5.19 Current procedures for expenditure monitoring are inadequate fortracking and controlling total public expenditures on the order of US$3billion annually. During the course of the budget year, the Ministry ofFinance monitors its financial position by looking at its cash balance inBangladesh Bank. More detailed information on expenditures at a ministerialor departmental level are available only after lengthy delays and at tooaggregate a level (and often with systematic inaccuracies) to permit the datato be used to monitor Xhe detailed outcome of the expenditure program. Inorder to prevent overspending, the Ministry of Finance relies on a detailedsystem of line-item expenditure controls backed up by strict authorizationprocedures, rather than monitoring ewpenditures on a broader basis. Thissystem hinders the delegation of responsibility and accountability to thesectoral ministries and agencies. Moreover, there is a growing concern thatthe present system cannot cope with the increasing complexity of theexpenditure program, leading to opportunities for the misappropriation ofpublic funds. Certain agencies have been given independent e.penditureauthorization power (particularly Roads and Highways, Public Works and ForestDepartment) and generate large expenditure overruns which account for asignificant share of overspending in the Revenue Budget.
5.20 The Ministry of Finance introduced a plan in 1983 to deal with thissituation. The centralized functions of audit and the preparation of accountswere to be separated, with pre-audit and preliminary preparation of accountsdel3gated to the operating ministries, while the Controller General ofAccounts and the Auditor General would retain authority for the preparation ofcombined accounts and post-audit procedures. Parts of this plan have been
- 99 -
completed, with Chief Accounts Officers established for all of the majorspending ministries. However, no provision was made for the introduction ofimproved data processing facilities, so the government's skilled accountingpersonnel continue to be preoccupied with maintaining manual data procedures,rather than concentrating on improving accountIng systems and informationflows. As a result, the primary focus of the accounting system has remainedoriented on the preparation and auditing of final accounts, rather thandeveloping a flexible management information system for monitoring the outcomeof the public expenditure program.
5.21 An equally serious problem from the accounting perspective was theprogram of decentralization to the upazilas. Independent of its rationalefrom a development perspective, the rapid implementation of thedecentralization program put a serious strain on the government's accountingsystem. Each of the 460 upazilas requires the posting of two experiencedaccounting officers (one to handle 'transferreds functions under the controlof the upazila, and one to handle "delegated" functions funded by operatingministries). Moreover, the number of separate treasury units expanded from 64to over 500, with substantially increased complexity in terms of lines ofcommunication and control. This change stretched the government's accountingpersonnel very thinly, which has delayed the delegation of accounting controlto the sectoral ministries. In addition, the system of accounts imposed onthe upazilas is overly complex, which delays the reporting of expenditures tothe central government (see Chapter 12). This in turn delays the preparationof ministerial accounts, which reduces the usefulness of the expenditurereporting system for the purpose of budgetary control during the fiscal year.
5.22 These issues are highly complex, and it is not possible to discussthem in detail in a report of this type. However, the Government is unlikelyto sanction any substantial delegation of responsibility for expenditurecontrol to the sectoral ministries until the procedures for expenditurereporting and control are improved significantly. The current system ofexpenditure authorization, which is a contributing factor to manyimplementation problems, is able to maintain fiscal control in spite of a veryweak information system. The Ministry of Finance will therefore want to beassured that an equally effective mechanism of expenditure control is in placebefore it relaxes the existing procedures. Improvements in accounting andexpenditure reporting systems will have to accompany changes in planning andbudgeting procedures before the other reforms can achieve their intendedobjectives.
5.23 The Government may wish to consider the following recommendations:
(i) A detailed study of the current accounting system is needed toprovide a framework for further improvements. Such a study wasinitiated in FY87, but it was not completed because of disputes withthe consultants. This type of study is essential for furtherprogress in this area, and the Government should consider completingthe existing study or commissioning a new one to provide therequired information.
(ii) Introduction of electronic data processing equipment will beessential in order to improve expenditure reporting procedures.
- 100 -
However, the experience in other countries indicates that this stepshould only be taken after basic decisions on the structure ofaccounts have been made. Therefore, the study referred to aboveshould be completed before any major effort is made to computerizeaccounting procedures. 0'
(iii) The structure of upazila accounts is a serious problem for severalreasons. It uses too many accounting staff, it is too complex to beoperated effectively on a decentralized basis, and the resultingdelays in expenditure reporting affect the reporting system for thecentral government. This implies that a substantial simplificationof upazila aczounting procedures should be considered, which shouldbe addressed in a separate study.
Summary
5.24 Table 5.1 provides a summary of recommendations for changes in thearea of planning, budgeting and expenditure control. As indicated earlier,the recommendations for changes in the planning and budgeting system should beviewed as a logical evolutionary step for Bangladesh. In contrast,improvements in accounting and expenditure control have been delayed far toolong and therefore have some urgency in order to support improvements in thepublic expenditure program. For this reason, the Government may wish torequest technical assistance to initiate the suggested studies within the nearfuture.
B. Employment and Compensation
5.25 Personnel costs represent the largest item in the budget,representing 53Z of expenditures in the FY89 Revenue Budget. As in mostdeveloping countries, government wage and employment policies are an importantlead indicator for the rest of the economy, and public sector compensationlevels are a factor in macroeconomic policy through their impact on the fiscaldeficit. This section addresses some of the major issues involved in publicsector employment and compensation policies, including: (i) the size andcomposition of public sector employment; (ii) public sector compensationpolicy; and (iii) fringe benefits.
10/ A fairly easy stage in the computerization process is to automatepayroll records. This would have the additional benefit of providingbetter information on staffing patterns, which is not available exceptat the ministerial level.
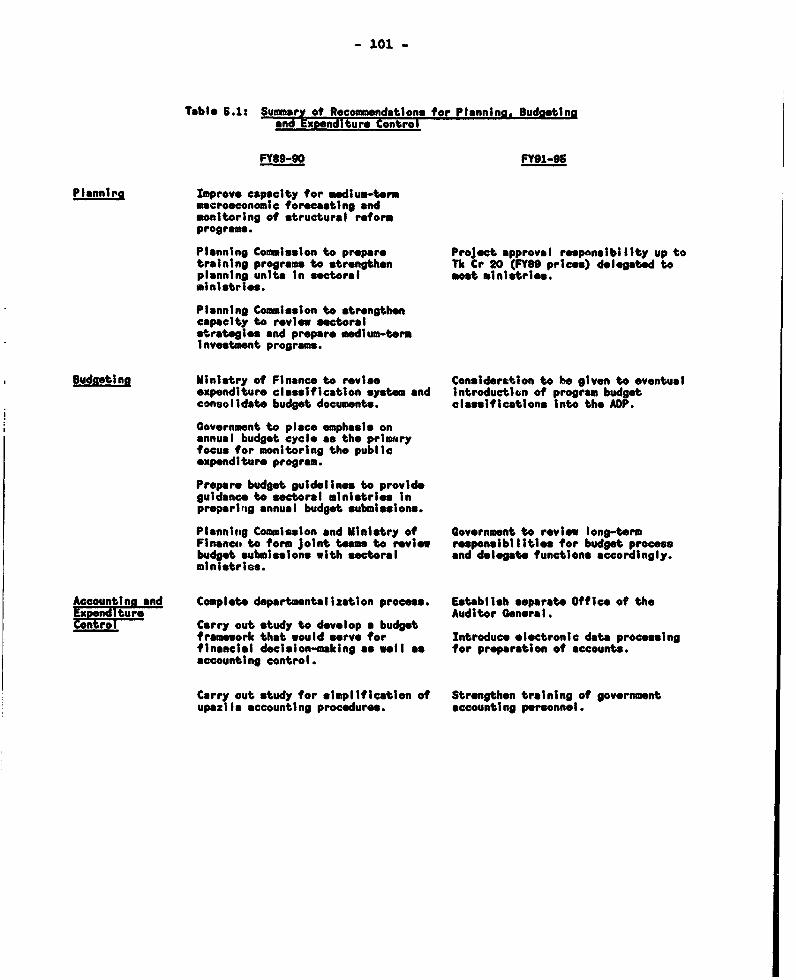
- 101 -
Tablo 6.1: Summary of Rocommendations for Plannin. Budsoetinaand Expenditure Contro
FY990 FY91-95
Planniro Improve capacity for medium-termmacroeconomic forcesting andmonitoring of structural reformprograms.
Planning Commission to prepare Projoet approval responsibility up totraining program to strengthen Tk Cr 20 (FY99 prices) delegated toplanning unlts In sectoral most ministries.ministries.
Planning Commission to strengthencapacity to review sectoralstrategies and prepare medium-termInvestment program.
Budgetina Ministry of Finance to revise Consideration to be givon to evontualexpenditure classification system and Introduction of program budgetconsolidate budget documents. classifications into the ADP.
Government to placo emphasis onannual budget cycle as the primaryfocus for monitoring tho publicexpenditure program.
Propare budgot guidelines to provideguidance to sectoral ministries Inpreparintg annual budget oubmissions.
Planning Commslsion and Ministry of Government to reviow long-termFinncrn to form joint toams to review responsibilitieos for budget processbudgot submissions with osectorl and dlegateo functions accordingly.ministries.
Accounttna and Completo departmntelization process. Establish soperate Office of theAuditor Goneral.
Co-n7t-ro-l- Carry out study to develop a budgetframework that would serve for Introduce electronic date processingfinancial docision-making as well as for preparation of accounts.accounting control.
Carry out study for simplification of Strengthon training of governmentupazilI accounting procedures. accounting personnol.
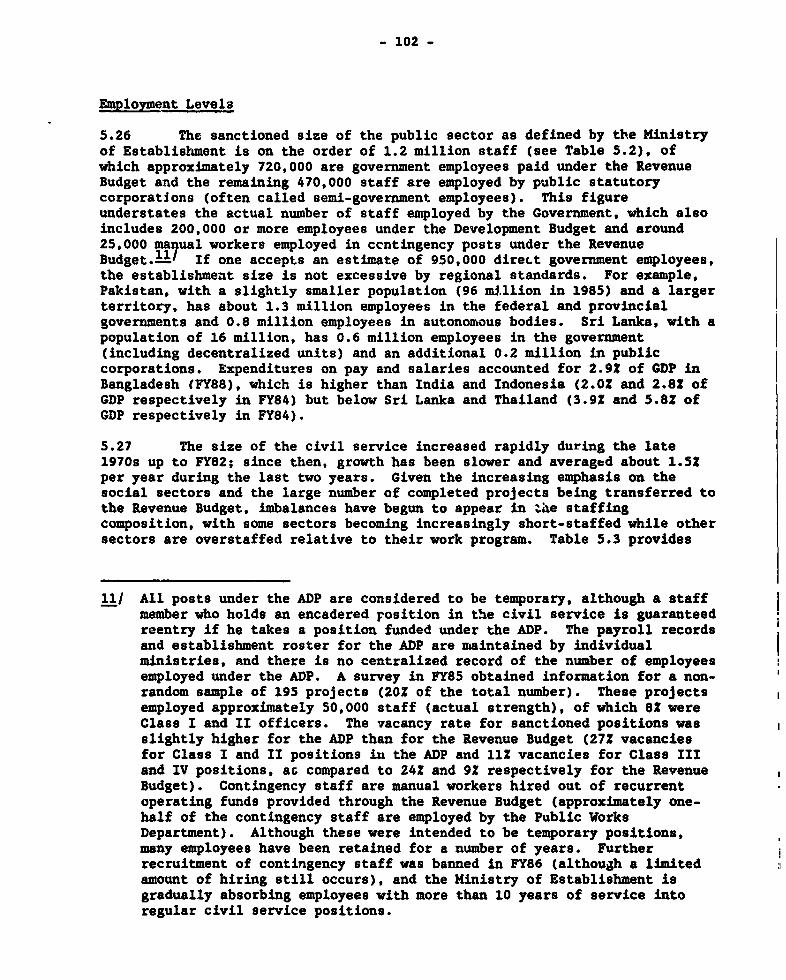
- 102 -
Emploympnt Levels
5.26 The sanctioned size of the public sector as defined by the Ministryof Establishment is on the order of 1.2 million staff (see Table 5.2), ofwhich approximately 720,000 are government employees paid under the RevenueBudget and the remaining 470,000 staff are employed by public statutorycorporations (often called semi-government employees). This figureunderstates the actual number of staff employed by the Government, which alsoincludes 200,000 or more employees under the Development Budget and around25,000 man)ual workers employed in ccntingency posts under the RevenueBudget.ll1 If one accepts an estimate of 950,000 direct government employees,the establishment size is not excessive by regional standards. For example,Pakistan, with a slightly smaller population (96 million in 1985) and a largerterritory, has about 1.3 million employees in the federal and provincialgovernments and 0.8 million employees in autonomous bodies. Sri Lanka, with apopulation of 16 million, has 0.6 million employees in the government(including decentralized units) and an additional 0.2 million in publiccorporations. Expenditures on pay and salaries accounted for 2.92 of GDP inBangladesh (FY88), which is higher than India and Indonesia (2.02 and 2.8? ofGDP respectively in FY84) but below Sri Lanka and Thailand (3.9Z and 5.8Z ofGDP respectively in FY84).
5.27 The size of the civil service increased rapidly during the late1970s up to FY82; since then, growth has been slower and averaged about 1.52per year during the last two years. Given the increasing emphasis on thesocial sectors and the large number of completed projects being transferred tothe Revenue Budget, imbalances have begun to appear in .Ae staffingcomposition, with some sectors becoming increasingly short-staffed while othersectors are overstaffed relative to their work program. Table 5.3 provides
11/ All posts under the ADP are considered to be temporary, although a staffmember who holds an encadered position in the civil service is guaranteedreentry if he takes a position funded under the ADP. The payroll recordsand establishment roster for the ADP are maintained by individualministries, and there is no centralized record of the number of employeesemployed under the ADP. A survey in FY85 obtained information for a non-random sample of 195 projects (20? of the total number). These projectsemployed approximately 50,000 staff (actual strength), of which 82 wereClass I and II officers. The vacancy rate for sanctioned positions wasslightly higher for the ADP than for the Revenue Budget (272 vacanciesfor Class I and II positions in the ADP and 11 vacancies for Class IIIand IV positions, as compared to 24? and 9S respectively for the RevenueBudget). Contingency staff are manual workers hired out of recurrentoperating funds provided through the Revenue Budget (approximately one-half of the contingency staff are employed by the Public WorksDepartment). Although these were intended to be temporary positions,many employees have been retained for a number of years. Furtherrecruitment of contingency staff was banned in FY86 (although a limitedamount of hiring still occurs), and the Ministry of Establishment isgradually absorbing employees with more than 10 years of service intoregular civil service positions.
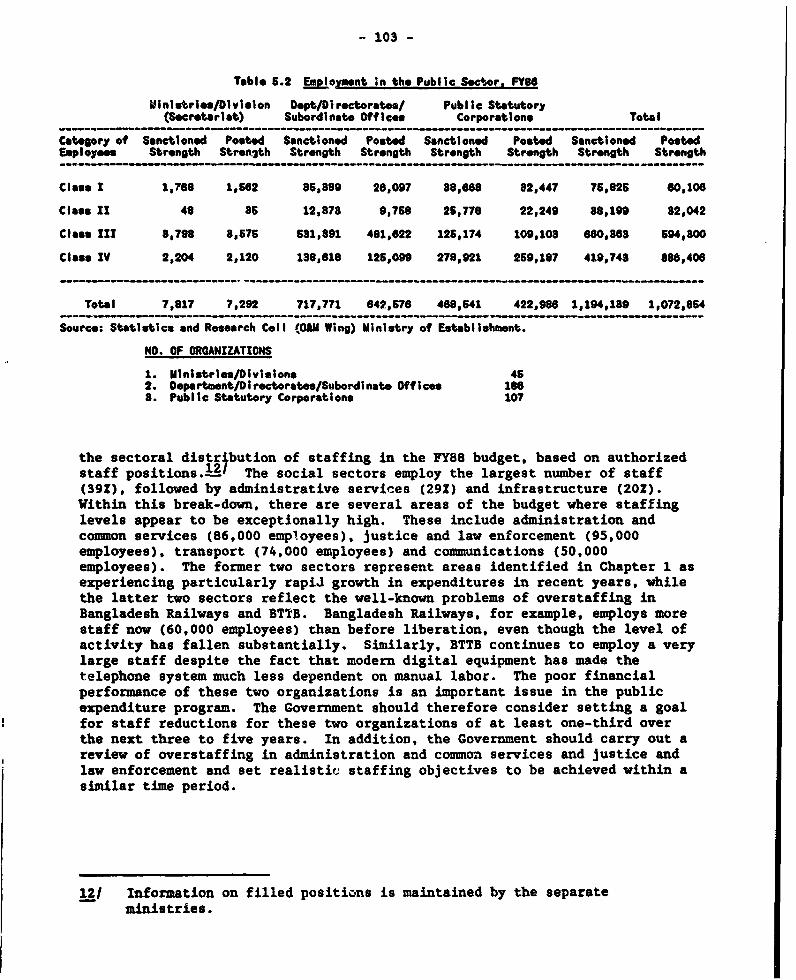
- 103 -
Table 6.2 Employsnt In the Public Sector. FY86
Min1striee/Divieion DOpt/Directorate./ Public Statutory(Secretariat) Subordinate Offices Corporations Total
Category of Sanctioned Posted Sanctioned Posted Sanctioned Posted Sanctioned PostedEaployas Strength Stren.1th Strength Strength Strength Strength Strength Strength
_______________ ~- - -- - - - -- - - - -__ _ _ _ _ _ _ _ _ ___ _ _ _ _ _ _ _ _ -___ __ ___ __ ___ __ ___ __
Closs T 1,768 1,642 85,589 28,097 88,688 82,447 76,626 60,106
Class II 48 86 12,878 9,768 25,778 22,249 88,199 82,042
Class III 8,798 8,676 581,891 481,022 126,174 109,103 660,868 594,800
Class IV 2,204 2,120 138,618 126,099 278,921 269,187 419,743 886,406
Total 7,817 7,292 717,771 642,676 468,641 422,986 1,194,189 1,072,854
Source: Statistics and Resoarch Cell (OM Wing) Ministry of Establishment.
NO. OF ORGANIZATIONS
1. Ministries/Divisions 462. Department/Directorates/Subordinato Offices 1868. Public Statutory Corporations 107
the sectoral distr4bution of staffing in the FY88 budget, based on authorizedstaff positions.12 The social sectors employ the largest number of staff(39Z), followed by administrative services (291) and infrastructure (202).Within this break-down, there are several areas of the budget where staffinglevels appear to be exceptionally high. These include administration andcommon services (86,000 employees), justice and law enforcement (95,000employees), transport (74,000 employees) and communications (50,000employees). The former two sectors represent areas identified in Chapter 1 asexperiencing particularly rapid growth in expenditures in recent years, whilethe latter two sectors reflect the well-known problems of overstaffing inBangladesh Railways and BTTB. Bangladesh Railways, for example, employs morestaff now (60,000 employees) than before liberation, even though the level ofactivity has fallen substantially. Similarly, BTTB continues to employ a verylarge staff despite the fact that modern digital equipment has made thetelephone system much less dependent on manual labor. The poor financialperformance of these two organizations is an important issue in the publicexpenditure program. The Government should therefore consider setting a goalfor staff reductions for these two organizations of at least one-third overthe next three to five years. In addition, the Government should carry out areview of overstaffing in administration and common services and justice andlaw enforcement and set realistic; staffing objectives to be achieved within asimilar time period.
12/ Information on filled positions is maintained by the separateministries.
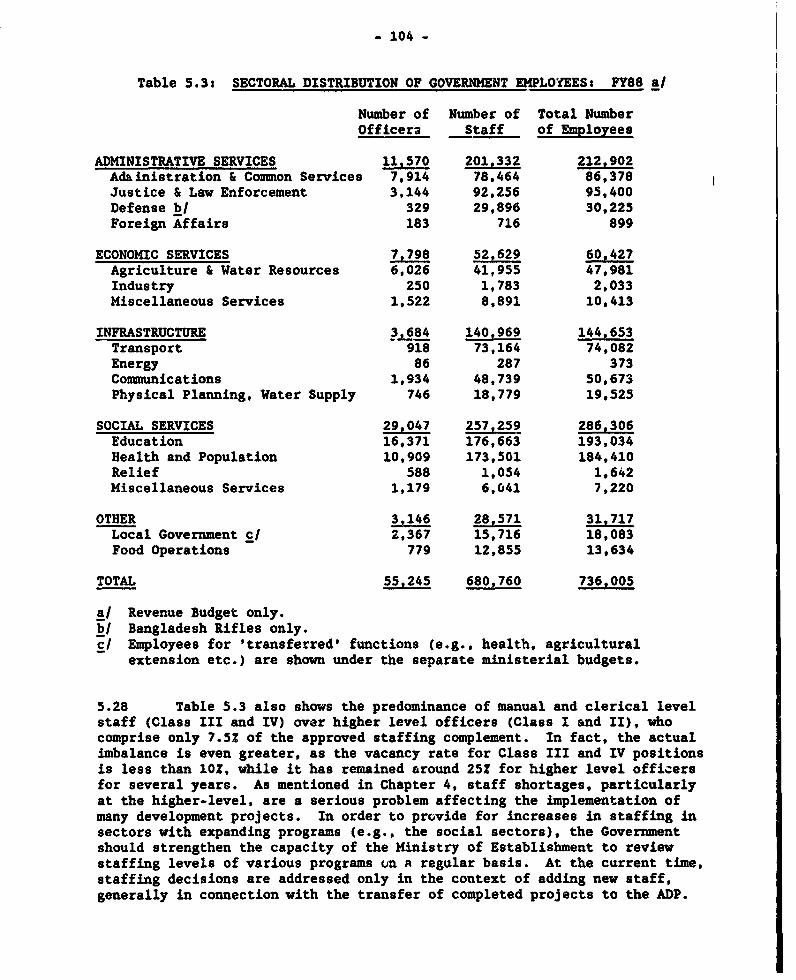
- 104 -
Table 5.3: SECTORAL DISTRIBUTION OF GOVERNMENT EMPLOYEES: FY88 a/
Number of Number of Total NumberOfficera Staff of Employees
ADMINISTRATIVE SERVICES 11,570 201,332 212,902Aduinistration & Common Services 7,914 78,464 86,378Justice & Law Enforcement 3.144 92,256 95,400Defense b/ 329 29,896 30,225Foreign Affairs 183 716 899
ECONOMIC SERVICES 7,798 52,629 60,427Agriculture & Water Resources 6,026 41,955 47,981Industry 250 1,783 2,033Miscellaneous Services 1,522 8,891 10,413
INFRASTRUCTURE 3,84 140,969 144,653Transport 918 73,164 74,082Energy 86 287 373Communications 1,934 48,739 50,673Physical Planning, Water Supply 746 18,779 19,525
SOCIAL SERVICES 29.047 257,259 286,306Education 16,371 176,663 193,034Health and Population 10,909 173,501 184,410Relief 588 1,054 1,642Miscellaneous Services 1,179 6,041 7,220
OTHER 3,146 28,571 31,717Local Government c/ 2,367 15,716 18,083Food Operations 779 12,855 13,634
TOTAL 55,245 680,760 736,005
a/ Revenue Budget only.b/ Bangladesh Rifles only.c/ Employees for 'transferred' functions (e.g., health, agricultural
extension etc.) are shown under the separate ministerial budgets.
5.28 Table 5.3 also shows the predominance of manual and clerical levelstaff (Class III and IV) over higher level officers (Class I and II), whocomprise only 7.5? of the approved staffing complement. In fact, the actualimbalance is even greater, as the vacancy rate for Class III and IV positionsis less than 10?, while it has remained around 25? for higher level officersfor several years. As mentioned in Chapter 4, staff shortages, particularlyat the higher-level, are a serious problem affecting the implementation ofmany development projects. In order to provide for increases in staffing insectors with expanding programs (e.g., the social sectors), the Governmentshould strengthen the capacity of the Ministry of Establishment to reviewstaffing levels of various programs un a regular basis. At the current time,staffing decisions are addressed only in the context of adding new staff,generally in connection with the transfer of completed projects to the ADP.
- 105 -
Little or no attention is devoted to a systematic review of staffing patternsand identifying positions that need to be expanded or contracted to meetchanging work patterns. Moreover, although Class I and II officers aretransferred at regular intervals within the civil service, there is much lessflexibility in transferring Class III and IV staff in order to correctimbalances in staffing requirements. Over time, it should be possible toresolve many of the problems in staffing 4mbalances for lower level staffwithout having to declare redundancies. 3 ' This will require greaterflexibility in redeployment decisions, however, and a continuous review ofstaffing requirements. In view of the large imbalance between officers andstaff, the Government should continue to restrict the recruitment of Class IIIand IV staff, while it should consider easing restrictions on the recruitmentof Class I officers in order to bring down the very high vacancy rate.14/
Compensation Policy
5.29 The compensation package for government employees is established bynational pay commissions which are set up on an ad hoc basis at 4-8 yearintervals. There have been three such commissions since independence, in1973, 1977 and 1985. The current salary structure, which was established in1985 and referred to as the Modified New Scale (MNS), doubled the rate ofbasic pay, provided some enhancements in cash allowances, and consolidated thesalary structure into 20 basic grades. In between pay commissions, cashallowances are used to compensate for increases in the cost of living. Forexample, the dearness allowance has been used on a number of occasions toprovide cost of living increases, while the festival allowance has been usedfor this purpose during the past three years. Although this system appearscumbersome, it avoids frequent increases in the basic salary structure, whichwould affect a number of other benefits (especially pension rights) which arelinked to the basic salary structure.
5.30 Estimates of the level of cash compensation, including the value ofall cash allowances, are summarized in Table 5.4 for the period FY78-88 for
13/ This does not address the important problem of skill requirements.Clearly the demand for additional trained teachers cannot be solved bytransfers of clerical workers. However, in many cases, existing in-service training or supplementary training programs may be sufficient toresolve many problems of skill mismatches.
14/ In the longer run, the Government should consider measures to reduce theimbalance in staffing ratios by encouraging early retirement of ClassIII and IV staff and turning various low-level functions (e.g., officecleaning) over to private contractors.
- 106 -
several benchmark positions.151 These data illustrate the twin problems ofdeterioration in real compensation levels and compression of the wage scalethat have been a general characteristic of the government's compensationpolicy since independence. For example, between FY78-83, the compensationlevel for Class I and II officers fell by 30-35X in real terms, while thecompensation level for Class III and IV staff fell by only 19-232 becauseinterim wage adjustments tended to benefit lower grade staff proportionatelymore. As a result, the ratio of highest to lowest compensation levels fellfrom 8.7 in FY78 to 7.0 in FY83. These trends led to growing problems ofmorale in the civil service and a declining ability to attract qualifiedapplicants. Accordingly, the 1985 Pay Commission took as its basic mandatethe need to restore compensation levels to at least their FY78 position. Thiswas achieved for Class I and II officers, but no additional increment wasprovided to compensate for lost income in the interim years or to reflectgeneral increases in per-capita incomes. For Class III and IV staff, the 1985Pay Commission took a somewhat different approach. The bottom salary for thelowest grade staff was established with reference to a defined poverty levelon the grounds that all government staff should earn at least a minimum livingwage. This raised the lowest salary level by almost 40? above the level thathad been established in FY78 in real terms. Moreover, the Pay Commissionretained the previous rate of salary progression for all Class III and IVstaff above the minimum level, so that all lower level staff enjoyed asubstantial increase in real compensation above the FY78 level.
5.31 While one can appreciate the Commission's concern to introduce apoverty threshold into the government compensation scale, an alternateapproach would have reduced the rate of pay progression above the minimum
15/ As in most former British colonies, the salary structure is based on alarge number of cash and in-kind allowances. The major cash allowancesincluded in this analysis are: basic salary level, dearness allowance,house rent allowance (which ranges from 35-55Z of basic pay depending onsalary grade and location), medical allowance (which has shifted from areimbursement system to a flat allowance of Tk 100/month), festivalallowance (introduced i-: June 1984 and timed to religious festivals),rest and recreation allowance (one month's basic pay every three years),conveyance allowance (for Class III and IV staff in major cities),compensatory allowance (abolished in June 1985), transport allowance(for non-gazetted and Class IV employees), domestic aid allowance (forSecretaries), entertainment allowance (for Joint Secretaries and above),and other miscellaneous allowvnces (which cover a wide variety ofemployees such as the armed forces, Post Office employees, BangladeshRailways, etc.). A final set of allowances (daily allowance and travelallowance) are used to compensate government employees traveling onofficial business and should logically be included in recurrentoperating expenditures. In certain cases (e.g., agricultural extensionstaff), the travel allowances are paid as salary supplemeats forconvenience reasons. While the Government will probably Yish to keepsome of the allowances for historical and convenience reasons (such asbasic salary and dearness and festival allowances), it would bedesirable for simplicity and clarity reasons to merge the remaining onesinto the basic salary scale during the next pay commission review.
- 107 -
level or compressed the number of salary scales in order to limit the impacton the budget. The public sector pay scales would have still have been quiteattractive for most Class III and IV positions, as the Government has nodifficulty in filling the available positions. The 1985 compensation awardshad a major impact on the budget because pay increases were skewed so heavilyin favor of the large number of lower grade employees. In addition, thecompression of the civil service pay scale increased significantly, with thecompensation ratio between highest and lowest levels falling to 6.4. Althoughthere are no specific guidelines for a desirable level of progression insalary scales, experience from other countries indicates that a compensationratio below 8 is generally undesirable, while a compensation ratio below 6 canindicate serious imbalances in the salary structure and problems of decliningproductivity and malpractices and difficulty in attracting and retaininghighly qualified staff.
5.32 Since the Pay Commission awards in FY85, compensation levels haveagain fallen in real terms, despite various adjustments such as the extensionof festival allowances. The deterioration in real compensation has been onthe order of 8-10Z (as of FY88) for Class I and I- officers and 13-15Z forClass III and IV staff. While Class I and II officers have fallen below theFY78 compensation levels in real terms, Class III and IV staff still remainsubstantially above the FY78 levels. This pattern of prolonged deteriorationin the wage structure can have a serious adverse effect on morale, as well asbuilding in unnecessarily sharp shocks for the budget when the compensationstructure is adjusted. It would be desirable for the Government to approachcompensation policies in a more systematic fashion. In the immediate future,the Government should review the compensation levels for Class I and IIofficers and consider salary adjustments to offset the deterioration in realwages that has occurred since 1985. These adjustments should be delinked fromthe compensation structure for Class III and IV staff, which is stillsignificantly above the FY78 level in real terms.16 In the medium term, theGovernment may wish to maintain a greater degree of progression in thecompensation structure between highest and lowest grade employees in order toattract and motivate qualified personnel. Civil servants should also beallowed to benefit from the overall growth of per-capita incomes over time.In this regard, the Government should consider holding pay commission reviewsat more regular intervals (say every five years). In the interim years, theMinistry of Establishment should be strengthened to make recommendations tothe Government on appropriate annual increases, rather than -che ad hocdecisions that characterize the current process. An important issue thatneeds more analysis is the choice of an appropriate index for determiningpublic sector pay adjustments in the period between national pay commissionreviews. International experience indicates that a simple index based on theconsumer price index should not be used, as it can help embed inflationaryexpectations into the economy. This is particularly important in Bangladeshwhere public sector pay decisions have a very strong influence as a leadindicator. An alternative formula based on changes in per capita consumption
16/ This recommendation would be politically and socially difficult for theGovernment to implement during a period of stagnant economic growth, andit may have to be phased in gradually as economic performance improves.
- 108 -
levels or another objective criterion needs to be considered for possibleadoption in the future.
Table 5.4: Trends in Nominal and Real Cash Compensation a/(Taka per month)
Salary Scale FY78 FY83 FY86 FY88
MNS1 (Secretary)Nominal compensation 3780 4293 9000 10070Real compensation 2011 1305 2027 1865Index of real compensation (FY78=100) 100 65 101 93
MNS5 (Deputy Secretary)Nominal compensation 2743 3232 6423 7001Real compensation 1459 982 1447 1296Index of real compensation (FY78-100) 100 67 99 89
MNS9 (Assistant Secretary)Nominal compensation 1490 1851 3681 4012Real compensation 793 563 829 743Index of real compensation (FY78=100) 100 71 104 94
MNS15Nominal compensation 672 890 1993 2156Real compensation 384 296 496 438Index of real compensation (FY78=100) 100 77 129 114
MNS20Nominal compensation 405 559 1270 1366Real compensation 231 186 316 278Index of real compensation (FY78=100) 100 81 137 120
Ratio: MNS1/MNS9Nominal compensation 2.5 2.3 2.4 2.5Real compensation 2.5 2.3 2.4 2.5
Ratios MNS1/MNS20Nominal compensation 9.3 7.7 7.1 7.4Real compensation 8.7 7.0 6.4 6.7
a/ The cost of living indices used for deflating nominal compensation are theconsumer price index for middle income families in Dhaka, Chittagong andKhulna for MNS1, 5 and 9; the deflator used for MNS15 and 20 is theconsumer price index for non-gazetted government employees in Dhaka.
- 109 -
Fringe Benefits
5.33 Fringe benefits, or benefits in-kind, can have a major impact oneffective compensation levels and the implied progression of the salarystructure. The major in-kind benefits are access to public housing, provisionof a government vehicle for private use, use of an official telephone at home,access to subsidized medical facilities at government hospitals, and access tosubsidized food under PFDS. Other benefits that will not be discussed hereinclude the leave entitlement, dccess to subsidized loans for house construc-tion and vehicle purchase, and various retirement, death and disabilitybenefits.
5.34 In order to analyze fringe benefits, it is necessary to make anapproximate valuation of them in monetary terms. Based on the current cost cfconstruction, the subsidy on public housing is estimated to vary from Tk7600/month for MNS1 positions to Tk 2000/month for MNS20 positions.17/ Foremployees who have access to housing, this represents a subsidy of about 125?of basic pay (equivalent to 315X of the house rent allowance) for the MNS1level, and a subsidy of 295? of basic pay (or 5352 of house rent allowance) atthe MNS20 level. The subsidy for private use of an official vehicle is esti-mated at about Tk 4800/month, which represents 80-94? of the basic pay ofemployees entitled to this benefit.181 The use of an official telephone inthe residence is supposed to be subject to a monthly ceiling of Tk 350-550 formost officials {this was recently raised), but in practice the ceiling isnever enforced.191 The subsidy on rations distributed through the essentialpriority (EP) category of the PFDS (available to the armed forces and selectedother groups) is about 80? for foodgrains and 60? for edible oil as comparedto the ration price and is even higher in comparison to the cost ofprocurement. Subsidies for government employees under the 'other priority,(OP) category of PFDS have been reduced considerably in recent years and arecurrently about 4?; the Government has indicated its intention to remove allsubsidies for the OP category during FY90.
5.35 Table 5.5 provides estimates of total compensation levels, includingboth cash and in-kind benefits, for the benchmark positions. These estimatesare indicated as a range, with the lower end of the range representing theeffective compensation level received by employees who are provided with houserent allowance, while the upper end represents compensation for employees withaccess to subsidized housing. These estimates illustrate some importantcharacteristicfs of the current compensation structure. First of all, thetotal compensation of employees in a given salary scale can vary considerably,depending on whether or not they have access to public housing, with themaximum-to-minimum ratio within a salary grade varying from 133? at the upper
17/ This is a conservative valuation, as it does not include the cost ofland, which is at a premium in Dhaka.
18/ Officers at the rank of Joint Secretary and above are entitled to anautomobile.
19/ Officers at the rank of Deputy Secretary and above are entitled to aresidential telephone.
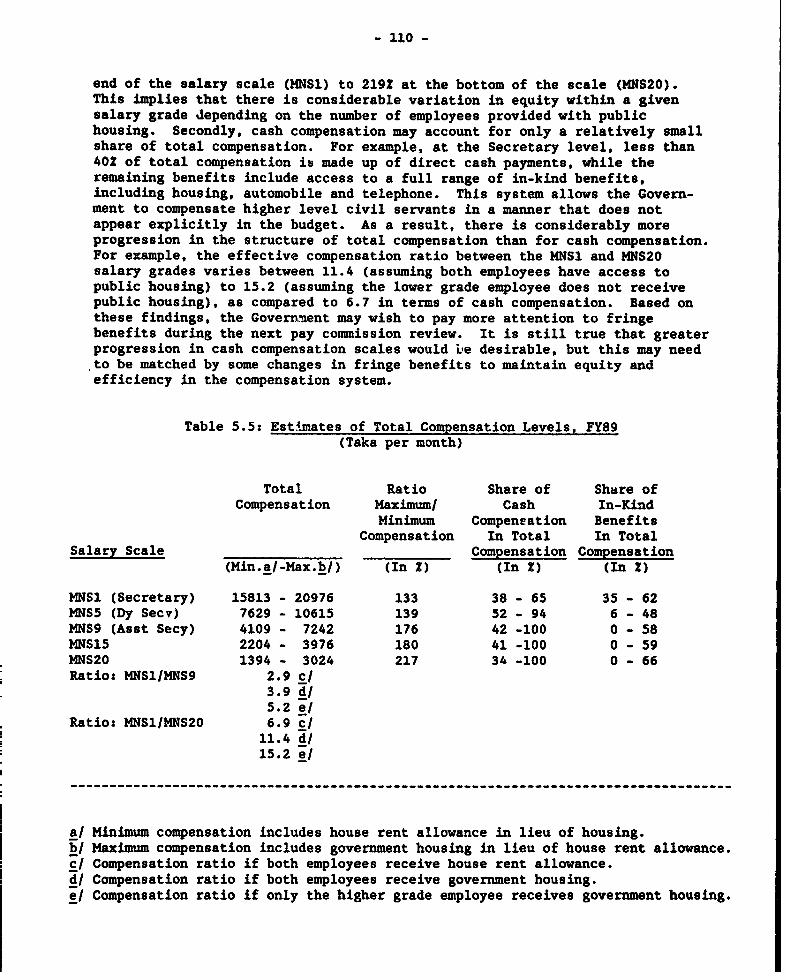
- 110 -
end of the salary scale (MNS1) to 2192 at the bottom of the scale (MNS20).This implies that there is considerable variation in equity within a givensalary grade depending on the number of employees provided with publichousing. Secondly, cash compensation may account for only a relatively smallshare of total compensation. For example, at the Secretary level, less than402 of total compensation is made up of direct cash payments, while theremaining benefits include access to a full range of in-kind benefits,including housing, automobile and telephone. This system allows the Govern-ment to compensate higher level civil servants in a manner that does notappear explicitly in the budget. As a result, there is considerably moreprogression in the structure of total compensation than for cash compensation.For example, the effective compensation ratio between the MNS1 and MNS20salary grades varies between 11.4 (assuming both employees have access topublic housing) to 15.2 (assuming the lower grade employee does not receivepublic housing), as compared to 6.7 in terms of cash compensation. Based onthese findings, the Govermnent may wish to pay more attention to fringebenefits during the next pay commission review. It is still true that greaterprogression in cash compensation scales would be desirable, but this may needto be matched by some changes in fringe benefits to maintain equity andefficiency in the compensation system.
Table 5.5: Estimates of Total Compensation Levels, FY89(Taka per month)
Total Ratio Share of Share ofCompensation Maximum/ Cash In-Kind
Minimum Compeneation BenefitsCompensation In Total In Total
Salary Scale Compensation Compensation(Min.a/-Max.b/) (In Z) (In Z) (In 2)
MNSI (Secretary) 15813 - 20976 133 38 - 65 35 - 62MNS5 (Dy Secv) 7629 - 10615 139 52 - 94 6 - 48MNS9 (Asst Secy) 4109 - 7242 176 42 -100 0 - 58MNS15 2204 - 3976 180 41 -100 0 - 59MNS20 1394 - 3024 217 34 -100 0 - 66Ratio: MNSl/MNS9 2.9 c/
3.9 d/5.2 e/
Ratio: MNS1/MNS20 6.9 c/11.4 d/15.2 e/
a/ Minimum compensation includes house rent allowance in lieu of housing.b/ Maximum compensation includes government housing in lieu of house rent allowance.c/ Compensation ratio if both employees receive house rent allowance.d/ Compensation ratio if both employees receive government housing.et Compensation ratio if only the higher grade employee receives government housing.
- ill -
5.36 Based on the amount of housing carried on various registers, it isvery roughly estimated that about 1O of civil serrants resident in Dhaka haveaccess to subsidized housing. There are no similar estimates available forother cities or for rural areas. Access to public housing in Dhaka appears tobe distributed across the entire salary scale, although the availability ofhousing improves higher up the salary scale. In addition, there are discre-pancies between departments, with some agencies (such as Bangladesh Railways,Bangladesh Telephone and Telegraph Board and the Post Office) using theiraccess to investment resources to provide their employees with housing on apreferential basis. Besides the equity aspects of public housing, there areseveral other reasons why the Government should be concerned about the currentsituation. The first is the impact on mobility. The original rationale forpublic housing was to enable the Government to transfer civil servants asneeded. However, when civil servants have access to highly subsidized housingin Dhaka, they will resist assignments that might curtail the loss of thisbenefit. Indeed, even civil servants that do not have subsidized housing mayresist transfers outside Dhaka if they feel such a move will jeopardize theirchance for subsidized housing. A second problem arising from public housingis the inevitable problem of patronage and favoritism. A third problem is thecontinued pressure on the Government to build additional public housing, whichis an inefficient use of scarce local resources.20/ Another problem withpublic housing is the persistent I-ck of maintenance, which could be bettermanaged by the existing tenants. Finally, there is the consideration ofrevenues, as the Government could realize a substantial return by renting thestock of public housing at a rate which is closer to market rents. Theseconsiderations imply the following recommendationss
(i) The Government should stop construction of new public housing withinthe boundaries of municipal areas and pourashavas. Outside urbanareas, construction of new housing should be lizited to the mostessential purposes.
(ii) Housing rents should be raised in conjunction with increases in cashcompensation to a level which approximates economic rentals. Inorder to accomplish this, the Government should consider merging thehouse rent allowance and the dearness allowance and raising rents ongovernment housing whenever the combined dearness allowance isadjusted for increases in the cost of living (say on the basis of 50Zof the change in the dearness allowance). Over a period of five toten years, this would go a considerable distance toward reducingthe relative benefit of access to subsidized housing.21/
20/ The guidelines for new housing construction by PWD call for spaceallocations that are quite generous in comparison to existing housingconditions in urban areas.
21/ This process will have to be recognized by adjustments in salarypayments at periodic intervals, as the objective is not to reduce thecompensation of higher level employees but rather to introduce agreater degree of equity and efficiency into the overall compensationsystem.
- 112 -
(iii) The Government should investigate the possibility of disposing ofpart of its housing stock within urban areas to existing tenants orother eligible employees at cost recovery prices in order to relieveitself of the maintenance burden.
5.37 Changes in housing benefits will inevitably require a considerabletime period to implement because of the sensitivity of the subject. Incontrast, the Government should consider changes in automobile and telephonebenefits that can be implemented quite quickly. It is estimated that up to700 civil servants (excluding the armed forces and the autonomous bodies) areprovided with a government car, while provision of a telephone in theresidence may include at least 5000 employees. Both of these benefits wereintroduced when cars and telephones were uncommon, but this situation nolonger applies. In both cases, the Government could replace the benefits witha cash allowance that would be less costly to the budget. It is thereforerecommended that provision of a government car should be restricted to themost senior government officials. In the case of a telephone, access to aconnection is the major benefit (these are currently in short supply), and theGovernment should consider abolishing the payment of monthly charges in orderto provide greater incentives for efficient use. In both cases, theGovernment should provide a one-time adjustment in cash compensation in lieuof in-kind benefits.
Summary
5.38 This discussion has focused on some of the more obvious features ofthe current structure of public sector compensation and employment. However,the conclusions from this analysis are quite important in terms of the long-term prospects for the public expenditure program. As in many developingcountries, the government's compensation policies have been dictated more byshort-term financial and political considerations than by long-term objectivesfor developing an efficient and motivated body of civil servants to implementpublic programs. Past compensation awards, which increased the compression ofthe salary structure and placed a heavy burden on the budget because of theirskew toward the lower grades, have been inefficient and failed to address theserious problem of high vacancy rates for Class I officers. The Governmentshould therefore consider the possibility of reforms in the compensationsystem in order to meet its long-term personnel requirements. A review of thecompensation system for Class I officers is supposed to be undertaken as partof a proposed Public Administration Efficiency Study. Although the TAPP forthis study was approved in February 1988, the consultants have still not beenselected. The Government may wish to expedite this study in order to providea basis for revising the compensation system as part of the next national paycommission deliberations.
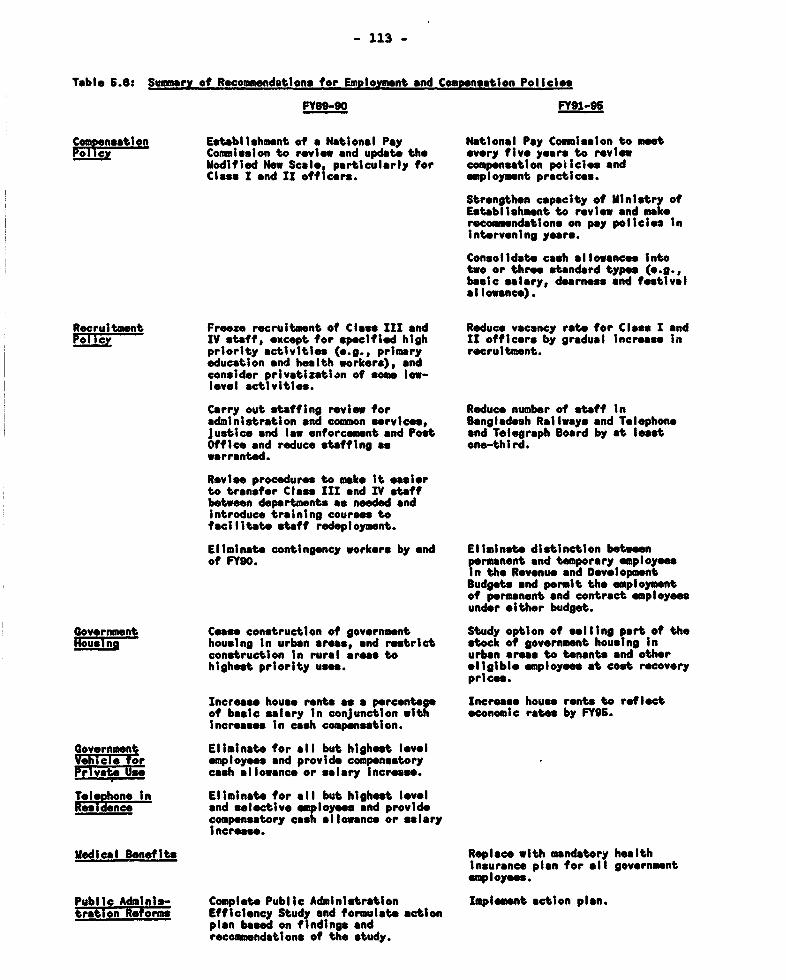
- 113 -
Table 6.6: Summary ot Recommendations for Employment and Compensation Policles
FY89-90 FY91-96
i Comgnensnton Establishment of a National Pay Natlontl Pay Commission to meetPo,li Commission to review and update tho every five yoars to review
Modified New Scale, porticularly for compensation poilctes ondClass I and II officers. employment practices.
Strengthen capacity of Ministry ofEstablishment to review and makerecomm ndations on pay policies InIntervening yers.
Consolidate cash allowances intotwo or three standard types (e.g.,basie salary, dearness and festivalallowance).
Recruitment Freeze recruitment of Class III and Reduce vacancy rate for Closs I andPot ic- IV staff, except for specified high II officers by gradual Increase in
priority activities (e.g., primary recruitment.education and health workers), andconsider privstizatien of some low-level activities.
Carry out staffing review for Reduce number of staff Inadministration and common services, Bangladesh Railways and Telephonejustice and low enforcement and Post and Telegraph Board by at leastOffice and reduce staffing as one-thIrd.warranted.
Revise procedures to make It eoaierto transfer Class III and IV staffbetween departments as needed andintroduce training courses tofacilitate staff redeployment.
Eliminate contingency workers by end Eliminato distinction betweenof FY90. permanent and temporary employee
In the Revenue and DevelopmentBudgets and permit the employmentof permanent and contract employeesunder either budget.
Government Cease construction of government Study option of selling part of theHousing housing in urban areas, and restrict stock of govornment housing in
construction In rural areas to urban areas to tenante and otherhighest priority uses, *eIgible employees at cost recovery
prices.
Incress house rents as a percentage Incr4ase house rents to reflectof basic salary In conjunction with economic rates by FY95.Increases In cash compensation.
Government Eliminate for all but highest levelVehicle for employes and provide compensatory
cash allowance or salary increaso.
Telephone In Eliminate for all but highest levelResidence and selective employsee and provide
compensatory cash allowance or salaryIncrease.
Medical Benefits Replace with mandatory healthInsurance plan for all governmentemployee.
Public Adminis- Complote Public Administration Implement action plan.tratlon Reforms Efficiency Study and formulate action
pin based on findings andrecommendations of the study.
PART II
SECTORAFL EXPENDITURE PROGRA4MS
Note: The following chapters stummarize information on the expenditure programin a number of sectors that was used to develop the recommendations for publicexpenditure reform that are contained. in this report. The focus of thediscussion is on the cost-effectiveness and future expenditure prospects forcurrent and potential public programs; therefore, Issues of developmentstrategy and sectoral policy reform receive relatively less attention exceptas they relate to matters of public expenditure reform. While every efforthas been made to verify the accuracy and consistency of the analysis in thissection, the broad coverage of the report has made it impossible to discussthe full range of issues affecting each program. In several sectors,additional analysis will be required before the Government can decide onchanges in public expenditure priorities. The proposals presented here shouldtherefore be regarded as suggestions for possible changes, rather than as firmrecommendations for the restructuring of the public expenditure program.
- 115 -
Chapter VI
Agriculture and Water Resources
6.1 Acceleration of the agricultural growth rate is the single mostimportant requirement for achieving a higher rate of economic growth. Asindicated in Table 6.1, growth in the agricultural sector fell to an averagelevel of 2.2Z during FY82-87 due to stagnation in the growth of foodgrainproduction. The macroeconomic scenario discussed in Chapter 2 indicates thatan increase in the agricultural growth rate to about 3.5-4.02 per year will benecessary to sustain a higher rate of growth in the rest of the economy.Experience in Bangladesh and other countries demonstrates that achieving suchan increase in agricultural growth is difficult but technologically feasiblein the context of a realistic set of agricultural policies. Publicexpenditures can play an important complementary role in achieving thisincrease, but public programs will only be effective in an environment thatprovides adequate incentives for farmers to increase production and encouragesprivate investment in agricultural activities.
6.2 In the crop sub-sector where 752 of agricultural value-addedoriginates, better use of water resources through irrigation, flood controland drainage has been the critical factor in determining agricultural growthby making possible the use of HYV crops and chemical fertilizers. It isestimated that 75% of the increase in foodgrain production during the pastdecade has been due to 4ncreased dry season production (boro rice End wheat),which depends primarily on small scale pumped irrigation. The remainingincrease in aman rice production has benefited from improved flood control anddrainage in the wet season, with supplementary irrigation as needed. Thisproduction pattern was encouraged by the rapid spread of small scaleirrigation equipment as part of the Medium Term Foodgrain Production Plan(MTFPP) launched by the Government in 1980. In addition, the MTFPP stressedeconomic liberalization of the agricultural sector with greater reliance onincentive prices and privatization of support services that were previouslycontrolled by public sector agencies, most notably the Bangladesh AgriculturalDevelopment Corporation (BADC).
o.3 Despite the initial success of the MTFPP in achieving a rapidincrease in the iise of agricultural inputs, the actual performance ofagricultural production has been mixed, with rapid increases in foodgrainproduction during the early years of the MTFPP program being offset by aslowdown in the agricultural growth rate since then. The reasons for thispattern have been widely debated, and a number of factors have beenidentified, including variable weather conditions (with several years ofdisastrous flooding), depressed consumer demand, problems in maintainingeffective incentive prices, reductions in sales of minor irrigation equipment,and constraints on agricultural credit. An additional factor which isaddressed in this chapter is the decline in public expenditures for theagricultural sector that occurred during this period.
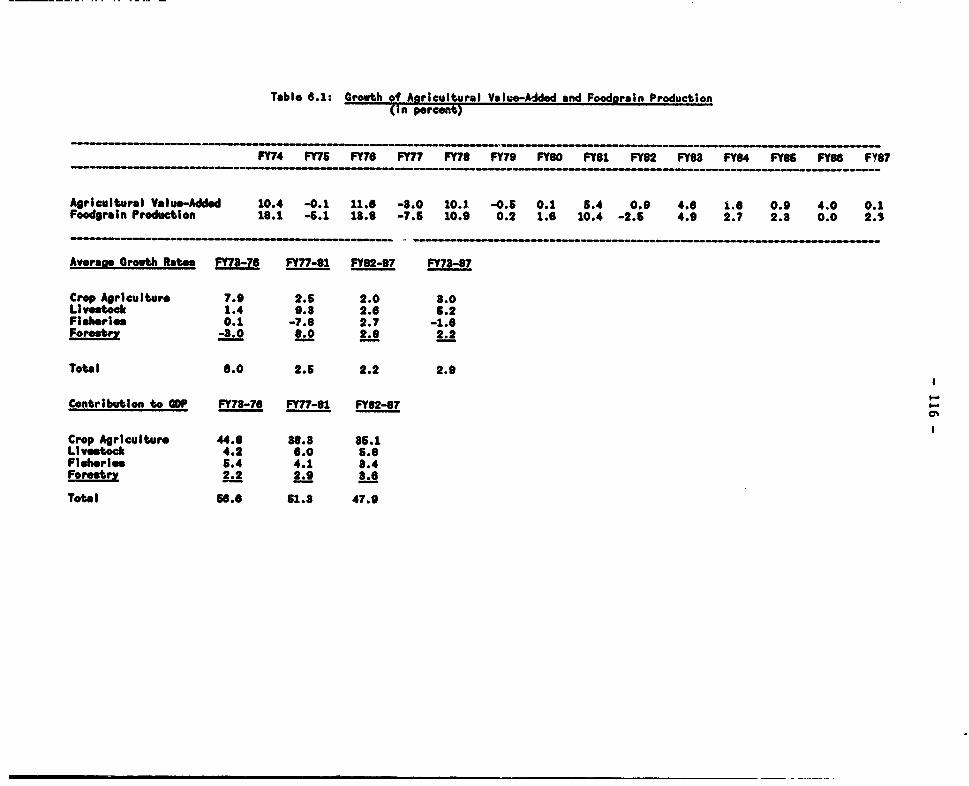
Table 6.1: Growth of A_ricultural Value-Added and Foodnrain Production(in percent)
FY74 FY75 FY76 FY77 FY78 FY79 FY60 FY81 FY82 FY88 FY84 FY86 FY88 FY87
Agricultural Value-Added 10.4 -0.1 11.6 -3.0 10.X -0.6 0.1 5.4 0.9 4.6 1.6 0.9 4.0 0.1Foodgrain Production 18.1 -6.1 18.6 -7.6 10.9 0.2 1.6 10.4 -2.6 4.9 2.7 2.3 0.0 2.1
Averame Growth Rates FY78-76 FY77-81 FY62-87 FY7a-87
Crop Agriculture 7.9 2.5 2.0 8.0Livestock 1.4 9.8 2.6 5.2Fisheries 0.1 -7.6 2.7 -1.6Forestry -8.0 8.0 2.6 2.2
TO" l 6.0 2.5 2.2 2.9
Contribution to GOP FY78-76 FY77-81 FY82-e7
Crop Agriculture 44.8 38.8 35.1Livestock 4.2 6.0 6.6FlherIes 5.4 4.1 8.4Forestry 2.2 2.9 8.6
Total 56.6 51.8 47.9
- 117 -
6.4 One of the conclusions that has emerged from recent experience isthp, most public programs have not yielded the economic returns expected ofthem. The major reasons include slow implementation performance for publicsector programs, failure to maintain completed infrastructure and operate itin an efficient manner, and deficiencies in the support services needed toachieve the full benefits of agricultural projects (such as research andextension services and agricultural credit). In this situation, it would bedifficult to support an increase in public expenditures on agriculturalprograms unless effective steps are taken to improve implementationperformance.
6.5 Flood Rehabilitation. Preliminary estimates of the costs of the1988 flood rehabilitation program by the United Nations include US$133.4million in medium-term improvements for agriculture programs and $126.6million for flood control and irrigation infrastructure (of which $53.8million represents immediate repair costs and $72.8 million represents longer-term requiremAnts). The largest share ($91.2 million) includes expendituresassociated with the government's recent initiative to increase foodgrainproduction to 20.0 million tons by FY92, as compared to 16.5 million tons inFY87 anti 88. This is an ambitious objective, that would imply an averagegrowth rate for foodgrain production of 82 per year between FY89-92. Giventhe presence of persistent implementation constraints, this objective will bedifficult to achieve and may uot be the most cost-effective approach toincrease agricultural production. The second largest share of the proposedflood rehabilitation program includes the construction of ten modern grainsilos at the district level at a cost of $27.2 million. Bangladesh undertooka major program for the construction of food storage facilities in the late1970s and early 1980s. While existing storage capacity appears to be adequatefor normal requirements, additional capacity may be justified if theGovernment adopts an expanded set of objectives for foodstock management. Thefinal components of the flood rehabilitation program include $11.9 million forlivestock programs and $3.1 million for forestry programs.
6.6 With regard to flood control and irrigation infrastructure, thepreliminary estimates of flood damage indicate that about 1,750 km ofembankments, 400 km of canals, 100 km of protective works on river and coastalembankments and 1,200 water control structures will need immediate repair at acost of $53.8 million. Additional financing requirements include $22.2million in repair costs and $50.6 million for upgrading and strengtheningriver and coastal protection works in order to withstand future flooding onthe 1988 scale.
Expenditure Trends in Agriculture
6.7 The introduction of the MTFP' was associated with an importantchange in the government's approach to public expenditures as a means ofstimulating growth in agriculture. Even after eliminating fertilizersubsidies, total expenditures on agricultural services and water resourcedevelopment fell by 272 in real terms over the period FY83-88 and declined in
- 118 -
relative terms from 15.42 to 9.71 of the total budget.l/ A number of factorscontributed to this trend, i4cluding the completion of major projects in waterresources and food storage and reductions in subsidies for minor irrigationequipment. Table 6.2 provides a detailed breakdown of the allocation ofexpenditures in the ADP over the per od FY81-89, representing approximately802 of total sectoral expenditures.I As indicated in this table, majorreductions occurred in FY83 and FY86, corresponding to the years when fiscalstabilization objectives were a primary concern in the budget. Expenditureallocations were reduced by 44Z in real terms between FY81-86 (48Z whenfertilizer subsidies are included), although they have recovered significantlysince then, regaining almost half the ground lost since FY81. The reductionin fertilizer subsidies is often cited as a major factor in this process, butin fact the reduction in fertilizer subsidies accounted for less than 102 ofthe reduction in the agricultural budget between FY81-86. Of greaterimportance was the reduction in allocations for water resource programs,particularly ground water development (reflecting privatization and subsidyreductions, as well as technical and demand constraints on the implementationof public sector programs), which accounted for almost 40X of the reduction inexpenditures. An additional 202 of the reduction in expenditures was due toreduced allocations for the construction of food storage facilities, while theremaining expenditure reductions reflected general restraint in theallocations for other activities. In comparison to FY86, recent budgets haveshown increased expenditures in areas such as surface water development, ruralinfrastructure, crop agriculture services (other than input supply), andtorestry, fisheries and livestock.
1' See Table 1.2 in Chapter 1. This reduction is somewhatoverstated, as it does not include the expansion of FFW and VGDprograms which provide an alternative source of funding for waterprojects, nor does it fully account for the shift of smallerprojects to the upazilas. Nevertheless, in comparison to othersectors, agriculture has experienced one of the sharpestreductions in public funding over this period.
21 The use of budget allocations rather than actual expenditures isfar from satisfactory but is the only available option, givenlimitations on data availability. The Planning Commissionprovides estimates of actual expenditures based on sectors ratherthan individual projects, which would be necessary to derive theexpenditures for major sub-programs. Moreover, there aresystematic errors in the recording of data, particularly involvingdirect payments in foreign exchange by donor agencies. Analternative source of data on project implementation is maintainedby IMED, but the information has not been made available foranalysis by external agencies. Thus, the analysis presented hereshould be interpreted as representing the intentions of theGovernment as indicated by ADP budget allocations, rather than therealization of those intentions as indicated by actualexpenditures.
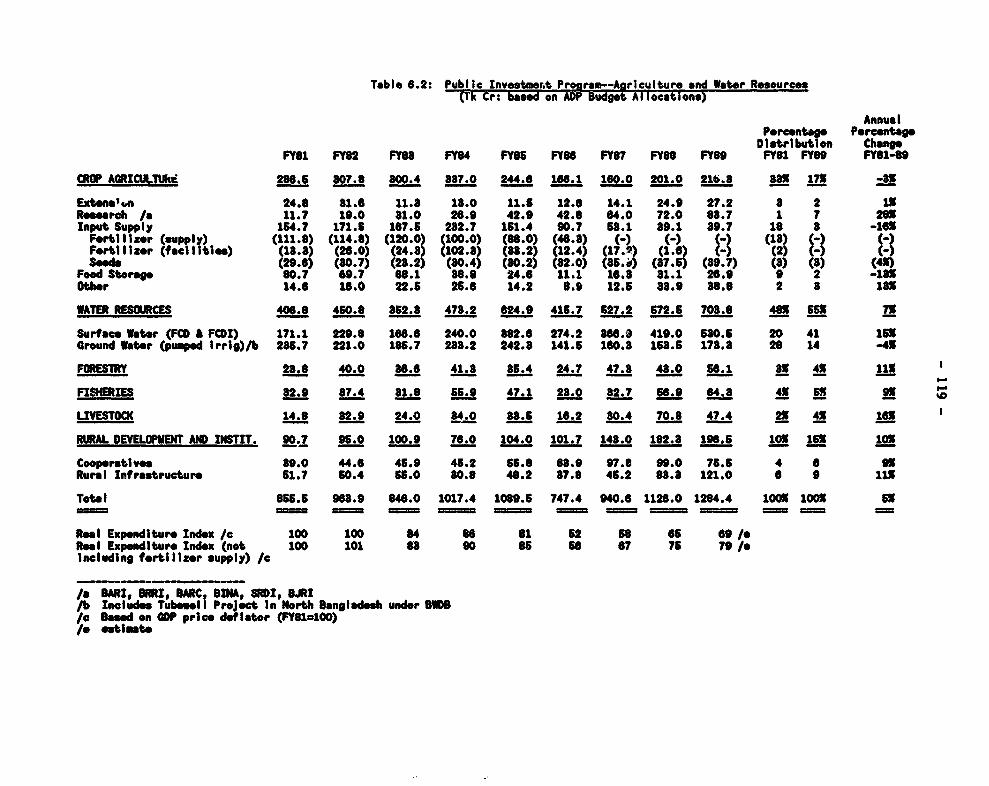
Table 6.2: Public Investmoret Program--Aarieulture and Water Resources(Tk Cr: based on ADP Budget Allocation*)
AnnualPercentage PercentageDistribution Change
FY81 FY82 FY8S FY84 FY86 FY86 FY87 FY88 FY89 FY81 FY89 FY81-9
CROP AO!CULRCtTU 286.6 807.8 800.4 887.0 244.6 166.1 160.0 201.0 216.8 881 171 _38
Exatensn 24.8 81.0 11.8 18.0 11.6 12.6 14.1 24.9 27.2 a 2 1X
Research /a 11.7 19.0 81.0 26.9 42.9 42.8 64.0 72.0 88.7 1 7 28X
Input Supply 164.7 171.6 167.5 282.7 151.4 90.7 68.1 89.1 89.7 18 8 -16X
Fertillixer (spply) (111.8) (114.8) (120.0) (100.0) (88.0) (6.8) ()Fortilizer f*aclitles) (18.8) (26.0) (24.8) (102.8) (U8.2) (12.4) (17. ) (1.6) (2)
Seed (29.6) (80.7) (28.2) (30.4) (80.2) (82.0) (85.i) (87.6) (89.7) (8) (8) (4X)
Food Storae 80.7 69.7 68.1 86.8 24.6 11.1 16.8 81.1 26.9 9 2 -18X
Other 14.6 16.0 22.5 25.8 14.2 8.9 12.5 88.9 38.8 2 8 18X
WATER RESOURCES 406.8 460.8 852.8 478.2 624.9 415.7 627.2 672.5 708.8 4SX 565 7X
Surface Water (FCD & FCDI) 171.1 229.8 166.6 240.0 882.6 274.2 868.0 419.0 580.6 20 41 151
Ground Water (pumped Irrig)/b 285.7 221.0 185.7 288.2 242.8 141.5 160.8 158.5 178.a 28 14 -45
FORESTRY 28.6 40.0 86.6 41.8 85.4 24.7 47.8 48.0 56.1 SS 41 113
FISIERIES 82.9 87.4 81.8 56.9 47.1 23.0 82.7 66.9 64.8 4X 6XW 9
LIVESTOCK 14.8 82.9 24.0 84.0 88.5 16.2 80.4 70.8 47.4 21 4X 16x
RURAL DEVELOPMENT AND INSTIT. 90.7 95.0 100.9 76.0 104.0 101.7 148.0 182.8 196.5 10X 15t 10X
Cooperative 89.0 44.6 45.9 45.2 56.8 68.9 97.8 99.0 76.5 4 6 9X
Rural Infrastructure 51.7 50.4 55.0 80.8 48.2 87.8 45.2 88.8 121.0 6 9 lis
Total 865.6 98e.9 848.0 1017.4 1089.6 747.4 940.6 1126.0 1284.4 1001 100X 5X
_MMM= X;m = = =C = =m = = . = =_= =m
Real Expendlture Index /a 100 100 84 86 81 52 S8 es 69 /o
Real Expendlture Index (not 100 101 68 90 85 se 67 75 79/
lncluding fertilizer supply) Ic
/ ARI, BRRI, ARC BINA, SRDI, BJRI/b Includes Tubewell Project In North Bangladesh under BIDB/c Based on GDP price deflator (FYl100)/e estimte
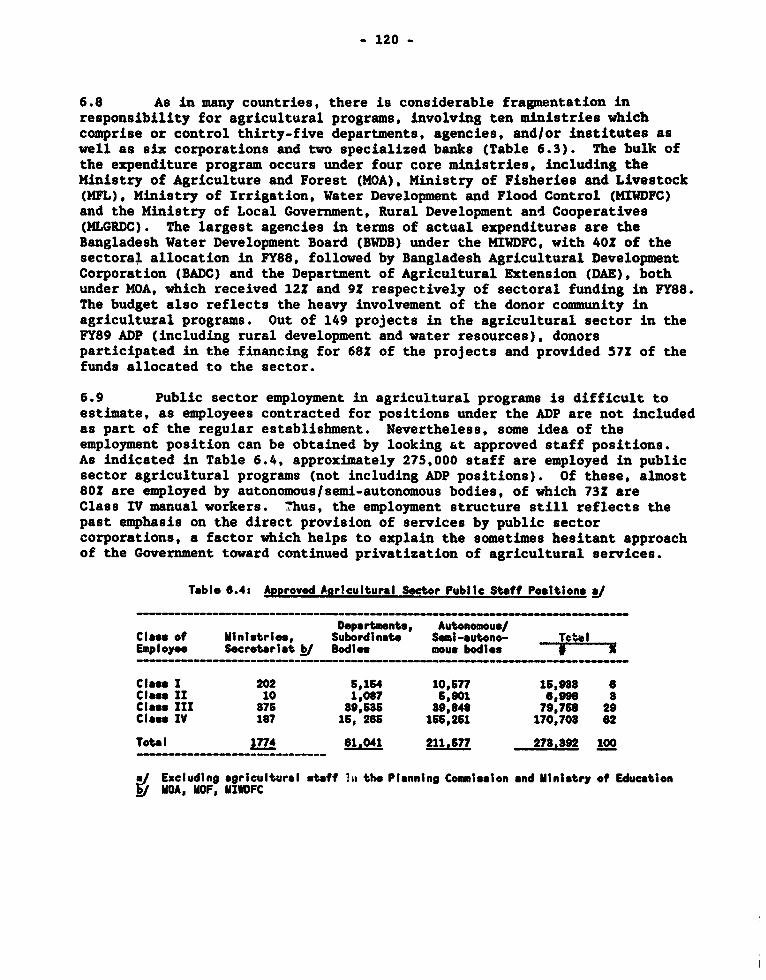
- 120 -
6.8 As in many countries, there is considerable fragmentation inresponsibility for agricultural programs, involving ten ministries whichcomprise or control thirty-five departments, agencies, and/or institutes aswell as six corporations and two specialized banks (Table 6.3). The bulk ofthe expenditure program occurs under four core ministries, including theMinistry of Agriculture and Forest (MOA), Ministry of Fisheries and Livestock(MFL), Ministry of Irrigation, Water Development and Flood Control (MIWDFC)and the Ministry of Local Government, Rural Development and Cooperatives(MLGRDC). The largest agencies in terms of actual expenditures are theBangladesh Water Development Board (BWDB) under the MIFIDC, with 40Z of thesectoral allocation in FY88, followed by Bangladesh Agricultural DevelopmentCorporation (BADC) and the Department of Agricultural Extension (DAE), bothunder MOA, which received 122 and 9? respectively of sectoral funding in FY88.The budget also reflects the heavy involvement of the donor community inagricultural programs. Out of 149 projects in the agricultural sector in theFY89 ADP (including rural development and water resources), donorsparticipated in the financing for 68? of the projects and provided 57? of thefunds allocated to the sector.
6.9 Public sector employment in agricultural programs is difficult toestimate, as employees contracted for positions under the ADP are not includedas part of the regular establishment. Nevertheless, some idea of theemployment position can be obtained by looking Et approved staff positions.As indicated in Table 6.4, approximately 275,000 staff are employed in publicsector agricultural programs (not including ADP positions). Of these, almost80? are employed by autonomous/semi-autonomous bodies, of which 73? areClass IV manual workers. Thus, the employment structure still reflects thepast emphasis on the direct provision of services by public sectorcorporations, a factor which helps to explain the sometimes hesitant approachof the Government toward continued privatization of agricultural services.
Table 6.4: Approved Agrlcultural Sector Public Staf? Posttions a/
Departments, Autonomous/Clase of Ministries, Subordinate Sesi-auteno- TotalEmployee Secretriat 5 Bodies mous bodies
Class I 202 5,164 10,577 15,988 6Class I1 10 1,087 5,001 6,996 8Class II 875 89,585 39,848 79,768 29Class IV 187 15, 265 156,251 170,708 62
Tot l 1774 81,041 211,577 278.892 100
Excluding agricultural statf la; the Planning Commlsion and Ministry of EducationMOA, MOF, MIWDFC
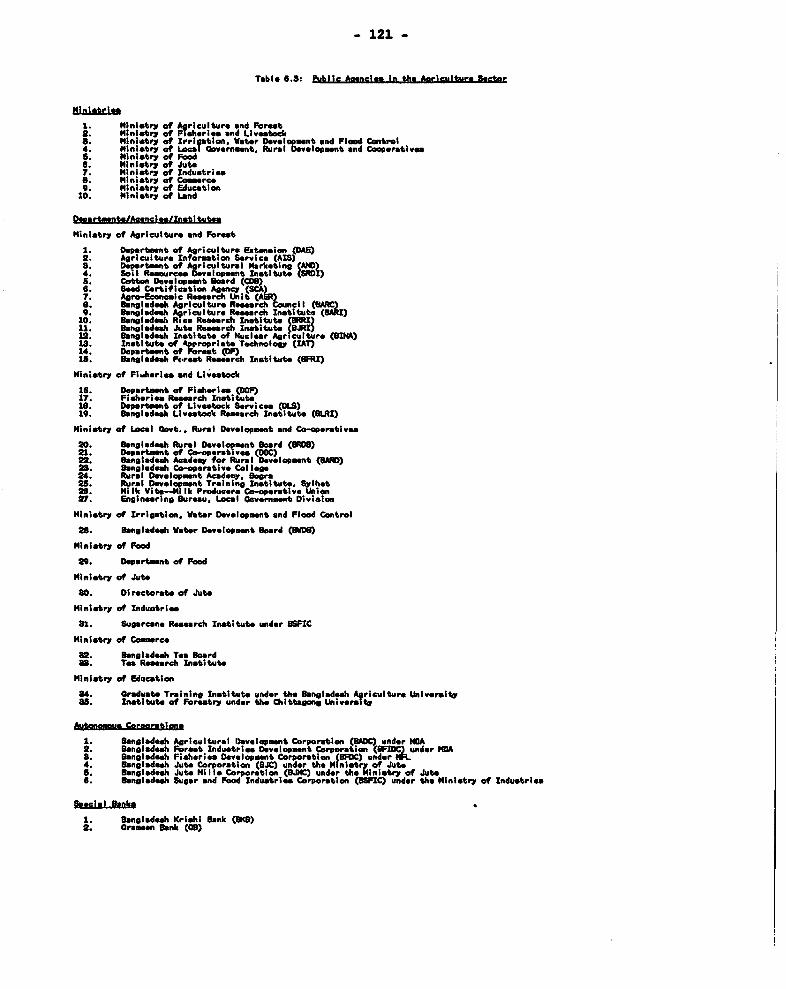
- 121 -
Table 6.s. Publtc Aaencies in the Aarieultura Sectoe
1. Ministry of Agriculture and Forest2. inistry of Fisheries and Livestock. Ministry rf Irrilation. Water Devolopment and Fload Control
4, Ministry of Lacs I Government, Rural Developent and CooperativesS. Ministry orf Food6. Ministry of Jute7 Ministry of Industries6. Miinlstry of Commerce9. Ministry of Education10. ministry of Land
QqatmntscAmnelgalXnetitute
Miniatry of Agriculture and Forost
1 Department of Agricultur. Extension (DAE)2. Agriculture Informtion Service (AIS)8 Deartment of Agricultural Marketing (MC)4. Sol Resoures Developaent Institute (SRDI)
. Cotton Development Bord (CD9)6. Seed Certification Agency (SCA)7. Agro-Sconic Reearch Unit t(%t)6. Bangladesh Agriculture Resrch Council BARC9. Bangladesh Agriculture RPsearch Institue (8Am)
10. Bnlades h Rics " Rrh Institut 3RRltl. Bngludeh Jute Rearch Inatitute (.R'I)12. Banladeh Institute at Nuclear Agr culture (BIA)1S. institut of aptropriats Technoloy (IAT)14 Deprtmnt ot Forest ()is. b ladesh Fresrt Rearch Institute BRIl)
Mtinistry af Fiiherils end Llvestock
l6 Department af Fisheries (DOF)17. Fsheries Reerch Institutes Departmnt of Livestock Service aOLS)19. Bngladeh Livestock Resarch Institute (SlI)
Ministry of Local aovt., Rural Developmt and Co-operatives
20 aengladesh Rural Developeent Bord (bO21. Depaent f Co-oper t es (DOC)22. Bangl adeh Academy for Rural Developmnt (8MU )2. Bangladeh Co-operative Col logo24. Rural Development Acadmy, Bogra25. Rural Devlopment Training Institute. Sy\het26. Milk Vit-Mil 1k Producers Co-operative Linon27 Engineering Bureau, Local Governmnt Division
Ministry of Irrigation, Water Development and Flood Control
26. Bangladesh Water Development Board (0U)
Ministry of Food
29. DepartmnO of Food
Ministry of Jute
80. Directorate of Jute
Hinistry of Industries
at. Sugarcane Research Institute under iSFIC
Ministry of Comerce
32 Bangladesh Tea BoardaSt Te RoaFrch Institute
Ministry of Education
84. Graduate Training Institute under the ibngladesh Agriculture University88. Intitute of Forestry under the Chittagong University
AU DCoroDratlens
1. Bangladesh Agricultural Development Corporation (BADC) under NMA2. bangladesh Fort Industrie Dvelopmnt Corporation (BID under MFA8. Bangladesh Fisheries Development Corporation (BFIC) under FIFL4. Bangladesh Jute Corporation (BJC) under the Filnistry of Juteo. Bangladesh Jute Mills Corporation (BJMC) under thei Ministry of Jute6. Bangladesh Sugar and Food Industries Corporation (BIFIC) under the Ministry of Indutries
Seecial Banks
1. Banglaedeh Krishl Bank (GMB)2. Oramen Bank (08)
- 122 -
Detailed Expenditure Programs
6.10 The detailed analysis of agricultural expenditure programs followsthe order used in Table 6.2, coverings
(t) crop agriculture;( _) water resources;(iii) fisheries, forestry and livestock; and(iv) rural development and institutions.
Crop Agriculture
6.11 Crop agriculture accounts for about 802 of sectoral GDP in terms ofvalue-added. The major crops are rice (about 752 of total value-added),followed by jute and sugar cane. The bulk of public expenditures for cropagriculture are undertaken by agencies under the Ministry of Agriculture andForest, mainly for agricultural extension, research and input supply. Otheractivities of particular relevance to crop agriculture that are covered inthis section include foodgrain management (under the Ministry of Food) andagricultural credit.
6.12 Agricultural Extension. Agricultural extension has received lowpriority in the ADP, with a budget allocation that remained stagnant innominal terms at about Tk Cr 12 between FY83-87. While the budget allocationhas increased recently (to Tk Cr 27 in FY89) in order to bring some long-standing donor-aided projects to a conclusion, many of the underlying problemswhich hamper the effectiveness of the extension service remain unresolved.3Agricultural extension constitutes a major claim on the allocation foragriculture in the Revenue Budget, accounting for Tk Cr 65.5 or 512 of theallocation for the Ministry of Agriculture and Forest (not including theForest Department) in the FY89 budget.41 Of this amount, 952 is earmarked topay the salaries of extension staff, including DAE central and district levelstaff (about 5000 employees) and field staff at the upazila level (about17,000 employees). The budget provision for the operating costs of theextension service is Tk Cr 3, of which the largest component is a ,ook-entrytransfer to cover the telephone charges of upazila field offices.51 The
31 Even with the recent increase, the allocation in the ADP is inadequate tosupport the ongoing projects. For example, the FY89 ADP allocation forthe Second Extension and Research Project was set at the equivalent of$1.9 million (taken from the original PP projection) rather than $6.1million which is needed according to a revised work plan prepared by ajoint Government/IDA review mission.
4/ Includes Department of Agricultural Extension (DAE), Field ServiceDivision, and Upazila Agriculture Office.
5/ An important component of extension costs, the travel allowances forfield staff, is included in the budget as personnel rather than operatingcosts.
- 123 -
Government has stated on a number of occasions that it intends to consolidateagricultural extension services under DAE in order to achieve economies ofscale, but several agencies still maintain separate staffs which performextension services, including the Department of Fisheries, Department ofLivestock Services, BADC and BEWDB. It is estimated that the other agenciesaccount for about 25,000 extension staff, which is more than the numbermaintained by DAE. In addition to the cost-inefficiencies arising fromduplication of activities, this situation encourages agencies to extendservices in a manner that may not be consistent with the most cost-effectiveapproach to extension.
6.13 Efficient functioning of the agricultural extension service is aimportant requirement for Bangladesh to achieve its agricultural objectives.HYV technology accounts for only one-third of the total area under foodgraincultivation (comprising about one-fifth of the cultivated area during the wetseason and four-fifths during the dry season) and provides about one-half oftotal foodgrain production. Total fertilizer application is less than 30Z ofthe estimated agronomic potential, reflecting both inadequate coverage (onlyhalf of the area under local varieties uses fertilizer) and low applicationrates (representing an average of 40? of the recommended level in the case ofHYV and 602 for local varieties). While some of the deficiencies are due totechnological constraints (such as inadequate coverage of FCD for wet seasoncultivation), it a'so reflects the failure of the extension system to deliverclear and reliable information on available technologies to individualfarmers. Given the prevailing pattern of production (many small farmers onfragmented plots with a low literacy rate and limited access to modern meansof communication), field level services constitute the only effective means bywhich technical information can be conveyed for the foreseeable future.
6.14 One of the major problems constraining the functioning of theagricultural extension service is the shortage of recurrent operating funds.The Revenue Budget provides only Tk Cr 0.85 to cover the operating costs of403 upazila field offices (not including telephone costs). This is inadequateto support the wide range of activities that need to be provided, and in somecases the extension staff cannot even afford to buy writing paper. In orderto get funds for activities such as field days and demonstration projects,extension staff have to request funds from the upazila development budget(which is supported by a central government grant), where their requestcompetes with locally-financed infrastructure projects such as feeder roadsand small-scale water projects. Disagreements about local cperating costsreached a peak during FY87, when MOA refused to make payments of travelallowances to field level staff because of disputes about accounting forexpenditures through the upazilas. While this particular problem has now beenresolved, it illustrates a deeper problem regarding the coordination andfunding of local level activities that affects other public services as well(such as health and education).
6.15 The resolution of problems affecting agricultural extension involvescomplex institutional questions. In the context of the overall budget, theamount of additional funds required is small (for example, it is estimatedthat an annual allocation of Tk 50,000 per upazila, or Tk Cr 2.0 in total,would be sufficient to support an improved program of field demonstrations and
- 124 -
information activities), but it is important that the funds be available atthe upazila level in order to improve the efficiency of the extension service.It should be possible to establish a reimbursement system for the upazilaswhich provides for direct control of the funds by upazila field officers andensures that funds earmarked for extension activities are used for designatedactivities. The Government needs to recognize that effective functioning ofthe extension service will be costly in terms of its demands on local fundsbecause of the wide geographic coverage of the services that are required. Inthis situation, it is essential to reduce unit costs by as much as possible,for example by consolidating the existing extension services and defining moreclearly the exter.sion activities that can be provided in a cost-effectivemanner.
6.16 Agricultural Research. Unlike extension, agricultural research hasobtained favorable treatment in the ADP, growing at a nominal rate of 28Z p.a.between FY81-89 (representing the highest rate of increase for an agriculturalprogram) and increasing from 1Z to 7Z of the sectoral allocation under theADP, with a budget in FY89 of Tk Cr 84. Funding under the Revenue Budget isalso significant, providing an additional Tk Cr 23 in FY89, most of which isused for grants to research institutes. The largest amounts under the ADP areallocated to the Bangladesh Agricultural Research Council (BARC)--Tk Cr 32 inFY89--and the Bangladesh Agricultural Research Institute (BARI)--Tk Cr 22 inFY89--with lesser amounts allocated to a number of specialized researchinstitutes. As in many countries, the research structure is highlyfragmented. The current system, which is supposed to be coordinated by BARC,consists of fifteen separate research organizations and seven educationalinstitutions, with funding provided through the budgets of eight ministries.As a result, BARC's coordination role is largely ineffective, as it has nocontrol over the allocation of research funds other than funds earmarked forfarming systems research which are provided by donor agencies.
6.17 It is generally agreed that the physical infrastructure alreadyavailable for agricultural research is well in excess of the country'sinstitutional and financial capacity to manage effectively. Each researchinstitute has its own overhead costs, including administration, buildings,equipment, transport, and professional and support staff. As a result, budgetallocations are utilized for maintaining the existing system, particularly forstaff salaries, leaving only limited funds to support research activities.Most of the staff lack adequate training and experience in the application ofresearch methodology to practical farming problems, and a lack of coordinationwith the extension service means that technical messages are often abstract orunrelated to on-farm conditions. (A well known example is the continuedemphasis on a single recommended fertilizer dosage, although it has beenestablished that farmers ignore the research advice and use significantly lessfertilizer.) Institutional reform and cost-efficiency improvements, as wellas strengthening the role of BARC in the allocation of research funds, shouldprecede any further increase in budget allocations, for agricultural research.
6.18 Input SupPlY. The role of public sector agencies, particularlyBADC, in the supply of agricultural inputs was reduced substantially duringthe 1980s. Fertilizer subsidies were eliminated In FY87, due in large part toa 50Z reduction in the international price of urea (current dollar terms)
- 125 -
between 1980 and 1987. The remaining budget allocation for fertilizer supplywas eliminated from the ADP for FY89 with the completion of projects for theconstruction of fertilizer storage sheds by BADC. At the current time, theonly significant allocation for input supply in the ADP is Tk Cr 39.7 tosupport seed production by BADC. Allocations in the Revenue Budget include TkCr 0.7 for the Seed Certification Agency and Tk Cr 1.2 for the PlantProtection Service.
6.19 BADC is responsible for the production and distribution of highquality seeds for rice, wheat, potatoes, vegetables, oilseeds and pulses. Inthe case of jute, quality seed is produced by the Bangladesh Jute ResearchInstitute and distributed by BADC. The major problem is the inadequate supplyof seeds, with BADC providing only about 0.5Z of the seeds used by farmers forrice and 25-35Z for wheat. The quality of seeds supplied by private distri-butors is said to be below generally acceptable standards. One of the factorscontributing to this situation is the high rate of subsidy maintained by BADCon the sale of seeds, estimated at about 60X of variable costs for cereal andjute seeds (on the basis of the difference between BADC's sale price and theprocurement price paid by BADC to outgrowers). This subsidy allows BADC toabsorb very high production costs on its 26 seed multiplication farms,reflecting inefficient management and a lack of cost control, while itinhibits the private sector from producing quality seeds by providinginadequate profit margins to cover costs. Expanding the supply of qualityseeds is an important objective of the agricultural growth strategy. Theexisting subsidies do not support this objective, as they largely serve toprotect BADC and discourage private competition. While the Government maywish to retain an important role to BADC in seed supply in order to ensureadequate quality, improvements in cost efficiency (particularly by expandingprivate outgrower programs) should be an important part of government effortsin this area.
6.20 Although the budget allocation for fertilizer subsidies has beeneliminated in recent years, the Government will face a decision in the nearfuture on fertilizer prices if recent increases in international urea pricescontinue (the average price of urea f.o.b. Europe for 1988 was 45Z higher thanthe average price in 1986). The available evidence indicates that eliminationof fertilizer subsidies has not depressed the demand for fertilizer.Fertilizer use increased by 7Z p.a. from FY81-87, despite significantincreases in domestic fertilizer prices, largely because increased irrigationencouraged greater use. Given the limitations on the availability of localfunds, fertilizer subsidies would constrain the scope for increased expeidi-tures in programs which have greater potential for achieving sustainableincreases in production, such as water resource development. With regard tothe government's poverty alleviation objectives, the targeting of fertilizersubsidies would be perverse, as the subsidy would go primarily to farmers whoalready have access to irrigation and therefore have a wider range oftechnologies available (these are generally larger farmers with better land),while poorer farmers without irrigation would benefit very little from thesubsidy. Unlike the situation in the late 19709 when fertilizer was importedon concessional terms and the fertilizer subsidy was largely implicit in thebudget (reflecting reduced counterpart payments in local terms), thefertilizer subsidy would now have to be an explicit transfer of funds in order
- 126 -
to maintain the financial viability of the domestic fertilizer industry.Although there is no economic difference between implicit and explicitsubsidies, in practice financial pressures on the budget would encourage theGovernment to reduce the subsidy payments and thereby undermine the self-financing capability of the fertilizer industry. It is therefore recommendedthat reintroduction of fertilizer subsidies should be discouraged on fiscalgrounds.
6.21 Foodgrain Storage a-id Foodstock Management. Allocations for theconstruction of foodgrain storage facilities under the ADP decreased fromTk Cr 80.7 in FY81 to Tk Cr 26.9 in FY89 as the Public Food DistributionSystem (PFDS) completed the construction of planned facilities. Currentexpenditures are oriented almost entirely tcward the rehabilitation ofexisting structures. In terms of public expenditure policy, a more importantconsideration is the financial management of the deficit in the foodgrairaccount, which historically has been one of the most volatile components ofthe budget. Table 6.5 shows the movement of the food account deficit for theperiod FY81-89.
Table 6.6: Food Account Deficit(1k Cr)
FY61 FY82 FY8S FY64 FYe6 OS 8 FY8 FY8 !/ FY89
Deficit 467 380 856 g80 426 l68 1 684 876(of wh i ch foodstockchange) 275 280 -8 22 196 27 12 600 87
ajestimateb/budgoet
6.22 While the computation of the food account deficit is complex, fourfactors can be identified which are important in determining its outcome.These are:
(i) Consumer price subsidies. At the beginning of the ls80s, consumersubsidies through the PFDS accounted for 8-9Z of recurrentexpenditures. Subsidies have been reduced substantially since thendue to large price increases for most distribution channels 6/ andthe fall in international prices for foodgrains, from an average of$460/metric ton for rice in 1980-81 (f.o.b. Thailand) to $211/ton in1986. (A similar though less substantial reduction occurred inwheat prices during the same period.) The Government has indicatedthat it will remove subsidies on distribution channels serving civilservants during FY90, improve the targeting of distribution channels
6/ With the exception of the politically sensitive Essential PrioritiesChannel, which is provided mainly to military personnel.
- 127 -
serving the poor (such as the Modified Rationing Channel), and movethe financial burden of the Essential Priorities Channel to thebudget of the Ministry of Defense.
(ii) Consumer price stabilization. Even if most consumer subsidies areeliminated on average, there will still be a periodic deficit in thefoodgrain account to meet consumer price stabilization objectives,especially in view of the volatility in world foodgrain prices (forexample, the average price of rice f.o.b. Bangkok for 1988 was$301.5/metric ton, 432 higher than the average 1986 price). Thispolicy is a reasonable approach to minimizing short-term adjustmentcosts for lower income groups. However, during periods when inter-national prices increase rapidly (as in 1988), there will be a needto cover the additional costs of food imports which are not matchedby consumer price increases. Some of the costs can be recoveredlater if international prices fall, but the use of lagged priceswill generally mean that a net government contribution to the foodaccount will be required due to international inflation and interestcharges. Alternatively, the Government may consider adding a marginto consumer prices to recover these costs over time.
(iii) Producer Price support. The PFDS has been criticized forconcentrating on consumer price stabilization while neglectingproducer price incentives. The PFDS is supposed to announce publicprocurement prices before the sowing season, which are intended toestablish a floor price for the next harvest. In practice, theannounced prices often reflect prices during the past season and areadjusted during the harvest to meet domestic procurement needs. ThePFDS has also failed to support procurement prices during goodharvests; in the case of rice, market prices remained below theprocurement price during four out of five good harvests in the pasttwelve years. There are indications that the PFDS has decided totake a more active role in maintaining producer prices. In May andJune of 1988, when the aman crop replanted after the 1987 floodsyielded a bumper harvest, market prices initially fellsignificantly. Tha PFDS intervened with open market purchases ofabout 200,000 tons (despite the fact that food stocks were alreadyhigh due to post-flood food imports), which helped to support pricesat about the level of the announced procurement price. It has beenrecommended that the PFDS should continue to support floor pricesfor producers through open market operations, while foodgrainimports should be used as a residual source to fill out domesticrequirements. This approach will require additional working capitalin order to wanage open market operations more effectively, and itmay require some modifications in foodgrain storage facilities.Since consumer and producer price stabilization efforts will notnecessarily be cc4nter-cyclical (because domestic and internationalmarket conditions are not necessarily correlated), this policy willprobably increase the overall variability of expenditures onfoodstock management.
- 128 -
(iv) Natural disasters. As indicated by Table 6.5, one of the primaryfactors contributing to movements in the food account deficit is therestocking activities of the PFDS. Restocking purchases aredetermined largely by adverse weather conditions, including droughts(FY81 and 82) and floods (FY85, 88, and 89). Part of the foodgrainpurchases may be financed with external disaster relief, but this isoften at the expense of general commodity aid (which thereforereduces the amount of local counterpart funds available to thebudget). The Government also purchases a portion of the additionalfoodgrain imports with its own funde, which likewise reduces theavailability of local funds for the budget. As such, changes in thefood account deficit can increase financing pressures on the ADP atprecisely the time when the Government needs to mobilize additionalbudgetary funds for disaster relief. There is a prima facie case,therefore, for spreading the financing burden for foodgrainrestocking over a broader base in the economy, rather thanconcentrating its impact solely on the budget.
6.23 The policies described above are likely to increase the variabilityof the food account deficit, thereby introducing a greater source ofinstability into the budget. This will make planning of the publicexpenditure program more difficult, particularly since movements in the foodaccount deficit have a multiplied impact on the ADP by reducing theavailability of local funds. To offset this problem, the Government will needto be more flexible in reflecting changes in the food account deficit in itsmonetary targets and domestic borrowing requirements. Another option thatwould achieve the same objective is to move the food account soff-budget3 andtreat it as a separate managed fund with access to commercial bank financingto help finance its short-term operations. In view of the experience in othersectors such as jute, however, it would be essential to monitor the access offood account to bank financing in order to avoid building up a bidden deficit.Periodic injections of public funds from the budget may be necessary tomaintain the food account on a sound financial basis, and these should beprovided as an explicit budget transfer.
6.24 Agricultural Credit. Agricultural credit programs receive asignificant input of funds through the Revenue Budget, amounting toTk Cr 164.3 in the FY88 budget (see Table 6.6).7 These allocations includethree types of expendituress (i) a subsidy of Tk Cr 30 to cover thegovernment's share of the cost of interest remission on agricultural loans aspart of the FY87 action plan to improve agricultural credit recovery; (ii)advances of Tk Cr 6.3 in local funds to agricultural cooperatives; and (iii)the remaining Tk Cr 128, which consists of loans from donors to domesticfinancial institutions to support specialized agricultural credit programs.The range of issues concerning agricultural credit programs is highly complex
7/ Most of the funds are passed through the Revenue Budget for accountingpurposes and are recorded under 'Non-ADP Project Assistance."
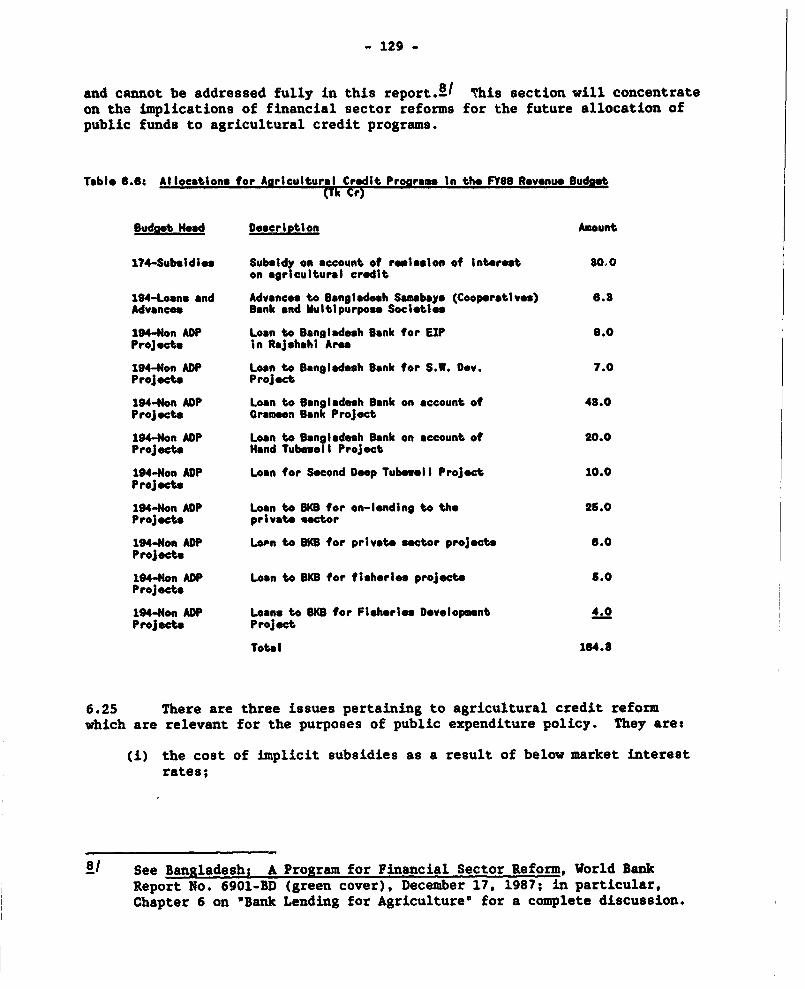
- 129 -
and cannot be addressed fully in this report.8/ This section will concentrateon the implications of financial sector reforms for the future allocation ofpublic funds to agricultural credit programs.
Table 6.6: Allocations for Agricultural Creodit Proarams In the FY89 Revenue Budsot(Tk Cr)
Budeet Head Description Amount
174-Subsidies Subsldy on account of remission of interest o0oon agricultural credit
194-Loans and Advnces to Bangladesh Samabays (Cooperatives) 6.8Advances Bank and Multipurpose Societies
194-Non ADP Loan to Bangladesh Bank for EIP 8.0Projects in Rajehahi Area
194-Non ADP Loan to Bangladesh Bank for S.. Dov. 7.0Projects Project
194-Non ADP Loon to Bangladesh Bank on account of 48.0Projects Grameen Bank Project
194-Non ADP Loan to Bangladesh Bank on account of 20.0Projects Hand Tubewell Project
194-Non ADP Loan for Second Deep Tubewll Project 10.0Projects
194-Non ADP Loan to BKB for on-lending to the 25.0Projects private q etor
194-Non ADP Loin to BKB for privete sector projects 6.0Projects
194-Non ADP Loan to BKB for fisheries projects 5.0Projects
104-Non ADP Loans to BKB for Fisheries Development 4.0Projects Project
Tot l 164.8
6.25 There are three issues pertaining to agricultural credit reformwhich are relevant for the purposes of public expenditure policy. They are:
(i) the cost of implicit subsidies as a result of below market interestrates;
S 8/ See Bangladesh; A Program for Financial Sector Reform, World BankReport No. 6901-BD (green cover), December 17, 1987; in particular,Chapter 6 on 'Bank Lending for Agriculture' for a complete discussion.
- 130 -
(ii) the financial implications of resolving past problems of poor loanrecovery, including credit remission programs arising from naturaldisasters; and
(iii) the prospects for increasing the scale of agricultural creditprograms in the future.
6.26 Turning first to the issue of interest rate subsidies, thecombination of low lending rates and high credit risk has resulted in anegative return to the NCBs and Bangladesh Krishi (Agriculture) Bank (BKB) onagricultural loans. The first step in resolving this situation is to make thesubsidies transparent by providing an explicit transfer through the budget tocover the cost. It is estimated that the average interest subsidy onagricultural loans is on the order of 52 (after adjusting for proposed changesin the interest rate on deposits and improvements in credit recoveryperformance). On the basis of the current lending volume for agriculture inthe range of Tk Cr 1,200, this would imply an annual budgetary cost of aboutTk Cr 60 to cover interest subsidies. This cost would be partially offset,however, by increased non-tax revenues resulting from the elimAn4ation ofpreferential refinancing schemes through Bangladesh Bank and increased taxespaid by the NCBs and BKB on profits. These factors could result in increasedbudgetary revenues on the order of Tk Cr 30-40, leaving a net cost to thebudget of about Tk Cr 20-30.9/
6.27 While the process of converting interest rate subsidies from animplicit to an explicit basis in the budget would be an important stepforward, it should be viewed as only the first stage in a gradual eliminationof subsidies on agricultural credit prograris. As long as subsidies appear inthe budget, there will be financial pressures to limit the growth of lendingin order to control the cost of the subsidies. Moreover, numerous casestudies throughout the world have demonstrated that intezest rate subsidiesare not an efficient way to promote agricultural investment. Subsidiesencourage larger and more influential farmers with better access to credit tomonopolize the available funds, squeezing out smaller and poorer farmers. Thecontrol of on-lending rates discourages banks from expanding their operationsto cover poorer farmers who require smaller loans entailing a higheradministrative cost. The successful experience of the Grameen Bank hasdemonstrated that the poor are a good credit risk and that access to credit ismore important than the cost at which it is provided. Therefore, it isrecommended that the Government should establish a schedule for the gradualelimination of subsidies by raising interest rates to market levels over time.
6.28 The second issue related to agricultural credit programs is the costof resolving past problems of poor loan recovery related to rapid expansion oflending volumes in the early 1980s. In support of the MTPPP, the Governmentencouraged a rapid increase in agricultural lending from FY81-85, whichresulted in an increase in the amount of agricultural credit outstanding by4502 over this period. The expansion was supported by a substantial increasein the number of rural branches operated by the NCBs and BKB, which grew from
91 These calculations are preliminary and subject to revision.
- 131 -
924 in FY76 to 3,225 in FY84. The combination of rapid credit expansion andinexperienced b7anch operations, combined with political involvement in thecredit allocation process, resulted in a sharp deterioration in loanrecoveries, as indicated by a fall in the loan recovery rate to 26Z of theamount due in FY86 and an attendant rise in overdue payments to 51? of totalcredit outstanding by the end of FY86. In this situation, strong measureswere required to preserve the integrity of the financial sector and limitfurther losses on agricultural credit programs. The Government initiated anaction plan in September 1986 to improve the credit recovery rate, whichincluded agreed targets for credit recovery, legal sanctions againstdefaulters, expanded use of credit passbooks, and a program of interestremission for small to moderate size overdue loans. The cost of the interestremissior. program has been estimated at about Tk Cr 360, which is beingabsorbed in equal shares by the Government, Bangladesh Bank and the NCBs. 10/The subsidy payment of Tk Cr 30 in the FY88 budget is the first payment by theGovernment toward this program, the cost of which is being spread over fouryears.
6.29 While the credit recovery action plan has had encouraging results inimproving the collection of overdue payments, BKB and the NCBs are stillholding a large number of loans that will ultimately prove to beuncollectible. This is part of a general problem of poor loan recovery thatwill requice the intervention of the Government to restore the financialsolvency of the NCBs and BKB. The part of the recapitalization program whichis attributable to agricultural loans has not yet been quantified until theloan portfolios can be classified according to their repayment prospects.AIJBeyond this immediate problem, it would be desirable to protect the viabilityof financial institutions involved irn agricultural lending in the event ofwidespread losses arising from future natural disasters. An Agricultural andRural Guarantee Fund (ARGF) has been proposed to help accomplish thisobjective. This approach is preferabl! to declaring a general rescheduling ofagricultural loans, as it would: (i) allow for a prompt recognition offinancial loFses arising from natural disasters, rather than postponingcollection problems to a future date; (ii) provide a method for channeling newloans to farmers deemed to have suffered crop losses due to natural disasters,which would simplify procedures and segregate lending to cover the cost ofunavoidable crop losses from general problems of credit recovery; (iii)provide incentives to BKB and the NCBs to exercise prudence in extending croploans by guaranteeing only a portion of the losses due to natural disasters;and (iv) spread the budgetary cost of disaster losses over several years byallowing for regular budget contributions to the ARGF (plus some self-financing due to reinvestment and interest charges), rather than largeallocations in the period when the losses occur.
10/ In fiscal terms, the division of the cost is largely irrelevant, as theshares covered by Bangladesh Bank and the NCBs are reflected in lowertax and non-tax revenues accruing to the budget.
11/ It is known, however, that the major cost of the recapitalizationprogram will result from loans to the jute industry.
- 132 -
6.30 The final issue is the financial requirements for expansion ofagricultural credit programs. Table 6.7 compares the record of disbursementsof agricultural credit with sales of irrigation equipment and fertilizer usefor the period FY81-87. The sharp reduction in disbursements of agriculturalcredit beginning in FY86 was associated with a substantial fall-off in salesof irrigation equipment (particularly STWs and DTWs) and a moderate reductionin fertilizer use. While other factors influenced these results (e.g., priceincentives, the decline in jute revenues, etc.), agricultural credit hasclearly been a major factor both in the early success of the MTFPP(particularly in the rapid increase in equipment sales from FY81-84) and thesubsequent stagnation of the program. Even in the most expansionary years foragricultural credit (FY84-85), gross disbursements represented only 5.7Z ofagricultural GDP, as compared to 10.4t for Pakistan. Renewed expansion ofagricultural credit programs will therefore be a major requirement forregaining momentum in the growth of agricultural output. While theinstitutional capacity of BKB will be an important factor constraining thegrowth of credit programs in order to prevent a reoccurrence of theunsustainable burst in agricultural lending of the early 1980s, the Governmentshould encourage renewed growth of agricultural lending in a realistic manner.
Table 6.7: Agricultural Credit and Input Use, FY81-87
FY81 FY82 FY83 FY84 FY85 FY86 FY87Agricultural Credit (Tk Cr)Gross disbursements 373 424 679 1005 1150 632 645Net disbursements 152 110 337 487 566 25 -460
Irrigation Equipment Sales ('000)Low Lift Pumps 4.4 14.8 24.8 24.7 16.0 15.0 5.6Shallow Tubewells 17.6 26.5 39.2 33.2 28.5 8.4 12.0Deep Tubewells 0.6 1.5 3.3 2.3 2.2 0.6 0.3
Fertilizer ('000 mt) 889 829 968 1129 1260 1156 1321
6.31 Calculations have not yet been prepared to estimate the resourcesneeded to support the growth of agricultural credit programs. (These areexpected to be prepared as part of an upcoming Agricultural Credit Project.)Future allocations of resources should come primarily from donc.r-supportedprojects. In addition, the Government should encourage donors to restrict theestablishment of preferential lending programs directed to par1icularagricultural sub-sectors (which often involve large implicit subsidies) infavor of greater reliance on general credit programs. As indicated in Table6.6, many of the current credit programs are directed toward specificgeographical regions and/or particular activities (e.g., the Southwest AreaDevelopment Project, Deep Tubewells Project, Fisheries, etc). This increasesthe complexity of agricultural lending programs and introduces inequities intothe credit system through preferential lending terms which undermine theprocess of financial sector reform. Wherc concessional lending programs are
-133 -
included in the budget, they should be clearly directed toward lower incomegroups (e.g., Grameen Bank type activities).
6.32 Other Programs. The expenditure category labeled as OtherPrograms in Table 6.2 includes a variety of special purpose programs, most ofwhich are oriented toward a particular crop (such as cotton development, teaplantations, etc.). In general, the projects include most of the componentsalready discussed, such as agricultural extension, research, seed production,and credit. Agricultural services have often suffered in the past fromexcessive specialization, to the detriment of cost-efficiency andconcentration on core activities. The specialized programs should therefotebe reviewed on a case-ty-case basis within the following guidelines. First,establishment of credit programs directed to specialized activities and directpublic sector involvement in productive activities should be avoided.12/Specialized extension services should be provided only in the case ofgeographically confined production activities limited to mono-cropcultivation. Research activities should be reviewed by BARC to ensurecoordination with other research programs. While these guidelines may imply asomewhat more restrictive approach toward specialized programs in the future,they are necessary to avoid a proliferation of special purpose activities,which has hampered the development of agriculture programs in a number ofother developing countries.
Water Resources
6.33 Expenditures for the development of water resources represent thelargest share of the public expenditure program in agriculture, accounting forTk Cr 704 or 55: of the sector's allocation in the FY89 ADP. ApproximatelyTk Cr 52 is allocated for water development activities under the budget ofMIWDFC in the FY89 Revenue Budget, virtually all of which is passed to BWDB asa grant. BWDB also receives a share of the FFW allocation (generally lessthan 100,000 tons of foodgrain) to pay for the rehabilitation of earthworks inconnection with water development projects. Combining all sources,expenditures for water development programs represent approximately 92 of thetotal use of funds for the public expenditure program.
6.34 The composition of the public expenditure program for water resourcedevelopment has changed significantly during the FY81-89 period. Expendituresfor surface water development (flood control and drainage, with or withoutsupplementary irrigation--FCD and FCDI) have accounted for a growing share ofpublic expenditures during this period, increasing from 202 to 41X of thesector's allocation in the ADP. The allocation for FCD projects has beenhighly sensitive to the overall fiscal climate, with sharp cuts occurring inFY83 and FY86. In recent years, however, the budget for surface waterprojects has increased rapidly, almost doubling in nominal terms between
12/ In this regard, the government's decision in the FY89 Tea Policy toestablish a central processing factory under private sector managementappears to be a reasonable approach.
- 134 -
FY86-89.13/ In contrast, the budget for ground water development (pumpedirrigation, including shallow tubewells-STWs, deep tubewells-DTWs, and lowlift pumps-LLPs) has decreased from 28? to 142 of the sectoral allocation inthe ADP, representing a 671 cut in real terms. 14/ As a result, the totalallocation in the ADP for water development projects has declined byapproximately 20Z in real terms between FY81-89.
6.35 FY81 represented a transitional period in BWDB's investment programfollowing a joint Government/IDA review in 1979 which recommended a shift awayfrom the large scale FCD and gravity irrigation schemes in order to focus onshort gestation projects and divisible components of larger projects. It tookuntil FY86 before the backlog of ongoing projects was largely completed.15ŽIn order to establish investment priorities for the sector, a National WaterPlan (NWP) exercise was initiated in 1983 to prepare a long-term plan for thedevelopment of water resources. A draft NWP report was issued in 1986, andfurther work is now underway to revise the plan and operationalize it.
6.36 The framework develop'4d in the draft NWP envisions an increase infoodgrain production by about 11 million metric tons (as compared to 16.5million tons total production in FY87 and 88) over a twenty-yearimplementation period.161 The recommended program would bring an incremental3.5 million ha. under irrigation--1.2 million ha. from surface waterdevelopment (FCDIs and LLPs) and 2.3 million ha. from ground water sources(STWs and DTWs)--as compared to approximately 2.1 million ha. at present. Inaddition, 1.8 million ha. of cultivable land would be provided with FCDprotection, bringing the total coverage of FCD to about 3.1 million ha. Thisinvestment program would nearly exhaust the potential for agricultural growthbased on current patterns of water management, as 722 of the irrigationpotential and an equal percentage of the economic FCD potential would be
13/ This comparison is inflated by the inclusion of Tk Cr 114 in the FY89allocation for BWDB to cover rehabilitation projects due to FY88 flooddamage. If this sum is eicluded, the budget for surface waterdevelopment would be 362 of the budget for agriculture in FY89,representing an increase of 122 p.a. in nominal terms between FY81-89and a real increase of about 102 in aggregate.
14/ Some expenditures for LLPs are included in surface water developmentprojects under BWDB.
15/ There are exceptions, howevcr. The Teesta Barrage project hasbeen ongoing since 1978 at a very high cost to the budget in termsof the utilization of local funds (the FY89 allocation for thisproject represents approximately 25X of BWDB's total allocation oflocal funds).
16/ The NWP is cast over the period 1986-2005, but given the del4ys inreviewing and operationalizing the plan and subsequent flood damage, theinitiation of the plan in FY91 appears to be more likely. The estimateof 11 million tons incremental foodgrain production does not includelikely increases in agricultural yields tnd is therefore understated.
- 135 -
achieved under the plan. 171 Thus, it is clear that the NWP's recommendationswill have an important bearing on the overall prospects for economic growthand the evolution of the public expenditure program in the agricultural sectorover the foreseeable future.
6.37 The NWP has concluded that almost all types of -water projects havepotentially high rates of return. However, in view of the need to obtain aquick production response and minimize the financial impact on the budget, thefollowing priorities have bepn recommended for the allocation of funds and thesequencing of investments:
Priority I: Continued implementation of minor irrigation schemes,including: ti) the utilization of available surface waterresources by LLPs; and (ii) developmEnt of ground waterresources by STWs (including deep-set STWs).
Priority II(a): Implementation of economically viable maior irrigationschemes, including: (i) development of quick implementationprojects on the main rivers; (ii) development of regionalsurface water resources by larger, more complex FCDIprojects where investment in addition to LLPs is required;and (iii) implementation of irrigation schemes usingcombined surface and ground water in areas with asignificant proportion of high and medium-high land suitablefor increases in the use of HYVs.
Priority II(b): Implementation of minor irrigation schemes using DTWs.
Priority III: Flood control and drainage (FCM. projects in areas whereadequate gravity drainage is feasible.
While continued emphasis on expansion of ground water irrigation through STWsis endorsed by the NWP, several longer-term recommendations ftr water resourceprograms have important implications for the public expenditure program. It
17/ Achievement of the rsmaining potential for irrigated agriculture wouldrequire major investments in barrages, canals and drainage to developthe full potential of the Ganges, Meghna and Brahmaputra rivers. TheNWP does not address the viability of barrages on the Ganges andBrahmaputra directly, instead recommending field studies to prepare theprojects for eventual implementation after the completion of the NWPinvestment program. It is estimated, however, that construction of thebarrages during the NWP period would double the cost of the investmentprogram in terms of the requirements for public resources. This highcost weuld seriously constrain the resources ivailable for the rest ofthe NWP program and postpone the achievement of its objectives for anindefinite period. For this reason, it is assumed that currentproposals for the construction of major barrage projects (includingtoken allocations in the ADP for the Ganges Barrage since FY81) will notbe pursued.
- 136 -
is therefore desirable to review these findings in more detail in terms oftheir financial and institutional requirements.
6.38 One of the major concerns of the NWP is to maximize the incrementalproduction response obtainable from a given input of public investment funds.This is appropriate, as the total cost of the investment program recommendedby the NWP is substantially in excess of the level that can be financed fromcontributions of public resources. The amount of private investment thattakes place in water resource development will therefore be a majordeterminant of the production response that can be achieved. Based on thecurrent system of subsidies in water development programs, the NWP recommendsa total investment program over the twenty-year implementation perio4 ofapproximately Tk Cr 24,50' ($7.9 billion) in constant FY88 prices 181, ofwhich Tk Cr 13,100 ($4.2 biilion) would represent public investment (53Z ofthe total) and the remaining Tk Cr 11,400 ($3.7 billion) would be privateinvestment. While the NWP does not address the question of pricing andincentives for private investment, it is nevertheless clear that this issuewill be a major consideration in the feasibility of the program.
6.39 The priority placed on STW and LLP irrigation by the NWP is sound,both in terms of the quick implementation and production response potential ofsuch programs and because of their relatively low requirements for publicinvestment funds. At present, STWs are sold by both BADC and privatedistributors, while LLPs are provided with a subsidy ranging from 30-40X forsales to 752 for ren als.191 Since a major share of this program is coveredby private investment, public funds would be released to concentrate onmedium-term programs to improve surface water irrigation potential.
6.40 The priority placed on FCDI projects by the NWP would represent animportant change from current priorities, which in practice have concentratedon FCD with less priority for irrigation development. The NWP suggests thatthe potential for continued expansion of surface water irrigation using LLPsis becoming increasingly constrained by technical considerations, such aslimits on the supply of water during the dry season and the increasingdistance that water must be lifted to reach more distant fields. For thisreason, it will be necessary to augment the availability of dry season waterresources in many areas. This would be done by implementing increasinglycomplex projects, involving interventions such as large land-based pumping
18/ Corresponding to Tk Cr 13,900 in the constant 1983 prices used in the NWPreport.
19/ It was anticipated under the HTFPP that subsidies on STWs and LLPs wouldbe fully eliminated by now and the distribution of irrigation equipmentwould be taken over by the private sector, but this has not occurred.Private distributors are allowed to market STWs, but their participationhas been discouraged by restrictive conditions on the procurement ofirrigation equipment.
- 137 -
stations 20/ and improved off-takes to augment the water supply of smallerrivers and canals where LLPs can be used, followed by gravity-based irrigationdevelopment where it is economically justified. It is recognized in the NWPthat the performance of BWDB in such projects has not been satisfactory.Projects including major pumping stations, such as the Pabna, Meghna, Donagodaand Kurigram projects, have resulted in a high unit cost (on the order ofTk 60,000/ha) for protected and irrigated land. While some large irrigationprojects (e.g. Chandpur, Muhuri, and Karnafuli) are performing well, thephysical performance of other projects (e.g., Barisal) has been belowexpectations due to weak management of the pumping stations and neglect ofoperations and maintenance. Some of the problems are related to the largescale of projects, but many of the smaller projects (so-called EarlyImplementation Projects) have suffered from high unit costs and weakoperational performance as well. For this reason, the NWP recommends a slowincrease in investment for FCDI projects over the next several years.Substantial assistance will be required to improve the operational capacityand performance of BWDB in order to carry out its responsibilities under theNWP.
6.41 Unlike surface water development where a single investment scenariois presented, the NWP presents four different scenarios for the development ofground water resources which would imply significantly different institutionaland financial requirements and have a corresponding impact on the anticipatedproduction response. The two lowest level scenarios are based on variants ofexisting STW technology, which would have minimal requirements for publicinvestment fu7ds and utilize technology that is already well established inBangladesh.21 1 In contrast, the high level scenario, which is recommended bythe NWP on the basis of its production potential, would aim for a mix of DTWand STW irrigation. Under this scenario, the country would be zoned intocontrol areas, and STWs (including deep-set STWs) would be permitted onlywhere they are able to utilize 952 of the existing ground water potential. Inthe remaining areas, DTWs would be used, although the use os STWs would beallowed in the interim period while DTW irrigation was being developed. 22/The high level scenario would achieve a maximum utilization of existing groundwater resources, although it would imply a substantially greater cost in termsof its requirements for public funds and organizational complexity.
20/ There are technical reservations as to whether the NWP's inclusion offloating pump stations is viable.
21/ The difference in the plans is between the use of STWs and the expandeduse of deep-set STWs (where the suction pumps are placed in a 1 to 3meter deep pit), with the advantage that deep-set-STWs can tap groundwater resources to a greater depth.
22/ The fourth scenario envisions a less intensive use of DTWs in view oftheir high unit cost and the likely inability of the Government toenforce the zoning separation of STWs and DTWs. There is evidence thatthe zoning system has been a major source of delays in projectimplementation.
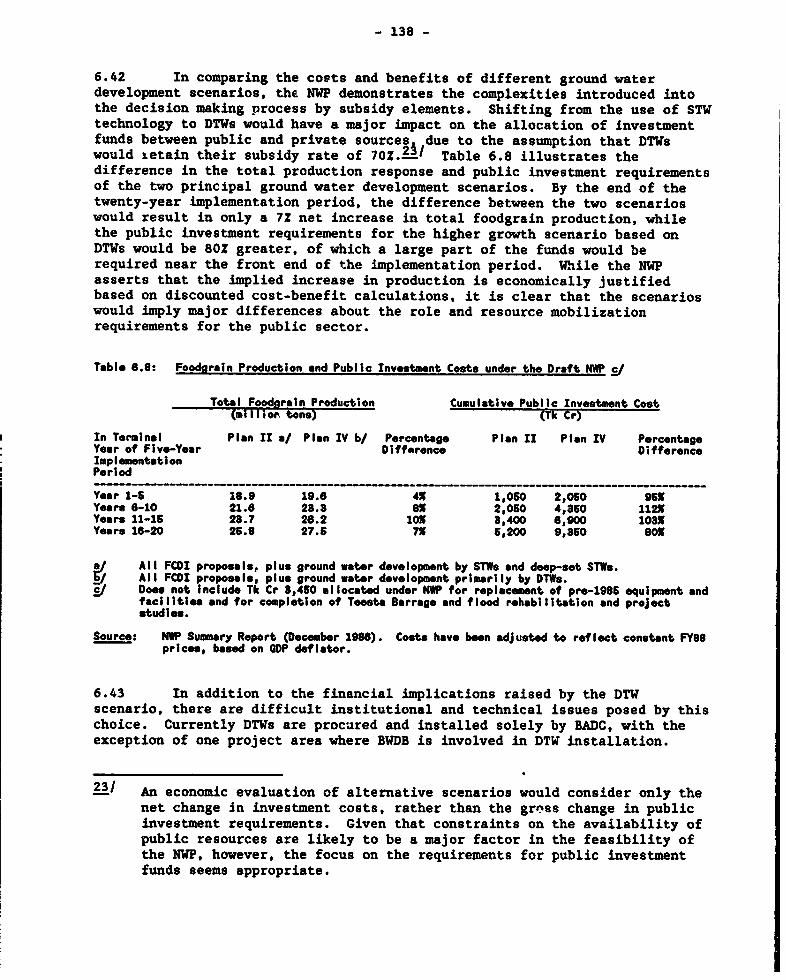
- 138 -
6.42 In comparing the costs and benefits of different ground waterdevelopment scenarios, the NWP demonstrates the complexities introduced intothe decision making process by subsidy elements. Shifting from the use of STWtechnology to DTWs would have a major impact on the allocation of investmentfunds between public and private sources due to the assumption that DTWswould Letain their subsidy rate of 70Z.2 / Table 6.8 illustrates thedifference in the total production response and public investment requirementsof the two principal ground water development scenarios. By the end of thetwenty-year implementation period, the difference between the two scenarioswould result in only a 7Z net increase in total foodgrain production, whilethe public investment requirements for the higher growth scenario based onDTWs would be 80 greater, of which a large part of the funds would berequired near the front end of the implementation period. While the NWPasserts that the implied increase in production is economically justifiedbased on discounted cost-benefit calculations, it is clear that the scenarioswould imply major differences about the role and resource mobilizationrequirements for the public sector.
Table 6.8: Foodarain Production and Public Investment Costs under the Draft NWP S/
Total Foodorain Production Cumulative Public Investment Cost(milIIorn tons) (Tk Cr)
In Terminal Plan II a/ Plan IV b/ Percentage Plan II Plan IV PercentageYear of Five-Year Difference DifferenceImplementationPeriod
…-------- --- -- _-___-_______---_______--___ _…
Year 1-5 18.9 19.6 4X 1,060 2,050 95XYears 6-10 21.6 28.8 8% 2,060 4,860 112XYears 11-15 28.7 26.2 lOX 8,400 6,900 108XYears 16-20 25.6 27.5 7X 5,200 9,860 80X
^/ All FCDI proposals, plus ground water development by STWs and deep-set STIs.k/ All FCDI proposals, plus ground water developmsnt primarily by DTWs.sI Does not include Tk Cr 8,460 allocatod under NIP for replacement of pre-1985 equipment and
facilities and for completion of Teosta Barrage and flood rehabilitation and projectstudies.
Source: NWP Summary Report (Docember 1986). Costs have been adjusted to reflect constant FY88prices, basd on CDP deflator.
6.43 In addition to the financial implications raised by the DTWscenario, there are difficult institutional and technical issues posed by thischoice. Currently DTWs are procured and installed solely by BADC, with theexception of one project area where BWDB is involved in DTW installation.
23/ An economic evaluation of alternative scenarios would consider only thenet change in investment costs, rather than the gross change in publicinvestment requirements. Given that constraints on the availability ofpublic resources are likely to be a major factor in the feasibility ofthe NWP, however, the focus on the requirements for public investmentfunds seems appropriate.
- 139 -
Annual installations of DTWs peaked in FY83 with 3300 units and have sincedeclined to a level of about 600 units in FY86 and 87. In addition toproblems such as constraints on agricultural credit, iistallations of DTWshave been hurt by the current policy of selling only to cooperatives. besidesthe 70Z subsidy on installation costs (representing a price reduction from Tk600,000 to Tk 175,000 per unit), maintenance of DTWs by BADC is alsosubsidized, with spare parts supplied at cost and no service charge. As aresult, maintenance is sub-standard and the performance of the pumps isunreliable; in FY87, 4000 BADC DTWs were inoperative, representing an idleinvestment cost of nearly Tk Cr 1000. Installations of DTWs have also haddifficulty in achieving adequate economies of scale, due to problems inmobilizing small farmers (up to 50 farmers per DTW) to take advantage of theavailable pumping capacity. Under an IDA-financed DTW project, for example,the average effective command area for a DTW has been only 20 ha. as comparedto 33 ha. assumed at appraisal. Efforts by BADC to improve the utilization ofDTWs under its Irrigation Management Program have not been successful due toweak management. While the problems of limited command area and unreliablemaintenance have reduced the financial viability of DTWs, their economicviability has been questioned due to reductions in international foodgrainprices in recent years.234 In summary, the recommendation of the NWPregarding DTWs needs to be reexamined. It is unrealistic to subsidizeinvestment in expensive DTW technology in areas suitable for STWs. Even if atsome point in time, there is a need to convert to DTWs (which is doubtful formost areas), it would be cheaper to provide support for such conversions atthe time that they are required, rather than spending scarce resources now inanticipation of an event that may never occur. For the present time, DTWsshould be limited to areas where existing ground water resources cannot beutilized by 6TW technology.
6.44 The lowest priority in the NWP ranking is assigned to FCD projects,and the NWP is sharply critical of the current public investment program (asjudged by the Third Five Year Plan target allocations) for what it regards asan undue priority given to FCD projects. In the absence of supplementaryirrigation to permit dry season cultivation, the increase in yields obtainablefrom FCD projects is limited to changes in wet season cropping patterns,particularly shifts to HYV varieties. Given that other constraints haveimpeded the shift to HYV varieties (such as weak agricultural extension, pooroperation of water control facilities, unavailability of quality seeds), thebenefits ach eved so far from FCD projects have been generally below theirpotential.25 On the other hand, FCD is often a pre-condition for theeventual introduction of irrigation in many areas of the country. Theexperience of the recent floods underlines the benefits of FCD in reducingrecurrent (and sometimes devastating) damage to lives, property, standing
24/ This indicates that the ERRs used in the NWP should receive a criticalreview.
251 Project completion reports recently prepared for seven water developmentprojects found that realized rates of return were generally one-half orless of the expected value, with six of the seven projects having an expost rate of return of 13? ur less.
- 140 -
crops and project infrastructure. This implies that the NWP may haveunderestimated the eventual benefits (and therefore the implicit ranking) ofFCD projects.
6.45 In order to realize the potential of FCD projects, greater attentionwill have to be given to O&M funding requirements. BWDB is currently respon-sible for over 400 completed piojects, ranging in size from small singlestructure schemes to large multipurpose projects. The NWP has estimated thatthe operating efficiency of these schemes is only about 45Z of their potentialperformance, while a 1984 survey of BWDB's operations found that about one-half of the existing projects were in need of substantial rehabilitation. Thereasons for this poor performance have been identified as: (a) inadequatefunding available for O&M; (b) weaknesses in BWDB's organizationalarrangements, O&M procedures and staff capabilities; and (c) insufficientinvolvement of farmers and farmer groups, as individual farmers often takeactions detrimental to the projects (such as cutting of embankments, a problemthat affects the majority of projects). According to BWDB's estimates, theshortfall in financing for O&M requirements during the last six years hasconsistently been on the order of about US$10 million (Tk Cr 32 in FY89prices) o,r about 401 of the funding requested by BWDB in the RevenueBudget.16 O&M requirements are expected to rise in the future as additionalprojects are completed and donor financing for initial start-up costs lapses.In addition, it is estimated that rehabilitation on projects allowed todeteriorate in the past may require at least Tk Cr 300 to repair, which wouldimply an annual investment cost on the order of Tk Cr 50. Thus, BWDB's annualrequirements for O&M and rehabilitation works (not including FFW) could amountto Tk Cr 150 million (FY88 constant prices) by FY90, or approximately 30? ofBWDB's budget allocation (Revenue Budget plus ADP) for surface waterdevelopment in FY88.
6.46 BWDB has started to take actions to create a better balance betweenthe construction of new projects and O&M for existing schemes. In 1984, BWDBdivided its field organization into an implementation wing in charge of largeprojects under a Member (Implementation) and four Chief Engineers (Projects)and an O&M wing under a Member (O&M) and four Z- 1 Chief Engineers. Thisorganizational change has worked reasonably we' - in terms of increasing theattention given to O&H requirements. However, with the changing focus of BWDBoperations (most new projects generally include a large number of widelydispersed small schemes), there may be a further need to realignresponsibilities and staffing patterns. In the future, BWDB intends to expandits emphasis on rehabilitation and OWM as it develops experience and technicalcapacity in connection with ongoing schemes. Financing for rehabilitation andO&M is expected to be provided by: (i) improved cost recovery from benefi-ciaries, either cash or in-kind; (ii) continued subventions from the Revenue
26/ This estimate is based on requests prepared by BWDB's fielddivisions and does not draw on a uniform methodology for costestimation. Under the Second Small Scale Flood Control, Drainageand Irrigation Project, BWDB has agreed to establish an O&M CostCell to improve the accuracy of future requests for O&M financingof completed projects.
- 141 -
Budget, particularly for projects such as FCD that do not lend themselves todirect cost recovery from the beneficiaries; and (iii) increased donorfinancing on a long-term declining basis to augment the funds available fromthe other sources. Given the technical difficulties involved in implementingdirect cost recovery and the limited flexibility of the Revenue Budget,supplemental donor financing for O&M is expected to be required for a numberof years in order to carry out this program.
6.47 Looking at the prospective investment costs implied by the NWP, therecommendations do not appear to be out of line. The most realistic planbased on STW technology (Plan II) would require an average annual publicinvestment cost on the order of Tk Cr 260 (FY88 constant prices). To thisshould be added the annual requirements for O&M and rehabilitation costs(about Tk Cr 150), an amount that will increase over time as additionalprojects are completed. In contrast, the budget allocation for water resourcedevelopment in the FY88 ADP was approximately Tk Cr 575, so the NWP proposalscan be accommodated within the existing budget allocations if the Governmentis willing to reprioritize the investment program. It is likely that the unitcosts assumed by the NWP will prove optimistic, however, given the persistentoccurrence of implementation problems. The implementation of the NWP maytherefore require an increase in funding over time. In order to achieve thisincrease in a cost-effective manner, it will be necessary to build up theproject pipeline in a gradual manner to avoid over-taxing the capacity of themain implementing agencies, particularly BWDB. It will also be necessary forthe Government to address the problems in project implementation that affectthe performance of the current expenditure program.
6.48 In summary, the NWP states that the weak project pipeline and thepoor implementation performance of public sector agencies constitute the mostserious constraints to the realization of a rational plan for water resourcedevelopment. This situation is compounded by the government's reluctance touse foreign technical assistance to prepare ar. adequate pipeline o' projects.BWDB has recently begun to address problems of project delays by instituting aproject monitoring system. This effort needs to be combined with an improvedforward budget system in order to achieve a better allocation of scarce localresources.
6.49 A second problem identified in this discussion is the criticalneglect of operations and maintenance. The poor maintenance of BADC-installedDTWs and the inadequate funding of agricultural extension services demonstratethat this problem affects other programs as well, which are needed to achievethe benefits of irrigated agriculture. There are several measures that can betaken to address this problem. The first is to transfer responsibility forO&M wherever feasible to the direct beneficiaries. In the case of pumpedirrigation, this can best be done by selling the equipment to user groups andencouraging the private sector to provide repair and maintenance services.For other types of irrigation schemes, it may require the formation of wateruser groups which have the authority to levy water charges and use theproceeds for maintenance purposes. The anticipated transfer of someirrigation projects to the upazilas, particularly under current regulationswhich limit the use of government grants for maintenance purposes, is unlikelyto be successful due to a lack of financial resources at the upazila level.
- 142 _
Where it is not feasible to transfer responsibility for maintenance activitiesto direct beneficiaries (such as flood embankments, major pumping stations,etc.), it will be necessary for the Government to provide adequate recurrentfunds to support O&M activities. Finally, O&M funding needs to be givenhigher priority in the planning and budgeting process. In cases such as BWDB,this may require institutional changes to focus attention on O&M concerns; inother cases, it will require training and education programs. Given theimportance of O&M programs for the development of agriculture, it would beappropriate for the donors to finance O&M on a long-term declining basis.
6.50 Finally, the last issue raised by the NWP is the question of usersubsidies in the water sector. Subsidies are a powerful tool in the publicexpenditure program for achieving well-specified objectives. Unfortunately,there is often a tendency to suggest subsidies as a first response to aproblem, rather than as an exceptional measure. In terms of public investmentpriorities, this is a damagi:ag approach, given the serious constraints onlocal resources that dominate the outlook for the budget. The previousdiscussion on the implications of DTW subsidies for the cost of the NWPillustrates the substantial fiscal impact that subsidy programs can have.Widespread subsidies in water resource programs, given that the unit costs ofpublic interventions are likely to go up as the sector takes on increasinglycomplex irrigation projects, would almost certainly result in a reduction inthe size of the public investmert program and a lower rate of growth inagricultural production. Subsidies cannot be ruled out completell as thereare strong arguments for their use in clearly defined situations.- . However,a strong effort to limit reliance on subsidy programs should continue to be animportant part of the agriculture expenditure program.
Forest, Fisheries and Livestock
6.51 Forest. Forestry accounts for about 3Z of GDP. About 9Z of theland area is under forest, the great majority in areas which are presentlyinaccessible. In most other regions, there is a shortage of wood, leadingincreased use of cattle dung and agricultural by-products as fuel andproblems of raw material supply for wood-based industries. Public expendi-tures for forestry are provided under the Forest Department of the MOA. InFY89, the ADP budget allocation for the Forest Department equaled Tk Cr 56.1,of which the largest share was allocated to two donor-financed projectsconcentrating on coastal mangrove plantations (Tk Cr 24) and upazila socialforestry (Tk Cr 18.5). The Revenue Budget allocation for forest activitieswas Tk Cr 14.6, while revenue collections from the sale of timber and otherforest products was expected to yield Tk Cr 51. Thus, the operations of theForest Department are almost entirely self-financed as a result of costrecovery charges. Besides the budget allocations for the Forest Department,the FY89 ADP includes a small allocation for the Bangladesh Forest IndustriesDevelopment Corporation (Tk Cr 3 for a rubber plantation project and Tk Cr 1.1
27/ For example, most countries have found it impossible to achieve fullcost recovery for large FCDI projects. In this situationt, coverage ofO&H costs may be a more appropriate target in practice.
- 143 -
in technical assistance), with Tk Cr 0.8 in expected dividends for the RevenueBudget.
6.52 There is a need for increased public investment in afforestationprojects--mangroves, watersheds, and barren lands--and social forestryprograms, the latter of which should take place through the upazilas. Asthese projects are unlikely to lead to significant cost recovery in the nearterm, additional public resources will be required by the sector. At the sametime, the current emphasis on mechanized forestry extraction should bereexamined in terms of Bangladesh's comparative advantage in wood-basedindustries. The financial performance of public sector paper mills, which area large user of forest products, has been generally poor due to price controlsand poor management. According to BCIC's FY86 Annual Report, public sectorpaper mills had negative profitability (Tk Cr -3) on sales of Tk Cr 25 andwere essentially bankrupt. Thus, there may be justification for shifting thefocus of public sector forest programs toward socially-oriented activitieswith lower prospects for direct cost recovery, while requiring that activitiesbased on forest product extraction be operated according to commercialstandards of financial viability.
6.53 Fisheries. Fisheries contribute approximately 32 to GDP. Fishingis important in terms of employment and nutrition, with about 8Z of thepopulation (most of them poor) depending on fisheries for their livelihood andmost of the animal protein in the national diet stemming from fish. Inaddition, shrimp production has developed in recent years as a major exportactivity, accounting for approximately 112 of total export earnings in FY88.The potential for growth in the sector is substantial, as current fish yieldsare low and have been declining (except for shrimps) in recent years. Publicsector involvement can be important in facilitating a transition fromtraditional capture fisheries with little or no investment requirements toplanned exploita'-ion involving the application of modern fish culturetechniques with significantly greater requirements for public and privatesector investment. The sector has received relatively low priority in thepast, and public sector interventions have often been poorly conceived andmanaged. Thus, institutional and sectoral reforms will be essential in orderto establish a better basis for public expenditures in the future.
6.54 The FY89 ADP budget allocation for fisheries amounts to Tk Cr 64.3,of which about one-third (Tk Cr 21.7) is allocated to a donor-financed shrimpculture project, with the remainder allocated to a variety of activities, mostof which fall under the Department of Fisheries (DOF) in the Ministry ofFisheries and Livestock. The FY89 Revenue Budget allocation for fisheries isTk Cr 14, most of which is used to provide extension services at the upazilalevel. In the future, it is recommended that public expenditures in thissector should increase significantly, aiming for a doubling of the budget byFY95. This would allow the completion of ongoing projects in shrimp cultureand aquaculture, plus additional investments in the following activities:
(i) Additional infrastructure to support the expansion of shrimp culturein the private sector (along the lines of the current shrimp cultureproject), aiming for an incremental increase in shrimp culture land
- 144 -
of about 6000 ha per year by FY95 at an estimated cost on the orderof Tk Cr 20 (FY88 constant prices) per year.
(ii) Massive stocking of open public waters, such as rivers and floodplains, at the onset of the monsoon season. Public stocking isnecessary because direct recovery of stocking costs is not possiblein this season and hence not attractive to the private sector,whereas costs can be recovered by a private investor for a secondstocking as the flood waters recede. The production of fish fryshould take place in private sector hatcheries, as hatcheriesmanaged by DOF have a record of high costs and poor yields. Aimingat an FY95 target of stocking 500,000 ha of open waters at a cost inconstant prices of about Tk 5000/ha, the cost of this program wouldbe about Tk Cr 25 on an annual basis. In addition, the Governmentshould consider the possibility of providing support for thedevelopment of quick-yielding pond fisheries to be managed by theprivate sector.
6.55 Areas of concern in this sector include: (i) weak extensionservices, particularly for pond fisheries; (ii) involvement of DOF inactivities which are best left to the private sector, such as direct fish andfry production and the supply of inputs such as fish nets; (iii) the need toimprove cost recovery, of which the most important measures are a plannedexport cess on shrimp exports (0.4-0.92 of the value of shrimp eyports),direct charges on beneficiaries of public infrastructure (including an annualfee of Tk 1500-3000 per ha on improved shrimp culture areas) and betterlicensing arrangements for public waters leased to private fishermen; and(iv) improved management of DOF and BFDC, addressing critical areas of staffmotivation and quality, overstaffing, excessive administration costs(including over-investment in infrastructure) and inadequate allocations foroperations and maintenance.
6.56 Livestock. The livestock sector contributes about 52 of GDP. Keyroles of the sector include the supply of bovine draft power for cropagriculture and animal protein for human consumption. Due to importrestrictions on mechanical power tillers, animal draft power is becoming anincreasing constraint on crop production, while the declining availability ofland for fodder points to a declining trend in the availability of draftanimals. Per-capita availability of animal protein has declined for allcategories of livestock except for chicken, which is less dependent on fodderland.
6.57 Public expenditures in the sector have focused on Upazila LivestockDevelopment Centers (ULDCs), of which there are currently 200 with eventualplans to establish them in all upazilas. In the FY89 ADP, the livestocksector received an allocation of Tk Cr 47.4, of which 602 was allocated for asingle donor-financed project to expand the provision of infrastructure(ULDCs, vaccine production, etc.). The FY89 Revenue Budget allocation isTk Cr 37.4, the largest share of which goes to support upazila levelactivities. Cost recovery in the sector is minimal, with revenue receipts ofTk Cr 9.5 expected in PY89, almost all of -hich will come from sales by publicsector dairy and poultry farms. Excluding farming activities, the Department
- 145 -
of Livestock Services (DLS) employs approximately 8000 staff, of which 3000are located at headquarters and in district and project offices, while 5000are located at the upazila level.
6.58 Present plans for the public sector appear to be overly ambitious.The DLS is involved in a wide range of direct production activities (vaccines,day old chicks, hatching eggs) which are losing money and, because of theirpoor cost recovery, inhibit the development of private sector suppliers. Thesystem of ULDCs has had limited effectiveness due to inadequate allocations ofoperating funds, so that even minimal in-field services are generally notavailable. In order to reduce overheads and achieve better integration withother extension activities, the Government should consider merging the DLSfield staff and facilities into DAE. Finally, the Government needs to take amore positive stance towards the development of private veterinary services,which could provide a basis for delivering services in the long run.
Rural Development and Institutions
6.59 Cooperatives. The FY89 ADP provides Tk Cr 75.5 for cooperativedevelopment, of which the largest share (Tk Cr 70.9) is allocated to donor-assisted projects under the Bangladesh Rural Development Board (BRDB), whilethe remainivg amount is provided to the Rural Development and CooperativesDivision of MLGRDC. The FY89 Revenue Budget provides Tk Cr 38.4 for coopera-tive development, of which Tk Cr 15.0 covers operating costs and personnel forthe Cooperatives Division, Tk Cr 14.3 is provided as grants-in-aid to varioustraining academies and BRDB, and Tk Cr 7.8 represents a loan to the BangladeshSamabaya (Cooperatives) Bank. Despite this substantial funding for coopera-tive development (Tk Cr 114 in total), there is widespread opinion thatcurrent programs based on the original Comilla-type model have had limitedsuccess, and a period of consolidation rather than continued expansion isnecessary. Many of the major donor-financed cooperative development projects,such as Rural Development II, Northwest Rural Development Project, SouthwestRural Development Project and Noakhali Rural Development Project are drawingto a close. These projects have developed substantial infrastructure tosupport the cooperative system in its current form, and a period of gradualpublic sector withdrawal of staffing and financial support is necessary toencourage the cooperatives to concentrate on the original goals of autonomyand self-reliance. It is therefore recommended that funding for this activitybe gradually reduced over the next several years.
6.60 One of the major criticisms of the cooperative program is that ithas failed to reach the rural poor. On the other hand, BRDB has devotedconsiderable effort during the past three years to its Rural Poor Program,which appears to have achieved significant initial success. Funding for thecontinuation of this program has been provided by several donors, and themajor concern at this point is to control the expansion of the program to arate that can be managed effectively. The Government has indicated a stronginterest in expanding activities which benefit the rural poor. Various NGOs,such as the Grameen Bank and the Bangladesh Rural Advancement Committee(BRAC), have achieved considerable success in the development of programs toassist the rural poor. Proposals are currently being prepared for theestablishment of an independent foundation (the Khudra Rin Foundation) that
- 146 -
would channel public funds to NGOs involved in providing programs for therural poor. This proposal appears to have considerable merit as compared topast approaches where the Government has tried to manage such programsdirectly. On this basis, an expansion of public expenditures in poverty-oriented programs appears to be both feasible and desirable.
6.61 Rural Infrastructure. The FY89 ADP provides Tk Cr 121 for thedevelopment of rural infrastructure, the major share of which would beundertaken in connection with integrated rural development projects.Integrated projects have not worked well in the past, and they have createddifficult problems of coordination. There is evidence, however, that theprovision of rural infrastructure has been an effective method for increasingrural productivity and improving the delivery of public services. The majorissue in this regard is the need to increase local responsibility forconstruction and maintenance of rural infrastructure, particularly through thegeneration of local revenues. These issues are discussed in more detail inChapter 12.
Summary
6.62 Table 3.2 summarizes the major recommendations of this chapterregarding the level and composition of the public expenditure program inagriculture and water resources. In the short run, (FY89-90), the activitieswhere additional expenditures are needed include flood rehabilitation, O&M forflood embankments and irrigation facilities, .improved operational support forinstalled DTWs and LLPs (pending privatization of maintenance functions) andincreased local operating funds for agricultural extension. In the longerrun, (FY91-95 and beyond), there are substantial opportunities for increasedpublic expenditures in the agricultural sector in order to support long-termgrowth in output. This assumes, however, that the cost-efficiency andimplementation capacity of public sector programs can be improved. Experiencein developing countries over the past twenty years has confirmed that theefficiency of public investment is ultimately a major determinant of the lo..g-term growth capacity of an economy. In the case of Bangladesh, it is likelyto spell the difference between a declining standard of living and increasingdependency on the one hand and a slow but measurable improvement in the livingconditions for a majority of the population on the other.
6.63 The findings of this review indicate that the Government should takea careful look at current public expenditure priorities and the role of thepublic sector ir. providing agricultural services. Several conclusions standout regarding the current expenditure programs:
(i) Many important agricultural services which should remain with thepublic sector are hobbled by shortages of local operating costs,often of a modest amount (e.g. agricultural extension and research).
(ii) In contrast, services where tho private sector should be involvedare hampered by public sector agencies using subsidies andrestrictive c^nditions to maintain their position, generally at theexpense of sefrvices to the farmer (e.g. BADC installation and
- 147 -
maintenance of DTWs, DOP involvement in fish production activities,DLS).
(iii) The cost of public sector programs is likely to increasesubstantially in the future as unit costs rise (FCDI projects), newactivities are undertaken (open water fish stocking, rural povertyprograms), and services are extended to a wider population(agricultural credit and extension services). Given the limitationson public resources, tnis will only be possible if subsidies areminimized (except in cases of genuine need) and the public sectorrestricts its involvement in activities that can be turned over tothe private sector.
- 149 -
Chapter VII
Industrv
7.1 The current policy framework for public investment in the industrialsector was established in the New Industrial Policy of 1982 and subsequentlyupdated in the Revised Industrial Policy of 1986. Explicit guidelines havebeen provided for public sector investment, which is intended to supportindustrial development in those areas where private sector initiatives are notadequate. Exclusive public sector involvement has been narrowed to a ReserveList cf strategic industries, comprising: (i) military goods, (ii) generation,transmission and distribution of electricity (excluding standby generation),(iii) mechanized forest extraction, (iv) telecommunications, (v) airtransportation (excluding cargo) and railways, (vi) atomic energy, and(vii) currency printing and minting. This is a major improvement overprevious regulations, which excluded the private sector completely from basicindustries such as textiles, jute, banking and insurance, among others.Public enterprises have been encouraged to reduce their dependence onfinancing in the ADP by relying on self-generated funds and joint ventureswith local and foreign private investors. Approximately 382 of industrialcapacity in jute, 702 of fixed assets in textiles, 12Z in the sugar and foodindustries, 102 in the chemical industries, and 42 of fixed assets in thesteel and engineering sub-sector have been privatized since 1982. In sectorswhere the private sector is expected to take the lead, investment by existingpublic enterprises is supposed to be limited to balancing, modernization,repair and rehabilitation activities (BMR). The Government has thereforeindicated that public investment will not be the major engine of growth in theindustrial sector and should be employed selectively where it has clearfinancial and economic justification.
7.2 The major share of public investment in the industrial sector takesplace through five public sector corporat ons, each of which includes a numberof individual manufacturing enterprises.lf The major corporations are:(i) Bangladesh Chemical Industries Corporation (BCIC), accounting for 25enterprises (including the Chittagong Urea Plant) which cover 10OZ of domesticcapacity in fertilizer, cement production and paper mills, as well as firmsspecializing in products such as batteries, matches and sheet glass;(ii) Bangladesh Jute Mills Corporation (BJMC), with 38 enterprises controlling55Z of operating looms in the jute sector; (iii) Bangladesh Textile MillsCorporation (BTMC), with 43 enterpri3es accounting for 602 of total textileyarn production and 5-7Z of domestic fabric production; (iv) Bangladesh Steeland Engineering Corporation (BSEC), with 21 enterprises providing productssuch as steel billets, plates and sheets, iron and steel pipes, vehicleassembly, machine tools, diesel engines, and electrical cables andtransformers; and (v) Bangladesh Sugar and Food Industries Corpo-ation(BSFIC), with 18 enterprises accounting for 10OZ of domestic sugar mills plusa vegetable oil mill and a spirits and alcohol manufacturing company. Thus,
1/ A sixth public sector corporation, the Bangladerh Forest IndustriesDevelopment Corporation, is discussed in Chapter 6.
- 150 -
despite the substantial divestiture program during the past decade, publicenterprises still account for a major share of production capacity in severalkey industries. Besides these five corporations, a limited amount of publicinvestment takes place in other industrial activities, such as the ChittagongExport Processing Zone and the industrial estate program under BangladeshSmall and Cottage Industries Corporation (BSCIC).
7.3 The United Nations mission ha3 estimated the flood rehabilitationrequirements of the industrial sector as $225.2 million, or 202 of totaldamages.2- One of the major constraints on flood rehabilitation efforts isexpected to be access to term investment credit, which is discussed in moredetail in this chapter.
7.4 The public investment program for industry has shown largevariations over the period FY81-89 (see Table 7.1) due to several large lumpyinvestments in fertilizer plants. When the fertilizer plants are removed, theoverall trend in expenditures is similar to that of agriculture, with sharpcuts in FY83 and FY86 and a generally rising trend since then. Publicinvestment has fallen in real terms for most industrial sectors, particularlyfor jute and steel and engineering. Only textiles and wotherl industries haveshown a rising trend in investment in real terms. On an aggregate basis,therefore, the pattern of public investment during the FY81-89 period appearsto be broadly consistent with the guidelines established in the NIP.
7.5 In order to examine the viability of the public investment programin more detail, financial and economic rates of return have been reestimatedfor a broad sa,mple of industrial projects using consistent cost/benefitmethodology.31 While the rates of return in most cases are significantlylower than the estimates provided in the original PPs (reflecting flawedproject appraisal methodology in many of the feasibility studies), thisexercise indicated that the major share of the investment program is ofacceptable quality. Some 85-90Z of the proposed investment program in termsof cost, including most of the fertilizer projects, appears to be viable on aneconomic basis, although financial viability is not always satisfactory (e.g.,the Chittagong Urea Plant because of large cost overruna). On the other hand,
2/ This estimate has subsequently been reduced to $62 million.
3/ This exercise, which was carried out specifically for the publicexpenditure review, was based on a revised TFYP project list which wasadjusted to remove projects considered unlikely to be initiated in thenear future (based on preparation status and committed funding). Thereestimation of the economic and financial rates of return was based ondata contained in the original PPs, which were adjusted in a number ofcases to reflect updated information on the supply of raw materials, marketdemand, and cost changes. The shadow prices in the economic evaluationwere based on estimates prepared for the TIP study and updated usingsubsequent information.
- 151 -
Table 7.1: Public Investment Proara_--Industry(Tk Cr; based on OP budget allocatione)
AnnumiPercentage PercentageDistributton Change
FY61 FY82 FY68 FY84 FY86 FY6S FY87 FY8S FY89 FY81 FY69 FY81-89
Chemical Industries
cii.tiIIzr A54.5 97.6 106.0 181.6 166.9 852.5 655.6 882.4 93.0 48X 22X -8xOther /a 60.2 106.5 50.8 110.4 67.8 9.6 16.0 47.4 96.8 17X 238 ON
Jute 14.1 21.6 10.9 16.9 18.5 0.6 6.8 6.1 5.8 41 lX -12X
Textiles /b 44.6 52.7 59.2 61.0 48.8 44.5 96.6 91.8 99.7 18X 24X llX
Steel andEnolnerIgg 89.0 61.1 26.3 7.0 9.8 15.8 15.9 15.4 86.8 11X 6X -1X
Sugaru*nd FoodIndu__ri-s 16.1 21.6 28.0 26.9 46.1 80.7 16.4 4.4 19.2 4X 41 aX
Other 27.8 45.2 39.5 42.1 66.0 48.9 69.9 57.5 70.8 OX 17X 121
Total 865.8 406.5 815.2 395.1 4C7.9 508.1 782.6 604.0 421.1 100X 1OOX 2X~~= m __ =
Real ExpenditureIndex le lOO 102 75 81 73 S6 117 64 64 /d
Real ExpenditureIndex (notIncludingfertilizer) /c 100 186 68 95 76 45 60 56 75 /d
/a Including BMEDC/BOOUC./b Including Bangladesh Handloo. Board and Department of Textiles./c Based on GOP price def later (FYS1=100)./d Etim"te.
the viability of 10-15Z of the proposed projects appears to be doubtful due toa number of factors, such as inadequate supply of raw materials (sugar andpaper mills), inadequate domestic demand (diesel engine factory) and anexcessive level of domestic protection (glass manufacturing). In addition, anumber of investments have no clear justification for inclusion in the publicinvestment program and could be left for private investors to take up. A listof projects with questionable viability and/or public sector priority ispresented in Table 7.2, along with recommendations regarding proposed actions.A cross-check of the FY89 ADP indicates that ten of the projects (accountingfor 14Z of the ADP budget allocation for the industrial sector) are alreadyunder implementation, most of them with committed donor financing. Thisindicates that there is scope for further pruning of the public investmentprogram in industry, both by applying stricter criteria for undertakinginvestment projects by the public sector and by improving the application ofcost/benefit methodology in the appraisal of projects.
- 152 -
Table 7.2. TFYP Industrial Project. with Quwetionable Priority
Estimated Plwned TFYP jncluded FYi9Ct;T"FYr) Al location in FYS9 Allocation
F-roject (Th Cr) (c CrO RAee_ndtlon- ADP (TII C)
P"E of Umnin Ci.. Divest and l*aveShoet Factory 14.9 10.0 for private Sector Yoe 2.8
Snprovemnt of Chittegna Economically unviableChemical Complain (CID Part) 50.8 11.0 (preaumd) Ye 8.7Development of Nrth _enalPap*r Hill 21.1 13.0 Econoacelly unviabie Ye 7.0
Cauetic Chlorlde Plant 20.0 2.0 Economical ly unviable -(pra d)
Sods Ash Coepiex 87.5 10.0 Eo ne ically unviable - _(prau_md)
bCIC Pharmaeutical Complex 15.0 1.0 Leavi for private Yoe 1.9Sector
Setting i~JIp/rovement ofClass Factory 5.0 2.0 Leav- for private sector - -
i>R of Chittaong SteelHills Lisited 1090.0 50.0 Economically unviable Ys 22.0
DU of Notel-x Divest and leave forCorporation Limiit-J 2.0 1.8 private ector -
E of Iang ladeeh Can Divest and leave forCopny Limited 8.s 8.5 private ector - -
Pro,grenive Manufacture of Unviable (prawumed)Rings and Spindles in S6M 4.9 4.0 mrket not eoteblieod -
High Voltage Cables and Appear, viable butConductorsMWg. Plant 7.0 5.8 market not established Ye 2.6
of Bangladesh Dieel Unlikely to be econo-Plant to Manufacture micelly viable andHigh Cylinder Engines 15.0 15.0 mrketable -
Prog iva Mufacturing Acona ical ly unviabilof e and Truck at PIL 5.0 5.0 (presumed)
Sponge Iron and Steel Complex 750.0 100.0 Unviable (praumd) -
Aluminum Rod Mills 10.5 4.0 Leave for private etor Y 4.5
BP Sheet Mg. Plant 60.0 S60 Leave for private sector - -
Alloy and Special Steel Plant 40.0 8.0 Unviable (likely) - -
Progreaeive Manufacturing of Leave for privateSeal Electrnic Component. 25.0 5.0 sector - -
Hoha-mdi Sugar Mi;II 58.0 80.0 Raw material supply - -inadequate
Etabliahmnt of a F"d 10.0 2.0 Leave for private sector - -Meal Plant for both Cattleand Poultry Feed
Establishmnt of a YeastManufacturing Plant 10.0 2.0 Leave for private aector
Expanelon of Dhaka Vgeteble Divest and leave for01i Industries Litd 1.8 1.8 private eector
Esport Marketing of Handloom Leave for privateProduct. 12.0 12.0 *eator - -
Integrated Schema for Devel- Unviable both financiallyop_ant of Sericulture 48.9 48.9 atd e cnomically Ye 7.8
Empanaion and Ibdernization Divest and leave forof FDC Studio 34.7 20.0 private sector Yea 8.5
Diltrict-baaed 24 Industrial Economl collEatete- 85.0 15.0 unju*tifia bI Ye 2.0
Totas f 2.9 9.W8
Totsl s Xof TFYP/FYS9 ADP Al location 1i6 141
- 153 -
7.6 In addition to direct public investment, manufacturing enterprisesreceive substantial financial transfers by other mechanisms that represent asignifi,ant diversion of public revenues to public corporations. It is beyondthe scope of this report to discuss all these channels in detail, but a briefdescription of them and some idea of their magnitude will give a better ideaof the level of financial transfers to public industrial enterprises:
(i) Direct Subsidies. Direct subsidies through the budget are limitedbecause they come under close budget scrutiny. In recent years, theonly subsidies provided in this manner have been to Khulna NewsprintHill to compensate for domq stic sales of newsprint at a controlledprice (Tk Cr 7.6 in FY88)4_ and Chittagong Steel Mills to subsidizethe manufacture of mild steel billets from pig iron on the groundsthat the Chittagong plant could not compete with private rerollingmills using lower priced scrap steel from old ships (Tk Cr 9.1 inFY88).
(ii) Internal Transfer of Funds/Transfer Pricing. A more common methodof providing subsidies is to control the price of intermediateinputs or transfer funds within a corporation to cover loss-makingactivities. For example, natural gas was sold at a subsidized pricethroughout most of the 19809 in order to hold down costs forfertilizer and power production. This had the effect, however, ofreducing internal cash generation by the gas companies andincreasing their dependence on public funds through the ADP tofinance new investments. An alternative method of covering lossesis cross-subsidization, either between closely related products(e.g., profits from sales of urea were used to cover losses on thedomestic production of TSP of about Tk Cr 35 in FY87) or bytransferring revenues between enterprises (e.g., BTMC uses theprofits earned by about one-third of its operating mills to coverlosses for the remaining two-thirds).
(iii) Access to ADP Financing. Becayse of weak profitability and lowinternal generation of funds,- most public sector industrialinvestments depend on the ADP for their investment financingrequirements. For example, in the FY89 ADP, out of an approvedbudget of Tk Cr 421.1 for industrial projects (including technicalassistance and self-financed projects), external financing sourcesare expected to provide Tk Cr 214.4 (51Z of the total), Tk Cr 181.0is expected to come from the government's resources (43Z of thetotal), and the corporations are expected to contribute onlyTk Cr 25.7 (62 of the total) from their own funds.
4/ Writing paper, which is also subject to price controls, does not receivea subsidy.
5/ As in most countries, this problem is compounded by the failure to adjustdepreciation chat, a for inflation.
- 154 -
(iv) Concessional Lending Terms and Debt Fnversions. Governmentregulations concerning the on-lending of public funds for industrialprojects are poorly monitored and enforced. The local currencyportion of the loan is often treated as an equity contribution.6/For the foreign currency portion of the loan, the Ministry ofFinance enforces payments only in the amount necessary to cover debtservice obligations to the donors. As the loans are often providedon concessional terms to the Government (the subsidiary on-lendingagreements may specify different on-lending terms for theenterprises), the result is that many firms receive capital inputson highly subsidized terms. In addition, when enterprises run intofinancial trouble and fail to cover their debt service obligationsto the Government, it is commonly agreed that the loans will berescheduled, interest payments reduceq and/or debts will beconverted into equity contributions 71. While financialrestructuring is justified at times in order to restore theviability of an enterprise faced with unavoidable losses, repeateduse of debt rescheduling in order to subsidize continuing lossesundermines the integrity of the lending process and encouragesenterprises to treat investment funds as a grant.
(v) Access to Financial Credits. In addition to investment financingthrough the ADP, public enterprises are often able to obtain workingcapital and overdraft financing from commercial banks (generally theNCBs) to cover operating losses. Given the poor financial conditionof many of the enterprises (BJHC in particular), a large amount ofthe loans will eventually have to be written off. While the fullcost to the budget for capital restructuring of the NCBs has not yetbeen computed (see the discussion of jute sector issues below), theGovernment has begun to recognize this problem by segregating theloans to jute mills and providing a nominal contribution through thebudget (Tk Cr 10 in FY89) to cover the interest cost on bankfinancing of jute mill losses. This allocation substantiallyunderstates the losses that will have to be borne by the budget inthe longer term.
(vi) Excessive Protection Levels. Most public enterprises benefit from ahigh level of tariff protection and/or quantitative restrictions,and it is doubtful that a number of the enterprises (such as paper
6/ While equity -n1tributions can be desirable to prevent enterprises frombeing under-capitalized (a common problem in developing countries), thedecision to inject equity is often taken without financial analysis orany expectation of receiving a return on equity.
7/ For example, debt conversions in the FY88 budget included Tk Cr 9.0 forBSCIC, Tk Cr 52.7 for BOGHC, Tk Cr 35.6 for BSF;., Tk Cr 39.4 for BCICand Tk Cr 5.7 for Bangladesh Parjatan Z'orporation. The total amount ofdebt relief (Tk Cr 142.4) was almost as large as the amour.<- of localcurrency resources provided to support new investments for the industrialsector in the FY8s ADP.
_ 155 -
mills, sugar mills, steel and engineering products, etc.) would beable to maintain operations in a more competitive environment.81The cost to consumers can be very high (e.g., domestic sugar priceswere 30Z above the equivalent international price in recent years,except through PFDS ration channels), and the resulting revenue isoften used to sustain inefficient operations by the public sectorenterprises rather than promoting viable investments. Protectioncan also be applied against domestic private producers, such as theban on sales of raw sugar to gur producers, thereby allowing publicsector sugar mills to offer prices to cane growers 102 below marketlevels.
7.7 The implication of this analysis is that public sector industrialenterprises are sustained by a complex web of implicit subsidies and benefits,the total cost of which to the budget and the economy may be much greater thanthe funds provided through the public investment program. The Government hasmade progress in reducing these costs in recent years through divestiture ofpublic enterprises, introduction of market pricing, and rationalization oftariff policies. As the number of public industrial enterprises has shrunk,however, the financial performance of the firms remaining in the public sectorhas deteriorated. Public investment policy can address only one aspect ofthis problem, and a broader approach to sectoral issues will be needed in themedium term. For the purposes of the public expenditure review, however, theremainder of this section will focus primarily on investment priorities.
7.8 Fertilizer.9' Fertilizer consumption has increased rapidly sinceindependence, with an average annual growth rate of 9.2Z. However, there isstill considerable scope for increased consumption of fertilizer, due to lowintensity of use, an inappropriate mix of fertilizer types (between urea, TSPand MP) and limited spread of HYV crop varieties that make the most efficientuse of chemical fertilizers. Based on the availability of large reserves ofnatural gas at favorable extraction costs, the Government has supported thedevelopment of an extensive production capacity for urea fertilizer in thepublic sector. Following a period of rehabilitation of existing plants duringthe 1970s, installed capacity expanded significantly with the commissioning in1982 of the Ashuganj plant (520,000 tpy of urea), the Polash plant in FY87(95,000 0py of urea) and the Chittagong plant i.L FY88 (561,000 tpy ofurea).i°Q In terms of future additions to capa:ity, the Jamuna ammonia/urea
8/ Despite the high level of protection on average, the pattern of protectionis uneven and may discriminate against certain types of activities (e.g.,the TIP study indicated that fertilizer production has had a negativeeffective rate of protection in the past due to subsidies to domesticconsumers)
9/ This section is based on Bangladesh: Fert,lizer Sector Review, World BankReport No. 7145-BD, August 31, 1988 (green cover).
10/ In addition, Lhe Chittagong TSP plant, which was completed in 1968-70,has an installed capacity of 153,000 tpy of TSP based on imported phosphaterock and sulfur.
- 156 -
plant is expected to start construction soon, with a planned capacity of561,000 tpy of urea to come on stream in FY92-93. In addition, there aretentative plans for an export-oriented plant at Chittagong (the KAYCO project)in the future. Bangladesh currently has a total installed capacity foL uireaof 1,630,000 tpy, which will increase to over 2 million tpy when the Jamunaplant is commissioned. Domestic consumption of urea was 945,000 tons in FY87and is expected to increase to the range of 1.5-1.8 million tons by FY95.Thus, Bangladesh will have significant surplus capacity in urea production atleast through FY95, part of which can be used for export production.
7.9 Given the favorable cost of natural gas, it appears that Bangladeshhas a comparative advantage in urea production for the regional Asian market.This situation, in which Bangladesh has moved from being a net importer to anexporter of fertilizer, sharpens the focus on issues of pricing and cost-efficiency in order to ensure that the fertilizer industry maintains itseconomic and financial viability. With regard to investment alternatives(assuming that the Jamuna plant goes ahead as scheduled), the outstandingissues are:
(1) whether to proceed with the proposed KAFCO export plant;
(ii) the scale of future plant size;
(iii) rationalization of existing urea production facilities, particularlythe high cost Fenchuganj plant; and
(iv) continued operation of the Chittagong TSP plant.
7.10 Bangladesh has yet to establish a capability for selling ureacompetitively in the international market in significant quantities. Exportsales will encounter higher market risks than production for the domesticmarket, due to inherently volatile market demand and prices. In thissituation, it would be desirable for additions to capacity that are aimed atexport sales to be based on joint ventures in order to share the market riskand take advantage of external technical expertise in export marketing.Because of the high cost for new plant additions, it may not be possible tofinance additional capacity entirely with private sector financing. However,given that export sales are essentially a commercial proposition, it would bedesirable to minimize the impact of new plant additions on the ADP by relyingon self-generated funds as much as possible. Considerations of costcompetitiveness should also determine the choice of plant size and location.Under current technological conditions, there are considerable economies ofscale in plant size, particularly in terms of reducing the marginal operatingcosts of production, which are highly sensitive to energy efficiency. Forexample, the variable operatirg costs of the relatively small Polash plant areapproximately 50X higher than the costs per ton at the Chittagong 1 nt,despite the fact that both plants were constructed quite recently. Thismeans that additions to capacity will generally be quite large in relation todomestic demand, implying that Bangladesh will continue to have an exportable
11/ The Polash plant was constructed using tied bilateral grant aid.
- 157 -
surplus of varying amounts for the foreseeable future. As regards plantlocation, production aimed at export sales would be most economic located ator near the existing Chittagong facility.
7.11 The emergence of surplus production capacity provides an opportunityto rationalize producti.on at the existing facilities. The variable operatingcosts of the Fenchuganj plant are the highest of all the current productionfacilities, approximately 902 higher tnan the Chittagong plant, as a result ofthe plant's small size and outdated technology (it was commissioned in 1961and modernized in the 1980s). Since production at the Fenchuganj plant is nolonger necessary to meet domestic demand, its operations should be judged onan economic basis as compared to using some of the production from theChittagong plant for consumption rather than export. A study is being carriedout at present to determine possible cost saving measures at the Fenchuganjplant. The results of this study should be used to decide whether to maintainthe Fenchuganj plant in operation or close down its operations. In themeantime, production of ammonium sulfate at Fenchuganj (which is usedprimarily by the tea gardens) is uneconomic in view of the very favorableprice for imports.121 and the ammonium sulfate unit should be shut down.
7.12 The other facility that needs to be addressed is the Chittagong TSPplant. Given that raw materials have to be largely imported, new investmentin this type of facility would not be justified. Even on a "sunk-cost" basis,the economics of producing TSP at the existing plant justify domesticproduction of TSP only when the import price is relatively high. This arguesfor operating the plant in a flexible manner, with BCIC taking advantage ofthe option to "make or buy" in order to obtain supplies of TSP at minimumcost.
7.13 Implicit in the previous discussion on plant rationalization andinvestment decisions is a critical assumption concerning pricing policies forfertilizer. Given that urea 's a tradable commodity for which Bangladesh hassurplus production capacity, the appropriate price for evaluating newinvestments and measuring the yr7 fitability of existing plants is the exportparity price to Asian markets.13 In contrast, the Government has maintain7dan ex-factory pricing formula based on the estimated costs of production.1-This system is a holdover from the period when BADC had monopoly control overfertilizer distribution and the Government subsidized fertilizer prices at
12/ Low priced ammonium sulfate is available on the world market as a by-product from caprolactum and steel producers.
13/ For TSP, import parity is a more appropriate price objective.
14/ Up to May 1988, the pricing formula for urea varied by factory. The pricehas now been set at a uniform Tk 4025/ton for all factories, with theexception of the Chittagong Urea Plant.
- 158 -
below world market levels.L51 The Government has now made substantialprogress in liberalizing the retail distribution of fertilizer, and it hasstated its commitment to deregulate the fertilizer marketing system by FY92.It is anticipated that BADC will continue to participate in fertilizerdistribution on a non-discriminatory basis, with responsibility for ensuringadequate fertilizer supplies in difficult to reach areas. However, theGovernment has not yet revised its pricing structure for fertilizer productionand distribution. In order to provide efficient price incentives for theproduction and consumption of fertilizer, the following changes in the pricingstructure should be considered by the Government. First, BCIC should base itsex-factory price for fertilizer on the current (not averaged) export parityprice for Asian markets and rationalize its production and investmentdecisions within this framework. The Government has indicated that it willstabilize the domestic price of fertilizer to farmers on the basis of athree-year rolling average of international prices. In the context of aderegulated fertilizer distribution system in which traders are allowed to buydirectly in bulk from the factories, this implies that the Government willhave to operate a price stabilization fund to cover the difference betweenBCIC's ex-factory price based on export parity and the price paid bydistributors. The remained unanswered questions involve matters of accountingprocedures, reimbursement mechanisms, and management and financing of thestabilization fund. While these matters involve tricky technical questions,they should not be allowed to preempt the basic economic principles of thepricing strtucture.
7.14 The remaining issue that needs to be addressed is the financialrestructuring of the fertilizer plants. The large financial losses sustainedby the fertilizer industry over the past several years reflect thegovernment's decision to allow farmers to benefit from the depressedinternational price for urea.l61 Other problems, such as the rapid costescalation of the Chittagong Urea plant due to international exchange ratemovements, have contributed to placing the fertilizer companies in poor
15/ Much of the subsidy element in fertilizer pricing was due to the subsidizedprice of natural gas, which was passed on to consumers through a cost-pluspricing formula. In recent years, the Government has increased the priceof natural gas toward its estimated long-run marginal cost. Ex-factoryfertilizer prices remained unchanged between July 1985 and May 1988,however, despite the fact that the price of gas increased by 140Z (fromTk 11.77 per mscf to Tk 28 per mscf). As a result, the fertilizer plantssultained large financial losses and could not cover their depreciationand interest charges. The Government justified this policy on the basi.that the retail price of urea was slightly in excess of the export parityprice measured on the basis of the depressed international price for ureaprevailing in 1986. While the increase in ex-factory urea prices announcedin May 1988 has helped to reduce these financial losses, the current priceis still at least 1OZ below the cost o). production.
16/ As an alternative, the Government could have chosen to maintain fertilizerprices about international levels in order to benefit from a pricewindfall, as it did with petroleum pricing.
- 159 -
financial condition. In this situation, financial restructuring is warrantedin order to recognize past losses and provide a sound financial basis for thecontinued development of the industry. ThM. should be undertaken inconjunction with the pricing reforms described above in order to achieve itsdesired impact.
7.15 Other Chemical Industries. Investment by BCIC in projects otherthan fertilizer has been highly sensitive to the overall budget situation,with major cuts taking place in FY83 and FY86 (the budget allocation in thelatter year fell to Tk Cr 9.6). Since then, investments have increasedrapidly, rising to Tk Cr 96.3 in FY89, with the major projects being: (i) BMRand expansion of Chhatak Cement Factory (Tk Cr 45.8); (ii) four projects underthe self-financed investment category (Tk Cr 23.9); and (iii) a number ofprojects with nominal funding allocations, including rehabilitation of papermills (some as joint ventures), BMR of Usmania Glass Sheet Factory andimprovement of the Chittagong Chemical Complex.
7.16 The Chhatak Cement Plant is based mainly on imported limestone fromIndia; however, the availability of imported supplies has not been a problem.The plant serves a small portion of domestic demand, accounting for about 15Xof domestic consumption in FY85. Reestimation of the economic and financialrates of return for the project indicates that the project is potentiallyviable with a FRR of 25.42 and an ERR of 22.6Z. Price controls were recentlyremoved on cement, and prices were last increased in July 1988. This removedthe major problem that had constrained the viability of investments in thissub-sector in the past.
7.17 Four paper mill projects are included in the FY89 ADP, three asjoint ventures, of which the most important is the development of North BengalPaper Mills. The Government intended to partially privatize North BengalPaper Mills during FY88 by selling 49? of its shares, but the approach waswithdrawn when it was determined that the problems faced by the enterprisewere more fundamental than weak management. This result is confirmed by thereevaluat on of the project, which indicates a FRR of 11.2Z and an ERR of-17.OZ.17 I This is consistent with the finding of the TIP study that thepaper industry has negative value-added at border prices because of its highcapital intensity and poor fit with factor eDdowments in Bangladesh. In thissituation, the Government would be better adv.lsed to terminate furtherinvestment and plan for a gradual phasing down of public sector production.This would permit a reevaluation of the government's objectives for the forestsector, which should shift away from industrial forestry management towardafforestation and social forestry programs.
7.18 The remaining investments in the FY89 ADP for the chemicalsub-sEctor include activities such as the manufacture of glass sheets andimprovement of the Chittagong Chemical Complex. These are import substitutionprojects, which, because of their small scale geared to low domestic demand
17/ These estimates are substantially lower than the values provided in thePP, which contains a number of questionable assumptions on methodologicalgrounds.
- 160 -
and their high capital intensity, generally result in low or negative value-added with high rates of protection needed to make them financially viable.For example, the attempt to reestimate the ERR for the Usmania Sheet GlassProject showed that costs would exceed benefits no matter what discount ratewas used, indicating that operation of the plant (even if the investment costswere free) would result in a continued net loss to the economy. Theseprojects are not consistent with the government's policy of efficientindustrial development and should therefore be reviewed for possible deferralor termination.
7.19 Jute. The problems of the jute sector reflect a declining industryfacing difficult questions of excess capacity and low efficiency. Jute hasbecome progressively less important to the economy in relative terms as newareas of non-traditional export activities are opened. Nevertheless, raw juteand manufactured jute goods still provide almost 40? of Bangladesh's exportearnings (FY87) and account for approximately 10? of employment and 7Z of GDP(1Z of monetized GDP). The Government cannot afford to neglect the problemsof the jute sector, despite the fact that their resolution will requiresubstantial political courage.
7.20 Public transfers to the jute sector over the past several years,most of which have been indirect and not reflected in the budget (therebydiluting their political impact), are very large and have contributed toperpetuating the existing problems, rather than working toward a feasiblesolution. The largest amount of funds has been provided through directedcredit programs from the NCBs to BJMC and BJC in order to provide workingcapital and term credit to cover operating losses. For the five-year period1982-86, the net amount of new loans advanced to the two corporations wasTk Cr 526, of which more than 98? was provided by the NCBs. Given the poorfinancial performance of the jute corporations (both BJC and BJMC hcvenegative net worth and are losing money continuously), neither of them islikely to be able to repay the loans. As the total amount owed exceeds thecapital and reserves of the NCBs by a substantial margin, standard financialprocedures of provisioning and suspension of interest will do little toresolve the problem. This means that the cost of bailing out the NCBs for thelosses incurred by BJC and BJMC will ultimately have to fall on the governmentbudget.
7.21 There are a number of financial options for restructuring the debtof the jute corporations. In any of the feas_.ole alternatives, the budgetwill have to bear the cost of interest and principal repayments on the debt,either as a direct subsidy payment or indirectly through other channels (forexample, if Bangladesh Bank assumes responsibility for part of the losses, itwill be reflected in reduced profits accruing from Bangladesh Bank to thebudget). These procedures will only recognize losses that have alreadyoccurred and hence are unavoidable. The major benefit of showing the lossesin the budget (besides restoring the financial viability of the NCBs) is todraw attention to the high cost involved in postponing action on jute sectorproblems, hopefully improving the likelihood that constructive actions will betaken. There are a number of steps that the Government can take to improveefficiency in the jute sector and reduce further losses, such as rationalizingthe jute procurement process, improving inventorv stock management and price
- 161 -
stabilization activities of BJC, reducing over-capacity li7 jute manufacturing,and undertaking BMR investments In the remaining mills. 8 The most difficultissue is to reduce employment in the public sector jute mills. Consideringthe high cost that is already being incurred by the Government (directly orindirectly). it should be possible to find a solution that compensatesredundant workers and still results in lower overall costs to the economy.The current situation should be labeled as a crisis that is only beingaggravated by the fact that its costs are being hidden. In terms of theadverse implicat,.ons for the budget and the financial sector, as well asunnecessary consequences for aggravating the decline of one of Bangladesh'smajor export industries, this problem deserves to be addressed as a matter ofpriority.
7.22 Textiles. The problems of the public sector textile mills aresimilar, although less extreme, to the issues encountered in the jute sector.More than a decade of strict operating controls on individual mills, combinedwith a reluctance of the Government to address problems of excess capacity andinefficiency in the public sector mills, have led to large operating lossesand a net financial drain on the financial sector.l19 The Government took asignificant step toward re,orm of the sector in 1982, when it denationalized22 of BTMC's mills. Subsequent progress in structural reform has beenexceedingly slow, and the economy his been able to reap litt!' benefit fromthe government's promising start. For example, almost no backward linkageshave been established between the thriving ready-made garment industry anddomestic textile producers, thereby limiting the domestic value-added obtain-able from this ol1,ortunity. The Government has allocated an increasing shareof funds under the ADP to the textile sector in recent years, accounting for242 of the allocation for industry in FY89, in order to complete BMR invest-ments on a number of textile mills (including a limited number of privatemills). Progress on this project has been very slow, and there is no evidencethat the modernized mills are performing any better in financial terms thanthe older mills. During the past year, the Government has taken measures toprovide managers of public sector mills with greater autonomy over pricing andcost control decisions, including hiring and firing. Most mill managers havebeen reluctant to use this authority, and many are continuing to recordoperating losses which are being financed by overdraft credits from the NCBs.Tnis situation exposes the Government to an open-ended financial commitmentthat is very dangerous. The Government has already provided equity on theorder of Tk Cr 180-200 to enable mills undergoing BMR to achieve their agreedfinancial ratios and reduce their past debt burden. However, with continuingoperating losses and little threat of sanctions fo. poor performance, themills are likely to go on accumulating debt which will have restructured in a
18/ For more detail, see Bangladesh: Prospects and Policy Issues in the JuteSector, World Bank Economic Report No. 6161-BD, April 21, 1986 (greencover).
19/ Much of the problem of cost inefficiency is related to overstaffing. Itis estimated that 1OZ of the employees currently drawing pay are completelyidle, while the labor productivity per spindle is only half of the levelin Indian mills.
- 162 -
repeating cycle of losses for the budget. In this context, even the ongoingBMR investments are dubious, as they may only contribute to the growing debtburden.
7.23 Steel and Engineering. Due to large financial losses sustained byBSEC since FY82 and concerns about the economic viability of the sector,public investments in steel and engineering fell to nominal levels duringFY84-88. Howev,z, the FY89 ADP provides a sharp increase in the allocationfor the sector (to Tk ',r 36.8) due to the initiation of a project for BMR ofChittagong Steel hills, as -fell as the start -p of two new projects, HighVoltage Cables and Conductors and an Aluminum Rod Mill.
7.24 Rehabilitation of the Ciiittagong Steel Mill is a major undertakingwith an estimated cost (according to the PP) of Tk Cr 110 (approximately $35million). The project has been assigned high priority by the Government, anda donor financing protocol was signed aven before a feasibility study wascompleted for the project. A special committee headed by the Director, BSEC,with representatives from both Government and outside sources, was formed tosc.-utinize the feasibility of the project. The PP indicates that the projectis considered to be viable, with an incremental FRR of 26.8Z and an ERR of17.9%. Apart from technical questions concerning these estimates(particularly the choice of prices for the output), the basis on which theproject has been conceived should be reconsidered. At least three studiesduring the past several years have concluded that the Chittagong Steel Mill iseconomically unviable and that contyinued operations result in a net loss offoreign exchange to the economy.2 The question that should be addressed bythe feasibility study, therefore, is not whether the incremental cost of theBMR investments is beneficial (i.e., will the investment make a bad situationany better?) but whether the BMR investment will result in making thecontinued operation of the plant viable on an overall basis. Using thisapproach, the BMR improvements are estimated to have an FRR of 30.7Z and anERR of -0.1%. In other words, even arssuming that the full benefits of the BMRinvestment are achieved in terms of improved plant operations, the operationof the plant will still result in negative value-added to the economy. Thisindicates that the appropriate response of the Governiment should be to phasedcwn operation of the steel plant, rather than undertaking substantial newinvestments to improve its operations.
7.25 Reestimation of the expected rates of return for the two remainingprojects (High Voltage Cables and Aluminum Rod Mill) indicates that bothprojects are potentially viable (FRR of 58.5Z and ERR of 66.4Z for the HighVoltage Cables plant and FRR of 34.8? and ERR of 31.22 for the Aluminum RodMill). The question that needs to be addressed is whether this is asufficient basis for proceeding with public sector investment in the projects.The domestic market for the two products is very limited (the only customerfor the output of the High Voltage Cables plant would be BPDB, while the
20/ The Atkins' report in 1982 ("Iron and Steel Sector of Bangladesh"), theTIP study in 1985 ("Overview of Assistance Policies for the Steel andEngineering Indus6ries") and Robert Warner ("Report on the Basic SteelIndustry") in 1984.
- 163 -
output of the Aluminum Rod Mill would be used as an input to the High VoltageCables plant). Moreover, the public sector environment in which the plantswould operate is conducive to cost inefficiencies and poor quality control.Most countries have found that establishing an integrated industrial structurebased on monopoly suppliers and purchasers is highly risky. (An obviousexample in Bangladesh is the reluctance of BPDB to accept transformersproduced by the General Electric Motors plant because of quality problems.)In this situation, it would be better for the Government to encourage theprivate sector to conscruct and operate the plants, perh.ps in the context ofa joint venture arrangement. Given the stated government policy of promotingprivate sector participation and limiting the role of direct publicinvestment, the rationale for undertaking these two projects in the publicsector does not appear to be compelling.
7.26 Sugar Industries. A review of tue sugar industry in 1987 concludedthat further investment in public sector sugar mills, even at minimum levelsneeded to replace essential equipment, would not be economically justified.The sugar industry is highly protected, inefficient, and tightly controlled.Consumers are forced to bear the cost as a result of a 1002 duty on sugarimports and an import monopoly by the Government. In order to compensate forthis situation, the Government subsidizes sugar distribution through the PFDS,while outgrowers are paid a procurement price which is below market levels.As a result, BSFIC reported a small financial profit in FY88 (after threeyears of large losses), but this was achieved at high cost to the economy.The lack of price incentives has discouraged productivity improvements in canegrowing, and the Government has outlawed competition by small private crushersin the mill areas in order to maintain the supply of cane to the sugar mills.Despite the fact that shortages of sugar cane are a major constraint and mostmills operate at well below capacity, BSFIC recently announced (November 1988)that it intends to construct three new sugar mills, two with tilateralfinancing and one using the government's own funds. A phased program todecontrol the sugar industry and privatize the sugar mills would appear to bea more realistic approach than continued injections of public funds.
7.27 Other Industries. The remaining public investments in theindustrial sector are focused mainly on the construction of industrialestates. The Chittagong Export Processing Zone (ADP allocation of Tk Cr 20.7in FY89) has been reasonably successful and improvement of its infrastructureappears to be advisable. On the other hand, the construction of industrialestates by Bangladesh Small and Cottage Industries Corporation (ADP allocationof Tk Cr 21.5 in FY89) has not been successful because of poor projectimplementation and weak demand. A rethinking of the government's support rolein this area appears to be desirable.
7.28 Industrial Development Term Lending. As with agriculture credit,public funds for industrial develonment finance institutions are passedthrough the Revenue Budget rather than the ADP. Due to the poor performanceof the two public DFIs (Bangladesh Shilpa Bank - BSB, and Bangladesh ShilpaRin Sangstha - BSRS), the donors have largely stopped providing new foreigncurrency resources to support the institutions, and allocations for the twoDFIs under the 'Non-ADP Projects' heading of the budget amoanted to Tk Cr 2.0in FY87 and nothing in FY88. Both institutions are effectively bankrupt, and
- 164 -
their debt recovery problems are among the worst ir. Bangladesh. The roots ofthis problem are similar to the situation with agricultural lending--emphasison rapid expansion of lending with poor control on loan quality or debtrecovery, subsidized interest rates only partially offset by preferentialrefinancing facilities, political interference, etc. Nevertheless, theprovision of term lending remains an essential ingredient in the developmentof medium and large scale industry, particularly by the private sector. Whileprivate commercial banks should be encouraged to expand their term lending,there is likely to be a construrtive role for public DFI lending as well. Inthis situation, the Government should give priority to institutional andfinancial reforms to reestablish BSb as a suitable vehicle for increasedlending. There is no need for two separate institutions in this aree,however, and the operations of BSRS should be phased out.
lummary
7.29 Table 3.3 summarizes the major recommendations of this chapterregarding the public investment program in industry. The discussionillustrates both the benefits and the missed opportunities of the government'sreform program in the area of public enterprises. The policy directionsestablished by the New Industrial Policy in 1982 represented a bold andrealistic approach to the industrial sector, with the public and privatesecc.ors intended to play a complementary role. A major benefit expected fromthis approach (in addition to opening up new areas of growth, such as thegarment industry) is that the Government can concentrate its resources onactivities which are best suited to public sector involvement because of theirlarge capital cost and technological complexity, such as the fertilizerindustry. As demonstrated by the pattern of allocations in the ADP, publicinvestment i" the remaining sub-sectors between PY82-86 generally reflectedthe government's determination to reduce the dependence on public fundsthrough divestiture of public enterprises and limiting investments in theremaining firms to rehabilitation activities. Unfortunately, this approachhas not been matched by an equal determination to address the difficultstructural problems faced by most of the industries, with the result that thefinancial performance of the remaining public enterprises has generallydeteriorated since 198?. The current pattern of large financial losses hascompromised the integrity of the financial sector, and it has left a largeburden of outstanding liabilities that the Government will have to recognizein the budget, thereby reducing the funding available for developmentactivities.
7.30 Since FY86, with the gradual relaxation of fiscal stringency in thebudget, there has been an increase in public investments in the industrialsector, often for projects with dubious justification or benefits. Theprimary attention of the Government in recent years has been directed towardtrade policy reforms and macroeconomic initiatives to open the Bangladesheconomy to an external environment and th.ereby gain a continuing stimulus forexport-oriented growth. While this effort is an essential part of improvingthe environment for efficient industrial growth, it is necessary to addressthe difficult problems of structurql reform for the public enterprises aswell. Public investment policy can be one part of this approach. To besuccessful, policy reforms should also include changes in prices and subsidiesand institutional changes to address the problems of overstaffing and excesscapacity that hinder the development of improved efficiency and competitive-ness.
- 165 -
Chapter VIII
Energy and Natural Resources
8.1 The Government has increased the share of public expendituresallocated to the energy and natural resources sector substantially during the1980s, despite the general climate ot fiscal restraint. On the whole, theresults of this effort have been reasonably successful. Natural gasproduction increased at an average annual rate of 17? between FY81-87, andelectricity consumption grew by 14Z per year during the same period. Thiseffectively satisfied the growth in demand for commercial energy, so thatdomestic demand for imported petroleum products stabilized at about 0.9million tons, slightly below the level in FY75-80. The rapid growth indomestic energy production has been accompanied, however, by increasingproblems related to the financing, operations and planniig for the sector.The Government has recently begun to address these problems under an EnergySector Credit, which, while not yet effective, has already begun to producesignificant improvements.
8.2 Table 8.1 shows the pattern of public investments in the energysector as indicated by allocations in the ADP for the period FY81-89.Eroenditures for most types of energy development fell in real terms duringFY81-83, following the general pattern of fiscal restraint in the ADP.However, expenditures surged after FY83, particularly between FY83-87, so thattotal investment in the sector increased by 175? in nominal terms (42? inconstant prices) between FY83-89. The largest increases have been for powergeneration (3751 increase in nominal terms between FY83-89) and ruralelectrification (375Z increase during the same period', while publicexpenditures for natural gas development increased by only 29? in nominalterms over the FY83-89 period, representing a 30? decline in constant prices.During the past two years (FY 8-89), there has been a slowing down in theoverall pace of investment, and the balance of investments in the power sector(e.g., between generation, transmission and distribution) has begun to returntoward historic trends. However, issues concerning the overall composition ofthe investment program, progress in project implementation and the financing
i of investment costs continue to play an important role in the public; expenditure program for this sector.
8.3 The cost of flood rehabilitation due to the 1988 floods wasestimated by the United Nations mission on a preliminary basis as Tk Cr 134($41.8 million) for Bangladesh Power Development Board (BPD4) and Tk Cr 43($13.4 million) for the Rural Electrification Board (REB). l Five 132133 kVand eleven 33/11 kV substations, 2,000 km of distribution lines, 4,000distribution transformers, 1,000 tons of conductors, 12,000 poles, 60 km ofcable and 250,000 electric meters are estimated to have been partially orcompletely damaged. Allowing time for the delivery of materials, most of therepair work is expected to take place in FY90 and FY91. No significant flooddamage was reported for the natural gas or petroleum sub-sectors.
I/ Subsequent assessments as of January 1989 by BPDB and REB have reduced theestimated cost of flood damages to about $30 million equivalent for BPDB andabout $3.5 million equivalent for REB.
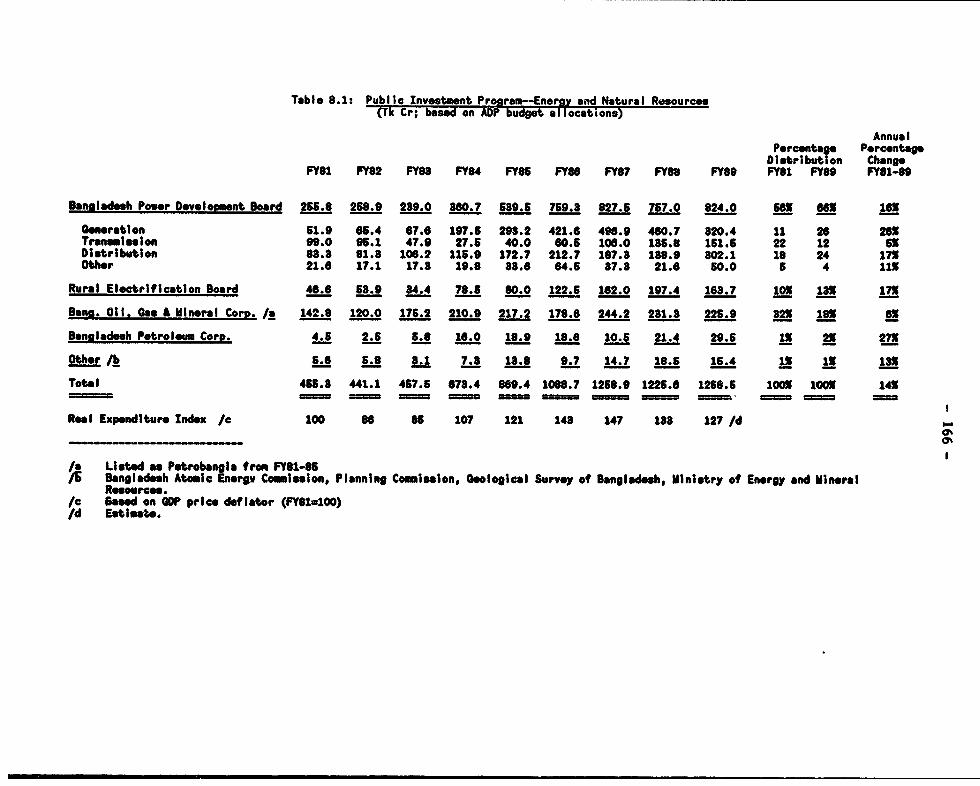
Table 8.1: Public Investment Pro!ran-En.ray and Natural Resources(Tk Cr; base on ADF budget allocations)
AnnualPercentage PercentageDistribution Change
FYsl FYs2 FYOs FYs4 FYOs FYss FYsw FYOs FYOs FY81 FY89 FY81-83
BanAladesh Power Devolopment Board 265.8 258.9 239.0 s88.7 589.5 759.3 827.5 757.0 824.0 6ex 6e6 161
eneration 51.9 65.4 67.6 197.5 293.2 421.6 496.9 460.7 320.4 11 26 261Transmission 99.0 96.1 47.9 27.6 40.0 60.5 106.0 186.8 161.5 22 12 65Distribution 83.3 81.8 106.2 115.9 172.7 212.7 187.3 188.9 802.1 18 24 17XOther 21.6 17.1 17.3 19.8 83.6 64.5 37.3 21.6 60.0 5 4 113
Rural Electrification Board 46.8 53.9 34.4 78.5 80.0 122.5 162.0 197.4 183.7 1OX 13x 17X
Bona. Oil. Gas A Mineral Corp. /n 142.9 120.0 176.2 210.9 217.2 178.6 244.2 231.3 225.9 321X 19X e
B8nnladesh Petroleum Corp. 4.5 2.5 5.8 18.0 18.9 18.6 10.5 21.4 29.6 13 2X 27X
other /b 5.6 5.8 3.1 7.3 13.8 9.7 14.7 18.5 15.4 1X 1X 13x
Total 465.3 441.1 457.5 673.4 869.4 1088.7 1258.9 1225.6 1258.6 100X 100 14X_ l==Z== - =u _ _ = =I == =
Real Expenditure Index /c 100 B6 8a 107 121 143 147 133 127 /d
/a Listed as Petrobangla from FY1l-s5/E Bangladesh Atomic Energ, Comission, Planning Coalmssion, Geological Surney of BOngladesh, Ministry of Energy and Mineral
Resources./c Based on GDP price deflator (FY61a100)/d Estimate.
- 167 -
8.4 In the past, investment planning in the energy sector took place ina piecemeal fashion, dictated largely by the availability of financialresources, including aid in-kind. This has been exacerbated by delays inproject implementation and cost overruns, so that only 552 of planned electri-city generation capacity was commissioned between FY81-85, together with 70Xof the planned distribution lines. This led to severe shortages of electri-city supply in FY86, to ihich the Government responded by installing addi-tional liquid fueled gas turbines and increasing power generation from oilfired plants in the west zone, which deviated from the least-cost investmentprogram. While investment targets in gas production wells and transmissionpipelines were largely achieved (902), the delayed commissioning of gas usingpower and fertilizer plants led to reduced demand and a shortfall of 40? inmeeting gas supply targets. These factors umphasized the need to have anintegrated development strategy which would cover all sub-sectors and make arealistic estimate of the financial and institutional limitations on implemen-tation capacity. As an initial step in this direction, the Government out-lined a rolling three year Priority Investment Program (PIP) beginning withthe years FY88-90 which concentrated on the completion of generation capacityand the expansion and rehabilitation of transmission and distribution networksfor the power sub-sector, rationalization of the drilling exploration program,development of an integrated gas transmission and distribution system anddevelopment of an LPG capability for the natural gas sub-sector, and refinerymodernization for the petroleum sub-sector. For the longer term, studies wereinitiated to develop a sectoral planning framework for future investments, aswell as to prepare more detailed least-cost investment programs for each ofthe individual sub-sectors. Some of the issues which are expected to arise inthe context of the longer-term investment plan aret (i) the pace of explora-tion needed to meet domestic gas demand and the availability of sufficient gasfor export; (iij the government's announced intention to construct a nuclearpower generation station in the west zone, which various system studies haveshown to be an uneconomic and costly option, as well as entailing considerabletechnical and environmental risks; (iii) the diminishing supply of traditionalfuels and the need to promote conservation and find acceptable substitutes forhousehold energy consumption; and (iv) the viability of further expansion ofrural electrification into areas where the demand will be primarilyresidential.
8.5 One of the most serious constraints on the implementation of theinvestment program has been shortages of local currency resources. In thefirst year of the PIP (FY88), the target for foreign-financed investments wasvirtually met (99X), while the locally-financed components suffered asignificant shortfall due to funding constraints (88Z completion). Withinthese aggregate figures, a more detailed examination of individual projectscousfirms that local currency shortages were often the major factor behindslippages in the implementation schedule. For example, in the Second GasDevelopment Project, the procurement of expensive donor-financed pipelines andsurface facilities was significantly delayed because of a lack of local fundsto prepare the drilling sites. In the revised PIP for FY89-91,rationalization of the investment program in order to be consistent with theavailability of local funding has been a major factor in shaping investmentpriorities.
- 168 -
8.6 Unlike secto.s such as education and health, the energy and naturalresources sector has the capacity to make a significant contribution tofinancing its investment program. Given the limited scope for other forms ofdomestic resource mobilization, this objective should have high priority forthe Government. Between FY8O-88, the average tariff level for BPDB wasincreased by about 190Z in nominal terms and 42Z in real terms, equivalent toaverage annual increases of 14.5Z and 4.5Z respectively. The average price ofnatural gas was increased by 20Z at the beginning of FY86, with furtherincreases of 20S, 25Z, and 15? taking place at the beginning of each of thefiscal years FY87-89. As a result, the average price of natural gas nowexceeds its estimated long-run marginal cost (including a depletion premium).Both power and gas prices have been restructured to reflect the economic costof supplying different groups of customers. Finally, the Government hasmaintained the domestic retail prices of petroleum products despite the fallin international petroleum prices, so that Bangladesh Petroleum Corporation(BPC) was able to contribute Tk Cr 35 to the budget in FY88 in non-taxrevenues, in addition to Tk Cr 49 received by the Goverrnent in petroleumexcise taxes. While there are still improvements to be made in the financialperformance of energy sector corporations (particularly BPDB), these priceincreases represent a substantial improvement in the revenue generationcapacity of the sector during the past several years.
8.7 It is premature to make recommendations on the future investmentrequirements of the energy sector until the long-term sectoral planningframework and the individual least-cost investment programs referred to aboveare completed. Nevertheless, the experience so far under the Energy SectorCredit provides several valuable lessons which can be applied to othersectors. The first lesson is the importance of having a realistic view ofinvestment priorities in the sector, rather than proceeding on a project byproject basis. This is most evident in the imbalance between investments inpower generation, transmission and distribution in BPDB's proposed investmentplan. BPDB had prepared a least-cost investment plan for power generation,but the plan was not integrated with a program for development of thetransmission system in order to ensurf that power could be evacuated to demandcenters. Many donors have a preference for financing thermal generationprojects because, as compared to transmission and distribution projects,generation projects are discrete, implementation can be managed moreefficiently, procurement does not involve many contracts, and the projects canbe designed to match tied bilateral financing requirements. As a result,donors have financed generation plants without analyzing their overall impacton BPDB's system, resulting in high outage rates, low operating voltages andhigh systemq losses due to inadequate transmission capacity.
8.8 A second important lesson from the Energy Sector Credit is theimportance of accounting for constraints on local cost financing. In itsinitial draft investment plan for FY89-91, BPDB suggested an increase ininvestment from Tk Cr 715 in FY89 to Tk Cr 1,345 in FY91, representing anincrease of 90Z in nominal terms, primarily due to the start-up of new power
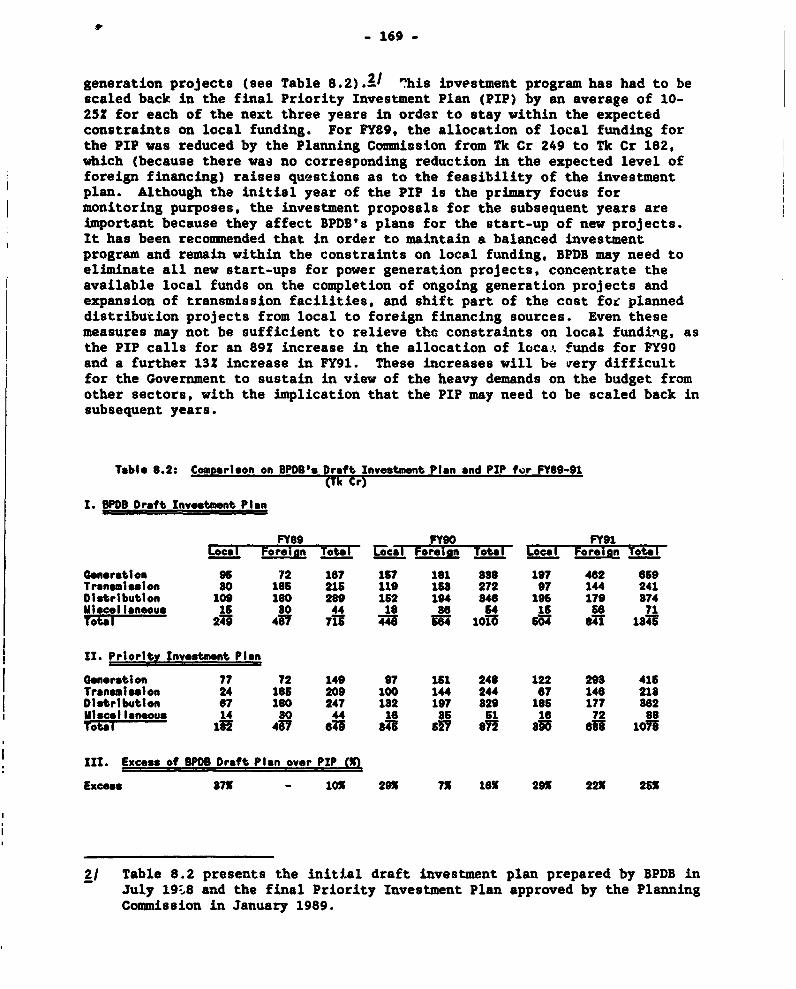
- 169 -
generation projects (see Table 8.2).V1 nhis investment program has had to bescaled back in the final Priority Investment Plan (PIP) by an average of 10-25Z for each of the next three years in order to stay within the expectedconstraints on local funding. For FY89, the allocation of local funding forthe PIP was reduced by the Planning Commission from Tk Cr 249 to Tk Cr 182,which (because there was no corresponding reduction in the expected level offoreign financing) raises questions as to the feasibility of the investmentplan. Although the initial year of the PIP is the primary focus formonitoring purposes, the investment proposals for the subsequent years areimportant because they affect BPDB's plans for the start-up of new projects.It has been recommended that in order to maintain a balanced investmentprogram and remain within the constraints on local funding, BPDB may need toeliminate all new start-ups for power generation projects, concentrate theavailable local funds on the completion of ongoing generation projects andexpansion of transmission facilities, and shift part of the cost for planneddistribution projects from local to foreign financing sources. Even thesemeasures may not be sufficient to relieve the constraints on local funding, asthe PIP calls for an 891 increase in the allocation of locat funds for FY90and a further 132 increase in FY91. These increases will be very difficultfor the Government to sustain in view of the heavy demands on the budget fromother sectors, with the implication that the PIP may need to be scaled back insubsequent years.
Table 8.2: Comparison on BPDB's Draft Investment Plan and PIP for FY89-91(Tk Cr)
I. 8PDB Draft Investment Plan
FY89 FY90 FY91Local Foreian Total cal Foreign Totar Local Foreign Total
Generation 95 72 187 15? 161 a88 197 482 659Transmission 80 185 215 119 163 272 97 144 241Distributlon 109 180 289 162 194 840 196 179 874Miscellaneous 16 80 44 16 3B 64 15 S6 71Total 21 4d 7 7i1 4i i 10o 56 81 1IM
II. Priority Investment Plan
|GneratIon 77 72 149 97 161 248 122 293 416Traneisalson 24 186 209 100 144 2U 67 146 218Distribution 67 180 247 182 197 829 185 177 862Miscellaneous 14 so 44 16 86 51 16 72 88Total IN 47 oni Su 517 87! 81f SU 1071
III. Excess of BPDB Draft Plan over PIP (X)
Excess 87X - 10X 29X 7X 16X 29X 22X 26X
2/ Table 8.2 presents the initial draft investment plan prepared by BPDB inJuly 19:,8 and the final Priority Investment Plan approved by the PlanningCommission in January 1989.
- 170 -
8.9 This leads to the third lesson from the Energy Sector Credit, whichis the need to integrate resource mobiliza*ion and cost efficiency objectivesinto the planning of the investment program. Power system losses, bothtechnical and non-technical, were about 422 in FY88, over twice the levelexpected for a well-designed and operated power system. If power systemlosses had been 322 instead of 422 and the difference had been realized inadditional electricity sales, BPDB's revenues would have increased byTk Cr 90-100, which would have gone a long way toward relieving the localfunding constraint on the PIP. In the future, given the substantial claims onpublic funds that are expected to come from sectors with limited revenuepotential, it is essential that the energy sector should self-finance a muchgreater proportion of its investment requirements and make a significantcontribution to the budget through taxes and profit contributions. It hasbeen agreed under the Energy Sector Credit that BPDB should increase its rateof return on revalued assets in order to finance capital replacement costs andundertake new investment projects with internally generated funds. Actions toachieve these targets include tariff increases, rate restructuring, reductionof power system losses, and collection of accounts receivable. In the case ofnatural gas, BOGMC has the capacity to assume substantial responsibility forself-financing its investment program, including the possible participat'on offoreign private investors in exploration and appraisal.
8.10 The experience gained so far under the Energy Sector Credit willrequire a number of modifications in order to be applied to other sectors.The energy sector has a number of advantages for the introduction of sectoralinvestment planning, including: (i) a l'mited number of agencies in thesector; (ii) substantial capacity for revenue mobilization, which providesgreater autonomy and flexibility in planning investment programs; and(iii) the technology involved in the sector is well established and providesobjective indicators to measure cost-efficiency and performance. Othersectors will have to make adaptations in their approach to expenditureplanning in order to apply the lessons from the Energy Sector Credit. Forexample, the agriculture sector is characterized by an extensive fragmentationof responsibilities among operating agencies and ministries, and it will benecessary for the Planning Commission to take the lead in improving sectoralplanning procedures. The social sectors, on the other hand, have well-definedinstitutional responsibilities but lack the potential for significant revenuegeneration, which means that they will continue to be subject to theuncertainties of the budget process. The transport sector represents a mix ofresponsibilities between direct operating agencies (such as BangladeshRailways) and gover'iment departments (Roads and Highways Department) withlittle experience in inter-agency or inter-modal cooperation. While thesesectoral differences must be accommodated in the development of the planningprocess, the essential lessons from the energy sector--namely, the importanceof a realistic investment program in order to provide a framework for projectbased activities, the need to ensure consistency in the use of foreign andlocal resources within a rolling multi-year investment program, and theimportance of incorporating resource mobilization objectives into thepreparation of the expenditure program--remain valid as important objectivesfor the improvement of public expenditure planning in other sectors.
- 171 -
Detailed Expenditure Programs
8.11 Power Development. As indicated in Table 8.1, the investmentprogram for BPDB in the FY89 ADP shows a substantial reduction in powergeneration investments and a corresponding increase in the funds allocated fortransmission and distribution improvements. This reflects the restructuringof the investment program undertaken as part or the first year's experiencewith the PIP. Nevertheless, as noted in Table 8.2, BPDB has not yet completedthe revision of its investment program for FY90 and 91 to be consistent withthe likely a-ailabilit- of local resources and incorporate the recent flooddamage. This shoula be completed as a matter of priority, as it affects thepreparation and approval of new projects that must be started now in order tobegir. implementation withln the next few years.
8.12 In the longer term, one of the major uncertainties facing theinvestment program is the government's announced intention to construct anuclear powe; plant of the west zone. It has been demonstrated on severaloccasions that this approach would not be a least cost solution to meeting thepower requirements in the west none. The present strategy for the west zoneis based on the construction of a second east-west power interconnector acrossthe Jamuna River (which would be placed on the Jamuna Bridge if it isconstructed) to enable generation plants using natural gas in the east zone tomeet the power requirements of the west zone. In the longer term, optionswhich are available for the west zone include the construction of additionalpower interconnectors as they are needed, construction of a gas pipeline onthe Jamuna Bridge (provided that it is demonstrated that thexe are sufficientgas reserves in the east zone to make this option viable), and greater effortsto fin4 and develop energy resources on the west bank (such as coal or naturalgas).31 There is no compelling justification for the construction of anuclear power plant, and initiation of this project (which has been on thegovernment's project list for a long period) would represent a substantialdeviation from the investment priorities embodied in the PIP.
8.13 BPDB has made significant progress in meeting its technical andfinancial targets establtshed under the Energy Sector Credit. Afterincreasing to a high point of 462 in October 1987, power system losses havedeclined steadily toward an average target of 352 over a three month period,which was achieved during the first half of FY89. Further reductions inlosses toward a target of 321 needs to be maintained through continuation ofBPDB's metering program, particularly for high tension consumers who accountfor about 40% of kwh sales. Similarly, after increasing to 5.3 months billingin January 1988, BPDB has made steady progress in reducing its accountsreceivable toward an initial target of 4.5 months billing (declini 5thereafter to 3.5 months billing). Issues which have not yet been resolvedinclude BPDB's policies for writing off accounts which are clearlyuncollectib'- and the settlement of government arrears to BPDB (which amountto 35-40? of total accounts receivable). BPDB is expected to achieve a targetrate of return of 22 on revalued assets during FY89 on the basis of an average
31 Options farther in the future might include importing power from Nepal orIndia.
- A72 -
increase in tariffs by 32 on July 1, 1988. In the future, target tates ofreturn of 42 in FY90, 62 in FY91, 7? in FY92, and 8Z in FY93 and thereafterappear to be both feasib:e and appropriate In the light of BPDB's need toger1erate4 esources to support the implementation of the priority investmentprogram._7
8.14 Rural Electrification. As indicated in Table 8.1, the investmentprogram in rural electrification has increasei rapidly in recent years,growing from Tk Cr 34.4 in FY83 to Tk Cr 163.7 in the FY89 A.DP. Floodrehabilitation due to the 1988 floods is expected to add about Tk Cr 43 ($13.4million) to REB's investment requirements over the next three years. Ruralelectrification is supported through subsidies to rural electrificationcooperatives (Palli Bidyut Sanity-PBS) during their first five years ofoperation in order to cover operating expenses. Current invg'*ment plansenvision the establishment of 62 PBSs in five phases between l5 e and the year2000. Subsidies in FY88 are estimated at .bout Tk Cr 6.0, which couldincrease rapidly in the future as more cooperatives are added to the program.An analysis of 11 PBSs in operation for five years or more indicates thatsubsidies can be reduced significantly by sizing investments to realisticexpected demand, reduction of system losses by each PBS, and improvement- iabilling and collection of accounts. Subsidies to PBSs should be terminatedafter five years as currently planned in order to provide an incentive forcost saving measures. It is estimated that these actions would permitsubsidies to be reduced to an annual level of about Tk Cr 3.4 during the FY91-95 period (constant FY88 prices), even if bulk electricity tariffs areincreased as expected. The other issue that needs to be addressed by theGovernment is the viability of extending rural electrification into areaswhere the demand will be predominantly residential (as opposed to industrialand/or agricultural). In this regard, the Government has recently agreed toundertake a study of inter-fuel substitution possibilities for residentialuse, which would investigate the possible trade-offs between traditional bio-mass fuels, electricity, and o ter fuels in order to meet residential energynews, particularly for peri-urban and rural poor households.
8.15 Natural Gas. The investment program for L.^tural gas has declined inreal terms during the FY81-89 period, with allocations increasing in nominalterms from Tk Cr 142.8 in the FY81 ADP to Tk Cr 225.9 in the FU89 ADP. Thistrend reflects the relative success of BOGMC in achieving its FY81-85investment targets and the subsequent need to allow time for the demand forgas to catch up with available supply. Consequently, there is littlejustification at present for drilling 'safe development wells within theproven reserves of known fields. Rather, an appraisal program based onavailable high resolution seismic surveys should be implemented to establishthe full gas potential of the country and to ensure that incremental demandafter 1990 can be met. This would provide the necessary information toprepare a long-term development plan for the natural gas sub-sector, includingsuch issues as the viability of a gas pipeline across the proposed JamunaBridge and the availability of sufficient reser ;s to make gas export projects
4/ The Government has recently approved a plan for the reorganization of BPDBin order to improve operating efficiency and financial control.
- 173 -
feasible. As regards priorities for gas transmission and distribution,current investment requirements have been identified as part of a recentlycompleted national gas grid study. Donor funds are potentially available tofinance those investments, but persistent shortages in local funds have been amajor constraint on the implementation of projects in this area. It isestimated that the funds provided to the gas sector in the FY89 ADP cover only262 of BOGMC's requiraments, which may cause delays in investments needed tobring gas and relatel products to their expected markets.
8.16 As a result of price increases for natural gas in recent years,BOGMC has become a significant net contributor of resources to the governmentbudget. In FY86, for example, BOGMC contributed Tk Cr 238.2 in revenues tothe budget (counting all sources, of which 792 were in the form of excisetaxes on gas sales), while its net inflow of loans and grants (including bothforeign and local funds) was Tk Cr 136.7. Due to increases in the price ofnatural gas since FY86, the net financial contribution has probably increasedin favor of the Government (financial accounts are not available, however).This means that the investment program for BOGHC could be undertaken withself-generated funds while still providing substantial revenue contributionsto the budget (foreign loans would still be needed, however, to cover foreignexchange costs). The Government, on the other hand, has preferred to maintaindirect control over revenue inflows by increasing taxes and other actions toclaim 90Z of the additional revenues generated by gas price increases.
8.17 The Government has recently agreed to a reorganization of BOGMCwhich would provide individual gas companies with a greater degree offinancial autonomy, enabling them to self-finance a greater portion of theirinvestment program, which would be partially offset through reduced fundingallocations under the ADP. Gas tariffs were increased by 152 on average forall consumer groups on July 1, 1988 (with the exception of metered residentialconsumers). However, the price of gas to power, fertilizer, small industryand residential consumers is still below the long run marginal cost of supplyby 10.72, 2.72, 9.2Z and 35.02, respectively. A further increase in the priceof gas by about 152 will be needed at the beginning of FY90, which willincrease the average price of gas above the lo.g-run marginal cost in order tomobilize resources for the budget and reduce the differential between theprice of gas and the long-run marginal cost of supplying the customer groupsjust mentioned.
8.18 Petroleum. Existing facilities for the transportation, storage anddistribution of petroleum produicts are adequate to meet projected demand inthe medium term (three to five years), and there does not appear to be anysignificant uneconomic duplication of facilities. Hence, the scope for publicinvestment at the current time is limited to the ongoing project formodification of the existing refinery. The Government is also promoting theinvolvement of international oil companies in petroleum exploration, anddomestic private participation is being sought for a pilot LPG separating,bottling and distribution facility. This is a realistic approach to improvingthe technical capacity of the sector, and further efforts to involve theprivate sector should be encouraged, such as the distribution of compressednatural gas, coal mining and utilization, and perhaps even power generation.A study of possible areas for private involvement in the energy sector iscurrently being carried out, which is expected to propose concrete actions
- 174 -
(e.g., relaxation of the regulatory framework, incentives, approvals,licenses, etc.) that would facilitate market entry and introduce a greaterelement of competition into the sector, as well as mobilizing additionalprivate funds and technical expertise.
8.19 As indicated above, the Government has earned substantial revenuesin recent years by maintaining domestic petroleum prices above border prices.In March 1987, gasoline and diesel prices exceeded c.i.f. prices by about 200Zand 1152, respectively. In view of the need to mobilize domestic resources, acontinued premium on petroleum prices of at least 20? above the relevantborder price is recommended.
Summary
8.20 A summary of recommendations for the energy sector is provided inTable 3.4. The recent experience of the energy sector provides a number ofimportant lessons for the planning of public expenditures, several of whichhave been highlighted in this chapter. While the specifiz institutional andfinancial structure of the energy sector has made it the most promising areafor the initial application of these principles, the approach can be modifiedand applied in a number of other sectors as well. This approach can becontentious, as it raises a number of difficult issues that are often ignoredin the traditional project-based approach to investment planning. Theseissues are still far from being fully resolved in the energy sector.Nevertheless, the process of raising and addressing issues is a necessary partof the investment planning process, and in the long run it can lead tosubstantial improvements in the technical capacity of domestic agencies andthe cost-efficiency and financial viability of the public expenditure program.
- 175 -
Chapter IX
Transportation and Communications
9.1 The expenditure program in the transportation sector ischaracterized by a fragmentation in the development strategy across modes andimplementing agencies, a concentration on short-term investment planning withinsufficient attention to the sequencing of investments and inter-modalpriorities, and poor cost-efficiency and financial discipline within most ofthe public operating companies. This situation is particularly unfortunate,as poor internal transportation is one of the most binding constraints onimproving the delivery of essential services throughout the country. At thecurrent stage of development in Bangladesh, realistic investments in thetransportation sector can have high rates of return and significantly improvethe efficiency of public and private investments in the other sectors.:! TheGovernment should therefore put priority on improving the quality ofinvestment planning and the preparation of sectoral strategies for agenciesinvolved in this sector.2/
9.2 Table 9.1 indicates the pattern of public investment for thetraDsportation and communications sectors in the ADP for FY81-89. Budgetallocations for transportation have been highly sensitive to the overallfiscal climate, and the level of public investment was cut almost in half inreal terms between FY81-85. As with most sectors, budget allocationsincreased significantly after FY85. In the FY89 ADP, the largest share offunds is allocated to road construction (53? of the sector allocation), withrailways receiving the second largest share (27? of the sector allocation).The share of funds allocated to the rail sector remained relatively constantdaring the FY81-89 period, but the share devoted to road construction4acreased significantly, particularly since FY85. This has been due to asubstantial increase in expenditures for bridge construction (increasing by1400? in nominal terms between FY85-89) and "other, road nrojects (290?increase, mostly dub to flood rehabilitation), with national highways (1051increase) accounting for most ̂ f the remaining share. The increases for roadconstruction have been balanced by reductions in the relative shares foraviation (due to the completion of regional airports in the early
This is illustrated by a recent ex post evaluation of a project toconstruct road bypasses around the towns of Chandina and Comilla toimprove traffic conditions on the Chittagong-Dhaka highway. Despitehigher than anticipated construction costs (+17Z) and significant delaysin project implementation (5.5 years versus 2.5 years expectedoriginally), the ex post economic rate of return for the project was 33?as compared to 17? expected at appraisal due to increased traffic volumesand higher than expected cost savings for buses.
2/ In this regard, the Government has recently initiated a transportationsector study in conjunction with IDA which is intended to provide such astrategic framework.
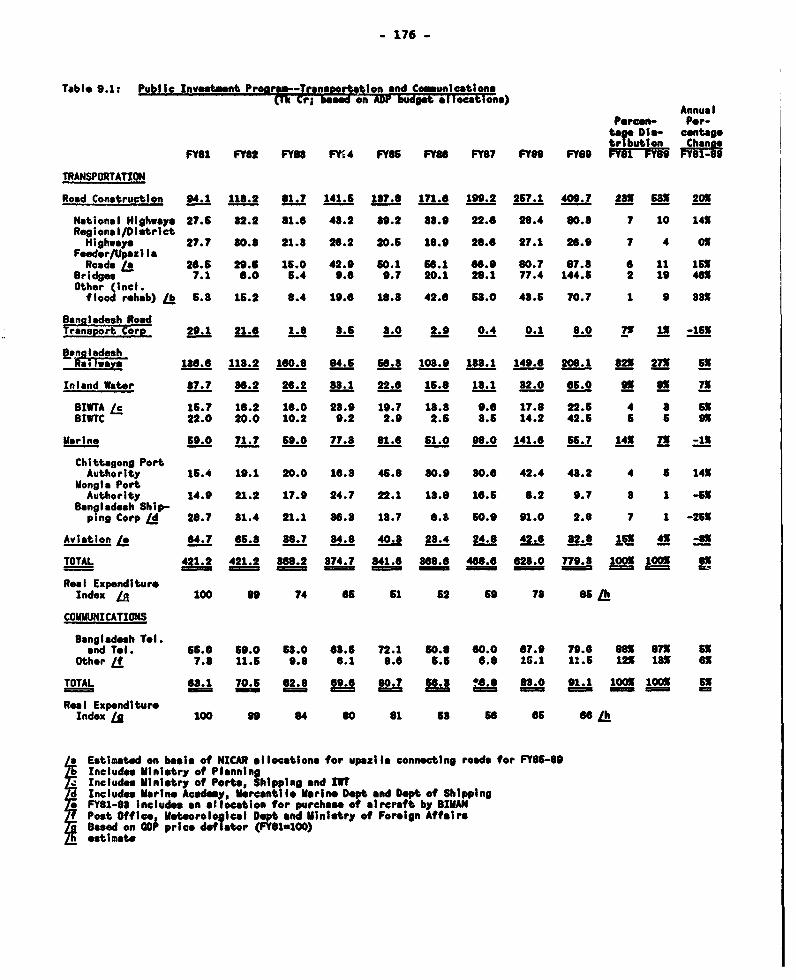
- 176 -
Table 9.1: Public InvestAwit Proramo--Transeortotlon and Comunicatione(1k Cr; b exd on ADP budgpt allocatlonno)
AnnualPercon- Por-
tag Die centag.
FY61 FY82 FY88 FV14 FY8s FY66 FYs7 FY6 FYe9 tFiu 9 ion
TRANSPORTATION
Road Construction 94.1 118.2 01.7 141.5 187.8 171.6 199.2 257.1 409.7 28X U8X 20X
National Highways 27.6 82.2 81.6 48.2 89.2 88.9 22.6 28.4 80.8 7 10 14XRegional/DistrictHighways 27.7 80.8 21.8 26.2 20.5 18.9 28.6 27.1 26.9 7 4 ox
Feeder/UpaziIaRoad i 26.5 29.6 16.0 42.9 60.1 66.1 66.9 80.7 67.8 6 11 15X
Bridge* 7.1 6.0 5.4 9.6 9.7 20.1 28.1 77.4 144.5 2 19 46xOther (Inl.flood rehab) /b 5.8 15.2 8.4 19.6 16.8 42.6 58.0 48.5 70.7 1 9 881
Ban ladesh RoadTransor Corp 29.1 21.6 1.8 8.5 8.0 2.9 0.4 0.1 8.0 7n 1X -1516
BvnaladenhRailways 186.6 118.2 160.6 84.5 60.8 108.9 188.1 149.6 208.1 83 271x 1X
Inland Water 87.7 38.2 26.2 88.1 22.6 15.8 18.1 82.0 65.0 91x 6 7x
BIWTA Le 16.7 16.2 16.0 28.9 19.7 18.8 9.6 17.8 22.5 4 8 5XBIWTC 22.0 20.0 10.2 9.2 2.9 2.5 8.5 14.2 42.5 5 5 ox
Marine 59.0 71.7 59.0 77.8 81.6 51.0 98.0 141.6 55.7 14X 7X -1X
Chittagong PortAuthority 15.4 19.1 20.0 16.8 45.8 80.9 80.6 42.4 48.2 4 5 14X
Monglo PortAuthority 14.9 21.2 17.9 24.7 22.1 18.8 16.6 8.2 9.7 8 1 -5x
Bangladesh Ship-ping Corp Id 26.7 81.4 21.1 86.8 18.7 6.3 50.9 91.0 2.8 7 1 -25X
Aviation 1! 64.7 65.8 86.7 84.8 40.8 28.4 24.6 42.6 82.8 L5x 4X -8x
TOTAL 421.2 421.2 866.2 874.7 841.6 868.6 468.6 628.0 779.8 1o00 100x 8x
R"l ExpenditureIndex La 100 69 74 e6 C1 52 59 78 /h
COMMUICATIONS
Bangladesh Tsl.and T1l. 65.6 59.0 68.0 68.5 72.1 60.8 60.0 67.9 79.6 SOX 871 eX
Other /f 7.8 11.5 9.8 6.1 8.6 5.5 6.8 15.1 11.6 12X 18X ex
TOTAL 6..1 70.5 62.8 69.6 80.7 56.8 _.8 68.0 91.1 1003 1OOX 5X
Real ExpenditureIndex L 100 99 84 80 61 58 s6 6s 66 L
/x Esti ted on basis of NICAR *llocationo for upaxila connecting roads for FY86-89Inlude, Ministry of Planning
, Includes Ministry of Ports, Shipping end IWTIncludes Moaine Academy, Mrcantile Marine Dopt and Dept of Shipping
e FYBI-Sa Includes on *tlocation for purchaso of slecraft by BIMANPost Office, Meteorological Dept and Ministry of Foreign AffairsBased on GDP price dsfitor (FY81SlO0)estimate
- 177 -
1980s),!/ marine (due to lower expenditures for Mongla Port Authority andreductions in the FY89 budget for Bangladesh Shipping Corporation), and theBangladesh Road Transport Corporation. The budget for inland water transportshowed a steady decline throughout the period PY81-87, although the budge,allocations in FY88-89 have been increased to cover the purchase of newferries by BIWTC. The budget for communications, of which the major sharegoes to Bangladesh Telephone and Telegraph Board (BTTB), has fallen in realterms by about 362 during the FY81-89 period, which is largely attributable tothe poor implementation performance and financial condition of BTTB.
9.3 The transportation and communications sectors suffered extensivedamage from the 1988 floods. The United Nations report on the flood providesa preliminary estimate of rehabilitation costs for the two sectors of US$411.3million (36X of the total estimated rehabilitation program), of which $103.5million would be for immediate repairs and $307.8 million would be forlonger-term rehabilitation. In contrast, the total investment program in theFY89 ADP for the two sectors is approximately $240 million, so the estimatedflood damage represents the equivalent of almost two years of normalinvestment. Except for immediate repairs, the longer-term cost of the floodrehabilitation program will have to be integrated into ongoing programs forrehabilitation of the bas3' transportation and communications networks, theimplications of which are examined below.
9.4 Transportation Sector Priorities. The low level of economicactivity and subsistence orientation of much of the economy does not placeheavy demands on the tran%sportation system, at least as regards the role ofmod3rn transport modes. Industrial activity is largely concentrated in theDhaka-Chittagong axis. Other inter-urban and urban-rural movements,consisting primarily of agricultural products, intermediate inputs such asfertilizer, cement and petroleum products, and essential consumer goods, canbe accommodated with a relatively sparse main network. Local access remains akproblem in much of the country, and traditional transport methods (countryboats, bullock carts, etc.) still account for a major share of total transportmovements, particularly in rural areas.
9.5 In line with its policy in other sectors, the Government hasliberalized regulations regarding private sector participation in thetransportation sector. As a result, private sector operators have taken overmost of the responsibility for providing transport services in the road andinland water sectors. Rail and air transport services (except cargo) haveremained as government monopolies, and the Bangladesh Shipping Corporationretains a major role in deep water shipping due to regulations requiring thata share of imports be transported in Bangladesh vessels. The financialperformance of public sector transport operations has been generallyunsatisfactory. Inappropriate fare policies and poor revenue collection havecontributed to this situation, but management problems, excessive government
31 The budget for aircraft purchases by Biman was moved out of the ADPafter FY83; otherwise, there would be a substantial increase in theaviation share due to Biman's recent purchases of DC-lOs.
- 178 -
regulation and inappropriate investment policies have also been majorcontributing factors.
9.6 Investment planning in the transportation sector has been conductedlargely in response to donor initiatives, usually to identify projects forpossible financing. While a few studies have attempted to address inter-modalpriorities, they have had little impact in shaping investment priorities. Inthe absence of a clear policy framework, investment patterns have oftenfollowed the preferences of individual donors. As a result, serious questionscan be raised concerning the relative priority of various investments and thecost-effectiveness of different modes in providing transport services in theunusual operating environment provided by Bangladesh. In the road sector, thebasic skeleton of the major arterial highway network is in place. Trafficvolumes are still quite low on much of the network, although the share of roadtransport has grown rapidly in recent years since the Government eased res-trictions on the importation and operation of vehicles by private operators.Given the dense but highly dispersed pattern of settlement and the rudimentarynature of domestic trade, road transport can be an effective mechanism forimproving the integration of the economy and ensuring basic access to servicesand markets for most of the population. However, the Government has Lotdeveloped a balanced long-term investment program to improve the road network,focusing instead on the construction ef new roads and more recently on majorbridge investments. With regard to the rail sector, Bangladesh Railways hashad to contend with a fragmented system consisting of two track gauges and abreak in the network because of the Jamuna River. Although the comparativeadvantage of the railroad is in bulk commodity movements, government policyand past deficiencies in road passenger services forced BR to concentrate onpassenger movements. This has hampered freight operations and compromisedBR's financial performance due to inappropriate fare policies and weak revenuecollection. Finally, the situation with inland water transport (IWT) can bestbe described as prolonged neglect. Public expenditures on IWT have remainedon the order of $1-2 million annually throughout the 1980s, much of whichrepresents bilateral assistance for road ferries. The recent floods havedrawn attention to the chronic neglect of river dredging, which in combinationwith reduced dry season water flows has seriously reduced the capacity of theIWT system in many areas. In summary, this trief survey of sectoral issues,which has touched on some of the difficult technical questions facing thesector, is intended to show the importance of developing a realistic long-terminvestment plan. In the absence of such a framework, the discussion in thissection will concentrate on the cost-effectiveness of individual transportmodes.
Roads
9.7 The major part of the road network was developed in the 1950s and1960s. Thus, under any circumstances, most of the road network would beapproaching the end of its normal life and would require major rehabilitationinvestments. This problem has been compounded by the low standards used ininitial construction, the continual stress on the roads due to adverseconditions (heavy monsoon rains and frequent floods, with repairs oftenundertaken as a temporary measure), and insufficient attention to routine road
- 179 -
maintenance. As a result, despite the low level of vehicle use,4/ most of themajor road network is in poor condition. Recent studies have identified one-third of the existing network as urgently needing rehabilitation, while thecondition of the remaining portion of the roads is generally considered to beinadequate. In view of this situation, IDA has included Bangladesh inCategory 4 in terms of its classification of road priorities, which indicatesthat investments in road rehabilitation and maintenance improvements shouldtake priority over all other activities in order to bring the road network toan acceptable standard.
9.8 Construction and maintenance of the road network is theresponsibility of the Roads and Highways Department (RHD) in the Ministry ofCommunication. The current road network under the control of RED consists ofapproximately 10,800 km of national, regional and feeder/connecting roads,5/of which about 572 are paved, some one lane only (see Table 9.2). Given theriverine topography of Bangladesh, bridges and ferries are ar important partof the road network. A survey of the road network in 1984 indicated thatapproximately 2,000 bridges and 4,000 culverts are included in the major roadnetwork. A visual inspection of the bridges at that time indicated that aboutone-third of them had deteriorated to the point where they were considereddangerous", requi.:ing either urgent repair or in some cases immediateclosure. Ferries are used on about 30 river crossings; RHD is responsible forshort crossings, and BIWTC operates ferries on the Padma and Jamuna rivercrossings. It was estimated that about 100 ferry boats are in operation, ofwhich abouit half are of steel construction and many are more than ten yearsold.
41 Average daily traffic exceeds l,OPO vehicles on only 112 of the majorroad network and is below 250 vehicles daily on 52X of the roads.
51 RHD constructs roads up through the feeder road type A category, whichconnect upazila headquarters to the main road network. Upazilas aresupposed to provide the maintenance for feeder roads after theirconstruction by RHD, but in practice the upazilas have neither funds norcapacity for road maintenance. The upazilas are also supposed toprovide maintenance for some 130,000 km of minor feeder roads, manv ofwhich are usable for only a few aonths in the year.
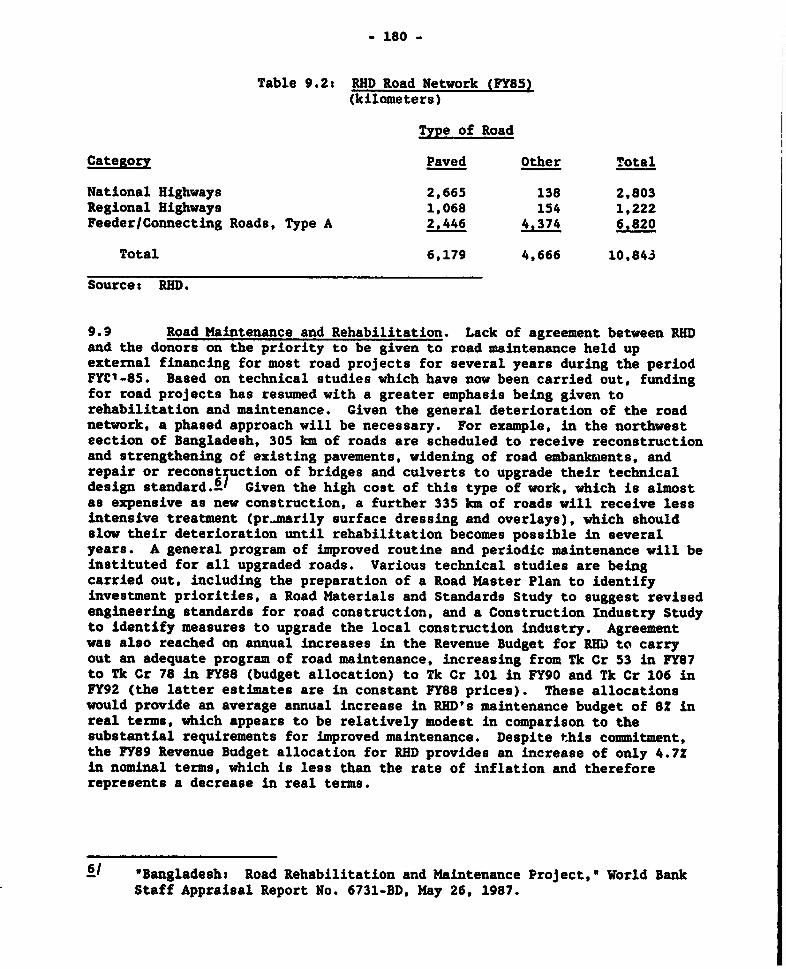
- 180 -
Table 9.2: RHD Road Network (PY85)(kilometers)
Type of Road
Category Paved Other Total
National Highways 2,665 138 2,803Regional Highways 1,068 154 1,222Feeder/Connecting Roads, Type A 2,446 4.374 6,820
Total 6,179 4,666 10,84.3
Source: RHD.
9.9 Road Maintenance and Rehabilitation. Lack of agreement between RHDand the donors on the priority to be given to road maintenance held upexternal financing for most road projects for several years during the periodFYC1-85. Based on technical studies which have now been carried out, fundingfor road projects has resumed with a greater emphasis being given torehabilitation and maintenance. Given the general deterioration of the roadnetwork, a phased approach will be necessary. For example, in the northwestsection of Bangladesh, 305 km of roads are scheduled to receive reconstructionand strengthening of existing pavements, widening of road embankments, andrepair or reconst uction of bridges and culverts to upgrade their technicaldesign standard.61 Given the high cost of this type of work, which is almostas expensive as new construction, a further 335 km of roads will receive lessintensive treatment (pr marily surface dressing and overlays), which shouldslow their deterioration until rehabilitation becomes possible in severalyears. A general program of improved routine and periodic maintenance will beinstituted for all upgraded roads. Various technical studies are beingcarried out, including the preparation of a Road Master Plan to identifyinvestment priorities, a Road Materials and Standards Study to suggest revisedengineering standards for road construction, and a Construction Industry Studyto identify measures to upgrade the local construction industry. Agreementwas also reached on annual increases in the Revenue Budget for RED to carryout an adequate program of road maintenance, increasing from Tk Cr 53 in FY87to Tk Cr 78 in FY88 (budget allocation) to Tk Cr 101 in FY90 and Tk Cr 106 inFY92 (the latter estimates are in constant FY88 prices). These allocationswould provide an average annual increase in RHD's maintenance budget of 81 inreal terms, which appears to be relatively modest in comparison to thesubstantial requirements for improved maintenance. Despite this commitment,the PY89 Revenue Budget allocation for RHD provides an increase of only 4.7Zin nominal terms, which is less than the rate of inflation and thereforerepresents a decrease in real terms.
6/ uBangladeshs Road Rehabilitation and Maintenance Project, World BankStaff Appraisal Report No. 6731-BD, May 26, 1987.
- 181 -
9.10 Agreement on a road maintenance program for roads under theresponsibility of local governments is less advanced. Many of the roadsstarted as earthwork embankments constructed by hand labor under the FFWprogram. Although their overall length is impressive, their technical qualityis variable and rudimentary. While this is adequate for most purposes (suchas farm to market roads), many of the roads are becoming increasinglyimportant in terms of providing access for basic services and therefore needto be upgraded to an all-season basis. This will require strengthening theearthworks through improved soil compaction, widening and raising the roadsurfaces above flood level, installation of bridges and culverts to providedrainage, and improved road surfacing. The potential benefits of such aprogram, which various studies have indicated can be significant, arecompromised by an almost total lack of maintenance. The potential costs ofmaintaining an improved local road network would be substantial. Consideringonly the feeder road type A program, it is estimated that the annualmaintenance cost for such roads would be on the order of Tk Cr 60 (FY88prices) if they are upgraded to all weatho;r standards. The maintenance costsfor the feeder road type B network, if they are upgraded to brick surfaces inorder to handle light traffic conditions, would be on the order of Tk Cr 85(FY88 prices). This means that road maintenance costs alone could exhaust thefunds currently provided to the upazilas for local development projects.Since local sources of revenue are inadequate to absorb the increased cost ofroad maintenance, the economic viability of improved local feeder roads isdoubtful in the current situation. This problem is expected to be a majorfocus on the recently approved Rural Roads and Markets Project, which willexamine alternatives for increasing local revenues or making otherarrangements for improving road maintenance at the upazila level.
9.11 One of the issues that should be addressed by the Government and thedonors is the need to integrate flood repairs into the program for long-termrehabilitation of the road network. Recent experience indicates that therepair of flood-damaged roads will continue to be a major part of theinvestment program for the foreseeable future. At present, the emphasis inflood rehabilitation is to make quick repairs to the roads. This approach isexpensive; in the four years FY86-89, the total allocation for the repair offlood damaged roads in the ADP was Tk Cr 107, which is equal to the budget forthe construction of national, district and regional roads in the FY89 ADP.Preliminary estimates indicate that the cost of rehabilitation from the 1988floods could be as much as Tk Cr 530 (US$164.8 million), including the damageto upazila roads.71 Approximately 3,000 km of national roads and highwayswere under water, as well as 10,000 km of roads under the supervision of theupazilas, plus countless feeder and dirt roads. Damage to the roads consistedmostly of pavement disintegration, potholes and erosion of embankments andearthworks. In addition, 85 bridges on the national road network were totallydamaged and 213 partially damaged, as well as 100 culverts totally orpartially damaged. About 600 drainage structures were damaged on rural roads.Given this widespread damage, the flood rehabilitation program cannot be
71 The estimate for national roads has subsequently been reduced to $114million. However, the estimate for local government roads is expectedto increase, perhaps as high as $65 million.
- 182 -
considered separately from the ongoing programs for road rehabilitation. Thenecessary investments should be integrated into the investment planningexercise being carried out in conjunction with the Road Master Plan study.The issue of construction standards also needs to be addressed. While itwould be prohibitively expensive to build the road network to withstand allpossible flood damage, improvements in road construction standards wouldappear to be economically justified. This will also assist in relief effortsin the event of a reoccurrence of major floods. This approach is likely toincrease the total cost of the road rehabilitation program, which places aneven higher priority on sound investment planning.
9.12 Within this framework of road rehabilitation and idaintenance, it isuseful to examine the current pattern of investment in the ADP to see how itsupports thia approach. As indicated earlier, the major expansion in publicexpenditures for the road sector occurred after FY85, with the allocation forthe road sector in the ADP increasing by 2002 in nominal terms (110? inconstant prices) between FY86-89. Table 9.3 provides a breakdown of thechange in funding between the FY86 and FY89 ADPs, classified by project typeand source of funding. The largest increase has been for the construction ofnew bridges, representing 55Z of the increase in funds (57Z for localfunding). The national highway network received only 19Z of the additionalfunds (17? of the local funds), mostly for two donor projects forrehabilitation of the road network. Donor-assisted projects for other typesof road construction, including flood rehabilitation, received 192 of theincrease in funds (102 of the local funds), while projects financed entirelyfrom locally provided funds received the remaining 62 (162 of the localfunds). This pattern of funding indicates a clear need to review prioritiesin the road sector and establish guidelines for the allocation of fundsbetween rehabilitation, maintenance and new construction.
9.13 Bridges. The construction of bridges (other than fairly minor spans)generally received loi )riority in the period after independence in view of thecritical need to upgrade the basic road network, particularly the Dhaka-Chittagongaxis. In recent years, however, the Government has placed high priority on thecompletion of road bridges across the remaining river crossings. Major bridges inthe FY89 ADP include the Buriganga bridge near Dhaka (recently completed), theMeghna bridge on the Dhaka-Chittagong highway, and the Karnufuli and Gorai bridges,all of which have received donor financing. Bridges which are being studied forpossible implementation in the near future include the Meghna-Gumti bridge (in orderto complete the last open crossing on the Dhaka-Chittagong road) and the Jamunabridge to connect the east and west sections of Bangladesh, as well as a possiblesecond bridge over the Buriganga. The total cost of the bridge program is estimatedto be on the order of US$1 billion, of which approximately half would be requiredfor the Jamuna bridge. As such, the bridge program represents about one-fourth ofthe anticipated public investment cost for the National Water Plan; alternatively,it would cover almost all of the estimated cost of flood rehabilitation as a resultof the 1988 floods. Given the urgent needs of other sectors as well as thegovernment's emphasis on the rehabilitation of existing roads and bridges, theallocation of such a large amount of funds for the construction of new bridgesshould be critically reexamined by the Government.
- 183 -
Table 0.8: ADP Fundlng for Road Project-. FYBS-99(Tk Cr)
FY86 FY69 Change In Chango In LocalAllocation Allocation Allocation Funding
TYPe of Prolect Amount X Amount X Amount X Amount
Donor-Flnancod Prot4etBridge Contrution 4. 4 135.6 88 180.7 66 62.6 67National Highways 22.1 16 67.0 19 44.9 19 16.6 17Feeder Road. /a 0.0 0 26.5 8 28.6 12 8.6 9Flood RehbililEation 82.0 27 48.2 18 16.2 7 (1.8) (2)Other Road* 20.9 18 24.4 7 8.6 1 8.0 O
Sub-total 79.8 67X 808.6 85X 223.8 94X 77.9 84X
Locally Financed ProJect.All Roads 40.1 83X 54.8 16X 14.2 ON 14.2 16XTotal 119.9 1OOX 867.9 103X 2B8.C 800X 92.1 100X
/a Doe" not Include feeder road* finane d out of the upaxila development grant.
9.14 A bridge over the Jamuna river has been a political goal since thefounding of Bangladesh. A direct road linkage would be a visible expressionof the political unity of the country, as well as opening up opportunities forspreading development from the more advanced eastern part of the country(which includes the Dhaka-Chittagong industrial axis and large reserves ofnatural gas) to the less developed western ide of the river. Until recently,these plans were considered to be infeasible in view of the substantialtechnical difficulties in crossing the Jamuna river, which is one of theworld's largest braided rivers with a large variation in annual flow andsituated in a seismically active region. The feasibility of crossing theJamuna was demonstrated, however, with the recent construction of the firsteast-west power interconnector. Given that a second power interconnectorwould be required around FY94 at a stand-alone cost of about $100 million, astudy was initiated to see whether the interconnector could be placed on aroad bridge and thereby help justify the cost of a fixed crossing. After anintensive engineering analysis which suggested the innovative application ofoff-shore oil platform construction technology for the bridge, the project wasdeemed to be technically feasible with an estimated cost (depending on thefinal configuration) in the range of $373-478 million.!'
9.15 The economic analysis of the Jamuna bridge has examined severalconfigurations.9/ The first option would involve the improvement of the
8/ This is based on prices as of November 1987 and does not include pricecontingencies or customs duties and taxes. The higher estimate includesthe cost of an optional rail connection on the bridge, while the lowerestimate represents the cost of a road-only bridge (both options includea power interconnector).
9/ In addition to a four-lane roadway, a power interconnector and apossible rail line, the bridge would include provision for a possiblegas pipeline and telecommunication links. The benefits of these latteroptions have not been included in the economic analysis, however.
- .84 -
existing ferry service over the Jamuza river plus the construction of astand-alone power interconnector. The economic analysis indicates that ferryimprovements would have an economic rate of return on the order of 86Z.12'This confirms that the existing ferry service is a major constraint ontransport operations across the river. From a practical point of view, theoption of an improved ferry and a stand-alone power interconnect:or has much torecommend it. As compared to the existing situation (which can involve delaysof several days for cargo crossings), the improved ferry service would achievea large share of the transport benefits expec.ed from the Jamuna bridge atmuch lower cost.
9.16 The economic analysis of the bridge has been carried out incomparison to the improved ferry.-l The major benefits are: (i) the'avoided' costs as a result of placing the power interconnector on the bridgeand foregoing improvements to the ferry service; and (ii) the incrementalbenefits of improved transport services as compared to the improved ferrycase. The preliminary analysis indicates that the incremental economic rateof return for a 'road-only" bridge would be 16.0-17.6? (depending onassumptions regarding the pricing of rail services), while a 'road-plus-rail'bridge would have an economic rate of return of 14.3-16.32.
9.17 The Government has stated that the Jamur- bridge is its highestpriority project in the investment program. The final feasibility study forthe bridge is not yet completed, so it is premature to make a judgement on theviability of the bridge. However, in anticipation of the need to make a finaldecision on the project, the Government should begin to address the possibleimplications for the public investment program. The Jamuna bridge project islarge enough to have a macroeconomic impa;, so the analysis of the bridgeneeds to go beyond standard cost/benefit methodology. The following concernsshould be addressed by the Government in making its final decision:
i) Reprioritization of the public investment program. The Jamunabridge is a large lumpy investment project, the impact of whichwill be accentuated by the ongoing program for road rehabilitationand bridge construction. The bridge will affect other projects inthe public investment program through its impact on local fundsand project management capacity. It is important that theGovernment explicitly provide for this, rather than allowing theeffects of the bridge to be absorbed through under-budgeting oflocal funds for the remaining project portfolio and delays in
10/ The economic case for the power interconnector, either as a stand-aloneproject or as part of the bridge, has been justified on the basis of theleast cost plan for power development that was discussed in Chapter 8.
/ This is standard procedure in economic analysis, where the netincremental benefits of each mutually exclusive alternative are derivedin comparison to the next least costly option. In comparison to theexisting ferry service and a stand-alone interconnector, the overalleconomic rate of return of the bridge wo"ld be on the order of 20.9-21.62 (road only) and 18.4-19.7? (road and rail together).
- 185 -
project implementation.121 Given the recent emergence of largefinancial requirements for flood rehabilitation and possibleincreases in project aid for areas identified in this report, theGovernment will need to assess the priority of the bridgecarefully vis-a-vis other investments.
(ii) Financial implications of the bridge project. The externalfinancing required for the bridge could have an impact on theavailability of external resources for other purposes, eitherthrough a reallocation of project and commodity aid to the bridgeor, if the financing sources are not on concessional terms,through future deLc-service obligations. The significance ofthese factors will depend on whether the financing for the bridgeis 'additional' to the amount that would be forthcoming from thedonors in normal circumstances and the terms on which it isprovided.
(iii) Economic and financial risks. Besides the technical risks whichare being addressed in the engineering studies, the bridge entailreconomic and financial risks because of the persistent occurrenceof implementation delays in Bangladesh. Like most large projects,the scale of the bridge cannot be reduced if cost overruns anddelays occur.
While there are obvious risks in implementing a project of such magnitude, thepriority being given to the Jamuna bridge by the Government is understandablein terms of its potential for regional integration and long-term developmentof markets and promotion of economic activity. Given its strategic role inthe transportation network, the bridge will undoubtedly be built at somepoint. The real question is whether the timing of the bridge is appropriatein view of the expected benefits and current resource constraints andexpenditure requirements, and what the appropriate scale of constructionshould be (e.g., the possible inclusion of a rail link).
9.18 Road User Charges. Because the transport sector uses a large shareof refined petroleum products, road users in general contribute more revenueto the budget than is required for maintenance of the road network. However,as petroleum revenues are considered to be a general revenue source for thebudget, there is justification for additional specific road user charges inorder to ensure that the road network is properly maintained. In the FY88budget, the Government proposed levying tolls on all transport vehicles usingrecently constructed by-pass roads (e.g. Comilla-Feni). In addition, the
12/ The Government has been collecting a Jamuna Bridge surcharge levy sinceFY86 to cover the local costs of the bridge construction. The revenueshave been credited to a special sub-account of the government'sconsolidated fund, which now has a balance of Tk Or 140. In practice,the revenues have been used as part of the government's generalrecelpts, so that the local funds available for the rest of the ADP willbe reduced when the Ministry of Finance has to reimburse the funds tothe Jamuna Bridge sub-account.
- 186 -
Government has agreed to prepare a Road User Charges Action Plan in cennectionwith the Road Rehabilitation and Maintenance Project. The Government shouldreconsider its policy regarding bridge tolls, which were abolished severalyears ago. Adequate O&M will be essential to ensure the safety and integrityof major bridges during their anticipated lifetime. Dedicated bridge tollscan provide an assured source of revenues for this purpose, and imposition oftolls at a level sufficient to cover at least O&M costs should be arequirement for all major bridge projects.
9.19 Bangladesh Road Transport Corporation. Public investment in BRTChas been minimal in recent years, although the budget allocation in the FY89ADP has been increased to Tk Cr 8.0 to provide a down payment on 362replacement buses, presumably to be purchased on the basis of a state tradingagreement.131 The role of BRTC in the road transport sector has fallensteadily since the Government liberalized import and operating restrictions onprivate transport operators. BRTC's financial and operating performance isunsatisfactory, and it is unlikely to be able to meet debt service payments onthe replacement buses. The best approach for the Government would be toprivatize BRTC in order to gain some benefit from the remaining capitalequipment and help the existing employees find jobs in the private sector.Failing this, the Government should limit now investments in BRTC and allowthe operations to run down of their own accord.
Railroads
9.20 Since gaining independence, Bangladesh has invested around $1.0billion in Bangladesh Railways (BR). Despite this, the freight trafficcarried by BR is only half of the level in 1969. Passenger traffic hasreturned to pre-independence levels, but BR has not maintained its marketshare due to the rapid expansion of road transport services. Table 9.4provides estimates of the breakdown of freight and passenger transport for thethree major tranrport modes for FY86. Although these figures are approximate,they confirm that BR's historic -importance in the transport sector has in factfallen substantially in recent years.
131 These are bilateral trading agreements, generally with eastern blockcountries.
- 187 -
Table 9.4: Freight and Passenger Transport Statistics, FY86
Rail (X) Road (S) TM. (X) Total (X)
Tonnes (million) 2.3 (10) 15.4 (65) 5.9 (25) 23.6 (100)T-km (billion) 0.61 (13) 2.62 (57) 1.41 (30) 4.64 (100)Pass. (million) 97 (23) 184 (43) 148 (34) 429 (100)Pass.km (billion) 7.0 (23) 16.6 (55) 6.5 (22) 30.1 (100)
Source: Mission estimates based on the Intermodal Transport StudX. Passengerestimates for rail have been increased by 651 to account forticketless travelers.
9.21 Up until PY83, BR was e1erally able to break-even in terms ofcovering its operating expenses. 4er Since FY83. however, there has been asignificant deterioration in BR's financial performance, with a consequentsharp increase in subsidy payments. Table 9.5 provides a summary of B"'soperating revenues and expenditures from FY77-89. This table shows the majorreasons for BR's deteriorating performance. Between FY77-83, BR was able toincrease its revenues in line with its operating expenses through frequenttariff increases. Since FY83, operating expenses have continued to increaserapidly (13.41 per annum in nominal terms, which is above the rate ofinflation), while fare increases have been infrequent and too small to sustainthe growth of operating revenues. Thus, BR4s detoriorating performance can beattributed to poor cost control and most importantly to inappropriate farepolicies, particularly since FY83.
9.22 Given the scarcity of local funds to support the ADP, the financialperformance of BR is a serious problem for the budget. Moreover, thesefigures understate the level of subsidies going to the railroad. Debt servicepayments on foreign loans alone (almost all of which are on concessionalterms) would increase the subsidies to BR by Tk Cr 38 to Tk Cr 142 (FY89).This is equal to almost the entire allocation of local funds in the FY89 ADPfor road sector investments (including bridges). When one includes the factthat BR makes no financial provision for the replacement of equipment or paysany debt service charges on local funds (let alone earning a reasonable returnof invested capital), it is clear that the overall level of subsidies ineconomic terms is very substantial indeed.
14/ This does not include provision for depreciation or debt service.
- 188 -
Table 9.5: Financial Performance of Bangladesh Railways, FY77-89(Tk Cr)
Operating Net Operating Income (+)Year Revenue Expenses /a Subsidy X-)
FY77 54.3 56.4 -2.1FY78 62.7 65.7 -3.0FY79 82.9 79.4 +3.5FY80 92.3 95.7 -3.4FY81 104.1 121.9 -17.8FY82 129.0 130.8 -1.8FY83 149.5 150.3 -0.8FY84 144.6 178.2 -33.6FY85 168.6 196.6 -28.0FY86 160.4 249.6 -89.2FY87 160.1 267.6 -107.5FY88 lb 175.0 282.2 -107.2FY89 /c 175.0 278.4 -103.4
La Does not include depreciation reserve or debt service./b Revised estimate./c Budget.
Source: Ministry of Finance.
9.23 Despite the deterioration in BR's financial performance since FY83,it has been able to attract considerable financing from the donors. ^s indicatedin Table 9.1, investment by BR fell from Tk Cr 136.6 in FY81 to Tk Cr 56.3 inFY85. Since FY85, investment in the railroad has increased to Tk Cr 208.1 inthe FY89 ADP. This assistance has allowed BR to carry out an extensiverehabilitation program for its facilities and equipment. However, theexpectation that this investment would allow BR to improve its financial andoperating performance has not been realized.
9.24 The actions needed to improve BR's performance are well-known andhave been spelled out in a number of reports. BR gives priority to passengertransport services at the detriment of freight operations, although itscomparative advantage lies with freight. While this approach may have hadsome justification in the period after independence when road transportservices were in poor condition, this situation is no longer relevant with therecent expansion in private road transport services. Experience in othercountries demonstrates that road transport is more efficient for almost alltypes of passenger trips, particularly because buses operate more frequently andserve a variety of routes and destinations. A change in BR's operatingphilosophy to give priority to freight traffic is the key to other actions
- 189 -
which would improve its performance. The major actions that have beensuggested and their possible impact on annual revenues and costs are thefollowingt
(i) Passenger fare increases. According to BR's own estimates,revenues from passenger services cover only about one-third ofoperating costs (FY86). At a minimum, doubling passenger fares ir.real terms would be desirable, which could increase revenues(depending on its impact on passenger travel) by Tk Cr 50-80.
(ii) Reduction of ticketless travel. Ticketless travel is estimated tobe about 402 (excluding the intercity services). Stricterenforcement would increase revenues by Tk Cr 30-50.
(iii) Closure of branch lines. BR has long maintained that many of itsbranch lines should be closed. Many of them carry almost nofreight, and passenger services could be easily replaced by roadtransport. A rough estimate of the cost savings attributable toclosing 14 branch lines indicates that Tk Cr 20 could be achieved.
(iv) Closure of uneconomic Rassenger services. The actions describedabove would go a long way toward rationalizing passenger demand.Based on changes in demand, BR should terminate uneconomicpassenger services, which would have a large impact on reducingcosts (the potential savings are difficult to estimate separatelyfrom the other measures).
(v) Increasing freight rates. Freight tariffs are estimated to coverabout 802 of operating costs (FY86). A 252 increase in real termswould yield Tk Cr 15-20 in revenues.
(vi) Staff reductions. BR has more staff now than before independence,despite the substantial decrease in services and introtuction oflabor-saving technology. The total cost for salaries, wages andallowances was approximately Tk Cr 140 in FY88, which isapproximately equal to the annual subsidy. It is estimated that astaff size on the order of two-thirds of the existing level shouldbe adequate, particularly if pausenger services are rationalized.This would provide cost savings of Tk Cr 40-50, much of whichwould be offset in the initial years by redundancy payments.
On this basis, cost savings and/or revenue increases on the order ofTk Cr 1.50-220 can be identified, which would allow BR to eliminate itsoperating deficit and begin to make a contribution to debt service paymentsand capital replacement. Given the magnitude of the changes, they wouldrequire several years to be implemented.
9.25 In BR's present situation, very little additional capital investmentwould appear to be justified, as the investments are unlikely to achieve theiranticipated benefits in tne current operating situation. Even if BR initiatesmany of the changes suggested above, a period of reduced investment would bedesirable in order to allow BR time to meet changing demand patterns and
- 190 -
incorporate the current projects into its operations. The rehabilitation ofthe track network will be substantially completed in the current investmentprogram. Therefore, the major investment issue relates to the availability ofequipment, particularly locomotives, wagons and coaches. There areindications that BR's existing fleet of wagons and coaches is more thanadequate for its requirements, thereby contributing to a low utilization rate.Improvements in passenger and freight operations woiild release additionalwagons and coaches becuse of reductions in turnaround times and thecancellation of uneconomic services. Hence, there seems to be little need foradditional wagons and coaches over the next several years, and evenreplacement investment can probably be curtailed. Similarly, the availabilityof locomotives should not be a problem if passenger services are rationalized.Recent purchases of both meter gauge and broad gauge main line locomotivesshould be adequate for BR's anticipated needs, while older locomotives can bewithdrawn from service as passenger services are reduced. Hence, theinvestment program during the FFYP period (FY91-95) should be limited totechnical assistance and maintenance related activities in order to improveBR's operations and possible implementation of improved container servicesbetween Chittagong and Dhaka.
9.26 There are two additional issues to be considered in BR's proposedinvestment program. The first is flood rehabilitation requirements from the1988 flood. Recent estimates have revised the estimate of flood damages from$81 million (as estimated in the UN report) to $36 million. This programshould be an important part of the investment activities to be undertaken byBR in the FFYP period.
9.27 The other outstanding factor in BR's proposed investment program isthe possible inclusion of a rail link on thq Jamuna bridge, provided that thedecision to build the bridge is positive.151 The preliminary economicanalysis indicates that the incremental economic rate of return for placingthe rail link on the bridge would be on the order of 4.8-10.3Z.16/ Themacroeconomic issues rel;ced to a possible rail link on the Jamuna bridge arethe following. First, substantial progress on a clear and coherent program toimprove BR's financial and operating performance should take place beforeconsideration is given to new investment projects, including the Jamuna bridgelink. With regard to the specific question of constructing a rail link on the
15/ BR has both broad gauge and meter gauge track on the west side of theJamuna, while the east bank is all meter gauge. BR currently operates aferry across the Jamuna in order to connect the two meter gauge sectionsat Bahadurabad Ghat. Construction of the rail link would allow BR tobypass the ferry service and improve services between eastern Bangladeshand the northwest part of the country. It would also require theconstruction of a new meter gauge rail line in order to connect thebridge with the existing meter gauge track at Bogra on the west bank andSarishabari on the east bank.
16/ The range in the estimated economic rate of return is due to differentassumptions on the pricing of rail services, which has a major impact onthe modal split of traffic between the road and rail networks.
- 191 -
bridge, the major concern relates to the additional financial burden of theinvestment. The inclusion of a rail link on the Jamuna bridge would increasethe cost of the bridge by approximately $105 million. Furthermore, theaddition of a new link to the rail network may require other investments totake advantage of the connection, including the possibility of replacing thebroad gauge system with met-r gauge track at some point. Hence, the long-terminvestment implications of the decision may be as important as the immediatedecision about placing the rail on the bridge. In the best of circumstances,this decision would be examined in the context of long-term priorities for thedevelopment of various transport modes. As a convincing inter-modaljustification is not yet available, the second option should be 'o undertakean analysis of the financial implications of the public investment program inthe road and rail sectors combined.
Inland Water
9.28 The public investment program for inland water declined fromTk Cr 37.7 in FY81 to Tk Cr 13.1 in FY87. In FY88 and 89, there has been asignificant increase in the ADP allocation to Tk Cr 65.0 in FY89.1i7 This isdue to the anticipated purchase of river ferries by BIWTC under a bilateralassistance agreement. The maintenance of inland waterways has recently beengiven greater prominence due to the floods and the possible impact ofincreased river siltation. 'While it is too early to determine whethersiltation was a major factor in the floods, there are grounds for anticipatingthat the public sector will take a more active role in the inland watersector.
9.29 BIWTA. Bangladesh Inland Water Transport Authority (BIWTA) isresponsible for the regulation of inland water transport services and themaintenance of river channels, landings and navigation signals. Its budgetunder the ADP has been virtually stagnant in the range of Tk Cr 15-20 sinceFY81. BIWTA estimates that the annual operating costs needed to support anadequate program for the dredging of inland waterways is about Tk Cr 12-15,whereas the amount provided by the Government has generally been in the rangeof Tk Cr 4-6. This has contributed to siltation problems in secondarywaterways, which is often mentioned as a major problem in maintaining dryseason navigation. There is a reasonable case for additional expenditures forthe maintenance of navigable waterways. A study has recently been cosupletedto provide a development strategy for inland waterways, and it is expectedthat this will pruvide the basis for increased funding for BIWTA.
9.30 BIWTC. The role of the Bangladesh Inland Water TransportCorporation (BIWTC) has decreased substantially as a result of private sectorparticipation in inland water transport. The expansion of the private sectorwas stimulated during the 1970s as a result of directed credit programs. Bythe early 1980s, there was substantial excess capacity in the sector, and theresulting competition among operators (and poor credit recovery policies)
17/ The FY89 Revenue Budget includes Tk Cr 7.8 as a grant-in-aid to BIWTA tohelp cover operating costs and a subsidy payment of Tk Cr 1.0 to BIWTCto subsidize water transport services on unprofitable routes.
-192 -
caused many of the loans to go bad. The result of this shake-out, however,has been the development of a thriving network of private operators. Theanomaly in the system is BIWTC. Both its financial and operating performanceare generally agreed to be poor. Some of the services provided by BIWTCcompete with the private sector at relatively high cost. While there may be ajustification for BIWTC to operate in particular areas (e.g., coastaloperations, ferries, etc.), these need to be carefully justified in terms oftheir cost and potential requirements for operating subsidies. Substantialinstitutional strengthening and cost reduotions should be a prerequisite forany additional investment in BIWTC.
9.31 The cost of flood rehabilitation in the inland water sector has beenestimated as Tk Cr 14.7 ($4.6 million) on an immediate basis and Tk Cr 52.2($16.3 million) in the longer run.181 Part of this amount (the breakdown isnot specified) would go for restoring navigation equipment and high prioritydredging by BIWTA, which is consistent with the strategy suggested above. Onthe other hand, rehabilitation investment for BIWTC should be considered inthe context of the longer-term role for the compaiy.
Marine
9.32 Chittagong Port Authority. Public investment in port developmenthas been in the range of Tk Cr 40-50 per year throughout most of the FY81-89period. The bulk of this has been for the expansion and improvement ofChittagong Port Authority (CPA). While this is a high priority investmentbecause of continuing congestion, implementation delays have been a majorproblem. Even two years after the completion of two multipurpose berths, thecontracts for the supporting facilities have not been let, so the berths areessentially inoperable. CPA earns substantial revenues from port fees, so theproblem is not due to a shortage of local funds. Indeed, because of the slowpace of project implementation, CPA had accumulated a cash surplus of wellover Tk Cr 200 by the end of FY88. Rather, the delays in projectimplementation have been due to procurement and technical assistancedifficulties. The highest priority is therefore to complete the ongoingprojects on an efficient basis. During the FFYP period (FY91-95), CPA willneed additional investment on the order of $60-100 million to handle theexpected increase in container traffic, repair and modernize its facilities,and improve operating efficiency. Given the revenue available from port fees,CPA should undertake this project on a self-financed basis, assisted by loansfrom donor agencies to cover the foreign costs of the improvements.
9.33 Shipping. While expenditures by Bangladesh Shipping Corporation(BSC) have generally declined since FY81, the ADP in FY87 and FY88 includedsubstantial funds (Tk Cr 142 in total) for the purchase of vessels. Thisexpenditure is difficult to justify. Estimates by the Ministry of Financeindicate that BSC made a substantial loss (Tk Cr 21.6 in FY86) on theoperation of its own vessels, while it claimed a profit (Tk Cr 14.1 in FY86)on the operation of chartered vessels. In this situation, a discontinuation
18/ Subsequent estimates indicate a slightly higher figure of $9.0 millionfor short-term repairs and $17.7 million for longer term measures.
- 193 -
of purchases of vessels and rationalization of BSC's operations would bejustified.
Aviation
9.34 Civil Aviation. Expenditures for civil aviation have been in therange of Tk Cr 20-40 since FY83. Expenditures for the construction ofairports in secondary towns were largely completed in the early 1980s. It isexpected that expenditures will rise during the next few years forimprovements to Zia International Airport in Dhaka as a result of damages fromthe 1988 floods. The immediate repair costs have been estimated at $2.5million to repair runway cracks and restore lighting and navigation systems tofull operations. An additional expenditure of $4.5 million has been suggestedfor drainage improvements and embankments to protect the runway in the eventof future flooding. It has also been suggested that Chittagong Airport shouldbe upgraded to accept wide-bodied aircraft to provide an alternative landingsite for Dhaka. The cost of this improvement (including an overlay of theDhaka runway) has been estimated on a preliminary basis at $36 million. Thisis a very large expenditure in the face of alternative requirements for funds,and therefore it should be scrutinized very carefully.
9.35 Biman. Since FY83, the purchase of aircraft by Bangladesh Biman hasbeen financed on the basis of external commercial loans, rather than throughthe government budget. Nevertheless, Biman's investment program represents apotential problem area for the budget that needs to be addressed. Domesticand regional airfares are very low and do not cover direct operating costs(based on Biman's estimated budget for FY88). As a result, domestic andregional services are heavily cross-subsidized from Biman's internationalroutes. During the first six months of FY88, Biman had total revenues ofTk Cr 263, of which Tk Cr 194 (96Z) was attributable to international routes.Because of the cross-subsidy to regional and domestic routes, Biman has notbeen able to meet its debt service payments for aircraft, which therefore havehad to be borne implicitly by the government budget. Biman is currentlyinvolved in a major expansion program and has been purchasing new aircraft toserve its international routes. This is a risky commercial venture, and manynational airlines have found that they cannot maintain an adequate revenueyield to justify the purchase of expensive wide-body aircraft. (Biman'saverage aircraft utilization factor on international routes is 10 hours, whichis acceptable by international standards. Biman's revenue performance per kmand average load factors are not available.) Moreover, this strategy runs therisk that additional revenues generated on international routes will be usedto support increased domestic and regional services, thereby exposing thegovernment budget to steadily increasing obligations for debt servicepayments. At a minimum, the Government should take steps to ensure thatBiman's international routes are operated on a fully commercial basis,including the responsibility for meeting all external debt service payments inforeign exchange. Airfares for domestic and regional services should beincreased substantially to cover a greater share of costs. As a last option,an explicit subsidy payment should be included in the budget to cover losseson domestic and regional services. This would be preferable to the existingsystem of implicit cross-subsidies, although the justification for the subsidyon distributional and efficiency grounds would not be compelling.
- 194 -
Communications
9.36 Bangladesh Telephone and Telegraph Board. The major share ofexpenditures in the public investment program for communications are forBangladesh Telephone and Telegraph Board (BTTB). The allocation for ETTB inthe ADP has averaged about Tk Cr 60 since FY81, representing a decrease inreal terms of about 402 between FY81-89. The major reason for this decline isthe implementation performance of BTTB. BTTB is considered to be one of theweakest telecommunications entities in South Asia. Even before the recentfloods, the operating efficiency of BTTB was very low, on the order of 202,despite the relatively low density of its network. On average, 502 of thetelephone lines are not working; 702 of the reported faults are due tounderground cable problems, reflecting an unusually serious deficiency in thebasic network. Much of this is due to inadequate provisions for operationsand maintenance, as well as organizational and management deficiencies.BTTB's investment program is also seriously unbalanced. BTTB expects to add46,000 lines of new switching equipment and associated transmission equipmentin FY89-90 at a total cost of Tk Cr 310. This large investment is unlikely tobe utilized effectively, however, as the urban cable networks are not matchedto the equipment and are in poor condition. Rectifying this problem isexpected to cost an additional Tk Cr 150.
9.37 BTTB has estimated the damage from the recent floods at over $100million, of which $22.6 million would be required for immediate replacement ofunderground cable networks in Dhaka and other towns and other urgent repairs.The cost basis for the remaining $78.2 million for longer-term rehabilitationhas not been specified. Given the condition of the network prior to thefloods, most of this expenditure represents basic rehabilitation of thetelephone network rather than damage due to the floods. While urgent repairsto put the telephone system back in operation should have high pricrity, theremaining investments should be approached in the context of a long-terminvestment project for BTTB. This should include the preparation of arealistic program for strengthening the capacity and operating efficiency ofthe telephone network and organizational changes in BTTB to improve strategyformulation, operations and maintenance, and training. Given the pastperformance of BTTB, a substantial technical assistance component would berequired to prepare and implement this project.
9.38 A final area of concern about BTTB is its financial performance.BTTB is operated as a semi-autonomous board of the Government, rather than acommercial agency. As such, it does not apply normal standards of commercialaccounting. BTTB claims an annual surplus in its budget.19i However, foreignloans are included on a concessional basis, and the provisions fordepreciation are inadequate. As a result, instead of being able to self-finance its investment program, which is expected of most telecommunicationscompanies in the world, BTTB is almost completely dependent on the ADP forboth local and foreign financing. In order to address this situation,reductions in operating costs (particularly with respect to overstaffing) andimprovements in billing, revenue collection and cost control should be themajor line of approach. Tariff increases may be necessary, but BTTB's tariffs
191 Beginning with the FY87 budget, this has included a charge for localcurrency loans.
- 195 -
are already comparable on a regional basis (a more detailed tariff study wouldbe desirable). In this situation, cost reductions and improvements in revenuecollections should have higher priority. In the longer run, establishment ofBTTB as a separate commercial entity should be considered, provided that itspresent operational and financial difficulties are adequately resolved.
9.39 Post Office. The Post Office registered a deficit in FY87 ofTk Cr 27.3 on operating expenses of Tk Cr 62.2 (not including Tk Cr 5.9 ininterest charges). Domestic postal rates for envelopes have not been changedsince FY85, with the result that the operating deficit has been increasingsteadily. Experience in other countries indicates that increasing subsidieswill eventually lead to declining services because of funding shortfalls.Given the importance of postal services in a country such as Bangladesh withpoor internal communications, it is preferable to aim for a recovery ofoperating costs. Increases in domestic postal rates (on the order of Tk 0.5every two years) and reductions in operating costs with a goal of coveringoperating costs by FY95 would be a reasonable objective. The investmentprogram for the Post Office in the FY89 ADP is Tk Cr 8.5. Most of this isallocated for civil works (especially staff housing) rather than equipmentneeded to improve the operations of the postal service, and the focus of theinvestment program should therefore be reviewed. Flood damage to postalservice buildings is estimated at less than Tk Cr 2.0, in addition toTk Cr 1.1 from the 1987 floods, most of which can be implemented relativelyquickly.
Summary
9.40 Table 3.5 provides a summary of recommended actions for the publicexpenditure program in the transportation and communications sectors. Theinvestment program proposed for the transportation sector appears to be overlyambitious and may be unsustainable within the likely constraints on fundingand physical implementation capacity. A carefail projection of fundingrequirements, including both foreign and local resources, and a realisticassessment of investment priorities should be carried out before any major newproject commitments are entered into. Other problems that have beenidentified include the chronic neglect of operations and maintenance and thepoor financial and operating performance of public sector transport operators.Given the importance of the transportation sector in terms of public fundingand development priorities, a major effort to .pgrade expenditure planning andbudgeting procedures in the transportation sector is highly desirable. It isessrntial that the Road Master Plan Study and the transportation sector studyshould proceed as quickly as possible so that investment priorities can berefined in the near future.
9.41 As regards the communications sector, the flood rehabilitationprogram prepared by BTTB reflects long-term rehabilitation requirementsbrought about by inadequate operations and maintenance and poor investmentplanning, rather than the immediate impact of flood damage. As such, most ofthe investment should be carried out as part of a long-term program to improvethe telecommunications network and address the serious operational andfinancial problems of BTTB.
-197-
Chapter X
Education
10.1 Enrollment in primary education has averaged about 60S of eligibleschool-age children since the mid-1970s, which is well below the levelachieved in many other developing countries (73? in the region). In addition,the quality of instruction needs substantial improvement, both in terms of itsrelevance for a largely agrarian society (where adult literacy is only 20Z inrural areas) and in terms of attracting and retaining promising students (onie-third of entering students drop-out before the second grade). The Governmeithas embarked on an ambitious program to upgrade the education system toachieve universal primary education (UPE) by the year 2000, defined as a 90Senrollment rate. Physical facilities are being expanded, the content andsupply of textbooks improved, and teacher training and supervision is beingupgraded. Even at this relatively early stage, however, concerns are emergingas to the long-term sustainability of the program in terms of its recurrentcost implications.
10.2 Table 10.1 shows the pattern of public investment in the educationsector between FY81-89 as gi en in the ADP. Allocations for the sector weregenerally stagnant in real terms between FY81-85, with increases occurring inyears when fiscal policy was less stringent (FY82 and FY84) which were offsetby cuts when fiscal policy was tighter (FY83 and FY85). Since FY85,allocations for the education sector have increased substantially, growing bymore than 150? in nominal terms and by approximately 80? in real terms.Looking at the FY81-89 period as a whole, the investment program has grown atan average annual rate of about 7Z in real terms, which represents asubstantial increase in resource flows to the education sector. A large shareof the additional resources has gone to primary education, which increased asa proportion of the education budget in the ADP from 30? to 48? between FY81-89, representing an average annual increase of 25? in nominal terms (14? inreal terms). Expevditures for technical and vocational level education alsoincreased significantly, while the allocations for secondary and higher leveleducation and universities stayed roughly constant in real terms. Thus, thepattern of investment in the ADP is generally consistent with the government'sstated priorities of universal primary education and the development of job-related skills.
10.3 The budget allocations in the ADP do not provide a comprehensivepicture of expenditure patterns in the education sector, as the bulk of theexpenditure program (70? on average) is provided through the Revenue Budget.Table 10.2 provides a breakdown of the total expenditure program for educationin the FY89 budget, as well as the percentage of funds provided from donorfinancing.11 Several features are worth noting. Although secondary and
On the basis of the detailed breakdown of project costs given in thePPs, it is estimated that about one-half of the expenditures in theADP are used for recurrent costs, while the other half are used forcapital investment (civil works and equipment).
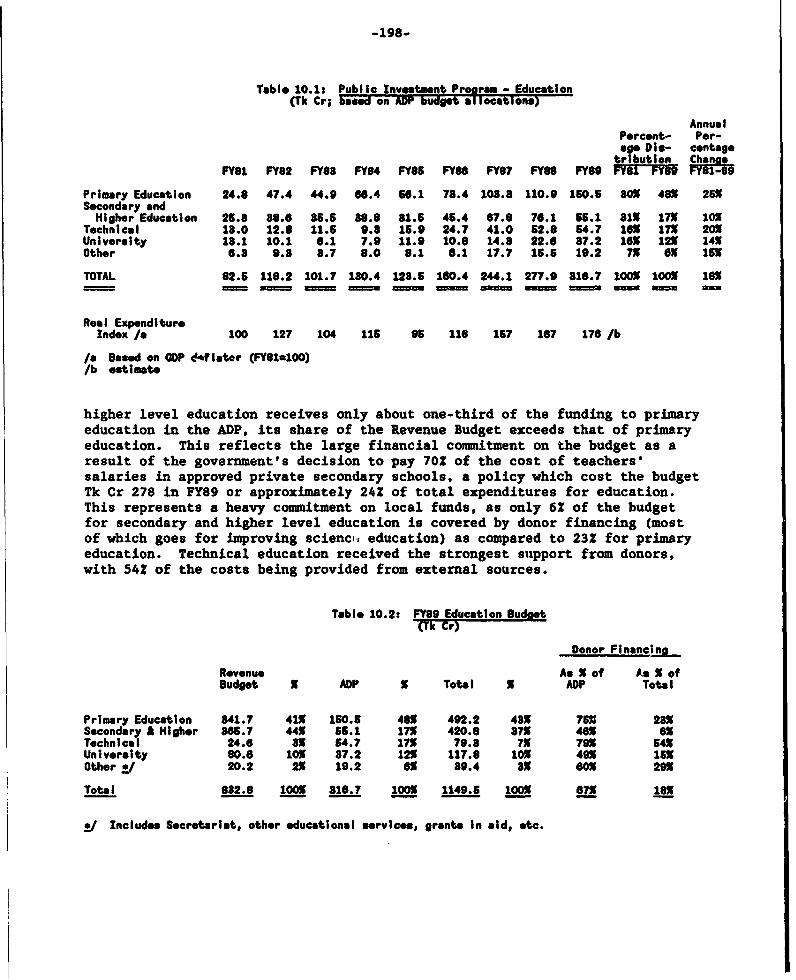
-198-
Table 10.1: Public Investment Program - Education(tk Cr; ba d on OP budget allocations)
AnnualPercent- Por-age Die- centag.tribution Change
FY61 FY82 FY88 FY84 FY6S FY66 FY87 FY68 FY89 PY8-FY8 FY81-09
Primary Education 24.6 47.4 44.9 86.4 66.1 78.4 108.8 110.9 160.5 80X 48X 256Secondary andHigher Education 25.8 88.6 85.5 86.8 81.5 45.4 67.8 76.1 55.1 81X 17X 10%
Technical 18.0 12.8 11.6 9.8 15.9 24.7 41.0 52.8 54.7 16% 17X 20%University 18.1 10.1 6.1 7.9 11.9 10.8 14.8 22.6 87.2 16X 12X 14XOther 6.8 9.8 8.7 8.0 6.1 6.1 17.7 16.6 19.2 7X Ox 15X
TOTAL 82.5 118.2 101.7 180.4 128.6 160.4 244.1 277.9 816.7 100X 100X 16Xe= =3= = = _ = 3a== === ===
Real ExpenditureIndex la 100 127 104 115 95 116 157 167 176 /b
/a Based on GOP & lator (FY814100)/b estimate
higher level education receives only about one-third of the funding to primaryeducation in the ADP, its share of the Revenue Budget exceeds that of primaryeducation. This reflects the large financial commitment on the budget as aresult of the government's decision to pay 70Z of the cost of teachers'salaries in approved private secondary schools, a policy which cost the budgetTk Cr 278 in FY89 or approximately 24? of total expenditures for education.This represents a heavy commitment on local funds, as only 6? of the budgetfor secondary and higher level education is covered by donor financing (mostof which goes for improving scienc( education) as compared to 23? for primaryeducation. Technical education received the strongest slupport from donors,with 54? of the costs being provided from external sources.
Table 10.2: FY89 Education Budbot(Tk Cr)
Donor Financing
Revenue As X ot 0. X ofBudget s ADP X Total X ADP Total
Primary Education 841.7 41X 160.5 48X 492.2 48X 75X 23xSecondary A Hlgher 865.7 44X 56.1 17% 420.8 87X 46X exTechnical 24.6 8x 54.7 17X 79.8 7X 79X 64XUniversity 60.6 10% 87.2 12% 117.8 10X 49X 15XOther !I 20.2 2X 19.2 es 89.4 8X s0X 29X
Total 882.8 100% 316.7 100% 1149.5 100% 67X 18X
g Includes Secretriat, other educational services, grants In aId, etc.
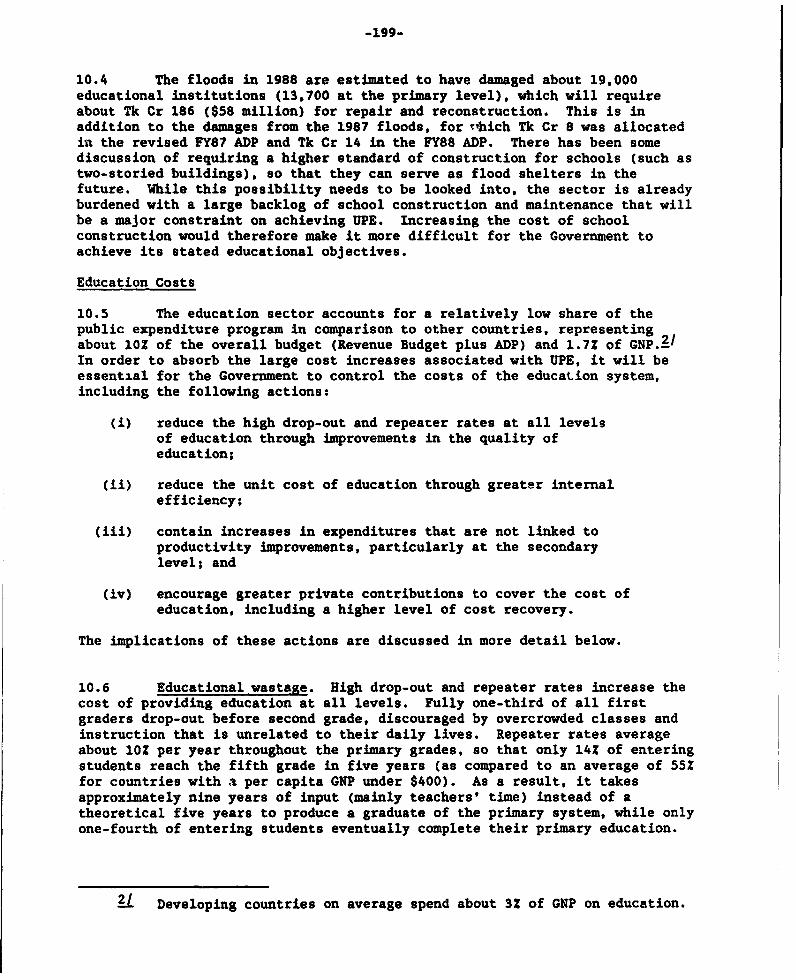
-199-
10.4 The floods in 1988 are estimated to have damaged about 19,000educational institutions (13,700 at the primary level), which will requireabout Tk Cr 186 ($58 million) for repair and reconstruction. This is inaddition to the damages from the 1987 floods, for *hich Tk Cr 8 was allocatedin the revised FY87 ADP and Tk Cr 14 in the FY88 ADP. There has been somediscussion of requiring a higher standard of construction for schools (such astwo-storied buildings), so that they can serve as flood shelters in thefuture. 'While this possibility needs to be looked into, the sector is alreadyburdened with a large backlog of school construction and maintenance that willbe a major constraint on achieving UPE. Increasing the cost of schoolconstruction would therefore make it more difficult for the Government toachieve its stated educational objectives.
Education Costs
10.5 The education sector accounts for a relatively low share of thepublic expenditure program in comparison to other countries, representingabout 102 of the overall budget (Revenue Budget plus ADP) and 1.7Z of GNP.VIn order to absorb the large cost increases associated with UPE, it will beessential for the Government to control the costs of the education system,including the following actions:
(i) reduce the high drop-out and repeater rates at all levelsof education through improvements in the quality ofeducation;
(ii) reduce the unit cost of education through greater internalefficiency;
(iii) contain increases in expenditures that are not linked toproductivity improvements, particularly at the secondarylevel; and
(iv) encourage greater private contributions to cover the cost ofeducation, including a higher level of cost recovery.
The implications of these actions are discussed in more detail below.
10.6 Educational wastage. High drop-out and repeater rates increase thecost of providing education at all levels. Fully one-third of all firstgraders drop-out before second grade, discouraged by overcrowded classes andinstruction that is unrelated to their daily lives. Repeater rates averageabout 102 per year throughout the primary grades, so that only 142 of enteringstudents reach the fifth grade in five years (as compared to an average of 552for countries with a per capita GNP under $400). As a result, it takesapproximately nine years of input (mainly teachers' time) instead of atheoretical five years to produce a graduate of the primary system, while onlyone-fourth of entering students eventually complete their primary education.
2/ Developing countries on average spend about 3? of GNP on education.
-200-
10.7 At the secondary level, repeater rates are estimated to be over 25Z(compared to 202 in other low income countries). Of students who reach grade10, only 80? are judged by their school to be ready to take the SecondarySchool Certificate (SSC) examination, and of these 502 fail. As a result, ittakes about 16 years of secondary school input (instead of a theoretical five)to produce one SSC graduate. Similarly, the intermediate colleges require anestimated five years of input instead of two years to produce one HigherSecondary Certificate graduate. In the degree colleges, there are fewer drop-outs or repeaters, but the failure rate of those who sit for BA and BS degreesaverages 652. In the university system (Honors Degree), frequent strikes andclosures of the universitieq and delays of up to a year in grading finalexaminations contribute to keeping students enrolled well beyond the expectedperiod.
10.8 The high wastage rate at all levels of the education system needs toreceive serious attention. While part of the problem undoubtedly involves thepoor quality of instruction (i.e, supply-side problems), there may well bedemand factors (i.e. low perceived benefits of education) that need to beaddressed. Whatever the reasons for the high wastage rates, it is clear thatthe education system is being hampered by a large number of students whorequire a long time to complete their studies. Significant benefits can beachieved by moving students through the education system more efficiently andby ensuring that students who leave school obtain skills that can be usedproductively in the labor market.
10.9 Unit costs. Table 10.3 compares the average cost per student atvarious levels of the education system. The average cost per student inpublic secondary schools and colleges is six times the cost per student inprimary education, while the corresponding comparisons are 20:1 for vocationaland teacher training institutes, 65:1 for specialized training institutes(such as textiles, leather, graphic arts, glass and ceramics, and engineeringcolleges) and 54:1 for university education. In contrast, the costdifferential between secondary and primary education i,s about 3:1 for otherdeveloping countries and about 2.2:1 for South Asia.3/ Similarly, the ratioof costs for university students to primary education is 26:1 for otherdeveloping countries and 15:1 for South Asia. The average cost per student inBangladesh is about 62 of per capita GNP for primary education, while it is37Z for secondary and higher schools, 325Z for universities and almost 4002for specialized colleges. By almost all measures, therefore, thediscrepancies in the unit costs of education at various levels are excessive.While this indicates the need to control education costs at higher levels, thelow expenditure per student at the primary level is also an important factorin explaining the differentials, which indicates that expenditure control canaddress only part of the problem.
31 World Bank, Financing Education in Developing Countries, 1986. Thedata for other developing countries are based on 1980 comparisons.There are indications that the average cost per student in privatesecondary schools may be somewhat less than the comparison shownhere.
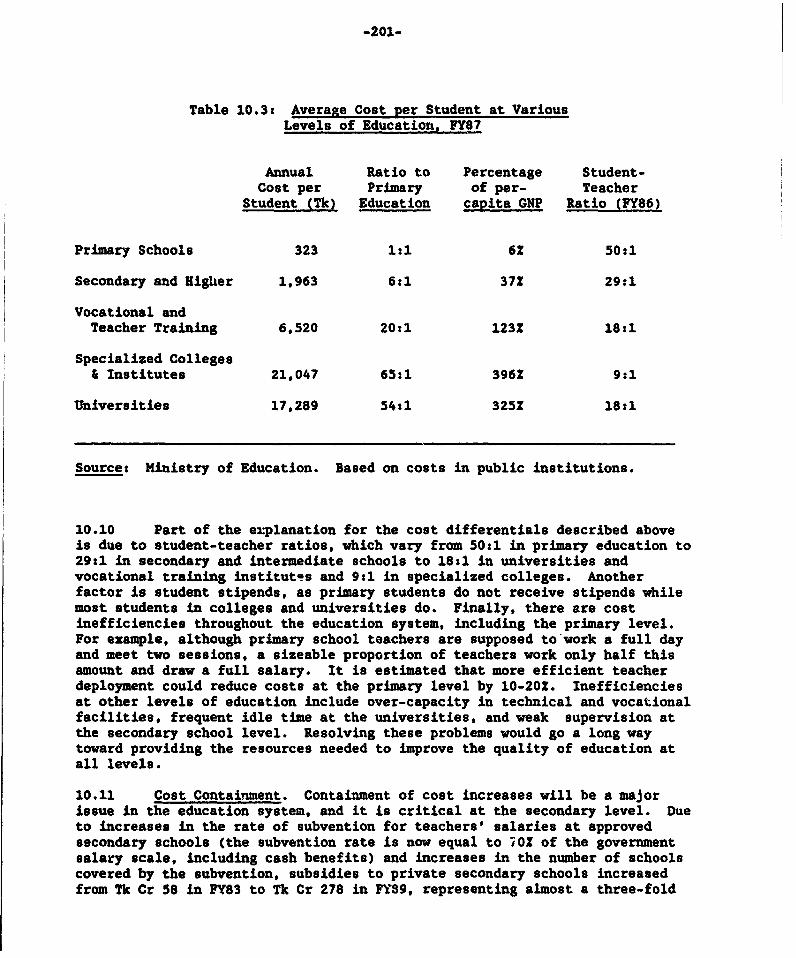
-201-
Table 10.3: Average Cost per Student at VariousLevels of Education, FY87
Annual Ratio to Percentage Student-Cost per Primary of per- Teacher
Student (Tk) Education capita GNP Ratio (FY86)
Primary Schools 323 1:1 6? 50:1
Secondary and Higher 1,963 6:1 37Z 29:1
Vocational andTeacher Training 6,520 20:1 123? 18:1
Specialized Colleges& Institutes 21,047 65:1 396Z 9:1
Universities 17,289 54:1 325Z 18sl
Source: Ministry of Education. Based on costs in public institutions.
10.10 Part of the explanation for the cost differentials described aboveis due to student-teacher ratios, which vary from 50:1 in primary education to29:1 in secondary and intermediate schools to 18:1 in universities andvocational training institutes and 9:1 in specialized colleges. Anotherfactor is student stipends, as primary students do not receive stipends whilemost students in colleges and universities do. Finally, there are costinefficiencies throughout the education system, including the primary level.For example, although primary school teachers are supposed to'work a full dayand meet two sessions, a sizeable proportion of teachers work only half thisamount and draw a full salary. It is estimated that more efficient teacherdeployment could reduce costs at the primary level by 10-20?. Inefficienciesat other levels of education include over-capacity in technical and vocationalfacilities, frequent idle time at the universities, and weak supervision atthe secondary school level. Resolving these problems would go a lc,ng waytoward providing the resources needed to improve the quality of education atall levels.
10.11 Cost Containment. Containment of cost increases will be a majorissue in the education system, and it is critical at the secondary level. Dueto increases in the rate of subvention for teachers' salaries at approvedsecondary schools (the subvention rate is now equal to ?OS of the governmentsalary scale, including cash benefits) and increases in the number of schoolscovered by the subvention, subsidies to private secondary schools increasedfrom Tk Cr 58 in PY83 to Tk Cr 278 in FY89, representing almost a three-fold

-202-
increase in constant prices. In principle, it may be preferable for theGovernment to support secondary education by subsidizing private secondaryschools rather than establishing public institutions. Nevertheless, theincrease in funding for secondary schools appears to have had little impact onimproving educational quality. The accreditation process for secondaryschools is lax, and no standards or inspection systems have been establishedto control how the funds are used. The Ministry of Education recentlyproposed placing a cap on the current rate of subvention and limiting thenumber of schools that qualify (there are currently almost 1000 schools thathave requested accreditation in order to receive the subvention). There isstrong pressure from the Secondary and College Teachers' Associations toincrease the rate of subvention to lOOS of the government salary scale. Sucha move would significantly reduce the prospects for achieving UPE within theforeseeable future.
10.12 There are a number of actions that have been proposed for achievingcost savings and quality enhancements at reasonable cost. These includepromotion of greater private and NGO participation in education programs(particularly at the pre-primary and non-formal levels, including adultliteracy), expan.ing community contributions (either cash or in-kind) forclassroom construction and maintenance, improving the efficiency of technicaland vocational education programs, and increasing cost recovery, particularlyat the secondary and higher levels of education. The Ministry of Educationhas prepared a draft set of policy prcposals which recommend a number of stepsto control costs, focus priorities on the achievement of UPE and improve thequality and relevance of education throughout the system. These proposalsrepresent a thoughtful and reslistic assessment of priorities in the educationsector, and adoption of the proposals would constitute an important steptoward establishing a realistic basis for further expansion of publicexpenditures in this sector.
Fiscal Implications of Universal Primary Education
10.13 The future costs of the education system will depend largely on thegovernment's willingness to institute policy reforms. In this regard. it isuseful to have a base set of projections to assess the implications of UPE forthe public expenditure program. Such a scenario has been prepared on thebasis of reasonable estimates about changes in unit costs and the requirementsfor various types of expenditures (such as school construction, teachers'salaries, teacher training, classroom supplies, etc.) needed to achieve UPE.The major unknown factor is the extent to which increases in unit costs neededto achieve quality enhancements at the primary level can be offset by costsavings through reductions in student wastage and internal cost efficiency
-203-
improvements elsewhere in the education system.4/ For the purposes of thisreport, it is assumed that modest net increases in unit costs (on the order of12 per year) will be required in order to improve educational quality andreduce drop-out and repeater rates so t at student wastage at the primarylevel is cut in half by the year 2000.51
10.14 Table 10.4 shows the costs involved in achieving UPE as compared tothe base case of maintaining the primary enrollment rate at its current levelof 602 with no quality improvements. The cost increases would come fromseveral sources:
ti) Population growth. Expected growth in the number of school-agechildren will require an expansion of the education system just tomaintain the primary enrollment rate in the vicinity of 602. Thiswill generate annual real cost increases on the order of 32 to coverthe additional teachers, school materials, school construction andmaintenance improvements needed to accommodate a growing studentbody (see Scenario 1).
(ii) Increase in the primary enrollment rate to 902. Expanding theprimary enrollment rate to 902 of eligible school-age children andintroducing quality improvements to reduce the high student wastagerate would require annual increases in expenditures at the primarylevel of approximately 7Z in real terms (see Scenario 2).
(iii) Increases in secondary level enrollments. An increase in the numberof students that complete the primary level would generate anincrease in enrollments at secondary and higher levels of education.Assuming no change in the current transition rate from primary tosecondary and no changes in unit costs at the secondary level, theintroduction of UPE is likely to increase expenditures for secondaryeducation by about 72 per annum in real terms.
4/ Cost increases related to quality enhancements will arise from (i) wagecreep due to a higher percentage of trained teachers; (ii) improvementsin teaching materials such as textbooks and other supplies; (iii) highercosts for teacher training, including more in-service and retrainingprograms; (iv) better school facilities; and (v) better supervision,including a reduction in the ratio of teachers to supervisors at theupazila level. For additional explanation of the assumptionsincorporated into these proje-cions, a working paper prepared for thePublic Expenditure Review discusses the projection methodology ingreater detail.
5/ Since little is known about the technological relationship betweenschool inputs and the outputs of the system, this assumption cannot betested. It is likely that the assumed increases in unit costs will nctbe sufficient to achieve the targeted reductions in wastage rates, inwhich case the cost implications of UPE will be even higher thanprojected here.
-204-
Table 10.4: Proiections of Education Expenditures, FY88-FYOO(Tk Cr; constant FY88 prices)
Cost Requirements
Scenario 1s Steady State FY88 FY90 FY95 FY00Budget
Primary 421 497 558 593a. Maintain primary Secondarv a/ 359 382 491 541
enrollment rate Total 780 879 1049 1134at current level. As Z
b. No reduction in of FY88 10O 113S 1342 145Zstudent wastage ratesfor primary education. Average Annual Increase - 3.1S
c. No cost increases forquality improvements.
d. Maintain currenttransition rate fromprimary to secondary level.
Scenario 2: Universal Primary FY88 FY90 FY95 FY00Education Budget
a. Increase primary Primary 421 540 752 926enrollment rate to Secondar a/ 359 390 590 85890? by year 2000. Total 780 930 1342 1784
b. Reduce student As 2 ofwastage rates at FY88 100l 119S 1722 2291primary level by one-half.
c. Selective cost increases atprimary level for quality Average Annual Increase = 7.1Zimprovements.
d. Maintain current transitionraqte from primary to secondarylevels.
a/ Does not include capital expenditures.
-205-
10.15 Under reasonable assumptions, therefore, the cost of attaining UPE
is likely to require annual real increases in expenditures for primary and
secondary education of about 7Z between now and the year 2000, as compared to
an increase of 3! needed to maintain enrollment levels at their current rate.
Depending on the rate of growth in the economy, this will imply an increase in
the share of education in the overall budget from about 1OZ at present to 11-13Z by FY95. At the same time, the scenario allows little flexibility forcost increases elsewhere in the education system.
Detailed Expenditure Programs
10.16 Primary Education. The challenge of achieving UPE in the face of alarge and rapidly growing school age population is tremendous. Even with a
growth rate of 22 per year in the number of children reaching school age(which is less than the current growth rate of 2.6Z for the population), thepotential number of children seeking entry to the first grade could reach 3.4million in 1990, 3.8 million in 1995, and 4.2 million in year 2000. At this
rate, the total number of students in primary school, assuming UPE is achievedby the year 2000, would reach 10.3 million in 1990, 13.2 million by 1995, and17.4 million in year 2000.61 To accommodate this large increase in primary
school enrollment, 80,000 additional classrooms would be needed by year 2000,
assuming that each classroom handles two classes of 50 students each on a
daily basis. Current projects in the ADP provide for the construction of 2000
new classrooms ovet a period of about five years, as well as the repair and
renovation of about 1500 primary schools and the construction of sanitary
latrines and tubewells at schools that lack these facilities.7/ Althoughthese projects will help alleviate the current shortage in classrooms, they
will leave a deficit of about 20,000 usable classrooms in addition to the
construction that will be required to achieve UPE.
10.17 Keeping in mind the capacity of the sector to undertake capital
investments, an optimistic target would be to achieve an annual building rate
on the order of 8a over the next three years (measured as the number of new
classrooms constructed as a proportion of the current deficit). This implies
a construction rate of about 6,600 new classrooms annually by FY91. Togetherwith an annual repair rate of 102 for schools requiring renovation, this would
reduce the deficit in classrooms to about 101 of total requirements by the
year 2000. At an average cost of Tk 200,000 per classroom (including the cost
of school furniture), this would require expenditures of about Tk Cr 145 per
year by FY91. In order to address the remaining deficit in facilities, more
6! This assumes that wastage rates are cut in half at the primary level.In addition, the projections do not include the so-called "baby class"of under-aged students who attend school along with older siblings,which could increase space requirements by an additional 2 millionstudents in the year 2000.
71 A school mapping exercise carried out in 1983 found that only 222 ofexisting schools were usable throughout the school year and 412 neededtotal reconstruction.
-206-
innovative scheduling of classes (e.g. three shifts in the lower grades) wouldneed to be explored.
10.18 The construction program described above would require a annualbudget for recurrent maintenance activities of about Tk Cr 25 by FY90,increasing to Tk Cr 60 by the year 2000. In FY88, the allocation for repairsand maintenance for the education sector was Tk Cr 21.5, of which only Tk Cr 5was allocated for primary schools. In practice, flood rehabilitation hasoften been used by the Ministry of Education to catch up on the backlog ofmaintenance for primary schools. With a substantial increase in schoolconstruction in the future, this approach will not be appropriate, andalternative methods, including parent support through cash or in-kindservices, should be explored to maintain schools in a reasonable condition.
10.19 In addition to more classrooms, the sector must hire and train moreteachers to accommodate the increase in primary school enrollment. Keepingthe pupil/teacher ratio at about 50:1 and maintaining two shifts per teacherper day would require an increase of about 80,000 primary school teachers bythe year 2000 to support UPE. Teacher training institutes graduated about38,000 teachers between 1975 and 1983 while operating at less than fullcapacity, so some increase in the number of facilities may be required in themedium term, esptc ially if the Government introduces retraining programs forexisting teachers.8! As regards salary costs for additional teachers, theFY89 budget allocated Tk Cr 335 for salaries and allowances of primary schoolteachers and other staff, representing 98Z of the allocation in the RevenueBudget for primary education. With the projected increase in the number ofteachers and staff associated with UPE, the budget allocation would rise to TkCr 346 in FY90, Tk Cr 441 in FY95, and Tk Cr 546 in year 2000 (FY88 constantprices).
10.20 These projections are intended to illustrate the physical andfinancial requirements for achieving UPE. These projections are onlyrealistic, however, if the Government is willing to carry out policy reformsto improve education quality and control unit costs. These are difficultactions to carry out in the contexlt of a highly conservative sector withstrong labor unions. Nevertheless, it is important to keep an ambitiousobjective in mind, even if a cautious assessment indicates that achieving UPEwill require a longer timetable than is currently projected by the Government.These considerations confirm the need for the Government to maintain costcontrol at all levels of education, as sigaificant increases in expendituresat higher levels would likely delay UPE for an even longer period. For thedonors, there is a need to avoid getting too caught-up in the physical targetsfor UPE. In the long run, it will be more important to work with theGovernment in establishing the institutional structure and planning capabilityneeded to support UPE when it is finally achieved.
10.21 Secondary and Hiaher Education. A total of 3.3 million stunents arecurrently enrolled in secondary schools and colleges, of vhich about 10? are
8/ There are 52 Primary Teacher Institutes (PTI) with a total capacity of10,400. The actual enrollment in August 1986 was 6,860, so no increasein PTIs is required in the near future.
-207-
enrolled in public secondary schools. In addition, there are about 0.7million madrasah students falling under che administrative and budgetaryresponsibility of the Ministry of Education.91 Since the establishment of thesubvention for teacher salaries in private secondary schools, the number ofschools has increased at an average rate of 3.8Z per year, as compared withenrollment in primary schools which grew at about 2Z annually over the sameperiod. With the achievement of UPE and a reduction in student wastage rates,the total number of students in secondary schools and intermediate collegescould reach 7 million by year 2000. Degree college students and madrasahstudents at the secondary and higher level could provide an additional 2million. If the share of enrollments remains at current levels, all but about500,000 students would be enrolled in non-government schools by year 2000.
10.22 The Government needs to ensure that it receives adequate benefitsfor its substantial contribution to private secondary education. This shouldinclude the establishment of a minimum curriculum for schools to qualify forthe government subvention. Additional teacher trainin- may be desirable toupgrade the skills of current teachers, and closer supervision of secondaryschools and colleges is in order. More importantly, the Government needs totake a firm line on retaining the subvention for teachers' salaries at thecurrent rate (despite very strong pressure from the teachers' associations)and limiting the number of new schools that become eligible for thesubvention.
10.23 Vocational and Technical Education. The donors have providedgenerous support for vocational and technical education, covering about 54Z ofthe costs in the FY89 budget (Revenue Budget plus ADP). Despite thissubstantial input, the current system exhibits high unit costs (reflectingexcess capacity at many institutions) and is providing skills that are notwell-matched to labor market conditions. These problems are known, and anumber of measures have been recommended to deal with them. However, theMinistry of Education has had difficulty in implementing reforms in the faceof strong local opposition, including frequent student and teacher strikes.Until progress is made in resolving this situation, it is recommended that thelevel of support for vocational and technical education should be phased downand that no further construction of new facilities should take place.
10.24 Universities. In FY89, the Government provided Tk Cr 80.6 in grantsthrough the Revenue Budget to the universities; in addition, Tk Cr 37.2 wasprovided through the ADP, mainly for libraries, laboratories and studentresidence halls. Government grants account for about 87Z of the budget of theuniversities; tuition fees and other internal sources of income cover onlyabout 8Z of total costs. Enrollment has grown at an average annual rate of3.5S since 1974, most of which has occurred in the last ten years. Atpresent, there are seven universities, with two more being built in Sylhet andKhulna. The University of Dhaka has the largest enrollment with 35Z of thestudents, followed by the University of Rajshahi with 302.
9/ Madrasah schools provide religious instruction to Muslim students.There are five types of madrasahs, depending on the level of educationoffered to students. Ebtedayee madrasah students (essentially primaryschool) numbered about another 1.4 million in 1986.
-208-
10.25 The high unit cost in the universities (and especially in thespecialized technical institutions) deserves attention. In part, thisreflects students taking a lengthy period to complete their degrees. This ispartially due to poor job prospects, as the majority of students take liberalarts courses, for which there is relatively low demand in the labor market.i0/In addition, cost efficiency at the universities is poor. with high overheadcosts (particularly for support personnel) and student stipends. Given thesemi-independent status of the universities, they should take the initiativein addressing this situation. The Government ran assist by freezing budgetallocations and enrollments at current levels, thereby encouraging theuniversities to address the issues of internal efficiency and cost recovery.The Ministry of Education has recommended that fees should be graduallyincreased from grade nine up through the university level, accompanied byscholarships and student loans. This approach is reasonable on both equityand efficiency grounds and should be pursued by the Government.
10.26 Cost Recovery. Table 10.5 provides the current fee structure ingovernment and private schools. There appears to be ample opportunity toraise fees, particularly at the higher levels (including vocational andtechnical education). 1 In view of the substantial funding requirements forachieving UPE, frequent increases in fees at all levels of the educationsystem should be considered. This would also encourage students to completetheir course of study more quickly, thereby helping to reduce the unit costsof the education system.
Summary
10.27 Table 3.6 provides a summary of recommendations for the educationsector. The Government has adopted an ambitious goal in universal primaryeducation which has received enthusiastic support from the donor community.Achieving universal primary education by the target date of year 2000 willrequire a long-term sustained increase in the level of expenditures forprimary education, on the order of 7-8Z per year in real terms underoptimistic assumptions. Absorbing this increase will require a substantialincrease in local funds for teachers' salaries and supplies and a majorimprovement in project implementation performance. Equally as important, itwill require strict control of cost increases at all levels of education, aswell as policy actions to reduce unit costs and improve educational quality.The Ministry of Education has recently prepared a draft framework of policychanges that would go a long way toward redirecting government priorities toachieving UPE. The government's response to these proposals should be a majorfactor in determining the future level of donor support for educationprograms.
10/ A contributing factor is the fact that the Government has reduced therecruitment of Class I and II officers in recent years.
11/ User fees cover 5Z of unit costs at the secondary level and 12 at theuniversity level, as compared to 1OZ and 29Z respectively in India.
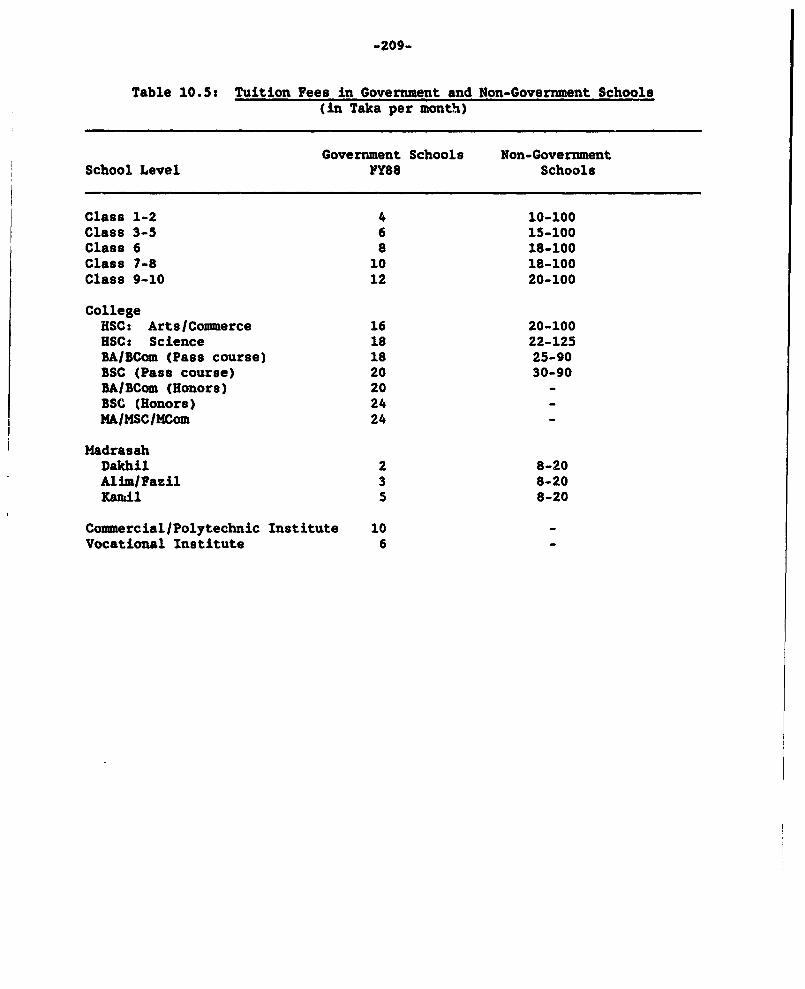
-209-
Table 10.5: Tuition Fees in Government and Non-Government Schools(in Taka per month)
Government Schools Non-GovernmentSchool Level YY88 Schools
Class 1-2 4 10-100Class 3-5 6 15-100Class 6 8 18-100Class 7-8 10 18-100Class 9-10 12 20-100
CollegeHSCs Arts/Commerce 16 20-100HSC: Science 18 22-125BAIBCom (Pass course) 18 25-90BSC (Pass course) 20 30-90BAIBCom (Honors) 20 -BSC (Honors) 24MA/MSC/MCom 24
MadrasahDakhil 2 8-20Alim/Fazil 3 8-20Kanij 5 8-20
Commercial/Polytechnic Institute 10Vocational Institute 6
- 211 -
Chapter XI
Health asd Population Control
11.1 The current health situation is characterized by a moderately highpopulation growth rate (estimated at 2.62 per year, about the middle of thedistribution for the 37 poorest countries), with very high infant mortalityand incidence of other diseases and low levels of health infrastructure(roughly 7,000 people per physician, approximately 3 to 4 times the level inIndia). The policy framework for the sector was established in 1975, when theGovernment endorsed the concept of strengthening health services at the locallevel and included population control as a major objective of the healthprogram. Public expenditures for health and family planning represented 4Z ofthe total budget and 0.8Z of GDP as of FY87, which reflects a 402 increase inreal per capita expenditures over the past decade. The main features of theexpenditure program can be characterized as: (i) rapid growth with anemphasis on the construction of new facilities; (ii) integration of health andfamily planning services under a single ministry and sharing of commonfacilities, although with separate management and field service systems; and(iii) a low unit cost of services throughout the system, with low utilizationrates for newly created health facilities. While the overall direction of thegovernment's program is generally sound, there is a growing recognition thatfurther improvements will be needed.
11.2 The focal point for the rural health care program has been theestablishment of a system of Upazila Health Complexes (UHCs; generally a 31bed hospital, of which 344 out of a planned 397 have been constructed); UnionHealth and Family Welfare Centers (UHFWCs; rural clinics, of which 2,300 outof a planmed 4,500 have been completed); and field services at the ward level,consisting of a Family Welfare Assistant (female) and/or a Health Aess stant(male), which nee now established in approximately 902 of all wards.1 f Donorfinancing has been essential in establishing this system, both forconstruction of physical facilities and also covering much of the recurrentcosts of the system, including drugs, contraceptives, medical and surgicalrequisites, training for district and upazila staff, communnicat.Lons programs(e.g., to increase public awareness of oral rehydration salts and promotedemand for contraceptives), and the salaries of supervisory and field staff,including funding for 14,500 family welfare assistants.
11.3 Health and population control are listed separately in the ADP,although the services were combined under one ministry in 1982. Table 11.1provides the breakdown of allocations in the ADP for the period FY81-89.While allocations for the sector fell by approximately 202 in constant pricesbetween FY81-86, the allocations in the ADP have increased since then and arenow at about the FY81 level in real terms. Expenditures for populationcontrol have increased from 562 to 652 of the sectoral allocation over the
1/ The average target population at each level is: (i) for UHCs, a populationof about 220,000; (ii) for UHFWCs, a population of about 22,000; and (iii)for field services, a population of about 7,500.
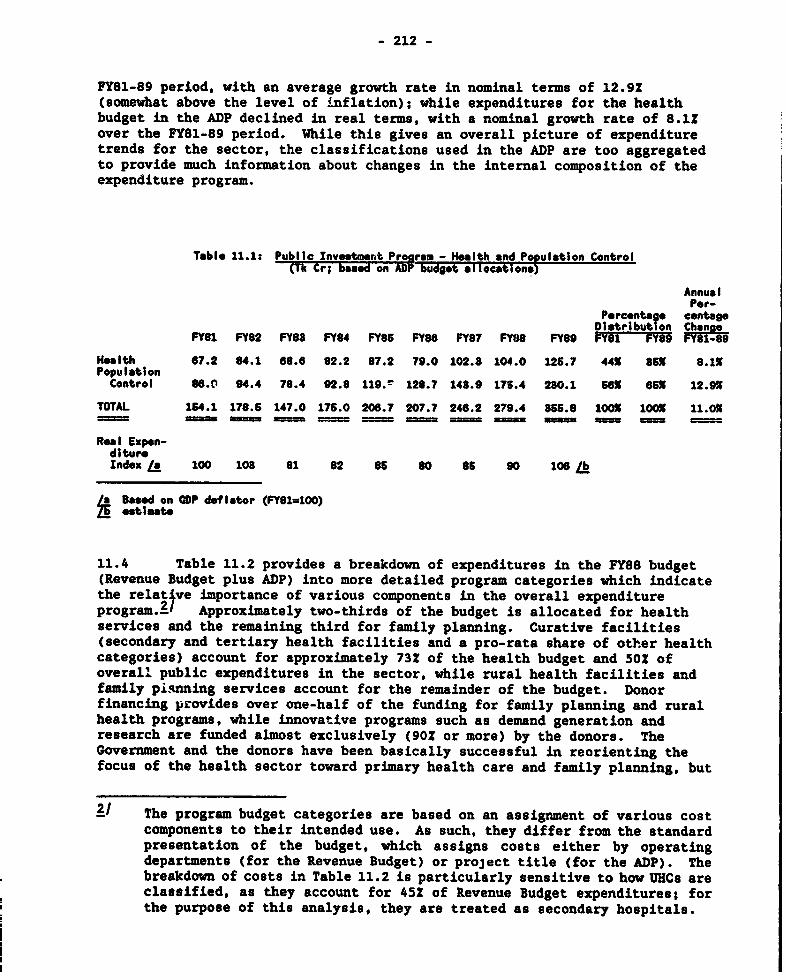
- 212 -
FY81-89 period, with an average growth rate in nominal terms of 12.92(somewhat above the level of inflation); while expenditures for the healthbudget in the ADP declined in real terms, with a nominal growth rate of 8.12over the FY81-89 period. While this gives an overall picture of expendituretrends for the sector, the classifications used in the ADP are too aggregatedto provide much information about changes in the internal composition of theexpenditure program.
Tabl- 11.1: Public Investmenit PrOgram - Health and Population Control(Tk Cr; based on ADP budget alloCations)
AnnualPer-
Perc ntag cOntag.Distributyon Change
FY81 FY82 FY83 FY84 FY8S FY86 FY87 FY88 FY89 FY81 FY89 FYSI-S9
Health 67.2 84.1 6e.6 82.2 87.2 79.0 102.8 104.0 126.7 44X a5X 8.1%Populatlon
Control MC.I 94.4 78.4 92.8 119.- 128.7 148.9 175.4 230.1 6OX 66X 12.9%
TOTAL 164.1 178.6 147.0 175.0 206.7 207.7 246.2 279.4 355.8 100X 100X 11.0%= = _ _= =_ S =U=
Rea I Expen-di tureIndex / 100 108 81 82 85 80 86 90 106 Lb
; Based on CDP deflator (FYS1=100)
11.4 Table 11.2 provides a breakdown of expenditures in the FY88 budget(Revenue Budget plus ADP) into more detailed program categories which indicatethe relat ve importance of various components in the overall expenditureprogram.2f Approximately two-thirds of the budget is allocated for healthservices and the remaining third for family planning. Curative facilities(secondary and tertiary health facilities and a pro-rata share of other healthcategories) account for approximately 732 of the health budget and 502 ofoverall public expenditures in the sector, while rural health facilities andfamily piqnning services account for the remainder of the budget. Donorfinancing provides over one-half of the funding for family planning and ruralhealth programs, while innovative programs such as demand generation andresearch are funded almost exclusively (902 or more) by the donors. TheGovernment and the donors have been basically successful in reorienting thefocus of the health sector toward primary health care and family planning, but
2/ The program budget categories are based on an assignment of various costcomponents to their intended use. As such, they differ from the standardpresentation of the budget, which assigns costs either by operatingdepartments (for the Revenue Budget) or project title (for the ADP). Thebreakdown of costs in Table 11.2 is particularly sensitive to how UHCs areclassified, as they account for 452 of Revenue Budget expenditures; forthe purpose of this analysis, they are treated as secondary hospitals.
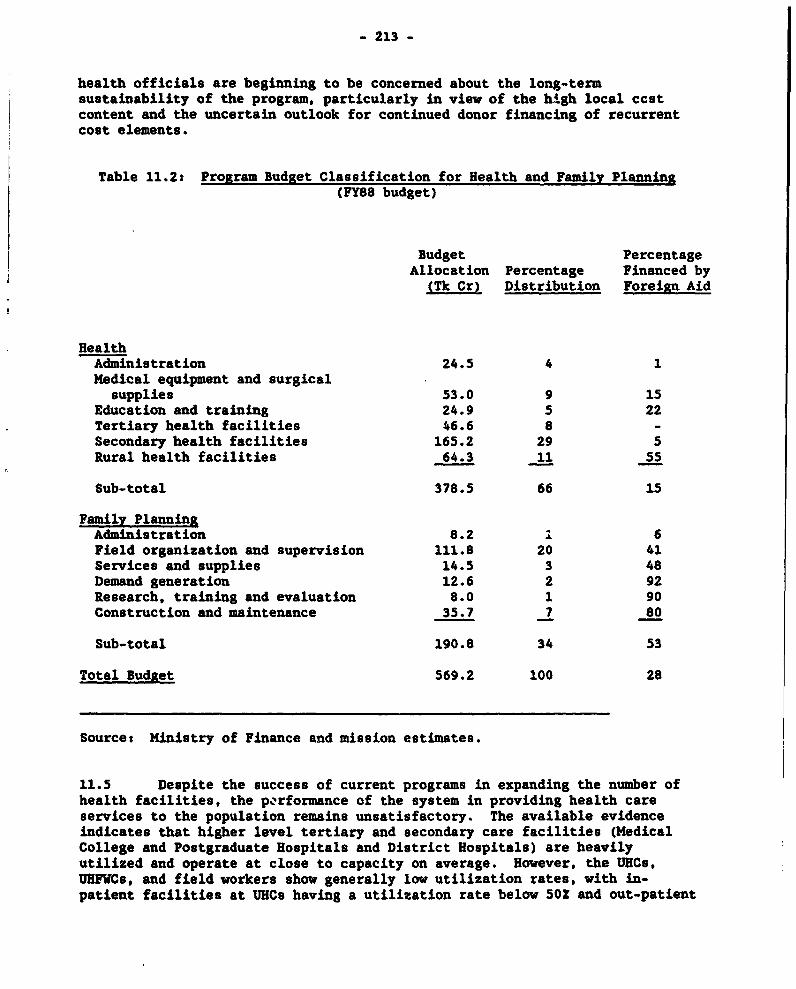
- 213 -
health officials are beginning to be concerned about the long-termsustainability of the program, particularly in view of the high local ccstcontent and the uncertain outlook for continued donor financing of recurrentcost elements.
Table 11.2: Program Budget Classification for Health and Family Planning(FY88 budget)
Budget PercentageAllocation Percentage Financed by
(Tk Cr) Distribution Foreign Aid
HealthAdministration 24.5 4 1Medical equipment and surgicalsupplies 53.0 9 15
Education and training 24.9 5 22Tertiary health facilities 46.6 8 -Secondary health facilities 165.2 29 5Rural health facilities 64.3 11 55
Sub-total 378.5 66 15
Family PlanningAdministration 8.2 1 6Field organization and supervision 111.8 20 41Services and supplies 14.5 3 48Demand generation 12.6 2 92Research, training and evaluation 8.0 1 90Construction and maintenance 35.7 7 80
Sub-total 190.8 34 53
Total Budget 569.2 100 28
Source: Ministry of Finance and mission estimates.
11.5 Despite the success of current programs in expanding the number ofhealth facilities, the porformance of the system in providing health careservices to the population remains unsatisfactory. The available evidenceindicates that higher level tertiary and secondary care facilities (MedicalCollege and Postgraduate Hospitals and District Hospitals) are heavilyutilized and operate at close to capacity on average. However, the UHCs,UHFWCs, and field workers show generally low utilization rates, with in-patient facilities at UHCe having a utilization rate below 50Z and out-patient
- 214 -
facilities at UHFWCs serving an average of only 30-40 patients per day from aclient population of 22,000. A number of studies have tried to determine thereason for this pattern. In part, it appears to reflect a lack of acceptanceon the part of the rural population towards modern health facilities.Maternal and child health care, in particular, appears to have particulardifficulty in attracting patients. This problem can presumably be addressedover time through information campaigns and community involvement programs.Several studies have indicated that another factor underlying the lowutilization rates has been inadequate budget allocations for drugs andsupplies. These studies estimated that existing budgets provide only one-third of the drugs and supplies needed to neet the needs of the clinics. Anexperiment aimed at easing the constraints on drug supplies in two upazilasresulted in an increase in the utilization rate by 42? as compared to theprevious year. This indicates that there is room to expand the efficiency ofthe system through improvements in operational budgets.
11.6 Flood Rehabilitation. The United Nations mission on flood reliefhLs estimated that approximately 1,500 health facilities were damaged in the1988 floods, which will require repairs costing approximately $16.7 million.In addition, the Government has recommended improvements to provide safe waterduring future floods by installing shallow tubewells and water storagecapacity at rural health institutions at a cost of about $21 million.
11.7 Donor Coordination. One of the interesting features of theexpenditure program is the high degree of donor coordination. It becameapparent during the 19708 that high donor interest in health and familyplanning and the large number of separate donor missions were becoming anexcessive administrative burden on the Government and were contributing tofragmentation in the expenditure program and the development of parochialinterests. As a result, the Government and the donors agreed that a morecoordinated approach would be necessary. The largest program in the sector atpresent (the Third Population and Family Health Project) involves seven donorsas direct cofinanciers, and other donors are involved as parallel cofinanciersor as interested participants. Review missions for the project are heldjointly, and one donor (IDA) takes the lead in coordinating the financingprogram and the inputs of the various donors. This approach has substantiallyimproved the coordination and focus of the donor p.rograms. While the Ministryof Health and Population Control has to face the coordinated advice of anumber of donors, this pressure has induced the Ministry to improve itsability to establish priorities and provide direction to the expenditureprogram. This approach has helped the donors to look at the expenditurerequirements for the sector as a whole (including both recurrent and capitalinputs) rather than attempting to identify discrete or easily implementablepackages. While this level of coordination is not necessary (or feasible) inall sectors, it is a useful approach in situations where several donors areinvolved and a large portion of the expenditure program tonsists of recurrentinputs. Even where investment projects are more discrete (such as the energysector), better coordination between the Government and the donors wouldgenerally be beneficial for improving the composition of the expenditureprogram.
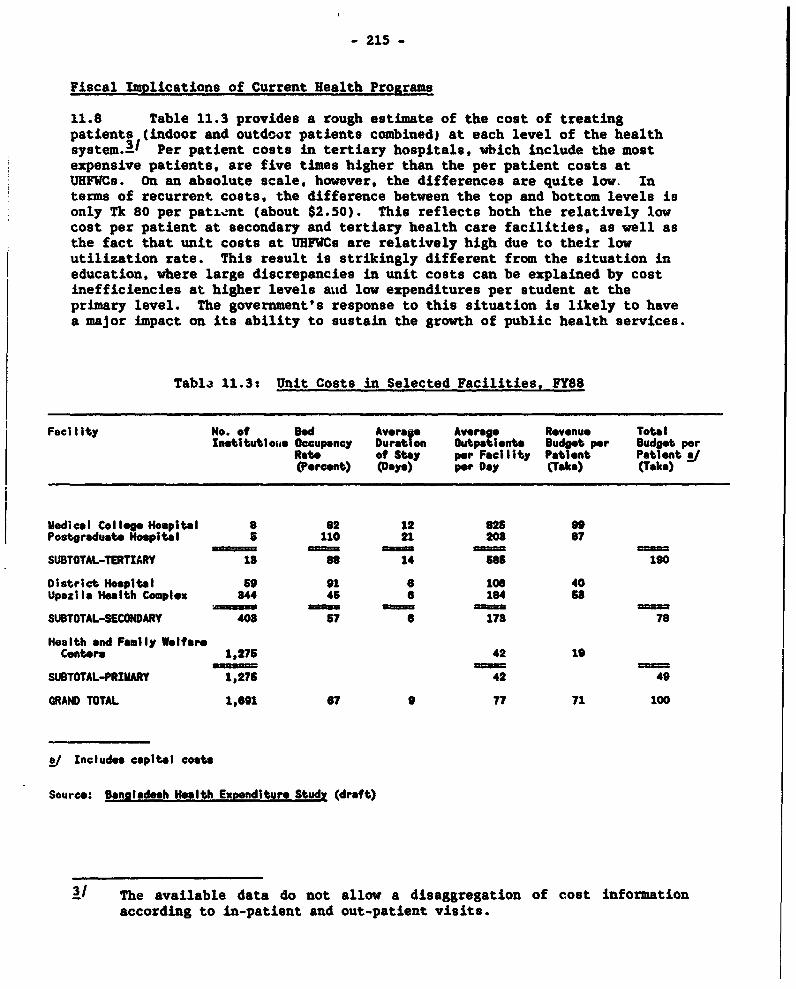
- 215 -
Fiscal Implications of Current Health Programs
11.8 Table 11.3 provides a rough estimate of the cost of treatingpatients (indoor and outdoor patients combined) at each level of the healthsystem.3/ Per patient costs in tertiary hospitals, wbich include the mostexpensive patients, are five times higher than the per patient costs atUHFWCs. On an absolute scale, however, the differences are quite low. Interms of recurrent costs, the difference between the top and bottom levels isonly Tk 80 per pati,:nt (about $2.50). This reflects both the relatively lowcost per patient at secondary and tertiary health care facilities, as well asthe fact that unit costs at UHFWCs are relatively high due to their lowutilization rate. This result is strikingly different from the situation ineducation, vhere large discrepancies in unit costs can be explained by costinefficiencies at higher levels aud low expenditures per student at theprimary level. The government's response to this situation is likely to havea major impact on its ability to sustain the growth of public health services.
Tabla 11.3: Unit Costs in Selected Facilities, FY88
FacilIty No. of Bed Average Average Rwvenue TotalInstitutiouse Occupancy Duration Outpatients Budget per Budget per
Rate of Stay per Facility Patient Pationt /(Percent) (Day.) per Day (Taka) (Tak.)
Medical College Hospital 8 62 12 625 99Postgraduate Hospital 5 110 21 20B 87
SUBTOTAL-TERTIARY 18 88 14 568 190
District Hospital 59 91 6 106 40Upazila Health Complex B44 46 6 164 Ss
_m _ = Q3S _SUBTOTAL-SECONDARY 408 67 6 178 76
Health and Family WelfareCenters 1,275 42 19
SUBTOTAL-PRIMARY 1,275 42 49
GRAND TOTAL 1,691 67 9 77 71 100
pj Includes capital costs
Source: Bansladesh Health Expenditure Study (draft)
3/ The available data do not allow a disaggregation of cost informationaccording to in-patient and out-patient visits.
- 216 -
11.9 The most obvious approach to improving utilization rates at lowerlevel facilities is to increase spending in order to improve the quality ofservices. This is consistent with the results of the studies cited above;moreover, it reflects the findings of recent surveys that show that manypatients in rural areas prefer private health care because the quality of careis better or the facilities are more convenient. While increased spendingwill almost certainly improve utilization rates and lower the average cost perpatient, the net impact on the budget will be to increase the fundingrequirements for the health services. Efforts should also be made to improvepublic awareness of the health facilities, as surveys show that only half ofthe population in unions served by a UHFWC are aware of its existence.
11.10 In order to estimate the cost implications of ongoing programs inthe health sector, Table 11.4 compares two projections based on:(i) maintaining existing service levels and completing the physical expansionprogram; and (ii) completing the physical program and increasing operatingbudgets in order to improve utilization rates. In both scenarios, it isassumed that the construct'on of rural health facilities is completed by FY95,rather than the original target date of FY90, and that health system costs(independent of quality improvements) increase to accommodate populationgrowth. In Scenario 1 (no quality improvements), total expendituree on healthand family planning programs increase in real terms by 5? per year betweenFY88-95, while Scenario 2 (quality improvements) shows annual cost increasesof 8.2? over the same period. The largest growth is for recurrent costcomponents, which increase by 5.6Z annually in Scenario 1 and by 9.7? inScenario 2. Given that most recurrent costs are financed at least partiallyby donors, the impact of the health programs on the availability of localfunds will be even greater if donor funding for the components is phased downas the present projects are completed.
11.11 It is clear that the Government and the donors need to address thelong-term recurrent cost financing requirements of the health sector. Thecost increases projected in Table 11.4 have already been built into the budgetthrough ongoing projects to complete the rural health and family planningsystem on a nation-wide basis. The important issue is therefore whether theGovernment can afford to maintain this system and improve quality, or whetherthe recurrent financing burden is such that the system will ultimately fail toprovide an adequate level of service. While the primary health care systemhas been correctly portrayed as the most cost-effective approach on a per-patient basis, in budgetary terms it will be very expensive to maintainbecause of its extensive coverage and high labor cost.
011.12 In order to ensure that current programs achieve their anticipatedbenefit>, several steps should be considered. First of all, it should berecognized that the health budget will have to increase in both real terms andas a share of total expenditures. This should help to provide a justificationfor increases in domestic resource mobilization. Secondly, the Government andthe donors need to agree on a realistic schedule for the Government toincrease its coverage of recurrent cost components for the health sector.This has been an issue in the past, when the Government agreed to absorb thesalaries for 4,500 FWAs recruited under an earlier health project, which wereeventually rolled-over into the next project due to funding constraints on thehealth budget. Given the large proportion of recurrent costs already financed
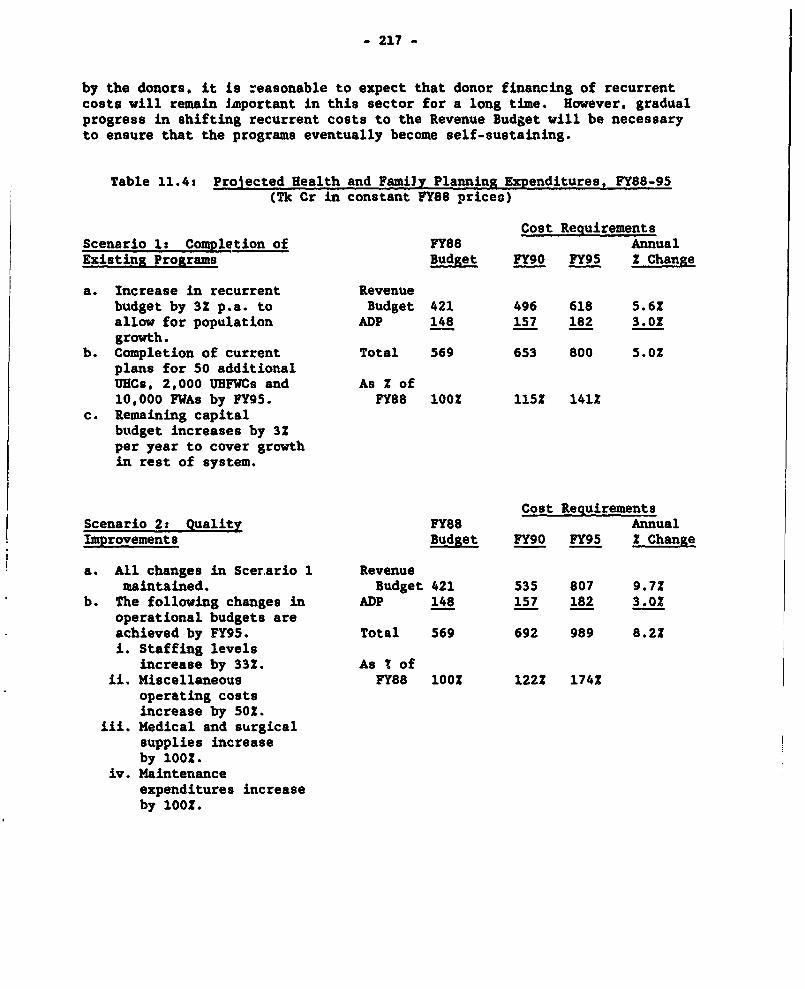
- 217 -
by the donors, it is reasonable to expect that donor financing of recurrentcosts will remain Lmportant in this sector for a long time. However, gradualprogress in shifting recurrent costs to the Revenue Budget will be necessaryto ensure that the programs eventually become self-sustaining.
Table 11.4: Projected Health and Family Planning Expenditures, FY88-95(Tk Cr in constant FY88 prices)
Cost RequirementsScenario 1: Completion of FY88 AnnualExistin8 Proarams Budget FY90 FY95 I Change
a. Increase in recurrent Revenuebudget by 3Z p.a. to Budget 421 496 618 5.6Xallow for population ADP 148 157 182 3.01growth.
b. Completion of current Total 569 653 8oo 5.0Zplans for 50 additionalUHCs, 2,000 UHFWCs and As Z of10,000 FWAs by FY95. FY88 100o 1152 1412
c. Remaining capitalbudget increases by 32per year to cover growthin rest of system.
Cost RequirementsScenario 2: Quality FY88 AnnualImprovements Budget FY90 FY95 2 Change
! a. All changes in Scer.ario 1 Revenuemaintained. Budget 421 535 807 9.72
b. The following changes in ADP 148 157 182 3.02operational budgets areachieved by FY95. Total 569 692 989 8.22i. Staffing levels
increase by 332. As I ofii. Miscellaneous FY88 1002 1222 174%
operating costsincrease by 502.
iii. Medical and surgicalsupplies increaseby 1002.
iv. Maintenanceexpenditures increaseby 1002.
- 218 -
1111. Finally, the Government needs to address cost recovery objectivesfor che health sector. Current charges for health services are minimal andprovide very little revenue at any level of the system. Given the problem oflow demand at the primary healc-h care level, the introduction of cost recoveryexcept for a token amount is probably premature. However, cost recovery canbe increased for higher health care facilities, particularly if adequateprovision is made for truly needy patients. Some obvious options are toabolish subsidized medical care for civil servants at public hospitals(perhaps replaced by a compulsory health insurance program), increases in roomand subsistence fees, and increased tuition fees for medical students. Whilesuch fees are bound to be unpopular, the experience in other countriesindicates that these measures are unavoidable in order to keep the financialburden of health services from becoming an excessive drain on the budget andcompromising the quality of services that can be provided. It is estimatedthat a realistic program of cost recovery could eventually cover up to 20Z ofthe health budget. Finally, the Government should encourage the growth ofprivate medical services as an alternative to the public system. Informalevidence indicates that there has been a rapid increase in private medicalfacilities in recent years (due in part to the large number of doctors andparamedics receiving training), and surveys show that many patients prefer torely on private care. This would allow the public health care system toconcentrate on services where public interventions are needed most,particularly for the poor and family planning and maternal and child healthcare.
11.14 Family Planning. Family planning has mainly focused on theprovision of contraceptives (including voluntary sterilizations). There isgrowing evidence that this supply-based approach has had diminishing returnsin recent years, and attention is currently being given to identifying ways toincrease the demand for family planning services. One of the key linkageswill be improved public awareness of maternal and child health care services(MCH). Only 162 of rural women receive any form of pre-natal care, and lessthan 5Z of rural children below the age of one year have been immunizedagainst any form of preventable disease. Ample evidence demonstrates thatinterventions in fertility control and MCH are complementary. This areashould receive greater attention as the physical construction phase of thecurrent health projects winds down. Donor support can be important forinitiating new programs in MCH, but it is important that this effort shouldnot compromise ongoing programs in the health sector. which will requirecontinued financial support and technical assistance for a number of years tocome.
Summary
11.15 Table 3.7 provides a summrry of recommendations for the health andpopulation control sector. The Government and the donors need to make aninformed judgement on the financial implications of public health careprograms and the actions that will be required tc sustain the programs in thefuture. The goals of the current programs are sound, and the need for greaterprogress in improving health care is clearly evident. However, in the currentbudgetary situation, the programs will not be able to achieve their objectivesunless the Goverunnent is willing to allocate an increasing share of public
- 219 -
resources to the health sector and the donors are willing to provide financialsupport for the recurrent costs of the health bystem on a long-term basis. Alarge part of the government's contribution should come from general revenues,which will require improvements in domestic resource mobilization. Anadditional part should come from greater cost recovery, despite the politicaldifficulties of this approach. Finally, the Government should accept the factthat it cannot provide a full range of health care services within theconstraints on the budget. Public programs will be most effective if they aretargeted at those who need them most, particularly the poor and women andchildren.
- 221 -
Chapter XII
Local Infrastructure
12.1 Local infrastructure covers a wide variety of activities, includingurban and rural roads, small scale drainage and flood protection, water supplyand sanitation, markets, solid waste disposal, public housing, governmentbuildings, street lighting and other activities that generally fall under theresponsibility of local government agencies. There has been a substantialincrease in public expenditures for local infrastrucwure during the FY81-89period, particularly starting in FY83 when the Government introduced theupazila development program and placed high priority on the expansion of localservices and responsibilities. The momentum of these programs appears to haveslowed in recent years, however, because of growing constraints on theavailability of local resources. The timing is therefore appropriate toreview the size and cost-effectiveness of government programs in this sector.
12.2 Accounting for changes in local level expenditures is difficultbecause of the large number of revisions in budgetary classifications duringthe period FY83-86, many of which were 4ntroduced to reflect the shift inresponsibilities to the upazila level.1 Based on Table 12.1, it is estimatedthat local infrastructure programs in the ADP expanded by over 40? in realterms between PY83-85, primarily because of the expansion of block grants.Since FY85, there has been a general decline in local infrastructure programsin real terms, although the overall level of expenditures remains quite large,representing 152 of total expenditures in the FY89 ADP. The major categoriesof expenditures on local infrastructure covered in this chapter include: (i)urban infrastructure, including expenditures by Dhaka and Chittagong MunicipalCorporations, the four Development Authorities in the major cities, and thedevelopment assistance grant for secondary towns (pourashavas); (ii) ruralinfrastructure, including the development assistance grant for upazilas andthe Chittagong Hill Tracts program, plus the infrastructure component ofintegrated rural development projects; (iii) water supply and sanitation,including the Dhaka and Chittagong Water Supply and Sewerage Authorities plusprojects under the Public Health Engineering Department for water supply insecondary towns and rural areas; and (iv) public housing and other governmentbuildings. In addition to these programs, the Revenue Budget providessubstantial transfers of funds to cover staffing and operating costs of localgovernment services. It is estimated that local government employees accountfor approximately 125,000 of the sanctioned posts in the civil service, or 171
The expenditure tables in this chapter and in Chapter 1 define localgoveranent as a separate category only for the period since FY83. WhileADP expenditures can be reclassified on a fairly consistent basis forthe FY81-89 period, expenditures for local government through theRevenue Budget are difficult to disaggregate on a consistent basis priorto FY86 and virtually impossible prior to FY83.
- 222 -
of positions funded under the Revenue Budget.2/ Finally, a large share of theFFW program is used for earthwork construction and maintenance at the upazilalevel. In total, therefore, about 7-102 of public sector resources are usedto support expenditure programs at the local level, representing a budgetshare that is roughly equivalent to the expenditure programs for agricultureand water resources, education, or industry.
12.3 Over half of the investment program for local infrastructureconsists of four block grants for upazila development projects (Tk Cr 170 inFY89), construction of government buildings and offices at the district andupazila level (Tk Cr 170), the Chittagong Hill Tracts special program(Tk Cr 50) and the development assistance grant to pourashavas (Tk Cr 20).These grants are funded entirely from local resources, so they have adisproportionate impact on the investment program by preempting funds thatcould be used for donor-assisted projects in other sectors. For this reason,as well as growing concerns about the cost-effectiveness of the programs,there has been a tendency to cut back the block grants in recent budgets, withthe development grant for upazilas falling from Tk Cr 230 in FY85 to Tk Cr 170in FY89, zila and upazila infrastructure from Tk Cr 225 to Tk Cr 170 betweenFY86-89, and development assistance to pourashavas from Tk Cr 30 to Tk Cr 20between FY88-89.
12.4 As indicated in Table 12.1, the percentage of donor financing forlocal infrastructure programs in the FY89 ADP is only 232 on average, withalmost all of the funding going to rural development projects and water supplyand sanitation. This compares to foreign financing percentages of 56Z foragriculture and water resources, 512 for industry, 712 for power development,582 for transportation, 641 for education, and 582 for health and populationcontrol. Given the pervasive constraints on local funding, programs for localinfrastructure will not be sustainable unless the Government finds ways toleverage the existing programs with more donor financing. The Government hasbeen doing this for clearly defined activities (e.g., upazila health centers,upazila connecting roads, livestock development centers, etc.), but so far ithas discouraged broader donor participation in local development programs.This may have been due to a desire to allow the upazilas to become establishedwithout placing too many demands on the system, but the upazila system has nowbeen in operation for over five years. Anecdotal information provides a mixedimage of the effectiveness of the upazilas, with some public servicesbenefiting from more direct contact with their constituencies, while in othercases there are reports of abuse of authority and misuse of government funds.
2/ Almost all staff employed at the upazila level hold permanent positionsin the civil service and can be transfe,:red by the central goverment.The few staff employed directly by the upazils are largely in menialpositions. Functions and staff are separated at the upazila level into"transferred functions' (i.e., activities such as agriculturalextension, primary health, primary education and civil works) which areunder the responsibility of the elected council (the upazila Parishad),and "retained functions" (i.e., magistrate, police, statisticalfunctions, accounts) which remain under the direct authority of centralgovernment ministries.
Table 12.1: Public Investment Propram - Local Infrastructure(Tkr, based on ADP budget allocations)
Annual Share ofPer- Foreign
Percentage contage FinancingDistribution Change in FY89
FY98 FY84 FY86 FY88 FY87 FY88 FY89 FY88 FY89 FY83-89 ADP
URBAN INFRASTRUCTURE 19.0 88.8 55.3 40.1 71.1 82.6 77.6 SX 10X 26.4x 8X
Dhaka la 7.6 18.9 88.7 19.2 27.7 41.8 46.0 2 6 86.8 9Chittagong 1 0.5 2.0 5.9 3.8 10.1 5.2 5.8 - 1 47.7 20Deo. Assist. to Pourashavas /e 7.0 10.0 9.2 12.0 20.0 80.0 20.0 2 2 19.0 0Other /d 8.9 7.9 6.6 5.1 18.8 8.0 6.7 1 1 6.5 0
RURAL WNRASTRUCTIUE 211.6 218.2 828.2 284.8 291.2 a8B.8 841.0 6OX 43X 8.8X 27?
Rural Development Projects / 66.6 89.7 48.2 87.8 45.2 88.8 121.0 19 1S 10.6 77DeW. Assist. to Upaailso 140.0 166.0 280.0 200.0 200.0 200.0 170.0 40 22 3.8 0Chittagong Hill Tracte /j 4.9 7.5 50.0 47.0 46.0 50.0 60.0 1 a 47.8 0
WATER SUPPLY AND SNITATION 70.0 72.7 60.2 68.5 98.7 181.8 126.2 21X 16X 8.8X 6o0
Dhaka 27.8 18.6 9.0 9.4 14.2 42.4 88.8 7 4 8.6 6Chittagong 18.5 20.8 24.0 20.1 20.0 20.6 0.0 4 0 - -Other 86.2 88.4 27.2 84.0 69.5 98.6 92.4 10 12 17.5 59
HOSID ND OT1ER GOVT. BUILDINGS 48.1 228.8 287.4 2F8.2 282.6 286.7 289.0 14X 81X 80.65 4X
Public Housing 8.4 8.6 8.2 11.6 16.8 28.2 16.7 1 2 80.4 s0Zils A Upaxila Infrastructure Jg 2.0 172.8 193.0 226.0 176.0 170.0 170.0 1 22 109.7 0Other Govt. Housing & Offices 42.7 42.6 86.2 21.6 41.8 89.6 52.8 12 7 8.4 0
TOTAL 854.8 648.0 881.1 646.6 688.6 818.8 788.8 100% 100X 14.11 28X= == = _M= _ _-= -
Real Expenditure Index Ih lO 182 144 129 122 1B4 120 Ai
as haka Municipal Corporation and Rajdhanl Unnayan KartripakhyaI'lChittan' Municipal Corporstion and Chittagong Development AutVority
7c Listed ao Urb n Works Program prior to FY8SIncludo Khulna and Rajehbhi Development Authorities
e Included under Rural Development and Institutions In tho ADPBlock grant; expenditures prieor to FY85 were Included under Cabinet DivisionIncludes Bangladesh Parjatan Corporation, Fire Services and Civil Defense, Police end various other MinistriesBased on GOP d flator (FY88100)estimate
- 224 -
The monitoring cell in the Local Government Division of MLGRDC has collectedinformation on a substantial number of upazilas, which is being extendedcontinuously. This information needs to be analyzed with a view todetermining !'hat improvements can be made in the current grant system. Theprimary obje Ave should be to determine the cost-effectiveness anddevelopment impact of local government programs in order to provide arealistic basis for seeking donor support. Among the issues to be coveredshould be the criteria for the allocation of grants, the types of expenditureseligible for grant financing, and the system of accounting and monitoring forgrant funds in the future.
12.5 Many of the problems which affect expenditure programs in t.issector are similar to concerns raised in earlier chapters, including: (i) theneed to develop low cost standards to serve a larger share of the populationwithin existing resource constraints; (ii) a chronic neglect of operations andmaintenance due to inadequate generation of funds at the local level;(iii) delays in project implementation, reflecting the need to strengthenstaff capacity and streamline coordination procedures, particularly thosebetween central and local government agencies; and (iv) the need to improveprogramming and preparation of investment programs at the local level in orderto provide an adequate pipeline of priority projects. In addition, two areasdeserve to receive special attention because of their particular importancefor the public expenditure program. These are: (a) financial management andpreparation of accounts at the upazila level; and (b) improvement of localrevenue generation by the upazilas and pourashavas.
12.6 Financial Management. The Government decided to decentralize localfunctions to the upazilas at virtually the same time as it began a majorrevision in its financial accounting system to delegate greater authority overaccounts and expenditure authorization to the sectoral ministries. Thedemands of implementing two major reforms simultaneously have adverselyaffected the structure and functioning of government accounting. In order tosatisfy political demands for a rapid devolution of expenditure control to theupazilas, the Ministry of Finance accepted a very complex structure of localgovernment accounting. Each upazila is required to maintain two separateaccounts offices (one for transferred functions and one for retainedfunctions), each of which is headed by a t- .ned accountant. Expenditureshave to be recorded in four separate ledg, &ccounts, each of which isstructured around a separate transfer of _..ding from the Government (a fifthledger account is used to record expenditures against the upazila's ownrevenues). In practice, very few upazilas can maintain their accounts in goodorder, due in part to a chronic shortage of trained accountancy staff.Information on expenditures is reported late, if at all, and the delaysprevent the Government from compiling its aggregate accounts on a timelybasis.3/ In addition, there is a growing concern about accountability for
31 Upazilas obtain funds from the sectoral ministries to support their"transferred" functions. However, upazilas report their expendituresthrough the Controller and Accountant General. Delays in passing thisinformation back to the sectoral ministries causes further delays in thecompilation of ministerial accounts.
- 225 -
government funds at the upazila level, as the upazilas function as separatetreasury units and do not observe the same standards of expenditure control asthe rest of the Government. These problems inevitably call into question thecredibility of the local government system. Moreover, they represent a majorproblem for improving expenditure reporting for the Government as a whole. Areview of local government accounting and expenditure control with theobjective of simplifying and improving the transparency of the system ofaccounts should be an important consideration in local government programs.
12.7 Local Revenues. There are serious imbalances between the servicesthat local governments are expected to provide and the revenues available tofinance them. The revenues available to the upazilas consist of market leasesand a variety of minor fees, taxes and charges. The revenue base of themunicipalities and the pourashavas has deteriorated over time due to the lowelasticity of existing land taxes and the fact that taxes with greaterelasticity (e.g. the foctroim tax) were abolished by the central governmentand replaced with a reimbursement grant that has remained fixed in nominalterms. As a result, local governments are highly dependent on centralgovernment grants, which carry a number of restrictions on their use. One ofthe most obvious examples involves the problem of road maintenance. Theannual maintenance requirement for local roads is expected to increase toTk Cr 150 under current upgrading programs, while the upazilas are permittedto use only 252 of their development grant to carry out maintenanceactivities. To give another example, regulations currently allow the upazilasto use up to 22 of the development grant for the physical maintenance ofhealth centers, but they are not allowed to supplement the drug budgets of thecenters, which can be a major constraint on utilization. Even where funds areearmarked in ministerial budgets, problems can arise, such as the refusal ofthe Ministry of Agriculture to pay travel allowances during FY87 to upazilaagricultural field staff. While some of these examples reflect teethingproblems associated with the introduction of a new system, their persistenceindicates the need for a more critical look at the functions and resourcesassigned to local governments. In particular, the following actions should beconsidereds
(i) Experience in most countries indicates that the efficiency oflocal services improves when local communities bear a share of thecosts. Consideration should be given to augmenting local revenuesources, with the Land Development Tax being the most logicalrevenue instrument.
(ii) A study needs to be undertaken to evaluate the services providedby upazilas and pourashavas and how they should be financed (e.g.,direct transfers from ministries, local revenues, governmentgrants, loans, etc.).41 This would provide the basis for a morerational grant structure that is consistent with theresponsibilities assigned to the local level.
4/ Suggestions for improvements in municipal and pourashava finances areprovided ins "Bangladesh: Urban Government Finance and ManagementIssues and Opportunities," World Bank Sector Report No. 5790-BD (greencover), June 1985.
- 226 -
12.8 Flood Rehabilitation. Local level infrastructure was heavilydamaged by the recent floods. In addition to the costs discussed under othersectoral expenditure programs (e.g., water control structures, schools andhealth centers), the United Nations flood relief report has provided apreliminary assessment of local damages. Tubewells and latrines in badlyeroded areas (mainly near river banks) will need repair or replacement at anestimated cost of about Tk Cr 10 ($3.2 million), for which donor financing isalready available. Approximately Tk Cr 110 ($34.5 million) is required forrural roads, and damage to municipal infrastructure (roads, drains, sewerageand water supply systems) ia estimated to cost an additional Tk Cr 156 ($48.9million). The Government is also considering the construction of floodprotection embankments around Dhaka and the neighboring industrial area, whichcould cost up to $100 million and should therefore be carefully reviewed.Finally, damage to rural and peri-urban housing cannot be estimated with anydegree of accuracy, but it may account for an additional $1.0 billion in floodrelated damages. The Government expects NGOs to provide the bulk ofassistance for individual households, as the budget has little flexibility toabsorb the costs in view of other demands on it.
Urban Infrastructure
12.9 Urban growth in Bangladesh, on the order of 7-9Z per year, is one ofthe highest rates in the world, approximately three times the rate of ruralpopulation growth. Thus, while the population distribution remainspredominantly rural (77Z), the urban areas are expanding very rapidly from alimited base. This trend is expected to continue in the future because of thelimited capacity of the agricultural sector to absorb surplus labor. Thus,most estimates predict that Dhaka will reach a population of 10-14 million bythe year 2000 (about 6 million at present) and Chittagong will have about 3-5 million (2 million at present), while the rest of the urban population willbe spread over a large number of secondary urban centers. Given the high rateof expected growth and limited resource base, urban governments will be hardpressed to maintain even minimal levels of public services.
12.10 The funds allocated for urban infrastructure represent about 10? ofthe budget for local infrastructure in the FY89 ADP, with urban water supplyaccounting for 13X more. About one-third of the funds (Tk Cr 24.2) representself-financed projects by the Dhaka Development Authority (Rajdhani UnnayanKartripakhya). These projects represent property development for commercialand residential purposes. As such, they are potentially very profitable andshould be required to provide improvements in basic infrastructure as well.The remaining funds for urban infrastructure are spread rather thinly over themunicipalities and pourashavas and provide little in the way of supportinglong-term urban growth, especially for the peri-urban areas where most of thepoor are concentrated. In practice, flood rehabilitation funds are a majorsource of financing for urban investment. As regards other sources of funds,the FY89 Revenue Budget provides Tk Cr 31.2 in untied grants to urbangovernments, which is a reduction from previous levels (Tk Cr 38.1 in FY87).On an overall basis, public expenditures on urban services (not includingwater supply) are probably on the order of Tk Cr 200 per year, or about Tk 100($3.20) per resident per year. At this level of funding, most residents
- 227 -
(particularly the poor) have little chance of benefiting from improvements inurban services.
12.11 The Government needs to make a serious reassessment of its policiesto manage rapid urban growth. Large investments in infrastructure (on theorder needed to support international business investment) will be possibleonly in Dhaka and Chittagong. Even in these cities, the Government shouldinsist that most investments should be largely self-financing, given that alarge share of modern sector production is located in these cities. This willrequire efforts to improve municipal finances; until this is accomplished, theGovernment should be reluctant to consider major investment projects that drawheavily on public resources. It is essential that the activities of thevarious entities concerned with development and investment planning in Dhakaand Chittagong be coordinated on a metropolitan-wide basis. Outside Dhaka andChittagong, there may be a better case for providing part of the cost of urbaninvestments on a grant basis. The Government should insist, however, that ashare of the investment cost should be recovered from local contributions(including in-kind resources) and that unit costs be kept as low as possible.
Rural Infrastructure
12.12 About one-third of the funds provided through the ADP for ruralinfrastructure are associated with integrated rural development projects.Donor support has been generous, with 772 of project costs financed by donorsin the PY89 ADP. On a small-scale basis with intensive supervision,integrated development projects can achieve significant benefits. However,the coordination of infrastructure components has been difficult in thecontext of large-scale multi-sectoral projects, and it is doubtful that thebenefits of integrated development are being achieved. In Chapter 6, it wasrecommended that the Government should wind down support for the cooperativemovement as current projects are completed. In connection with this, thedonors may wish to shift the bulk of their support for rural infrastructuredevelopment to sectoral-based projects.
12.13 The remaining support for rural infrastructure includes thedevelopment assistance grant to upazilas and the Chittagong Hill Tracts grant(the latter is associated with internal security considerations). TheGovernment has tried to control the allocation of the upazila grant byspecifying funding percentages for different types of projects, but this hasbeen largely ineffective. An evolutionary approach is therefore suggested.Some activities should be transferred to sectoral programs, so that donorfinancing can be used to leverage local funds. General purpose grants shouldbe aimed at a narrower set of objectives (e.g. improvements in maintenance)and should be linked to increases in local revenue generation.
Water Suzpply and Sanitation
12.14 Dhaka. The institutional capacity of the Dhaka Water Supply andSewerage Authority (DWASA) has been gradually strengthened through long-termdonor support. Project implementation continues to be hampered by proceduraland technical delays, however, especially concerning procurement and technicalassistance. A series of tariff increases permitted DWASA to achieve a 32 rateof return on revalued assets in FY88, although arrears increased to over 10
- 228 -
months' billing (Tk Cr 31, of which goverrament arrears represented Tk Cr 8).51A further tariff increase of 122 will be necessary in FY89 in order for DWASAto maintain its rate of return, and significant improvements in collection andbilling are essential. Up to now, DWASA has been able to increase capacitythrough relatively low cost investments (e.g., deep tubewells) and efficiencyimprovements (e.g., leak detection). The scope for additional improvements ofthis type is nearly exhausted. Studies are needed to determine the least costmethod of meeting Dhaka's long-tern water supply requirements. Whatevermethod is chosen (i.e., tapping deep aquifers versus development of a majorsurface water source), major investments on the order of $350 million areexpected to be necessary during the FFYP period. Given the constraints onlocal resources in the ADP, DWASA needs to be in a sound financial position teself-finance the local costs of its investment program.
12.15 Chittagong. The Chittagong Water Supply and Sewerage AuthorityiCWASA) is currently in the process of preparing the next stage of itsinvestment program, estimated to cost on the order of $60-80 million duringthe FFYP period. The major concern is CWASA's inability to improve itsfinancial performance. CWASA earned a rate of return of -3.82 on revaluedassets in FY88, and billing arrears remained at about 7 months for privateaccounts and 8 months for government accounts (the latter represents 452 ofCWASA's total billings). An immediate tariff increase on the order of 202 isneeded, as well as actions to address the high proportion of unbilled water,equal to about 502 of production in FY88. The Government can help by taking aclear position that urban investments in Dhaka and Chittagong are expected tobe self-financing (including debt repayments). Improvements in CWASA'sfinancial performance should have high priority as part of the preparation forthe next project.
12.16 Other. Investments in water supply and sanitation outside of Dhakaand Chittagong (Tk Cr 92.4) represent 122 of the sector's allocation in theFY89 ADP, of which 592 of the costs are donor financed. Extensive technicalassistance has resulted in low cost design standards. Approximately 702 ofthe funds are allocated for water supply systems in district and smallertowns. Another 82 is intended for low cost sanitation programs, and theremaining amount is for rural water supply, primarily tubewells in areas withsalinity problems and where the ground water level is being lowered byirrigation. Public water supplies are provided in 55 of the 62 districttowns. These systems offer 6 to 8 hours of service daily, and none of themsupplies water outside of the densely populated central area (reaching about afifth of the population in each town). Operations and maintenance aregenerally inadequate, due in part to inadequate cost recovery. Hand pumpedtubewells are used to supplement the public water supply for the remainingresidents. In rural areas, about 550,000 tubewells (mostly hand pumps) areused to provide drinking water. It is estimated that about 402 of urbanresidents and 32 of the rural population have a satisfactory latrine. Evenwith very low standards, the future cost of these programs is expected to behigh, particularly in view of the need to provide deeper tubewells because ofground water and salinity proolems. Cost recovery is a standard feature in
5/ It is interesting that only the charges for municipal standpipes, whichare covered by MLGRDC, are paid by the Government on a regular basis.
- 229 -
these programs, albeit at a modest level. These approaches generallyrepresent a realistic and cost-effective response and deserve continuedsupport by the Government and the donors.
Public Housing and Other Government Buildings
12.17 The Government has tried various approaches to public housing (walk-up flats, sites and services, etc.), almost all of which are overdesigned andunaffordable to the majority of the urban population except on a highlysubsidized basis. For most urban residents, low cost improvements (e.g.footpaths, surface water drainage, water supply from standpipes and tubewells,low cost latrines, etc.) are the only feasible means of improving theirenvironment within existing resource constraints, and the Government shouldexplore programs along these lines.
12.18 The Government has tried to promote housing construction through theHouse Building Finance Corporation (HBFC). Virtually all of HBFC's resourcescome directly or indirectly from the Government (e.g. government-guaranteeddebentures sold to Bangladesh Bank). Most of HBFC's loans have gone to thetop 20Z of the income group. Financial performance has been poor; forexample, in FY86, 682 of HBFC's loan accounts were in arrears (the largemajority for more than twelve months) and a third of the funds raised throughdebentures were used to cover operating cash losses. It has been recommendedthat the onl realistic option is to declare HBFC bankrupt and dissolve itsoperations.61 An alternative means of providing housing finance for lowincome households could possibly be developed around the experience of GrameenBank programs, while commercial banks could be encouraged to extend mortgagelending operations for upper income households. As in the case ofagricultural credit, the government budget will have to Dear theresponsibility for HBFC's losses. Allowing HBFC to continue operations wouldjust add to this burden and increase the ultimate cost to the budget.
12.19 The final expenditure category in Table 12.1 covers governmenthousing and other buildings, the largest share of which is under the zila andupazila infrastructure grant It was suggested in Chapter 5 that theGovernment should stop construction of housing for civil servants in urbanareas on equity and efficiency grounds. In view of the constraints on localfunding in the ADP, the Government should also consider scaling back theconstruction of government buildings in upazilas, at least until a review ofthe effectiveness of the current program has been completed.
Summary
12.20 Table 3.8 provides a summary of recommendations for this sector.Local infrastructure is an important part of the public expenditure program,both in terms of the level of funding and its role in the development process.Nevertheless, the government's current approach places an excessive demand onlocal resources with limited benefits in terms of meeting the most urgent
!1 6/ Bangladesh: Urban Housing Finance Review," World Benk Sector ReportNo. 7229-BD (green cover), June 30, 1988.
- 230 -
needs of rapid population growth. Alternative approaches are required whichpreserve local responsibility and give greater attention to the generation oflocal revenues and adequate maintenance of completed infrastructure. In themeantime, it is recommended that the use of general purpose block grantsshould be scaled back substantially, and efforts should be made to leveragedonor funds for local infrastructure programs. Continued improvements in thefinancial performance of DWASA and CWASA are particularly important in view ofthe major investments required in these cities during the FFYP period.

i
iI
I
I
I
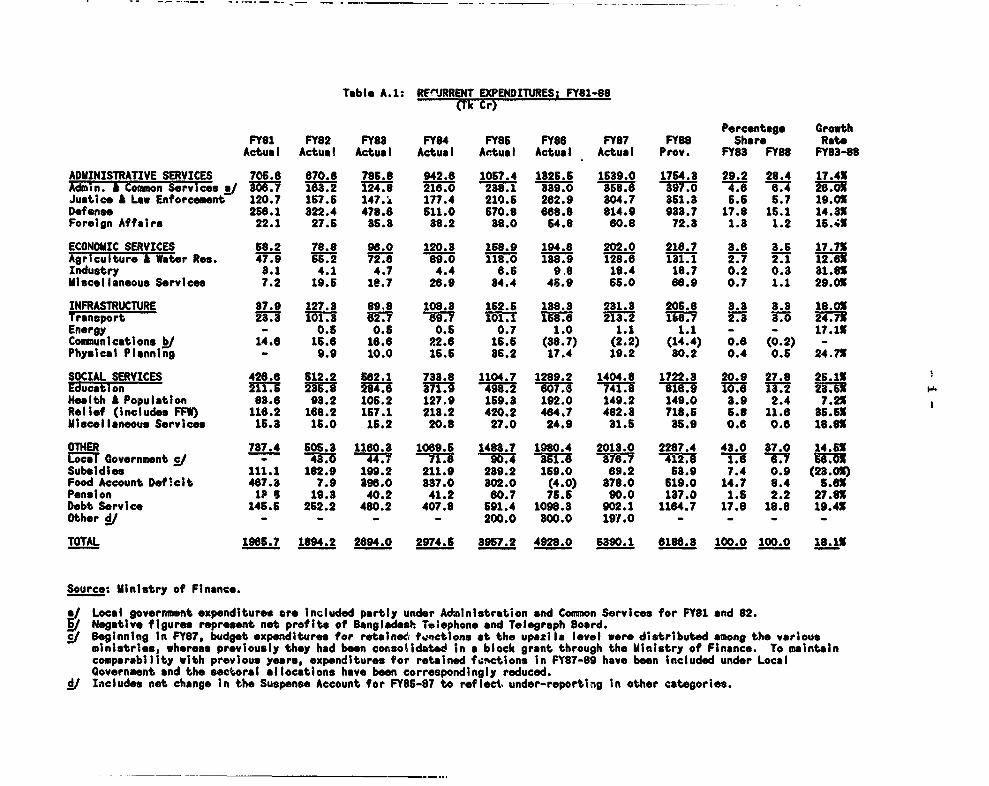
Table A.1: RE>JRRENT EXPENDITURES: FYSi-88lTk Cr)
Percentage GrowthFY81 FY82 FY83 FY84 FY85 FY86 FY87 FY88 Share Rate
Actual Actual Actual Actual Actual Actual Actual Prov. FY83 FY88 FY83-88
ADMINISTRATIVE SERVICES 706.6 670.8 785.8 942.6 1067.4 1826.6 1639.0 1754.3 29.2 28.4 17.4XAdmin. A Common Services / 806.7 183.2 124.8 9 1i -8 238.1 389.0 358.6 397.0 4.6 8.4 26.0XJustice A Law Enforcemont 120.7 157.6 147.i 177.4 210.5 262.9 804.7 361.3 5.6 5.7 19.01Defense 268.1 322.4 478.6 611.0 570.8 688.8 814.9 933.7 17.8 16.1 14.31Foroign Affairs 22.1 27.5 38.3 38.2 38.0 64.8 60.8 72.3 1.3 1.2 15.41
ECONOMIC SERVICES 68.2 78.8 98.0 120.3 158.9 194.6 202.0 218.7 3.8 3.6 17.71Agriculturo W ater Ros. 47.9 55.2 72.6 89.0 118.0 138.9 128.6 131.1 2.7 2.i12.6Industry 8.1 4.1 4.7 4.4 8.6 988 18.4 18.7 0.2 0.3 31.81Miscellaneous Services 7.2 19.6 1e.7 26.9 84.4 45.9 65.0 68.9 0.7 1.1 29.01
INFRASTRUCTURE 87.9 127.3 89.8 108.8 152.6 138.3 231.3 206.6 3.3 3.3 18.0XTransport T 1 T1013 02.7 7 .7 101.1 168.6 -213.2 i NE7 2.3 U6 24.7XEnergy - 0.6 0.6 0.5 0.7 1.0 1.1 1.1 - - 17.1X
Communications k/ 14.6 16.6 16.8 22.6 16.6 (38.7) (2.2) (14.4) 0.6 (0.2) -
Physical Planning - 9.9 10.0 16.6 85.2 17.4 19.2 30.2 0.4 0.5 24.7?
SOCIAL SERVICES 428.6 612.2 682.1 733.8 1104.7 1289.2 1404.8 1722.3 20.9 27.8 26.1XEducation 211.5 _236. 28U4.6 17T1.3 -49.2 607.6 741.8 818.9 1M 18G .2 D723HeaIth A Population 88.6 93.2 106.2 127.9 169.8 192.0 149.2 149.0 3.9 2.4 7.2XRolief (includes FFW) 116.2 168.2 167.1 213.2 420.2 464.7 482.8 718.5 5.8 11.8 85.5xMiscellaneous Services 16.3 15.0 16.2 20.8 27.0 24.9 31.6 86.9 0.6 0.6 18.8X
OTHER 737.4 606.3 1160.3 1069.5 1483.7 1980.4 2013.0 2287.4 43.0 37.0 14.6XLocal Government SI -: 744" 44.7 -706 INK"i 7ii87 412.8 8T ii.7Subsidies 111.1 182.9 199.2 211.9 289.2 169.0 69.2 63.9 7.4 0.9 (23.01)Food Account Deficit 407.3 7.9 396.0 837.0 802.0 (4.0) 378.0 619.0 14.7 8.4 5.6XPension 1I 6 19.3 40.2 41.2 60.7 75.6 90.0 187.0 1.6 2.2 27.81Debt Service 146.6 262.2 480.2 407.8 691.4 1098.3 902.1 1184.7 17.6 18.8 19.4XOther OJ - - - - 200.0 300.0 197.0 - - - -
TOTAL 1965.7 1894.2 2894.0 2974.5 3957.2 4928.0 5390.1 8186.3 100.0 100.0 18.11
Source: Ministry of Finance.
*/Local government expenditures ore included partly under Ad&inistration and Common Services for FY81 and 82.Negative figures represent not profits of Bangladesh Telephone and Telegraph Board.
J Beginning In FY87, budget expenditures for rotalnedi tunctions at the upazila level were distributed among the variousministries, whereas previously they had been consolidated in a block grant through the Ministry of Finance. To maintaincomparability with previous years, expenditures for retained f%.nctions In FY87-89 have been included under LocalGovernment and the sectoral allocations hav* been correspondingly reduced.
i/ Includes net change in the Suspense Account for FY86-87 to reflect under-reporting In other categories.
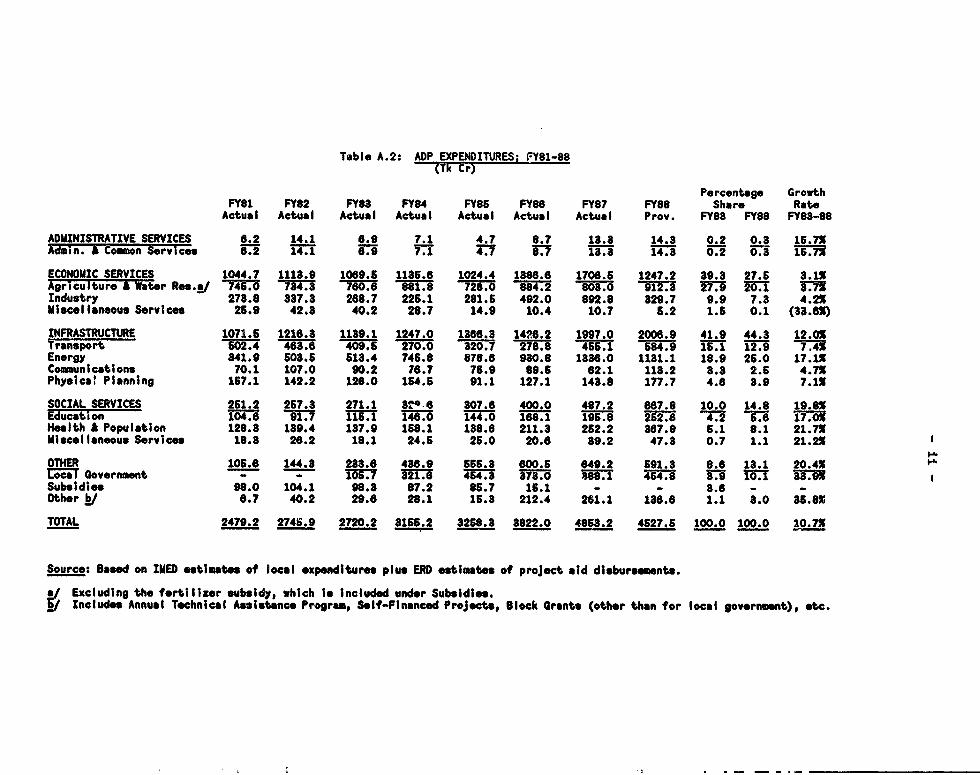
Table A.2: ADP EXPENDITURES; FY81-88(TFk r
Percentage GrowthFY01 FY82 FY83 FY84 FY85 FY86 FY87 FY88 Share Rate
Actual Actual Actual Actual Actual Actual Actual Prov. FY88 FY88 FY83-88
ADMINISTRATIVE SERVICES 6.2 14.1 6.9 7.1 4.7 8.7 13.8 14.3 0.2 0.3 16.7XAdmin. & Common Services 6.2 14.1 6.9 7.1 4.7 8.7 18.8 14.3 0.2 033 15.7X
ECONOMIC SERVICES 1044.7 1113.9 1069.5 1136.8 1024.4 1886.6 1706.5 1247.2 39.3 27.6 3.1XAgriculture Wa tor Res.j ?746.0 7-413 7o.e -881.8 728.0 884.2 -807.5 912.8 27.9 20.1 3.7XIndustry 273.8 337.3 268.7 226.1 281.6 492.0 892.8 329.7 9.9 7.3 4.25Miscollaneous Servlces 25.9 42.8 40.2 28.7 14.9 10.4 10.7 5.2 1.6 0.1 (33.86)
INFRASTRUCTURE 1071.6 1216.3 11B9.1 1247.0 1866.8 1426.2 1997.0 2006.9 41.9 44.3 12.05Transport 502.4 468.6 409.6 270.0 320.7 278.8 456.1 584.9 15.1 12.9 7.4XEnergy 341.9 503.5 513.4 746.8 878.6 930.8 1886.0 1131.1 18.9 26.0 17.1XComunicatlons 70.1 107.0 90.2 78.7 76.9 89.6 62.1 113.2 3.3 2.6 4.71Physlcs! Planning 167.1 142.2 128.0 164.6 91.1 127.1 143.8 177.7 4.6 a.9 7.1X
SOCIAL SERVICES 261.2 267.3 271.1 32e1.6 307.6 400.0 487.2 687.8 10.0 14.8 19.8XEducation 10i4.6 91.7 115.1 148.0 144.0 168.1 196.8 TS2.8 4.2 6.B 17T.01Health A Population 128.8 189.4 137.9 168.1 188.6 211.8 262.2 367.9 6.1 8.1 21.7XMiscellaneous Services 18.8 26.2 18.1 24.6 26.0 20.8 89.2 47.3 0.7 1.1 21.21
OTHER 106.8 144.8 2B3.8 486.9 555.8 010.6 649.2 591.8 8.6 18.1 20.4X I4
Loal Covornment - - 1067 21.6 454.8 W73. 0 888.1 TS75§ U§ 10.1 38.95 Subsidies 98.0 104.1 98.8 87.2 85.7 16.1 - - 3.8 - -Other k/ 8.7 40.2 29.8 28.1 15.3 212.4 261.1 138.6 1.1 8.0 35.8X
TOTAL 2479.2 2745.9 2720.2 8166.2 3258.8 8822.0 4863.2 4527.5 100.0 100.0 10.?X
Source: Based on IMED estimates of local expenditures plus ERD estimates of project aid disbursements.
a/ Excluding the fertilizer subsidy, which is Included under Subsidies.I Includes Annual Technical Assistance Program, Self-Financed Projects, Block Grants (other than for local govornment), etc.
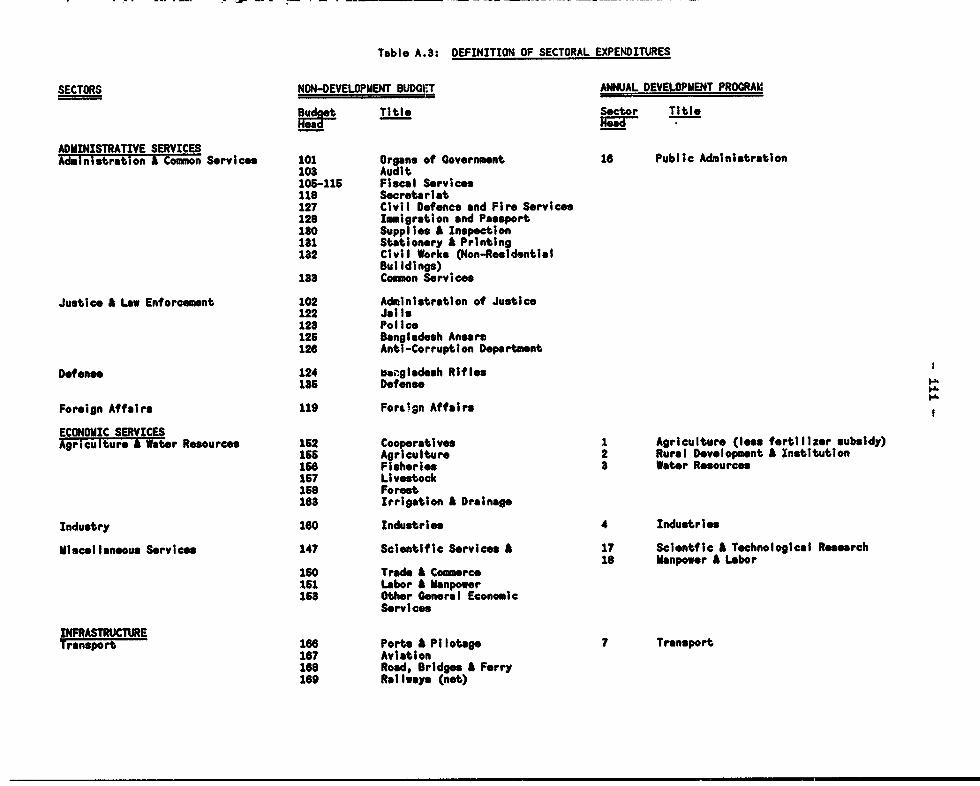
Table A.3: DEFINITION OF SECTORAL EXPENDITURES
SECTORS NON-DEVELOPMENT BUDGItT ANNUAL DEVELOPMENT PROCRAM
Budoot Title Sector Title
ADMINISTRATIVE SERVICESAdministration & Common Services 101 Organs of Government 16 Public Administration
103 Audit106-116 Fiscal Services118 Secrotariat127 Civil Defence and Fire Services128 Immigration and Passport180 Supplies A Inspection131 Stationery A Printing132 Civil Works (Non-Residential
Buildings)133 Common Services
Justice A Law Enforcemont 102 Administration of Justice122 Jails123 Police125 Bangladesh Ansare126 Anti-Corruption Department
Defense 124 an9gladesh Rifles135 Defense
Foreign Affairs 119 Forilgn Affairs
ECONOMIC SERVICESAgriculture & Wster Resources 162 Cooperatives 1 Agriculture (less fertilizer subsidy)
165 Agriculture 2 Rural Development & Institution160 Fisheries 3 Water Resources157 Livestock158 Forest168 Irrigation A Drainage
Industry 160 Industries 4 Industries
Miscellaneous Services 147 Scientific Services A 17 Scientfic A Technological Research18 Manpower A Labor
150 Trade A Commerce151 Labor A Manpower153 Other General Economic
Services
INFRASTRUCTURETransport 166 Ports A Pilotage 7 Transport
167 Aviation168 Road, Bridges i Ferry169 Railways (net)
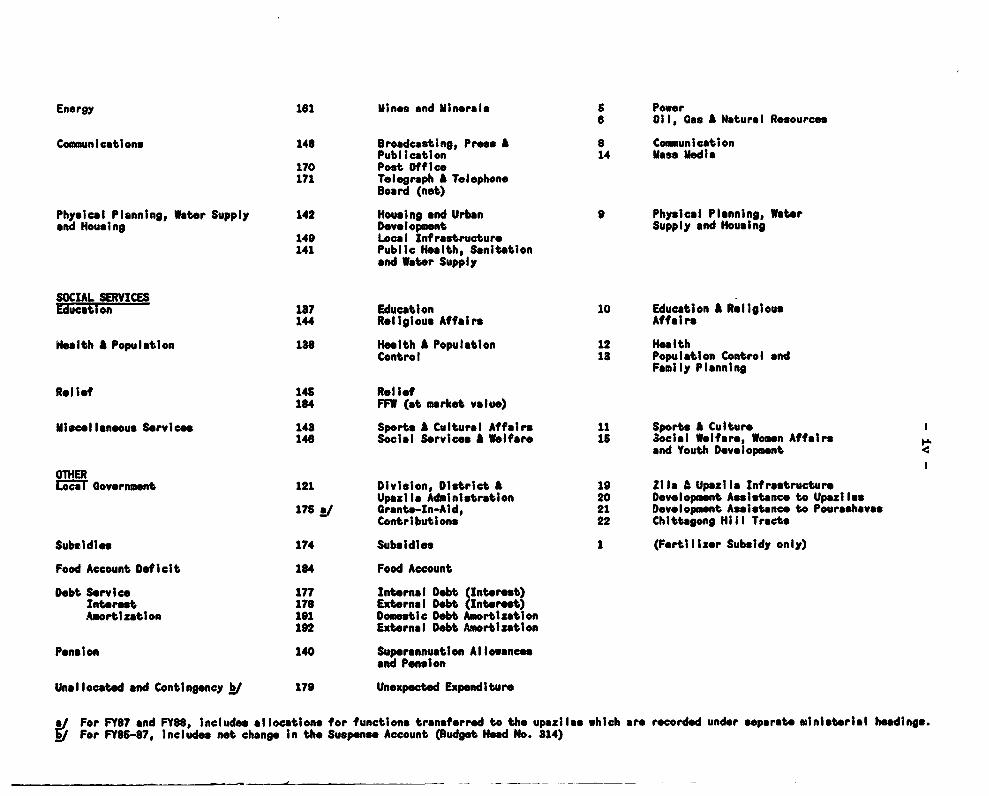
Energy 161 Mines and Minerals S Power6 Oll, Gas A Natural Resources
Communications 148 Broadcasting, Press A 8 CommunicationPublication 14 Mass Media
170 Post Office171 Telegraph A Telephone
Board (net)
Physical Planning, Water Supply 142 Housing and Urban 9 Physical Planning, Waterand Housing Development Supply and Housing
149 Local Infrastructure141 Public Health, Sanitation
and Water Supply
SOCIAL SERVICESEducation 1B7 Education 10 Education A Religious
144 Religious Affairs Affals
Health A Population 18 Health £ Population 12 HealthControl 13 Population Control and
Family Planning
Relief 146 Relief184 FFW (at market value)
Miscellaneous Services 148 Sports A Cultural Affalrs 11 Sports A Culture14S Social Services A Welfare 16 Social Welfare Women Affairs
and Youth Developmnt 4
OTHERLocal Government 121 Division, District & 19 Zile A Upazila Infrastructure
Upazilo Administration 20 Development Assistance to Upaxilas175 !/ Grant-In-Alid, 21 Development Assistance to Pourashavas
Contributions 22 Chittagong Hill Tracts
Subsidies 174 Subsidie 1 (Fertilizer Subsidy only)
Food Account Deficit 184 Food Account
Debt Service 177 Internal Debt (InterestInterest 178 External Debt (Interet)Amortlzatlon 191 Domestic Debt Amortization
192 External Debt Amortization
Penslon 140 Superannuation Alloancesand Pension
Unallocated and Contingency y 179 Unexpected Expenditure
V For FY87 and FY88, Includes allocations for functions transferred to the upazilas which are recordod under separate ministerial headings.For FY86-87, Includes net change In the Suspense Account (Budget Head No. 814)

>, ! | N DIA ~BANGLADESH
.J xoS . 5 9 E 1 ............. A o ~~~~~~~~~Upozillaz Hiaquarters Upozilba Boundriers
,'g10 + °lsDii lh,*>8, @t&, * ~~~~~~~~~~~~~Zilla Headq4uarters ---- Zilla Boundaries
,j o *,{ \ bladotv 4s > > t @ ~~~~~~~~~~~~~Division Headguairter s Division Boundaries
26° *1 . ' b.N^,N& gI,id, _ 3; N t,^ * ~~~~~~~~~~~~National Co,,,.1o ~ International Boundaries
25 P rho s 5a<> ; ,sS, a;fpt ' l llOwri - ''ts oP;\UleDg t~~~~~~~~~~~~~~~~~~~~~~~~~~~~~~~~~~~~~~~5
25 , .t b 0 oT 9' ' ' -~MA _Jo$. N D A
2r 2 t> rF
INDIA 2r-
*-ss- -F y *, X S f {' -98So/ iiR98i 1- \ \~~~b K
rsF ^¢r{wrh ).2 U{ l*,F a^^ t4 _/K-Ir
8t, ~ ~ ~ ~ ~ ~ ~ ~ ~ ~ ~ ~ ~ ~~~~~~~~~~~~~. bsl- £ n >
INDI *i>^,?' ,. t , r
. . ,-.^J. 0 ~~~~~~~~10 2,0 30 4jO 50MPLCS * BURMA.M LAK -21° 0 2 46 S0 tiO KILOAISTERS 21
a~~~ ~ ~ ~~ ~ ~ ~~~ 9j 9.1° 1 k g