surf coat technol 2008 patricia bicamada silano
TRANSCRIPT

Seediscussions,stats,andauthorprofilesforthispublicationat:https://www.researchgate.net/publication/235347628
SurfCoatTechnol2008Patriciabicamadasilano
DATASET·FEBRUARY2013
READS
119
4AUTHORS,INCLUDING:
IdalinaAoki
UniversityofSãoPaulo
71PUBLICATIONS563CITATIONS
SEEPROFILE
MeloHercílioG.de
UniversityofSãoPaulo
56PUBLICATIONS551CITATIONS
SEEPROFILE
Allin-textreferencesunderlinedinbluearelinkedtopublicationsonResearchGate,
lettingyouaccessandreadthemimmediately.
Availablefrom:IdalinaAoki
Retrievedon:05February2016

Available online at www.sciencedirect.com
202 (2008) 2850–2858www.elsevier.com/locate/surfcoat
Surface & Coatings Technology
Corrosion behavior of carbon steel protected with single and bi-layer ofsilane films filled with silica nanoparticles
P.H. Suegama a, H.G. de Melo a, A.A.C. Recco b, A.P. Tschiptschin b, I.V. Aoki a,⁎
a Escola Politécnica da Universidade de São Paulo, Depto. de Engenharia Química, C.P. 61548, 05424-970 São Paulo, SP, Brazilb Escola Politécnica da Universidade de São Paulo, Depto. de Engenharia Metalurgica e de Materiais, C.P. 61548, 05424-970 São Paulo, SP, Brazil
Received 8 July 2007; accepted in revised form 16 October 2007Available online 30 October 2007
Abstract
The electrochemical behaviour of carbon steel coated with bis-[trimethoxysilylpropyl]amine (BTSPA) filled with silica nanoparticles innaturally aerated 0.1 mol L−1 NaCl solutions was evaluated. The coating was prepared by adding different concentrations of silica nanoparticles(100, 200, 300, 400 and 500 ppm) to the hydrolysis solution and then a second layer without silica nanoparticles was applied. The electrochemicalbehavior of the coated steel was evaluated by means of open-circuit potential (EOC), electrochemical impedance spectroscopy (EIS) andpolarization curves. Surface characterization was made by atomic force microscopy (AFM), and its hydrophobicity assessed by contact anglemeasurements. EIS diagrams have shown an improvement of the barrier properties of the silane layer with the silica addition, which was furtherimproved on the bi-layer system. However, a dependence on the filler concentration was verified, and the best electrochemical response wasobtained for samples modified with 300 ppm of silica nanoparticles. AFM images have shown a homogeneous distribution of the silicananoparticles on the sample surface; however particles agglomeration was detected, which degraded the corrosion protection performance. Theresults were explained on the basis of the improvement of the barrier properties of the coating due to the filler addition and on the onset ofdefective regions on the more heavily filled coatings allowing easier electrolyte penetration.© 2007 Elsevier B.V. All rights reserved.
Keywords: Corrosion protection; Silane film; Silica nanoparticles; EIS
1. Introduction
Organosilane molecules, hereafter called silane, containhydrolysable alkoxy groups, which, after hydrolysis andcondensation, establish covalent bonds with the native oxide/hydroxide film, initiating the formation of a multifunctional self-assembled coating on the metallic substrate. These groupsconvert to hydrophilic silanol groups (SiOH), which are readilyadsorbed onto the metal surface via formation of hydrogenbonds with surface hydroxyls (MeOH). In a subsequent curingor drying process, such bonds further convert to metallo-siloxane bonds (MeOSi) at the interface by releasing water. Theformation of these oxane bonds leads to a good anchoring of thesilane layer to the metal substrate. Additionally, the excess SiOHgroups on the film easily condense among themselves, forming asiloxane network (SiOSi) with an appreciable thickness. The as-
⁎ Corresponding author.E-mail address: [email protected] (I.V. Aoki).
0257-8972/$ - see front matter © 2007 Elsevier B.V. All rights reserved.doi:10.1016/j.surfcoat.2007.10.028
formed SiOSi network is very hydrophobic if one of thesubstituents on the Si atom is a carbon atom [1]. The use of a bis-silane can further improve the reticulation process, as a largernumber of SiOH groups will be available to react betweenthemselves, and thus building thicker polymeric metallo-organicprotective layers [2]. The final result of the silane pre-treatmentis a dense silicon and oxygen rich coating that constitutes aprotective physical barrier.
Studies have shown that so-called “bis-silanes” or dipodalsilanes display superior protection on metal surfaces, especiallywhen used in conjunction with functional mono-silane treat-ments for adhesion to other organic layers applied on top. Thesecompounds enhanced performance is achieved by forming amore pronounced hydrophobic polysiloxane layer (higher num-ber of SiOSi bonds) during condensation, but that still allowchemical coupling using the functional group present either inthe dipodal silane itself or in the mono-silane solution additive.Thus, combination of silanes (mixtures) usually performs betterthan films of silanes alone [3]. Current knowledge of the

Fig. 1. Scheme of silica nanoparticles on primary, aggregates and agglomeratesform.
2851P.H. Suegama et al. / Surface & Coatings Technology 202 (2008) 2850–2858
coupling agent/substrate interface and of the coupling agent/polymer interface shows that the maximum coupling efficiencydepends on the number of mineral O–Si (oxane) bonds formedwith the substrate and on the nature of the organofunctionalgroups that interact with the polymer [4].
Deposition of silane films from hydrolyzed solution is veryfast and the thickness of the films remains virtually unchanged,even if the immersion time is varied from 30 s to 30 min [5].When the metal is dipped into a dilute silane solution of 2–5%by volume concentration for a few seconds, silanol groups getadsorbed instantaneously on the metal surface. Several studieshave shown that the silane film thickness on metals increaseswith the concentration of the silane solution, and the relation-ship between silane film thickness and solution concentration ispractically linear [6].
The mechanism by which thin films of functional silanesprotect metals from various form of corrosion appears to bequite simple. There is no evidence that silanes are electro-chemically active in solution or in the solid state. They cannotbe reduced or oxidized, unless they carry functional groups thathave electrochemical activity. As most functional groupspresent in commercial silanes are not electrochemically active,it can be assumed that silane films are primarily barrier coatings.They reduce the rate at which water and electrolyte can reachthe interface where they would induce corrosion reactions.Thus, the most important properties of silanes films are theirhydrophobicity and barrier properties [6].
One major drawback to the widespread use of silane films as apassivating treatment is that despite their hydrophobicity, even-tually moisture reaches the metal–silane interface. [6]. Indeed,silane coatings may present small pores and pinholes or microcracks that facilitate electrolyte diffusion and the accumulation ofaggressive species at the interface coating/substrate, leading tocorrosive attack. In this sense, future advances in the silane filmstechnology needs formulating more robust coatings; however,thicker silane monolayers are usually too brittle, and the stabilityof the solutions used to deposit them is relatively poor. Severalalternative methods have been attempted, starting with theinclusion of additives in the silane film such as nano-sized fillerand inhibitors [6]. The former treatment increases the film barrierproperties and the latter gives self-healing abilities [7,8].
Most of studies with silane films uses hydrolysis solutionswith high amounts of organic solvents, such as ethanol ormethanol (N90% (wt) in the solution composition) [4,7–17],the latter been known by its toxicity. This provides a majorobstacle in the introduction of these alcohol-based silanes intoexisting industrial systems because of the low flash pointtemperature. Among the most investigated silanes, mixtures ofBTSPA is one of the more environmentally compliant as it isfully soluble in aqueous solution due to the presence of thehydrophilic amine [1,3]. However this also constitutes a majordrawback since the film can be easily dissolved when in contactwith aqueous electrolyte. Indeed, many studies investigating theanticorrosion behavior of BTSPA revealed poor performancewhen compared with other functional or non-functional silanes[1,18,19]. In one of their studies Van Ooij et al. verified anexcellent anticorrosion performance for a BTSPA and BTSPT
mixture to protect Al alloys [1]. So it is likely that upon mixingthe hydrophilic BTSPA with a hydrophobic component,adequate protective properties can be achieved.
In this work, the corrosion behavior of BTSPA films filledwith silica nanoparticles was investigated using electrochemicaltechniques. The investigation was performed in 0.1 mol L−1
NaCl solution. In order to obtain more environmentally com-pliant silane hydrolysis solution and with higher flashpointtemperatures, the films were obtained in a solution with 50% ofalcohol (ethanol) and 50% of water [20,21]. The electrochemi-cal response of single (SL) and bi-layer (BL) films was inves-tigated. Contact angle measurements and AFM were employedto assess the hydrophobic and morphological characteristics ofthe modified films.
2. Experimental
A UNS 10100 steel with nominal composition 0.1 wt.%C,0.30 wt.%Mn, 0.05 wt.%S, 0.04 wt.%P and balance of Fe wasused as substrate. Prior to immersion in the silane solution, thesteel substrate was ground with 320, 400 and 600 emery paper,degreased in an acetone ultrasonic bath and immersed in a 2.5%w/w NaOH solution (10 min). The alkaline etch helps toimprove the wettability of the metallic substrate and to obtain awater break-free surface. Following cleaning the panels werewashed with distilled water and dried in hot air streamaccording to procedures already described elsewhere [22–24].
The 2% (w/w) silane solution was prepared by adding thebis-[trimethoxysilylpropyl]amine (BTSPA) to a 50/50% w/wethanol/deionized water solution previously acidified to pH 4.0with acetic acid. Afterwards the solution was stirred at roomtemperature for 30 min to allow for hydrolysis. When preparingthe silica containing solution, the nanoparticles were added tothe ethanol/deionized water solution at the same time as thesilane, in order to enhance their dispersion during hydrolysis.Different amounts of silica were added in order to formdispersions with 100, 200, 300, 400 and 500 ppm of total silicaamount, calculated in relation to the total volume of the silanehydrolysis solution. In all the cases the silane coating wasproduced by immersion of the substrate during 2 min in thesilane solution. The silica nanoparticles used were Cab-O-SilTS-610, these are fumed silica of high-purity treated withdimethyldichlorosilane, with primary particles size around10 nm, but according to the supplier, they can also formaggregates with 30–50 nm size (Fig. 1). According to thesupplier [25] this treatment replaces many of the hydroxyl

Table 1Parameters used to obtain the coated steel samples
Sample Immersion in[SiO2]+BTSPAhydrolysissolution
[SiO2]/ppm 1st Curecuringtime/min
Immersionin BTSPAhydrolysissolution
2nd CureCuringtime/min
SL100 Yes 100 40 – –SL200 Yes 200 40 – –SL300 Yes 300 40 – –SL400 Yes 400 40 – –SL500 Yes 500 40 – –SLF Yes – 40 – –BL100 Yes 100 20 Yes 40BL200 Yes 200 20 Yes 40BL300 Yes 300 20 Yes 40BL400 Yes 400 20 Yes 40BL500 Yes 500 20 Yes 40BLF Yes – 20 Yes 40
SL for samples with single layer coatings, BL for samples with bi-layer coatings.100 to 500 accounts for the amount of silica nanoparticles added to the silanesolution. Curing temperature: 150 °C.
Table 2Contact angle values for silane coated carbon steel samples
Sample Angle Sample Angle
SL100 77° BL100 84°SL200 78° BL200 86°SL300 80° BL300 90°SL400 72° BL400 71°SL500 70° BL500 69°SLF 75° BLF 76°
2852 P.H. Suegama et al. / Surface & Coatings Technology 202 (2008) 2850–2858
surface groups on the fumed silica for methyl groups, providinghydrophobic characteristics to the particles.
Two groups of samples were obtained:
1) One by a single immersion in the hydrolyzed solution(with silica nanoparticles), which was afterwards cured at150 °C for 40 min to obtain a single layer (SL);
2) The other was obtained by dipping during 2 min in thesilane-hydrolyzed solution (without silica nanoparticles)samples previously coated with a single layer and submittedto the curing procedure during 20 min. Afterwards thesample was cured at 150 °C for 40 min. With this procedurebi-layer (BL) coatings were produced.The basic conditionsemployed to obtain the films are summarized in Table 1.The contact angle was determined on silane-coated samples
by the sessile drop method using a Ramé–Hart contact-anglegoniometer, Model 100-10. Several measurements were carriedout on the bare and coated substrate with a water drop of ca.15 mm3 under room atmosphere. The reported values constitutean average of at least 5 measurements.
To perform the AFM experiments, silane layers preparedaccording to the different procedures investigated in this workwere deposited on monocrystal Si disks. The AFM images wereobtained using a SHIMADZU SPM 9600 J3® atomic forcemicroscope (AFM). Si-cantilever from nanosensor was used withconstant force of about 50 N/m and nominal resonance frequencyof 291 kHz. The operating frequency was 5% lower than theresonance one. Driving amplitude was 300 mV and operatingpoint of 214mV.AFM imageswere acquired in dynamicmode, inwhich a cantilever oscillate with the probing tip close to its freeresonance frequency with given amplitude. The interaction be-tween the sample and the probe gives rise to a phase shift of theprobe vibration with respect to that measured in free oscillationcondition, i.e. with the probe far away from the sample. Thevertical displacement (height) necessary to keep the set amplitudeprovides information about the topography of the system.
Monocrystal Si disks were also employed to determine thethicknesses of the silane films profile using a Kosakalab-Surfcorder-SE1700α.
The corrosion resistance of the coated steel was evaluated bymeans of electrochemical measurements carried out in 400 mLof naturally aerated and unstirred 0.1 mol L−1 NaCl solution.An Ag|AgCl|KClsat electrode, connected to the workingsolution through a Luggin capillary, was used as reference,and a Pt network as auxiliary electrode. The working electrodewas mounted in the EG&G electrochemical flat cell, exposingan area of 1 cm2 to the solution.
Open-circuit potential (EOC vs. time) and electrochemicalimpedance spectroscopy (EIS) measurements were made usingEG&G potentiostat/galvanostat model 283 and a Solartron-SI1255 frequency response analyzer. The EIS tests wereperformed applying a 10 mV (rms) sinusoidal perturbation tothe EOC value, starting from 5×10⁴ to 1×10⁻² Hz with 7measurements per frequency decade after 3 h of immersion inthe test solution.
Polarization curves were recorded for all samples in apotential range from −250 to +250 mV versus EOC/Ag|AgCl|KClsat at a scan rate of 0.5 mV/s and linear polarization curveswere obtained from −20 to +20 versus EOC/Ag| AgCl|KClsat ata scan rate of 0.166 mV/s.
3. Results and discussion
3.1. Structural and morphological characterization
The thicknesses of some silane films determined onmonocrystal Si disks were: SLF: 38 nm; BLF: 72 nm; SL100:76 nm; BL300: 335 nm; BL500: 772 nm. As observed, thethickness increases when the second layer is applied indicatingthat no important dissolution of the first layer occurred.Moreover, the layer thickness is also augmented as more silicananoparticles are added.
Contact angle measurements were obtained for all samplesand the acquired data are presented in Table 2. Samples with300 ppm of silica (SL300 and DL300) presented the highestvalues from each series, indicating that they present morehydrophobic surface. BL300 sample presented the highest valuesuggesting that it must provide best barrier action against waterpenetration.
The data of Table 2 show that for both kind of samples, SLand BL, there is an increase of the contact angle values withsilica addition up to 300 ppm. For higher silica amounts theangles start to decrease indicating degradation on the

Fig. 2. AFM height (A) and phase (B) images of SLF sample and (C) Cross-section scheme of the single non-filled silane layer.
2853P.H. Suegama et al. / Surface & Coatings Technology 202 (2008) 2850–2858
hydrophobic nature of the film. Furthermore, the contact anglesmeasured on films filled with 400 and 500 ppm of silicananoparticles were inferior to those exhibited by non-filledfilms, suggesting a strong deterioration of the films propertiesdue to the particles addition. According to the literature defectscan appear when a silane film is heavily loaded with silica, thistends to form porous films, which can promote electrolyteintrusion and premature film delamination [26]. The beneficialeffect of the BL treatment on the properties of the film isevidenced by the higher contact angles exhibited by thesesamples when compared with the SL coated ones in the regionwhere the silica nanoparticles treatment seems to be effective,i.e., up to 300 ppm.
AFM images were acquired by the phase imaging mode. Inthis mode, the vertical displacement (height) necessary to keepthe set amplitude provides information about the topography ofthe surface (height image). On the other hand, the measuredphase shift provides direct information about the sampleproperties. For example, when the tip touches a harder surface,the dissipation energy changes, affecting the signal andchanging the image contrast as well, generating a qualitativeimage of harder or softer regions [27,28], which correspondsto differences in the viscoelastic properties of the surface.Accordingly, combining topographic image with BTSPAfilm phase images, it is possible to verify how the silicananoparticles are distributed on the film and to assess theirhomogeneity.
Figs. 2–4 show AFM images of SLF, SL300 and BL300samples obtained for a scanned area of 1 μm2. The roughnessobtained for some of these samples by the AFM software were:SLF = 0.461 ± 0.588 nm, SL300 = 3.847 ± 4.836 nm,BL300=0.429±0.543 nm and BL500=1.347±1.743. Figureslabeled as (A) show the height image, (B) the phase image and(C) a cross section scheme. For the non-filled BTSPA sample,Fig. 2A, is possible to observe a smooth surface, with a heightrange of 5.72 nm, in Fig. 2A the image shows heterogeneousviscoelastic behavior of the material surface, indicated by thedifferent contrast. When, SiO2 particles were added, Fig. 3A,stronger height differences (color contrasts) were verified incomparison with Fig. 2A. These features were uniformlydistributed throughout the whole image, indicating that they areuniformly distributed into the film and with a height range of37 nm, indicative of an increase of the film roughness. Thissuggests that the thickness of the film is more heterogeneouswhen compared with the non-filled one; however, as silanes areapplied as a pre-treatment step this increasing in roughness canenhance anchorage between the film and polymeric layers to beapplied on top. The size of the features distributed in the silanematrix is in the order of tenths of nanometers indicating thatthey can be either agglomerated silica nanoparticles or evenisolated ones, considering that tip effects of the AFM adds atleast 20 nm to each observed feature. Indeed, images obtainedover a larger surface (5 μm×5 μm), not presented here,have shown small circular patterns regularly distributed in thesilane film.
In Fig. 3B the topographic influence of the silica nanoparticleson the image can be clearly distinguished. This is indicative
that the more external SiO2 are covered with a very thin silanelayer, giving them adherence to the bulk of the film. Thedifferences between the surface characteristics of the silica filledand non-filled silane films can be better evaluated by comparingthe cross-section schemes presented in Figs. 2C and 3C. Inthe latter the silica nanoparticles are distributed within the film,
2854 P.H. Suegama et al. / Surface & Coatings Technology 202 (2008) 2850–2858
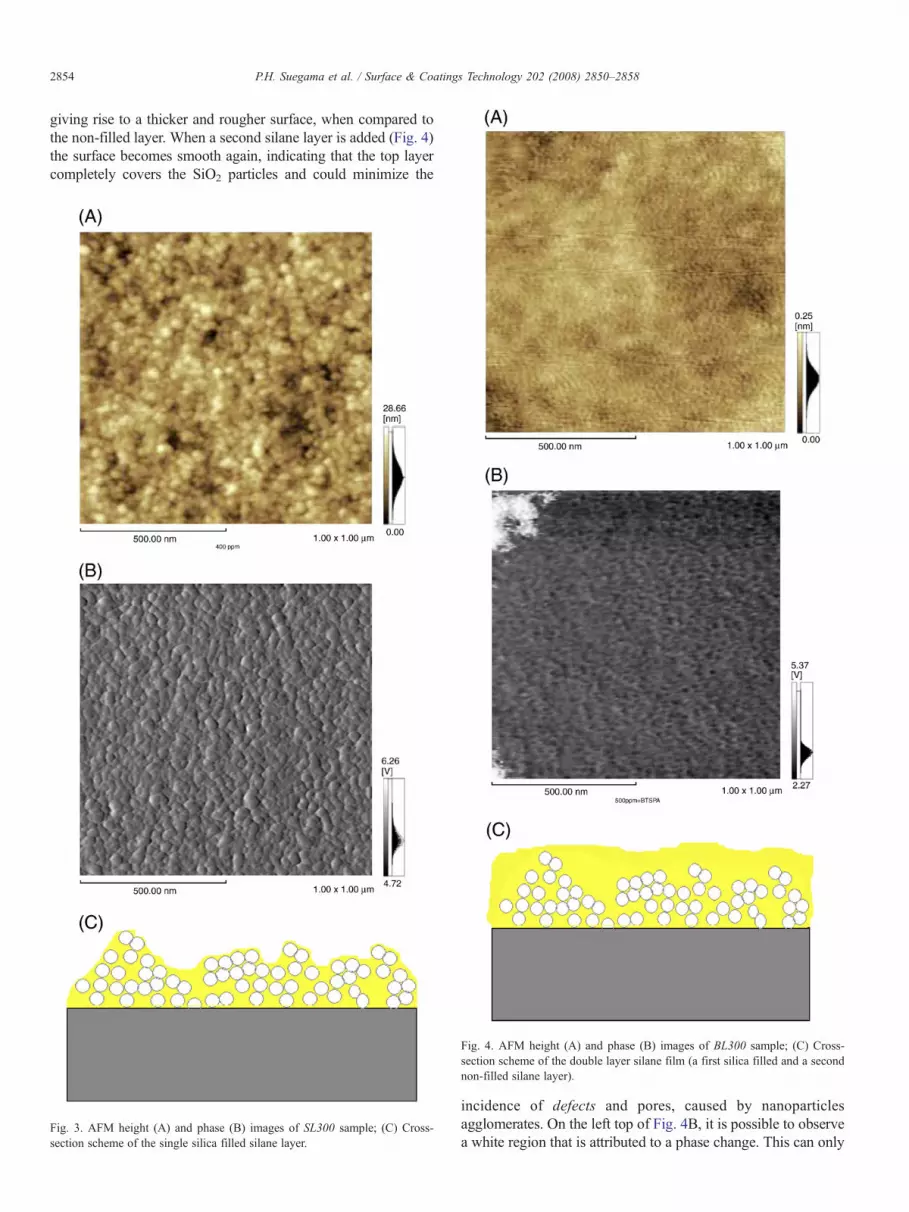
giving rise to a thicker and rougher surface, when compared tothe non-filled layer. When a second silane layer is added (Fig. 4)the surface becomes smooth again, indicating that the top layercompletely covers the SiO2 particles and could minimize the
Fig. 4. AFM height (A) and phase (B) images of BL300 sample; (C) Cross-section scheme of the double layer silane film (a first silica filled and a secondnon-filled silane layer).
Fig. 3. AFM height (A) and phase (B) images of SL300 sample; (C) Cross-section scheme of the single silica filled silane layer.
incidence of defects and pores, caused by nanoparticlesagglomerates. On the left top of Fig. 4B, it is possible to observea white region that is attributed to a phase change. This can only

Fig. 5. Open-circuit potential (EOC) vs. time for carbon steel substrate, BTSPAcoated sample and BTSPA filled with SiO2 coated sample (A) single layerand (B) double layer, recorded in aerated and unstirred 0.1 mol L−1 NaClsolution, at 25 °C.
2855P.H. Suegama et al. / Surface & Coatings Technology 202 (2008) 2850–2858
be the polymer phase, since the SiO2 particles are not observed.When the sample is dipped in the second silane solution to obtainthe top silane layer, heterogeneous surface can be generated. Toanchor the top layer some non-cross-linked silanol groupsare necessary on the bottom layer [21] that is why a mildercuring procedure was adopted. As the bottom layer is not fullycross-linked, it can be partially dissolved by the hydrolyzedsolution, as silanes are highly soluble in ethanol solutions.In this way, for the BL samples, small regions where only thenon-modified silane layer is formed can co-exist with zoneswhere the bi-layered structure is consolidated.
3.2. Corrosion studies
Open circuit potential measurements were obtained for allthe samples. For single-layer (SL) coated samples, Fig. 5A, theEOC showed a fast potential drop until 45 min and, afterwards,it gradually drifts to lower values up to 140 min, when it reachesa steady state. For this set of samples the EOC values exhibit
a strong correlation with the contact angle measurements pre-sented in Table 2. In this sense, the higher the contact angle,the less negative is the potential. So it can be supposed thatelectrolyte penetration must be the responsible for the decreasein the potential during the experiment. This same correlationbetween contact angle and EOC values was also observed for theBL coated samples, Fig. 5(B). Comparing the EOC valuesobtained for SL and BL coated samples, it is possible to verifythat, generally, the former present a faster potential drift than thelatter, which can be ascribed to the presence of a thinner silanelayer, allowing faster electrolyte penetration to the film/substrate interface. This feature is more evident for thesituations where the silica pre-treatments were not effective(400 and 500 ppm) further evidencing the defective nature ofthe modified layer.
In Fig. 6(A) and (B) EIS plots of the SL series obtained after3 h of immersion are presented. In accordance with thepreviously discussed results, it can be observed that increasingthe SiO2 amounts, up to 300 ppm, increases the diameter ofthe capacitive loop, indicating better corrosion resistance.Moreover, the films modified with the highest amounts ofnanoparticles exhibited lower protective performance than thenon-modified one. This can be likely due to a large number ofdefects caused by the huge quantity of SiO2 particles in the filmstructure, as already discussed in the AFM results. Thesefindings are in accordance with previous results published byother authors [16] that have also detected that silica nanopar-ticles addition can be beneficial to the anticorrosive propertiesof silane layers when added up to a certain amount. Theseauthors [16] also attributed this deleterious effect to theintroduction of defects in the silane film. Bode plots for SLfilms, presented in Fig. 6(B) basically show no difference intheir HF region, indicating that somehow silica nanoparticlesacts to retard the interfacial process, as a great increase of the LFimpedance limit was verified upon addition of nanoparticles upto 300 ppm. This lack of differentiation in the HF region can belinked with the high water uptake tendency of the BTSPA filmsdue to their hydrophilic nature.
The impedance data for the BL series are presented in Fig. 6(C) and (D). Regarding the effect of SiO2 nanoparticles additionin the corrosion resistance, the same trends observed for the SLseries are valid for these samples, including the HF phase anglebehavior. However, it is possible to observe an increase of totalimpedance for all BL samples when compared to the SL ones,which can be ascribed to the presence of a thicker layer.Comparing the overall behavior the BL300 sample presentedthe highest impedance value indicating the best protection tothe substrate.
The impedance data presented in Figs. 6 were fitted using theequivalent electrical circuit showed in Fig. 7. The circuit waschosen taking into account the physical structure of the samplesand the best fitting results, evidenced by low residual errors (χ2)for each parameter of the circuit. In the proposed circuit Rs is theelectrolyte resistance. The [R1CPE1] component occurring athigher frequencies is associated to the properties of the silanefilm. On the other hand, the [R2CPE2] component is linked tothe charge transfer reaction associated with the oxidation of the

Fig. 7. Equivalent circuit used to fit the impedance data for SL and BL series inaerated and unstirred 0.1 mol L−1 NaCl solution after 3 h of immersion.
Fig. 6. EIS diagrams: (A) Nyquist plots and (B) −ϕ vs. log(f) and |Z| vs. log(f) Bode plots for single layer and (C) Nyquist plots and (D) −ϕ vs. log(f) and |Z| vs.log(f) Bode plots for bi-layer series obtained after 3 h of immersion in 0.1 mol L−1 NaCl solution. Full lines represent the results of the fitting procedure using theequivalent circuit of Fig. 7.
2856 P.H. Suegama et al. / Surface & Coatings Technology 202 (2008) 2850–2858
substrate, where R2 corresponds to the charge transfer resistanceand Y02 to the capacitance of the steel/electrolyte interface.Constant phase elements (CPE) substitute the capacitances (C)accounting for heterogeneous and/or rough surfaces. The resultsof the fitting procedure are presented in Table 3.
The values of the fitting procedure associated with the silanelayer indicate that diffusive pathways are established within thefilm. The order of magnitude of Y01 and Y02 are 10
–5 S s(1– n)
cm–2, with n close to 0.5 and 0.7, respectively. A n=0.5 can beassociated to the porous nature of the coating, since a CPE withsuch exponent can adequately model a finite length diffusionpathway. [29–34], while n around 0.7 is related with theheterogeneity of charge distribution on the coating surface [35–37]. Due to the complexity of the systems, this equivalent circuitonly represents a simplified manner to describe the electro-chemical interface. However the procedure clearly confirms theimprovements on the properties of the silane film due to theaddition of the silica nanoparticles, especially in the amountsranging from 200 to 300 ppm. In the literature, the order ofmagnitude of Y0 for silane films on galvanized steel is 10–6 Ss(1– n) cm–2 [7,17,38], and on carbon steel is 10–5 S s(1– n) cm–2.
Such high capacitance values are typical of silane films and thedifference occurs due to the zinc oxide on the galvanized steelsurface. The comparison of the published results [20,21] withthose presented in Table 3 leads us to suppose that the silane layercapacitance can be in parallel with the diffusion one, however, asthey act additively it was impossible to differentiate between thenwith the fitting procedure, unless one of them was fixed (pureWarburg behavior, for instance). However, as this procedureintroduces new parameters in the equivalent circuit with noevidence of a new time constant in our experimental results it isnot presented.

Table 3Values for the elements of the equivalent circuit showed in Fig. 7 for SL and DLseries in aerated and unstirred 0.1 mol L−1 NaCl solution after 3 h of immersion
Sample Rs/ R1/kΩcm2
CPE1 R2/kΩcm2
CPE2 χ2/10−4
Y0.1/10–5
S s(1–n)
cm−2
n1 Y0.2/10−5
S s(1–n)
cm−2
n2
SLF (%error) 50 1.2 2.3 0.52 56 6.2 0.66 5.34.9 12 12 5.2 6.1 10 3.4
SL100 (%error) 49 0.18 3.7 0.67 21 7.1 0.74 0.893.2 13 3.1 5.2 2.3 15 2.4
SL200 (%error) 58 0.39 1.9 0.58 140 9.6 0.65 7.92.7 14 12 9.9 10 10 2.3
SL300 (%error) 74 3.5 1.4 0.52 131 4.9 0.66 3.97.6 5.1 13 4.7 5.3 3.3 1.25
SL400 (%error) 62 0.80 0.78 0.65 57 7.8 0.61 1.14.9 3.8 13 2.1 2.6 1.6 0.75
SL500 (%error) 53 1.0 7.3 0.56 21 3.7 0.83 8.93.7 13 11 2.4 5.1 15 4.8
BLF (%error) 70 1.62 1.20 0.61 216 4.11 0.57 1.16.8 4.2 7.4 1.30 4.7 2.4 0.60
BL100 (%error) 73 6.49 2.1 0.51 163 4.32 0.63 1.06.4 4.1 5.1 1.52 2.8 2.8 1.21
BL200 (%error) 62 4.34 0.96 0.54 327 5.71 0.74 3.37.1 5.7 2.9 1.45 1.9 3.75 2.01
BL300 (%error) 50 4.60 0.67 0.50 328 5.14 0.71 3.75.4 3.9 3.9 0.83 3.3 0.64 0.47
BL400 (%error) 53 6.49 1.9 0.52 303 4.04 0.70 2.14.4 4.1 3.5 6.5 4.3 9.9 3.86
BL500 (%error) 57 5.03 3.6 0.61 54 7.26 0.66 2.73.7 1.6 5.5 0.63 1.98 0.62 0.86
Data obtained by fitting.
2857P.H. Suegama et al. / Surface & Coatings Technology 202 (2008) 2850–2858
Taking into account the R2 values that can be attributed toRct (charge transfer resistance at themetal/electrolyte interface)it is possible to see a close agreement between the EIS,polarisation curves and linear polarization resistance, Rp, results(Table 4). In this way, for films that are as defective as the silaneones, for EIS fitting results analysis, it is better to focus in thelow frequency results, mainly Rct, that represents morefaithfully the corrosion resistance of the coated substrate.
The polarization curves obtained after 30 min of immersionfor samples coated with BTSPA filled with silica nanoparticlesare shown in Fig. 8. The cathodic and anodic branches wereobtained on the same sample and in the increasing potentialdirection. The curves clearly show that polarization of theanodic reaction is the main responsible for the increas-
Table 4Rp values, obtained from linear polarisation, after 1 h of immersion in 0.1 molL−1 NaCl solution
Sample Rp/kΩ cm2 Sample Rp/Ω cm2
SL100 10.7 BL100 41.1SL200 12.3 BL200 110SL300 79.0 BL300 130SL400 13.3 BL400 50.1SL500 8.0 BL500 27.1SLF 6.6 BLF 10.7Carbon steel 2.5
ing corrosion resistance exhibited by the samples coated withsilica filled silane layers, when this treatment is effective (up to300 ppm).
In Table 4, the Rp values obtained from linear polarization,for SL and BL samples and for carbon steel are presented. Foreach series, the samples modified with 300 ppm of silicapresented the highest Rp values confirming their superior anti-corrosive properties.
Concerning the overall results obtained in the present work,analogy with painting systems can be made. For these systemsthere is a critical amount of pigment that can be added to anorganic coating, beyond which it becomes more permeable orporous. As the pigment concentration increases, its agglomera-tion is enhanced leading to a more opened (cracked) andpermeable structure. The same phenomenon can occur in thesilane film if the amount of added silica nanoparticles is toohigh. When they are not uniformly distributed, they becomeagglomerated, making porous and cracked films and decreasingthe corrosion protection, as confirmed by our experimentalresults.
Fig. 8. Polarization curves for (A) single layer and (B) bi layer coatedsamples obtained after 30 min of immersion in 0.1 mol L−1 NaCl solution atv=0.5 mV s−1.

2858 P.H. Suegama et al. / Surface & Coatings Technology 202 (2008) 2850–2858
4. Conclusions
In this work the anticorrosion performance of monolayer andbi-layer BTSPA films modified silica nanoparticles wasinvestigated by means of electrochemical and surface char-acterization techniques.
For the monolayer systems, the overall results have shownthat nanoparticles addition improves the anticorrosion behaviorof the silane layers when added up to a certain amount(300 ppm), which was reflected on higher impedance, morepolarized anodic and cathodic behavior and also in highercontact angles. Moreover, AFM observations show that, underfavorable conditions the fillers are uniformly distributed withinthe silane structure, giving rise to a rough surface.
It was also shown that the addition of a second silane layer(un-modified) on the top of the modified ones, forming a bi-layer structure, further improved the anticorrosive properties ofthe silane coating, as long as they are applied on top of a layerfilled with the right amount of modifiers. This procedureresulted in thicker layers, showing that the bottom ones do notdissolve during the immersion of the coated sample in thesilane solution, and with a smooth surface, observed by AFM,indicating that the top layer completely covers the bottom one.On the other hand, when the top layers were applied on topof defective bottom layers (with filler excess) there is noimprovement of the anticorrosive properties and the top layerdoes not successfully cover the bottom one defects.
Acknowledgements
The financial support from FAPESP-Fundação de Amparoà Pesquisa do Estado de São Paulo (Proc. no. 05/51851-4 and04/00776-0) is greatfully aknowledged. We are grateful to theqLaboratório de Filmes Finos do IFUSPq, Brazil, for the SPMfacility (FAPESP proc. # 95/5651-0).
References
[1] D. Zhu, W.J. van Ooij, Electrochim. Acta 49 (2004) 1113–1125.[2] F. Zucchi, V. Grassi, A. Frignani, G. Trabanelli, Corros. Sci. 46 (2004)
2853–2865.[3] D. Zhu, W.J. van Ooij, Prog. Org. Coat. 49 (2004) 42–53.[4] W. Trabelsi, E. Triki, L. Dhouibi, M.G.S. Ferreira, M.L. Zheludkevich,
M.F. Montemor, Surf. Coat. Technol. 200 (2006) 4240–4250.[5] A.H. Terryn, J. Vereecken, Thin Solid Films 441 (2003) 76–84.[6] W.J. van Ooij, D. Zhu, M. Stancy, A. Seth, T. Mugada, J. Gandhi, P.
Puomi, Tsinghua Sci. Technol. 10 (2005) 639–664.[7] W. Trabelsi, P. Cecilio, M.G.S. Ferreira, M.F. Montemor, Prog. Org. Coat.
54 (2005) 276–284.[8] V. Palanivel, Y. Huang,W.J. van Ooij, Prog. Org. Coat. 53 (2005) 153–168.[9] V.M. Palanivel, Modified Silane Thin Films as an Alternative to
Chromates for Corrosion Protection of AA2024-T3 Alloy, University ofCincinnati, Master, Engineering: Materials Science, 2003, 153p.
[10] A.C. Bastos, M.G. Ferreira, A.M. Simões, Corros. Sci. 48 (2006)1500–1512.
[11] W. Yuan, W.J. van Ooij, J. Colloid Interf. Sci. 185 (1997) 197–209.[12] D. Zhu, W.J. van Ooij, Corros. Sci. 45 (2003) 2163–2175.[13] W. Trabelsi, L. Dhouibi, E. Triki, M.G.S. Ferreira, M.F. Montemor, Surf.
Coat. Technol. 192 (2005) 284–290.[14] M.F. Montemor, A.M. Simões, M.G.S. Ferreira, B. Williams, H. Edwards,
Prog. Org. Coat. 38 (2000) 17–26.[15] A. Cabral, R.G. Duarte, M.F. Montemor, M.L. Zhedkevich, M.G.S.
Ferreira, Corros. Sci. 47 (2005) 869–881.[16] M.F. Montemor, A.M. Cabral, M.L. Zheludkevich, M.G.S. Ferreira, Surf.
Coat. Technol. 200 (2006) 2875–2885.[17] A.M. Cabral, W. Trabelsi, R. Serra, M.F. Montemor, M.L. Zheludkevich,
M.G.S. Ferreira, Corros. Sci. 48 (2006) 3740–3758.[18] http://www.sintef.no/static/mt/norlight/ICEPAM/01-van-Ooij_Cincinnati.
pdf.[19] D. Zhu, Corrosion Protection of Metals by Silane Surface Treatment,
Doctor of Philosophy (Ph.D.) Materials Science and Engineering,University of Cincinnati, 2005, 324p.
[20] M.F. Oliveira, S. Wolynec, I.V. Aoki, Pitture e Vernici European Coatings82 (2006) 47–55.
[21] M.F. Oliveira. Estudo da influência de organo-silanos na resistência àcorrosão de aço carbono por meio de técnicas eletroquímicas. Universi-dade de São Paulo, PhD Thesis, Polytechnic School, 2006. 218p.
[22] A. Franquet, J. De laet, T. Schram, H. Terryn, V. Subramanian, W.J. vanOoij, Thin Solid Films 384 (2001) 37–45.
[23] P.C. Hiemenez, R. Rajagopalan, Principles of Colloid and SurfaceChemistry, 3rd ed., Marcel Dekker, New York, 1997, 670p.
[24] J. Lyklema, H.P. van Leeuwen, Fundamentals of Interface and ColloidScience, Elsevier, Academic Press, The Netherlands, v.2, 1991, 751p.
[25] Cabot Corporation, http://www.cabot-corp.com/cws/businesses.nsf/8969ddd26dc8427385256c2c004dad01/6f4564baec7c883985256-c7a005021bb/$FILE/TD-130%20-%20CAB-O-SIL%20TS-610.pdf.
[26] V. Palanivel, D. Zhu, W.J. van Ooij, Prog. Org. Coat. 47 (2003) 384–392.[27] S.N. Magonov, J. Cleveland, D. Denley, M.–H. Whangbo, Surf. Sci. 389
(1997) 201.[28] B. Anczykowski, B. Gotsmann, H. Funchs, J.P. Cleveland, V.B. Elings,
Appl. Surf. Sci. 140 (1999) 376.[29] M. Sluyters-Rehbach, J.H. Sluyters, in: A.J. Bard (Ed.), Electroanalytical
Chemistry, vol. 4, Marcel Dekker, Inc., N.Y., 1970, p. 1.[30] R. De Levie, in: P. Delahay, W. Tobias (Eds.), Advances in Electro-
chemistry and Electrochemical Engineering, Wiley-Interscience, N.Y.,1967, p. 329.
[31] M. Cai, S.M. Park, J. Electrochem. Soc. 143 (1996) 3895–3902.[32] D.D. Macdonald, in: R. Varma, J.R. Selman (Eds.), Techniques for
Characterization of Electrodes and Electrochemical Processes, John Wiley& Sons, Inc., N.Y., 1991, p. 515.
[33] R. de Levie, J. Electroanal. Chem. 281 (1990) 1.[34] S.G. Real, J.R. Vilche, A.J. Arvía, J. Electroanal. Chem. 341 (1992) 181.[35] W.H. Mulder, J.H. Sluyters, Electrochim. Acta 33 (1988) 303.[36] E.D. Bidóia, L.O.S. Bulhões, R.C. Rocha-Filho, Electrochim. Acta 39
(1994) 763.[37] A. Lasia, Electrochemical Impedance Spectroscopy and its Aplications.
In: Modern Aspects of Electrochemistry, (Eds. B.E. Conway, J.O'M.Bockris, and R.E. White), Kluwer Academic/Plenum Publishers, N.Y.(1999) 143–248.
[38] W. Trabelsi, P. Cecílio, M.G.S. Ferreira, K. Yasakau, M.L. Zheludkevich,M.F. Montemor, Prog. Org. Coat. 59 (2007) 214.