summer internship project report on working capital management
TRANSCRIPT
SUMMER INTERNSHIP PROJECT REPORTON
“WORKING CAPITAL MANAGEMENT IN
MARATHON ELECTRIC INDIA PVT. LTD.”
SUBMITTED IN PARTIAL FULFILLMENT
TOWARDS THE AWARD OF
MASTER OF BUSINESS ADMINISTRATION
(2013 – 15)
SUBMITTED BY:
SUNIL KUMAR
University Roll No. : 138410183
MBA II YEAR (IV TRIMESTER)
1
INSTITUTE OF BUSINESS MANAGEMENT
DECLARATION
I SUNIL KUMAR, student of MBA session 2013-2015,
hereby declare that my work entitled “Analysis
ofworking capital management” at Marathon Electric India
Pvt. Ltd. is the outcome of genuine efforts done
by me under an able guidance of MR. MAHESH
NAGPAL (Finance Controller) and been submitted to
the GLA University, (Mathura) as a dissertation in
partial fulfillment for the award of the
degree of Master of Business Administration (MBA)
comprises only my original work and due
toan acknowledgement has been made in the
text to all other material used.
Date: (SUNIL KUMAR)
2

3
4

ACKNOWLEDGEMENTApplication of theoretical knowledge to a practical
situation is the bonanzas of this survey. Without a
proper combination of inspections and perspirations,
it’s not easy to achieve anything. There is always a
sense of gratitude, which we express to others for
help and the needy service they render during
the different phases of our lives. We would do it
as we really wish to express my gratitude
toward all those who have been helpful to us
directly or indirectly during the
development of this training report.
We would like to thank my supervisor Mr. MAHESH
NAGPAL (Finance Controller) who was always there
to help and guide us when we needed help.
His perceptive criticism kept us working
to make this report more full proof. We are
thankful to him for encouraging and valuable
support. Working under his was an extremely
knowledgeable and enriching experience for me.
We are very thankful to him for all the
value additions and enhancement done to me. I
also thanks to our Assist. Professor (Mr.Ankit Saxena) of
GLA University.
No words can adequately express our overriding
debt of gratitude to my parents, whose support5
helps me in all the way. Above all we shall thank
our colleagues who constantly encouraged
and blessed me so as to enable us to do
this work successfully.
EXECUTIVE SUMMERYThe report basically related to the how to
manage working capital in the company. Cash
is the lifeblood of the company without this
company cannot run successfully. In this we find
out the shortfalls of working capital management
and to find out the company liquidity,
profitability we use some tools to analyze
the financial data of the company for some
future plan. For this study, we collect both types
of data primary data, as well as secondary data also. We
use the descriptive method of the research methodology.
6

To complete this summer training report in a
short time my supervisor and my colleagues also
help to me.
INDEX
SR NO. PARTICULARS PAGE NO.
7
I Front Page i
II Declaration ii
III Company certificate Iii
IV Acknowledgement iv
V Executive Summery v
VI Index vi
1 Chapter – 1About the Company Profile
1 – 10
2 Chapter – 2Introduction to the topic
11 – 19
3 Chapter – 3Objective and Methodology
20 – 25
4 Chapter – 4Data analysis and interpretation
26 – 47
6 Chapter – 5Finding & Conclusions
48 – 50
7 Limitation for further study 51
8 Appendices vii – xi
8

CHAPTER – 1
INTRODUCTION
&
ABOUT
THE COMPANY PROFILE
9
COMPANY PROFILE
Marathon Electric India Pvt. Ltd. Was established in
1913. Since 1913, Marathon Electric has been dedicated to
providing customers with quality products for targeted
applications.
Headquartered:
Wausau, Wisconsin, USA
Regd. Office & Works:
Faridabad (Haryana)
10
Product:
Motors
Nature of business:
Manufacturing & Assembling
Website:
www.marathonelectric.in
INTRODUCTION
In India, Marathon Electric delivers efficient mechanical
power solutions using AC electric motors up to 4.5MW.
Marathon Electric India has manufacturing facilities,
Marathon Electric India Pvt. Ltd. At Faridabad & Marathon
Electric Motors (India) Ltd in Kolkata. Together,
Marathon Electric in India is the Largest Manufacturer &
Exporter of Electric Motors. MEIPL strategic product
lines include Motors and Fans. Our range of Fractional
Horsepower motors serves applications such as Heating,
Ventilating, Air-conditioning & Commercial Refrigeration
(HVAC), General Purpose Applications, Evaporative Coolers
& Cooler Kits, and Washing Machines & Wet Rice Grinders.
MEIPL Integral Horsepower motors range up to 11KV serving
a wide range of applications such as pumps, compressors,11
fans, crushers, conveyors, kilns etc. We also
manufacture Propeller, Axial Flow and Centrifugal Flow
type of industrial fans used for various purposes.
Marathon Electric is part of
Regal Beloit Corporation. The
Regal Beloit Corporation is a
leading manufacturer of
electrical and mechanical motion
control and power generation
products serving markets
throughout the world. Regal
Beloit is headquartered in
Beloit, Wisconsin, and has
manufacturing, sales, and service
facilities throughout North
America and in Mexico, Europe,
and Asia.
Global Technology Center - India (GTCI)
The Global Technology Center (Marathon) - India, also
known as GTCI is located at the ve y heart of the city12

of Hyderabad, the city of pearls. The technology
center is the global hub for Engineering and
Information Technology.
GTCI has world class facilities with Engineering and
IT teams working collaboratively with Regal Beloit
locations globally. This center started its operations
in August 2005. Since then the technological
improvements and world class delivery has made GTCI a
truly competitive advantage for Regal Beloit
Corporation.
Our BrandsMarathon in India is also well known for its brandsGenteq, AUE & Cool Home.
13
Our Products
AC motors, single / Three phase
Cooler motors and Fans
Air Circulator
Wet Rice Grinder
Cage Induction Motors
Roller Table Motors
ECM Motors
14
Fitness Equipment Motors
Marathon Electric – Business units India Headquarter/ MEIPL Faridabad, Haryana
Manufacturing Unit of Fractional Horsepower Motors
MEMIL Kolkata, West Bengal
Manufacturing unit of Integral Horsepower HVAC
Motors
Global Technology Center (Marathon) India –
Hyderabad
The technology center is the global hub of
Engineering and information Technology.
Our Vision
We will clearly differentiate our products and services
as the best value to our customers, as measured by our
customers. We will maintain a sustainable, competitive
advantage through the excellence of our people and our
processes – creating value for all our stakeholders.
Our Mission
We will live our values, demonstrating integrity in all
our actions. We will function with a high level of
15

personal energy, energizing those around us. We will have
the courage to make difficult decisions and execute to
accomplish our vision.
Award and recognitions
Safety Award, 2007
Haryana State Safety and Welfare Awards2007
16

2008 Annual S.A.F.E. Award
Safety Awareness for Employees Award
Award for Export Excellence
ISO 9001:200017

ISO 9001:2008 Certificate from NSF
Award for Excellence in Cost Management
Objectives
To deliver world class performance to customers
through innovation, quality, delivery,
responsiveness and cost.
Develop, attract,& retain the best people by
providing and engaging work environment while
helping them achieves their career goals.
18
Stand top quartile performance in the diversified
industrial sector with respect to revenue growth,
profitability, and cash flow.
Factors of Success
Wide range of motors.
Well advanced manufacturing plant and localization.
Brand value and excellent service after sales.
A developer in FHP motors and hasa major export
marketof India.
80 percent market of market share in India for FHP
motors.
20 percent market share in IHP motors.
19
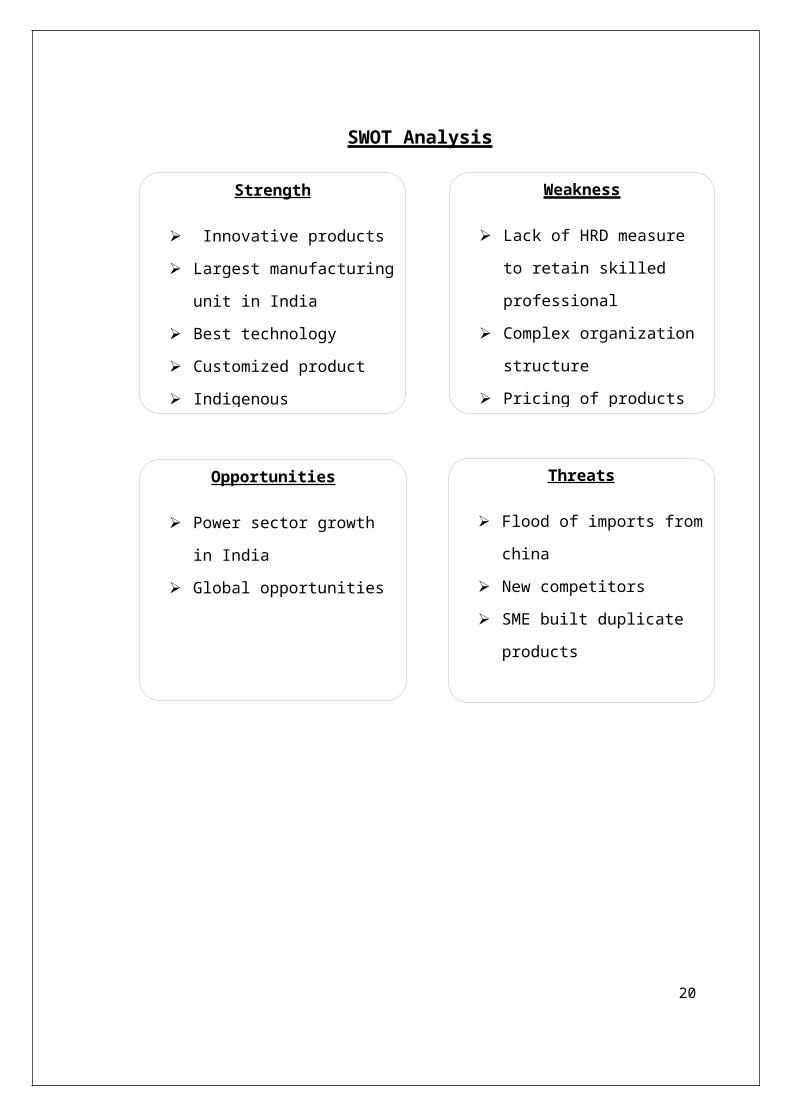
SWOT Analysis
20
Strength
Innovative products
Largest manufacturing
unit in India
Best technology
Customized product
Indigenous
Weakness
Lack of HRD measure
to retain skilled
professional
Complex organization
structure
Pricing of products
Opportunities
Power sector growth
in India
Global opportunities
Threats
Flood of imports from
china
New competitors
SME built duplicate
products

CHAPTER – 2
INTRODUCTION,
OBJECTIVE AND SCOPE OF STUDY
21
INTRODUCTION
Meaning of Capital
In the ordinary sense of the word capital means an
initial investment invested by a businessman or owner at
the time of commencing the business.
Introduction of Working Capital
It describes about how the company manages its working
capital and the various steps that are required in the
management of working capital.
Cash is the lifeline of a company. If this lifeline
deteriorates, so does the company’s ability to fund
operations, reinvest, and meet capital requirements and
payments. Understanding a company’s cash flow prospects
is to look at its Working Capital Management.
Thus, in very simple words, working capital may be
defined as “capital invested in current assets.” Here
current assets are those assets, which can be converted22
into cash within a short period of time and the cash
received is again invested in these assets. Thus, it is
constantly receiving or circulating. Hence, working
capital is also known as circulating capital or floating
capital.
Meaning of working capital
Working capital means the funds (i.e., capital) available
and used for day to day operation (i.e.; working) of a
company. In Accounting
Working Capital = Current Assets – CurrentLiabilities
Definition of working capital
According to Weston & Brigham
“Working capital refers to a firm’s investment
in short term assets - cash, short term securities,
account receivable, and inventories.”
According to Mead Mallett& Field
“Working capital means currentassets”
The project describes how the management of working
capital takes place at Marathon Electric India Pvt. Ltd.
Classification of working capital
Working capital can be classified are as follows-
23
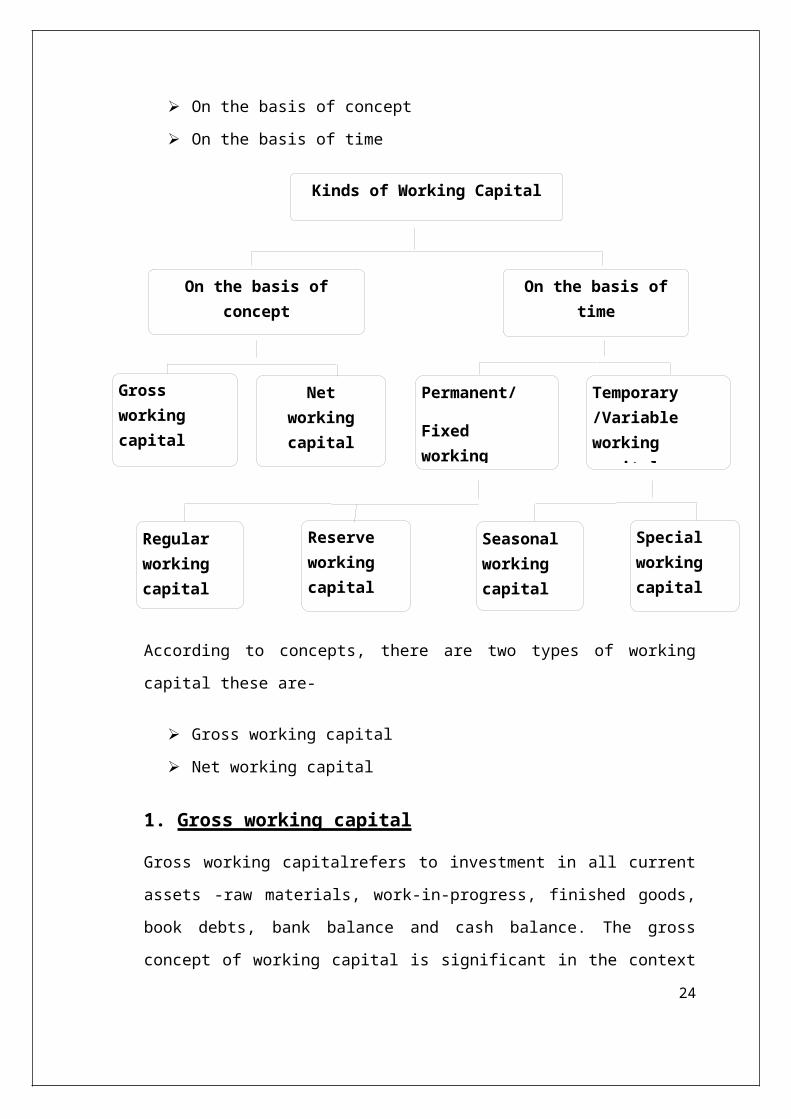
On the basis of concept
On the basis of time
According to concepts, there are two types of working
capital these are-
Gross working capital
Net working capital
1. Gross working capital
Gross working capitalrefers to investment in all current
assets -raw materials, work-in-progress, finished goods,
book debts, bank balance and cash balance. The gross
concept of working capital is significant in the context
24
On the basis ofconcept
Gross working capital
On the basis oftime
Networkingcapital
Kinds of Working Capital
Permanent/
Fixed working
Temporary /Variable working capital
Regular working capital
Reserve working capital
Seasonal working capital
Special working capital
of measuring working capital needed, measuring the size
of the business, continued and smooth flow of operations
of the business and the like.
2. Net working capital
Net working capitalrefers to the excess of current assets
over current liabilities. That is, the value of current
assets minus the value of current liabilities
(currentliabilities includetrade creditors, bills
payable, outstanding expenses such as wages, salaries,
dividend payable and tax payable, bank overdraft, etc.)
The net concept of working capital is significant in the
context of financing of working capital, the short term
liquidity aspects of the business, and the like.
Net working capital may be positive or negative. A
positive net working capital arises when current assets
exceed current liabilities and a negative working capital
occurs when current liabilities are in excess of current
assets. It shows bad liquidity position. This is a
qualitative concept which highlights the character of the
sources from which the funds have been procured to
support that portion of the current assets which is in
excess of current liabilities.
According to time there are two kinds of working
capital. These are-
25
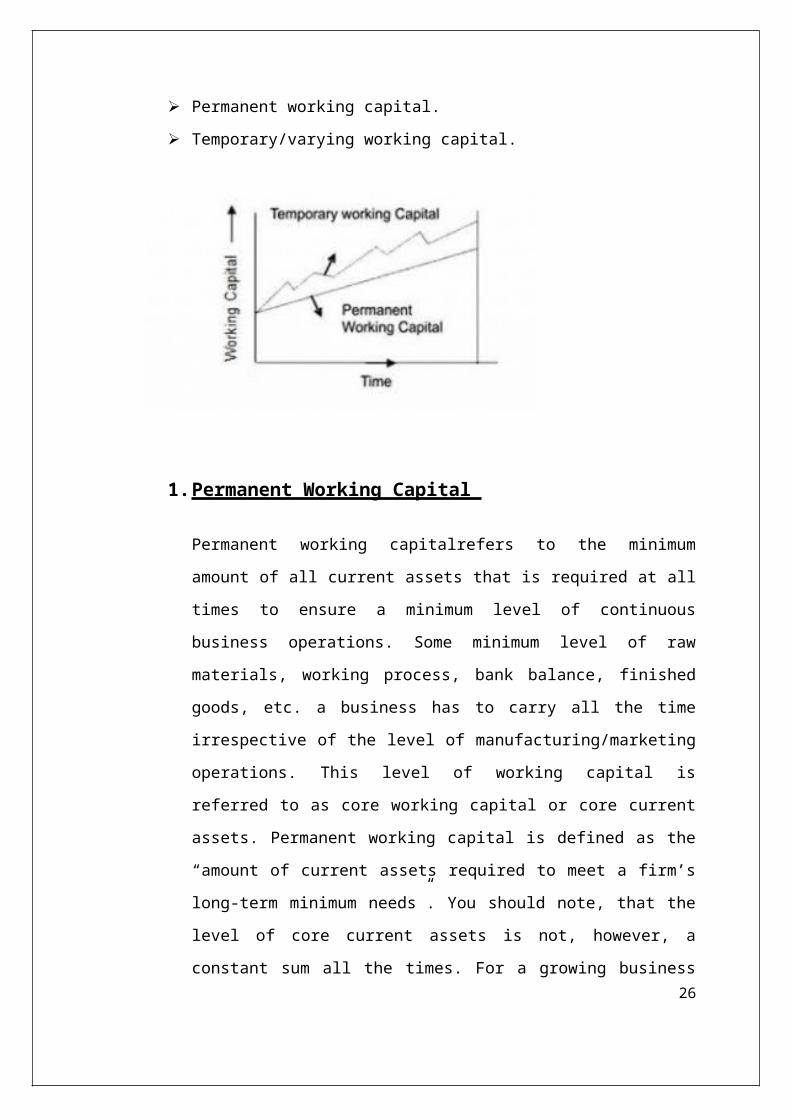
Permanent working capital.
Temporary/varying working capital.
1.Permanent Working Capital
Permanent working capitalrefers to the minimum
amount of all current assets that is required at all
times to ensure a minimum level of continuous
business operations. Some minimum level of raw
materials, working process, bank balance, finished
goods, etc. a business has to carry all the time
irrespective of the level of manufacturing/marketing
operations. This level of working capital is
referred to as core working capital or core current
assets. Permanent working capital is defined as the
“amount of current assets required to meet a firm’s
long-term minimum needs”. You should note, that the
level of core current assets is not, however, a
constant sum all the times. For a growing business26
the permanent working capital will be rising, for a
declining business it will be decreasing and for a
stable business it will be remaining more, or
lessstay-put. So permanent working capital
perennially needs one though not fixed in volume.
This part of the working capital being a permanent
investment needs to be financed through long-term
funds.Depending upon the changes inthe production
and sales, the need for working capital, over and
above the permanent working capital, will fluctuate.
Initial Working Capital :In the initial period ofits operation, a firm must need enough money to pay
certain expenses before the business profits. In the
initial years the banks may not funding loans or
overdrafts, sales may have to be made on credit and
it may be necessary to pay the creditors
immediately. Therefore the owners themselves have to
provide the necessary funds in the initial period,
which may be known as initial working capital.
Regular Working Capital : The firm is always
required to keep certain funds with it to continue
the regular business operations, which is called as
Regular Working Capital. It is required to maintain
regular stock of raw materials and work-in-progress
and also of the finished goods, which must be
maintained permanently at a definite level. Regular
27
working capital is the excess of current assets over
current liabilities. It ensures smooth operation of
business.
2.Temporary or Variable Working Capital
Temporary or variable working capitalvaries with the
volume of operations. If fluctuates with scale of
operations. This is the additional working capital
required during up sessions over the above the fixed
working capital. During seasons more production/sales
takeplace, resulting in larger working capital needs.
The reverse is true during off-seasons. As seasons
alternate, temporary working capital moves up and down
like tides. Temporary working capital is defined as the
“amount of current assets that varies with seasonal
requirements”. Temporary working capital can be
financed through short term funds, i.e. current
liabilities. When the level of temporary working
capital moved up, the business might use short-term
funds and when the level of temporary working capital
recedes, the business might retire its short term
loans.
Seasonal Working Capital :Some business
operations require additional working capital during
a particular season. For example, the groundnut oil
producers may have to purchase groundnut in a
28
particular season and have to employ additional
labor for that purpose. These may require additional
funds for a temporary period, which may be called as
seasonal working capital.
Special Working Capital: In all enterprises,
some unforeseen events do occur like a sudden
increase in demand, downward movement of prices of
raw materials, strike, or natural calamities, when
extra funds are needed to tide over such situation.
Such type of extra funds is called as Special
working capital.
Importance of working capital
Working capital is one of the important measurements of
the financial position. The words of H. G. Guthmann
clearly explain the importance of working capital.
“Working Capital is the lifeblood and the nerve center of
the business.” The object of working capital management
is to manage firm’s current assets and liabilities in
such a way that a satisfactory level of working capital
is maintained. If the firm cannot maintain a satisfactory
level of working capital, it is likely to become
insolvent andmay even be forced into insolvency. Thus,
the need for working capital to run day-to-day business
activities smoothly can’t be overstated.
Requirements of working capital
29
There are no set rules or formula to determine the
working capital requirements of the firms. A large number
of factors influence the working capital need of the
firms. All factors are of different importance and also
an important change for the firm over time. Therefore, an
analysis of the relevant factors should be made in order
to determine the total investment in working capital.
Generally the following factors influence the working
capital requirements of the firm:
• Nature and size of the business
• Seasonal fluctuations
• Production policy
• Taxation
• Depreciation policy
• Reserve policy
• Dividend policy
• Credit policy:
• Growth and expansion
• Price level changes
• Operating efficiency
Sources of working capital
30
The financial manager is always interested in obtaining
the working capital at the right time at a reasonable
cost and at the best possible favorable terms. A part of
the working capital investment is a permanent investment
in fixed assets. These following are the various sources
of working capital:-Source of working capital divided
into two parts
Long - term
Short - term
Sources of long term working capital
Issues of share
Floating of debenture
Public deposit
Loans
Sources of short term working capital
Internal source
Depreciation
Taxation
Accrued expense
Ploughing back of profit
External source
Bank credit
Trade credit
Government assistance
Loan from Director
31
Security of employee
Need of working capital
The need for working capital arises due to the time gap
between production and realization of cash from sales.
Working capital is must for every business for purchasing
raw materials, semi-finished goods, stores & spares etc.
and the following purpose
To purchase raw material, spare parts and othercomponents.
To meet overhead expenses.
To hold finished and spare parts etc.
To pay selling and distributing expenses.
To repair& maintenance both machinery as well asfactory built.
To pay wages, salaries and other charges.
To helpful in maintaining uncertainties involved inbusiness fields.
Working capital management
Working capital management means management or
administrating of all aspects of working capital: current
assets and current liabilities.
In other word of Adam Smith; “working capital management
is concerned with the problems that arise in attempting
32
to manage the current assets, current liabilities and the
interrelationship that exist between them”
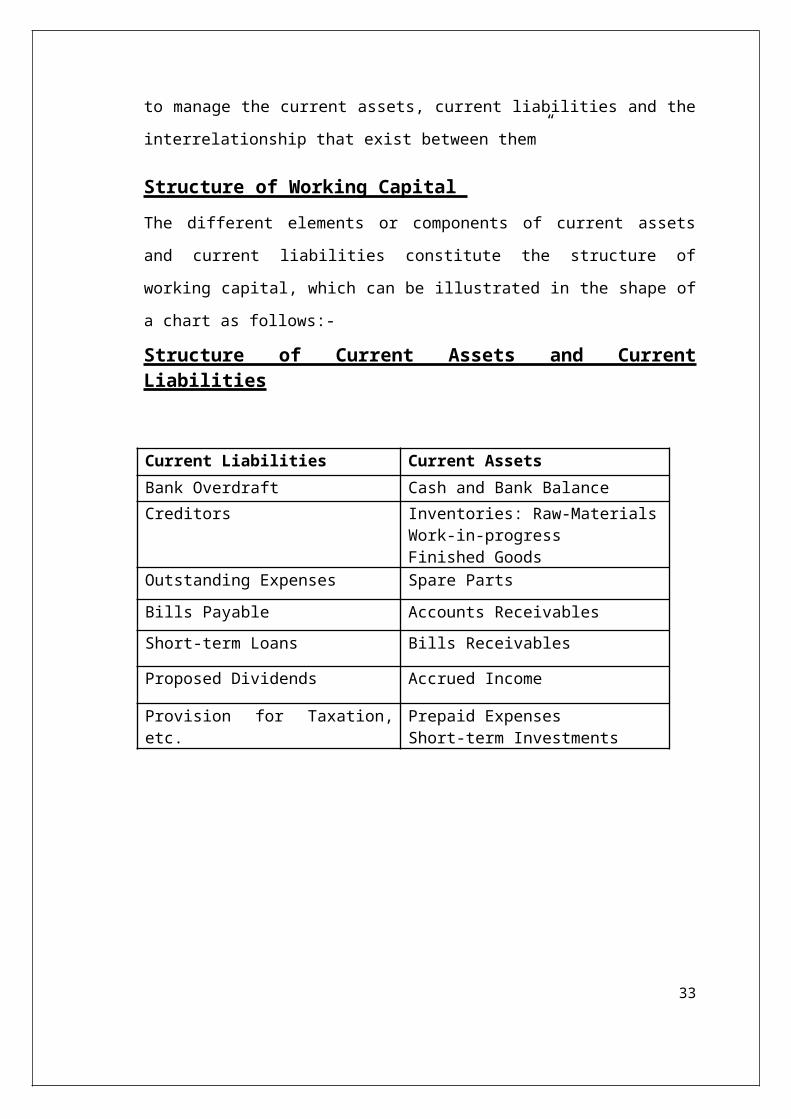
Structure of Working Capital The different elements or components of current assets
and current liabilities constitute the structure of
working capital, which can be illustrated in the shape of
a chart as follows:-
Structure of Current Assets and CurrentLiabilities
Current Liabilities Current AssetsBank Overdraft Cash and Bank BalanceCreditors Inventories: Raw-Materials
Work-in-progressFinished Goods
Outstanding Expenses Spare PartsBills Payable Accounts ReceivablesShort-term Loans Bills Receivables
Proposed Dividends Accrued Income
Provision for Taxation,etc.
Prepaid ExpensesShort-term Investments
33

CHAPTER – 3OBJECTIVE, SCOPE
AND
METHODOLOGY
Need of the Study
34
The need of the study is the important part of the
project. My purpose of doing this study is to find out
the cause of shortage of working capital. Working capital
is the lifeblood and the nerve center of business.
Working capital is very essential to maintain the smooth
running of a business. No business can run successfully
without an adequate amount of working capital. How the
business retain their market share as well as the
goodwill of the company. So that company has to maintain
its cash to run the business and accomplishing their day
to day expenses.
Objective of the study
To study the Working Capital position of Marathon
Electric India Pvt. Ltd.
To study the movement of Working Capital components
( Inventory, Creditor's, Debtor’s )
To evaluate the cash management performance in terms
( Size, Liquidity control ) of Marathon Electric
India Pvt. Ltd.
35
Scope of the study
The scope of study is identified after and during the
study is conducted. The main scope of the study was to
put into practical and theoretical aspect of the study
into real life work experience. The study of working
capital is based on tools like Ratio Analysis, Statement
of change in working capital. Further the study is based
on the last four years, i.e. 2009-2010 to 2012-2013
annual report of Marathon Electric India Pvt. Ltd.
36
INTRODUCTONThe research methodology is a way to systematically solve
the research problem. It may be understood as a science
of studying new research is done systematically. In that
various steps, those are generally adopted by a
researcher in studying his problem along with the logic
behind them.
The procedure by which a researchergoes about their work
of describing, explaining predicting phenomenon is called
methodology.
Research Design
37
A research design is an arrangement of condition for
collection at analysis of data in a manner that combines
relevance to the research purpose with the economy in the
process.
Process of Research
Formulating the objective of the study(What the study
is about and why it is being made)
Designing the method of data collection (What
technique of gathering data will be adopted)
Selecting the sample (How much material will be
needed)
Collecting the data (Where can be required data can
be found and with what time period should the data be
related)
Processing and analysis the data
Reporting and finding
Sampling Design
38
A sample design is a definite plan for obtaining a sample
from a given population. It refers to the technique or
the procedure adopted in selecting items for the sample.
The main constituents of the sampling design below-
Sampling unit
Sample size
Sampling unit
A sampling framework, i.e. developed roe the target
population that will be sampled, i.e. who is to be
surveyed
Sample unit taken by me – Financial statement of the
company
Sample size
It is the substantial portions of the largest population
that are sampled achieve reliable results.
Sample size – the last four years, i.e. 2009-2010 to
2012-2013 financial statements of the company.
A tool used for calculation – MS-Excel.
Data collection
The datahave been collected from two types-39
Primary data
Secondary data
Primary data
Primary data are the data which is collected from first
hand, for the first time which is original in nature.
Secondary data
Secondary data are those data which have already
collected and stored. Secondary data easily get those
secondary data from records annual reports of the
company, etc. It will save the time, money and to collect
the data.
The major source of data of this project was collected
through annual reports, profit and loss account of the
four year period of company, i.e. from 2009-2010 to 2012-
2013 and some more information collected from the
internet and text source.
Tools used for Analysis of data
The data were analyzed using the following tools. They
are-
Ratio Analysis.
40

Statement of changes in working capital.
41
CHAPTER – 4
DATA ANALYSIS
AND
INTERPRETATION
DATA ANALYIS AND INTERPRETATIONAn analysis of working capital will be very helpful for
knowing the operation efficiency of the company. The
following table provides data relating to the net working
capital of MIEPL.
(A) Net Working Capital = Current Assets –Current Liabilities
Table showing Net Working Capital
42
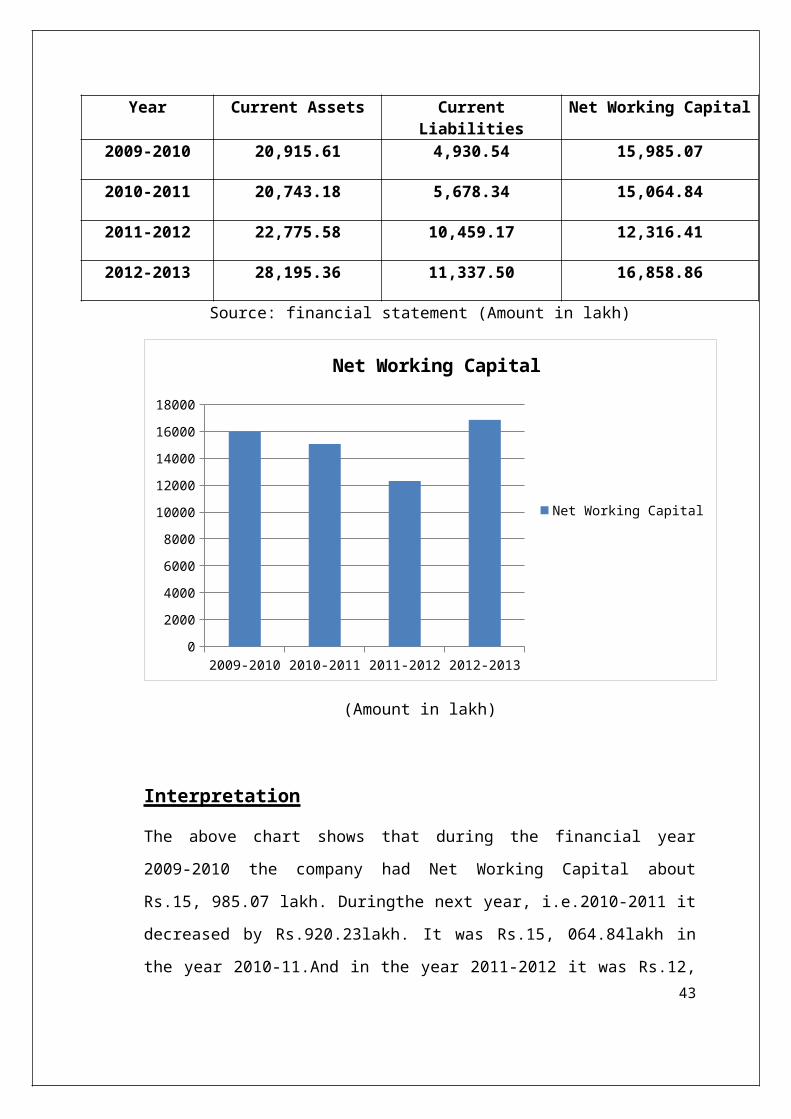
Year Current Assets CurrentLiabilities
Net Working Capital
2009-2010 20,915.61 4,930.54 15,985.07
2010-2011 20,743.18 5,678.34 15,064.84
2011-2012 22,775.58 10,459.17 12,316.41
2012-2013 28,195.36 11,337.50 16,858.86
Source: financial statement (Amount in lakh)
2009-2010 2010-2011 2011-2012 2012-20130
200040006000800010000120001400016000
18000
Net Working Capital
Net Working Capital
(Amount in lakh)
Interpretation
The above chart shows that during the financial year
2009-2010 the company had Net Working Capital about
Rs.15, 985.07 lakh. Duringthe next year, i.e.2010-2011 it
decreased by Rs.920.23lakh. It was Rs.15, 064.84lakh in
the year 2010-11.And in the year 2011-2012 it was Rs.12,43
316.41lakh which again decreased by Rs.2, 748.43 lakh as
compared to last year, i.e. 2011-1012. The above chart
interprets that the company iscontinuingdecrease in the
NWC till 2011-2012. But in the year 2012-2013it was
increased by Rs.4, 542.45 lakh. Duringthis year NWC was
about Rs.16, 858.86 lakh. This means that the company is
in a positive position in the year 2012-2013 and it
hassufficient capital to pay off its current liabilities.
(B) Ratio Analysis
Introduction
Ratio analysis is a powerful tool financial analysis.
Ratio analysis is a process of comparison of one figure
against another, which makes a ratio and the appraisal of
the ratios to make a proper analysis about the strengths
and weakness of the firm’s operations. The term ratio
refers to the numerical or quantitative relationship
between two accounting figures. Ratio analysis of
financial statement stands for the process of determining
and presenting the relationship of items and group of
items in the statements.
44
Types of Ratio Analysis
Liquidity Ratio
Turnover/Activity Ratio
1. Liquidity Ratios
Liquidity refers to the ability of a firm to meet its
current obligations as and when these become due. The
short term obligations are met by realizing amounts of
current, floating, or circulating assets.
Following are the ratios which can help to assess the
ability of a firm to meet its current liabilities
1. Current Ratio
2. Acid Test Ratio /Quick Ratio / Liquidity
Ratio
3. Absolute Liquidity Ratio
2. Turnover / Activity Ratios
These are the ratios which indicate the speed with
which assets are converted or turned over into sales.
1. Inventory Turnover Ratio
2. Debtors/Account receivable Turnover Ratio
3. Creditors/Account payable Turnover Ratio
4. Working Capital Turnover Ratio
45
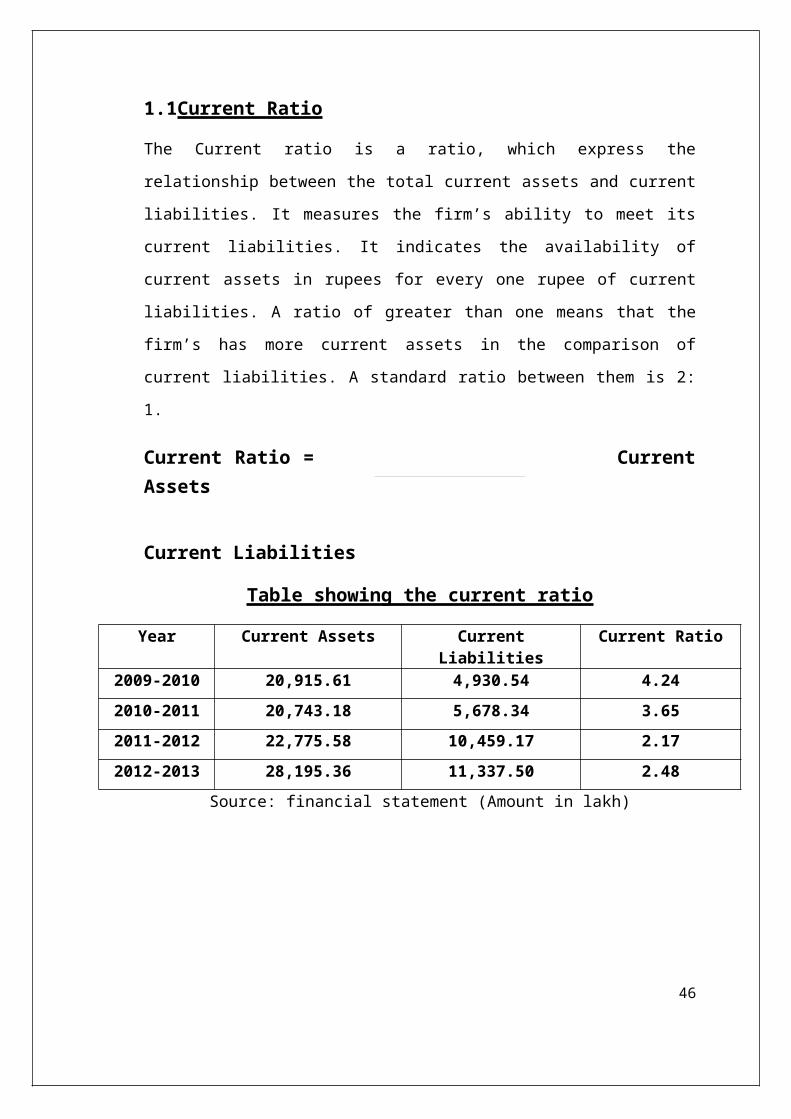
1.1Current Ratio
The Current ratio is a ratio, which express the
relationship between the total current assets and current
liabilities. It measures the firm’s ability to meet its
current liabilities. It indicates the availability of
current assets in rupees for every one rupee of current
liabilities. A ratio of greater than one means that the
firm’s has more current assets in the comparison of
current liabilities. A standard ratio between them is 2:
1.
Current Ratio = CurrentAssets
Current Liabilities
Table showing the current ratio
Year Current Assets CurrentLiabilities
Current Ratio
2009-2010 20,915.61 4,930.54 4.242010-2011 20,743.18 5,678.34 3.652011-2012 22,775.58 10,459.17 2.172012-2013 28,195.36 11,337.50 2.48
Source: financial statement (Amount in lakh)
46
2009-2010 2010-2011 2011-2012 2012-20130
0.51
1.52
2.53
3.54
4.5
Current Ratio
Current Ratio
(Amount in lakh)
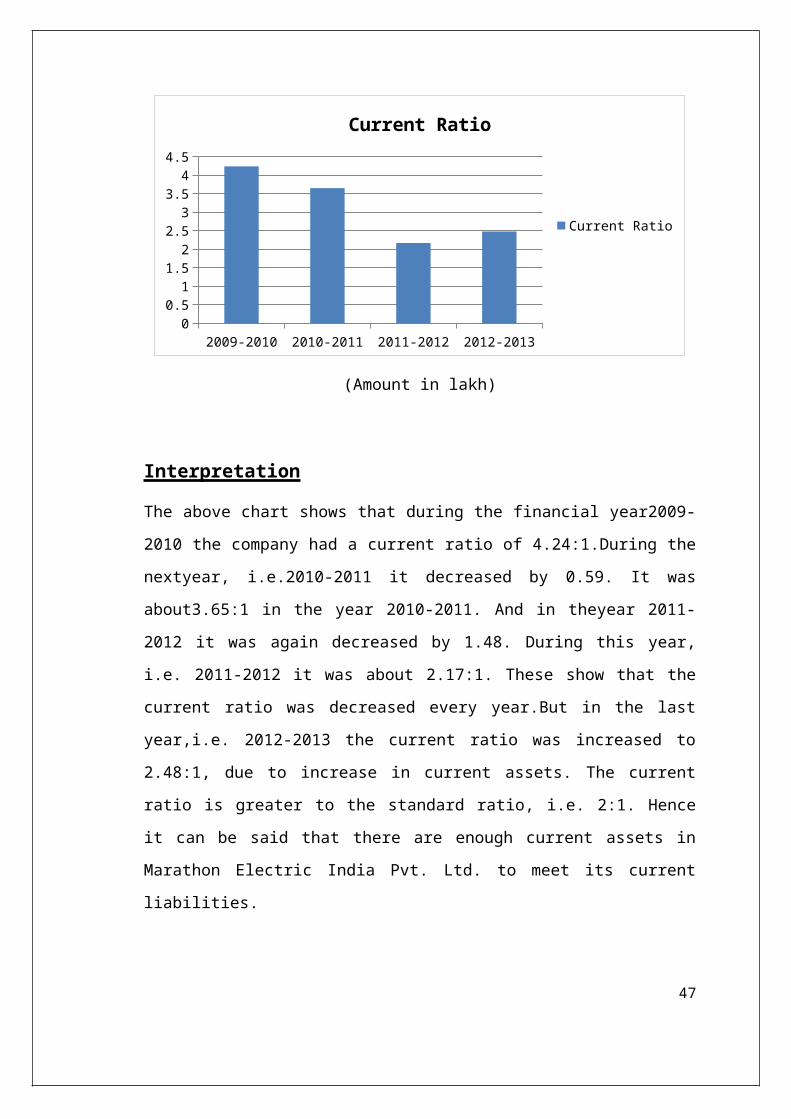
Interpretation
The above chart shows that during the financial year2009-
2010 the company had a current ratio of 4.24:1.During the
nextyear, i.e.2010-2011 it decreased by 0.59. It was
about3.65:1 in the year 2010-2011. And in theyear 2011-
2012 it was again decreased by 1.48. During this year,
i.e. 2011-2012 it was about 2.17:1. These show that the
current ratio was decreased every year.But in the last
year,i.e. 2012-2013 the current ratio was increased to
2.48:1, due to increase in current assets. The current
ratio is greater to the standard ratio, i.e. 2:1. Hence
it can be said that there are enough current assets in
Marathon Electric India Pvt. Ltd. to meet its current
liabilities.
47
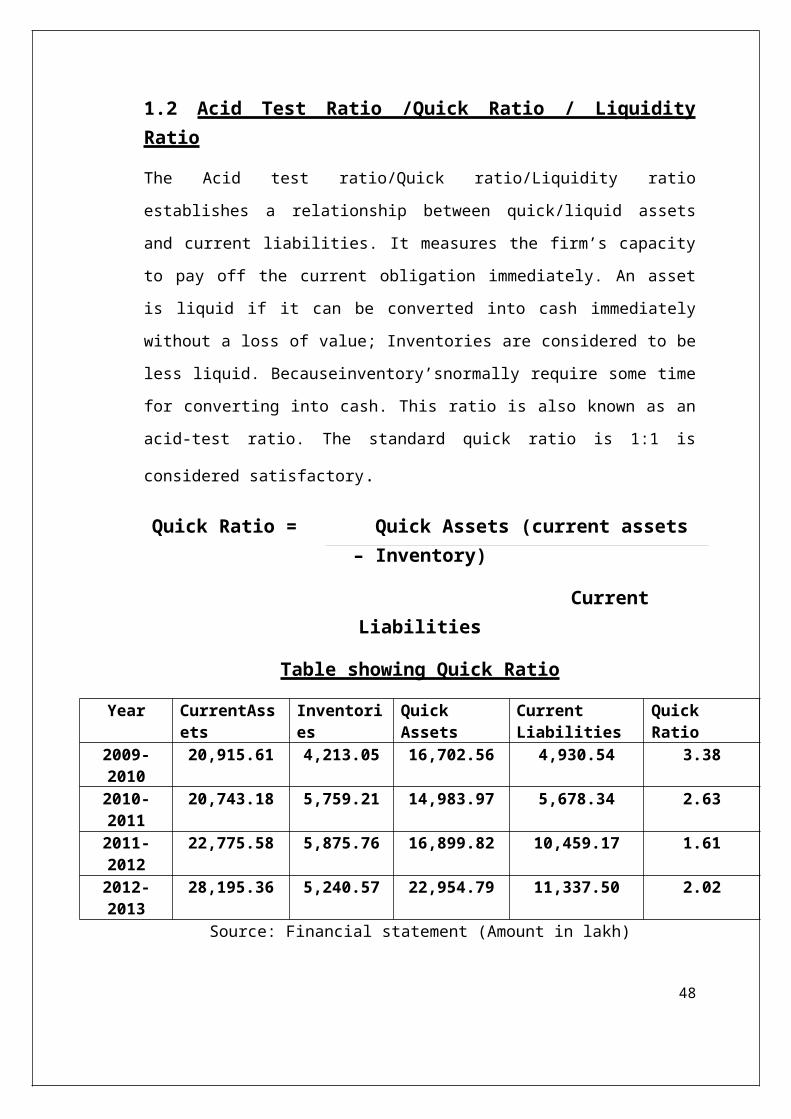
1.2 Acid Test Ratio /Quick Ratio / LiquidityRatio
The Acid test ratio/Quick ratio/Liquidity ratio
establishes a relationship between quick/liquid assets
and current liabilities. It measures the firm’s capacity
to pay off the current obligation immediately. An asset
is liquid if it can be converted into cash immediately
without a loss of value; Inventories are considered to be
less liquid. Becauseinventory’snormally require some time
for converting into cash. This ratio is also known as an
acid-test ratio. The standard quick ratio is 1:1 is
considered satisfactory.
Quick Ratio = Quick Assets (current assets– Inventory)
CurrentLiabilities
Table showing Quick Ratio
Year CurrentAssets
Inventories
Quick Assets
Current Liabilities
Quick Ratio
2009-2010
20,915.61 4,213.05 16,702.56 4,930.54 3.38
2010-2011
20,743.18 5,759.21 14,983.97 5,678.34 2.63
2011-2012
22,775.58 5,875.76 16,899.82 10,459.17 1.61
2012-2013
28,195.36 5,240.57 22,954.79 11,337.50 2.02
Source: Financial statement (Amount in lakh)
48
2009-2010 2010-2011 2011-2012 2012-20130
0.51
1.52
2.53
3.54
Quick Ratio
Quick Ratio
(Amount in lakh)
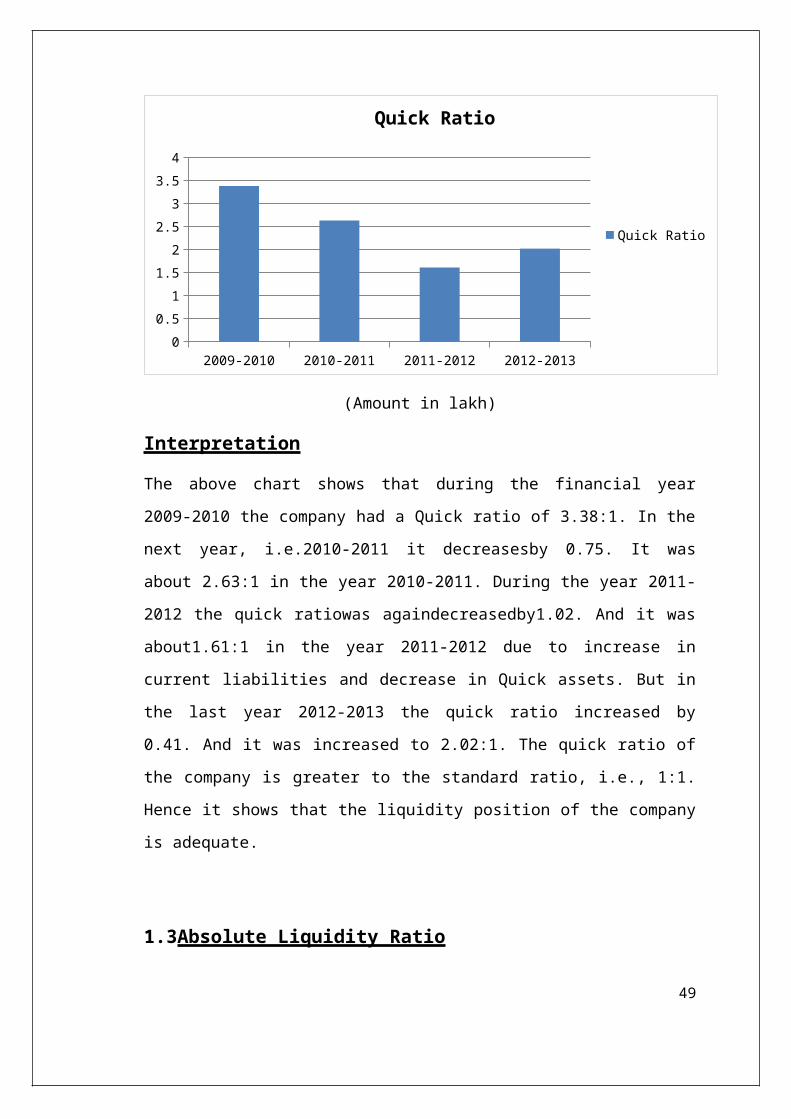
Interpretation
The above chart shows that during the financial year
2009-2010 the company had a Quick ratio of 3.38:1. In the
next year, i.e.2010-2011 it decreasesby 0.75. It was
about 2.63:1 in the year 2010-2011. During the year 2011-
2012 the quick ratiowas againdecreasedby1.02. And it was
about1.61:1 in the year 2011-2012 due to increase in
current liabilities and decrease in Quick assets. But in
the last year 2012-2013 the quick ratio increased by
0.41. And it was increased to 2.02:1. The quick ratio of
the company is greater to the standard ratio, i.e., 1:1.
Hence it shows that the liquidity position of the company
is adequate.
1.3Absolute Liquidity Ratio
49
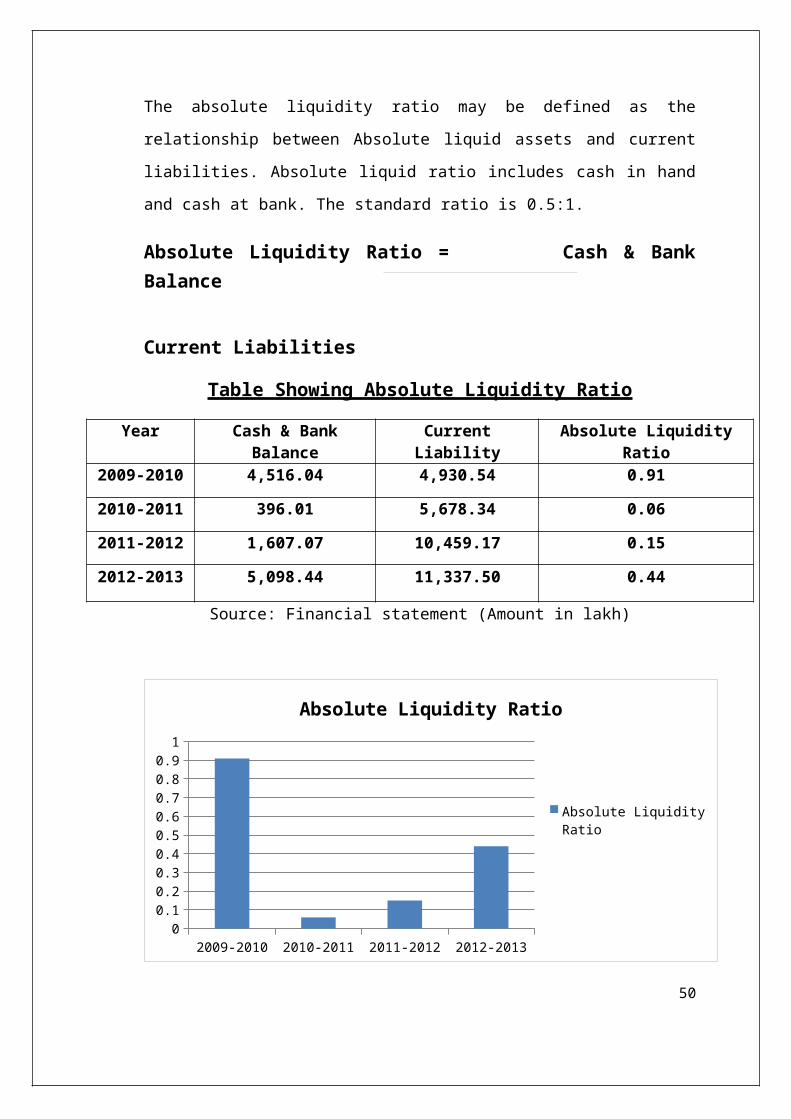
The absolute liquidity ratio may be defined as the
relationship between Absolute liquid assets and current
liabilities. Absolute liquid ratio includes cash in hand
and cash at bank. The standard ratio is 0.5:1.
Absolute Liquidity Ratio = Cash & BankBalance
Current Liabilities
Table Showing Absolute Liquidity Ratio
Year Cash & BankBalance
CurrentLiability
Absolute LiquidityRatio
2009-2010 4,516.04 4,930.54 0.91
2010-2011 396.01 5,678.34 0.06
2011-2012 1,607.07 10,459.17 0.15
2012-2013 5,098.44 11,337.50 0.44
Source: Financial statement (Amount in lakh)
2009-2010 2010-2011 2011-2012 2012-20130
0.10.20.30.40.50.60.70.80.91
Absolute Liquidity Ratio
Absolute Liquidity Ratio
50
(Amount in lakh)
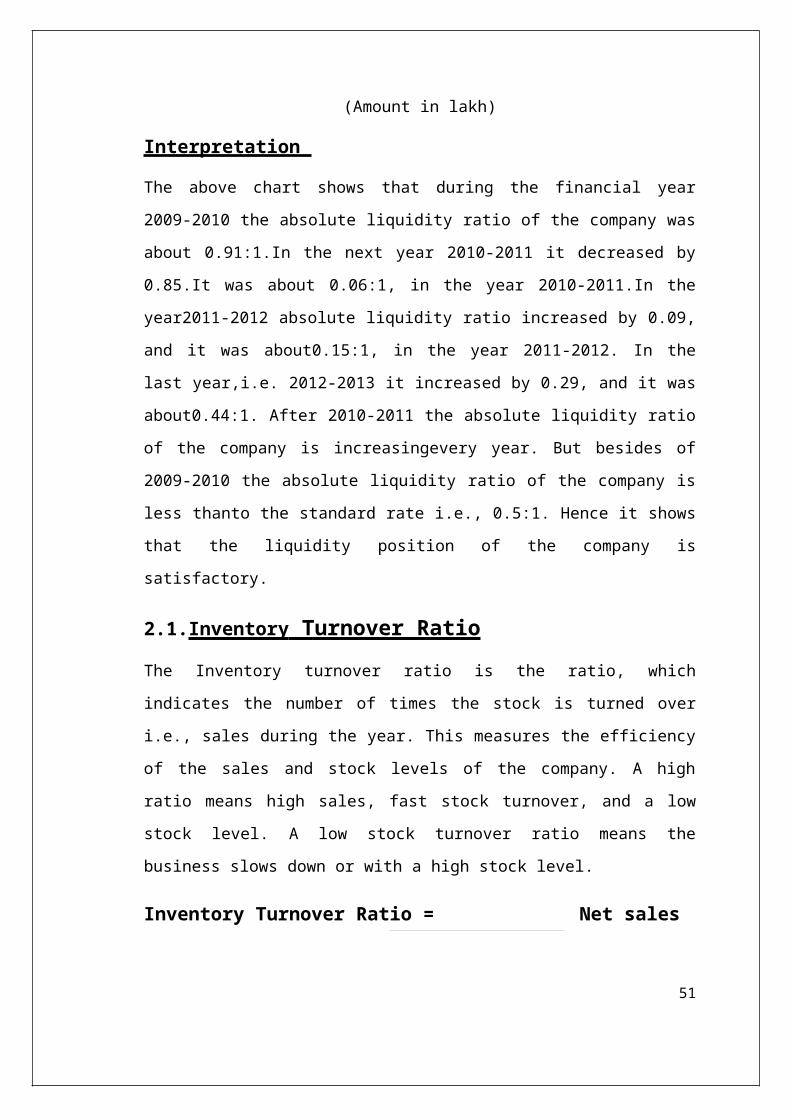
Interpretation
The above chart shows that during the financial year
2009-2010 the absolute liquidity ratio of the company was
about 0.91:1.In the next year 2010-2011 it decreased by
0.85.It was about 0.06:1, in the year 2010-2011.In the
year2011-2012 absolute liquidity ratio increased by 0.09,
and it was about0.15:1, in the year 2011-2012. In the
last year,i.e. 2012-2013 it increased by 0.29, and it was
about0.44:1. After 2010-2011 the absolute liquidity ratio
of the company is increasingevery year. But besides of
2009-2010 the absolute liquidity ratio of the company is
less thanto the standard rate i.e., 0.5:1. Hence it shows
that the liquidity position of the company is
satisfactory.
2.1.Inventory Turnover Ratio
The Inventory turnover ratio is the ratio, which
indicates the number of times the stock is turned over
i.e., sales during the year. This measures the efficiency
of the sales and stock levels of the company. A high
ratio means high sales, fast stock turnover, and a low
stock level. A low stock turnover ratio means the
business slows down or with a high stock level.
Inventory Turnover Ratio = Net sales
51
Closing Inventory
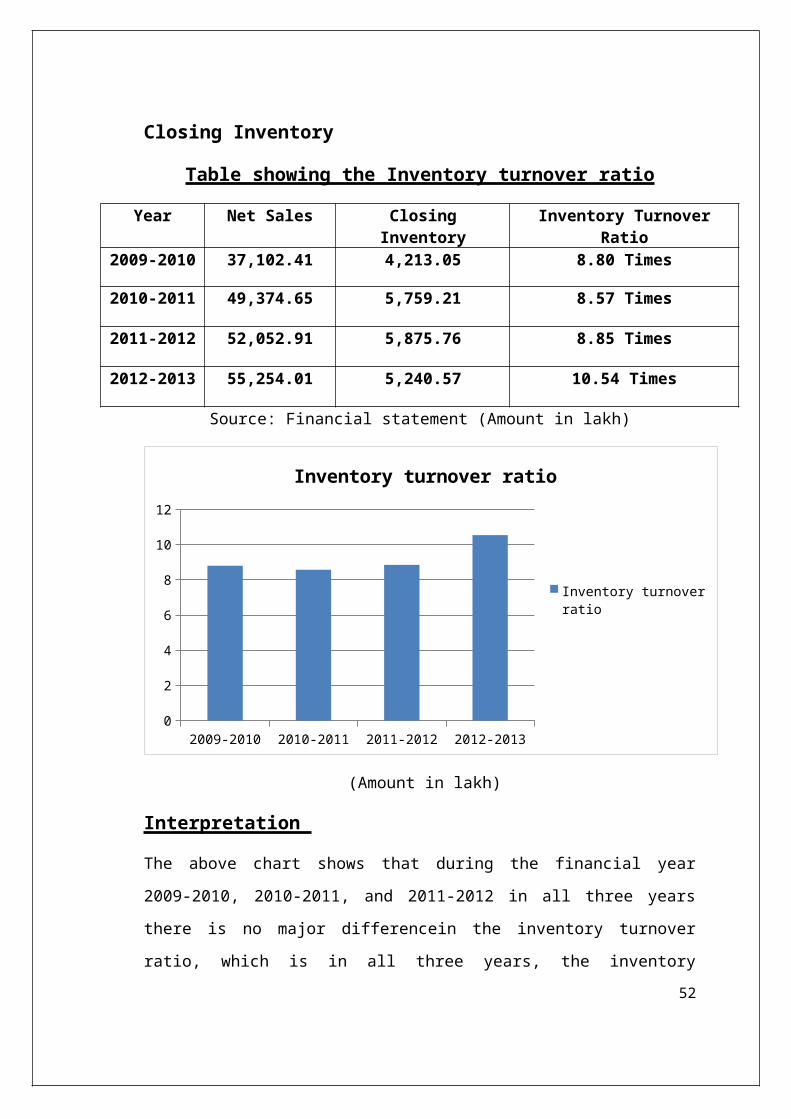
Table showing the Inventory turnover ratio
Year Net Sales ClosingInventory
Inventory TurnoverRatio
2009-2010 37,102.41 4,213.05 8.80 Times
2010-2011 49,374.65 5,759.21 8.57 Times
2011-2012 52,052.91 5,875.76 8.85 Times
2012-2013 55,254.01 5,240.57 10.54 Times
Source: Financial statement (Amount in lakh)
2009-2010 2010-2011 2011-2012 2012-20130
2
4
6
8
10
12
Inventory turnover ratio
Inventory turnover ratio
(Amount in lakh)
Interpretation
The above chart shows that during the financial year
2009-2010, 2010-2011, and 2011-2012 in all three years
there is no major differencein the inventory turnover
ratio, which is in all three years, the inventory52
turnover ratio was about 8.80 times,8.57 times, and 8.85
times, respectively.But in the last year, i.e. 2012-2013
it increased by 1.69 times as compared to the previous
year, i.e. 2011-2012. And it was about 10.54 times in the
year 2012-2013. It shows that in all three years the
company had general sales, but in the last year 2012-2013
the company increased in its sales as compared to last
three previous years i.e. 2009-2010, 2010-2011, and 2011-
2012.
2.2 Debtors/Account receivable Turnover Ratio
The Debtors/Account receivable turnover ratio indicates
the speed of debt collection of the firm. This ratio
computes the number of times debtors (receivables) has
been turned over during the particular period.
Debtors Turnover Ratio = Net sales
Average Debtors
Note: In MEIPL, we have taken the total net sales
instead of the credit sales, because the credit sales
information has not available for the calculation of
Debtors Turnover Ratio.
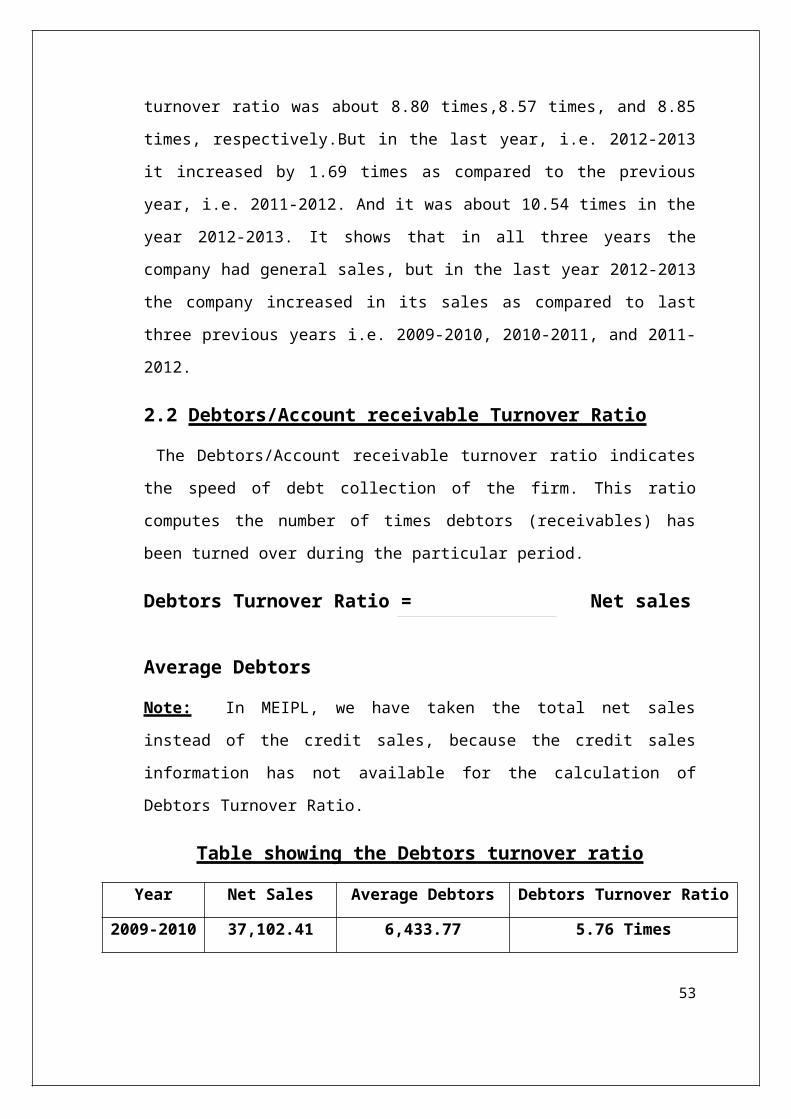
Table showing the Debtors turnover ratio
Year Net Sales Average Debtors Debtors Turnover Ratio
2009-2010 37,102.41 6,433.77 5.76 Times
53
2010-2011 49,374.65 7,653.72 6.45 Times
2011-2012 52,052.91 8,461.06 6.15 Times
2012-2013 55,254.01 10,904.96 5.06 Times
Source: Financial statement (Amount in lakh)
2009-2010 2010-2011 2011-2012 2012-20130
1
2
3
4
5
6
7
Debtors turnover ratio
Debtors turnover ratio
(Amount in lakh)
Interpretation
The above chart shows that the debtor turnover ratio is
fluctuating over the years. It was about 5.76 times in
the year 2009-2010. It increased by 0.69 times in the
year 2010-2011. It was about 6.45 times in the year 2010-
2011. But in the year 2011-2012 it was decreased by0.30
times, and it was about 6.15 times in the year 2011-2012.
During the next year, i.e. 2012-2013 it was 5.06 which
again decreased by 1.09 times as compared to the last
year i.e. 2011-2012. This graph is showing that the
company is not collecting debt rapidly.
54
2.3. Creditors/Account payable Turnover Ratio
The creditor’s turnover ratio is the ratio, which
indicates the number of times the debts are paid in the
year. This ratio is calculatedto be as follows:
Creditors Turnover Ratio = NetPurchases
Average Creditors
Note: In the MEIPL, we have taken the cost of materialsconsumed instead of credit purchases, because the credit
purchase information has not available for the
calculation of Creditors Turnover Ratio.
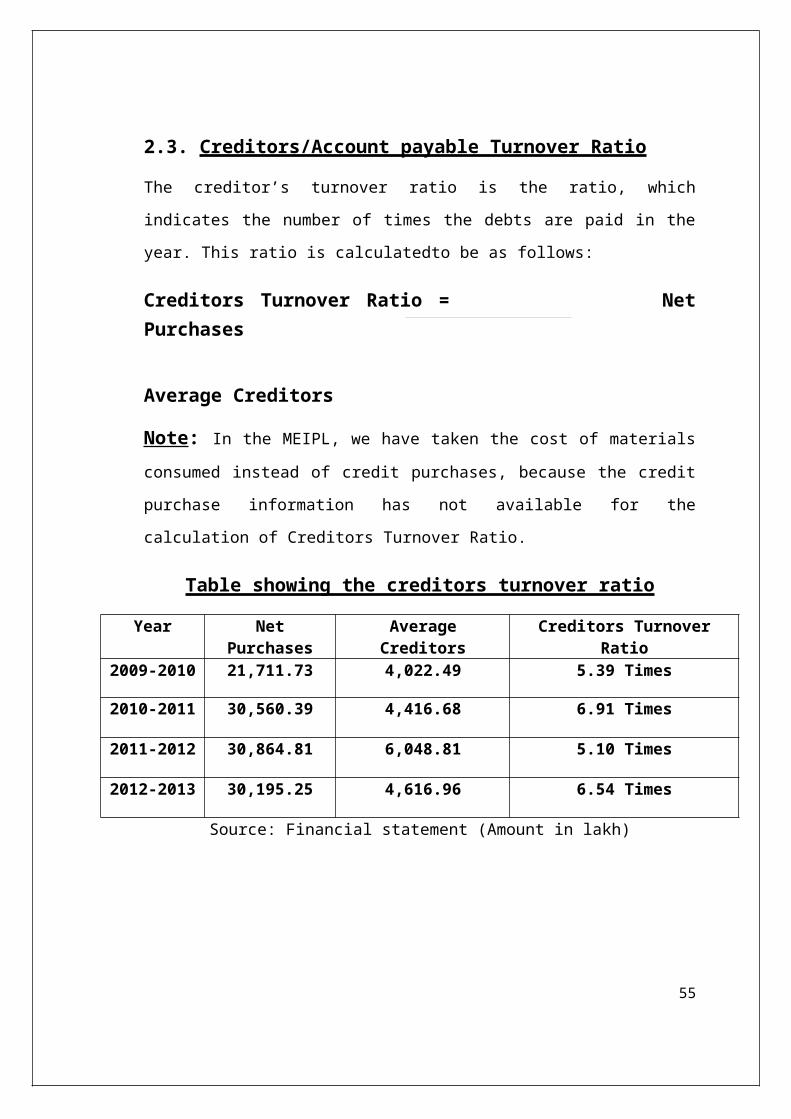
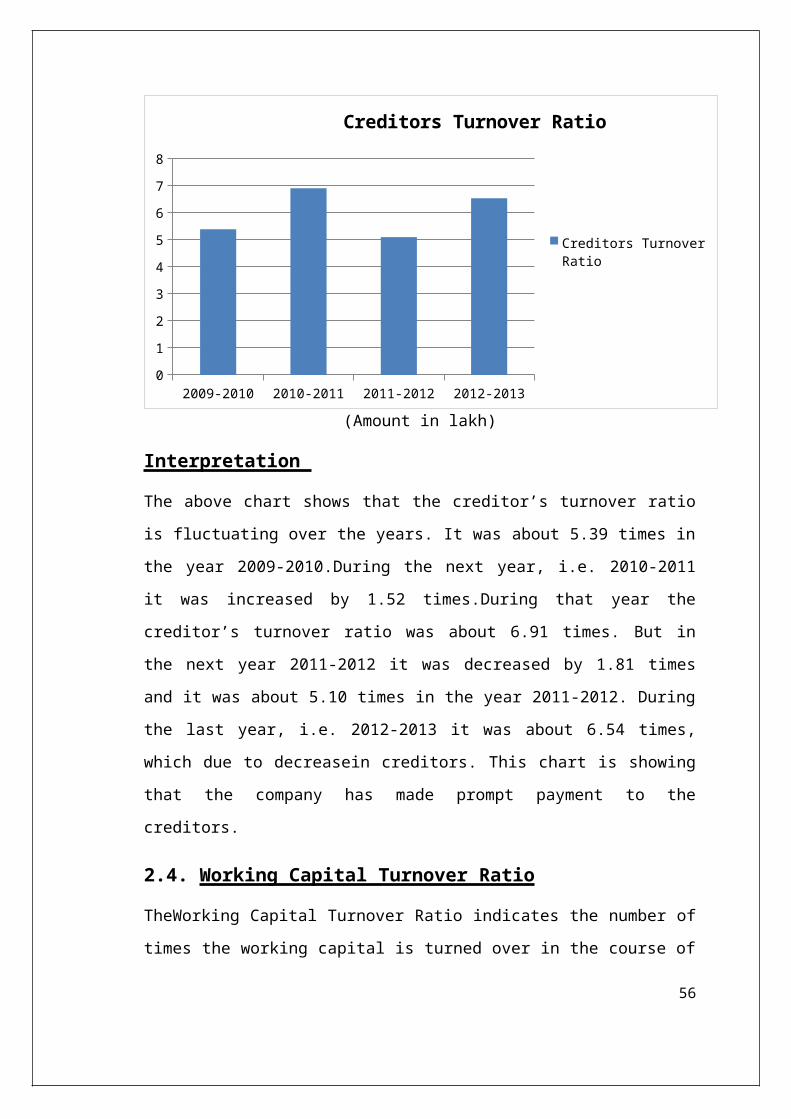
Table showing the creditors turnover ratio
Year NetPurchases
AverageCreditors
Creditors TurnoverRatio
2009-2010 21,711.73 4,022.49 5.39 Times
2010-2011 30,560.39 4,416.68 6.91 Times
2011-2012 30,864.81 6,048.81 5.10 Times
2012-2013 30,195.25 4,616.96 6.54 Times
Source: Financial statement (Amount in lakh)
55
2009-2010 2010-2011 2011-2012 2012-20130
1
2
3
4
5
6
7
8
Creditors Turnover Ratio
Creditors Turnover Ratio
(Amount in lakh)
Interpretation
The above chart shows that the creditor’s turnover ratio
is fluctuating over the years. It was about 5.39 times in
the year 2009-2010.During the next year, i.e. 2010-2011
it was increased by 1.52 times.During that year the
creditor’s turnover ratio was about 6.91 times. But in
the next year 2011-2012 it was decreased by 1.81 times
and it was about 5.10 times in the year 2011-2012. During
the last year, i.e. 2012-2013 it was about 6.54 times,
which due to decreasein creditors. This chart is showing
that the company has made prompt payment to the
creditors.
2.4. Working Capital Turnover Ratio
TheWorking Capital Turnover Ratio indicates the number of
times the working capital is turned over in the course of
56
the year. This ratio measures the efficiency with which
the working capital is used by the firm. A higher ratio,
efficient utilization of working capital and a low ratio
indicates inefficient utilization of the working capital.
But a very high working capital turnover ratio is not a
good situation for any company.
Working Capital Turnover Ratio =Net Sales
Net Working Capital
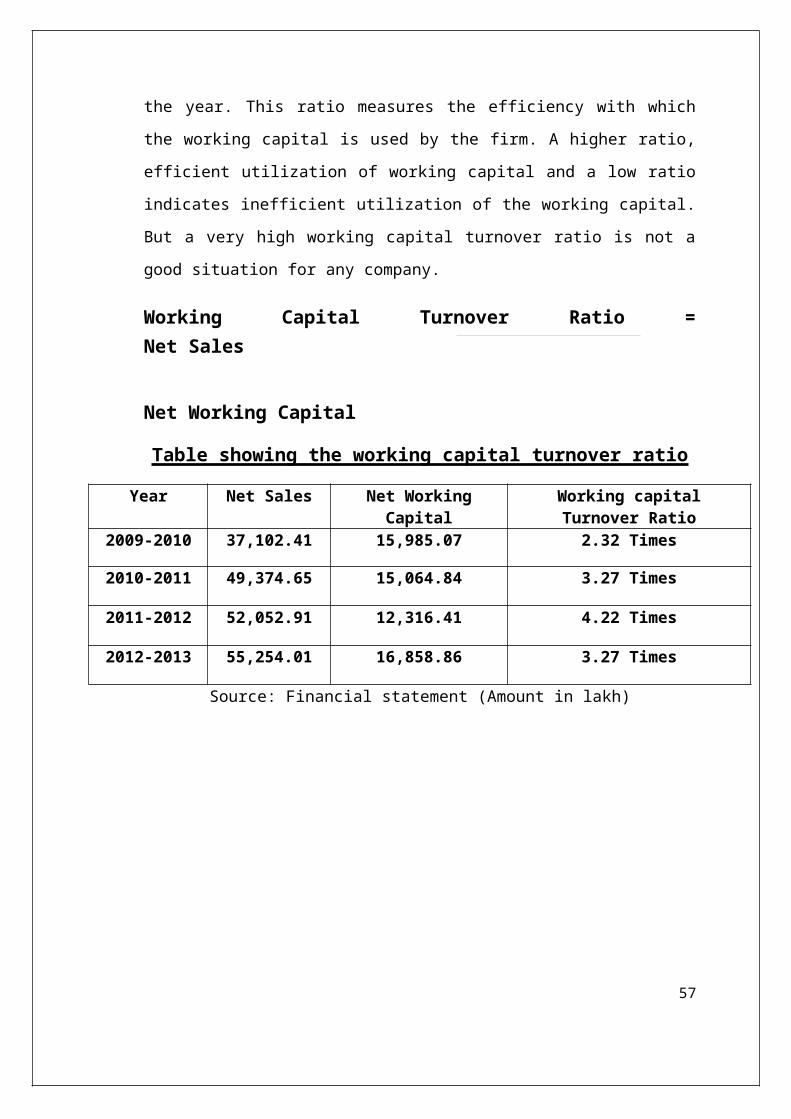
Table showing the working capital turnover ratio
Year Net Sales Net WorkingCapital
Working capitalTurnover Ratio
2009-2010 37,102.41 15,985.07 2.32 Times
2010-2011 49,374.65 15,064.84 3.27 Times
2011-2012 52,052.91 12,316.41 4.22 Times
2012-2013 55,254.01 16,858.86 3.27 Times
Source: Financial statement (Amount in lakh)
57
2009-2010 2010-2011 2011-2012 2012-20130
0.51
1.52
2.53
3.54
4.5
Working Capital Turnover Ratio
Working Capital Turnover Ratio
(Amount in lakh)
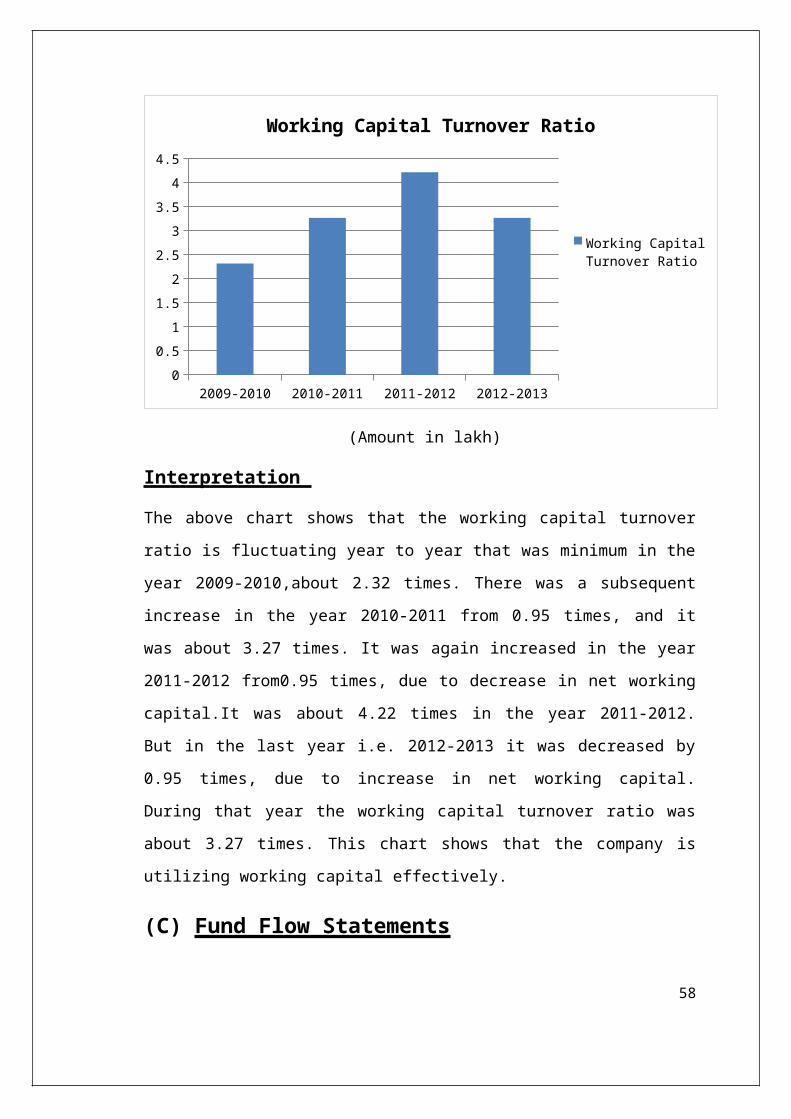
Interpretation
The above chart shows that the working capital turnover
ratio is fluctuating year to year that was minimum in the
year 2009-2010,about 2.32 times. There was a subsequent
increase in the year 2010-2011 from 0.95 times, and it
was about 3.27 times. It was again increased in the year
2011-2012 from0.95 times, due to decrease in net working
capital.It was about 4.22 times in the year 2011-2012.
But in the last year i.e. 2012-2013 it was decreased by
0.95 times, due to increase in net working capital.
During that year the working capital turnover ratio was
about 3.27 times. This chart shows that the company is
utilizing working capital effectively.
(C) Fund Flow Statements
58
Principles of working capital for calculating purposes
Current Assets
If the current assets increase as a result of this,
working capital also increases. If the current assets
decrease as a result of this, working capital also
decreases.
Current liabilities
If the current liabilities increase as a result of this,
working capital also decreases. If the current
liabilities decrease as a result of this, working capital
also increases.
Statement of Change in Working Capital:
The purpose of preparing this statement is for finding
out the increase or decrease in working capital and to
make a comparison between two financial years.
59
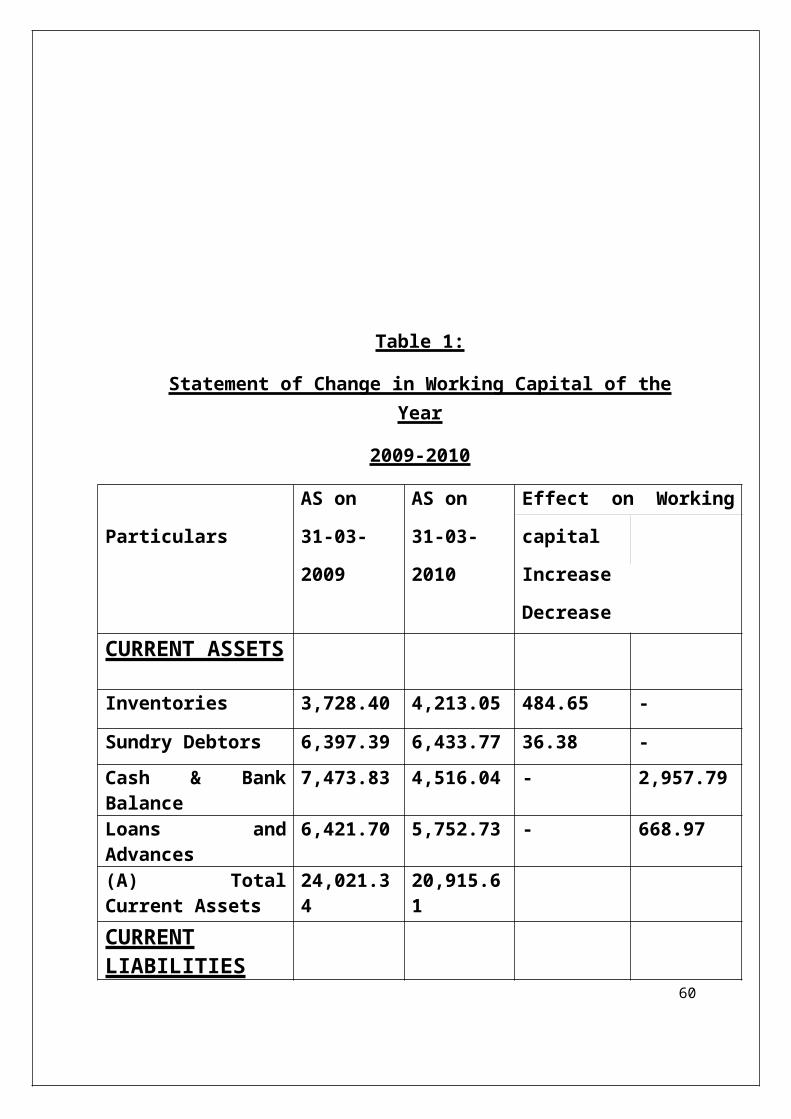
Table 1:
Statement of Change in Working Capital of theYear
2009-2010
Particulars
AS on
31-03-
2009
AS on
31-03-
2010
Effect on Working
capital
Increase
DecreaseCURRENT ASSETS
Inventories 3,728.40 4,213.05 484.65 -
Sundry Debtors 6,397.39 6,433.77 36.38 -Cash & BankBalance
7,473.83 4,516.04 - 2,957.79
Loans andAdvances
6,421.70 5,752.73 - 668.97
(A) TotalCurrent Assets
24,021.34
20,915.61
CURRENTLIABILITIES
60
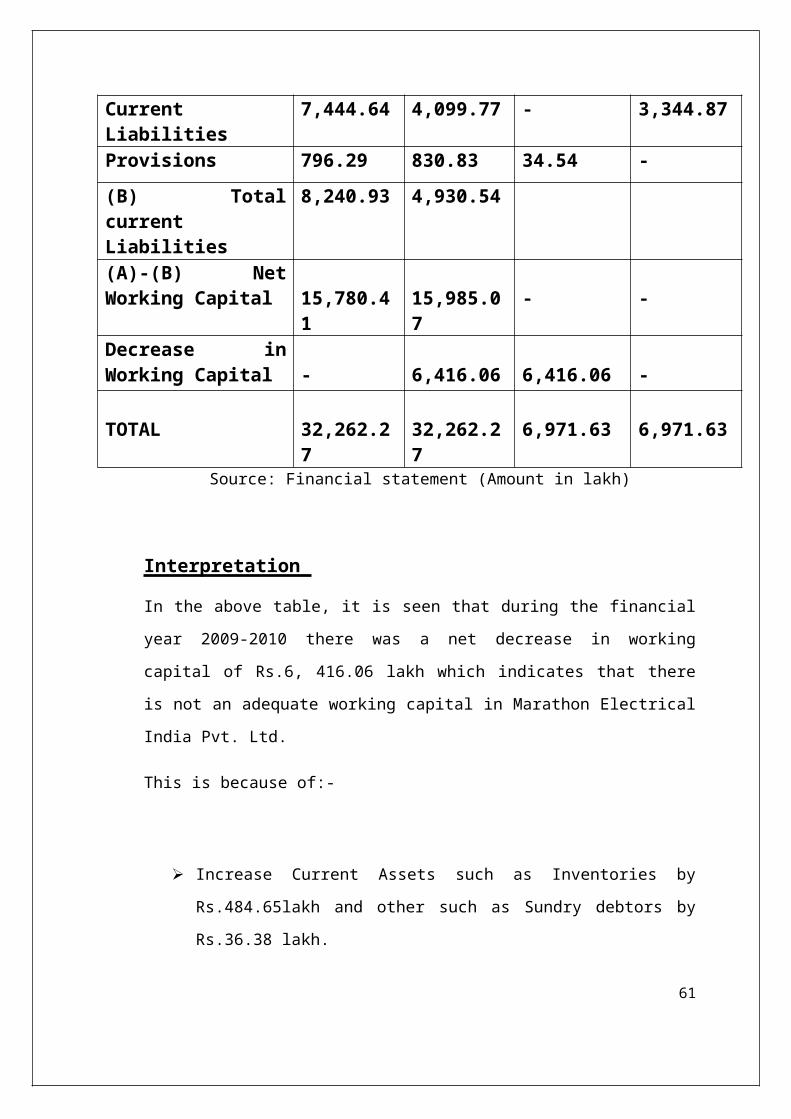
CurrentLiabilities
7,444.64 4,099.77 - 3,344.87
Provisions 796.29 830.83 34.54 -(B) TotalcurrentLiabilities
8,240.93 4,930.54
(A)-(B) NetWorking Capital 15,780.4
115,985.07
- -
Decrease inWorking Capital - 6,416.06 6,416.06 -
TOTAL 32,262.27
32,262.27
6,971.63 6,971.63
Source: Financial statement (Amount in lakh)
Interpretation
In the above table, it is seen that during the financial
year 2009-2010 there was a net decrease in working
capital of Rs.6, 416.06 lakh which indicates that there
is not an adequate working capital in Marathon Electrical
India Pvt. Ltd.
This is because of:-
Increase Current Assets such as Inventories by
Rs.484.65lakh and other such as Sundry debtors by
Rs.36.38 lakh.
61
Decrease in Cash & Bank Balance by Rs.2, 957.79
lakh. And other current assets such as Loans and
Advances by Rs.668.97 lakh.
Decrease in Current Liabilities by Rs.3, 344.87lakh.
Increase in provisions by Rs.34.54 lakh.
Table 2:
Statement of Change in Working Capital of theYear
2010-2011
62
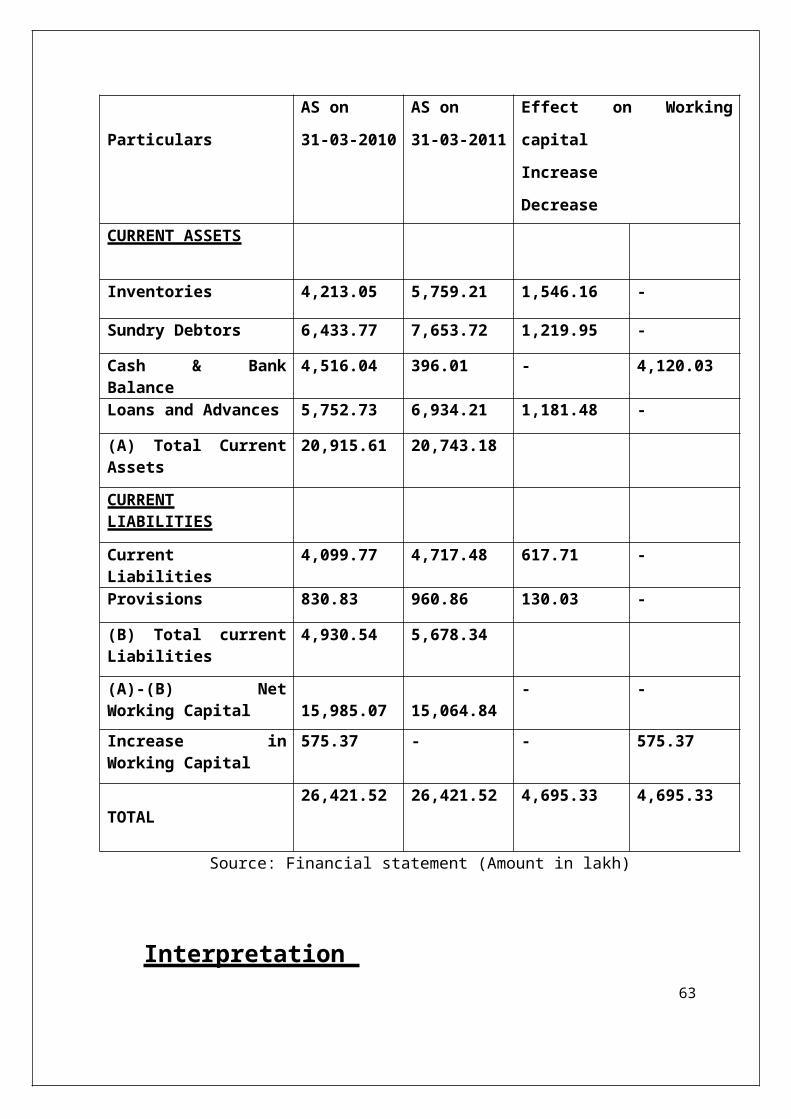
Particulars
AS on
31-03-2010
AS on
31-03-2011
Effect on Working
capital
Increase
DecreaseCURRENT ASSETS
Inventories 4,213.05 5,759.21 1,546.16 -
Sundry Debtors 6,433.77 7,653.72 1,219.95 -
Cash & BankBalance
4,516.04 396.01 - 4,120.03
Loans and Advances 5,752.73 6,934.21 1,181.48 -
(A) Total CurrentAssets
20,915.61 20,743.18
CURRENTLIABILITIES
CurrentLiabilities
4,099.77 4,717.48 617.71 -
Provisions 830.83 960.86 130.03 -
(B) Total currentLiabilities
4,930.54 5,678.34
(A)-(B) NetWorking Capital 15,985.07 15,064.84
- -
Increase inWorking Capital
575.37 - - 575.37
TOTAL26,421.52 26,421.52 4,695.33 4,695.33
Source: Financial statement (Amount in lakh)
Interpretation 63
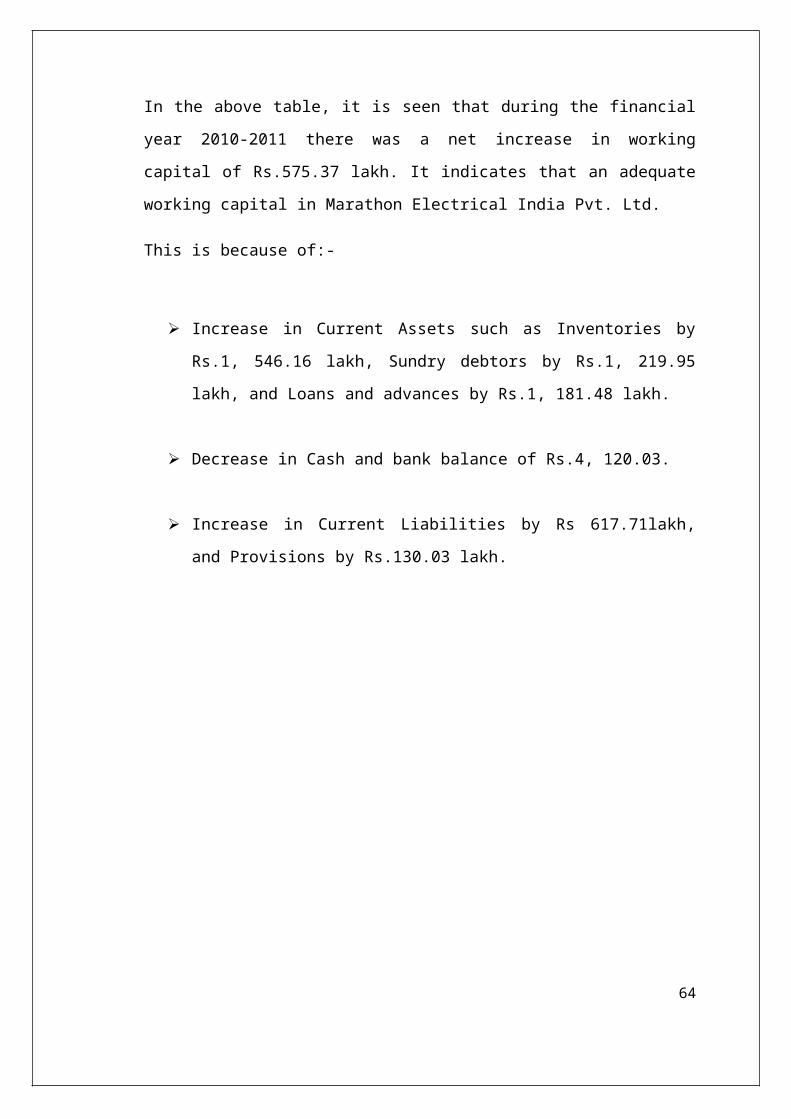
In the above table, it is seen that during the financial
year 2010-2011 there was a net increase in working
capital of Rs.575.37 lakh. It indicates that an adequate
working capital in Marathon Electrical India Pvt. Ltd.
This is because of:-
Increase in Current Assets such as Inventories by
Rs.1, 546.16 lakh, Sundry debtors by Rs.1, 219.95
lakh, and Loans and advances by Rs.1, 181.48 lakh.
Decrease in Cash and bank balance of Rs.4, 120.03.
Increase in Current Liabilities by Rs 617.71lakh,
and Provisions by Rs.130.03 lakh.
64
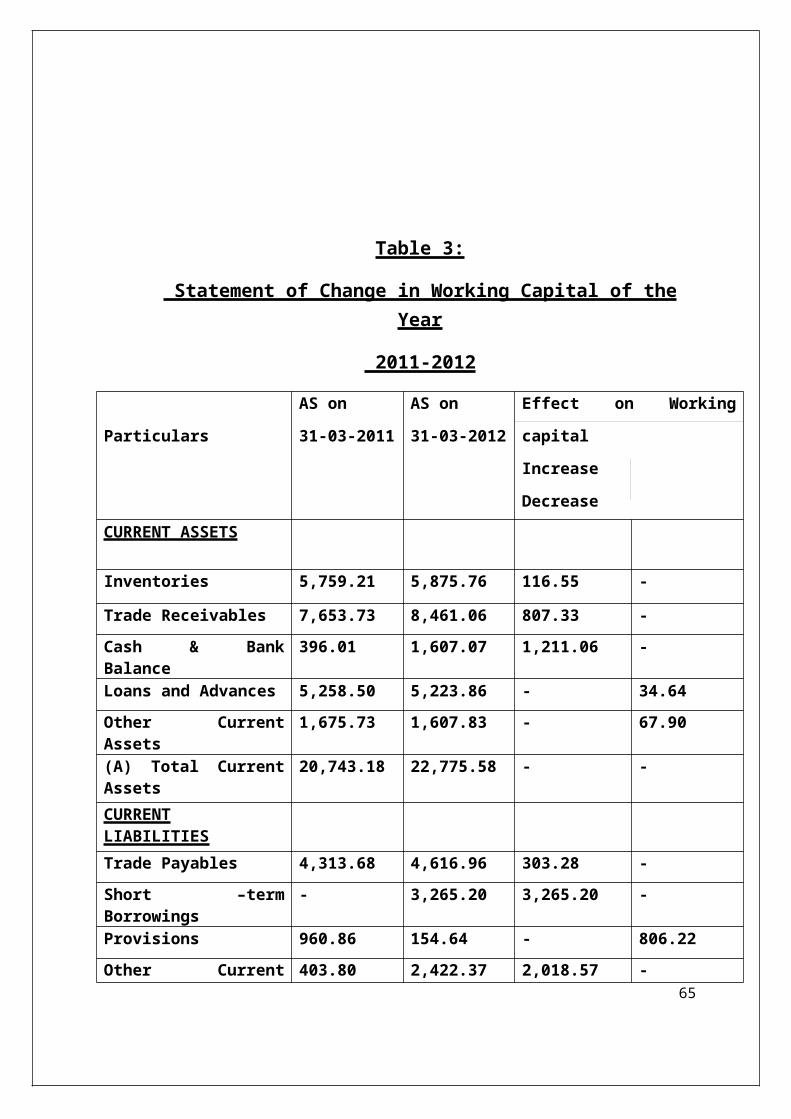
Table 3:
Statement of Change in Working Capital of theYear
2011-2012
Particulars
AS on
31-03-2011
AS on
31-03-2012
Effect on Working
capital
Increase
DecreaseCURRENT ASSETS
Inventories 5,759.21 5,875.76 116.55 -
Trade Receivables 7,653.73 8,461.06 807.33 -Cash & BankBalance
396.01 1,607.07 1,211.06 -
Loans and Advances 5,258.50 5,223.86 - 34.64Other CurrentAssets
1,675.73 1,607.83 - 67.90
(A) Total CurrentAssets
20,743.18 22,775.58 - -
CURRENTLIABILITIESTrade Payables 4,313.68 4,616.96 303.28 -Short –termBorrowings
- 3,265.20 3,265.20 -
Provisions 960.86 154.64 - 806.22Other Current 403.80 2,422.37 2,018.57 -
65
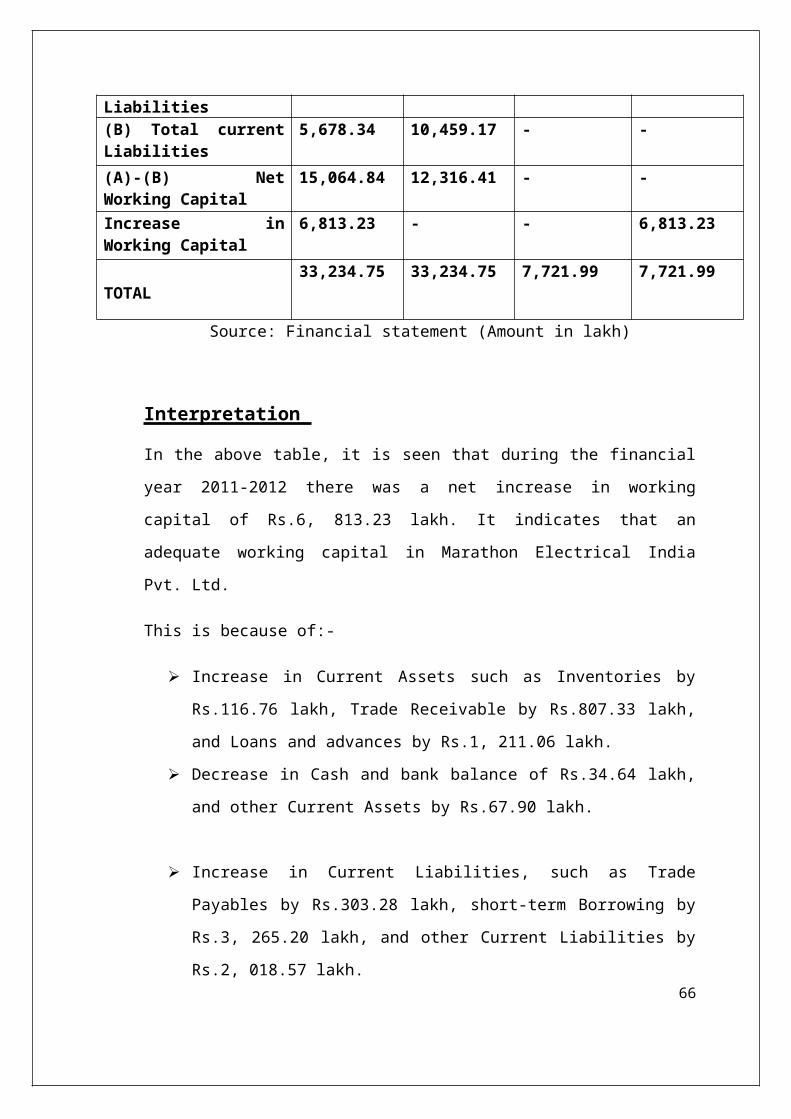
Liabilities(B) Total currentLiabilities
5,678.34 10,459.17 - -
(A)-(B) NetWorking Capital
15,064.84 12,316.41 - -
Increase inWorking Capital
6,813.23 - - 6,813.23
TOTAL33,234.75 33,234.75 7,721.99 7,721.99
Source: Financial statement (Amount in lakh)
Interpretation
In the above table, it is seen that during the financial
year 2011-2012 there was a net increase in working
capital of Rs.6, 813.23 lakh. It indicates that an
adequate working capital in Marathon Electrical India
Pvt. Ltd.
This is because of:-
Increase in Current Assets such as Inventories by
Rs.116.76 lakh, Trade Receivable by Rs.807.33 lakh,
and Loans and advances by Rs.1, 211.06 lakh.
Decrease in Cash and bank balance of Rs.34.64 lakh,
and other Current Assets by Rs.67.90 lakh.
Increase in Current Liabilities, such as Trade
Payables by Rs.303.28 lakh, short-term Borrowing by
Rs.3, 265.20 lakh, and other Current Liabilities by
Rs.2, 018.57 lakh.66
Decrease in Provisions by Rs.806.22 lakh.
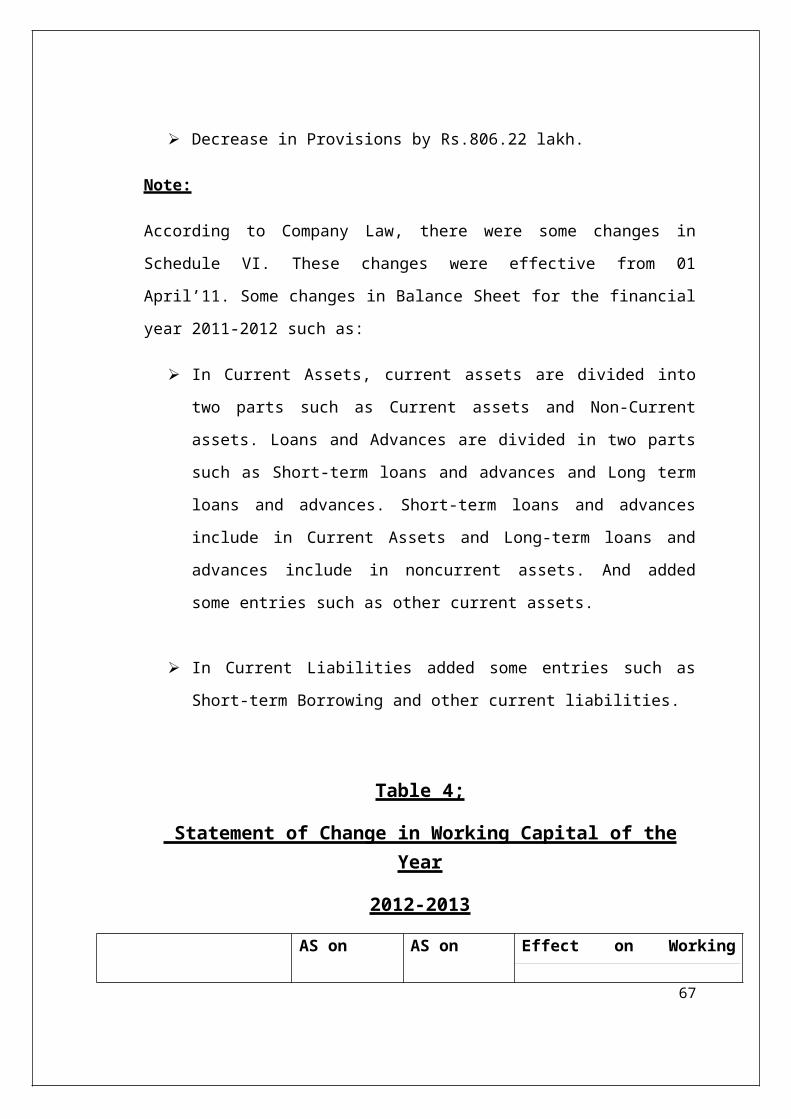
Note:
According to Company Law, there were some changes in
Schedule VI. These changes were effective from 01
April’11. Some changes in Balance Sheet for the financial
year 2011-2012 such as:
In Current Assets, current assets are divided into
two parts such as Current assets and Non-Current
assets. Loans and Advances are divided in two parts
such as Short-term loans and advances and Long term
loans and advances. Short-term loans and advances
include in Current Assets and Long-term loans and
advances include in noncurrent assets. And added
some entries such as other current assets.
In Current Liabilities added some entries such as
Short-term Borrowing and other current liabilities.
Table 4;
Statement of Change in Working Capital of theYear
2012-2013
AS on AS on Effect on Working
67
Particulars 31-03-2012 31-03-2013 capital
Increase
DecreaseCURRENT ASSETS
Inventories 5,875.76 5,240.57 - 635.19
Trade Receivables 8,461.06 10,904.96 2,443.90 -Cash & BankBalance
1,607.07 5,098.44 3,491.37 -
Loans and Advances 5,223.86 4,592.60 - 631.26Other CurrentAssets
1,607.83 2,358.79 750.96 -
(A) Total CurrentAssets
22,775.58 28,195.36 - -
CURRENTLIABILITIESTrade Payables 4,616.96 6,048.81 1,431.85 -Short –termBorrowings
3,265.20 3,530.58 265.38 -
Other CurrentLiabilities
2,422.37 1,521.16 - 901.21
Provisions 154.64 236.95 82.31 -(B) Total currentLiabilities
10,459.17 11,337.50 - -
(A)-(B) NetWorking Capital
12,316.41 16,857.86 - -
Increase inWorking Capital
6,298.11 - - 6,298.11
TOTAL39,532.86 39,532.86 8,465.77 8,465.77
Source: Financial statement (Amount in lakh)
68
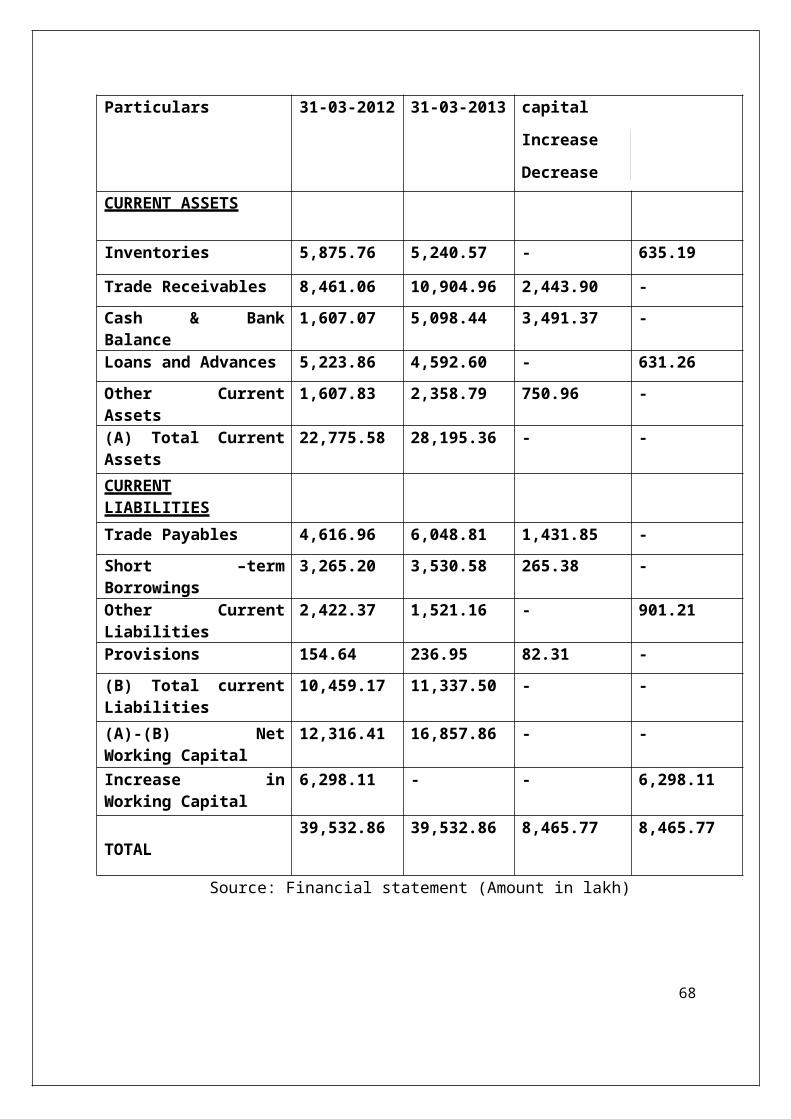
Interpretation
In the above table, it is seen that during the financial
year 2012-2013 there was net increasing in working
capital of Rs.6, 298.11 lakh. It indicates that an
adequate working capital in Marathon Electrical India
Pvt. Ltd.
This is because of:-
Increase in Current Assets such as Trade Receivable
by Rs.2, 443.90 lakh, Cash, and bank balance of
Rs.3, 491.37 lakh. And other Current Assets by
Rs.750.96 lakh.
Decrease in Current Assets such as Inventories by
Rs.635.19 lakh, and Loans and advances by Rs.631.26
lakh.
Increase in Current Liabilities, such as Trade
Payables by Rs.1, 431.85 lakh, Short-term Borrowing
by Rs.265.38 lakh, and Provisions by Rs.82.31lakh.
Decrease in other Current Liabilities by Rs.901.21
lakh.
69

CHAPTER – 5FINDINGS
AND 70
CONCLUSIONS
FINDINGS Working capital of Marathon Electric India Pvt. Ltd
was decreasing every year showing the negative
working capital, besides of 2012-2013. After that
the company is higher than standard rate, i.e. 2:1,
and the position of the company is satisfactory.
The Marathon Electric India Pvt. Ltd. hada higher
Current ratio being 4.24:1 and Quick ratio was
3.38:1.
The MEIPL hadan Absolute liquidity ratiovery low in
the year 2010-2011. During the next year, it was
71
increased by 0.09 times as compared to 2010-2011.
And in the last year, i.e. 2012-2013 it was again
increased.
The MEIPL had an inventory turnover ratio very low
in the year 2010-2011. During the next year, it was
increased by 0.28 times as compared to 2010-2011.And
in the last year, i.e. 2012-2013 it was again
increased.
The MEIPL had Debtor’s turnover ratio very high in
the year 2010-2011. During the next year, it was
decreased by 0.30 times as compared to 2010-2011.And
in the last year, i.e.2012-2013 it was again
decreased.
The Creditor’s turnover ratio of MEIPL was
fluctuating year to year. It was very high in the
year 2010-2011. During the next year, i.e. 2011-2012
it was decreased by 1.81 times as compared to 2010-
2011. And in the last year 2012-2013 it was again
increased.
The MEIPL hada working capital turnover ratio very
low in the year 2009-2010. During the next two
years, i.e. 2010-2011 & 2011-2012, it was increased
by 0.95 & 0.95 times respectively, as compared to
72
the previous year, i.e.2009-2010. And in the last
year, i.e. 2012-2013 it was decreased by 0.95 times
as compared to the previous year, i.e. 2011-2012.
CONCLUSIONS
The study on working capital management conducted in
Marathon Electric India Pvt. Ltd. to analyze the
financial position of the company. The company’s
financial position is analyzed by using the tool of
financial statements from 2009-2010 to 2012-2013.
The financial status of Marathon Electric India Pvt.
Ltd is good. In the last year i.e., 2012-2013 the
inventory turnover ratio has increased, this is a
good sign for the company.
The company’s liquidity position is not good with
regard to the investment in current assets as there
are adequate funds invested in it.
The company is managing its financial position in a
better way. There is a balance between Current
assets and current liabilities and also current
ratio is always above the standard rate.
Further, Company’s creditor’s turnover ratio is not
so good because of this company may face the
73
shortage of the funds to pay off its debts. To avoid
such situation, companies should use their funds in
a productive way and there should be timely payment
of creditors.
Company net working capital is decreasing, but in
the last year i.e., 2012-2013 it was increased,
still the company is in a better management
position, and the company present status of
maintaining current liabilities and current assets
is satisfactory.
They are able to manage their cash, funds, and
debts. By adopting better management practices, the
company may attain a sound financial position in the
future and will be able to manage its working
capital very effectively and efficiently.
LIMITATIONS OF THE STUDY The study is conducted in very short duration
(summer training).
The analysis is limited to just 4 years of data
study (from 2009 to 2013) for financial analysis.
Limited interaction with the concerned head due to
their busy schedule.
74
The findings of the study are based on the
information retrieved from the selected unit.
Very less information and time spent with the
company staff.
This study is done on the basis of the historical
data not in the actual workplace.
The financial data sensitive in nature the same
could not acquire easily.
Every personhas its own preparation to analyze the
financial data so maybe it varies from person to
person.
The companyhas not provided their financial data
properly because of it is confidential in nature.
75
APPENDICES
Balance sheet and
Profit and loss account of the company
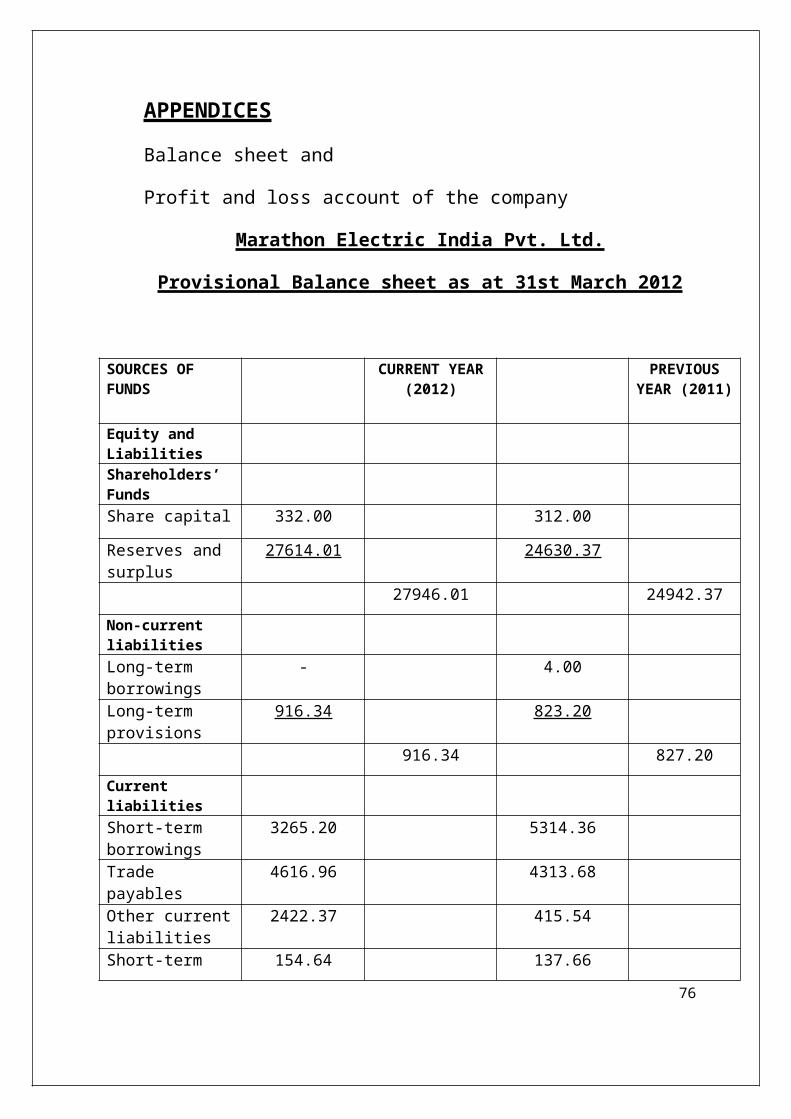
Marathon Electric India Pvt. Ltd.
Provisional Balance sheet as at 31st March 2012
SOURCES OF FUNDS
CURRENT YEAR(2012)
PREVIOUSYEAR (2011)
Equity and LiabilitiesShareholders’ FundsShare capital 332.00 312.00
Reserves and surplus
27614.01 24630.37
27946.01 24942.37Non-current liabilitiesLong-term borrowings
- 4.00
Long-term provisions
916.34 823.20
916.34 827.20Current liabilitiesShort-term borrowings
3265.20 5314.36
Trade payables
4616.96 4313.68
Other currentliabilities
2422.37 415.54
Short-term 154.64 137.66
76
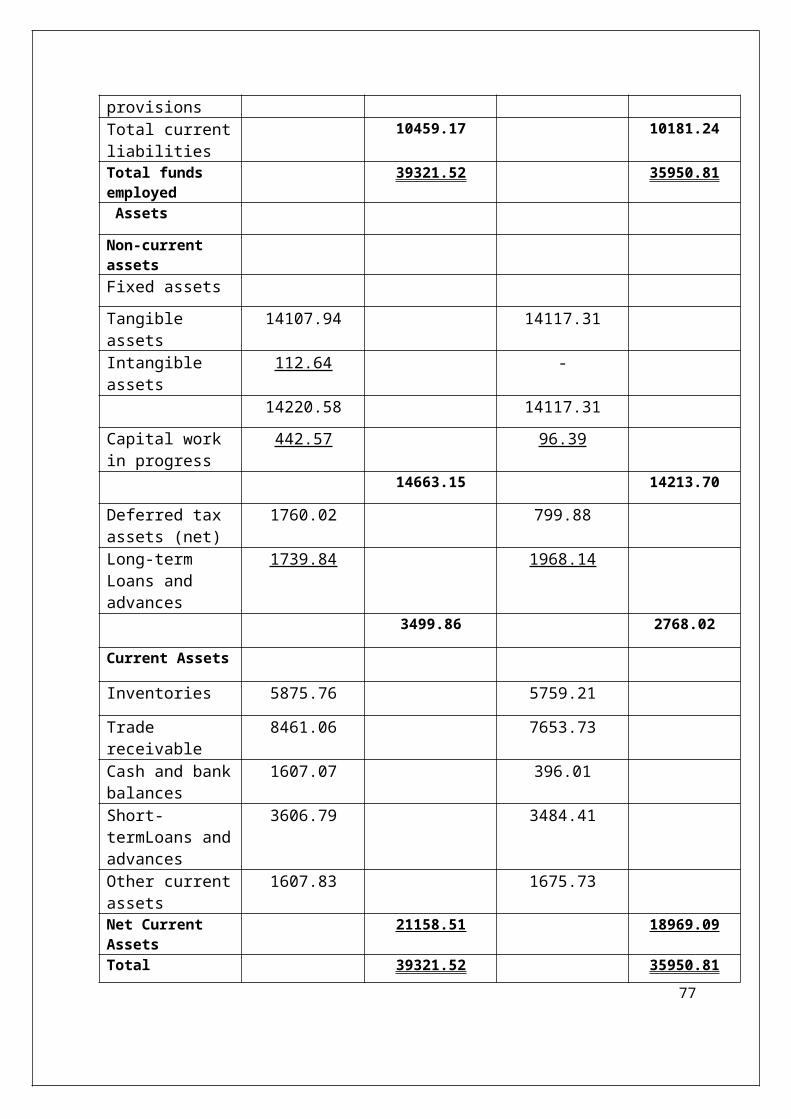
provisionsTotal currentliabilities
10459.17 10181.24
Total funds employed
39321.52 35950.81
Assets
Non-current assetsFixed assetsTangible assets
14107.94 14117.31
Intangible assets
112.64 -
14220.58 14117.31Capital work in progress
442.57 96.39
14663.15 14213.70
Deferred tax assets (net)
1760.02 799.88
Long-term Loans and advances
1739.84 1968.14
3499.86 2768.02
Current Assets
Inventories 5875.76 5759.21
Trade receivable
8461.06 7653.73
Cash and bankbalances
1607.07 396.01
Short-termLoans andadvances
3606.79 3484.41
Other currentassets
1607.83 1675.73
Net Current Assets
21158.51 18969.09
Total 39321.52 35950.8177
application ofFunds
Source: Financial statement (Amount in lakh)
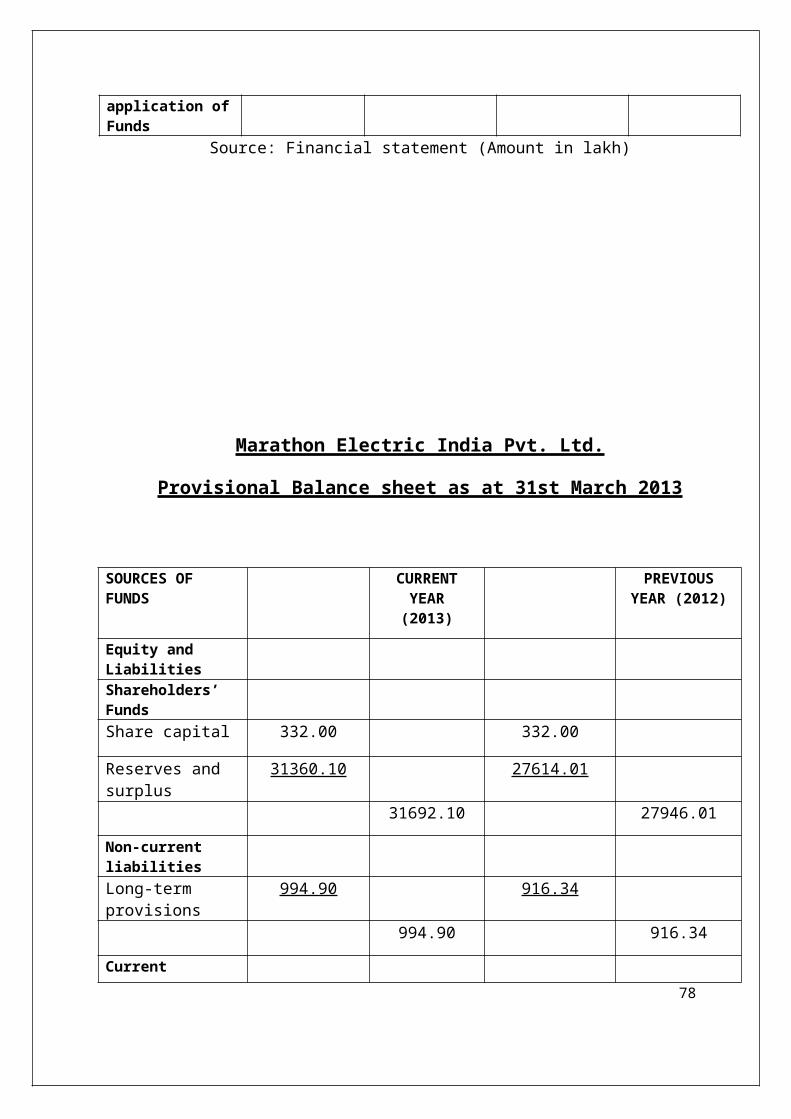
Marathon Electric India Pvt. Ltd.
Provisional Balance sheet as at 31st March 2013
SOURCES OF FUNDS
CURRENTYEAR(2013)
PREVIOUSYEAR (2012)
Equity and LiabilitiesShareholders’ FundsShare capital 332.00 332.00
Reserves and surplus
31360.10 27614.01
31692.10 27946.01
Non-current liabilitiesLong-term provisions
994.90 916.34
994.90 916.34
Current 78
liabilitiesShort-term borrowings
3530.58 3265.20
Trade payables 6048.81 4616.96
Other current liabilities
1521.16 2422.37
Short-term provisions
236.95 154.64
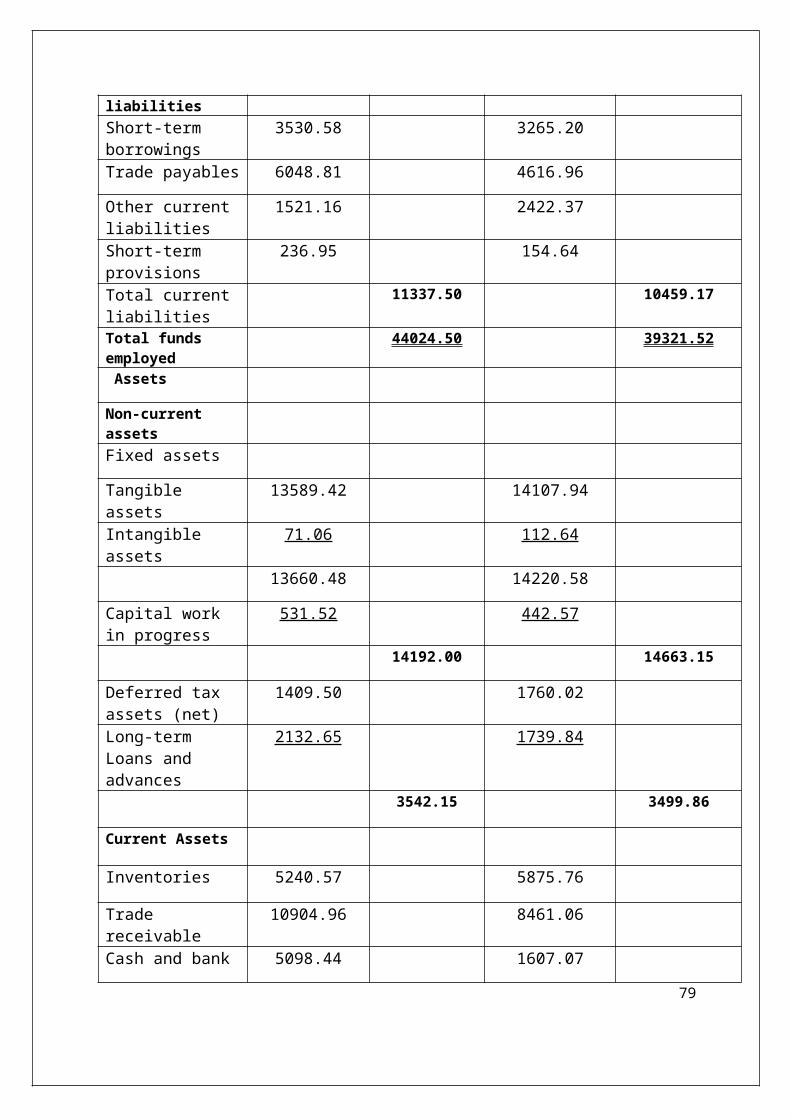
Total current liabilities
11337.50 10459.17
Total funds employed
44024.50 39321.52
Assets
Non-current assetsFixed assets
Tangible assets
13589.42 14107.94
Intangible assets
71.06 112.64
13660.48 14220.58
Capital work in progress
531.52 442.57
14192.00 14663.15
Deferred tax assets (net)
1409.50 1760.02
Long-term Loans and advances
2132.65 1739.84
3542.15 3499.86
Current Assets
Inventories 5240.57 5875.76
Trade receivable
10904.96 8461.06
Cash and bank 5098.44 1607.07
79
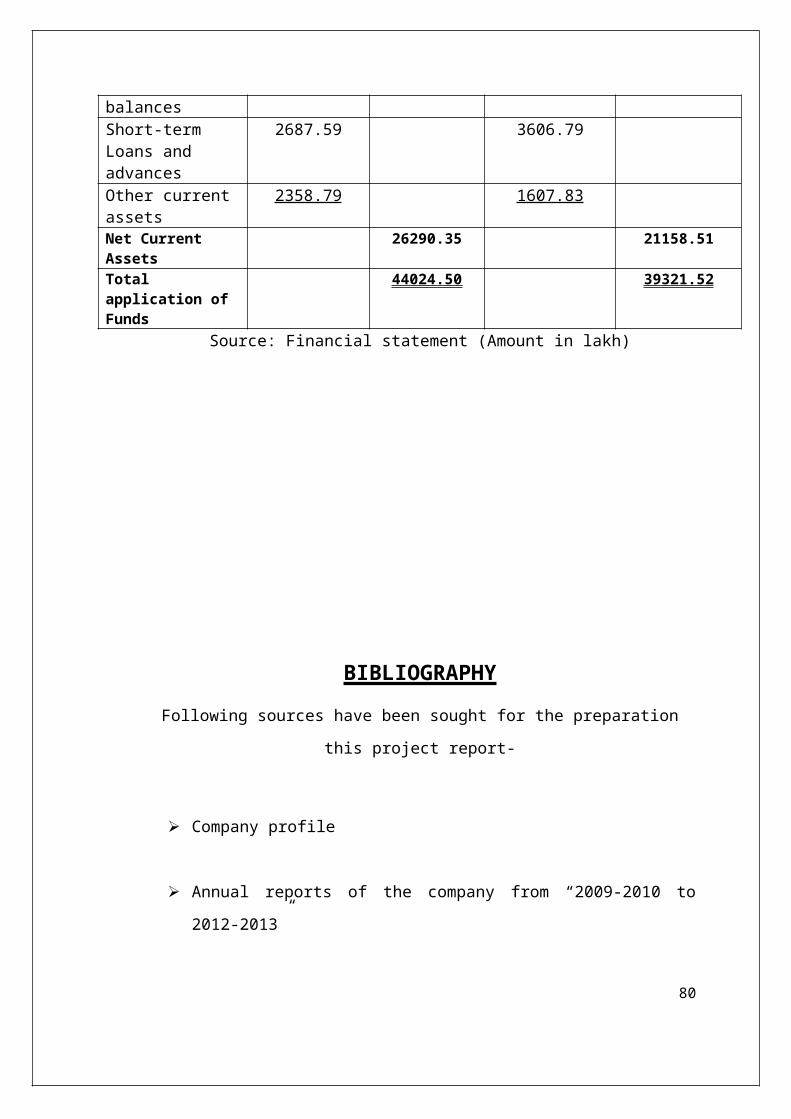
balancesShort-term Loans and advances
2687.59 3606.79
Other current assets
2358.79 1607.83
Net Current Assets
26290.35 21158.51
Total application of Funds
44024.50 39321.52
Source: Financial statement (Amount in lakh)
BIBLIOGRAPHYFollowing sources have been sought for the preparation
this project report-
Company profile
Annual reports of the company from “2009-2010 to
2012-2013”
80
Direct interaction with the employees of the
company.
Internet-
www.marathonelectric.in
www.google.com
www.wikipidea.org
81