internship experience
TRANSCRIPT

1
CHAPTER- I
INTRODUCTION
1.1 Background
People have always been seeking security and protection for themselves as well as
their property. That led them to introduce and develop scientific and technological
tools on one hand, and banking development on the other hand. Today financial sector
plays vital role in our economy.
Financial sector immensely contributes to the economic growth and prosperity.
Financial Institutions play pivotal role in the economic well being and future growth
of a market oriented economy. Financial Institution’s principal assets are financial
assets or claims stocks, bonds and loans instead of real assets. In most industrialized
economies today, the liabilities of financial institutions are the principal means for
making payments for goods and services and their loans are the chief source of credit
for all economic units in society via: business, households and government.
The basic functions of Financial Institutions are to formulate capital through
collecting scattered public deposits in the economy and mobilizing them into
productive sectors. It provides wide range of services to the different strata of society
to facilitate the growth of trade, commerce, industry and agriculture of the national
economy. It also provides remittance of money, providing letter or credit, bank
guarantee, developed the plastic money like debit card, credit visa card,
ATM(Automatic Teller Machine), SCT(Smart Choice Technology), as banking
services and non-banking products like insurance is also going to be a tremendous
opportunity provided to the public.
1.1.1 Evolution of Banking Industry
The evolution of banking industry had started during ancient times. There was
reference to the activities of moneychanger in the temple Jerusalem in the New
Testament. In ancient Greece, the famous temples of Delphi and Olympia served as
the great depositories for peoples’ surplus funds and these were the centers of money
lending transaction. Indeed the traces of “rudimentary banking” in ancient Rome
2
roughly followed the Greek pattern. Banking suffered oblivion after the fall of the
Roman Empire after the death of Emperor Justinian in 565 AD, and it was not until
the revival of trade and commerce in the Middle Ages that the lessons of finance were
learnt anew from the beginning. Money lending in the middle Ages was, however,
largely confined to the Jews since the Christians were forbidden by the Canon law to
indulge in the sinful act of lending money to others on interest. However, as the hold
of the Church loosened with the development of trade and commerce about the
thirteenth century Christians also took to the lucrative business of money lending,
thereby entering into keen competition with the Jews who had hitherto monopolized
the business.
As a public enterprise, banking made its first beginning around the middle of the
twelfth century in Italy and the Bank of Venice, founded in 1157 was the first the
public banking institution. Following it were established the Bank of Barcelona and
the Bank of Genoa in 1401 and 1407 respectively. The Bank of Venice and the Bank
of Genoa continued to operate until the eighteenth century. With the expansion of
commercial activities in Northern Europe there sprang up a number of private banking
houses in Europe and slowly it spread throughout the world. In Nepal, modern
banking starts from the establishment of Nepal Bank Limited.
1.1.2 Development of Banking Industry In Nepal
In the country, the development of banking is relatively recent. The record of banking
system in Nepal gives detail account of mixture of slow and steady evolution in the
financial and global economy of Nepalese life. Involvement of landlords, rich
merchants, shopkeepers and other individual moneylender has acted as fence to
institutional credit in presence of unorganized money market.
It shows that some crude bank operations were in practice even in the ancient times,
in Nepalese Chronicle, it was recorded that the new era known as Nepal Sambat was
introduced by Shakhadhar Sakhwa, a Sudra merchant of Kantipur in 879 or 880 A.D.
after having paid all the outstanding debts in the country. This shows the basic of
money lending practice in ancient Nepal. Towards the end of 8th century, Gunkam
Dev had borrowed money to rebuild the Kathmandu valley. In 11th century, during
3
Malla regime there was an evidence of professional moneylenders and bankers and
money-lending business, particularly for financing the foreign trade with a Tibet.
The establishment of “Tejarath Adda” could be regarded as pioneer foundation of
banking in Nepal during the year 1877 AD. It was fully subscribed by the
government of Kathmandu valley, which played a vital role in the banking system.
There was no other financial institution set-up and no efforts to expand the services.
Above all of the defects, this institution did not accept any deposits from the public.
In the absence of saving mobilization the “Adda” faced financial problems making it
impossible to Carter to the credit and service need of the general population through
out the country.
Then the government started trade with India and Tibet. Various indigenous bankers
handled even the trade, because transfer of the money could be safely made only
through these bankers in the absence of modern banking institutions. Hence, the need
of banking intuition was realized. This was even strongly supported by the situation
caused during 1934 AD’s earthquake where there was a need of finance for the
reconstruction of works. Reviewing these situations, the “Udyog Parishad (Industrial
Development Board)” was constituted in 1936 AD. One year after its formulation, it
formulated the “Company Act” and “Nepal Bank Act” in 1937 A.D.
In the year 1934 AD, the establishment of Nepal Bank Ltd, with the Imperial Bank of
India came into existence under “Nepal Bank Act, 1937” as the first commercial bank
of Nepal, inaugurated by Late King Tribhuwan on November 1937. Rastriya Banijya
Bank, the second commercial bank was established in the year 1965. RBB being the
largest commercial bank plays a major role in the economy. The financial shapes of
the two old banks have a tremendous impact on the economy that is the reason why
these banks still exist in spite of their bad position. Thus we can say that modern
banking practices began only before the Second World War with the establishment of
the first banking institute, Nepal Bank Limited, which was establishment as a joint
venture of government and private individuals.
Earlier banks were different from modern commercial banks in many respects. The
banks, which operated in the past, combined central banking functions such as issue
4
of currency, with commercial banking operations like accepting deposits and
financing business. In course of time this practice was abandoned and specialized
institutions for the central banking functions were created. Now, a central bank can be
easily distinguished from a commercial bank due to there objectives and unique
functions.
The commercial banks facilitated and supervised by Central bank hold the deposits of
million of persons, government and business units. It exchanges money, accepts
deposits, grants loan and operates commercial transaction. They make funds available
through their lending activities to borrowers, individuals, business firms and
government and investing activities from small average amount to large number of
productive and needed sector of the country, so as to develop the nation.
With the opening of NABIL bank in 1985 the door of opening commercial banks was
opened to the private sector. Then whole lot of commercial banks was opened in
Nepal. Today all the Banks except Nepal Bank Ltd. and Rastriya Banijya Bank are
making profit. The inefficiency of these two public sector banks has lead to the
success of other private banks.
As the commercial bank grew they stopped entertaining small projects. Thus a scope
for opening finance companies emerged. In 2042 B.S., finance company Act was
passed, but private sector kept stony silence till 2049 B.S. the first break came in
month of Shrawan of that year, when first company Nepal Housing and Development
Finance Company came. The second came in the Poush of the same year, Nepal
Finance and Saving Company.
1.1.3 Background of Nepal Investment Bank Limited
Nepal Investment Bank Ltd. (NIBL), previously Nepal Indosuez Bank Ltd., was
established in 1986 as a joint venture between Nepalese and French partners. The
French partner (holding 50% of the capital) was Credit Agricole Indosuez, a
subsidiary of one the largest banking group in the world.
With the decision of Credit Agricole Indosuez to divest, a group of companies
comprising of bankers, professionals, industrialists and businessmen, has acquired on
5
April 2002 the 50% shareholding of Credit Agricole Indosuez in Nepal Indosuez
Bank. The name of the bank has been changed to Nepal Investment Bank Ltd. upon
approval of Bank’s Annual General Meeting, Nepal Rastra Bank and Company
Registrar’s office with the following shareholding structure.
A group of companies holding 50% of the capital
Rastriya Banijya Bank holding 15% of the Capital.
Rashtriya Beema Sansthan holding the same percentage.
The remaining 20% being held by the General Public (which means that NIBL is a
Company listed on the Nepal Stock Exchange).
1.1.4 Vision
The vision of NIBL is to be most preferred provider of financial services in Nepal.
1.1.5 Mission Statement
To be the lending Nepali bank, delivering world class service through the blending of
state-of-the-art technology and visionary management in partnership with competent
and committed staff, to achieve sound financial health with sustainable value addition
to all our stakeholders. They are committed to do this mission while ensuring the
highest levels of ethical standards, professional integrity, corporate governance and
regulatory compliance.
1.1.6 Company Objective
To develop a customer oriented service culture with special emphasis on customer
care and convenience.
To increase the bank’s market share by following a disciplined growth
strategy.
To leverage the technology platform and open scalable system to achieve cost-
effective operations, efficient MIS, improved delivery capability and high
service standards.
To develop innovative products and services that attracts the targeted
customers and market segments.
To continue to develop products and services that reduces the cost of funds.
6
To maintain a high quality asset portfolio to achieve strong and sustainable
returns and to continuously build shareholders’ value.
To explore new avenues for growth and profitability.
1.1.7 Corporate Strategy
Corporate strategy is “We want to be the preferred provider of financial services in
Nepal having the largest capital base and delivering maximum shareholder value.”
1.1.8 Company Core Values and Ethical Principles
The core values of the bank tell that the customers and the communities they serve,
who they really are, what they are about, and the principles by which they pledge to
conduct business. In essence, they believe that success can only be achieved by living
their core values and principles:
Customer Focus
At NIBL, the prime focus of the bank is to prefect its customer service. Customers are
their first priority and driving force. They wish to gain customer confidence and be
their trusted partner.
Quality
It believed a quality service experience is paramount to its customers and they are
strongly committed in fulfilling this ideal.
Honesty and Integrity
It ensures the highest level of integrity to the customers, creating an ongoing
relationship of trust and confidence. They treat their customers with honesty, fairness
and respect.
Belief in the people:
It recognizes that employees are its most valuable asset and its competitive strength.
It respects the worth and dignity of individual employees who devote their careers for
the progress of the bank.

7
Team work
It believes in teamwork and feed that loyal and motivated teams can produce
extraordinary results. They are derived by a performance culture where recognition
and rewards are based on individual merit and demonstrated track record.
Good Corporate Governance
Effective corporate Governance procedures are essential to achieve and maintain
public trust and confidence in any company. At NIBL, they are committed in
following the best practices resulting in good corporate governance.
Corporate Social Responsibility
As a responsible corporate citizen, they consider it important to act in a responsible
manner towards the environment and society. Their commitment has always been to
behave ethically and contribute towards the improvement of quality of life of their
people, the community and greatly the society of which they are an integral part.
1.1.9 Promoters and Shareholders
NIBL is managed by a team of experienced bankers and professionals having proven
track record, who can offer us what we are looking for.
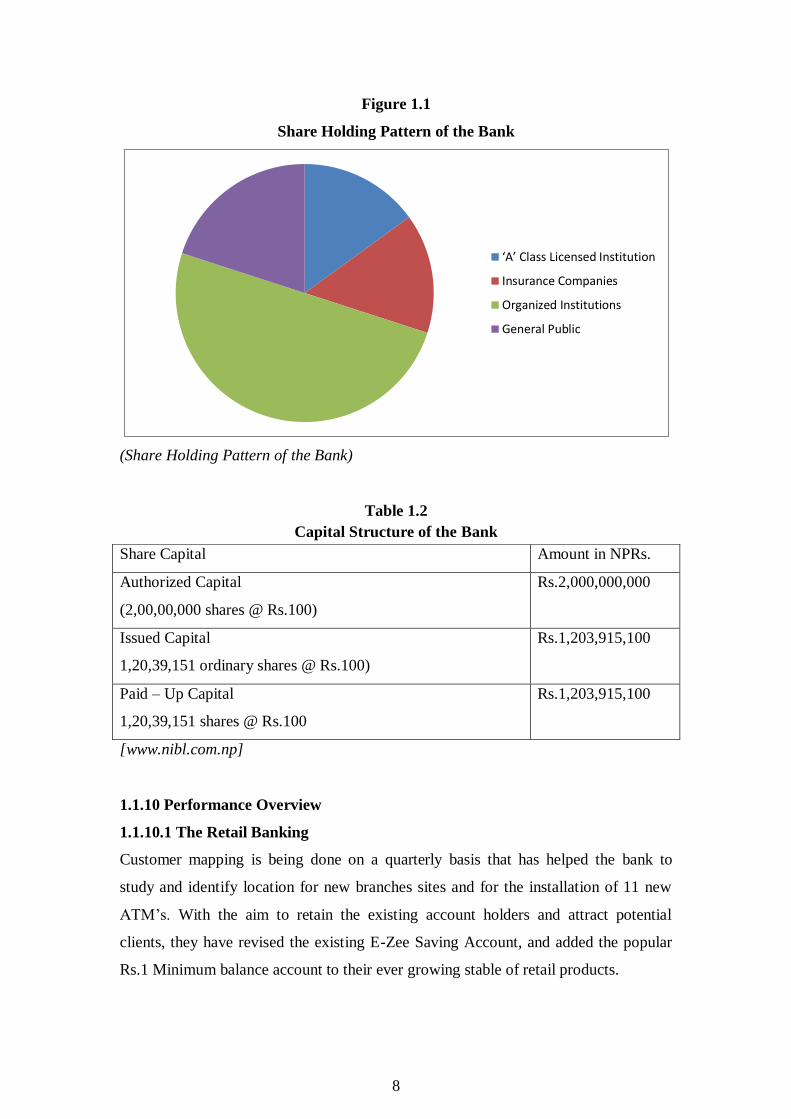
Table 1.1
Share Holders of the Bank
Share Holding [%]
1. ‘A’ Class Licensed Institution 15%
2. Insurance Companies 15%
3. Organized Institutions 50%
4. General Public 20%
TOTAL 100%
[www.nibl.com.np]
8
Figure 1.1
Share Holding Pattern of the Bank
(Share Holding Pattern of the Bank)
Table 1.2
Capital Structure of the Bank
[www.nibl.com.np]
1.1.10 Performance Overview
1.1.10.1 The Retail Banking
Customer mapping is being done on a quarterly basis that has helped the bank to
study and identify location for new branches sites and for the installation of 11 new
ATM’s. With the aim to retain the existing account holders and attract potential
clients, they have revised the existing E-Zee Saving Account, and added the popular
Rs.1 Minimum balance account to their ever growing stable of retail products.
‘A’ Class Licensed Institution
Insurance Companies
Organized Institutions
General Public
Share Capital Amount in NPRs.
Authorized Capital
(2,00,00,000 shares @ Rs.100)
Rs.2,000,000,000
Issued Capital
1,20,39,151 ordinary shares @ Rs.100)
Rs.1,203,915,100
Paid – Up Capital
1,20,39,151 shares @ Rs.100
Rs.1,203,915,100

9
Apart from Schools, they have on-line arrangements (for the payment and other
instruments) with the likes of Nepal Telecom Corporation, World link Technology,
Web Surfer, Mercantile Communications and other Internet Service Providers as well
as e- commerce sites like Muncha.com.
1.1.10.2 Card Center
They have issued 69,480 VISA Debit Cards during fiscal year 2007/08 with total
1Number of NIBL, debit cards of 115,417 in the market during FY 2007/08. They
have developed a total of 600 POS machines most of which are providing significant
returns.Besides all examinations fees online payments, they have been providing
Student and Exchange Visitor’s Program (SEVIS) – a visa fees payment service for
students going to the US. They are working on issuance of prepaid virtual cards
(USD) to the general public which can be used for purchase of internet based
products and services.
1.1.10.3 Remittance
The bank signed remittance agreements with UAE Exchange Centre (for payment
through SWIFT), Habib Exchange Company and Emirates and East India Exchange
in UAE, Gulf Exchange Company and City Exchange Company in Qatar, Global
Money Transfers. They also plan to start remittance business from Malaysia in FY
2007/08. A total of 38 remittance disbursement locations were added all over the
country increasing the total disbursement locations to 109.
1.1.10.4 Corporate Banking
The total loans and advances at the end of 2007/08 stood at Rs.27.53 billion with a
growth of 55% during the year. The branches possess a satisfactory share of the
bank’s lending and its growth. The bank’s NPA is 1.13% at is one of the lowest in the
Nepali banking industry and well within international standards. New proposals for
hydropower projects and cement industries are being reviewed along with a
consortium banks.
1.1.10.5 Trade Finance
There has been a rise in the volume of letters of credit (LC) and guarantees issued by
the bank with a commensurate increase in their fee based income. The total number

10
of import LC issued in 2006/07 was 1,566. The number of bank guarantee issued in
2006/07 is 1,830 which have purchased up the contribution in revenue from fee based
income by over 20%. Furthermore, a total no. of 19 Counter Guarantees amounting
to USD 8 million were issued in 2006/07. Similarly, the total commission income
from trade finance in 2007/08 was Rs.75.05 million.
1.1.10.6 Treasury
This year the total exchange gain was Rs 135.36 million with an increase of 7.68%.
The total T-bill portfolio as on end of FY was Rs. 3,256 million. Interest earned on
placement of LCY was Rs. 183.07 million as compared to last year’s figure of Rs.
106.42 million, an increase of 72.03%. They have taken initiative to diversify their
investment portfolio of foreign currencies to various financial instruments and also
started using on-line software to deal in foreign currencies with various banks. They
have allocated funds into principal protected products that diversify their income
sources away from Nepal.
1.1.10.7 Information Technology
Prompted by the quantum growth in our retail and borrowing customer base and the
consequent increase in the volume of transactions it became apparent that the current
banking software was hard pressed to keep up with the growth rates. Thus, the bank,
after a comprehensive study decided to invest in a new banking software - Finnacle -
a product of the world renowned IT company, Infosys, India After successful
implementation of Postpaid Mobile Bill Payment Collection, the bank has well
demonstrated its lead in technical innovation by introducing Prepaid Mobile Recharge
PIN through its e-Banking (Internet Banking) and ATM outlets for their customer’s
convenience – another first in the banking industry in Nepal. Customers can now
simply buy a Prepaid Mobile Recharge PIN electronically from either the e-Banking
or 30 ATMs deployed across the country.
1.1.10.8 Human Resources
Rapid growth and branch expansion has been the cornerstone of the bank’s strategic
focus. With a commitment to continue to provide the best product and service
delivery to all their valued customers, they have recruited many talented people and
also focused on training their staff with the skills they need to achieve their

11
organizational objectives. The bank also has a performance management system that
rewards employees with incentives for achieving their assigned individual goals and
objectives. The bank provides opportunity in terms of training for career advancement
and fast tracks high potential employees with accelerated promotions and greater
responsibilities.That has served as a good motivator for both performance and loyalty.
1.1.11 Awards
Nepal Investment Bank Limited (NIBL) has been awarded the prestigious "Bank of
the Year 2003" and "Bank of the Year 2005" and “Bank of the Year 2008” by the
London-based Financial Times Group's “The Banker”. This honor was provided to
NIBL for meeting the stringent benchmark criteria set by The Banker. The Award is
based on the growth and performance in terms of capital, assets, and return on equity
and management quality. NIBL was also awarded as “The Best Presented Accounts
Award – 2006”, for standing first in the banking sector by The Institute of Chartered
Accountants of Nepal (ICAN). This recognition is a great honor and a source of pride
and inspiration to the bank.
It has already launched the "Premier Banking Cell" that caters to its high net worth
clients and renders consultancy services in taxation, legal, insurance and travel and
tours.The Bank constantly interacts with existing and potential customers to get
feedback and suggestions that in turn help to design products and services to suit the
requirements and expectations of customers. The Bank has started a concept of "15
Minute Banking" or the convenience of all its valued customers. Customers entering
any of its branches can carry their entire banking transaction within 15 minutes.
1.1.12 Corporate Governance
At NIBL, all staffs are firmly committed to the highest standards of governance. The
Board of Directors ensures that the activities of the bank are always conducted with
the highest ethical standards and in the best interests of all its stakeholders. The BOD
continues to ensure that the bank conducts itself as a model corporate citizen by
specifying corporate values for the bank and stipulating a Code of Conduct and Ethics
for the employees to ensure that t he employees maintain their dignity and integrity
and build customer confidence.
12
Pursuant to Section 12 of the Bank and Financial Institutions Act, 2006 requires
appointment of an independent director to the Board of the Bank. The bank has
adopted one independent director in its Board. There are several Board constituted
committees, each with a defined scope of work and terms of reference. These
committees are responsible for providing independent and expert advice to the Board
on the subjects assigned.
Executive Credit Committee
Audit Committee
Human Resource Development Committee
Construction Committee
System Committee
The bank has adopted good corporate governance practices prescribed by the Nepal
Rastra Bank as well as in other relevant statues such as the Company Act 2006 and
Bank and Financial Institution Act, 2006. The team believes that the trust, confidence
and goodwill reposed on the bank by the stakeholders and clients is, inter alias, an
acknowledgement of the good corporate governance practices adopted by the bank.
1.1.13 Study Focus
Many assets in the financial system are claims against other borrowers. As such, the
value of those assets fluctuates with the strength of the borrower’s balance sheet.
Banks and other lending institutes must constantly balance risks and rewards. Too
high a price of loan products and you lose the customer, too low, and you affect the
profit margin or take a loss. Too much capital on reserve and you miss investment
revenue, too little and you risk regulatory non compliance and financial instability.
Credit risk is the risk that arises because of the possibility that promised cash flows on
financial claims held by FI, like loans and bonds, will not be paid in full. That affects
bank’s profitability because of various reasons. Credit is the most common cause of
bank failures, causing virtually all regulatory environments to prescribe minimum
standards for credit risk management. The basis of sound credit risk management is
the identification of the existing and potential risks inherent in lending activities.
13
Credit risk management has always been on the radar of the top management of any
company, but at no other time has its scenario – plagued by increasing competition
and that great nemesis the sub prime lending crisis. In this age of advancing and
complex risk transfer mechanisms, it may make sense to step back and take a look
into the very basic of credit risk management. It will help to identify the key priority
areas and challenges in the credit risk arena and how a solution can be designed to
tackle the risk. So the study is focused on the credit risk that affect severely into the
bank
1.2 Objectives of the Study
The main objective of the study is to examine the credit risk management system
adopted by NIBL and to find various areas of improvements to manage the credit risk
effectively within the bank.
The study has the following specific objectives:
To analyze the credit procedures of the bank and recovery status or control
over the credit portfolio.
To find out credit quality problems faced by the bank.
To provide suitable recommendation and suggest additional measures for
improvement of credit risk management in present performed conditions
related to credit risk.
1.3 Significance of the Study
Though different risks are associated with the loan disbursement, the credit risk
affects the credit portfolio tremendously in the commercial banks. Uncertainties of
the risk in the credit portfolio that may cause from unpredicted and unanticipated
consequences affect the bank and may lead to bankruptcy. Hence effective credit risk
management is very important and should be taken as most challenging management
factor by the bank.
Managing credit risk is the combination of various processes executed by managers of
the commercial bank that includes identifying, assessing, monitoring, diversifying and
controlling while performing leading activities of the bank.

14
Credit risk management deals with various types of businesses and sectors as well as
correlation among various sectors in bank’s portfolio. It is very much complex to
manage. Despite its complexity, managers need to manage credit risk effectively by
identifying all the risks that may arise in the business activities and aggregate risk of
its exposures can be evaluated to certain extent.
1.4 Relevance of the Study
Currently, banks are gaining the stakeholders’ belief through their efficient
management and professional services and playing an eminent role in the economy.
The credit risk for banks is unforeseen. So, the study is focused on credit risk
management practice of the bank. The study attempts to interlink the financial
performance and the credit risk management practice of the bank.
The study is expected to be useful to the shareholders as they can analyze the risk
relating to credit. The study is expected to be useful to the management bodies of the
bank to evaluate its performance prevailing situation of credit risk management and
implement new mechanism if any and manage the risk. The study is expected to be
useful to the government body, NRB for further research is the area to formulate and
implement new policies and regulations. The study is expected to be useful to the
other stakeholders to know the practices made over the risk management by the bank.
1.5 Statement of the Problem
Although being in small economy, financial institutions are increasing that leads to
the tough competition in banking sector because of wide range of operations. Due to
the unhealthy competition among the banks, it lacks good investment opportunities;
the recovery of the credit also became so difficult. Non performing loans are
increasing year by year. The commercial banks adopt new innovative technology to
provide better services and stay competitive in the market. Rapid development of
technology, new way of banking business and various innovations provide
tremendous opportunity for market driven commercial banks. It is one of the most
risks exposing sector. The study will examine the credit risk management practices
adopted by the bank as it exposes more credit risk. It is also expected that the credit
risk management of Nepal has not been conducted and the study can give new insight
15
of credit risk management practice of commercial banks. Banks are delivering
numerous functions for global economy and capital markets.
Managing risks like systematic risk, credit risk, operation risk, liquidity, legal risk,
counterparty risk for banking sector became extremely vital due to high degree of
internal and external market dynamism. Since economic condition of the country is
degrading due to conflict and overall economic sector either manufacturing or
commercial sectors have undergone heavy losses, the bank must focus in the credit
risk pertaining to existing lending portfolios and potential credit risks that may arise
due to emerging categories of new lending in future.
1.6 Limitations of the Study
Though this study will try to cover all the credit risk related sectors, it still has some
limitations. This study is concentrated only on the credit management practices and
the performance of Nepal Investment Bank Limited. This research study largely
depends on the secondary data like annual reports (Profit and Loss Account, Balance
Sheet and Financial Statements).The study is based on only financial and statistical
tools and technology. The study mainly based on last eight years data (2001 to 2008)
that are not enough for the statistical calculation and cannot be generalized for entire
financial sectors.
1.7 Organization of the Study
The study has been divided into different five chapters as follows:
Chapter I – Introduction
This chapter describes the basic concept and background of the study. It has served
orientation for readers to know about the basic information of the research area,
various problems of the study, objectives of the study and need or significance of the
study. It is oriented for readers for reporting or giving them perspective they need to
understand the detailed information about coming chapter.
Chapter II – Review Of Literature
The second chapter of the study assures readers that they are familiar with important
research that has been carried out in similar areas. It also establishes that the study as

16
a link in a chain of research that is developing and emerging knowledge about
concerned field.
Chapter III – Research Methodology
Research Methodology refers to the various sequential steps to be adopted by a
researcher in studying a problem with certain objectives in view. It describes about
the various source of data related with study and various tools and techniques
employed for presenting the data.
Chapter IV – Presentation, Analysis And Interpretation
This chapter analysis the data related with study and presents the finding of the study
and also comments briefly on them.
Chapter V – Summary, Conclusion and Recommendation
On the basis of the results from data analysis, the researcher concluded about the
performance of the concerned organization for better improvement.
17
CHAPTER II
REVIEW OF LITERATURE
Review of literature means reviewing research studies or other relevant proposition in
the related area of the study so that all the past and previous studies, their conclusion
and perspective of deficiency may be known and further researcher can be conducted
or done.
In other words, its just like fact are finding based on sound theoretical framework
oriented towards discovery of relationship guided by experience, resonating and
empirical investigation. The primary purpose of literature is to learn and it helps
researcher to find out what research studies have been conducted in one’s chosen field
of study, and what remains to be done. For review study, the researcher uses different
books and journal, reviews and abstracts, indexes, reports, and dissertation or research
studies published by various institutions, encyclopedia, etc.
The researcher reviewed the literature into two parts:
2.1 Conceptual/ Theoretical Framework
2.2 Review of related studies
2.1 Theoretical/ Conceptual Framework
2.1.1 Concept of Bank
Simply, Bank is financial institution that accepts deposits and invest the amount in the
lending activities and also it provides commercial services. In ancient time, bank
emerged from Latin word Baucus, French word Banque and Italian word Bianca,
which all means a Bench where sitting over there to invest, exchange and keep record
of money and cash. These all functional activities formed as current banking industry.
2.1.2 Introduction of Banking Industry
Banks are among the most important financial institutions in the economy. They are
the principal source of credit (loan able funds) for millions of households (individuals
and families), local units of government (school districts, cities, countries).
Moreover, for small local businesses, banks are often the major source of credit to
18
stock the shelves with merchandise. When the business and consumers have to make
payments for the purchase of goods and services, they can use cheques provided by
the banks, credit and debit cards or electronic accounts connected to a computer
network. And when they need financial information and financial planning, it is the
bankers to whom they turn most frequently for advice and counsel.
Worldwide, banks grant more installment loans to consumers than any other financial
institution. In most years, they are among the leading buyers of bonds and notes
issued by governments to finance public facilities. Banks are among the most
important sources of short term working capital for businesses and have become
increasingly active in recent years in making loans for new plants and equipments.
Banks reserves are the principal channel for government economic policy to stabilize
the economy.
Banks can be identified by the functions they perform in the economy. Now-a-days
the functions of the banks as well as functions of their principal competitors are also
changing. Many financial institutions – including leading security dealers, brokerage
firms, mutual funds and insurance companies are trying to be as similar as possible to
banks in the services they offer. Banks in turn are challenging these non bank
competitors by seeking expanded authority to offer real estate and security brokerage
services, insurance coverage, investment in mutual funds, and many other new
products. The success of bank lies on the ability to identify the financial services the
public demands, produce those services efficiently and sell them at a competitive
price.
2.1.3 Commercial Banks
Commercial banks are the major component in the financial system. They work as the
intermediary between depositors and lenders and facilitate in overall development of
the economy, with major thrust in industrial development. Commercial banks come
into existence mainly with the objectives of collecting the idle funds, mobilizing them
into productive sector and causing an overall economic development. The bankers
have the responsibility of safeguarding the interest of the depositors, the shareholders
and the society they are serving. A sound banking system is important because of the
key roles it plays in the economy: intermediation, maturity transformation, facilitating

19
payments flows, credit allocation and maintaining financial discipline among
borrowers. Banks are the gathers of saving.
2.1.4 Growth
The banking sector in Nepal stated with the establishment of Nepal Bank Limited.
Today, we got 26 commercial banks in operation with Nepal Bank Limited and
Rastriya Banijya bank as Public sector and other 23 Private sector banks. It can be
shown as:
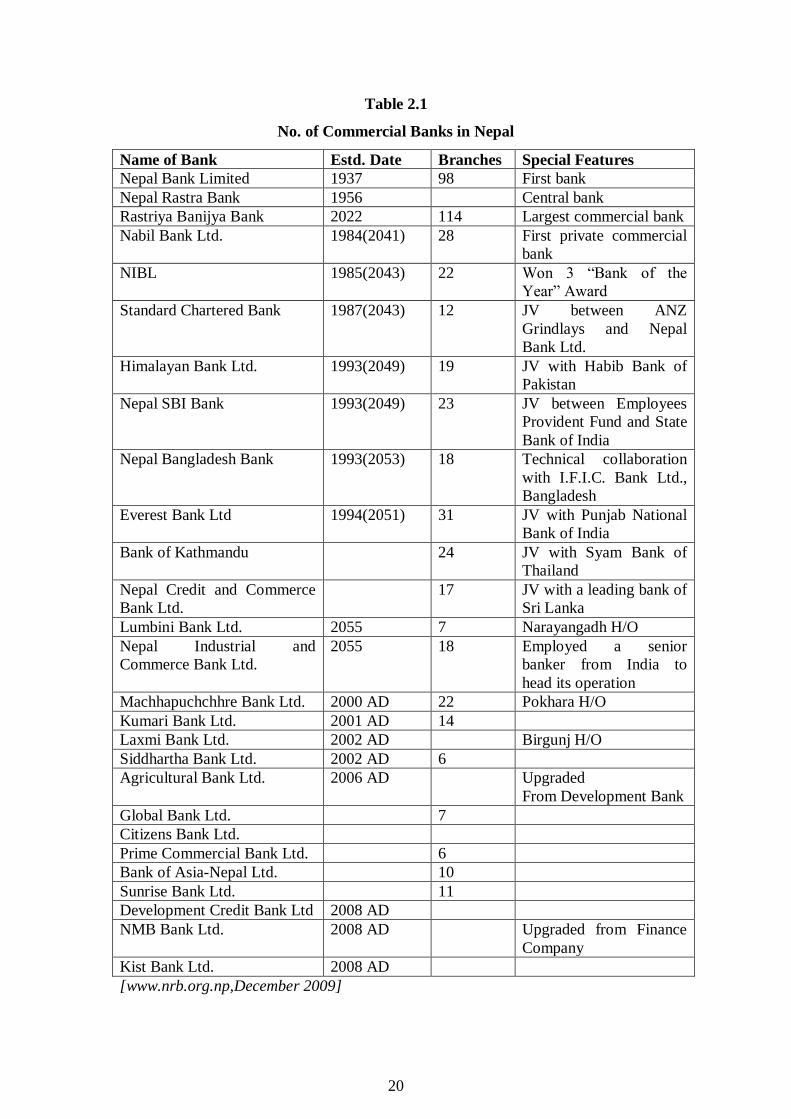
20
Table 2.1
No. of Commercial Banks in Nepal
Name of Bank Estd. Date Branches Special Features
Nepal Bank Limited 1937 98 First bank
Nepal Rastra Bank 1956 Central bank
Rastriya Banijya Bank 2022 114 Largest commercial bank
Nabil Bank Ltd. 1984(2041) 28 First private commercial
bank
NIBL 1985(2043) 22 Won 3 “Bank of the
Year” Award
Standard Chartered Bank 1987(2043) 12 JV between ANZ
Grindlays and Nepal
Bank Ltd.
Himalayan Bank Ltd. 1993(2049) 19 JV with Habib Bank of
Pakistan
Nepal SBI Bank 1993(2049) 23 JV between Employees
Provident Fund and State
Bank of India
Nepal Bangladesh Bank 1993(2053) 18 Technical collaboration
with I.F.I.C. Bank Ltd.,
Bangladesh
Everest Bank Ltd 1994(2051) 31 JV with Punjab National
Bank of India
Bank of Kathmandu 24 JV with Syam Bank of
Thailand
Nepal Credit and Commerce
Bank Ltd.
17 JV with a leading bank of
Sri Lanka
Lumbini Bank Ltd. 2055 7 Narayangadh H/O
Nepal Industrial and
Commerce Bank Ltd.
2055 18 Employed a senior
banker from India to
head its operation
Machhapuchchhre Bank Ltd. 2000 AD 22 Pokhara H/O
Kumari Bank Ltd. 2001 AD 14
Laxmi Bank Ltd. 2002 AD Birgunj H/O
Siddhartha Bank Ltd. 2002 AD 6
Agricultural Bank Ltd. 2006 AD Upgraded
From Development Bank
Global Bank Ltd. 7
Citizens Bank Ltd.
Prime Commercial Bank Ltd. 6
Bank of Asia-Nepal Ltd. 10
Sunrise Bank Ltd. 11
Development Credit Bank Ltd 2008 AD
NMB Bank Ltd. 2008 AD Upgraded from Finance
Company
Kist Bank Ltd. 2008 AD
[www.nrb.org.np,December 2009]

21
2.1.5 Nepalese Banking Sector- Opportunities and Challenges
In any economy, banking sector plays a pivotal role in the overall development of the
economy. The economic reforms initiated by the government more than a decade ago
have changed the landscape of several sectors of the Nepalese economy. Banking
sector is going through major changes as a consequence of economic reforms. That
affect the ownership pattern of banks, regulatory aspects, availability of funds, the
cost of funds as well as opportunities to earn, range of services ( fee-based and fund
based), and management of priority sector lending. As a consequence of liberalization
in interest rates and cutthroat competition, banks are operating on reduced spread.
Development Financial Institutions (DFIs) will have a lesser impact on the Nepalese
economy. Consumerism is here to stay. Non-banking products, like insurance is going
be a tremendous opportunity for banking sector.
The economic reforms have also generated new and powerful customers (Nepalese
middle class) and new mix of players (public sector units, private banks, and foreign
banks). The emerging competition has generated new expectations from the existing
and the potential customers. There still lies an urgent need to introduce new products.
Existing products need to be delivered in an innovative and cost-effective way by
taking full advantage of emerging technologies.
The new rules of competition require recognition of the importance of consumers and
the necessity to address the needs through innovative products supported by new
technology. As a consequence of competition, the managerial challenges include
market segmentation, product positioning, innovative delivery channels, cross-selling
etc. At an organization level, elaborate systems need to be evolved to manage, assess,
and contain risk (including portfolio, client, and exchange rate).
The banks may have to reorient their resources in the form of reorganized branch
networks, reduced manpower, dramatic reduction in establishment cost, honing the
skills of the human resources, and innovative ways of attracting talented managerial
pool. The Nepal Rastra Bank on their part needs to strengthen the existing norms in
terms of governing and directing the functioning of these banks. Nepal Rastra Bank is
currently working on bringing out a comprehensive directive under the new
ordinance, which will cover all classes of financial institutions, including commercial
22
banks, development financial institutions, finance companies and micro-finance
institution. Banks in their part need to strengthen their audit and compliance
functions. They would be evaluated based on their performance in the market place,
both in terms of their financial performance and also on the regulatory and
compliance issues.
The Nepalese banking sector is at an exciting point in its development. The
opportunities to enter new business and new markets and to deliver higher levels of
customer service are immense. As the Nepalese banks position themselves as
financial service providers, banking business is getting redefined. Technology is
unsettling the earlier business processes and customer behavior is undergoing
considerable changes. These have enhanced the forces of competition. As compared
to earlier regime, Nepalese banks have adopted better operational strategies and
upgraded their skills. They have withstood the initial challenges and have become
more adaptive to the changing environment.
Four trends will fundamentally alter the banking industry in future: consolidation and
merger, globalization of operations, development of new technology and sustenance
of traditional services. With the new capital adequacy norms coming through, it is
expected that few banks have no choice but to merge. In order to have sustainable
growth in the bottom lines, banks must increase their global market operations,
especially in treasury products by being more innovative and selecting a pool of
products which the global market is offering today to reward the calculated risk taken
by the banks. Nepal Rastra Bank’s support for liberalizing the global market
operations is highly evident. Technological advancement and new ways of doing
banking business must be a continuous process.
It is said that the banking sector mirrors the larger economy. Its linkages to all sectors
make it a proxy for what is happening in the economy as a whole. Indeed, the
Nepalese banking sector today has the same sense of excitement and opportunity that
is evident in the Nepalese Economy. The fundamental structural changes in recent
years have taught us many lessons. A combination of developments arising form
technological advancements and a liberalized marketplace-disintermediation, blurring
23
of traditional roles and boundaries, emphasis on shareholder value creation – has led
to a transformation of the banking sector.
Commercial Banks are one of the vital aspects of this sector, which deals in the
process of canalizing the available resources in the needed sectors. It is the
intermediary between the deficit and surplus of financial resources. Financial system
contains two components viz., depository financial institutions and non depositary
financial institutions. Commercial Banks and Finance Companies (in Nepalese
context) are the examples of depository financial institutions whereas Employee
Providence Fund, Development Banks, Insurance Companies etc. are the examples of
non-depository financial institutions. All the economic activities are directly or
indirectly channeled through these banks.
Financial institutions make the flow of investment easier as it pools the funds
scattered in the economy and mobilized them o the productive sector. But these
institutions inherent a large amount of risk, which cannot be, denied either. If a bank
behaves irresponsibility, the costs borne by the economy are enormous. A large
amount of depositors’ money is at stake.
Bank came into existence mainly with the objectives of collecting the idle funds,
mobilizing them into productive sector and causing an overall economic development.
The bankers have the responsibility of safeguarding the interest of the depositors, the
shareholders and the society they are serving.
2.1.6 Concept of Credit
Credit is the sum amount of money lent by the creditor( Bank) to the
borrower(Customer) either on the basis of security or without security. Sum of money
lent by the bank, is known as credit ( Oxford Advanced Learners Dictionary, 1992).
Credit and advances are important items on the asset side of the balance sheet of the
commercial bank. Bank earns interest on credits and advances, which is one of the
major sources of income for banks. Bank prepares credit portfolio, otherwise it will
not only add bad debts but also affect profitability adversely( Varhney and Swarrop,
1992:42)Credit is financial assets resulting from the delivery of cash or other assets

24
by a lender to borrower in return for an obligation of repay on specified on demand.
Banks generally grants credit on four ways ( Chhabra and Teneja, 1991).
Overdraft
Cash Credit
Direct Credit
Discounting of Bills
2.1.7 Types of Credit
Overdrafts
It denotes the excess amount withdrawn over their deposits. In other words, bank
provide sum limit of money to their value customer according to their believe and
level of transaction.
Cash Credit
The credit is not given directly in cash but deposit account is being opened on the
name of credit taker and the amount credited to that account. In this way, every credit
creates deposit.
Term Credit
It refers to money lent in lump sum to the borrowers. It is principle form of medium
term debt financing having maturity period of 1 to 8 years. Barely and Myars urge
that bank credits with maturities exceeding 1 year are called term loan. The firm
agrees to pay interest based on the bank’s prime rate and to repay principle in the
regular installments. Special patterns of principle payments over time can be
negotiated to meet the firm’s special needs (Richard, 1996:89).
Working Capital Credit
Working capital denotes the difference between current liabilities. It is granted to the
customers to meet their working capital gap for supporting production process. A
natural process develops in funds moving through the cycle are generated to repay a
working capital credit.
Priority or Deprived Sector Credit:
Commercial banks are required to extend advances to the priority and deprived sector.

25
12% of the total credit must be forwarded toward priority sector including deprived
sector. Rs. 2 million for agriculture cum service sector and Rs. 2.5 million for single
borrowers are limit sanctioned to priority sector. Institutional support to “Agriculture
Development Bank” and “Rural Development Bank” are also considered under this
category. Deprived sector lending includes:
Advances to poor/ downtrodden/weak/deprived people up to Rs.30,000 for
generating income or employment.
Institutional Credit to Rural Development Bank.
Credits to NGOs those are permitted to carryout banking transactions for
lending up to Rs.30000.
Hire Purchase Financing (Installment Credit)
FI also extend credit to their customers. It is different types such as residential
building, commercial complex, Construction of warehouse, etc. It is given to those
who have regular income or can earn revenue from housing project itself.
Project Credit
Project credit is granted to the customers as per project viability. The borrowers have
to invest certain proportion to the project from their equity and the rest will be
financed as project credit. Construction credit is short term credits made to developers
for the purpose of completing proposed projects. Maturities on construction credits
range from 12 months to as long as 4 to 5 years, depending on the construction credits
range from 12 months to as long as 4 to 5 years, depending on the size of the specific
project. The basic guideline principle involved in disbursement policy is to advance
funds corresponding to the completion stage of the project. Term of credit needed for
project fall under it (Johnson, 1940:83).
Consortium Credit
No single FI grant credit to the project due to single borrower limit or other reason
and so two or more such institutions may consent to grant credit facility to the project
of which is baptized as consortium credit. It reduces the risk of project among them.
Financials bank equal (or likely) charge on the project’s assets.
26
Credit cards and Revolving Lines of Credit
Banks are increasingly utilizing cards and revolving lines of credit to make unsecured
consumer credit. Revolving credit line lowers the cost of making credit since
operating and processing cost are reduced. Due to standardization, centralized
department processes revolving credits resulting reduction on administration cost.
Continued borrowing arrangement enhances cost advantages. Once the credit line is
established, the customer can borrow and repay according to his needs and the bank
can provide the fund to the customer at lower cost.
Off –Balance sheet Transaction:
In fact, bank guarantee and letter of credit refer to off balance sheet transaction of
financial institution. It is also known as contingent liability. Contingent liability
pinpoints the liability, which may or may not arise during the happening of certain
event. Footnotes are kept as references to them instead of recording in the book of
accounts. It is non-funded based remunerative facilities but more risky than the
funded until adequate collateral are not taken. Lets its two varieties be described
separately.
Bank Guarantee
It is used for the sake of the customers in favor of the other party (beneficiary) up to
the approved limit. Generally, a certain percent or amount is taken as margin from the
customer and the customer’s margin account is credited.
Letter of credit
It is issued on behalf of the customer (Buyer/Importer) in favor of the exporter(Seller)
for the import of goods and services stating to pay certain sum of money on the
submission of certain documents complying the stipulated terms and conditions as per
the agreement of L/C. It is also known as importers letter of credit
2.1.8 Credit Risk
FI transforms claims of household savers (in the form of deposit) into loans issued to
corporations, individuals and government. FI accepts the credit risk on these loans in
exchange for a fair return sufficient to cover the cost of funding (e.g. Covering the
costs of borrowing or issuing deposits) to household savers and the credit risk

27
involved in lending. Credit risk arises because of the possibility that promised cash
flows on financial claims held by FIs like loans & bonds will not be paid in full which
affect severely into bank’s profitability because of various reasons such as
deteriorating quality of assets, risk of non payment of loan, risk of payment of higher
interest rate on deposits, and risk of deterioration of bank’s image. If the principal
and interest of all financial claims were paid, there won’t be credit risk.
Credit risk for commercial bank may arise due to various reasons such as external and
internal elements relating to borrowers, lack of sound mechanism for information,
false financial information given by borrower, lack of transparency among banking
sectors, lack of credit rating agencies, etc. Diversification is the major tool for
controlling or managing unsystematic credit risk that has been exemplified in the
study of bank mergers.
Credit risk is the most important and greatest risk for commercial banks of Nepal as
substantial portion of their balance sheet contains credit portfolio. The risk is of
greatest importance to commercial banks as it can be assessed, mitigated, controlled,
and hedged due to which tremendous attention is given by banks, investors,
regulators, and practitioner.
Individual banks and banking groups are required to have in-place a comprehensive
risk management policies and processes to identify, evaluate, monitor and control or
mitigate material risks. Supervisors must be satisfied that banks have a credit risk
management process that takes into account the risk profile of the institution, with
prudent policies and processes to identify, measure, monitor and control credit risk
(including counterparty risk). This would include the granting of loans and making of
investments, the evaluation of the quality of such loans and investments and the
ongoing management of the loan and investment portfolios.
2.1.9 Risk Management
Banks are by their very nature in the risk management business and risk in an integral
part of banking. However, with the continuing increase in the scale and complexity of
the banking business and the rapid growth in the volume of their financial
transactions, risk management strategies include the transferable of risk to other
28
parties, avoidance of risk, reduction of the negative effect of the risk and acceptance
of the consequences of a particular risk. The design of a risk management system in a
commercial bank depends among other things, on its size, capital structure,
complexity of functions, technical expertise, quality of MIS and the like. It is
structured to address both banking as well as non-banking risks. With a view to
maximize ensures that the bank takes well-calculated business risks while
safeguarding the bank’s capital, its financial resources and profitability. The bank’s
primary business activity is commercial banking where substantial risk comprises of
credit risks. To a lesser extent, commercial banking activities also expose the bank to
market risk arising from reprising; maturity and currency mismatches give rise to
interest rate risk, liquidity risk and foreign exchange risk. The BOD of NIBL
recognizes that a critical factor in the bank’s continued growth, profitability and
stability is its effective risk management capabilities and risk return trade-off. In this
respect, the bank ensures its risk management capabilities and also continuously
promotes a pro-active risk management culture in the bank
2.1.10 Credit Risk Management
Credit risk is the probability that a borrower of counterparty will fail to meet its
obligations in accordance with the terms of approval of the credit. This includes non-
repayment of capital and/or interest within the agreed time frame, at the agreed rate of
interest and in the agreed currency.
Various branches are the business units of the bank. Each branch forwards business
proposals to the Head of Credit Division, Head Office. The Credit Division critically
analyses the proposal from different perspectives in line with statutory, regulatory and
internal guidelines. Thereafter, if the business proposal is found to be creditworthy, it
is placed in the Credit Committee. The Credit Committee is comprised of seasoned
bankers who evaluate credit proposals. The Committee analyzes in depth financial as
well as non-financial information regarding the borrower such as business history,
market situation, and future prospects of the market, managerial capabilities, cash
flow and then declines or recommends approval of the designated credit authorities.
To ensure proper and adequate risk analysis and timely customer service, Credit
Policy and Procedures Guide (CPPG) provides various layers in the credit approval

29
process. The CPPG has conferred specific credit discretions ranging from the General
Manager to the Executive Credit Committee, the penultimate authority of the bank.
Adoption of international standards via their in-house Credit Policy and Procedures
Guide.
Formation of Credit Quality Control (CQC) unit for monitoring the quality of
credit, both at the account level and portfolio level.
Regular review of the credit portfolio by the Senior Management with periodic
reporting to the BOD.
Separate independent audit and inspection of borrowers by internal auditors in
addition to audit and inspection by statutory auditors.
Strict adherence to the prudential guidelines of the Central Bank on London
Classification, Interest Recognition, Asset Classification, Single Obligor Limit,
Sectored Exposure etc.
Establishing suitable exposure limits for borrowers and sectors and monitoring the
limits on a regular basis.
Risk mitigation steps with a special emphasis on collateral.
Setting counterparty limits based on financial strength.
Training of lending and legal officers on documentation and professional
valuations. Developing skills and expertise of lending officers to scientifically
assess project viability and customer integrity.
Educating the staff on provisions in the banks and Financial Institution Act and
other relevant statues and the regulatory guidelines of the Central Bank.
Seeking external legal option and advice.
Identifying Early Warning Signals (EWS) and taking prompt action thereon.
Constant post sanctions monitoring with special independent team for verification
of hypothetical stocks.
2.1.11 Market Risk Management
Market risk is the uncertainty in the future value of the bank’s on balance sheet and
off balance sheet financial items resulting from movements in factors such as interest
rates, foreign currency exchange rates, equity prices and commodity prices. The
Asset Liability Management Committee (ALCO) services as the primary oversight
30
and decisions for the bank’s management of market risk and liquidity risk of the bank.
The key elements in the market risk management framework are principles, risk limits
and risk measures.
2.1.12 Foreign Exchange Management
Foreign exchange risk arises from exchange rate movements which affect the profit of
the bank from its foreign exchange open positions. This risk is managed by setting
pre-determined limits on open foreign positions, the monitoring of the open foreign
positions, the monitoring of the open positions against these limits and the setting and
monitoring of their stop-loss mechanism.
Important Risk Management Measures of the Bank to Address Market Risk and
Foreign Exchange Risk include:
A pro-active Assets Liability Management Committee (ALCO) that meets on weekly
basis.
Review of ALCO decisions by top Management and BOD
Conduction of gap analysis, timely re-pricing of products and hedging of exposures.
Risk management via forward contracts, swaps and currency options.
Daily monitoring of Credit to Deposit (CD) ratio.
Maintaining the Liquid Asset Ratio with a contingency buffer.
Constant monitoring of dealer, broker, counterparty, transaction, product and
currency exposure limits.
Regular monitoring of competitor behavior and building competitor intelligence.
Maintaining strong relationship with correspondent banks.
Enhancing fee based income to reduce dependence on fund based income.
Non-engagement in large scale transactions on a speculative basis.
Separation of front and back officers at the treasury department.
2.1.13 Liquidity Risk Management
The objective of liquidity management is to ensure that the bank has sufficient funds
to meet its contractual and regulatory financial obligations at all times. Liquidity risk
relates to the ability of the bank to maintain sufficient liquid assets at reasonable cost
to meet its financial obligations as and when they fall due. The bank’s liquidity policy
is to ensure that all contractual commitments can be met by readily available sources
31
of funding. In addition, liquid assets are maintained in relation to cash flows to
provide further sources of funding in the event of a crisis. The bank also has excellent
access to financial markets to ensure the availability of funds. With in 2010, Nepal
will open its doors to foreign banks allowing them to set up branches in Nepal. Given
their highly competitive strength and nature, it is imperative for Nepalese bankers to
enhance their efficiency and competitiveness to meet future challenges. For this
purpose, Nepalese bankers have to improve on all accounts, be it human resource,
information technology, capital resource, branch network, product development,
service standard and the like. One of the ways to augment capacity and pool the
required resources is to go for an M & A option. In this context, they believe banks
should merge to achieve synergy in operations and increased profitability.
2.1.14 Process of Credit Disbursement in NIBL
1. Application Form
The first step of credit is to fill the application form i.e. the customer must apply for
the loan specifying the amount of loan that is required and the purpose of the loan.
The applicant has to specify all the information in the form.
2. Information Sheet
After applying for the loan, information sheet should be filled by the applicant
provided by the bank. That includes: Firm ownership License detail History of the
organization Promoters’/managers’ experience Process of the firm (production, raw
material, supply and distribution through direct interview Market (clients) Balance
Sheet Sister concerns Other sources of income Business risk Loan from other banks
3. Proposal Credit Memorandum
After getting all the required information, proposal for credit memorandum is made
analyzing SWOT Analysis (competition and environment benefit and soundness of
the (firm) and including all the information gained from information sheet and direct
interview, the credit policy and collateral provided by the applicant after value
calculation through the agents either by IBB Engineering & Consultancy or Apex
Construction or Debendra & Associates specifying the return from the loan.

32
4. Executive Committee
The proposal credit memorandum is forwarded to the executive committee to finalize
whether it is appropriate to provide the loan to the applicant. Executive committee is
the team of the bank that determines that whether the loan is going to be good or not
and whether to disburse or not.
5. Disbursement
After the executive committee reviews the loan application or credit proposal, it
approves the loan and then the loan is disbursed either by cash as spot loan or loan
commitment.
2.1.15 Measurement of Credit Risk
Measurement of credit risk on individual loans or bonds is crucial of an FI manager is
to Price a loan or values a bond correctly, and (2) set appropriate limits on the amount
of credit extended to any one borrower or the loss exposure it accepts from any
particular counterparty. For example, the Industry Perspectives box highlights how
the default of one major borrower can have a significant impact on the value of an FI.
Thus managers need to manage the FI’s loan portfolio to protect the overall FI from
the failure of a single borrower. Management of overall loan portfolio is equally
important. Traditionally, managing the credit portfolio was risk management. But the
marketplace is broader and more complex today, and best-practice institutions know
they need to measure and manage risk across the entire enterprise. We recognize that
managing Credit Risk is still essential to enterprise-wide risk management, so we
offer products and services to institutions and individuals involved in retail,
commercial, and corporate credit risk. RMA is the premier provider of commercial
credit education and information.
2.1.16 Default Risk Models
Economists, analysts, and FI managers have employed many different models to
assess the default risk on loans. These vary from the relatively qualitative to the
highly quantitative models. Proper financial risk management is one of the main
pillars of financial health of the banks. But traditional techniques for credit risk
assessment, widely used by commercial banks have their limitations. One of such
drawback is that they analyze credit risk of particular bank, based on information of
33
previous periods, and not at the moment of the transaction. The models that can be
used to manage the default credit risk are as follows.
Qualitative Models
The FI manager has to assemble information from the private sources as credit and
Deposit files and from external sources, credit rating agencies in absence of publicly
available information on quality of borrower. A number of key factors enter into the
credit decision that include. Borrower specific factor
Reputation: The borrower’s reputation that involves the borrowing – lending history
of the credit applicant that can be established only over time through repayment and
observed behavior which is difficult for the new borrowers.
Leverage/Capital structure/Ratio of debt to equity: It affects the probability of its
default. Large amount of debt, like loans and bonds increase the borrower’s interest
charges and pose a significant claim on its cash flows.
Volatility of earnings: A high volatile earning stream increases the probability that
the borrower cannot meet fixed interest and principal charges for any given capital
structure.
Collateral: Loan pricing decision depends upon the degree of collateral or assets
backed security of the loan as it gives the first claim to the leader.
Market specific factor
Business cycle: The position of the company economy in the business cycle phase is
very important to an FI in assessing the probability of borrower default as if in
recession phase of business cycle of luxury products would be risky than the necessity
products in recession.
Level of interest rate: Generally, high interest rates are correlated with higher credit
risk. It may encourage borrowers to take excessive risks or encourage only the most
risky customers to borrow.
34
Credit Scoring Models
Mathematical models that use observed loan applicant’s characteristics either to
calculate a score representing the applicant’s probability of default or to sort
borrowers into different default risk classes. From the economic and financial
characteristics, an FI manager can establish important factors explaining default risk,
evaluate relative degree of that factor, improve pricing of default risk, easily screen
out bad loan applicants, and calculate reserves needed to meet expected future loan
losses. Consumer loan may include income, assets, age, occupation of the applicant
and cash flow information, financial ratios, statistical tools like linear probability
models are required for Commercial and Industrial loans.
Derivation of Credit Risk/Credit Derivation
It is to analyze the risk premiums inherent in the current structure of yields on
corporate debt or loans to similar risk rated borrowers. Rating agencies like Standard
& Poor (S&P) categorized corporate bond issuers into different classes of credit
quality rating. For example, AAA, AA, A indicates investment quality borrowers.
Derivative market has already been grown in the western countries as banks,
securities firms, corporations and other institutes exercised hedging their credit risk
exposure or realign their lending portfolio or against adverse moves in credit quality
of their investment. It has not been used yet in Nepal. It will be totally new approach
for Nepali FIs. Credit derivatives may be used to manage realized default risk as
credit swaps. Swaps will help banks to manage the risk relating to default risk,
interest rate risk and currency exchange rate risk. Nepal has stated that there was
growing market for credit derivatives that had provided powerful new tools for
managing credit risk that are less costly and more effective than traditional models.
2.2 Review of Related Studies
2.2.1 Review of Articles and Journals
Bajracharya (2007), in his article “Monetary policy and deposit mobilization In
Nepal” has concluded that mobilization of the domestic saving is one of the prime
objectives of the monetary policy in Nepal. And commercial banks are the most active
financial intermediary for generating resources in the form of deposit of private sector
and providing credit to the investors in different sectors of the economy.

35
Bhandari (2008), says that in banking sector or transaction, an availableness of loan
management and its methodology is regarded very important. Under this
management, many subject matters are considered and thought. For example, there
are subject matters like the policy of loan flow, the documents of loan flow, loan
administration, and audit of loan, renewal of loan, the condition of loan flow, and the
provision of security, the provision of the payment of capital and its interest and other
such procedures. This management plays a great role in healthy competitive activities.
It is very important to be reminded that most of the bank failures in the world are due
to shrinkage in the value of loan and advances..Hence the risk of non payment of loan
is known as credit risk or default risk(Dahal,2002:114).Portfolio management helps to
minimize or manage the credit risk by spreading over the risk to various portfolios.
This method of managing credit risks is guided by the saying, Do not put all the eggs
in a single basket.
2.2.2 Review of Related Thesis (Dissertations)
Paudel (2001), in his Thesis “ A study on lending practices of joint venture
commercial banks with reference to Nepal Bangladesh Bank Ltd.(NBBL) and
Himalayan Bank Ltd.(HBL)” has made comparative study of these two banks in
different lending aspects and strategies.
In his findings, the liquidity position of NBBL is comparatively better than HBL. The
liquidity ratio of HBL is more stable and consistent than NBBL that indicates the
stable policy of HBL. NBBL is found slightly better to be maintaining between assets
and liabilities. NBBL has high loan and advances to total assets ratio, loan and
advances to total deposit ratio, but HBL has high investment to total loan and
advances and investment to total deposit ratio. He has concluded that NBBL is able to
manage its assets to complete in this competitive banking business than HBL.As per
the findings the liquidity position of NBBL is better and hence HBL is recommended
to increase its liquidity position. He has suggested both banks to strictly follow the
NRB directives, which will help them to reduce credit risk arising from borrower’s
default, lack of proper credit appraisal, defaulter by blacklisted borrowers and
professional defaulter. Loan loss provision of both banks is in fluctuating trend. So
both banks are suggested to adopt sound credit collection policy which will help to
decrease loan loss provision.

36
The main objective of his thesis “Lending practices of Joint Venture Commercial
banks with reference to NBBL and HBL” is investment criteria and sector, loan
distribution and advance practice of joint venture bank. The limitation of the thesis
was that it was based on secondary data given by respondents five year‘s data and non
ending years data.
Ojha (2002), in his dissertation about “Lending Practices” has written that the
commercial banks have to expand their credit in the area of rural economy so as to
compromise between the liquidity and credit need such economy. This helps in
minimizing the idle fund in business and at the same time contribute to the national
economy. The banks should also increase the volume of credit in the sector of
agriculture as the ratio of contribution made by the banks in this priority sector is
decreasing.
Researcher has found out that following the normal guidance of Nepal Rastra Bank
and acting upon reduces many of the credit risk arising from borrower’s defaulter,
lack of proper credit appraisal, defaulter by blacklisted borrowers, and professional
defaulter, The over confidence of commercial banks regarding credit appraisal
efficiency and negligence while taking information from Credit Information Bureau
(CIB) has caused many of the bad debts in these banks. He thinks that these banks
have to follow the directives of NRB strictly and be more cautious and realistic while
granting loans and advances.
The high volume of liquidity reveals that a degree of lending strength has been
prevailing in all of the commercial bank. The lack of reliable lending opportunities
and fear of losing the principle in rural sector has been keeping these banks less
oriented towards the lending function. Hence, the government should take appropriate
action to initiate these banks to attract the flow of credit in rural economy. Posing the
compulsions by directives does not create long term healthy lending practices unless
the commercial banks are not self motivated to flow credit in this sector.
Joshi (2003), In “A Comparative Study of Financial Performance of Standard
Chartered Bank Nepal Limited and Everest Bank Ltd.” States that the mean current
37
ratio of EBL is slightly higher than that of the SCBNL and the variability of ratio of
EBL is more consistent than s SCBNL in comparison, The mean ratio of cash and
bank balance to total deposit of SCBNL is lower in comparison to EBL. SCBNL has
better liquidity position than EBL because of the high volume of liquidity indicates
the inability of the bank to mobilize its current assets. Moreover SCBNL’s ratio are
homogenous than EBL. The mean ratio of cash and bank balance to current assets of
SCBNL is lower in comparison to EBL. Similarly, SCBNL’s ratio of the study period
is more consistent than EBL. The mean ratio of loan and advances to total deposit of
EBL is higher than SCBNL. It can be said that EBL used to provide greater loan and
advance in comparison to its total deposit than SCBNL. Likewise, SCBNL‘s ratio
seems to be variable than EBL. The mean ratio of investment on government
securities to total working fund of SCBNL is higher than EBL. Consequently, it has
consistency in maintaining the ratio than EBL. The mean ratio of return on loan and
advances of SCBNL has found to be significantly greater than EBL with more
consistency than that of EBL. The mean ratio of credit risk of SCBNL is lower than
that of EBL’s ratio are more consistent than that of SCBNL. Growth ratio of deposit
are consistent than that of SCBNL is lower i.e. 19.28 % in comparison to EBL i.e.
76.46%.
The main statement of the problem of his research is the investment decision is the
major tool of financial institution. There are many finance companies and commercial
banks operating in Nepal. The fast growth of such organizations has made pro-rata
increment in collecting deposits and their investment, They collect adequate amount
from the mass, however they could not find or locate new investment sectors required
to mobilize their fund on the changing context of Nepal. Many banks or companies
succumbed to liquidation although they had sustainable investment capacity. The
increasing rate of liquidity has caused downward trend in investment sectors. It has
ensured bad impact on interest rate of depositors, lower market value of shares, etc.
for the assessment of such adverse impact, this study has shown to contrast and
analyze the investment policy of joint venture banks, Joint venture banks viz.
Standard Chartered Bank Nepal Ltd. and Everest Bank Ltd. The main objectives are
to compare investment policy of concerned banks, find out the empirical relationship
among total investment, deposit , deposit utilization, loan and advance, net profit and
outside assets and comparison of SCBNL and EBL.
38
Regmi (2004), in the study Entitled “Credit Management of Commercial Banks with
Reference to Nepal Bangladesh Bank and Bank of Kathmandu” states that
commercial banks are those banks which work form commercial view point. They
perform all kinds of banking functions such as, accepting deposits, advancing credits,
credit creation and management of credit and advances. Portfolio management helps
to minimize or manage the credit risks and spreading over the risks to various
portfolios. Banks earn interest on credit and advances which is one of the major
sources of income for banks. On average, 5 years of research period, cash and bank
balance to total deposits of ratio of NB bank and BOK is 12.75% and 14.12%
respectively. Likewise NB Bank and cash and bank balance 1.584 times of current
deposits and BOK has cash and bank balance 1.014 times of current assets. NB bank:
most of the credit and advances almost 70% is provided as assets guarantee. The
assets guarantee credit is increasing period by period. After assets guarantee bank
provides credit on bills guarantee credit is 3421.3 millions (76.1% of total credit) and
in the last period it is 3347.99 millions (58.2% of total credit)
The main statement of the problem of his research is that Nepal is a small country
with small market. Economic condition of the county is degrading. Nepal being an
agriculture county needs more investment in this sector. Nevertheless, commercial
banks are rather concerned in industrial and foreign projects. As a result, the credit
extended to this sector is unsatisfactory. Besides, they are not even fulfilling the
NRB”s regulation of 12% investment of their total loans to priority sectors like
agriculture, cottage and small industries and services. Similarly, the banks are not
following the diversification principle i.e. they are not considering the investment
portfolio position. A good portfolio theory indicates diversification of investable
funds to reduce risks . Hence, the principle do not put all the eggs in a basket” really
does not apply in context of Nepalese commercial banks. As a result, many banks
today could not recover their loan because, in the past, a major portion of their
investment were made in garment, carpets and hotel sectors that has now come to the
brick of extinction. The objectives of this research are to analyze the functions,
objectives, activities, credits and advances procedure and recovery status of the NB
bank and BOK.

39
Shrestha, S, (2005) in his dissertation “Credit management with special reference to
Nepal SBI Bank Ltd” illustrates that lending is one of the most important parts of
function of a commercial bank and composition of loan and advances directly affects
the performance and profitability of the bank. There is intense completion in banking
business with limited market and less investment opportunities available. Every bank
is facing the problem of default loan and there is always possibility of a certain
portion of the loan and advances, profitability deposits position of Nepal SBI Bank
Limited is analyzed and its contribution in total profitability has been measured.
The main statement of the problem of his study is that credit management is the
essence of commercial banking. Consequently, the formulation and implementation of
sound credit policies are among the most important responsibilities of bank directors
and management. Well conceived credit policies and careful credit practices are
essential if a bank is to perform its credit creating function effectively and minimize
the risk inherent in any extension of credit management effects on the company’s
profitability and liquidity. So it is one of the crucial decisions for the commercial
banks. Measuring the credit performance in quality, efficiency and contribution of
profitability, liquidity position and its effect on credit performance and measure the
growth rate and propensity of growth based of trend analysis are the main objectives
of his dissertation.
Gurung (2006), explored in his research “Lending policy and recovery management
of Standard Chartered Bank Nepal Ltd and NABIL Bank Ltd” has found out that the
deposit collection by the banks shows that the it is increasing but in fluctuating trend.
The trend analysis of deposit collection assumes that deposit collection in the
forthcoming years will continue. Out of different types of deposit collection account,
higher account has been collected in saving deposit account. Out of the total deposit
collection, SCBNL has disbursed 36% of average as a loan and NABIL has disbursed
52% of its deposit collection as a loan disbursement to deposit collection ratio. Thus,
this ratio is quite low in case of sample bank especially of SCBNL. It is further
proved by the calculations of correlation coefficient which is 0.75 and 0.23 of SCBNL
and NABIL respectively.
40
In order to analyze the recovery management of these banks, their loan provision and
NPL were analyzed, while looking at the loan loss provision of SCBNL it is in
decreasing trend from 2002. The correlation coefficient of loan loss provision and
loan disbursement of SCBNL is 0.36. While looking at the future trend of loan loss
provision it shows the increasing trend in case of SCBNL and the trend of Loan loss
provision is decreasing every year in case of NABIL, which is proved by the trend
analysis. The correlation of loan loss provision and loan disbursement of NABIL is
negative .The main statement of his problem is there are many banks mushrooming.
Although banks are not interested to expand heir branch in remote rural area..there are
difficulty and lengthy formality of procedure for long term and medium term as well
as short term loan. Low deposit habit of Nepalese people and lack of strong recovery
act of lending and bad debt. The main objectives of dissertation are loan and advance
providing procedure of bank, lending and investment sector of bank, recovery
condition of both SCBNL and NABIL bank.
Mirsra (2007), entitled her thesis “Credit Management of Everest Bank Limited”
illustrate that liquidity position; cash reserve ratio shows the more liquidity position.
Cash and bank balance to current assets ratio shows that the bank is able to maintain
good financial condition. Cash and bank balance to current assets ratio shows that the
bank’s ability to meet the daily cash requirement of their customer’s deposit. That is
why liquidity position of the bank is better.
In the aspect of profitability position, interest income to interest expenses ratio shows
the more profitable salivation. In addition, total income to total expenses ratio shows
that the overall predominance of the bank is satisfactory. Return on loan and advances
shows profitable position of EBL. Analysis of assets management ratio, loan advances
to total assets ratio shows the better performance but loan and advances to total
deposit position is minimum than the averages. Whereas, investment in loan and
advances is safe and does not take any risk. That’s why, assets management position
of the bank shows better performance in the latest year.
After analyzing the lending efficiency of the bank, the loan lo provision to loan
advances indicates the better performance in the latest year. The interest expenses to
total deposit ratio shows the improving efficiency of the bank. EBL has sufficient
41
liquidity. It shows that the bank has not got investment sectors to utilize their liquid
money. This is to recommend that cash and bank balance of EBL is high. Bank’s
efficiency should be increased to satisfy the demand of depositors at low level of cash
and bank balance does not provide returns to the bank. Therefore, some percentage of
the cash and bank balance should be invested in profitable sectors. Bank should open
up its branches in remote areas with the objective to provide the banking services and
minimum deposit amount should be reduced. The main objectives of this study are to
evaluate the credit management and to examine the impact of deposit in liquidity.
Limbu (2008), in his dissertation “Credit Management of Nabil Bank Limited”
highlighted that aggregate performance and condition of Nabil Bank. In the aspect of
liquidity position of liquidity position, cash and bank balance reserve ratio shows the
more liquidity position. Cash and bank balance to total deposit has fluctuating trend in
5 year’s study period. Cash and bank balance to current deposit is also fluctuating.
The average mean of cash and bank balance to interest sensitive ratio is able to
maintain good financial condition.
In the aspect of assets management ratio, assets management position of the bank
shows the better performance in the recent years. Non performing assets to total assets
ratio is decreasing trend. The bank is able to obtain higher lending opportunity during
the study period. Therefore, credit management is in good position of the bank. In
leverage ratio, debt to equity ratio is in increasing trend. High total debt to total assets
ratio shows higher financial risk and vice-versa. It represents good condition of total
assets to net worth ratio. In the aspect profitability position, total net profit to gross
income, total interest income to total income ratio of the bank is in increasing trend.
The study shows the little high earning capacity of NABIL through loan and
advances. Earning per share and the price earning ratio of NABIL is also in increasing
trend. These mean that there is better profitability in the coming years. It represents
high expectation of company in market and high demand of share. Loan loss
provision to total loan and advances ratio and non performing loan to total loan and
advances of NABIL is in decreasing trend. The ratio is continuously decreasing which
indicates that bank’s increasing performance. Thus, credit management is in good
position.
42
The main objective of the research study is to evaluate various financial ratios of the
bank, to analyze the portfolio of lending of selected sector of banks, to determine the
impact of deposit in liquidity and its effect on lending practices and to offer suitable
suggestions based on findings of the study. In the statistical tools analysis, average
mean, correlation analysis and trend analysis have been calculated. Correlation
coefficient between total credit and total assets shows high degree of positive
correlation. Correlation coefficient between total deposit and loan and advances has
high degree of positive correlation. It is concluded that increasing total deposit will
have positive impact towards loan and advances.
2.3 Research Gap
The purpose of this study is to develop some expertise in one’s area, to see what new
contribution can be made and to receive some ideas, knowledge and suggestions in
relation to credit management of Nepal Investment Bank. Thus, the previous studies
can’t be ignored because they provide the foundation to the present study. In other
words, there has to be continuity in the research process. This continuity in research is
ensured by linking the present study with the past research studies. Here, it is clear
that the new research cannot be found on the same topic, i.e. “Credit Risk
Management of Nepal Investment Bank. Therefore, to fulfill this gap, this research is
selected taking previous research studies as guideline. To complete this research work
many books, articles, journals and various published and unpublished dissertations are
also followed as guideline to make the present research smooth and easier to make. In
this regard, here we are going to analyze the different procedures regarding credit
management, which is only considered by Nepal Investment Bank. Our main research
problem is to analyze whether NIBL has right level of liquidity or not and as well as
to see where it is using proper financial and statistical tools or not Similarly, trend
analysis of investment and profit are reviewed to make this research complete.
Therefore, this study is useful to the concern bank as well as different persons such as:
shareholders, investors, policy makers ,stock brokers ,state of government and so on.

43
CHAPTER III
RESEARCH METHODOLOGY
3.1 Introduction
Research methodology describes the methods and process applied in the entire aspect
of the study .the main objective of this research is to measure the credit risk of the
selected commercial banks and to study the various management techniques and
principles used by the Nepalese commercial banks to manage the credit risk. Thus,
this chapter consists of the research methodology applied in the study for the
fulfillment of the stated objectives. Thus, the overall approach to the research is
presented in this chapter. This chapter consists of research design, sample size and
selection process, data collection procedure and data processing and presentation
techniques and tools.
3.2 Research Design
This study is the combination of descriptive and analytical type of research .historical
data are used to identify and analyze the credit risk of a bank in the past period
.similarly management system ,organizational structure policies for mitigating the
credit risk and the credit risk management procedures have been presented in
descriptive from so as to identify the current status from which pitfalls can be
identified .From collection of past data and information from key informants, the
credit risk management system has been analyzed and recommendations have been
for improving the credit risk management of banks. . Secondary data are mostly used
for this research purpose. The major sources of secondary data are as follows: Annual
report of Nepal investment bank NRB directives. Economy survey of government of
Nepal and ministry of finance. Newspaper, journals, articles and various magazines.
Dissertation of central library of T.U. and library of Shanker Dev Campus.
3.3 Population and Sample
Since the research topic is about “Credit Risk Management of Nepal Investment Bank
Limited”, so here all the total 26 commercial banks established in Nepal constitute or
form the population. The population for the study comprises all the Nepalese

44
commercial banks. Among that population, the researcher has selected the
commercial bank named NIBL, as the sample under the study. The sample is chosen
with an objective to find out the credit risk management of NIBL, which has
successfully completed glorious 25 years. Likewise, financial statements of five years
(beginning from 2004/2005 to 2008/2009 ) are selected as samples for the purpose of
it.
3.4 Data Collection Procedure
Especially the annual report of Nepal investment bank limited and the website of
concern bank limited are taken as main source of data collection for purpose of study
.NRB publication such as economic report and bulletin, banking and financial
statistics, annual report of NRB etc .other main source is website of NRB and website
of Nepal share market. Most of the data and substance are obtain from above source.
3.5 Method of Data Analysis Technique
For the purpose of the study all collected primary as well as secondary data are
arranged, tabulated under various heads and them after disunities and statistical
analysis have been carried out to enlighten the study. Mainly financial methods are
applied for the purpose\ of this study. Appropriate statistical tools are also used. To
make the study more specific and reliable, the researcher uses two types of for tool
analysis,
1 Financial analysis
2 Statistical analysis.
3.5.1 Financial tool
Stakeholders of a business firm perform several types of analysis on a bank is
financial statements. All of these analyses rely on comparisons or relationship of data
that enhance the utility or practical value of accounting information.
45
3.5.1.1 Ratio Analysis
A ratio is simply one number expressed in term of another and as such it express the
quantitative relationship between any two numbers. Ratio refers to the numerical or
quantitative relationship between two items/variables. A ratio is calculate by dividing
one item of relationship with the other. A ratio can be expressed in term of
percentage, proportion, and as a coefficient. A ratio is a figure or a percentage
representing the comparison of two variables or any substance. The relationship
between two accounting figure, expressed mathematically is known as financial ratio.
The technique of ratio analysis is part of the whole process of analysis of financial
statement of any business and industrial company especially to tame output and credit
decision. It is defined as the systematic use of ratio to interpret the financial
statements so that the strength and weakness of a firm as well as its historical
performance and current financial condition can be determined. Thus ratio analysis is
useful to evaluate, judgment and taking appropriate decision.
A. Liquidity Ratio:
Liquidity means the ability of a firm to meet its short-term or current obligations.
Liquidity ratios are used to measure the ability of a firm to meet its short-term
obligations and the present cash solvency as well as ability to remain in debt. It’s not
good for having excess liquidity and low liquidity in any organization. Inadequate
liquidity can lead to unexpected cash short falls and reduce profitability as well as
inadequate liquidity can lead to the liquidity insolvency of the institution. On the other
hand, excessive liquidity can lead to two asset yields and contribute to poor earnings
performance. To find –out the ability of bank or financial institution, following ratios
are analyzed and find liquidity ratios to identify the liquidity position.
i. Cash Reserve Ratio
It’s also known as cash and bank balance to total deposit ratio. This ratio shows the
ability of banks immediate funds to cover their deposit. Higher the ratio shows higher
liquidity position and ability to cover the deposits and vice versa. Total deposit
includes current deposit saving, fixed deposit, call short deposit, and other types of
deposit. This ratio can be calculated using the following formula.
46
Cash Reserve Ratio= Cash and Bank balance
Total Deposit
ii. Cash and Bank Balance to Current Assets Ratio
Cash and bank balance are liquid current assets. This ratio measures the percentage of
liquid fund with the current assets. Higher ratio indicates the banks sound ability to
meet the daily cash requirement of their customers’ deposit. So bank has to maintain
cash and bank balance to current assets ratio properly.
Cash and bank balance to Current Assets Ratio= Cash and Bank balance
Current Assets
iii. Cash and Bank Balance to Interest Sensitive Deposit ratio
Saving deposit is deposited by public in a bank with objectives of increasing their
wealth. Interest rate plays important role in the follow of interest sensitive deposit.
Fixed and current deposit is not interest sensitive. Fixed deposits have a fixed term to
maturity and Current deposits are not sensitive towards interest rate. The ratio of cash
and bank balance to interest sensitive deposits measure the bank ability to meets its
sudden out flow of interest sensitive deposit to the change interest rate.
Cash and bank balance to interest sensitive deposit ratio = Cash and Bank balance
Sensitive Deposi
B. Activity Ratio
It is also known as efficiency turnover ratio or assets management ratio. Its measures
how efficiently the firm utilize the assets. Turnover means; how much number of
times the assets flow through a firm’s operations and into sales. Greater rate of turn
over or conversion indicates more efficiency of a firm managing and utilizing its
assets, being other things equal. Various ratios are follows.
i. Credits Advances to Fixed Deposit ratio
Fixed deposits are the long-term bearing obligations and credits and advances is the
major sources of investment to generate the income by the commercial banks. This
47
ratio measures how many times the amount is used in credits and advances income
prison to fixed deposit for the income generating purpose. The ratio is slightly differ
with the former one, because it only includes the fixed deposits, where as the former
on includes all the deposits. The following formula is used to obtain this ratio.
Credits and advances to fixed ratio = Credit and Advances
Fixed Deposits
ii. Credits advances to total deposits ratio
It is also known as loan advance to total deposit ratio. Commercial banks utilize the
outsider’s fund for profit generation purpose. Credits and advances to deposit ratio
shows whether the banks are successful to utilize the outsiders funds (i.e. total
deposit) for the profit generating purpose on the credit and advances or not.
Generally, a high ratio reflects higher efficiency to utilize outsider’s fund and vice-
versa. The ratio can be calculated by using following formula.
Credits and advances to total deposit ratio = Credit and Advances
Total Deposits
iii. Credit and advances to total assets ratio
It measures the ability in mobilizing total assets into credits and advances for profit
generating income. A higher ratio is considered as an adequate symbol for effective
utilization of total assets of bank into credit and advances which creates opportunity
to earn more and more. It is calculated as:
Credit and Advances to Total Assets Ratio = Credit and Advances
Total Assets
iv. Non-performing assets to total assets ratio
This ratio shows the relationship of non-performing assets and total assets. This ratio
represents the proportion between the non-performing assets and total assets of bank.
It shows the how much assets is non-performing or idle in the total assets of bank.
Higher NPA to total assets ratio indicates the worst performance, which reduces the
profitability of bank. Higher ratio shows the low efficient operating of the credit
48
management and lower ratio shows the more efficient operating of credit
management.
Non-performing assets to total assets ratio = Non−Performing Assets
Total Assets
C. Leverage ratio
It is also known as capital structure ratio. Leverage ratio helps to test long term
solvency position of the firm. It informs us the relationship of long-term debt with
total capital or shareholder fund. The use of finance is refers by financial leverage. .
These ratios are also called solvency ratio or capital structure ratio. These ratios
indicate mix of funds provided by owners and lenders. To judge the long-term
financial position of the firm, leverage ratios are calculated. This ratio highlights the
long-term financial health, debt servicing capacity and strength and weaknesses of the
firm. Following ratios are included under leverage ratios.
i. Total debt to equity ratio:
It shows the relationship between debt and equity. Total debt to equity ratio measures
the relative proportion of outsiders and owner’s funds employed in the total
capitalization. Hear, total debt includes total deposits, bills payable and other
liabilities of the bank and equity includes paid up capital, retained earning and
reserves. The formula used to determine the ratio is:
Total debt =long term debt +current liability
ii. Total debt to total assets ratio:
It examines the relationship between borrowed funds (i.e. total debt) and total assets.
It shows the relative extent to which the firm is using borrowed money. A lower ratio
is preferable since it reduces the distress of the creditors by using more amount of
equity on total access. Total debt includes both current liabilities and long term debt.
Creditors prefer law debt ratios because the lower the ratio, the greater the cushion
against creditors losses in the event of liquidation. Stockholders on the other hand
may want more leverage because it magnifies expected earnings. It is computed as:
Total Debt to Total Assets Ratio = Total Debt
Total Assets

49
iii. Total Assets to Net worth Ratio:
The ratio is calculated to find out the proportion of owner’s find to finance for the
total assets. Total Assets comprises of the total value of the assets side of balance
sheet where as net worth is the sum of the share capital plus reverses and retained of
the bank. It is calculated to see the amount of assets financed by net worth.
Total Assets to Net worth Ratio= Total Assets
Net worth
D. Profitability Ratio
The ratio shows the profitability conditions of the bank. Profit is essential for the
survival of bank so it is regarded as the engine that drives the banking business and
indicates economic progress. Profitability ratio is calculating to measure the
management ability regarding how well they have utilized their funds. Lending is one
of the major functions of commercial bank so following are the various types of ratio,
which should the contribution of loan and advances in profit and help to be investor
whether to invest in particular firm or not.
I. Net Profit to Gross Income Ratio
The ratio measures the position of profitability of the company to total income. This
shows the sound and weakness of the company to utilize its resources. Higher ratio
shows the higher efficiency of management and lower ratio shows the lower
efficiency of the management .The formula of net profit to gross income ratio is
Net profit to gross income = Net profit
Gross Income
ii. Interest Income to Total Income Ratio
The ratio measures the volume of interest incomes to total income. The high ratio
indicated the banks performance on other fee-based activities. The high ratio indicates
the high contribution made by lending and investing activities.
Interest income to total income ratio = Interest Income
Total Income

50
iii. Operating profit to Lone and Advances Ratio
Operating profit to loan and advances ratio measure the earning capacity of
commercial bank. Operating profit to loan and advances ratio is calculated by
dividing operating profit by loan and advances.
Operating profit to loan and advances ratio = Operating profit
Loan and Advances
iv. Return on loan and advances ratio
This ratio measures the earning capacity of the commercial bank through it fund
mobilization as loan and advances. Higher ratio indicated greater success to mobilize
fund as loan and advances and vice versa. Mostly loan and advances includes cash,
credit, bank overdraft, bills purchased and discounted.
Return on loan and advances = Net Profit
Loan and Advances
v. Net profit to Total Assets
This ratio shows the relationship of net profit and total assets and is to determine how
efficiently the total assets and is to determine how efficiently the total assets have
been used by the management. This ratio indicates the ability of generation profit per
rupees of total assets. It also evaluates the present return on the total assets as a guide
for return expected on future purchase of assets. Higher the ratio shows the more
efficient operating of management and lower the ratio shows the low efficient
operating of management. This ratio is computed by
Net profit to Total Assets ratio = Net profit
Total Assets
vi. Earning Per Share (EPS)
Earning per share measures the profit available to the cash equity holders. It only
measures the overall operational efficiency bank. It is the profit tax figure EPS tells us
what profit the common share holder get for every share.
Earning per share = Profit After tax
No.of common share

51
vii. Price Earning Ratio
This ratio shows the relationship between earning per share and market value per
share. This ratio measures the profitability of the firm. Higher ratio shows the higher
efficiency of the management and lower ratio shows the lower efficiency of the
management. The ratio is computed by.
E. Lending Efficiency Ratio
This ratio is concerned with measuring the efficiency of bank. This ratio also shows
the utility of available fund. One following is the various types of lending efficiency
ratio.
i. Loan Loss Provision to Total Loan and Advances Ratio Loan loss provision to total loan and advances describes the quality assets that a bank
holding. The provision for loan loss reflects the increasing probability of non-
performing loan. The provision of loan mean the net profit of the banks will come
down by such amount. Increase in loan loss provision decreases in profit result to
decreases in dividends but it is positive impact is that strengthens financial conditions
of the bank by controlling the credit risk and reduced the risks related deposits. So, it
can said that loan suffer it only for short term while the good financial conditions and
safety of loans will make banks prosperity regulating increasing profits for long term.
The low ratio indicates the good quality of assets of in total volume of loan and
advances. High ratio indicates more risky assets in total volume of loan advances.
Loan loss provision to total loan and advances = Loan Loss Provision
Total Loan and Advances
ii. Non-Performing Loan to Total Loan and Advances
This ratio shows the relationship of non-performing loan and total loan and advances
and is to determine how efficiently management has used the total loan and advances.
Higher ratio shows the low efficient operating of the management and lower ratio
shows the more efficient operating of credit management.
Non-performing loan to total loan and advances = Non−performing Assets
Total Loan and Advances

52
iii Interest Expenses to Total Deposit Ratio
This ratio measures the percentage of total interest paid against total deposit. A high
ratio indicates higher interest expenses on total deposit. Commercial banks are
dependent upon its ability to generate cheaper fund. The cheaper fund has more the
probability of generating loans, advances, and vice versa.
Interest expenses to total deposit ratio = Interest Income
Total Deposits
3.6.2 Statistical tools
For supporting the study, statistical tool such as mean, standard deviation, coefficient
of variation, correlation and diagrammatic cum pictorial tools have been used under it.
Arithmetic Means (average)
Arithmetic mean also called ‘the mean’ or ‘average’ as most popular and widely used
measure of central tendency. Arithmetic mean is statistical constants which enables us
to comprehend in a single effort of the whole. Arithmetic mean represents the entire
data by a single value. It provides the gist and gives the birds’ eye view of the huge
mass of a widely numerical data. It is calculate as:
n
i
iXn
X1
1
Where,
X = Mean value or Arithmetic mean
n
i
iX1 = sum of the observation
N = number of observation
Correlation coefficient(r)
Correlation may be defined as the degree of linear relationship existing between two
or more variables. These variables are said to be correlated when the change in the
value of one results change in another variable. Correlation is categorized three types.
They are simple, partial and multiple correlations. Correlation may be positive,
negative or zero. Correlation can be classified as linear or non-linear. Here, we study
simple correlation only. In simple correlation the effect of other is not included rather

53
these are taken as constant considering them to have no serious effect on the
dependent. Formula.
Correlation Coefficient (r)
22
2
2
2
22
1
2
1
2121
21
XXNXXN
XXXXNr xx
Where,
21XXN= No. of product observation and sum of product X1 and X2
21 XX= Sum of product X1 and sum of product X2
Coefficient of variation (c.v.)
The coefficient of variation is measures the relative measures of dispersion, hence n
capable compare two variables independently in term of variability
C.V. = 100*
X
standard deviation
x =sum of the observation
Probable error
The probable error of the coefficient of correlation helps in interpreting its value.
With the help of probable error, it is possible to determine the reliability of the value
of the coefficient in so far as it depends on the conditions of random sampling. The
probable error of the coefficient of correlation is obtained as follows:
P.E. = N
r 21*6745.0
Here,
r= correlation coefficient
N = Number of Paris of observations
If the value of ‘r’ is less than the probable error, there is no evidence of correlation,

54
I.e.the value of ‘r’ is not at all significant. Then, if the value of ‘r’ is more than six
times the probable error, the coefficient is correlation is practically certain, i.e., the
value of ‘r’ is significant.
Times Series Analysis
Time series is used to measure the change of financial, economical as well as
commercial data .the least square method to trend analysis has been used in measuring
the trend analysis. This method is widely used in practice. The straight line trend of a
series of data is represented by the following formula.
Y= a + b x
Here,
Y is the dependent variable, a is y intercept or value of y when x=0,b is the slope of
the trend line or amount of change that comes in y for a unit change in x
55
CHAPTER IV
PRESENTATION ANALYSIS AND INTERPRETATION
4.1 Introduction
This chapter needs the analysis, presentation, interpretation and major findings of
relevant data of Nepal Investment Bank Ltd. In order to fulfill the objectives of
research study. To obtain better result, the data has been analyzed according to the
research methodology as mentioned in the third chapter. The purpose of this chapter is
to introduce the mechanics of data analysis and interpretation. With the help of this
analysis, efforts have been made to highlight credit risk management of NIBL as well
as other cases and problems as well. For analysis, different types of analytical
methods and tools such as financial ratio analysis as well as statistical analysis have
been used. This chapter deals with various aspects of credit risk management as
financial ratios, impact of deposit in liquidity, priority sector lending, lending
efficiency, correlation and trend analysis.
4.2 Financial Statement Analysis
Financial analysis is done by applying various financial tools in order to clean picture
on the viability of the project. The financial analysis is done to ascertain the liquidity,
profitability, leverage, debt servicing and interest servicing ability of the firm. The
concept of financial statement analysis has been already discussed in previous
chapter. Here, we study and analyze the data by using accounting tools.
4.2.1. Liquidity Ratio
Liquidity refers to the ability of a firm to meet its short-term or current obligations. So
liquidity ratios are used to measure the ability of a firm to meet its short-term
obligations. Inadequate liquidity can lead to unexpected cash short falls that must be
covered at excessive costs reducing profitability. In the worst case, inadequate
liquidity can lead to the liquidity insolvency of the institution. To find out the ability
of the bank to meet their short term obligations, which are likely to mature in the short
period, the following ratios are developed under the liquidity ratios to identify the
liquidity position.
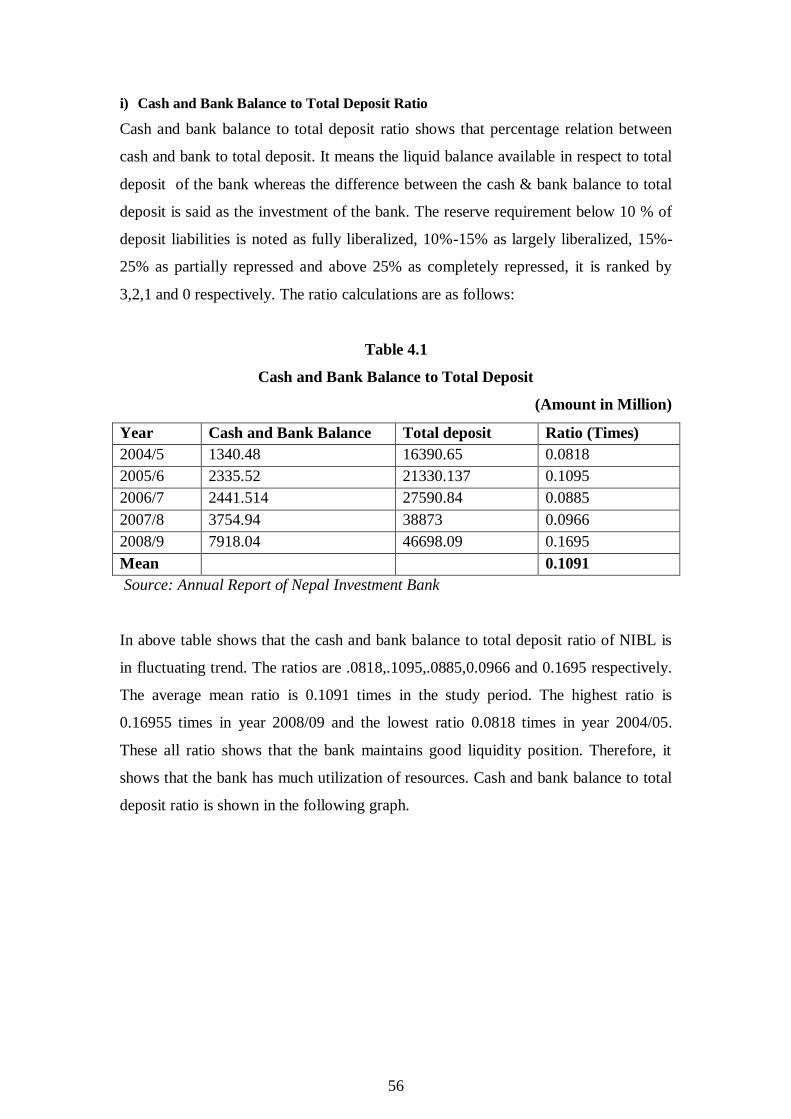
56
i) Cash and Bank Balance to Total Deposit Ratio
Cash and bank balance to total deposit ratio shows that percentage relation between
cash and bank to total deposit. It means the liquid balance available in respect to total
deposit of the bank whereas the difference between the cash & bank balance to total
deposit is said as the investment of the bank. The reserve requirement below 10 % of
deposit liabilities is noted as fully liberalized, 10%-15% as largely liberalized, 15%-
25% as partially repressed and above 25% as completely repressed, it is ranked by
3,2,1 and 0 respectively. The ratio calculations are as follows:
Table 4.1
Cash and Bank Balance to Total Deposit
(Amount in Million)
Year Cash and Bank Balance Total deposit Ratio (Times)
2004/5 1340.48 16390.65 0.0818
2005/6 2335.52 21330.137 0.1095
2006/7 2441.514 27590.84 0.0885
2007/8 3754.94 38873 0.0966
2008/9 7918.04 46698.09 0.1695
Mean 0.1091
Source: Annual Report of Nepal Investment Bank
In above table shows that the cash and bank balance to total deposit ratio of NIBL is
in fluctuating trend. The ratios are .0818,.1095,.0885,0.0966 and 0.1695 respectively.
The average mean ratio is 0.1091 times in the study period. The highest ratio is
0.16955 times in year 2008/09 and the lowest ratio 0.0818 times in year 2004/05.
These all ratio shows that the bank maintains good liquidity position. Therefore, it
shows that the bank has much utilization of resources. Cash and bank balance to total
deposit ratio is shown in the following graph.
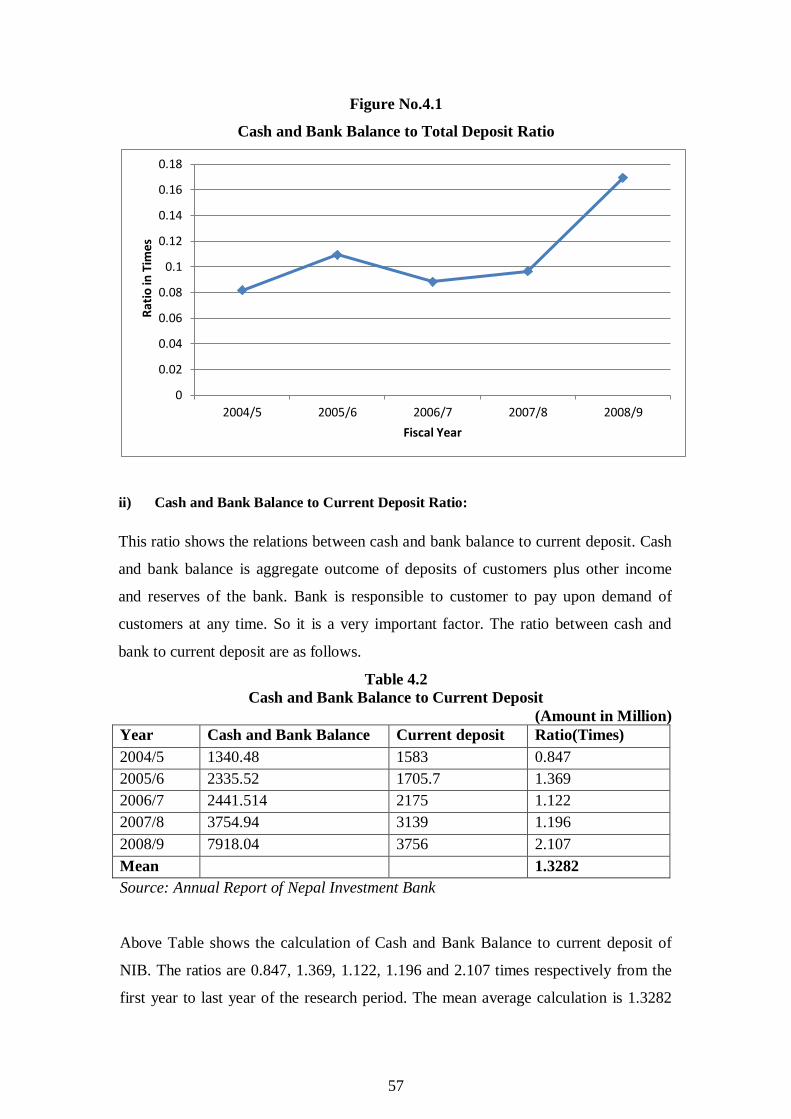
57
Figure No.4.1
Cash and Bank Balance to Total Deposit Ratio
ii) Cash and Bank Balance to Current Deposit Ratio:
This ratio shows the relations between cash and bank balance to current deposit. Cash
and bank balance is aggregate outcome of deposits of customers plus other income
and reserves of the bank. Bank is responsible to customer to pay upon demand of
customers at any time. So it is a very important factor. The ratio between cash and
bank to current deposit are as follows.
Table 4.2
Cash and Bank Balance to Current Deposit
(Amount in Million)
Year Cash and Bank Balance Current deposit Ratio(Times)
2004/5 1340.48 1583 0.847
2005/6 2335.52 1705.7 1.369
2006/7 2441.514 2175 1.122
2007/8 3754.94 3139 1.196
2008/9 7918.04 3756 2.107
Mean 1.3282
Source: Annual Report of Nepal Investment Bank
Above Table shows the calculation of Cash and Bank Balance to current deposit of
NIB. The ratios are 0.847, 1.369, 1.122, 1.196 and 2.107 times respectively from the
first year to last year of the research period. The mean average calculation is 1.3282
0
0.02
0.04
0.06
0.08
0.1
0.12
0.14
0.16
0.18
2004/5 2005/6 2006/7 2007/8 2008/9
Rat
io in
Tim
es
Fiscal Year

58
times, which means consistency in this ratio during the research period. Cash and
bank balance would be sufficient to meet the demand of current depositors. Therefore
here seems to be making more cash and bank balance to meet the current deposit.
Otherwise, the bank would lose its image from the view point of customers if all the
current depositors demand for their deposits. Here, the mean ratio is only 1.3282, so
more cash and bank balance is required to meet the current depositor’s requirement.
Figure 4.2
Cash and Bank Balance to Current Deposit ratio
iii) Cash and Bank Balance to Interest Sensitive Deposit Ratio
The ratio of cash and bank balance to interest sensitive deposits measures the ability
to meet its sudden outflow of interest sensitive deposits due to the change in interest
rate.
Table No 4.3
Cash and Bank balance to interest sensitive deposit Ratio
(Amount in million)
Year Cash and Bank Balance Sensitive Deposit Ratio(Times)
2004/5 1340.48 6703 0.199
2005/6 2335.52 8082 0.289
2006/7 2441.514 10742 0.227
2007/8 3754.94 13689 0.274
2008/9 7918.04 17066.25 0.463
Mean 0.2904
Source:Annual Report of Nepal Investment Bank
0
0.5
1
1.5
2
2.5
2004/5 2005/6 2006/7 2007/8 2008/9
Rat
io in
Tim
es
Fiscal year
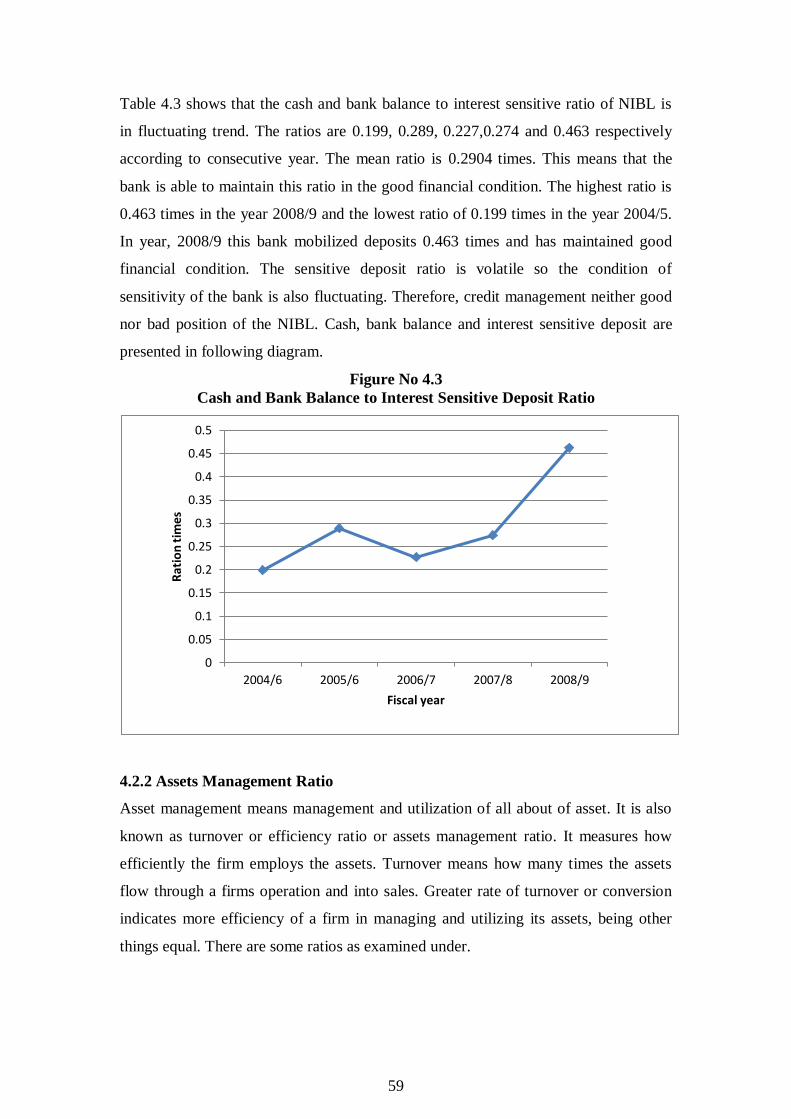
59
Table 4.3 shows that the cash and bank balance to interest sensitive ratio of NIBL is
in fluctuating trend. The ratios are 0.199, 0.289, 0.227,0.274 and 0.463 respectively
according to consecutive year. The mean ratio is 0.2904 times. This means that the
bank is able to maintain this ratio in the good financial condition. The highest ratio is
0.463 times in the year 2008/9 and the lowest ratio of 0.199 times in the year 2004/5.
In year, 2008/9 this bank mobilized deposits 0.463 times and has maintained good
financial condition. The sensitive deposit ratio is volatile so the condition of
sensitivity of the bank is also fluctuating. Therefore, credit management neither good
nor bad position of the NIBL. Cash, bank balance and interest sensitive deposit are
presented in following diagram.
Figure No 4.3
Cash and Bank Balance to Interest Sensitive Deposit Ratio
4.2.2 Assets Management Ratio
Asset management means management and utilization of all about of asset. It is also
known as turnover or efficiency ratio or assets management ratio. It measures how
efficiently the firm employs the assets. Turnover means how many times the assets
flow through a firms operation and into sales. Greater rate of turnover or conversion
indicates more efficiency of a firm in managing and utilizing its assets, being other
things equal. There are some ratios as examined under.
0
0.05
0.1
0.15
0.2
0.25
0.3
0.35
0.4
0.45
0.5
2004/6 2005/6 2006/7 2007/8 2008/9
Rat
ion
tim
es
Fiscal year

60
i) Credit and Advances to Fixed Deposit Ratio
Credit and advances clearly state that it is the assets of the bank and fixed deposit is
the liability. It is also known as loan and advance ratio. So, this is the ratio between
assets and liability. This helps to show the ratio of Loan and Advances to fixed
deposit. We can also conclude that what part of the credit and advances is initiated
against fixed deposit.
Table 4.4
Credit and Advances to Fixed Deposit Ratio
(Amount in million)
Year Credit and Advances Fixed Deposit Ratio(Times)
2004/5 10453 3212 3.254
2005/6 13178 5413 2.434
2006/7 17769 7517 2.364
2007/8 27529 7944 3.465
2008/9 36827 11633 3.165
Mean 2.9364
Source: Annual Report of Nepal Investment Bank
Table 4.4 shows that Loan and advances to fixed deposits ratios of NIBL in increasing
trend overall. The ratios of NIBL in 2004/5 was 3.254 and it increased to 3.165 in
2008/9. The mean ratio is 2.9364 times. This means that the bank is able to maintain
this ratio in the good financial condition. Credit and advance to fixed deposit ratio is
presented in following diagram.
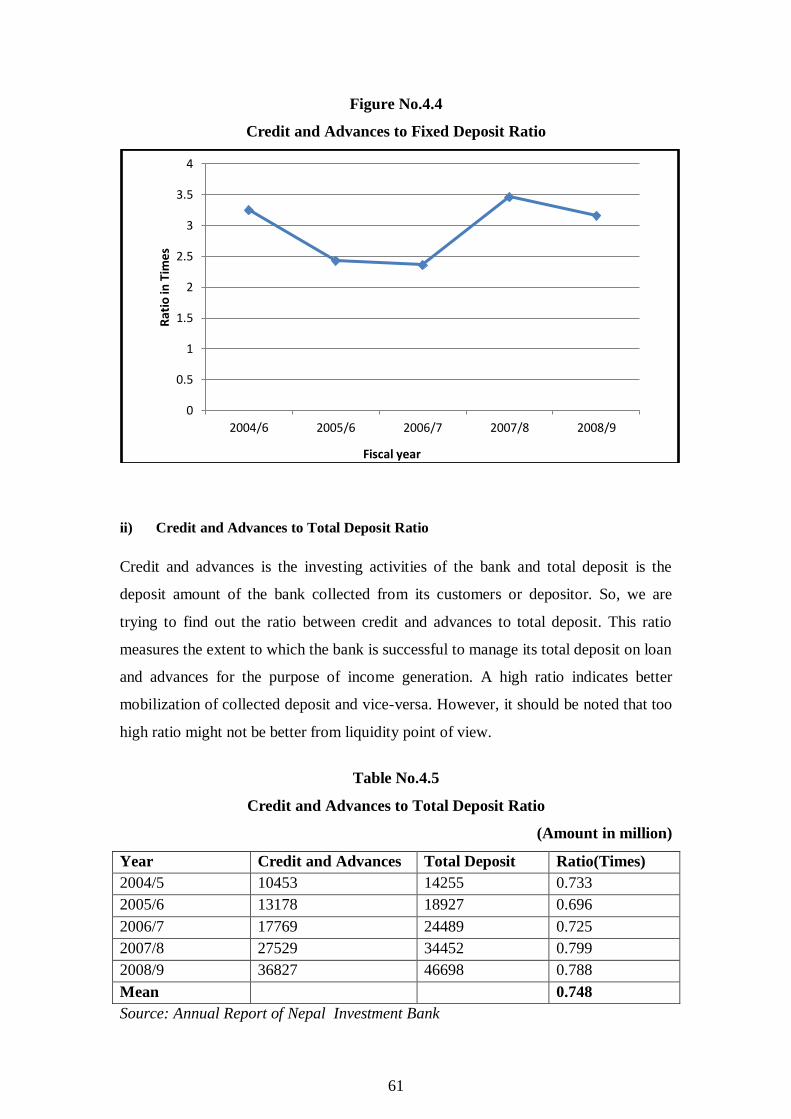
61
Figure No.4.4
Credit and Advances to Fixed Deposit Ratio
ii) Credit and Advances to Total Deposit Ratio
Credit and advances is the investing activities of the bank and total deposit is the
deposit amount of the bank collected from its customers or depositor. So, we are
trying to find out the ratio between credit and advances to total deposit. This ratio
measures the extent to which the bank is successful to manage its total deposit on loan
and advances for the purpose of income generation. A high ratio indicates better
mobilization of collected deposit and vice-versa. However, it should be noted that too
high ratio might not be better from liquidity point of view.
Table No.4.5
Credit and Advances to Total Deposit Ratio
(Amount in million)
Year Credit and Advances Total Deposit Ratio(Times)
2004/5 10453 14255 0.733
2005/6 13178 18927 0.696
2006/7 17769 24489 0.725
2007/8 27529 34452 0.799
2008/9 36827 46698 0.788
Mean 0.748
Source: Annual Report of Nepal Investment Bank
0
0.5
1
1.5
2
2.5
3
3.5
4
2004/6 2005/6 2006/7 2007/8 2008/9
Rat
io in
Tim
es
Fiscal year
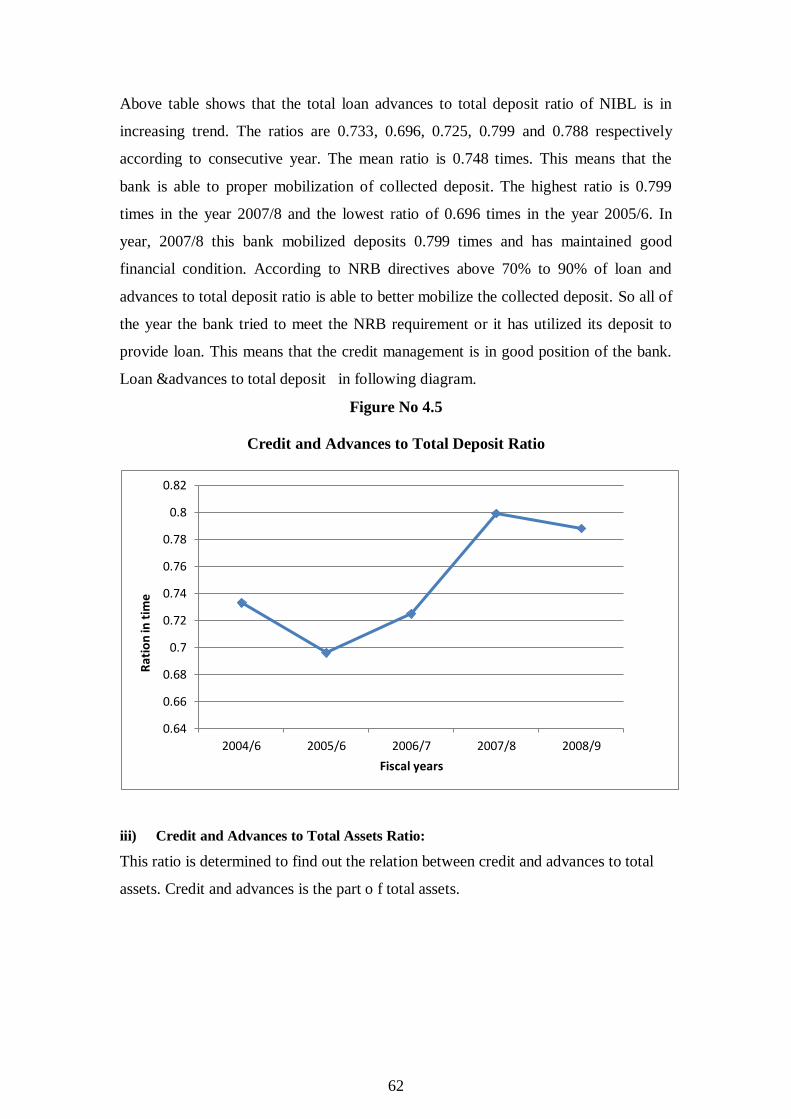
62
Above table shows that the total loan advances to total deposit ratio of NIBL is in
increasing trend. The ratios are 0.733, 0.696, 0.725, 0.799 and 0.788 respectively
according to consecutive year. The mean ratio is 0.748 times. This means that the
bank is able to proper mobilization of collected deposit. The highest ratio is 0.799
times in the year 2007/8 and the lowest ratio of 0.696 times in the year 2005/6. In
year, 2007/8 this bank mobilized deposits 0.799 times and has maintained good
financial condition. According to NRB directives above 70% to 90% of loan and
advances to total deposit ratio is able to better mobilize the collected deposit. So all of
the year the bank tried to meet the NRB requirement or it has utilized its deposit to
provide loan. This means that the credit management is in good position of the bank.
Loan &advances to total deposit in following diagram.
Figure No 4.5
Credit and Advances to Total Deposit Ratio
iii) Credit and Advances to Total Assets Ratio:
This ratio is determined to find out the relation between credit and advances to total
assets. Credit and advances is the part o f total assets.
0.64
0.66
0.68
0.7
0.72
0.74
0.76
0.78
0.8
0.82
2004/6 2005/6 2006/7 2007/8 2008/9
Rat
ion
in t
ime
Fiscal years
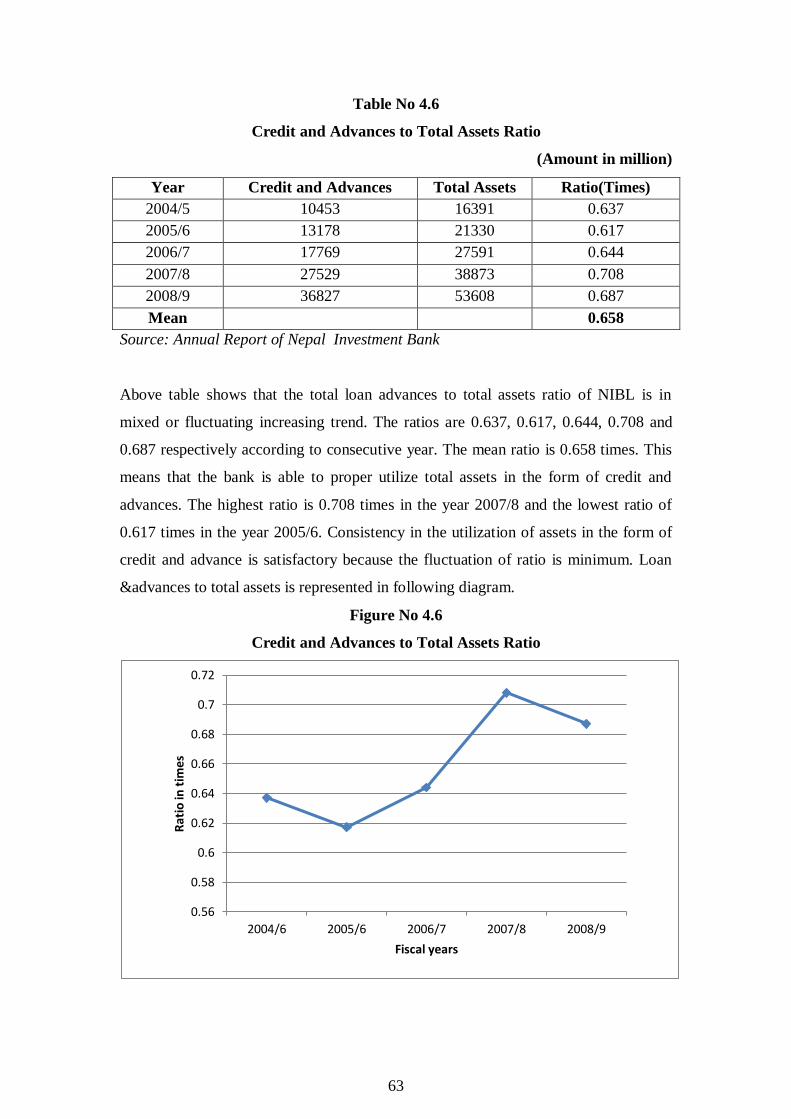
63
Table No 4.6
Credit and Advances to Total Assets Ratio
(Amount in million)
Year Credit and Advances Total Assets Ratio(Times)
2004/5 10453 16391 0.637
2005/6 13178 21330 0.617
2006/7 17769 27591 0.644
2007/8 27529 38873 0.708
2008/9 36827 53608 0.687
Mean 0.658
Source: Annual Report of Nepal Investment Bank
Above table shows that the total loan advances to total assets ratio of NIBL is in
mixed or fluctuating increasing trend. The ratios are 0.637, 0.617, 0.644, 0.708 and
0.687 respectively according to consecutive year. The mean ratio is 0.658 times. This
means that the bank is able to proper utilize total assets in the form of credit and
advances. The highest ratio is 0.708 times in the year 2007/8 and the lowest ratio of
0.617 times in the year 2005/6. Consistency in the utilization of assets in the form of
credit and advance is satisfactory because the fluctuation of ratio is minimum. Loan
&advances to total assets is represented in following diagram.
Figure No 4.6
Credit and Advances to Total Assets Ratio
0.56
0.58
0.6
0.62
0.64
0.66
0.68
0.7
0.72
2004/6 2005/6 2006/7 2007/8 2008/9
Rat
io in
tim
es
Fiscal years
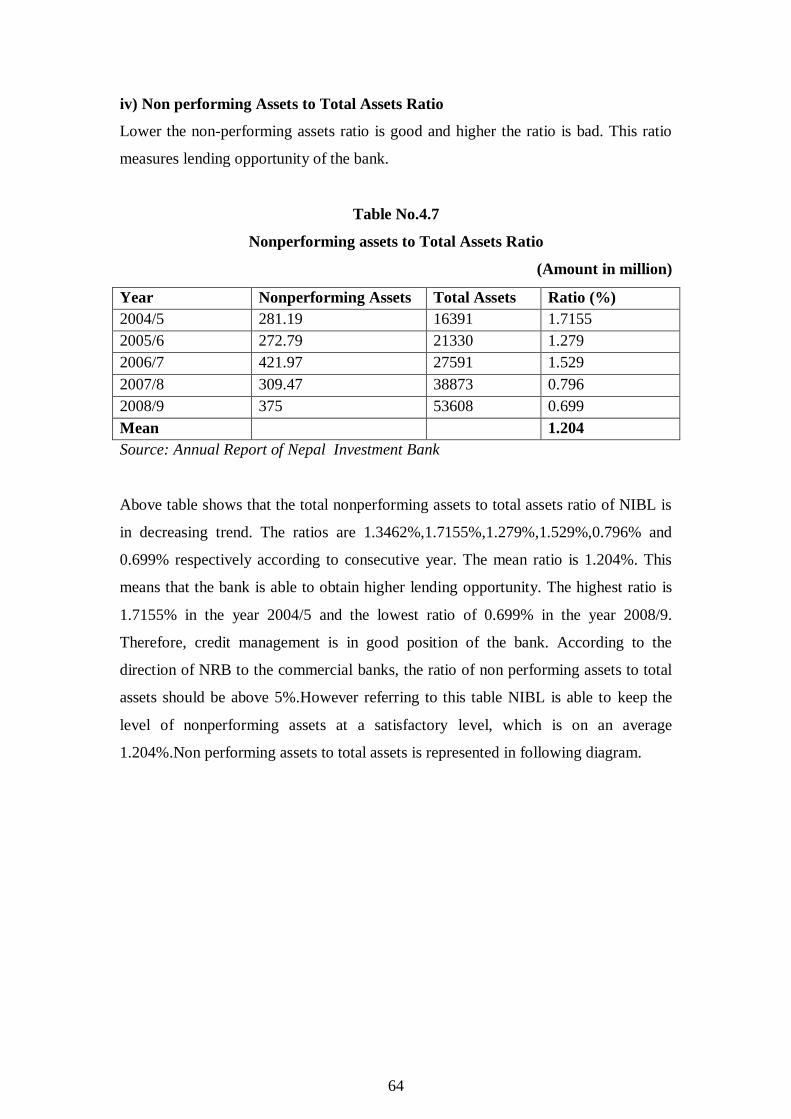
64
iv) Non performing Assets to Total Assets Ratio
Lower the non-performing assets ratio is good and higher the ratio is bad. This ratio
measures lending opportunity of the bank.
Table No.4.7
Nonperforming assets to Total Assets Ratio
(Amount in million)
Year Nonperforming Assets Total Assets Ratio (%)
2004/5 281.19 16391 1.7155
2005/6 272.79 21330 1.279
2006/7 421.97 27591 1.529
2007/8 309.47 38873 0.796
2008/9 375 53608 0.699
Mean 1.204
Source: Annual Report of Nepal Investment Bank
Above table shows that the total nonperforming assets to total assets ratio of NIBL is
in decreasing trend. The ratios are 1.3462%,1.7155%,1.279%,1.529%,0.796% and
0.699% respectively according to consecutive year. The mean ratio is 1.204%. This
means that the bank is able to obtain higher lending opportunity. The highest ratio is
1.7155% in the year 2004/5 and the lowest ratio of 0.699% in the year 2008/9.
Therefore, credit management is in good position of the bank. According to the
direction of NRB to the commercial banks, the ratio of non performing assets to total
assets should be above 5%.However referring to this table NIBL is able to keep the
level of nonperforming assets at a satisfactory level, which is on an average
1.204%.Non performing assets to total assets is represented in following diagram.
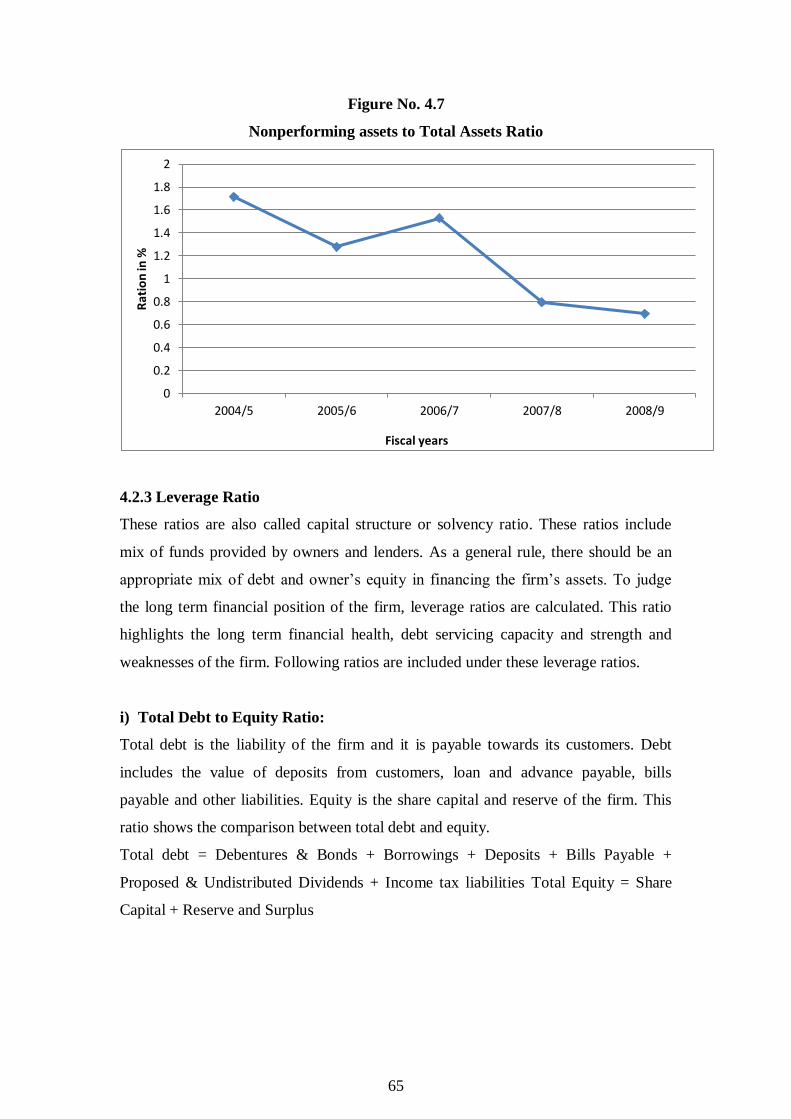
65
Figure No. 4.7
Nonperforming assets to Total Assets Ratio
4.2.3 Leverage Ratio
These ratios are also called capital structure or solvency ratio. These ratios include
mix of funds provided by owners and lenders. As a general rule, there should be an
appropriate mix of debt and owner’s equity in financing the firm’s assets. To judge
the long term financial position of the firm, leverage ratios are calculated. This ratio
highlights the long term financial health, debt servicing capacity and strength and
weaknesses of the firm. Following ratios are included under these leverage ratios.
i) Total Debt to Equity Ratio:
Total debt is the liability of the firm and it is payable towards its customers. Debt
includes the value of deposits from customers, loan and advance payable, bills
payable and other liabilities. Equity is the share capital and reserve of the firm. This
ratio shows the comparison between total debt and equity.
Total debt = Debentures & Bonds + Borrowings + Deposits + Bills Payable +
Proposed & Undistributed Dividends + Income tax liabilities Total Equity = Share
Capital + Reserve and Surplus
0
0.2
0.4
0.6
0.8
1
1.2
1.4
1.6
1.8
2
2004/5 2005/6 2006/7 2007/8 2008/9
Rat
ion
in %
Fiscal years
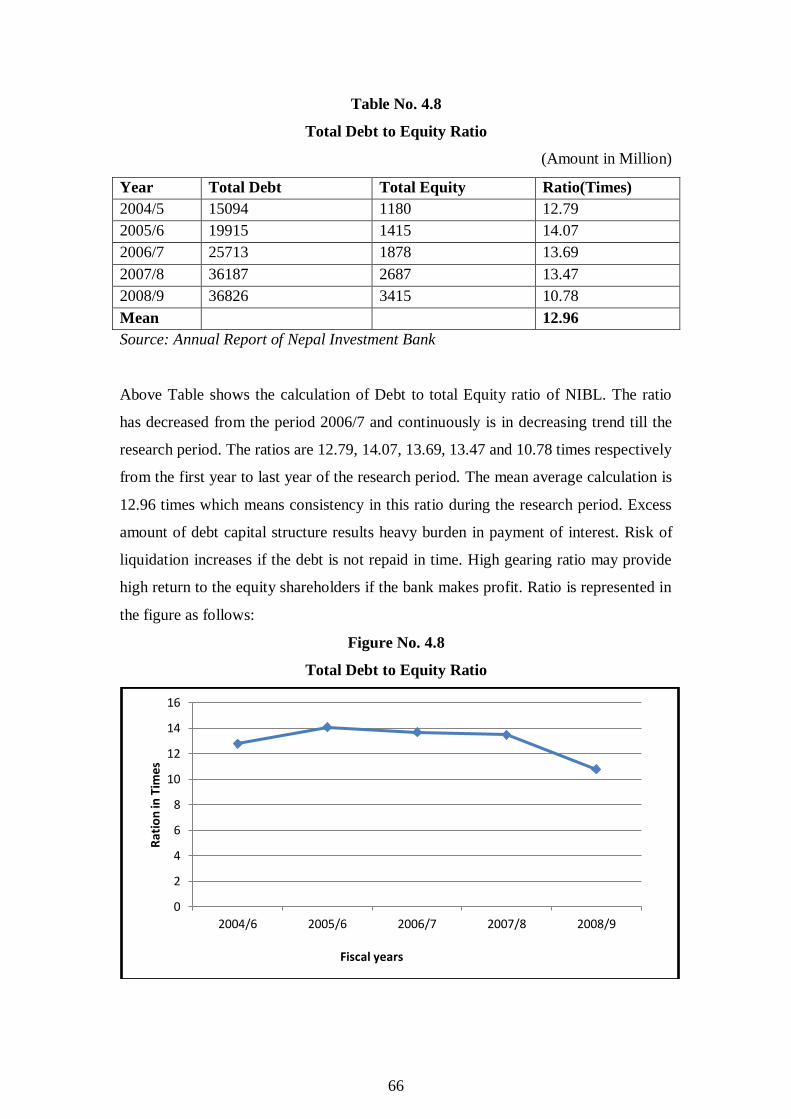
66
Table No. 4.8
Total Debt to Equity Ratio
(Amount in Million)
Year Total Debt Total Equity Ratio(Times)
2004/5 15094 1180 12.79
2005/6 19915 1415 14.07
2006/7 25713 1878 13.69
2007/8 36187 2687 13.47
2008/9 36826 3415 10.78
Mean 12.96
Source: Annual Report of Nepal Investment Bank
Above Table shows the calculation of Debt to total Equity ratio of NIBL. The ratio
has decreased from the period 2006/7 and continuously is in decreasing trend till the
research period. The ratios are 12.79, 14.07, 13.69, 13.47 and 10.78 times respectively
from the first year to last year of the research period. The mean average calculation is
12.96 times which means consistency in this ratio during the research period. Excess
amount of debt capital structure results heavy burden in payment of interest. Risk of
liquidation increases if the debt is not repaid in time. High gearing ratio may provide
high return to the equity shareholders if the bank makes profit. Ratio is represented in
the figure as follows:
Figure No. 4.8
Total Debt to Equity Ratio
0
2
4
6
8
10
12
14
16
2004/6 2005/6 2006/7 2007/8 2008/9
Rat
ion
in T
ime
s
Fiscal years
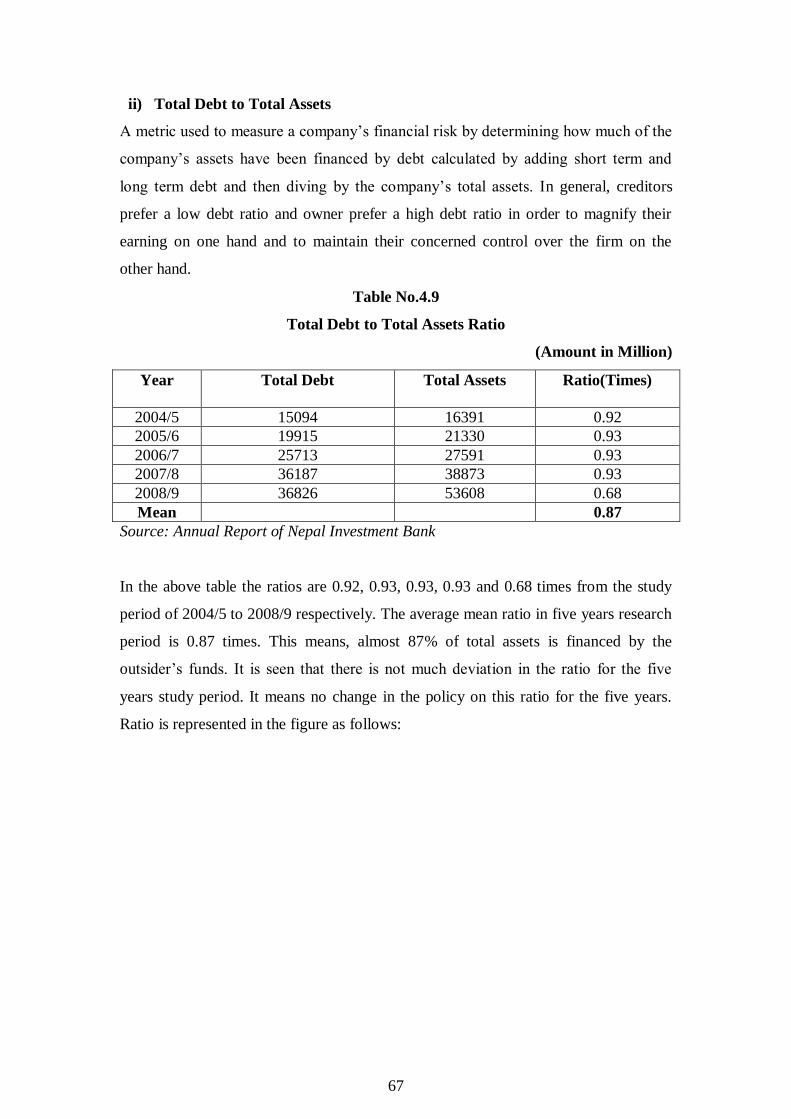
67
ii) Total Debt to Total Assets
A metric used to measure a company’s financial risk by determining how much of the
company’s assets have been financed by debt calculated by adding short term and
long term debt and then diving by the company’s total assets. In general, creditors
prefer a low debt ratio and owner prefer a high debt ratio in order to magnify their
earning on one hand and to maintain their concerned control over the firm on the
other hand.
Table No.4.9
Total Debt to Total Assets Ratio
(Amount in Million)
Year Total Debt Total Assets Ratio(Times)
2004/5 15094 16391 0.92
2005/6 19915 21330 0.93
2006/7 25713 27591 0.93
2007/8 36187 38873 0.93
2008/9 36826 53608 0.68
Mean 0.87
Source: Annual Report of Nepal Investment Bank
In the above table the ratios are 0.92, 0.93, 0.93, 0.93 and 0.68 times from the study
period of 2004/5 to 2008/9 respectively. The average mean ratio in five years research
period is 0.87 times. This means, almost 87% of total assets is financed by the
outsider’s funds. It is seen that there is not much deviation in the ratio for the five
years study period. It means no change in the policy on this ratio for the five years.
Ratio is represented in the figure as follows:
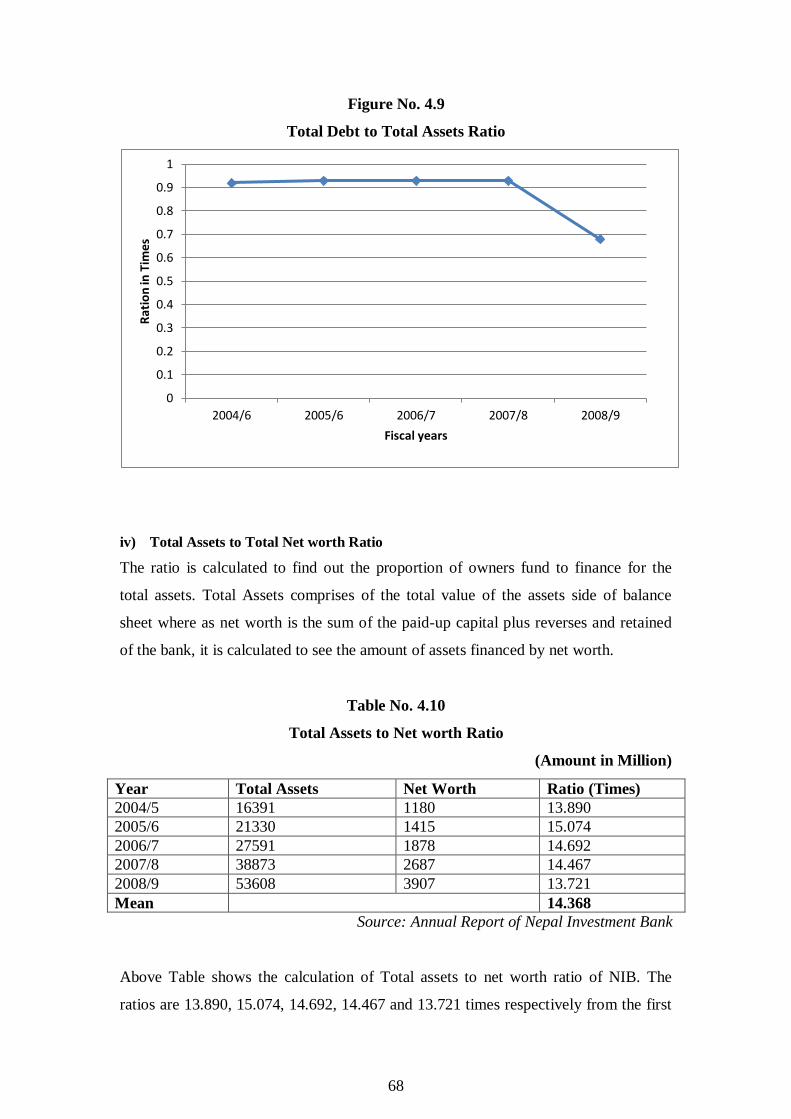
68
Figure No. 4.9
Total Debt to Total Assets Ratio
iv) Total Assets to Total Net worth Ratio
The ratio is calculated to find out the proportion of owners fund to finance for the
total assets. Total Assets comprises of the total value of the assets side of balance
sheet where as net worth is the sum of the paid-up capital plus reverses and retained
of the bank, it is calculated to see the amount of assets financed by net worth.
Table No. 4.10
Total Assets to Net worth Ratio
(Amount in Million)
Year Total Assets Net Worth Ratio (Times)
2004/5 16391 1180 13.890
2005/6 21330 1415 15.074
2006/7 27591 1878 14.692
2007/8 38873 2687 14.467
2008/9 53608 3907 13.721
Mean 14.368
Source: Annual Report of Nepal Investment Bank
Above Table shows the calculation of Total assets to net worth ratio of NIB. The
ratios are 13.890, 15.074, 14.692, 14.467 and 13.721 times respectively from the first
0
0.1
0.2
0.3
0.4
0.5
0.6
0.7
0.8
0.9
1
2004/6 2005/6 2006/7 2007/8 2008/9
Rat
ion
in T
ime
s
Fiscal years

69
year to last year of the research period. The mean average calculation is 14.368 times
which means consistency in this ratio during the research period. The lowest ratio is
13.721 in the period 5th year and the highest ratio is 15.074 in the 2nd year. In the table
above, we can see that the total assets and net worth are increasing year by year
during the study period. The figure 4.10 clearly shows Total assets to net worth ratio
of the bank.
Figure No.4.10
Total Assets to Net worth Ratio
4.2.4 Profitability Ratio
Profit is the major objective of any business organization. Profit is regarded as engine
that drives the business enterprises. Profitability ratios are very helpful to measure the
overall efficiency in the operation of the FIs. Profitability ratio is calculated based on
sales and investment. In the context of banks, no bank can survive without profit.
Profit is one of the major indicators to measure the efficient operation of the bank.
The bank acquires profit by providing different services to its customers or by
providing loan and advances and making various kinds of investment opportunities.
Profitability ratio measure the efficiency of the bank. A higher profit ratio shows the
higher efficiency of the bank and vice- versa. The following ratios are calculated:
13
13.5
14
14.5
15
15.5
2004/6 2005/6 2006/7 2007/8 2008/9
Rat
io in
tim
es
Fiscal years
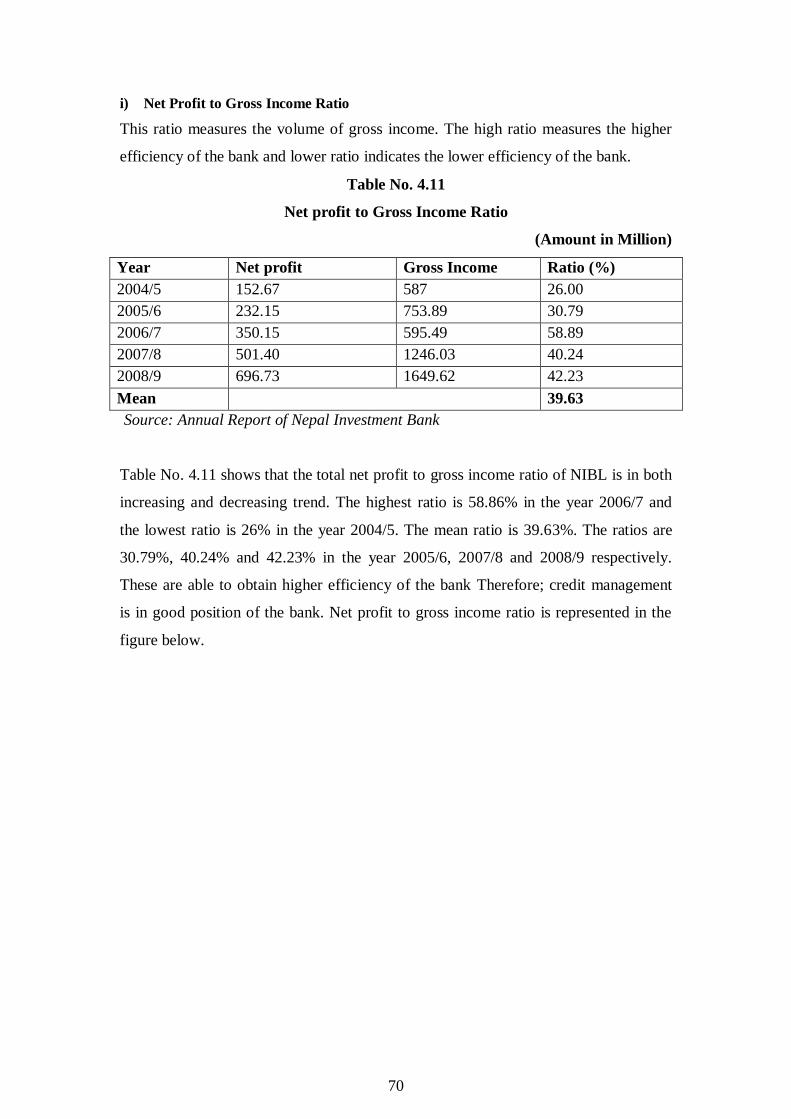
70
i) Net Profit to Gross Income Ratio
This ratio measures the volume of gross income. The high ratio measures the higher
efficiency of the bank and lower ratio indicates the lower efficiency of the bank.
Table No. 4.11
Net profit to Gross Income Ratio
(Amount in Million)
Year Net profit Gross Income Ratio (%)
2004/5 152.67 587 26.00
2005/6 232.15 753.89 30.79
2006/7 350.15 595.49 58.89
2007/8 501.40 1246.03 40.24
2008/9 696.73 1649.62 42.23
Mean 39.63
Source: Annual Report of Nepal Investment Bank
Table No. 4.11 shows that the total net profit to gross income ratio of NIBL is in both
increasing and decreasing trend. The highest ratio is 58.86% in the year 2006/7 and
the lowest ratio is 26% in the year 2004/5. The mean ratio is 39.63%. The ratios are
30.79%, 40.24% and 42.23% in the year 2005/6, 2007/8 and 2008/9 respectively.
These are able to obtain higher efficiency of the bank Therefore; credit management
is in good position of the bank. Net profit to gross income ratio is represented in the
figure below.
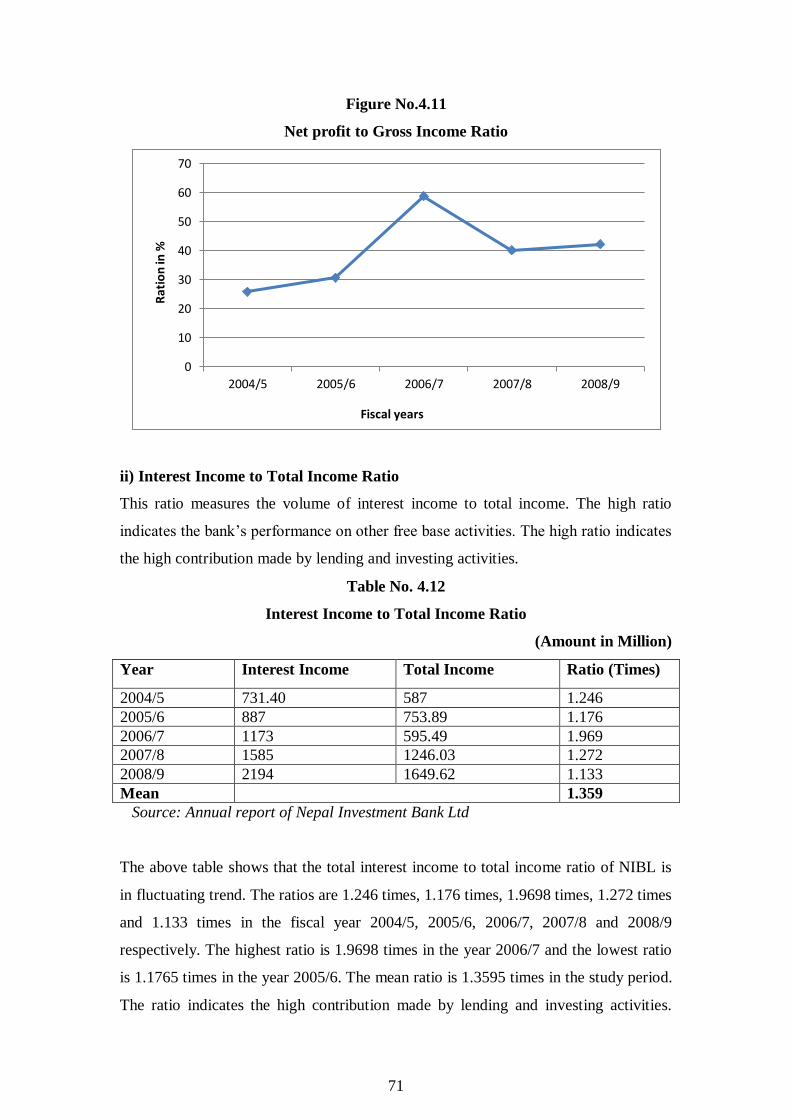
71
Figure No.4.11
Net profit to Gross Income Ratio
ii) Interest Income to Total Income Ratio
This ratio measures the volume of interest income to total income. The high ratio
indicates the bank’s performance on other free base activities. The high ratio indicates
the high contribution made by lending and investing activities.
Table No. 4.12
Interest Income to Total Income Ratio
(Amount in Million)
Year Interest Income Total Income Ratio (Times)
2004/5 731.40 587 1.246
2005/6 887 753.89 1.176
2006/7 1173 595.49 1.969
2007/8 1585 1246.03 1.272
2008/9 2194 1649.62 1.133
Mean 1.359
Source: Annual report of Nepal Investment Bank Ltd
The above table shows that the total interest income to total income ratio of NIBL is
in fluctuating trend. The ratios are 1.246 times, 1.176 times, 1.9698 times, 1.272 times
and 1.133 times in the fiscal year 2004/5, 2005/6, 2006/7, 2007/8 and 2008/9
respectively. The highest ratio is 1.9698 times in the year 2006/7 and the lowest ratio
is 1.1765 times in the year 2005/6. The mean ratio is 1.3595 times in the study period.
The ratio indicates the high contribution made by lending and investing activities.
0
10
20
30
40
50
60
70
2004/5 2005/6 2006/7 2007/8 2008/9
Rat
ion
in %
Fiscal years
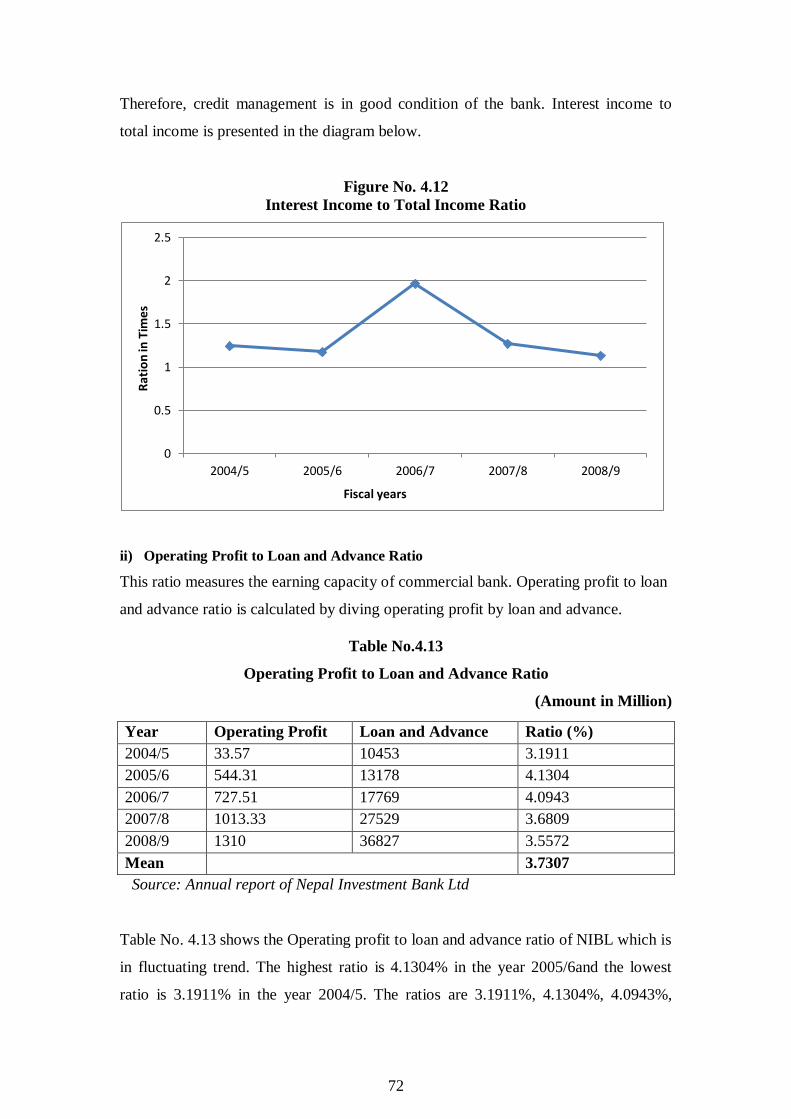
72
Therefore, credit management is in good condition of the bank. Interest income to
total income is presented in the diagram below.
Figure No. 4.12
Interest Income to Total Income Ratio
ii) Operating Profit to Loan and Advance Ratio
This ratio measures the earning capacity of commercial bank. Operating profit to loan
and advance ratio is calculated by diving operating profit by loan and advance.
Table No.4.13
Operating Profit to Loan and Advance Ratio
(Amount in Million)
Source: Annual report of Nepal Investment Bank Ltd
Table No. 4.13 shows the Operating profit to loan and advance ratio of NIBL which is
in fluctuating trend. The highest ratio is 4.1304% in the year 2005/6and the lowest
ratio is 3.1911% in the year 2004/5. The ratios are 3.1911%, 4.1304%, 4.0943%,
0
0.5
1
1.5
2
2.5
2004/5 2005/6 2006/7 2007/8 2008/9
Rat
ion
in T
ime
s
Fiscal years
Year Operating Profit Loan and Advance Ratio (%)
2004/5 33.57 10453 3.1911
2005/6 544.31 13178 4.1304
2006/7 727.51 17769 4.0943
2007/8 1013.33 27529 3.6809
2008/9 1310 36827 3.5572
Mean 3.7307
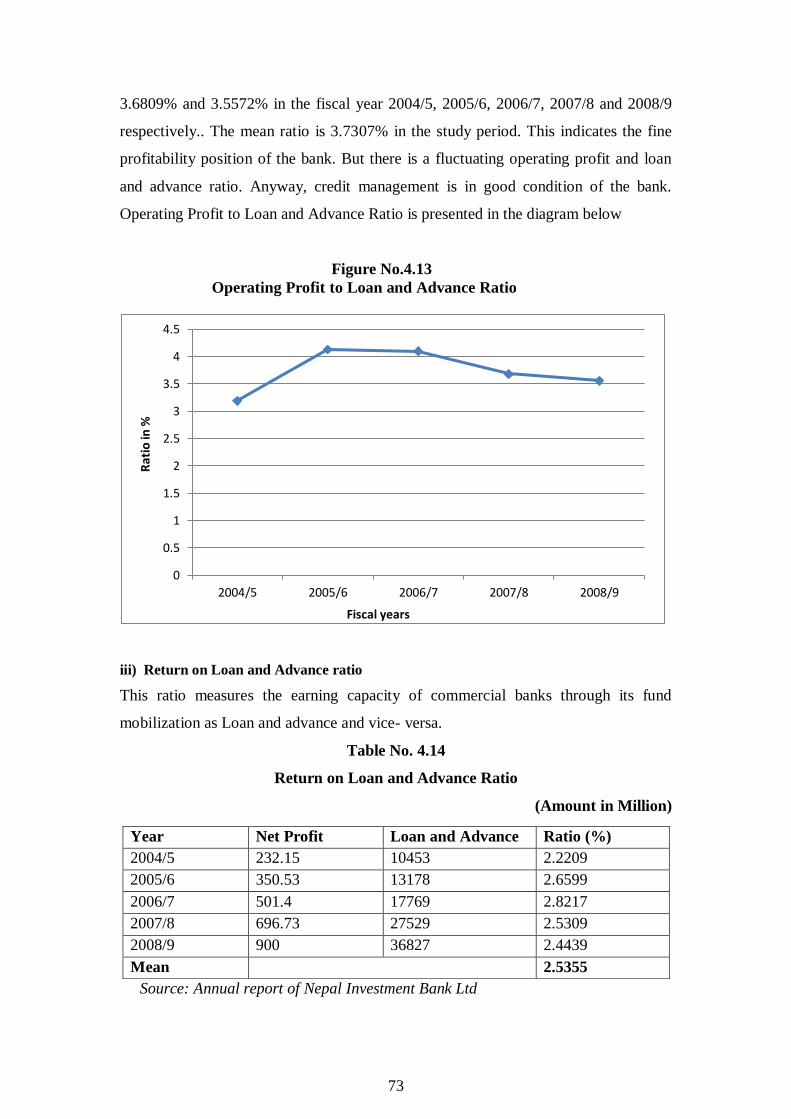
73
3.6809% and 3.5572% in the fiscal year 2004/5, 2005/6, 2006/7, 2007/8 and 2008/9
respectively.. The mean ratio is 3.7307% in the study period. This indicates the fine
profitability position of the bank. But there is a fluctuating operating profit and loan
and advance ratio. Anyway, credit management is in good condition of the bank.
Operating Profit to Loan and Advance Ratio is presented in the diagram below
Figure No.4.13
Operating Profit to Loan and Advance Ratio
iii) Return on Loan and Advance ratio
This ratio measures the earning capacity of commercial banks through its fund
mobilization as Loan and advance and vice- versa.
Table No. 4.14
Return on Loan and Advance Ratio
(Amount in Million)
Source: Annual report of Nepal Investment Bank Ltd
0
0.5
1
1.5
2
2.5
3
3.5
4
4.5
2004/5 2005/6 2006/7 2007/8 2008/9
Ra
tio
in %
Fiscal years
Year Net Profit Loan and Advance Ratio (%)
2004/5 232.15 10453 2.2209
2005/6 350.53 13178 2.6599
2006/7 501.4 17769 2.8217
2007/8 696.73 27529 2.5309
2008/9 900 36827 2.4439
Mean 2.5355
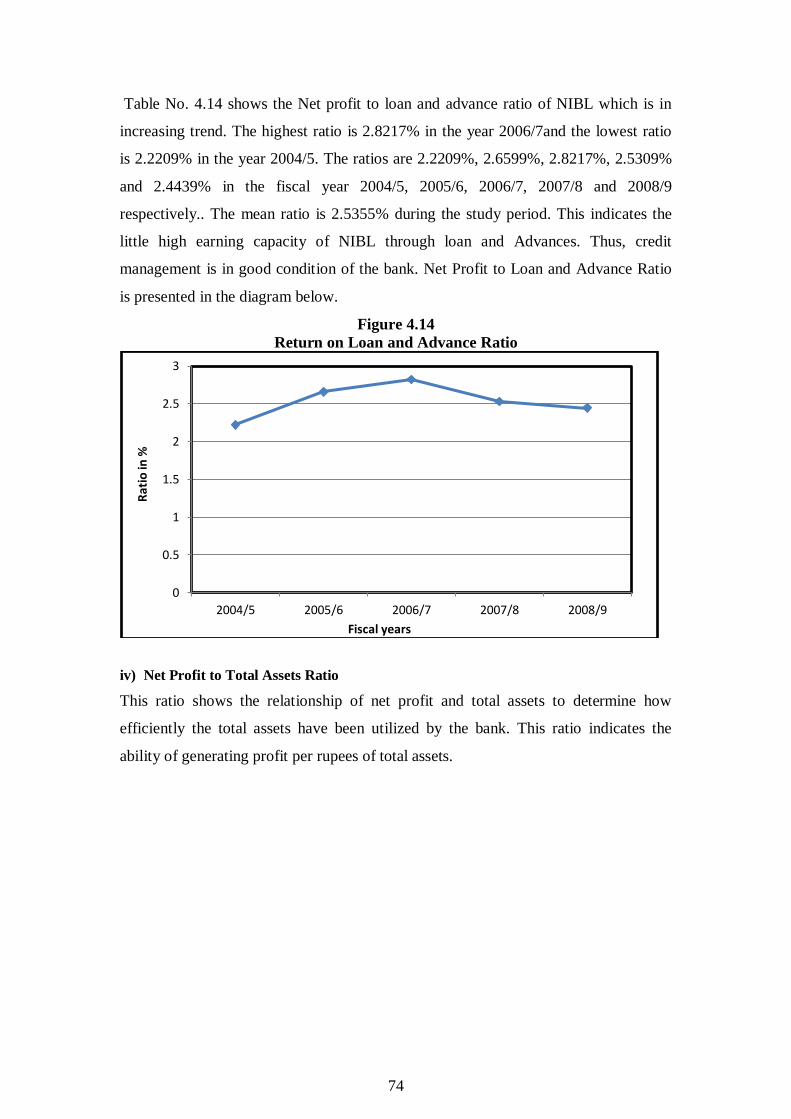
74
Table No. 4.14 shows the Net profit to loan and advance ratio of NIBL which is in
increasing trend. The highest ratio is 2.8217% in the year 2006/7and the lowest ratio
is 2.2209% in the year 2004/5. The ratios are 2.2209%, 2.6599%, 2.8217%, 2.5309%
and 2.4439% in the fiscal year 2004/5, 2005/6, 2006/7, 2007/8 and 2008/9
respectively.. The mean ratio is 2.5355% during the study period. This indicates the
little high earning capacity of NIBL through loan and Advances. Thus, credit
management is in good condition of the bank. Net Profit to Loan and Advance Ratio
is presented in the diagram below.
Figure 4.14
Return on Loan and Advance Ratio
iv) Net Profit to Total Assets Ratio
This ratio shows the relationship of net profit and total assets to determine how
efficiently the total assets have been utilized by the bank. This ratio indicates the
ability of generating profit per rupees of total assets.
0
0.5
1
1.5
2
2.5
3
2004/5 2005/6 2006/7 2007/8 2008/9
Rat
io in
%
Fiscal years
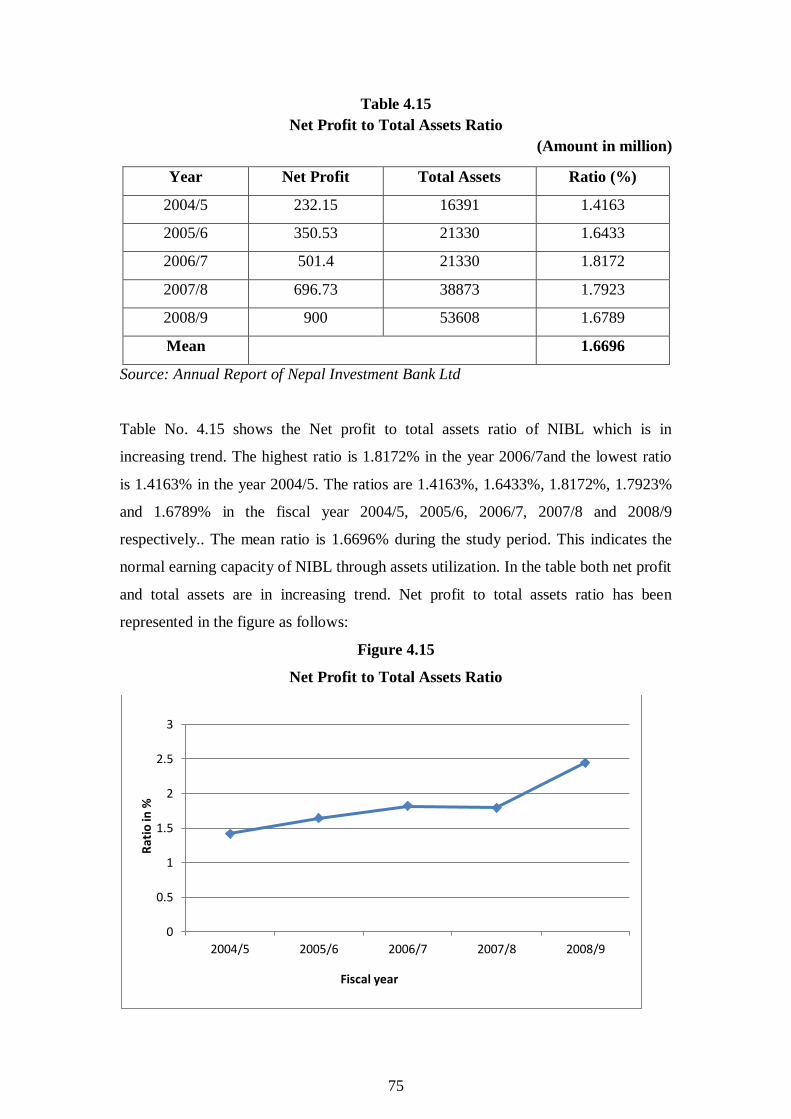
75
Table 4.15
Net Profit to Total Assets Ratio
(Amount in million)
Source: Annual Report of Nepal Investment Bank Ltd
Table No. 4.15 shows the Net profit to total assets ratio of NIBL which is in
increasing trend. The highest ratio is 1.8172% in the year 2006/7and the lowest ratio
is 1.4163% in the year 2004/5. The ratios are 1.4163%, 1.6433%, 1.8172%, 1.7923%
and 1.6789% in the fiscal year 2004/5, 2005/6, 2006/7, 2007/8 and 2008/9
respectively.. The mean ratio is 1.6696% during the study period. This indicates the
normal earning capacity of NIBL through assets utilization. In the table both net profit
and total assets are in increasing trend. Net profit to total assets ratio has been
represented in the figure as follows:
Figure 4.15
Net Profit to Total Assets Ratio
0
0.5
1
1.5
2
2.5
3
2004/5 2005/6 2006/7 2007/8 2008/9
Rat
io in
%
Fiscal year
Year Net Profit Total Assets Ratio (%)
2004/5 232.15 16391 1.4163
2005/6 350.53 21330 1.6433
2006/7 501.4 21330 1.8172
2007/8 696.73 38873 1.7923
2008/9 900 53608 1.6789
Mean 1.6696
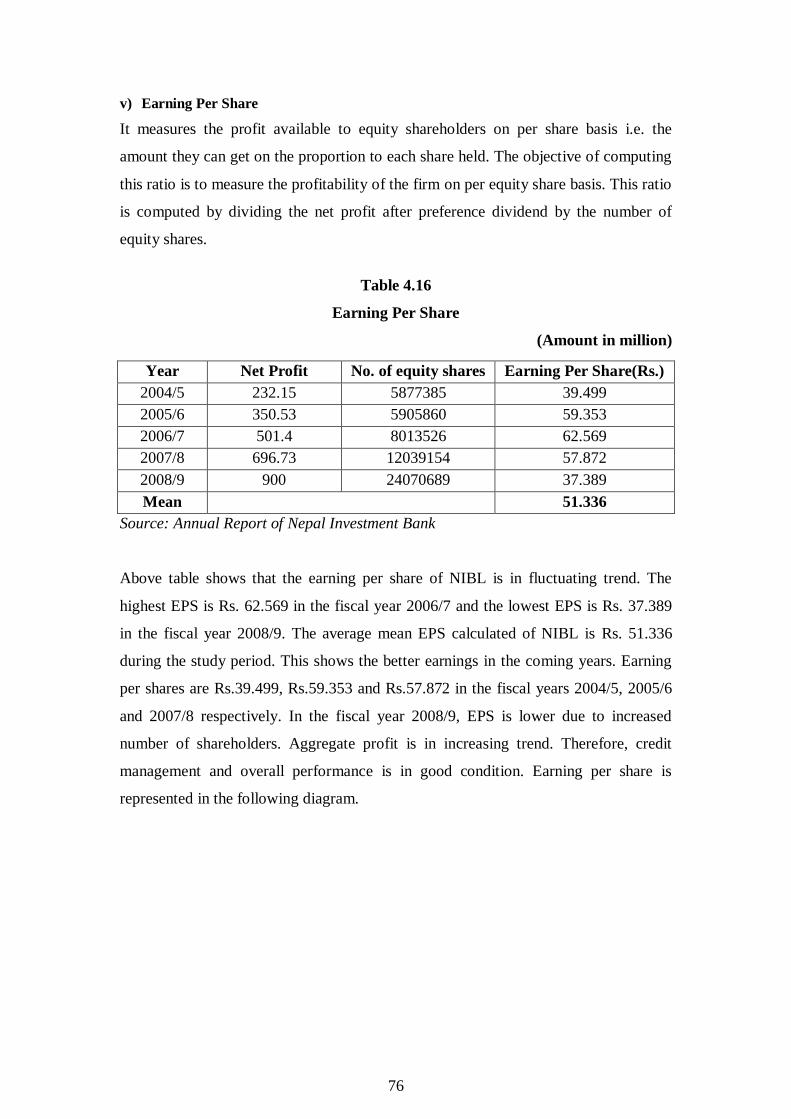
76
v) Earning Per Share
It measures the profit available to equity shareholders on per share basis i.e. the
amount they can get on the proportion to each share held. The objective of computing
this ratio is to measure the profitability of the firm on per equity share basis. This ratio
is computed by dividing the net profit after preference dividend by the number of
equity shares.
Table 4.16
Earning Per Share
(Amount in million)
Source: Annual Report of Nepal Investment Bank
Above table shows that the earning per share of NIBL is in fluctuating trend. The
highest EPS is Rs. 62.569 in the fiscal year 2006/7 and the lowest EPS is Rs. 37.389
in the fiscal year 2008/9. The average mean EPS calculated of NIBL is Rs. 51.336
during the study period. This shows the better earnings in the coming years. Earning
per shares are Rs.39.499, Rs.59.353 and Rs.57.872 in the fiscal years 2004/5, 2005/6
and 2007/8 respectively. In the fiscal year 2008/9, EPS is lower due to increased
number of shareholders. Aggregate profit is in increasing trend. Therefore, credit
management and overall performance is in good condition. Earning per share is
represented in the following diagram.
Year Net Profit No. of equity shares Earning Per Share(Rs.)
2004/5 232.15 5877385 39.499
2005/6 350.53 5905860 59.353
2006/7 501.4 8013526 62.569
2007/8 696.73 12039154 57.872
2008/9 900 24070689 37.389
Mean 51.336
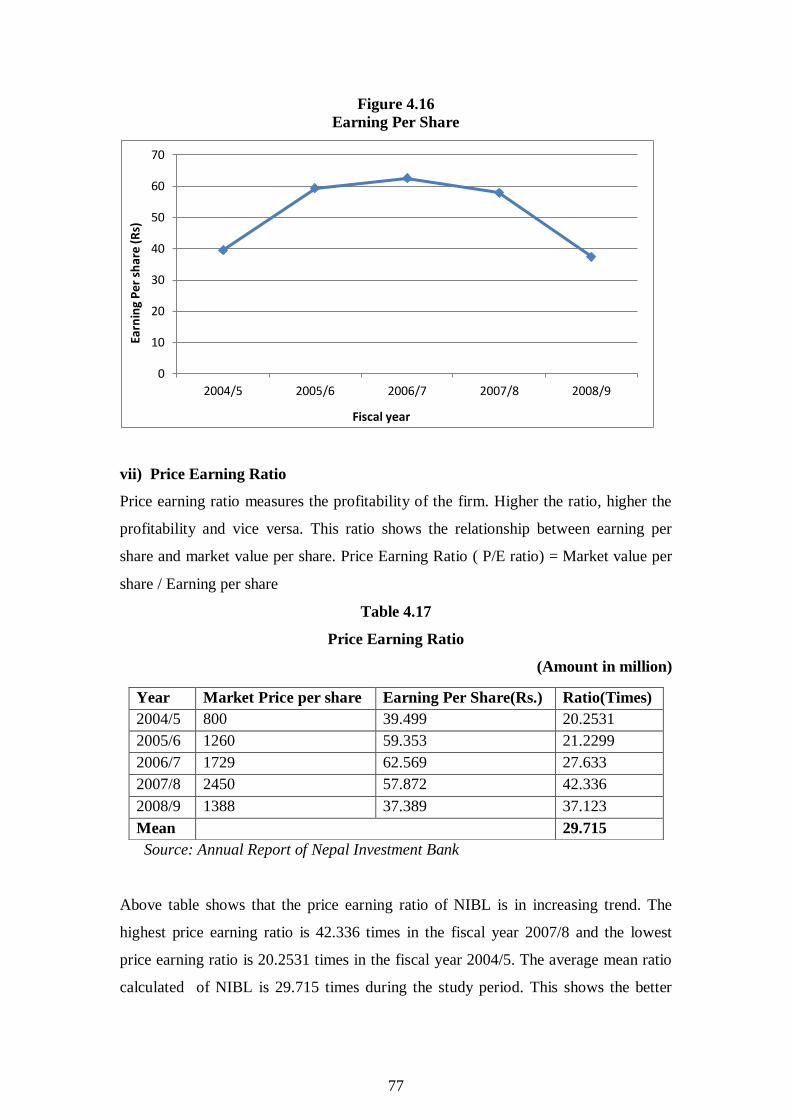
77
Figure 4.16
Earning Per Share
vii) Price Earning Ratio
Price earning ratio measures the profitability of the firm. Higher the ratio, higher the
profitability and vice versa. This ratio shows the relationship between earning per
share and market value per share. Price Earning Ratio ( P/E ratio) = Market value per
share / Earning per share
Table 4.17
Price Earning Ratio
(Amount in million)
Source: Annual Report of Nepal Investment Bank
Above table shows that the price earning ratio of NIBL is in increasing trend. The
highest price earning ratio is 42.336 times in the fiscal year 2007/8 and the lowest
price earning ratio is 20.2531 times in the fiscal year 2004/5. The average mean ratio
calculated of NIBL is 29.715 times during the study period. This shows the better
0
10
20
30
40
50
60
70
2004/5 2005/6 2006/7 2007/8 2008/9
Earn
ing
Pe
r sh
are
(R
s)
Fiscal year
Year Market Price per share Earning Per Share(Rs.) Ratio(Times)
2004/5 800 39.499 20.2531
2005/6 1260 59.353 21.2299
2006/7 1729 62.569 27.633
2007/8 2450 57.872 42.336
2008/9 1388 37.389 37.123
Mean 29.715
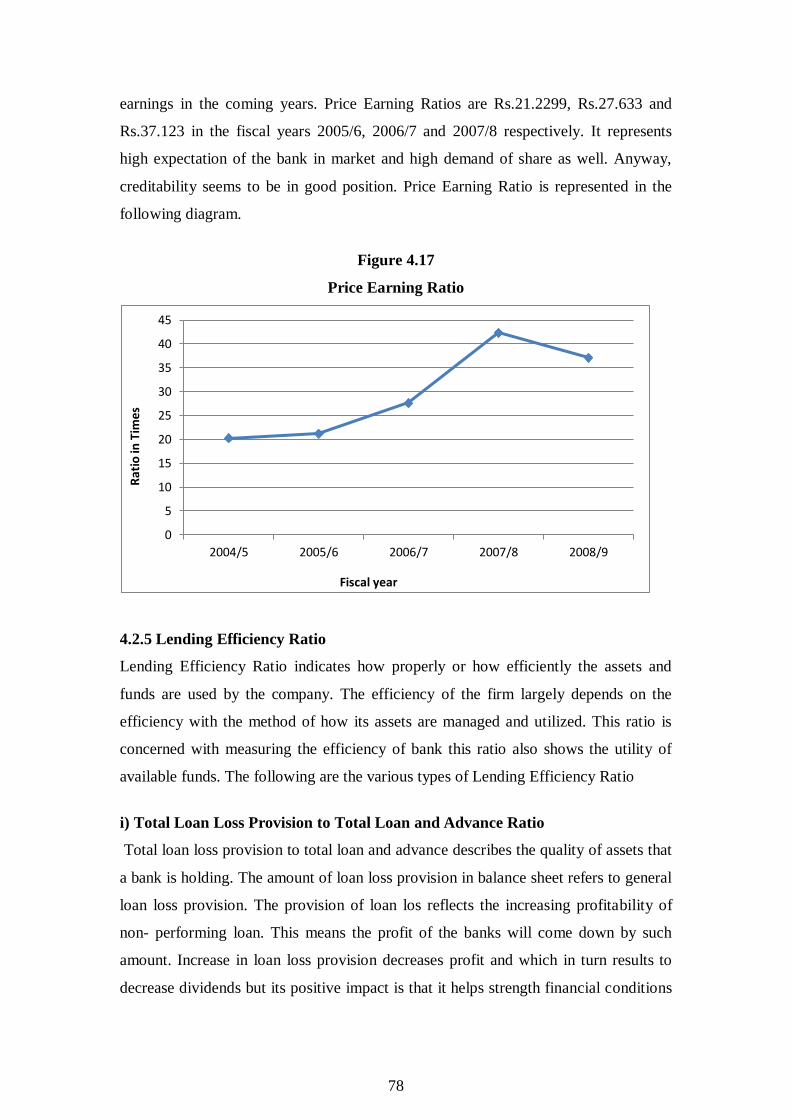
78
earnings in the coming years. Price Earning Ratios are Rs.21.2299, Rs.27.633 and
Rs.37.123 in the fiscal years 2005/6, 2006/7 and 2007/8 respectively. It represents
high expectation of the bank in market and high demand of share as well. Anyway,
creditability seems to be in good position. Price Earning Ratio is represented in the
following diagram.
Figure 4.17
Price Earning Ratio
4.2.5 Lending Efficiency Ratio
Lending Efficiency Ratio indicates how properly or how efficiently the assets and
funds are used by the company. The efficiency of the firm largely depends on the
efficiency with the method of how its assets are managed and utilized. This ratio is
concerned with measuring the efficiency of bank this ratio also shows the utility of
available funds. The following are the various types of Lending Efficiency Ratio
i) Total Loan Loss Provision to Total Loan and Advance Ratio
Total loan loss provision to total loan and advance describes the quality of assets that
a bank is holding. The amount of loan loss provision in balance sheet refers to general
loan loss provision. The provision of loan los reflects the increasing profitability of
non- performing loan. This means the profit of the banks will come down by such
amount. Increase in loan loss provision decreases profit and which in turn results to
decrease dividends but its positive impact is that it helps strength financial conditions
0
5
10
15
20
25
30
35
40
45
2004/5 2005/6 2006/7 2007/8 2008/9
Rat
io in
Tim
es
Fiscal year
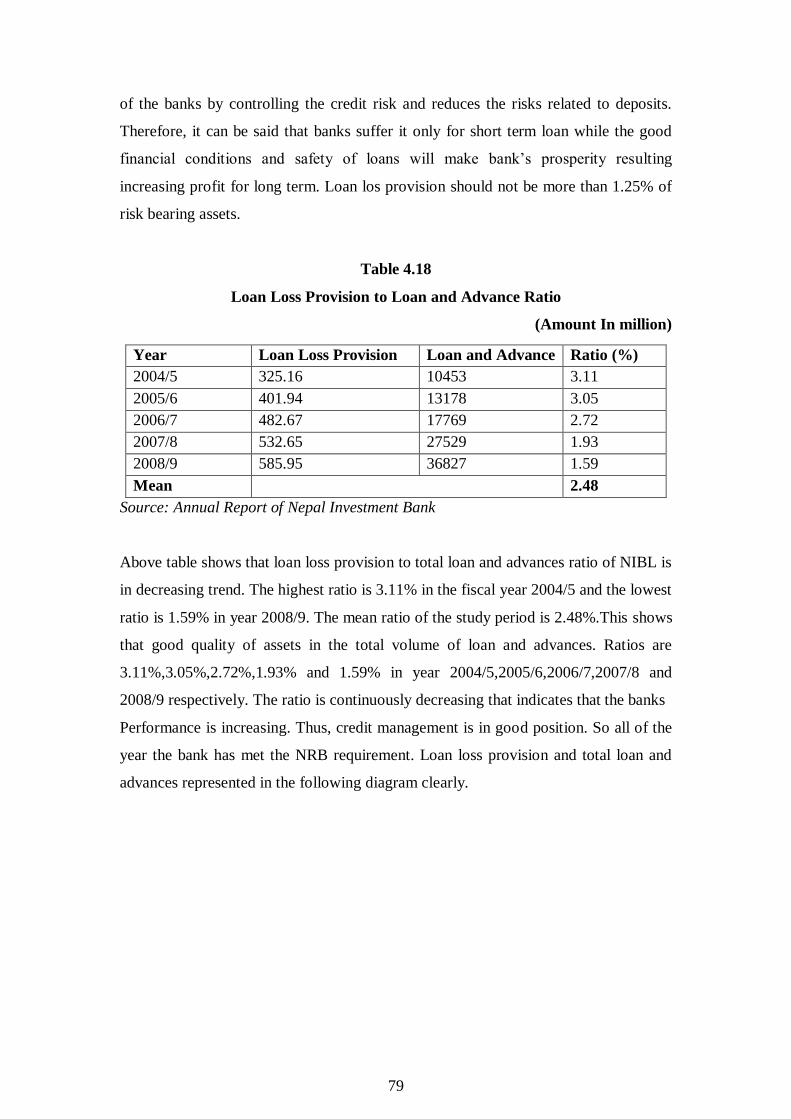
79
of the banks by controlling the credit risk and reduces the risks related to deposits.
Therefore, it can be said that banks suffer it only for short term loan while the good
financial conditions and safety of loans will make bank’s prosperity resulting
increasing profit for long term. Loan los provision should not be more than 1.25% of
risk bearing assets.
Table 4.18
Loan Loss Provision to Loan and Advance Ratio
(Amount In million)
Source: Annual Report of Nepal Investment Bank
Above table shows that loan loss provision to total loan and advances ratio of NIBL is
in decreasing trend. The highest ratio is 3.11% in the fiscal year 2004/5 and the lowest
ratio is 1.59% in year 2008/9. The mean ratio of the study period is 2.48%.This shows
that good quality of assets in the total volume of loan and advances. Ratios are
3.11%,3.05%,2.72%,1.93% and 1.59% in year 2004/5,2005/6,2006/7,2007/8 and
2008/9 respectively. The ratio is continuously decreasing that indicates that the banks
Performance is increasing. Thus, credit management is in good position. So all of the
year the bank has met the NRB requirement. Loan loss provision and total loan and
advances represented in the following diagram clearly.
Year Loan Loss Provision Loan and Advance Ratio (%)
2004/5 325.16 10453 3.11
2005/6 401.94 13178 3.05
2006/7 482.67 17769 2.72
2007/8 532.65 27529 1.93
2008/9 585.95 36827 1.59
Mean 2.48
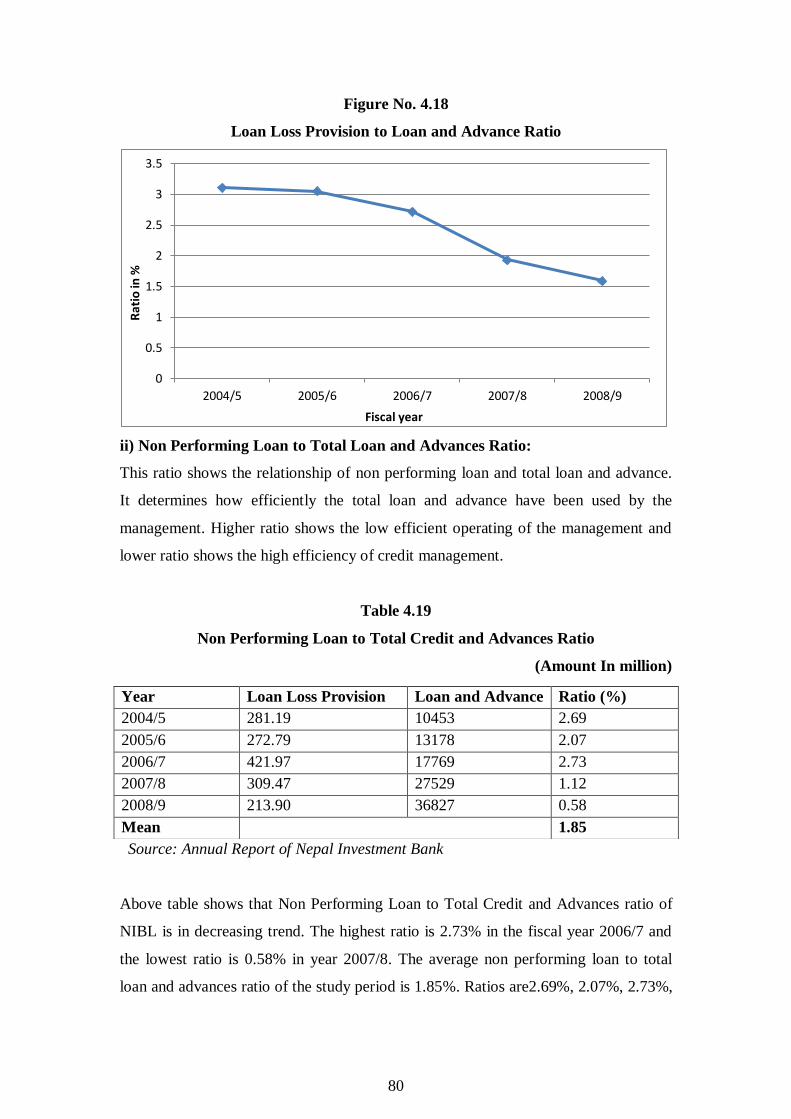
80
Figure No. 4.18
Loan Loss Provision to Loan and Advance Ratio
ii) Non Performing Loan to Total Loan and Advances Ratio:
This ratio shows the relationship of non performing loan and total loan and advance.
It determines how efficiently the total loan and advance have been used by the
management. Higher ratio shows the low efficient operating of the management and
lower ratio shows the high efficiency of credit management.
Table 4.19
Non Performing Loan to Total Credit and Advances Ratio
(Amount In million)
Source: Annual Report of Nepal Investment Bank
Above table shows that Non Performing Loan to Total Credit and Advances ratio of
NIBL is in decreasing trend. The highest ratio is 2.73% in the fiscal year 2006/7 and
the lowest ratio is 0.58% in year 2007/8. The average non performing loan to total
loan and advances ratio of the study period is 1.85%. Ratios are2.69%, 2.07%, 2.73%,
0
0.5
1
1.5
2
2.5
3
3.5
2004/5 2005/6 2006/7 2007/8 2008/9
Rat
io in
%
Fiscal year
Year Loan Loss Provision Loan and Advance Ratio (%)
2004/5 281.19 10453 2.69
2005/6 272.79 13178 2.07
2006/7 421.97 17769 2.73
2007/8 309.47 27529 1.12
2008/9 213.90 36827 0.58
Mean 1.85
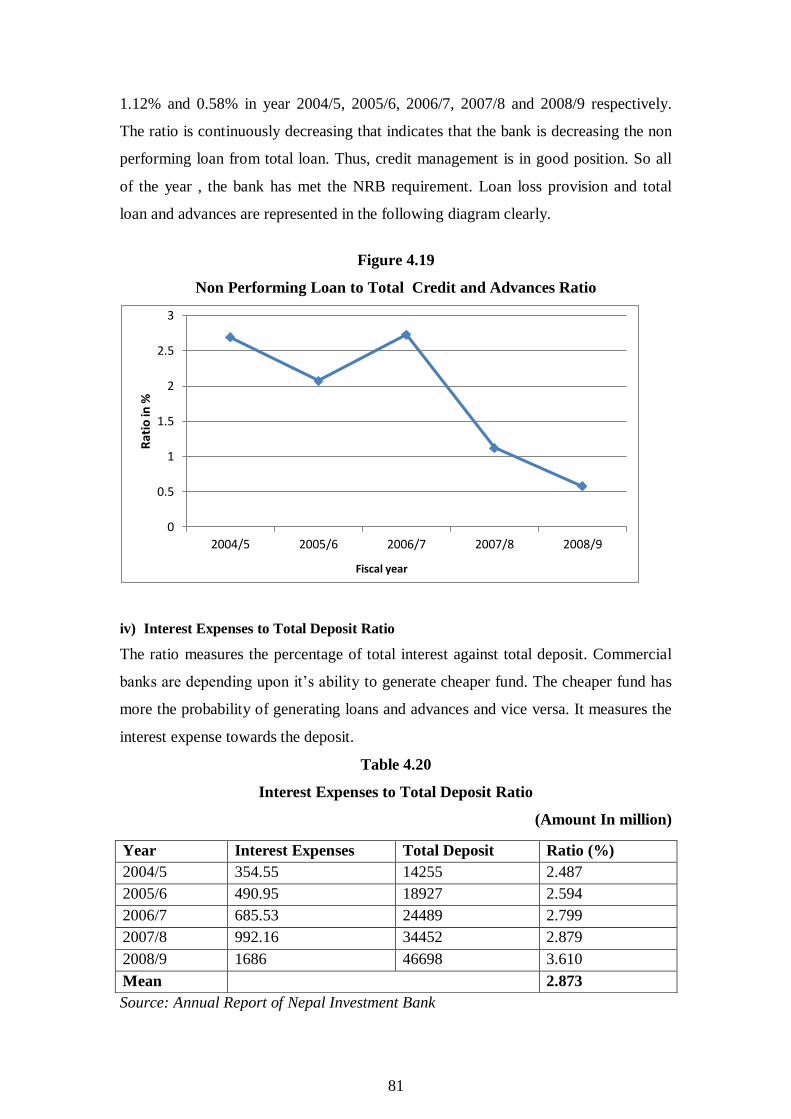
81
1.12% and 0.58% in year 2004/5, 2005/6, 2006/7, 2007/8 and 2008/9 respectively.
The ratio is continuously decreasing that indicates that the bank is decreasing the non
performing loan from total loan. Thus, credit management is in good position. So all
of the year , the bank has met the NRB requirement. Loan loss provision and total
loan and advances are represented in the following diagram clearly.
Figure 4.19
Non Performing Loan to Total Credit and Advances Ratio
iv) Interest Expenses to Total Deposit Ratio
The ratio measures the percentage of total interest against total deposit. Commercial
banks are depending upon it’s ability to generate cheaper fund. The cheaper fund has
more the probability of generating loans and advances and vice versa. It measures the
interest expense towards the deposit.
Table 4.20
Interest Expenses to Total Deposit Ratio
(Amount In million)
Source: Annual Report of Nepal Investment Bank
0
0.5
1
1.5
2
2.5
3
2004/5 2005/6 2006/7 2007/8 2008/9
Rat
io in
%
Fiscal year
Year Interest Expenses Total Deposit Ratio (%)
2004/5 354.55 14255 2.487
2005/6 490.95 18927 2.594
2006/7 685.53 24489 2.799
2007/8 992.16 34452 2.879
2008/9 1686 46698 3.610
Mean 2.873

82
Above table shows that Interest Expenses to Total Deposit Ratio of NIBL is in
fluctuating trend. The highest ratio is 3.61% in the fiscal year 2008/9 and the lowest
ratio is 2.487% in year 2004/5. The average mean point of interest expenses to total
deposit ratio of the study period is 2.873%. Ratios are 2.487%, 2.594%, 2.799%,
2.879% and 3.610% in year 2004/5, 2005/6, 2006/7, 2007/8 and 2008/9 respectively.
The ratio does not indicate higher interest expenses on total deposit. Commercial
Banks are dependent upon its ability to generate cheaper fund. Interest Expenses to
Total Deposit Ratio is represented in the following diagram clearly
Figure 4.20
Interest Expenses to Total Deposit Ratio
4.3 Statistical Analysis
i) Correlation Coefficient
Correlation coefficient is used to define the relationship between two or more
variable. Coefficient of correlation has been studied to find out whether the two
available variables are inter correlated or not. If the result falls within the correlated
point, the two variables are Interco related otherwise not. Now to find out the
correlation coefficient between total lending and total assets, the widely used method
of Karl Pearson’s Coefficient of Correlation has been adopted.
0
0.5
1
1.5
2
2.5
3
3.5
4
2004/5 2005/6 2006/7 2007/8 2008/9
Rat
ion
in %
Fiscal year

83
Correlation Coefficient (
22
2
2
2
22
1
2
1
2121
21
XXNXXN
XXXXNr xx
Here,
21XXN= No. of product observation and sum of product X1 and X2
21 XX= Sum of product X1 and sum of product X2
N= Number of pairs of X1 and X2 observed
r = Karl Pearson’s Coefficient of Correlation
ii) Probable Error
It is a method to determine the reliability of the value of Pearson’s coefficient of
correlation. It helps in interpreting the value of coefficient of correlation. If r is the
calculated correlation coefficient in a sample of n pairs of observation, then its
standard error, usually denoted by S.E & given by.
S.E(r)= 1-r2
Probable error of the coefficient of correlation can also be calculated from S.E. of the
Coefficient of correlation by the following formula:
P.E. = N
r 21*6745.0
Where r= coefficient of correlation
N= no of observations
The probable error is used to test whether the calculated value of correlation
significant
or not.
If r < 6* P.E (r), then the value of r is not significant
If r > 6* P.E (r), then the value of r is significant
In this course of study, the correlation coefficient and probable error is used to
measure sample relationship between Total credit and Total assetsLoan and Advance
and Total deposit.
A. Correlation Coefficient between Deposit & Loan & Advances
Deposit have played very important role in the performance of commercial banks and

84
similarly loan and advances are very important to mobilize the collected deposits. Co-
efficient of correlation between deposit and loan & advances measures the degree of
relationship between these two variables. The main objectives of computing “r”
between these two variables is to justify whether deposit are significantly used as loan
& advances in proper way or not .Coefficient of correlation determination between
deposit and loan advances of NIBL is shown below
Table 4.21
Correlation Coefficient between Deposit and Loan and Advances
Correlation
Coefficient
Coefficient of
determination (r2)
Probable Error
(P.E)
6P.Er
0.997 0.994 0.00181 0.011
Source: Through SPSS Data Editor
The above table shows that the correlation coefficient between deposit and loan and
advances is 0.997. There is highly positive correlation between loan and advances and
deposit collection. The coefficient of determination is 0.994,, which depicts that
99.4% of loan has been explained by the deposit collection. It shows that increase in
deposit highly lead to increase loan and advances. In accordance to increase in
deposit, NIBL’s loan and advances is in increasing trend.
Probable error(P.E) is calculated to be 0.00181 and 6 P.E. is 0.011. Probable error of
the correlation coefficient denoted by P.E. is the measure of testing the reliability of
the calculated value of r. Here ‘ r’ is greater than 6 P.E than there is evidence of
significant correlation between loan and deposit. That further reveals there is
significant relationship between loan and advances and deposit.
B.Coefficient of Correlation between Total Deposits and Total Assets
The coefficient of correlation between deposit and asset measures the degree of
relationship between these two variables. The following Table No. 4.30 shows the
coefficient correlation between deposits and total assets i.e.r, P. Er. and coefficient of
determination (r2) of NIBL during the study period. The table 4.22 presents the
correlation coefficient between Total Deposits and Total Assets.

85
Table 4.22
Correlation Coefficient between Deposit and total assets
Correlation
Coefficient
Coefficient of
determination (r2)
Probable Error
(P.E)
6P.Er
0.999 0.998 0.00062137 0.0036
Source: Through SPSS Data Editor
The above table shows that the correlation coefficient between Total Deposits and
Total Assets of NIBL is 0.999. It shows the highly positive correlation between Total
Deposits and Total Assets. In addition, coefficient of determination of NIBL is 0.998.
The correlation coefficient is significant because the correlation coefficient is more
than 6 P. Er. It refers that there is significant relationship between total deposit and
total assets. From the above table, the conclusion can be drawn that NIBL has high
degree positive correlation between total deposit and total assets.
C. Coefficient of Correlation between Loan and advances and Net Profit
Coefficient of Correlation between Loan and advances and Net Profit is used to
measure the degree of relationship between two variable i.e. Loan and advances and
net profit of NIBL during the research period, where loan and advances is
independent variable ( X ) and net profit is dependent variable ( Y ). The main
objective of calculating this ratio is to determine the degree of relationship whether
the net profit is significantly correlated or not and the variation of net profit to loan
and advances through the coefficient of determination. The following table shows the
Coefficient of Correlation between Loan and advances and Net Profit of NIBL for the
study period.
Table No. 4.23
Coefficient of Correlation between Loan and advances and Net Profit
Correlation
Coefficient
Coefficient of
determination (r2)
Probable Error
(P.E)
6P.Er
0.989 0.978 0.00663 0.04
Source: Through SPSS Data Editor
The above table shows that the correlation coefficient between Total Profit and Loan
and Advance of NIBL is 0.989. It shows the highly positive correlation between Total
Profit and Loan and Advance. In addition, coefficient of determination of NIBL is

86
0.978, which depicts that 97.8 percent of profit is explained by loan and advance.
Probable Error( P.E ) is calculated as 0.00663 and 6 P.Er. is 0.04.The correlation
coefficient is significant because the correlation coefficient is more than 6 P. Er. It
refers that there is significant correlation between Loan and deposit. From the above
table, the conclusion can be drawn that NIBL has high degree positive correlation
between total profit and loan and advances.
D. Coefficient of Correlation between Total Debt and Total Assets
Coefficient of Correlation between Total Debt and Total Assets measures the degree
of the relationship between two variables, i.e. Total Debt and Total assets. In the
correlation analysis, Investment is independent variable and net Profit is dependent
variable. The following table shows the coefficient of correlation, coefficient of
determination, probable error and six times of P.Er. during the fiscal year 2004/5 to
2008/9.
Table No 4.24
Correlation Coefficient between total debt to total assets
Correlation
Coefficient
Coefficient of
determination (r2)
Probable Error
(P.E)
6P.Er
0.999 0.996 0.00121 0.0072
Source: Through SPSS Data Editor
Above t\able shows that Correlation Coefficient between total debt to total assets of
NIBL is 0.999, which implies there is highly positive correlation between total debt
and total assets. In addition coefficient of determination is 0.996. It means 99.6 % of
assets is contributed by Debt. Obviously , this correlation is significant at all due to
coefficient of determination is higher than probable error. Thus , it can be concluded
that the degree of relationship between total debt and total assets of NIBL is highly
positively correlated.
87
E. Correlation Coefficient between loan and advances and non performing assets
Table No. 4.25
Correlation Coefficient between loan and advances and nonperforming assets
Correlation
Coefficient
Coefficient of
determination (r2)
Probable Error
(P.E)
6P.Er
0.555 0.308 0.2087 1.25
Source: Through SPSS Data Editor
The above table shows that the Correlation Coefficient between loan and advances
and nonperforming assets of NIBL . The correlation coefficient between sector wise
lending and loan and advances of NIBL is 0.555. There is moderate positive
correlation loan and advances and non performing assets. The coefficient of
determination is 0.308, which depicts that 30.8% of NIBL has been explained by the
loan and advances. Probable error is calculated to be 0.2087 and 6 P.E . is 1.25.
Probable error of the correlation coefficient denoted by P.E. is the measure of testing
the reliability of the calculated value of r. Here, “r” is smaller than 6 P.E.then there is
evidence of insignificant correlation between Loan and advance and PSL ratio . This
further reveals there is insignificant relationship between loan and advances and
deposit.
F. Trend Analysis:
Here, trend analysis of total deposits and loan and advances is projected for the five
years. The measure of trend analysis shows the behavior of given variables in the
series of time. This trend analysis is carried out to see average performance of the
banks for next five years. Trend analysis is based on some assumptions: All the other
things will remain unchanged. The bank will run in present condition. The economy
will remain in present stage.NRB will not change its guidelines to commercial banks.
i) Trend Analysis of Total Deposit:
Deposits are the important part in banking sector. Hence, its trend for next seven years
will be forecasted for future analysis. This is calculated by using least square method.
Y= a + bx
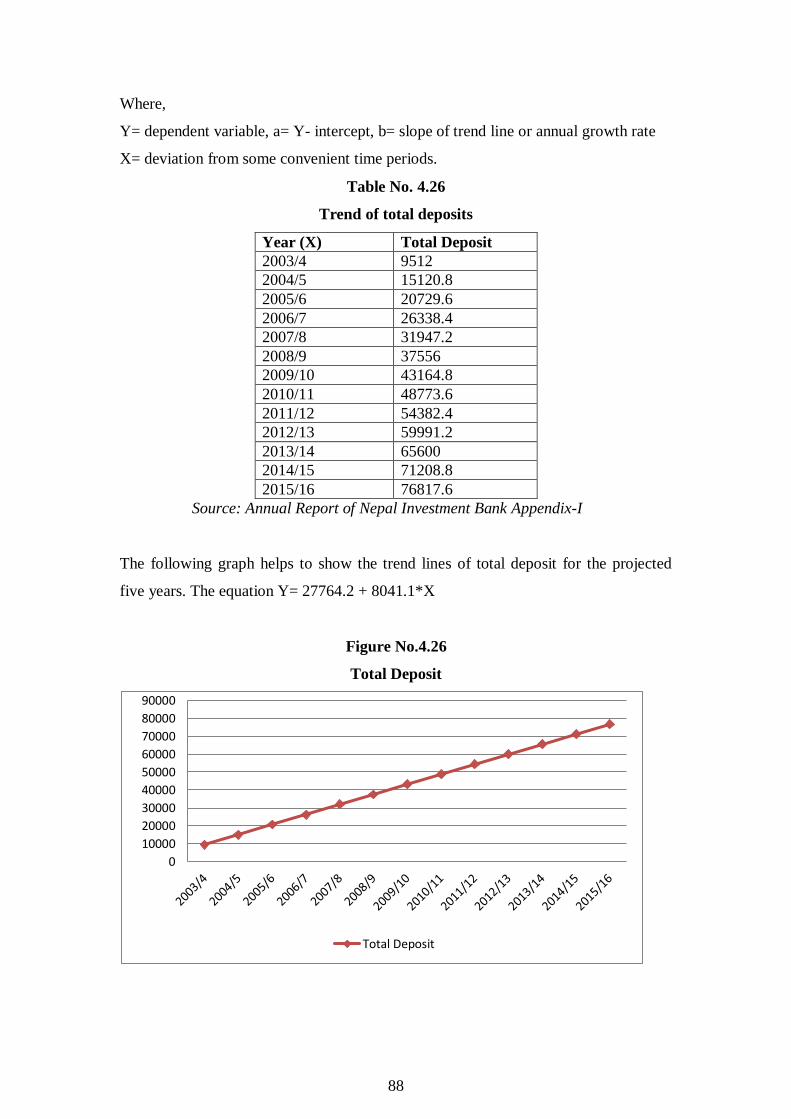
88
Where,
Y= dependent variable, a= Y- intercept, b= slope of trend line or annual growth rate
X= deviation from some convenient time periods.
Table No. 4.26
Trend of total deposits
Year (X) Total Deposit
2003/4 9512
2004/5 15120.8
2005/6 20729.6
2006/7 26338.4
2007/8 31947.2
2008/9 37556
2009/10 43164.8
2010/11 48773.6
2011/12 54382.4
2012/13 59991.2
2013/14 65600
2014/15 71208.8
2015/16 76817.6
Source: Annual Report of Nepal Investment Bank Appendix-I
The following graph helps to show the trend lines of total deposit for the projected
five years. The equation Y= 27764.2 + 8041.1*X
Figure No.4.26
Total Deposit
0
10000
20000
30000
40000
50000
60000
70000
80000
90000
Total Deposit

89
Above table and figure shows total deposit of NIBL. The trend of total deposit of
NIBL is in increasing trend. The rate of increment of total deposit for NIBL seems to
be smoothly increasing trend. The trend analysis shows the projected deposit amount
in fiscal year FY 2008/9 to FY 2015/16.
Trend Analysis of total loan and advances
Table No. 4.27
Trend Analysis of total loan and advances
Year (X) Total loan and
advances
2003/4 5724.4
2004/5 10494
2005/6 15263.6
2006/7 20033.2
2007/8 24802.8
2008/9 29572.4
2009/10 34342
2010/11 39111.6
2011/12 43881.2
2012/13 48650.8
2013/14 53420.4
2014/15 58190
2015/16 62959.6
Source: Annual Report of Nepal Investment Bank Appendix-II
The following graph helps to show the trend lines of Loan and advance for the
projected five years. The equation is Y= 21151.2 + 6709.9*X
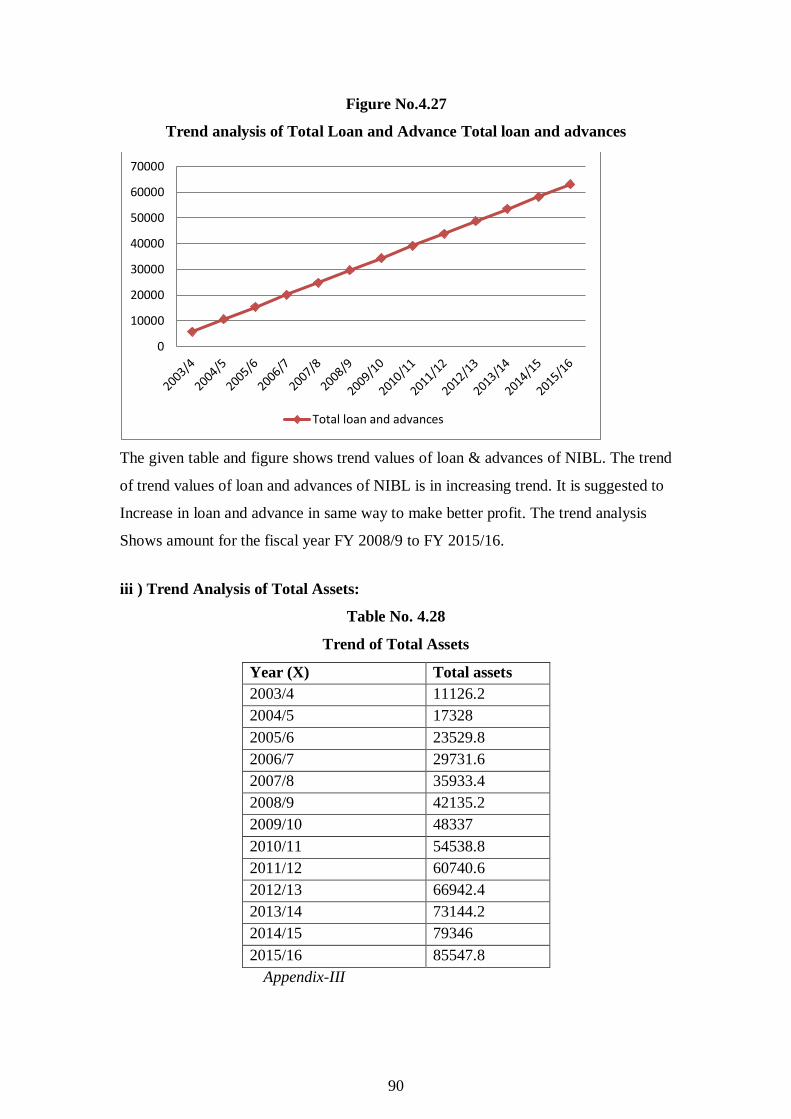
90
Figure No.4.27
Trend analysis of Total Loan and Advance Total loan and advances
The given table and figure shows trend values of loan & advances of NIBL. The trend
of trend values of loan and advances of NIBL is in increasing trend. It is suggested to
Increase in loan and advance in same way to make better profit. The trend analysis
Shows amount for the fiscal year FY 2008/9 to FY 2015/16.
iii ) Trend Analysis of Total Assets:
Table No. 4.28
Trend of Total Assets
Year (X) Total assets
2003/4 11126.2
2004/5 17328
2005/6 23529.8
2006/7 29731.6
2007/8 35933.4
2008/9 42135.2
2009/10 48337
2010/11 54538.8
2011/12 60740.6
2012/13 66942.4
2013/14 73144.2
2014/15 79346
2015/16 85547.8
Appendix-III
0
10000
20000
30000
40000
50000
60000
70000
Total loan and advances

91
The following graph helps to show the trend lines of Total Assets for the projected
five years. The equation is Y= 31558.6 + 9197.7*X
Figure No.4.28
Trend Analysis of Total Assets Total assets
The given table and figure shows trend of Total Assets of NIBL. The trend of trend
values of Total Assets of NIBL is in increasing trend. The rate of increment of Total
Assets for NIBL seems to be moderately increasing. It is suggested to maintain the
same type of increment regularly to make better profit. The trend analysis shows the
projected deposit amount for the fiscal year FY 2008/9 to FY 2015/16.
0
10000
20000
30000
40000
50000
60000
70000
80000
90000
Total assets
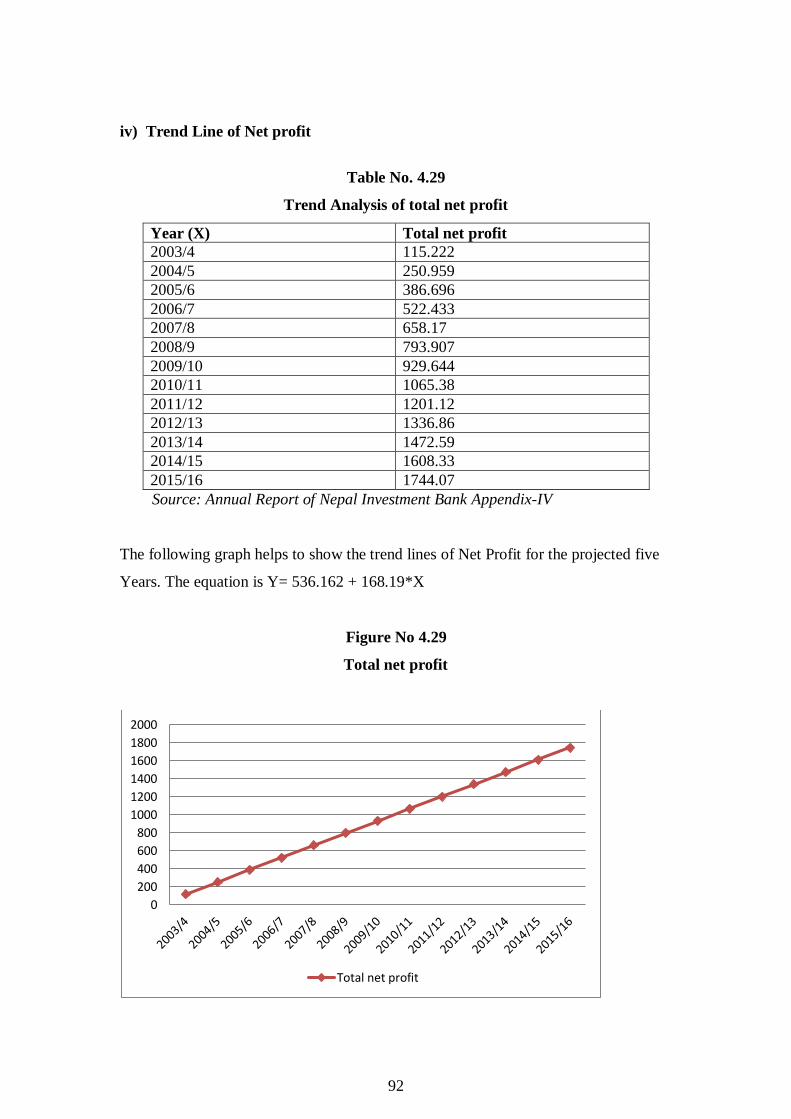
92
iv) Trend Line of Net profit
Table No. 4.29
Trend Analysis of total net profit
Year (X) Total net profit
2003/4 115.222
2004/5 250.959
2005/6 386.696
2006/7 522.433
2007/8 658.17
2008/9 793.907
2009/10 929.644
2010/11 1065.38
2011/12 1201.12
2012/13 1336.86
2013/14 1472.59
2014/15 1608.33
2015/16 1744.07
Source: Annual Report of Nepal Investment Bank Appendix-IV
The following graph helps to show the trend lines of Net Profit for the projected five
Years. The equation is Y= 536.162 + 168.19*X
Figure No 4.29
Total net profit
0
200
400
600
800
1000
1200
1400
1600
1800
2000
Total net profit
93
The above table and figure shows that the Total Profit of NIBL is in increasing trend.
The rate of increment of total profit seems to be aggressively in increasing trend. It is
better for company but this type of increment should be maintained regularly. The
trend analysis shows the deposit amount in fiscal year 2008/9 to fiscal year 2015/16.
4.4 Major Findings of Study
Liquidity Ratio
The cash and bank balance to total deposit of NIBL shows the fluctuating trend during
the study period. The mean ratio is 0.093 times in the study period. Cash and bank
balance to current deposit of the bank shows the fluctuating trend during the study
period. The mean average calculation is 1.070 times in the study period. This means
that the bank is able to maintain good liquidity position. The cash and bank balance to
interest sensitive ratio of NIBL is in fluctuating trend. The mean ratio is 0.284 times.
This means
that the bank is able to maintain this ratio in the financial condition. Therefore, the
liquidity management is in good position of NIBL. This means that the bank is able to
maintain good financial condition.
Assets Management Ratio
Loan and advances to fixed deposits ratio are increasing trend in overall. The mean
ratio is 2.9432 times at the research period. The total loan and advances to total
deposit ratio of NIBL is in increasing trend. The average mean ratio of NIBL is 0.718
times in the study period. Similarly credit and advance to total asset is not so
fluctuating trends. The average mean ratio is 63.06%. It shows that the bank has
capability of utilizing total assets in the form of credit and advances.The total non-
performing assets to total assets of NIBL is in decreasing trend. The mean ratio is
1.333%. The bank is able to obtain higher lending opportunity. The ratio indicated
high contribution made by lending and investing activities. Thus, credit risk
management is in a good position.
94
Leverage Ratio
The Debt to equity ratio of NIBL is in increasing trend during the study period. The
average mean ratio is 14.24 times. Excess amount of debt capital structure results
heavy burden in payment of interest. Risk of liquidation increases if the debt cannot
be repaid in time. The analysis indicated that the bank is highly leveraged because the
claim of the outsiders exceeds than those of the owners over the bank assets. The Debt
to assets ratio of NIBL is high or in other words, they have excessively geared capital
structure. The average mean ratio in 5 years research period is 0.93 times. It means
almost 93% of total assets is financed by the outsider’s funds. It is seen that there is
not much deviation in the ratio for the five years study period.Total assets to net worth
ratio of the bank are decreasing and fluctuating trend thereafter. In overall the study
period the average ratio at that times is 15.318 times. It represents good condition of
Total assets to net worth ratio.
Profitability Ratio
Profitability ratios are very helpful to measure the overall efficiency in operation of a
financial institution. The total net profit to gross income ratio of NIBL is in increasing
and decreasing trend. The mean ratio is 3.96. These are able to obtain higher
efficiency.
This means that credit management is in good position.The total interest to total
income ratio of NIBL is in fluctuating trend. The highest ratio is 1.9698 times in year
2005/6 and lowest ratio is 1.1765 times in year 2004/5. The mean ratio is 1.399 times
in the study period. The ratio indicates the high contribution made by lending and
investing activities. The operating profit to loan and advances ratio of NIBL is in
fluctuating trend. The highest ratio is 4.401% in the year 2003/4 and lowest ratio
3.191% in the year 2004/5. The average mean ratio over the period is 3.9%. This
shows the better profitability position of the bank. That return on loan and advances
ratio of NIBL is in increasing trend. These show the highest earning in 2006/7 and
lowest earning capacity in 2003/4 from loan and advances. These show the little high
earning capacity of NIBL through loan and advances. Thus,
95
credit management is in good position. The Net profit to total assets ratio of NIBL is
in increasing trend. The highest ratio is 1.817 in 2006/7 and lowest ratio is 1.1339% in
the year 2003/4. The mean ratio is 1.56%. This shows the normal earning capacity
through asset utilization. The Earning per share of NIBL is in fluctuating trend. The
highest EPS is Rs 62.569 in the year 2006/7 and lowest EPS Rs.39.499 in the year
2004/5. The average means EPS of NIBL is Rs 54.199 in the study period. This shows
the better profitability in the study years.
That price-earning ratio earning of NIBL is in increasing trend. The highest price-
earning ratio is 42.336s in year 2007/8 and lowest ratio 18.1818 times in year 2003/4.
The average mean ratio of NIBL is 25.927 times in the study period. This shows the
better profitability in the last years. These mean that the better profitability in the
coming last years. It represents high expectation of company in market and high
demand of share. However, it is recommended to risk in invest in market price.
Lending Efficiency Ratio
The loan loss provision to total loan and advances ratio of NIBL is in decreasing
trend. The highest ratio is 3.11% in year 2004/5 and lowest ratio 1.93% in year
2007/8. The mean ratio of the study period is 2.73%. These indicate the good quality
of assets in total volume of loan and advances. The ratio is continuously decreasing
this which indicates that bank’s performance is increasing. Thus, credit management
is in good position. The Non-performing loan to total loan and advance of NIBL is in
decreasing trend. The highest ratio is 2.69% in the year 2004/5 and lowest ratio
1.12% in year 2007/8. The mean ratio of the study period is 2.37%.. The ratio is
continuously decreasing this which indicates efficient operation of credit management
The interest expenses to total deposit ratio of NIBL is in fluctuating trend. The highest
ratio is 2.87% in year 2007/8 and lowest ratio 2.487% in year 2004/5. The mean point
of interest expenses to total deposit ratio of the study period is 2.718%. These indicate
the good quality of assets in total volume of loan and advances. The ratio does not
indicate higher interest expenses to total deposit. Commercial banks are dependent
upon its ability to generate cheaper fund.
96
4.5 Statistical Tools
Correlation Coefficient
The correlation coefficient between deposit and loan advances is 0.997. There is
highly positive correlation between loan and advances and deposit collection. The
coefficient of determination is 0.994, which depicts that 99.4% of loan has been
explained by the deposit collection. It shows that increase in deposit highly lead to
increase loan and advances. ‘ r’ is greater than 6 P.E.there is evidence of significant
correlation between loan and deposit. That further reveals there is significant
relationship between loan and advances and deposit.
The coefficient of correlation between deposit and total assets of NIBL is 0.999. It
shows the highly positive correlation. In addition, coefficient of determination of
NIBL means there is 99.8% of total assets is explained by total deposit. The
correlation coefficient is significant because the correlation coefficient is more than of
6 P.Er.The correlation coefficient between total profit and loan and advances is 0.989.
There is highly positive correlation between total profit and loan and advances. The
coefficient of determination is 0.978, which depicts that 97.8% of profit has been
explained by the loan and advances.‘ r’ is greater than 6 P.E.then there is evidence of
significant correlation between loan and deposit. The coefficient of correlation
between total debt and net profit of NIBL is 0.996. It means 99.6% of assets is
contributed by debt.It shows the highly positive correlation. In ddition, coefficient of
determination of NIBLis higher than 6 P.E. Thus it can be concluded that the degree
of relationship between total debt and total assets of NIBL has highly positive
correlation.The correlation coefficient between loan and advances and non performing
asset of NIBL is 0.555. There is moderate positive correlation between loan and
advances and non performing assets. The coefficient of determination is 0.308, which
depicts that 30.8% of non performing assets has been explained by the loan and
advances. ‘r’ is smaller than 6 P.E. then there is evidence of significant correlation
between loan and advance and PSL ratio.

97
Trend Analysis
The trend of total deposit of NIBL is in increasing trend. The rate of increment of
total deposit for NIBL seems to be smoothly in increasing trend. The trend values of
loan and advances of NIBL are in increasing trend. It is suggested to increase loan and
advance in the same way to make better profit. The trend of Total Assets of NIBL is
in increasing trend. The rate of increment of Total Assets for NIBL seems to be
moderately increasing trend. It is better for company. This type of increment should
be maintained regularly. The trend of Total Profit of NIBL is also is in increasing
trend. The rate of increment of Total Profit for NIBL seems to be aggressively in
increasing trend. It is better for the company and this type of increment should be
maintained regularly.
98
CHAPTER V
SUMMARY, CONCLUSION AND RECOMMENDATION
5.1 Summary
The research is about the credit Management of Nepal Investment bank. In this
chapter, summary conclusion and recommendation are included. All the summary and
conclusion are made according to obtained data from analysis. Recommendation has
made which would be beneficial for the management of the bank and other
stakeholder. In the aspect of liquidity position, cash and bank balance reserve ratio
shows the more liquidly position. Cash and bank balance total deposit has fluctuating
trend in 5 year study period. The average mean ratio is 0.0935 times in the study
period. These all ratio shows that the bank is maintain the good liquidity position of
the bank. Cash and bank balance to current deposit is also fluctuating. The mean
average calculation is 1.070 times. Cash and bank balance would sufficient to meet
the demand of current depositors. The average mean of cash and bank balance to
interest sensitive ratio is 0.248 times. It shows the bank is able to maintain good
financial condition. In the assets management ratio, credit advances to fixed deposit
ratio is increasing trends. The average mean of NIBL is 2.9432 times at research
period. In aggregate is shows the better performance but credit and advances to total
deposit position in minimum than averages. NIBL bank has generally mixed or
fluctuating increasing trends of credit Advance to Total Assets ratio. The average
mean ratio is 63.06%. It shows that bank has capability in utilizing total assets in the
form of credit and advance. Whereas investment in credit advance is done safely not
taking more risk. That’s why assets management position of the bank shows better
performance in the recent years. A non-performing assets to total assets ratio is
opportunity during the study period. Therefore, credit management is in good position
of the bank. In leverage ratio Debit to equity ratio is in constants trend and the
average mean ratio for total debt to equity ratio is 14.24 times Total debt to total
assets ratio is 92 times, which means 93% of the bank’s assets are financed with debt,
and only the remaining 7% of the financing comes from shareholder’s equity. High
total debt to total assets ratio posses higher financial risk and vice-versa. Total assets
to net worth ratio of the bank are decreasing and fluctuating trend thereafter. In over
99
all the study period the average ratio at the time is 15.318 times, it represents good
condition of total assets to net worth ratio. In the aspect of profitability position, total
net profit to gross income, the total interest income to total income ratio of NIBL is in
increasing and decreasing trend. The mean ratio is 39.6% in the study period. The
ratio indicates the high contribution made by leading and investing activities. The
total interest income to total income ratio of NIBL is in fluctuating trend. The mean
ratio is 1.399 times in the study period. The operating profit to loan and advances
ratio of NIBL is in fluctuating trend. The return on lone and advance ratio of NIBL is
in increasing trend. The average mean ratio is 2.46%. These shows the little high
earning capacity of NIBL bank through lone and advances. The net profit to total
assets ratio of NIBL is in increasing trend the mean ratio is 1.56%. This show the
normal earning capacity through asset utilization. Earning per share of NIBL Bank is
in increasing trend. The average ratio is 25.927 times in the study period. These mean
that the better probability in the coming last years. It represents high expectation of
company in market and high demand of share. After analyzing the lending efficiency
of the bank, the lone loss provision to total loan and advances ratio of NIBL is in
decreasing trend. The mean ratio of the study period is 2.73%. The ratio is
continuously decreasing this indicates that bank increasing performance. Thus, credit
management is in a good position. The Non-performing lone to total loan and advance
ratio is also decreasing trend. This ratio indicates the more efficient operating of credit
management. The interest expenses to total deposit ratio of NIBL in the fluctuating
trend. The average mean point of interest expense to total deposit ratio is 2.718%
during the study period. That this ratio does not indicates higher interest expenses on
total deposit. In statistical analysis, correlation analysis and trend analysis have been
calculated. Correlation coefficient between total credit and total assets is 0.999, which
shows high degree of positive correlation. It can be concluded that assets and total are
increasing and can be said that increasing assets will have positive impact towards
loan and advances. The correlation coefficient between Total profit and loan and
advances is 0.989. There is highly positive correlation between loan and advances and
deposit collection. Similarly, correlation coefficient between total debt net profit of
NIBL is 0.999 which implies there is highly positive correlation between debit and
Total assets. The correlation coefficient between sector wise lending and loan
advances of NIBL is 0.555. There is moderate positive correlation between loan and
advances and nonperforming assets. Trend analysis tool are done for future
100
forecasting. Trend analysis for total deposit is calculated to see future deposit trend of
the bank. The trend of total deposit of NIBL is in increasing trend. The trend of trend
values of loan & advances of NIBL is increasing trend similarly The trend of Total
Assets of NIB is
also increasing trend. The trend of Total Profit of NIB is in increasing trend. The rate
of increment of Total Profit of NIBL seems to be aggressively increasing trend.
5.2 Conclusion
The study is conducted on credit management of Nepal Investment Bank, which is
one of the leading banks in Nepal. NIBL has been maintaining a steady growth rate
Over this period. NIBL has earned a net profit of Rs 796 million for the fiscal year
2007/08 and this comes to be 39.12% more as compared to the same period in the
previous fiscal year. NIBL earned operating profit of Rs 1149 million for the fiscal
year 2007/08 and this comes to be 34.07% more as compared to the same period in
the fiscal year. Similarly, total deposit is Rs 34452 million for the fiscal year 2007/08
and this comes to be 40.89% more as compared to the same period in the previous
fiscal year. Similarly, total loan is Rs 27529 million which is increase by 54.93%
compare as previous fiscal year.
Nepal Investment bank has adequate liquidity position. It shows that bank’s
investment is appropriate. NIBL bank shows the fluctuating trend during the study
period. Now in Nepal, many banks and financial institution are functioning to collect
deposit and invest money somewhere in the investigable sectors. Remittance has also
help to increase the amount of deposit in bank. On the other hand due to political
crisis economic sectors have been damaged. Most of the projects have been
withdrawn due to security problem. So, banks are utilizing their fund in home loan,
auto loan and share loan etc in consumer banking.
Loan and advances to fixed deposits ratio and the total loan advances to total deposit
ratio of NIBL are increasing trend in overall. The mean ratio is 2.9432 times and
0.718 times in the study period. Similarly credit and advances to total asset is not so
fluctuating tends. The average mean ratio is 63.06%. The total non- performing assets
ratio of NIBL is in decreasing trend. The mean ratio is 1.333%. The bank is able to
obtain higher lending opportunity. The ratio indicates the high contribution made by

101
lending and investing activities. Thus, credit management is in a good position. The
Debit to equity ratio of NIBL is in increasing trend during the study period. The
analysis indicates that the bank is highly leveraged because the claim of the outsiders
exceeds than those of the owners over the bank assets. The Debt to assets ratio of
NIBL is high or in other words, they have excessively geared capital structure. 93% of
total assets of NIBL is financed by the outsider’s funds. Total assets to net worth ratio
of the bank are decreasing and fluctuating trend thereafter. Probability ratio are very
helpful to measure the overall efficiency in operation of a financial institution. The
total net profit to gross income ratio of NIBL is in increasing and decreasing trend.
The ratio is 39.6 . These are able to obtain higher efficiency of the bank. Therefore,
credit management is in good position of the bank. The bank is able to obtain higher
efficiency. This means that credit management is in good position. Loan loss
provision to total loan and advances ratio of NIBL is in decreasing trend. This shows
that good quality of assets in total volume of loan and advances. Total non-performing
assets to total assets ratio is also in decreasing trend. It indicates proper manage of
total asset. This ratio indicates the more efficient operating of credit management.
Ratio are decreasing trend it indicates the bank is decreasing the non-performing loan
from total loan. Interest expenses to total deposit ratio of NIBL is increased in fiscal
year 2007/08. That this ratio does not indicate higher interest expenses on total
deposit. The trend of Total Deposit, Total Asset, Loan and Advance and Total Profit
of NIBL is in increasing trend. Equity portion of the bank is slightly increasing in the
resent year due to issue of directives by Nepal Rastra Bank (NRB) the entire bank to
increases it’s paid up capital. Every commercial has to meet 2000million paid up
capitals till 2070 B.S. NIBL has currently Ordinary Shares of 12039154 Rs. 100 each
1203915400 paid up capital. NRB has issued that direction to provide more safety to
the customers. Therefore, bank has continuously increasing their capital every year.
5.3 Recommendation
These findings may be useful for them who are concerned directly of indirectly with
the credit management of the bank especially reference to Nepal Investment Bank. On
the basis of above analysis and findings of the study, following suggestions and
Recommendation can be drawn out.

102
Generally banks have to maintained liquid assets. The current ratio of the
NIBL is
Considerable. This can be regarded as good liquidity position. The liquidity
position affects external and internal factors such as prevalent investment
situations, central bank requirements and so on. Considering the growth
position of financial market, the lending policy management capabilities,
strategic planning and fund flow situation, bank should maintain enough liquid
assets to pay short-term obligations. So, it is recommended to maintain sound
liquidity position to NIBL.
Cash and bank balance of NIBL is moderate. Banks efficiency should be
increased to satisfy the demand of depositor at low of cash and bank balance
does not provide return to the bank. Therefore, some percentage of the cash
and bank balance should be invested in profitable sectors.
Bank is suggested to make policy to ensure rapid identification of delinquent
loans. Bank should make immediate follow-up of loan until it is recovered.
The recovery of loan is very challenging as well as important part of the bank.
Therefore, bank must be careful to strengthen credit collection policy.
Government securities such as Treasury bills, Development bonds, saving
certificates etc. are risk less investment alternatives because the are free of
default risk as well as liquidity risk and can be easily sold in the market. In
this research study, it has found that the NIBL has made some amount of fund
in Government securities. But it is recommended to invest more funds in
Government securities. But it is recommended to invest more funds in
Government securities instead of keeping them idle.
NIBL should avoid extending credits merely based on oral information
presented at the credit interview. Historical financial and trade records should
be obtained for proper assessment of the proposal.
NRB recommended following the NRB directives which will helps to reduce
Credit risk arising from defaulter, lack of proper credit appraisal, defaulter by
103
Blacklisted borrowers and professional defaulter. Government has established
Credit information bureau, which will provide suggestion to commercial bank.
So NIBL is suggested to collect as much information about borrowers and
only lend to non-risky area and to non-defaulter.NIBL bank should be
fulfilling some social obligations by extending their resources to rural area and
promoting the development of poor and disadvantages group. In order do so,
they should open their branches in the remote area with the objective to
provide the banking services. The minimum deposit amounts should be
reduced.
The economical liberalization policy adopted by Nepal Government has
created an environment of cutthroat competition in the banking sectors. In the
context NIBL bank is suggested to formulate and implement sound and
effective financial and non-financial strategies to minimize their operational
expenses to meet required level of profitability.
International relation of NIBL is satisfactory in comparison to other banks.
Due to tough competition the bank should make negotiation with the
international banks to increase its transactions on the international areas.
According to NRB directives, all the commercial bank should increase the
capital up to Rs 2000 million by 2070 B.S. NIBL is increasing the paid up
capita to meet NRB directive. Either capitalization of profit, declaration of
Bonus share or right share issue can make the increment in capital.

104
Appendix-I
(A)Trend Analysis of Total Deposit:
Year(x) Total Deposit(Y) X= x-2006/7 X2 XY
2004/5 14255 -2 4 -28510
2005/6 18927 -1 1 -18927
2006/7 24489 0 0 0
2007/8 34452 1 1 34452
2008/9 46698 2 4 93396
Total N = 5 ∑ 𝑌 =𝟏𝟑𝟖𝟖𝟐𝟏 ∑ 𝑌 =𝟎 ∑ 𝑿𝟐 =𝟏𝟎 ∑ 𝑋𝑌 =𝟖𝟎𝟒𝟏𝟏
Source: Annual Report of Nepal Investment Bank Limited
Let the trend line be
Y = a + bx ………………(1) Where
X = x - Middle year
a = ∑Y/N
b = ∑XY/∑ X2
NIBL
a = 27764.2
b = 8041.1
where as
Yc = 27764.2 + 8041.1 of NIBL
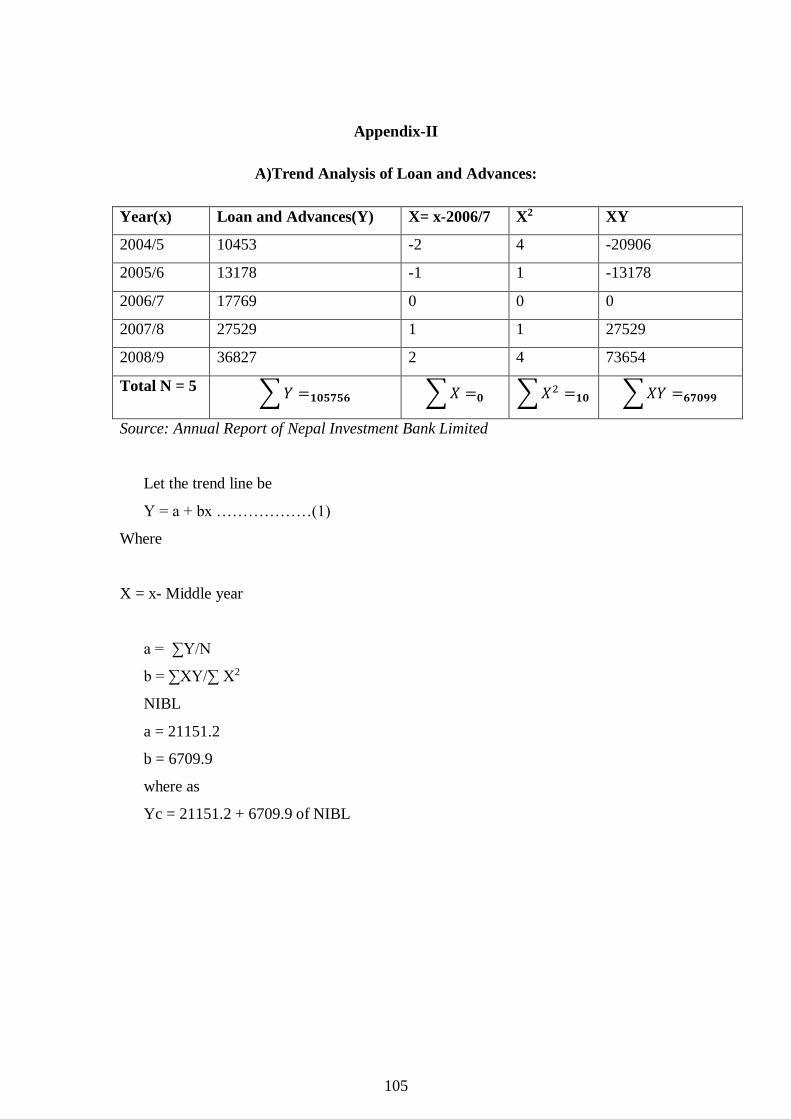
105
Appendix-II
A)Trend Analysis of Loan and Advances:
Year(x) Loan and Advances(Y) X= x-2006/7 X2 XY
2004/5 10453 -2 4 -20906
2005/6 13178 -1 1 -13178
2006/7 17769 0 0 0
2007/8 27529 1 1 27529
2008/9 36827 2 4 73654
Total N = 5 ∑ 𝑌 =𝟏𝟎𝟓𝟕𝟓𝟔 ∑ 𝑋 =𝟎 ∑ 𝑋2 =𝟏𝟎 ∑ 𝑋𝑌 =𝟔𝟕𝟎𝟗𝟗
Source: Annual Report of Nepal Investment Bank Limited
Let the trend line be
Y = a + bx ………………(1)
Where
X = x- Middle year
a = ∑Y/N
b = ∑XY/∑ X2
NIBL
a = 21151.2
b = 6709.9
where as
Yc = 21151.2 + 6709.9 of NIBL
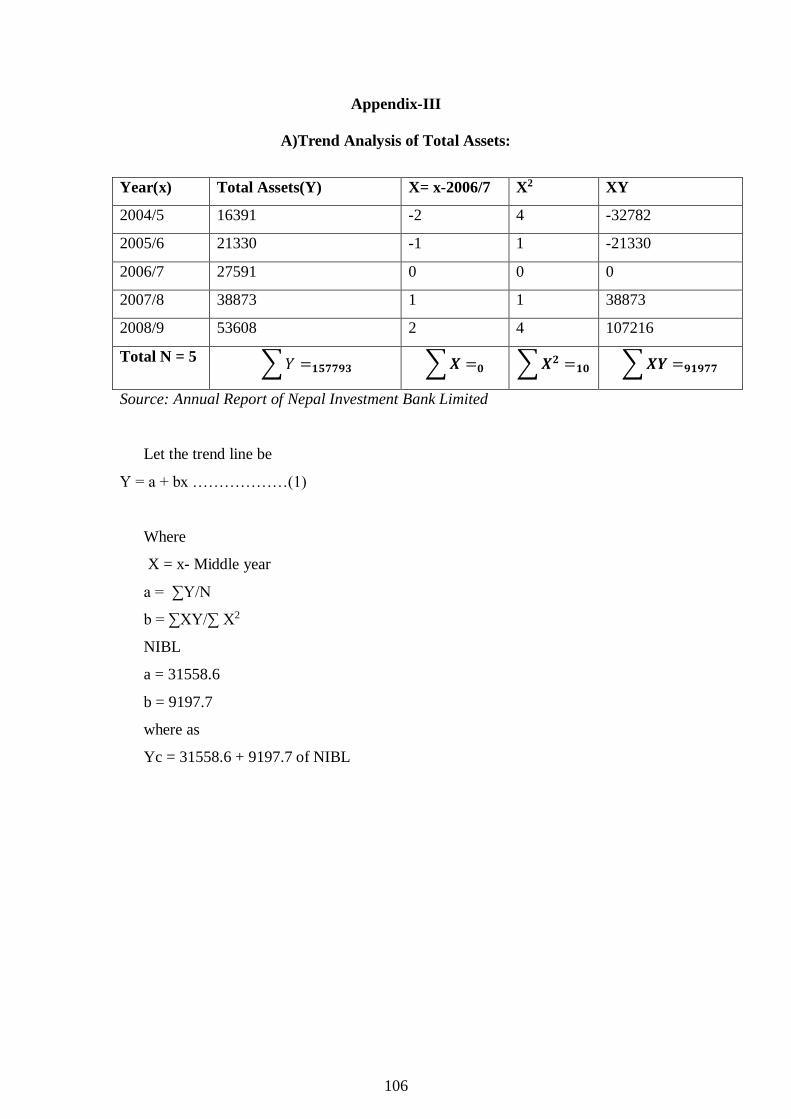
106
Appendix-III
A)Trend Analysis of Total Assets:
Year(x) Total Assets(Y) X= x-2006/7 X2 XY
2004/5 16391 -2 4 -32782
2005/6 21330 -1 1 -21330
2006/7 27591 0 0 0
2007/8 38873 1 1 38873
2008/9 53608 2 4 107216
Total N = 5 ∑ 𝑌 =𝟏𝟓𝟕𝟕𝟗𝟑 ∑ 𝑿 =𝟎 ∑ 𝑿𝟐 =𝟏𝟎 ∑ 𝑿𝒀 =𝟗𝟏𝟗𝟕𝟕
Source: Annual Report of Nepal Investment Bank Limited
Let the trend line be
Y = a + bx ………………(1)
Where
X = x- Middle year
a = ∑Y/N
b = ∑XY/∑ X2
NIBL
a = 31558.6
b = 9197.7
where as
Yc = 31558.6 + 9197.7 of NIBL

107
Appendix-IV
(A) Trend Analysis of Net Profit:
Year(x) Net Profit (Y) X= x-2006/7 X2 XY
2004/5 232.15 -2 4 -464.30
2005/6 350.53 -1 1 -350.53
2006/7 501.40 0 0 0
2007/8 696.73 1 1 696.73
2008/9 900.00 2 4 1800
Total N = 5 ∑ 𝒀 =𝟐𝟔𝟖𝟎.𝟖𝟏 ∑ 𝑿 =𝟎 ∑ 𝑿 =𝟏𝟎 ∑ 𝑿 =𝟏𝟔𝟖𝟏.𝟗
Source: Annual Report of Nepal Investment Bank Limited
Let the trend line be
Y = a + bx ………………(1)
Where
X = x- Middle year
a = ∑Y/N
b = ∑XY/∑ X2
NIBL
a = 536.162
b = 168.19
where as
Yc = 536.162 + 168.19 of NIBL