study of hydrocarbon saturation by geophysical methods
TRANSCRIPT
Seventeenth International Water Technology Conference, IWTC17 Istanbul, 5-7 November 2013
STUDY OF HYDROCARBON SATURATION BY GEOPHYSICAL METHODS
B. Mendoza
1,3, M. De Biase
2,3, L. Capozzoli
3, V. Giampaolo
3, E. Rizzo
3, and S. Straface
3,4
1 Universidad Nacional de Chimborazo, Riobamba, Ecuador E-mail: [email protected]
2 Università della Basilicata, Potenza (PZ), Italy E-mail: [email protected]
3 Istituto di Metodologie per le Analisi Ambientali, Consiglio Nazionale delle Ricerche, Tito (PZ),
Italy, E-mail: [email protected]; [email protected]; [email protected] 4 Università della Calabria, Dipartimento di Ingegneria per l’Ambiente e il Territorio e Ingegneria
Chimica, (CS), Italy, E-mail: [email protected]
ABSTRACT
The contamination of soil and groundwater by LNAPLs is a problem that has been treated over
several years, because, they are used in the industrial worldwide. Its location and behavior in the
subsurface has been monitored through invasive methods that disturb the environment and they are
costly. In this sense, we integrated a noninvasive hydrogeophysical method as Ground Penetrating
Radar (GPR) with chemical analysis (Infrared Spectrophotometry) to localize contaminant distribution
and quantify TPH concentrations . For this purpose, we made a 2D hydrogeophysical experiment in a
sand box saturated by diesel in which we validated this methodology.
Keywords: LNAPL, TPH, IR, GPR, hydrogeophysics.
1 INTRODUCTION
The contamination of soil and groundwater is produced by human activity mainly from spills, leaks
and discharges of industrial processes. This implies a high risk to health and the environment. In this
context, the pollution effect is produced by two types of organic and inorganic contaminants. Within
the group of organic contaminants there are light non-aqueous phase liquids (LNAPLs) such as
gasoline and diesel.
Because of their density and chemical composition, LNAPLs tend to move toward the upper aquifer
causing the formation of spots along the same, so making difficult their monitoring. Usually, direct
chemical methods such as infrared spectrophotometry (IR) and gas chromatography (GC) are used to
quantify the LNAPLs concentrations expressed in Total Petroleum Hydrocarbons (TPHs). Moreover,
the indirect geophysical methods usefully applied for hydrogeological characterization and monitoring
in contaminated area, are Ground Penetrating Radar (GPR), Electrical resistivity (ER), Induced
Polarization (IP), and Self-potential (SP). They are sensitive to physical and chemical subsurface
property variations due to the contaminants in the porous media.
The aim of this work is to identify a relationship between LNAPLs saturation degree and the
dielectric permittivity by means of an integrated chemical and geophysical approach. In order to
estimate the diesel content in groundwater by GPR measurements, a hydrogeophysical laboratory
experiment was developed merging GPR and chemical IR data.
2 METHODS
2.1 Hydraulic theoretical background
The two-phase flow numerical model establishes the governing equations and constitutive
relationships that define fluid retention and permeability in the natural media. The governing equations
for two-phase flow in porous media follow separate mass conservation equations for the wetting and
Seventeenth International Water Technology Conference, IWTC17 Istanbul, 5-7 November 2013
non-wetting fluids. Water is considered to be the wetting fluid since water favors contact with the
solid matrix (i.e. mineral grains making up the aquifer). LNAPL is the non-wetting fluid, which means
it has a lower tendency to interact with the solid matrix as compared to water (Charbeneau, 2000). The
governing equations for multiphase flow are coupled nonlinear partial differential equations (PDEs).
Constitutive relationships are also integrated into the PDEs to account for fluid retention and aquifer
permeability. The following equations are based on Mualem (1976) and Van Genuchten (1980). The
mass conservation equations for the wetting (w) and non-wetting (nw) fluids, assuming two
incompressible fluids, are:
(
( ))=0 (1)
(
( ))=0 (2)
where θs is the porosity of porous medium, Se is the saturation degree of wetting and non-wetting
phase, k0 is the intrinsic permeability of porous medium [L2], kr is the relative hydraulic conductivity
of wetting and non-wetting phase [LT-1
], η is the dynamic viscosity of wetting and non-wetting phase
[ML-1
T-1
], p is the hydraulic pressure of wetting and non-wetting phase [ML-1
T2], ρ is the density of
wetting and non-wetting phase [ML-3
], g is the gravity acceleration [LT-2
], and finally z is the depth
[L]. Equations (1) and (2) are subject to the constraint:
(3)
This constraint assumes that the void space of the porous media is completely filled by water and/or
LNAPL. The saturation of either fluid phase can range from 0 to 1. Capillary pressure (pc) is the
pressure difference between the non-wetting and wetting phase interfaces and is mathematically
defined as:
(4)
Capillary pressure results from the density difference between two fluids and is a function of the
fluid phase saturations. Effective saturation changes with capillary pressure. This relationship is
quantified as:
(5)
where is the specific capacity of the wetting and non-wetting phases at a given pressure. In order to
simplify the model, Equations (3), (4) and (5) are substituted in Equations (1) and (2), so that the
governing equations become:
( ) [
( )] (6)
( ) [
( )] (7)
2.2 GPR theoretical background Ground penetrating radar (GPR) is an electromagnetic technique designed primarily to investigate
the shallow subsurface of the earth, building structures, roads, and bridges. GPR utilizes the
transmission and reflection of high frequency electromagnetic (EM) waves in the range between
10MHz to 2GHz. The propagation of the radar signal depends on the frequency-dependent electrical
properties of the ground. When the radiated energy encounters an inhomogeneity in the electrical and
Seventeenth International Water Technology Conference, IWTC17 Istanbul, 5-7 November 2013
magnetic properties of the subsurface, part of the incident energy is reflected back to the radar antenna
and part is transmitted through the inhomogeneity (Daniels, 2004).
The GPR data are presented as a two or three dimensional depth profile along a single or more
scanned traverse line in which the vertical axis corresponds to the two-way travel-time measured in
nanoseconds. If the propagation velocity of the electromagnetic waves is known, the depth of the
reflector (d) can be determined from:
(8)
where tv is the two-way travel time, and v is the EM velocity through the subsurface material. The EM
wave velocity of propagation in a medium is equal to:
√ (9)
where c is the light velocity in free space (0,3 m/ns) and k is the relative dielectric permittivity which
is a measure of the capacity of a material to store a charge when an electric field is applied to it
relative to the same capacity in a vacuum (Sheriff, 1984).
The GPR is one of the techniques that has seen increasing use in the investigation of both
unsaturated and saturated hydrogeology. Greaves et al. (1996) used GPR interval velocities gathered
from surface common midpoint (CMP) surveys, and coupled their results with Topp’s equation (Topp
et al., 1980) to estimate moisture content in saturated sediments. Due to the success achieved in the
field of hydrogeology, in recent years GPR was used effectively for the study of large areas to search
of anomalies into the electromagnetic behavior attributable to the presence of pollutants. GPR is able
to detect the level of pollution in vadose zone and to identify the plume in groundwater (Atekwana et
al., 1998; Godio et al. 1998). Furthermore, several researches were conducted aimed at identifying
mainly the correlation between soils electromagnetic properties and water and hydrocarbons content.
Laboratory experiments have allowed to verify the complex interaction between electromagnetic
properties, conductivity and dielectric permittivity (Santamarina et al., 1997). Most of the studies were
controlled injections of contaminants in which GPR surveys were performed before, during and
following the injections. In addition to controlled injections of LNAPLs there have been several GPR
studies of accidental spill sites (Bermejo et al., 1997; Sauck et al., 1998).
In presence of contaminants in the subsurface, it is possible to record changes in the electrical
behavior of contaminated rocks and soils. However, for a good understanding of the pollution
phenomenon the use of GPR in the analysis and monitoring of contaminants in the environment
cannot be separated from knowledge of the chemical and physical dispersed contaminants. Even
though, GPR is able to provide relatively high spatial resolution, on the other hand its penetration
depth will in many cases be insufficient because of attenuation related to clays or high pore water
conductivity.
The physical properties of the most common contaminants have been tabulated in a rigorous
manner by Lucius (1992). From the study of these tables has been possible to obtain reference
parameters for the characterization of LNAPL used in laboratory. The electrical properties are defined
in terms of dielectric permittivity, magnetic permeability, and electrical conductivity. The attenuation
of the signal generated by the EM antennas is particularly affected by both the dielectric permittivity
and electrical conductivity. For this reason, the estimation of these parameters is very important for the
understanding of the investigated problem.
Dielectric permittivity for the GPR frequencies is determined by the physical properties of the
materials of the medium, that usually consists of a matrix of air, water, minerals and NAPL. The
mechanism that most influences GPR measurement is characterized by displacement of the water
(k=80) naturally contained in the matrix when is replaced by NAPL characterized by permittivity
values much lower (k= 2-10). In general, when NAPL replaces water in the pore space of rock or soil,
Seventeenth International Water Technology Conference, IWTC17 Istanbul, 5-7 November 2013
the relative dielectric permittivity of the media decreases, thereby increasing the wave velocity. The
electrical properties of rock and soil, containing mixtures of air, water and NAPL have been estimated
using volumetric mixing laws such as the complex refractive index model (CRIM) (Birchak et al.,
1974) and effective media theory (Sen et al., 1981). The accuracy of quantitative estimates of the
LNAPL content affected significantly the specific distribution of the voids and the volume fraction of
variable liquid and gaseous substances present in the medium. Overcoming this difficulty is probably
the most important challenges in the field of environmental research conducted in geophysics.
2.3 Chemical background
The Spectrophotometry InfraRed (IR) methodology is used to investigate the composition of a
sample or to identify a compound. This method analyze the electromagnetic spectrum, i.e. the
absorbed infrared spectrum of a material within a whole frequency range of the spectrum. Because
each chemical element has its own absorption band or wavelength associated with the energy
differences of its different atomic orbitals, knowing the absorbed infrared spectrum it is possible to
measure the sample composition. For the TPHs, this method measures the absorption caused by
changes in vibration-rotation of the C-H bonds of hydrocarbons. In particular, in our experiment we
used the 8440 U.S. EPA (1996) method in a wavelength range of 3200-2700 cm-1
and with detection
limit of 10 to 600 mg kg-1
of TPH.
The quantification is obtained by comparing the sample absorption against a calibration curve made
with a reference oil, and in case of more concentrated extracts it is advisable to make the necessary
dilutions to obtain measurements of absorbance between 0.1 and 0.8. (Fernández et al., 2006). The
TPHs signal in IR method is represented by three characteristic peaks at 2956, 2926 and 2855 cm-1
;
however, in this study to calculate the TPHs concentration we only consider the peak at 2956 cm-1
.
The TPH values are calculated from the extrapolation of the absorbance value obtained for samples
within the calibration curve. Values are expressed in mg L-1
and converted to mg kg-1
of dry soil (DS),
considering the amount of soil removed, the amount of solvent that was used to make a solution, and
the amount of sample taken from this solution, as follows:
( )
(10)
where TPHs is the Total Petroleum Hydrocarbons (mg L-1
), Abs is the absorbance of the sample 2956
cm-1
, b is the intercept of the calibration curve and m the calibration curve slope.
This value can be expressed in mg kgDS-1
by:
(
) [
(
)
] [
] [
] (11)
where VD is the total volume of solution (dichloromethane), VE is the volume taken from VD and
began to evaporation, VT is the volume of tetrachlorethylene where the sample was dissolved or
evaporated, FC1 is the correction factor for the TPH (mg) in VT equal to 1000, P is the weight (g of
dry soil extracted equal to PH*FH), FC2 is the correction factor to obtain mg of TPH in kg of dry
solid, PH is the amount of moisture soil extracted and, finally, FH the correction factor of humidity
equal to:
( )
(12)
In this sense, the TPH quantitative analysis with infrared spectroscopy is a relatively fast method for
determining the approximate LNAPL amount in the soil, in fact the main advantage of the technique is
the simplicity, speed and low cost. However, especially for heterogeneous samples it shows limited
accuracy and precision and it does not give information concerning the type of hydrocarbons exist in
the sample or the presence or absence of toxic molecules (Weisman, 1998).
Seventeenth International Water Technology Conference, IWTC17 Istanbul, 5-7 November 2013
3 EXPERIMENTS SET-UP
The experiments were performed at the hydrogeophysical Laboratory of University of Calabria
(Cosenza, CS, Italy) in collaboration with the Hydrogeosite Lavoratory (Institute of Methodology for
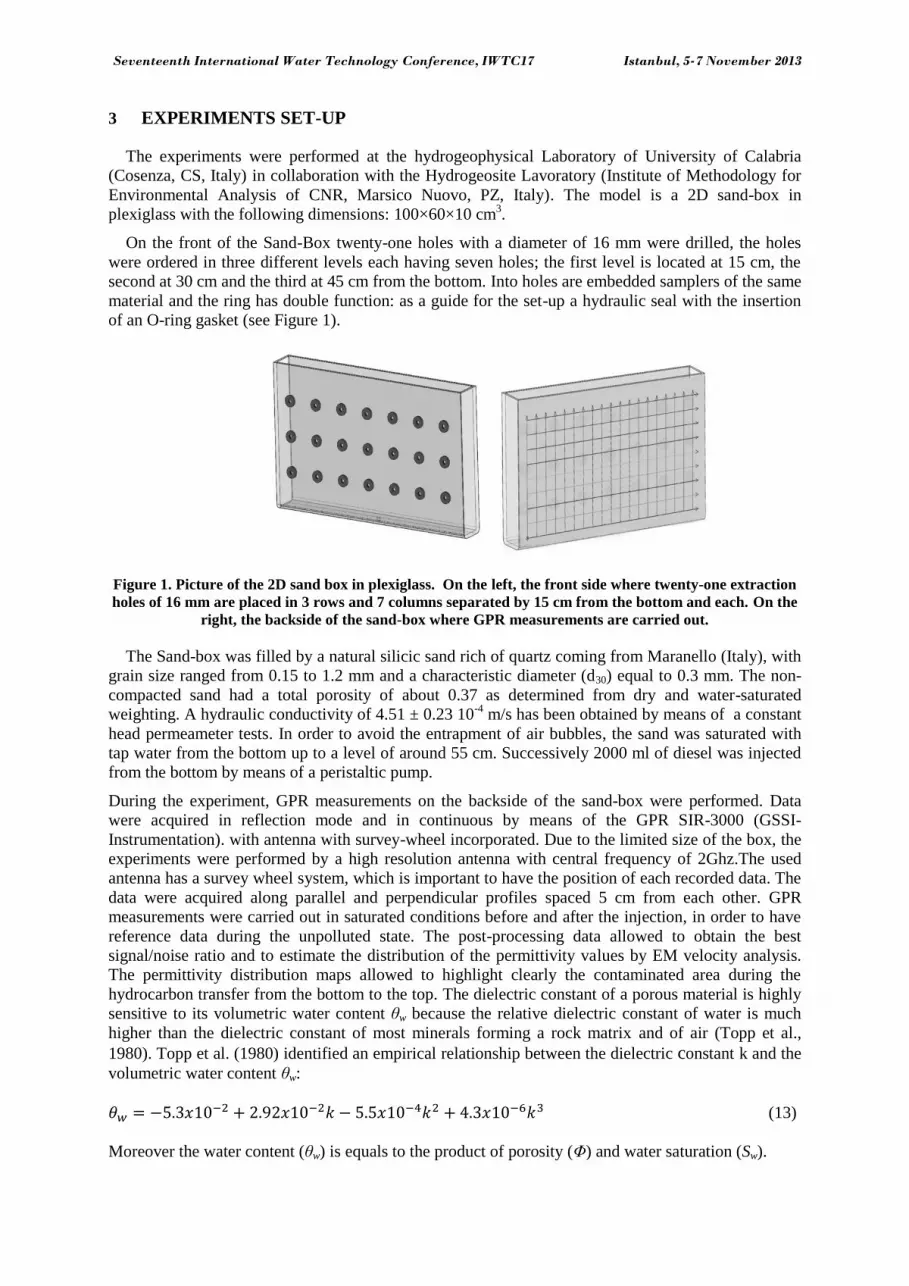
Environmental Analysis of CNR, Marsico Nuovo, PZ, Italy). The model is a 2D sand-box in
plexiglass with the following dimensions: 100×60×10 cm3.
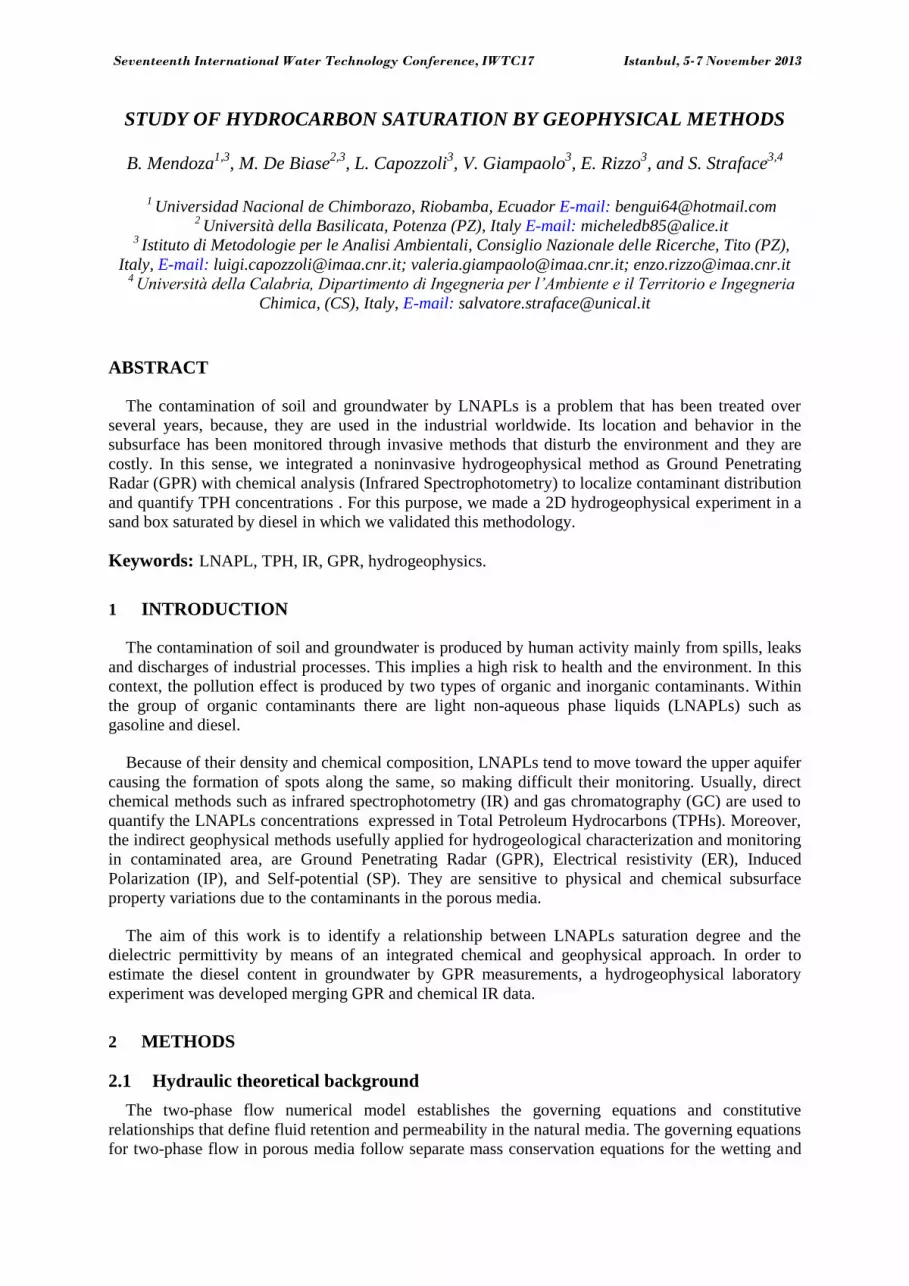
On the front of the Sand-Box twenty-one holes with a diameter of 16 mm were drilled, the holes
were ordered in three different levels each having seven holes; the first level is located at 15 cm, the
second at 30 cm and the third at 45 cm from the bottom. Into holes are embedded samplers of the same
material and the ring has double function: as a guide for the set-up a hydraulic seal with the insertion
of an O-ring gasket (see Figure 1).
Figure 1. Picture of the 2D sand box in plexiglass. On the left, the front side where twenty-one extraction
holes of 16 mm are placed in 3 rows and 7 columns separated by 15 cm from the bottom and each. On the
right, the backside of the sand-box where GPR measurements are carried out.
The Sand-box was filled by a natural silicic sand rich of quartz coming from Maranello (Italy), with
grain size ranged from 0.15 to 1.2 mm and a characteristic diameter (d30) equal to 0.3 mm. The non-
compacted sand had a total porosity of about 0.37 as determined from dry and water-saturated
weighting. A hydraulic conductivity of 4.51 ± 0.23 10-4
m/s has been obtained by means of a constant
head permeameter tests. In order to avoid the entrapment of air bubbles, the sand was saturated with
tap water from the bottom up to a level of around 55 cm. Successively 2000 ml of diesel was injected
from the bottom by means of a peristaltic pump.
During the experiment, GPR measurements on the backside of the sand-box were performed. Data
were acquired in reflection mode and in continuous by means of the GPR SIR-3000 (GSSI-
Instrumentation). with antenna with survey-wheel incorporated. Due to the limited size of the box, the
experiments were performed by a high resolution antenna with central frequency of 2Ghz.The used
antenna has a survey wheel system, which is important to have the position of each recorded data. The
data were acquired along parallel and perpendicular profiles spaced 5 cm from each other. GPR
measurements were carried out in saturated conditions before and after the injection, in order to have
reference data during the unpolluted state. The post-processing data allowed to obtain the best
signal/noise ratio and to estimate the distribution of the permittivity values by EM velocity analysis.
The permittivity distribution maps allowed to highlight clearly the contaminated area during the
hydrocarbon transfer from the bottom to the top. The dielectric constant of a porous material is highly
sensitive to its volumetric water content θw because the relative dielectric constant of water is much
higher than the dielectric constant of most minerals forming a rock matrix and of air (Topp et al.,
1980). Topp et al. (1980) identified an empirical relationship between the dielectric constant k and the
volumetric water content θw:
(13)
Moreover the water content (θw) is equals to the product of porosity (Φ) and water saturation (Sw).
Seventeenth International Water Technology Conference, IWTC17 Istanbul, 5-7 November 2013
(14)
In our case of study, using Topp’s empirical relationship, the GPR data allowed to estimate the
LNAPL saturation degree using equations 13 and 14.
The three different datasets were processed by removing the effect connected to the coupling
between the antenna and the box and the information contained in radargrams outside the area of
interest. From processed-data, “significant traces” (one profile every 5 cm) were extracted. They
describe the propagation mode on the high-frequency electromagnetic waves generated in the sand-
box. Analyzing the propagation velocity of the waves and knowing the sand box geometry it was
possible to estimate the relative dielectric permittivity.
When the steady-state conditions were reached, twenty-one samples were collected, in order to
chemically quantify the hydrocarbon content. All samples were analyzed according to the methods
3541 and 3540C for extraction, and 8440 U.S. EPA (1996) for determination of Hydrocarbons (g/kg)
of TPH by Infrared Spectrophotometry. The validation of the results was previously performed by
means of three benchmarks with known concentrations of hydrocarbons (0.5, 1, 2 mL) giving an error
of 2.5% in concentration values: this result shows the effectiveness of the IR method for quantifying
TPH. The chemical analysis has the aim to obtain the distribution of the hydrocarbon content and to
validate the LNAPL saturation degree determined by Topp’s formula from the GPR data.
4 RESULTS AND DISCUSSIONS
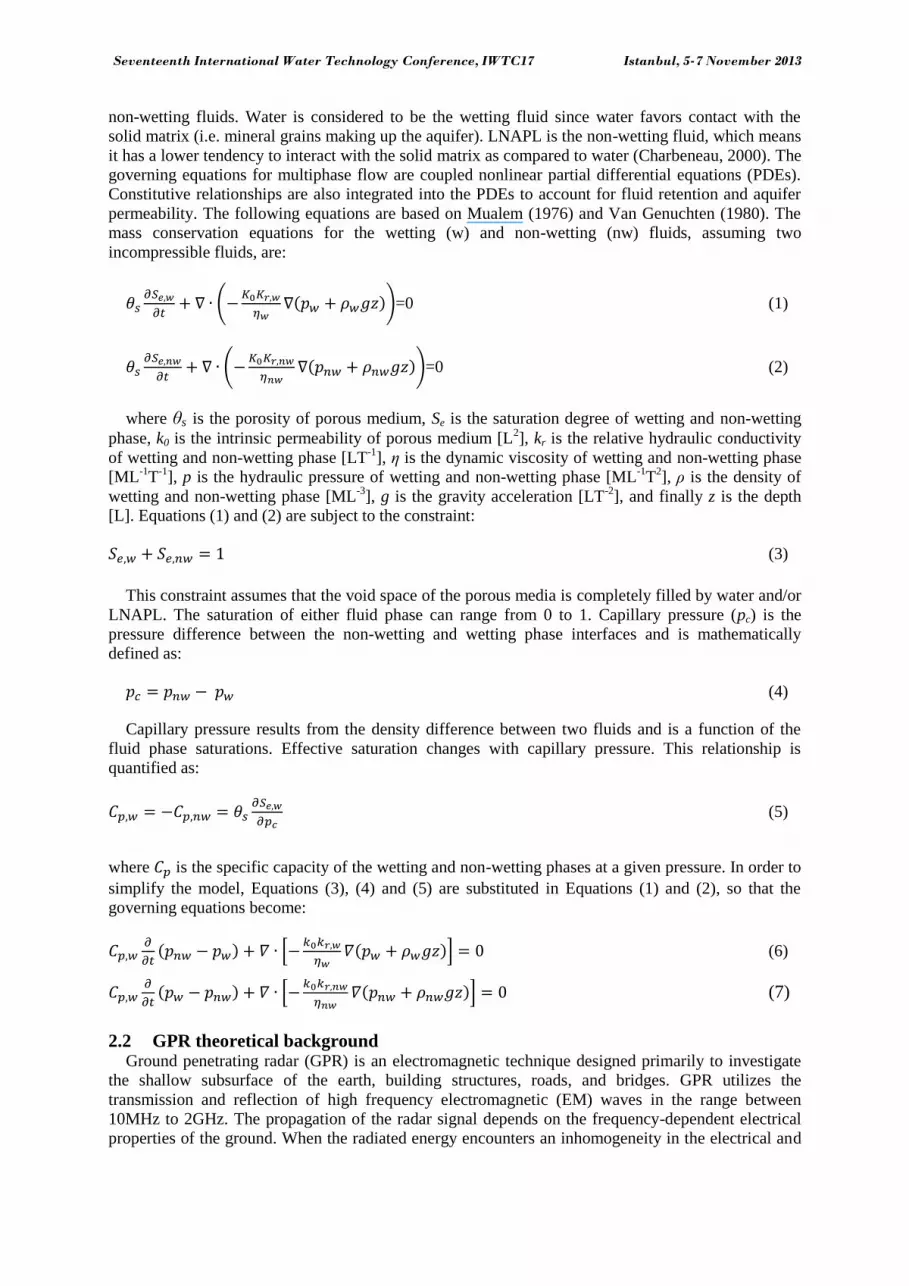
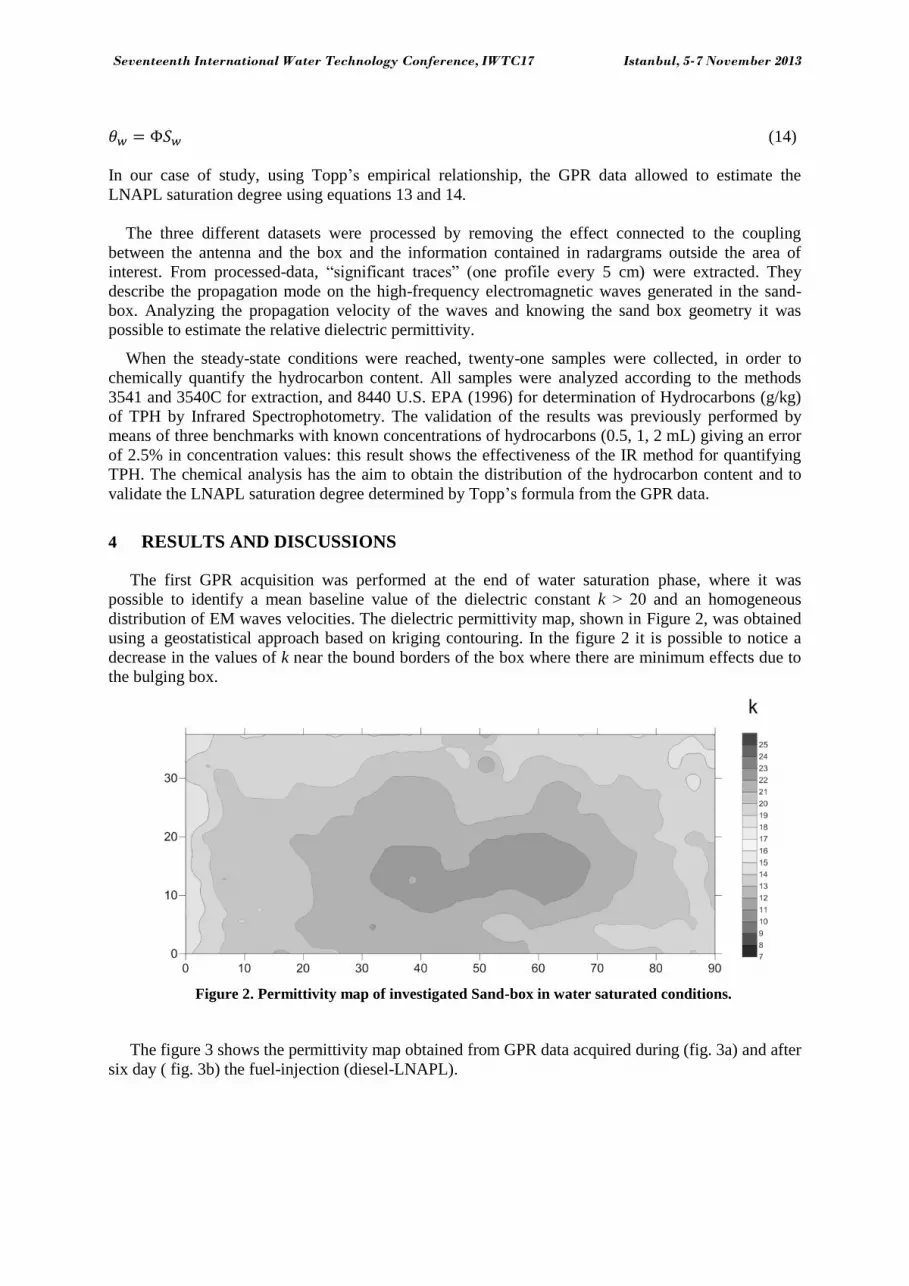
The first GPR acquisition was performed at the end of water saturation phase, where it was
possible to identify a mean baseline value of the dielectric constant k ˃ 20 and an homogeneous
distribution of EM waves velocities. The dielectric permittivity map, shown in Figure 2, was obtained
using a geostatistical approach based on kriging contouring. In the figure 2 it is possible to notice a
decrease in the values of k near the bound borders of the box where there are minimum effects due to
the bulging box.
Figure 2. Permittivity map of investigated Sand-box in water saturated conditions.
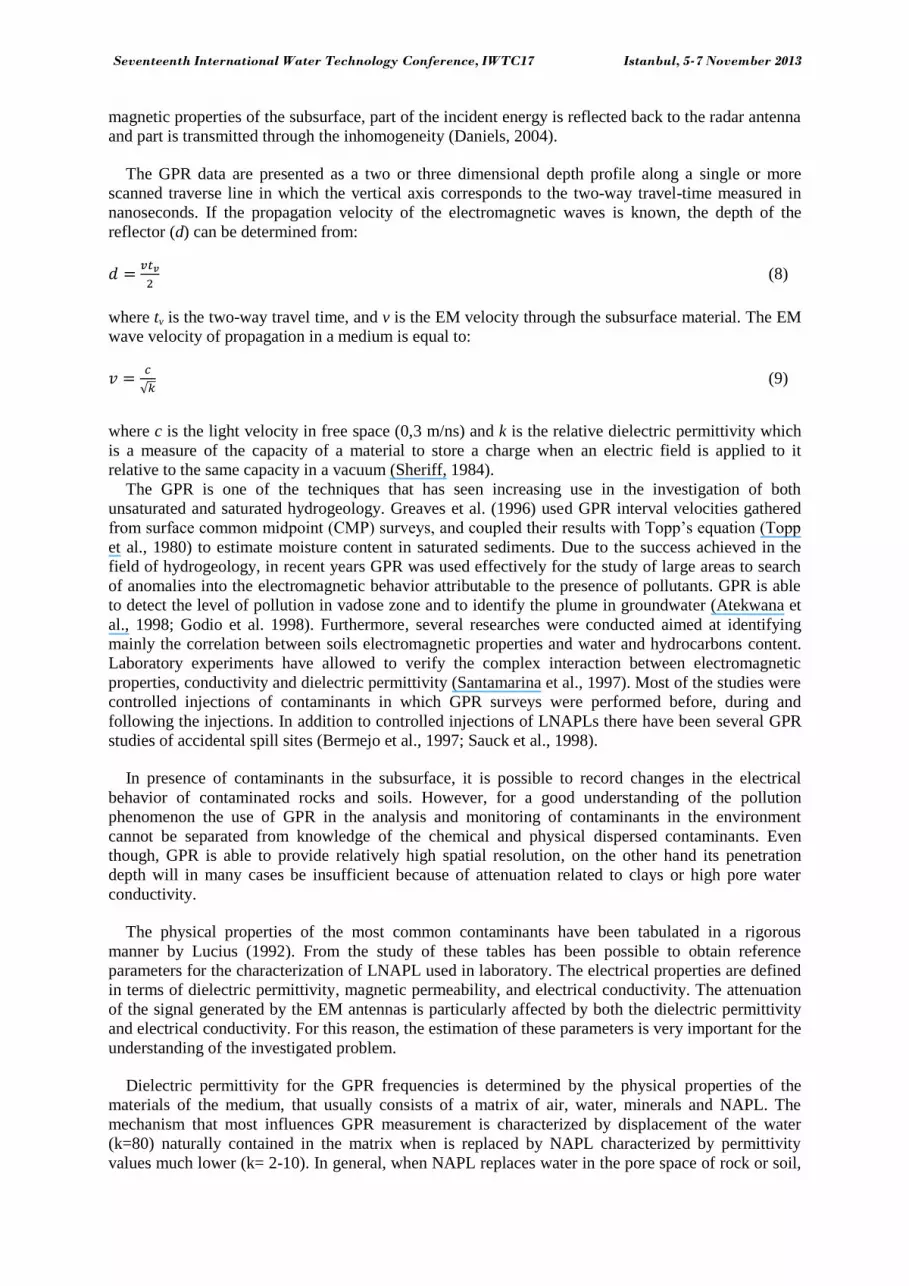
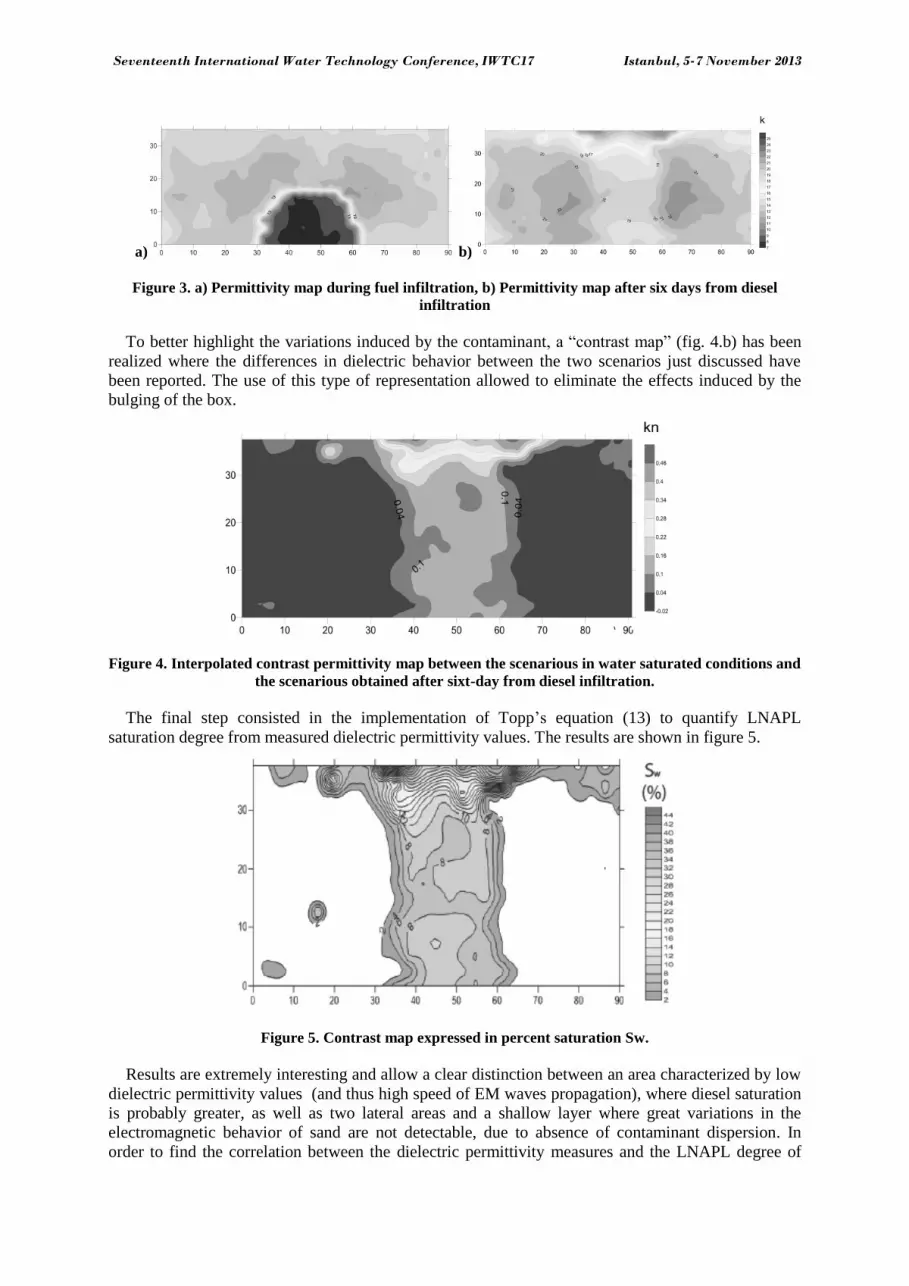
The figure 3 shows the permittivity map obtained from GPR data acquired during (fig. 3a) and after
six day ( fig. 3b) the fuel-injection (diesel-LNAPL).
Seventeenth International Water Technology Conference, IWTC17 Istanbul, 5-7 November 2013
a) b)
Figure 3. a) Permittivity map during fuel infiltration, b) Permittivity map after six days from diesel
infiltration
To better highlight the variations induced by the contaminant, a “contrast map” (fig. 4.b) has been
realized where the differences in dielectric behavior between the two scenarios just discussed have
been reported. The use of this type of representation allowed to eliminate the effects induced by the
bulging of the box.
Figure 4. Interpolated contrast permittivity map between the scenarious in water saturated conditions and
the scenarious obtained after sixt-day from diesel infiltration.
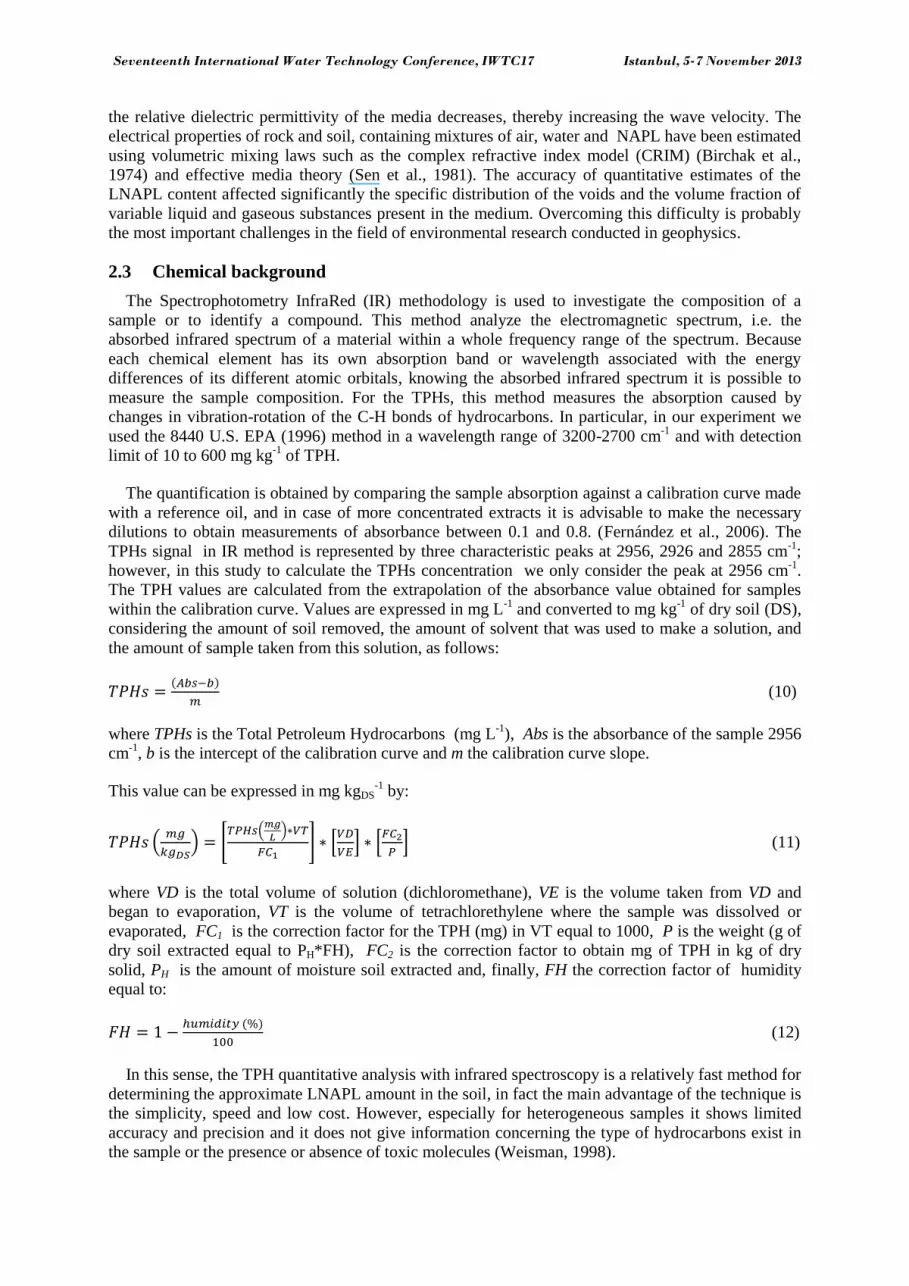
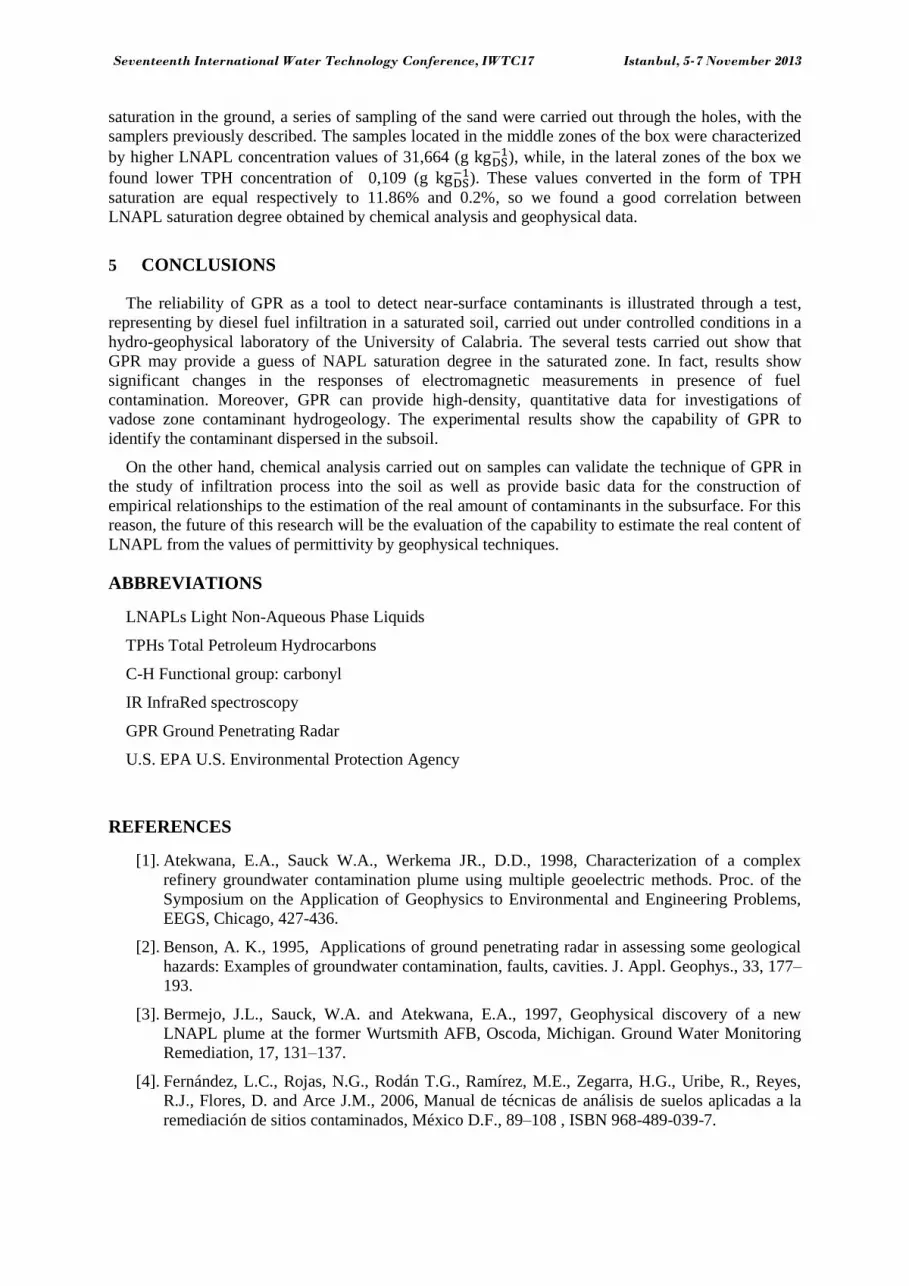
The final step consisted in the implementation of Topp’s equation (13) to quantify LNAPL
saturation degree from measured dielectric permittivity values. The results are shown in figure 5.
Figure 5. Contrast map expressed in percent saturation Sw.
Results are extremely interesting and allow a clear distinction between an area characterized by low
dielectric permittivity values (and thus high speed of EM waves propagation), where diesel saturation
is probably greater, as well as two lateral areas and a shallow layer where great variations in the
electromagnetic behavior of sand are not detectable, due to absence of contaminant dispersion. In
order to find the correlation between the dielectric permittivity measures and the LNAPL degree of
Seventeenth International Water Technology Conference, IWTC17 Istanbul, 5-7 November 2013
saturation in the ground, a series of sampling of the sand were carried out through the holes, with the
samplers previously described. The samples located in the middle zones of the box were characterized
by higher LNAPL concentration values of 31,664 (g ), while, in the lateral zones of the box we
found lower TPH concentration of 0,109 (g ). These values converted in the form of TPH
saturation are equal respectively to 11.86% and 0.2%, so we found a good correlation between
LNAPL saturation degree obtained by chemical analysis and geophysical data.
5 CONCLUSIONS
The reliability of GPR as a tool to detect near-surface contaminants is illustrated through a test,
representing by diesel fuel infiltration in a saturated soil, carried out under controlled conditions in a
hydro-geophysical laboratory of the University of Calabria. The several tests carried out show that
GPR may provide a guess of NAPL saturation degree in the saturated zone. In fact, results show
significant changes in the responses of electromagnetic measurements in presence of fuel
contamination. Moreover, GPR can provide high-density, quantitative data for investigations of
vadose zone contaminant hydrogeology. The experimental results show the capability of GPR to
identify the contaminant dispersed in the subsoil.
On the other hand, chemical analysis carried out on samples can validate the technique of GPR in
the study of infiltration process into the soil as well as provide basic data for the construction of
empirical relationships to the estimation of the real amount of contaminants in the subsurface. For this
reason, the future of this research will be the evaluation of the capability to estimate the real content of
LNAPL from the values of permittivity by geophysical techniques.
ABBREVIATIONS
LNAPLs Light Non-Aqueous Phase Liquids
TPHs Total Petroleum Hydrocarbons
C-H Functional group: carbonyl
IR InfraRed spectroscopy
GPR Ground Penetrating Radar
U.S. EPA U.S. Environmental Protection Agency
REFERENCES
[1]. Atekwana, E.A., Sauck W.A., Werkema JR., D.D., 1998, Characterization of a complex
refinery groundwater contamination plume using multiple geoelectric methods. Proc. of the
Symposium on the Application of Geophysics to Environmental and Engineering Problems,
EEGS, Chicago, 427-436.
[2]. Benson, A. K., 1995, Applications of ground penetrating radar in assessing some geological
hazards: Examples of groundwater contamination, faults, cavities. J. Appl. Geophys., 33, 177–
193.
[3]. Bermejo, J.L., Sauck, W.A. and Atekwana, E.A., 1997, Geophysical discovery of a new
LNAPL plume at the former Wurtsmith AFB, Oscoda, Michigan. Ground Water Monitoring
Remediation, 17, 131–137.
[4]. Fernández, L.C., Rojas, N.G., Rodán T.G., Ramírez, M.E., Zegarra, H.G., Uribe, R., Reyes,
R.J., Flores, D. and Arce J.M., 2006, Manual de técnicas de análisis de suelos aplicadas a la
remediación de sitios contaminados, México D.F., 89–108 , ISBN 968-489-039-7.
Seventeenth International Water Technology Conference, IWTC17 Istanbul, 5-7 November 2013
[5]. Longino, B.L. and Kueper, B.H., 1999, Non-wetting phase retention and mobilization in rock
fractures. Water Resources Research, 35(7), 2085-2093.
[6]. Lucius, J.E., Olhoeft, G.R., Hill, P.L. and Duke, S.K., 1992, Properties and hazards of 108
selected substances -1992 Edition, U.S. Geological Survey Open-File Report 92-527.
[7]. Martinez, A., Carr, T., Beaty, D., Byrnes, A. and Stiles, J., 1999. Abstract: Comparison of
ground-penetrating radar response and rock properties in a sandstone-dominated incised
valley-fill deposit. In Society of Exploration Geophysicists Annual Meeting Expanded
Abstracts, 582–585.
[8]. Mualem, Y., 1976, A new model for predicting the hydraulic permeability of unsaturated
porous media. Water Resources Research, 12, 513-522.
[9]. Olhoeft, G. R., 1986, Direct detection of hydrocarbon and organic chemicals with ground
penetrating radar and complex resistivity. In Proceedings of the NWWA/API Conference on
Petroleum Hydrocarbons and Organic Chemicals in Ground Water—Prevention, Detection
and Restoration, Dublin, OH, 284–305.
[10]. Radzevicius, S. J., Daniels, J. J., Guy, E. D., and Vendl, M. A., 2000, Significance of
crossed-dipole antennas for high noise environments. In Proceedings of the Symposium on the
Application of Geophysics to Environmental and Engineering Problems, Washington, DC,
407–413.
[11]. Redman, J.D., DeRyck, S.M. and Annan, A.P., 1994, Detection of LNAPL pools with
GPR: Theoretical modelling and surveys of a controlled spill. Proceedings, Fifth International
Conference on Ground Penetrating Radar, June 1994, Kitchener, Ontario, 1283–1294.
[12]. Santamarina, J.C., Fam, M., 1997, Dielectric permittivity of soils mixed with organic
and inorganic fluids (0.02 GHz to 1.30 GHz). J. Environmental and Engineering Geophysics,
2(1), 37-51.
[13]. Sauck W.A., 2000, A model for the resistivity structure of LNAPL plumes and their
environs in sandy sediments. Journal of Applied Geophysics, 44(2-3), 151–165.
[14]. Sen, P.N., Scala, C. and Cohen, M., 1981, A self similar model for sedimentary rocks
with application to the dielectric constant of fused glass beads. Geophysics, 46, 781–795.
[15]. Sheriff, R.E., 1984, Encyclopedic Dictionary of Exploration Geophysics. Soc. Explor.
Geophys., Tulsa, OK, 2nd ed., 323 pp.
[16]. Topp, G.C., Davis, J.L. and Annan, A.P., 1980, Electromagnetic determination of soil
water content: Measurements in Coaxial Transmission Lines. Water Resources Research,
16(3), 574–582.
[17]. van Genuchten, M.T., 1980, A closed-form equation for predicting the hydraulic
conductivity of unsaturated soils. Soil Science Society of America Journal, 44, 892-898.