star-forming cores embedded in a massive cold clump: fragmentation, collapse, and energetic outflows
TRANSCRIPT
arX
iv:0
812.
2187
v1 [
astr
o-ph
] 1
1 D
ec 2
008
Accepted for publication in ApJPreprint typeset using LATEX style emulateapj v. 08/22/09
STAR-FORMING CORES EMBEDDED IN A MASSIVE COLD CLUMP:FRAGMENTATION, COLLAPSE AND ENERGETIC OUTFLOWS
Martin Hennemann, Stephan M. Birkmann, Oliver Krause, Dietrich Lemke,Yaroslav Pavlyuchenkov1, Surhud More and Thomas Henning
Max-Planck-Institut fur Astronomie, Konigstuhl 17, 69117 Heidelberg, Germany
10 December 2008
ABSTRACT
The fate of massive cold clumps, their internal structure and collapse need to be characterised tounderstand the initial conditions for the formation of high-mass stars, stellar systems, and the originof associations and clusters. We explore the onset of star formation in the 75M⊙ SMM1 clump in theregion ISOSS J18364-0221 using infrared and (sub-)millimetre observations including interferometry.This contracting clump has fragmented into two compact cores SMM1 North and South of 0.05 pcradius, having masses of 15 and 10M⊙, and luminosities of 20L⊙ and 180L⊙. SMM1 South harboursa source traced at 24 and 70µm, drives an energetic molecular outflow, and appears supersonicallyturbulent at the core centre. SMM1 North has no infrared counterparts and shows lower levelsof turbulence, but also drives an outflow. Both outflows appear collimated and parsec-scale near-infrared features probably trace the outflow-powering jets. We derived mass outflow rates of at least4 × 10−5 M⊙ yr−1 and outflow timescales of less than 104 yr. Our HCN(1-0) modelling for SMM1South yielded an infall velocity of 0.14 kms−1 and an estimated mass infall rate of 3× 10⁻⁵ M⊙ yr−1.Both cores may harbour seeds of intermediate- or high-mass stars. We compare the derived coreproperties with recent simulations of massive core collapse. They are consistent with the very earlystages dominated by accretion luminosity.Subject headings: dust, extinction — ISM: clouds — ISM: individual (ISOSS J18364-0221) — ISM:
jets and outflows — ISM: kinematics and dynamics — stars: formation
1. INTRODUCTION
1.1. Star formation in massive cold clumps
The early phases of star formation occur in the dens-est and coldest regions within molecular clouds, i.e.dense cold cores. Detailed studies of nearby star-formingmolecular clouds have led to a conception of the evolu-tion of individual low-mass stars from prestellar cores topre-main-sequence stars (e.g. Andre & Montmerle 1994;di Francesco et al. 2007; Ward-Thompson et al. 2007).The formation of high-mass stars (M & 10M⊙) isless understood, in particular its earliest stages andthe link to the origin of associations and clusters(Zinnecker & Yorke 2007; Beuther et al. 2008). Previ-ous studies, mostly aimed towards luminous infraredsources, have provided evidence for collimated outflows(recently e.g. Zhang et al. 2007; Beuther & Shepherd2005, and ref. therein) and large-scale rotating structuresaround forming high-mass objects (Zhang 2005, and ref.therein). This indicates that they also grow via accre-tion through a disk and that the high radiation pressurecould be released in outflow cavities (Krumholz et al.2005). In the low-mass regime, accretion rates arefound to be of the order 10−6 M⊙ yr−1 (Whitney et al.1997). Much higher values of 10−3 M⊙ yr−1 are expectedduring the build-up of high-mass stars (McKee & Tan2003; Banerjee & Pudritz 2007) and corresponding in-creased outflow energetics have been observed (e.g.see compilation by Wu et al. 2004, and ref. therein).
Electronic address: [email protected] Current address: Institute of Astronomy of the Russian
Academy of Sciences, Moscow, Russia
Recently, simulations of protostars accreting at suchhigh rates predicted a bloating by several tens ofsolar radii or more and the accompanying high lu-minosity at low surface temperature before theyreach the main sequence (Yorke & Bodenheimer 2008;Hosokawa & Omukai 2008). This gives further indica-tion that the formation process differs from a scaled-upversion of the low-mass case.
It is presumed that the onset of high-mass star forma-tion occurs in cores (diameters of 0.1 pc and less) withinmassive cold clumps (diameters of around 0.5 pc). Sur-veys in the far-infrared and at millimetre wavelengthsare well suited to search for such objects, but so farthe earliest, i.e. prestellar, stages have eluded discov-ery. Motte et al. (2007) derive statistical lifetimes of lessthan 103 yr for the former, and of 104 yr for massive densecores that are forming stars but exhibit low infrared emis-sion. Interferometric observations provide the essentialspatial resolution to study the substructure of clumps,and to infer the properties of embedded cores furtherrequires a good coverage of their spectral energy distri-bution. In this work we present such a detailed study ofone clump. In particular, we investigate the amount offragments in the clump and their properties, the aris-ing outflow activity, and the indications for collapse.The clump is located in the region ISOSS J18364-0221that has been identified using the ISOPHOT Serendip-ity Survey (ISOSS, Lemke et al. (1996); Stickel et al.(2007)) at 170µm to establish far-infrared colour tem-peratures. Krause (2003) and Krause et al. (2004) se-lected sources containing a large fraction of cold dust,and subsequent studies revealed a population of cold
2 Hennemann et al.
clumps (Krause et al. 2003; Hennemann et al. 2008) anda collapsing massive core (Birkmann et al. 2007).
1.2. The ISOSS J18364-0221 star-forming region andthe SMM1 clump
The star-forming region ISOSS J18364-0221(R.A. 18h36m24.7s, Decl. -0221′49′′[J2000]) was initiallystudied by Birkmann et al. (2006) and is located ata distance of about 2.2 kpc. Derived from the near-infrared extinction over a 15′ × 15′ field (∼ 100pc2),the cloud complex associated with the star-formingregion comprises a mass M ≈ 3200M⊙. In the samemanner, a lower mass limit M ≥ 460M⊙ was foundfor the central region (∼ 1 pc2), while the far-infraredand submillimetre measurements give a luminosity L≈ 800L⊙, an average dust temperature of about 15Kand a mass of 900+450
−330 M⊙. This region contains twoclumps detected in the submillimetre continuum namedSMM1 and SMM2 that are separated by about 1.5′
along the east-west direction. The SMM1 clump issubject of this publication. Its effective radius is about0.2 pc, and from the thermal emission a characteristicdust temperature of 16.5+6
−3 K and a clump mass ofMSMM1 = 75 ± 30M⊙ were found. The molecularline observations reported in Birkmann et al. (2006)show red-shifted self-absorption that is interpreted assignature of collapse motions. Furthermore, at least oneoutflow is present. The outflow properties resulting fromthe single-dish observations, i.e. the outflow mass ofabout 18M⊙ and the mass outflow rate of 10−3 M⊙ yr−1,are comparable to values derived for outflows from pre-sumed high-mass star precursors. These results renderthe SMM1 clump a promising object to study theearly phases of collapse and fragmentation occurring inmassive cold cores.
The detailed study of this source we present here madeuse of recently collected infrared and (sub-)millimetredata described in the next section. They reveal two star-forming cores and molecular outflows (Section 3). InSection 4, we discuss the core properties in the contextof early-stage star formation and present a comparison ofthe observed HCN spectra with simple radiative transfermodels. Finally, the results are summarised in Section 5.
2. OBSERVATIONS AND DATA REDUCTION
2.1. Near-infrared observations
Imaging observations in the J, H, and Ks band to-wards ISOSS J18364-0221 have been obtained and aredescribed in Birkmann et al. (2006). Additional near-infrared images in the H2 ν =1-0 S(1) line (λ = 2.122µm)were taken with the Calar Alto 3.5m telescope in Octo-ber 2005 using the prime-focus wide-field camera Omega-2000 (Baumeister et al. 2003). Omega-2000 features afield of view (FOV) of 15.4 × 15.4 arcmin2 with a pixelscale of 0.4496′′ pix−1. The exposures were dithered onsource to allow for sky subtraction. The data reductionwas done using IRAF.
2.2. Mid- and far-infrared observations
IRAC (Fazio et al. 2004) imaging in all four pho-tometric bands, MIPS (Rieke et al. 2004) imaging at24µm and 70µm and MIPS spectral energy distribution
(SED) mode observations were undertaken with Spitzer(Werner et al. 2004). The basic flux calibrated imag-ing data of the Spitzer Science Center (SSC) pipelinewere used for further data reduction and analysis. Cos-metic corrections and astrometric refinement were per-formed with the MOPEX software (Makovoz & Marleau2005), and the final images were combined using scriptsin IRAF. Aperture photometry and PSF fitting wasdone with the aperture corrections given in the IRACdata handbook and on the SSC website2. The MIPSSED mode calibration is based on a spectrum of α Boo(Low et al. 2005) and the measured MIPS 70µm fluxes.The calibration uncertainties are about 2% (IRAC,Reach et al. (2005)), 4% (MIPS 24, Engelbracht et al.(2007)), and 10% (MIPS 70, Gordon et al. (2007)).The resulting photometric accuracy is estimated to 5%(IRAC), 10% (MIPS 24), and 20% (MIPS 70 and SED).
2.3. Submillimetre observations
The submillimetre continuum observations withSCUBA at the JCMT are outlined in Birkmann et al.(2006). In light of the results from the inter-ferometric observations that are described in thenext section, we reanalysed the jiggle maps. TheORAC-DR (Jenness & Economou 1999) and SURF(Jenness & Lightfoot 1998) software were used for datareduction and the photometric calibration based onmaps of Uranus acquired shortly before and afterthe observations. Further analysis as described inSandell & Weintraub (2001) used the MIRIAD software(Sault et al. 1995). The deviations of the JCMT beamfrom a single Gaussian have been considered by usingthe Uranus maps to construct symmetric beam modelsand deconvolve the maps of the target regions. Thederived beam sizes are 8.2′′ at 450µm and 14.8′′ at850µm. The maps were restored with Gaussian beamsof 8′′ and 14′′, respectively, and fluxes as well as decon-volved source sizes have been derived by fitting Gaus-sian components. The noise levels (1σ) in the restoredmaps are 100mJy beam−1 at 450µm and 23mJy beam−1
at 850µm. The photometric accuracy obtained is esti-mated to 30% at 450µm and 20% at 850µm. For a largeaperture covering the SMM1 clump, the photometric re-sults reproduce those of Birkmann et al. (2006) withinthe uncertainty ranges.
2.4. Millimetre observations
We have carried out millimetre observations usingthe IRAM 30m and Plateau de Bure Interferometer(PdBI). The molecular lines CO(2-1), HCO+(1-0) andHCN(1-0) have been observed together with the con-tinuum at 1.3mm and 3.4mm. The line frequenciesare 230.538GHz for CO(2-1) and 89.188526GHz forHCO+(1-0). The HCN(1-0) transition includes threehyperfine components within 4MHz at 88.630416GHz(F1→1), 88.631847GHz (F2→1), and 88.633936GHz(F0→1)
3. The PdBI configurations C and D were utilised;D was observed in September 2006 and C in April2007 with the new generation facility receivers. Spec-
2 http://ssc.spitzer.caltech.edu/mips/apercorr/3 NIST Recommended Rest Frequencies for Observed Interstellar
Molecular Microwave Transitions: http://physics.nist.gov/restfreq
Star-forming cores in a massive clump 3
tral resolutions of 40 kHz (3mm lines), 160kHz (CO(2-1)), 1.25MHz (3.4mm continuum, 3 × 160MHz band-width), and 2.5MHz (1.3mm continuum, 2 × 320MHzbandwidth) were used. Phase calibrators were 1749-096 and 1741-038, additional amplitude calibrators wereMWC349 and 3C273. Corresponding short-spacing ob-servations were accomplished in February 2007 at theIRAM 30m as On-the-fly maps using the single pixel het-erodyne receivers with the VESPA correlator and spec-tral resolutions of 80 kHz (1 mm lines, 80MHz band-width) and 20 kHz (3 mm lines, 40MHz bandwidth). Thedata were reduced and calibrated with the GILDAS4
software. GILDAS was also used to combine the short-spacing and interferometric data for the lines. In the caseof CO, we chose to convert the measured visibilities tomaps using a weighting scheme that achieves the highestspatial resolution (synthesised beam size of 1.85′′×1.33′′)at the expense of sensitivity for extended emission.Therefore the combined CO map does not recover thecomplete flux. Compared to the single-dish spectra, theline wing fluxes in the combined map are lower by a factorof 5±1. For HCN, the comparison of the extracted spec-tra shows that the flux measured in the single-dish data isreproduced in the combined map. The synthesised con-tinuum beam sizes are 1.9′′ × 1.0′′ (PA 11.6) at 1.3mmand 4.6′′×3.2′′ (PA 6.1) at 3.4mm. We reach noise lev-els (1σ) in the cleaned maps of 0.6mJy beam−1 (1.3mmcontinuum), 0.13mJybeam−1 (3.4mm continuum),0.5 Jy beam−1 km s−1 (CO(2-1)), 0.07 Jybeam−1 km s−1
(HCO+(1-0)), and 0.1 Jy beam−1 km s−1 (HCN(1-0)).Assuming a dust temperature of 20K, we are sensitiveto total masses of about 0.2M⊙ (3σ in the 1.3mm con-tinuum). The noise level (1σ) in the individual HCN(1-0) spectra used for the modelling is 0.1K. The 1.2mmcontinuum was observed with the MAMBO-2 bolometerarray in March 2007. The MOPSIC software was usedfor data reduction and the noise level (1σ) in the result-ing map is 10mJybeam−1. The photometric accuracy isestimated to 20%.
3. RESULTS
3.1. Multiwavelength maps of SMM1
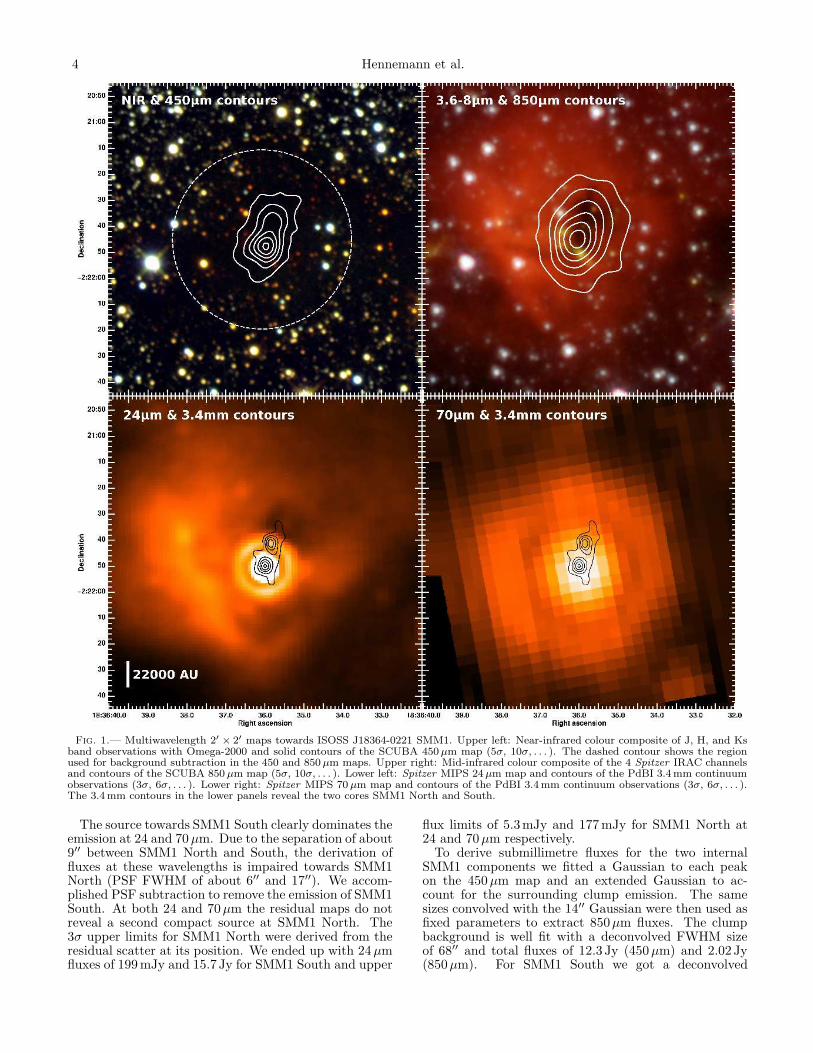
In Figs. 1 and 2 we show multiwavelength maps ob-served towards ISOSS J18364-0221 SMM1. In the inter-ferometric millimetre continuum observations SMM1 isresolved into two cores SMM1 North and SMM1 South(Fig. 1 lower panels), separated by 9.5′′ (ca. 21000AU).In the near-infrared (Fig. 1 upper left), noticeable ex-tinction and reddening is present in the surrounding ofSMM1. There are no near-infrared sources detected to-wards the (sub-)millimetre peaks. The mid-infrared mea-sured with IRAC (Fig. 1 upper right) is dominated byextended emission in the 8µm band along the outer rimof SMM1. Towards the centre of SMM1, a filamentarystructure is observed in absorption, and no stellar ob-jects are associated. At 24µm (Fig. 1 lower left) a pointsource at SMM1 South shows up. At this wavelength,the extended emission around SMM1 is also visible, andin the north-west a dip remains, but the absorption fea-ture is superposed by the PSF of the southern source.No obvious 24µm source towards SMM1 North is de-
4 http://www.iram.fr/IRAMFR/GILDAS
tected. Similarly, SMM1 South emits at 70µm (Fig. 1lower right). The wide PSF overlays possible extendedemission at the rim of SMM1, and no obvious emissionat SMM1 North is detected.
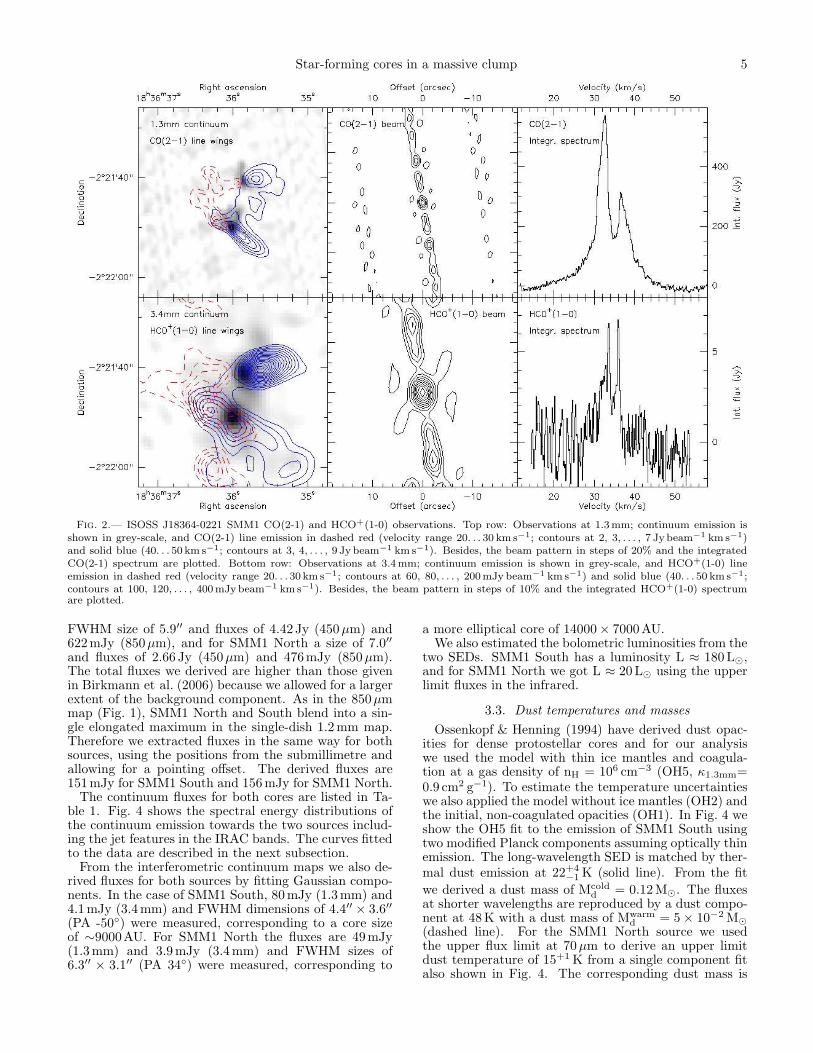
In the interferometric 1.3mm continuum map (Fig. 2top row), both SMM1 North and South appear slightlyextended to the north, but the beam sidelobes may af-fect the morphology. At 3.4mm they appear unresolved(Fig. 2 bottom row), and none of the extensions aretraced. The contours in Fig. 2 derived from the emis-sion in the line wings of the CO(2-1) and HCO+(1-0)transitions reveal two molecular outflows. SMM1 Southconstitutes the origin of a north-east-to-south-west (PAca. 50) outflow that also gives rise to the mid-infraredfeatures. Towards SMM1 North an outflow in east-to-west direction (PA ca. -80) is found. Its red lobe blendsinto the red lobe of the SMM1 South outflow. Mostprominent in CO(2-1) is the SMM1 South blue outflowlobe that appears collimated. In HCO+(1-0), the bluelobe of the SMM1 North outflow is strongest and it alsoshows a rather low outflow opening angle, but in bothcases the outflows are traced only close to the cores andwe could not derive an accurate quantitative measure.
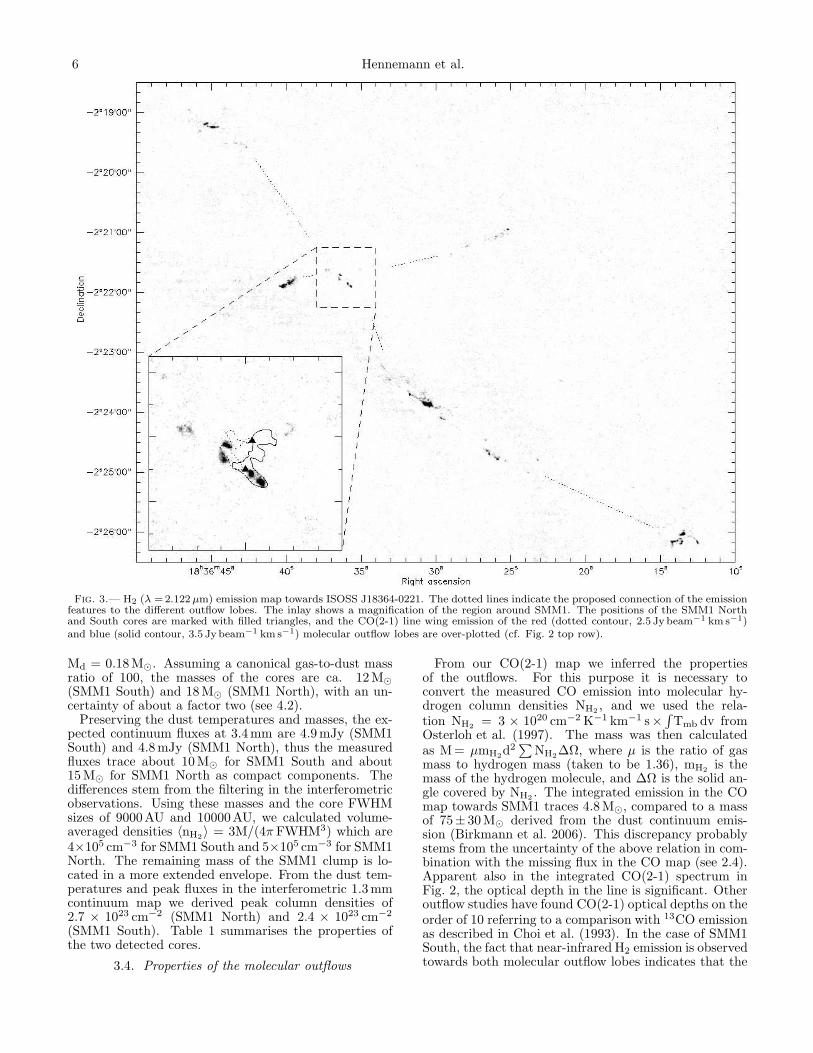
In Fig. 3 we show the near-infrared H2 ν = 1-0 S(1)(λ =2.122µm) line emission map. This map has beenderived by subtracting the scaled K band image fromthe narrow-band image so that stars cancelled out. Starsthat were not properly subtracted have been masked af-terwards for clarity. As shown in the inlay of Fig. 3,towards the blue and red lobes of the molecular out-flow driven by SMM1 South there is patchy near-infraredH2 emission. Such features trace protostellar jets, andthe emission probably arises from collisionally excitedH2 in shocked gas (Elias 1980; Reipurth & Bally 2001,and ref. therein). This is supported by faint filamen-tary emission in the 4.5 and 5.8µm bands we detectedlateral to SMM1 South along north-east-to-south-westand in the vicinity of SMM1 North (yellowish featuresin Fig. 1 top right). These bands contain several H2
lines (Noriega-Crespo et al. 2004; Smith & Rosen 2005).Only a weak near-infrared feature is detected close tothe blue lobe of the SMM1 North outflow. On the large-scale map we found additional filaments of H2 emission.Though they are not exactly aligned with the molecu-lar outflows, they can be assigned to individual lobeswhich would make it necessary that the proposed jetsshow bending resulting in S-shapes. The outermost fea-tures in the North-East and South-West are located at aprojected distance of about 6.7 pc from each other, andthe South-West feature is at a projected distance of about4.6 pc from SMM1 South. Among the sources detectedin the vicinity of the features, we do not find other can-didates for jet-driving young stellar objects.
3.2. SEDs and core sizes
In the near-infrared and at 3.6µm no emission is coin-ciding with SMM1 North or South and we derived upperflux limits from our maps. Close to SMM1 North, theemission in the 4.5 and 5.8µm IRAC bands were mea-sured on levels of 71 and 155µJy. In the 4.5µm bandthere is extended emission overlapping with the SMM1South position, where the flux is about 1.2mJy. At 8 µmno counterparts corresponding to SMM1 North or Southare detected.
4 Hennemann et al.
Fig. 1.— Multiwavelength 2′ × 2′ maps towards ISOSS J18364-0221 SMM1. Upper left: Near-infrared colour composite of J, H, and Ksband observations with Omega-2000 and solid contours of the SCUBA 450 µm map (5σ, 10σ, . . . ). The dashed contour shows the regionused for background subtraction in the 450 and 850 µm maps. Upper right: Mid-infrared colour composite of the 4 Spitzer IRAC channelsand contours of the SCUBA 850 µm map (5σ, 10σ, . . . ). Lower left: Spitzer MIPS 24 µm map and contours of the PdBI 3.4mm continuumobservations (3σ, 6σ, . . . ). Lower right: Spitzer MIPS 70 µm map and contours of the PdBI 3.4mm continuum observations (3σ, 6σ, . . . ).The 3.4mm contours in the lower panels reveal the two cores SMM1 North and South.
The source towards SMM1 South clearly dominates theemission at 24 and 70µm. Due to the separation of about9′′ between SMM1 North and South, the derivation offluxes at these wavelengths is impaired towards SMM1North (PSF FWHM of about 6′′ and 17′′). We accom-plished PSF subtraction to remove the emission of SMM1South. At both 24 and 70µm the residual maps do notreveal a second compact source at SMM1 North. The3σ upper limits for SMM1 North were derived from theresidual scatter at its position. We ended up with 24µmfluxes of 199mJy and 15.7 Jy for SMM1 South and upper
flux limits of 5.3mJy and 177mJy for SMM1 North at24 and 70µm respectively.
To derive submillimetre fluxes for the two internalSMM1 components we fitted a Gaussian to each peakon the 450µm map and an extended Gaussian to ac-count for the surrounding clump emission. The samesizes convolved with the 14′′ Gaussian were then used asfixed parameters to extract 850µm fluxes. The clumpbackground is well fit with a deconvolved FWHM sizeof 68′′ and total fluxes of 12.3 Jy (450µm) and 2.02 Jy(850µm). For SMM1 South we got a deconvolved
Star-forming cores in a massive clump 5
Fig. 2.— ISOSS J18364-0221 SMM1 CO(2-1) and HCO+(1-0) observations. Top row: Observations at 1.3mm; continuum emission isshown in grey-scale, and CO(2-1) line emission in dashed red (velocity range 20. . . 30 km s−1; contours at 2, 3, . . . , 7 Jy beam−1 km s−1)and solid blue (40. . . 50 km s−1; contours at 3, 4, . . . , 9 Jy beam−1 km s−1). Besides, the beam pattern in steps of 20% and the integratedCO(2-1) spectrum are plotted. Bottom row: Observations at 3.4mm; continuum emission is shown in grey-scale, and HCO+(1-0) lineemission in dashed red (velocity range 20. . . 30 km s−1; contours at 60, 80, . . . , 200mJy beam−1 km s−1) and solid blue (40. . . 50 km s−1;contours at 100, 120, . . . , 400mJybeam−1 km s−1). Besides, the beam pattern in steps of 10% and the integrated HCO+(1-0) spectrumare plotted.
FWHM size of 5.9′′ and fluxes of 4.42 Jy (450µm) and622mJy (850µm), and for SMM1 North a size of 7.0′′
and fluxes of 2.66 Jy (450µm) and 476mJy (850µm).The total fluxes we derived are higher than those givenin Birkmann et al. (2006) because we allowed for a largerextent of the background component. As in the 850µmmap (Fig. 1), SMM1 North and South blend into a sin-gle elongated maximum in the single-dish 1.2mm map.Therefore we extracted fluxes in the same way for bothsources, using the positions from the submillimetre andallowing for a pointing offset. The derived fluxes are151mJy for SMM1 South and 156mJy for SMM1 North.
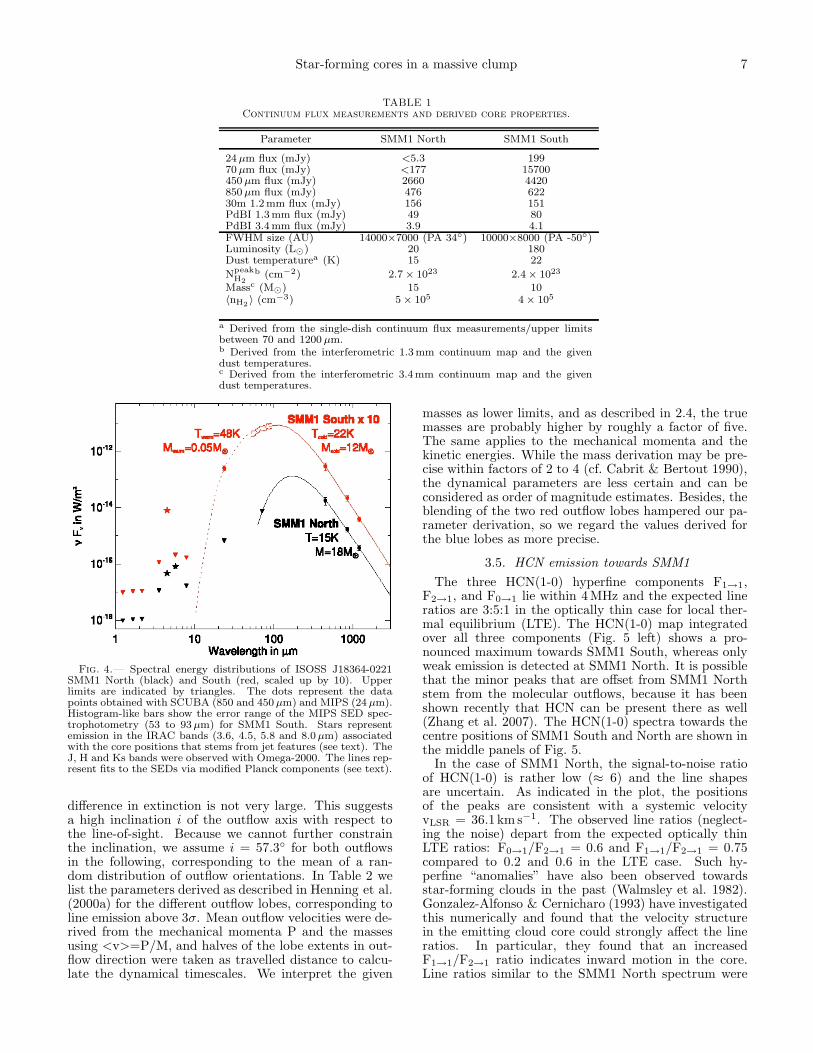
The continuum fluxes for both cores are listed in Ta-ble 1. Fig. 4 shows the spectral energy distributions ofthe continuum emission towards the two sources includ-ing the jet features in the IRAC bands. The curves fittedto the data are described in the next subsection.
From the interferometric continuum maps we also de-rived fluxes for both sources by fitting Gaussian compo-nents. In the case of SMM1 South, 80mJy (1.3mm) and4.1mJy (3.4mm) and FWHM dimensions of 4.4′′ × 3.6′′
(PA -50) were measured, corresponding to a core sizeof ∼9000AU. For SMM1 North the fluxes are 49mJy(1.3mm) and 3.9mJy (3.4mm) and FWHM sizes of6.3′′ × 3.1′′ (PA 34) were measured, corresponding to
a more elliptical core of 14000× 7000AU.We also estimated the bolometric luminosities from the
two SEDs. SMM1 South has a luminosity L ≈ 180L⊙,and for SMM1 North we got L ≈ 20L⊙ using the upperlimit fluxes in the infrared.
3.3. Dust temperatures and masses
Ossenkopf & Henning (1994) have derived dust opac-ities for dense protostellar cores and for our analysiswe used the model with thin ice mantles and coagula-tion at a gas density of nH = 106 cm−3 (OH5, κ1.3mm=0.9 cm2 g−1). To estimate the temperature uncertaintieswe also applied the model without ice mantles (OH2) andthe initial, non-coagulated opacities (OH1). In Fig. 4 weshow the OH5 fit to the emission of SMM1 South usingtwo modified Planck components assuming optically thinemission. The long-wavelength SED is matched by ther-mal dust emission at 22+4
−1 K (solid line). From the fit
we derived a dust mass of Mcoldd = 0.12M⊙. The fluxes
at shorter wavelengths are reproduced by a dust compo-nent at 48K with a dust mass of Mwarm
d = 5 × 10⁻² M⊙
(dashed line). For the SMM1 North source we usedthe upper flux limit at 70µm to derive an upper limitdust temperature of 15+1 K from a single component fitalso shown in Fig. 4. The corresponding dust mass is
6 Hennemann et al.
Fig. 3.— H2 (λ =2.122 µm) emission map towards ISOSS J18364-0221. The dotted lines indicate the proposed connection of the emissionfeatures to the different outflow lobes. The inlay shows a magnification of the region around SMM1. The positions of the SMM1 Northand South cores are marked with filled triangles, and the CO(2-1) line wing emission of the red (dotted contour, 2.5 Jy beam−1 km s−1)and blue (solid contour, 3.5 Jy beam−1 km s−1) molecular outflow lobes are over-plotted (cf. Fig. 2 top row).
Md = 0.18M⊙. Assuming a canonical gas-to-dust massratio of 100, the masses of the cores are ca. 12M⊙
(SMM1 South) and 18M⊙ (SMM1 North), with an un-certainty of about a factor two (see 4.2).
Preserving the dust temperatures and masses, the ex-pected continuum fluxes at 3.4mm are 4.9mJy (SMM1South) and 4.8mJy (SMM1 North), thus the measuredfluxes trace about 10M⊙ for SMM1 South and about15M⊙ for SMM1 North as compact components. Thedifferences stem from the filtering in the interferometricobservations. Using these masses and the core FWHMsizes of 9000AU and 10000AU, we calculated volume-averaged densities 〈nH2
〉 = 3M/(4π FWHM3) which are4×105 cm−3 for SMM1 South and 5×105 cm−3 for SMM1North. The remaining mass of the SMM1 clump is lo-cated in a more extended envelope. From the dust tem-peratures and peak fluxes in the interferometric 1.3mmcontinuum map we derived peak column densities of2.7 × 1023 cm−2 (SMM1 North) and 2.4 × 1023 cm−2
(SMM1 South). Table 1 summarises the properties ofthe two detected cores.
3.4. Properties of the molecular outflows
From our CO(2-1) map we inferred the propertiesof the outflows. For this purpose it is necessary toconvert the measured CO emission into molecular hy-drogen column densities NH2
, and we used the rela-tion NH2
= 3 × 1020 cm−2 K−1 km−1 s×∫Tmb dv from
Osterloh et al. (1997). The mass was then calculatedas M = µmH2
d2∑
NH2∆Ω, where µ is the ratio of gas
mass to hydrogen mass (taken to be 1.36), mH2is the
mass of the hydrogen molecule, and ∆Ω is the solid an-gle covered by NH2
. The integrated emission in the COmap towards SMM1 traces 4.8M⊙, compared to a massof 75± 30M⊙ derived from the dust continuum emis-sion (Birkmann et al. 2006). This discrepancy probablystems from the uncertainty of the above relation in com-bination with the missing flux in the CO map (see 2.4).Apparent also in the integrated CO(2-1) spectrum inFig. 2, the optical depth in the line is significant. Otheroutflow studies have found CO(2-1) optical depths on theorder of 10 referring to a comparison with 13CO emissionas described in Choi et al. (1993). In the case of SMM1South, the fact that near-infrared H2 emission is observedtowards both molecular outflow lobes indicates that the
Star-forming cores in a massive clump 7
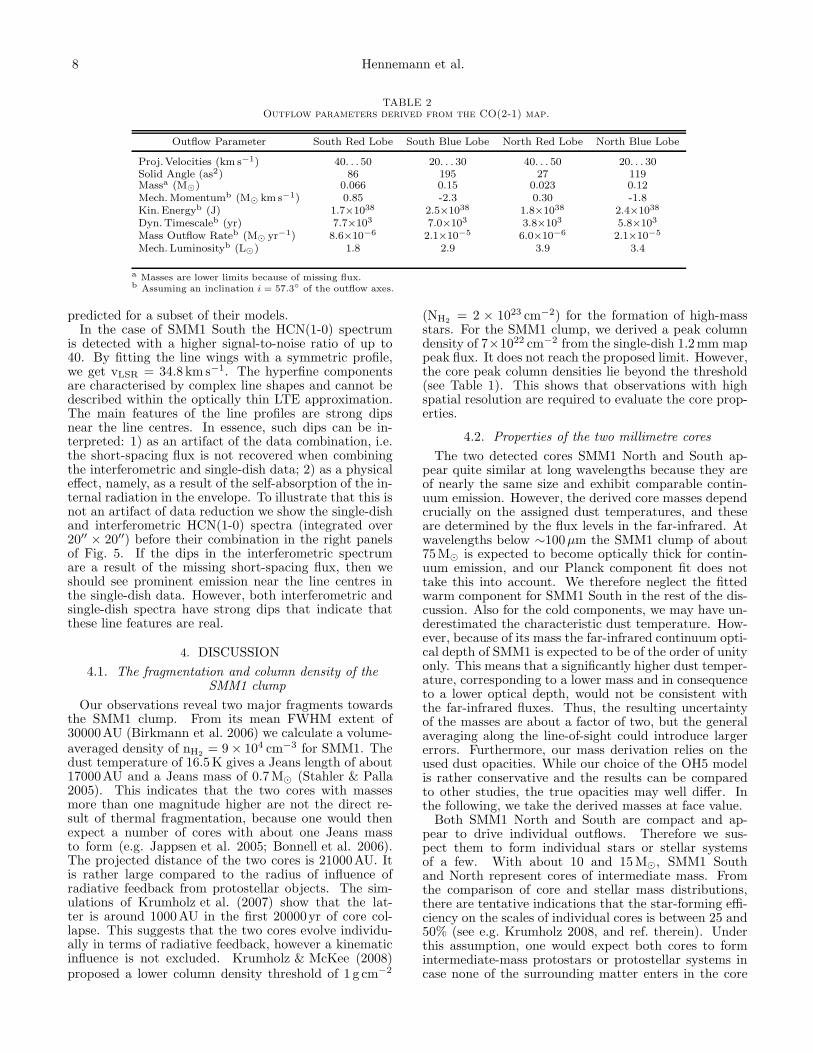
TABLE 1Continuum flux measurements and derived core properties.
Parameter SMM1 North SMM1 South
24 µm flux (mJy) <5.3 19970 µm flux (mJy) <177 15700450 µm flux (mJy) 2660 4420850 µm flux (mJy) 476 62230m 1.2mm flux (mJy) 156 151PdBI 1.3mm flux (mJy) 49 80PdBI 3.4mm flux (mJy) 3.9 4.1FWHM size (AU) 14000×7000 (PA 34) 10000×8000 (PA -50)Luminosity (L⊙) 20 180Dust temperaturea (K) 15 22
Npeak
H2
b (cm−2) 2.7 × 10²³ 2.4 × 10²³
Massc (M⊙) 15 10〈nH2
〉 (cm−3) 5 × 10⁵ 4 × 10⁵
a Derived from the single-dish continuum flux measurements/upper limitsbetween 70 and 1200 µm.b Derived from the interferometric 1.3mm continuum map and the givendust temperatures.c Derived from the interferometric 3.4mm continuum map and the givendust temperatures.
Fig. 4.— Spectral energy distributions of ISOSS J18364-0221SMM1 North (black) and South (red, scaled up by 10). Upperlimits are indicated by triangles. The dots represent the datapoints obtained with SCUBA (850 and 450 µm) and MIPS (24 µm).Histogram-like bars show the error range of the MIPS SED spec-trophotometry (53 to 93 µm) for SMM1 South. Stars representemission in the IRAC bands (3.6, 4.5, 5.8 and 8.0 µm) associatedwith the core positions that stems from jet features (see text). TheJ, H and Ks bands were observed with Omega-2000. The lines rep-resent fits to the SEDs via modified Planck components (see text).
difference in extinction is not very large. This suggestsa high inclination i of the outflow axis with respect tothe line-of-sight. Because we cannot further constrainthe inclination, we assume i = 57.3 for both outflowsin the following, corresponding to the mean of a ran-dom distribution of outflow orientations. In Table 2 welist the parameters derived as described in Henning et al.(2000a) for the different outflow lobes, corresponding toline emission above 3σ. Mean outflow velocities were de-rived from the mechanical momenta P and the massesusing <v>=P/M, and halves of the lobe extents in out-flow direction were taken as travelled distance to calcu-late the dynamical timescales. We interpret the given
masses as lower limits, and as described in 2.4, the truemasses are probably higher by roughly a factor of five.The same applies to the mechanical momenta and thekinetic energies. While the mass derivation may be pre-cise within factors of 2 to 4 (cf. Cabrit & Bertout 1990),the dynamical parameters are less certain and can beconsidered as order of magnitude estimates. Besides, theblending of the two red outflow lobes hampered our pa-rameter derivation, so we regard the values derived forthe blue lobes as more precise.
3.5. HCN emission towards SMM1
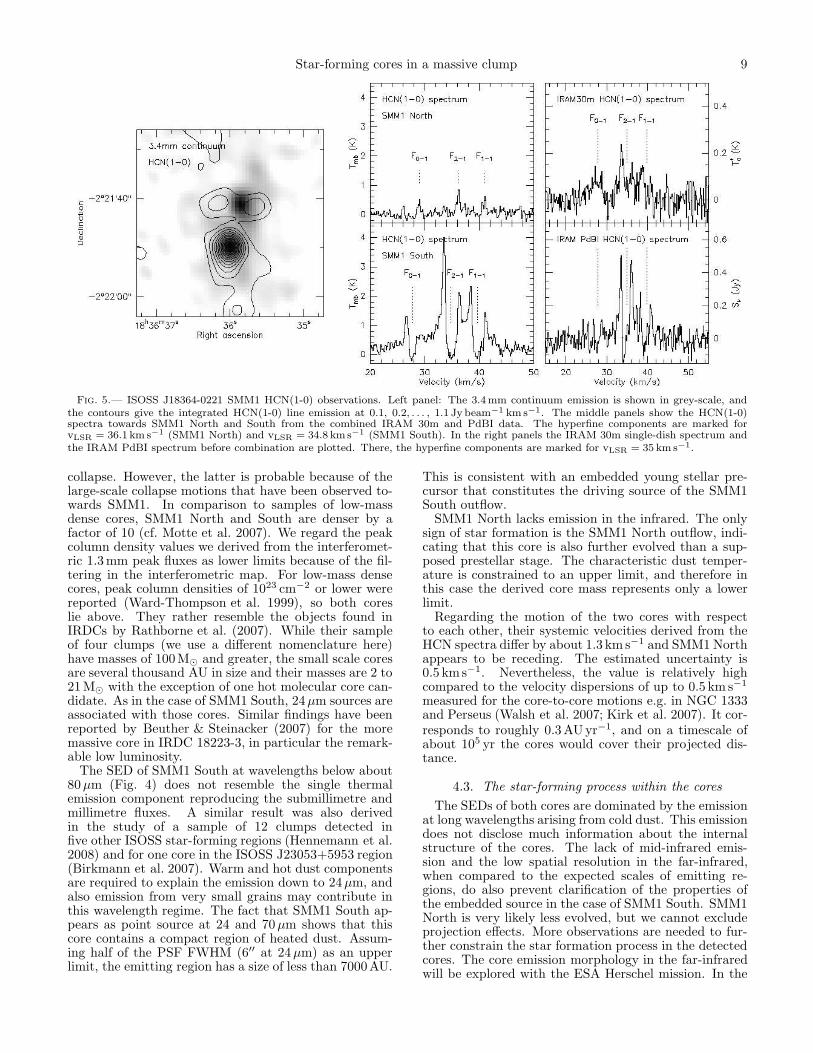
The three HCN(1-0) hyperfine components F1→1,F2→1, and F0→1 lie within 4MHz and the expected lineratios are 3:5:1 in the optically thin case for local ther-mal equilibrium (LTE). The HCN(1-0) map integratedover all three components (Fig. 5 left) shows a pro-nounced maximum towards SMM1 South, whereas onlyweak emission is detected at SMM1 North. It is possiblethat the minor peaks that are offset from SMM1 Northstem from the molecular outflows, because it has beenshown recently that HCN can be present there as well(Zhang et al. 2007). The HCN(1-0) spectra towards thecentre positions of SMM1 South and North are shown inthe middle panels of Fig. 5.
In the case of SMM1 North, the signal-to-noise ratioof HCN(1-0) is rather low (≈ 6) and the line shapesare uncertain. As indicated in the plot, the positionsof the peaks are consistent with a systemic velocityvLSR = 36.1km s−1. The observed line ratios (neglect-ing the noise) depart from the expected optically thinLTE ratios: F0→1/F2→1 = 0.6 and F1→1/F2→1 = 0.75compared to 0.2 and 0.6 in the LTE case. Such hy-perfine “anomalies” have also been observed towardsstar-forming clouds in the past (Walmsley et al. 1982).Gonzalez-Alfonso & Cernicharo (1993) have investigatedthis numerically and found that the velocity structurein the emitting cloud core could strongly affect the lineratios. In particular, they found that an increasedF1→1/F2→1 ratio indicates inward motion in the core.Line ratios similar to the SMM1 North spectrum were
8 Hennemann et al.
TABLE 2Outflow parameters derived from the CO(2-1) map.
Outflow Parameter South Red Lobe South Blue Lobe North Red Lobe North Blue Lobe
Proj.Velocities (km s−1) 40. . . 50 20. . . 30 40. . . 50 20. . . 30Solid Angle (as2) 86 195 27 119Massa (M⊙) 0.066 0.15 0.023 0.12Mech. Momentumb (M⊙ km s−1) 0.85 -2.3 0.30 -1.8Kin. Energyb (J) 1.7×1038 2.5×1038 1.8×1038 2.4×1038
Dyn. Timescaleb (yr) 7.7×10³ 7.0×10³ 3.8×10³ 5.8×10³
Mass Outflow Rateb (M⊙ yr−1) 8.6×10⁻⁶ 2.1×10⁻⁵ 6.0×10⁻⁶ 2.1×10⁻⁵
Mech. Luminosityb (L⊙) 1.8 2.9 3.9 3.4
a Masses are lower limits because of missing flux.b Assuming an inclination i = 57.3 of the outflow axes.
predicted for a subset of their models.In the case of SMM1 South the HCN(1-0) spectrum
is detected with a higher signal-to-noise ratio of up to40. By fitting the line wings with a symmetric profile,we get vLSR = 34.8 km s−1. The hyperfine componentsare characterised by complex line shapes and cannot bedescribed within the optically thin LTE approximation.The main features of the line profiles are strong dipsnear the line centres. In essence, such dips can be in-terpreted: 1) as an artifact of the data combination, i.e.the short-spacing flux is not recovered when combiningthe interferometric and single-dish data; 2) as a physicaleffect, namely, as a result of the self-absorption of the in-ternal radiation in the envelope. To illustrate that this isnot an artifact of data reduction we show the single-dishand interferometric HCN(1-0) spectra (integrated over20′′ × 20′′) before their combination in the right panelsof Fig. 5. If the dips in the interferometric spectrumare a result of the missing short-spacing flux, then weshould see prominent emission near the line centres inthe single-dish data. However, both interferometric andsingle-dish spectra have strong dips that indicate thatthese line features are real.
4. DISCUSSION
4.1. The fragmentation and column density of theSMM1 clump
Our observations reveal two major fragments towardsthe SMM1 clump. From its mean FWHM extent of30000AU (Birkmann et al. 2006) we calculate a volume-averaged density of nH2
= 9 × 104 cm−3 for SMM1. Thedust temperature of 16.5K gives a Jeans length of about17000AU and a Jeans mass of 0.7M⊙ (Stahler & Palla2005). This indicates that the two cores with massesmore than one magnitude higher are not the direct re-sult of thermal fragmentation, because one would thenexpect a number of cores with about one Jeans massto form (e.g. Jappsen et al. 2005; Bonnell et al. 2006).The projected distance of the two cores is 21000AU. Itis rather large compared to the radius of influence ofradiative feedback from protostellar objects. The sim-ulations of Krumholz et al. (2007) show that the lat-ter is around 1000AU in the first 20000yr of core col-lapse. This suggests that the two cores evolve individu-ally in terms of radiative feedback, however a kinematicinfluence is not excluded. Krumholz & McKee (2008)proposed a lower column density threshold of 1 g cm−2
(NH2= 2 × 1023 cm−2) for the formation of high-mass
stars. For the SMM1 clump, we derived a peak columndensity of 7×1022 cm−2 from the single-dish 1.2mm mappeak flux. It does not reach the proposed limit. However,the core peak column densities lie beyond the threshold(see Table 1). This shows that observations with highspatial resolution are required to evaluate the core prop-erties.
4.2. Properties of the two millimetre cores
The two detected cores SMM1 North and South ap-pear quite similar at long wavelengths because they areof nearly the same size and exhibit comparable contin-uum emission. However, the derived core masses dependcrucially on the assigned dust temperatures, and theseare determined by the flux levels in the far-infrared. Atwavelengths below ∼100µm the SMM1 clump of about75M⊙ is expected to become optically thick for contin-uum emission, and our Planck component fit does nottake this into account. We therefore neglect the fittedwarm component for SMM1 South in the rest of the dis-cussion. Also for the cold components, we may have un-derestimated the characteristic dust temperature. How-ever, because of its mass the far-infrared continuum opti-cal depth of SMM1 is expected to be of the order of unityonly. This means that a significantly higher dust temper-ature, corresponding to a lower mass and in consequenceto a lower optical depth, would not be consistent withthe far-infrared fluxes. Thus, the resulting uncertaintyof the masses are about a factor of two, but the generalaveraging along the line-of-sight could introduce largererrors. Furthermore, our mass derivation relies on theused dust opacities. While our choice of the OH5 modelis rather conservative and the results can be comparedto other studies, the true opacities may well differ. Inthe following, we take the derived masses at face value.
Both SMM1 North and South are compact and ap-pear to drive individual outflows. Therefore we sus-pect them to form individual stars or stellar systemsof a few. With about 10 and 15M⊙, SMM1 Southand North represent cores of intermediate mass. Fromthe comparison of core and stellar mass distributions,there are tentative indications that the star-forming effi-ciency on the scales of individual cores is between 25 and50% (see e.g. Krumholz 2008, and ref. therein). Underthis assumption, one would expect both cores to formintermediate-mass protostars or protostellar systems incase none of the surrounding matter enters in the core
Star-forming cores in a massive clump 9
Fig. 5.— ISOSS J18364-0221 SMM1 HCN(1-0) observations. Left panel: The 3.4mm continuum emission is shown in grey-scale, andthe contours give the integrated HCN(1-0) line emission at 0.1, 0.2, . . . , 1.1 Jy beam−1 km s−1. The middle panels show the HCN(1-0)spectra towards SMM1 North and South from the combined IRAM 30m and PdBI data. The hyperfine components are marked forvLSR = 36.1 km s−1 (SMM1 North) and vLSR = 34.8 kms−1 (SMM1 South). In the right panels the IRAM 30m single-dish spectrum andthe IRAM PdBI spectrum before combination are plotted. There, the hyperfine components are marked for vLSR = 35 km s−1.
collapse. However, the latter is probable because of thelarge-scale collapse motions that have been observed to-wards SMM1. In comparison to samples of low-massdense cores, SMM1 North and South are denser by afactor of 10 (cf. Motte et al. 2007). We regard the peakcolumn density values we derived from the interferomet-ric 1.3mm peak fluxes as lower limits because of the fil-tering in the interferometric map. For low-mass densecores, peak column densities of 1023 cm−2 or lower werereported (Ward-Thompson et al. 1999), so both coreslie above. They rather resemble the objects found inIRDCs by Rathborne et al. (2007). While their sampleof four clumps (we use a different nomenclature here)have masses of 100M⊙ and greater, the small scale coresare several thousand AU in size and their masses are 2 to21M⊙ with the exception of one hot molecular core can-didate. As in the case of SMM1 South, 24µm sources areassociated with those cores. Similar findings have beenreported by Beuther & Steinacker (2007) for the moremassive core in IRDC 18223-3, in particular the remark-able low luminosity.
The SED of SMM1 South at wavelengths below about80µm (Fig. 4) does not resemble the single thermalemission component reproducing the submillimetre andmillimetre fluxes. A similar result was also derivedin the study of a sample of 12 clumps detected infive other ISOSS star-forming regions (Hennemann et al.2008) and for one core in the ISOSS J23053+5953 region(Birkmann et al. 2007). Warm and hot dust componentsare required to explain the emission down to 24µm, andalso emission from very small grains may contribute inthis wavelength regime. The fact that SMM1 South ap-pears as point source at 24 and 70µm shows that thiscore contains a compact region of heated dust. Assum-ing half of the PSF FWHM (6′′ at 24µm) as an upperlimit, the emitting region has a size of less than 7000AU.
This is consistent with an embedded young stellar pre-cursor that constitutes the driving source of the SMM1South outflow.
SMM1 North lacks emission in the infrared. The onlysign of star formation is the SMM1 North outflow, indi-cating that this core is also further evolved than a sup-posed prestellar stage. The characteristic dust temper-ature is constrained to an upper limit, and therefore inthis case the derived core mass represents only a lowerlimit.
Regarding the motion of the two cores with respectto each other, their systemic velocities derived from theHCN spectra differ by about 1.3 km s−1 and SMM1 Northappears to be receding. The estimated uncertainty is0.5 kms−1. Nevertheless, the value is relatively highcompared to the velocity dispersions of up to 0.5 km s−1
measured for the core-to-core motions e.g. in NGC 1333and Perseus (Walsh et al. 2007; Kirk et al. 2007). It cor-responds to roughly 0.3AUyr−1, and on a timescale ofabout 105 yr the cores would cover their projected dis-tance.
4.3. The star-forming process within the cores
The SEDs of both cores are dominated by the emissionat long wavelengths arising from cold dust. This emissiondoes not disclose much information about the internalstructure of the cores. The lack of mid-infrared emis-sion and the low spatial resolution in the far-infrared,when compared to the expected scales of emitting re-gions, do also prevent clarification of the properties ofthe embedded source in the case of SMM1 South. SMM1North is very likely less evolved, but we cannot excludeprojection effects. More observations are needed to fur-ther constrain the star formation process in the detectedcores. The core emission morphology in the far-infraredwill be explored with the ESA Herschel mission. In the
10 Hennemann et al.
case of SMM1 South, high spatial resolution imaging be-yond 20µm combined with high sensitivity, possible withthe MIRI instrument on JWST, will severely constrainthe properties of the embedded protostellar object. Inthe following, we discuss implications given by the de-rived outflow properties and our modelling of the HCNspectra.
4.3.1. Outflow activity
Collimated outflows have been observed for low-masscores and, more recently, also for young high-massobjects, supporting the disk accretion scenario (seeBeuther & Shepherd 2005, and ref. therein). In theformer case, a high degree of collimation is linked toearly stages and a widening of the outflow opening anglefollows during further evolution (Arce & Sargent 2006).According to some observational evidence, this holds forhigh-mass sources as well and may provide a basis fortheir evolutionary classification.
The fact that we observed rather collimated outflowsclose to their proposed origins SMM1 North and Southis consistent with the idea that the embedded drivingsources have formed and launched the outflows recently.This is supported by the estimated dynamical timescalesof less than 104 yr.
The outflow energetics change by orders of magni-tude from low-mass cases to luminous high-mass driv-ing sources (e.g. Wu et al. 2004; Henning et al. 2000b),and the span of outflow kinetic energies that have beenderived is 1031 J ≤ Ekin ≤ 1041 J. For the sample ofBeuther et al. (2002b) with L > 103 L⊙, they got valueson the order of Ekin ≈ 1039 J. With Ekin ≈ 5 × 1038 J,the outflows of the SMM1 cores reach the same order ofmagnitude, in particular because the adopted masses arelower limits. They exceed those of low-mass cores.
So far we have only considered the molecular outflowsclose to the cores. The traced molecular gas has prob-ably been entrained by collimated jets. If we assumethat the H2 emission features at larger distances stemfrom these jets, which is supported by the rough align-ment with the molecular outflows, we can derive a sec-ond timescale for the outflow activity of the cores. How-ever, we cannot constrain the jet velocities from observa-tions. Beuther et al. (2002b) used a ratio of jet velocityto molecular outflow velocity of 20, and for the SMM1cores the resulting jet velocities are about 300km s−1.This is in the range of velocities that have been ob-served for Herbig-Haro flows from low-luminosity sources(Reipurth & Bally 2001). From the measured offsets ofthe outermost H2 feature in the south-west we got atimescale of approximately 1.8 × 10⁴ yr for the SMM1South jet. This is above the molecular outflow timescaleof approximately 7 × 10³ yr. For the SMM1 North jet,the outermost feature in the west gives a timescale ofabout 7 × 10³ yr, which agrees with the molecular out-flow timescale. Accounting for the overall uncertainties,these values are consistent with the proposed relation ofjets and molecular flows, which of course does not ex-clude other scenarios.
Parsec-scale jets and outflows have been found towardsmany young low-mass stellar objects, mostly traced byoptical or near-infrared line emission (Reipurth & Bally2001). The more energetic outflows in the high-massregime are therefore expected to also extend to these
sizes, although few observations were reported to date(e.g. Bally 2008; Beuther et al. 2002a). The presumedjets from SMM1 support this idea. The filamentary andpatchy structure observed in H2 can be caused by dif-ferent factors. Besides the varying line-of-sight extinc-tion, the local H2 abundance may play an important rolein determining where the shock-excited emission arises,and the kinematics of internal shocks is presumably in-fluenced by the penetrated medium. An interesting pos-sibility is the connection to the mass ejection history ofthe driving source, which is linked to the accretion his-tory for disk-driven outflows. The several features wedetected indicate a varying mass-loss rate for the SMM1cores. Such a burst mode of accretion may result fromdisk instability driven by infall (Vorobyov & Basu 2006).
The S-shape that we observe for the presumed SMM1South jet can be interpreted as a precession of the outflowaxis. The outermost feature we found in the south-westapproximately lies on the projected outflow axis with PA≈ 50 we derived from the molecular outflow lobes closeto the core, while the features in between are offset tolower PA. This means the core rotation axis is not alongthe line-of-sight, but rather has a high inclination.
4.3.2. Modelling of the HCN emission
HCN appears to be more resistant to freeze-out in colddense cores compared to CO-related molecules as HCO+
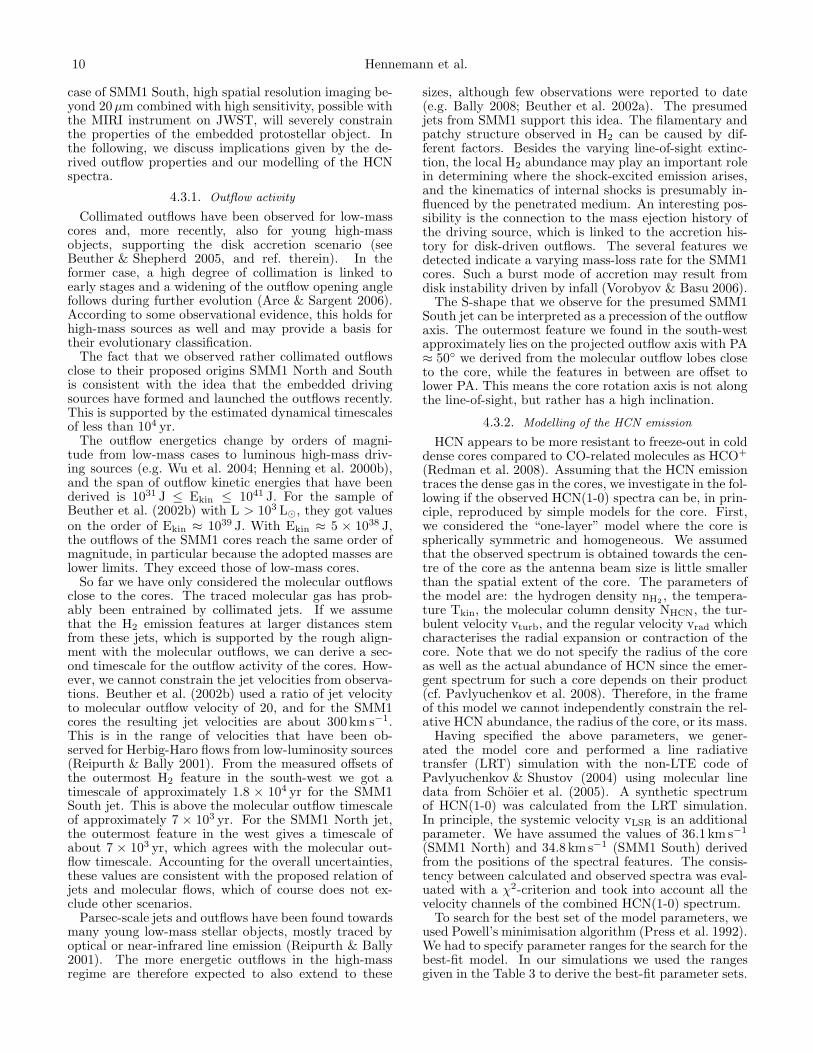
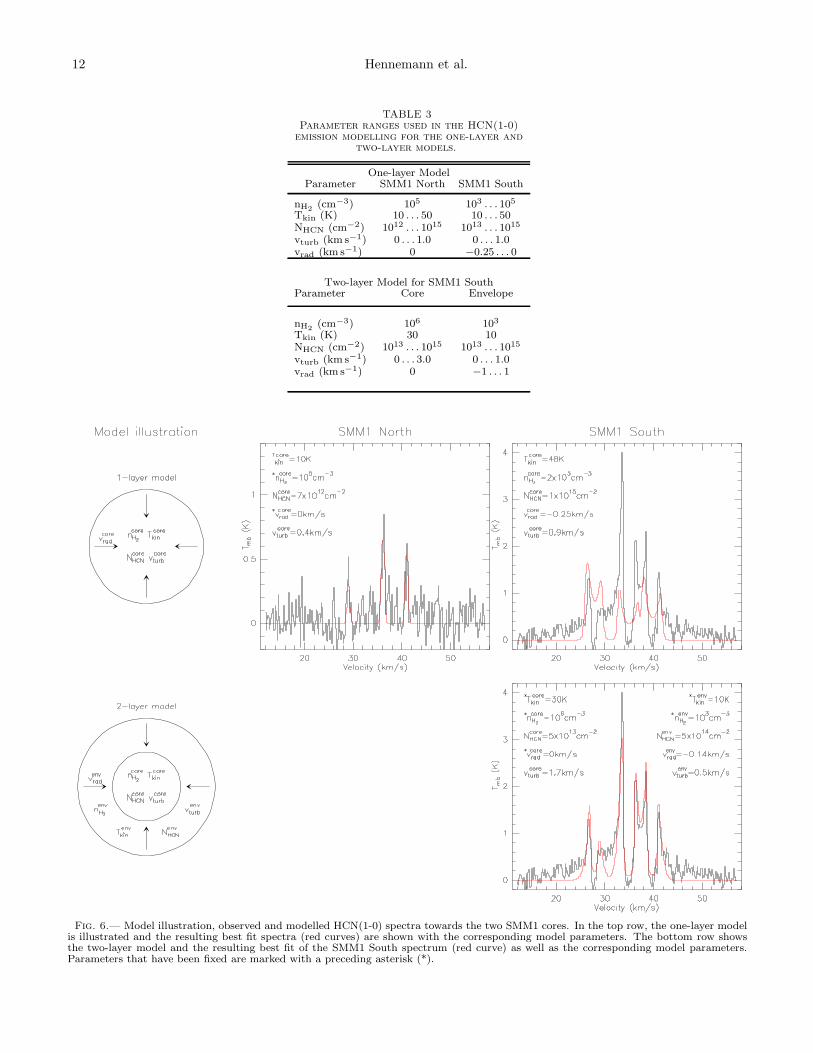
(Redman et al. 2008). Assuming that the HCN emissiontraces the dense gas in the cores, we investigate in the fol-lowing if the observed HCN(1-0) spectra can be, in prin-ciple, reproduced by simple models for the core. First,we considered the “one-layer” model where the core isspherically symmetric and homogeneous. We assumedthat the observed spectrum is obtained towards the cen-tre of the core as the antenna beam size is little smallerthan the spatial extent of the core. The parameters ofthe model are: the hydrogen density nH2
, the tempera-ture Tkin, the molecular column density NHCN, the tur-bulent velocity vturb, and the regular velocity vrad whichcharacterises the radial expansion or contraction of thecore. Note that we do not specify the radius of the coreas well as the actual abundance of HCN since the emer-gent spectrum for such a core depends on their product(cf. Pavlyuchenkov et al. 2008). Therefore, in the frameof this model we cannot independently constrain the rel-ative HCN abundance, the radius of the core, or its mass.
Having specified the above parameters, we gener-ated the model core and performed a line radiativetransfer (LRT) simulation with the non-LTE code ofPavlyuchenkov & Shustov (2004) using molecular linedata from Schoier et al. (2005). A synthetic spectrumof HCN(1-0) was calculated from the LRT simulation.In principle, the systemic velocity vLSR is an additionalparameter. We have assumed the values of 36.1 km s−1
(SMM1 North) and 34.8 kms−1 (SMM1 South) derivedfrom the positions of the spectral features. The consis-tency between calculated and observed spectra was eval-uated with a χ2-criterion and took into account all thevelocity channels of the combined HCN(1-0) spectrum.
To search for the best set of the model parameters, weused Powell’s minimisation algorithm (Press et al. 1992).We had to specify parameter ranges for the search for thebest-fit model. In our simulations we used the rangesgiven in the Table 3 to derive the best-fit parameter sets.
Star-forming cores in a massive clump 11
The ranges resulted from several runs where we specifiedparts of the adjacent parameter space and did not findgood reproductions of the observed spectra. Though un-likely, we cannot exclude that additional compatible setsof parameters exist. In order to assure that the min-imisation routine was not trapped in a local minimum,we repeated the calculations starting with several sets ofinitial parameters. The best-fit spectra obtained for theone-layer model with the corresponding parameters areshown in Fig. 6 in the top row.
In the case of SMM1 North, the observed line ra-tios were reproduced fairly well. We found a degener-acy between the hydrogen density, the kinetic temper-ature and the HCN column density and therefore weset nH2
= 105 cm−3. This resulted in Tkin = 10K andNHCN = 7× 1012 cm−2. Furthermore, given the assump-tion that the observed HCN(1-0) components are indeedsingle-peaked and relatively narrow, the effect of the reg-ular and turbulent velocities cannot be distinguished.Therefore we set the regular velocity to zero. The derivedvalue of the turbulent velocity is 0.4 km s−1. Note that incontrast to the study of Gonzalez-Alfonso & Cernicharo(1993), we did not have to introduce any regular veloc-ity to explain the “anomalous” line ratios. The obtainedratios naturally appeared as a result of the non-LTE ex-citation in the subcritical density.
In the case of SMM1 South, the one-layer model couldnot reproduce the maximal intensities and the strengthof the self-absorption dips at the same time. We showone representative spectrum from the one-layer model inFig. 6.
A natural way to reproduce the observed spectrumof SMM1 South is to include a low-density envelopein the model which should lead to self-absorption. Wechecked this by constructing a “two-layer” model with5+5 parameters, and chose a configuration where a staticcore (vcore
rad = 0) is surrounded by a spherically sym-metric, homogeneous envelope. The increased numberof parameters makes it difficult to identify a best setthrough the minimisation routine. Therefore we fixedsome of the parameters based on the following argu-ments. First, we assumed that the hydrogen density inthe core is higher while in the envelope it is lower thanthe critical density for HCN(1-0). Given this assump-tion, we expect the formation of strong self-absorptiondips if the HCN column density in the envelope is highenough. We set the densities to ncore
H2= 106 cm−3 and
nenvH2
= 103 cm−3. We also fixed the temperature in theenvelope Tenv
kin = 10K assuming that it is not heatedby the inner (most probably warmer) part of the core,for which we chose Tcore
kin = 30K. Changes in the coretemperature do not affect the derived model spectra sig-nificantly. Thus, we varied the five parameters Ncore
HCN,vcoreturb, Nenv
HCN, venvturb, venv
rad , and constrained them using theminimisation routine.
The best-fit spectrum obtained from the two-layermodel is presented in Fig. 6 (bottom). The two-layermodel could reproduce the intensity, the strong self-absorption dips and asymmetry of the observed spec-trum quite well. The line wings may stem from out-flowing gas, or also be due to a more complex velocityprofile not incorporated in the model. The importantoutcome of this model can be summarised as follows:
First, the strong self-absorption in the line profiles canbe reproduced by the high-density core together with thelow-density envelope. Second, the asymmetry of the lineprofiles can be explained by the infalling envelope (wegot venv
rad = −0.14km s−1), given the relatively high tur-bulent velocities in the core (vcore
turb = 1.7 km s−1) and inthe envelope (venv
turb = 0.5km s−1). However, this config-uration is not the only way to fit the line asymmetries.In particular, we were able to reproduce the line asym-metries by the combination of an expanding core and astatic envelope because of the similar relative velocities.We consider this scenario implausible, though, becauseof the short outflow timescales.
Finally, we stress that the considered simple modelsdid not reliably constrain the other parameters of thecores, but they illustrated that the observed spectra canindeed be explained theoretically. In order to get morereliable information about the core properties one hasto consider a set of molecular lines and transitions to-gether with more physical models of the source. Unfor-tunately, the available data, in particular the HCO+(1-0)measurements, are not sufficient to enable this. Indeed,if we used HCO+(1-0) in addition to HCN(1-0) in ourfitting routine, we would have to incorporate two moreparameters for the HCO+ abundance (in the core andin the envelope), while HCO+(1-0) alone will not allowus to further constrain the excitation conditions. Forthe latter, at least a few more transitions of HCO+ orits isotopomers were necessary. On the other hand, amore physical model of the core (e.g. with smooth dis-tributions) has more parameters to fit which makes sucha model even more uncertain. Thus, the usage of moresophisticated models is required when detailed spectralmaps of the sources are available.
4.3.3. Collapse of SMM1 South
The modelling of the HCN emission showed that thespectrum of SMM1 South can be explained with a col-lapse of the core. From the resulting velocity we cal-culated estimates for the mass infall rate using dM/dt≈ M/t = M vin/r. For SMM1 South, vin = 0.14km s−1
is the regular velocity of the envelope in the two-layermodel. Together with the mass and radius from Table 1this gave an infall rate of 3× 10⁻⁵ M⊙ yr−1. This is con-sistent with the mass outflow rates, but is only a crudeestimate.
4.3.4. Internal turbulence
Additional parameters we obtained from the HCNemission are the internal turbulent velocities of the coresthat reproduced the observed line widths. However, inboth cases rotational motions, more complex velocityprofiles, and also outflows may contribute to the linewidths. Such effects were not considered in our mod-els. In the case of SMM1 South, the fitted model showsa very turbulent core and less turbulence in the enve-lope. When compared to the isothermal sound speed ofaround 0.2 km s−1 for cold cores (T ≈ 20K), the core tur-bulence of 1.7 km s−1 is highly supersonic. The turbulentvelocity in the envelope of 0.5 km s−1 is on the scale ofthe sound speed but still in the supersonic regime. TheSMM1 North HCN spectrum indicates a more quiescentstate of this core. The linewidths are reproduced with a
12 Hennemann et al.
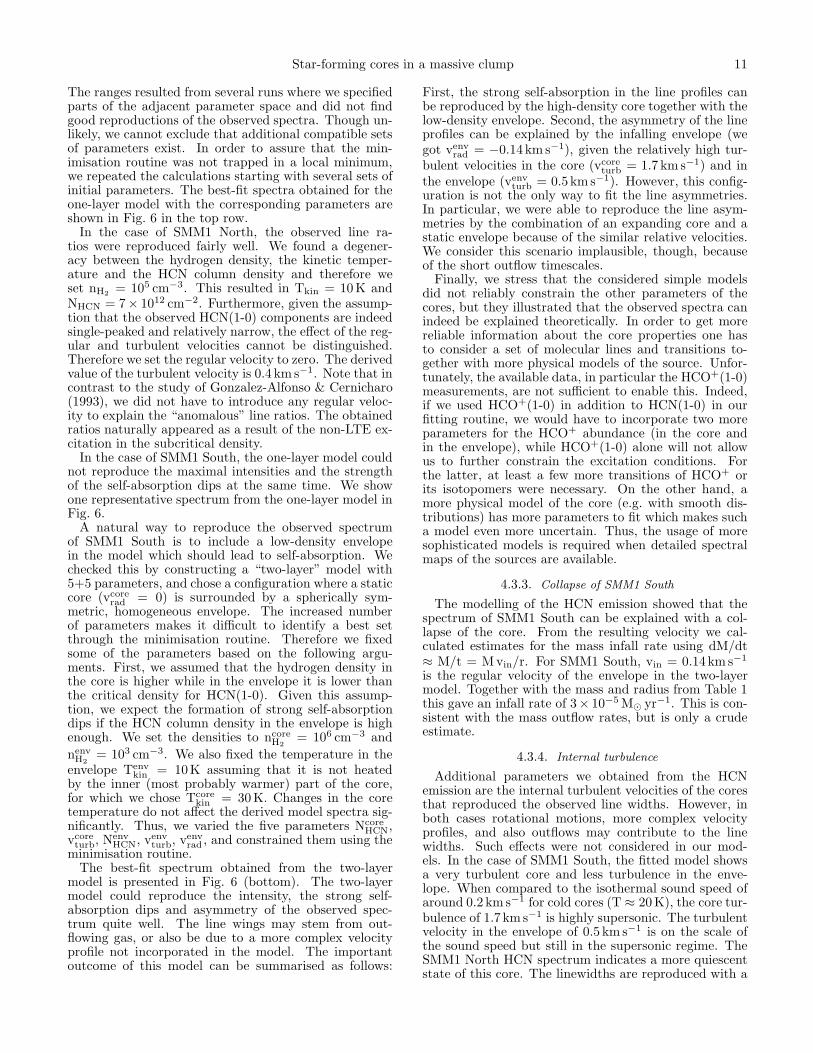
TABLE 3Parameter ranges used in the HCN(1-0)
emission modelling for the one-layer andtwo-layer models.
One-layer ModelParameter SMM1 North SMM1 South
nH2(cm−3) 105 103 . . . 105
Tkin (K) 10 . . . 50 10 . . . 50NHCN (cm−2) 1012 . . . 1015 1013 . . . 1015
vturb (km s−1) 0 . . . 1.0 0 . . . 1.0vrad (km s−1) 0 −0.25 . . . 0
Two-layer Model for SMM1 SouthParameter Core Envelope
nH2(cm−3) 106 103
Tkin (K) 30 10NHCN (cm−2) 1013 . . . 1015 1013 . . . 1015
vturb (km s−1) 0 . . . 3.0 0 . . . 1.0vrad (km s−1) 0 −1 . . . 1
Fig. 6.— Model illustration, observed and modelled HCN(1-0) spectra towards the two SMM1 cores. In the top row, the one-layer modelis illustrated and the resulting best fit spectra (red curves) are shown with the corresponding model parameters. The bottom row showsthe two-layer model and the resulting best fit of the SMM1 South spectrum (red curve) as well as the corresponding model parameters.Parameters that have been fixed are marked with a preceding asterisk (*).
Star-forming cores in a massive clump 13
turbulent velocity of 0.4 km s−1.
5. SUMMARY AND CONCLUSIONS
We have investigated the onset of star formation inthe massive cold clump ISOSS J18364-0221 SMM1. Thederived results regarding the clump fragmentation, thecore and outflow properties, and the collapse indicationsare summarises as follows:
1. Two compact, embedded cores are the only objectswe identified. Thus, this clump shows little frag-mentation, but seems to rather produce a low num-ber of compact objects.
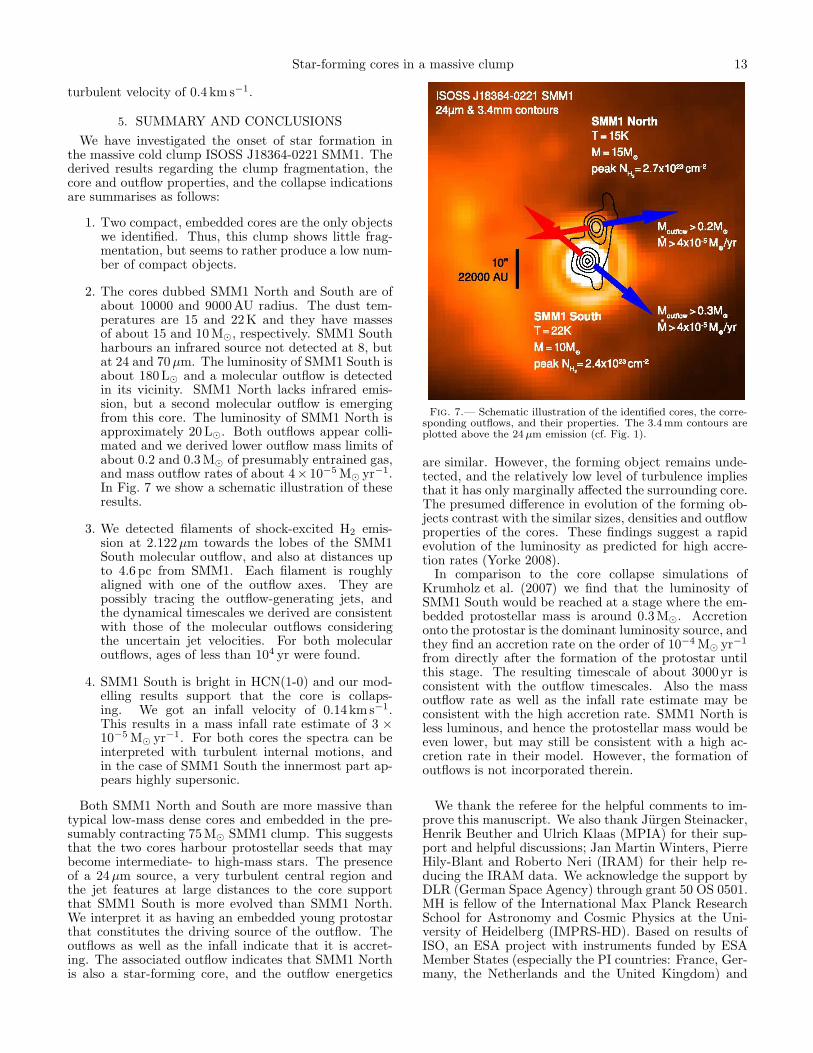
2. The cores dubbed SMM1 North and South are ofabout 10000 and 9000AU radius. The dust tem-peratures are 15 and 22K and they have massesof about 15 and 10M⊙, respectively. SMM1 Southharbours an infrared source not detected at 8, butat 24 and 70µm. The luminosity of SMM1 South isabout 180L⊙ and a molecular outflow is detectedin its vicinity. SMM1 North lacks infrared emis-sion, but a second molecular outflow is emergingfrom this core. The luminosity of SMM1 North isapproximately 20L⊙. Both outflows appear colli-mated and we derived lower outflow mass limits ofabout 0.2 and 0.3M⊙ of presumably entrained gas,and mass outflow rates of about 4× 10⁻⁵ M⊙ yr−1.In Fig. 7 we show a schematic illustration of theseresults.
3. We detected filaments of shock-excited H2 emis-sion at 2.122µm towards the lobes of the SMM1South molecular outflow, and also at distances upto 4.6 pc from SMM1. Each filament is roughlyaligned with one of the outflow axes. They arepossibly tracing the outflow-generating jets, andthe dynamical timescales we derived are consistentwith those of the molecular outflows consideringthe uncertain jet velocities. For both molecularoutflows, ages of less than 104 yr were found.
4. SMM1 South is bright in HCN(1-0) and our mod-elling results support that the core is collaps-ing. We got an infall velocity of 0.14 km s−1.This results in a mass infall rate estimate of 3 ×10⁻⁵ M⊙ yr−1. For both cores the spectra can beinterpreted with turbulent internal motions, andin the case of SMM1 South the innermost part ap-pears highly supersonic.
Both SMM1 North and South are more massive thantypical low-mass dense cores and embedded in the pre-sumably contracting 75M⊙ SMM1 clump. This suggeststhat the two cores harbour protostellar seeds that maybecome intermediate- to high-mass stars. The presenceof a 24µm source, a very turbulent central region andthe jet features at large distances to the core supportthat SMM1 South is more evolved than SMM1 North.We interpret it as having an embedded young protostarthat constitutes the driving source of the outflow. Theoutflows as well as the infall indicate that it is accret-ing. The associated outflow indicates that SMM1 Northis also a star-forming core, and the outflow energetics
Fig. 7.— Schematic illustration of the identified cores, the corre-sponding outflows, and their properties. The 3.4mm contours areplotted above the 24 µm emission (cf. Fig. 1).
are similar. However, the forming object remains unde-tected, and the relatively low level of turbulence impliesthat it has only marginally affected the surrounding core.The presumed difference in evolution of the forming ob-jects contrast with the similar sizes, densities and outflowproperties of the cores. These findings suggest a rapidevolution of the luminosity as predicted for high accre-tion rates (Yorke 2008).
In comparison to the core collapse simulations ofKrumholz et al. (2007) we find that the luminosity ofSMM1 South would be reached at a stage where the em-bedded protostellar mass is around 0.3M⊙. Accretiononto the protostar is the dominant luminosity source, andthey find an accretion rate on the order of 10−4 M⊙ yr−1
from directly after the formation of the protostar untilthis stage. The resulting timescale of about 3000yr isconsistent with the outflow timescales. Also the massoutflow rate as well as the infall rate estimate may beconsistent with the high accretion rate. SMM1 North isless luminous, and hence the protostellar mass would beeven lower, but may still be consistent with a high ac-cretion rate in their model. However, the formation ofoutflows is not incorporated therein.
We thank the referee for the helpful comments to im-prove this manuscript. We also thank Jurgen Steinacker,Henrik Beuther and Ulrich Klaas (MPIA) for their sup-port and helpful discussions; Jan Martin Winters, PierreHily-Blant and Roberto Neri (IRAM) for their help re-ducing the IRAM data. We acknowledge the support byDLR (German Space Agency) through grant 50 OS 0501.MH is fellow of the International Max Planck ResearchSchool for Astronomy and Cosmic Physics at the Uni-versity of Heidelberg (IMPRS-HD). Based on results ofISO, an ESA project with instruments funded by ESAMember States (especially the PI countries: France, Ger-many, the Netherlands and the United Kingdom) and
14 Hennemann et al.
with participation of ISAS and NASA. The ISOSS wassupported by funds from DLR. Based on observationscollected at the German-Spanish Astronomical Centre atCalar Alto, operated jointly by the Max-Planck-Institutfur Astronomie and the Instituto de Astrofısica de An-dalucıa (CSIC), on observations with the James-Clerk-Maxwell Telescope (JCMT), on observations made withthe Spitzer Space Telescope, which is operated by theJet Propulsion Laboratory, California Institute of Tech-nology under a contract with NASA, and on observationsat the IRAM 30m and the IRAM Plateau de Bure Inter-
ferometer. IRAM is supported by CNRS (France), MPG(Germany), and IGN (Spain). This publication makesuse of data products from the Two Micron All Sky Sur-vey, which is a joint project of the University of Mas-sachusetts and the IPAC/California Institute of Technol-ogy, funded by the NASA and the NSF, and made use ofNASA’s ADS Bibliographic Services.
Facilities: CAO:3.5m (Omega-2000), Spitzer (IRAC,MIPS), JCMT (SCUBA), IRAM:30m (VESPA,MAMBO-2), IRAM:Interferometer
REFERENCES
Andre, P., & Montmerle, T. 1994, ApJ, 420, 837Arce, H. G., & Sargent, A. I. 2006, ApJ, 646, 1070Bally, J. 2008, in ASP Conf. Ser. 387, Massive Star Formation:
Observations Confront Theory, ed. H. Beuther, H. Linz, &Th. Henning (San Francisco: ASP), 158
Banerjee, R., & Pudritz, R. E. 2007, ApJ, 660, 479Baumeister, H., Bizenberger, P., Bayler-Jones, C. A. L., Kovacs,
Z., Roser, H.-J., & Rohloff, R.-R. 2003, in Proc. SPIE 4841,Instrument Design and Performance for Optical/InfraredGround-based Telescopes, ed. M. Iye & A. F. M. Moorwood,343
Beuther, H., Linz, H., & Henning, Th., 2008, ASP Conf. Ser. 387,Massive Star Formation: Observations Confront Theory (SanFrancisco: ASP)
Beuther, H., Schilke, P., Gueth, F., McCaughrean, M., Andersen,M., Sridharan, T. K., & Menten, K. M. 2002a, A&A, 387, 931
Beuther, H., Schilke, P., Sridharan, T. K., Menten, K. M.,Walmsley, C. M., & Wyrowski, F. 2002b, A&A, 383, 892
Beuther, H., & Shepherd, D. 2005, Reprinted from Astrophysicsand Space Science Library 324, Cores to Clusters: StarFormation with Next Generation Telescopes, ed. M. S. N.Kumar, M. Tafalla, & P. Caselli (New York: Springer), 105
Beuther, H., & Steinacker, J. 2007, ApJ, 656, L85Birkmann, S. M., Krause, O., Hennemann, M., Henning, Th.,
Steinacker, J., & Lemke, D. 2007, A&A, 474, 883Birkmann, S. M., Krause, O., & Lemke, D. 2006, ApJ, 637, 380Bonnell, I. A., Clarke, C. J., & Bate, M. R. 2006, MNRAS, 368,
1296Cabrit, S., & Bertout, C. 1990, ApJ, 348, 530Choi, M., Evans, II, N. J., & Jaffe, D. T. 1993, ApJ, 417, 624di Francesco, J., Evans, II, N. J., Caselli, P., Myers, P. C.,
Shirley, Y., Aikawa, Y., & Tafalla, M. 2007, in Protostars andPlanets V, ed. B. Reipurth, D. Jewitt, & K. Keil (Tucson:Univ. Arizona Press), 17
Elias, J. H. 1980, ApJ, 241, 728Engelbracht, C. W. et al. 2007, PASP, 119, 994Fazio, G. G. et al. 2004, ApJS, 154, 10Gonzalez-Alfonso, E., & Cernicharo, J. 1993, A&A, 279, 506Gordon, K. D. et al. 2007, PASP, 119, 1019Hennemann, M., Birkmann, S. M., Krause, O., & Lemke, D.
2008, A&A, 485, 753Henning, Th., Lapinov, A., Schreyer, K., Stecklum, B., &
Zinchenko, I. 2000a, A&A, 364, 613Henning, Th., Schreyer, K., Launhardt, R., & Burkert, A. 2000b,
A&A, 353, 211Hosokawa, T., & Omukai, K. 2008, in ASP Conf. Ser. 387,
Massive Star Formation: Observations Confront Theory, ed.H. Beuther, H. Linz, & Th. Henning (San Francisco: ASP), 255
Jappsen, A.-K., Klessen, R. S., Larson, R. B., Li, Y., & Mac Low,M.-M. 2005, A&A, 435, 611
Jenness, T., & Economou, F. 1999, in ASP Conf. Ser. 172,Astronomical Data Analysis Software and Systems VIII, ed.D. M. Mehringer, R. L. Plante, & D. A. Roberts (SanFrancisco: ASP), 171
Jenness, T., & Lightfoot, J. F. 1998, in ASP Conf. Ser. 145,Astronomical Data Analysis Software and Systems VII, ed.R. Albrecht, R. N. Hook, & H. A. Bushouse (San Francisco:ASP), 216
Kirk, H., Johnstone, D., & Tafalla, M. 2007, ApJ, 668, 1042Krause, O. 2003, Ph.D. Thesis, Combined Faculties for the
Natural Sciences and for Mathematics of the Ruperto-CarolaUniversity of Heidelberg, Germany
Krause, O., Lemke, D., Toth, L. V., Klaas, U., Haas, M., Stickel,M., & Vavrek, R. 2003, A&A, 398, 1007
Krause, O., Vavrek, R., Birkmann, S., Klaas, U., Stickel, M.,Toth, L. V., & Lemke, D. 2004, BaltA, 13, 407
Krumholz, M. R. 2008, in ASP Conf. Ser. 387, Massive StarFormation: Observations Confront Theory, ed. H. Beuther,H. Linz, & Th. Henning (San Francisco: ASP), 200
Krumholz, M. R., Klein, R. I., & McKee, C. F. 2007, ApJ, 656,959
Krumholz, M. R., & McKee, C. F. 2008, Nature, 451, 1082Krumholz, M. R., McKee, C. F., & Klein, R. I. 2005, ApJ, 618,
L33Lemke, D. et al. 1996, A&A, 315, L64Low, F. J., Smith, P. S., Werner, M., Chen, C., Krause, V., Jura,
M., & Hines, D. C. 2005, ApJ, 631, 1170Makovoz, D., & Marleau, F. R. 2005, PASP, 117, 1113McKee, C. F., & Tan, J. C. 2003, ApJ, 585, 850Motte, F., Bontemps, S., Schilke, P., Schneider, N., Menten,
K. M., & Broguiere, D. 2007, A&A, 476, 1243Noriega-Crespo, A. et al. 2004, ApJS, 154, 352Ossenkopf, V., & Henning, Th. 1994, A&A, 291, 943Osterloh, M., Henning, Th., & Launhardt, R. 1997, ApJS, 110, 71Pavlyuchenkov, Ya., Wiebe, D., Shustov, B., Henning, Th.,
Launhardt, R., & Semenov, D. 2008, ApJ, in press(arXiv:0808.2375)
Pavlyuchenkov, Y. N., & Shustov, B. M. 2004, AstronomyReports, 48, 315
Press, W. H., Teukolsky, S. A., Vetterling, W. T., & Flannery,B. P. 1992, Numerical recipes in FORTRAN. The art ofscientific computing (2nd ed.; Cambridge: University Press)
Rathborne, J. M., Simon, R., & Jackson, J. M. 2007, ApJ, 662,1082
Reach, W. T. et al. 2005, PASP, 117, 978Redman, M. P., Khanzadyan, T., Loughnane, R. M., & Carolan,
P. B. 2008, in ASP Conf. Ser. 387, Massive Star Formation:Observations Confront Theory, ed. H. Beuther, H. Linz, &Th. Henning (San Francisco: ASP), 38
Reipurth, B., & Bally, J. 2001, ARA&A, 39, 403Rieke, G. H. et al. 2004, ApJS, 154, 25Sandell, G., & Weintraub, D. A. 2001, ApJS, 134, 115Sault, R. J., Teuben, P. J., & Wright, M. C. H. 1995, in ASP
Conf. Ser. 77, Astronomical Data Analysis Software andSystems IV, ed. R. A. Shaw, H. E. Payne, & J. J. E. Hayes(San Francisco: ASP), 433
Schoier, F. L., van der Tak, F. F. S., van Dishoeck, E. F., &Black, J. H. 2005, A&A, 432, 369
Smith, M. D., & Rosen, A. 2005, MNRAS, 357, 1370Stahler, S. W., & Palla, F. 2005, The Formation of Stars
(Weinheim: Wiley-VCH)Stickel, M., Krause, O., Klaas, U., & Lemke, D. 2007, A&A, 466,
1205Vorobyov, E. I., & Basu, S. 2006, ApJ, 650, 956Walmsley, C. M., Churchwell, E., Nash, A., & Fitzpatrick, E.
1982, ApJ, 258, L75Walsh, A. J., Myers, P. C., Di Francesco, J., Mohanty, S., Bourke,
T. L., Gutermuth, R., & Wilner, D. 2007, ApJ, 655, 958Ward-Thompson, D., Andre, P., Crutcher, R., Johnstone, D.,
Onishi, T., & Wilson, C. 2007, in Protostars and Planets V, ed.B. Reipurth, D. Jewitt, & K. Keil (Tucson: Univ. ArizonaPress), 33
Ward-Thompson, D., Motte, F., & Andre, P. 1999, MNRAS, 305,143
Werner, M. W. et al. 2004, ApJS, 154, 1Whitney, B. A., Kenyon, S. J., & Gomez, M. 1997, ApJ, 485, 703Wu, Y., Wei, Y., Zhao, M., Shi, Y., Yu, W., Qin, S., & Huang, M.
2004, A&A, 426, 503Yorke, H. W. 2008, presented at EPoS 2008: The Early Phase of
Star Formation – The future of the field, ed. J. Steinacker &A. Bacman (Ringberg Castle Rottach-Egern:Max-Planck-Gesellschaft),http://www.mpia-hd.mpg.de/homes/stein/EPoS2008/index.html

Star-forming cores in a massive clump 15
Yorke, H. W., & Bodenheimer, P. 2008, in ASP Conf. Ser. 387,Massive Star Formation: Observations Confront Theory, ed.H. Beuther, H. Linz, & Th. Henning (San Francisco: ASP), 189
Zhang, Q. 2005, in IAU Symp. 227, Massive Star Birth: ACrossroads of Astrophysics, ed. R. Cesaroni, M. Felli,E. Churchwell, & M. Walmsley (Cambridge: University Press),135
Zhang, Q., Sridharan, T. K., Hunter, T. R., Chen, Y., Beuther,H., & Wyrowski, F. 2007, A&A, 470, 269
Zinnecker, H., & Yorke, H. W. 2007, ARA&A, 45, 481