energetic basis of osmotolerence
TRANSCRIPT
J. theor. Biol. (1997) 189, 333–352
0022–5193/97/240333+20 $25.00/0/jt970522 7 1997 Academic Press Limited
The Energetic Basis of Osmotolerance in Plants: Physical Principles
V. S* C. N. M
Department of Biotechnology, University of Pune, Pune 411 007, India
(Received on 20 July 1995, Accepted in revised form on 2 July 1997)
The current impasse in breeding for osmotolerance in plants has deep-seated reasons. The theoreticalnature of the problem is not understood by the experimental biologists and agriculturists. Conversely,the diversity of the classes of responses that beset the experimenter are not anticipated by thetheoretician. The evidence is mounting in favor of a diffusive mechanism for control of growth by theosmolarity of the medium/soil for plants and microbes. We examined a series of models as a locus ofinteraction of osmolarity of the medium and the simulations revealed a vast spectrum of possiblebiological behaviors. Of these, the diffusive mechanism for control of velocity of respiratory enzymologywas most dominant. The osmotic phenomena were re-evaluated by systematizing the theory in termsof time dependent changes in the organism, as initial responses and subsequent regulatory responses.The theoretical work presented herein leads some novel experimental approaches to define the problemof limits to yield by methods not thus far employed in plant research.
7 1997 Academic Press Limited
1. Introduction
‘‘Breeding for drought resistance has been a consistenttheme for as long as I can remember and probably thegreatest source of wasted breeding effort in the wholefield of plant breeding’’
Arnon (1980)
Why do microbes and plants not thrive inmedia/environments of lower water potential i.e.,under conditions of salinity and drought? This is avery active area of research; surprisingly however,there has been no real progress either in ourunderstanding or in the practical development ofdrought resistant varieties. Since Arnon made thestatement quoted at the head of this paper, a verysubstantial international effort has been on inengineering genes that allow synthesis or accumu-lation of the so-called compatible osmolytes into cropplants (Flores & Galston, 1984; Turner, 1981; Casaset al., 1993, Tarczynski et al., 1993). This approachhowever, has had no success. In 1993, of the 565
environmental release permits issued for food plants,not one was for development of drought or salinetolerance (Beck & Ulrich, 1993). The technicalfeasibility for 24 of the most important crop traits wasconstructed in 1994; drought tolerance is rankedamong the technically most difficult (Kidd, 1994).
Due to the general failure in breeding for droughttolerance, the accumulation of compatible osmolyteshas become the premise on which almost all currentwork on osmotolerance rests. It is increasingly beingrecognized that insufficient evidence exists to impli-cate this as the sole or the primary mechanism forosmotolerance even in microbes (cf. Cayley et al.,1991, 1992). (i) The levels of the so-called compatibleosmolytes are not generally at levels sufficient toconfer osmotolerance. (ii) Osmolytes, such as glycerolhave also been implicated in osmotolerance (Ben-Amotz & Avron, 1973). Presence of high concen-trations of intracellular glycerol as seen in Dunaliella,cannot be explained by synthesis alone, unless, thesemembranes exhibit very low permeability to glyceroland/or exhibit high levels of uptake with correspond-ing increase in energy requirements. In the absence ofprecise measurements of reflection coefficients to*Author to whom correspondence should be addressed.
. . . 334
polyols including glycerol in the membranes (cf.Ben-Amotz & Avron, 1979; Brown & Edgley, 1979),the status of glycerol remains as an enigma (Avron,1986). Besides, it has been clearly demonstrated(Ben-Amotz & Avron, 1973) that ATP is an essentialrequirement for the accumulation of glycerol.Glycerol formation is completely inhibited in thepresence of the uncoupler, Carbonyl Cyanidep-Trifluoromethoxyphenylhydrazone (FCCP). Thisevidence strongly suggests that the primary responsein osmotolerance is energetic. (iii) A large number ofnaturally tolerant species or varieties do not show thepresence of osmolytes. (iv) In higher plants, it isdifficult to determine the cytosol concentration ofpolyols due to the contribution of vacuole to total cellvolume (Tarczynski et al., 1992). (v) The mechanismassumes that the osmolytes when they do accumulate,do so in the cytoplasm (Vreeland, 1987). Theestimates of internal osmolytes are increasingly beingmade using NMR which is not capable ofdistinguishing between intracellular and extracellularosmolytes (Tarczynski et al., 1992). The question isnot whether we can make tobacco survive better atsay 0.25 M NaCl as opposed to 0.15 M NaCl, whichindeed was what achieved by incorporation of themannitol pathway by genetic engineering (Tarczynskiet al., 1992, 1993). Casuarina and other mangroveswhich grow in salt water or Dunaliella which growsin sea water, speak of tolerance even to 1.0 M NaCland far above. The primary question is growth and itsosmotic dependence. And yet, the entire literature issingularly devoid of any critical reference to thesimilarities and distinctions between how well anorganism grows or yields, and how well it does sodespite osmolarity. Are these the same questions?
Due to the vast spectrum of biological behaviorsthat drought tolerance entails, the area lacks clarity.Technical difficulties and inherent complexity of thebiological response to drought, both, contribute tothe lack of progress in this area. The ability torecognize a primary osmotic response and moresignificantly, a primary and universal trait which is ameasure of this, is absent. Many of the prevailingnotions current in literature are difficult to compre-hend from first principles. Without a clear theoreticalunderstanding based on first principles, of whatconstitutes an osmotic response, ‘‘wasted effort’’ asArnon (1980) contends, will continue to be the rule inthis area of study. In this study therefore, we explicitlyaddress the following questions and attempt at asystematization of the required ideas based on newlines of evidence and reasoning: (i) what is theprimary osmotic response? (ii) what are the secondaryresponses and how are they confused with the
primary osmotic response? (iii) can one unequivocallydistinguish a secondary response from a primaryresponse? (iv) what are the energetic costs of droughtavoidance, drought tolerance, osmolyte accumulationetc., (v) what is the energetic relationship betweentolerance and growth or biomass productivity? Mostimportant, these theoretical formalisms could betranslated into criteria for the study of osmoticresponses and strategies for the development ofdrought resistant plants. We also present new resultsthat explore quantitative models that determine viathe route of energetics—what controls the ability ofan organism to penetrate the osmotic space, droughtor salinity? These results were prompted by studiesfrom our laboratory (Mathai et al., 1993; Mathai &Sitaramam, 1994) on the osmotic relationships inenergetics, which in turn permitted to define as here,the energetic basis of osmotic phenomena.
2. Effects of Osmotic Pressure on Biological Systems:Formalisms
What constitutes an osmotic response and whatlegitimately constitutes a compensatory/correctiveresponse? Time, surely, is critical, since correctiveresponses can only follow the initial stress response,a fact which has been exploited to define the natureof acclimatory/adaptive responses in the past(Sitaramam & Rao, 1977). Osmotic phenomena aregenerally considered in thermodynamic terms, inwhich the water potential is of paramount importance(Kedem & Katchalsky, 1958; Nobel, 1969; Schafer &Andreoli, 1986). It should be noted that inequilibrium thermodynamics, there are no variableswith dimensions of time in it. In a system ofirreversible processes in the near equilibrium zone,with adequate complexity by way of a number ofcompeting forces and events, it is mandatory that thechoice of causal forces be identified by a right choiceof time-scales appropriate for the mechanism(s). Inthe case of far from equilibrium processes, time scalesare indispensable markers in identifying the relevantforces and fluxes. In osmotic phenomena, a cleardistinction has to be made between the initial event,and the subsequent events that result from shifts inthe equilibrium states within the system, each ofwhich relax in a time constant of its own. At the veryoutset, it may be realized that water fluxes (i.e.,volume fluxes) are associated with a time constant ofa few milliseconds (Macey, 1984; Solomon, 1989;Zeidel et al., 1992), whereas, osmotic end-effects mayvary from this time-scale to even a life time! It is oftenconfusing to see in published literature an implicit orexplicit assumption that the prime mover for all
335
osmotic effects is the water potential. Indeed, it isfruitful to consider that the prime mover is theinternal energy that cannot be dissipated. It is thisresidual energy that elicits a series of responses eachin a time scale that is the result essentially of a shiftin some equilibrium state. We briefly recapitulate therelevant physics at two levels: firstly, within the framework of the primary osmotic response and secondly,the derived phenomena.
:
Osmotic methodology used in biology is largelyrestricted to the use of the basic Boyle-van’t Hoffrelationship (Nobel, 1969)
PV= nRT (1)
where P is the osmotic pressure, V, the volume, n, theinternal solute content, R, the gas constant and T, theabsolute temperature. P is defined here as internalosmotic pressure. DP would refer to Pint −Pext suchthat Pi qPo and is positive outwards to representexpansion. It follows that osmotic pressure andvolume have an inverse relationship such that thedependent variable, V, would vary linearly with 1/P.This formalism is observed more in default inpublished literature. The prime mover in any osmoticresponse tends to be relegated to water activity,volume (i.e., water content) being the most readilyunderstood response to osmotic stress. Non-idealosmotic responses are related to the form,
(P−P)(V−Vo)= nRT (2)
where (P−P) is the net pressure difference, P, thehydrostatic pressure (whose quantitative contributionis decided entirely due to the elastic recoil of thestretching membrane, it being zero in a structure withnear zero elastic coefficient) and Vo, the osmoticallyinactive dead space, while n, the internal solutecontent, is generally held to be invariant (Cook, 1967;Greinstein et al., 1984; Hempling et al., 1977).Exception proves to be the rule in each of thevariables/parameters. Hydrostatic pressure P avariable of importance in different cells, n generallyvariable in most cells and Vo, an excessively usedparameter in osmotic titrations of volume responses.Vo is known to arise due to anomalous water activitydue to presence of protein, though, the osmoticallyinactive water itself should be considered negligible(Freedman & Hoffman, 1979). Regardless of thenature of the experimental system studied, mostinvestigators in most areas of biology hardly deviatefrom the above equation in their methods of analysis.On the other hand, in erythrocyte literature, these
considerations have been given due importance andconcern.
We first consider the case of volume flux, whichclearly belongs to the realm of initial response ratherthan any corrective (regulatory) measure. The physicscan then be unambiguously defined and time-scales beunderstood in real dimensions. The pressure-volumeisotherm implies work done and hence energetics.
Energetics
It is clear that, while considering water fluxes acrossa semi-permeable membrane, as in biologicalmembranes, we need to consider the elastic energychanges therein explicitly. Given a vesicle with radius,r, the elastic energy on expansion to (r+ dr) is
Uel =4r2.DP.dr (3)
where DP is the (osmotic) pressure difference betweeninside and outside the vesicle. The elastic energy of asurface in turn relates to a compressibility modulus,R, given by
Uel =R(a− ao)2/2a (4)
where, a=4pr2. Typically we consider the averageinterfacial head-group area of a phospholipid of070Ä2 and R of approx. 100 dynes cm−1
(Israelachvili et al., 1980). The area of the vesicle, withn number of molecules each with the exposed area ofAH and with a mole occupancy at the surface fL,would be
ao =(AH.n)/fL (5)
and the mole fraction of lattice defects at the surface
fV =1− fL (6)
On combining these expressions, we obtain,
Uel =(aDP)2/8pR. (7)
The total energy of the system, i.e., membranes andits contents is
U=Uel +Usolution (8)
During osmotic swelling, Uel and Usolution vary such thatUsolution increases with volume. Herein is the primaryrelevance of water activity.
U=Uel + 4mH2O.NH20 +Smsolutes.Nsolutes5
+(TS−PV)solution (9)
mH20 being the chemical potential of water and Nrepresenting the number of (water) molecules. Each ofthese terms can change, the dominant contribution
. . . 336
being from the changes in the chemical potential ofwater. In that limited sense, we may consider wateractivity as the prime mover and the elastic changesand chemical potential of other species of solutes asthe consequences.
The change in the free energy of the system nowneeds to be defined. The dissipation function relatesto changes in the Gibbs’ free energy/potential as arate process such that,
F=−dG/dt (10)
since, P (pressure) and T (temperature) are constants.In a biological system, in which scalar reactions andvectorial transport processes are coupled, we haveshown the advantage in defining the dissipationfunction per unit volume (u=F/V) (Vaidhyanathan& Sitaramam, 1991).
The Gibb’s free energy,
G=Gsolution +Gmembrane (11)
the solution being a composite of all that it containssuch that
Gsolution = mH20.NH20 +Smsolutes.Nsolute (12)
which already incorporates the entropic term. On theother hand, ignoring the PV term for the membranewhich would be very small,
Gmembrane =Uel −TSmembrane (13)
The entropic term contributed by the membrane isinitially ignored. In a direct experiment that involvesmeasurement of water fluxes, say using fast kinetics,these are measurable. Volume, at time t,
V(t) =V(t=0) + (1− e− t/t).dV (14)
where, V(t=0) is the initial volume and t is therelaxation time associated with the water fluxes,resulting in a net increase of dV in the volumeasymptotically (Mlekoday et al., 1983). These can berelated to earlier expressions such that,
dV=(3P/2R)(3/4p)1/3V4/3(t=0) (15)
The dissipation function would thus relate to
u=[((aP)2/8pR+ zdV)/3t]/V(t) (16)
assuming that the process is nearly completed in atime-scale three times that of the time constant and z
is approximately d(mH2O.NH20)/dV, emphasizing therole of activity of water. At this level the second ordereffects may be ignored conveniently. The changes inthe internal energy are thus severely restricted by t
(typically in milliseconds), which decides the timeframe of events directly related to osmotic phenom-ena. Thus, one may define the primary osmotic
phenomena as those that occur within this time frame.It is in this scale that a clear osmotic pressure-volumerelationship as in eqn (1) may be expected to bereadily measured. As solute fluxes occur from withinto compensate for volume expansion by ridding theinterior of solutes, this would lead to a deviation(reduction) in the volume of the vesicle from theexpected. This deviation due to solute fluxes would beexpected to have a time constant larger than that ofwater fluxes. Successful measurements beyond thistime-scale of water fluxes could well be fortuitous,since, events such as solute fluxes could readily maskthe primary relationship of V vs. 1/P as measured.
However, the entropic term associated with Gmembrane
cannot be ignored. It means that an additive termexists for u in eqn (13). Can this be measured? Itsignifies the changes in the order of the membrane(Sitaramam, 1988; Sitaramam & Sarma, 1981) forwhich several techniques exist. Most importantamong them would be the presence of voids discussedbelow. These voids exhibit an interesting relationshipto osmotic pressure of nearly linear compression,which is conceptually consistent and is feasible froma measurement point of view.
Another major factor of importance is that thebiological systems are not dilute. It is well recognizedthat the so-called Vo would not correspond to the‘‘osmotic dead space’’ but, arises due to anomalousactivity of the highly concentrated solutions ofhemoglobin in erythrocytes (Freedman & Hoffman,1979). In fact, except at near isotonicity, the osmoticpressure-volume relationship may not correspond tothe Boyle-van’t Hoff relationship at all, controlled bythe limits of expansion and contraction due to thenon-ideal solutes within.
Elastic energy-dependent phenomena
Since the membrane expands and contractsconsequent to volume changes, the obvious source ofchange in free energy in the system resides in theelastic energy variations in osmotically challengedmembranes.
We will first consider the consequences of enhancedelastic energy of the membrane, which is competentto affect equilibria. The geometry of the bimolecularlipid bilayer with its amphipathic molecules does notreadily permit exposure of acyl chains to the bulkwater phase without some cost (Dill & Florey, 1981).The cost of exposure of acyl chains is the overridingfactor that really limits the enhancement of voids inthe bilayer (due to recoiling of the acyl chains),resulting in a variable surface tension, which isdirectly linked to the distribution of voids in acomplex manner. This directly embodies the change
337
in Smembrane. Osmotic equilibrium would be reachedwhile a measurement of a steady state change inelastic energy is made, as this is distinctly within therange of osmotic phenomena. The residual elasticenergy changes in the membrane, therefore, bemeasured either as variations in surface area e.g.,merocyanine 540, (Williamson et al., 1983) or as voidsusing anisotropy measurements of fluorescent probeswhich penetrate to various depths in the bilayer(Mathai & Sitaramam, 1994). We briefly discuss theseto highlight how the considerations have alreadydeviated far from water activity.
Elastic energy-mediated modulation of activity ofthe adenine nucleotide transporter reconstituted intoliposomes. The discussion thus far would indicate thatmerely because changes in an osmotic gradient isgenerated, there is no a priori reason why measuredchanges in activity must relate to water activity. Aclassic example of elastic energy changes affecting theactivity is that of the adenine nucleotide transporter.In the adenine nucleotide translocator reconstitutedliposomes as well as in native mitochondria(measured as the occluded latent ATPase activity,with external substrate of ATP), the activity wasinhibited on either side of isotonicity showing abiphasic profile in liposomes which were not lysed atthe tonicities tested (Sambasivarao et al., 1988). Since,the data did not conform to more traditional osmoticanalyses of transformations on P such as 1/P or Pper se, the elastic energy relationship was invoked toobtain a nonlinear operator with regard to P suchthat
Uel =R(a− ao)2/2a (17)
where a A (1/P)2/3. On plotting activity of thetransporter against a function,
f(E)=Uel/R= 4(1/P)2/3 − (1/Piso)2/352/(1/P)2/3 (18)
the activity was linearly inhibited in native mitochon-dria as well as in the reconstituted system in amutually indistinguishable manner in a comparablerange of osmotic gradient (Mathai et al., 1993). Asexpected of an osmotic response in a vesicle witha limiting membrane, the response exhibited adiscontinuity at a critical osmotic gradient. Since, thecatalytic rate constant,
kcat =(A/hso+A')e−D/kT (19)
where, D is the activation energy, hs, the solventviscosity, A, a function of the structural parametersthat characterize the potential energy profile, theexponent, o(0Q oR 1) relates to the attenuatinginfluence of the protein matrix on solvent (i.e.,lipid) viscosity and A', a residual viscosity-indepen-
dent parameter, empirically determined (Gavish &Werber, 1979). Since the velocity of enzyme ortransporter at non-limiting ligand concentrationswould be,
J= kcat.Et (20)
where Et is the active protein, variations in the activitycould arise either from variations in hs or fromvariations in D. Since the activation energy wouldarise from energy internal to the system under steadystate, it follows that,
D= f(Uel)= f(R(a− ao)2/2a). (21)
We should consider changes in elastic energy ratherthan the contributions from water and soluteactivities, since, the changes in the activity of theseproteins would be far in excess of what may be dueto other terms of energy. Thus, these experimentshave offered a unique distinction between the primaryrole of elastic energy, as opposed to osmotic pressure(i.e., solute effects alone). The choice of theunderlying mechanism rests on whether the activityfollowed a linear inhibition, as expected of increase indensity with increase in viscosity (vide infra), or,biphasic as expected of elastic energy changes. Thelatter was the case with the adenine nucleotidetranslocator, by no means universal for transporters.Thus, protein dynamics would have an intimaterelationship with the elastic forces that the proteinsare exposed to on osmotic stretch.
Elastic energy and surface charge-related phenom-ena. It is now clear that biological membranes exhibitcharge anisotropy, having net positive charge in theinterior and often net negative charge in the exterior.Thus, a charge gradient exists across the bilayer(Sitaramam et al., 1992; Sitaramam, 1997). Analysisof a large number of membrane proteins has revealedthat, the true variable is charge anisotropy dueto orientation of proteins, and the net membranecharge is positive inwards. More importantly, it wasclear, based on an evaluation of the variance of thecharges and the anisotropy thereof, that themembrane proteins would rather be different thantend to a common value of charge anisotropy. Chargeanisotropy has the significance in that the rateconstants of processes need to be corrected as,
K2 =K(12 a). (22)
Here, a is the asymmetry parameter which makes adirection-specific correction to the rate constant, K.Major consequences emerge from the existence ofcharge anisotropy. Firstly, the rate processes associ-ated with various catalytic activities emerge from anenthalpy-entropy compensation that embodies a
. . . 338
frequency factor, which remains without an empiricalfooting (Somogyi et al., 1984). If we consider thatthe protein exists in two geometric states, one ofelasto-mechanical (at constant surface charge densityand variable volume of the protein) and the other ofelectrostatic (constant volume and variable surfacecharge density) instabilities with relatively compar-able energy levels, the protein would oscillate betweenthese states giving rise to the above frequency factor.Secondly, the surface potential, f, at any point (R) onthe surface of the membrane modeled as electricdipole is given by the surface integral
f(R)= (1/4poo)gS
D(R')n(R').9'(1/bR−R'b)da' (23)
where oo is the dielectric constant, D(R')= s(R')d(R'),s(R'), being the local charge density and d(R'), thethickness of the membrane at location R'. The vectorn(R') is a unit outward normal to the membranesurface (S) on which the surface integral (of the dipolecontribution to the local potential at any given pointR) with respect to area, a', is computed. The surfacepotential would vary with the distribution andcontribution of each protein at the surface. Thecrucial point to remember is that of sidedness, i.e.,n(R') being outward normal which distinguishesinside from outside. Besides sidedness, the dipole isnot merely due to a charged surface, but also due tothe curvature of the vesicle, which decreases onosmotic expansion.
So far we have seen that water fluxes lead to volumefluxes, which in turn lead to compensatory changes insolute fluxes. The physical coupling between thesesecondary fluxes and the initial osmotic phenomenonis in the stretch sensitivity of the proteins. Theprimary sensor is the membrane itself. A cleardistinction could be made between the monotonicprimary osmotic (solute effect) and the biphasicelastic energy dependence, in specific experimentalsituations successfully. It is in this regard that the areaof osmobiology experiences a considerable differencein outlook from what is otherwise available inliterature.
For instance, it is important to note that these ideasare only superficially similar to the turgor mechan-isms proposed by Zimmermann and his co-workers(Coster et al., 1978; Zimmermann, 1978). Similaritiesexist to the extent that Zimmermann visualizeddevelopment of restoring forces by way of internalstrain following turgor pressure. He consideredexistence of an electrical field across the membranewhich is also coupled to membrane thickness by wayof electrostriction. Thus, he suggested that the turgor
pressure is sensed by an electromechanical com-pression. The similarity ends there, since, our studiesshow direct osmotic modulation of membraneproteins on osmotic stretch. The reconstitutionexperiments of the purified transporter indicate thelack of need to implicate metabolic transformations,such as protein phosphorylation, to account forturgor sensitivity. This brings to fore the all importantquestion, whether these are the causes or the effects.A major departure from Zimmermann’s approach,therefore, relates to his prediction that, the reactionsper se are likely to be affected. Because, the pressuresinvolved in modifying chemical reaction in condensedphases are too high, to be of relevance to sensing ofturgor pressure. Our studies on voids (Mathai et al.,1993) in membranes, based on the less publicizedfact of Bondi (1964), that hydrocarbon phases arecharacterized by a high content of voids, has put paidto speculations on the sources of turgor sensing.These results described below, are indicative of thedominant role of diffusion control, particularly, in themembrane phase. The role of electric and electrostaticinteractions are not denied by these considerations.These ideas help to establish the primacy of osmoticphenomena, and their consequent interactions explic-itly, at a physical as well as empirical levels.
-
In this domain, the system has already reached anequilibrium with regard to water/volume fluxes.Neither the internal nor the external solute contenthas changed. At larger osmotic fluxes, the internalconcentrations would suffer dilution, precisely deter-mined by the additional volume flux, leading to adecrease in activities. The notable exception would bein the case of excessive macromolecular crowding,wherein, one could visualize the possibility ofrestricted diffusion in highly viscous media. In thiscase alone, water influx would bring about decreasein the viscosity of the internal aqueous phase,facilitate diffusion and enhance the reaction velocities,increase fluidity etc.
In most cases wherein osmotic responsivity wasseen, this was defined as inhibition of activity in excessof what would be seen due to solute effect alone, asin a soluble enzyme. Thus the activity
J= Jmax −K P (24)
where K is an empirically determined coefficient,coupling activity to osmotic pressure (Sambasivarao& Sitaramam, 1983; Sitaramam, 1992). This uniforminhibition is distinctly different from the biphasicrelationship, obtained as in the case of modulation, byelastic energy/surface area considerations. It was
339
empirically seen that osmotic pressure uniformlyinhibited respiration in mitochondria and photosyn-thesis in chloroplasts (Mathai et al., 1993). It wassurprising to see that no complex in these structuresshowed osmotic inhibition, whereas, stretch acti-vation appeared only when the activity requiredpassage of electrons through the quinone-containingsegment. This led to the formalism that the voidsavailable in the bilayer for quinone diffusion would bethe rate limiting step and not any complex or even thequinone per se.
Voids in membranes: analyses based on influence ofosmotic pressure on catalysis of redox reactions
When we consider redox reactions involving adiffusible intermediate such as a quinone, we maydefine the overall velocity as a function of theoxidizing and reducing ends of the tandem processsuch that the observed overall rate (Kroger &Klingenberg, 1973; Heron et al., 1978)
Vobs =Vred.Vox/(Vred +Vox) (25)
Vobs =Vred.N/((Vred/Vox)+N) (26)
where N is the molar ratio of complex III (quinoneoxidase) to complex I (quinone reductase) or,
1/Vobs =(1/N)(1/(Vox[QT]))+1/(Vred[QT]) (27)
and [QT]=Q+QH2, i.e., the total quinone pool.Given,
1/Vobs =1/Vobskk +1/Vdiff; where Vobskk =Vobs (28)
Vdiff =(1/2)(D/DX.[QT]), (29)
where D=diffusion coefficient and DX is the meandistance between enzyme molecules and
1/DX= rN (30)
where, r is a proportionality factor (Cohen &Turnbull, 1959; Galla et al., 1979; Gutman, 1980; Liet al., 1986; O’Leary, 1987). If 1/DX= bP, where b
is a proportionality constant, then, N=(b/r)P.Finally,
1/Vobs =(1/P) (1/(b/r)) ((1/(Vox[QT]))
+((2/(rD[QT])))+1/(Vred[QT]) (31)
Considering that
D=(kT/f )(AF/AAL).e2g(AHC /AF (32)
and AAL =AHC +AF (where AAL, total area, AHC, hardcore area of lipid and AF, free area per lipid molecule,relating to the area available for the lipid and g is afactor sensitive to van der Waals forces acting
between lipid molecules). while 1/AF = aP2/3, where a
is the proportionality constant, it would mean that,
D=(kT/f )(AF/AAL).e−2g(AHC.ap2/3) (33)
where, k is the Boltzman constant, f is thetranslational frictional coefficient, which can beincorporated readily above in eqn (31) (Mathai et al.,1993).
These relationships reduce the problem of osmotol-erance to testable ideas otherwise not feasible, boththeoretically and experimentally. The key factorrelates to determining what makes the electrontransport (i.e., energy generation) resistant toosmolarity. Since major contender is D, diffusion perse, we have evaluated the effect of each of the relevantparameters in entirety as well by omitting eqn (33)and admitting only a fixed value for D.
The question of activation volumes
In the interpretation of osmotic profiles the slope,K , is amenable to a thermodynamic interpretation interms of volume changes. Any flux, J, represents anequilibrium process,
ln J/DP=−(DV/RT) (34)
where, J, is the activity of the process, DV, theactivation volume and R and T have the usualmeaning (Chong et al., 1985). It stands to reason thatany structure that differentially excludes solute asopposed to a solvent, would exhibit an osmoticgradient with consequent osmotic compression, asituation that would be true even of polymericproteins. Diffusion of these solutes/solvent is given by
D=ga
r*
D(r)P(r)dr (35)
where P(r) is the probability of finding a circularregion in the polymeric structure with a radiusbetween r and r+dr that is unoccupied, while r* isthe smallest hole into which the probe can diffuse.This P(r) would be energetically defined such that
P(r)= e(−W(r)/kT) (36)
where W(r) is the work required to create a hole ofradius r in the solvent. Activation volumes have beenmeasured for several processes in the mitochondrionand the chloroplast (Mathai et al., 1993; Pan et al.,1995). Interestingly, the activation volume is low forsoluble enzymes such as catalase, but not for enzymessuch as lactate dehydrogenase or Luciferin-luciferase.Compressibility of a large number of proteins hasbeen determined (Lee, 1983; Gekko & Hasegawa,1986) and it would be interesting to correlate these
. . . 340
diverse measurements to see, if these reflect the sameevents. Activation volume is best viewed as athermodynamic entity, wherein a mechanistic in-terpretation requires more direct lines of evidence.The advantage of this however is that, it can also bemeasured for complex processes in the absence ofmore direct lines of evidence, insofar as due care istaken in interpreting it. For instance, if two processesare in tandem and each is osmotically sensitive, thenone may indicate that their activation volumes wouldadd up. That is, the processes become more sensitivethan either alone. Plotting of activities in absoluteunits as well as in logarithmic scale would be nearlythe same, when we consider changes in the activitiesof small magnitudes. How ‘small’ can be decidedempirically using robust statistical methods.
Rand and co-workers (Rand et al., 1993), on theosmotic modulation of hexokinase activity suggestedthat, the activation volume reflects the number ofwater molecules solvating hexokinase. Their argu-ment is quite simple. The use of inert molecules likenon-electrolyte polymers to affect the osmoticallyavailable water was considered to justify therelationship of DG and water activity thus:
DG=−RT ln Kd + nRT ln (W)= constant (37)
where, nRT ln (W)=PDVW
so that
DVW =RT D ln Kd/DP=RT ln (Kod/Kp
d )/DP (38)
Here Kod and Kp
d are dissociation constants measuredat corresponding osmotic pressures. The authorsconcluded that a measure of the change in Kd withchange in osmotic pressure would give the changein volume of water that occurs on glucose binding.Here the water potential and changes thereof areconsidered as causal to change in the equilibriumstate. This interpretation is not without an alterna-tive. Voids exist even within proteins and areessentially measurable in a variety of ways includingcompressibility measurements, computational tech-niques and also probes similar to those used inmembranes. Long range interactions are seen to be ofparamount importance in proteins and even in theassignment of codons to amino acids in the geneticcode itself (Sitaramam, 1989). It is entirely conceiv-able that solutes at the surface of a protein polymercan affect its interior in a variety of ways. Thehydration shell of the protein would be in equilibriumwith that of the electrolytes and non-electrolytes inthe bulk solvent. The surface roughness of thepolymer with continuous motion of the loops, at thesurface and within, could be interfered with by solutes
in a given range of their molecular dimensions.Fluctuations in the protein could particularly play animportant role even as the mobility of the defectswithin the protein. A comparison of activationvolumes revealed that (cf. Mathai et al., 1993; Panet al., 1995) the membrane-mediated activities arenot really discontinuous or qualitatively differentfrom the soluble enzymes, and actually represent acontinuous spectrum of osmotic susceptibilities.Therefore, activation volume of hexokinase (Randet al., 1993) is not distinct phenomenologically fromthe ambit of electron transport in membranes; eventhe ferrrocyanide:methylviologen oxidoreduction ofthe chloroplast has low activation volume closer tosoluble proteins.
Thus, it is clear that the proximate force responsiblefor osmotic effects should be treated as an openquestion and that the methods of analyses should beequally open-minded. We may consider scaling thearguments upwards to explain the phenomenology ofenergetics of whole organisms, provided, we haveconvenient linear approximations/methodologies tohandle experimental data.
Variations in the internal solute content
Even at a cellular and organelle level, considerablefluctuations in volume occurs under the so-calledisotonic conditions. This would be possible only whenthe water fluxes accompany obligatorily solute fluxes.While changes in membrane structure is harder toevaluate using ionic solutes, conductance to non-elec-trolytes such as polyols would be more readilyinterpretable with regard to structural changes in thebilayer. Especially when the polyol is foreign to thecell/organelle (e.g., sucrose for mitochondria) changesin permeability indicate structural dynamics in themembrane leading to variations in the internal solutecontent (Sitaramam & Sarma, 1981).
In the relationship (P−P)V= nRT, the assump-tion is that n does not vary. However, n, indeed variesdepending on the molecular mass of the solute and thephysical state of the membrane. A given solute maybe small enough to permeate readily through thepolymeric matrix of the membrane and thereby givevaluable information on the nature of porosity of themembrane. Such a porous membrane, as biologicalmembranes are, has a very acute cut-off for solutes(Stein & Lieb, 1986), an information which can bequantitatively used to assess the equivalent poreradius of membranes. However, it may not bepossible to assess permeability to each solute in allexperimental situations. Therefore, one may use Ki.e., the stretch sensitivity of the biological system/
341
polymer as an excellent proxy variable to assess theporosity of membranes (cf. Kulkarni et al., 1996).
The caution expressed regarding the interpretationof activation volume is equally applicable in theinterpretation of the empirical K . It encompasses thevolume-sensitive domain as well as the compactiondomain of the osmotic response of a vesicle, each ofwhich however will yield a different activation volume(larger for volume changes and smaller for com-paction). The distinction is often possible and reliable,when each of these are measured simultaneously.
Ionic effects vs. osmotic effects: ground rules fordistinction
The question persists as what are ionic effects andwhat are osmotic effects. In simpler systems such aserythrocytes, the distinction is easy to make. Forinstance, if we perform an osmotic titration and if thecritical response (such as a break-point for thatactivity) occurs at nearly half the concentration inNaCl media compared with sucrose media, clearly,this emerges from an osmotic effect. Is there anadditional effect of ionic strength? This is a testablequestion. The ionic strength effect occur due to fixed,net charges on the matrix, membrane proteins or themembrane itself. Net charge, of necessity, would beanionic or cationic. The distinction can be achievedby doing titration with an ionic series of salts. If theeffective concentration of the external ion requiredincreases with decrease in valence of the ion, thecharge would be due to its counter ion and the effectis ionic. Clearly, the effective concentration decreasesby an order of magnitude, if the valence increases byone extra charge. The osmotic effects and ionic effectsare usually separated by an order of magnitude suchthat, the ionic screening effects are completed by say10 mM, whereas, the isotonic concentrations wouldbe of the order of 150 mM of NaCl in the erythrocytes(Sitaramam, 1988).
Ionic effects are also sometimes given molecularspecificity with regard to the nature of the ion. Twoeffects must be distinguished here. An ion interactswith the binding site either via a specific affinity whichvaries for each ion and each site, or, it simply interactsvia a space filling mechanism, solely dependent onits hydration shell diameter. The smaller ion wouldhave a larger hydration shell. Based on these bindingisotherms and hydration shell diameters of the ionicseries of same valency, one can determine the rank ofpreference, termed the Eisenman series (Diamond &Wright, 1969). For instance each ionophore has aparticular Eisenman series of preference, which isdifferent from the rank of hydration shell diameter.For the monovalent cations, ranking in the Eisenman
series would be LiqNaqKqRbqCs (series XI),whereas the Eisenman series for valinomycin wouldbe RbqKqCs�Na�Li (series III, based onbinding isotherm). Such series have been visualizedfor other ionic series as well. Thus, we can distinguishion specific effects from hydration shell effects as wellas valence effects by careful experimentation.Comparison with non-electrolytes would help identifythe primary osmotic effects.
More difficult effects are due to mobile charges,which includes transport as well as membranepotential and related effects. Generally, membranepotential and pH changes are not affected by osmoticpressure and it would be possible to compare the ioniceffects with non-ionic effects. The major problem inthese studies is not so much as to what is the effectbut how to exclude a possible multifaceted effect.
The theoretical treatment of osmotic phenomena isfurther complicated when these concepts are appliedto breeding programs for drought tolerance. It isnecessary to explicitly understand both yield andosmotolerance. Any possibility of improvement ofeither, primarily depends on a clear definition of thephenotype. It is thus critical to consider thethermodynamics of growth.
We may consider the basic equation of biologicalgrowth as
1Grespiration = 1Ggrowth + 1Gmaintenance (39)
Since each represents a process which is osmoticallysensitive, it follows that
1Grespiration = 1Grespiration (max) −K respiration P (40)
1Ggrowth = 1Ggrowth (max) −K growth P (41)
1Gmaintenance = 1Gmaintenance (max) 2K maintenance P (42)
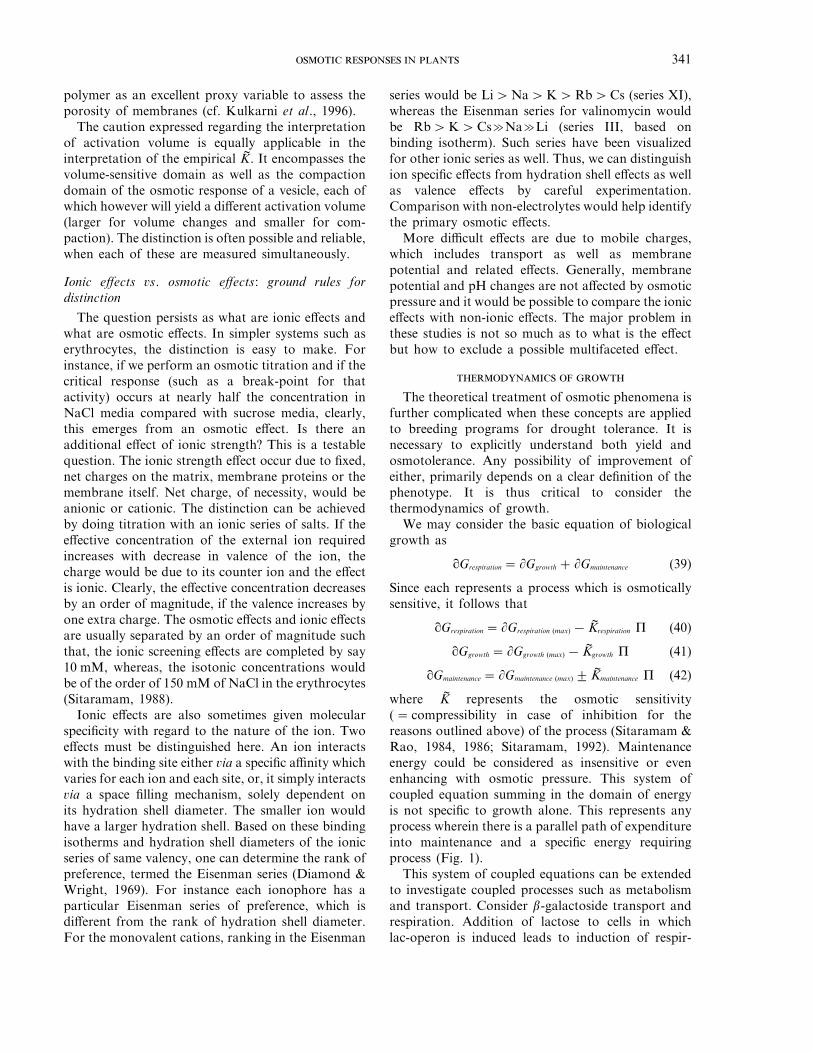
where K represents the osmotic sensitivity(=compressibility in case of inhibition for thereasons outlined above) of the process (Sitaramam &Rao, 1984, 1986; Sitaramam, 1992). Maintenanceenergy could be considered as insensitive or evenenhancing with osmotic pressure. This system ofcoupled equation summing in the domain of energyis not specific to growth alone. This represents anyprocess wherein there is a parallel path of expenditureinto maintenance and a specific energy requiringprocess (Fig. 1).
This system of coupled equations can be extendedto investigate coupled processes such as metabolismand transport. Consider b-galactoside transport andrespiration. Addition of lactose to cells in whichlac-operon is induced leads to induction of respir-
0 BPI growth
External osmotic pressure
En
erg
y fl
ux
0B.P.resp. 0 BP1
Res
pir
ati
on
0BP2
(a) (b)
∆Grespiration
∆Ggrowth
B
A
CC'
A'
∆Gmaintenance
. . . 342
F. 1. Energetics of osmotolerance. (a) Respiration and growthare inhibited by external osmotic pressure. Arrows indicate thebreak-points obtained in experimental data for the processes. Notethat aerobic growth ceases when maintenance energy equals theenergy due to respiration. (b) Break-points for susceptibility ofrespiration as the x-intercept of the determinant slope (BP2) or thepoint of interception of the determinant and non-determinantslopes (BP1).
where, A, is the substrate concentration, external, o,and internal, i, to the vesicle, JK and JT are the rateconstants (moles/time) of the occluded enzyme (suchas respiration) and the permease for the sugarrespectively (Bunow, 1980). Given the osmoticrelationship,
J= J(max) −K P= f(J) (48)
we may rewrite these in the osmotic domain as f(K)and f(P) as implicit expressions of above relationship.By a simple algebraic rearrangement,
f(JT)=Ao4 f (K).f(P)/( f (K)+ f (P))5 (49)
As a function of osmotic pressure, this wouldtypically yield a non-linear model for coupledrespiration. On the other hand, we may consider abranched model such that
Jox(total) = Jox(induced) + Jox(endogenous) (50)
which may be simplified to
JA = JB + JC (51)
Since, the net respiration is a sum of maximalrespiratory contribution from two independentprocesses of endogenous and glucose stimulatedactivities, each with its own osmotic sensitivity, wemay rewrite these as,
JA(max) −K aP= JB(max) −K bP+ JC(max) −K cP (52)
Therefore,
JA(max) = JB(max) + JC(max) (53)
and,
K aP=K bP+K cP (54)
Thus, in coupled respiration, determining thecompressibility coefficients for the induced andendogenous respiration would yield the hiddenvariable, K bP, or the specifically measured osmoticcompressibility of the induced respiration.
Thus, once a linear model is empirically verified, anumber of possibilities emerge that are measurable.Induced respiration, maintenance energy aremeasures which are not readily available by othermeans, whereas osmotic titrations offer a linear deviceto obtain these parameters in real systems.
If we consider a sphere with radius r with anexpansion of dr on application of external osmoticpressure P−DP (we measure osmotic pressure as adifference between the internal to the external, as a
ation. This was shown not to be due to lactose beinga metabolizable substrate for respiration, but, becauseof a respiratory control-like phenomenon. Specificquestions can be investigated using osmotic pressureas a probe. Let us first consider the stoichiometry ofb-galactoside transport. Since
Jox = Jox (max) −K ox P (43)
and Jgal = Jox.nwhere n is the stoichiometry of galactoside
transport to respiration,
Jgal = n (Jox(max) −K ox P) (44)
and
BP(break-point)= Jox(max)/K ox (45)
whether we consider transport or respiration (Sam-basivarao & Sitaramam, 1985; Sitaramam, 1989).Thus, if the stoichiometry is invariant as a functionof osmotic pressure, the break-point for osmoticinhibition of respiration and galactoside transportremain the same. On the other hand, a variablebreak-point would imply a variable stoichiometry.
If we consider the coupled processes of transportand respiration, we may initially consider them astandem processes
Ao : Ai : B (46)
The overall rate of an occluded enzyme within avesicle would be
JT = JKAo/(1+K/P) (47)
343
convention), the volume of the membrane mayremain constant or may vary. Since the volume of thelipid molecules per se would be invariant, any changein volume would relate to change in voids.
(1) As the zeroeth case, activities independent ofarea, thickness, voids and elastic forces should showno change due to the imposed osmotic gradients.Highly permeable species such as gases and waterpermeation (through the bilayer per se) may exhibitinsensitivity to the small changes in these parametersin a bilayer, hence unrelated to P.
(2) First, we consider the activities which relate tothe area, A, and thickness, g, of the membrane.According to Fick’s law of diffusion,
J= s.DC.A/g (55)
where, J, is the flux, DC, the concentration differenceof the species, A, the area and s, the permeabilitycoefficient. As the volume of the vesicle increases,the area would increase while the thicknessdecreases such that, considering the membranevolume constant, the change in thickness wouldbe,
dg3 g.(DP/R)(3Vo/4p)1/3 (56)
to the leading order in DP. Thus, when the activitysolely depends on thickness, it would increase linearlyas variations in P. It is difficult to visualize changesdue to thickness without the influence of area as in thecase of passive transport of water and othernon-electrolytes across a membrane. Departure fromthis expected behavior would be a measure of asuperimposed change in the resistance of themembrane for reasons including void formation.
(3) Second, membrane-independent activities thatare dependent on volume flux of the vesicles alonewould show a relationship to nRT/DP. Typically,fluorescence of a soluble probe such as car-boxyfluorescein at near quenching concentrationswould respond well to changes in volume (Scaletteret al., 1991).
(4) Third, the electrostatic potential of the chargedbilayer would vary as DP2/3 on expansion of thevesicle. Any activity, dependent on this potential,would naturally depend on powers of DP2/3. Surfacepotential probes such as 8-anilino-1-naphthalenesulfonic acid (ANS) would be expected to yield signalsthat relate to this (Radda & Vanderkooi, 1972; Slavik,1982).
(5) Fourth, presence of protein in a vesicle couldsignificantly affect the osmotic activity of water and,together with non-linear effects associated with limitsof compaction of the bilayer etc., there would be a
complex relationship between osmotic pressure andmeasured variables.
(6) It was empirically observed that a number ofrelationships such as activities of membrane-boundenzyme etc., exhibit a linear inhibition of activity withincrease in the osmoticum of the medium.
Choice of Methods of Analyses of OsmoticRelationships
Since there is no a priori reason why any measuredactivity should be confined to a particular relation-ship with osmotic pressure, there is much to besaid of a purely empirical approach to evaluation ofsuch analytical data. The problem is familiar toworkers in more mathematically oriented disciplinesand the approaches are primarily governed by threeconsiderations: (i) parsimony; (ii) statistics; (iii)utility.
Parsimony demands that we make do with thesimplest possible model. A polynomial is morecomplex than a linear relationship, since, the slope(tangent) of the response still depends on theindependent variable as in the case of a quadratic. Inbetween a simple linear relationship and a complexpolynomial, an alternative of intermediate complexityexists, the piece-wise linear approximation, betterknown as spline regression techniques. The statisticalconsiderations are many. First and foremost is that,the methodology should be objective and a goodmodel, after fitting to the experimental data, shouldyield residuals that are random without runs,indicating that the data is exhausted of patterns thatare unaccounted for. Second, linearizing transform-ations of the data should be avoided, or, wheninevitable, one should be cognizant of violatingconsequent biases in estimation as also inflated meansquare errors of the estimates. Last, the nullhypothesis should be clearly stated and should betestable. While spline techniques are conceptuallysimpler and satisfy the criterion of parsimony, it is byno means certain that the statistical requirements arereadily fulfilled by the existing techniques. In fact,confidence interval associated with the point ofintersection of two regression lines, fundamental tothe analyses of discontinuities in osmotic responses,remains a major hurdle in spline techniques. This wasaddressed to from our laboratory with a preliminaryanswer to the testing of whether two break-points aresimilar or different (Shanubhogue et al., 1992). Thedifficulty arises in this manner. To assign the datapoints to each line we require prior knowledge of theconfidence interval associated with the breakpoint,and, to determine the confidence interval associated
. . . 344
with each breakpoint we require the prior knowledgeof which data points are assigned to each line!
Arguments exist that osmotic responses would becurvilinear and not linear. The choice therefore restson how much variance can spline regressiontechniques can handle. If curvilinear, what order ofpolynomial need be chosen? If each response is to beanalysed differently, it imposes severe limitations onthe analyses of osmotic phenomena (Sambasivarao &Sitaramam, 1983; Sambasivarao et al., 1986). Thus,the question of analysis is to be laced withdemonstrable utility. This, indeed, is well recorded forerythrocyte lysis/volume curves in published litera-ture, wherein the break-points indicate materialproperties such as limits to elasticity/compression(Sambasivarao & Sitaramam, 1983; Sambasivaraoet al., 1986). The spline regression techniques alsoyielded the minimal possible residual sum of squaresin data analyses.
The break-points could represent material con-stants. The statistical theory based on Hudson’salgorithm and the computer program based onbootstrap techniques has already been published indetail (Shanubhogue et al., 1992). How useful thesebreak-points are depends on, how well these aremeasured and what physical realities these represent.Such piece-wise linear models could serve to definethe energetics of complex biological systems quiteelegantly.
Modeling of Osmotic Susceptibility of ElectronTransport as the Link between Voids and Activity Via
Compressibility
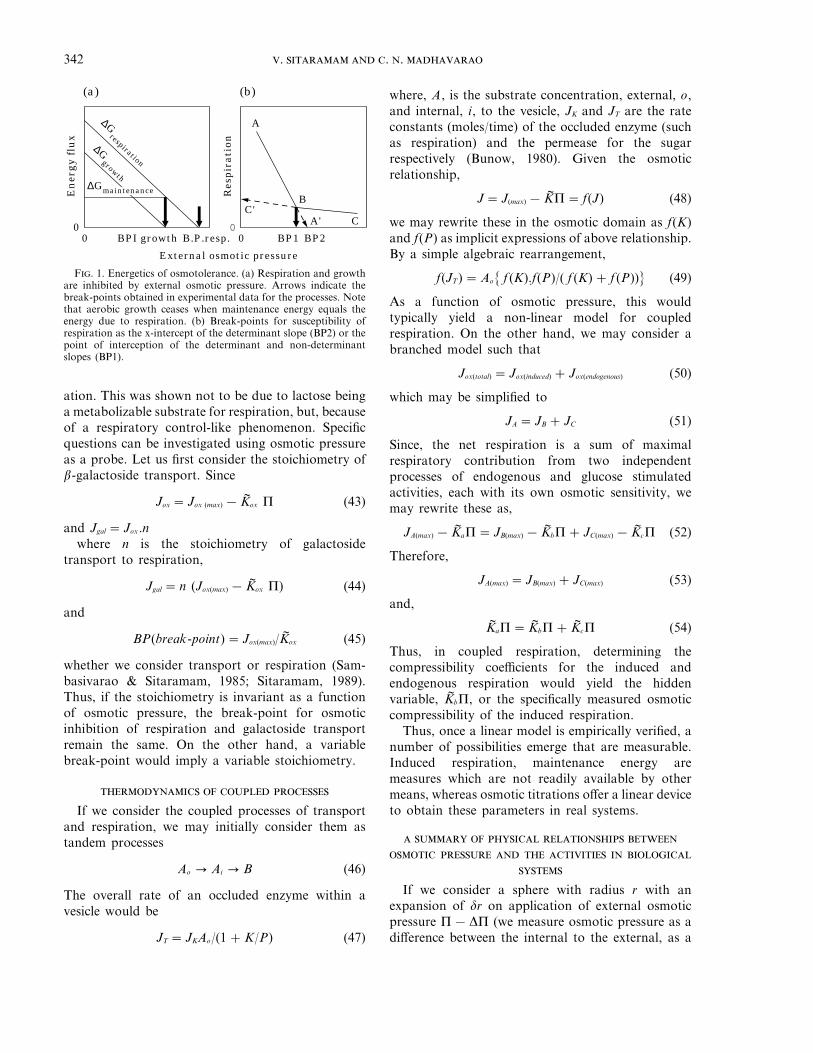
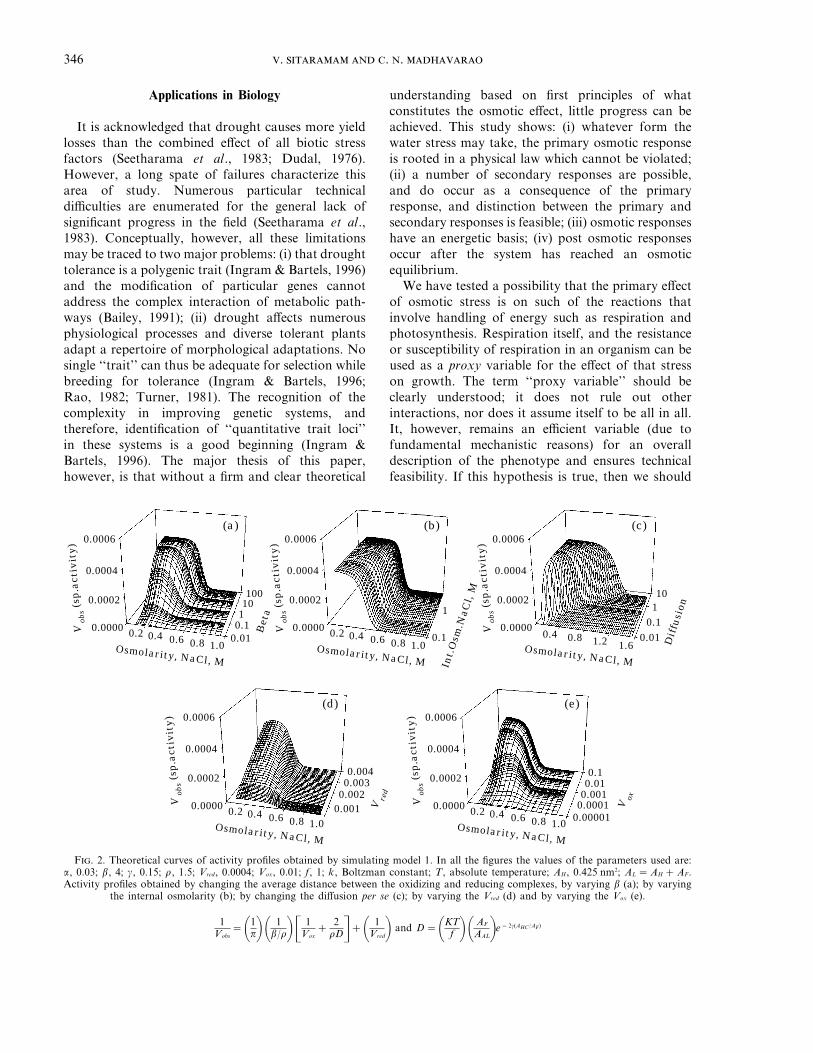
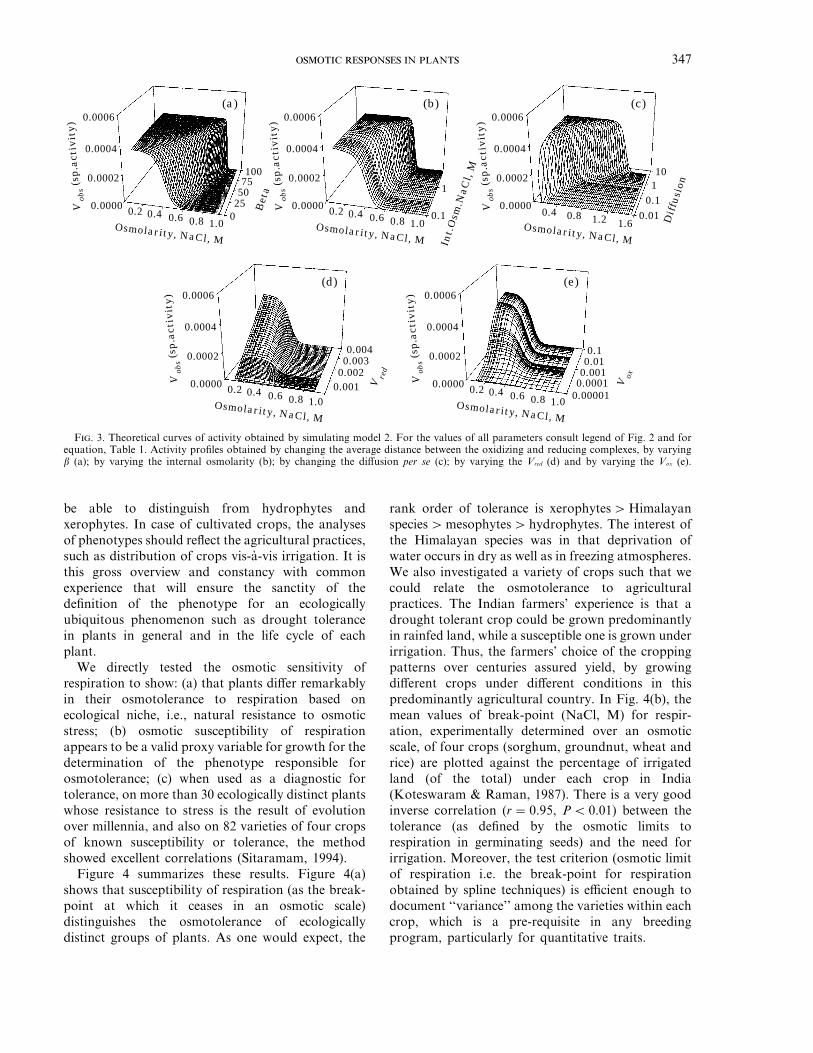
Electron transport involving redox reactions hasbasically three influencing components: (i) the meandistance between the oxidizing and reducing com-plexes; (ii) diffusion (of quinones) per se; and (iii)velocity of the reducing and the oxidizing complexes.Electron transport, therefore, is amenable formodeling through changes in these components. Theadditional parameters would be the internal solutecontent and the osmotic sensitivity of diffusion per se.Since the product of PV relates energy as the osmoticwork done, it would be possible to consider morecomplex relationships between volume and osmoticpressure. These are summarized in Table 1.
The investigations consisted of a series ofsimulations of Vobs vs. osmotic pressure for equationsdepicted in Table 1. Basically each simulationconsisted of varying one variable at a timenumerically. The results are depicted as representativefigures in Figs 2 and 3 as sets of five insets in each.In all instances, diffusion was kept independent of
osmotic pressure except in series C wherein diffusionwas allowed to vary as in eqn (31). Variations inactivity as variations in the Vobs with increasingosmolality were noted and summarized in Table 1.
The mean distance between the oxidizing andreducing complexes influences the observed activity ofthe electron transport (Vobs), depending on twoconstants, b and r, in addition to the externalpressure itself [eqn (28)]. Between these two constants,b changes the Vobs over the changing external osmoticpressure. Therefore, first, we investigated the differentrelationships between the external osmotic pressureand these two constants, purely empirically, in orderto change the Vobs with osmotic pressure. Thesesimulations confirmed that it is possible to change theVobs by changing b even though the amount ofmovement on the osmotic scale was significant onlywhen the P and b had an exponential relationship.
It was found that activity can be enhancedsignificantly, by changing the mean distance betweenthe complexes or the diffusion per se (cf. model 2). Inmodel 2, it is considered that the energy required tocompress a void is related as an exponential power ofthe external osmotic pressure and a proportionalityfactor. Therefore, the activity is not inhibited at lowosmolarities as the pressure is not sufficient tocompress the bilayer, to inhibit the diffusion ofquinones. Diffusion, D, is also varied by changing theinternal osmolarity which affects the free areaavailable per lipid. As the total membrane areaincreases with changing D, so does the free area perlipid; consequently the diffusion of quinones isincreased. Thus, when diffusion is increased, activityincreases as well as the profile shifts along theosmolarity scale, irrespective of how the meandistance is changed in different models. To avoidrepetition, Table 1 was made self-explanatory andcomprehensive while figs 2(a) to 3(e) illustrate someof the effects seen (figures omitted for brevity). In anearlier paper we have documented the theoreticalanticipation as well as experimental confirmation ofthe results on addition of cholesterol (which makesvoids disappear or diminish) to the mitochondrialinner membrane (Mathai & Sitaramam, 1994). Theseprofiles would serve a similar purpose of astandardized base for comparison of experimentaldata as a function of osmolarity.
These models also establish that the contribution ofinternal osmolarity towards decreasing the collapsi-bility of voids by changing the mean distance, andthereby decreasing the susceptibility of quinonediffusion, is not at all significant except in model 2.Therefore, internal osmolarity seems to have muchless effect on the activity profiles through suppressing
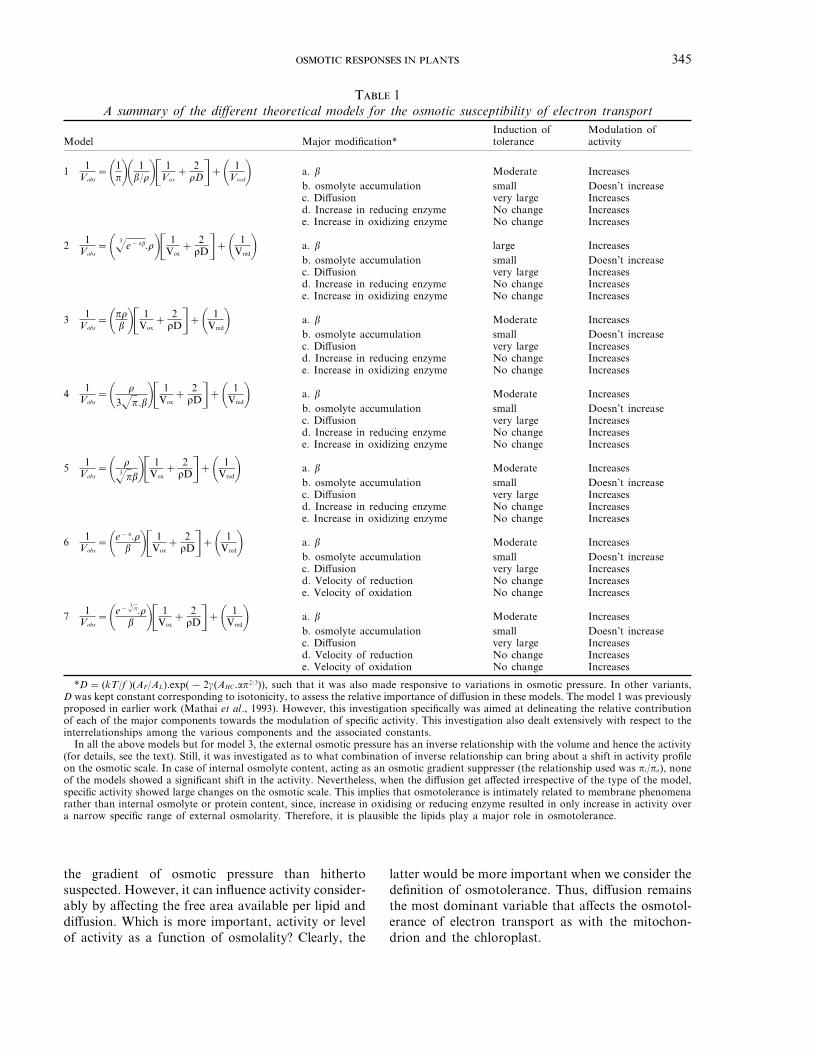
345
T 1A summary of the different theoretical models for the osmotic susceptibility of electron transport
Induction of Modulation ofModel Major modification* tolerance activity
1 1Vobs
=01p10 1b/r1$ 1
Vox+ 2
rD%+0 1Vred1 a. b Moderate Increases
b. osmolyte accumulation small Doesn’t increasec. Diffusion very large Increasesd. Increase in reducing enzyme No change Increasese. Increase in oxidizing enzyme No change Increases
2 1Vobs
=0 3ze− pb.r1$ 1Vox
+ 2rD%+0 1
Vred1 a. b large Increasesb. osmolyte accumulation small Doesn’t increasec. Diffusion very large Increasesd. Increase in reducing enzyme No change Increasese. Increase in oxidizing enzyme No change Increases
3 1Vobs
=0prb 1$ 1
Vox+ 2
rD%+0 1Vred1 a. b Moderate Increases
b. osmolyte accumulation small Doesn’t increasec. Diffusion very large Increasesd. Increase in reducing enzyme No change Increasese. Increase in oxidizing enzyme No change Increases
4 1Vobs
=0 r
3zp.b1$ 1Vox
+ 2rD%+0 1
Vred1 a. b Moderate Increasesb. osmolyte accumulation small Doesn’t increasec. Diffusion very large Increasesd. Increase in reducing enzyme No change Increasese. Increase in oxidizing enzyme No change Increases
5 1Vobs
=0 r3zpb1$ 1
Vox+ 2
rD%+0 1Vred1 a. b Moderate Increases
b. osmolyte accumulation small Doesn’t increasec. Diffusion very large Increasesd. Increase in reducing enzyme No change Increasese. Increase in oxidizing enzyme No change Increases
6 1Vobs
=0e− p.rb 1$ 1
Vox+ 2
rD%+0 1Vred1 a. b Moderate Increases
b. osmolyte accumulation small Doesn’t increasec. Diffusion very large Increasesd. Velocity of reduction No change Increasese. Velocity of oxidation No change Increases
7 1Vobs
=0e−3zp.rb 1$ 1
Vox+ 2
rD%+0 1Vred1 a. b Moderate Increases
b. osmolyte accumulation small Doesn’t increasec. Diffusion very large Increasesd. Velocity of reduction No change Increasese. Velocity of oxidation No change Increases
*D=(kT/f )(AF/AL).exp(−2g(AHC.ap2/3)), such that it was also made responsive to variations in osmotic pressure. In other variants,D was kept constant corresponding to isotonicity, to assess the relative importance of diffusion in these models. The model 1 was previouslyproposed in earlier work (Mathai et al., 1993). However, this investigation specifically was aimed at delineating the relative contributionof each of the major components towards the modulation of specific activity. This investigation also dealt extensively with respect to theinterrelationships among the various components and the associated constants.
In all the above models but for model 3, the external osmotic pressure has an inverse relationship with the volume and hence the activity(for details, see the text). Still, it was investigated as to what combination of inverse relationship can bring about a shift in activity profileon the osmotic scale. In case of internal osmolyte content, acting as an osmotic gradient suppresser (the relationship used was pi/po), noneof the models showed a significant shift in the activity. Nevertheless, when the diffusion get affected irrespective of the type of the model,specific activity showed large changes on the osmotic scale. This implies that osmotolerance is intimately related to membrane phenomenarather than internal osmolyte or protein content, since, increase in oxidising or reducing enzyme resulted in only increase in activity overa narrow specific range of external osmolarity. Therefore, it is plausible the lipids play a major role in osmotolerance.
the gradient of osmotic pressure than hithertosuspected. However, it can influence activity consider-ably by affecting the free area available per lipid anddiffusion. Which is more important, activity or levelof activity as a function of osmolality? Clearly, the
latter would be more important when we consider thedefinition of osmotolerance. Thus, diffusion remainsthe most dominant variable that affects the osmotol-erance of electron transport as with the mitochon-drion and the chloroplast.
0.8 1.0Osmolarity, NaCl, M
Bet
a
Vob
s (sp
.act
ivit
y)
Vob
s (sp
.act
ivit
y)
Vob
s (sp
.act
ivit
y)
Vob
s (sp
.act
ivit
y)
0.010.1110100
(a)
0.60.40.20.0000
0.0002
0.0004
0.0006
0.8 1.0Osmolarity, NaCl, M Int.
Osm
.NaC
l, M
0.1
1
(b)
0.60.40.20.0000
0.0002
0.0004
0.0006
0.8 1.0Osmolarity, NaCl, M
Vre
d
0.0010.0020.0030.004
(d)
0.60.40.20.0000
0.0002
0.0004
0.0006
Vob
s (sp
.act
ivit
y)
0.8 1.0Osmolarity, NaCl, M
Vox
0.00010.00001
0.0010.010.1
(e)
0.60.40.20.0000
0.0002
0.0004
0.0006
0.81.61.2
Osmolarity, NaCl, MD
iffu
sion
0.010.1
110
(c)
0.40.0000
0.0002
0.0004
0.0006
. . . 346
Applications in Biology
It is acknowledged that drought causes more yieldlosses than the combined effect of all biotic stressfactors (Seetharama et al., 1983; Dudal, 1976).However, a long spate of failures characterize thisarea of study. Numerous particular technicaldifficulties are enumerated for the general lack ofsignificant progress in the field (Seetharama et al.,1983). Conceptually, however, all these limitationsmay be traced to two major problems: (i) that droughttolerance is a polygenic trait (Ingram & Bartels, 1996)and the modification of particular genes cannotaddress the complex interaction of metabolic path-ways (Bailey, 1991); (ii) drought affects numerousphysiological processes and diverse tolerant plantsadapt a repertoire of morphological adaptations. Nosingle ‘‘trait’’ can thus be adequate for selection whilebreeding for tolerance (Ingram & Bartels, 1996;Rao, 1982; Turner, 1981). The recognition of thecomplexity in improving genetic systems, andtherefore, identification of ‘‘quantitative trait loci’’in these systems is a good beginning (Ingram &Bartels, 1996). The major thesis of this paper,however, is that without a firm and clear theoretical
understanding based on first principles of whatconstitutes the osmotic effect, little progress can beachieved. This study shows: (i) whatever form thewater stress may take, the primary osmotic responseis rooted in a physical law which cannot be violated;(ii) a number of secondary responses are possible,and do occur as a consequence of the primaryresponse, and distinction between the primary andsecondary responses is feasible; (iii) osmotic responseshave an energetic basis; (iv) post osmotic responsesoccur after the system has reached an osmoticequilibrium.
We have tested a possibility that the primary effectof osmotic stress is on such of the reactions thatinvolve handling of energy such as respiration andphotosynthesis. Respiration itself, and the resistanceor susceptibility of respiration in an organism can beused as a proxy variable for the effect of that stresson growth. The term ‘‘proxy variable’’ should beclearly understood; it does not rule out otherinteractions, nor does it assume itself to be all in all.It, however, remains an efficient variable (due tofundamental mechanistic reasons) for an overalldescription of the phenotype and ensures technicalfeasibility. If this hypothesis is true, then we should
F. 2. Theoretical curves of activity profiles obtained by simulating model 1. In all the figures the values of the parameters used are:a, 0.03; b, 4; g, 0.15; r, 1.5; Vred, 0.0004; Vox, 0.01; f, 1; k, Boltzman constant; T, absolute temperature; AH, 0.425 nm2; AL =AH +AF.Activity profiles obtained by changing the average distance between the oxidizing and reducing complexes, by varying b (a); by varying
the internal osmolarity (b); by changing the diffusion per se (c); by varying the Vred (d) and by varying the Vox (e).
1Vobs
=01p1 0 1b/r1 $ 1
Vox+ 2
rD%+0 1Vred1 and D=0KT
f 1 0 AF
AAL1e−2g(AHC /AF)
0.8 1.0Osmolarity, NaCl, M
Bet
a
Vob
s (sp
.act
ivit
y)
Vob
s (sp
.act
ivit
y)
Vob
s (sp
.act
ivit
y)
Vob
s (sp
.act
ivit
y)
0255075100
(a)
0.60.40.20.0000
0.0002
0.0004
0.0006
0.8 1.0Osmolarity, NaCl, M Int.
Osm
.NaC
l, M
0.1
1
(b)
0.60.40.20.0000
0.0002
0.0004
0.0006
0.8 1.0Osmolarity, NaCl, M
Vre
d0.0010.0020.0030.004
(d)
0.60.40.20.0000
0.0002
0.0004
0.0006
Vob
s (sp
.act
ivit
y)0.8 1.0Osmolarity, NaCl, M
Vox
0.00010.00001
0.0010.010.1
(e)
0.60.40.20.0000
0.0002
0.0004
0.0006
0.81.61.2
Osmolarity, NaCl, M
Dif
fusi
on
0.010.1
110
(c)
0.40.0000
0.0002
0.0004
0.0006
347
F. 3. Theoretical curves of activity obtained by simulating model 2. For the values of all parameters consult legend of Fig. 2 and forequation, Table 1. Activity profiles obtained by changing the average distance between the oxidizing and reducing complexes, by varyingb (a); by varying the internal osmolarity (b); by changing the diffusion per se (c); by varying the Vred (d) and by varying the Vox (e).
be able to distinguish from hydrophytes andxerophytes. In case of cultivated crops, the analysesof phenotypes should reflect the agricultural practices,such as distribution of crops vis-a-vis irrigation. It isthis gross overview and constancy with commonexperience that will ensure the sanctity of thedefinition of the phenotype for an ecologicallyubiquitous phenomenon such as drought tolerancein plants in general and in the life cycle of eachplant.
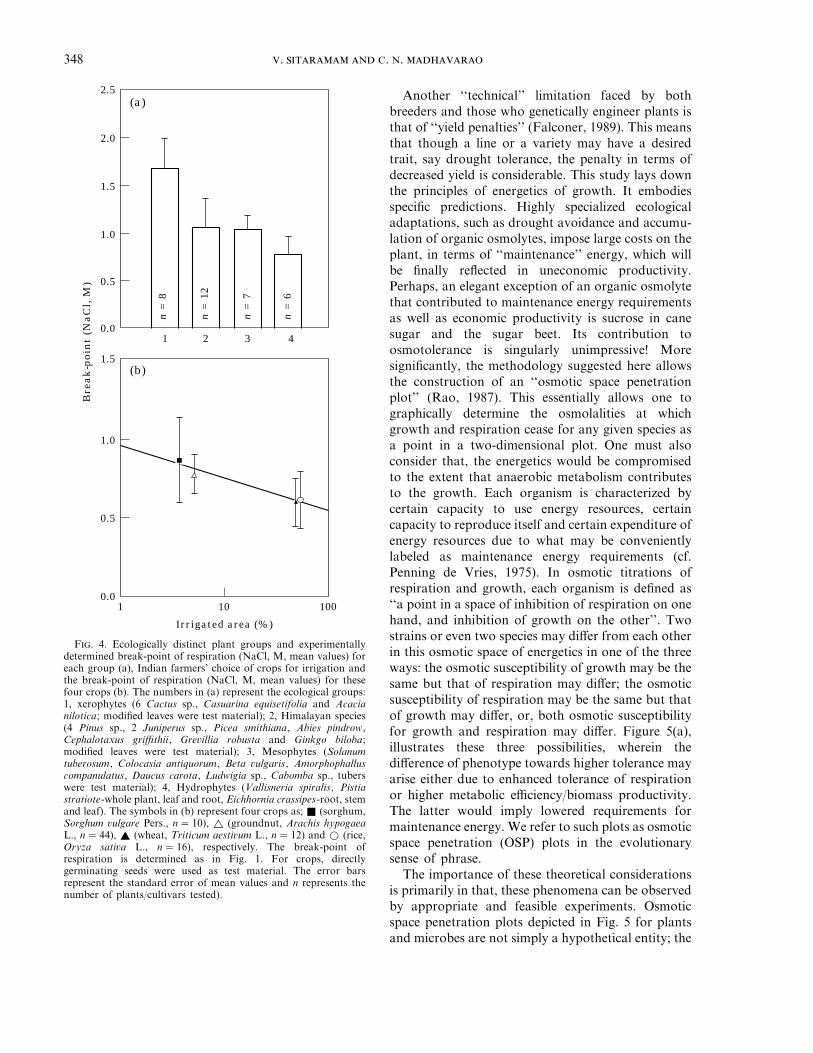
We directly tested the osmotic sensitivity ofrespiration to show: (a) that plants differ remarkablyin their osmotolerance to respiration based onecological niche, i.e., natural resistance to osmoticstress; (b) osmotic susceptibility of respirationappears to be a valid proxy variable for growth for thedetermination of the phenotype responsible forosmotolerance; (c) when used as a diagnostic fortolerance, on more than 30 ecologically distinct plantswhose resistance to stress is the result of evolutionover millennia, and also on 82 varieties of four cropsof known susceptibility or tolerance, the methodshowed excellent correlations (Sitaramam, 1994).
Figure 4 summarizes these results. Figure 4(a)shows that susceptibility of respiration (as the break-point at which it ceases in an osmotic scale)distinguishes the osmotolerance of ecologicallydistinct groups of plants. As one would expect, the
rank order of tolerance is xerophytesqHimalayanspeciesqmesophytesq hydrophytes. The interest ofthe Himalayan species was in that deprivation ofwater occurs in dry as well as in freezing atmospheres.We also investigated a variety of crops such that wecould relate the osmotolerance to agriculturalpractices. The Indian farmers’ experience is that adrought tolerant crop could be grown predominantlyin rainfed land, while a susceptible one is grown underirrigation. Thus, the farmers’ choice of the croppingpatterns over centuries assured yield, by growingdifferent crops under different conditions in thispredominantly agricultural country. In Fig. 4(b), themean values of break-point (NaCl, M) for respir-ation, experimentally determined over an osmoticscale, of four crops (sorghum, groundnut, wheat andrice) are plotted against the percentage of irrigatedland (of the total) under each crop in India(Koteswaram & Raman, 1987). There is a very goodinverse correlation (r=0.95, PQ 0.01) between thetolerance (as defined by the osmotic limits torespiration in germinating seeds) and the need forirrigation. Moreover, the test criterion (osmotic limitof respiration i.e. the break-point for respirationobtained by spline techniques) is efficient enough todocument ‘‘variance’’ among the varieties within eachcrop, which is a pre-requisite in any breedingprogram, particularly for quantitative traits.
1.5
0.5
0.010 100
Irrigated area (%)
Bre
ak
-po
int
(Na
Cl,
M)
1.0
1
0.5
0.04321
1.0
1.5
2.0
2.5
(b)
(a)
n =
8
n =
12
n =
7
n =
6
. . . 348
F. 4. Ecologically distinct plant groups and experimentallydetermined break-point of respiration (NaCl, M, mean values) foreach group (a), Indian farmers’ choice of crops for irrigation andthe break-point of respiration (NaCl, M, mean values) for thesefour crops (b). The numbers in (a) represent the ecological groups:1, xerophytes (6 Cactus sp., Casuarina equisetifolia and Acacianilotica; modified leaves were test material); 2, Himalayan species(4 Pinus sp., 2 Juniperus sp., Picea smithiana, Abies pindrow,Cephalotaxus griffithii, Grevillia robusta and Ginkgo biloba;modified leaves were test material); 3, Mesophytes (Solanumtuberosum, Colocasia antiquorum, Beta vulgaris, Amorphophalluscompanulatus, Daucus carota, Ludwigia sp., Cabomba sp., tuberswere test material); 4, Hydrophytes (Vallisneria spiralis, Pistiastratiote-whole plant, leaf and root, Eichhornia crassipes-root, stemand leaf). The symbols in (b) represent four crops as; Q (sorghum,Sorghum vulgare Pers., n=10), r (groundnut, Arachis hypogaeaL., n=44), R (wheat, Triticum aestivum L., n=12) and w (rice,Oryza sativa L., n=16), respectively. The break-point ofrespiration is determined as in Fig. 1. For crops, directlygerminating seeds were used as test material. The error barsrepresent the standard error of mean values and n represents thenumber of plants/cultivars tested).
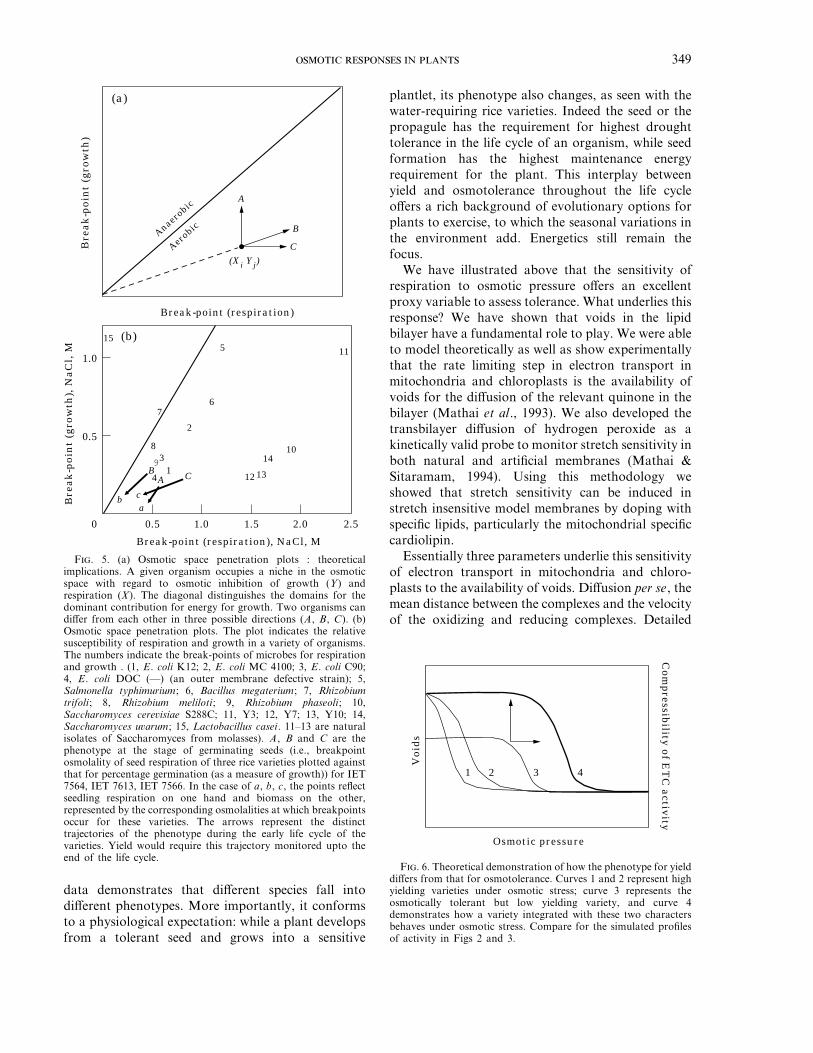
Another ‘‘technical’’ limitation faced by bothbreeders and those who genetically engineer plants isthat of ‘‘yield penalties’’ (Falconer, 1989). This meansthat though a line or a variety may have a desiredtrait, say drought tolerance, the penalty in terms ofdecreased yield is considerable. This study lays downthe principles of energetics of growth. It embodiesspecific predictions. Highly specialized ecologicaladaptations, such as drought avoidance and accumu-lation of organic osmolytes, impose large costs on theplant, in terms of ‘‘maintenance’’ energy, which willbe finally reflected in uneconomic productivity.Perhaps, an elegant exception of an organic osmolytethat contributed to maintenance energy requirementsas well as economic productivity is sucrose in canesugar and the sugar beet. Its contribution toosmotolerance is singularly unimpressive! Moresignificantly, the methodology suggested here allowsthe construction of an ‘‘osmotic space penetrationplot’’ (Rao, 1987). This essentially allows one tographically determine the osmolalities at whichgrowth and respiration cease for any given species asa point in a two-dimensional plot. One must alsoconsider that, the energetics would be compromisedto the extent that anaerobic metabolism contributesto the growth. Each organism is characterized bycertain capacity to use energy resources, certaincapacity to reproduce itself and certain expenditure ofenergy resources due to what may be convenientlylabeled as maintenance energy requirements (cf.Penning de Vries, 1975). In osmotic titrations ofrespiration and growth, each organism is defined as‘‘a point in a space of inhibition of respiration on onehand, and inhibition of growth on the other’’. Twostrains or even two species may differ from each otherin this osmotic space of energetics in one of the threeways: the osmotic susceptibility of growth may be thesame but that of respiration may differ; the osmoticsusceptibility of respiration may be the same but thatof growth may differ, or, both osmotic susceptibilityfor growth and respiration may differ. Figure 5(a),illustrates these three possibilities, wherein thedifference of phenotype towards higher tolerance mayarise either due to enhanced tolerance of respirationor higher metabolic efficiency/biomass productivity.The latter would imply lowered requirements formaintenance energy. We refer to such plots as osmoticspace penetration (OSP) plots in the evolutionarysense of phrase.
The importance of these theoretical considerationsis primarily in that, these phenomena can be observedby appropriate and feasible experiments. Osmoticspace penetration plots depicted in Fig. 5 for plantsand microbes are not simply a hypothetical entity; the
0.5
0 1.0 2.5
Break-point (respiration), NaCl, M
Bre
ak
-po
int
(gro
wth
), N
aC
l, M
1.5 2.00.5
1.0
Bre
ak
-po
int
(gro
wth
)
12 13
1410
6
2
7
83
19
4B
A
ab c
C
11515
(a)
(b)
C
B
A
(Xi Yj)Aero
bicAnaerobic
Break-point (respiration)
Osmotic pressure
Vo
ids
Co
mp
ressibility o
f ET
C a
ctivity
1 2 3 4
349
F. 5. (a) Osmotic space penetration plots : theoreticalimplications. A given organism occupies a niche in the osmoticspace with regard to osmotic inhibition of growth (Y) andrespiration (X). The diagonal distinguishes the domains for thedominant contribution for energy for growth. Two organisms candiffer from each other in three possible directions (A, B, C). (b)Osmotic space penetration plots. The plot indicates the relativesusceptibility of respiration and growth in a variety of organisms.The numbers indicate the break-points of microbes for respirationand growth . (1, E. coli K12; 2, E. coli MC 4100; 3, E. coli C90;4, E. coli DOC (—) (an outer membrane defective strain); 5,Salmonella typhimurium; 6, Bacillus megaterium; 7, Rhizobiumtrifoli; 8, Rhizobium meliloti; 9, Rhizobium phaseoli; 10,Saccharomyces cerevisiae S288C; 11, Y3; 12, Y7; 13, Y10; 14,Saccharomyces uvarum; 15, Lactobacillus casei. 11–13 are naturalisolates of Saccharomyces from molasses). A, B and C are thephenotype at the stage of germinating seeds (i.e., breakpointosmolality of seed respiration of three rice varieties plotted againstthat for percentage germination (as a measure of growth)) for IET7564, IET 7613, IET 7566. In the case of a, b, c, the points reflectseedling respiration on one hand and biomass on the other,represented by the corresponding osmolalities at which breakpointsoccur for these varieties. The arrows represent the distincttrajectories of the phenotype during the early life cycle of thevarieties. Yield would require this trajectory monitored upto theend of the life cycle.
plantlet, its phenotype also changes, as seen with thewater-requiring rice varieties. Indeed the seed or thepropagule has the requirement for highest droughttolerance in the life cycle of an organism, while seedformation has the highest maintenance energyrequirement for the plant. This interplay betweenyield and osmotolerance throughout the life cycleoffers a rich background of evolutionary options forplants to exercise, to which the seasonal variations inthe environment add. Energetics still remain thefocus.
We have illustrated above that the sensitivity ofrespiration to osmotic pressure offers an excellentproxy variable to assess tolerance. What underlies thisresponse? We have shown that voids in the lipidbilayer have a fundamental role to play. We were ableto model theoretically as well as show experimentallythat the rate limiting step in electron transport inmitochondria and chloroplasts is the availability ofvoids for the diffusion of the relevant quinone in thebilayer (Mathai et al., 1993). We also developed thetransbilayer diffusion of hydrogen peroxide as akinetically valid probe to monitor stretch sensitivity inboth natural and artificial membranes (Mathai &Sitaramam, 1994). Using this methodology weshowed that stretch sensitivity can be induced instretch insensitive model membranes by doping withspecific lipids, particularly the mitochondrial specificcardiolipin.
Essentially three parameters underlie this sensitivityof electron transport in mitochondria and chloro-plasts to the availability of voids. Diffusion per se, themean distance between the complexes and the velocityof the oxidizing and reducing complexes. Detailed
F. 6. Theoretical demonstration of how the phenotype for yielddiffers from that for osmotolerance. Curves 1 and 2 represent highyielding varieties under osmotic stress; curve 3 represents theosmotically tolerant but low yielding variety, and curve 4demonstrates how a variety integrated with these two charactersbehaves under osmotic stress. Compare for the simulated profilesof activity in Figs 2 and 3.
data demonstrates that different species fall intodifferent phenotypes. More importantly, it conformsto a physiological expectation: while a plant developsfrom a tolerant seed and grows into a sensitive
. . . 350
theoretical simulations, as described in Section 4 aresummarized in Fig. 6 into relatively few parameters ofpractical importance. This provides a theoreticalframework with minimal ground rules for anyapproach to the development of drought tolerance.(a) It is desirable that osmotic responses bequantitated on a common and continuous osmoticscale; this study throughout employs just such a scale.(b) Changes in internal osmolality, such as effected bycompatible osmolytes do not confer primary osmotictolerance. Thus, though internal osmolality canincrease activity, at a constant osmolality, theabsolute level of susceptibility on the osmolality scaleremains unchanged. (c) Diffusion is the mostdominant variable that affects the osmotolerance ofelectron transport. Thus, presence of voids in thebilayer remains the single most important factor thatdefines osmotic sensitivity/tolerance. (d) Introductionof incompressible voids, such as obtained byincorporation of cholesterol, increase osmotic sensi-tivity but decrease activity. These analyses thuselegantly illustrate that the engineering for droughttolerance is a balance between ‘‘activity’’ and osmotic‘‘sensitivity’’. It is thus logical that in the absence ofsuch a framework, the odds are stacked against anyeffort in the manipulation of organisms, whether bytraditional breeding, or, by genetic engineering,however valiant. This is sufficiently evident in thecurrent ‘‘state of the art’’.
While much of the experimental evidence is beingcommunicated elsewhere for data on microbes as wellas plants, it suffices to state that we have encountered,experimentally, variations in osmotolerance, as wellas variations in activity, of many of the kinds depictedin Table 1 and Figs 2 and 3. Thus, the simulationsdepict the possible variations seen in experimentaldata. This facilitates the experimenter to get a bird’seye view of the variations in biological data, todistinguish the kinetic possibilities and thermodyn-amic reasons in the activity profiles.
Several lacunae exist in projecting the currentsimulations to the field level of manipulation, fordrought tolerance. The foremost in this is todemonstrate that diffusion/voids are critical to thephenotype of plants. Interesting experiments can bevisualized such as reconstitution of mitochondria(chloroplasts being much more difficult) with lipidsfrom resistant and sensitive cultivars. Parallelexperiments on genetics of widely separated parentsfor tolerance, through several generations, usingclassical genetics should help in identifying thegenome relevant. Those would, however, be concernsof the plant breeders, who have an adequaterepertoire of classical genetic tools to handle
quantitative traits. Drought tolerance is indeed sucha quantitative trait!
The authors are grateful to Dr Anil Gore, Dr S. A.Paranjape and Dr A. D. Gangal for a number ofdiscussions. Dr N. M. Rao for his association in the earlyphases of this work and Zuben E. Sauna and Satish B.Kulkarni in the preparation of the manuscript areacknowledged. CNM was supported by a fellowship fromUniversity Grants Commission (India).
REFERENCES
A, I. (1980). Breeding for higher yields. In: PhysiologicalAspects of Crop Productivity pp. 77–81. Wageningen, TheNetherlands: International Potash Institute.
A, M. (1986). The osmotic component of halotolerant algae.Trends Biochem. Sci. 11, 5–6.
B, J. E. (1991). Toward a science of metabolic engineering.Science 252, 1668–1681.
B, C. I. & U, T. H. (1993). Environmental release permits.Valuable tools for predicting food developments. Bio/Technol-ogy 11, 1524–1529.
B-A, A. & A, M. (1973). The role of glycerol inosmotic regulation of the halophytic alga Dunaliella parva. PlantPhysiol. 51, 875–880.
B-A, A. & A, M. (1979). Osmoregulation in thehalophilic algae Dunaliella and Asteromonas. In: GeneticEngineering of Osmoregulation (Rains, I. W. & Valentine, R. C.,eds) pp. 75–90. New York: Plenum Press.
B, A. (1964). Van der Waals volumes and radii. J. Phys. Chem.68, 441–451.
B, A. D. & E, M. (1979). Osmoregulation in yeast. In:Genetic Engineering of Osmoregulation: Impact on PlantProductivity for Food, Chemicals, and Energy (Rains, D. W.,Valentine, R. C. & Hollander, A., eds) pp. 75–90. New York:Plenum Press.
B, B. (1980). Cellular enzymology: the steady-state kinetics ofcompartmentalized enzymes. J. theor. Biol. 84, 611–627.
C, A. M., K, A. K., Z, U. B., T, D. T.,A, J. D., B, L. G., B, R. A. & H, P. M.(1993). Transgenic sorghum plants via microprojectile bombard-ment. Proc. Natl. Acad. Sci. U.S.A. 90, 11212–11216.
C, S., L, B. A., G, H. J., & R, J M. T.(1991). Characterization of the cytoplasm of the Escherichia coliK-12 as a function of external osmolarity. Implications forprotein-DNA interactions in vivo. J. Mol. Biol. 222, 281–300.
C, S., L, B. A. & R, J., M. T. (1992). Origins ofthe osmoprotective properties of betaine and proline inEscherichia coli K-12. J. Bacteriol. 174, 1586–1595.
C, P. L.-G., F, P. A. G. & J, D. M. (1985).Mechanisms of inhibition of (Na, K)-ATPase by hydrostaticpressure studied with fluorescence probes. J. Biol. Chem. 260,14484–14490.
C, M. H. & T, D. (1959). Molecular transport inliquids and glasses. J. Chem. Phys. 31, 1164–1169.
C, J. S. (1967). Nonsolvent water in human erythrocytes.J. Gen. Physiol. 50, 1311–1325.
C, H. G. L., S, E. & Z, U. (1978). Turgorpressure sensing in plant cell membranes. Plant Physiol. 58,636–643.
D, J. M. & W, E. M. (1969). Biological membranes :The physical basis of ion nonelectrolyte selectivity. Ann. Rev.Physiol. 31, 581–646.
D, K. A. & F, P. J. (1981). Interphases of chain molecules:monolayers and lipid bilayer membranes. Proc. Natl. Acad. Sci.U.S.A. 77, 3115–3119.
D, R. (1976). Inventory of the major soils of the world withspecial references to mineral stress hazards. In: Plant Adaptation
351
to Mineral Stress in Problem Soils (Wright, M. J., ed) pp. 3–13.Ithaca New York: Cornell University.
F, D. S. (1989). In: Introduction to Quantitative Genetics.3rd Edn. England: ELBS, Longman.
F, H. E. & G, A. W. (1984). Osmotic stress inducedpolyamine accumulation in cereal leaves. Plant Physiol. 75,110–113.
F, J. C. & H, J. F. (1979). Ionic and osmoticequilibria of human red blood cells treated with nystatin. J. Gen.Physiol. 74, 157–185.
G, H.-J., H, W., T, U. & S, E. (1979).On two dimensional passive random walk in lipid bilayers andfluid pathways in biomembranes. J. Mem. Biol. 48, 215–236.
G, B. & W, M. M. (1979). Viscosity-dependentstructural fluctuations in enzyme catalysis. Biochemistry 18,1269–1274.
G, K. & H, Y. (1986). Compressibility-structurerelationship of globular proteins. Biochemistry 25, 6563–6571.
G, S., R, A., S, B. & G, E. W.(1984). Responses of lymphocytes to anisotonic media: Volumeregulating behavior. Am. J. Physiol. 246, (Cell Physiol. 15),C204–C215.
G, M. (1980). Electron flux through the mitochondrialubiquinone. Biochim. Biophys. Acta. 594, 53–84.
H, H. G., T, S. & D, A. (1977). Osmoticproperties of human lymphocyte. J. Cell. Physiol. 93, 293–302.
H, C., R, C. I. & T, B. L. (1978). Theinteraction between mitochondrial NADH-ubiquinone oxido-reductase and ubiquinol-cytochrome c oxidoreductase: Restor-ation of ubiquinone-pool behaviour. Biochem. J. 174, 791–800.
I, J. & B, D. (1996). The molecular basis ofdehydration tolerance in plants. Annu. Rev. Plant Physiol. PlantMol. Biol. 47, 377–403.
I, J. N., M, S. & H, R. G. (1980). Physicalprinciples of membrane organization. Quar. Rev. Biophys. 13,121–200.
K, O. & K, A. (1958). Thermodynamic analysis ofthe permeability of biological membranes to non-electrolytes.Biochim. Biophys. Acta. 27, 229–246.
K, G. (1994). Analyzing the future of worldwide agbiotech.Bio/Technology 12, 859–860.
K, P. & R, C. R. (1987). Weather and crops. In:Handbook of Agriculture (Tata, S. N. & Wadhwani, A. M., eds)pp. 1–19. New Delhi: Indian Council of Agricultural Research.
K, A. & K, M. (1973). Further evidence for thepool function of ubiquinone as derived from the inhibition of theelectron transport by antimycin. Eur. J. Biochem. 39, 313–323.
K, S. B., S, V. & S, V. (1996). Assessmentof molecular sieving across bacterial outer membrane ofPseudomonas. Biochim. Biophys. Acta 1281, 189–204.
L, B. (1983). Calculation of volume fluctuation for globularprotein models. Proc. Natl. Acad. Sci. U.S.A. 80, 622–626.
L, W., A, T. S., T, H., H, H. & C, H. Z.(1986). Elasticity of synthetic phospholipid vesicles andsubmitochondrial particles during osmotic swelling. Biochem-istry 25, 8220–8229.
M, R. I. (1984). Transport of water and urea in red blood cells.Am. J. Physiol. 246, C195–C203.
M, J. C. & S, V. (1994). Stretch sensitivity oftransmembrane mobility of hydrogen peroxide through voids inthe bilayer: role of cardiolipin. J. Biol. Chem. 269, 17784–17793.
M, J. C., S, Z. E., J, O. & S, V. (1993).Rate-limiting step in electron transport: osmotically sensitivediffusion of quinones through voids in the bilayer. J. Biol. Chem.268, 15442–15454.
M, H. J., M, R. & L, D. G. (1983) Osmotic waterpermeability of the human red cell. Dependence on direction ofwater flow and cell volume. J. Gen. Physiol. 81, 213–220.
N, P. S. (1969). The Boyle-Van’t Hoff relation. J. theor. Biol.23, 375–379.
O’L, T. J. (1987). Lateral diffusion of lipids in complex
biological membranes. Proc. Natl. Acad. Sci. U.S.A. 84,429–433.
P R-S, S, Z. E., D, R. A. & S, V.(1995). Influence of osmolality of the medium on photosyntheticelectron transport, proton fluxes and photophosphorylation inisolated thylakoids. Ind. J. Biochem. Biophys. 32, 1–10.
P V, F. W. T. (1975). The cost maintenance processesin plant cells. Ann. Bot. 36, 77–92.
R, G. K. & V, J. (1972). Can fluorescent probes tellus anything about membranes? Biochim. Biophys. Acta. 265,509–549.
R, R. P., F, N. L., B, P., F, G. & N,P. (1993). Measured change in protein solvation with substratebinding and turnover. Biochemistry 32, 5925–5929.
R, N. G. P. (1982). Transforming traditional sorghums in India.In: Sorghums in the Eighties: Proceedings of the InternationalSymposium on Sorghum. pp. 293–298. Patancheru, A. P., India:ICRISAT.
R, N. M. (1987). Studies on physical parameters that influencemembrane functions: Osmotic pressure as a probe. Ph.D. Thesis.Osmania University, Hyderabad, India.
S, D. & S, V. (1983). Studies on the non-linear osmotic pressure volume relationship in mitochondria andentry of sucrose into matrix space during centrifugation.Biochim. Biophys. Acta. 722, 256–270.
S, D. & S, V. (1985). Respiration inducesvariable porosity to polyols in the mitochondrial innermembrane. Biochim. Biophys. Acta. 806, 195–209.
S, D., K, R., R, N. M. & S, V.(1988). ATP hydrolysis induces variable porosity to mannitol inthe mitochondrial inner membrane. Biochim. Biophys. Acta. 933,200–211.
S, D., R, N. M. & S, V. (1986). Anoma-lous permeability and stability characteristics of erythrocytes innon-electrolyte media. Biochim. Biophys. Acta. 857, 48–60.
S, B. A., A, J. R. & H, C. R. (1991).Dynamics, structure, and function are coupled in themitochondrial matrix. Proc. Natl. Acad. Sci. U.S.A. 88,8057–8061.
S, J. A. & A, T. E. (1986). Principles of water andnonelectrolyte transport across membranes. In: Physiology ofMembrane Disorders (Andreoli, T. E., Hoffman, J. F., Fanestil,D. D. & Schultz, S. G., eds) pp. 177–188. New York andLondon: Plenum Medical Book Company.
S, N., S M. V. K., B F. R., S S.,M R. K., R B. V. S. . (1983). Physiological basis forincreasing and stabilizing yield under drought in sorghum. Proc.Indian Natl. Sci. Acad. B49, 498–523.
S, A., R, M. B., G, A. P. & S, V.(1992). Statistical testing of equality of two break-points inexperimental data. J. Biochim. Biophys. Methods 25, 95–112.
S, V. & R, N. J. (1977). Hierarchical modeling ofacclimatory processes. J. theor. Biol. 67, 25–49.
S, V. & R, N. M. (1984). Energetic basis ofosmotolerance in microbes and drought/salinity resistance incultivars. Third European Bioenergetics Conference, Hannover,The Netherlands.
S, V. & R, N. M. (1986). Molecular interactions in themembrane phase: Implications in Biotechnology. Indian J. Exp.Biol. 24, 615–623.
S, V. & S, M. K. J. (1981). Gravitational fieldenhances permeability of biological membranes to sucrose: Anexperimental refutation of the sucrose space hypothesis. Proc.Natl. Acad. Sci. U.S.A. 78, 3441–3445.
S, V. (1988). Self potential generated by unscreened fixedcharges at the membrane interface of the erythrocyte perturbs thelipid bilayer. Indian J. Biochem. Biophys. 25, 172–179.
S, V. (1989). Genetic code preferentially conserves longrange interactions among the amino acids. FEBS Lett. 247,46–50.
S, V. (1992). Molecular mechanisms of stretch activationof membrane-bound proteins. In: Biomembrane Structure and
. . . 352
Function, The State of Art (Gaber, B. P. & Easwaran,K. R. K. eds) pp. 123–132. Schenectady New York: AdeninePress.
S, V. (1994). Energetic basis of osmotolerance in plants:a strategy for reliable quantitative phenotyping for geneticmanipulations. In: International Symposium on Plant MolecularBiology and Biotechnology, December 14–17, 1994, New Delhi,India.
S, V. (1997). Anisotropy across biological membranes:histidine charges oppose net charge anisotropy. Curr. Sci. 72,562–571.
S, V., P, S. A. & G, A. D. (1992). Chargeanisotropy across biological membranes: evidence and impli-cations. Biochim. Biophys. Acta. 1098, 336–342.
S, J. (1982). Anilinonapthalene sulfonate as a probe ofmembrane composition and function. Biochim. Biophys. Acta.694, 1–25.
S, A. K. (1989). Water channels across the red blood celland other biological membranes. Methods Enzymol. 173,192–222.
S, B., W, G. R. & D, S. (1984). Thedynamic basis of energy transduction in enzymes. Biochim.Biophys. Acta. 768, 81–112.
S, W. D. & L, W. R. (1986). Transport and diffusion acrosscell membranes. London: Academic Press.
T, M. C., J, R. G. & B, H. J. (1992).Expression of a bacterial mtlD gene in transgenic tobacco leadsto production and accumulation of mannitol. Proc. Natl. Acad.Sci. U.S.A. 89, 2600–2603.
T, M. C., J, R. G. & B, H. J. (1993). Stressprotection of transgenic tobacco by production of the osmolytemannitol. Science 259, 508–510.
T, N. C. (1981). Drought resistance and adaptation to waterdeficit in crop plants. In: Stress Physiology in Crop Plants(Musell, H. & Staples, R. C., eds) pp. 181–194. New York:Wiley-Interscience.
V, V. S. & S, V. (1991). Should crossphenomenological coefficients be vectorial? Curr. Sci. 62,604–608.
V, R. H. (1987). Mechanisms of halotolerance inmicroorganisms. Crit. Rev. Microbiol. 14, 311–356.
W, P., M, K. & S, R. A. (1983).Merocyanine-540. A fluorescent probe sensitive to lipid packing.Biochim. Biophys. Acta. 732, 387–393.
Z, M. L., A, S. V., S, B. L. & A, P. (1992).Reconstituition of functional water channels in liposomescontaining purified red cell CHIP28 protein. Biochemistry 31,7436–7440.
Z, U. (1978). Physics of turgor and osmoregulation.Ann. Rev. Plant Physiol. 29, 121–148.