energetic environmental and economic assessment of three
TRANSCRIPT

This article appeared in a journal published by Elsevier. The attachedcopy is furnished to the author for internal non-commercial researchand education use, including for instruction at the authors institution
and sharing with colleagues.
Other uses, including reproduction and distribution, or selling orlicensing copies, or posting to personal, institutional or third party
websites are prohibited.
In most cases authors are permitted to post their version of thearticle (e.g. in Word or Tex form) to their personal website orinstitutional repository. Authors requiring further information
regarding Elsevier’s archiving and manuscript policies areencouraged to visit:
http://www.elsevier.com/copyright

Author's personal copy
Energetic environmental and economic assessment of threetree species and one herbaceous crop irrigated with primarytreated sewage effluent
V.A. Tzanakakis*, M.K. Chatzakis, A.N. Angelakis
National Foundation for Agricultural Research (N.AG.RE.F.), Institute of Iraklion, Iraklion, Greece
a r t i c l e i n f o
Article history:
Received 23 September 2011
Received in revised form
16 September 2012
Accepted 17 September 2012
Available online 22 October 2012
Keywords:
Wastewater land application
Bioenergy crops
Energy analysis
Economic analysis
Water use efficiency
Nutrient use efficiency
a b s t r a c t
The energetic, environmental, and economic performance of four bioenergy plant species
(Acacia cyanophylla, Eucalyptus camaldulensis, Populus nigra, and Arundo donax), irrigated with
pre-treated effluent in a three-year-field trial, was investigated. Results showed that irri-
gation was more energy demanding compared to other practices. A. cyanophylla achieved
34, 83, and 189% higher above ground biomass energy yield than E. camaldulensis, A. donax,
and P. nigra, respectively. A. cyanophylla and E. camaldulensis had higher energy require-
ments but they achieved higher net energy yield and energy ratio. P. nigra (3.49 V GJ�1) and
A. donax (2.34 V GJ�1) were found to have higher energy production cost compared to E.
camaldulensis (1.65 V GJ�1) and A. cyanophylla (1.24 V GJ�1). P. nigra and A. donax had the
highest nutrient use efficiency for nitrogen (NUE-N) and phosphorus (NUE-P), respectively.
It was concluded that species with low NUE, which is opposite to current directions, and
high water use efficiency (WUE) (i.e. plant species with relatively low water demands and
great biomass allocation in leaves), are more suitable when irrigation with strong effluent
occur and N removal is primary objective. Such plant species have comparatively lower
energy requirements, which is consistent with the current trend for low energy inputs in
agriculture. To mitigate the losses in plant biomass and reduce the adverse environmental
impacts from nutrients, additional practices should be adopted. Our results help us to draw
important conclusions in order to set criteria in the selection of suitable bioenergy crops
and practices.
ª 2012 Elsevier Ltd. All rights reserved.
1. Introduction
Bioenergy crops have a key role to play in the development of
strategies to increase the use of the renewable energy
resources, mitigate climate change, and protect the environ-
ment in EuropeanUnion (EU) [1]. Currently, the contribution of
renewable energy sources in EuropeanUnion (EU) is quite low,
at 4.5% of the total energy consumption with 60% of it covered
by energy frombiomass; however, in an effort to increase their
use, it was set a target for 2020 of 20% of the energy
consumption and increase of biofuels at 10% of the total fuels
used in road transportations [1,2]. Lignocellulosic biomass
from certain herbaceous crops and some woody perennials
grown in short rotation coppice, is considered to be essential in
meeting EU targets, since it can contribute in all energy sectors
including electricity, heating/cooling and biofuel [3].
The use of wastewater effluent to bioenergy cultivations is
a cost-effective practice, known also as land treatment
* Corresponding author.E-mail address: [email protected] (V.A. Tzanakakis).
Available online at www.sciencedirect.com
http: / /www.elsevier .com/locate/biombioe
b i om a s s a n d b i o e n e r g y 4 7 ( 2 0 1 2 ) 1 1 5e1 2 4
0961-9534/$ e see front matter ª 2012 Elsevier Ltd. All rights reserved.http://dx.doi.org/10.1016/j.biombioe.2012.09.051

Author's personal copy
systems (LTS) or slow rate systems (SRS), meeting environ-
mental and renewable bioenergy goals [4,5]. Effluent can
supply bioenergy crops with considerable amounts of water
and nutrients stimulating plant growth and energy yield and
decreasing production cost through the substitution of water
and fertilizers [6]. In addition, effluent application can reduce
the competition for water between bioenergy and traditional
crops,which is important concern in arid or semi-arid regions.
On the other hand, the use of effluents may lead to significant
nutrient losses to the environment, commonly due to inap-
propriate plant species and practices applied [7e9]. The
management of nutrients and particularly N is of prime
concern in effluent irrigated lands since excessive N loading
can lead to nitrates accumulation in soil and increase in
greenhouse gases emissions (e.g. NOx). In general, bioenergy
crops with high water use efficiency (WUE) and nutrient (e.g.
N) use efficiency (NUE) have been recognized asmore suitable,
since they use more efficiently water and nutrients applied,
which in turn reduce economic and environmental cost [3].
However, in cases of irrigation with relative strong effluent,
specieswith highWUEmay accumulate excessive nutrients in
rhizosphere, suggesting that the effluent loading should also
be taken into account [7,8].
Energy analysis is a common practice in the assessment of
bioenergy crops and/or applied agronomic practices assessing
the energetic performance of plant species and indicating its
environmental and economic sustainability [6]. In general,
plant species with greater differences between energy output
and input, leading to higher net energy yield and energy ratio,
have greater potential to be used as bioenergy crops [10,11].
However, there seems to be important in bioenergy cultiva-
tions theminimization of energy inputs [12], as it is associated
with less adverse environmental impacts and economical
cost, indicating that high net energy yield and energy ratio
should be combined with lower energy inputs. Irrigation with
effluent probably would help in this task, enhancing biomass
and yield and eliminating the energy requirements for fertil-
ization in the field but the potential benefits have not yet
emphasized in literature.
Adoption of bioenergy crops by farmers presumes that
species are more economically favorable than the traditional
ones, with which normally compete for land use [13]. Among
bioenergy crops, lignocellulosic plant species, e.g. willow and
eucalyptus under short rotation coppice, have been identified
as more appropriate combining high biomass production
potentials under low production cost [14]. These species have
also great potential to be used as vegetative filters due to
several desirable attributes, such as broad adaptation in
a wide range of soil-climatic conditions, wide genetic base,
fast growth and high biomass production, nutrient cycling,
and reduction of greenhouse gases emissions [3,4] but because
of the particular interest only for biomass production this
issue is not adequately considered.
In this study the effect of bioenergy crops (three tree
species and an herbaceous crop) on energy requirements,
energy yield derived from the produced biomass, net energy
balance, energy ratio, and economical cultivation cost was
investigated. Furthermore, it was investigated the environ-
mental performance of these plant species based on the
assessment of NUE for N and P, expressing the efficiency with
which plant species use the applied, via wastewater effluent
irrigation, nutrients. The information provided in this study is
expected to bring out the benefits in energy cultivations
derived from the use of wastewater effluent and help in the
development of criteria for the identification of the more
suitable bioenergy plant species and practices based on
environmental and economic cost and benefits.
2. Materials and methods
2.1. Experimental set up and agronomic techniques
Plant specieswere established at Skalani village, located about
5 km south east of Iraklion city, Greece (at N 35� 16.80 and E 25�
11.20). The soil was characterized as a clay loam with high
calcium content (55% CaCO3). The climate is semi-arid with
relatively humid winters and dry and warm summers. More
detailed information concerning, experimental design, soil
properties, effective precipitation, temperature, and reference
evapotranspiration of the experimental area are given in our
previous studies [7,8]. One-year old trees of eucalyptus (Euca-
lyptus camaldulensis), acacia (Acacia cyanophylla or saligna) and
poplar (Populus nigra) were transplanted on October 2000.
Rhizomes of reeds (Arundo donax) were also excavated, cut into
small cuttings and transplanted at distances 0.50 m between
and within rows. Plant species were allowed to grow without
any treatment until June 2001, when the application of pre-
treated wastewater began. Plant species received septic tank
primary treated sewage effluent [15] and hydraulic loading
rate was based on their water requirements and evaporation
losses estimated from a simple balance on a daily-time step.
Average values of the composition of septic tank-treated
effluent are summarized in Table 1.
The applied pre-treated wastewater increased from the
beginning of spring until late summer, controlled by plant
growth, thereafter effluent application rate was declined.
During first period of operation (from June 6, 2001 to
November 30, 2001) A. donax exhibited higher water
consumption (736 mm), followed by P. nigra at 724 mm, A.
cyanophylla at 637 mm, and E. camaldulensis at 631 mm. During
Table 1 e Average values of the composition of septictank-treated wastewater effluent, applied in differentbioenergy plant species.
Parameters 2001 2002 2003
EC (dS m�1) 2.02 2.08 2.10
pH 7.26 7.36 7.40
TSS (mg L�1) e 93 106
COD (mg L�1) 553 386 510
Inorganic P (mg L�1) 5.89 6.64 6.73
TP (mg L�1) 10.09 8.37 9.84
T (Kjeldahl) N (mg L�1) 87.04 102.09 124.64
Nitrates (mg L�1) e e 1.07
Kþ (mg L�1) e e 29.53
Naþ (mg L�1) e 132.64 126.38
Mg2þ (mg L�1) e 14.65 26.49
Ca2þ (mg L�1) e 80.76 80.78
b i om a s s an d b i o e n e r g y 4 7 ( 2 0 1 2 ) 1 1 5e1 2 4116

Author's personal copy
the next period of LTS operation (March 1, 2002 to November
15, 2002), effluent loading were 1020, 1074, 975, and 725 mm
for A. donax, A. cyanophylla, E. camaldulensis, and P. nigra,
respectively. In 2003 (March 1, 2003 to October 30, 2003)
respective values were 1515, 1852 1822 and 1212 mm for each
system.
Following each growing season harvesting was carried out
and the above ground biomass yield and its distribution
among different plant tissues were determined. Details about
the sampling method, storage, and lab analyses are provided
in our previous work [7]. In brief, at the end of every growing
season (October), one representative tree from each plot was
harvested and separated into individual organs. The fresh
weight of leaves, shoots and trunk (old wood) were recorded.
For reeds, the whole plot surface was harvested each season
and separated into leaves and shoots. All sampleswere kept in
plastic bags and were transported to the lab for the appro-
priate analyses. Dryweights of vegetationwere determined by
drying (65 �C) to a constant weight. In 2002 and 2003 one
replicate plot was harvested from each treatment and the
tissue dry weights were determined. The dried samples were
ground to 1-mm and used in elemental analysis [7]. Weed
control was done only during the establishment year. The
analytical presentation of the cultivation practices considered
in this study during the experimental period is summarized in
Table 2.
2.2. Determination of net energy balance and energyratio
Net energy yield and energy ratio in different plant species
were determined for the three growing seasons taking into
account the energy input and output. More analytically, the
net energy yield was determined by subtracting energy input
from energy output (yield), while energy ratio by dividing the
energy output with the energy input. In order to determine
energy inputs across species, energy input for soil prepara-
tion, plants planting, wastewater effluent application, plant
harvesting, and weed control were considered. Energy
requirements for delivering the production outside the field,
for storage and drying as well as indirectly energy inputs by
the pump and pipeline for effluent transport in the field were
not included in the calculations. Energy requirements for
application of the wastewater effluent (or irrigation energy
requirements) included electricity consumption by electric
engine pump. The electricity consumption was considered
here equal to 4.8 MJ m�3 of effluent [16]. Energy input for
mechanization is usually determined taking into account fuel
and lubricant consumption of the tractor as well as energy
requirements for the fabrication and repair of the machinery
utilized during the cultivation of species [17]. The calculation
of fuel and lubricant energy requirements of various
management operations is based on fuel and lubricant
consumption and their energy content. In this study, it was
assumed that the energy requirements was 4.5 GJ ha�1 for
soil preparation [6,12,16e19], 4.3 GJ ha�1 for planting
[6,12,16,18,19], 3.2 GJ ha�1 for harvesting [16,18e21], 1.2 GJ ha�1
for weed control [11,12,16], and 0.2 GJ ha�1 for pesticides
[12,20].
2.3. Elemental content and energy yield
In order to determine C and H content in above ground plant
tissues and energy yield dried samples gathered at the end of
third period (Oct. 2003), were grounded, passed through No 4
sieve (4.75 mm) and burnt in an oxygen bomb calorimeter to
determine their calorific value. The energy yield of above
ground biomass was calculated by multiplying the calorific
value with the above-ground dry matter yield reported in our
previous study [7]. For the previous growing seasons (2002 and
2001), the calculation of the energy yield was based on the
produced biomass at the end of these periods [7], assuming
that respective calorific values had the same value as the third
period. Previous work has shown that the calorific value of
many plant tissues was not affected by the age as well as by
fertilization, or by plant density or harvest time [18,19,22].
Elemental content in plant tissues were determined in dried
samples using elemental analyzer (PerkineElmer). C:N andC:P
ratio calculations were carried out at the end of the third
growing season, based on C and H content as well as on N and
P content in tissues reported in our previous work [7].
2.4. Nutrient use efficiency (NUE)
The NUE and WUE are widely used in the selection of the
appropriate plant species, particularly whether these are to be
irrigatedwithwastewater effluent and/or where limitations in
the use of water and nutrients exist. In this study, the NUE for
nitrogen (NUE-N) and phosphorus (NUE-P) were determined
from biomass yield divided by the amount of N and P recov-
ered, respectively, expressed as kg�1 kg�1. The biomass
production, nutrient contents in tissues, and the amount of N
or P recovered by different species, used in this study, have
been reported in our previous study [7].
2.5. Energy crop production cost
Energy production cost was estimated based on capital and
operation and maintenance (O&M) cost and it was expressed
as cost per unit the produced bioenergy, in order to link
economical requirements of the plant species with energetic
profits. The capital costs were estimated based on the receipts
of the different constructionworks after transferred to refer to
2003 and they were free from value added taxes. Major works
Table 2 e Agronomic practices carried out in differentplant species during the three growing seasons(2001e2003).
Practices Growing season
2001 2002 2003
Soil preparation O e e
Planting O e e
Irrigation O O O
Weed control O e e
Plant protection O O O
Harvesting Oa Oa O
a Harvesting only for A. donax species.
b i om a s s a n d b i o e n e r g y 4 7 ( 2 0 1 2 ) 1 1 5e1 2 4 117

Author's personal copy
involved the installation of monitoring apparatus (electro
valves, electric panel, etc.), pumps, soil preparation, plant
purchasing, planting, and installation of irrigation network.
Operation and maintenance (O&M) costs were calculated
based on the 3 year cost data and were also transferred to
reflect 2003 prices. Major O&M costs involved pesticides, weed
control, electricity consumption for irrigation,maintenance of
the irrigation network, and harvesting. Because the irrigation
needs were different per plant this cost was different per
plant. The same was for the man work during harvesting
(calculations included annual harvesting for A. donax, as
shown in Table 2).
In this study, Total Annual Economic Cost (TAEC) was
calculated for all plant species to indicate their economic
performance [23]. The TAEC of the system was given by the
sum of the annuitized construction cost (Cc) and the annual
operation and maintenance costs (Ca) as reported by Eq. (1):
TAEC ¼ ðCc � CRFÞ þ Ca (1)
CRF ¼ rð1þ rÞtð1þ rÞt�1
(2)
where t is time in years and r is the opportunity cost of capital
(OCC). The energy crop production cost of each species was
calculated by dividing the TAEC by the total number of GJs
produced per year.
2.6. Statistical analysis
Statistical analysis was performed for data analysis using
SPSS v.19 program. The effect of the plant species and tissues
was carried out by using General Linear Model, Univariate
Analysis of Variance (UNIANOVA). Post hoc pair wise
comparisons were examined by Tukey’s honestly significant
difference (HSD) test. Furthermore, a correlation analysis was
carried out to determine the relationship between N and P
content across plant tissues and NUE.
3. Results
3.1. Energy input
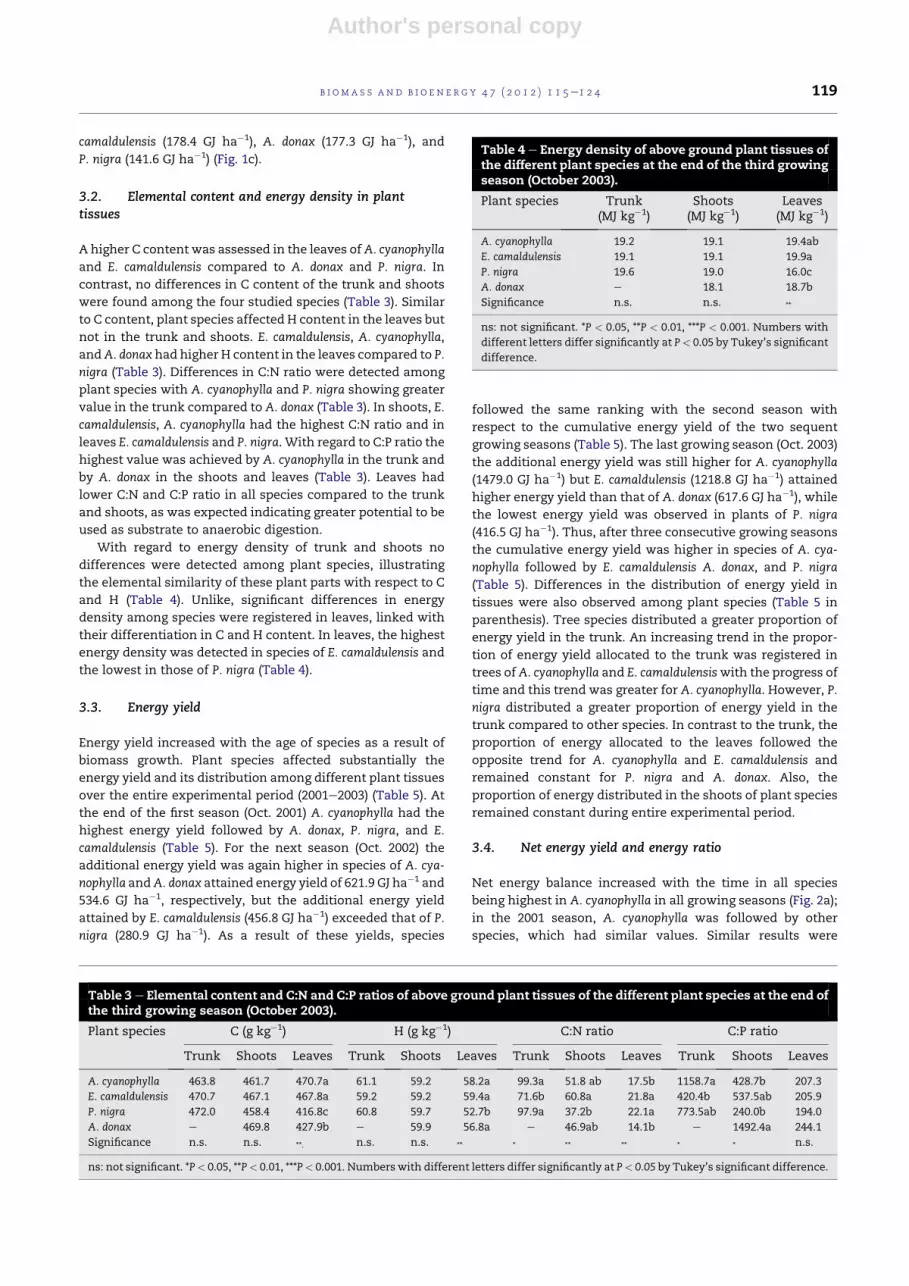
The applied energy increased with the progress of time in all
species reflecting mainly the energy consumption during
wastewater effluent application, since the additional energy
inputs arising from the cultivation practices were fairly small
(Fig. 1a,b,c). Indeed, the average cumulative cost for effluent
application was about 70% of the total applied energy for the
establishment year increasing at 82% and 89% in the following
years. Plant species affected significantly energy inputs,
particularly in the second and third growing seasons, owing to
the application rates of the effluents which were different
along species. At the end of the first growing season (Oct. 2001)
A. donax and P. nigra species had similar energy input followed
by that of A. cyanophylla, and E. camaldulensis (Fig. 1a). The
following season (2002) energy consumption of A. cyanophylla
(51.8 GJ ha�1) approached that of A. donax (52.4 GJ ha�1) and
these species were followed by E. camaldulensis (47.0 GJ ha�1)
and P. nigra (35.0 GJ ha�1). Thus, the cumulative energy input
for the two sequent seasons (2001e2002) was higher for A.
donax followed by A. cyanophylla, E. camaldulensis, and P. nigra
(Fig. 1b). With regards to the last season (2003) A. cyanophylla
had the highest energy input (92.3 GJ ha�1) followed by E.
camaldulensis (90.9 GJ ha�1), the energy input of which excee-
ded that of A. donax (76.2 GJ ha�1) and remained higher than
that of P. nigra (61.6 GJ ha�1). Overall, at the end of the three
growing seasons, the cumulative energy consumption was
more in A. cyanophylla (184.9 GJ ha�1) followed by E.
A. cyanophylla E.camaldulensis P.nigra A. donax0
10
20
30
40
50
60
70
Ene
rgy
inpu
t (G
J ha
-1)
Plant protectionWeed controlHarvestingPlantingSoil preparationIrrigation
A. cyanophylla E.camaldulensis P.nigra A. donax0
20
40
60
80
100
120
Ene
rgy
inpu
t (G
J ha
-1)
A. cyanophylla E.camaldulensis P.nigra A. donax0
25
50
75
100
125
150
175
200
225
Ene
rgy
inpu
t (G
J ha
-1)
a
b
c
Fig. 1 e Cumulative energy inputs across species for 2001
(a), 2001and 2002 (b), and 2001e2003 (c) growing seasons.
b i om a s s an d b i o e n e r g y 4 7 ( 2 0 1 2 ) 1 1 5e1 2 4118
Author's personal copy
camaldulensis (178.4 GJ ha�1), A. donax (177.3 GJ ha�1), and
P. nigra (141.6 GJ ha�1) (Fig. 1c).
3.2. Elemental content and energy density in planttissues
A higher C content was assessed in the leaves ofA. cyanophylla
and E. camaldulensis compared to A. donax and P. nigra. In
contrast, no differences in C content of the trunk and shoots
were found among the four studied species (Table 3). Similar
to C content, plant species affected H content in the leaves but
not in the trunk and shoots. E. camaldulensis, A. cyanophylla,
andA. donax had higher H content in the leaves compared to P.
nigra (Table 3). Differences in C:N ratio were detected among
plant species with A. cyanophylla and P. nigra showing greater
value in the trunk compared to A. donax (Table 3). In shoots, E.
camaldulensis, A. cyanophylla had the highest C:N ratio and in
leaves E. camaldulensis and P. nigra. With regard to C:P ratio the
highest value was achieved by A. cyanophylla in the trunk and
by A. donax in the shoots and leaves (Table 3). Leaves had
lower C:N and C:P ratio in all species compared to the trunk
and shoots, as was expected indicating greater potential to be
used as substrate to anaerobic digestion.
With regard to energy density of trunk and shoots no
differences were detected among plant species, illustrating
the elemental similarity of these plant parts with respect to C
and H (Table 4). Unlike, significant differences in energy
density among species were registered in leaves, linked with
their differentiation in C and H content. In leaves, the highest
energy density was detected in species of E. camaldulensis and
the lowest in those of P. nigra (Table 4).
3.3. Energy yield
Energy yield increased with the age of species as a result of
biomass growth. Plant species affected substantially the
energy yield and its distribution among different plant tissues
over the entire experimental period (2001e2003) (Table 5). At
the end of the first season (Oct. 2001) A. cyanophylla had the
highest energy yield followed by A. donax, P. nigra, and E.
camaldulensis (Table 5). For the next season (Oct. 2002) the
additional energy yield was again higher in species of A. cya-
nophylla andA. donax attained energy yield of 621.9 GJ ha�1 and
534.6 GJ ha�1, respectively, but the additional energy yield
attained by E. camaldulensis (456.8 GJ ha�1) exceeded that of P.
nigra (280.9 GJ ha�1). As a result of these yields, species
followed the same ranking with the second season with
respect to the cumulative energy yield of the two sequent
growing seasons (Table 5). The last growing season (Oct. 2003)
the additional energy yield was still higher for A. cyanophylla
(1479.0 GJ ha�1) but E. camaldulensis (1218.8 GJ ha�1) attained
higher energy yield than that of A. donax (617.6 GJ ha�1), while
the lowest energy yield was observed in plants of P. nigra
(416.5 GJ ha�1). Thus, after three consecutive growing seasons
the cumulative energy yield was higher in species of A. cya-
nophylla followed by E. camaldulensis A. donax, and P. nigra
(Table 5). Differences in the distribution of energy yield in
tissues were also observed among plant species (Table 5 in
parenthesis). Tree species distributed a greater proportion of
energy yield in the trunk. An increasing trend in the propor-
tion of energy yield allocated to the trunk was registered in
trees of A. cyanophylla and E. camaldulensiswith the progress of
time and this trend was greater for A. cyanophylla. However, P.
nigra distributed a greater proportion of energy yield in the
trunk compared to other species. In contrast to the trunk, the
proportion of energy allocated to the leaves followed the
opposite trend for A. cyanophylla and E. camaldulensis and
remained constant for P. nigra and A. donax. Also, the
proportion of energy distributed in the shoots of plant species
remained constant during entire experimental period.
3.4. Net energy yield and energy ratio
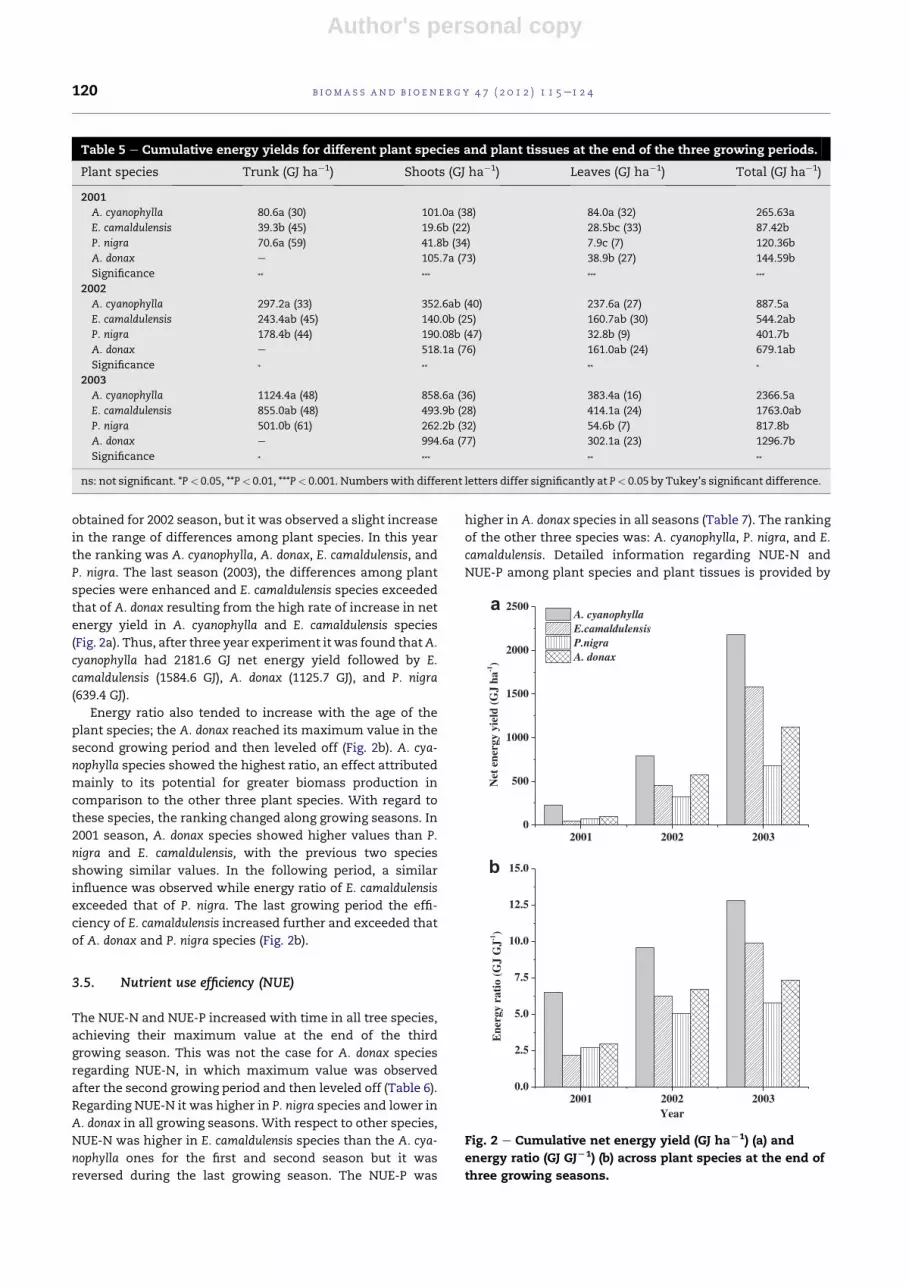
Net energy balance increased with the time in all species
being highest in A. cyanophylla in all growing seasons (Fig. 2a);
in the 2001 season, A. cyanophylla was followed by other
species, which had similar values. Similar results were
Table 3 e Elemental content and C:N and C:P ratios of above ground plant tissues of the different plant species at the end ofthe third growing season (October 2003).
Plant species C (g kg�1) H (g kg�1) C:N ratio C:P ratio
Trunk Shoots Leaves Trunk Shoots Leaves Trunk Shoots Leaves Trunk Shoots Leaves
A. cyanophylla 463.8 461.7 470.7a 61.1 59.2 58.2a 99.3a 51.8 ab 17.5b 1158.7a 428.7b 207.3
E. camaldulensis 470.7 467.1 467.8a 59.2 59.2 59.4a 71.6b 60.8a 21.8a 420.4b 537.5ab 205.9
P. nigra 472.0 458.4 416.8c 60.8 59.7 52.7b 97.9a 37.2b 22.1a 773.5ab 240.0b 194.0
A. donax e 469.8 427.9b e 59.9 56.8a e 46.9ab 14.1b e 1492.4a 244.1
Significance n.s. n.s. **. n.s. n.s. ** * ** ** * * n.s.
ns: not significant. *P< 0.05, **P< 0.01, ***P< 0.001. Numberswith different letters differ significantly at P< 0.05 by Tukey’s significant difference.
Table 4 e Energy density of above ground plant tissues ofthe different plant species at the end of the third growingseason (October 2003).
Plant species Trunk(MJ kg�1)
Shoots(MJ kg�1)
Leaves(MJ kg�1)
A. cyanophylla 19.2 19.1 19.4ab
E. camaldulensis 19.1 19.1 19.9a
P. nigra 19.6 19.0 16.0c
A. donax e 18.1 18.7b
Significance n.s. n.s. **
ns: not significant. *P < 0.05, **P < 0.01, ***P < 0.001. Numbers with
different letters differ significantly at P< 0.05 by Tukey’s significant
difference.
b i om a s s a n d b i o e n e r g y 4 7 ( 2 0 1 2 ) 1 1 5e1 2 4 119
Author's personal copy
obtained for 2002 season, but it was observed a slight increase
in the range of differences among plant species. In this year
the ranking was A. cyanophylla, A. donax, E. camaldulensis, and
P. nigra. The last season (2003), the differences among plant
species were enhanced and E. camaldulensis species exceeded
that of A. donax resulting from the high rate of increase in net
energy yield in A. cyanophylla and E. camaldulensis species
(Fig. 2a). Thus, after three year experiment it was found thatA.
cyanophylla had 2181.6 GJ net energy yield followed by E.
camaldulensis (1584.6 GJ), A. donax (1125.7 GJ), and P. nigra
(639.4 GJ).
Energy ratio also tended to increase with the age of the
plant species; the A. donax reached its maximum value in the
second growing period and then leveled off (Fig. 2b). A. cya-
nophylla species showed the highest ratio, an effect attributed
mainly to its potential for greater biomass production in
comparison to the other three plant species. With regard to
these species, the ranking changed along growing seasons. In
2001 season, A. donax species showed higher values than P.
nigra and E. camaldulensis, with the previous two species
showing similar values. In the following period, a similar
influence was observed while energy ratio of E. camaldulensis
exceeded that of P. nigra. The last growing period the effi-
ciency of E. camaldulensis increased further and exceeded that
of A. donax and P. nigra species (Fig. 2b).
3.5. Nutrient use efficiency (NUE)
The NUE-N and NUE-P increased with time in all tree species,
achieving their maximum value at the end of the third
growing season. This was not the case for A. donax species
regarding NUE-N, in which maximum value was observed
after the second growing period and then leveled off (Table 6).
Regarding NUE-N it was higher in P. nigra species and lower in
A. donax in all growing seasons. With respect to other species,
NUE-N was higher in E. camaldulensis species than the A. cya-
nophylla ones for the first and second season but it was
reversed during the last growing season. The NUE-P was
higher in A. donax species in all seasons (Table 7). The ranking
of the other three species was: A. cyanophylla, P. nigra, and E.
camaldulensis. Detailed information regarding NUE-N and
NUE-P among plant species and plant tissues is provided by
2001 2002 20030
500
1000
1500
2000
2500
Net
ene
rgy
yiel
d (G
J ha
-1)
A. cyanophyllaE.camaldulensisP.nigraA. donax
2001 2002 20030.0
2.5
5.0
7.5
10.0
12.5
15.0
Ene
rgy
rati
o (G
J G
J-1)
Year
a
b
Fig. 2 e Cumulative net energy yield (GJ haL1) (a) and
energy ratio (GJ GJL1) (b) across plant species at the end of
three growing seasons.
Table 5 e Cumulative energy yields for different plant species and plant tissues at the end of the three growing periods.
Plant species Trunk (GJ ha�1) Shoots (GJ ha�1) Leaves (GJ ha�1) Total (GJ ha�1)
2001
A. cyanophylla 80.6a (30) 101.0a (38) 84.0a (32) 265.63a
E. camaldulensis 39.3b (45) 19.6b (22) 28.5bc (33) 87.42b
P. nigra 70.6a (59) 41.8b (34) 7.9c (7) 120.36b
A. donax e 105.7a (73) 38.9b (27) 144.59b
Significance ** *** *** ***
2002
A. cyanophylla 297.2a (33) 352.6ab (40) 237.6a (27) 887.5a
E. camaldulensis 243.4ab (45) 140.0b (25) 160.7ab (30) 544.2ab
P. nigra 178.4b (44) 190.08b (47) 32.8b (9) 401.7b
A. donax e 518.1a (76) 161.0ab (24) 679.1ab
Significance * ** ** *
2003
A. cyanophylla 1124.4a (48) 858.6a (36) 383.4a (16) 2366.5a
E. camaldulensis 855.0ab (48) 493.9b (28) 414.1a (24) 1763.0ab
P. nigra 501.0b (61) 262.2b (32) 54.6b (7) 817.8b
A. donax e 994.6a (77) 302.1a (23) 1296.7b
Significance * *** ** **
ns: not significant. *P< 0.05, **P< 0.01, ***P< 0.001. Numbers with different letters differ significantly at P< 0.05 by Tukey’s significant difference.
b i om a s s an d b i o e n e r g y 4 7 ( 2 0 1 2 ) 1 1 5e1 2 4120
Author's personal copy
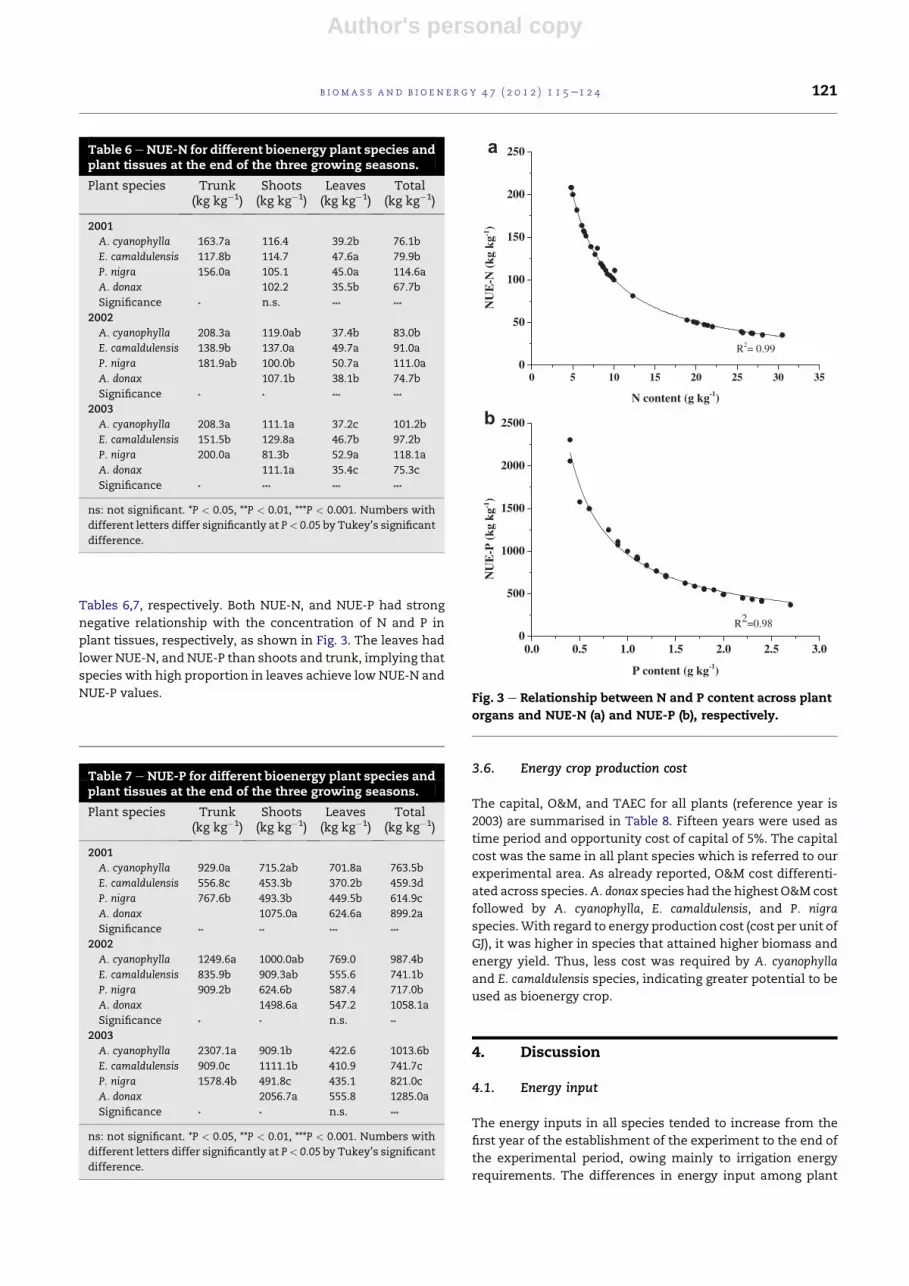
Tables 6,7, respectively. Both NUE-N, and NUE-P had strong
negative relationship with the concentration of N and P in
plant tissues, respectively, as shown in Fig. 3. The leaves had
lower NUE-N, and NUE-P than shoots and trunk, implying that
species with high proportion in leaves achieve low NUE-N and
NUE-P values.
3.6. Energy crop production cost
The capital, O&M, and TAEC for all plants (reference year is
2003) are summarised in Table 8. Fifteen years were used as
time period and opportunity cost of capital of 5%. The capital
cost was the same in all plant species which is referred to our
experimental area. As already reported, O&M cost differenti-
ated across species.A. donax species had the highest O&M cost
followed by A. cyanophylla, E. camaldulensis, and P. nigra
species.With regard to energy production cost (cost per unit of
GJ), it was higher in species that attained higher biomass and
energy yield. Thus, less cost was required by A. cyanophylla
and E. camaldulensis species, indicating greater potential to be
used as bioenergy crop.
4. Discussion
4.1. Energy input
The energy inputs in all species tended to increase from the
first year of the establishment of the experiment to the end of
the experimental period, owing mainly to irrigation energy
requirements. The differences in energy input among plant
Table 6 eNUE-N for different bioenergy plant species andplant tissues at the end of the three growing seasons.
Plant species Trunk(kg kg�1)
Shoots(kg kg�1)
Leaves(kg kg�1)
Total(kg kg�1)
2001
A. cyanophylla 163.7a 116.4 39.2b 76.1b
E. camaldulensis 117.8b 114.7 47.6a 79.9b
P. nigra 156.0a 105.1 45.0a 114.6a
A. donax 102.2 35.5b 67.7b
Significance * n.s. *** ***
2002
A. cyanophylla 208.3a 119.0ab 37.4b 83.0b
E. camaldulensis 138.9b 137.0a 49.7a 91.0a
P. nigra 181.9ab 100.0b 50.7a 111.0a
A. donax 107.1b 38.1b 74.7b
Significance * * *** ***
2003
A. cyanophylla 208.3a 111.1a 37.2c 101.2b
E. camaldulensis 151.5b 129.8a 46.7b 97.2b
P. nigra 200.0a 81.3b 52.9a 118.1a
A. donax 111.1a 35.4c 75.3c
Significance * *** *** ***
ns: not significant. *P < 0.05, **P < 0.01, ***P < 0.001. Numbers with
different letters differ significantly at P< 0.05 by Tukey’s significant
difference.
Table 7 e NUE-P for different bioenergy plant species andplant tissues at the end of the three growing seasons.
Plant species Trunk(kg kg�1)
Shoots(kg kg�1)
Leaves(kg kg�1)
Total(kg kg�1)
2001
A. cyanophylla 929.0a 715.2ab 701.8a 763.5b
E. camaldulensis 556.8c 453.3b 370.2b 459.3d
P. nigra 767.6b 493.3b 449.5b 614.9c
A. donax 1075.0a 624.6a 899.2a
Significance ** ** *** ***
2002
A. cyanophylla 1249.6a 1000.0ab 769.0 987.4b
E. camaldulensis 835.9b 909.3ab 555.6 741.1b
P. nigra 909.2b 624.6b 587.4 717.0b
A. donax 1498.6a 547.2 1058.1a
Significance * * n.s. **
2003
A. cyanophylla 2307.1a 909.1b 422.6 1013.6b
E. camaldulensis 909.0c 1111.1b 410.9 741.7c
P. nigra 1578.4b 491.8c 435.1 821.0c
A. donax 2056.7a 555.8 1285.0a
Significance * * n.s. ***
ns: not significant. *P < 0.05, **P < 0.01, ***P < 0.001. Numbers with
different letters differ significantly at P< 0.05 by Tukey’s significant
difference.
0 5 10 15 20 25 30 350
50
100
150
200
250
0.0 0.5 1.0 1.5 2.0 2.5 3.00
500
1000
1500
2000
2500
NU
E-N
(kg
kg-1
)
N content (g kg-1)
R2= 0.99
NU
E-P
(kg
kg-1
)
P content (g kg-1)
R2=0.98
a
b
Fig. 3 e Relationship between N and P content across plant
organs and NUE-N (a) and NUE-P (b), respectively.
b i om a s s a n d b i o e n e r g y 4 7 ( 2 0 1 2 ) 1 1 5e1 2 4 121

Author's personal copy
species are also attributed to this cost since the greater
proportion of the total energy input was for the application of
wastewater effluent in the field (Fig. 1). Opposite to the culti-
vation practices and harvesting, irrigation is considered as far
more energy demanding, contributing significantly to the total
energy requirements of plantations. In Portugal five poplar
production systems were analyzed reporting high annual
energy consumption (85 GJ ha�1) [12] attributed to the large
energy requirements for the application ofwastewater effluent
in the field (38 GJ ha�1), which are similar with those present in
the present study. It has been reported high energy consump-
tion (43.1 GJ ha�1) for the establishment year ofA. donaxmainly
causedbywastewater effluent application (22.1 GJ ha�1), which
accounted for 50% of the total energy requirements [24]. Even
lower energy requirements forA. donax rangedbetween7.7 and
22.7 GJ ha�1 has been found in literature [19]. The latter energy
requirements aremuch lower than what we found here due to
the lower water application rates.
4.2. Elemental content and energy density in plant tissues
The energy density in trunk and shoots was not affected by
species reflecting the elemental similarity of these plant parts
with respect to C and H. This was not the case for leaves since
they are more heterogeneous than wood and shoot [22]. The
energy density vary with the elemental content of the fuel,
particularly with the C, O2 and H content, as well as with fuel
physical properties such as moisture and ash content [24].
Differences in energy content have been observed mainly
among plants species, genotypes, and plant tissues, ranging
from 15 to 24 MJ kg�1on a dry basis [22,25] and our findings are
within that range, and are in accordance with those findings
reported in several previous studies. Also, results in this study
showed that C:N and C:P varied greatly with plant species and
plant tissues. Leaves had lower C:N and C:P in all plant
species, ranging from 14 to 22 and 181 to 238, respectively,
suggesting greater potential as feedback in anaerobic diges-
tion since for optimum microbial function a C:N:P ratio of
100e128:4e5:1 is recommended [26].
4.3. Energy yield
Energy yield constitutes an important factor which affects
significantly economic and environmental performance of
bioenergy cultivation. In the present study, energy yield
increased with the age of species due to biomass growth.
Furthermore, plant species affected significantly the energy
yield obtained by different plant tissues as well as the total
energy yield (Table 5). These results are in the same pattern
with biomass production [7], indicating that energy yield
should be more attributed to yielded biomass and its alloca-
tion among plant tissues and less to differentiation of plant
tissues in energy densities as it has been showed before. It has
been reported that biomass yield, and therefore energy yield,
vary greatly with plant species, clones, climatic conditions,
and management practices mainly irrigation, fertilization,
tree density and harvesting cycle [7,27]. For example, in
Europe, dense short rotation plantations (20,000 trees ha�1) of
Eucalyptus globules and E. camaldulensis produced 16 and
20 t ha�1 y�1 respectively 2 years after planting [28] and these
values, correspond approximately to 308 and 385 GJ ha�1 y�1.
With regard to poplar, it has been reported 8 t ha�1 y�1 dry
biomass which in our estimation corresponds
to155 GJ ha�1 y�1 [29] and this energy yield is much lower
compared to the yields obtained in this study for P. nigra. Great
variation in the yield of different clones of A. donax has been
reported with the average yield reaching about the 11 and
22 t ha�1 in the first and the second growing period, respec-
tively [30]. These values correspond approximately to 196 and
409 GJ ha�1 energy yields, lower than those obtained in this
study. Generally, energy yields achieved by the species of the
present study were higher than those reported in the litera-
ture, which is a presumable result considering the high water
and nutrient availability in soil and the climatewhere the field
experiments were carried out.
4.4. Net energy yield and energy ratio
In the present study, net energy yield and energy followed the
trend of energy yield, since both are directly proportional to
that, showing higher values in A. cyanophylla and E. camaldu-
lensis species. There is quite high variation in literature
regarding net energy yield and energy ratio due to different
species or genotypes, growing conditions, and processing
methods and assumptions, which makes it difficult for any
comparison of our results with earlier studies [6,12,16].
Generally, net energy yields presented in this study, particu-
larly for E. camaldulensis and A. cyanophylla, are considered
high, and ascribed mainly to the obtained energy yields.
Unlike, the energy ratio among the studied species were lower
than those reported for other energy species [6,12,16,18,24].
This indicates a relatively low efficiency in the use of the
energy inputs by the bioenergy plant species of the present
study ascribed to the great energy inputs. In Europe there is
a growing interest in low-inputs production systems in agri-
culture since these are friendlier to the environment [12].
From that point of view plant species and agronomic practices
with greater potential for lower energy requirements aremore
promising. However, the shift from high-input to low-input
production systems may decrease their potential for
biomass and energy production, indicating that more land is
required to compensate the losses. Indeed, in this study
depletion of energy inputs can be achieved by reducing
wastewater effluent application rates, which probably means
lower available water for plant species and hence lower
potential for biomass and energy yield. Also, this probably
suggests that suitable plant species are thosewith lowerwater
demands rather than those with higher biomass yield. This is
compatiblewith directions regarding nutrientmanagement in
effluent irrigated lands discussed below.
Table 8 e Production cost across the different plantspecies.
Plant species Capital2003
O&M2003
TAEC TAECGJ�1
A. cyanophylla 12627.4 1728.6 2945.1 1.2
E. camaldulensis 12627.4 1693.4 2909.9 1.6
P. nigra 12627.4 1633.9 2850.4 3.5
A. donax 12627.4 1812.2 3028.7 2.3
b i om a s s an d b i o e n e r g y 4 7 ( 2 0 1 2 ) 1 1 5e1 2 4122
Author's personal copy
4.5. Nutrient use efficiency (NUE)
NUE-N and NUE-P increased with time in all plant species
whereas differences were also observed among them. These
results are attributed to variations in the amount of plant
biomass and its allocation in the plant tissues across plant
species during the experimental period. The trunk had lower
nutrient content followed by shoots and leaves [7], and the
contributionof eachof plant tissue toplant biomass resulted in
variations in NUE-N and NUE-P, as shown in Fig. 3. Thus, the
increasewith timeof theseparameters is due to the increase in
plant biomassand its greater allocation in the trunkandshoots
than in leaves, particularly for the tree species. Similarly,
P. nigra, having greater allocation of biomass in the trunk and
lower in the leaves had the highest NUE-N compared to other
plant species. In contrast,A. donax species, having only shoots
and leaves, had the lowest NUE-N. However, the opposite
occurred forNUE-P ofA. donax, having thehighest value,which
is attributed to low P content in the shoots [7]. In this study, the
plant species with the lower NUE-N tended to accumulate less
nitrates in soil than thosewith higher NUE-N [8]. An important
factor for this result is the fact that the first ones assimilate
higher amounts of N in relation to their biomass, suggesting
that the plant species with low NUE-N are more suitable in
cases of irrigationwith liquids rich inN.However, this doesnot
seem to apply in cases of irrigation with fresh water and
application of commercial fertilizers, since plant species with
high NUE usemore efficiently fertilization inputs, whichmake
themmore economically and environmentally sustainable [3].
In addition, the impacts on environment from the use of
fertilizers in those plant species are minimized. In terms of
WUE, to avoid the nutrient accumulation, plant species should
have high WUE attributed, however, mainly to low water
demands rather than high biomass production, as has been
suggested [7]. The suggestion for lower effluent application
rates, in order to reduce the excessive nutrients in soils
exposed to strong wastewater effluent, coincide with that
derived from the energetic analysis of this study, demon-
strating that the reduction of effluent application rates can
serve both energetic and environmental management goals.
4.6. Energy crop production cost
Unlike the capital cost, O&M cost varied considerably across
plant species. A. donax species were clearly more expensive
than the other species, attributed to the annual biomass har-
vesting. In previous studies regarding perennial grasses, i.e.
switchgrass and miscanthus, harvesting was found to be an
expensive annual operation contributing significantly in the
overall annual operation cost [14], as also registered in the
present study.As a result ofO&Mcost, TAECwasalso greater in
A. donax species since it is directly proportional to that (See
Materials andmethods).With regard to energy production cost
(TAEC GJ�1), it was lower in A. cyanophylla and E. camaldulensis
species due to the energy yield produced by those species and
lower O&M cost. It has been found that the cost of production
per tonne or energy decline as yield increases [31]. Also, it was
reported that short rotation species, i.e. willow and eucalyptus,
had the lower production cost (about 3e5 V GJ�1 assuming 15
years of experience of large scale energy crop cultivation) than
that of perennial grasses (5e7 V GJ�1), i.e. miscanthus, switch
grass, and reed canary grass [14], due to the low annualized
costs for theharvestingof short rotationcoppice species (which
takes place every three or four years) and the establishment
cost. Also, it should be pointed out that calculations for O&M in
this study, referring to planting, use of pesticides,weed control,
and harvesting, included only man work which probably
caused an overestimated O&M cost, since the cost of the tradi-
tional farming is higher compared to that of mechanized [32].
However, our resultswere relatively lower than that reported in
previous studies concerning bioenergy plantations, i.e. willow,
poplars, switchgrass and miscanthus [14,33] which is predom-
inantly attributed to the high energy yields and the excluded
operations in the economic analysis such as land cost, cost of
risk, road transport, storage, overheads, wind-up etc.
5. Conclusions
This study showed that plant species can substantially affect
the total energy yield, energy requirements in the field, energy
ratio (energy use efficiency), net energy yield, and production
cost. Moreover, plant species differ in terms of NUE, which
influence the potential adverse environmental impacts
mainly due to excessive N loading. It was concluded that,
species with low NUE, which is opposite to current directions,
and high WUE (i.e. plant species with relatively low water
demands and great biomass allocation in leaves), are more
suitable when irrigation with strong effluent occur and N
removal is primary objective. Our suggestion for lower
effluent application rates coincide with that derived from
energetic analysis and is in agreement with the current trend
for low energy inputs in agriculture. However, this optionmay
lead to reduction of the biomass produced suggesting that
more land is required to compensate the losses. This might be
infeasible, particularly in areas with high needs in food crops
and/or with high land cost. To mitigate the losses in plant
biomass and reduce the adverse environmental impacts from
nutrients, additional practices should be adopted. Options
may include: a. more intense pretreatment particularly with
respect to N to meet crop needs, b. early planting, c. adjust-
ment of planting density, depended on plant species, envir-
omental conditions, and applied practices, to increase the
contribution of leaves in plant biomass, d. shortening of
harvest cycle or accelarated harvest for annual crops, also, to
ensure higher amount of leaves in plant biomass, e. optimi-
zation of dose-method-timing of irrigation according to plant-
soil capacity to assimilate the applied N (e.g. irrigationmethod
designed to deliver effluent to the area of maximum plant
uptake, multiple irrigation events that should be timed to
coincide to period of maximum plant uptake in daily basis,
decrease or interruption of irrigation late in growing period
when plant growth declines etc.). Extension of analysis to
road transport, storage, overheads, land cost and cost of risk
aswell as to environmental concerns such as gaseousN losses
in the field , in larger scale areas and in different regions, will
consolidate the necessary directions and support the multi-
role of plant species in effluent irrigated bioenergy crop
cultivations.
b i om a s s a n d b i o e n e r g y 4 7 ( 2 0 1 2 ) 1 1 5e1 2 4 123
Author's personal copy
Acknowledgments
This work was financed by the EU Coretech project: ICA 3-CT
1999-00012. Thanks are due to K.P. Tsagarakis (Department of
Environmental Engineering Democritus University of Thrace,
Xanthi 67100, Greece) for his contribution regarding the
economic analysis. Also, thanks are due to the Prof. Peter
Cornel (Institute IWAR, Technische Universitat Darmstadt,
Darmstadt, Germany) for his valuable comments and recom-
mendations concerning the manuscript and to Mr. K. Tsiotas
(CRES-Athens) for his contribution to analysis of samples.
r e f e r e n c e s
[1] Communication from the Commission. Renewable EnergyRoad Map. Renewable energies in the 21st century: buildinga more sustainable future. COM 2006;848. final (2007.01010).
[2] Bozbas K. Biodiesel as an alternative motor fuel: productionand policies in the European Union. Renew Sust Energ Rev2008;12(2):542e52.
[3] Jaradat A. Genetic resources of energy crops: biologicalsystems to combat climate change. Review article. Aust JCrop Sci (AJCS) 2010;4(5):309e23.
[4] Paranychianakis NV, Angelakis AN, Leverenz H,Tchobanoglous G. Treatment of wastewater with slow ratesystems: a review of treatment processes and plantfunctions. Crit Rev Env Sci Tec 2006;36(3):187e259.
[5] Chatzakis MK, Tzanakakis VA, Mara DD, Angelakis AN.Irrigation of castor bean (Ricinus communis L.) and sunflower(Helianthus annus L.) plant species with municipalwastewater effluent: impacts on soil properties and seedyield. Water 2011;3(4):1112e27.
[6] Heller MC, Keoleian GA, Volk TA. Life cycle assessment ofa willow bioenergy cropping system. Biomass Bioenerg 2003;25(2):147e65.
[7] Tzanakakis VA, Paranychianakis NV, Angelakis AN. Nutrientremoval and biomass production in land treatment systemsreceiving domestic effluent. Ecol Eng 2009;35(10):1485e92.
[8] Tzanakakis VA, Paranychianakis NV, Londra PA,Angelakis AN. Effluent application to the land: changes insoil properties and treatment potential. Ecol Eng 2011;37(11):1757e64.
[9] Tzanakakis VA, Angelakis AN. Chemical exergy as a unifiedand objective indicator in the assessment and optimizationof land treatment systems. Ecol Model 2011;222(17):3082e91.
[10] Mead DJ, Pimentel D. Use of energy analyses in silviculturaldecision-making. Biomass Bioenerg 2006;30(4):357e62.
[11] Lewandowski I, Schmidt U. Nitrogen, energy and land useefficiencies of miscanthus, reed canary grass and triticale asdetermined by the boundary line approach. Agr EcosystEnviron 2006;112(4):335e46.
[12] Nonhebel S. Energy yields in intensive and extensivebiomass production systems. Biomass Bioenerg 2002;22(3):159e67.
[13] Rosenqvist H, Dawson M. Economics of using wastewaterirrigation of willow in Northern Ireland. Biomass Bioenerg2005;29(2):83e92.
[14] Ericsson K, Rosenqvist H, Nilsson LJ. Energy crop productioncosts in the EU. Biomass Bioenerg 2009;33(11):1577e86.
[15] Tzanakakis VE, Paranychianakis NV, Angelakis AN.Performance of slow rate systems for treatment of domesticwastewater. Water Sci Technol 2007;55(1e2):139e47.
[16] Mantineo M, D’Agosta GM, Copani V, Patane C, Cosentino SL.Biomass yield and energy balance of three perennial cropsfor energy use in the semi-arid Mediterranean environment.Field Crop Res 2009;114(2):204e13.
[17] Doering C. Accounting for energy in farm machinery andbuildings. In: Pimentel D, editor. Handbook of energyutilization in agriculture Boca Raton. Florida: CRC Press;1980.
[18] Ercoli L, Mariotti M, Masoni A, Bonari E. Effect of irrigationand nitrogen fertilization on biomass yield and efficiency ofenergy use in crop production of Miscanthus. Field Crop Res1999;63(1):3e11.
[19] Angelini LG, Ceccarini L, Bonari E. Biomass yield and energybalance of giant reed (Arundo donax L.) cropped in centralItaly as related to different management practices. Eur JAgron 2005;22(4):375e89.
[20] Boehmel C, Lewandowski I, Claupein W. Comparing annualand perennial energy cropping systems with differentmanagement intensities. Agr Syst 2008;96(1e3):224e36.
[21] Scholz V, Heiermann M, Kaulfuss P. Sustainability of energycrop cultivation in Central Europe sociology, organicfarming, climate change and soil science. In: Lichtfouse E,editor. Netherlands: Springer; 2010. p. 109.
[22] Senelwa K, Sims REH. Fuel Characteristics of short rotationforest biomass. Biomass Bioenerg 1999;17(2):127e40.
[23] Borboudaki KE, Paranychianakis NV, Tsagarakis KP.Integrated wastewater management reporting at touristareas for recycling purposes, including the case study ofHersonissos, Greece. J Environ Manage 2005;36(4):610e23.
[24] Prochnow A, Heiermann M, Plochl M, Amon T, Hobbs PJ.Bioenergy from permanent grassland e a review: 2.Combustion. Bioresource Technol 2009;100(21):4945e54.
[25] Klasnja B, Kopitovic S, Orlovic S. Wood and bark of somepoplar and willow clones as fuelwood. Biomass Bioenerg2002;23(6):427e32.
[26] Pakarinen A, Maijala P, Stoddard FL, Santanen A,Tuomainen P, Kymalainen M, et al. Evaluation of annualbioenergy crops in the boreal zone for biogas and ethanolproduction. Biomass Bioenerg 2011;35(7):3071e8.
[27] Labrecque M, Teodorescu TI. Field performance and biomassproduction of 12 willow and poplar clones in short-rotationcoppice in southern Quebec (Canada). Biomass Bioenerg2005;29(1):1e9.
[28] Pereira JPJ, Boudet AM, Mitchell O, Mughini G, Kyritsis S,Dalianis C. Eucalypt plantations for production of raw-material for industry and energy in Europe. In: Chartier ea,editor. Proceedings of the Ninth European BioenergyConference on Biomass for Energy and the Environment.Copenhagen, Denmark: Pergamon, New York; 1996. p. 84.
[29] Moffat AJ, Armstrong AT, Ockleston J. The optimization ofsewage sludge and effluent disposal on energy crops ofshort rotation hybrid poplar. Biomass Bioenerg 2001;20(3):161e9.
[30] Cosentino SL, Copani V, D’Agosta GM, Sanzone E,Mantineo M. First results on evaluation of Arundo donax L.clones collected in Southern Italy. Ind Crop Prod 2006;23(2):212e22.
[31] Bullard M. Economics of miscanthus production. In:Jones MB, WM, editors. Miscanthus for energy and fibre.London: James and James (Science Publishers) Ltd.; 2001.
[32] Karale DS, KV, Bhende SM, Amle SB, Wankhede PS. Energyeconomic of small farming crop production operations.World J Agr Sci 2008;4(4):476e82.
[33] Smeets EMW, Lewandowski IM, Faaij APC. The economicaland environmental performance of miscanthus andswitchgrass production and supply chains in a Europeansetting. Renew Sust Energ Rev 2009;13(6e7):1230e45.
b i om a s s an d b i o e n e r g y 4 7 ( 2 0 1 2 ) 1 1 5e1 2 4124