sperm competition and the evolution of sperm design in mammals
TRANSCRIPT
RESEARCH ARTICLE Open Access
Sperm competition and the evolution of spermdesign in mammalsMaximiliano Tourmente1,2, Montserrat Gomendio1*†, Eduardo RS Roldan1*†
Abstract
Background: The influence of sperm competition upon sperm size has been a controversial issue during the last20 years which remains unresolved for mammals. The hypothesis that, when ejaculates compete with rival males,an increase in sperm size would make sperm more competitive because it would increase sperm swimming speed,has generated contradictory results from both theoretical and empirical studies. In addition, the debate hasextended to which sperm components should increase in size: the midpiece to accommodate more mitochondriaand produce more energy to fuel motility, or the principal piece to generate greater propulsion forces.
Results: In this study we examined the influence of sperm competition upon sperm design in mammals using amuch larger data set (226 species) than in previous analyses, and we corrected for phylogenetic effects by using amore complete and resolved phylogeny, and more robust phylogenetic control methods. Our results show that, assperm competition increases, all sperm components increase in an integrated manner and sperm heads becomemore elongated. The increase in sperm length was found to be associated with enhanced swimming velocity, anadaptive trait under sperm competition.
Conclusions: We conclude that sperm competition has played an important role in the evolution of sperm designin mammals, and discuss why previous studies have failed to detect it.
BackgroundSperm competition occurs when females mate with morethan one male in each sexual cycle and sperm from rivalmales compete to fertilize the ova [1]. A large body ofevidence has accumulated over the last few years showingthat sperm competition is a potent evolutionary forcethat has shaped many reproductive traits [2-4]. Analmost universal response to sperm competition acrosstaxa is an increase in sperm numbers, which enhancesmales’ fertilization success in competitive contexts [5-8].Early theoretical models proposed that the increase in
sperm numbers under sperm competition was achieved atthe expense of a reduction in their size, leading to the evo-lution of tiny sperm [9,10]. The presumed trade-offbetween sperm numbers and size is one of the most widelyaccepted assumptions in studies of gamete evolution, parti-cularly in relation to the evolution of anisogamy [9,11].
Most empirical studies have therefore assumed that a posi-tive relationship between sperm numbers and size is evi-dence against the predicted trade-off, and following thisreasoning it has been concluded that there is no supportfor the sperm size/number trade-off except in cases ofsperm gigantism [12,13] (reviewed in [14]). However,sperm competition game models are not based on the“direct trade-off”, which assumes a fixed budget for ejacu-late expenditure and predicts a trade-off between spermsize and numbers [15]. Instead, such models are based onthe “indirect trade-off” which assumes a fixed budget formale reproductive activity and proposes that investment inejaculates is traded-off against energy spent on mate acqui-sition. Irrespective of this distinction, it is assumed that eja-culate expenditure is the product of the number of spermand their size [14]. Models developed by Parker [16] con-sidered different advantages that could derive from anincrease in sperm size, and concluded that, if the mainselective benefit is that sperm become more competitive,sperm competition should not select for an increase insperm size. Recent models [15] suggest that, even underthe indirect trade-off, sperm size and number do effectively
* Correspondence: [email protected]; [email protected]† Contributed equally1Reproductive Ecology and Biology Group, Museo Nacional de CienciasNaturales (CSIC), José Gutiérrez Abascal 2, 28006 Madrid, SpainFull list of author information is available at the end of the article
Tourmente et al. BMC Evolutionary Biology 2011, 11:12http://www.biomedcentral.com/1471-2148/11/12
© 2011 Tourmente et al; licensee BioMed Central Ltd. This is an Open Access article distributed under the terms of the CreativeCommons Attribution License (http://creativecommons.org/licenses/by/2.0), which permits unrestricted use, distribution, andreproduction in any medium, provided the original work is properly cited.
trade-off directly, even though both can increase with levelsof sperm competition as the total investment on the ejacu-late increases. Other types of theoretical models used phy-sical and biomechanical principles and concluded that, inthe micro-environment in which sperm perform, a rela-tionship between sperm size and competitive ability (swim-ming velocity) is unlikely [17]. These theoretical modelshad a profound influence in this field.Contrary to these theoretical predictions, an alternative
hypothesis proposed that, if an increase in size conferreda competitive advantage to sperm, sperm competitionshould select simultaneously for an increase in spermnumbers and size, and no trade-off between these twotraits should be expected [18]. Preliminary analyses withthe evidence available at the time suggested that spermcompetition did favour an increase in sperm size whichresulted in faster swimming speeds [18].This hypothesis generated an intense controversy
which stimulated a great deal of work on the topic.Empirical work produced an increasing amount of evi-dence showing that levels of sperm competition wereassociated with increases in sperm size when interspeci-fic studies were carried out on taxa as diverse as birds,frogs, fish, butterflies, moths, nematodes (reviewed in[19]) and snakes [20]. In some species in which femalesposses sperm storage organs, this relationship did notbecome apparent until the size of the female storageorgan was taken into account [5,21] (reviewed in [22]).Different hypotheses were proposed to explain the func-
tional significance of increases in the length of differentsperm components: an increase in the flagellum wouldincrease the thrust needed to propel the sperm forward[18], an increase in midpiece volume would increase theamount of energy to fuel sperm motility [20,23,24], and anelongation of the sperm head would reduce the dragexperienced by the sperm cell resulting in an increase insperm swimming velocity [25]. It has also been suggestedthat the ratios between different sperm components couldinfluence sperm swimming velocity [25] and, in particular,that the ratio sperm head length/flagellum length shouldplay an important role [17].Recent studies in mammals [19], birds [26], and fish
[27] have also provided evidence that sperm size is asso-ciated with sperm swimming speed, after phylogeneticeffects are taken into account, lending further support tothe original hypothesis [18]. Furthermore, intraspecificstudies have shown that sperm swimming speed is themain determinant of fertilization success both in compe-titive [28,29] and non-competitive [30-32] contexts.However, the evidence linking sperm competition
levels and sperm size in mammals remains contentiousdue to inconsistencies between studies. An analysisusing a large sample of species reported a relationshipbetween levels of sperm competition and sperm size,
but the relation did not remain significant after phyloge-netic effects were taken into account [33]. Because thisstudy included many more species that others, it hasbeen generally assumed that the information providedwas more reliable and, as a consequence, it is widelyaccepted that no relationship exists between spermcompetition and sperm length among mammals (see, forexample, review in [34]). In addition, further studies onmammals reported either no relationship betweensperm competition and sperm size [35], or an effectexclusively on midpiece volume [23,24].The aim of this study was to carry out the most
extensive study to date of the relationship between levelsof sperm competition and sperm design in mammalsusing all the information currently available, whichincludes a much larger data set and better resolved phy-logenies than those used in previous studies. In addition,we examine the relationship between sperm size andsperm swimming velocity, controlling for phylogeneticeffects, in a larger data set than previously reported.
ResultsIn the study sample of 226 mammals (see additional file 1),total sperm length ranged from 28 μm to 258 μm (CV =43.8 ± 2.6). The head length accounted for a mean 9.4%of the total sperm length, and it ranged from 3.0 to 15.2μm (CV = 29.5% ± 0.2). Midpiece length represented amean 19.9% of the total sperm length (range 3.0-103.1μm) and it showed higher interspecies variability (CV =71.2% ± 0.9) than any other sperm component. The prin-cipal piece accounted for 70.5% of the total sperm length(range: 15.6-142.6 μm; CV = 41.7% ± 1.9). Body mass andtestes mass were extremely variable (CV = 450.53% ±29928.7 and 494.17% ± 27.6, respectively) when com-pared to sperm dimensions. On the other hand, relativetestes mass, which ranged from 0.07 to 5.23, presented avariability (CV = 84.1% ± 0.1) closer to that seen forsperm dimensions. A summary of information on bodymass, relative testes mass and sperm dimensions isshown in additional file 2.We found a significant positive association between
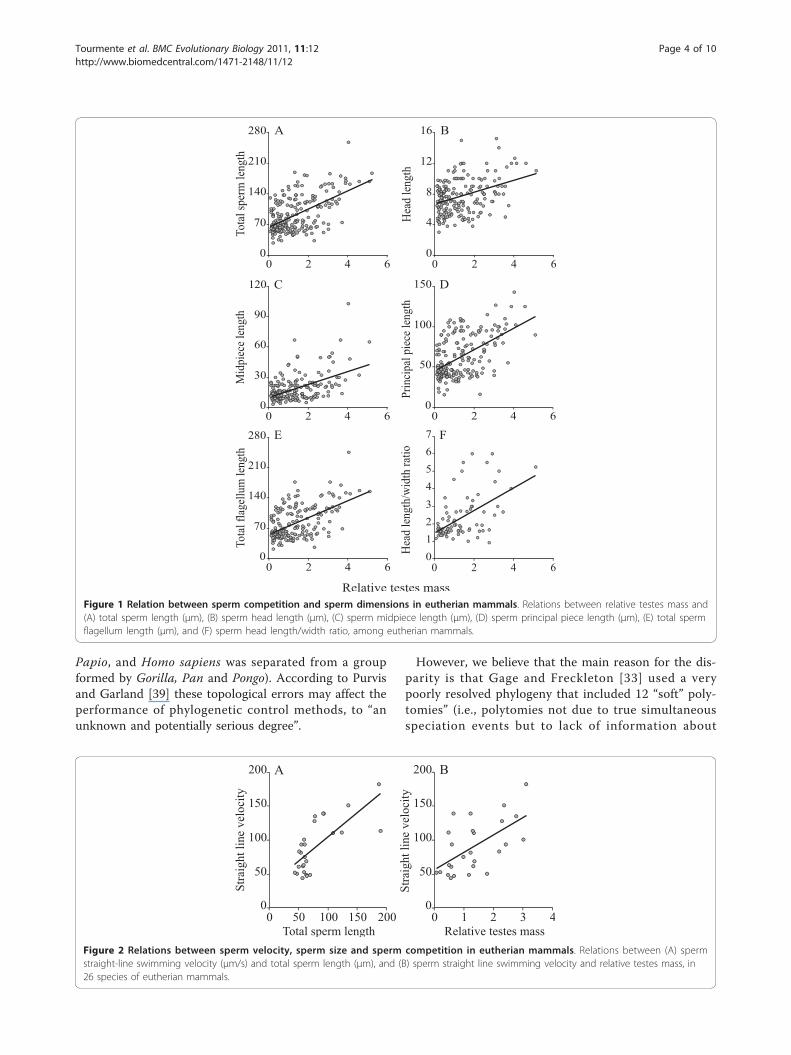
testes mass corrected for body mass (thereafter, relativetestes mass) and total sperm length after controlling forphylogenetic effects (Table 1, Figure 1A). However, totalsperm length was not associated with body mass.The same pattern emerged when the different sperm
components (head, midpiece, principal plus terminalpiece, and flagellum length) were analyzed separately,since all of them became longer as relative testes massincreased, but were unrelated to body mass after con-trolling for phylogenetic effects (Table 1, Figure 1B-E).The strength of the relationship with relative testesmass was similar for all sperm components except formidpiece length which was just below significance level.
Tourmente et al. BMC Evolutionary Biology 2011, 11:12http://www.biomedcentral.com/1471-2148/11/12
Page 2 of 10

In addition, as relative testes mass increased spermheads became more elongated (measured as the ratiohead length/head width) (Table 1, Figure 1F).Total sperm length showed a strong positive associa-
tion with sperm swimming velocity (Table 1, Figure 2A).Sperm swimming velocity was also significantly asso-ciated with relative testes mass, but not with body mass(Table 1, Figure 2B). It is worth noting that relativetestes mass showed a stronger association with spermswimming velocity than with the size of any sperm com-ponent after controlling for phylogenetic effects, andthat the relationship between sperm size and spermswimming velocity is highly significant.The ratio between head length and total flagellum
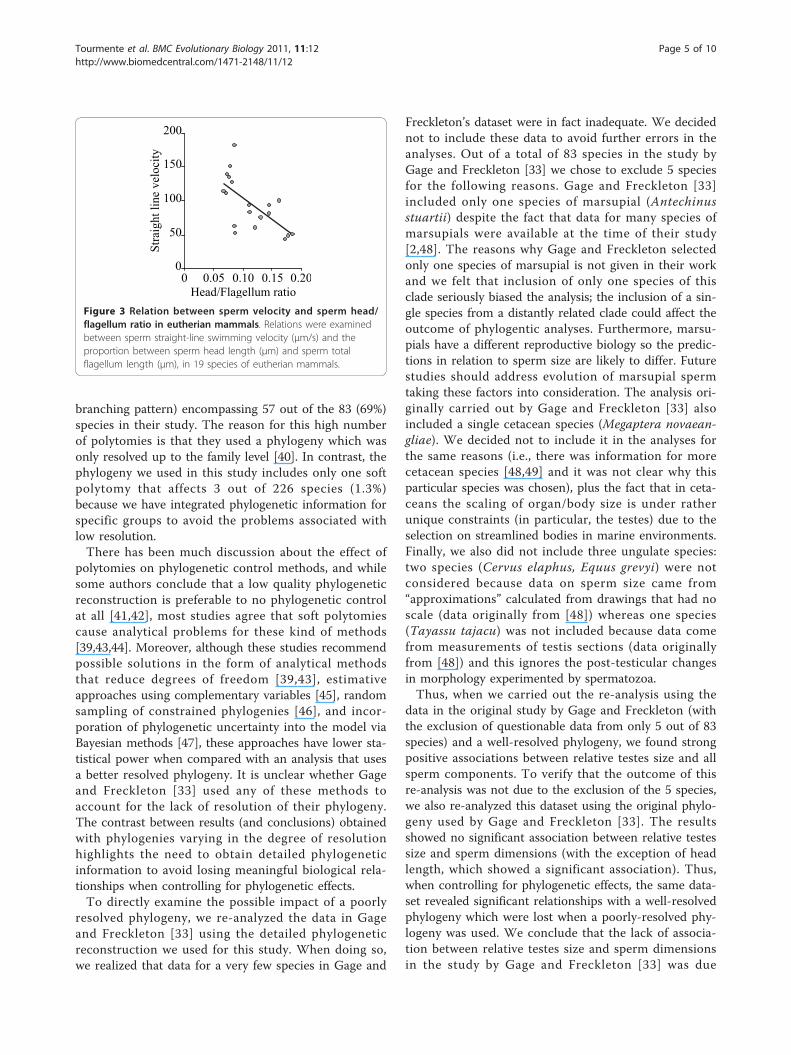
length was significantly associated with straight linevelocity (Table 1, Figure 3) so that as the proportion ofthe flagellum length in relation to head lengthdecreased, sperm velocity also decreased.
DiscussionIn the present study we found evidence suggesting that,in mammals, sperm competition is associated with anincrease in total sperm length, which results from anincrease in size of all sperm components: head, mid-piece, principal plus terminal piece and, hence, flagel-lum. All relationships between relative testes size (aproxy of sperm competition levels) and sperm dimen-sions remained significant after controlling for phyloge-netic effects, except for the midpiece, which was justbelow significance level.
The use of relative testes mass as an index of levelsof sperm competition is widely accepted, since inter-specific phylogenetic analyses and intra-specific compar-isons have shown that both are closely associated(reviewed in [8,36]). In addition, artificial selectionexperiments have shown that the relationship is causal,since experimental increases in sperm competition levelslead to increases in relative testes size [37]. Recent inter-specific analyses, controlling for other variables alsobelieved to influence testes size, show that relative testesmass is clearly related to levels of sperm competition inmammals [38]. The reason why an increase in relativetestes size, and therefore sperm production, seems auniversal response to levels of sperm competition is thatin most taxa sperm numbers influence fertilizationsuccess and enhance male fertilization success incompetitive contexts [5-8,36].Our results contrast with those reported by Gage and
Freckleton [33] who also found clear relationshipsbetween sperm length, and the size of the differentsperm components, and relative testes size, althoughthese relationships were lost after controlling for phylo-genetic effects. The reasons for this discrepancy mayhave to do with the fact that our study has a much lar-ger sample size (226 species in our study versus 83 spe-cies in that by Gage and Freckleton [33]) and that theseauthors used an incorrect grouping of some species(e.g., giraffe was included in Cervidae, Theropithecusgelada was placed in the same group with Erythrocebuspatas and Cercopithecus aethiops rather than with
Table 1 Relations between sperm competition, sperm dimensions and swimming velocity across Eutherian mammals
Dependent variable Predictor Slope F p l r CLs n
total sperm length body mass -8.21 1.06 0.3044 0.999 *, n.s. 0.07 -0.06 to 0.20 226
testes mass 8.24 3.99 0.0471 0.13 0.00 to 0.26
head length body mass 0.74 0.39 0.5317 0.946 *, n.s. 0.05 -0.10 to 0.19 194
testes mass 0.86 6.53 0.0114 0.18 0.04 to 0.33
midpiece length body mass -2.63 0.14 0.7116 0.945 *, n.s. 0.03 -0.12 to 0.17 194
testes mass 3.18 3.41 0.0665 0.13 -0.01 to 0.27
principal piece length body mass -7.57 2.04 0.1547 0.956 *, n.s. 0.10 -0.04 to 0.25 194
testes mass 7.32 5.62 0.0188 0.17 0.03 to 0.31
total flagellum length body mass -8.99 0.89 0.3456 0.999 *, n.s. 0.07 -0.07 to 0.21 194
testes mass 9.61 5.32 0.0222 0.16 0.02 to 0.31
head length/head width body mass -0.50 0.14 0.7076 0.783 *, * 0.04 -0.18 to 0.27 79
testes mass 0.56 5.72 0.0193 0.26 0.05 to 0.50
straight line velocity body mass -39.86 2.08 0.1624 0.880 n.s., n.s. 0.29 -0.11 to 0.71 26
testes mass 45.71 10.56 0.0035 0.56 0.23 to 1.04
straight line velocity total sperm length 0.72 29.66 <0.0001 <0.001 n.s., n.s. 0.74 0.55 to 1.37 26
straight line velocity head length/flagellum length -635.59 10.55 0.0047 <0.001 n.s., n.s. 0.62 0.23 to 1.21 19
Phylogenetically controlled multiple regression analyses revealing the effect of relative testes mass on sperm dimensions and sperm velocity, and the effect ofsperm length and the proportion between sperm head and flagellum on sperm velocity. The superscripts following the l value indicate significance levels (n.s.p > 0.05; * p < 0.05) in a likelihood ratio tests against models with l = 0 (first position) and l = 1 (second position). The effect size r calculated from the F valuesand its non-central 95% confidence limits (CLs) are presented. Confidence intervals excluding 0 indicate statistically significant relationships. The p values and CLthat indicate statistical significance are shown in bold. Abbreviations: n: number of species in each analysis.
Tourmente et al. BMC Evolutionary Biology 2011, 11:12http://www.biomedcentral.com/1471-2148/11/12
Page 3 of 10
Papio, and Homo sapiens was separated from a groupformed by Gorilla, Pan and Pongo). According to Purvisand Garland [39] these topological errors may affect theperformance of phylogenetic control methods, to “anunknown and potentially serious degree”.
However, we believe that the main reason for the dis-parity is that Gage and Freckleton [33] used a verypoorly resolved phylogeny that included 12 “soft” poly-tomies” (i.e., polytomies not due to true simultaneousspeciation events but to lack of information about
Relative testes mass
D
0 2 4 60
50
100
150
Pri
nci
pal
pie
ce l
ength
C
0 2 4 60
30
60
90
120
Mid
pie
ce l
ength
B
0 2 4 60
4
8
12
16
Hea
d l
ength
E
0 2 4 60
70
140
210
280
Tota
l fl
agel
lum
len
gth
A
0 2 4 60
70
140
210
280
Tota
l sp
erm
len
gth
F
0 2 4 60
1
2
3
4
5
6
7
Hea
d l
ength
/wid
th r
atio
Figure 1 Relation between sperm competition and sperm dimensions in eutherian mammals. Relations between relative testes mass and(A) total sperm length (μm), (B) sperm head length (μm), (C) sperm midpiece length (μm), (D) sperm principal piece length (μm), (E) total spermflagellum length (μm), and (F) sperm head length/width ratio, among eutherian mammals.
A B
0 50 100 150 200
Total sperm length
0
50
100
150
200
Str
aight
line
vel
oci
ty
0 1 2 3 4
Relative testes mass
0
50
100
150
200
Str
aight
line
vel
oci
ty
Figure 2 Relations between sperm velocity, sperm size and sperm competition in eutherian mammals. Relations between (A) spermstraight-line swimming velocity (μm/s) and total sperm length (μm), and (B) sperm straight line swimming velocity and relative testes mass, in26 species of eutherian mammals.
Tourmente et al. BMC Evolutionary Biology 2011, 11:12http://www.biomedcentral.com/1471-2148/11/12
Page 4 of 10
branching pattern) encompassing 57 out of the 83 (69%)species in their study. The reason for this high numberof polytomies is that they used a phylogeny which wasonly resolved up to the family level [40]. In contrast, thephylogeny we used in this study includes only one softpolytomy that affects 3 out of 226 species (1.3%)because we have integrated phylogenetic information forspecific groups to avoid the problems associated withlow resolution.There has been much discussion about the effect of
polytomies on phylogenetic control methods, and whilesome authors conclude that a low quality phylogeneticreconstruction is preferable to no phylogenetic controlat all [41,42], most studies agree that soft polytomiescause analytical problems for these kind of methods[39,43,44]. Moreover, although these studies recommendpossible solutions in the form of analytical methodsthat reduce degrees of freedom [39,43], estimativeapproaches using complementary variables [45], randomsampling of constrained phylogenies [46], and incor-poration of phylogenetic uncertainty into the model viaBayesian methods [47], these approaches have lower sta-tistical power when compared with an analysis that usesa better resolved phylogeny. It is unclear whether Gageand Freckleton [33] used any of these methods toaccount for the lack of resolution of their phylogeny.The contrast between results (and conclusions) obtainedwith phylogenies varying in the degree of resolutionhighlights the need to obtain detailed phylogeneticinformation to avoid losing meaningful biological rela-tionships when controlling for phylogenetic effects.To directly examine the possible impact of a poorly
resolved phylogeny, we re-analyzed the data in Gageand Freckleton [33] using the detailed phylogeneticreconstruction we used for this study. When doing so,we realized that data for a very few species in Gage and
Freckleton’s dataset were in fact inadequate. We decidednot to include these data to avoid further errors in theanalyses. Out of a total of 83 species in the study byGage and Freckleton [33] we chose to exclude 5 speciesfor the following reasons. Gage and Freckleton [33]included only one species of marsupial (Antechinusstuartii) despite the fact that data for many species ofmarsupials were available at the time of their study[2,48]. The reasons why Gage and Freckleton selectedonly one species of marsupial is not given in their workand we felt that inclusion of only one species of thisclade seriously biased the analysis; the inclusion of a sin-gle species from a distantly related clade could affect theoutcome of phylogentic analyses. Furthermore, marsu-pials have a different reproductive biology so the predic-tions in relation to sperm size are likely to differ. Futurestudies should address evolution of marsupial spermtaking these factors into consideration. The analysis ori-ginally carried out by Gage and Freckleton [33] alsoincluded a single cetacean species (Megaptera novaean-gliae). We decided not to include it in the analyses forthe same reasons (i.e., there was information for morecetacean species [48,49] and it was not clear why thisparticular species was chosen), plus the fact that in ceta-ceans the scaling of organ/body size is under ratherunique constraints (in particular, the testes) due to theselection on streamlined bodies in marine environments.Finally, we also did not include three ungulate species:two species (Cervus elaphus, Equus grevyi) were notconsidered because data on sperm size came from“approximations” calculated from drawings that had noscale (data originally from [48]) whereas one species(Tayassu tajacu) was not included because data comefrom measurements of testis sections (data originallyfrom [48]) and this ignores the post-testicular changesin morphology experimented by spermatozoa.Thus, when we carried out the re-analysis using the
data in the original study by Gage and Freckleton (withthe exclusion of questionable data from only 5 out of 83species) and a well-resolved phylogeny, we found strongpositive associations between relative testes size and allsperm components. To verify that the outcome of thisre-analysis was not due to the exclusion of the 5 species,we also re-analyzed this dataset using the original phylo-geny used by Gage and Freckleton [33]. The resultsshowed no significant association between relative testessize and sperm dimensions (with the exception of headlength, which showed a significant association). Thus,when controlling for phylogenetic effects, the same data-set revealed significant relationships with a well-resolvedphylogeny which were lost when a poorly-resolved phy-logeny was used. We conclude that the lack of associa-tion between relative testes size and sperm dimensionsin the study by Gage and Freckleton [33] was due
Figure 3 Relation between sperm velocity and sperm head/flagellum ratio in eutherian mammals. Relations were examinedbetween sperm straight-line swimming velocity (μm/s) and theproportion between sperm head length (μm) and sperm totalflagellum length (μm), in 19 species of eutherian mammals.
Tourmente et al. BMC Evolutionary Biology 2011, 11:12http://www.biomedcentral.com/1471-2148/11/12
Page 5 of 10

mainly to the use of a poorly-resolved phylogeny. There-fore, and contrary to the conclusion by Gage and Freck-leton [33], our analyses allow us to conclude that therelationship between sperm dimensions and sperm com-petition in mammals remains robust after adequatelycontrolling for phylogenetic effects.There are also some discrepancies between our results
and those in other studies on mammals. They can beexplained, at least partly, by the different representationof species from different orders in the data sets used.A study on bats found no relationships between levelsof sperm competition and sperm dimensions [35].Because female bats store sperm during hibernation, theneed for sperm to survive inside the female reproductivetract for up to several months could imply that in batssperm competition favours sperm traits which enhancetheir longevity, rather than their swimming speed. Stu-dies by Dixson and colleagues failed to find relationshipsbetween levels of sperm competition and sperm length,or length of various sperm components, first in primates[23] and, subsequently, in mammals [24]. However,since their data derived from samples collected fromcaudae epididymides during post-mortem dissections oftheir zoo animals, it consisted primarily of artiodactylsand primates, and included a low number of carnivoresand only two species of rodents. Thus, the lack of arelationship between levels of sperm competition andthe dimensions of different sperm components found inthese studies could be due to an over representation ofartiodactyls, carnivores and primates which have lowerdiversity in sperm dimensions [50]. Intriguingly, Dixsonand colleagues found a relationship between spermcompetition levels and sperm midpiece volume [23,24].The reason why midpiece volume but not midpiecelength showed a significant relation is not clear, sincedata show that there is very little variation in midpiecelength in artiodactyls, carnivores and primates (see addi-tional file 1). It may be that the width of the midpieceaccounts for most of the variation in midpiece volumebecause of the way it was calculated in that study.Sperm competition seems to act on all sperm compo-
nents in an integrative manner, because they are allfunctionally important and may all contribute in comple-mentary ways to enhance sperm swimming velocity: anincrease in midpiece size probably increases energy out-put [23], and longer principal pieces will generate greaterthrust to propel the sperm along the female reproductivetract [18] and generate additional energy [19]. In addi-tion, our study also found that sperm competition levelsare also associated to the degree of elongation of thesperm head, a trait which has received little attentiondespite the major role it could play in sperm hydrody-namics. Recent intraspecific studies have shown that thedegree of elongation of the sperm head has the strongest
impact upon sperm swimming velocity [25], because itreduces the degree of drag and thus the energy neededfor sperm movement [51]. Thus, relatively subtle differ-ences in the shape of the sperm head seem to have agreat impact upon swimming performance.We have also been able to show that as sperm become
longer, sperm swimming velocity increases. These find-ings expand on previous work [19] and agree with thoserecently reported for birds [26], fish [27] and sea urchin[52]. Furthermore, we have been able to reveal a directrelationship between levels of sperm competition andsperm swimming speed, a link that other studies havefailed to find [26]. Interestingly, relative testes size ismore strongly associated with sperm swimming velocitythan it is with the size of any sperm component, andthe relationship between sperm size and sperm swim-ming velocity is by far the strongest of all the relation-ships found. This means that relatively small changes inthe size of all sperm components and the shape of thehead have a major impact on sperm swimming velocity.Finally, we show that sperm velocity is inversely
related to the ratio between head length and flagellumlength. Humphries et al. [17] suggested that, sincesperm cells are extremely small, thus operating in a lowReynolds number environment, sperm velocity shouldbe determined by the balance between the propulsiveforce (which would increase with flagellum length) anddrag (which would be related to head length). Our find-ings represent the first comparative evidence supportingthis hypothesis, for which a recent intraspecific studyalso found support [53].While the picture emerging from interspecific studies
seems to support the hypothesis that sperm competitionfavours increases in sperm size, which enhance spermswimming velocity resulting in improved fertilizationsuccess, the intraspecific studies seem contradictory.Thus, a number of studies show a relationship betweensperm dimensions and velocity [25,53,54], whereas arecent review revealed that some intraspecific studiesdid not find a relationship [17]. This may be due to thefact that the methodology used has enough resolution todetect relationships between species because they differto a large extent in sperm size, but is insufficient todetect them at the intraspecific level given the smallmagnitude of differences and the large degree of varia-tion within species and within males. A recent intraspe-cific study [52] has shown that when sperm data on sizeand swimming velocity come from the same spermato-zoa, the relationship is clear. However, when data onsize come from a different sperm subsample than dataon sperm swimming velocity (as is the case in most stu-dies) such relationships are not found.Other intraspecific studies have concluded that small
sperm are more competitive (e.g. [55,56]. Studies on
Tourmente et al. BMC Evolutionary Biology 2011, 11:12http://www.biomedcentral.com/1471-2148/11/12
Page 6 of 10
insect models suffer from the limitation that so far it hasnot been possible to evaluate sperm swimming velocityin these species. Thus, the potential relationshipsbetween sperm size and sperm swimming velocity can-not be evaluated in these taxa until the technical diffi-culties are solved. It should also be noted that mostintraspecific studies do not actually measure “fertiliza-tion success” but rather some measure of paternity suc-cess. Thus, they cannot exclude other factors that couldbe playing a role at any stage after fertilization and dur-ing embryo development.Despite these caveats, it is plausible that the benefits
of increasing/decreasing sperm size vary between taxa.Since many intraspecific studies have been carried outon insects, one possibility is that because in this particu-lar group sperm remain in storage organs for long peri-ods of time, variables other than sperm size may bemore important at determining fertilization success.Thus, sperm longevity may be the major determinant offertilization success. If so, small sperm may be at anadvantage if they are able to survive for longer, asshown in external fertilizers [31], but the informationcurrently available does not allow to test this hypothesisproperly.The relevance of our findings for other taxa is sup-
ported by evidence from a recent review showing thatthe relationship between sperm competition and spermsize is widespread across taxa [19]. Since female mam-mals have no sperm storage organs, sperm survive forshort periods of time in the female reproductive tractand have to overcome relatively long distances to reachthe ova. Under these conditions fertilization success isdetermined mainly by sperm swimming velocity [32],and there are no confounding effects of co-evolutionbetween sperm size and female storage organs. Thus, itis in this system that the race to fertilize the ova is likelyto be the most important underlying mechanismexplaining fertilization success in competitive contexts.The outcome is that sperm competition selects for bothincreased sperm numbers and size, so total ejaculateexpenditure increases. The increase in ejaculate expendi-ture is energetically costly [57,58], but whether itrequires a trade-off with mating acquisition, or otherlife-history traits [e.g. [59-61]], remains to be explored.
ConclusionsOur findings provide further support to the originalhypothesis that the main adaptive value of changes insperm design under sperm competition is that theyincrease sperm swimming velocity [18]. Since a numberof studies have shown that sperm swimming velocity isa main determinant of fertilization success[19,28,29,32,62], this explains why it is targeted by sex-ual selection so efficiently.
This study presents phylogenetically-robust evidencethat sperm competition in mammals favours anincrease in the size of all sperm components and anelongation of the head, which result in faster swim-ming speeds.
MethodsThe study sample includes all eutherian mammals forwhich information was obtained. In those cases inwhich different values for the same species were avail-able from different studies, averages were used. We havenot included in the analysis a few species for which theonly data available were “approximations from Retzius’illustrations” because they lacked a reference scale (seeMethods and footnote to Table 1 in [48]). Additionally,we have not included Chiroptera due to their unusualreproductive traits which include sperm storage for longperiods of time in the female tract.
Sperm competition levels, sperm design and spermswimming velocityData on relative testes mass and sperm dimensions wereobtained from the literature for 226 species (39 families)of eutherian mammals (see additional file 1 for data andadditional file 3 for references). Sperm dimensionsincluded total sperm length (TSL), head length (HL),head width (HW), midpiece length (MPL), principalpiece length (PPL), and total flagellum length (TFL). Wealso calculated the ratio HL/HW.Data on sperm swimming velocity from fresh, non-
capacitated sperm were obtained from the literature for26 species (15 families) of eutherian mammals (seeadditional file 4 for data and additional file 3 for refer-ences). We used information on average straight-linevelocity (VSL: velocity calculated using the straight-linedistance between the beginning and end of the spermtrack), since it is a commonly used measure of spermswimming velocity. In any case, VSL significantly corre-lates with other sperm swimming parameters such ascurvilinear velocity (VCL) or average-path velocity(VAP) [19,32].
Data analysesTo test whether levels of sperm competition were asso-ciated with sperm dimensions, we performed multipleregression analyses using HL, MPL, PPL, TFL, TSL, HL/HW ratio and VSL for all species as dependent variablesand relative testes mass (a proxy of sperm competitionlevels) as predictor. To accurately represent relativetestes mass as a measure of sperm competition [38], weperformed multiple regression analyses including bothlog10-transformed testes mass and body mass as predic-tors of sperm dimensions. Since predictor variables wererelated to each other (thus non orthogonal) (additional
Tourmente et al. BMC Evolutionary Biology 2011, 11:12http://www.biomedcentral.com/1471-2148/11/12
Page 7 of 10
file 5), multiple regression analysis was performed usinga sequential (Type I) sum of squares, in which the pre-dictor variables were added to the model in the follow-ing order: body mass, testes mass.Species data may not be free of phylogenetic associa-
tion, since they may share character values as a result ofa common ancestry rather than independent evolution[63], and thus may not be truly independent [64]. Tocontrol for this phylogenetic inertia, we used a general-ized least-squares (GLS) approach in a phylogenetic fra-mework [41]. This method estimates a phylogeneticscaling parameter lambda (l) which represents thetransformation that makes the data fit the Brownianmotion evolutionary model. If l values are close to 0,the variables are likely to have evolved independently ofphylogeny, whereas l values close to 1 indicate strongphylogenetic association of the variables. As an advan-tage, GLS allows a variable degree of phylogenetic cor-rection according to each tested model, accounting fordifferent levels of phylogenetic association between dif-ferent traits. The estimation of l values and GLS ana-lyses were performed using a code written byR. Freckleton for the statistical package R v.2.8.1(R Foundation for Statistical Computing 2009) and themaximum likelihood value of l was compared againstmodels with l = 1 and l = 0.A complete phylogeny for all analyzed species was not
available. Therefore, a phylogenetic reconstruction wasused (additional file 6). Morphological and moleculartrees constructed for the Eutheria were used to deter-mine the phylogenetic position of the higher groups(orders and families), and group-specific phylogenies(both morphological and molecular) were used in thecase of the groups that accounted for more than twospecies (references in additional file 3).All statistical analyses were conducted with R v.2.8.1,
and p-values were considered statistically significant ata < 0.05. We avoided the use of Bonferroni correctionsince it increases the chances of committing type IIerrors [65]. Alternatively, we calculated the effect size rfrom F values [66-68] obtained from the GLS model;effect sizes ≥ 0.5 were considered large [69]. Finally, wecalculated the non-central confidence limits (CLs) for r,which indicate statistical significance if 0 is not con-tained within the interval [70].To be able to show values for relative testes mass in
the figures, values were calculated by dividing the actualtestes mass by the predicted testes mass, which wasobtained using the allometric relation between testesmass and body mass predicted by Kenagy and Trombu-lak [49] for all mammalian species: testes mass = 0.035× body mass0.72. However, because this measure hasbeen criticized as an inaccurate index of sperm
competition levels due to allometric problems [71], wehave not used it in any of the statistical analyses.
Additional material
Additional file 1: Sperm dimensions, body mass, testes mass andrelative testes size in 226 species of eutherian mammals.Abbreviations: HW: sperm head width (μm). HL: sperm head length (μm).MPL: sperm midpiece length (μm). PPL: sperm principal piece length(μm). TFL: total sperm flagellum length (μm). TSL: total sperm length(μm). B mass: body mass (g). T mass: testes mass (g). RTS: relative testesmass. SD: sperm dimensions.
Additional file 2: Mean values and range of corporal and spermdimensions in 226 species of eutherian mammals. CV is thecoefficient of variation. % TSL is the mean percentage of the total spermlength represented by each sperm component. The mean percentage ofincrement indicates the difference between the lowest to the highestvalue among species.
Additional file 3: References for the additional files.
Additional file 4: Sperm velocity and sperm length in 26 species ofeutherian mammals. Abbreviations: VSL: sperm straight line velocity(μm/s). TSL: total sperm length (μm).
Additional file 5: Relations between testes mass (g) and body mass(g) in 226 species of eutherian mammals. Values have been convertedto Log10 (p < 0.0001, R2 = 0.85). The line represented corresponds to theequation of the relation between these two variables published byKenagy & Trombulak (1986): Log testes mass = (0.72 * Log10 body mass)- 1.4559.
Additional file 6: Phylogenetic reconstruction for the 226 eutherianmammal species utilized in the GLS analysis.
AcknowledgementsWe are grateful to Becky Colley for her preliminary work compiling datafrom the literature and to Rob Asher for his advice on mammalianphylogenies. Funding was provided by the Spanish Ministry of Science andInnovation. We thank Margarita Chiaraviglio for her support.
Author details1Reproductive Ecology and Biology Group, Museo Nacional de CienciasNaturales (CSIC), José Gutiérrez Abascal 2, 28006 Madrid, Spain. 2Laboratoriode Biología del Comportamiento, Facultad de Ciencias Exactas, Físicas yNaturales, Universidad Nacional de Córdoba, Vélez Sarsfield 299, X5000JJCCórdoba, Argentina.
Authors’ contributionsAll authors designed and performed research, carried out data compilationand analyses, and participated in preparation of the manuscript. All authorsread and approved the final manuscript.
Authors’ informationM. Tourmente enjoyed a Boehringer Ingelheim Travel Grant and apostdoctoral fellowship of the Consejo Nacional de InvestigacionesCientíficas y Técnicas (CONICET), Argentina. M. Tourmente is currently apostdoctoral researcher funded by the Programa Nacional de Movilidad deRecursos Humanos de Investigación of the Spanish Ministry of Education.
Received: 8 May 2010 Accepted: 13 January 2011Published: 13 January 2011
References1. Parker GA: Sperm competition and its evolutionary consequences in the
insects. Biol Rev 1970, 45:525-567.2. Birkhead TR, Møller AP: Sperm Competition and Sexual Selection San Diego:
Academic Press; 1998.
Tourmente et al. BMC Evolutionary Biology 2011, 11:12http://www.biomedcentral.com/1471-2148/11/12
Page 8 of 10
3. Simmons LW: Sperm Competition and Its Evolutionary Consequences in theInsects Princeton: Princeton University Press; 2001.
4. Birkhead TR, Hosken DJ, Pitnick S: Sperm Biology. An Evolutionary PerspectiveBurlington, MA: Academic Press; 2009.
5. Briskie JV, Montgomerie R: Sperm size and sperm competition in birds.Proc R Soc Lond B Biol Sci 1992, 247:89-95.
6. Jennions MD, Passmore NI: Sperm competition in frogs: Testis size and“sterile male” experiment on Chiromantis xerampelina (Rhacophoridae).Biol J Linn Soc 1993, 50:211-220.
7. Gage MJG: Associations between body size, mating pattern, testis sizeand sperm lengths across butterflies. Proc R Soc Lond B Biol Sci 1994,258:247-254.
8. Gomendio M, Harcourt AH, Roldan ERS: Sperm competition in mammals.In Sperm Competition and Sexual Selection. Edited by: Birkhead TR, MollerAP. San Diego: Academic Press; 1998:667-756.
9. Parker GA: Why are there so many tiny sperm? Sperm competition andthe maintenance of two sexes. J Theor Biol 1982, 96:281-294.
10. Parker GA: Sperm competition and the evolution of animal matingstrategies. In Sperm Competition and the Evolution of Animal MatingSystems. Edited by: Smith RL. London: Academic Press; 1984:1-60.
11. Parker GA: Selection on non-random fusion of gametes during theevolution of anisogamy. J Theor Biol 1978, 73:1-28.
12. Pitnick S, Markow TA: Male gametic strategies: sperm size, testes size,and the allocation of ejaculates among successive mates by the sperm-limited fly Drosphila pachea and its relatives. Am Nat 1994, 143:785-819.
13. Pitnick S: Investment in testes and the cost of making long sperm inDrosophila. Am Nat 1996, 148:57.
14. Lessells CM, Snook RR, Hosken DJ: The evolutionary origin andmaintenance of sperm: selection for a small, motile gamete matingtype. In Sperm Biology: An Evolutionary Perspective. Edited by: Birkhead TR,Hosken DJ, Pitnick S. Burlington: Academic Press; 2009:43-67.
15. Parker GA, Immler S, Pitnick S, Birkhead TR: Sperm competition games:sperm size (mass) and number under raffle and displacement, and theevolution of P2. J Theor Biol 2010, 264:1003-1023.
16. Parker GA: Sperm competition and the evolution of ejaculates: towards atheory base. In Sperm Competition and Sexual Selection. Edited by: BirkheadTR, Moller AP. San Diego: Academic Press; 1998:3-54.
17. Humphries ST, Evans JP, Simmons LW: Sperm competition: linking form tofunction. BMC Evol Biol 2008, 8:319-329.
18. Gomendio M, Roldan ERS: Sperm competition influences sperm size inmammals. Proc R Soc Lond B Biol Sci 1991, 243:181-185.
19. Gomendio M, Roldan ERS: Implications of diversity in sperm size andfunction for sperm competition and fertility. Int J Dev Biol 2008,52:439-447.
20. Tourmente M, Gomendio M, Roldan ERS, Giojalas L, Chiaraviglio M: Spermcompetition and reproductive mode influence sperm dimensions andstructure among snakes. Evolution 2009, 63:2513-2524.
21. Miller GT, Pitnick S: Sperm-female coevolution in Drosophila. Science 2002,298:1230-1233.
22. Snook RR: Sperm in competition: not playing by the numbers. TREE 2005,20:46-53.
23. Anderson MJ, Dixson AF: Sperm competition: Motility and the midpiecein primates. Nature 2002, 416:496.
24. Anderson MJ, Nyholt J, Dixson AF: Sperm competition and the evolutionof sperm midpiece volume in mammals. J Zool 2005, 267:135-145.
25. Malo AF, Gomendio M, Garde J, Lang-Lenton B, Soler AJ, Roldan ERS:Sperm design and sperm function. Biol Lett 2006, 2:246-249.
26. Lüpold S, Calhim S, Immler S, Birkhead TR: Sperm morphology andsperm velocity in passerine birds. Proc R Soc Lond B Biol Sci 2009,276:1175-1181.
27. Fitzpatrick JL, Montgomerie R, Desjardins JK, Stiver KA, Kolm N, Balshine S:Female promiscuity promotes the evolution of faster sperm in cichlidfishes. PNAS 2009, 106:1128-1132.
28. Birkhead TR, Martinez JG, Burke T, Froman DP: Sperm mobility determinesthe outcome of sperm competition in the domestic fowl. Proc R SocLond B Biol Sci 1999, 266:1759-1764.
29. Gage MJG, Macfarlane CP, Yeates S, Ward RG, Searle JB, Parker GA:Spermatozoal traits and sperm competition in Atlantic salmon: Relativesperm velocity is the primary determinant of fertilization success. CurrBiol 2004, 14:44-47.
30. Froman DP, Feltmann AJ, Rhoads ML, Kirby JD: Sperm mobility: A primarydeterminant of fertility in the domestic fowl (Gallus domesticus). BiolReprod 1999, 61:400-405.
31. Levitan DR: Sperm velocity and longevity trade-off and influencefertilization in the sea urchin Lytechinus variegatus. Proc R Soc Lond B BiolSci 2000, 267:531-534.
32. Malo AF, Garde J, Soler AJ, García AJ, Gomendio M, Roldan ERS: Malefertility in natural populations of red deer is determined by spermvelocity and the proportion of normal spermatozoa. Biol Reprod 2005,72:822-829.
33. Gage MJG, Freckleton R: Relative testis size and sperm morphometryacross mammals: no evidence for an association between spermcompetition and sperm length. Proc R Soc Lond B Biol Sci 2003,270:625-632.
34. Pizzari T, Parker GA: Sperm competition and sperm phenotype. In SpermBiology: An Evolutionary Perspective. Edited by: Birkhead TR, Hosken DJ,Pitnick S. Burlington: Academic Press; 2009:207-245.
35. Hosken DJ: Sperm competition in bats. Proc R Soc Lond B Biol Sci 1997,264:385-392.
36. Parker GA, Pizzari T: Sperm competition and ejaculate economics. Biol Rev2010, 85:897-934.
37. Hosken DJ, Ward PI: Experimental evidence for testis size evolution viasperm competition. Ecol Lett 2001, 4:10-13.
38. Soulsbury CD: Genetic patterns of paternity and testes size in mammals.PLoS One 2010, 5:e9581.
39. Purvis A, Garland T Jr: Polytomies in comparative analyses of continuouscharacters. Syst Biol 1993, 42:569-575.
40. Liu FGR, Miyamoto MM, Freire NP, Ong PQ, Tennant MR, Young TS,Gugel KF: Molecular and morphological supertrees for eutherian(placental) mammals. Science 2001, 291:1786-1789.
41. Freckleton R, Harvey PH, Pagel MD: Phylogenetic analysis and comparativedata: a test and review of evidence. Am Nat 2002, 160:712-726.
42. Freckleton R: The seven deadly sins of comparative analysis. J Evol Biol2009, 22:1367-1375.
43. Garland T Jr, Díaz-Uriarte R: Polytomies and phylogenetically independentcontrasts: examination of the bounded degrees of freedom approach.Syst Biol 1999, 48:547-558.
44. Garland T Jr, Bennet AF, Rezende EL: Phylogenetic approaches incomparative physiology. J Exp Biol 2005, 208:3015-3035.
45. Pagel MD: Seeking the evolutionary regression coefficient: an analysis ofwhat comparative methods measure. J Theor Biol 1993, 164:191-205.
46. Housworth EA, Martins EP: Random sampling of constrained phylogenies:conducting phylogenetic analyses when the phylogeny is partiallyknown. Syst Biol 2001, 50:628-639.
47. Huelsenbeck JP: Accomodating phylogenetic uncertainty in evolutionarystudies. Science 2000, 288:2349-2350.
48. Cummins JM, Woodall PF: On mammalian sperm dimensions. J ReprodFertil 1985, 75:153-175.
49. Kenagy GJ, Trombulak C: Size and function of mammalian testes inrelation to body size. J Mammal 1986, 67:1-22.
50. Roldan ERS, Gomendio M, Vitullo AD: The evolution of euhterianspermatozoa and underlying selective forces: female selection andsperm competition. Biol Rev 1992, 67:551-593.
51. Gillies EA, Cannon RM, Green RB, Pacey AA: Hydrodynamic propulsion ofhuman sperm. J Fluid Mech 2009, 625:445-474.
52. Fitzpatrick JL, Garcia-Gonzalez F, Evans JP: Linking sperm length andvelocity: the importance of intramale variation. Biol Lett 2010, 6:797-799.
53. Helfenstein F, Podevin M, Richner H: Sperm morphology, swimmingvelocity, and longevity in the house sparrow Passer domesticus. BehavEcol Sociobiol 2010, 64:557-565.
54. Firman RC, Simmons LW: Sperm midpiece length predicts spermswimming velocity in houe mice. Biol Lett 2020, 6:513-516.
55. Gage MJG, Morrow EH: Experimental evidence for the evolution ofnumerous, tiny sperm via sperm competition. Curr Biol 2003, 13:754-757.
56. Garcia-Gonzalez F, Simmons LW: Shorter sperm confer higher competitivefertilization success. Evolution 2007, 61:816-824.
57. Dewsbury DA: Ejaculate cost and male choice. Am Nat 1982, 279:601-610.58. Olsson M, Madsen T, Shine R: Is sperm really so cheap? Costs of
reproduction in male adders, Vipera berus. Proc Roy Soc Lond Series B1997, 264:455-459.
Tourmente et al. BMC Evolutionary Biology 2011, 11:12http://www.biomedcentral.com/1471-2148/11/12
Page 9 of 10
59. Van Voorhies WA: Production of sperm reduces nematode life-span.Nature 1992, 360:456-458.
60. Simmons LW, Emlen DJ: Evolutionary trade-off between weapons andtestes. Proc Natl Acad Sc USA 2006, 103:16346-16351.
61. Pitnick S, Markow TA, Spicer GS: Delayed male maturity is a cost ofproducing large sperm in Drosophila. Proc Natl Acad Sc USA 1995,92:10614-10618.
62. Gomendio M, Malo AF, Garde J, Roldan ERS: Sperm traits and male fertilityin natural populations. Reproduction 2007, 134:19-29.
63. Harvey PH, Pagel MD: The Comparative Method in Evolutionary BiologyOxford: Oxford University Press; 1991.
64. Felsenstein J: Phylogenies and the comparative method. Am Nat 1985,125:1-15.
65. Nagakawa S: A farewell to Bonferroni: the problems of low statisticalpower and publication bias. Behav Ecol 2004, 15:1044-1045.
66. Rosenthal R: Meta-Analytic Procedures for Social Research Newbury Park:SAGE Publications; 1991.
67. Rosenthal R: Parametric measures of effect size. In The Handbook ofResearch Synthesis. Edited by: Cooper H, Hedges L. New York: SAGEPublications; 1994:231-244.
68. Rosnow R, Rosenthal R: Effect sizes for experimenting psychologists. CanJ Exp Psychol 2003, 57:221-237.
69. Cohen J: Statistical Power Analysis for the Behavioral Sciences New Jersey:Erlbaum, Hillsdale; 1988.
70. Smithson M: Confidence Intervals London: SAGE Publications; 2003.71. Tomkins JL, Simmons LW: Measuring relative investment: a case study of
testes investment in species with alternative male reproductive tactics.Anim Behav 2002, 63:1009-1016.
doi:10.1186/1471-2148-11-12Cite this article as: Tourmente et al.: Sperm competition and theevolution of sperm design in mammals. BMC Evolutionary Biology 201111:12.
Submit your next manuscript to BioMed Centraland take full advantage of:
• Convenient online submission
• Thorough peer review
• No space constraints or color figure charges
• Immediate publication on acceptance
• Inclusion in PubMed, CAS, Scopus and Google Scholar
• Research which is freely available for redistribution
Submit your manuscript at www.biomedcentral.com/submit
Tourmente et al. BMC Evolutionary Biology 2011, 11:12http://www.biomedcentral.com/1471-2148/11/12
Page 10 of 10