sorbonne université - core
TRANSCRIPT

Sorbonne Université
Ecole doctorale 397 : Physique et chimie des matériaux
Synthèse de polymères d'azote par pression comme
matériaux énergétiques du futur
Par Dominique Laniel
Thèse de doctorat en Science des matériaux
Dirigée par Paul Loubeyre
Présentée et soutenue publiquement le 18 septembre 2018
Devant un jury composé de :
Chrystèle Sanloup Professeur, UPMC Présidente
Emmanuel Lacôte Chercheur, CNRS Rapporteur
Julien Haines Chercheur, CNRS Rapporteur
Émilie Labarthe Ingénieure-Chercheure, CNES Examinatrice
Paul Loubeyre Directeur de recherche, CEA Directeur de thèse
Gunnar Weck Ingénieur-Chercheur, CEA Encadrant de thèse


1
“In the end, when it’s over, all that matters is what you’ve done.”
―Alexander the Great

2

3
REMERCIEMENTS
Déjà, ces trois belles années de thèse tirent à leur fin. Rien de tout ce qui a été
accompli durant cette période n'aurait été possible sans de très nombreux appuis et
encouragements.
D'abord, je tiens à remercier mon directeur de thèse Paul Loubeyre. Sa passion
et dévouement pour la science, ses bonnes idées, sa persévérance et ses
encouragements m'ont guidé tout au long de cette thèse. Paul, ce fut un grand privilège
de travailler avec toi, très sincèrement, merci pour tout.
Tout aussi important durant ces années, je remercie chaleureusement mon
encadrant Gunnar Weck. Son grand sens de l'humour, sa patience, sa disponibilité, sa
rigueur et curiosité scientifique, ses bons conseils et son attention aux détails m'ont été
indispensables durant ces trois années. Gunnar, mille mercis.
C’est un grand honneur pour moi que Messieurs Emmanuel Lacôte, Julien
Haines, ainsi que Mesdames Émilie Labarthe et Chrystèle Sanloup aient accepté d’être
membres du jury et je remercie Messieurs Emmanuel Lacôte et Julien Haines pour leurs
commentaires et leurs corrections.
Merci également à tous les autres membres permanents du LHPS : Ramesh
André, Florent Occelli, Thomas Plisson et Agnès Dewaele. Vous avez tous toujours été
disponibles pour me donner un coup de main, me conseiller, discuter science ou autres
et, au final, rendre ce séjour autant fructueux qu'agréable. Évidemment, je remercie
aussi les autres doctorants et apprentis que j'ai côtoyés : Adrien Marizy, Charles Pépin
et Églantine Ruaudel; maintenant tous passés à un échelon supérieur, ainsi que Jean-
Antoine Queyroux pour le temps, trop court, que nous passés ensemble. Merci aussi à
mon cobureau et thésard Bastien Guigue, toujours disponible pour d'amusantes
discussions de physique, sports, politique et autres…
Je tiens à remercier toutes les personnes qui m’ont apporté leur aide sur la ligne
ID27 de l’ESRF, soit Gaston Garbarino, Volodymyr Svitlyk et Mohamed Mezouar. Merci
4
également à toutes les personnes qui ont permis que cette thèse se déroule sans
problème : Catherine Cherfils, François Jollet, Laurent Colombet, Muriel Delaveau,
Brigitte Flouret et, en particulier, Sandra Boullier.
Ces remerciements ne seraient pas complets sans y inclure ceux qui, de l’autre
côté de l’océan, m’ont donné l’énergie et la motivation pour entreprendre, continuer et
terminer cette thèse. Amis de la tendre enfance, du primaire, du secondaire et de
l’université, un très grand merci. Évidemment, mon frère, ma sœur et tout
particulièrement mes parents méritent d’être remerciés. Leur amour inconditionnel – à
la fois rassurant, réconfortant et inspirant – même à 5650 km de distance, s’est à tout
moment fait sentir. Enfin, à ma compagne, avec qui j’ai partagé mes frustrations, mes
espoirs, mes joies et qui a toujours su m’épauler ainsi que m’encourager. Sevgili Başak,
sevgin ve bana verdiği güç için teşekkür ederim.

5
RÉSUMÉ DE LA THÈSE
L’exploration spatiale est un des projets les plus ambitieux de l’humanité. Un des
éléments le plus critique dans ce domaine est le propergol ‒ carburant de la fusée
constituant plus de 90% de la masse totale ‒ qui détermine la charge effective pouvant
être transportée. Vu son importance, des matériaux dégageant de plus en plus d’énergie,
fait d’éléments abondants, faciles d’extraction ainsi que sans empreinte écologique, sont
de plus en plus recherchés. Jusqu’à présent, ceux-ci sont produits par des méthodes de
chimie classique typiquement réalisée à pression ambiante. Cependant, l’exploitation du
paramètre pression pourrait permettre une rupture technologique en rendant
accessible une nouvelle chimie qui donnerait lieu à des matériaux inédits ; soit encore
plus puissants et performants. Intervenant directement dans l’équation de l’énergie
libre de Gibbs, ce paramètre est idéal pour l’exploration des états thermodynamiques
d’un système. Effectivement, des pressions de l’ordre de 100 GPa permettent de
transférer une énergie de plus de 10 eV, excédant même l’énergie de cohésion des
molécules les plus fortes et permettant de les briser [1]. Plus encore, le transfert
d'énergie par la pression promeut la délocalisation électronique, favorisant les
structures étendues (polymériques), idéales pour les matériaux énergétiques [2].
L’azote s’impose comme l’élément de choix pour former des matériaux à haute
densité d’énergie. En effet, cela s’explique par la différence d’énergie entre la liaison
simple N-N (160 kJ/mol) et la liaison triple N≡N (954 kJ/mol), permettant ainsi le
stockage d’une forte quantité d’énergie. De plus, produisant du diazote ‒ composant
environ 78% de l’atmosphère ‒ comme produit de réaction, c’est un matériau
énergétique « vert », c’est-à-dire non dommageable pour l’environnement. Pour ces
raisons, un solide composé uniquement de liaisons N-N est perçu comme étant le
matériau énergétique ultime [3].

6
En 1992, des calculs théoriques ont mis en évidence le potentiel de l’approche
haute pression pour la synthèse de matériaux énergétiques en prédisant la stabilité de
l’azote polymérique cubique gauche (cg-N) au-dessus de 50 GPa [4]. Ce solide est
composé d’un réseau tridimensionnel d’atomes d’azote simplement liés et donc idéal
d’un point de vue énergétique. Lors de sa décomposition, c’est une énergie de 794
kJ/mol qui est relâchée; soit près de cinq fois plus que le meilleur matériau énergétique
conventionnel présentement utilisé.
Vu les propriétés remarquables du solide d’azote polymérique, de nombreuses
expériences ont été entreprises afin de le synthétiser en laboratoire [5–9]. En 2004, une
équipe y est parvenue en comprimant de l’azote moléculaire jusqu’à 110 GPa, soit plus
d’un million de fois la pression atmosphérique, et en le chauffant à plus de 2200 K [10].
Contrairement aux calculs théoriques qui prévoyaient une métastabilité de l’azote
polymérique jusqu’aux conditions ambiantes, les expériences ont démontré que ce
dernier pouvait seulement être ramené à 42 GPa. Au-dessous de cette pression seuil, le
solide cg-N se décompose pour former du N2 et ce faisant libère son énergie
emmagasinée
L’utilisation de l’azote polymérique comme matériau énergétique n’est pas
possible pour deux raisons. D’abord, il est absolument nécessaire que ce dernier puisse
être récupéré aux conditions ambiantes. Ensuite, sa pression de synthèse est beaucoup
trop extrême pour être envisageable en industrie, où des pressions maximales de 10
GPa peuvent être atteintes. Peut-on contourner ces deux difficultés pour produire par la
pression des matériaux à haute densité d’énergie ?
L’objectif de cette thèse doctorale est la synthèse sous haute pression d’une
nouvelle forme, améliorée, d’azote polymérique qui serait métastable aux conditions
ambiantes et produite à des pressions moins extrêmes. La méthode choisie pour y
parvenir consiste à comprimer de l’azote moléculaire avec un autre élément qui, de par
son interaction chimique, puisse perturber suffisamment la molécule N2 pour induire la
rupture de la liaison triple à basse pression, permettant la synthèse d’un réseau
polyazoté ainsi qu’une stabilisation jusqu’aux conditions ambiantes.
Le choix de l’élément à mélanger à l’azote repose à la fois sur un raisonnement
physique et des calculs théoriques. Du point de vue physique, la précompression
chimique a déjà été démontrée comme pouvant être efficace pour perturber puis briser
des liaisons covalentes à plus basse pression. Le principe est simple : il suffit
d’augmenter la densité électronique de la molécule, comme cela se produit
naturellement en augmentant davantage la pression [11]. Pour y parvenir, deux voies
sont envisagées. Une première approche est de mélanger l’azote avec un élément
7
beaucoup plus volumineux qui, simplement par effet géométrique, impose aux atomes
d’azote une plus grande proximité et donc une plus forte densité électronique. La
deuxième méthode est d’ajouter à l’azote un élément réducteur, tel que les métaux
alcalins, qui transfèrerait volontairement une densité électronique à la molécule d’azote.
Évidemment, ces deux méthodes ne garantissent en aucun cas qu’une fois la liaison
triple de l’azote moléculaire brisée un réseau d’azotes simplement liés se formera, d’où
l’importance des calculs théoriques. Ceux-ci, en sondant le paysage énergétique
découlant de différents arrangements atomiques, permettent d’obtenir la structure du
composé le plus stable à une pression (et concentration) donnée. De plus, ces calculs
sont aussi en mesure d’estimer la métastabilité des composés prédits lors du
relâchement de la pression. Donc, ayant en tête les principes de la précompression
chimique et guidé par les calculs théoriques, les systèmes suivants ont été sélectionnés
pour les mesures sous haute pression de cette thèse : N2 pur, Xe-N2, H2-N2 et Li-N2.
L’outil expérimental pour atteindre les pressions nécessaires pour dissocier la
molécule d’azote est la cellule à enclumes de diamant (CED). Son schéma de principe est
assez simple : l’échantillon est confiné par un joint métallique entre deux enclumes de
diamant qui se rapprochent l’une de l’autre de façon à comprimer l’échantillon.
L’extrémité des enclumes de diamant en contact avec l’échantillon est de très petite
taille, soit de l’ordre de la dizaine ou de la centaine de micromètres de diamètre, de
sorte qu’une force modérée appliquée sur la base de l’enclume entraîne une pression
énorme sur l’échantillon ‒ jusqu’à quelques millions de fois la pression atmosphérique.
En plus d’être un des matériaux les plus durs, la grande transparence des diamants sur
de larges plages de longueurs d’onde est aussi un de ses plus grands atouts.
Effectivement, celle-ci permet une grande variété de techniques de caractérisation par
photons. Lors de cette thèse, deux méthodes furent exploitées pour l’étude des
échantillons comprimés : la diffraction par rayons X et la spectroscopie Raman. La
première permet la résolution structurale des phases produites par pression tandis que
la seconde nous informe sur l’évolution des interactions interatomiques.
La première étude expérimentale présentée dans cette thèse porte sur la
compression et le chauffage de l’azote pur dans des domaines de pression et
température jusqu’à présent jamais explorés. Depuis la synthèse de la phase cg-N,
plusieurs études théoriques ont porté sur le diagramme de phase de l’azote au-delà de
110 GPa et 2200 K [12–16]. Ces études, ainsi que leur vérification expérimentale, sont
essentielles afin de trouver de nouvelles géométries d’atomes d’azote simplement liés
qui pourraient s’avérer plus stables que cg-N et donc plus faciles à ramener aux
conditions ambiantes. D’après ces calculs, la phase cg-N devrait se transformer une
première fois à 188 GPa en une structure orthorhombique présentant des couches
d’anneaux N7 distordus (dite layered polymeric nitrogen, ou LP-N) puis à 263 GPa, en

8
une structure cubique s’apparentant à celle du diamant avec des entités N10 [12]. On
notera cependant qu’entre 188 et 263 GPa, six phases ont des enthalpies très proches
de la LP-N, soit à quelques dizaines de meV de celle-ci. Cette très faible différence
d'enthalpie entre ces différents solides signifie que, expérimentalement, presque tous
pourraient être produits. Cette affirmation est justifiée par des problèmes bien connus
avec les calculs théoriques, y compris le fait que ceux-ci sont effectués à une
température nulle, signifiant que le terme température-entropie (-TS) dans l'énergie
libre de Gibbs n’est pas pris en compte. Pour des systèmes comme l'azote, où des
barrières d'activation importantes doivent être surmontées par un chauffage laser
jusqu’à des températures atteignant 3000 K, la contribution du terme température-
entropie peut très bien devenir suffisante pour stabiliser une structure autre que celle
de plus basse énergie.
Suivant la publication de ces calculs, une étude expérimentale soumit l’azote
moléculaire à des conditions de pression et température allant jusqu’à 170 GPa et 2500
K. La phase LP-N (prédite à partir de 188 GPa) fut observée à compter de 125 GPa et
2500 K ainsi que jusqu’aux pressions et températures maximales atteintes dans ce
travail [17].
Lors de nos études, des pressions de 250 GPa et des températures de 3300 K ont
été obtenues, surpassant largement le domaine P-T précédemment atteint, ce qui a
permis la synthèse d’une nouvelle phase d’azote polymérique. Sa structure cristalline ne
correspond pas à la phase LP-N ni à la phase N10 prédite. Cette maille, ayant plutôt une
maille tétragonale (P42bc) de paramètres de réseau a = 4.261(1) Å et c = 8.120(1) Å à
187 GPa, concorde cependant très bien avec une autre structure prédite, celle-ci
constituée d’anneaux N6 interconnectés formant des bicouches (Figure 1), qui avait une
enthalpie calculée à peine plus élevée que la structure N10. Les mesures de spectroscopie
Raman ont permis de confirmer la présence de liaisons simples entre atomes d’azote.
Cette phase a pu être suivie en décompression jusqu’à 60 GPa, pression à laquelle les
diamants de la CED ont cédé et l’échantillon s’est échappé.

9
Figure 1 : Structure cristalline du nouveau solide d'azote polymérique. a) La maille du composé,
où l'on voit les deux couches d'hexagones interconnectés identiques à une rotation de 90° près. b) et c) Enchaînement d'anneaux N6. Les atomes de mêmes couleurs sont équivalents.
La deuxième étude porte sur les mélanges Xe-N2 et avait pour objectifs
d’observer directement l'impact d'une précompression chimique dû à la taille des
atomes de xénon ainsi que de tenter de synthétiser la structure XeN6 prédite par les
calculs théoriques. Cette phase est la seule prévue stable par les calculs et doit se former
à partir de 146 GPa à température nulle ou à 132 GPa à 2500 K. Sa structure est
particulière surprenante de par le fait que des liaisons covalentes Xe-N sont attendues,
formées grâce à une hybridation des orbitales 5p du xénon avec les orbitales 2p de
l'azote. Du point de vue énergétique, XeN6 serait constitué d'hexagones N6 où les
liaisons N-N seraient simples, conférant au composé une énergie libérée comparable
aux explosifs modernes lors de sa décomposition [18].
La première étape de cette étude fut la détermination du diagramme de
démixtion binaire de Xe-N2, réalisée en comprimant des échantillons avec 14
concentrations différentes. Ceci permit de découvrir deux solides : un solide riche en
xénon, constitué jusqu'à 10% molaire de molécules d'azote et adoptant la structure du
xénon pur, ainsi qu’un composé de van der Waals de stoechiométrie Xe(N2)2 avec une
maille cubique (Fd-3m). Dans ce dernier, les molécules d'azote sont sphériquement
désordonnées. Cependant, à 10 GPa le composé Xe(N2)2 subit une transition de phase
martensitique vers une maille tétragonale (I41/amd) où les molécules d'azote,
contraintes par l'interaction quadrupole-quadrupole entre N2-N2, s'alignent presque
complètement, tel que montré dans la Figure 2. Attestant l'efficacité de la
précompression chimique, à 30 GPa les distances intermoléculaires dans Xe(N2)2 sont
de 1.97 Å, soit équivalentes à celles mesurées dans l'azote pur à 80 GPa. En mesurant les
modes de vibration des molécules d'azote dans le composé, on observe un
10
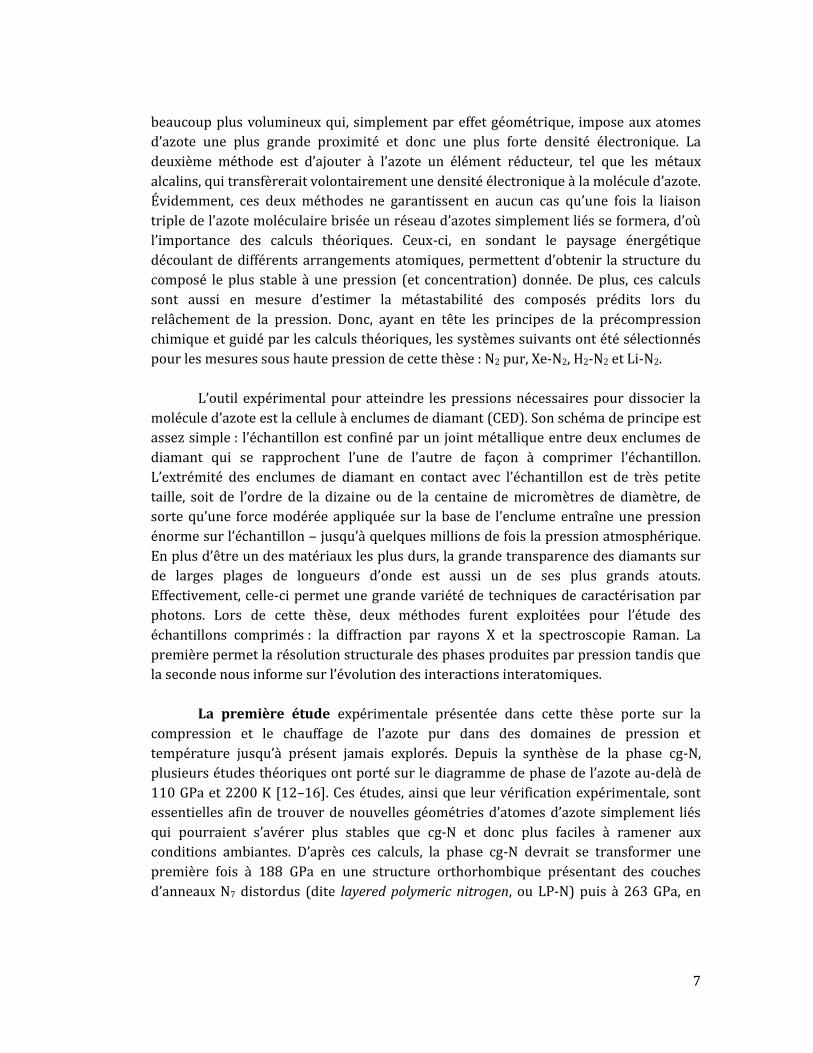
affaiblissement de la liaison intramoléculaire N2 qui se traduit par la baisse de la
fréquence de vibration avec pression (voir sur la Figure 2). Ce phénomène est aussi
observé dans l'azote pur à 80 GPa et indique que la proximité des molécules d'azote
provoque une redistribution électronique progressive d'intramoléculaire vers
intermoléculaire. Cette délocalisation électronique semblait prometteuse pour la
rupture de la liaison triple N≡N et la polymérisation du composé Xe(N2)2.
Figure 2 : a) Structure cristalline du composé Xe(N2)2 dans sa phase haute pression (I41/amd).
Les molécules d'azote ont un très léger désordre. Les sphères bleues et orange représentent des atomes d'azote et de xénon, respectivement. b) Évolution en pression des modes de vibration des
solides Xe(N2)2 et SXe (solide riche en xénon) ainsi que de l'azote pur. Vers 30 GPa, le vibron principal du composé Xe(N2)2 commence à diminuer avec la pression, signe de l'affaiblissement de
la liaison intramoléculaire N2. Un phénomène semblable est observé dans l'azote pur à 80 GPa.
Le composé Xe(N2)2 a été comprimé jusqu'à 154 GPa et chauffé à 2000 K sans
qu'une transition de phase ne soit observée. En se basant sur le second solide découvert
lors de l'étude du diagramme de démixtion binaire — le solide riche en xénon — il a été
déduit qu'une importante interaction Xe-N était aussi induite par la pression. Cette
interaction, bien qu'affaiblissant aussi la molécule d'azote, viendrait stabiliser
l'ensemble de la structure cristalline et empêcher une transition de phase vers une
structure polymérique.
Ce n'est qu'en chauffant nos échantillons de Xe-N2 pour une durée prolongée
(environ 1h) à des pressions et températures encore plus élevées qu'une transition de
phase a été observée. Les nouvelles raies de diffraction détectées ne correspondent pas
avec la structure XeN6 prédite. Bien que la qualité des données de diffraction ne
permette pas la résolution structurelle du nouveau solide, des modes de vibration de
basse fréquence pouvant correspondre à des liaisons simples N-N furent détectés. Ce
composé, présumé comme étant un composé de xénon polyazoté, a été suivi jusqu'à 23
GPa lors de sa décompression.

11
La troisième étude porte sur les systèmes N2-H2, reconnus comme ayant une
riche chimie. Aux conditions ambiantes, sept composés N-H ont déjà été synthétisés,
incluant les azanes (familles de composés NxHx+2) ammoniac (NH3) et hydrazine (N2H4).
Les calculs théoriques prévoient une interaction chimique exacerbée entre ces deux
éléments et une grande variété de nouveaux arrangements N-H qui serait stabilisés par
la pression. Parmi ceux-ci figurent plusieurs matériaux énergétiques tels que de longs
azanes, des couches bidimensionnelles d'azotes simplement liés et des espèces
anioniques exotiques comme le pentazole (N5-H+) [19–23]. Des expériences
précédemment réalisées sur des mélanges N2-H2 avaient résolu le diagramme de
démixtion binaire et découvert deux composés de van der Waals, de stoechiométrie
(N2)6(H2)7 et N2(H2)2. La structure du premier composé avait été résolue et il avait été
observé réagir chimiquement vers 50 GPa pour former du NH3 ionisé (NH2- NH4+) [24].
Deux autres séries d'expériences avaient aussi été réalisées sur des poudres de diverses
concentrations (allant de 5% à 80% molaire de N2) jusqu'à 50 GPa. De façon similaire au
composé (N2)6(H2)7, une réaction chimique induite par la pression était observée vers
50 GPa mais, interprétée comme produisant de longs azanes hautement énergétiques
[25,26]. Sachant que ces poudres doivent respecter le diagramme de démixtion binaire
et que (N2)6(H2)7 réagit pour produire de l'ammoniac ionisé, il semblait donc que les
azanes longs devraient résulter de la réaction chimique du composé N2(H2)2.
Figure 3 : a) Microphotographe d'un monocristal de N2(H2)2. b) Structure cristalline en bâton du
solide N2(H2)2. Uniquement le sous-réseau d'atomes d'azote est représenté. Une structure en cage, contenant l'hydrogène moléculaire, est clairement visible.
Nous avons étudié l’évolution du composé N2(H2)2 sous pression jusqu’à 60 GPa.
Sa structure cristalline a pu être résolue par diffraction de rayons X sur monocristal.
Totalisant 123 molécules et un volume de 2007.10(1) Å3 à 7.3 GPa, cette structure
complexe est constituée de larges cages formées par un sous-réseau d'atomes d'azote
piégeant les molécules d'hydrogène (voir Figure 3). Vers 50 GPa, il a été observé que le
solide de N2(H2)2 réagit lui aussi chimiquement (voir Figure 4). La signature
vibrationnelle du produit de réaction indique que des azanes de différentes longueurs
12
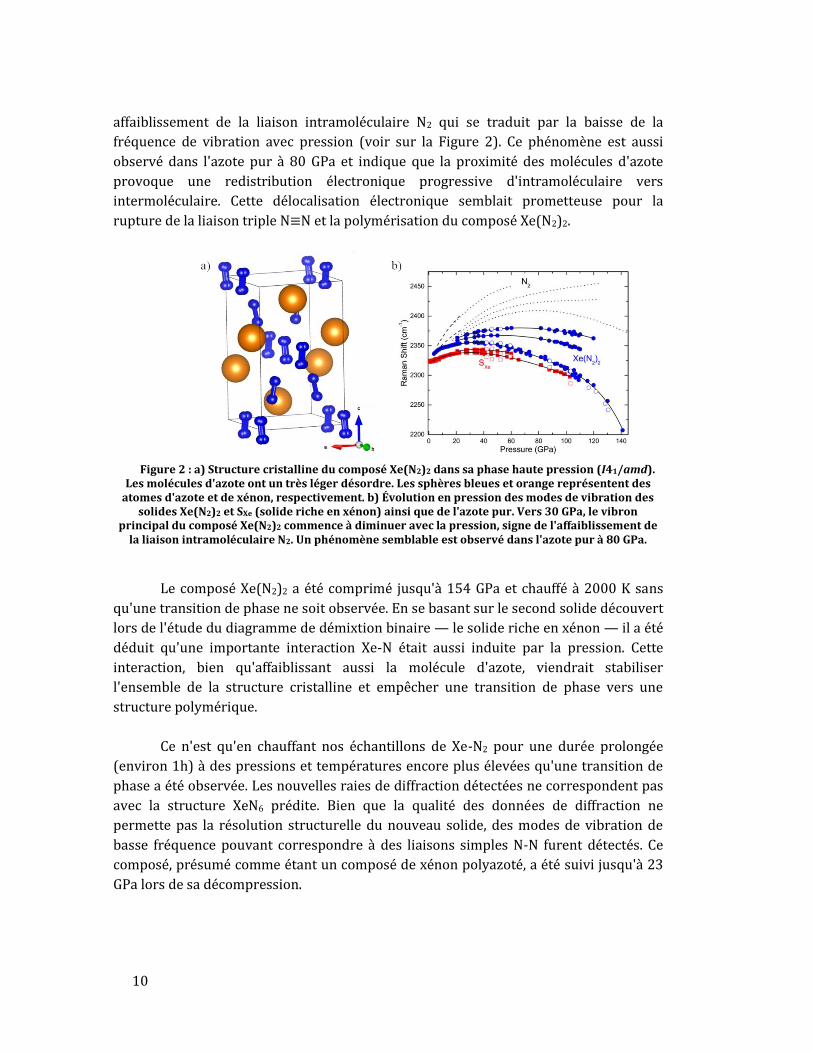
avaient effectivement été produits. En raison de la stoechiométrie de N2(H2)2, identique
à celle de l’hydrazine (N2H4), la présence de résidus de N2 ou de H2 permet d'identifier si
des azanes plus courts que celui-ci (consommant plus de H que de N) ou plus longs
(consommant plus de N que de H) ont majoritairement été produits. Il s'est avéré que
de l'azote moléculaire a pu être détecté; attestant que l'ammoniac (NH3) était en
majorité obtenue comme produit de réaction. Les deux composés de van der Waals
réagissant pour produire majoritairement des solides de stoechiométrie NH3, il est
conclu comme étant très improbable que les poudres, composées de ces deux solides,
aient comme produits de réaction surtout de très longs azanes.
Figure 4 : a) Microphotographes d'un monocristal de N2(H2)2 remplissant toute la cavité
expérimentale. À partir de 50 GPa, une réaction chimique induite par la pression est amorcée. Le produit de réaction est facile à identifier vu sa couleur jaunâtre. La réaction se complète vers 60 GPa. b) Microphotographe du même échantillon à 1.2 GPa suite à sa décompression. Vers 10 GPa,
une nouvelle réaction chimique se produit résultant en la conversion d'ammoniac en hydrazine. À l'équilibre solide-fluide, une cartographie par spectroscopie Raman (droite) permet d'identifier des
monocristaux d'hydrazine (rouge), de l'hydrazine liquide (bleu) et des bulles de N2-H2 (vert).
Lors de la décompression des produits de réaction du monocristal de N2(H2)2 à
des pressions sous 10 GPa, une nouvelle transformation chimique est observée. Une
cartographie par spectroscopie Raman de l'échantillon, illustrée sur la Figure 4,
démontre que la présence d’un seul type d'azane, l'hydrazine, est présent. L'ammoniac
établi comme étant stable sous ces conditions, s'est converti en hydrazine, qui lui est
métastable. Cet apparent accroc à la thermodynamique, bien que non sans précédent
[27], n'est pas encore complètement élucidé.
La quatrième étude effectuée dans le cadre de cette thèse porte sur les
mélanges lithium-azote. Étant donné la facilité avec laquelle le lithium donne son
unique électron de valence, cette investigation permet de voir l'effet d'une
précompression chimique exercée directement par un transfert électronique. Aux

13
conditions ambiantes, le lithium réagit déjà avec N2 et permet de briser la liaison
covalente triple de l'azote moléculaire pour produire les solides Li3N et LiN3, composés
des cations Li+ et des anions N3- et N3-, respectivement. L'objectif de cette étude était de
produire par pression le composé Li-N le plus riche en azote comportant des entités
polyazotés. Ces expériences sont guidées par le fort pouvoir réducteur de Li et par des
calculs. Ceux-ci prévoient une riche chimie Li-N à haute densité, avec plus de six
stoechiométries permettant des composés stables (Li13N, Li5N, Li3N2, LiN, LiN2 and
LiN5), outre ceux connus aux conditions ambiantes [28–31].
Le composé LiN5 ‒ le plus riche en azote ‒ est particulièrement intéressant
puisqu'il est constitué d'un anion pentazolate (N5-), pentagone d'azotes hautement
énergétiques. Pour cette raison, la synthèse d'une forme stable de pentazolates aux
conditions ambiantes a longtemps été un grand objectif des chimistes. Tout récemment,
ceux-ci furent synthétisés et stabilisés grâce à de larges matrices, sous la forme de
(N5)6(H3O)3(NH4)4Cl ou ([Na(H2O)(N5)2]·2H2O et [M(H2O)4(N5)2]·4H2O, M = Mn, Fe, et
Co) [32–34]. Bien que constituant un énorme progrès, ces composés sont encore
relativement pauvres en azote et donc peu énergétiques. Par opposition, le pentazolate
dans LiN5 serait stabilisé uniquement par un atome de lithium et est donc une
alternative beaucoup plus attractive que les composés précédemment obtenus. D'après
les calculs, un solide de LiN5 pourrait contenir une énergie de 2.72 kJ/g, et serait donc
plus performant que la plupart des matériaux énergétiques communément utilisés [28].
Conformément aux prédictions, nos expériences ont permis la synthèse de
quatre stoechiométries différentes de composés Li-N à partir d'un échantillon de
lithium pur entouré d'une beaucoup plus grande quantité d'azote moléculaire. Le solide
Li3N, déjà bien connu et caractérisé, est obtenu dès la mise en contact du lithium et de
l'azote. À partir de 10 GPa, un solide de stoechiométrie LiN2 fut produit pour la
première fois suite à une chauffe (1200 K). Sa structure cristallographique a pu être
déterminée, adoptant une maille hexagonale (P63/mmc) et est constituée de pernitrures
‒ dimères d'azote de charge négative ‒ d’un ordre de liaison N-N avoisinant 2.5. Dans
les zones de l'échantillon plus pauvre en azote, un second composé fut synthétisé, le
solide LiN. De maille orthorhombique (Cmcm), il comprend lui aussi des pernitrures qui
ont, cette fois, un ordre de liaison plus faible approchant 1.5. Au-dessus de 45 GPa, la
phase la plus riche en azote prévue par les calculs, le pentazolate de lithium LiN5 fut
obtenue, suivant le chauffage par laser de l’échantillon à des températures de plus de
2500 K. Les structures des composés Li-N découverts lors de cette thèse sont présentés
sur la Figure 5.

14
Figure 5 : a) Structure cristalline du solide LiN, contenant des pernitrures. b) Structure
cristalline du composé LiN2, lui aussi formé de pernitrures. c) La structure du solide de LiN5, tel que proposée dans la littérature [28]. Les sphères orange et bleues représentent les atomes de lithium et
d'azote, respectivement.
Un résultat important est que le solide de LiN5 a pu être récupéré aux conditions
ambiantes, comme démontré par spectroscopie Raman et spectrométrie de masse. Sa
synthèse et sa métastabilité aux conditions ambiantes sont une démonstration du
potentiel des synthèses haute pression pour produire des matériaux à haute densité
d'énergie qui peuvent rivaliser et même excéder les performances des composés
produits par chimie classique.
La recherche faite durant cette thèse est une claire illustration de l’efficacité du
paramètre pression pour la synthèse de nouveaux matériaux polyazotés à haute densité
d’énergie. Dans chacun des systèmes étudiés, que ce soit l’azote pur ou les mélanges Xe-
N2, N2-H2 et Li-N2, une nouvelle forme d’arrangement N-N simplement lié fut
découverte. Dans le cas des mélanges N2-H2 et Li-N2, ces composés ont été produits à
des pressions bien en deçà de l’azote polymérique pur, soit 50 et 45 GPa
respectivement. La synthèse de LiN5 et tout particulièrement sa récupération aux
conditions ambiantes est une étape importante dans la synthèse de composés
énergétiques par pression.
La chimie des hautes pressions en est encore à ses débuts comparativement à la
chimie classique sous conditions ambiantes. Les outils expérimentaux, et en particulier
les géométries d'échantillons, devront certainement encore être améliorés pour
permettre plus de flexibilité et une plus grande variété de techniques de caractérisation.
Les travaux de cette thèse établissent la chimie des hautes pressions comme une réelle
possibilité pour la synthèse de matériaux à haute densité d'énergie avec des
15
applications aux conditions ambiantes. En particulier, les mélanges à base d’azote et
d’hydrogène devraient être revisités en utilisant des pressions élevées combinées à des
températures élevées qui pourraient entraîner la formation du pentazole; l'ultime
arrangement N5. Alors que les études étaient jusqu'ici limitées aux composés binaires,
des composés ternaires et même quaternaires commencent à être envisagés et
fourniront sans aucun doute de nombreuses autres possibilités pour la synthèse de
nouveaux matériaux à forte densité d'énergie. Enfin, des méthodes telles que la
méchanochimie et la photochimie pourront aussi permettre d’abaisser fortement la
pression de synthèse des composés polyazotés.

16

17
THESIS SUMMARY
The goal of this thesis is to synthesize novel polynitrogen compounds by pressure as the
next-generation high energy density materials (HEDM). To achieve this, the physico-chemical
properties of pure nitrogen as well as the xenon-nitrogen, hydrogen-nitrogen and lithium-nitrogen
mixtures were studied under extreme pressure and temperature conditions. In the case of the
compression of pure nitrogen, a novel polymeric nitrogen solid composed of interconnected chains
of N6 rings was produced at 250 GPa and 3300 K, and then found metastable down to at least 60
GPa. The low pressure Xe-N2 investigation revealed the formation of a stoichiometric Xe(N2)2 van
der Waals compound. Above 150 GPa and 2500 K a xenon-polynitrogen material was observed and
preserved down to 23 GPa. The N2-H2 study, focusing on the characterization and high-density
behavior of the N2(H2)2 van der Waals compound, uncovered its pressure-induced chemical reaction
near 50 GPa. The reaction products were determined to be of the azane family (NxHx+2), with
ammonia (NH3) being the main constituent, disproving results previously reported in the literature.
Intriguingly, decompression of the reacted sample resulted, below 10 GPa, in the transformation of
ammonia into its thermodynamically less stable counterpart hydrazine (N2H4). Lastly, the Li-N2
system proved to be of great interest due to the large array of anionic nitrogen moieties discovered
(N3-, [N2]~2 [N2]~1 and N5-), owing to the rich chemistry between these two elements. In particular,
lithium pentazolate (LiN5), containing the elusive energetically-rich pentazolate anion, was
synthesized above 45 GPa and 2500 K. Moreover, it could be retained down to ambient conditions.
It is the room-condition polynitrogen compound with the largest fraction of nitrogen by weight and
the first polynitrogen HEDM produced by high pressure and retrieved down to ambient conditions.
These results demonstrate the potential of high pressure for the synthesis of industrially relevant
HEDM.

18
19
TABLE OF CONTENTS
Remerciements ........................................................................................ 3
Résumé de la thèse ................................................................................. 5
Thesis Summary .................................................................................... 17
Introduction ............................................................................................ 23
I. The significance of polynitrogen compounds ........................................... 23
II. The high pressure route: parameters at play .......................................... 24
II. A. Parameters for metastability ............................................................................. 27 II. B. Low pressure formed polymeric nitrogen arrangements ....................... 29
III. The selected systems for investigations .................................................. 32
Experimental Techniques in High Pressure Physics ................ 35
I. Sample preparation, high pressure and
high temperature generation .............................................................................. 36
I. A. Diamond anvil cells .................................................................................................. 36 I. B. Gas loading of mixtures and reactive samples .............................................. 41 I. C. Laser-heating ............................................................................................................. 43 I. D. Pressure measurements ......................................................................................... 45
II. Characterisation techniques and data analysis ...................................... 49
II. A. X-ray diffraction ...................................................................................................... 49 II. B. Raman Spectroscopy ............................................................................................. 66

20
Nitrogen under extreme conditions: Phase diagram .............. 73
I. The nitrogen molecule ........................................................................................ 73
II. Solid phases of pure nitrogen ......................................................................... 74
II. A. Low pressure phases of pure molecular nitrogen ...................................... 75 II. B. High pressure phases of pure molecular nitrogen ..................................... 80 II. C. Polymeric nitrogen phases .................................................................................. 82
III. The nitrogen melting curve ........................................................................... 85
Novel pure nitrogen polymeric phases ........................................ 87
I. Introduction ............................................................................................................ 87
II. Article ....................................................................................................................... 89
Search for xenon polynitrogen compounds .............................. 117
I. Introduction ......................................................................................................... 117
II. Article .................................................................................................................... 122
III. Chemical reaction in the Xe-N system .................................................... 133
Series of chemical transformations in the N2-H2 system ...... 139
I. Introduction ......................................................................................................... 139
II. Article .................................................................................................................... 145
Synthesis of high energy density
lithium-nitrogen compounds ......................................................... 159
I. Introduction ......................................................................................................... 159
II. Articles .................................................................................................................. 163
Conclusions........................................................................................... 205
From theoretical predictions to experiments ............................................ 208
High pressure synthesis of polynitrogen compounds:
the next steps. .......................................................................................................... 209
Polynitrogen compounds: where to now? ............................................................. 209 Producing high pressure phases at “ambient conditions” .............................. 210 Machine learning ............................................................................................................ 211 Development of experimental techniques ............................................................. 212

21
Annex ...................................................................................................... 215
I. High pressure investigation of iron and nitrogen:
the search for an iron pernitride .................................................................... 215
II. Articles .................................................................................................................. 216
III. Data on the Xe-N solid .................................................................................. 235
References ............................................................................................ 237

22

23
INTRODUCTION
I. THE SIGNIFICANCE OF POLYNITROGEN COMPOUNDS
On July 20th 1969, a NASA crew landed on the lunar ground, seen at the time as
the culminating point of space race. Four days earlier, the Apollo 11 spacecraft had been
launched from Kennedy Space Center by the Saturn V rocket. The rocket weighted 2970
tons, representing more than 21 times its payload of 140 tons. Spread across three
stages, the first filled with refined kerosene and liquid oxygen (LOX) and the second and
third with a mixture of liquid oxygen and liquid hydrogen (LH2), the propellant
represented about 93% of the total rocket’s mass. Even now, close to 50 years later, the
Saturn V rocket still holds the record of the heaviest carried payload sent to low Earth
orbit.
Since then, vast improvements were made to space rockets, including the rocket
engines redesign, lighter tanks and an overall reusability. Solid propellants were also
introduced, but while they have a lower efficiency than their liquid counterparts they
are mostly used for their lower cost and greater practicability. These developments
improved their overall safety, reliability, performance and cost-effectiveness. Curiously,
no significant advancements were realized towards the most critical aspect: a high
thrust high specific impulse propellant.1 Indeed, five decades later, the best high Isp
propellant is deemed to be cryogenic LOX/LH2 with a value of about Isp = 450 s (in
vacuum), previously employed in the Saturn V rocket. Others, such as liquid fluorine
and liquid hydrogen were shown to have a marginally higher Isp but with much greater
risks associated. Even now, the propellant represents more than 90% of a rocket’s mass
1 The specific impulse (Isp), typically used to define a propellant’s performance, is defined as
the total impulse delivered per weight unit of propellant consumed.

24
and thus higher performance materials would make for dramatic improvements,
increasing the carried payload and allowing for faster travel.
In this context, the synthesis of a novel high energy density material could be
ground-breaking for spatial applications. Polynitrogens compounds are considered
promising since the versatility of nitrogen bonding is particularly well adapted for the
chemical storage of energy. This is due to the large energy difference that exists
between the triple-bonded N≡N and the single-bonded N-N. Indeed, the triple bonded
nitrogen molecule has one of the strongest bonds with an energy of 954 kJ/mol while
the single bond is comparatively very weak, with a bond energy of 160 kJ/mol.
Transitioning from the single to triple bonded state releases 794 kJ/mol, which is close
to five times the energy produced by any conventional energetic material in use today
[3]. As such, a solely single-bonded nitrogen solid was deemed having a great potential
as the next generation propellant as well as an explosive. Moreover, this compound also
makes for clean high energy density materials having pure molecular N2 as its sole
decomposition product. However, the low activation barrier towards decomposition
renders the synthesis of stable polynitrogen compounds very challenging.
Many new neutral polynitrogen entities are predicted from theoretical
calculations, including the N4, N6, N8, N9, N10 and even up to a fullerene-type N60 (see
review article Ref. [35]). Among those, N4 is the only neutral nitrogen molecule that was
experimentally observed, and has a lifetime of about 1 μs [36]. The synthesis of charged
polynitrogen arrangements stabilized by other atoms was more successful and includes
N3-, N4+, N5+ and the N5- [36–38]. All but N4+ are stable in the bulk at ambient conditions.
Azides (N3-) may be stabilized solely by a single alkali cation while N5 cation and anion
can be secured in large matrices, namely N5AsF6 as well as the (N5)6(H3O)3(NH4)4Cl salt
and metal pentazolate hydrate complexes ([Na(H2O)(N5)2]∙2H2O along with
[M(H2O)4(N5)2]∙4H2O, M = Mn, Fe and Co) [32–34,38]. Yet, due to their low nitrogen
weight ratio, these compounds are not competitive high energy density materials
(HEDM).
The objective of this thesis is the synthesis of novel high energy density
polynitrogen compounds by a method alternative to conventional ambient conditions
chemistry: high pressure. With its own challenges and difficulties, this method has a
great potential to produce previously-unobserved energetic nitrogen phases.
II. THE HIGH PRESSURE ROUTE: PARAMETERS AT PLAY
From a thermodynamic point of view, the search for novel phases is done
through the exploration of the Gibbs free energy landscape. The Gibbs free energy G is
25
given by the equation G = U + pV – TS, in which U is the system’s internal energy, T its
temperature, S its entropy, V its volume and p its pressure. Pressure is especially
effective since in the multi-megabar range, the pV term can exceed a 10 eV (965 kJ/mol)
difference in the Gibbs free energy, larger than the strongest chemical bonds [1]. Not
only is pressure very potent to change G, but the way it shapes a material is equally
important. To better illustrate this point, let's first consider the case where the energy
transferred to a material is provided by increasing temperature. This would first favor a
more open structure, such as a bcc, and as temperature continues to go up, it would
eventually cause melting, decomposition into elemental species and even ionization.
However, the same material's behavior upon the same energy transfer but through
pressure is radically different and, for chemistry purposes, much more favorable.
Indeed, what is instead observed is an electron delocalization, leading to extended
solids and metals. This is commonly attributed to the electron's kinetic energy
dependency with density (∝ ρ2/3) which increases much faster than the electrostatic
potential energy (∝ ρ1/3). As such, at high pressure the localized electrons progressively
become less stable as the kinetic energy overcomes the electrostatic potential energy,
thus eventually leading to extended polymeric solids and metals [2].
The first demonstration of the potential of pressure to help break the strong
triple-bond of molecular nitrogen was executed by Haber in 1909. In the particular
context of those times, the natural reserves of niter, indispensable as a fertilizer for the
efficient growth of crops, were running dangerously low. New sources of fixated
nitrogen were thus direly needed to prevent mass famines. By a savvy process, Haber
managed to produce ammonia from pure molecular nitrogen and hydrogen by mixing
them at pressures and temperatures above 100 bars and 900 K, respectively, in the
presence of an osmium catalyst [39]. The tabletop experimental process was later
refined and adapted for industrial production with the help of Bosch at the BASF
chemical company. Attesting to its efficiency, the process is still widely used today.
In the late 20th century, theoretical calculations performed by Mailhiot et al.
predicted that under sufficient compression, the electron delocalization would cause
pure molecular nitrogen to polymerize and produce a purely single-bonded nitrogen
solid [4] at a pressure of 50 GPa. At a first glance, these calculations seem at odds with
experiments that had detected the molecular vibrational mode of molecular nitrogen up
to 180 GPa [40]. However, this set of experimental data was considered in calculations
and an explanation was provided: the molecular state would be metastable at these
pressures as a significant activation barrier would exist, impeding the transition
towards the polymeric state. The structure of the polymeric compound was calculated
to be cubic gauche (cg), a highly symmetric cubic lattice (I213) with a single N-N bond
length of 1.40 Å. Its expected low pressure stability suggested that cg-N would perhaps

26
be metastable down to ambient conditions [4,41]. An energy barrier of 0.86 eV/atom
impeding its decomposition to the molecular state was calculated and no mechanical
instabilities down to ambient pressure were detected, all of which suggested that cg-N
could be retrieved upon complete decompression.
At its expected density at ambient conditions (3.91 g/cc), the properties of cg-N
that are the most relevant for propellants (Isp) and explosives (detonation pressure) are
compared in Table 1 and 2 to commonly used materials. As it can be seen, it is
calculated to have a theoretical Isp of 510 s in vacuum and a detonation pressure of 660
GPa, ten times larger than the best non-nuclear explosive, thus validating its
extraordinary properties as a high energy density material.
Table 1: Representative values of Isp for common propellants in vacuum compared to
the predicted value for cg-N [42,43].
Compound Specific impulse (Isp, s) cg-N 510* LOX/LH2 457 LOX/Methane 365 N2O4/N2H4 348 LOX/RP-1 331 LOX/Butane 255 * theoretical value
Table 2: Explosive properties of common explosives compared to the predicted
values for cg-N. Data from Ref. [44].
Compound Density (g/cc) Detonation Pressure (GPa)
Energy*
Nitrocellulose 1.65 21.2 60 HMX 1.91 38.5 100 CL-20 2.04 47.8 121 cg-N 3.91 660 1060 * energy normalized for a HMX value of 100
An experimental group announced in 2004 the synthesis of the single-bonded
nitrogen network polymeric nitrogen. X-ray diffraction characterization confirmed its
structure to be the one predicted by the simulations and Raman spectroscopy featured
the symmetric stretching mode corresponding to a single covalent N-N bond. The
minimal synthesis pressure was still found to be above the calculated value of 50 GPa.
Indeed, cg-N was observed to form at 110 GPa after laser-heating the sample to

27
temperatures above 2100 K [10]. Moreover, the compound could not be retrieved down
to ambient pressure as it decomposed to its molecular form near 42 GPa following a
very weak red-laser illumination. Based on its determined equation of state, a density of
3.91 g/cc was to be expected after the complete pressure release. These results
demonstrated high pressure to be a valid approach, if not the only one, to synthesize the
ultimate green high energy density polymeric nitrogen. However, this solid is still a
ways off before being operative for real-world applications. The most obvious issue is
surely the apparent lack of metastability down to ambient conditions. Also, the extreme
pressure conditions needed to form it are ways beyond industrial capabilities, which
are typically limited below 10 GPa.
II. A. Parameters for metastability
A compound's metastability rests solely on one factor: the height of its energy
barrier towards a more stable state. As schematized in Figure 1, pressure changes the
energy landscape of a system and often induces a shift in the most stable state. This
allows to produce a phase that is not stable at ambient conditions but that is under
specific thermodynamical conditions. Retrieving the high pressure phase back to
ambient conditions, for example, requires a sufficiently large activation (or energy)
barrier blocking the transformation back to the energetically-favored state. Theoretical
calculations often calculate a crystal's phonon dispersion curve to ensure its mechanical
stability; i.e. that the phase is indeed sitting in an energy minimum [45]. In layman
terms, this requires that for a small motion of each of the crystal's atoms, a restoring
force dragging the atoms back to their equilibrium position exists. The deeper the
energy well, the stronger the restoring force and thus the larger metastability.
The pressure synthesis of novel, improved high energy density polynitrogen compounds is the objective of this thesis. Two obstacles need to be tackled, namely 1) the compound's metastability, ideally down to ambient conditions and 2) to lower the pressure conditions for synthesis, preferably below 10 GPa. Solving these two issues could result in an industrially relevant compound. As described in details below, the chosen strategy is to combine nitrogen with a variety of elements in order to form advantageous chemical precursors, favorable due to their potential for chemical precompression, topochemistry and laser-heating. These precursors have been selected with the guidance of theoretical predictions. The synthesized compounds were thoroughly characterized, mainly by X-ray diffraction as well as Raman spectroscopy measurements. Then, their recovery at ambient pressure was systematically attempted.
28
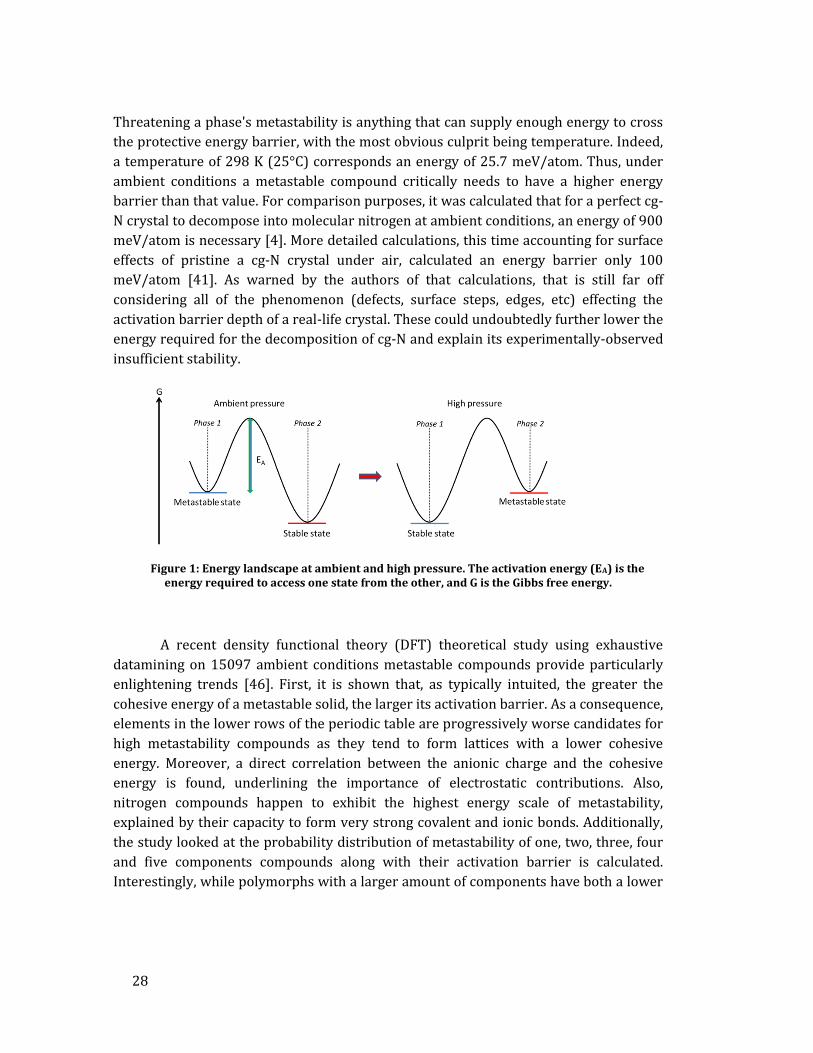
Threatening a phase's metastability is anything that can supply enough energy to cross
the protective energy barrier, with the most obvious culprit being temperature. Indeed,
a temperature of 298 K (25°C) corresponds an energy of 25.7 meV/atom. Thus, under
ambient conditions a metastable compound critically needs to have a higher energy
barrier than that value. For comparison purposes, it was calculated that for a perfect cg-
N crystal to decompose into molecular nitrogen at ambient conditions, an energy of 900
meV/atom is necessary [4]. More detailed calculations, this time accounting for surface
effects of pristine a cg-N crystal under air, calculated an energy barrier only 100
meV/atom [41]. As warned by the authors of that calculations, that is still far off
considering all of the phenomenon (defects, surface steps, edges, etc) effecting the
activation barrier depth of a real-life crystal. These could undoubtedly further lower the
energy required for the decomposition of cg-N and explain its experimentally-observed
insufficient stability.
Figure 1: Energy landscape at ambient and high pressure. The activation energy (EA) is the energy required to access one state from the other, and G is the Gibbs free energy.
A recent density functional theory (DFT) theoretical study using exhaustive
datamining on 15097 ambient conditions metastable compounds provide particularly
enlightening trends [46]. First, it is shown that, as typically intuited, the greater the
cohesive energy of a metastable solid, the larger its activation barrier. As a consequence,
elements in the lower rows of the periodic table are progressively worse candidates for
high metastability compounds as they tend to form lattices with a lower cohesive
energy. Moreover, a direct correlation between the anionic charge and the cohesive
energy is found, underlining the importance of electrostatic contributions. Also,
nitrogen compounds happen to exhibit the highest energy scale of metastability,
explained by their capacity to form very strong covalent and ionic bonds. Additionally,
the study looked at the probability distribution of metastability of one, two, three, four
and five components compounds along with their activation barrier is calculated.
Interestingly, while polymorphs with a larger amount of components have both a lower

29
activation barrier and a lower propensity to form, compounds resulting from a phase
separation have a much higher activation barrier and higher probability to be produced.
Finally, it was found that solids which are the Gibbs free energy minimizing state under
some thermodynamic condition (pressure, temperature, etc) have a greater probability
to be metastable compounds back at normal conditions; in opposition to synthesized
solids that were at no point the most stable phase. As drawn in Figure 1, this is typically
what is achieved during the pressure synthesis of compound and thus emphasizes the
pressure parameter to be a capable method to produce metastable compounds.
II. B. Low pressure formed polymeric nitrogen arrangements
The second objective can now be discussed, namely how to obtain novel
polynitrogen phases under less stringent pressure conditions. Two approaches are
possible: 1) discovering a new form of polynitrogen compound by mixing nitrogen with
another chemical entity and 2) lowering the pressure of synthesis of a known
compound by providing extra energy to the system or by choosing an appropriate
precursor. These approaches are certainly not mutually exclusive.
II. B. 0. New forms of polynitrogen compounds
This approach, perhaps the most discussed in the literature, is based around an
intuition-guided approach revolving around mixing nitrogen with other elements. The
interaction of nitrogen with another chemical entity opens up the possibility of new
nitrogen arrangements. The energy landscape of the nitrogen mixture system can be
explored by structure searching algorithms that may, or may not, reveal new
compounds composed of polynitrogen subunits stable under low pressures. Theoretical
calculations on this subject have recently exploded in numbers, providing a large
variety of polynitrogen arrangements stabilized by other elements. These elements
include mostly alkali metals, alkali earth metals, transition metals and even some noble
gases [23,47,56,48–55]. Experiments are direly needed to confirm or reject these
predictions.
While there are no definite rules allowing to predict, before even running
calculations or performing the experiments, if a certain nitrogen mixture will produce a
polynitrogen network, there is a general guideline. Indeed, at its essence, the objective
is to find a chemical entity that will sufficiently perturb the strong nitrogen triple bond
so that the N2 molecule splits apart. This is often accomplished through chemical
30
precompression. The basic idea consists of introducing other chemical entities which,
either by an electron transfer or by the larger volume of their electron cloud, increase
the effective average valence electron density of the precompressed nitrogen molecules
[11]. The greater the nitrogen electron density, the more favorable are the lower-order
bonds and the greater the intramolecular N-N distances. As such, measuring the
interatomic (or intramolecular in the cases of H2 and N2) distances in the chemically
precompressed atoms is typically a good indicator of this phenomenon's effectiveness.
Indeed, as a nitrogen molecule shifts from triple- to single-bonded, the N-N bond length
increases from about 1.1 to 1.4 Å [57]. Thus, chemical entities that can readily give away
electrons, such as atoms with low ionization energies and transition metals, as well as
large atomic volume elements are particularly interesting in the context of chemical
precompression.
Alkali metal-nitrogen systems provide a good example of the effect of chemical
precompression. The alkali metals readily provide a charge transfer of about one
electron which enables the formation of an azide (N3-), where the nitrogen atoms are
bonded through double-bonds. Moreover, larger alkali metals also provide an extra
boost in chemical precompression due to their sheer size, bringing closer the nitrogen
atoms [31,58,59]. For reasons explained earlier, they also favor the compound
metastability since they produce anionic nitrogen entities.
Of course, the mixture needs to be richer in nitrogen than in the perturbing
chemical entity so to increase the odds that when the N2 dimer breaks, N-N bonds are
formed instead of bonding nitrogen with another element.
II. B. 1. Lowering the synthesis conditions of known polynitrogen compounds
An alternate approach is to reduce the pressure of synthesis of an already
known stable polynitrogen compound by adding extra energy to the compression work.
This energy, which would have otherwise been provided by further increasing the
pressure, allows overcoming an energetic barrier towards the polynitrogen compound.
Laser-heating is the most common and accessible technique, already having been
demonstrated on pure nitrogen ‒ and a plethora of other compounds ‒ as the polymeric
form was accessed at 110 GPa at 2000 K instead of the amorphous single-bonded type
otherwise produced at about 150 GPa [9]. More exotic alternatives include
photochemistry, mechanochemistry, the choice of chemical precursors and
topochemistry.
Photochemistry ‒ i.e. a chemical reaction induced by the absorption of light ‒
under high pressure was reported on a number of accounts. While it is usually
31
performed by employing highly energetic photons, such as ultraviolet and X-rays
[60,61], a specific, sometimes lower energy, wavelength can be chosen to excite specific
molecular levels. For example, N2-O2 mixtures above 5 GPa were irradiated by a 1064
nm wavelength photons, corresponding to the energy required to reach the first excited
electronic energy level of the O2 molecule from its ground state. By doing so, a
photoinduced chemical reaction was observed and the NO+NO3- compound was
produced [62]. More recently, it was demonstrated that a chemical reaction between
N2-H2 initiated solely by pressure at 47 GPa could also be detected at 10 GPa through
near ultraviolet (370 nm) photochemistry. The reaction product was interpreted as
azanes (NxHx+2) of various lengths [25].
High pressure mechanochemistry is generally performed in rotational diamond
anvil cells (or in large volume presses such as the ROTOPEC), in which the piston
diamond can rotate along the main compression axis. It is reported to reduce the
pressure necessary for structural changes (including both chemical reactions and phase
transitions) by a factor of 3 to 5. At the nanoscale level, this is interpreted as being due
to the strain-induced generation of defects (particularly dislocation pile-ups) that
locally produce important stress. These strong defects are thought to allow the
barrierless nucleation of the high pressure phases, hence produced at reduced
compression [63]. The most notable example of mechanochemistry is perhaps the
transformation of rhombohedral boron nitride into the ultra-hard cubic boron nitride at
5.6 GPa instead of 55 GPa under hydrostatic conditions [64].
Another approach is to compress a carefully chosen chemical precursor that
may lower the energy barriers impeding the formation a desired compound. This
concept is intuitively sound in the case of molecular nitrogen, where a large amount of
energy is necessary to break apart the N2 triple bond. Thus, compressing a nitrogen-rich
precursor composed of low bond order N-N entities is more favorable to the formation
of an extended nitrogen network than the compression of the same elements mixed
with molecular nitrogen. This is exemplified in the case of cesium azide (CsN3) ‒ in
which nitrogen is in the form of a three-membered chain ‒ which was thought to be
much more favorable than having Cs and N2 as reactants in order to produce CsN5. This
strategy was employed to successfully form CsN5 [48]. Other examples supporting this
can be found in theoretical papers. Indeed, it was calculated that the energetically-rich
hydronitrogen compound (NH)4, composed of one-dimensional single-bonded nitrogen
atoms, could be produced at 36 GPa or 75 GPa depending on whether the compressed
precursor was tetrazene (TTZ) or, ammonium azide (AA), respectively [20]. The
pressure difference between the two precursors can be explained by the bonding order
of their nitrogen atoms. In AA, composed of azides, the bond order is of about 2.5
whereas it is closer to an average of 1.5 in TTZ, made up of (NH2-N=N-NH2) molecules.

32
The topochemical principle provides another set of conditions for a good
chemical precursor. This principle states that the preferential reaction pathway in the
case of a solid state reaction is the one that minimizes atomic and molecular
displacements [65]. As such, the crystalline structure of the reactants often determines
the structure of the resulting transformation products. This principle is particularly
relevant at high pressures since atomic diffusion is even lower than at ambient
conditions. The topochemical effect was demonstrated for both the pressure-induced
polymerization of diacetylenes and ethylene [65]. Making good use of this principle can
both favor the synthesis of specific geometries of polynitrogens as well as reduce the
energy needed for a transformation.
Now having a better handle on the synthesis methods of novel polynitrogen
solids from nitrogen-rich mixtures, the eventual means to reduce their formation
pressure and the physics behind a compound’s metastability, the strategy employed
during this Ph.D. thesis can be discussed hereafter.
III. THE SELECTED SYSTEMS FOR INVESTIGATIONS
Specific nitrogen systems were chosen for investigation as they seemed
promising for the synthesis of improved polynitrogen compounds. Our choices are
described below and the questions as well as hopes regarding their outcomes
underlined. In all cases, theoretical calculations had been reported in the literature and
further had helped guiding our choices.
Pure molecular nitrogen
At the root of this thesis, it is logical that molecular nitrogen should be the first
candidate for an investigation. This would allow the critical acquisition of a reference
dataset that will be useful in all subsequent studies as well as to reproduce and
reconfirm the established literature data. Of equal importance, significantly
overstepping the maximum previously-reported pressure and temperature conditions
could allow for the synthesis of a novel form of polymeric nitrogen, as suggested by
theoretical calculations. Indeed, a N10 diamond-like form of polynitrogen was calculated
to be stable above 263 GPa, along with many other arrangements with competitive
enthalpies [12]. Could a new single-bonded N-N geometry compound have a greater
cohesive energy and thus be easier to retain at ambient conditions? Or perhaps a

33
discovered novel arrangement could be more accessible by other experimental
techniques, such as chemical vapor deposition and laser-shocked syntheses?
Xenon-nitrogen mixture
First among the elements mixed with nitrogen, xenon was a particularly
interesting case to observe the effect of chemical precompression based on its very
large atomic volume. Would the nitrogen polymerization pressure be reduced
proportionally to the percentage of xenon atoms added? Furthermore, knowing that
xenon has loosely-bounded valence electrons, would a significant electronic interaction
occur between the two elements? If so, would it promote or hinder the formation of an
extended network? Moreover, by first determining the Xe-N2 binary phase diagram,
perhaps a van der Waals compound would be discovered and have a structural
arrangement facilitating through the topochemical principal a polymerization.
Providing further motivation to investigate this system, theoretical calculations have
predicted the pressure stabilization of a high energy density polynitrogen-xenon solid.
This compound, with a XeN6 stoichiometry, is expected to form above 145 GPa and is
the sole Xe-N compound predicted so far.
Lithium-nitrogen mixture
This mixture would allow to probe the effect of the second parameter in
chemical precompression: a gain in electronic density due to an electron transfer.
Indeed, the highly reactive lithium atoms were expected to give their sole valence
electron to the nitrogen atoms. Would this be more efficient than chemical
precompression achieved by the xenon atoms? Moreover, theoretical calculations
predicted a large wealth of anionic nitrogen moieties, ranging from N3-, ([N2]-2, [N2]-4),
N3- and even N5- [28,29]. The latter, stabilized as lithium pentazolate (LiN5), is highly
energetic on account of its low N-N bond order and is predicted to be formed below 20
GPa as well as being metastable down to ambient conditions. If the calculations were to
hold true, it would be the first polynitrogen compound produced by pressure to be
retrievable at ambient conditions. Its experimental confirmation would represent a
major breakthrough.

34
Hydrogen-nitrogen mixture
Though no steric chemical precompression of the hydrogen atoms on the nitrogen
atoms is anticipated, theoretical calculations predict many N-H compounds to be
produced. These range from azane chains, bi-dimensional polybonded nitrogen layers
to anionic species such as the elusive pentazole (N5-H+), all expected at pressures below
60 GPa. Furthermore, previous experimental studies are reported in the literature and
hint at the synthesis of long, energetically-rich azanes (NxHx+2) from the compression of
N2-H2 powders above 50 GPa [25,26]. However, another experimental study has
resolved the N2-H2 binary phase diagram and determined that these powders would
have to be composed of the (N2)6(H2)7 and N2(H2)2 van der Waals compounds [24].
Knowing that the compression of a (N2)6(H2)7 single crystal above 50 GPa results in the
formation of ionized ammonia, the N2(H2)2 compound should be responsible for the
synthesis of the long azane chains observed in N2-H2 powders. If the structure of the
N2(H2)2 compound can be determined, perhaps a topochemical effect responsible for the
formation of long azanes could be evidenced. The experimental verification of the high
pressure behavior of N2(H2)2 as well as the possibility to produce other arrangements of
hydronitrogen solids motivated the investigation of this system.
To help cross activation barriers, and thus reduce the pressure synthesis of the
hypothetical polynitrogen compounds, the various samples, with the exception of N2-H2,
were laser-heated to typically a few thousands of Kelvin.
The present manuscript is structured as follows. The first two sections describe
the high pressure experimental apparatus, the sample preparation methods and the
characterization techniques. Next, a whole chapter is devoted to the state of the art on
pure molecular nitrogen. Then, following a short introduction, the results obtained
during the investigation of pure N2 as well the Xe-N2, N2-H2 and Li-N2 mixtures will be
presented. Finally, a general discussion on the studies' outcome is made along with an
outlook for future work on the synthesis of novel polynitrogen compounds.

35
EXPERIMENTAL TECHNIQUES IN HIGH
PRESSURE PHYSICS
In nature, most of the matter is under pressure and the pressure range is very
large. While at the surface of Earth, pressures of about 1086 bars have been measured
at the bottom of the Marianna trenches, at its core matter is compressed to 3.6 Mbars,
which pales in comparison to the pressure attained in some celestial bodies, reaching
1.6•1025 Mbars in neutron stars. However, only in the last two centuries has man-made
high pressure generation been achieved. Accessible first by employing explosives,
dynamic pressure studies gained some popularity in the 19th century, period at which
the theoretical groundwork was mostly laid out, and in particular Rankine’s seminal
treatise titled “On the Thermodynamic Theory of Waves of Finite Longitudinal
Disturbance” in 1857. However, the field of dynamic pressure generation was hindered
and slowed down by the lack of high-speed instruments allowing a characterization on
the compressed samples, as the shocks could last only between 1 µs to 1 ns. Moreover,
even with an ideal setup, the very nature of these experiments does not permit an
isothermal compression of matter. Even today, while the diagnostic capabilities have
drastically improved and pressures on the order of the Gbar and even the Tbar are
attained, the same fundamental difficulties arise.
Parallel to these developments, Percy Williams Bridgman’s designed a double
anvil press that permitted high static pressures to be obtained. With the large
improvements achieved on this first conception, including mostly transparent anvils, a
metallic gasket allowing gases to be studied, in situ pressure gauges and much more,
static pressures of over 1 TPa are now claimed to have been reached. The intrinsically
very small dimensions of even the highest-pressure samples (a few cubic micrometers
in the Mbar range) is overcome as the latest generation of synchrotrons can produce
36
tightly focused beams of light of extreme brilliance to probe the sample. Moreover,
these allow a plethora of characterization techniques, namely circular and linear
polarization (for magnetic studies), high energy resolution inelastic scattering (for
dynamical properties), coherence imaging (for sensitive phase contrast images), high
energy elastic scattering (for disordered, liquid, amorphous and crystalline systems)
and so many more [66]. With so many recent developments granting experimentalists
tremendous quantities of tools, it is the golden times of static high pressure physics.
I. SAMPLE PREPARATION, HIGH PRESSURE AND HIGH TEMPERATURE
GENERATION
The very first anvil cell was produced by Percy Williams Bridgman in early
1930. Although conceptually very basic, this novel apparatus was constituted of a steel
structure holding two opposite tungsten carbide anvils between which a sample,
typically solid, was positioned [67]. This first device introduced the fundamental
principles allowing to generate high pressures. The second breakthrough had to wait
until the 1950's to occur, when two groups simultaneously thought of using diamond as
anvils [68][69]. The following important developments, giving rise to the traditional
apparatus used nowadays, came from the elaboration of a sample cavity, typically
constituted of a pierced metallic foil. In the next few sections, each of the vital elements
of a diamond anvil cell will be discussed.
I. A. Diamond anvil cells
A diamond anvil cell (DAC) is composed of two main parts: the cylinder and the
sliding piston, on both of which are mounted a diamond anvil. By applying a moderate
force on the piston, it moves closer to the stationary cylinder thus compressing the
sample confined in between the two facing anvils (see Figure 1). Due to the very large
ratio between the area of the back and of the very tip (culet) of the diamond, the
pressure exerted on the back of the diamond is multiplied at the culet. However, the
simplistic formula
is not nearly sufficient to calculate the pressure
inside the experimental cavity on account of the strain, friction and deformation of the
DAC body and of the metallic gasket.

37
Figure 1: a) Schematic of a diamond anvil cell, equipped with Drukker-type diamond anvils. b) Drukker and c) Almax-Boehler design diamond anvils. The provided values are in millimetres.
There exist two main types of DACs, screw DACs and membrane DACs. As the
name suggests it, in screw DACs the piston is screwed into the cylinder while in the
membrane DACs, a metallic membrane is inflated by compressed gas and pushes the
piston towards the cylinder. The membrane system, improved by Letoullec, Pinceaux
and Loubeyre [70] from the initial design of Daniels and Ryschkewitsch [71], is
advantageous since it allows a fine control of the pressure applied to the piston and thus
to the sample. This is vital for the precise determination of a binary phase diagram as
well as for the growth of single crystals. Furthermore, this setup also easily permits a
remote regulation of pressure, which is especially useful for synchrotron experiments
where opening up the experimental hutch and sample aligning are time consuming as
well as for low and high temperature experiments where the cell is in a vacuum
chamber. Consequently, this design was used for all experiments presented here.
Schematics of this cell are shown in Figure 1 as well as Figure 2.
38
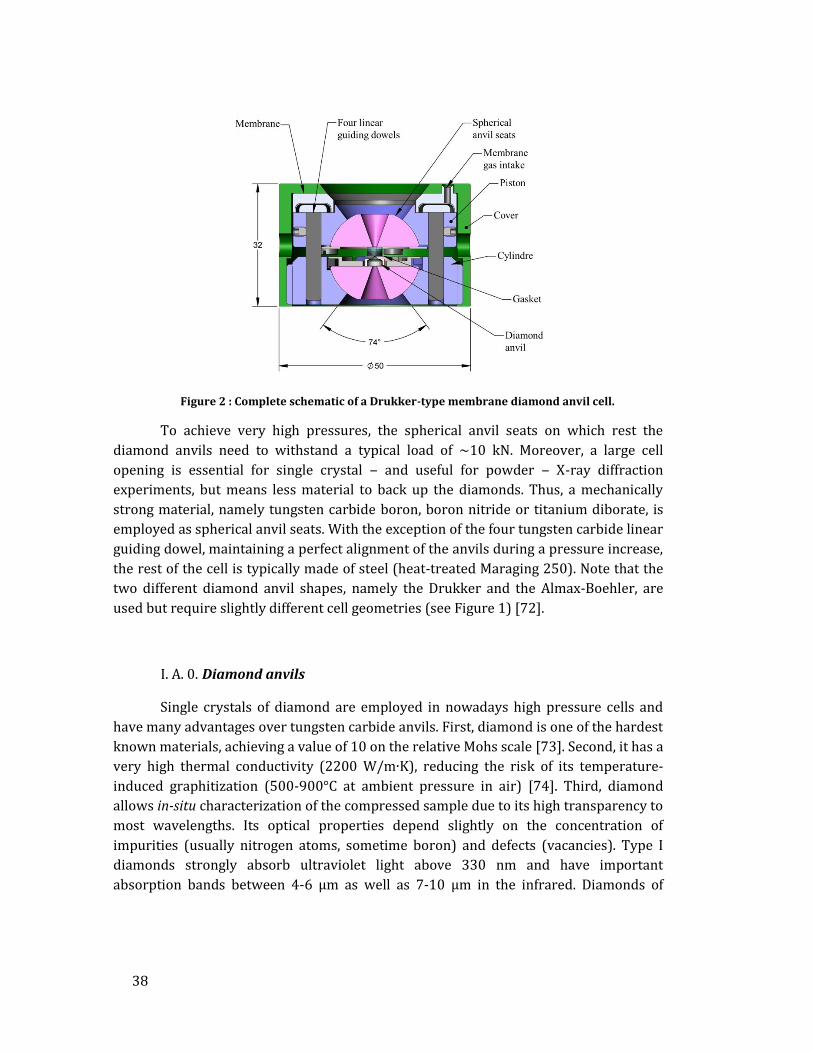
Figure 2 : Complete schematic of a Drukker-type membrane diamond anvil cell.
To achieve very high pressures, the spherical anvil seats on which rest the
diamond anvils need to withstand a typical load of ∼10 kN. Moreover, a large cell
opening is essential for single crystal ‒ and useful for powder ‒ X-ray diffraction
experiments, but means less material to back up the diamonds. Thus, a mechanically
strong material, namely tungsten carbide boron, boron nitride or titanium diborate, is
employed as spherical anvil seats. With the exception of the four tungsten carbide linear
guiding dowel, maintaining a perfect alignment of the anvils during a pressure increase,
the rest of the cell is typically made of steel (heat-treated Maraging 250). Note that the
two different diamond anvil shapes, namely the Drukker and the Almax-Boehler, are
used but require slightly different cell geometries (see Figure 1) [72].
I. A. 0. Diamond anvils
Single crystals of diamond are employed in nowadays high pressure cells and
have many advantages over tungsten carbide anvils. First, diamond is one of the hardest
known materials, achieving a value of 10 on the relative Mohs scale [73]. Second, it has a
very high thermal conductivity (2200 W/m∙K), reducing the risk of its temperature-
induced graphitization (500-900°C at ambient pressure in air) [74]. Third, diamond
allows in-situ characterization of the compressed sample due to its high transparency to
most wavelengths. Its optical properties depend slightly on the concentration of
impurities (usually nitrogen atoms, sometime boron) and defects (vacancies). Type I
diamonds strongly absorb ultraviolet light above 330 nm and have important
absorption bands between 4-6 μm as well as 7-10 μm in the infrared. Diamonds of

39
higher quality, known as type II, do not strongly absorb in the ultraviolet before 220 nm,
have a lower absorption in the 4-6 μm band and are almost completely transparent
above 7 μm. Due to their much-improved optical properties in the infrared, they are
typically used for infrared absorption spectroscopy measurements. The complete
absorption spectra of both types of diamonds can be found in the literature [75].
The maximum pressure that can be achieved using a given diamond anvil mainly
depends on its culet size (D). An empirical scale, produced by Ruoff et al [76], gives the
following relationship:
.
This formula is plotted in Figure 3. It is regarded as a good rule of thumb for culet
diameters between 20 to 300 μm. Indeed, this was recently validated with culets of 20
μm, which allowed reaching a pressure of 398 GPa, easily comparable to the value of
415 GPa given with the above empirical scale [77]. The physics behind this equation is
analogous to the Petch relationship as well as to the Griffith criterion: the critical stress
for a material found to be inversely proportional to the square root of the characteristic
length [78]. In the case of the diamond anvils, the characteristic length translates into
the culet size while the pressure within the sample cavity was employed instead of the
critical stress to determine the empirical relationship.
Figure 3: Ruoff’s empirical relationship between the maximum achievable pressures with respect to the diamond anvil culet diameter.
However, with focused ion beam machining, new diamond anvils were designed
and have allowed even greater pressures to be generated. A tore-shaped anvil has
recently been employed to reach pressures nearing 600 GPa on gold [79]. Even the
terapascal barrier seems to have been broken using nanocrystalline diamond anvils to

40
compress gold, however on a very small area of the sample (3 μm in diameter and 1 μm
in thickness) [80].
I. A. 1. Gasket
The role of the metallic gasket in a DAC is twofold: 1) contain the sample, thus
allowing gases and liquids to be loaded and 2) apply a radial pressure on the sample.
Before being employed, the gasket is indented, employing the diamond anvils, to a few
tens of gigapascals (~30 GPa) which reduces its thickness and, more importantly,
enhances its mechanical properties by strain-hardening it. Only then is the sample
cavity pierced, to a size of about 30-70% of the culet's diameter. To do so, an yttrium
femtosecond pulsed fiber laser (Amplitude Systèmes) was employed. While a
wavelength of 515 nm was typically used, the laser can also emit at 1033 and 344 nm.
Coupled with a WS-flex (Optec) motorized piezo-driven scan stages, on which the
gasket is mounted, sample cavities of diameter down to 15 µm were accurately drilled.
Figure 4 shows an image, obtained by an electron scanning microscope, of a
femtosecond laser-made hole in a rhenium gasket.
Figure 4: Scanning electron microscope image of a drilled rhenium gasket using a femtosecond pulsed laser.
While gasket materials are partially chosen for their lack of chemical reactivity
with most elements, the compression of hydrogen requires extra precautionnary
measures. Indeed, due to its size, hydrogen tends to diffuse inside rhenium and stainless
steel gaskets. In turn, this weakens the gasket's mechanical properties and slightly
changes the sample concentration, as observed in the case of N2-H2 mixtures. To prevent
this, the sample cavity inner walls were coated with a thin (≈ 2 μm) layer of gold. This
was accomplished by filling up and heavily compacting gold (< 1 GPa), using the
diamond anvil cell, inside the gasket's hole. Then, all but the gold crown was ablated by
41
the femtosecond laser. Although, this was not employed during this thesis, a high
vacuum metallic coater that allows a thin (a few tens or hundreds of nanometers)
coating the inner walls of the experimental chamber can also be used. This technique is
useful when much higher pressures are required (> 100 GPa) and therefore the sample
cavity is much smaller.
I. A. 2. Pressure transmitting medium
The main role of the pressure transmitting medium is precisely what its name
suggets: to transfer the pressure generated from the diamond anvils (and the plastically
deforming gasket) in such a fashion that a hydrostatic pressure is applied on the
sample. Based solely on hydrostaticity concerns, helium is regarded as the best pressure
transmitting media as it solidifies at the highest pressure — 11.5 GPa — and is the solid
with the lowest bulk modulus [81,82]. However, other considerations are taken into
account when choosing the pressure transmitting media, such as reactivity with the
sample, potential destructive diffusion into the diamond anvils, number of diffraction
peaks (for X-ray diffraction experiments), Raman modes and infrared absorption as well
as the sample chamber dimensions.
In the case of most experiments presented in this thesis, chemical reactions with
nitrogen were sought for and therefore nitrogen was the employed pressure
transmitting medium as well as acting as a reagent. Solidifying at 2.49 GPa, nitrogen has
a low bulk modulus as well as its pressure derivative (K0=2.69 GPa, K0'=3.93 and
K0=2.98 GPa and K0'=3.78 in the δ and ε phases, respectively) making it a fairly good
pressure transmitting medium, hydrostatic up to about 13 GPa [75] and
quasihydrostatic afterwards, with pressure gradient of about 3 GPa at 44 GPa [83].
Having only a few Raman and infrared active vibrational modes, it however produces
many diffraction peaks in the ε phase (rhombohedral, R-3c), which hinder the
observation of other solids' diffraction lines [9].
I. B. Gas loading of mixtures and reactive samples
With the objective of synthesizing novel polynitrogen compounds, pure nitrogen
or nitrogen gas mixtures (Xe-N2, H2-N2) were typically loaded in the DAC. Due to the
very high compressibility of elements that are gases at ambient conditions, their
compression from ambient pressure would result in dramatic reduction of the
experimental cavity diameter and thus very tiny sample sizes. To avoid this issue, the

42
gases are loaded into the DAC at high pressures (up to 1400 bars), thus greatly reducing
their compressibility and thus the sample cavity shrinkage. Of course, other
experiments may also require the loading of gases acting as the pressure transmitting
medium.
To reach these high loading pressures, a high pressure gas loading apparatus
was used (Sanchez Gas Loading System GLS1500). First, the membrane DAC is left
opened in the loading bomb. Two sets of pumps each with an empty volume of 285 cc,
one mainly in charge of controlling the DAC membrane pressure and the other of the
sample environment pressure, are then filled with the gas or the gas mixture desired to
be loaded in the DAC until reaching a pressure of 150-200 bars. Employing a piston-
type compression, the gas in the two pumps simultaneously increase in pressure up to
1400 bars on both the DAC's membrane and the loading bomb containing the DAC. In
order to seal the DAC, the membrane pressure is further raised an extra ~30 bars. With
a camera setup allowing the visualization of the DAC in-situ, it can be confirmed that the
DAC is closed. Then, the pressure in the loading bomb is brought down to ambient
condition while the membrane pump is lowered down in such a was as to keep the
sealing pressure constant. The DAC's microvalve can then be sealed, the leftover
pressure in the membrane pump released and the DAC disconnected.
When loading gas mixture, its concentration is calculated based on the partial
pressure of the two gases corrected with the second order Viriel coefficient, B(T), with T
being the temperature. The Viriel coefficient takes into account the potential of
interaction between the gas particles. The second order expansion of the Viriel equation
of state is [84]:
where P is the pressure, v the molar volume and R the ideal gas law constant. When
determined based on a Lennard-Jones potential, the second order Viriel coefficient B(T)
can be written as:
,
where
and
[84].
Here, Na is Avogadro's number, kB is Boltzmann constant, j is a positive integer and ε
as well as σ represent the depth of the potential well and the interatomic distance at
which the attractive and repulsive forces are even, respectively.

43
From the second order Viriel equation of state and a gas partial pressure (Pα,
defined as Pα=xαPmix where Pmix is the total pressure of the gas mixture), the
concentration of a loaded gas, xα, can be determined through:
where, for a binary gas mixture
,
in which Bαα(T) (and Bββ(T)) account for the interaction between same-species
particles and Bαβ(T) (as well as Bβα(T)) for the interaction between two different species.
As stated above, B(T) = b0B*(T) and thus through b0 and B*(T) it contains the crossterms
εαβ and σαβ. These can be determined from the Lorentz-Berthelot rule [85], which states
that:
and .
These values are known for all gases used in this thesis (Xe, H2 and N2) [86].
To ensure that the two gases have well blended and form a homogeneous
mixture, they are left to mix for over 12 hours before closing the diamond anvil cell.
I. C. Laser-heating
DAC laser-heating allows to reach very high temperatures and pressures that
are relevant to planetery sciences and to synthesize novel materials. Two types of high
power lasers are typically used: a Nd:YAG laser (λ = 1.064 μm) and a CO2 laser (λ = 10.6
μm). The emission wavelength of these lasers make each better suited for certain types
of materials. Usually, the Nd:YAG laser is employed for opaque and metallic solids
whereas the CO2 laser is more appropriate for transparent or insulating materials, such
as oxides and molecular compounds (NH3, CO2, H2O, etc). These continuous wave lasers
can generate a beam intensity of up to 100 W which can be focused down to about 10 or
30 μm on the surface of the sample, for the Nd:YAG and CO2 lasers respectively. Since
the temperature is known to decrease dramatically within a few microns into the bulk
of the solid [87], even in the case of metals, double-sided laser-heating was typically
performed in our experiments to reduce the thermal gradients.

44
Temperature measurement of the laser-heated samples are achieved by
recording the thermal radiation that they produce. Schwarzschild mirrors reflect the
heat-produced photons into a spectrometer covering from 400 to 950 nm. A fit of the
detected photons to Planck's law is then performed, through the formula:
where T is the temperature, h is Planck's constant, k is Boltzmann's constant, c is the
speed of light in vacuum and ε is the sample's emissivity. Using the more general case of
a grey body emission, ε is also a fitted parameter. As it can be seen from Figure 5, the
thermal emission intensity rapidly decreases with temperature. While temperatures
down to 1000 K can still be measured with a typical Si detector, employing a detector
sensitive between 1000-1700 nm, such as a InGaAs detector, allows temperatures of
700 K to accurately be measured.
Figure 5: Thermal radiation measured from a tungsten lamp. Spectra at various temperatures, recorded by employing a a) Si (with a single UV-grade fused silica window) and b) InGaAs detector,
and fitted using Planck’s law, yielding the temperatures shown in the top left of the graph.
I. C. 0. Laser-heating nitrogen and nitrogen mixtures
Three types of samples studied here were laser-heated: pure N2, Xe-N2 and Li-N2
mixtures. In each case, a different element was acting as the laser absorber. Pure
nitrogen and xenon have their band gap closing above 160 GPa and 150 GPa,
respectively [9,88], and thus become opaque and so good YAG absorbers. In the case of

45
Li-N2, pure lithium is a metal and easily heats up under the YAG laser. In the context of
this thesis, laser-heating was performed to cross eventual activation barriers impeding
a chemical transformation or a phase transition. To make sure that a chemical reaction
with the carbon of the diamond anvils did not occur, test runs were performed with a
thin layer (~ 200 nm) of a chemical insulator (Al2O3, TiO2) covering the diamond anvil.
During these runs, if the same sample behavior was observed, it confirmed that no
carbon impurities were taking part.
I. D. Pressure measurements
The accurate determination of pressure in a DAC is a challenge. The main issue
resides in the fact that a direct pressure measurement of a sample inside a DAC is a
complex endeavour that requires the use of specific techniques (ultrasonic
measurements, Brillouin scattering, inelastic X-ray scattering) which are not readily
available at high pressures (< 75 GPa) and that are very time consuming [89–91]. These
methods allow measuring a material’s elastic constants which, in turn, can be used to
obtain its isothermal bulk modulus (KT). Through the following relationship, knowledge
of the bulk modulus and of the sample’s volume (V, typically obtained by X-ray
diffraction) can provide the pressure:
By employing this equation to determine the pressure is considered as a direct
measurement and can be used to produce primary pressure gauges. While this method
was used for several solids up to high pressures (MgO up to 55 GPa [92], SiC up to 75
GPa [93]), another technique is more commonly employed and allows to obtain primary
pressure gauges up to very high pressures. That technique is based on shockwave
experiments. During these experiments, a high-speed shockwave is generated through a
material, generating high pressures and high temperatures. The Rankine-Hugoniot
equations relate a material’s pressure (PH0), specific volume (vHO) and internal energy
(UH0) before the shockwave as well as right behind the shockfront (PH, vH and UH,
respectively) to the shockwave velocity (Us) and the speed particle velocity inside the
compressed region behind the shock front (up) [94]:

46
The Us and up parameters can be determined by interferometric velocimetry
measurements and thus used to obtain PH and vH. However, it must be noted that the
values PH and vH obtained in this straightforward fashion are actually the pressure and
specific volume at the temperature of the Hugoniot. To correct and obtain these
parameters down to ambient temperature, a thermodynamic model (typically the Mie-
Grüniesen equation of state) which relates the temperature to material’s internal
energy (see ref. [95]). In this fashion, the cold compression curve V(P) for many simple
metals (including Al, Cu, Ta, W, Pt and Au) could be determined [96].
Having these materials’ equation of state determined through reliable, direct
measurements, the most practical approach is then to calibrate another material’s
property ‒ one that can conveniently be measured ‒ against these primary pressure
gauges. As described below, the most common secondary pressure gauges exploit a
material’s luminescence, Raman modes (both obtained with optical methods) or its unit
cell volume (through X-ray diffraction). Most of these pressure gauges can be loaded
along with the studied sample and permit an in-situ measurement of the pressure inside
the experimental cavity.
I. D. 0. Luminescence gauges
The most popular luminescence gauge is Cr-doped Al2O3 – ruby. The
introduction of the metallic ion Cr3+ creates new energy levels in alumina. Electrons can
be excited to these new states by the absorption of photons of a few eV and reemit, upon
their de-excitation, photons of mainly two different energy, producing a doublet
composed of the R1 and R2 peaks.
Due to the modification of the crystalline field by pressure, the energy levels
slightly shift during the compression of the ruby (see Figure 6 a)). By calibrating the
energy of the photons reemitted against pressure, this fluorescence can afterwards be
used to determine the pressure inside the sample cavity. Indeed, the following empirical
formula is the most commonly used to relate the measured peak wavelength (λ) and the
in-situ quasi-hydrostatic pressure (PH) [96]:
,
where λ0 is fluorescence wavelength measured at ambient pressure. The
uncertainty is established to be of about 0.03 GPa. Furthermore, the ruby fluorescence

47
gauge also provides qualitative insight about the hydrostaticity conditions in the
experimental chamber: as pressure increases and the hydrostaticity decreases, the full
width at half maximum of the R1-R2 doublet increases (Figure 6 b)). For significantly
non-hydrostatic conditions, for example if the R1 and R2 lines merge to produce a single
peak, the following equation provides a better estimate of the pressure (PNH) [97]:
.
A ruby of about 3-5 μm is typically loaded along the sample in the experimental
cavity.
Figure 6: a) Pressure evolution of ruby’s fluorescence. b) Fluorescence of a ruby microball under quasi-hydrostatic (blue) and non-hydrostatic (red) pressure conditions. The spectra were obtained
from a ruby microball embedded in neon.
I. D. 1. X-ray diffraction gauges
The criteria defining a good X-ray diffraction pressure gauge are the following: a
material's high compressibility; chemical inertness; large X-ray scattering power; highly
symmetric lattice (few diffraction peaks); well-known equation of state, a simple phase
diagram and a weak sensitivity to deviatoric stress. Gold, with a moderate
compressibility (167 GPa), 79 electrons, a simple fcc lattice up to pressures of at least a
few megabars as well as a very high chemical inertness fills all of the needed
characteristics and is thus often used as an X-ray pressure gauge [98]. A small gold chip
(≈2 μm) was loaded in the sample chamber for all experiments here requirering an X-
ray gauge. The pressure uncertainty with this secondary pressure gauge is less than 1
GPa below 120 GPa [98]. Other gauges are commonly used, such as NaCl, W and Pt.

48
In the specific case of ultra-high pressure experiments (> 200 GPa), the
experimental chamber diameter is often smaller than 15 µm. This generally precludes
the use of an in-situ pressure gauge such as a ruby or gold microball as its signal,
whether its luminescence or diffraction peaks, can overlap with that of the sample and
severely hinder its characterization. In such instances, either the rhenium gasket can
serve as a pressure gauge, in the case of X-ray diffraction measurements. Indeed, it was
demonstrated that if the X-ray diffraction measurements are obtained at the rhenium
gasket-sample interface, its diffraction peaks, due to its well-known equation of state,
can be employed to determine the pressure in the experimental chamber within about
5% of the actual pressure [99].
I. D. 2. Raman gauge
Dimaond is easily the most employed Raman pressure gauge. Similarly to the
rhenium gauge, it is most often employed as a backup gauge or when the experiment
does not permit the use of an in-situ pressure gauge. The high frequency edge inflexion
point of diamond’s main vibrational mode (centered at 1333 cm-1 under ambient
conditions), which shifts under the applied normal stress, was calibrated against lead’s
equation of state up to 410 GPa (see Figure 7). A pressure uncertainty of only 3 GPa is
claimed [100].
Figure 7: Raman spectra of a diamond anvil at ambient pressure (black) and at 236 GPa (red). The blue line is the first order derivative of the red spectra, and the dashed line marks the inflexion
point in the high frequency diamond edge, which gives a pressure of 236 GPa. For visualization purposes, the red spectrum was multiplied by a factor of 5. The red spectrum was obtained from
diamond anvils squeezing a Ar-N2 sample.
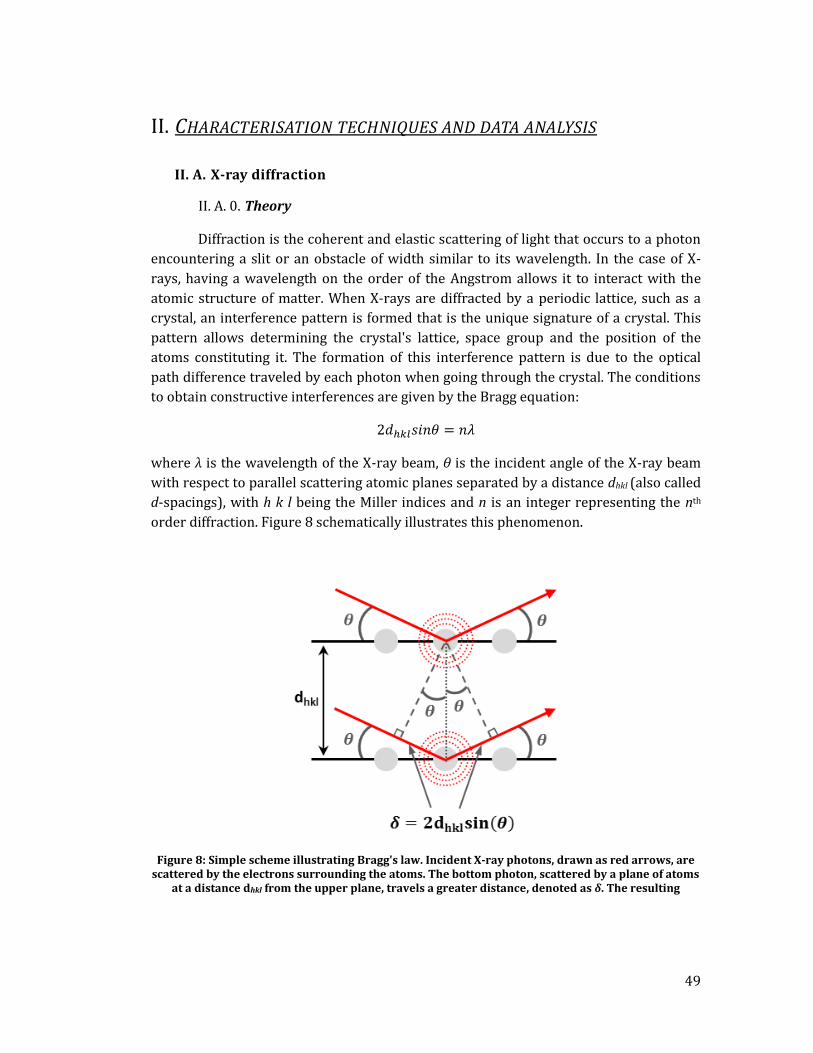
49
II. CHARACTERISATION TECHNIQUES AND DATA ANALYSIS
II. A. X-ray diffraction
II. A. 0. Theory
Diffraction is the coherent and elastic scattering of light that occurs to a photon
encountering a slit or an obstacle of width similar to its wavelength. In the case of X-
rays, having a wavelength on the order of the Angstrom allows it to interact with the
atomic structure of matter. When X-rays are diffracted by a periodic lattice, such as a
crystal, an interference pattern is formed that is the unique signature of a crystal. This
pattern allows determining the crystal's lattice, space group and the position of the
atoms constituting it. The formation of this interference pattern is due to the optical
path difference traveled by each photon when going through the crystal. The conditions
to obtain constructive interferences are given by the Bragg equation:
where λ is the wavelength of the X-ray beam, θ is the incident angle of the X-ray beam
with respect to parallel scattering atomic planes separated by a distance dhkl (also called
d-spacings), with h k l being the Miller indices and n is an integer representing the nth
order diffraction. Figure 8 schematically illustrates this phenomenon.
Figure 8: Simple scheme illustrating Bragg's law. Incident X-ray photons, drawn as red arrows, are scattered by the electrons surrounding the atoms. The bottom photon, scattered by a plane of atoms
at a distance dhkl from the upper plane, travels a greater distance, denoted as δ. The resulting

50
interference pattern is caused by the difference in optical path travelled by the upper and the bottom photons.
While certainly accurate, Bragg's law is a specific case of a more detailed set of
equations – the Laue equations – which contain additional information that can only be
accessed in the case of single crystal X-ray diffraction. That information is especially
valuable for an unambiguous crystal's space group determination. To derive the Laue
equations, one can consider the unit vectors s0 and s which are, respectively, in the
direction of the incident and scattered X-ray beams and a pair of atoms, part of a 1D-
chain, identified by positions vectors R1 and R2, with a1 = R1 – R2. This is schematically
represented in Figure 9. The difference in optical path length (DOPL) between the two
beams illustrated below is:
If we set the scattering vector S = (s – s0)/ and, knowing that for constructive
interference to occur the DOPL needs to be a multiple of the beam's wavelength, we
have:
,
where m is an integer. Now taking into account the case of 2D and 3D crystals, an
additional equation for each dimension is needed to represent the condition for
constructive interference, providing us with the three Laue equations, where ai are the
lattice parameter vectors:
Figure 9: Simple scheme illustrating Laue’s law. Incident X-ray photons, drawn as red arrows, are scattered by the electrons surrounding the atoms.

51
The tip of the scattering vector Shkl allowing for constructive interference
defines the reciprocal lattice, as schematically represented below using Ewald's sphere
(see Figure 10). As such, it can also be expressed as
where b1, b2 and b3 are the vectors defining the reciprocal lattice and have the following
relationship with the real (or direct) space lattice: (ai•bj) = δij, where δij is equal to 1 if i =
j and 0 otherwise. The relationship between the Laue equations and Bragg's law can
also be evidenced. By considering a plane represented by the Miller indices hkl,
containing the two non-equivalent vectors a1/h - a3/l and a2/k – a3/l, it can easily be
demonstrated that the Shkl scattering vector is perpendicular to this plane. Moreover,
the projection of the unit vector a1/h on the normalized scattering vector perpendicular
to the plane yields the interplanar distance:
Based on Figure 8, we know to be defined as the angle between the diffracting plane
and the incident as well as scattered beam. Thus, it is readily understood that the angle
between s0 and s is of 2 . Knowing this, based on Figure 10 and the above formula,
Bragg's law can be retrieved through simple geometry:

52
Figure 10: Schematic of the Ewald circle, the 2D equivalent of the Ewald sphere. The dotted green circles illustrate the effect of sample rotation on the nodes of the reciprocal lattice that are probed.
The Ewald sphere geometrically illustrates how Laue equations work. To
construct it, one needs to draw on the reciprocal lattice a vector of length 1/ parallel to
s0 with its tip on the lattice's origin, as illustrated in Figure 10. Then, centered on the
beginning of that same vector, a sphere of radius 1/ is traced. All of the reciprocal
lattice nodal points in contact with the surface of the sphere will satisfy the Laue
conditions and thus produce a diffraction spot. It is observed that the diameter (2/ ) of
the sphere determines the smallest d-spacing that may be measured. Of course,
changing the X-ray wavelength allows overcoming this issue and permits a different set
of diffraction spots to be observed. Finally, the rotation of the diffracting sample
changes the position of the sphere in reciprocal space and grants access to other
diffraction spots.

53
When performing X-ray diffraction experiments, the wavelength of the X-ray
beam is known and the diffraction angle is measured. Through the Bragg (and Laue)
equation, this allows us in turn to determine the distance between atomic planes. Each
constructive interference lines, or simply diffraction lines, help in establishing the
relationship between the d-spacings, the Miller indices and the crystal's lattice
parameters. The most general formula, applicable to crystals of all symmetry,
representing this relationship is:
where
where a1, a2 and a3 (also more commonly named a, b, c) are the length lattice
parameters and α, β, γ are the angular lattice parameters. In the case of a crystal with
the cubic symmetry, then a1 = a2 = a3 and α = β = γ = 90° which results in a simplified
formula:
Although Bragg's formula allows determining the whole set of lattice
parameters, no information is given on the atomic positions. This information is
obtained not from the d-spacing values but instead from the relative intensity of the
diffraction lines. The intensity is defined by the following formula:

54
where Ip is the intensity of the incident X-ray beam, K is a correction factor pertaining to
the nature of the diffracted beam (X-rays, neutrons or electrons), mhkl is the multiplicity
of a diffraction line, v is the diffracting volume, L is a correction factor depending on
whether the diffracting sample is a powder or a single crystal, P is the beam polarization
and Fhkl is the structure factor. The structure factor represents the amplitude and phase
of the photons diffraction by a given atomic plane, characterised by their Miller indices.
More specifically, it takes into account the parameters relating to the j atoms’ in the unit
cell: their number of electrons and their thermal displacement ‒ both contained within
the atomic scattering factor fj ‒ as well as their position within the crystalline lattice
with regard to their Miller indices. These parameters are linked through the following
formula:
Systematically absent diffraction lines can be understood by the above-defined
relationship between the atomic position and their hkl index. Indeed, a face centered
cubic crystal, having atoms on the relative positions (0 0 0), (0 ½ ½), (½ 0 ½) and (½ ½
0), has an non-zero Fhkl value only when all hkl indexes are all odd or even. The
systematic absence of diffraction lines is vital in determining a crystal's space group. On
the other hand, the atomic form factor is representative of an atom's scattering
efficiency and at non-zero temperatures, accounts for the thermal motion of the atoms:
where
and Bj is the Debye-Waller term. If the total electronic
density was concentrated at r = 0 and if thermal effects are neglected, the atomic form
factor would be equal to Z, the total amount of electrons carried by an atom. Inserting
this result in the above formula for Ihkl, we see that the total intensity is proportional to
the square of the electron count Z. This explains why low Z atoms, like hydrogen, helium
and lithium, are very difficult to detect by X-ray diffraction.
II. A. 1. Experimental Setup
Studying samples in a DAC imposes strict constraints on the sample size. Typical
sample sizes are on the order of a few tens of micrometers. In order to have a
55
sufficiently intense diffraction pattern, the incident photon beam needs to be of very
high brilliance. Brilliance is defined as
where BW is bandwidth. The brilliance of a third generation synchrotron light source
can be as high as ten orders of magnitude greater than a typical laboratory source [101].
Most of the experiments performed during this thesis were done at ID27 beamline of
the European Synchrotron Radiation Facility (ESRF). The X-ray beam at the ID27
beamline is produced by two small-gap undulators and has an oval-shape with its long-
axis along the horizontal. By employing a nitrogen-cooled Si(111) monochromator, the
X-ray beam energy can range from 6 keV (λ = 2 Å) to 90 keV (λ = 0.14 Å). The X-ray
beam is focused by two Kirkpatrick-Baez mirrors and cleaned by two pinholes down to
a ~5x5 µm2 spot on the sample. The diffraction patterns are collected in transmission
geometry using a 2D area detector (MAR-CCD) and a CeO2 reference sample is used to
determine the sample-detector distance, the beam's position on the horizontal and
vertical axes as well as the tilt and rotation of the detector. The DAC is mounted on
motorized translational tables and a goniometer allows the sample rotation about its
vertical axis [102]. An in situ laser-heating setup composed of two remote controlled
Nd:YAG lasers are also set up. The sample temperature during its heating is determined
using thermal radiation temperature measurements. The radiation is collected by
Schwarzschild objectives — spherical mirrors free of chromatic aberrations — and
analyzed over a large wavelength domain (typically 550–900 nm) using a CCD camera
mounted on a spectrograph [103]. The beamline’s setup is shown and annotated in
Figure 11. As specified in a previous section, the detected thermal radiation is fitted by
Planck's law, considering a grey body emission.

56
Figure 11: ID27 beamline of the ESRF. a) Photograph of the sample area where the YAG lasers optics, the X-ray beam, the Schwarzschild objectives and the DAC are shown. The MCC, which stands
for multi canal collimators are allows to remove a portion of the parasitic Compton scattering, is also shown. It was not used during this thesis. b) Another photograph of the sample area where the detector, collimator and the DAC mount with the motorized translational tables and a goniometer
are visible. c) The Schwarzschild objectives along with the thermoemission path and its corresponding optics are shown. Note that same set of optics also serves to produce an image of the
sample in the visible.
In all experiments performed for this thesis, the beam's energy was set to 33.17
keV (λ = 0.3738 Å) and angular X-ray diffraction was performed. Depending on the
nature of the sample, collection times varied between a few tens of seconds to a few
tens of minutes. The DIOPTAS software was employed to visualize and integrate the
recorded diffraction patterns [104].
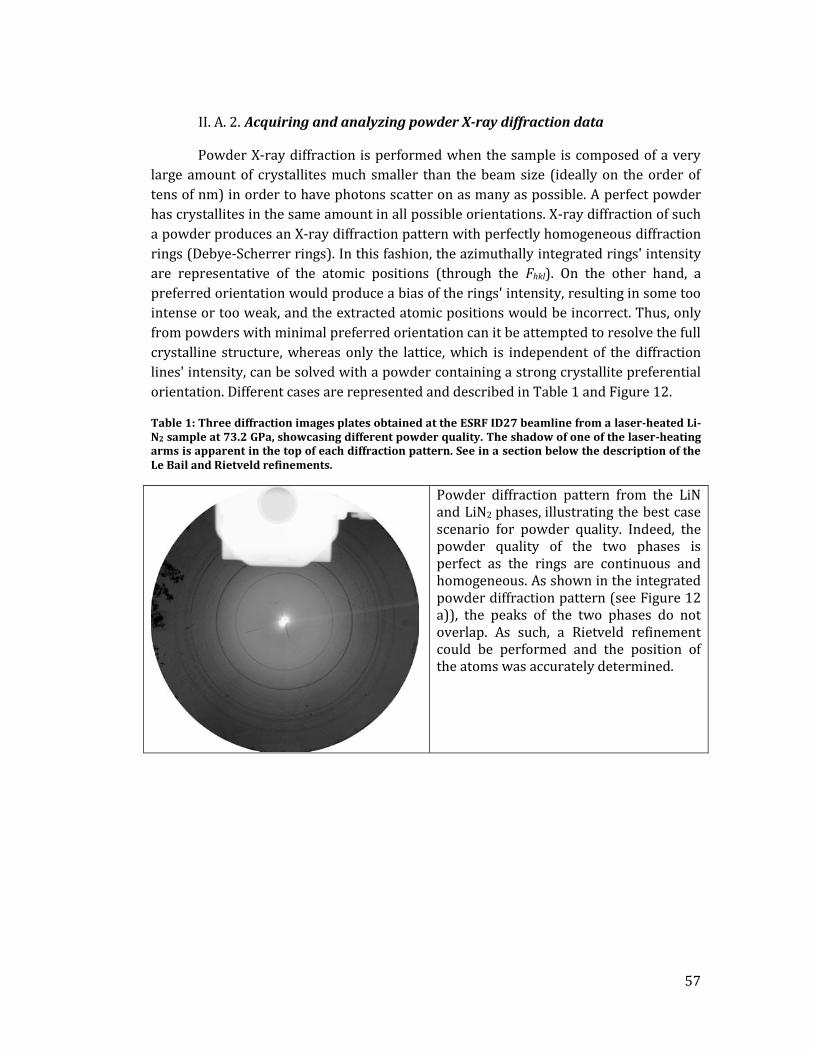
57
II. A. 2. Acquiring and analyzing powder X-ray diffraction data
Powder X-ray diffraction is performed when the sample is composed of a very
large amount of crystallites much smaller than the beam size (ideally on the order of
tens of nm) in order to have photons scatter on as many as possible. A perfect powder
has crystallites in the same amount in all possible orientations. X-ray diffraction of such
a powder produces an X-ray diffraction pattern with perfectly homogeneous diffraction
rings (Debye-Scherrer rings). In this fashion, the azimuthally integrated rings' intensity
are representative of the atomic positions (through the Fhkl). On the other hand, a
preferred orientation would produce a bias of the rings' intensity, resulting in some too
intense or too weak, and the extracted atomic positions would be incorrect. Thus, only
from powders with minimal preferred orientation can it be attempted to resolve the full
crystalline structure, whereas only the lattice, which is independent of the diffraction
lines' intensity, can be solved with a powder containing a strong crystallite preferential
orientation. Different cases are represented and described in Table 1 and Figure 12.
Table 1: Three diffraction images plates obtained at the ESRF ID27 beamline from a laser-heated Li-N2 sample at 73.2 GPa, showcasing different powder quality. The shadow of one of the laser-heating arms is apparent in the top of each diffraction pattern. See in a section below the description of the Le Bail and Rietveld refinements.
Powder diffraction pattern from the LiN and LiN2 phases, illustrating the best case scenario for powder quality. Indeed, the powder quality of the two phases is perfect as the rings are continuous and homogeneous. As shown in the integrated powder diffraction pattern (see Figure 12 a)), the peaks of the two phases do not overlap. As such, a Rietveld refinement could be performed and the position of the atoms was accurately determined.
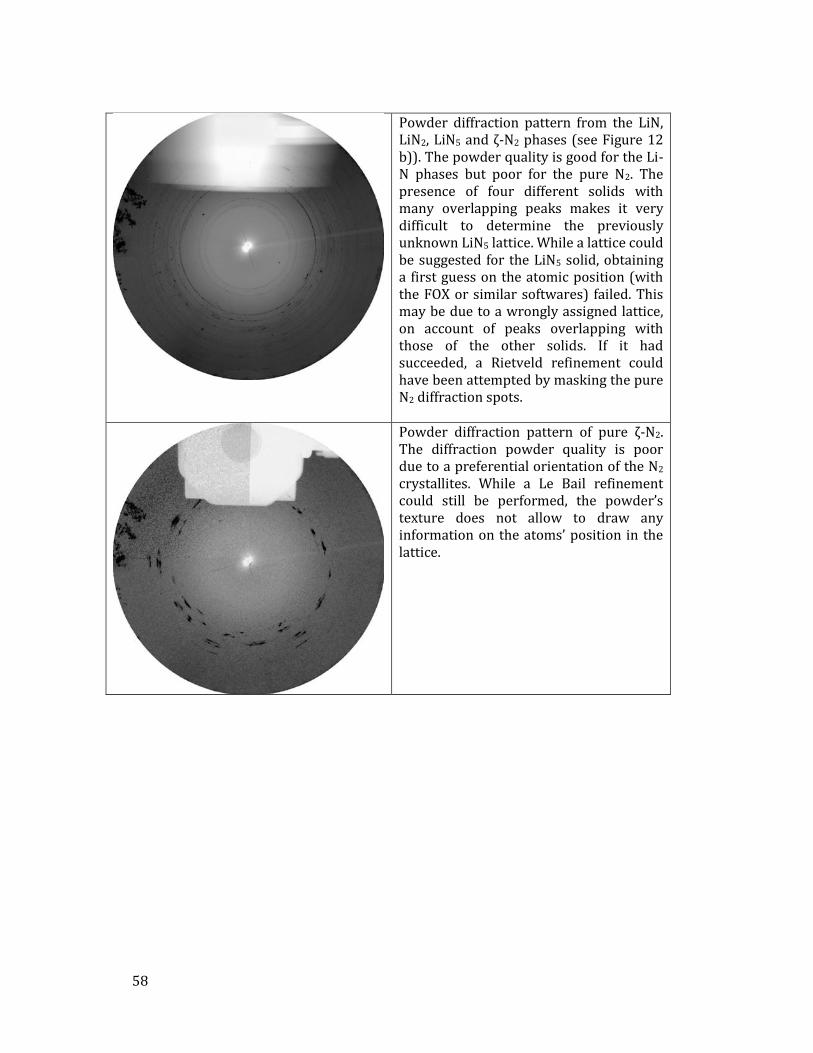
58
Powder diffraction pattern from the LiN, LiN2, LiN5 and ζ-N2 phases (see Figure 12 b)). The powder quality is good for the Li-N phases but poor for the pure N2. The presence of four different solids with many overlapping peaks makes it very difficult to determine the previously unknown LiN5 lattice. While a lattice could be suggested for the LiN5 solid, obtaining a first guess on the atomic position (with the FOX or similar softwares) failed. This may be due to a wrongly assigned lattice, on account of peaks overlapping with those of the other solids. If it had succeeded, a Rietveld refinement could have been attempted by masking the pure N2 diffraction spots.
Powder diffraction pattern of pure ζ-N2. The diffraction powder quality is poor due to a preferential orientation of the N2 crystallites. While a Le Bail refinement could still be performed, the powder’s texture does not allow to draw any information on the atoms’ position in the lattice.
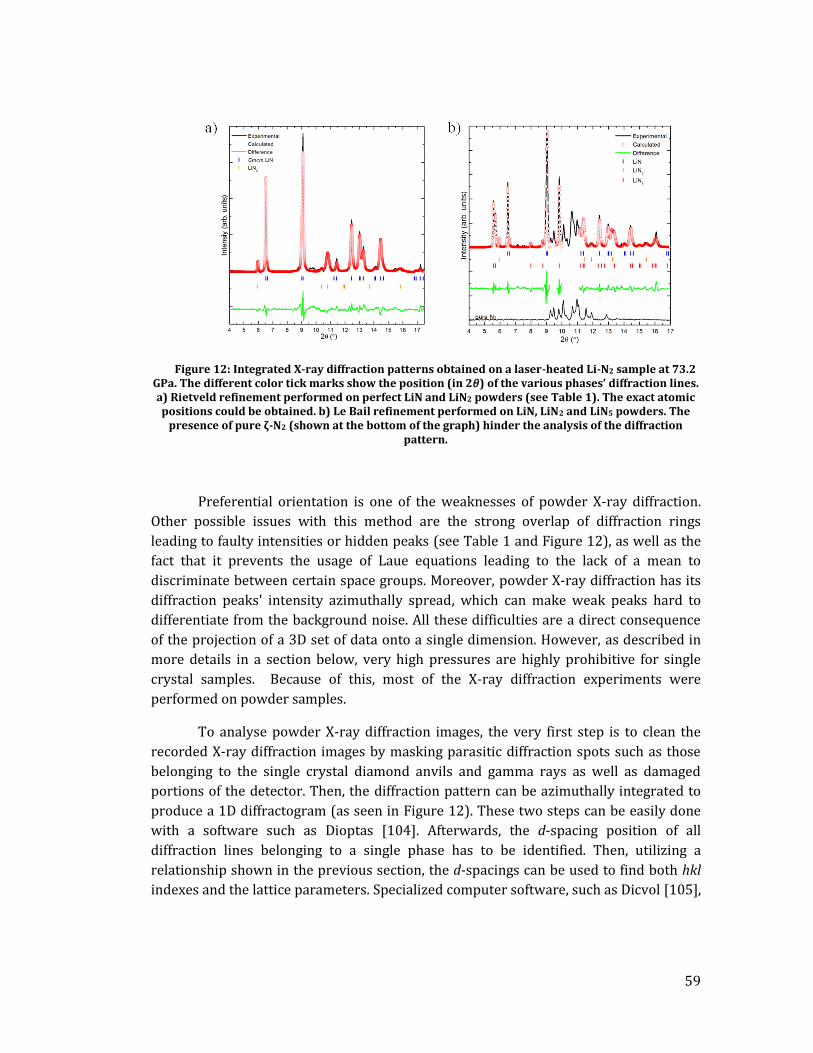
59
Figure 12: Integrated X-ray diffraction patterns obtained on a laser-heated Li-N2 sample at 73.2 GPa. The different color tick marks show the position (in 2 ) of the various phases’ diffraction lines. a) Rietveld refinement performed on perfect LiN and LiN2 powders (see Table 1). The exact atomic positions could be obtained. b) Le Bail refinement performed on LiN, LiN2 and LiN5 powders. The presence of pure ζ-N2 (shown at the bottom of the graph) hinder the analysis of the diffraction
pattern.
Preferential orientation is one of the weaknesses of powder X-ray diffraction.
Other possible issues with this method are the strong overlap of diffraction rings
leading to faulty intensities or hidden peaks (see Table 1 and Figure 12), as well as the
fact that it prevents the usage of Laue equations leading to the lack of a mean to
discriminate between certain space groups. Moreover, powder X-ray diffraction has its
diffraction peaks' intensity azimuthally spread, which can make weak peaks hard to
differentiate from the background noise. All these difficulties are a direct consequence
of the projection of a 3D set of data onto a single dimension. However, as described in
more details in a section below, very high pressures are highly prohibitive for single
crystal samples. Because of this, most of the X-ray diffraction experiments were
performed on powder samples.
To analyse powder X-ray diffraction images, the very first step is to clean the
recorded X-ray diffraction images by masking parasitic diffraction spots such as those
belonging to the single crystal diamond anvils and gamma rays as well as damaged
portions of the detector. Then, the diffraction pattern can be azimuthally integrated to
produce a 1D diffractogram (as seen in Figure 12). These two steps can be easily done
with a software such as Dioptas [104]. Afterwards, the d-spacing position of all
diffraction lines belonging to a single phase has to be identified. Then, utilizing a
relationship shown in the previous section, the d-spacings can be used to find both hkl
indexes and the lattice parameters. Specialized computer software, such as Dicvol [105],

60
are ideal to try out a large amount of lattices and provide the user with ones best fitting
the observed d-spacings. Combined with the Chekcell [106] software, which looks at
systematic extinctions of Bragg peaks, space groups are also suggested to the user. To
verify the choice of lattice and space group, they can be tested on the same diffraction
peaks at a variety of pressure, if that data is available. A Le Bail refinement is also a good
validation method. This consists on fitting the experimentally obtained X-ray diffraction
pattern by a calculated pattern. In this calculated pattern, the lattice parameters along
with the peaks' width parameters are fitted through a standard least-squares method.
However, the intensity of each diffraction peaks is adjusted independently; without
accounting for the scattering atoms' properties. This is appropriate as the atom's
position inside the lattice is not yet determined. A small difference between the
experimental and calculated diffraction pattern shows the validity of the Le Bail fit and
is a good indicator that the chosen space group and lattice parameters are correct.
Supposing a good enough powder quality (see Table 1), the determination of the
position of the atoms in the crystal's lattice can then be attempted. For this, knowledge
of the crystal's chemical composition (the atomic species and at the minimum an
estimation of its stoichiometry) is essential. Along with the experimental diffractogram,
that information can be inputted in specialized structure solving software such as the
FOX or EXPO [107,108]. These provide various methods, such as Monte Carlo, simulated
annealing, the Patterson method (direct method) that dispense a first guess on the
atomic positions. This first iteration can then be refined and validated through a
Rietveld refinement, implemented in software such as FULLPROF [109]. The Rietveld
refinement is analogous to the Le Bail refinement but takes into account a physical
model to fit the peaks' intensity, namely the equation provided earlier for Ihkl. As
previously described, on top of taking into account experimental parameters, such as
the beam polarization, it calculates the effect of a diffraction line's multiplicity, volume
of the unit cell and, more importantly, the structure factor which includes an atom's
position, site occupancy, thermal parameters, as well as their electronic density. The
goal of the Rietveld method is to minimize the function:
with yi(obs) and yi(calc) being the intensities of the experimental and calculated
diffraction patterns, respectively, of the ith point with a weighting factor of wi. The
quality of the fit is typically asserted by eye, especially through the plotting of the
difference between the experimental and calculated curves, although the weighted-
profile factor Rwp also supplies information on the fit's condition. This parameter is
calculated through the following formula:

61
In most cases, a Rwp value below 10% is deemed reasonable. More detailed information
on both Le Bail and Rietveld refinements can be found in the literature [110,111].
When the diffracted compound's structure is known and only the lattice
parameters are sought for, most of the above-mentioned steps can be skipped. After the
azimuthal integration of the diffraction pattern, a simple fitting of the diffraction lines
belonging to the known phase as well as assigning to them their (known) hkl indices
yields the lattice parameters. The XRDA software can be used to perform the lattice
parameters determination semi-automatically [112]. As it will be describe shortly after,
obtaining a unit cell's lattice parameter evolution with pressure is critical to determine
the compound's equation of state.
II. A. 3. Acquiring and analyzing single crystal X-ray diffraction data
Single crystal X-ray diffraction is generally regarded as much more powerful
than powder X-ray diffraction. Indeed, while both intrinsically containing the same
information, it is distributed in a three dimensional space in the case of single crystal X-
ray diffraction whereas it is condensed in a single dimension for powder X-ray
diffraction. For this reason, the former does not suffer from peak overlapping, has a
higher intensity per diffraction spot and easily allows the determination of the
reflection conditions (through Laue's equations), vital for the space group identification.
Thus, the complete structural resolution of a complex compound (large unit cell with a
high number of atoms) is more accessible from single crystal X-ray diffraction. However,
this technique has limited applicability as the growth of the necessary high quality
single crystal is not always feasible. In the best case scenario, the solid high pressure
phase is bordered by the liquid state. Then, the pressure needs to be slowly increase
until a single or several single crystal seeds nucleate. Another approach is to cross the
liquid-solid transition line and afterwards slowly cross it back during decompression,
reducing the pressure until all but one or a few single crystals are left. However, if the
looked-for high pressure phase does not border the melt, it can be attempted to grow a
single crystal in the low pressure phase bordering the melt and then increase pressure
at a very low rate through the phase transition. This latter method can only potentially
preserve the quality of the single crystal if the solid-solid phase transition is of second
order phase transition or if it is a displacive (martensitic) phase transition. On top of
that, high pressures tend to deteriorate the quality of single crystals due to non-
hydrostatic pressure conditions. Moreover, limited reciprocal space coverage on
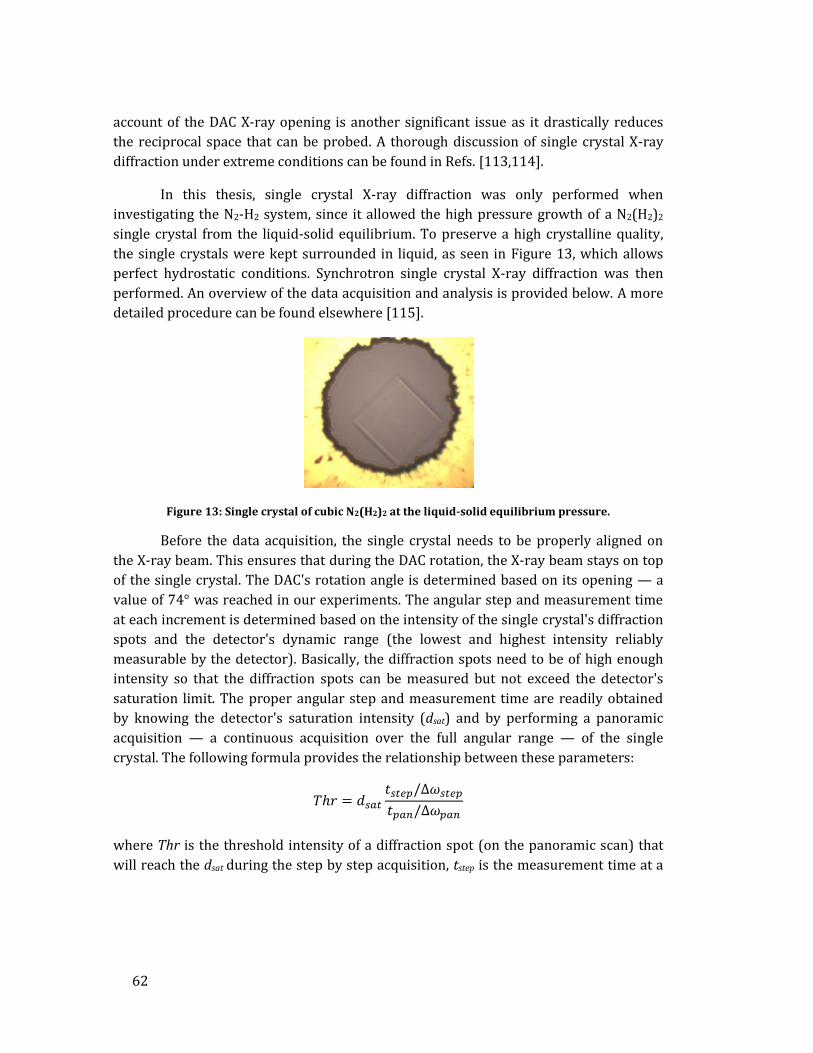
62
account of the DAC X-ray opening is another significant issue as it drastically reduces
the reciprocal space that can be probed. A thorough discussion of single crystal X-ray
diffraction under extreme conditions can be found in Refs. [113,114].
In this thesis, single crystal X-ray diffraction was only performed when
investigating the N2-H2 system, since it allowed the high pressure growth of a N2(H2)2
single crystal from the liquid-solid equilibrium. To preserve a high crystalline quality,
the single crystals were kept surrounded in liquid, as seen in Figure 13, which allows
perfect hydrostatic conditions. Synchrotron single crystal X-ray diffraction was then
performed. An overview of the data acquisition and analysis is provided below. A more
detailed procedure can be found elsewhere [115].
Figure 13: Single crystal of cubic N2(H2)2 at the liquid-solid equilibrium pressure.
Before the data acquisition, the single crystal needs to be properly aligned on
the X-ray beam. This ensures that during the DAC rotation, the X-ray beam stays on top
of the single crystal. The DAC's rotation angle is determined based on its opening — a
value of 74° was reached in our experiments. The angular step and measurement time
at each increment is determined based on the intensity of the single crystal's diffraction
spots and the detector's dynamic range (the lowest and highest intensity reliably
measurable by the detector). Basically, the diffraction spots need to be of high enough
intensity so that the diffraction spots can be measured but not exceed the detector's
saturation limit. The proper angular step and measurement time are readily obtained
by knowing the detector's saturation intensity (dsat) and by performing a panoramic
acquisition — a continuous acquisition over the full angular range — of the single
crystal. The following formula provides the relationship between these parameters:
where Thr is the threshold intensity of a diffraction spot (on the panoramic scan) that
will reach the dsat during the step by step acquisition, tstep is the measurement time at a

63
given angular step Δωstep, and tpan is the measurement time for the panoramic
acquisition over the full angular range Δωpan. A typical Δωstep is between 0.25 and 1°.
Once the data is collected, a specialized software such as CrysalisPro [116] can
be used to process the data up to the structure refinement. First, a peak hunting routine
finds all of the recorded diffraction intensities; both diffraction spots and rings. The
parasitic diffraction spots and rings such as those belonging to the diamonds and the
gasket need to be removed. This can be achieved by pinpointing them in the reciprocal
space viewer. Once only the diffraction spots of the sample remain, the software
(automatic) indexing routine to determine the unit cell can be launched. When
confident with the proposed unit cell, the data reduction and finalization (extraction of
the reflection intensities) can be done and will also suggest a space group. The
procedures doing this work take into account the background noise, absorption
corrections as well as the instrument model, previously determined using a known
sample. The final output includes a list of all the diffraction spots' intensities along with
their assigned hkl value, the unit cell parameters and space group as well as the
resolution statistics. Importantly, a Rint value, analogous to Rwp for powder X-ray
diffraction, is provided and represents the data quality. Typically, a Rint value lower than
15% is needed to afterwards achieve a reliable structural determination.
Similarly to the powder X-ray diffraction procedure, the structural
determination is performed by specialized software, such as Jana2006 [117], which
employs a variety of methods (including charge flipping algorithm [118] and direct
methods, such as the Patterson method [119]) that utilize the values outputted during
the data finalization. Once a first model is obtained, the adjustable parameters can be
refined using a least-square minimization routine.
II. A. 4. Isothermal equation of states
The determination of a compound's lattice parameters evolution, and therefore
of its volume, with respect to pressure allows to resolve its equation of state. Two
isothermal equations of state are commonly used: the Birch-Murnaghan [120]
and the Vinet [121]
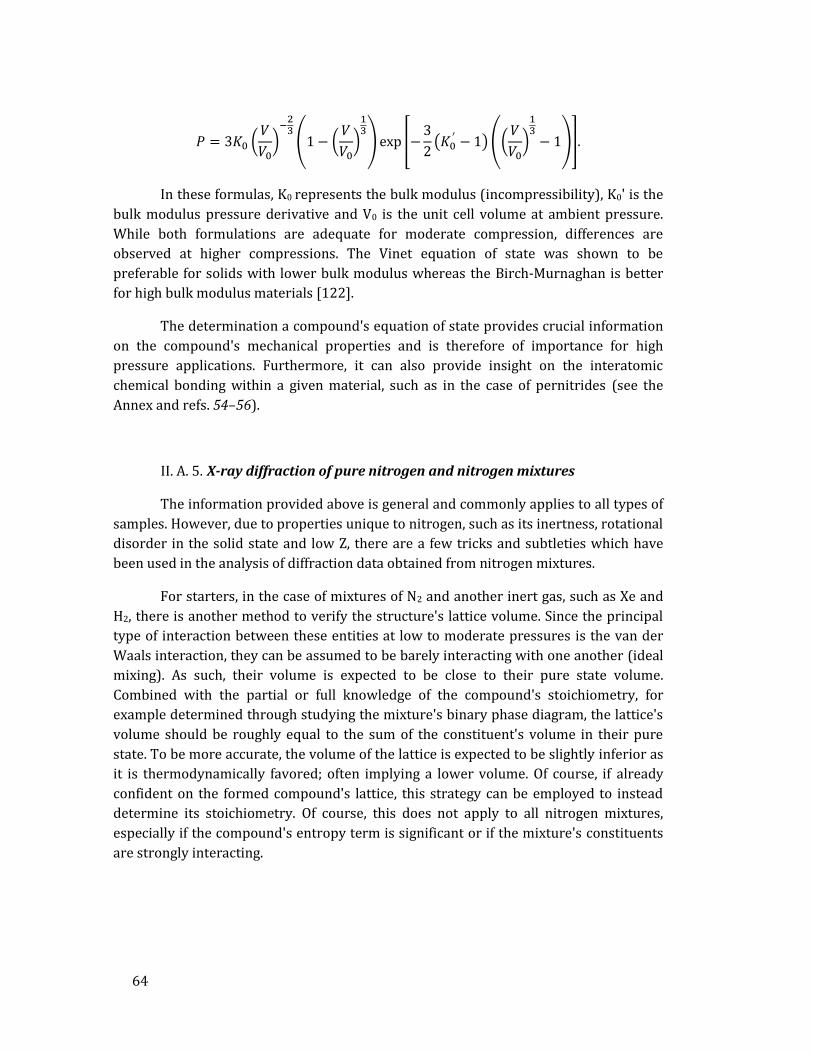
64
In these formulas, K0 represents the bulk modulus (incompressibility), K0' is the
bulk modulus pressure derivative and V0 is the unit cell volume at ambient pressure.
While both formulations are adequate for moderate compression, differences are
observed at higher compressions. The Vinet equation of state was shown to be
preferable for solids with lower bulk modulus whereas the Birch-Murnaghan is better
for high bulk modulus materials [122].
The determination a compound's equation of state provides crucial information
on the compound's mechanical properties and is therefore of importance for high
pressure applications. Furthermore, it can also provide insight on the interatomic
chemical bonding within a given material, such as in the case of pernitrides (see the
Annex and refs. 54–56).
II. A. 5. X-ray diffraction of pure nitrogen and nitrogen mixtures
The information provided above is general and commonly applies to all types of
samples. However, due to properties unique to nitrogen, such as its inertness, rotational
disorder in the solid state and low Z, there are a few tricks and subtleties which have
been used in the analysis of diffraction data obtained from nitrogen mixtures.
For starters, in the case of mixtures of N2 and another inert gas, such as Xe and
H2, there is another method to verify the structure's lattice volume. Since the principal
type of interaction between these entities at low to moderate pressures is the van der
Waals interaction, they can be assumed to be barely interacting with one another (ideal
mixing). As such, their volume is expected to be close to their pure state volume.
Combined with the partial or full knowledge of the compound's stoichiometry, for
example determined through studying the mixture's binary phase diagram, the lattice's
volume should be roughly equal to the sum of the constituent's volume in their pure
state. To be more accurate, the volume of the lattice is expected to be slightly inferior as
it is thermodynamically favored; often implying a lower volume. Of course, if already
confident on the formed compound's lattice, this strategy can be employed to instead
determine its stoichiometry. Of course, this does not apply to all nitrogen mixtures,
especially if the compound's entropy term is significant or if the mixture's constituents
are strongly interacting.

65
There are also some particularities in performing a structural refinement on
compounds made up of N2 molecules. As discussed in depth in the next section, nitrogen
molecules are commonly observed to be rotationally disordered up to 16 GPa [125–
127]. This leads to two important issues that hinder the structure determination. First,
the molecule's motion results in an effective spread of the electronic density, producing
low intensity diffraction peaks that can be tough to detect. The second difficulty is
taking into account their preferred orientation during the refinement. To achieve this,
several methods were demonstrated. Employed to resolve the complex structure of δ'-
N2 [125], one technique consists in progressively adding molecules with different
orientations on a crystallographic site where a N2 center of mass is known to be sitting.
Of course, this needs to be offsetted by changing the molecule's partial occupancy. In
this fashion, molecules can be added until the refinement's quality is no longer
improved. One of the pitfalls of this procedure is the risk of overfitting your data; i.e.
having too many fitting parameters for your dataset. This issue can be alleviated by
fixing the N-N bond length if it known, thus removing one fitting parameter per N2
molecule. Nonetheless, in some cases that is not sufficient. For these cases, another
approach that was successfully tested for single crystal X-diffraction data can be
attempted. The N2 molecules were substituted by Si atoms, on the premise that both
have the same total number of electrons. Then, the orientational disorder of the
molecules was modeled by the introduction of anharmonic anisotropic displacement
parameters, typically used for representing the atoms thermal motion. This procedure
is perhaps not as accurate as the first method since the atomic form factor of molecular
nitrogen and silicon are different due to their difference in electron density geometry.
However, the decrease of the number of fitting parameters justifies this approach in
cases where the number of independent diffraction spots is limited.
Lastly, when performing Rietveld refinements of a structure composed of a
heavy element and nitrogen, the low Z value of nitrogen has to be kept in mind. Indeed,
since the structure factor is approximately correlated to the Z2 of an element, xenon (Z2
= 2916) or even iron (Z2 = 676) have a much larger contribution to a compound's
diffraction lines' intensity than a nitrogen atom (Z2 = 49). Thus, refining parameters
belonging to a single nitrogen atom can be inconclusive as their variation barely affects
the overall fit's quality. For this reason as well for the aforementioned, when possible,
considering the N2 molecule (Z2 = 196) as a whole instead of two individual atoms in the
refinement software is preferred as it reduces the Z2 gap. For example, this can be done
in FULLPROF as it allows whole molecules as an input. This issue is discussed further in
the case of Xe-N2 and Fe-N2 mixtures.
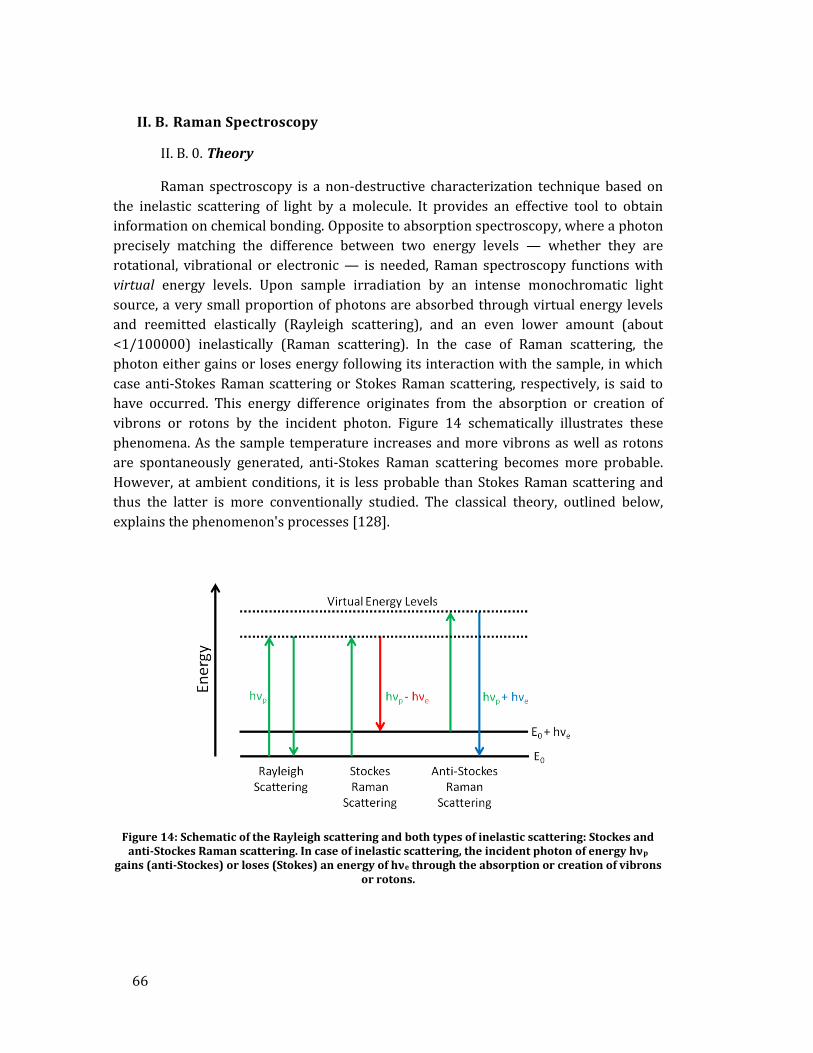
66
II. B. Raman Spectroscopy
II. B. 0. Theory
Raman spectroscopy is a non-destructive characterization technique based on
the inelastic scattering of light by a molecule. It provides an effective tool to obtain
information on chemical bonding. Opposite to absorption spectroscopy, where a photon
precisely matching the difference between two energy levels — whether they are
rotational, vibrational or electronic — is needed, Raman spectroscopy functions with
virtual energy levels. Upon sample irradiation by an intense monochromatic light
source, a very small proportion of photons are absorbed through virtual energy levels
and reemitted elastically (Rayleigh scattering), and an even lower amount (about
<1/100000) inelastically (Raman scattering). In the case of Raman scattering, the
photon either gains or loses energy following its interaction with the sample, in which
case anti-Stokes Raman scattering or Stokes Raman scattering, respectively, is said to
have occurred. This energy difference originates from the absorption or creation of
vibrons or rotons by the incident photon. Figure 14 schematically illustrates these
phenomena. As the sample temperature increases and more vibrons as well as rotons
are spontaneously generated, anti-Stokes Raman scattering becomes more probable.
However, at ambient conditions, it is less probable than Stokes Raman scattering and
thus the latter is more conventionally studied. The classical theory, outlined below,
explains the phenomenon's processes [128].
Figure 14: Schematic of the Rayleigh scattering and both types of inelastic scattering: Stockes and anti-Stockes Raman scattering. In case of inelastic scattering, the incident photon of energy hνp
gains (anti-Stockes) or loses (Stokes) an energy of hνe through the absorption or creation of vibrons or rotons.
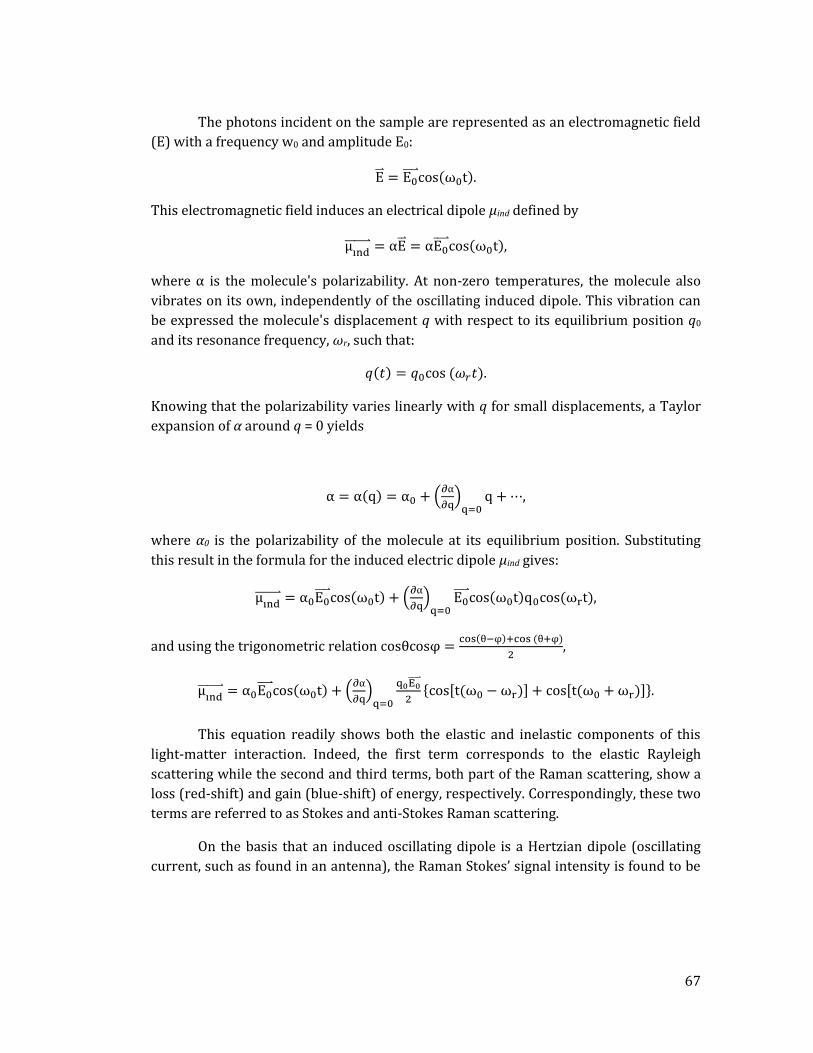
67
The photons incident on the sample are represented as an electromagnetic field
(E) with a frequency w0 and amplitude E0:
.
This electromagnetic field induces an electrical dipole μind defined by
μ ,
where is the molecule's polarizability. At non-zero temperatures, the molecule also
vibrates on its own, independently of the oscillating induced dipole. This vibration can
be expressed the molecule's displacement q with respect to its equilibrium position q0
and its resonance frequency, ωr, such that:
.
Knowing that the polarizability varies linearly with q for small displacements, a Taylor
expansion of α around q = 0 yields
,
where α0 is the polarizability of the molecule at its equilibrium position. Substituting
this result in the formula for the induced electric dipole μind gives:
μ
,
and using the trigonometric relation
,
μ
.
This equation readily shows both the elastic and inelastic components of this
light-matter interaction. Indeed, the first term corresponds to the elastic Rayleigh
scattering while the second and third terms, both part of the Raman scattering, show a
loss (red-shift) and gain (blue-shift) of energy, respectively. Correspondingly, these two
terms are referred to as Stokes and anti-Stokes Raman scattering.
On the basis that an induced oscillating dipole is a Hertzian dipole (oscillating
current, such as found in an antenna), the Raman Stokes’ signal intensity is found to be

68
proportional to the incident photon’s wavelength, the intensity of the incident beam as
well as the variation of the polarizability with q, such as:
Thus, increasing a sample’s Stokes Raman signal can only be achieved by either
increasing the power of the incident laser or the light’s frequency [129]. However,
pressure-induced modifications (such as atomic displacements, electronic density
redistribution) can impact the
term and cause spontaneous intensity changes.
Moreover, pressure gradients within the experimental cavity, due to non-hydrostatic
conditions, commonly lead to a peak broadening.
The frequency ωr at which a molecule is vibrating can easily be described by the
formula
, where K is known as the spring constant and δ is the effective mass
of the system. While δ is constant with pressure, K tends to increase. Indeed, the spring
constant in a molecule, for example N2, corresponds to the strength of the bond between
the nitrogen atoms. As pressure increases, the bond tightens up, similarly to a squeezed
spring and the Raman frequencies ωr goes up. As such, a drop in this value typically
indicates a weakening bond.
Raman spectroscopy has the ability to provide a great wealth of information. For
example, the Raman spectra of phonons is a finger-print of a material’s composition and
state. Through the vibrational selection rules, obtained by group theory analysis,
information about the crystal structure is provided. With pressure the Raman signature
of a material changes and allows to study phase transformation, chemical bonding,
chemical reactivity. For nitrogen, it is important to remember the Raman frequencies of
the three main bonding order: a single bond has a vibrational mode around 800 cm-1,
while it is of about 1400 and 2400 cm-1 for double and triple bonds, respectively. These
can easily be distinguished from one another.
II. B. 1. Considerations and limitations for high pressure Raman spectroscopy
Performing Raman spectroscopy measurements of a sample confined within a
diamond anvil cells adds extra constraints as well as difficulties. These are briefly
discussed here.

69
Geometrical constraints: The membrane DAC commonly used in the laboratory has a
total body height of 32 mm, allowing for a minimal work distance of 13 mm and 17 mm,
when measuring through the cylinder or piston anvil, respectively. The numerical
aperture (NA) of the DAC, especially when using Drukker-type diamond anvils, is
limited due to the large supporting anvil seats. This issue is lessened by using Almax-
Boehler type anvils that allow for a greater DAC opening (up to 70°). Theses constraints
restrict the objectives that may be used, as greater magnifications and NAs typically
need shorter sample-objective lengths. In turn, this puts a limit on size of the focalized
laser beam and on the total amount of light collected by the objective.
Diamond anvil window: In order to reach the sample, the laser beam needs to go
through about 1.72 mm of diamond (for the Almax-Boehler type used during this
thesis). This causes significant geometric and, at high pressures, chromatic aberrations,
which affect the overall signal quality and collection efficiency as well as the depth
selectivity. Furthermore, diamond windows produce parasitic back reflections which
increase the background level thus decreasing the signal-to-noise ratio [130]. Also, color
centers in diamond anvils absorb and produce fluorescence proportionally with
pressure [131]. This fluorescence tends to decrease along with the excitation laser
wavelength. However, knowing that the Raman intensity is proportional to the light
frequency at the power of four ( ), there is a trade off between the two. Thus, low
laser excitation wavelengths (∽488 nm) are usually best at low pressures (< 75 GPa)
whereas high wavelengths (∽647 nm) are typically better at higher pressures. Of
course, choosing the proper wavelength also needs to account for the probed sample
properties, (sensitivity to light, fluorescence, thermal emission, etc), which are prone to
be modified with pressure.
Sample heterogeneity: The sample sizes are of a few tens of micrometers or even less
at higher pressures. Often, tiny heterogeneities (few cubic micrometers), arise from a
pressure-induced chemical reaction or laser-heating. To correctly characterize and
understand the physico-chemical phenomena at play, a high spatial resolution (on the
order of the micrometer or below) is critical.
II. B. 2. Experimental setup
Confocal Raman spectroscopy measurements were performed using a
Alpha300M+ (WITec) system. Figure 15 shows a picture of the confocal Raman
microscope with the different parts annotated. A continuous Ar-Kr laser emits the three
employed wavelengths: 488 nm, 514 nm and 647 nm. Each is coupled into the
microscope with a polarized single-mode optical fiber. This polarized fiber allows only

70
for the lasers' emission transverse mode (with the electromagnetic oscillations
occurring perpendicular to the direction traveled by the light) to carry through, which
makes for a very low degradation and dispersion of the laser light. Inside the
microscope, the laser is first collimated into a parallel beam and then passed through a
laser line filter, removing both the parasitic laser frequencies as well as the
luminescence produced by the light’s passage into the single-mode fiber. Afterwards,
the laser is sent towards the microscope objective by a beamsplitter. While many
objectives are mounted on the switching revolver, solely the Olympus x50 objective (NA
= 0.35, working distance of 18 mm) was employed during this thesis. This objective
allows for a focalized spot size of about 0.6 μm on the sample. The scattered light is then
collected with the same objective, passed straight through the beamsplitter and
cleaned-up with a long pass Raman filter. Then, being a confocal setup, the light is
focused onto a multimode fiber. The core of the fiber serves as the confocal pinhole. The
advantage of the confocal setup is that it does not allow light from below or above the
focal point to reach the fiber. In turn, this permits a much greater depth resolution and
prevents stray light from polluting the signal. On the other end of the multimode
collection fiber, the light is dispersed on a diffraction grating and collected by a charge-
coupled detector (CCD). Gratings of 600 and 1800 l/mm were employed along with a
2000 by 256 pixel (15x15 μm2 pixel size) detector which allows a spectral resolution of
approximately 7 and 2 cm-1 (with the diffraction grating centered at 546 nm),
respectively. Finally, the sample is placed on a three-axis piezoelectrical scan stage
which permits automated, submicron accuracy displacements.
71
Figure 15: Annotated photo of the WITec confocal Raman setup. In green is drawn the beam path for the 514 nm wavelength.
This whole setup is particularly convenient for high pressure Raman
spectroscopy experiments for three main reasons. 1) The very high depth (5 μm) and
in-plane (0.6 μm) resolutions. The depth resolution greatly improves the signal quality
by reducing the diamond fluorescence while the in-plane resolution allows to resolve
the tiniest features. 2) Switching from one of the three wavelengths to another is a
matter of a few tens of seconds with little to no alignment optimization. Indeed, the
same optical pathway is employed for the three wavelengths, with their corresponding
filters all on a rotating mount. For the reasons described earlier, this is tremendously
useful for high pressure Raman studies. 3) The piezo-driven motorized stage. These
allow for comfortable, easy and quick sample positioning and characterization.
Furthermore, they permit precise, long acquisition times and fully automated sample
Raman mappings. As detailed in the case of the investigation of N2-H2 mixtures, these
mappings can be critical to correctly understand the sample behavior (see Figure 16). It
is important to note that the in-plane and depth resolutions are not limited by the
motors but instead by the size of the laser spot and the optical setup, respectively.

72
Figure 16: (a) Microphotograph of a 1 : 2 N2–H2 mixture at 1.2 GPa, the pressure at which hydrazine is in liquid–solid equilibrium, decompressed from 61.1 GPa. (b) A Raman mapping of the sample. The single crystals with well-defined edges in (b) are hydrazine (red) while bubbles were
determined to be a nitrogen– hydrogen liquid mixture (green). Both are in liquid hydrazine (blue).
73
NITROGEN UNDER EXTREME
CONDITIONS: PHASE DIAGRAM
I. THE NITROGEN MOLECULE
Nitrogen is the fifth most common element in the Universe and makes up for
about 78% of Earth’s atmosphere, mostly present in its molecular form N2. This
homonuclear diatomic molecule is strongly bound by a covalent triple bond – the
strongest of all known covalent bonds (942 kJ/mol). Attesting to its bond strength, N≡N
has an intramolecular distance of 1.098 Å, smaller than its similar-sized periodic table
neighbors, namely O=O (1.21 Å), C=C (1.24 Å) as well as isoelectronic C≡O (1.13 Å). As
all homoatomic dimers, the N2 molecule belongs to the symmetry point group D∞h. As
such, it possesses a single intrinsic vibrational mode, an Ag symmetrical stretching
observed at a frequency of 2744 cm-1 in the gas state. This mode is solely observable by
Raman spectroscopy as it only induces a change in the molecule’s polarizability; not of
its dipole moment.
While the N2 molecule does not have a dipole, its next order-term of the
multipole expansion, corresponding to a quadrupole, is non-zero. The following general
formula describes the electric potential generated by an electric quadrupole:
where V is the electric potential, R is a vector with its origin in the system of charges, n
is a unit vector in that same direction as R, Q is the quadrupole moment tensor and ϵ0 is
the electric permittivity. At ambient conditions, molecular nitrogen was measured to

74
have a quadrupole moment of -4.90 ± 0.3 x 10-40 Cm2 [132], which is average compared
to other simple molecules [133]. However, unlike most molecules, N2 does not have a
stronger type of interaction coming into play, such as a dipole moment (CO, NO), a
magnetic moment (O2), hydrogen bonds (H20, NH3), etc. Hence, the quadrupole-
quadrupole (QQ) interactions are dominant in solid N2. As deduced from the above
formula, the electric potential increases significantly as R gets shorter. The QQ
interaction between N2 molecules thus increases along with pressure. As it will be
shown in the following sections, these interactions greatly complexify the ambient
temperature solid state structural configuration of the low pressure phases of pure
nitrogen, as well as of some nitrogen-rich compounds. Indeed, as the QQ interaction get
stronger and stronger, it progressively constrains the rotationally-disordered N2
molecules and aligns them [134]. Mainly due to this type of interaction, nitrogen adopts
six different structures below 20 GPa. At higher pressures, eight other solid phases are
known, totaling fourteen, as shown in its phase diagram shown below (Figure 1).
II. SOLID PHASES OF PURE NITROGEN
Interestingly, the experimentally observed solid phases of pure molecular
nitrogen are troublesome to reproduce with theoretical calculations [13]. At lower
pressures, it is mainly due to the difficulty in implementing the QQ interaction [134]. At
higher pressures (> 50 GPa), calculations predict the polymeric phase (cg-N) to be
stable instead of the molecular phases. Recent work propose the entropy term to be
responsible for this discrepancy [135]. Indeed, while the cg-N phase is calculated more
stable, a large kinetic barrier – resulting from the strong N2 triple-bond – impedes the
molecular to polymeric transition. To overcome this energy barrier, laser-heating is
performed. However, it is suggested that at high temperatures the entropy term of the
molecular phases becomes sufficiently large that the polymeric solids are no longer
energetically-favored over the former. At 110 GPa and 2000 K, the entropy-temperature
term is finally not large enough and the transition to cg-N is observed. As it will be
discussed later in this thesis, theoretical calculations seem to be highly predictive for
the polymeric phases, perhaps due to their simple physics allowing an accurate
modeling, in opposition to the molecular phases.
Based on these considerations, the next sections will be structured in the
following fashion: 1) the low pressure molecular phases stabilized by QQ interaction
will be presented, 2) the higher pressure molecular phases, deemed favored due to
kinetic barriers and the entropy term, will be introduced and, 3) the polymeric phases,
predicted by the calculations, will then be examined.

75
Figure 1: Phase diagram of pure nitrogen with a) logarithmic scales, allowing a clear view of the low pressure-low temperature region and b) linear scales, where the high pressure-high
temperature parts can be observed. Data obtained from refs. 2–5. The phase intersected by the dashed blue lines will be discussed.
II. A. Low pressure phases of pure molecular nitrogen
II. A. 0. The β-N2 phase
At ambient temperature, molecular nitrogen solidifies at 2.49 GPa into a
hexagonal (P63/mmc) structure, named β-N2, with lattice parameters of a = 3.595 Å and
c = 5.845 Å [139,140]. In this phase, the position of individual nitrogen atoms is not
clearly defined, but merely the center of mass position of each N2 dimer is, found at the
2d Wyckoff position (see Figure 2). This is attributed to a static disorder as the
molecules are thought to be spherically disordered [139,141]. In the pressure domain of
β-N2, the molecules are still far apart and barely feel the presence of one another, which
explain their complete rotational disorder. From Raman spectroscopy studies, a single
vibrational mode was revealed, as seen in Figure 3 [141]. This is consistent with the
nitrogen molecule's center of mass sitting on a single Wyckoff position and not be close
enough to its neighbor so as to be perturbed.
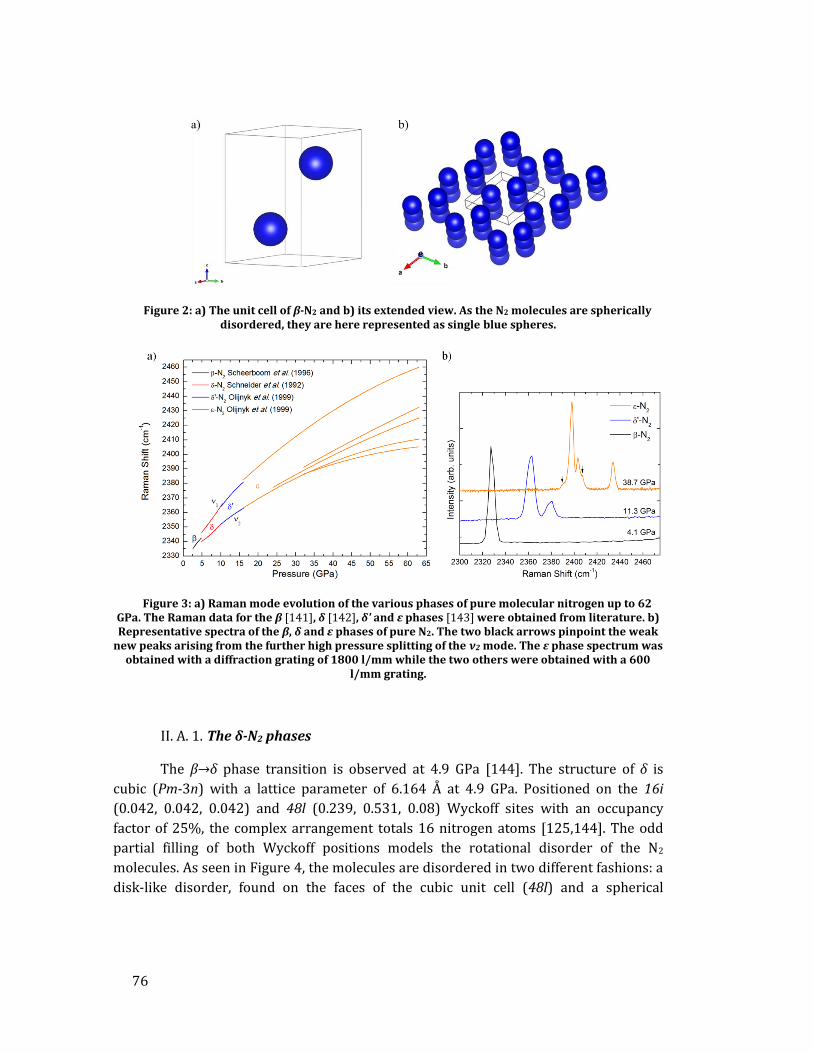
76
Figure 2: a) The unit cell of β-N2 and b) its extended view. As the N2 molecules are spherically disordered, they are here represented as single blue spheres.
Figure 3: a) Raman mode evolution of the various phases of pure molecular nitrogen up to 62 GPa. The Raman data for the β [141], δ [142], δ' and ε phases [143] were obtained from literature. b) Representative spectra of the β, δ and ε phases of pure N2. The two black arrows pinpoint the weak
new peaks arising from the further high pressure splitting of the ν2 mode. The ε phase spectrum was obtained with a diffraction grating of 1800 l/mm while the two others were obtained with a 600
l/mm grating.
II. A. 1. The δ-N2 phases
The β→δ phase transition is observed at 4.9 GPa [144]. The structure of δ is
cubic (Pm-3n) with a lattice parameter of 6.164 Å at 4.9 GPa. Positioned on the 16i
(0.042, 0.042, 0.042) and 48l (0.239, 0.531, 0.08) Wyckoff sites with an occupancy
factor of 25%, the complex arrangement totals 16 nitrogen atoms [125,144]. The odd
partial filling of both Wyckoff positions models the rotational disorder of the N2
molecules. As seen in Figure 4, the molecules are disordered in two different fashions: a
disk-like disorder, found on the faces of the cubic unit cell (48l) and a spherical

77
disorder, adopting a bcc arrangement (16i). Here, it is thought that the QQ interaction
have started to be felt by the N2 molecules as a portion of the molecules went from
completely spherically-disordered to disk-like disordered. Raman spectroscopy
measurements revealed two vibrational modes, as shown in Figure 3, that are
consistent with the X-ray data. The lowest frequency mode (ν2) belongs to the disk-like
disordered molecules while the highest frequency one (ν1) is attributed to the
spherically-disordered molecules [141,142,145].
Figure 4: Structure of δ-N2. The nitrogen atoms are sitting on the 16i and 48l Wyckoff positions, are each with a partial occupancy of 0.25, and model the spherical and disk-like rotational disorder,
respectively.
II. A. 2. The δ'-N2 phase
The δ-N2 phase was first thought to be stable up until it transformed into the ε-
N2 around 16 GPa [83,140]. Indeed, the quality of the best accessible X-ray diffraction
patterns did not permit at the time to see new diffraction peaks appearing at 10.5 GPa,
although a small, unexplained change in compressibility had been noticed. First
suggested by Raman spectroscopy data due the changing gradient of the spherically-
disordered N2 molecule vibron frequency with temperature and then later confirmed by
X-ray diffraction experiments, a phase transition from the δ to the δ' phase does occur at
10.5 GPa [125,141,145–148]. An extensive X-ray diffraction single crystal study
unambiguously resolved its very complex structure, revealing a tetragonal lattice
(P42/ncm) with a = 8.063 Å and c = 5.685 Å (at 14.5 GPa), containing 16 N atoms on 12
partially occupied Wyckoff positions [125]. The structural arrangement can be
understood as being composed of three types of rotationally disordered nitrogen

78
molecules. Forming a fcc sublattice, the first ensemble of molecules are pseudo-
spherically disordered, having a preferred rotation plane along the < > directions
and avoiding the < > directions. The two other types of rotationally-disordered
molecules are pseudo disk-like, as they also have preferred and unfavored rotation axes.
In total, twelve distinct Wyckoff positions, with occupancies varying from 8% to 33%,
were needed to account for this very complex arrangement of nitrogen molecules. The
structure is shown in Figure 5. Again, compared to the previous phase, the molecules
are more orientated which is attributed to the increase of the QQ interaction.
Figure 5: Structure of δ’-N2 obtained from ref. [125]. The shaded portions mark the molecules’ preferred orientations.
Regarding the Raman modes of δ'-N2, still only two vibrational modes, the
previously-observed ν1 and ν2 stretching modes, are detected and are shown in Figure 3.
This comes as a surprise because of the obvious drop in symmetry — compared to the
cubic δ-N2 phase — and since twelve occupied Wyckoff positions allow a greater
number of vibrational modes [147]. Indeed, the Raman (and infrared) spectroscopy
studies instead predicted a lower-symmetry cubic lattice for δ'-N2, namely the Fm3,
F432 and Fm3n space groups, based on the number of recorded vibrational modes. In
hindsight, the additional vibrational modes allowed by the P42/ncm space group are
simply too weak to be measured, even at low temperatures [147]. In any case, these
studies also independently came to the conclusion that the δ→δ' is caused by a partial
ordering of the rotating molecules.

79
II. A. 3. The ε-N2 phase
At a pressure of about 16 GPa, yet another phase transition occurs. The
molecules in the δ'-N2 structure are thought to finally become fully oriented, distorting
the δ'-N2 lattice through a small displacement as well as a slight extension along the
cube diagonal, resulting in the ε-N2 phase. This new phase adopts a hexagonal lattice
(R c) with parameters of a = 7.6050 Å and c = 10.6217 Å at 16.3 GPa [83]. The 48
nitrogen atoms are concluded to occupy the 12c (z = 0.0495) and 36f (x = 0.2731, y =
0.2127 and z = 0.2828) Wyckoff sites [140]. A drawing of this structure is found in
Figure 6. The molecules' arrangement is again attributed to the QQ interaction. Indeed,
the molecules adopt a pinwheel configuration, known to minimize the QQ interaction
[149]. This interpretation is further supported by theoretical calculations as only by
including the QQ interaction, along with a hexadecapole-hexadecapole interaction term,
could this structure be found as stable [134]. This slightly differs from the previous low
pressure molecular phases where solely the inclusion of the QQ interaction term was
sufficient to theoretically obtain the experimentally-observed structures.
Figure 6: a) Drawing of the structure of the ε-N2 phase. b) Drawing of the structure of the ε-N2
phase seen along its c-axis, from which the pinwheel arrangement of the N2 molecules, know to minimize the QQ interaction, is visible.
Raman characterization of the ε-N2 phase shows at first only the ν1 and ν2 modes.
However, a small asymmetry of the ν2 peak progressively becomes a weak shoulder on
the high frequency side of the ν2 mode at 21 GPa. From 30 GPa, the two bands are fully
resolved [148]. This doublet is the signature of the A1g and E1g components of the ν2
peak. Based on group theory calculations, the ε-N2 structure is precisely expected to
have these three measured modes (ν1 + 2ν2) [148]. Thus, when a third and then a fourth
ν2-like modes were measured at higher pressures (see Figure 3), concerns were raised
about the structure assigned to the ε-N2 phase [142,143]. As it stands, it is hypothesized
that the previously disk-like molecules are generating the ν2 peaks and might actually be
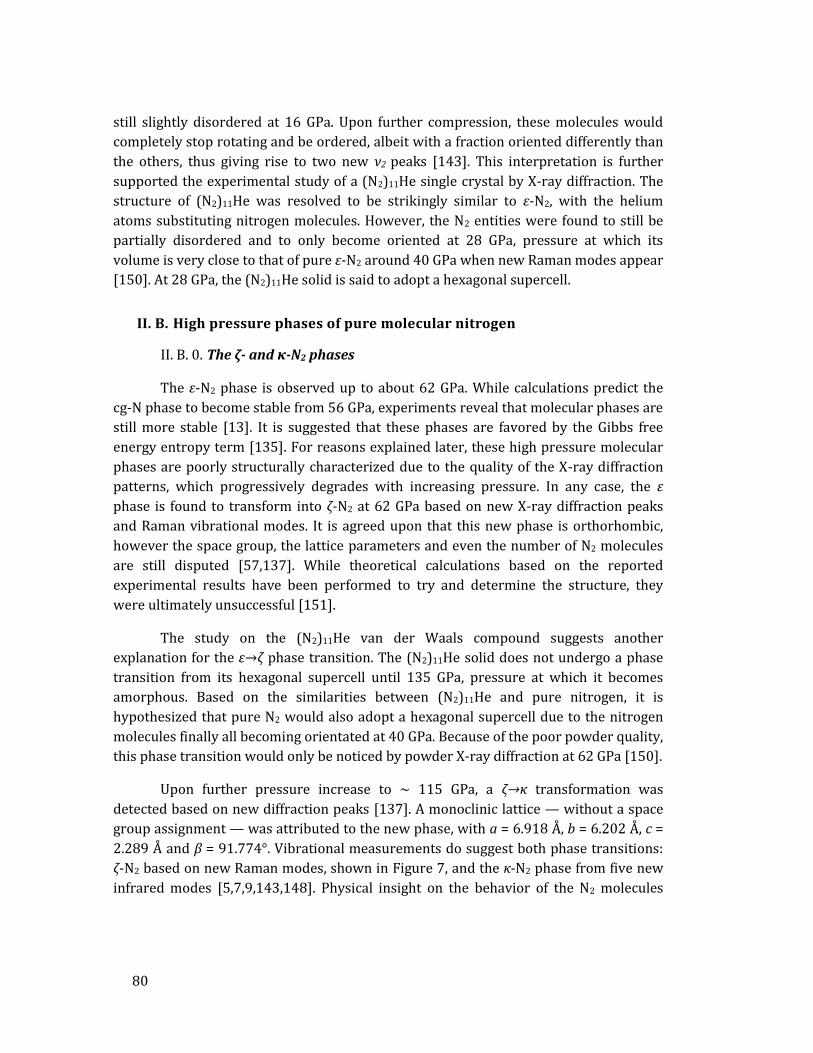
80
still slightly disordered at 16 GPa. Upon further compression, these molecules would
completely stop rotating and be ordered, albeit with a fraction oriented differently than
the others, thus giving rise to two new ν2 peaks [143]. This interpretation is further
supported the experimental study of a (N2)11He single crystal by X-ray diffraction. The
structure of (N2)11He was resolved to be strikingly similar to ε-N2, with the helium
atoms substituting nitrogen molecules. However, the N2 entities were found to still be
partially disordered and to only become oriented at 28 GPa, pressure at which its
volume is very close to that of pure ε-N2 around 40 GPa when new Raman modes appear
[150]. At 28 GPa, the (N2)11He solid is said to adopt a hexagonal supercell.
II. B. High pressure phases of pure molecular nitrogen
II. B. 0. The ζ- and κ-N2 phases
The ε-N2 phase is observed up to about 62 GPa. While calculations predict the
cg-N phase to become stable from 56 GPa, experiments reveal that molecular phases are
still more stable [13]. It is suggested that these phases are favored by the Gibbs free
energy entropy term [135]. For reasons explained later, these high pressure molecular
phases are poorly structurally characterized due to the quality of the X-ray diffraction
patterns, which progressively degrades with increasing pressure. In any case, the ε
phase is found to transform into ζ-N2 at 62 GPa based on new X-ray diffraction peaks
and Raman vibrational modes. It is agreed upon that this new phase is orthorhombic,
however the space group, the lattice parameters and even the number of N2 molecules
are still disputed [57,137]. While theoretical calculations based on the reported
experimental results have been performed to try and determine the structure, they
were ultimately unsuccessful [151].
The study on the (N2)11He van der Waals compound suggests another
explanation for the ε→ζ phase transition. The (N2)11He solid does not undergo a phase
transition from its hexagonal supercell until 135 GPa, pressure at which it becomes
amorphous. Based on the similarities between (N2)11He and pure nitrogen, it is
hypothesized that pure N2 would also adopt a hexagonal supercell due to the nitrogen
molecules finally all becoming orientated at 40 GPa. Because of the poor powder quality,
this phase transition would only be noticed by powder X-ray diffraction at 62 GPa [150].
Upon further pressure increase to ~ 115 GPa, a ζ→κ transformation was
detected based on new diffraction peaks [137]. A monoclinic lattice — without a space
group assignment — was attributed to the new phase, with a = 6.918 Å, b = 6.202 Å, c =
2.289 Å and β = 91.774°. Vibrational measurements do suggest both phase transitions:
ζ-N2 based on new Raman modes, shown in Figure 7, and the κ-N2 phase from five new
infrared modes [5,7,9,143,148]. Physical insight on the behavior of the N2 molecules

81
under these extreme pressure conditions is this time obtained from the Raman
measurements. As it can be seen in Figure 7, the three lowest frequency vibrons are no
longer blue shifted with pressure, as typically observed, but instead red shifted. This
inversion of pressure shift indicates a weakening of the N2 intramolecular bond
explained by a pressure-induced redistribution of electronic density, transferring part
of the triple-bond electron cloud towards intermolecular N2-N2 gaps. In effect, this
permits an elongation of the N2 intramolecular bond as well as a decrease of N2-N2
distances, both favorable for the later transformation into polymeric nitrogen, in which
intra and intermolecular distances are equal [57].
Figure 7: a) High pressure evolution of pure molecular nitrogen Raman modes. Data reproduced from ref. 14 and 18. b) Representative Raman spectra of the ε, ζ and κ phases. The black arrow
pinpoints the new peak of the ζ phase appearing near 85 GPa. The spectra of the κ phase is of better quality than the published experimental data, hence displaying more peaks.
II. B. 1. Amorphous molecular nitrogen
In the κ phase, molecular nitrogen was shown to undergo a pressure-induced
amorphisation towards a non-molecular phase [6,8,9,137]. The compressed nitrogen
samples were shown to progressively become opaque, have a widening followed by a
disappearance of both X-ray diffraction peaks and Raman modes. This amorphisation is
interpreted as a gradual transition into a non-molecular form of nitrogen: without
enough energy to cross the large activation barrier, only local transformations would
occur and the lack of sufficient atomic diffusion would prohibit a complete conversion
[8]. This hypothesis is supported by a new, very broad, vibrational mode centered about

82
640 cm-1 and thus somewhat close in frequency to the expected single-bonded N-N
mode [6,152,153]. Furthermore, electrical and optical measurements determined this
amorphous phase to be semiconducting, in stark contrast with the insulating diatomic
molecular nitrogen [8].
II. B. 2. The ι- and θ-N2 phases
The ι- and θ- N2 phases are responsible for the poor X-ray diffraction data
quality of the ζ and κ phases. Indeed, the ι and θ phases are obtained in a similar
pressure range as ζ and κ phases but at higher temperature. As they are metastable
down to ambient temperature, they thus prohibit the annealing, or recrystallization
from the liquid, of the ζ and κ phases. Mostly recognized by their vibrational signature,
the high pressure-high temperature molecular N2 phases are ill-characterized by X-ray
diffraction [7,154,155]. The ι-N2 phase was observed to be produced between 48-70
GPa above 750 K, and no structural arrangement, lattice parameters or otherwise, are
proposed [7,155]. Detected after heating pure N2 above 600 K at 95 GPa, the θ phase is
suggested to have an orthorhombic lattice with a = 6.797 Å, b = 7.756 Å and c = 3.761 Å
(at 95 GPa). Its diffraction peaks respect the systematic absences of space groups Pma2,
Pmn21, Pmc21, Pnc2 and P21212 [7]. Interestingly, the stability domain of these two
phases seems to strongly depend on the sample's thermodynamic path. For example, in
one study the ι phase was never observed the despite covering the phase diagram up to
100 GPa and 1800 K [154]. In that same study, it is describe that the θ phase can only be
obtained from a previously heated and quenched ζ-phase. This is explained by large
impeding transformational barriers [154,155].
II. C. Polymeric nitrogen phases
II. C. 0. The cubic-gauche polymeric nitrogen phase
From a pressure of 110 GPa, laser-heating a molecular phase of nitrogen, either
the ζ or κ phase, to temperatures above 2000 K finally ruptures the strong triple
covalent bond, giving rise to a polymeric network of triply single-bonded nitrogen
atoms [10,17,137]. Known as the cubic-gauche polymeric nitrogen (cg-N), it adopts a
cubic structure (I213) with a lattice parameter of a = 3.4542 Å (115.4 GPa). Eight
nitrogen atoms, sitting on the 8a (x = 0.067) Wyckoff sites, are contained within the
lattice [10]. This structural arrangement, drawn in Figure 8, matches theoretical
calculations performed by Mailhiot et al. in 1992 [4].
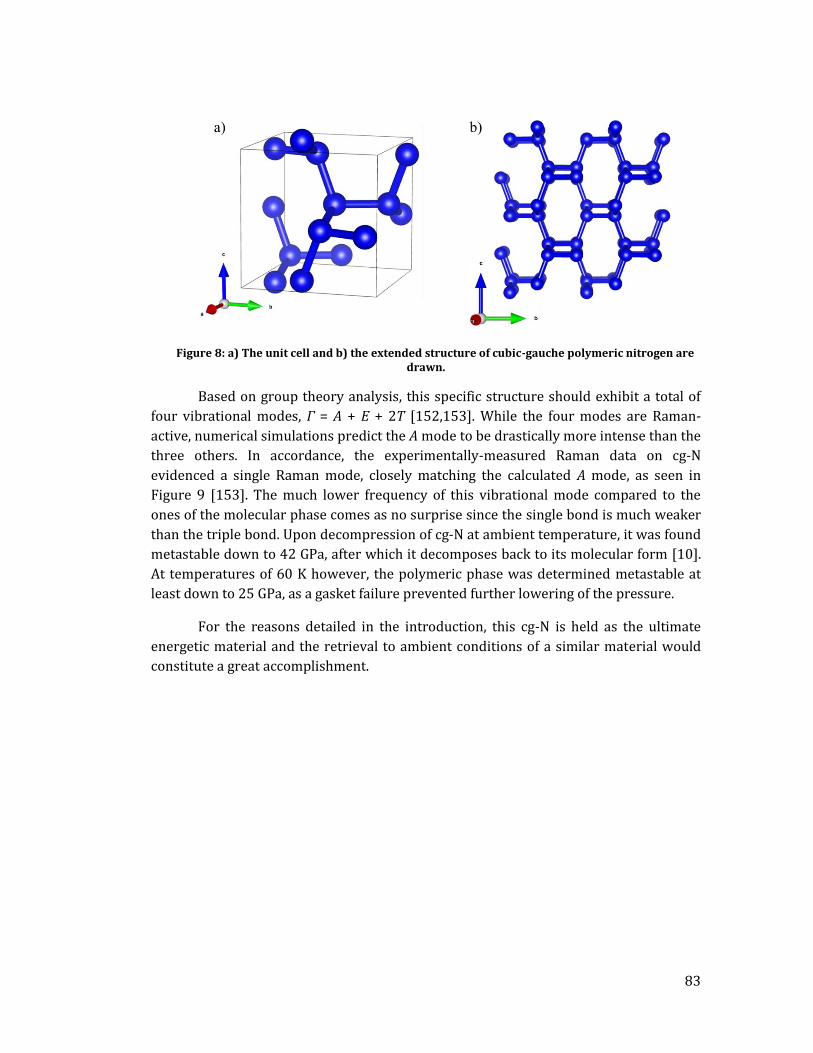
83
Figure 8: a) The unit cell and b) the extended structure of cubic-gauche polymeric nitrogen are drawn.
Based on group theory analysis, this specific structure should exhibit a total of
four vibrational modes, Γ = A + E + 2T [152,153]. While the four modes are Raman-
active, numerical simulations predict the A mode to be drastically more intense than the
three others. In accordance, the experimentally-measured Raman data on cg-N
evidenced a single Raman mode, closely matching the calculated A mode, as seen in
Figure 9 [153]. The much lower frequency of this vibrational mode compared to the
ones of the molecular phase comes as no surprise since the single bond is much weaker
than the triple bond. Upon decompression of cg-N at ambient temperature, it was found
metastable down to 42 GPa, after which it decomposes back to its molecular form [10].
At temperatures of 60 K however, the polymeric phase was determined metastable at
least down to 25 GPa, as a gasket failure prevented further lowering of the pressure.
For the reasons detailed in the introduction, this cg-N is held as the ultimate
energetic material and the retrieval to ambient conditions of a similar material would
constitute a great accomplishment.

84
Figure 9: a) Measured Raman modes evolution of both polymeric phases of nitrogen, cg-N (red) and LP-N (blue). The dashed red line corresponds to the theoretically calculated A mode of cg-N [153], while the dotted blue lines are the much weaker vibrational modes of LP-N [17]. b) Raman
spectra of both cg-N and LP-N phases following the compression and laser-heating of pure N2 to 157 GPa and above 2000 K.
II. C. 1. The layered polymeric nitrogen phase
Direct laser-heating of the optically-darkened κ-N2 phase above 125 GPa up to
175 GPa results in the synthesis of yet another form of polymeric nitrogen. X-ray
diffraction of the new compound revealed diffraction lines that were attributed to the
theoretically predicted layered polymeric nitrogen (LP-N) phase, an orthorhombic
structure (Pba2) with experimentally-determined lattice parameters of a = 4.1602 Å, b
= 4.2481 Å and c = 4.3689 Å at 112 GPa [17]. While a Rietveld refinement could not be
performed due to the quality of the powder, numerical simulation has predicted the 16
nitrogen atoms on four different 4c Wyckoff sites: (0.2933, 0.2172, 0.6608), (0.7852,
0.2167, 0.3403), (0.0209, 0.3363, 0.177) and (0.8381, 0.0171, 0.8219) [14]. These
atomic positions give rise to 2D layered chains of triply single-bonded nitrogen atoms,
as shown in Figure 10. Interestingly, this phase was produced at a lower pressure than
expected as calculations had predicted a pressure stability domain between 188-263
GPa [12,14].
With similar interatomic interactions (i.e. single-bonded nitrogen chains), LP-N
has Raman modes in the same frequency range as cg-N (see Figure 9). Two very intense
modes alongside with five much weaker ones were assigned as the vibrational signature
85
of LP-N. Based on the compound’s X-ray diffraction peaks and Raman modes, it was
determined to be metastable down to at least 52 GPa [17].
Intriguingly, the LP-N phase is thought to be produced alongside cg-N and a
monoclinic (C2/c) polymeric phase, predicted to be metastable under these pressure-
temperature conditions [17,156]. However, the latter phase was curiously not detected
by Raman spectroscopy.
Figure 10: a) The unit cell and b) extended view of the layered polymeric nitrogen phase.
III. THE NITROGEN MELTING CURVE
Until very recently, the melting curve of nitrogen was subject to debate. Earlier
experimental studies had all observed an intriguing maximum on the melting curve,
although there was a disagreement on whether it was at 50 GPa or 70 GPa (see refs
[157] and [154,155], respectively). These studies were in agreement with theoretical
calculations which explained the melting point maximum by a molecular liquid to
polymeric liquid phase transition at 90 GPa [158]. If verified, this polymeric liquid could
open up new pathways for retrieving a polymeric form of nitrogen at ambient
conditions.
The most recent experimental measurements dispelled these possibilities [136].
Nitrogen was compressed and heated in a novel sample design composed of two boron-
doped diamond disks sitting in small pits drilled in the diamond anvils' culet (see Figure
11). This geometry ensured a homogeneous heating and thus melting of the solid
nitrogen. The melt was detected by X-ray diffraction, which was also employed to
determine the structure of both the solid and the liquid phase. Two major conclusions
were drawn from this investigation. First, there is no maximum on the melting curve: it
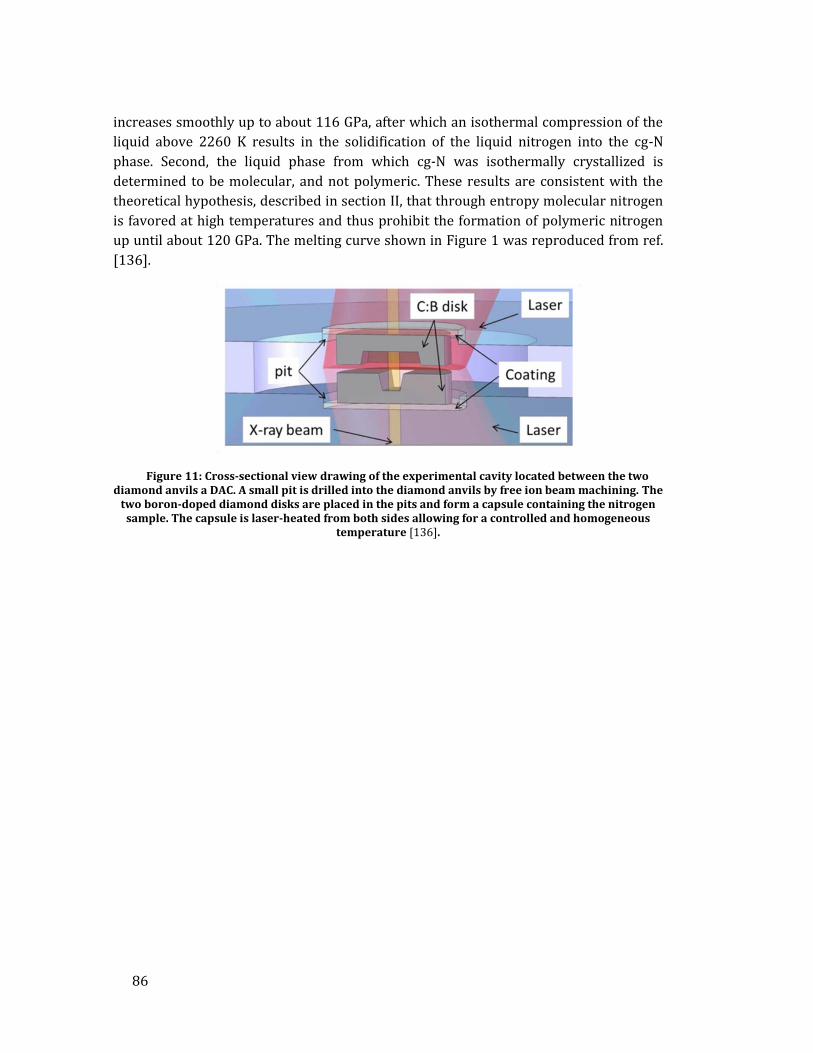
86
increases smoothly up to about 116 GPa, after which an isothermal compression of the
liquid above 2260 K results in the solidification of the liquid nitrogen into the cg-N
phase. Second, the liquid phase from which cg-N was isothermally crystallized is
determined to be molecular, and not polymeric. These results are consistent with the
theoretical hypothesis, described in section II, that through entropy molecular nitrogen
is favored at high temperatures and thus prohibit the formation of polymeric nitrogen
up until about 120 GPa. The melting curve shown in Figure 1 was reproduced from ref.
[136].
Figure 11: Cross-sectional view drawing of the experimental cavity located between the two diamond anvils a DAC. A small pit is drilled into the diamond anvils by free ion beam machining. The
two boron-doped diamond disks are placed in the pits and form a capsule containing the nitrogen sample. The capsule is laser-heated from both sides allowing for a controlled and homogeneous
temperature [136].
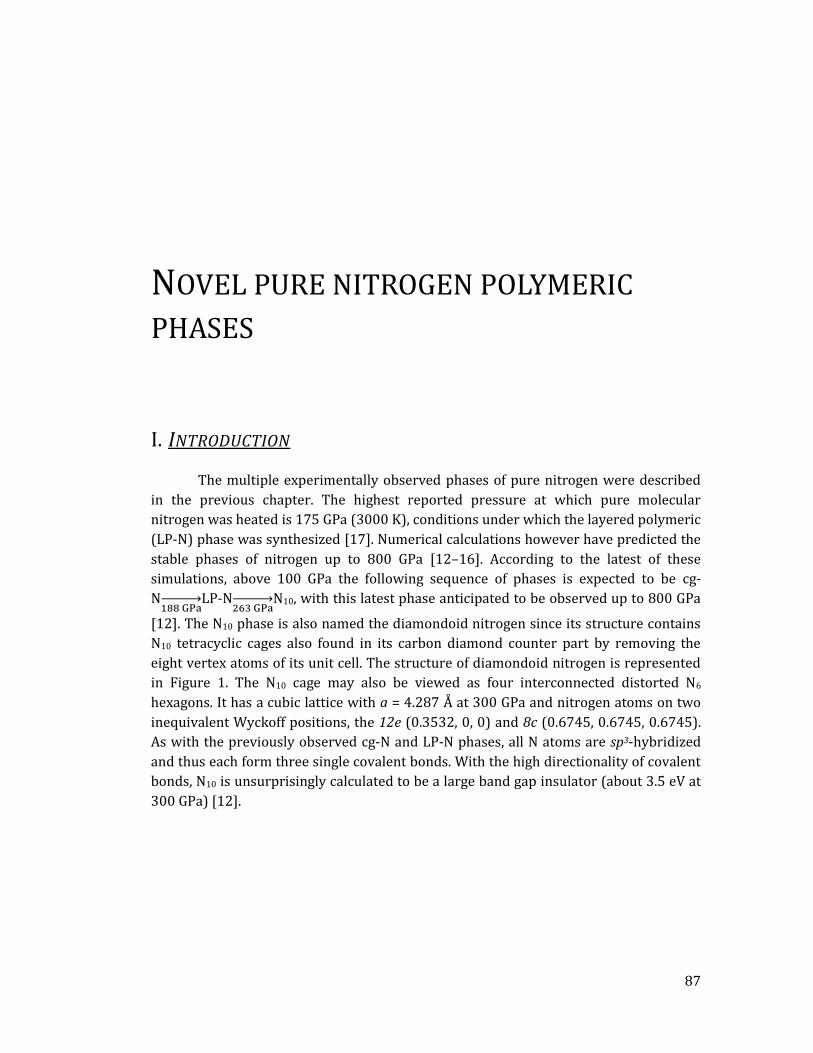
87
NOVEL PURE NITROGEN POLYMERIC
PHASES
I. INTRODUCTION
The multiple experimentally observed phases of pure nitrogen were described
in the previous chapter. The highest reported pressure at which pure molecular
nitrogen was heated is 175 GPa (3000 K), conditions under which the layered polymeric
(LP-N) phase was synthesized [17]. Numerical calculations however have predicted the
stable phases of nitrogen up to 800 GPa [12–16]. According to the latest of these
simulations, above 100 GPa the following sequence of phases is expected to be cg-
N LP-N
N10, with this latest phase anticipated to be observed up to 800 GPa
[12]. The N10 phase is also named the diamondoid nitrogen since its structure contains
N10 tetracyclic cages also found in its carbon diamond counter part by removing the
eight vertex atoms of its unit cell. The structure of diamondoid nitrogen is represented
in Figure 1. The N10 cage may also be viewed as four interconnected distorted N6
hexagons. It has a cubic lattice with a = 4.287 Å at 300 GPa and nitrogen atoms on two
inequivalent Wyckoff positions, the 12e (0.3532, 0, 0) and 8c (0.6745, 0.6745, 0.6745).
As with the previously observed cg-N and LP-N phases, all N atoms are sp3-hybridized
and thus each form three single covalent bonds. With the high directionality of covalent
bonds, N10 is unsurprisingly calculated to be a large band gap insulator (about 3.5 eV at
300 GPa) [12].
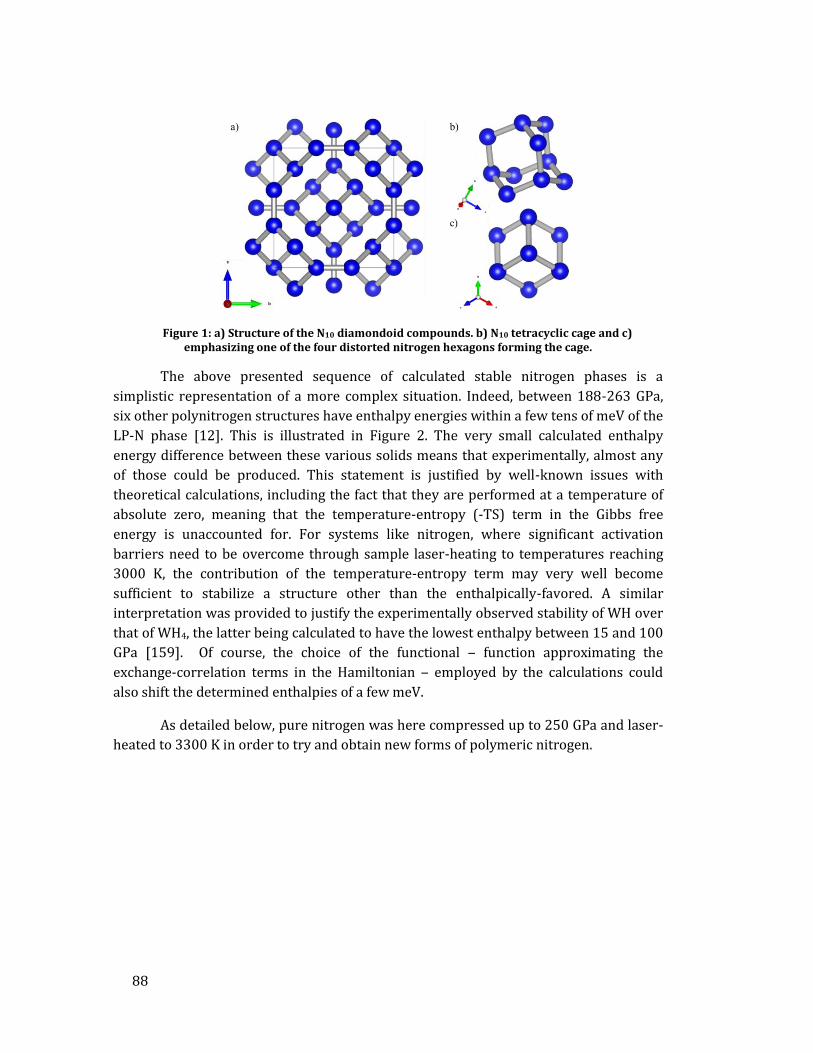
88
Figure 1: a) Structure of the N10 diamondoid compounds. b) N10 tetracyclic cage and c) emphasizing one of the four distorted nitrogen hexagons forming the cage.
The above presented sequence of calculated stable nitrogen phases is a
simplistic representation of a more complex situation. Indeed, between 188-263 GPa,
six other polynitrogen structures have enthalpy energies within a few tens of meV of the
LP-N phase [12]. This is illustrated in Figure 2. The very small calculated enthalpy
energy difference between these various solids means that experimentally, almost any
of those could be produced. This statement is justified by well-known issues with
theoretical calculations, including the fact that they are performed at a temperature of
absolute zero, meaning that the temperature-entropy (-TS) term in the Gibbs free
energy is unaccounted for. For systems like nitrogen, where significant activation
barriers need to be overcome through sample laser-heating to temperatures reaching
3000 K, the contribution of the temperature-entropy term may very well become
sufficient to stabilize a structure other than the enthalpically-favored. A similar
interpretation was provided to justify the experimentally observed stability of WH over
that of WH4, the latter being calculated to have the lowest enthalpy between 15 and 100
GPa [159]. Of course, the choice of the functional ‒ function approximating the
exchange-correlation terms in the Hamiltonian ‒ employed by the calculations could
also shift the determined enthalpies of a few meV.
As detailed below, pure nitrogen was here compressed up to 250 GPa and laser-
heated to 3300 K in order to try and obtain new forms of polymeric nitrogen.

89
Figure 2: Enthalpy curves of polynitrogen phases between 100 GPa and 500 GPa with respect to the LP-N (Pba2) compound. While the cg-N→LP-N-N10 sequence is predicted, a large number of
phases with similar enthalpy values are predicted between 188 GPa and 263 GPa. The figure was obtained from ref. [12].
II. ARTICLE
The many theoretical calculations on the very high pressure and temperature
behavior of nitrogen predict novel polynitrogen phases to be synthesized. The
experimental verification of these theoretical calculations is critical for a better
understanding of the high pressure behavior of nitrogen as well as for the possible
discovery of new arrangements poly-N which could inspire the design of an ambient
conditions form of nitrogen. In the study titled “The hexagonal layered polymeric
nitrogen phase synthesized near 250 GPa” in preparation for submission in Physical
Review Letters, pure molecular nitrogen was investigated at 250 GPa to 3000 K.
Upon its compression, Raman spectroscopy and X-ray diffraction measurements
on molecular nitrogen were obtained up to 160 and 200 GPa, respectively, pressures at
which no more signal could be detected. Shown in Figure 3, these measurements extend
the data found in the literature. Interestingly, the detected X-ray diffraction lines of
molecular nitrogen seem to closely follow those of κ-N2 up to about 170 GPa where a
distinct shift of slope is noticed. On another sample, this coincided with the complete

90
disappearance of the Raman modes of molecular N2, detected to occur between 160 and
170 GPa. A similar behavior was previously observed: Eremets et al. had followed the N2
molecular vibron up to 193 GPa and above 177 GPa, the Raman mode shift with
pressure was flat [8]. These datapoints are shown in Figure 3. Simultaneously, they had
detected a change in the resistance evolution with pressure. These observations had
been explained by the progressive transformation of the molecular solid into a much
harder amorphous solid. This interpretation also fits the here-presented X-ray
diffraction measurements.
Figure 3: a) X-ray diffraction data obtained on a pure nitrogen sample up to about 200 GPa. The empty blue and red circles are the experimental data collected during this thesis. The shift in the
data slope (at the blue and red data point junction) might indicate a structural modification of the κ phase. The full colored lines represent data obtained from Ref [137]. b) Evolution of the vibrational modes of molecular nitrogen up to 160 GPa. The empty blue circles represent data obtained during
this thesis. The full and dashed lines along with the empty black square are from the literature [8,9,143].
Above 200 GPa, the sample seemed to have become amorphous as neither X-ray
diffraction lines nor Raman modes could be detected and completely opaque; in
accordance with previous studies [6,8,9,137]. Starting from 209 GPa, the nitrogen
sample was laser-heated to moderate temperatures (1200 to 2000 K). As no
transformation were observed, the pressure was further increased up to 231 GPa where
the sample was heated to 2800 K, and then 3200 K. While no X-ray diffraction signal
was detected, the sample progressively became transparent, as shown in Figure 4.
Finally, at 244 GPa and 3300 K, new X-ray diffraction peaks were noticed and the
sample appeared almost completely transparent. As shown in the paper, the structure
of this solid was determined not to match the theoretically predicted N10 diamondoid or

91
the experimentally confirmed cg-N or LP-N phases, but instead a tetragonal (P42bc)
hexagonal layered polymeric (HLP) nitrogen; expected by the calculations to be of
slightly higher enthalpy than the N10 structure. The structure of HLP-N is drawn in
Figure 5. It is composed of layers of interconnected chains of N6 rings, with the top and
bottom layers being identical and simply rotated 90° along the c-axis.
Figure 4: Microphotographs of two pure nitrogen samples. a) Sample 1 at 221 GPa before laser-heating. Sample 2 b) 231 GPa after laser-heating at 2800 K, c) 224 GPa after laser-heating at 2800 K,
which caused a pressure decrease and d) following a pressure increase up to 244 GPa and laser-heating at 3300 K. e) X-ray diffraction patterns of sample 2 after its pressure increase up to 244 GPa
and subsequent to three laser-heating rounds at increasing temperatures. The diffractogram obtained ensuing the sample quenching from 3200 K shows new diffractions lines attributed to
HLP-N. The black tick marks indicate rhenium's diffraction lines.
Figure 5: Crystal structure of HLP-N. a) The unit cell, viewed along the a- and b-axes. The bottom and upper layers are observed to be identical but at 90° rotation with respect to the c-axis. b) The N6
chains viewed from the side and c) from up front.

92
Theoretical calculations were performed in an attempt to understand why the
HLP-N compound was obtained instead of the LP-N phase, which is the enthalpy-
minimizing solid at 244 GPa by about 10 meV. As the HLP-N phase is obtained at very
high temperatures, it was first hypothesized that it is stabilized through the entropy
term of the Gibbs free energy. However, accounting for the -TS term (through the quasi-
harmonic approximation) only shifted the energy difference between the two solids by
about 1 meV (at 3300 K). Similarly, van der Waals interactions were also added to the
calculations and reduced the enthalpy gap between the two phases by about 2 meV. As
such, it is thought that the functional employed for these calculations might instead be
at fault, or that anharmonic considerations are needed.
The HLP-N compound could be followed during decompression from 244 GPa
down to 66 GPa. X-ray diffraction characterization was performed from the maximum
pressure down to 176 GPa. In this pressure range, 15 pressure-volume data points were
acquired and fitted by a second order Birch-Murnaghan (see Figure 6). Since solids are
highly incompressible at these ultra high pressures, the precision on the retrieved bulk
modulus is lower. In any case, a value of K0 = 333(31) GPa (V0 = 200(4) Å3) was
obtained, which in-line with the other two polymeric nitrogen phases, as LP-N and cg-N
are reported to have values of K0 = 324.2 GPa (K0’ = 6.0) and K0 = 298 GPa (K0’ = 4),
respectively [10,17].
Figure 6: a) Evolution of the volume per atom with respect to pressure for the diamondoid N10, HLP-N, LP-N and cg-N compounds. b) Diffraction lines' position in 2θ of the HLP-N compound from 176 GPa to 244 GPa.
93
Below 176 GPa, the HLP-N solid was characterized by Raman spectroscopy. As
shown in the following manuscript, up to twelve Raman modes were detected, including
five lattice modes and seven intramolecular modes with frequencies between 650 and
1300 cm-1. These frequencies are in the range expected from N-N single bonds (700 to
1300 cm-1) [123,124,160,161]. The vibrons were followed down to 66 GPa, pressure at
which the diamond anvils ruptured and the nitrogen sample escaped.
The investigation of pure nitrogen at very high pressures and temperatures is a useful reference in the project of obtaining ambient conditions metastable polynitrogen solids. Indeed, this research serves to discover novel, more stable polynitrogen arrangements which, eventually, could be found easier to target through other methods, whether high pressure chemistry by doping nitrogen with selected impurities or by classical chemistry techniques, and secure at ambient conditions. The here-presented synthesis of the HLP-N compound will also contribute to the refinement of the theoretical calculations, which is indispensible in the context of material design.

94
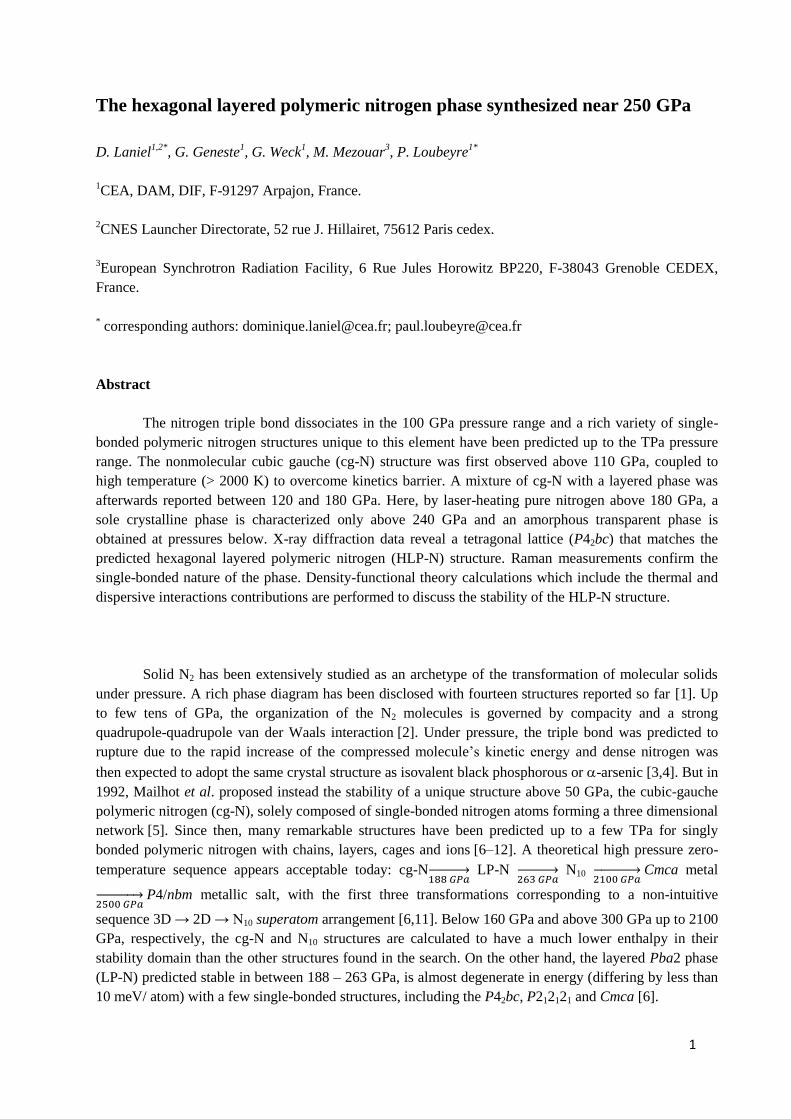
1
The hexagonal layered polymeric nitrogen phase synthesized near 250 GPa
D. Laniel
1,2*, G. Geneste
1, G. Weck
1, M. Mezouar
3, P. Loubeyre
1*
1CEA, DAM, DIF, F-91297 Arpajon, France.
2CNES Launcher Directorate, 52 rue J. Hillairet, 75612 Paris cedex.
3European Synchrotron Radiation Facility, 6 Rue Jules Horowitz BP220, F-38043 Grenoble CEDEX,
France.
* corresponding authors: [email protected]; [email protected]
Abstract
The nitrogen triple bond dissociates in the 100 GPa pressure range and a rich variety of single-
bonded polymeric nitrogen structures unique to this element have been predicted up to the TPa pressure
range. The nonmolecular cubic gauche (cg-N) structure was first observed above 110 GPa, coupled to
high temperature (> 2000 K) to overcome kinetics barrier. A mixture of cg-N with a layered phase was
afterwards reported between 120 and 180 GPa. Here, by laser-heating pure nitrogen above 180 GPa, a
sole crystalline phase is characterized only above 240 GPa and an amorphous transparent phase is
obtained at pressures below. X-ray diffraction data reveal a tetragonal lattice (P42bc) that matches the
predicted hexagonal layered polymeric nitrogen (HLP-N) structure. Raman measurements confirm the
single-bonded nature of the phase. Density-functional theory calculations which include the thermal and
dispersive interactions contributions are performed to discuss the stability of the HLP-N structure.
Solid N2 has been extensively studied as an archetype of the transformation of molecular solids
under pressure. A rich phase diagram has been disclosed with fourteen structures reported so far [1]. Up
to few tens of GPa, the organization of the N2 molecules is governed by compacity and a strong
quadrupole-quadrupole van der Waals interaction [2]. Under pressure, the triple bond was predicted to
rupture due to the rapid increase of the compressed molecule’s kinetic energy and dense nitrogen was
then expected to adopt the same crystal structure as isovalent black phosphorous or -arsenic [3,4]. But in
1992, Mailhot et al. proposed instead the stability of a unique structure above 50 GPa, the cubic-gauche
polymeric nitrogen (cg-N), solely composed of single-bonded nitrogen atoms forming a three dimensional
network [5]. Since then, many remarkable structures have been predicted up to a few TPa for singly
bonded polymeric nitrogen with chains, layers, cages and ions [6–12]. A theoretical high pressure zero-
temperature sequence appears acceptable today: cg-N LP-N
N10
Cmca metal
P4/nbm metallic salt, with the first three transformations corresponding to a non-intuitive
sequence 3D → 2D → N10 superatom arrangement [6,11]. Below 160 GPa and above 300 GPa up to 2100
GPa, respectively, the cg-N and N10 structures are calculated to have a much lower enthalpy in their
stability domain than the other structures found in the search. On the other hand, the layered Pba2 phase
(LP-N) predicted stable in between 188 – 263 GPa, is almost degenerate in energy (differing by less than
10 meV/ atom) with a few single-bonded structures, including the P42bc, P212121 and Cmca [6].

2
The cg-N structure was observed in 2004 by Eremets et al. from 110 GPa to 140 GPa above 2000
K [13]. Recently, Tomasino et al. reported a novel form of singly bonded nitrogen, called LP-N,
synthesized by the direct laser heating of nitrogen between 126 GPa and 175 GPa. However, the
assignment of the Pba2 structure to LP-N has yet been independently confirmed. This new phase was
always obtained with a significant amount of cg-N along with the metastable C2/c phase in smaller
amounts [14]. Later, it was proposed that a mixture of cg-N, Pba2 and Pccn single bonded allotropes
matches better the observed diffraction pattern, although not favored from the calculated enthalpy [10].
In this letter, we investigate the structural transformation of solid nitrogen in the pressure range
180 GPa – 250 GPa under direct laser heating. By going to higher pressure than previously reported, we
aimed to go out the stability field of cg-N and so obtain the next singly bonded nitrogen phase in a pure
form. Indeed, a single crystalline phase was produced at 244 GPa. The structure corresponds to a
tetragonal P42bc arrangement formed of interconnected chains of nitrogen hexagons. The phase called
hexagonal layered polymeric nitrogen (HLP-N) is characterized by both Raman spectroscopy and X-ray
diffraction measurements and is found metastable down to a least 66 GPa. Further insights are provided
on the properties of this new phase by density functional calculations (DFT), which also presents clues
questioning the structural assignment of the LP-N phase.
Two pure molecular nitrogen samples were loaded at 1400 bars in diamond anvil cells equipped
with diamond culets of 40 or 50 μm, reaching pressures of 230 GPa and 244 GPa, respectively. Prior to
heating, both samples were compressed above 180 GPa where nitrogen is completely opaque and no X-
ray diffraction peak nor Raman signature can be detected [15–18]. The sample could then be heated by
the direct absorption of the laser radiation. Laser-heating the sample to 1200 K at 209 GPa was noticed to
make the nitrogen sample partially transparent. Yet, no X-ray diffraction peaks or vibrational modes
appeared. Extending the laser-heating temperature and pressures to 2800K and 231 GPa further increased
the sample's transparency but still diffraction peaks could not be distinguished. The nitrogen sample was
thus interpreted to be in an amorphous state likely constituted of various poly-N arrangements. A possible
explanation for this observations is that in the pressure range between 188 GPa and 263 GPa, eight single-
bonded phases of nitrogen are predicted by ab-initio calculation with enthalpy differences of less than 50
meV [6]. Thereof, it constitutes a multi-valleys degenerate enthalpy landscape that could promote an
amorphous state. Finally, increasing the pressure to 244 GPa and laser-heating the sample to 3300 K
resulted in a drastic rise in transparency and the appearance of diffraction peaks, as illustrated in Fig. 1. In
the angle-resolved X-ray diffraction patterns, there is a significant overlapping of peaks between the
novel poly-N phase and the Re gasket: although the X-ray spot was 3 μm at half width, the tail of the X-
ray beam extended to the Re at the edge of the 12 μm diameter N sample. Fortunately because the
synthesized nitrogen sample has a multi-grains texture, the diffraction peaks from the novel poly-N phase
could be well identified on the image plate (see Fig. 2). These diffraction spots were followed down to
176 GPa. The evolution of the 2θ diffraction peaks position versus pressure is given in the Supplementary
Materials.

3
Figure 1: Microphotographs of the nitrogen samples after laser heating at: a) 231 GPa and b) 244 GPa, under transmitted light. c)
Integrated X-ray diffraction patterns collected with an X-ray wavelength of λ = 0.3738 Å. The integrated diffraction patterns
were obtained after laser-heating the sample to 3300 K at 244 GPa. The transformed sample thus obtained was then probed under
decompression down to 176 GPa. The Re peaks are marked at 176 GPa by black tick lines. The blue dashed lines follow the nine
diffraction lines of HLP-N which could be followed with pressure. The integrated diffraction patterns are shifted along the y-axis
for clarity.
The newly-observed diffraction peaks did not match any of the three previously synthesized
polynitrogen phases: cg-N, Pba2 and C2/c [13,14]. Moreover, comparison of the integrated diffraction
patterns to the theoretically predicted diamondoid N10 cubic (I-43m) structure, expected to be stable above
263 GPa, did not provide a good fit. Yet, another predicted structure with a tetragonal (P42bc) lattice
proved to well explain all of the new diffraction lines [6]. This was confirmed by a Le Bail refinement,
performed on a diffractogram recorded at 187 GPa. The following lattice parameters were obtained: a =
4.261(1) Å and c = 8.120(1) Å (V = 147.43 Å3). Because of the preferred orientation of the synthesized
phase due to multigrain texture, mainly the peaks along the (h0l) direction could be discerned. A total of
nine diffraction peaks could be followed from 244 GPa down to 176 GPa, as shown in Fig. 1, enough for
an accurate determination of the tetragonal lattice parameters.
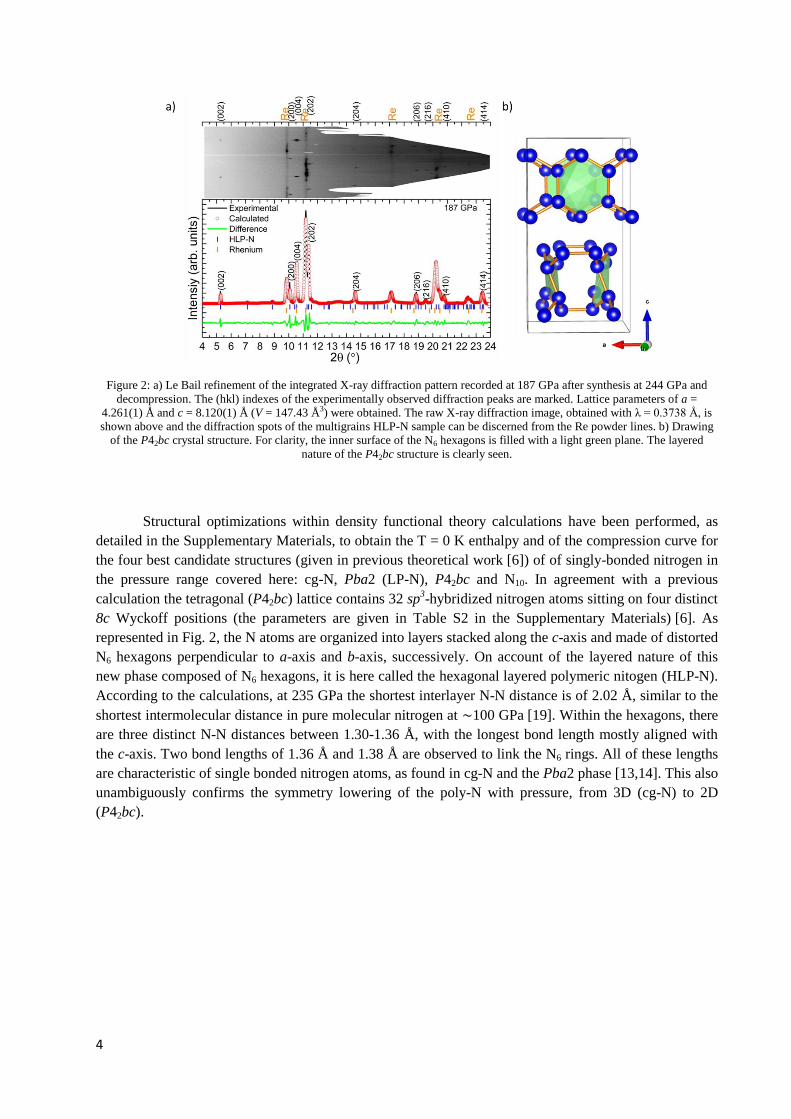
4
Figure 2: a) Le Bail refinement of the integrated X-ray diffraction pattern recorded at 187 GPa after synthesis at 244 GPa and
decompression. The (hkl) indexes of the experimentally observed diffraction peaks are marked. Lattice parameters of a =
4.261(1) Å and c = 8.120(1) Å (V = 147.43 Å3) were obtained. The raw X-ray diffraction image, obtained with λ = 0.3738 Å, is
shown above and the diffraction spots of the multigrains HLP-N sample can be discerned from the Re powder lines. b) Drawing
of the P42bc crystal structure. For clarity, the inner surface of the N6 hexagons is filled with a light green plane. The layered
nature of the P42bc structure is clearly seen.
Structural optimizations within density functional theory calculations have been performed, as
detailed in the Supplementary Materials, to obtain the T = 0 K enthalpy and of the compression curve for
the four best candidate structures (given in previous theoretical work [6]) of of singly-bonded nitrogen in
the pressure range covered here: cg-N, Pba2 (LP-N), P42bc and N10. In agreement with a previous
calculation the tetragonal (P42bc) lattice contains 32 sp3-hybridized nitrogen atoms sitting on four distinct
8c Wyckoff positions (the parameters are given in Table S2 in the Supplementary Materials) [6]. As
represented in Fig. 2, the N atoms are organized into layers stacked along the c-axis and made of distorted
N6 hexagons perpendicular to a-axis and b-axis, successively. On account of the layered nature of this
new phase composed of N6 hexagons, it is here called the hexagonal layered polymeric nitogen (HLP-N).
According to the calculations, at 235 GPa the shortest interlayer N-N distance is of 2.02 Å, similar to the
shortest intermolecular distance in pure molecular nitrogen at ∼100 GPa [19]. Within the hexagons, there
are three distinct N-N distances between 1.30-1.36 Å, with the longest bond length mostly aligned with
the c-axis. Two bond lengths of 1.36 Å and 1.38 Å are observed to link the N6 rings. All of these lengths
are characteristic of single bonded nitrogen atoms, as found in cg-N and the Pba2 phase [13,14]. This also
unambiguously confirms the symmetry lowering of the poly-N with pressure, from 3D (cg-N) to 2D
(P42bc).
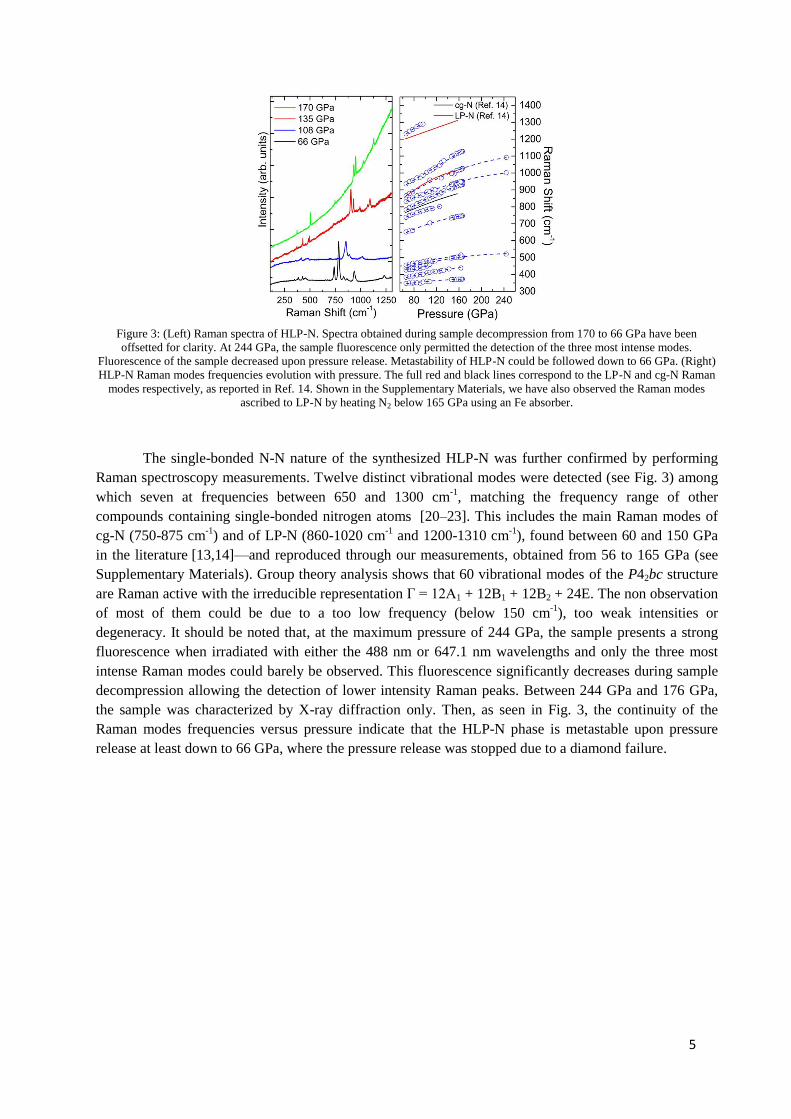
5
Figure 3: (Left) Raman spectra of HLP-N. Spectra obtained during sample decompression from 170 to 66 GPa have been
offsetted for clarity. At 244 GPa, the sample fluorescence only permitted the detection of the three most intense modes.
Fluorescence of the sample decreased upon pressure release. Metastability of HLP-N could be followed down to 66 GPa. (Right)
HLP-N Raman modes frequencies evolution with pressure. The full red and black lines correspond to the LP-N and cg-N Raman
modes respectively, as reported in Ref. 14. Shown in the Supplementary Materials, we have also observed the Raman modes
ascribed to LP-N by heating N2 below 165 GPa using an Fe absorber.
The single-bonded N-N nature of the synthesized HLP-N was further confirmed by performing
Raman spectroscopy measurements. Twelve distinct vibrational modes were detected (see Fig. 3) among
which seven at frequencies between 650 and 1300 cm-1
, matching the frequency range of other
compounds containing single-bonded nitrogen atoms [20–23]. This includes the main Raman modes of
cg-N (750-875 cm-1
) and of LP-N (860-1020 cm-1
and 1200-1310 cm-1
), found between 60 and 150 GPa
in the literature [13,14]—and reproduced through our measurements, obtained from 56 to 165 GPa (see
Supplementary Materials). Group theory analysis shows that 60 vibrational modes of the P42bc structure
are Raman active with the irreducible representation Γ = 12A1 + 12B1 + 12B2 + 24E. The non observation
of most of them could be due to a too low frequency (below 150 cm-1
), too weak intensities or
degeneracy. It should be noted that, at the maximum pressure of 244 GPa, the sample presents a strong
fluorescence when irradiated with either the 488 nm or 647.1 nm wavelengths and only the three most
intense Raman modes could barely be observed. This fluorescence significantly decreases during sample
decompression allowing the detection of lower intensity Raman peaks. Between 244 GPa and 176 GPa,
the sample was characterized by X-ray diffraction only. Then, as seen in Fig. 3, the continuity of the
Raman modes frequencies versus pressure indicate that the HLP-N phase is metastable upon pressure
release at least down to 66 GPa, where the pressure release was stopped due to a diamond failure.

6
Figure 4: Comparison between calculation and experimental data. a) Evolution of the compression curve of various polynitrogen
solids. The dashed-lines indicate the present T = 0 K calculation for the cg-N, Pba2, P42bc and N10 structures, respectively as
red, yellow, blue, purple. The symbols are the experimental data, from ref. 14 for cg-N and Pba2 and the present data for P42bc.
The T=0 K compression curves calculated for the cg-N, Pba2, P42bc and N10 structures are
plotted as dashed lines in Fig 4 a). The packing efficiency is seen to increase along the sequence cg-N,
Pba2, P42bc, N10, that is by going from a 3D to 2D to 3D superatom N-singly bonded arrangements [6].
The compression curves of Pba2 and P42bc are very near, underlining the similarity between these two
layered structures constituted of linked chains of N quasi-hexagons. The present experimental data for the
P42bc structure are in good agreement with calculations, with a slightly higher volume at a given pressure
that could partly be explained by the thermal expansion of experiment (T = 300 K). The experimental
data for cg-N (obtained from the literature [14]) are also in good agreement with the calculations.
However, the experimental volumes measured for the Pba2 structure, reported in Ref. [14], are much
lower than the calculations. That is an indication that the Pba2 structure assignment for the so called LP-
N phase reported in Ref. [14] might not be correct.
Calculation of the T = 0 K enthalpy-pressure relations for the most stable structures around 250
GPa are plotted in Fig. S9 of the Supplementary Materials. Due to the very small enthalpy differences
between these various structures, the structural optimization and the convergence of the calculationwere
pushed below 1 meV/atom (see Supplementary Materials). At 244 GPa, the enthalpy of P42bc is 11 meV
greater than that of Pba2, in very good agreement with the previous calculations [6]. Adding the thermal
and dispersive interactions contributions do not make the P42bc the most stable phase. The thermal
(vibrational) contribution, calculated at the temperature of the synthesis (3300 K), was estimated in the
harmonic approximation and obtained by calculating the phonon band structure of the P42bc and Pba2
arrangements at a given pressure. The two structures are dynamically stable with no imaginary mode. The
thermal contribution to the Gibbs free energy difference, essentially given by the entropy term, lowers the
difference between P42bc and Pba2 by 1 meV only. The influence of dispersive interactions was also
tested by correcting the GGA-PBE functional with a semi-empirical scheme of Grimme [24,25]: the
enthalpy difference between P42bc and Pba2 is reduced by ~2 meV/atom. In total, the Pba2 structure is
still found more stable than P42bc by ~8 meV/atom. Performing the calculations with a higher degree of
approximation, i.e taking into account the anharmonic terms in the thermal contribution or using another

7
exchange-correlation functional that would bring a perfect agreement with the compression curve, could
probably reverse the Gibbs free energy difference between Pba2 and P42bc. However, that is beyond the
scope of the present work.
In summary, pure nitrogen was investigated up to the most extreme conditions yet reached
through its static compression: 244 GPa and 3300 K. The P42bc polymeric singly bonded phase was
synthesized. It is a layered structure, composed of interconnected chains of N6 rings, named the HLP-N
phase. That is surprising since the Pba2 structure is given slightly more stable by calculations and was
reported in a previous experimental study. On one hand, we show here that the previous assignment of the
Pba2 structure to LP-N can be questioned. On the other hand, even by taking into account dispersive
interactions and thermal contributions, the Pba2 phase is still calculated slightly more energetically
favorable. That should motivate further calculations that could test anharmonic effects and other
exchange-correlation functionals. The present observations unambiguously confirm the predicted
structural evolution of polymeric nitrogen from a 3D (cg-N) to a 2D layered structure. The next
experimental step would be the synthesis of the superatom N10 structure but pressures in excess of 300
GPa would have to be be reached.
References
[1] M. Frost, R. T. Howie, P. Dalladay-Simpson, A. F. Goncharov, and E. Gregoryanz, Phys. Rev.
B 93, 024113 (2016).
[2] A. Erba, L. Maschio, C. Pisani, and S. Casassa, Phys. Rev. B 84, 012101 (2011).
[3] A. McMahan and R. LeSar, Phys. Rev. Lett. 54, 1929 (1985).
[4] R. J. Needs, R. M. Martin, and O. H. Nielsen, Phys. Rev. B 33, 3778 (1986).
[5] C. Mailhiot, L. Yang, and A. McMahan, Phys. Rev. B 46, 14419 (1992).
[6] X. Wang, Y. Wang, M. Miao, X. Zhong, J. Lv, T. Cui, J. Li, L. Chen, C. J. Pickard, and Y.
Ma, Phys. Rev. Lett. 109, 175502 (2012).
[7] C. J. Pickard and R. J. Needs, Phys. Rev. Lett. 102, 1 (2009).
[8] A. R. Oganov and C. W. Glass, J. Chem. Phys. 124, 244704 (2006).
[9] Y. Ma, A. Oganov, Z. Li, Y. Xie, and J. Kotakoski, Phys. Rev. Lett. 102, 065501 (2009).
[10] A. A. Adeleke, M. J. Greschner, A. Majumdar, B. Wan, H. Liu, Z. Li, H. Gou, and Y. Yao,
Phys. Rev. B 96, 1 (2017).
[11] J. Sun, M. Martinez-Canales, D. D. Klug, C. J. Pickard, and R. J. Needs, Phys. Rev. Lett. 111,
1 (2013).
[12] Y. Yao, J. S. Tse, and K. Tanaka, Phys. Rev. B - Condens. Matter Mater. Phys. 77, 1 (2008).
[13] M. I. Eremets, A. G. Gavriliuk, I. A. Trojan, D. A. Dzivenko, and R. Boehler, Nat. Mater. 3,
558 (2004).
[14] D. Tomasino, M. Kim, J. Smith, and C.-S. Yoo, Phys. Rev. Lett. 113, 205502 (2014).
[15] A. F. Goncharov, E. Gregoryanz, H. K. Mao, Z. Liu, and R. J. Hemley, Phys. Rev. Lett. 85,
1262 (2000).
[16] E. Gregoryanz, A. Goncharov, R. Hemley, and H. Mao, Phys. Rev. B 64, 052103 (2001).
[17] E. Gregoryanz, A. F. Goncharov, C. Sanloup, M. Somayazulu, H. K. Mao, and R. J. Hemley,
J. Chem. Phys. 126, 184505 (2007).
[18] M. I. Eremets, R. J. Hemley, H. Mao, and E. Gregoryanz, Nature 411, 170 (2001).
[19] M. I. Eremets, A. G. Gavriliuk, N. R. Serebryanaya, I. A. Trojan, D. A. Dzivenko, R. Boehler,
H. K. Mao, and R. J. Hemley, J. Chem. Phys. 121, 11296 (2004).
[20] S. Jiang, X. Huang, D. Duan, S. Zheng, F. Li, X. Yang, Q. Zhou, B. Liu, and T. Cui, J. Phys.
Chem. C 118, 3236 (2014).
[21] A. F. Young, J. A. Montoya, C. Sanloup, M. Lazzeri, E. Gregoryanz, and S. Scandolo, Phys.
Rev. B 73, 2 (2006).

8
[22] E. Gregoryanz, C. Sanloup, M. Somayazulu, J. Badro, G. Fiquet, H. Mao, and R. J. Hemley,
Nat. Mater. 3, 294 (2004).
[23] A. F. Young, C. Sanloup, E. Gregoryanz, S. Scandolo, R. J. Hemley, and H. K. Mao, Phys.
Rev. Lett. 96, 155501 (2006).
[24] S. Grimme, S. Ehrlich, and L. Goerigk, J. Comput. Chem. 32, 1456 (2011).
[25] S. Grimme, J. Antony, S. Ehrlich, and H. Krieg, J. Chem. Phys. 132, 154104 (2010).
1
Supplementary Materials
The hexagonal layered polymeric nitrogen phase
synthesized near 250 GPa
D. Laniel1,2*
, G. Geneste1, G. Weck
1, M. Mezouar
3, P. Loubeyre
1*
1CEA, DAM, DIF, F-91297 Arpajon, France.
2CNES Launcher Directorate, 52 rue J. Hillairet, 75612 Paris cedex.
3European Synchrotron Radiation Facility, 6 Rue Jules Horowitz BP220, F-38043 Grenoble CEDEX,
France.
* Emails: [email protected]; [email protected]

2
Experimental Method
Two different samples were studied: in run 1 the 180 GPa-230 GPa pressure range was covered
using 50 μm diamond anvil culet; in run 2 the pressure range 200 GPa-244 GPa was investigated using 40
μm diamond anvil culet. Rhenium gaskets with a hole diameter between 17-23 μm was employed. On
account of the very small experimental cavity, no internal pressure calibrants were put in to prevent
parasitic diffraction lines and chemical reactions. Instead, pressure was determined either with the
equation of state of rhenium by collecting the X-ray diffraction signal at the edge of the sample cavity or
using the high-frequency edge of the diamond anvils first order Raman band, having about 5%
uncertainty in pressure [1,2]. When the two measurements could be done simultaneously, they agreed
within their uncertainty.
Angular dispersive powder X-ray diffraction measurements were obtained at the ID27 beamline
of the European Synchrotron Research Facility (ESRF). The X-ray beam, of wavelength set at λ = 0.3738
Å, was focused down to a full width at half maximum of about 2.5 x 2.5 μm2. A MAR-CCD detector
recorded the X-ray diffraction patterns which were then integrated using DIOPTAS and analyzed using
the XRDA as well as the FULLPROF softwares [3–5]. Double-sided YAG laser-heating of the nitrogen
samples was performed through both openings of the DAC on ID27 and at our laboratory. Temperatures
during laser-heating were accurately measured by fitting the sample’s thermal radiation to Planck’s law.
To ensure homogenous temperatures inside the sample cavity, the temperature was measured from both
openings of the DAC and verified to be equal. As molecular nitrogen readily absorbs the YAG laser
above about 110 GPa, no absorber was required [6].
Confocal Raman spectroscopy measurements were performed using an Alpha300M+ (WITec).
Sample excitation was done with a continuous Ar-Kr laser employing the 488 nm line or 647 lines,
focused down to less than 1 µm. The Stokes Raman signal was collected in back-scattering geometry by a
CCD coupled to a 1800 lines/mm grating, allowing a spectral resolution of approximately 5 cm-1
. To
avoid a photoinduced decomposition of the novel polynitrogen phase, the laser power was kept below 10
mW on the sample and acquisition times were of 180 s.
Theoretical Calculation Method
Density-functional calculations have been performed with the ABINIT code [7] and the Projector
Augmented Wave (PAW) method [8,9], in the framework of the Generalized Gradient Approximation, as
formulated by Perdew, Burke and Ernzerhof [10]. The PAW atomic dataset for nitrogen has been taken
from the JTH table [11]. First a set of structural optimizations have been performed to obtain the enthalpy
and volume as a function of pressure, for different structures proposed in the literature (Pba2, P42bc, the
N10 diamondoid and cg-N). The unit cells of these structures contain respectively 16, 32, 20 and 8 atoms.
The plane-wave cut-off is set to 30 Hartrees and a dense k-point mesh is used to sample the Brillouin
Zone (16x16x16 for Pba2, 12x12x7 for P42bc, 16x16x16 for N10 and 16x16x16 for cg-N). At one
selected pressure (294 GPa), we have checked that the structural optimization using a denser k-point mesh
of 24x24x24 (Pba2), 24x24x15 (P42bc) and 24x24x24 (N10) provides the same enthalpies (within
differences lower than 5x10⁻⁵
meV/atom) as those obtained by employing the previously mentioned k-
point meshes. This indicates the excellent converge with respect to the Brillouin zone sampling. Also, the
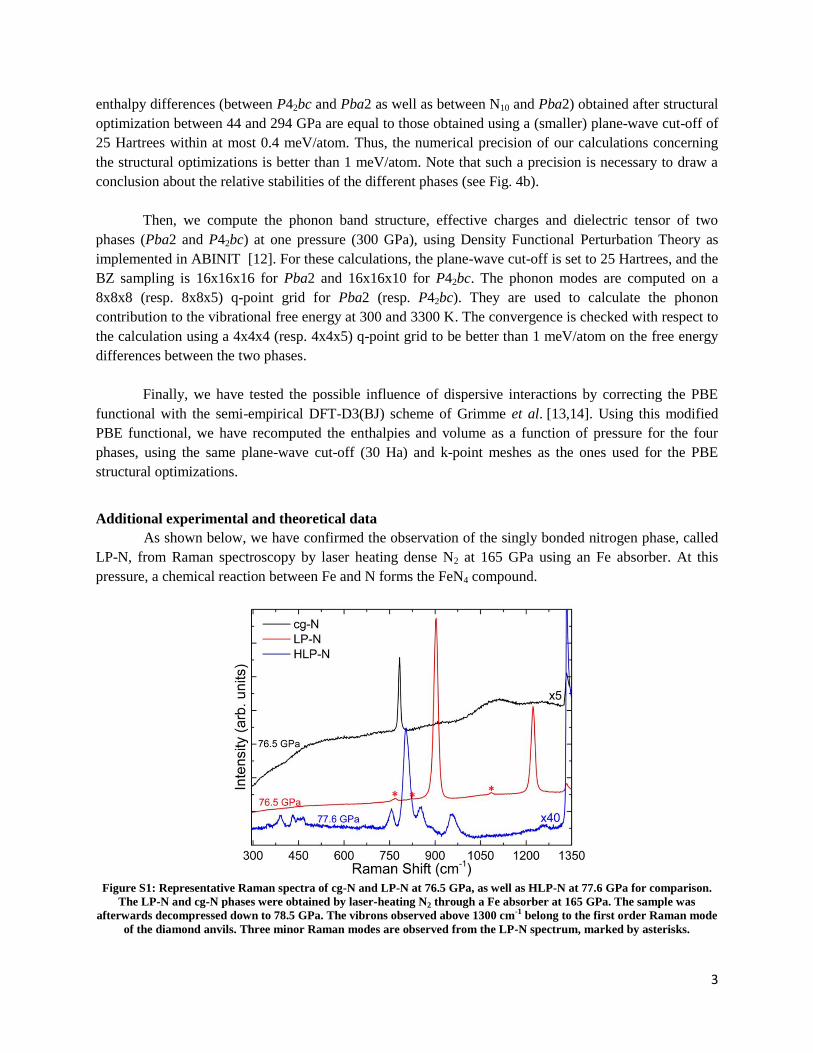
3
enthalpy differences (between P42bc and Pba2 as well as between N10 and Pba2) obtained after structural
optimization between 44 and 294 GPa are equal to those obtained using a (smaller) plane-wave cut-off of
25 Hartrees within at most 0.4 meV/atom. Thus, the numerical precision of our calculations concerning
the structural optimizations is better than 1 meV/atom. Note that such a precision is necessary to draw a
conclusion about the relative stabilities of the different phases (see Fig. 4b).
Then, we compute the phonon band structure, effective charges and dielectric tensor of two
phases (Pba2 and P42bc) at one pressure (300 GPa), using Density Functional Perturbation Theory as
implemented in ABINIT [12]. For these calculations, the plane-wave cut-off is set to 25 Hartrees, and the
BZ sampling is 16x16x16 for Pba2 and 16x16x10 for P42bc. The phonon modes are computed on a
8x8x8 (resp. 8x8x5) q-point grid for Pba2 (resp. P42bc). They are used to calculate the phonon
contribution to the vibrational free energy at 300 and 3300 K. The convergence is checked with respect to
the calculation using a 4x4x4 (resp. 4x4x5) q-point grid to be better than 1 meV/atom on the free energy
differences between the two phases.
Finally, we have tested the possible influence of dispersive interactions by correcting the PBE
functional with the semi-empirical DFT-D3(BJ) scheme of Grimme et al. [13,14]. Using this modified
PBE functional, we have recomputed the enthalpies and volume as a function of pressure for the four
phases, using the same plane-wave cut-off (30 Ha) and k-point meshes as the ones used for the PBE
structural optimizations.
Additional experimental and theoretical data
As shown below, we have confirmed the observation of the singly bonded nitrogen phase, called
LP-N, from Raman spectroscopy by laser heating dense N2 at 165 GPa using an Fe absorber. At this
pressure, a chemical reaction between Fe and N forms the FeN4 compound.
Figure S1: Representative Raman spectra of cg-N and LP-N at 76.5 GPa, as well as HLP-N at 77.6 GPa for comparison.
The LP-N and cg-N phases were obtained by laser-heating N2 through a Fe absorber at 165 GPa. The sample was
afterwards decompressed down to 78.5 GPa. The vibrons observed above 1300 cm-1 belong to the first order Raman mode
of the diamond anvils. Three minor Raman modes are observed from the LP-N spectrum, marked by asterisks.

4
Figure S2: Evolution of the a) cg-N and b) LP-N Raman modes with pressure, compared with those found in the
literature [6]. In b), all of the LP-N Raman modes are shown, including the weak intensities modes (marked by asterisks).
The two main modes are found at~850 cm-1 and ~1200 cm-1 at 56 GPa.
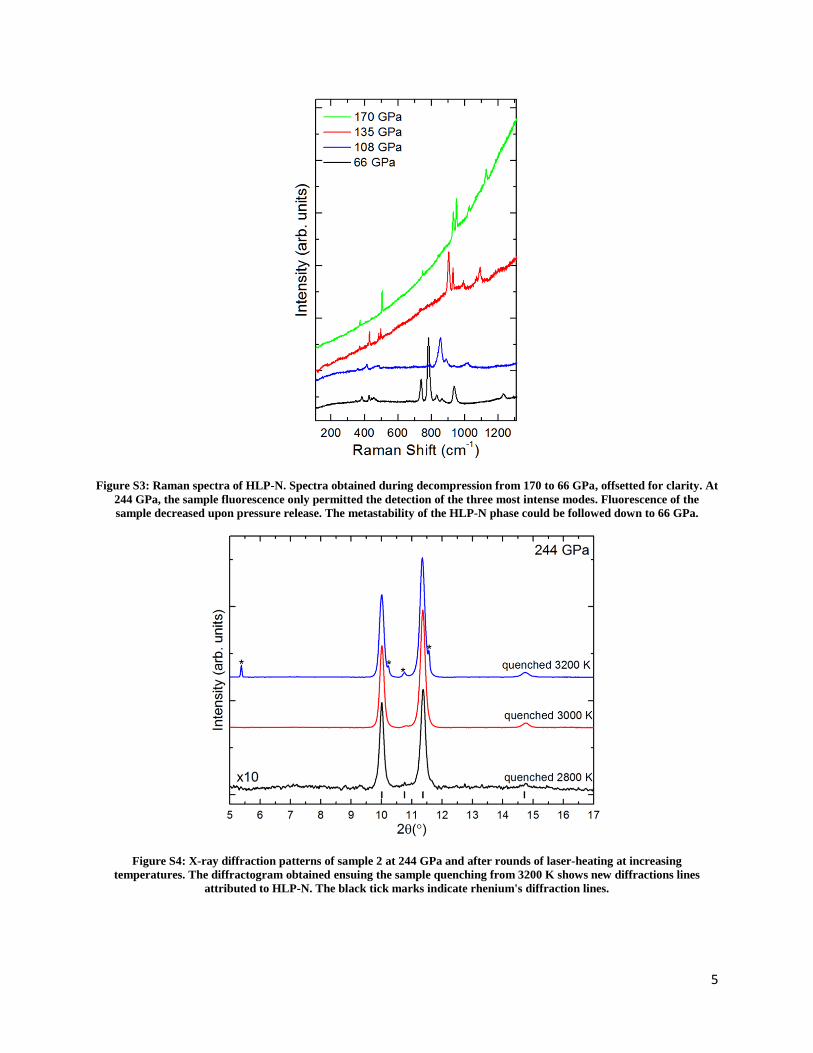
5
Figure S3: Raman spectra of HLP-N. Spectra obtained during decompression from 170 to 66 GPa, offsetted for clarity. At
244 GPa, the sample fluorescence only permitted the detection of the three most intense modes. Fluorescence of the
sample decreased upon pressure release. The metastability of the HLP-N phase could be followed down to 66 GPa.
Figure S4: X-ray diffraction patterns of sample 2 at 244 GPa and after rounds of laser-heating at increasing
temperatures. The diffractogram obtained ensuing the sample quenching from 3200 K shows new diffractions lines
attributed to HLP-N. The black tick marks indicate rhenium's diffraction lines.
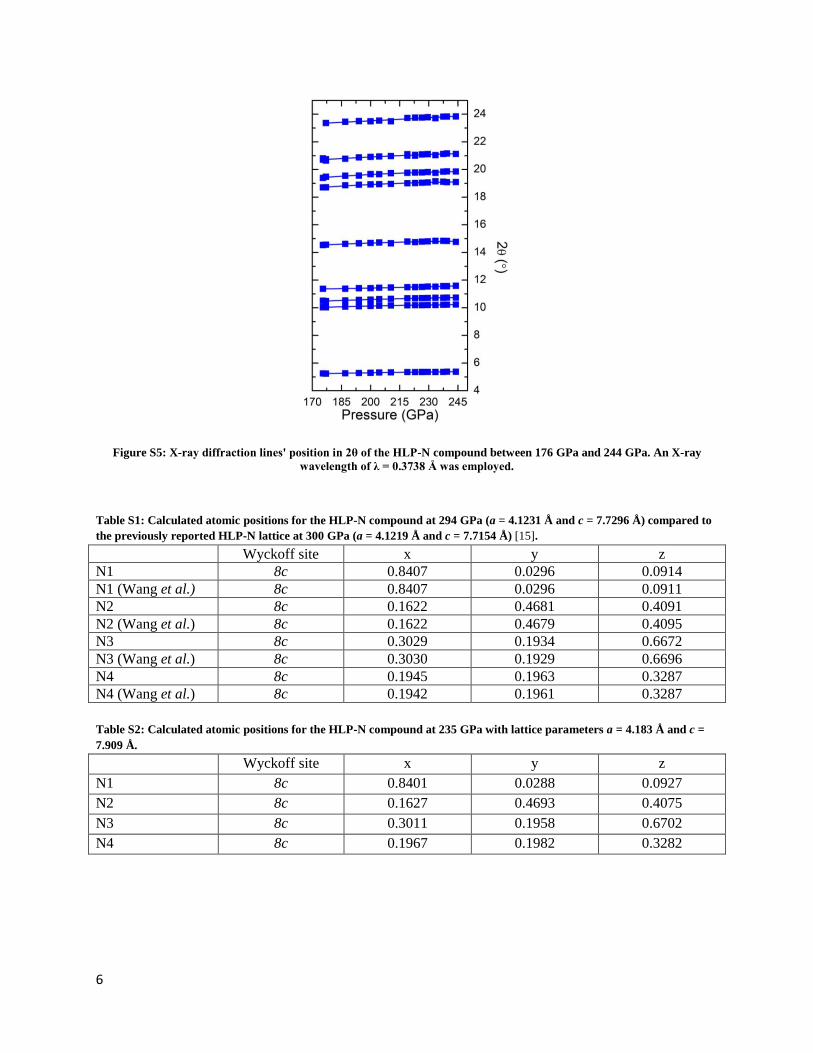
6
Figure S5: X-ray diffraction lines' position in 2θ of the HLP-N compound between 176 GPa and 244 GPa. An X-ray
wavelength of λ = 0.3738 Å was employed.
Table S1: Calculated atomic positions for the HLP-N compound at 294 GPa (a = 4.1231 Å and c = 7.7296 Å) compared to
the previously reported HLP-N lattice at 300 GPa (a = 4.1219 Å and c = 7.7154 Å) [15].
Wyckoff site x y z
N1 8c 0.8407 0.0296 0.0914
N1 (Wang et al.) 8c 0.8407 0.0296 0.0911
N2 8c 0.1622 0.4681 0.4091
N2 (Wang et al.) 8c 0.1622 0.4679 0.4095
N3 8c 0.3029 0.1934 0.6672
N3 (Wang et al.) 8c 0.3030 0.1929 0.6696
N4 8c 0.1945 0.1963 0.3287
N4 (Wang et al.) 8c 0.1942 0.1961 0.3287
Table S2: Calculated atomic positions for the HLP-N compound at 235 GPa with lattice parameters a = 4.183 Å and c =
7.909 Å.
Wyckoff site x y z
N1 8c 0.8401 0.0288 0.0927
N2 8c 0.1627 0.4693 0.4075
N3 8c 0.3011 0.1958 0.6702
N4 8c 0.1967 0.1982 0.3282

7
Table S3: Measured position of the HLP-N diffraction peaks with respect to pressure.
P (GPa) d-spacing (Å) 2θ (°)
175.5 4.0826 5.2477
175.5 2.1374 10.0329
175.5 2.0417 10.5042
175.5 1.8876 11.3647
175.5 1.4779 14.5304
175.5 1.1503 18.7005
175.5 1.1100 19.3871
175.5 1.0871 19.7991
175.5 1.0397 20.7104
175.5 1.0352 20.8012
177 4.0941 5.2329
177 2.1370 10.0345
177 2.0465 10.4794
177 1.4753 14.5555
177 1.3365 16.0770
177 1.1501 18.7039
177 1.1056 19.4650
177 1.0434 20.6370
177 1.0382 20.7403
177 0.9232 23.3584
187 4.0764 5.2557
187 2.1287 10.0738
187 2.0373 10.5270
187 1.4694 14.6149
187 0.9197 23.4499
187 1.3286 16.1730
187 1.1412 18.8510
187 1.1011 19.5450
187 1.0367 20.7710
187 1.8863 11.3722
194 4.0612 5.2754
194 2.1221 10.1055
194 2.0305 10.5627
194 1.8796 11.4130
194 1.4649 14.6592
194 1.1384 18.8974
194 1.1005 19.5551
194 1.0320 20.8670
194 0.9179 23.4961
200 4.0512 5.2884
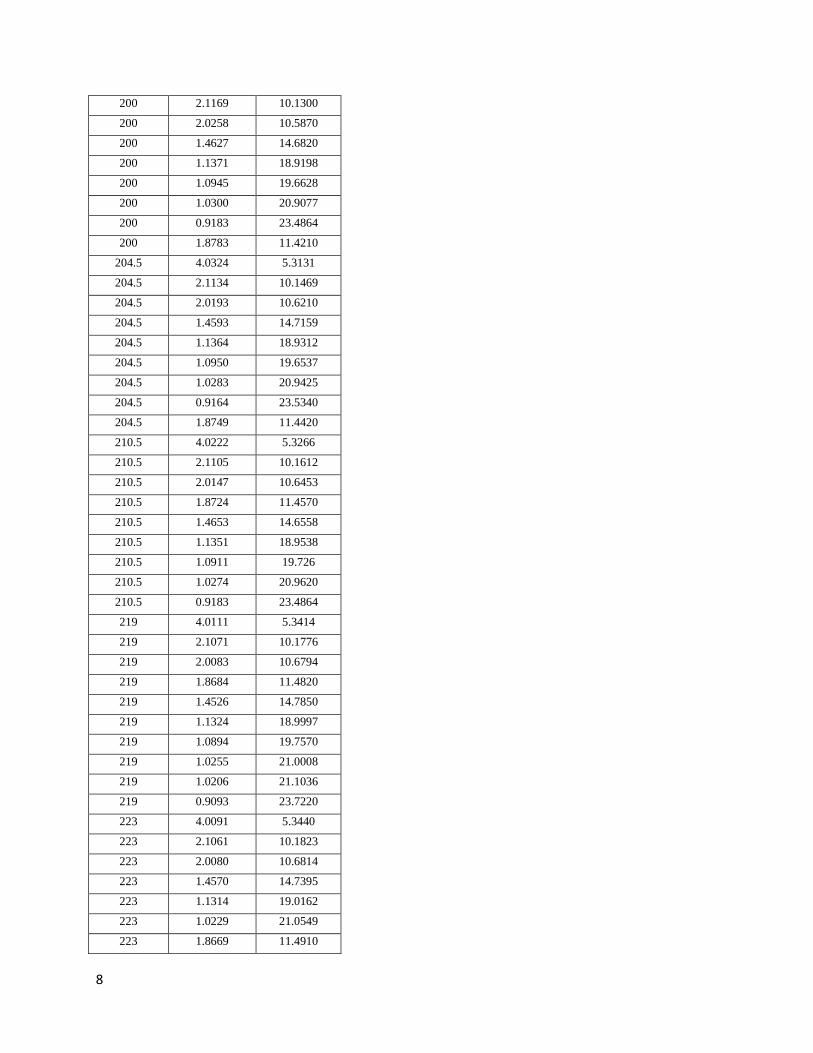
8
200 2.1169 10.1300
200 2.0258 10.5870
200 1.4627 14.6820
200 1.1371 18.9198
200 1.0945 19.6628
200 1.0300 20.9077
200 0.9183 23.4864
200 1.8783 11.4210
204.5 4.0324 5.3131
204.5 2.1134 10.1469
204.5 2.0193 10.6210
204.5 1.4593 14.7159
204.5 1.1364 18.9312
204.5 1.0950 19.6537
204.5 1.0283 20.9425
204.5 0.9164 23.5340
204.5 1.8749 11.4420
210.5 4.0222 5.3266
210.5 2.1105 10.1612
210.5 2.0147 10.6453
210.5 1.8724 11.4570
210.5 1.4653 14.6558
210.5 1.1351 18.9538
210.5 1.0911 19.726
210.5 1.0274 20.9620
210.5 0.9183 23.4864
219 4.0111 5.3414
219 2.1071 10.1776
219 2.0083 10.6794
219 1.8684 11.4820
219 1.4526 14.7850
219 1.1324 18.9997
219 1.0894 19.7570
219 1.0255 21.0008
219 1.0206 21.1036
219 0.9093 23.7220
223 4.0091 5.3440
223 2.1061 10.1823
223 2.0080 10.6814
223 1.4570 14.7395
223 1.1314 19.0162
223 1.0229 21.0549
223 1.8669 11.4910

9
223 1.0883 19.7770
223 1.0256 21.0000
223 0.9083 23.7470
226.5 4.0048 5.3498
226.5 2.1061 10.1822
226.5 2.0056 10.6942
226.5 1.1303 19.0352
226.5 1.0213 21.0874
226.5 0.9081 23.7530
226.5 1.8653 11.5010
226.5 1.4533 14.7770
226.5 1.0880 19.7830
229.5 3.9998 5.3564
229.5 2.1036 10.1943
229.5 2.0033 10.7063
229.5 1.8605 11.5306
229.5 1.4513 14.7980
229.5 1.1292 19.0531
229.5 1.0203 21.1083
229.5 1.0865 19.8100
229.5 0.9073 23.7750
233.5 4.0055 5.3488
233.5 2.1034 10.1951
233.5 2.0016 10.7151
233.5 1.8621 11.5204
233.5 1.0238 21.0354
233.5 1.4479 14.8330
233.5 1.1243 19.1370
233.5 1.0896 19.7520
233.5 0.9097 23.7120
237.5 3.9993 5.3571
237.5 2.1004 10.2101
237.5 2.0016 10.7155
237.5 1.8563 11.5569
237.5 1.4476 14.8362
237.5 1.1258 19.1124
237.5 1.0200 21.1156
237.5 1.0849 19.8400
237.5 0.9057 23.8160
239.4 3.9896 5.3701
239.4 2.0989 10.2174
239.4 1.9989 10.7297
239.4 1.8566 11.554

10
239.4 1.4482 14.8293
239.4 1.1277 19.0795
239.4 1.0181 21.1547
239.4 1.0839 19.8580
239.4 0.9055 23.8230
244 3.9915 5.3676
244 2.0963 10.2301
244 1.9991 10.7289
244 1.8517 11.5859
244 1.4549 14.7615
244 1.1275 19.0830
244 1.0197 21.1208
244 0.9051 23.8340
244 1.0845 19.8460
Table S4: Measured volume per atom of the HLP-N lattice with respect to pressure.
P (GPa) Volume/atom (Å3)
175.5 4.67
177 4.67
187 4.60
194 4.56
200 4.55
204.5 4.52
210.5 4.49
219 4.46
223 4.46
226.5 4.44
229.5 4.42
233.5 4.43
237.5 4.40
239.4 4.37
244 4.39

11
Figure S6: Electronic band structure of the HLP-N phase at 244 GPa along with its electronic density of states (DOS). The
Fermi level was set at 0 eV. The band gap is of 3.9 eV.
Figure S7: Phonon band structure of the HLP-N phase at 300 GPa along with its DOS. The optical phonons (all but three
lowest-frequency modes) at the Γ point are at frequencies between ∼370 and ∼1600 cm-1.

12
Figure S8: Structure of the HLP-N solid showing the isosurface for the electron density of 1.01 el/Å3. a) A single unit cell
and b) four unit cells are shown. These drawings show 1) the lack of bonding in the interlayer regions and 2) the
significance of accounting for van der Waals interactions.
Figure S9: a) Enthalpy of the various structures in competition for stability in the pressure range of the P42bc synthesis.
Corrections of thermal contribution (3300 K), van der Waals interaction and their sum at 244 GPa are shown as a star,
an hexagon and a square respectively. b) The enthalpy-pressure curve between 100 GPa and 320 GPa; well matching
previous calculations [15].
13
References
[1] S. Anzellini, A. Dewaele, F. Occelli, P. Loubeyre, and M. Mezouar, J. Appl. Phys. 115, 043511
(2014).
[2] Y. Akahama and H. Kawamura, J. Phys. Conf. Ser. 215, 012195 (2010).
[3] S. Desgreniers and K. Lagarec, J. Appl. Crystallogr. 27, 432 (1994).
[4] C. Prescher and V. B. Prakapenka, High Press. Res. 35, 223 (2015).
[5] J. Rodriguez-Carvajal, Phys. B Condens. Matter 192, 55 (1993).
[6] D. Tomasino, M. Kim, J. Smith, and C.-S. Yoo, Phys. Rev. Lett. 113, 205502 (2014).
[7] X. Gonze, F. Jollet, F. Abreu Araujo, D. Adams, B. Amadon, T. Applencourt, C. Audouze, J.-M.
Beuken, J. Bieder, A. Bokhanchuk, E. Bousquet, F. Bruneval, D. Caliste, M. Côté, F. Dahm, F. Da
Pieve, M. Delaveau, M. Di Gennaro, B. Dorado, C. Espejo, G. Geneste, L. Genovese, A.
Gerossier, M. Giantomassi, Y. Gillet, D. R. Hamann, L. He, G. Jomard, J. Laflamme Janssen, S.
Le Roux, A. Levitt, A. Lherbier, F. Liu, I. Lukačević, A. Martin, C. Martins, M. J. T. Oliveira, S.
Poncé, Y. Pouillon, T. Rangel, G.-M. Rignanese, A. H. Romero, B. Rousseau, O. Rubel, A. A.
Shukri, M. Stankovski, M. Torrent, M. J. Van Setten, B. Van Troeye, M. J. Verstraete, D.
Waroquiers, J. Wiktor, B. Xu, A. Zhou, and J. W. Zwanziger, Comput. Phys. Commun. 205, 106
(2016).
[8] P. E. Blöchl, Phys. Rev. B 50, 17953 (1994).
[9] M. Torrent, F. Jollet, F. Bottin, G. Zérah, and X. Gonze, Comput. Mater. Sci. 42, 337 (2008).
[10] J. P. Perdew, K. Burke, and M. Ernzerhof, Phys. Rev. Lett. 77, 3865 (1996).
[11] F. Jollet, M. Torrent, and N. Holzwarth, Comput. Phys. Commun. 185, 1246 (2014).
[12] C. Audouze, F. Jollet, M. Torrent, and X. Gonze, Phys. Rev. B - Condens. Matter Mater. Phys. 73,
(2006).
[13] S. Grimme, S. Ehrlich, and L. Goerigk, J. Comput. Chem. 32, 1456 (2011).
[14] S. Grimme, J. Antony, S. Ehrlich, and H. Krieg, J. Chem. Phys. 132, 154104 (2010).
[15] X. Wang, Y. Wang, M. Miao, X. Zhong, J. Lv, T. Cui, J. Li, L. Chen, C. J. Pickard, and Y. Ma,
Phys. Rev. Lett. 109, 175502 (2012).

116

117
SEARCH FOR XENON POLYNITROGEN
COMPOUNDS
I. INTRODUCTION
Heaviest among the stable noble gases and fifth in the seventh column of the
periodic table, xenon is an odorless and colorless gas. It exists in the atmosphere, where
it is contained in about one part per million and is retrieved from air by fractional
distillation. Due to its scarcity, xenon is one of the most expensive gases.
Part of the noble gases family, it was first thought to be a completely inert gas.
However, its electronic structure, providing it with a large number of electrons, makes it
a unique case. Indeed, with a radius of 2.16 Å, electrons further away from the xenon
nuclei ‒ namely the ones in the 5p shell ‒ are very loosely bound and susceptible to
interact, particularly with a highly electronegative atom [162]. The potential for a
chemical reaction with xenon was first demonstrated in 1962 when Neil Bartlett
produced the first ever noble gas compound: xenon hexafluoroplatinate (Xe+[PtF6]-)
[163]. Soon after, this lead to the discovery of the noble gas binary compound XeF4 by a
direct chemical reaction between Xe and F at 400°C in an atmosphere of molecular
hydrogen [164]. The compound was thoroughly characterized by a large variety of
experimental methods (single crystal X-ray and neutron diffraction, infrared and Raman
spectroscopy as well as nuclear magnetic resonance [165]) and its structure was
unambiguously determined [166,167]. Its structure is shown in Figure 1. Later, it was
understood that by slightly changing the concentrations of xenon and fluorine as well as
the reaction temperature, the XeF2 and XeF6 compounds could also be produced [168–
170]. The structure of XeF2 is also shown in Fig. 1. On the other hand, that of XeF6 is
poorly known, partially due to its six different crystalline arrangements each with large
unit cells [166,171]. After this first syntheses, a plethora of Xe-based compounds were
produced, now numbering in the tens [165,172].

118
Figure 1: Crystal structure of the xenon fluoride compounds. a) XeF2 crystallizes in a tetragonal (I41/mmm) unit cell with Xe and fluorine atoms on the 2a and 4e (z = 0.2857 Å) Wyckoff positions with Xe-F bond lengths of 1.997 Å. b) XeF4 adopts a monoclinic lattice (P21/n) with the Xe atom on the 2a Wyckoff position and the F atoms two different 4e sites, (-0.225, 0.027, -0.306) and (0.242,
0.165, -0.162). The Xe-F bond lengths are of 1.951 and 1.954.
At ambient pressure, the behavior and the properties of xenon are well
understood [165]. Its compression to extreme densities however, both as a pure
element and in a mixture, unveiled a new exciting chemistry. In the case of elemental
xenon, a reorganization of its electronic density was expected to lead to an insulator to
metal phase transition, through the pressure-induced indirect overlap of the 5p valence
and 5d conduction bands. The metallization was first calculated to occur around 200
GPa [173] and was later revised down to 128 GPa [174,175]. These predictions
generated a great deal of research activities [88,176,185,177–184]. Progressively, the
properties of xenon under compression were uncovered. At ambient temperature,
xenon solidifies at a pressure of 0.4 GPa and adopts an fcc arrangement [186]. The solid
undergoes a very sluggish martensitic phase transition from fcc to hcp starting as early
as 3 GPa [182]. Near 70 GPa, the transformation is completed and the hexagonal phase
persists at least up to 259 GPa [180,182,187]. The metallization of xenon was observed
by absorption and reflection measurements at 134 GPa [88,184], as later confirmed by
electrical conductivity data [181].
Having the pressure behavior of pure xenon mapped up allows a better
understanding of the changes induced by other atomic species. At low pressure,
mixtures of xenon with another hardly reacting entity, such as H2O, O2, N2 and H2
typically form compounds bound through weak van der Waals interaction. For these
types of compounds, it was inferred from studies on metallic alloys that their solid state
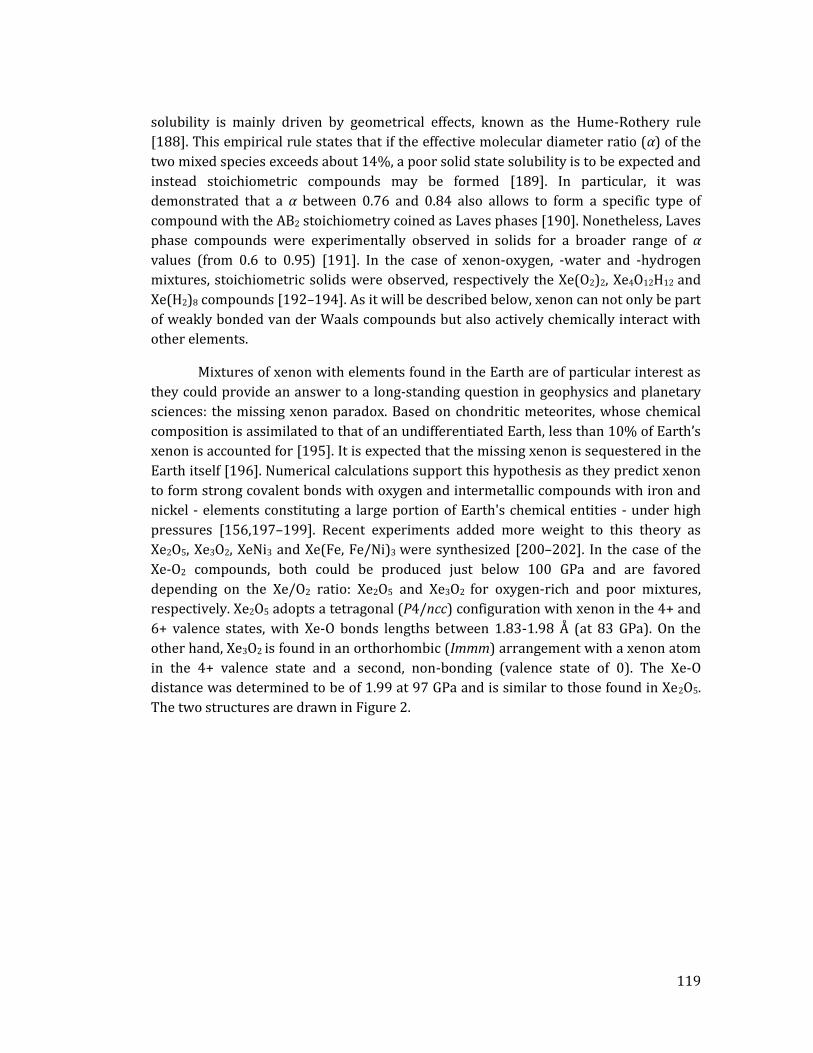
119
solubility is mainly driven by geometrical effects, known as the Hume-Rothery rule
[188]. This empirical rule states that if the effective molecular diameter ratio (α) of the
two mixed species exceeds about 14%, a poor solid state solubility is to be expected and
instead stoichiometric compounds may be formed [189]. In particular, it was
demonstrated that a α between 0.76 and 0.84 also allows to form a specific type of
compound with the AB2 stoichiometry coined as Laves phases [190]. Nonetheless, Laves
phase compounds were experimentally observed in solids for a broader range of α
values (from 0.6 to 0.95) [191]. In the case of xenon-oxygen, -water and -hydrogen
mixtures, stoichiometric solids were observed, respectively the Xe(O2)2, Xe4O12H12 and
Xe(H2)8 compounds [192–194]. As it will be described below, xenon can not only be part
of weakly bonded van der Waals compounds but also actively chemically interact with
other elements.
Mixtures of xenon with elements found in the Earth are of particular interest as
they could provide an answer to a long-standing question in geophysics and planetary
sciences: the missing xenon paradox. Based on chondritic meteorites, whose chemical
composition is assimilated to that of an undifferentiated Earth, less than 10% of Earth’s
xenon is accounted for [195]. It is expected that the missing xenon is sequestered in the
Earth itself [196]. Numerical calculations support this hypothesis as they predict xenon
to form strong covalent bonds with oxygen and intermetallic compounds with iron and
nickel - elements constituting a large portion of Earth's chemical entities - under high
pressures [156,197–199]. Recent experiments added more weight to this theory as
Xe2O5, Xe3O2, XeNi3 and Xe(Fe, Fe/Ni)3 were synthesized [200–202]. In the case of the
Xe-O2 compounds, both could be produced just below 100 GPa and are favored
depending on the Xe/O2 ratio: Xe2O5 and Xe3O2 for oxygen-rich and poor mixtures,
respectively. Xe2O5 adopts a tetragonal (P4/ncc) configuration with xenon in the 4+ and
6+ valence states, with Xe-O bonds lengths between 1.83-1.98 Å (at 83 GPa). On the
other hand, Xe3O2 is found in an orthorhombic (Immm) arrangement with a xenon atom
in the 4+ valence state and a second, non-bonding (valence state of 0). The Xe-O
distance was determined to be of 1.99 at 97 GPa and is similar to those found in Xe2O5.
The two structures are drawn in Figure 2.

120
Figure 2: Structures of the a) Xe2O5, b) Xe3O2 and c) XeNi3 compounds. The orange, purple and green atoms represent xenon, oxygen and nickel, respectively.
The synthesis of XeNi3 was done at 150 GPa by laser-heating pure nickel
embedded in xenon [201,202]. A simple cubic (Pm-3m) structure was observed,
isostructural to Cu3Au. A chemical reaction between xenon and iron was only detected
above 210 GPa, also after laser-heating the sample. The resulting X-ray diffraction
pattern seemed to indicate the synthesis of two intermetallic Xe-Fe compounds, found
in orthorhombic (Pmmn) and cubic (Pm-3m) arrangements, the latter with the same
atomic positions as XeNi3 occupied. While the experiments are not conclusive, Xe/Fe
ratios of 1:3 are suggested for both solids.
These results demonstrate both the low pressure tendency of xenon to produce
van der Waals compound and its high pressure chemical reactivity. However many
questions still remain to be answered. First, what does the binary phase diagram of Xe-
N2 looks like? Similarly to water, hydrogen and oxygen mixtures with xenon, would a
van der Waals compound be formed? If one of more compounds are formed, would they
be adequate candidates to test out chemical precompression or observe the effect of
topochemistry? Would a xenon-nitrogen chemical interaction be observed? Would it
lead to the synthesis of a polymeric Xe-N solid? If so, at what pressure? What would be
its metastability?
Already, a few tentative answers can be provided. At 5.5 GPa, xenon and
molecular nitrogen have an effective molecular diameter ratio of = 0.88. Solely from
this value, a solid-state solubility along with the formation of a van der Waals compound
could be expected. Such a compound also has been suggested to form in Xe-N2 mixtures
(35). Based on the Raman characterization of samples at 84 and 7.5 mol% of N2
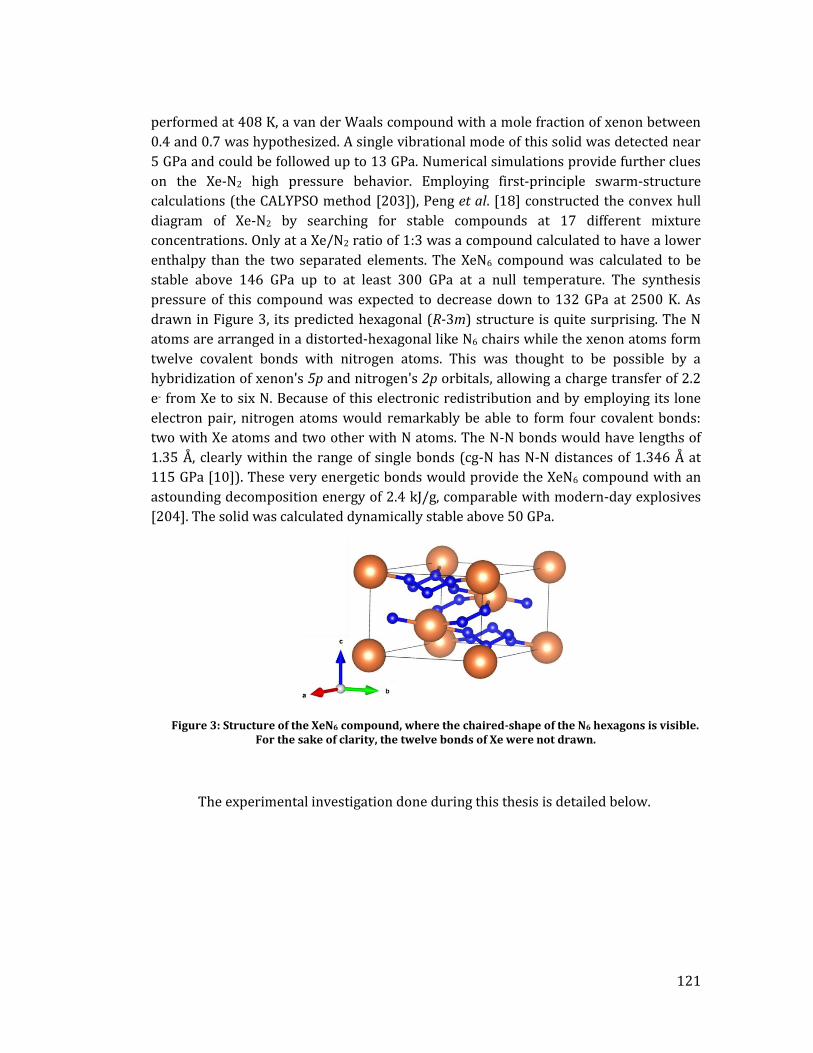
121
performed at 408 K, a van der Waals compound with a mole fraction of xenon between
0.4 and 0.7 was hypothesized. A single vibrational mode of this solid was detected near
5 GPa and could be followed up to 13 GPa. Numerical simulations provide further clues
on the Xe-N2 high pressure behavior. Employing first-principle swarm-structure
calculations (the CALYPSO method [203]), Peng et al. [18] constructed the convex hull
diagram of Xe-N2 by searching for stable compounds at 17 different mixture
concentrations. Only at a Xe/N2 ratio of 1:3 was a compound calculated to have a lower
enthalpy than the two separated elements. The XeN6 compound was calculated to be
stable above 146 GPa up to at least 300 GPa at a null temperature. The synthesis
pressure of this compound was expected to decrease down to 132 GPa at 2500 K. As
drawn in Figure 3, its predicted hexagonal (R-3m) structure is quite surprising. The N
atoms are arranged in a distorted-hexagonal like N6 chairs while the xenon atoms form
twelve covalent bonds with nitrogen atoms. This was thought to be possible by a
hybridization of xenon's 5p and nitrogen's 2p orbitals, allowing a charge transfer of 2.2
e- from Xe to six N. Because of this electronic redistribution and by employing its lone
electron pair, nitrogen atoms would remarkably be able to form four covalent bonds:
two with Xe atoms and two other with N atoms. The N-N bonds would have lengths of
1.35 Å, clearly within the range of single bonds (cg-N has N-N distances of 1.346 Å at
115 GPa [10]). These very energetic bonds would provide the XeN6 compound with an
astounding decomposition energy of 2.4 kJ/g, comparable with modern-day explosives
[204]. The solid was calculated dynamically stable above 50 GPa.
Figure 3: Structure of the XeN6 compound, where the chaired-shape of the N6 hexagons is visible. For the sake of clarity, the twelve bonds of Xe were not drawn.
The experimental investigation done during this thesis is detailed below.
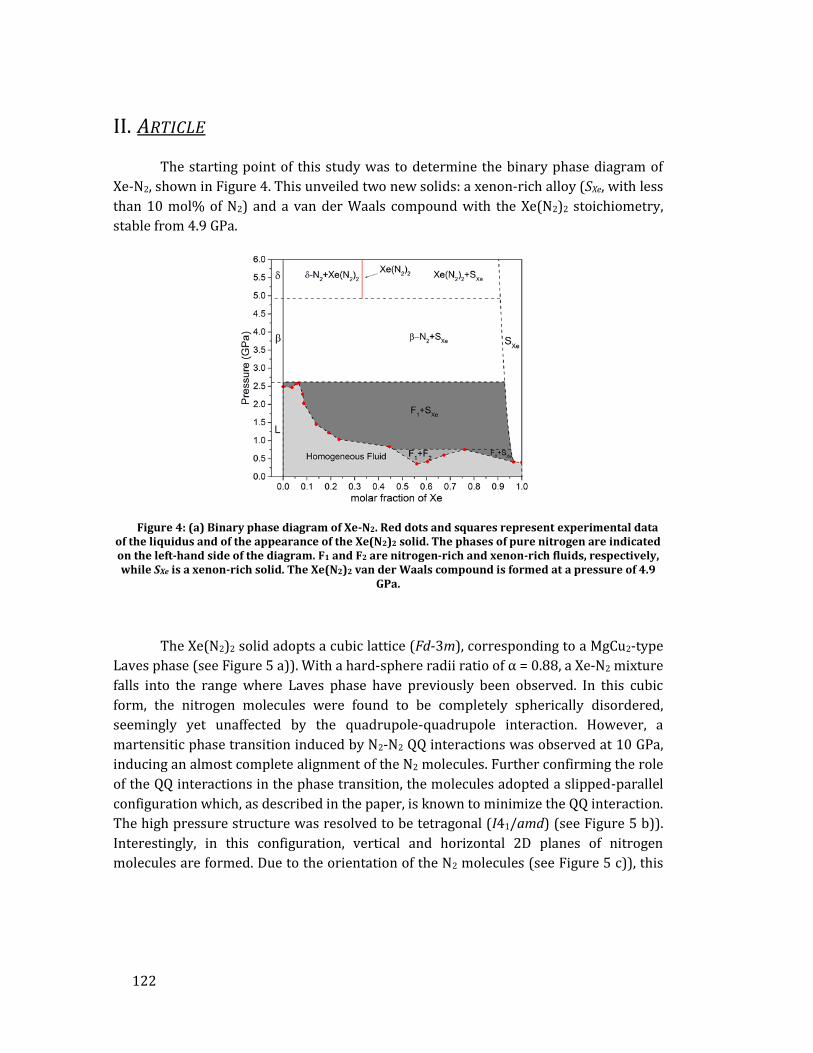
122
II. ARTICLE
The starting point of this study was to determine the binary phase diagram of
Xe-N2, shown in Figure 4. This unveiled two new solids: a xenon-rich alloy (SXe, with less
than 10 mol% of N2) and a van der Waals compound with the Xe(N2)2 stoichiometry,
stable from 4.9 GPa.
Figure 4: (a) Binary phase diagram of Xe-N2. Red dots and squares represent experimental data of the liquidus and of the appearance of the Xe(N2)2 solid. The phases of pure nitrogen are indicated on the left-hand side of the diagram. F1 and F2 are nitrogen-rich and xenon-rich fluids, respectively, while SXe is a xenon-rich solid. The Xe(N2)2 van der Waals compound is formed at a pressure of 4.9
GPa.
The Xe(N2)2 solid adopts a cubic lattice (Fd-3m), corresponding to a MgCu2-type
Laves phase (see Figure 5 a)). With a hard-sphere radii ratio of α = 0.88, a Xe-N2 mixture
falls into the range where Laves phase have previously been observed. In this cubic
form, the nitrogen molecules were found to be completely spherically disordered,
seemingly yet unaffected by the quadrupole-quadrupole interaction. However, a
martensitic phase transition induced by N2-N2 QQ interactions was observed at 10 GPa,
inducing an almost complete alignment of the N2 molecules. Further confirming the role
of the QQ interactions in the phase transition, the molecules adopted a slipped-parallel
configuration which, as described in the paper, is known to minimize the QQ interaction.
The high pressure structure was resolved to be tetragonal (I41/amd) (see Figure 5 b)).
Interestingly, in this configuration, vertical and horizontal 2D planes of nitrogen
molecules are formed. Due to the orientation of the N2 molecules (see Figure 5 c)), this

123
structure was though to favor their polymerization on account of the topochemical
principle.
Figure 5: a) Cubic structure of Xe(N2)2, formed at 4.9 GPa. The nitrogen molecules are spherically disordered are so are drawn as blue spheres. b) Tetragonal structure of Xe(N2)2, formed at 10 GPa.
The cubic to tetragonal phase transition is explained by the almost complete alignment of the N2 molecules, on account of QQ interaction. c) Tetragonal structure of Xe(N2)2, with the horizontal N2
planes evidenced.
Upon further compression, the chemical precompression exerted by the xenon
atoms was found to be significant: at only 30 GPa, the nitrogen molecules were behaving
as those in the pure compound at about 80 GPa [57]. This was deduced from the close-
to identical N2-N2 intermolecular distances in Xe(N2)2 at 30 GPa compared to those in
pure N2 at 80 GPa as well as from the beginning of the Xe(N2)2 N2 vibron’s red shift (see
Figure 6). As explained in the section relating to pure molecular nitrogen, the red shift is
indicative of the weakening of the N2 intramolecular bond due to an electron charge
transfer, shifting part of the triple-bond electron cloud towards intermolecular N2-N2
gaps. In turn, this causes an increase in the N2 dimer’s length and a shortening of the
intermolecular distances. Based on the measurable precompression effect as well as the
nitrogen molecule planes favoring topochemistry, a transformation either into the
predicted XeN6 structure or into a polymeric phase not predicted by the calculations,
could reasonably be expected. Surprisingly, at no point up to 154 GPa did the N2
molecules split apart, even after laser-heating the samples up to 2000 K. This is
especially unexpected as the N2 molecule triple-bond, through its vibrons frequency, is
known to be weaker than in pure N2, which polymerizes at 110 GPa and above 2000 K.
Thus, the only logical conclusion is that a Xe-N chemical interaction is stabilizing the
Xe(N2)2 compound and impeding a chemical transformation. This hypothesis is
supported by further arguments in the following paper.

124
Figure 6: Raman shift of N2 vibron modes in different solids with respect to pressure. Data were obtained from mixtures with concentrations between 11 and 30 mol % Xe. The red squares and blue circles were obtained from SXe and Xe(N2)2, respectively. The black dashed and dotted lines are the
pure N2 vibrational modes taken from references [142] and [5], respectively.
These results are published in the journal Physical Review B in an article titled
“Xe(N2)2 compound up to 150 GPa: Reluctance to the formation of a xenon nitride”.
Simultaneously to the publication of this paper, R. Howie et al. as well as Niwa et al.
reported similar results in Scientific Reports and in the Journal of Physical Chemistry and
Chemical Physics, respectively [205,206].
This first study of Xe-N2 mixtures was a clear demonstration of the significant impact of chemical precompression on the N2 molecules by an atom with a much larger atomic volume. Moreover, the tetragonal structure of the Xe(N2)2 compound, found above 10 GPa, favored a polymerization of the nitrogen molecules on account of the topochemical principle. Nonetheless, a significant chemical interaction between Xe and N2 was observed to stabilize the tetragonal structure and prevent the formation of an extended network. If xenon were to have been replaced by a similar-sized element that could have transferred a portion of its electronic density to the nitrogen atoms (an element with a lower ionisation energy), such as an alkali, an alkaline earth or transition metal, perhaps this could have been a sufficient push to break apart the nitrogen molecules and induce polymerization at low pressures (∼ 60 GPa).
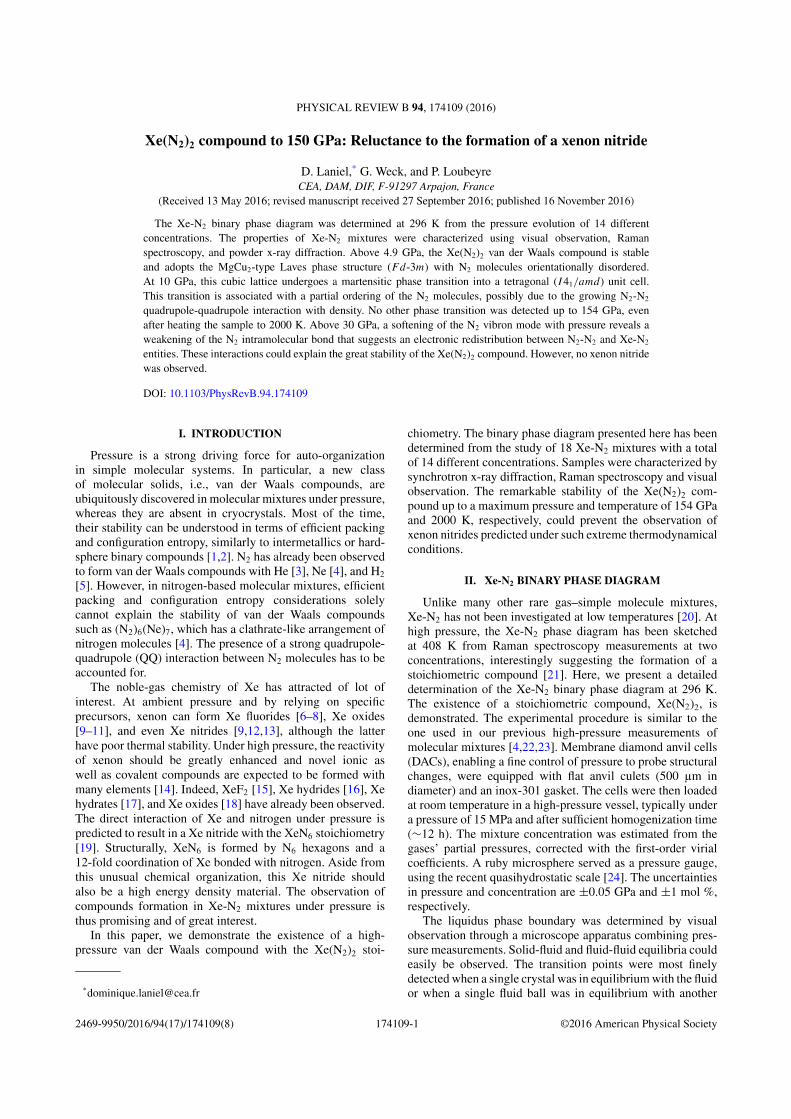
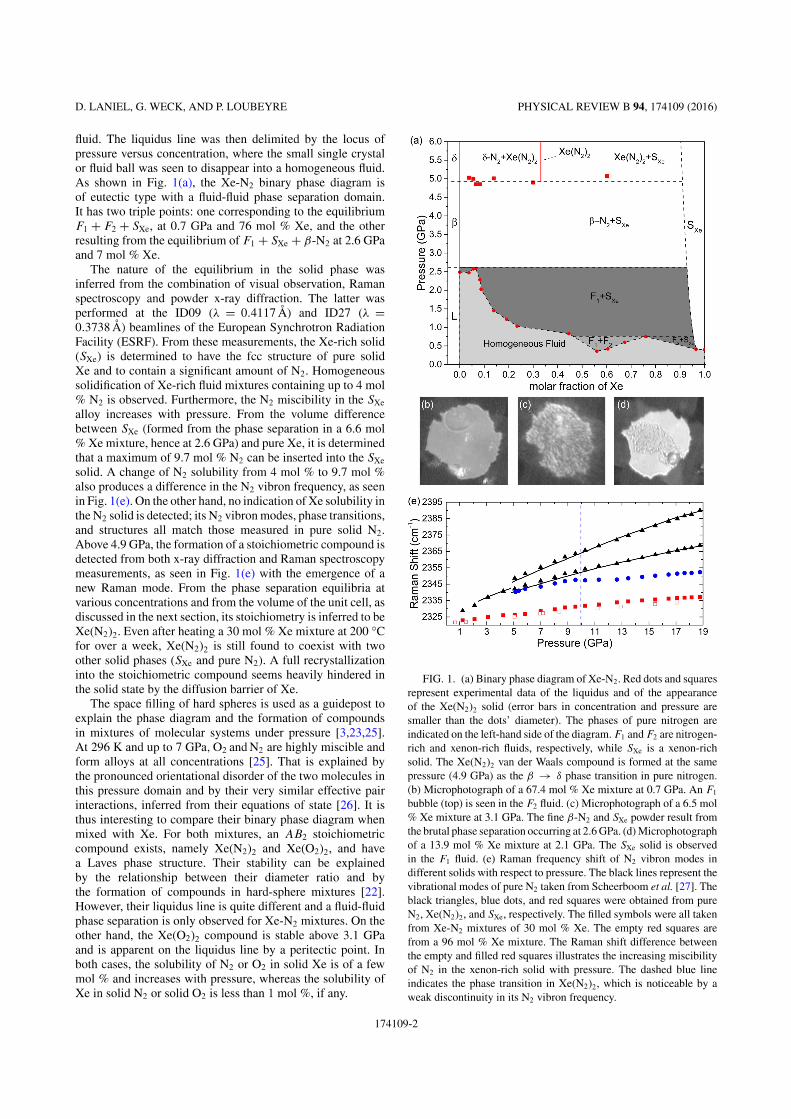


133
III. CHEMICAL REACTION IN THE XE-N SYSTEM
In the presented article, the Xe(N2)2 compound was studied up to 154 GPa and
2000 K. Surprisingly, no chemical reaction was observed under these conditions, even
though the N2 molecule is greatly weakened and that numerical calculations show XeN6
to be much more stable. The lack of chemical reaction in Xe(N2)2 was also reported
elsewhere, even after heating to 2000 K at 180 GPa [205]. In both cases, the heating of
the Xe(N2)2 compound only served to release some of the strain within the crystal, as
deduced from the thinning of the X-ray diffraction peaks. The unsuspected stability of
the Xe(N2)2 compound thus seemed to hinder a possible chemical reaction towards a
xenon polynitrogen solid. However, later experiments revealed that while impeding a
transformation, it did not completely prohibit it. A few low intensity peaks, later
assigned to a xenon polynitrogen compound, were observed after extensive sample
laser-heating (> 1 hour at 2500 K). These peaks, marked by asterisks in Figure 7, clearly
evidence the new phase to be in minority with respect to Xe(N2)2. That sample,
previously laser-heated at 128 GPa, also has diffraction peaks belonging to cg-N (later
confirmed by Raman spectroscopy measurements). The previous laser-heating explains
the high powder quality along with the narrow peaks at 148 GPa.
The necessity for prolonged laser-heating to transform the sample indicates a
large activation barrier between the two phases causing a low reaction rate. As such,
higher temperatures could help increase the reaction rate. Another approach would
consist on avoiding having Xe(N2)2 as a reactant, hoping for a lower energetic barrier
between a pure Xe as well as pure N2 mixture and the new Xe-N phase.

134
Figure 7: a) Image plates recorded from the X-ray diffraction of a 5 mol% Xe Xe-N2 sample before (left, 148 GPa) and after (right, 174 GPa) laser-heating. The most intense diffraction spots belong to
the diamond anvils. b) Integrated X-ray diffraction patterns before and after laser-heating. The bottom diffractogram shows many peaks consistent with Xe(N2)2 (shown by tick marks). The upper
diffractogram has new peaks appearing after laser-heating that are indicated by asterisks. The lozenges mark cg-N diffraction peaks, arising from a previous sample laser-heating at 128 GPa, also
observed from Raman spectroscopy.
It was thus first attempted to circumvent the formation of the van der Waals
compound to see if a higher proportion of the sample would transform at high
pressures and temperatures. To achieve this, the Xe-N2 fluid was fast compressed,
hoping that xenon's high viscosity would prevent a significant diffusion, necessary to
form the Xe(N2)2 compound. The rapid compression was achieved by closing the
microvalve linking the DAC's membrane to the electronic pressure controller,
increasing the latter's pressure by about 50 bars and then opening the microvalve. In
doing so, the pressure increment was done in a fraction of a second. Figure 8 shows the
sample before and after such a compression.

135
Figure 8: Xe-N2 sample a) before and b) after its rapid compression. The microvalve was opened with a pressure difference of 50 bars between the membrane and the pressure controller. The
sample pressure jumped from 0.6 GPa to 76.3 GPa.
X-ray diffraction measurements validated this approach: after the rapid sample
compression, the diffraction peaks of Xe(N2)2 were not detected but instead, those of
pure xenon were observed. Laser-heating this sample at 169 GPa to 2500 K gave rise to
new diffraction peaks correlated with the decrease in intensity of those belonging to
pure Xe, as seen in Figure 9 a). Unfortunately, the resulting diffraction pattern still
contained the Xe(N2)2 compound as the majority phase. However, the previously
observed diffraction peaks belonging to the new Xe-N solid were found to be slightly
more intense and better defined. Illustrated in Figure 9 b), these cannot be explained by
the theoretically predicted XeN6, polymeric phases of pure nitrogen (cg-N and LP-N) or
pure xenon [10,17,18,187]. The unexplained diffraction lines 2θ position are plotted
with pressure in Figure 9 c), down to 70 GPa. Only the peaks observed from multiple
samples are shown. The full d-spacing table can be found in the Annex section.
Depending on the sample preparation and, in particular, if a thin chemically and
thermally insulating layer of either LiF or Al2O3 was covering the diamond anvils,
parasitic diffraction lines were observed. In particular, the Al2O3 layer which is
amorphous at first, was found to recrystallize in two of its high pressure polymorphs
after laser-heating it above 2000 K at pressure exceeding 140 GPa, thus generating
many new unwanted diffraction peaks [207]. This was unfortunate as it seemingly
provided for the highest fraction of reacted sample along with good powder quality. The
various experimental runs are summarized in Table 1. As seen, the lowest temperature
to achieve at chemical reaction was 2000 K, using an insulating layer on the diamond
anvils. It was also attempted to heat the sample above 3000 K but it very often resulted
in the shattering of the diamond anvils. The effect of the sample concentration is
discussed further below.
Based on the information gathered from the X-ray diffraction characterization,
the new solid has a large lattice as deduced by the low angle diffraction lines, namely at
7.73 Å and 5.36 Å in d-spacing. Moreover, a difference in texture between the
unassigned diffraction peaks was observed from several, but not all, reacted samples

136
and would suggests that two new phases, and not just one, have been synthesized along
with Xe(N2)2. This is reminiscent of the high pressure and high temperature xenon-poor
Xe3O2 and xenon-rich Xe2O5 compound formed from Xe-O2 mixtures [200]. Combined
with the presence of intense Xe(N2)2 diffractions lines, surely overlapping weaker peaks
of the new phase, an indexation of the newly produced compound(s) is still ongoing.
However, as detailed below, complementary Raman spectroscopy measurements
provided further critical information on both the chemical composition of the reacted
compound and on its stoichiometry.
Figure 9: a) Quarter of diffraction image plates obtained on a fast-compressed 19 mol% Xe Xe-N2 sample without an insulating layer before (left) and after (right) laser-heating to 2800 K at 169 GPa. After laser-heating, very large and diffuse diffraction spots belonging to xenon can still be observed. b) Integrated image plate with tick lines corresponding to Xe(N2)2, XeN6, cg-N and LP-N [10,17,18], all
at 155 GPa. While many diffraction lines are explained by Xe(N2)2, many new peaks are left unexplained by known phases. c) Pressure evolution of the newly-obtained diffraction lines, drawn
as empty black circles. Only those observed from more than one sample were plotted. The empty red circles mark the theoretically calculated diffraction lines for the XeN6 structure.
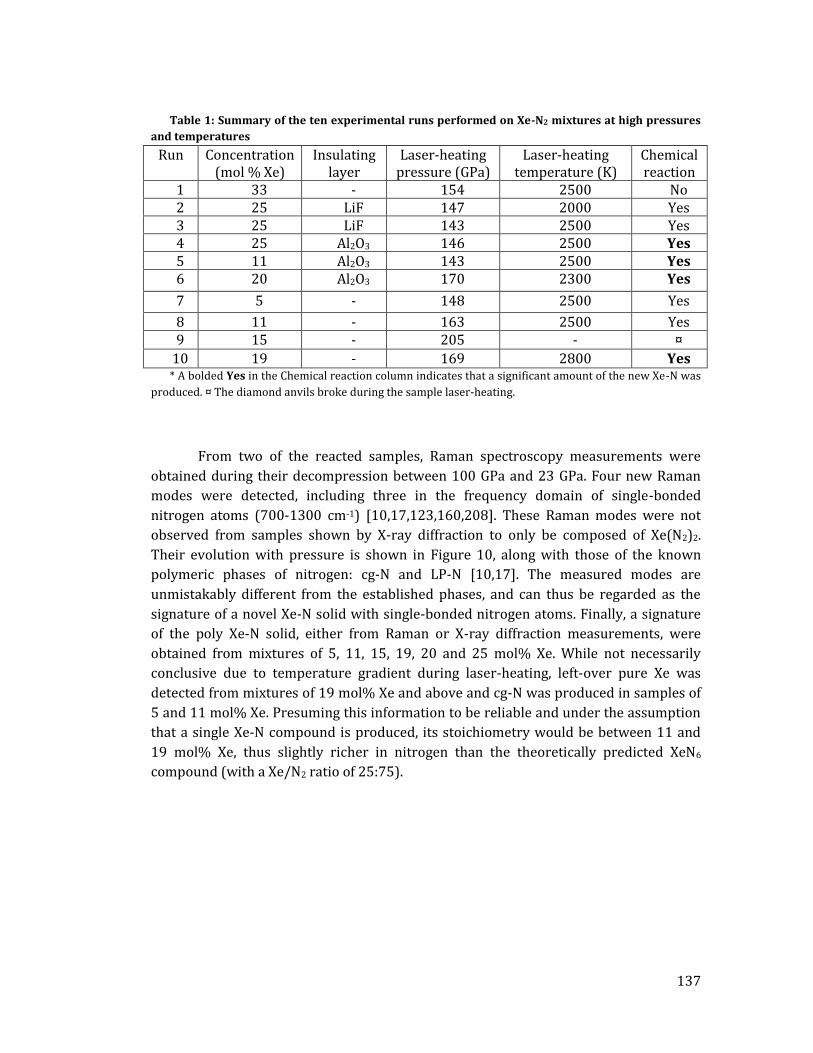
137
Table 1: Summary of the ten experimental runs performed on Xe-N2 mixtures at high pressures
and temperatures
Run Concentration (mol % Xe)
Insulating layer
Laser-heating pressure (GPa)
Laser-heating temperature (K)
Chemical reaction
1 33 - 154 2500 No 2 25 LiF 147 2000 Yes 3 25 LiF 143 2500 Yes 4 25 Al2O3 146 2500 Yes 5 11 Al2O3 143 2500 Yes 6 20 Al2O3 170 2300 Yes
7 5 - 148 2500 Yes
8 11 - 163 2500 Yes 9 15 - 205 - ¤
10 19 - 169 2800 Yes * A bolded Yes in the Chemical reaction column indicates that a significant amount of the new Xe-N was
produced. ¤ The diamond anvils broke during the sample laser-heating.
From two of the reacted samples, Raman spectroscopy measurements were
obtained during their decompression between 100 GPa and 23 GPa. Four new Raman
modes were detected, including three in the frequency domain of single-bonded
nitrogen atoms (700-1300 cm-1) [10,17,123,160,208]. These Raman modes were not
observed from samples shown by X-ray diffraction to only be composed of Xe(N2)2.
Their evolution with pressure is shown in Figure 10, along with those of the known
polymeric phases of nitrogen: cg-N and LP-N [10,17]. The measured modes are
unmistakably different from the established phases, and can thus be regarded as the
signature of a novel Xe-N solid with single-bonded nitrogen atoms. Finally, a signature
of the poly Xe-N solid, either from Raman or X-ray diffraction measurements, were
obtained from mixtures of 5, 11, 15, 19, 20 and 25 mol% Xe. While not necessarily
conclusive due to temperature gradient during laser-heating, left-over pure Xe was
detected from mixtures of 19 mol% Xe and above and cg-N was produced in samples of
5 and 11 mol% Xe. Presuming this information to be reliable and under the assumption
that a single Xe-N compound is produced, its stoichiometry would be between 11 and
19 mol% Xe, thus slightly richer in nitrogen than the theoretically predicted XeN6
compound (with a Xe/N2 ratio of 25:75).

138
Figure 10: a) Evolution with pressure of the Raman modes of the reacted Xe-N compound along with those of the cg-N and LP-N phases [10,17]. b) Raman spectra of the reacted Xe-N solid at various
pressures, offsetted for clarity. The asterisks mark the detected Raman peaks.
The comparison between the high pressure studies of Xe-O2 and Xe-N2 mixtures
is interesting. In the Xe-O2 system, the XeO, XeO2 and XeO3 compounds were calculated
as stable at high pressures [198]. While experiments indeed observed a transformation
at high pressure, the obtained compounds do not match the structure or stoichiometry
of those predicted. Further calculations were able to find the experimentally observed
compounds (Xe2O5 and Xe3O2) only after considering more stoichiometries, searching
for larger unit cells and determining the proper functional for xenon oxides [200]. While
theoretical calculations on the Xe-N2 system were performed for many stoichiometries
(16), it is possible that the right stoichiometry might have been missed or that, due to
limitations on the unit cell size or improper functional choice, the right compound(s)
did not come out as stable.
Thus, while further theoretical and experimental studies might be needed to
fully resolve the structural characterization of this solid, the results presented here are
certainly promising and should be insightful for future work.

139
SERIES OF CHEMICAL
TRANSFORMATIONS IN THE N2-H2
SYSTEM
I. INTRODUCTION
Composed of a single proton and electron, hydrogen is the lightest of all
elements and is by far the most abundant element in the Universe. Gaseous under
ambient conditions, its pure stable form is dihydrogen (H2) constituted of a single
covalent bond binding the two atoms together.
In its pure form, H2 has attracted a significant interest in the field of high
pressure physics. In 1935, Wigner and Huntington predicted that at very high
pressures, molecular hydrogen would atomize and become metallic [209]. While the
metallization pressure was first set to 25 GPa ‒ an incredibly high pressure to achieve at
the time of this first prediction ‒ it is now expected around 450 GPa [210]. Only after
the forecast of room temperature superconductivity, along with its metastability back to
ambient conditions [211], was the intense research for the synthesis of metallic
hydrogen initiated. While reports of its metallization have been announced several
times, none stood the rigorous scrutiny of the research community [212–215].
Supposing the metastability calculations to hold true and not taking into account the
astounding pressure needed to produce it, metallic hydrogen is expected to be an
incredible propellant (Isp = 1700 s in vacuum) on account of its high density, moderate
molecular recombination energy and low mass of the reaction products [216].
140
Of special interest here is the particularly rich nitrogen-hydrogen chemistry. At
ambient conditions, a wide variety of stable and metastable compounds are known to
exist, namely ammonia (NH3), hydrazine (N2H4) ‒ both part of the azane family (NnH2+n)
‒, diezene (N2H2), triazene (N3H3), tetrazene (N4H4), hydrogen azide (HN3) as well as
ammonium azide ((NH4)(N3)) [217]. With the exception of ammonia, all of these
compounds are metastable. Furthermore, hydrazine is the ambient conditions highest
energy density compound due to the single bond between its nitrogen atoms and its
relatively high density (1.024 g/cm3 at 2 °C) [218]. While its energy density is not
sufficient for it to be considered as a good explosive, the weight of its reaction products
allows for a moderate Isp (220 s in vacuum). For its simplicity of use and preparation, it
is found on more than 50 satellites' thrusters and is expected to continue to be utilized
[219]. The synthesis of longer metastable azanes, thus with a greater concentration of
single-bonded N-N atoms, would certainly be of interest as a propellant. By traditional
chemical methods, triazane (N3H5) is the longest azane to be produced, although it was
found highly unstable [217,220].
Pressure opens up another route to produce novel hydronitrogen compounds,
including longer azanes. The Haber-Bosch process is an example of the outstanding
potential of high pressure to observe nitrogen-hydrogen chemistry. In 1909, the two
German scientists first demonstrated in a small-scale setup how the very strong
nitrogen molecule could be broken up and chemically react with molecular hydrogen at
pressures and temperatures above 25 MPa and 400°C to produce ammonia, through the
help of an osmium catalyst. Later, the process was refined and optimized for industrial
production, instead opting for the less expensive iron catalyst doped with K2O, Al3O3,
SiO2 and CaO along with lower pressure-temperature requirements [39]. This discovery
was of tremendous importance, first of all since the synthesized ammonia, used
massively as fertilizer, revolutionized agriculture as well as helped end famines in
Europe and secondly, as a demonstration of the role of the pressure parameter to
permit the exploration of new chemical interactions.

141
Figure 1: a) Nitrogen-hydrogen enthalpy binary phase diagram, reproducd from Ref. [21]. N-H compounds predicted on the enthalpy convex hull, of stoichiometry b) N4H, c) N3H, d) N9H4 and e) NH (tetrazene). The blue and green spheres represent nitrogen and hydrogen atoms, respectively.
In a little more than a century, the understanding of the hydronitrogen
chemistry has drastically improved. Several of the ambient conditions metastable N-H
compounds along with pure N2-H2 mixtures have been experimentally characterized at
high densities [24,25,225–230,26,126,160,208,221–224] while theoretical calculations
predicting new pressure-stabilized stoichiometries and phases were performed [19–
23]. Of particular interest are the two calculated enthalpy convex hulls, each from a
different group, as they nicely summarize what theory expects at any N-H concentration
and pressure. While different sets of calculations do not completely agree, they do
illustrate similar tendencies. They are shown in Figure 1 and Figure 2. First, they show
that ammonia is the sole stable hydronitrogen compound at least up to 15 GPa. While
this changes at 30 GPa, NH3 stays on the enthalpy convex hull up to 470 GPa, pressure at
which it decomposes into more stable compounds [21]. However, it is expected undergo
an autoionisation between 36-90 GPa with half of the NH3 molecules losing a hydrogen
nucleus (proton) to the other half, thus forming the ionic compound (NH2-)(NH4+)
[21,231]. Second, they both display between 30 and 60 GPa many new intriguing
compounds appearing on the convex hull. Indeed, in the first published set of
calculations, five solids with stoichiometries of N4H, N3H, N9H4, NH and NH4 anticipated
stable, as shown in in Figure 1 [21]. These compounds are all constituted of
polynitrogen sublattices of different lengths, with the exception of the NH4
stoichiometry solid, made up of NH3 and H2 molecules. Also, the NH stoichiometry
compound corresponds to the known ambient conditions metastable N4H4 tetrazene,
crystallized in a monoclinic P21/c lattice. According to the second ‒ and most recent ‒
set of calculations (see Figure 2), two pentazolate (N5-) anion-based solids are stable at
60 GPa, one stabilized through an ammonia cation (NH4+) and the other solely by an
proton (H+) [23]. These structures are drawn in Figure 2. The authors report these
compounds to have a sufficiently low enthalpy such that the previously predicted

142
compounds no longer appear on the N-H enthalpy convex hull. This assertion is
supported by recent theoretical predictions of stable pentazolate arrangements in most
alkali-nitrogen mixtures [28,29,47,232] and the experimental synthesis of the CsN5 [48]
and LiN5 compounds [233]. It is worth noting that hydrazine, although metastable at
ambient conditions, never appears on the enthalpy convex hull until slightly over 200
GPa [21].
Figure 2: Nitrogen-hydrogen enthalpy binary phase diagram, reproduced from Ref. [23]. The solids’ stoichiometry is a) N5H and b) N3H2. The blue and green spheres represent nitrogen and
hydrogen atoms, respectively.
These predictions may be compared with experiments recently performed on
several hydronitrogen compounds. Regarding ammonia, its stability against
decomposition up to 183 GPa was demonstrated [229]. Furthermore, the molecules
were established to autoionize between 120-150 GPa [224,229], pressures exceeding
the value theoretically calculated (between 30-90 GPa). This small discrepancy is
attributed to the temperature and entropy contributions which are not accounted for in
the enthalpy-based numerical predictions (as they are performed at T = 0 K). Upon
decompression, ionized ammonia reverts back to its molecular form around 100 GPa
[224,229].
Hydrazine was also the subject of experimental investigations up to 46.5 GPa.
After its crystallization in a monoclinic (P21) solid at 1.2 GPa, it undergoes two
structural transformations: at 2.4 GPa into another monoclinic lattice followed by an
isostructural phase transition at 18.4 GPa, both ascribed to minor modifications of the
intermolecular H-H bonds [160]. Other experiments performed on hydrazine evidenced
its metastability at pressures of 3.5 and 5.0 GPa, as a prolonged white X-ray beam
irradiation resulted in its dissociation into NH3 and N2 [208]. Finally, the last of the
ambient conditions’ metastable hydronitrogen compound to have been studied under
pressure is ammonium azide. While theoretical papers predicted it to transition into an
intriguing (NH)4 stoichiometry phase constituted of one-dimensional single-bonded
nitrogen chains capped with hydrogen atoms at 36 GPa [20], the experimental results
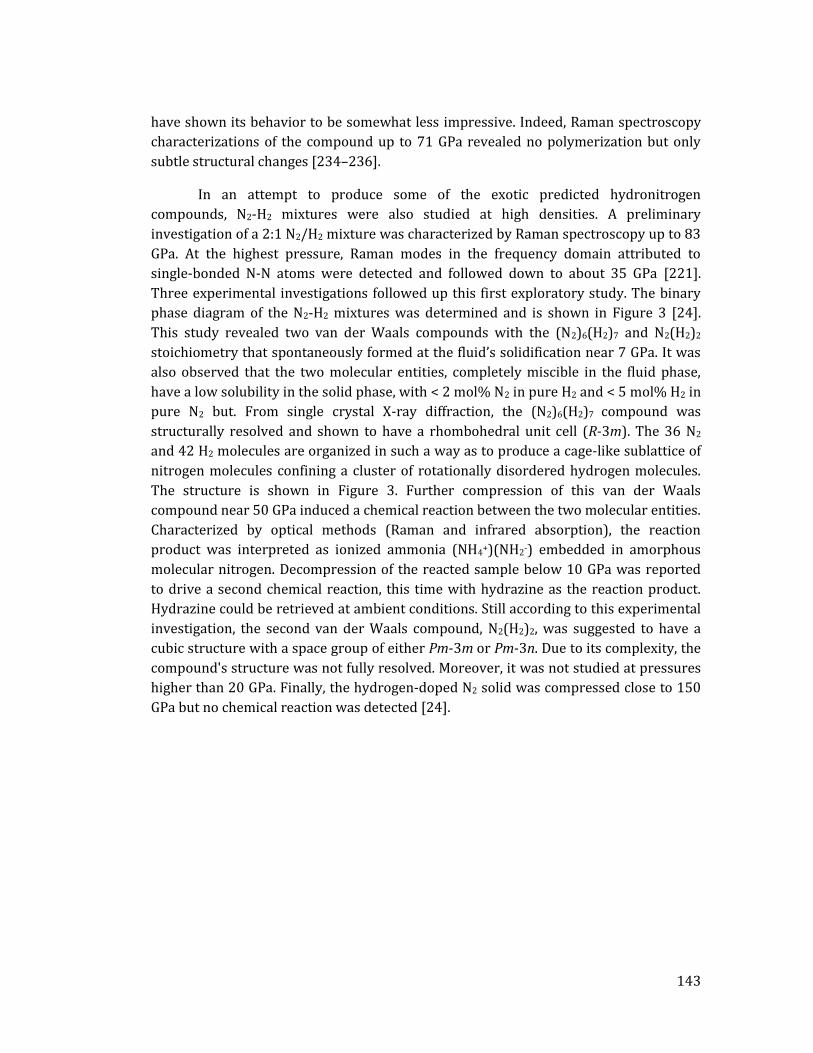
143
have shown its behavior to be somewhat less impressive. Indeed, Raman spectroscopy
characterizations of the compound up to 71 GPa revealed no polymerization but only
subtle structural changes [234–236].
In an attempt to produce some of the exotic predicted hydronitrogen
compounds, N2-H2 mixtures were also studied at high densities. A preliminary
investigation of a 2:1 N2/H2 mixture was characterized by Raman spectroscopy up to 83
GPa. At the highest pressure, Raman modes in the frequency domain attributed to
single-bonded N-N atoms were detected and followed down to about 35 GPa [221].
Three experimental investigations followed up this first exploratory study. The binary
phase diagram of the N2-H2 mixtures was determined and is shown in Figure 3 [24].
This study revealed two van der Waals compounds with the (N2)6(H2)7 and N2(H2)2
stoichiometry that spontaneously formed at the fluid’s solidification near 7 GPa. It was
also observed that the two molecular entities, completely miscible in the fluid phase,
have a low solubility in the solid phase, with < 2 mol% N2 in pure H2 and < 5 mol% H2 in
pure N2 but. From single crystal X-ray diffraction, the (N2)6(H2)7 compound was
structurally resolved and shown to have a rhombohedral unit cell (R-3m). The 36 N2
and 42 H2 molecules are organized in such a way as to produce a cage-like sublattice of
nitrogen molecules confining a cluster of rotationally disordered hydrogen molecules.
The structure is shown in Figure 3. Further compression of this van der Waals
compound near 50 GPa induced a chemical reaction between the two molecular entities.
Characterized by optical methods (Raman and infrared absorption), the reaction
product was interpreted as ionized ammonia (NH4+)(NH2-) embedded in amorphous
molecular nitrogen. Decompression of the reacted sample below 10 GPa was reported
to drive a second chemical reaction, this time with hydrazine as the reaction product.
Hydrazine could be retrieved at ambient conditions. Still according to this experimental
investigation, the second van der Waals compound, N2(H2)2, was suggested to have a
cubic structure with a space group of either Pm-3m or Pm-3n. Due to its complexity, the
compound's structure was not fully resolved. Moreover, it was not studied at pressures
higher than 20 GPa. Finally, the hydrogen-doped N2 solid was compressed close to 150
GPa but no chemical reaction was detected [24].

144
Figure 3: a) Binary phase diagram of N2-H2, reproduced from ref. 19. b) Crystal structure of the (N2)6(H2)7 van der Waals compound. The blue and green spheres represent nitrogen and hydrogen
atoms, respectively.
These results somewhat contrast with the two other experimental studies that
followed. In those, N2-H2 powders with concentrations of 5, 10, 20, 50 and 80 mol% N2
were compressed to 60 GPa and characterized by both X-ray diffraction and Raman
spectroscopy [25,26]. While the composition of these powders was reported to differ
from the pure compounds, they were not identified. However, based on the known
binary phase diagram of N2-H2, they are expected to be composed of the H2-rich, N2-rich,
N2(H2)2 or (N2)6(H2)7 solids or a mixture of these, depending of their concentration. In
any case, the powders were all found to chemically react near 50 GPa and to all have
similar spectroscopic signatures to those obtained from the (N2)6(H2)7 solid. Supported
by numerical calculations, the reaction products of the reacted powders were ascribed
to azane chains of various lengths (polymers from N2H4 to N6H8) or tetrazene [25,26].
On decompression, these reaction products were also found to produce hydrazine.
Hereafter we present a study of the N2(H2)2 compound under pressure. This
investigation mainly aimed at synthesizing novel, possibly energetically-rich
hydronitrogen compounds. As the (N2)6(H2)7 and N2-H2 powders reportedly did not
yield the same reaction products, it was deduced that if solids with N-N single bonds
were produced in the powders, they should form from the N2(H2)2 van der Waals
compound. Indeed, pure N2 doped with H2 molecules and (N2)6(H2)7 were shown not to
react at least up to 150 GPa and to produce ionized ammonia at 50 GPa, respectively.
Secondary objectives were to 1) determine the complex structure of the N2(H2)2
compound, 2) validate that the van der Waals compounds composed the N2-H2 powders
and, 3) supposing a chemical reaction to also occur in the N2(H2)2 compound, to provide
a better understanding of its reaction products. The achieve the latter point, a
145
homogeneous N2(H2)2 sample (such as a single crystal) was deemed preferable as it
provides intrinsic advantages to the determination of the chemical entities formed after
a chemical reaction. With a known before reaction stoichiometry, left-over molecular N2
or H2 would allow to distinguish if NH3 or N–H oligomers and polymers were primarily
synthesized after the chemical reaction. Moreover, a single crystal would make it easier
to resolve the compound's structure. Finally, the objectives 2) and 3) would allow to
solve the points of contention between previous experimental studies of N2-H2 mixtures
[24–26].
II. ARTICLE
The results of this study were published in the Journal of Physical Chemistry and
Chemical Physics in an article titled “Pressure-induced chemical reactions in the N2(H2)2
compound: from the N2 and H2 species to ammonia and back down into hydrazine”. In this
article, it is first shown that by single crystal X-ray diffraction, the complex and
previously-unsolved crystal structure of the N2(H2)2 van der Waals compound was
resolved. The difficulties to determine the structure were mainly a) its very large unit
cell (2007.10 Å3 at 9.1 GPa), thus containing many atoms, b) a sharp decrease of the X-
ray diffraction spots observed intensities as a function of the diffraction angle and c) the
very low intensity diffraction spots produced by the H2 molecules. The structure, shown
in Figure 4, contains 41 N2 molecules and 82 H2 molecules. Similarly to pure nitrogen
and van der Waals compounds containing N2 (such as Xe(N2)2 and (N2)6(H2)7), the
nitrogen molecules were found to be significantly rotationally disordered. This is
interpreted to have resulted in the observed drop of diffraction spots intensity with the
diffraction angle. Attempting to employ previously-reported methods to model the
rotational disorder, such as adding differently oriented nitrogen molecules on the same
N2 center of mass (while correcting for the occupancy) [125], did not succeed as it
resulted in an overfitting of the experimental data. Thus, the disorder was modeled by
considering the N2 molecules as Si atoms (also having 14 electrons) and introducing
anharmonic anisotropic displacement parameters (ADP). The ADP is typically used to
represent the thermal motion of an atom. In this fashion, the number of fitting
parameters was considerably reduced and the center of mass position as well as
orientation of the nitrogen molecules (Si atoms) could be resolved. Unfortunately, the
position of the hydrogen molecules could not be determined because of the limited X-
ray diffraction data.

146
Figure 4: N2 arrangement of the N2(H2)2 compound. (a) A single unit cell in the wireframe representation. The outer scaffold (b) confines the inner portion (c), both of which are drawn with
the Si atoms simulating the N2 molecules. The rotational disorder of the nitrogen molecules (modelled by Si atoms with anharmonic anisotropic displacement parameters) is shown in b) and
c).
Given that the structure for the N2(H2)2 compound was found, it is tempting to
see if it is a good contender for topochemistry. The outer scaffold of the structure, as
seen in Figure 4 b), seems to suggest that long polymeric chains could be obtained upon
further compression. However, a definite analysis requires the structure evolution with
pressure and, more specifically, the knowledge of the N2 molecules' orientation once the
rotational disorder has subsided at higher pressures. Indeed, as found in pure nitrogen,
increase the pressure typically forces the molecules to align which can lead to important
structural changes (hence the multiple phase transitions in pure N2). Unfortunately, the
N2(H2)2 compound was not characterized by X-ray diffraction at higher pressures. The
single crystal's quality would have rapidly deteriorated and, especially with the complex
arrangement of the compound, would no longer have allowed to resolve the structure.
Instead, the N2(H2)2 compound was characterized by Raman spectroscopy up to
55 GPa, pressure at which a chemical reaction spontaneously initiates. This comes
somewhat as a surprise since, based on the evolution of the Raman modes with
pressure, there is no sign of a chemical interaction between the N2 and H2 entities nor of
a weakening of the N2 molecule. Coming back to the high pressure investigations of pure

147
N2 and of the Xe(N2)2 compound, a chemical interaction between N2-N2 or Xe-N2 entities
is detected through the sudden redshift of the N2 vibrons. Moreover, this redshift is also
assimilated to a weakening of the N2 molecule, and still intense laser-heated is required
to break apart the N2 triple bond and overcome the kinetic barrier. However, as shown
in Figure 5, the frequency of the N2 modes in N2(H2)2 seems to increase almost linearly
with pressure and no heating is necessary for the transformation. A similar
phenomenon was observed in the (N2)6(H2)7 compound [24]. This chemical reaction
between N2 and H2 can not be attributed to a chemical precompression as 1) its unit cell
volume is slightly greater (2007.10 Å3) than the ideal mixing volume at the same
pressure (2003.26 Å3) and 2) there is no sign of charge transfer. While theoretical
investigations are needed to provide a mechanism for the sudden chemical reaction, it
could be related to hydrogen's high mobility (through quantum tunneling), which
allows it to more easily overcome kinetic barriers.
Figure 5: Rama shift of a N2(H2)2 single crystal Raman modes with pressure. A single H2 vibron, blue shifted compared to the pure compound, is observed while five N2 stretching modes are
measured. The pure N2 and pure H2 vibrons were obtained from the literature [142,237].
In any case, once the chemical reaction had taken place, left-over molecular
nitrogen unmistakably proved the synthesis of a hydrogen-rich reaction product. As the
sole vibrational modes measured by Raman spectroscopy could be attributed to the
azane family, the main reaction product was asserted to be NH3. However, longer azanes
were determined to also be present as secondary reaction products since the single-
bonded N-N Raman mode was detected. This result challenges the previous

148
experimental studies on N2-H2 powders as it is now established that both N2-H2 van der
Waals compounds produce some form of ammonia. In addition, we have also performed
powder X-ray diffraction experiments and showed powders to be composed of both van
der Waals compounds. These aspects of our investigation of the N2-H2 system are
detailed in the following paper.
During the decompression of the ammonia-rich azane mixture, a progressive
chemical transformation was observed. Below 10 GPa, the majority of the sample seems
to have transformed into hydrazine. As shown in Figure 6, a Raman mapping of the
sample at 1.2 GPa reveals no trace of any other form of azane but hydrazine. This is a
very surprising result since ammonia is well-known to be energetically-favored with
respect to hydrazine, which is metastable at ambient conditions. This is also illustrated
in the convex hulls shown in Figure 1 and Figure 2. As concluded in the paper, there is
no obvious mechanism for this transformation and a theoretical investigation would be
insightful. It is worth noting that the previous studies on the N2-H2 mixtures also
retrieved hydrazine at ambient conditions [24–26].
Figure 6: (a) Microphotograph of a 1 : 2 N2–H2 mixture at 1.2 GPa, the pressure at which hydrazine is in liquid–solid equilibrium, decompressed from 61.1 GPa. (b) A Raman mapping of the sample. The single crystals with well-defined edges in (b) are hydrazine (red) while bubbles were
determined to be a nitrogen– hydrogen liquid mixture (green). Both are in liquid hydrazine (blue).
The results here-shown can hardly be extracted to correct or be compared to the
theoretically calculated hydrogen-nitrogen enthalpy convex hull. Indeed, the studied
samples have not been provided with enough energy to cross possible activation
barriers and thus verify the observed compounds to be the truly thermodynamically-
stable compounds. Future experiments should focus on devising a clever sample
geometry which would allow for the heating of the N2-H2 mixtures to a few thousands of
Kelvins. Only then could the true thermodynamically stable nature of hydronitrogens be
determined.
149
The study of the N2-H2 system, and in particular of the N2(H2)2 van der Waals compound, was critical to provide a better understanding of the reaction product obtained near 50 GPa. Based on previous experimental and theoretical studies, the N2(H2)2 solid was a promising candidate to synthesize highly effective hydronitrogen energetic materials; ideal for rocket propellants. At the outset of this investigation, topochemistry was suggested as the mechanism responsible for the reported synthesis of long azane chains. While the complex N2(H2)2 structure was resolved at low pressure, the rotationally disordered nitrogen molecules prevented to be conclusive with regard to the effect of topochemistry. However, it could unambiguously be shown that reacted N2(H2)2 produce mostly ammonia and a minority of longer azanes. The N2-H2 system may still be key to the next generation propellant as it has yet to be demonstrated that the disordered azane mixture is the thermodynamically stable high pressure form. As such, laser-heating a hydronitrogen mixture could yield one of the highly energetic compounds predicted by the numerical simulations, such as pentazole.

150


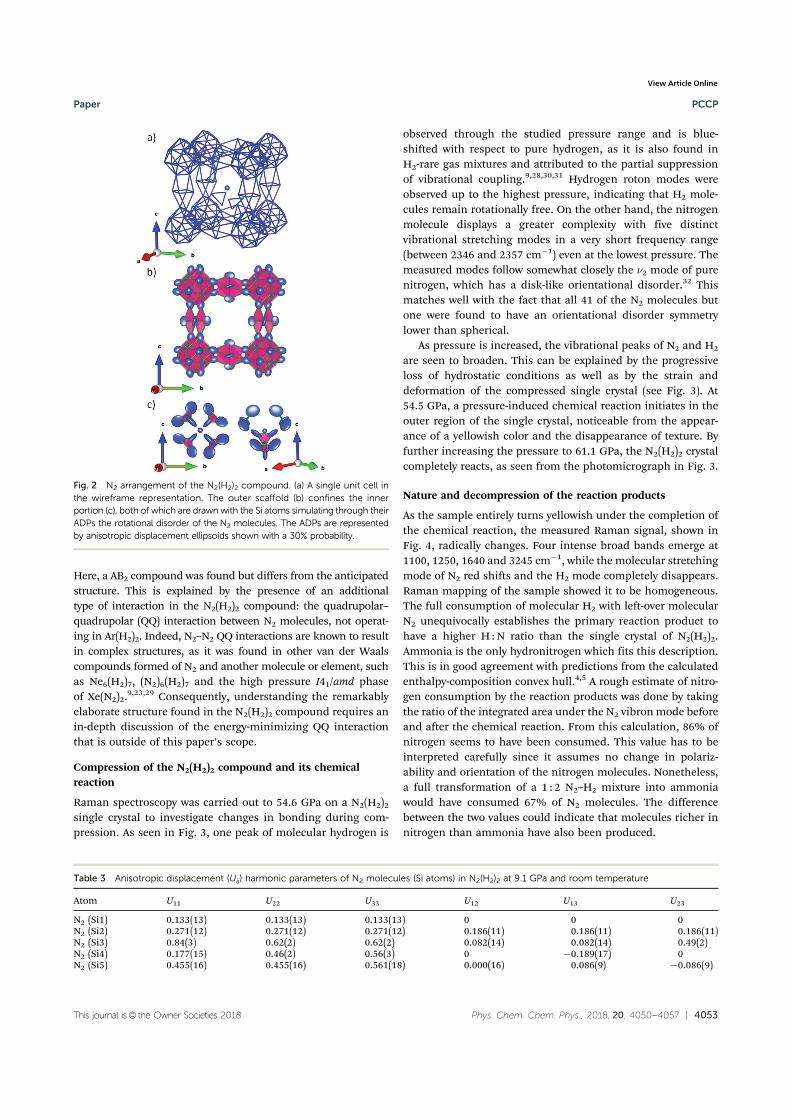


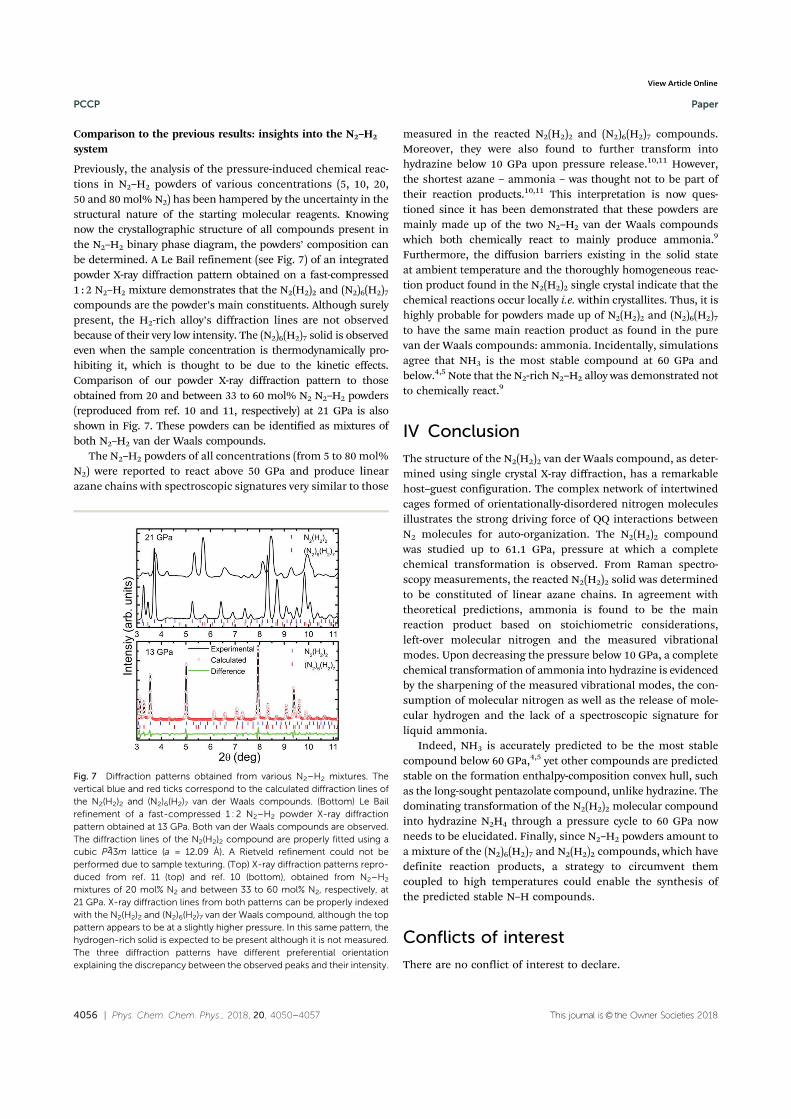

159
SYNTHESIS OF HIGH ENERGY DENSITY
LITHIUM-NITROGEN COMPOUNDS
I. INTRODUCTION
Lithium, third lightest element of the periodic table, assembles under an inert
environment into a very ductile, silvery shiny metal. Like other alkali elements, its
single valence electron has a very low ionization energy and thus can easily be stripped
away. As such, lithium is highly reactive under ambient conditions, readily chemically
transforming in contact with air to produce LiOH, LiOH•H2O, Li3N and even Li2CO3.
Under ambient conditions, lithium is viewed as a simple, prototypical metal
adopting a cubic lattice with very weak electron-ion interaction, effectively making it a
nearly-free electron material. Under pressure, however, it was shown to completely
depart from its straightforward behavior. Its phase diagram is shown in Figure 1.
Indeed, the common notion that compact metallic structures (bcc, hcp, fcc) are
increasingly favored at high density is disproved in the case of lithium. The ambient
conditions bcc solid transforms into a fcc structure near 7.5 GPa [238,239], but then
shifts into a symmetry-lowering I-43d cubic solid containing 16 atoms at 42 GPa and
then into an orthorhombic lattice with 88 atoms around 60 GPa. At higher pressures,
the trend continues with two further orthorhombic phase transitions [240]. Near 80
GPa lithium was showed through electrical resistance measurement to become
semiconducting [241]. This is understood by a pressure-induced electronic
redistribution, where the delocalized electrons are localized in the interstitial positions
of the crystal structure, effectively forming a high pressure electride with the electrons
behaving as anions [242–244]. This series of phase transition was observed at
temperatures below 200 K as at ambient temperature, lithium melts around 40 GPa
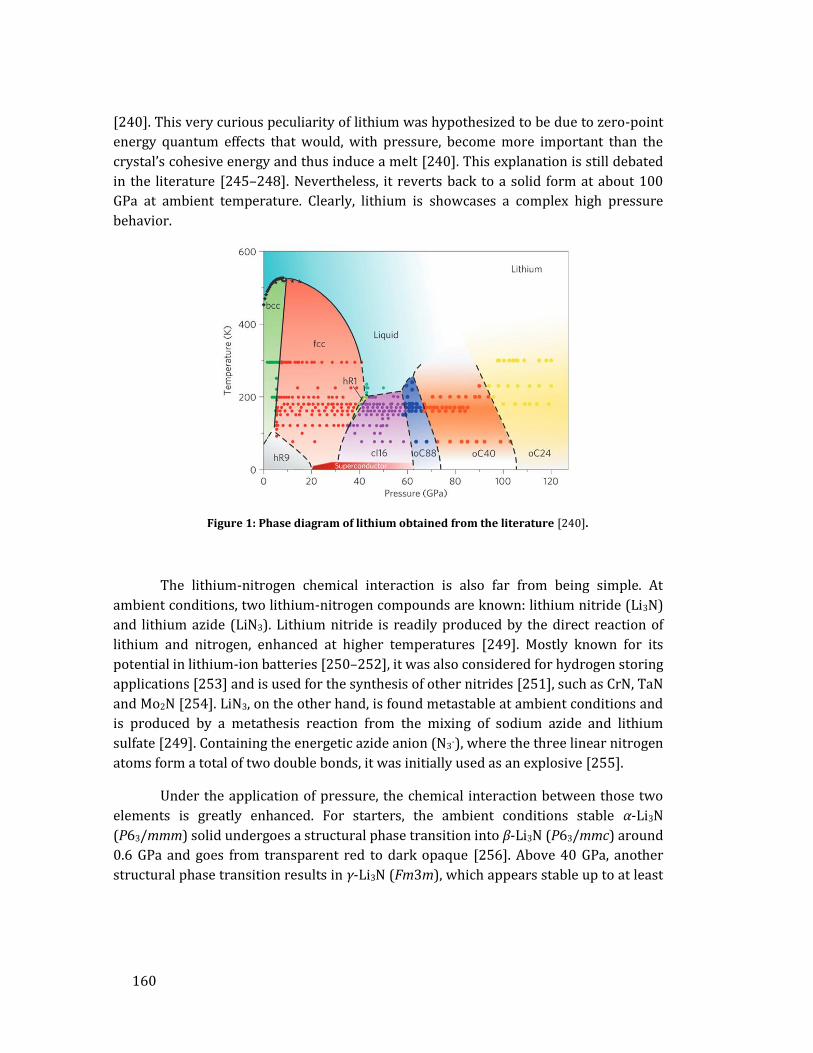
160
[240]. This very curious peculiarity of lithium was hypothesized to be due to zero-point
energy quantum effects that would, with pressure, become more important than the
crystal’s cohesive energy and thus induce a melt [240]. This explanation is still debated
in the literature [245–248]. Nevertheless, it reverts back to a solid form at about 100
GPa at ambient temperature. Clearly, lithium is showcases a complex high pressure
behavior.
Figure 1: Phase diagram of lithium obtained from the literature [240].
The lithium-nitrogen chemical interaction is also far from being simple. At
ambient conditions, two lithium-nitrogen compounds are known: lithium nitride (Li3N)
and lithium azide (LiN3). Lithium nitride is readily produced by the direct reaction of
lithium and nitrogen, enhanced at higher temperatures [249]. Mostly known for its
potential in lithium-ion batteries [250–252], it was also considered for hydrogen storing
applications [253] and is used for the synthesis of other nitrides [251], such as CrN, TaN
and Mo2N [254]. LiN3, on the other hand, is found metastable at ambient conditions and
is produced by a metathesis reaction from the mixing of sodium azide and lithium
sulfate [249]. Containing the energetic azide anion (N3-), where the three linear nitrogen
atoms form a total of two double bonds, it was initially used as an explosive [255].
Under the application of pressure, the chemical interaction between those two
elements is greatly enhanced. For starters, the ambient conditions stable α-Li3N
(P63/mmm) solid undergoes a structural phase transition into β-Li3N (P63/mmc) around
0.6 GPa and goes from transparent red to dark opaque [256]. Above 40 GPa, another
structural phase transition results in γ-Li3N (Fm3m), which appears stable up to at least

161
200 GPa [257]. Under compression, these various phases were characterized solely by
X-ray diffraction. Monoclinic (C2/m) LiN3 on the other hand was not observed to
undergo any structural modification up to 60 GPa at ambient temperature [258]. More
recently, lithium diazenide (Li2N2) was obtained from the decomposition of LiN3 at 9
GPa and 750 K, and retrieved down to ambient conditions where its orthorhombic
structure (Immm) was resolved [259]. This result hinted that a more complex chemistry
could be induced by pressure and that novel stoichiometries were accessible. Indeed,
this was later supported by theoretical calculations which unveiled five new
stoichiometries stable against decomposition at pressures below 100 GPa: Li13N, Li5N,
Li3N2, LiN2 and LiN5, along with yet undiscovered phases for already known
stoichiometries [28–31]. Two independent teams produced enthalpy convex hulls of the
Li-N system. Both are shown in Figure 2. Of all the theoretically calculated stable Li-N
phases, three stand out as promising high energy density materials and are drawn in
Figure 3. The high pressure phase of LiN2, stable above 58 GPa, is composed of neutral
infinite chains of N-N atoms of bond order between one and two, contained in a triclinic
(P-1) lattice. With the LiN3 stoichiometry, a hexagonal (P6/m) lattice with planar
benzene-like (N6)2- rings are predicted favorable on the enthalpy convex hull from 44
GPa, as also demonstrated from two other set of independent calculations [29–31]. Here
again, the N-N bonds were found to be in between a single and double bond. Stable on
the enthalpy convex hull between 10-15 GPa, calculated metastable down to ambient
conditions and with the highest N/Li ratio, LiN5 is the most attractive of these phases
[28,29]. Lithium pentazolate is expected to adopt a monoclinic lattice (space group of
either P21/c or P21) with planar N5- rings having N-N atoms at quasi-equal distances of
1.33-1.34 Å, suggesting a bond order between one and two. The low pressure stability
and ambient conditions metastability of LiN5 is explained by the single electron transfer
of lithium to the pentazolate ring, which allows both its aromaticity and the formation
of stabilizing ionic bonds. Upon decomposition, an energy of 2.72 kJ/g is expected,
which compares to the energy released by modern day explosives (HMX, RDX, TATB)
[28].

162
Figure 2: Li-N enthalpy convex hulls obtained from a) ref. [28] and b) ref. [29].
Figure 3: Structures of the high energy density Li-N compounds: a) triclinic LiN2 (58 GPa), hexagonal LiN3 (36-44 GPa) and monoclinic LiN5 (15 GPa) [29]. In parenthesis are the pressures at which the compounds were calculated to become stable. The blue and red spheres represent the
nitrogen and lithium atoms, respectively.
Due to its potential as a high energy density material, the synthesis of a
pentazolate anion is a long-standing goal of chemists. The very first confirmed
formation of the N5 ring was obtained in the mid-1900s in the form of an
arylpentazolate (C6H5N5) [260]. The chemical isolation of the pentazolate, however,
would take more than 50 years to achieve. First detected in the gas phase by mass
spectrometry in 2002 [37], it was only recently observed in 2016 as an ion in a liquid
solution of tetrahydrofuran (THF, (CH2)4O), although it proved to be unstable at
ambient temperatures and only stable below -40°C [261]. In the past year
breakthroughs were realized as the N5- anion was produced in both liquid and solid
forms at ambient conditions through large stabilizing matrix, namely as a
(N5)6(H3O)3(NH4)4Cl salt or as metal pentazolate hydrate complexes

163
([Na(H2O)(N5)2]·2H2O and [M(H2O)4(N5)2]·4H2O, M = Mn, Fe, and Co) [33,34,262]. The
high pressure approach also appeared as a valuable path to obtain pentazolate-
containing solids as the CsN5 salt could be produced at 60 GPa and, found metastable
down to 18 GPa [48]. While of limited practicality due to pressure constraints, the CsN5
compound has the critical advantage that a single atom was sufficient to stabilize the
pentazolate anion.
The first and foremost goal of the study of the lithium-nitrogen system was the
synthesis of lithium pentazolate. As described earlier, these types of compounds are
heavily sought-for and, if metastable to ambient conditions, would present a great
improvement over current pentazolate salts due to its very large N/Li mass ratio of
nearly 91%. Moreover, it would definitely establish high pressure as a relevant method
to produce ambient conditions metastable polynitrogen compounds. The secondary
objective of these investigations was the synthesis and characterization of the other Li-
N compounds predicted by the theoretical calculations. From the choice of the loaded
sample — small pieces of lithium along with a much greater quantity of nitrogen —
many solids with stoichiometries in between that of pure Li and LiN5 could be formed;
each of the stabilized phases being the nitrogen-richest permitted by the free energy
convex hull at a given pressure. In addition, the Li-N2 system provides the opportunity
to explore the effects of a chemical precompression achieved through a significant
charge transfer. This charge transfer is responsible for the prediction of so many
anionic nitrogen moieties, which include N3-, [N2]-2 and [N2]-1, N3-, and N5-. According to
the theoretical simulations discussed in the introduction of this thesis, there is a direct
correlation between high metastability and ionic bonds. Retrieving at ambient
conditions the anionic nitrogen arrangements is thus probable.
II. ARTICLES
Two papers resulted from the investigation of the Li-N2 system. The first
presented here, titled "Direct reaction of nitrogen and lithium up to 75 GPa: Synthesis of
the Li3N, LiN, LiN2 and LiN5 compounds" and submitted in Inorganic Chemistry, describes
the Li-N solids produced upon the compression and laser-heating of pure lithium
embedded in a much larger quantity of molecular nitrogen.
Immediately upon loading the Li-N2 sample, β-Li3N is observed. This
transformation is also reported to occur at ambient conditions; without even the need
of heating. As it will be discussed shortly, all of the subsequent chemical reactions
require some amount of laser-heating. Of course, this can be attributed to the low

164
atomic diffusion coefficient in the solid state, and thus highlights the validity of the
topochemistry principle. To ensure that β-Li3N is the most stable Li-N compound while
in excess of N2, it was laser-heated at pressures as low as 3.5 GPa and remained. Laser-
heating the sample above 10.5 GPa however results in a chemical reaction and the LiN2
solid is observed. This solid adopts a hexagonal (P63/mmc) lattice and contains a
charged N2 dimer (pernitride) (see Figure 4).
Figure 4: a) Structure of the hexagonal (P63/mmc) LiN2 compound. b) Structure of the orthorhombic (Cmcm) LiN compound. The blue and red atoms represent the nitrogen and lithium
atoms, respectively.
The structure determined matches the theoretically predicted one. As suggested
by the compound's stoichiometry, the pernitride was found to have an excess charge
close to 1-, based on the N-N bond length determined by X-ray diffraction. These
pernitrides, often formed in transition metal-nitrogen compounds (see the study of Fe-
N2 in the Annex), have a noticeable effect on the solid's bulk modulus. The relationship
between pernitride and bulk modulus is explained as follows: the extra electron(s)
transferred to the N2 dimer fill the N-N antibonding molecular orbitals (1πg*). This filling
results in an increased repulsion between the two N atoms, thus leading to a higher bulk
modulus [55,263]. Up to the complete filling of the anti-bonding orbitals, the greater the
charge density transferred to the N2 dimer, the larger the bulk modulus. These orbitals
are represented in Figure 5. In the case of LiN2, a single electron fills up the antibonding
orbitals. As such, the bulk modulus is not expected to be significantly increased. Indeed,
a K0 = 63(4) GPa and K0' = 3.9(4), were obtained, as detailed in the article. While it is
much larger than those measured in pure Li (11.3 GPa) [238], ε-N2 (2.98 GPa) [83] as
well as LiN3 (19.1 GPa) [258], it is slightly lower than in β-Li3N (74 GPa) and γ-Li3N (78
GPa) [257,264].

165
Figure 5: Molecular-orbital diagram of the N2 molecule as well as of the [N2]1- and [N2]2- pernitrides. Figure inspired from Ref. [55].
Above 25.2 GPa, a second new Li-N compound was observed along with LiN2:
LiN. By powder X-ray diffraction, its structure was resolved to be orthorhombic (Cmcm)
and also contains a pernitride (see Figure 4). This phase was also correctly predicted by
the theoretical calculations. Based on the structural determination and the N2 dimer
Raman frequency, a charge transfer of about 2e- was found, as expected from its
stoichiometry. According to the explanation described above, the bulk modulus of LiN is
expected to be greater than that of LiN2 as it has an extra electron in the antibonding
orbitals. Indeed, values of K0 = 112(19) GPa and K0' = 3.2(4) were obtained, with the bulk
modulus being almost twice as large as that of LiN2. Thus far, it is the highest of any known
Li-N solid.
Unlike LiN2, which is the nitrogen-rich stable Li-N compound between about 10
and 45 GPa, LiN is synthesized only when the laser-heated Li3N piece has insufficient
access to molecular nitrogen. Indeed, while LiN2 forms in the sample regions where
there is the most molecular nitrogen, LiN tends to be produced in the bulk of the Li3N
solid. Above 45 GPa, the same observations were made between the nitrogen-richest
stable Li-N compound (LiN5, described below) and LiN. This is shown by Raman
mappings in Figure 6. While it is well-known that it is important to have a homogeneous
sample temperature during laser-heating, this result highlights the dangers of having a
chemically inhomogeneous sample environment. Indeed, during the first set of
experiments, as many as five phases could be observed in a single X-ray diffraction
pattern, namely pure nitrogen, Li3N, LiN, LiN2 and LiN5. As three of these phases had
never been observed before, their determination was arduous. After the nature of the

166
LiN compound was understood, care was taken to only load into the DAC tiny lithium
pieces so that they could be completely transformed. In any case, as shown in the paper,
the pressure stability domain of the four observed Li-N phases was resolved through
sample laser-heating at regular pressure intervals (∽ 5 GPa).
Figure 6: a) Microphotograph of a Li-N2 sample laser-heated at 60 GPa and decompressed down to 12 GPa. b) The same microphotograph superimposed with the Raman mapping. The yellow to red (weak to strong intensity peaks for LiN5, respectively) and purple to white (weak to strong intensity peaks for LiN, respectively) portions map where LiN5 and LiN Raman modes were detected. The LiN5
is found in the outer regions, further away from the main Li piece and in close contact with molecular N2.
Published in the Journal of Physical Chemistry Letters, the synthesis of the LiN5
compound is presented in a paper titled "High-pressure synthesized lithium pentazolate
compound mestastable under ambient conditions". Upon laser-heating either Li3N or LiN2
above 45 GPa, another chemical reaction occurred and the LiN5 compound was
produced. In accordance, new vibrational modes as well as diffraction lines were
detected. Unfortunately, the diffraction patterns containing the LiN5 diffraction lines
were always polluted with those of LiN2, LiN as well as pure N2. From these diffraction
patterns, it was possible to dismiss the structures suggested for LiN5 by theoretical
investigations [28,29]. A monoclinic lattice was suggested based on nine diffraction
lines identified on a sample at 73 GPa. Despite many attempts to produce samples with
clean diffraction patterns, we were ultimately unsuccessful. Curiously, very thin and
small lithium pieces, when laser-heated, tended to form thin, transparent films of LiN5
(see Figure 7). While these could be identified by Raman spectroscopy, they produced
no diffraction signal.

167
Figure 7: Microphotographs of the chemical transformation of a Li3N piece embedded in N2 along with the Raman mapping of the sample chamber to spatially pinpoint the LiN5 compound. (a)
Microphotographs at 52.0 GPa before (top left) and after (bottom left) laser heating. Before heating, the numbers 1 mark the lithium piece. The laser-heated and transformed solid, labeled by a blue
arrow, appears translucent and grew in size. A texture change is also observed in the solid nitrogen surrounding the laser-heated lithium piece, identified by a green arrow. (b) Microphotographs of the same sample at 12.7 GPa, with and without the superimposed Raman mapping (top right and
bottom right, respectively). At this pressure, pure molecular nitrogen is no longer reticulated as it underwent the ε-N2 → δ*-N2 phase transition. The yellow to red color scale indicates the intensity of the main N5 stretching Raman mode, from strong to weak, respectively. The textured, transparent
area above the main LiN5 piece is found to have the same N5 Raman modes.
Other methods to obtain a homogeneous LiN5 solid were attempted. As the
parasitic peaks came from Li-N solids with a lower nitrogen concentration, it was
thought that by homogeneously laser-heating the Li3N piece for a considerable amount
of time, thus allowing sufficient nitrogen diffusion, a full transformation into LiN5 might
be obtained. To achieve this, it was tried to load a pure lithium piece positioned on a
laser absorber. Unfortunately, due to the difficulty in manipulating pure lithium – which
is very sticky – in a glovebox, we were never able to get the wanted sample geometry. A
similar approach was attempted with loading LiN3 instead of pure Li, the former being
easier to manipulate and, due to its stoichiometry, does not require as much nitrogen
(and thus nitrogen diffusion) to transform into LiN5. This experiment was done once,
and laser-heating the LiN3 piece resulted in an amorphous solid. However, the sample
might have been partially contaminated with water. In another set of DAC loading,
thinking that the thin transparent LiN5 solids might be amorphous, there were annealed
at 12 GPa. This resulted in its decomposition into LiN3 and pure N2.
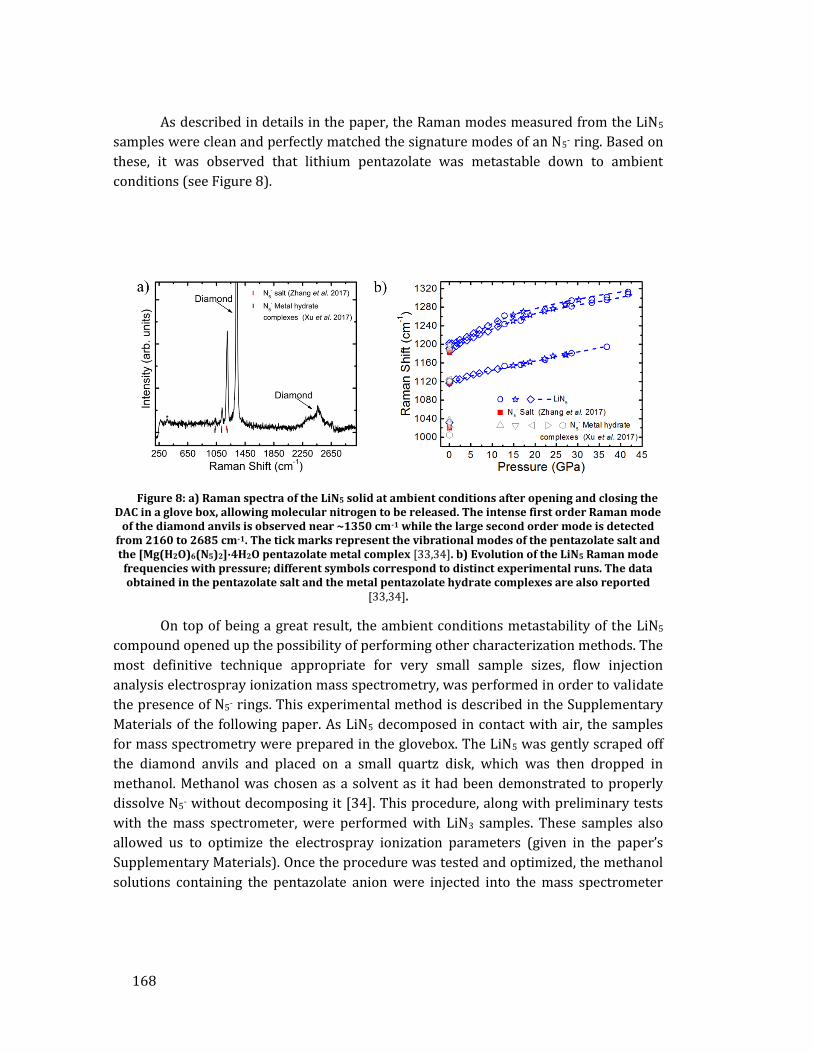
168
As described in details in the paper, the Raman modes measured from the LiN5
samples were clean and perfectly matched the signature modes of an N5- ring. Based on
these, it was observed that lithium pentazolate was metastable down to ambient
conditions (see Figure 8).
Figure 8: a) Raman spectra of the LiN5 solid at ambient conditions after opening and closing the DAC in a glove box, allowing molecular nitrogen to be released. The intense first order Raman mode
of the diamond anvils is observed near ~1350 cm-1 while the large second order mode is detected from 2160 to 2685 cm-1. The tick marks represent the vibrational modes of the pentazolate salt and the [Mg(H2O)6(N5)2]∙4H2O pentazolate metal complex [33,34]. b) Evolution of the LiN5 Raman mode frequencies with pressure; different symbols correspond to distinct experimental runs. The data obtained in the pentazolate salt and the metal pentazolate hydrate complexes are also reported
[33,34].
On top of being a great result, the ambient conditions metastability of the LiN5
compound opened up the possibility of performing other characterization methods. The
most definitive technique appropriate for very small sample sizes, flow injection
analysis electrospray ionization mass spectrometry, was performed in order to validate
the presence of N5- rings. This experimental method is described in the Supplementary
Materials of the following paper. As LiN5 decomposed in contact with air, the samples
for mass spectrometry were prepared in the glovebox. The LiN5 was gently scraped off
the diamond anvils and placed on a small quartz disk, which was then dropped in
methanol. Methanol was chosen as a solvent as it had been demonstrated to properly
dissolve N5- without decomposing it [34]. This procedure, along with preliminary tests
with the mass spectrometer, were performed with LiN3 samples. These samples also
allowed us to optimize the electrospray ionization parameters (given in the paper’s
Supplementary Materials). Once the procedure was tested and optimized, the methanol
solutions containing the pentazolate anion were injected into the mass spectrometer

169
which was set to detect at a mass/charge (m/z) ratio of -70; corresponding to that of
N5-. From all four N5--containing solutions, coming from two separate LiN5 samples, a
weak but an unambiguous peak appeared at the correct m/z ratio. A raw spectrum is
shown in Figure 9, along with the extracted ion-current time evolution during the
methanol-N5- solution injection. Hence, the mass spectrometry experiments validated
both the presence of the pentazolate anion as well as its metastability down to ambient
conditions.
Figure 9: a) Raw mass spectrometry spectra of the solutions containing LiN5, the LiN3 calibrant and solely methanol. The arrow marks the peak corresponding to the m/z of N5-. b) Mass
spectrometry results from LiN5 dissolved in methanol, with the extracted ion current for m/z values between 69.5 and 70.5, measured as a function of time. The LiN5 samples are injected and measured at 0.4 and 0.58 min, respectively, for samples 1 and 2, while both methanol reference samples were injected at 0.4 min. (Inset) Integrated ion current−time curves shown in the main figure for the two
LiN5 and the two reference samples.
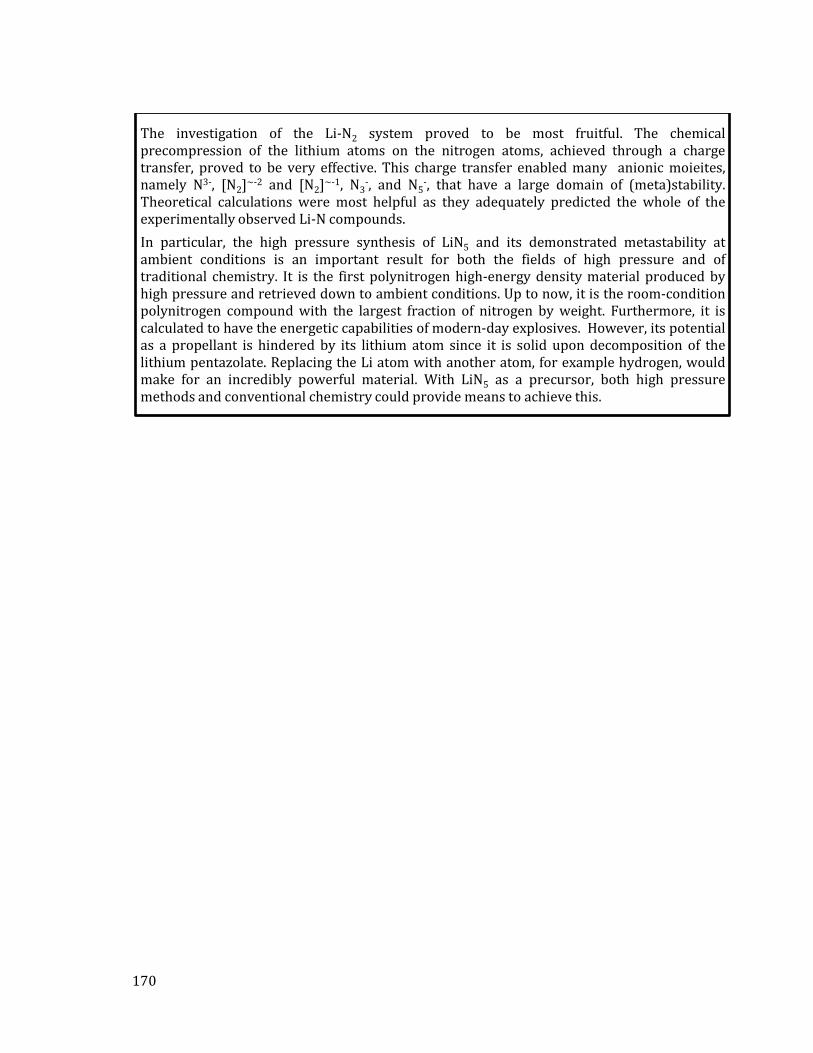
170
The investigation of the Li-N2 system proved to be most fruitful. The chemical precompression of the lithium atoms on the nitrogen atoms, achieved through a charge transfer, proved to be very effective. This charge transfer enabled many anionic moieites, namely N3-, [N2]∼-2 and [N2]∼-1, N3
-, and N5-, that have a large domain of (meta)stability.
Theoretical calculations were most helpful as they adequately predicted the whole of the experimentally observed Li-N compounds.
In particular, the high pressure synthesis of LiN5 and its demonstrated metastability at ambient conditions is an important result for both the fields of high pressure and of traditional chemistry. It is the first polynitrogen high-energy density material produced by high pressure and retrieved down to ambient conditions. Up to now, it is the room-condition polynitrogen compound with the largest fraction of nitrogen by weight. Furthermore, it is calculated to have the energetic capabilities of modern-day explosives. However, its potential as a propellant is hindered by its lithium atom since it is solid upon decomposition of the lithium pentazolate. Replacing the Li atom with another atom, for example hydrogen, would make for an incredibly powerful material. With LiN5 as a precursor, both high pressure methods and conventional chemistry could provide means to achieve this.

Direct Reaction of Nitrogen and Lithium up to 75 GPa: Synthesis ofthe Li3N, LiN, LiN2, and LiN5 CompoundsDominique Laniel,*,†,‡ Gunnar Weck,† and Paul Loubeyre†
†CEA, DAM, DIF, F-91297 Arpajon, France‡CNES Launcher Directorate, 52 rue J. Hillairet, 75612 Paris cedex, France
ABSTRACT: A wide variety of Li-N compounds arepredicted as stable under pressure and associated with variousnitrogen anionic moieties. Accordingly, the LiN5 compoundwas recently synthesized at 45 GPa by the direct reaction ofnitrogen and lithium. In this study, we present anexperimental investigation of the Li-N binary phase diagramfrom ambient pressure up to 73.6 GPa. The samples loaded inthe diamond anvil cells were constituted of pure lithiumpieces embedded in a much greater quantity of molecular nitrogen and, at incremental pressure steps, were laser-heated toproduce the thermodynamically favored solid. The following compounds are observed: Li3N, LiN2, LiN as well as LiN5, andtheir pressure stability domain is disclosed. Two are synthesized for the first time, namely Cmcm LiN and P63/mmc LiN2. Bothare structurally resolved and characterized by X-ray diffraction and Raman spectroscopy measurements. Their high bulkmodulus is characteristic of charged N2 dimers.
■ INTRODUCTION
Until recently, only two lithium−nitrogen compounds wereknown: lithium nitride (Li3N) and lithium azide (LiN3).Lithium nitride, containing the N3− anion, is stable at ambientconditions and is readily produced by the direct reaction oflithium and nitrogen, enhanced at high temperatures.1 Mostlyknown for its potential in lithium-ion batteries,2−4 it was alsoconsidered for hydrogen storing applications5 and is used as aprecursor for the synthesis of other nitrides,3 such as CrN,TaN and Mo2N.
6 On the other hand, LiN3 is found metastableat ambient conditions and is produced by a metathesis reactionfrom the mixing of sodium azide and lithium sulfate.1 It wasinitially employed as an explosive7 since it contains theenergetic azide anion N3
−, where the three linear nitrogenatoms form a total of two double bonds.Under the application of pressure, the chemical interaction
between Li and N should be greatly enhanced. In addition tothe Li3N and LiN3 stoichiometries, six others (Li13N, Li5N,Li3N2, LiN, LiN2, and LiN5) are predicted stable on the Li-Nenthalpy convex hull.8−11 Owing to lithium’s reactivityprompt to free itself of its single valence electronthetypically inert molecular nitrogen is enticed to break or alter itsstrong covalent triple bond and form various anionic species.The nitrogen arrangements in the calculated Li-N compoundsrange from atomic (N3−), charged dimers ([N2]
−2, [N2]−4),
azides (N3−), pentazolates (N5
−) and infinite chains. Of these,lithium pentazolate (LiN5) is of considerable interest as a highenergy density material since it contains the elusive energeti-cally rich N5
− ring expected metastable down to ambientconditions.So far, the high pressure investigations of Li-N mixtures have
mainly focused on the compression of the compounds
available at ambient conditions: the stable Li3N and themetastable LiN3. Around 0.6 GPa, the ambient conditions’stable α-Li3N (P63/mmm) solid undergoes a structural phasetransition into β-Li3N (P63/mmc) and goes from transparentred to dark opaque.12 Above 40 GPa, another transformationresults in γ-Li3N (Fm3m), which appears stable up to at least200 GPa.13 Under compression, X-ray diffraction and X-rayRaman spectroscopy measurements of the various Li3N phaseswere reported.12−14 The monoclinic form (C2/m) of LiN3,stable at ambient conditions, was not observed to undergo anystructural modification up to 60 GPa at ambient temperature.15
In 2012, another Li-N compound was synthesized: dilithiumdiazenide (Li2N2 or simply LiN), which was obtained from thedecomposition of LiN3 at 9 GPa and 750 K. This solid wassolely characterized at ambient conditions where its ortho-rhombic structure (Immm) composed of charged N2 dimerswas solved.16 This result hinted that, as expected fromtheoretical calculations, a more complex chemistry couldindeed be induced by pressure and that novel stoichiometriesare accessible. The very recent synthesis of the elusive LiN5compound at 45 GPa, observed metastable down to ambientconditions, confirmed this theoretical picture.8,9,17
Here, we present a systematic experimental investigation ofthe Li-N phase diagram with a sample configuration favoringthe synthesis of nitrogen-rich phases. Pure lithium flakesembedded in a much greater quantity of nitrogen werecompressed up to 73.6 GPa as well as laser-heated (up toabout 2500 K) at various pressure steps to cross possibleactivation barriers toward the thermodynamically stable
Received: May 16, 2018Published: August 23, 2018
Article
pubs.acs.org/ICCite This: Inorg. Chem. 2018, 57, 10685−10693
© 2018 American Chemical Society 10685 DOI: 10.1021/acs.inorgchem.8b01325Inorg. Chem. 2018, 57, 10685−10693
Dow
nloa
ded
via
CE
A S
AC
LA
Y o
n Se
ptem
ber
4, 2
018
at 1
0:38
:27
(UT
C).
Se
e ht
tps:
//pub
s.ac
s.or
g/sh
arin
ggui
delin
es f
or o
ptio
ns o
n ho
w to
legi
timat
ely
shar
e pu
blis
hed
artic
les.

compound. Four Li-N compounds are produced and theirpressure stability domain is resolved. Of these, two new solidsare produced and characterized by X-ray diffraction andRaman spectroscopy: Cmcm LiN and P63/mmc LiN2. More-over, complementary data on Li3N are reported.
■ EXPERIMENTAL METHODMeasurements were performed in membrane diamond anvil cells(DAC) equipped with diamond anvils of culet diameter of either 150or 300 μm. A few pure lithium pieces of typically about 10 × 10 × 5μm3 in size were positioned in the sample chamber under argon gas ina glovebox. The closed sample chamber was then opened up in a highpressure vessel and filled with pure molecular nitrogen (1400 bar).Nitrogen, acting as both a pressure transmitting medium and areagent, was always largely in excess with respect to lithium. Rheniumwas used as gasket material. A small ruby chip or gold micrograin wasloaded along with the sample and used to determine the pressureinside the experimental chamber.18,19 It was always verified by Ramanspectroscopy that no water contamination of the sample had occurredduring the loading process. To make sure that no chemical reactionoccurred with the carbon surface of the diamond anvil, one run wasperformed with a thin titanium protective layer (200 nm) sputteredon both diamond anvils.20
Confocal Raman spectroscopy measurements were performedusing an Alpha300M+ (WITec). Sample excitation was done with acontinuous Ar-Kr laser employing the 647.1 nm line, focused down toless than 1 μm by using an Olympus SLMPLN 50X Objective with anumerical aperture of 0.35. The Stokes Raman signal was collected inbackscattering geometry by a CCD coupled with a 600 lines/mmgrating allowing a spectral resolution of approximately 8 cm−1.Automated motorized sample positioning with piezo-driven X-Y scanstages of submicron accuracy allowed for precise Raman mapping ofthe sample. Raman spectra were typically recorded using 110 mW oflaser power and 30 s acquisition times.X-ray diffraction measurements were performed on the ID27
beamline of the ESRF in angular-dispersive mode. The X-ray beam,with λ = 0.3738 Å, was focused by two Kirkpatrick−Baez mirrors andcleaned by one pinhole to an ∼5 × 5 μm2 spot on the sample. Thesample to detector distance was calibrated using a CeO2 referencesample. X-ray powder diffraction patterns collected on a MAR-CCDdetector were integrated using DIOPTAS and analyzed using theXRDA as well as the FULLPROF software.21−23
Double-sided laser-heating of the Li-N2 mixtures was performed atour laboratory and at the ESRF ID27 beamline using YLF lasers. Bothpure lithium and the LiN2 compound absorb the YLF laser and werethus used as absorbers for laser-heating. To promote nitrogendiffusion into the lithium solid, the samples were always laser-heatedfor several minutes (∼5 min) above the melting temperature ofmolecular nitrogen.24 Below 20 GPa, laser-heating temperatures werelimited to temperature lower than ∼1500 K since going to highertemperatures damaged the samples. Above 20 GPa, temperatures of∼2500 K were reached. If a new phase was detected, the samples werefurther heated until they were homogeneous or no furthertransformation was observed. If no reaction took place, pressurewas increased after which the sample was laser-heated again.Temperatures were measured by fitting the sample’s thermoemissionto Planck’s law.25
■ RESULTS AND DISCUSSION
Stability Domain of Li-N Phases in Excess ofNitrogen. Twelve independent pressure runs were devotedto investigating the synthesis of the compounds stable on thenitrogen-rich side of the Li-N binary phase diagram up to 73.6GPa. Four compounds were reproducibly observed, namely,Li3N, LiN, LiN2 as well as LiN5, and their respective pressurestability domain was determined by X-ray diffraction and
Raman spectroscopy measurements associated with laser-heating for selected pressure steps.Representative sets of integrated X-ray diffraction patterns
obtained before and after sample laser-heating are shown inFigure 1, which illustrates the various chemical trans-
formations. Lithium and nitrogen were observed to immedi-ately react to form Li3N after sample loading, in agreementwith the literature.12 The lowest loading pressure being abovethe α → β phase transition in Li3N (0.6 GPa),12 a β-Li3Npowder was always first identified. As shown in Figure 1, laser-heating of this powder at 3.5 GPa resulted only in theannealing of β-Li3N and so no other compound with a largerfraction of nitrogen is stable in this pressure range. At 10.5GPa, laser-heating Li3N in an excess of nitrogen amounted inthe synthesis of the LiN2 compound. The pressure of stabilityof LiN2 is thus in between 3.5 and 10.5 GPa. From 10.5 to 43.2GPa, laser-heating either the Li3N or the LiN2 compoundsembedded in excess nitrogen systematically resulted in theformation of LiN2. This establishes LiN2 to be the stable Li-Ncompound with the largest nitrogen of fraction over thispressure range. Above 46.5 GPa up to 73.6 GPa, laser-heatingof the Li3N or the LiN2 compounds produces the LiN5compound. The characterization of LiN5 is provided else-where.17
It is interesting to note that, from 25.2 GPa and above, thesynthesis of the LiN2 as well as the LiN5 solid wasaccompanied by the formation of the LiN compound, asshown in the integrated diffraction patterns of Figure 1. For
Figure 1. Three sets of integrated X-ray diffraction patterns obtainedfrom two distinct Li-N2 samples. The first three diffractograms wereobtained from a unique sample that was laser-heated (LH) twice: firstat 3.5 GPa and then again at 10.5 GPa, resulting in the red and bluediffractograms, respectively. The top four diffractograms wereacquired from a second sample, laser-heating once at 25.2 GPa andagain at 73.6 GPa. The phases corresponding to the same colored tickmarks are indicated on the right of the plot. The asterisk and fullcircles mark peaks attributed to the rhenium gasket and to ζ-N2,respectively. The tick marks of ζ-N2 were not plotted as thecompound’s lattice is not well established. The lattice parameters ofthe phases shown in this figure can be found in Table 1.
Inorganic Chemistry Article
DOI: 10.1021/acs.inorgchem.8b01325Inorg. Chem. 2018, 57, 10685−10693
10686

reasons explained below, LiN was prominently detected insample regions with low nitrogen concentrations and is notobserved at 9.0 GPa, contrary to previous investigations.16 Thelattice parameters of the various Li-N phases shown in Figure 1can be found in Table 1, while their stability domains aresummarized in Figure 2.Two sets of calculations of the enthalpy convex hulls for the
Li-N system provide a complete understanding of (i) theexperimental observation of the LiN2 and LiN5 compounds,(ii) the formation of LiN in the region of the heated samplenot in contact with the nitrogen reagent, (iii) the higher thanpreviously reported synthesis pressure of LiN, and (iv) theabsence of the LiN3 compound’s synthesis.8,9 On the basis ofthese calculations, both the LiN and the LiN2 compounds areexpected to be stable from ambient conditions up to at least100 GPa. One set of calculations predicts LiN3 stable from 49GPa and LiN5 from 15 GPa,9 while, in the second set ofcalculations, LiN3 and LiN5 sit on the convex hull from 8.5 and9.9 GPa,8 respectively. So within the pressure uncertainty ofthese calculations, it can be expected that both LiN and LiN2should become stable on the enthalpy convex hull at verysimilar pressures, lower than the pressures at which LiN3 andLiN5 should be favored. Moreover, LiN5 should become stableat a pressure very close or lower to that of LiN3. Here, takinginto account the fact that the experiments were performed withlithium embedded largely in excess of nitrogen, thermody-namics will always favor the synthesis of the nitrogen-richeststable compound at any given pressure. Henceforth, when laser-heating Li3N at 10.5 GPa, the formation of LiN2 is detected as
it is thermodynamically preferred over LiN, which wasreported to be stable from 9.0 GPa.16 With the same logic, itis not surprising that LiN3 was not observed as its pressurestability domain overlaps with that of LiN5. This explanationjustifies why the synthesis of the LiN compound occurs solelyin nitrogen-deprived areas of the sample cavity and usually as aminority phase. Thus, the experiments presented heredetermined that the following compounds are to be the stableseries of pressure-induced chemical reactions occurring whennitrogen atoms vastly outnumber lithium atoms: Li3N, LiN2,and LiN5. It is important to note that, when a mixture ofphases is obtained, the ones produced in the bulk of the Lipiece are not considered as the nitrogen-richest stable phase onthe convex hull. Instead, the nitrogen-richest stable phase onthe convex hull at a given pressure is the one observed at theLi−N2 interface, where the synthesized phases are notsignificantly dependent on diffusion.In the next sections, Raman spectroscopy measurements and
the X-ray diffraction characterization of the Li3N, LiN, andLiN2 compounds are presented. Experimental data on thelithium pentazolate has previously been reported.17
Characterization of the Li-N Compounds. LithiumNitride Li3N. The Li3N compound has been the subject ofextensive X-ray diffraction studies, covering the pressure rangeof ambient up to 200 GPa.13,14 However, to the best of ourknowledge, only the vibrational modes of α-Li3N, phase stableup to 0.6 GPa have previously been reported.26 Here, Ramanspectroscopy measurements of β-Li3N were performed and areshown up to 39.1 GPa. From its known hexagonal structure
Table 1. Lattice Parameters of the Various Li-N Compounds Shown in Figure 1a
compound pressure (GPa) a (Å) b (Å) c (Å) β (deg)
β-Li3N (P63/mmc) 3.5 3.506(1) 6.242(1)β-Li3N (P63/mmc) 25.2 3.306(1) 5.868(1)LiN2 (P63/mmc) 10.5 2.713(1) 7.688(1)LiN2 (P63/mmc) 25.2 2.607(1) 7.553(1)LiN2 (P63/mmc) 73.6 2.401(1) 7.191(1)LiN (Cmcm) 25.2 7.239(1) 3.924(1) 3.576(1)LiN5 (P2) 73.6 3.808(1) 3.838(1) 2.410(1) 99.84(4)
aThe lattice parameters of the Cmcm LiN solid at 73.6 GPa are provided in Figure 4.
Figure 2. (a) Schematic representation of the pressure stability of the Li3N, LiN, LiN2, and LiN5 compounds. The yellow vertical ticks on thehorizontal line above the graph indicate the pressure at which laser-heating was performed. An open-ended rectangle means that the compound wasnot studied above that pressure, and thus it is unknown whether or not the phase is still stable. In the case of the Li3N and LiN compounds,literature data were also used to draw their stability domain.13,16 On the basis of these, the α-Li3N (P63/mmm) is stable up to 0.6 GPa, after whichβ-Li3N (P63/mmc) is observed up to about 40 GPa, then transforming into γ-Li3N (Fm3m). Immm LiN is produced from 9 GPa and Cmcm LiNwas synthesized from 25.2 GPa. P63/mmc LiN2 and P2 LiN5 are observed stable. (b) Microphotograph of a typical Li-N2 sample after loading. Inthe center, three small lithium pieces are embedded in a much greater quantity of molecular nitrogen. A small ruby microchip and gold micrograinare visible in the upper portions of the experimental cavity.
Inorganic Chemistry Article
DOI: 10.1021/acs.inorgchem.8b01325Inorg. Chem. 2018, 57, 10685−10693
10687
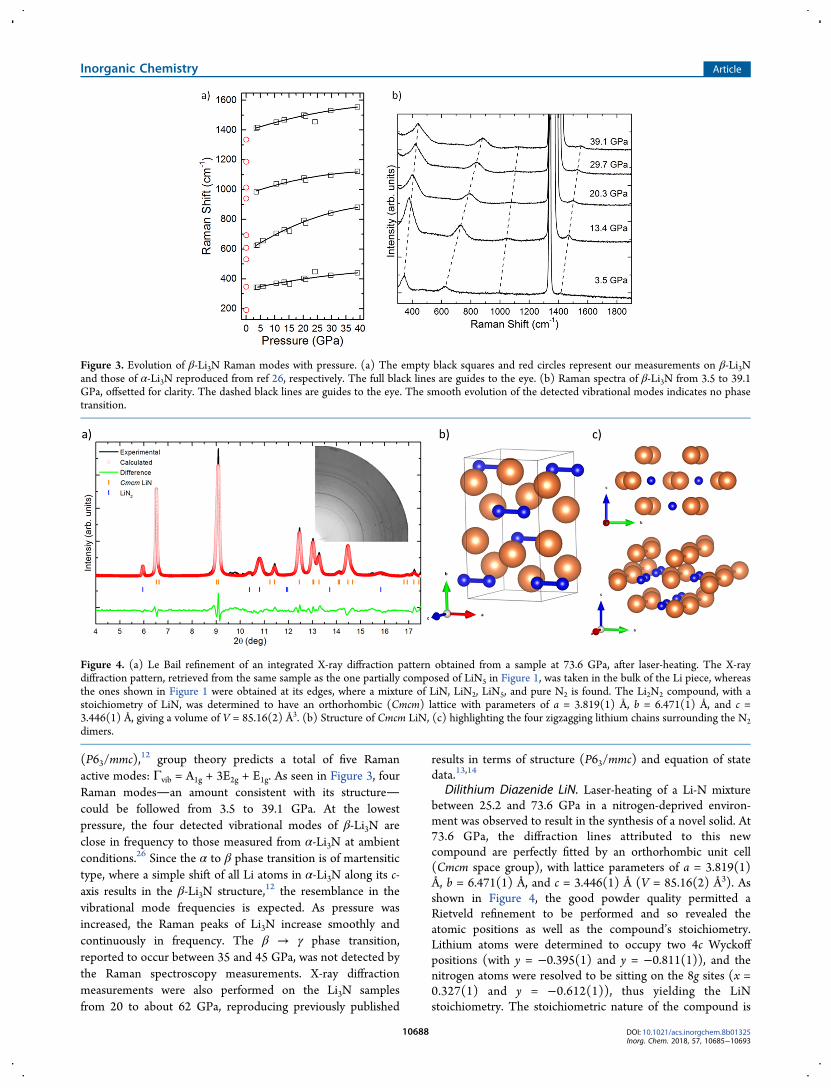
(P63/mmc),12 group theory predicts a total of five Raman
active modes: Γvib = A1g + 3E2g + E1g. As seen in Figure 3, fourRaman modesan amount consistent with its structurecould be followed from 3.5 to 39.1 GPa. At the lowestpressure, the four detected vibrational modes of β-Li3N areclose in frequency to those measured from α-Li3N at ambientconditions.26 Since the α to β phase transition is of martensitictype, where a simple shift of all Li atoms in α-Li3N along its c-axis results in the β-Li3N structure,12 the resemblance in thevibrational mode frequencies is expected. As pressure wasincreased, the Raman peaks of Li3N increase smoothly andcontinuously in frequency. The β → γ phase transition,reported to occur between 35 and 45 GPa, was not detected bythe Raman spectroscopy measurements. X-ray diffractionmeasurements were also performed on the Li3N samplesfrom 20 to about 62 GPa, reproducing previously published
results in terms of structure (P63/mmc) and equation of statedata.13,14
Dilithium Diazenide LiN. Laser-heating of a Li-N mixturebetween 25.2 and 73.6 GPa in a nitrogen-deprived environ-ment was observed to result in the synthesis of a novel solid. At73.6 GPa, the diffraction lines attributed to this newcompound are perfectly fitted by an orthorhombic unit cell(Cmcm space group), with lattice parameters of a = 3.819(1)Å, b = 6.471(1) Å, and c = 3.446(1) Å (V = 85.16(2) Å3). Asshown in Figure 4, the good powder quality permitted aRietveld refinement to be performed and so revealed theatomic positions as well as the compound’s stoichiometry.Lithium atoms were determined to occupy two 4c Wyckoffpositions (with y = −0.395(1) and y = −0.811(1)), and thenitrogen atoms were resolved to be sitting on the 8g sites (x =0.327(1) and y = −0.612(1)), thus yielding the LiNstoichiometry. The stoichiometric nature of the compound is
Figure 3. Evolution of β-Li3N Raman modes with pressure. (a) The empty black squares and red circles represent our measurements on β-Li3Nand those of α-Li3N reproduced from ref 26, respectively. The full black lines are guides to the eye. (b) Raman spectra of β-Li3N from 3.5 to 39.1GPa, offsetted for clarity. The dashed black lines are guides to the eye. The smooth evolution of the detected vibrational modes indicates no phasetransition.
Figure 4. (a) Le Bail refinement of an integrated X-ray diffraction pattern obtained from a sample at 73.6 GPa, after laser-heating. The X-raydiffraction pattern, retrieved from the same sample as the one partially composed of LiN5 in Figure 1, was taken in the bulk of the Li piece, whereasthe ones shown in Figure 1 were obtained at its edges, where a mixture of LiN, LiN2, LiN5, and pure N2 is found. The Li2N2 compound, with astoichiometry of LiN, was determined to have an orthorhombic (Cmcm) lattice with parameters of a = 3.819(1) Å, b = 6.471(1) Å, and c =3.446(1) Å, giving a volume of V = 85.16(2) Å3. (b) Structure of Cmcm LiN, (c) highlighting the four zigzagging lithium chains surrounding the N2dimers.
Inorganic Chemistry Article
DOI: 10.1021/acs.inorgchem.8b01325Inorg. Chem. 2018, 57, 10685−10693
10688
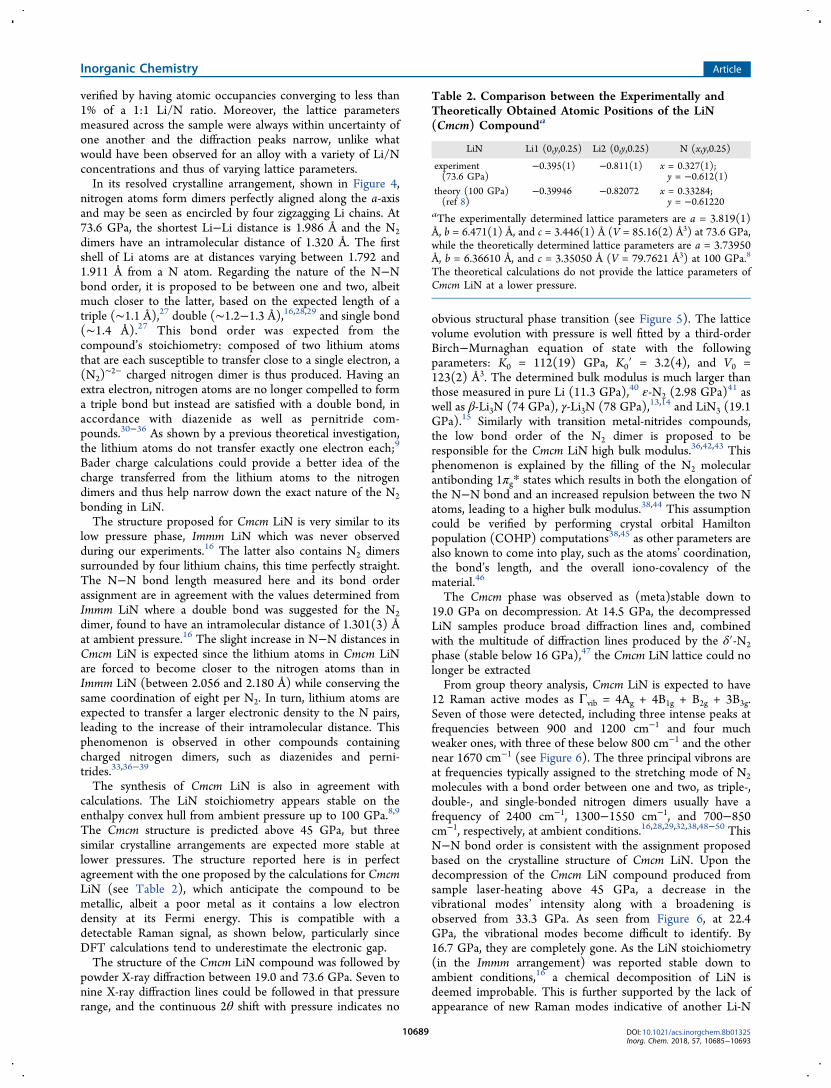
verified by having atomic occupancies converging to less than1% of a 1:1 Li/N ratio. Moreover, the lattice parametersmeasured across the sample were always within uncertainty ofone another and the diffraction peaks narrow, unlike whatwould have been observed for an alloy with a variety of Li/Nconcentrations and thus of varying lattice parameters.In its resolved crystalline arrangement, shown in Figure 4,
nitrogen atoms form dimers perfectly aligned along the a-axisand may be seen as encircled by four zigzagging Li chains. At73.6 GPa, the shortest Li−Li distance is 1.986 Å and the N2dimers have an intramolecular distance of 1.320 Å. The firstshell of Li atoms are at distances varying between 1.792 and1.911 Å from a N atom. Regarding the nature of the N−Nbond order, it is proposed to be between one and two, albeitmuch closer to the latter, based on the expected length of atriple (∼1.1 Å),27 double (∼1.2−1.3 Å),16,28,29 and single bond(∼1.4 Å).27 This bond order was expected from thecompound’s stoichiometry: composed of two lithium atomsthat are each susceptible to transfer close to a single electron, a(N2)
∼2− charged nitrogen dimer is thus produced. Having anextra electron, nitrogen atoms are no longer compelled to forma triple bond but instead are satisfied with a double bond, inaccordance with diazenide as well as pernitride com-pounds.30−36 As shown by a previous theoretical investigation,the lithium atoms do not transfer exactly one electron each;9
Bader charge calculations could provide a better idea of thecharge transferred from the lithium atoms to the nitrogendimers and thus help narrow down the exact nature of the N2bonding in LiN.The structure proposed for Cmcm LiN is very similar to its
low pressure phase, Immm LiN which was never observedduring our experiments.16 The latter also contains N2 dimerssurrounded by four lithium chains, this time perfectly straight.The N−N bond length measured here and its bond orderassignment are in agreement with the values determined fromImmm LiN where a double bond was suggested for the N2dimer, found to have an intramolecular distance of 1.301(3) Åat ambient pressure.16 The slight increase in N−N distances inCmcm LiN is expected since the lithium atoms in Cmcm LiNare forced to become closer to the nitrogen atoms than inImmm LiN (between 2.056 and 2.180 Å) while conserving thesame coordination of eight per N2. In turn, lithium atoms areexpected to transfer a larger electronic density to the N pairs,leading to the increase of their intramolecular distance. Thisphenomenon is observed in other compounds containingcharged nitrogen dimers, such as diazenides and perni-trides.33,36−39
The synthesis of Cmcm LiN is also in agreement withcalculations. The LiN stoichiometry appears stable on theenthalpy convex hull from ambient pressure up to 100 GPa.8,9
The Cmcm structure is predicted above 45 GPa, but threesimilar crystalline arrangements are expected more stable atlower pressures. The structure reported here is in perfectagreement with the one proposed by the calculations for CmcmLiN (see Table 2), which anticipate the compound to bemetallic, albeit a poor metal as it contains a low electrondensity at its Fermi energy. This is compatible with adetectable Raman signal, as shown below, particularly sinceDFT calculations tend to underestimate the electronic gap.The structure of the Cmcm LiN compound was followed by
powder X-ray diffraction between 19.0 and 73.6 GPa. Seven tonine X-ray diffraction lines could be followed in that pressurerange, and the continuous 2θ shift with pressure indicates no
obvious structural phase transition (see Figure 5). The latticevolume evolution with pressure is well fitted by a third-orderBirch−Murnaghan equation of state with the followingparameters: K0 = 112(19) GPa, K0′ = 3.2(4), and V0 =123(2) Å3. The determined bulk modulus is much larger thanthose measured in pure Li (11.3 GPa),40 ε-N2 (2.98 GPa)
41 aswell as β-Li3N (74 GPa), γ-Li3N (78 GPa),13,14 and LiN3 (19.1GPa).15 Similarly with transition metal-nitrides compounds,the low bond order of the N2 dimer is proposed to beresponsible for the Cmcm LiN high bulk modulus.36,42,43 Thisphenomenon is explained by the filling of the N2 molecularantibonding 1πg* states which results in both the elongation ofthe N−N bond and an increased repulsion between the two Natoms, leading to a higher bulk modulus.38,44 This assumptioncould be verified by performing crystal orbital Hamiltonpopulation (COHP) computations38,45 as other parameters arealso known to come into play, such as the atoms’ coordination,the bond’s length, and the overall iono-covalency of thematerial.46
The Cmcm phase was observed as (meta)stable down to19.0 GPa on decompression. At 14.5 GPa, the decompressedLiN samples produce broad diffraction lines and, combinedwith the multitude of diffraction lines produced by the δ′-N2phase (stable below 16 GPa),47 the Cmcm LiN lattice could nolonger be extractedFrom group theory analysis, Cmcm LiN is expected to have
12 Raman active modes as Γvib = 4Ag + 4B1g + B2g + 3B3g.Seven of those were detected, including three intense peaks atfrequencies between 900 and 1200 cm−1 and four muchweaker ones, with three of these below 800 cm−1 and the othernear 1670 cm−1 (see Figure 6). The three principal vibrons areat frequencies typically assigned to the stretching mode of N2molecules with a bond order between one and two, as triple-,double-, and single-bonded nitrogen dimers usually have afrequency of 2400 cm−1, 1300−1550 cm−1, and 700−850cm−1, respectively, at ambient conditions.16,28,29,32,38,48−50 ThisN−N bond order is consistent with the assignment proposedbased on the crystalline structure of Cmcm LiN. Upon thedecompression of the Cmcm LiN compound produced fromsample laser-heating above 45 GPa, a decrease in thevibrational modes’ intensity along with a broadening isobserved from 33.3 GPa. As seen from Figure 6, at 22.4GPa, the vibrational modes become difficult to identify. By16.7 GPa, they are completely gone. As the LiN stoichiometry(in the Immm arrangement) was reported stable down toambient conditions,16 a chemical decomposition of LiN isdeemed improbable. This is further supported by the lack ofappearance of new Raman modes indicative of another Li-N
Table 2. Comparison between the Experimentally andTheoretically Obtained Atomic Positions of the LiN(Cmcm) Compounda
LiN Li1 (0,y,0.25) Li2 (0,y,0.25) N (x,y,0.25)
experiment(73.6 GPa)
−0.395(1) −0.811(1) x = 0.327(1);y = −0.612(1)
theory (100 GPa)(ref 8)
−0.39946 −0.82072 x = 0.33284;y = −0.61220
aThe experimentally determined lattice parameters are a = 3.819(1)Å, b = 6.471(1) Å, and c = 3.446(1) Å (V = 85.16(2) Å3) at 73.6 GPa,while the theoretically determined lattice parameters are a = 3.73950Å, b = 6.36610 Å, and c = 3.35050 Å (V = 79.7621 Å3) at 100 GPa.8
The theoretical calculations do not provide the lattice parameters ofCmcm LiN at a lower pressure.
Inorganic Chemistry Article
DOI: 10.1021/acs.inorgchem.8b01325Inorg. Chem. 2018, 57, 10685−10693
10689

compound. Hence, to explain this phenomenon, a sluggishstructural phase transition from Cmcm toward one of thepredicted low pressure structures of LiN is proposed. Indeed,these other phases were calculated to be better metals thanCmcm, which could account for the progressive disappearanceof the Raman modes. This corroborates with the X-raydiffraction investigations from which the Cmcm lattice couldno longer be observed below 19.0 GPa, and no newunidentified peaks were detected. This could indicate that,perhaps due to the dragging phase transition, the new phase ispoorly crystallized or even amorphous.Lithium Diazenide LiN2. When heating the β-Li3N
compound at pressures above 10.5 GPa, new diffraction linesappear and the laser-heated portion of the solid visuallychanges from dark opaque to shiny white (see Figure 7). Thediffraction lines of the synthesized compound are best fitted bya hexagonal (P63/mmc) structure with lattice parameters of a =2.631(1) Å and c = 7.615(1) Å at 21.2 GPa. As shown inFigure 7, a Rietveld refinement could be performed on anintegrated X-ray diffraction pattern. The Li and N atoms were
resolved to sit on the 2a and 4f (z = 0.827(1)) Wyckoffpositions, respectively, thus corresponding to a LiN2stoichiometry. Its stoichiometric nature is ascertained throughthe same reasoning described for the LiN compound. Thenitrogen atoms in LiN2, similarly to those in the LiNcompound, are arranged in pairs, forming N2 dimers parallelto the c-axis. The structure adopted by LiN2 is akin to theNiAs-type structure, where the N2 molecule center of mass andthe Li atom occupy the position of the As anion and Ni cation,respectively. The lithium atoms as well as the N2 dimers are ina 6-fold coordination, with the former in an octahedral site,while the latter are in a trigonal prismatic coordination due tothe hcp packing.The N-N atoms forming the nitrogen dimers are at a
distance of 1.197 Å. Comparison to N−N distances incompounds with dimers of known bond order allows theassignment of a double bond, albeit this time closer to thetriple bond rather than the single bond. Again, this wasexpected based on purely stoichiometric considerations: with asingle lithium atom per nitrogen pair, an electron charge
Figure 5. (a) Unit cell volume of orthorhombic Cmcm LiN as a function of pressure. The data points were fitted with a third-order Birch−Murnaghan equation of state using V0 = 123(2) Å3, K0 = 112(19) GPa, and K0′ = 3.2(4) values, drawn as a full black line. (b) Evolution of the LiNcompound diffraction lines 2θ values with respect to pressure.
Figure 6. (a) Evolution of the main Raman modes of the LiN compound with pressure. (b) Cascade of selected spectra, where the ‡ and † symbolsmark peaks from pure N2 and LiN5, respectively. The intense mode around 1350 cm−1 and the broad peak at 2550 cm−1 are the diamond’s first-and second-order Raman modes. The dashed black lines are guides to the eye.
Inorganic Chemistry Article
DOI: 10.1021/acs.inorgchem.8b01325Inorg. Chem. 2018, 57, 10685−10693
10690
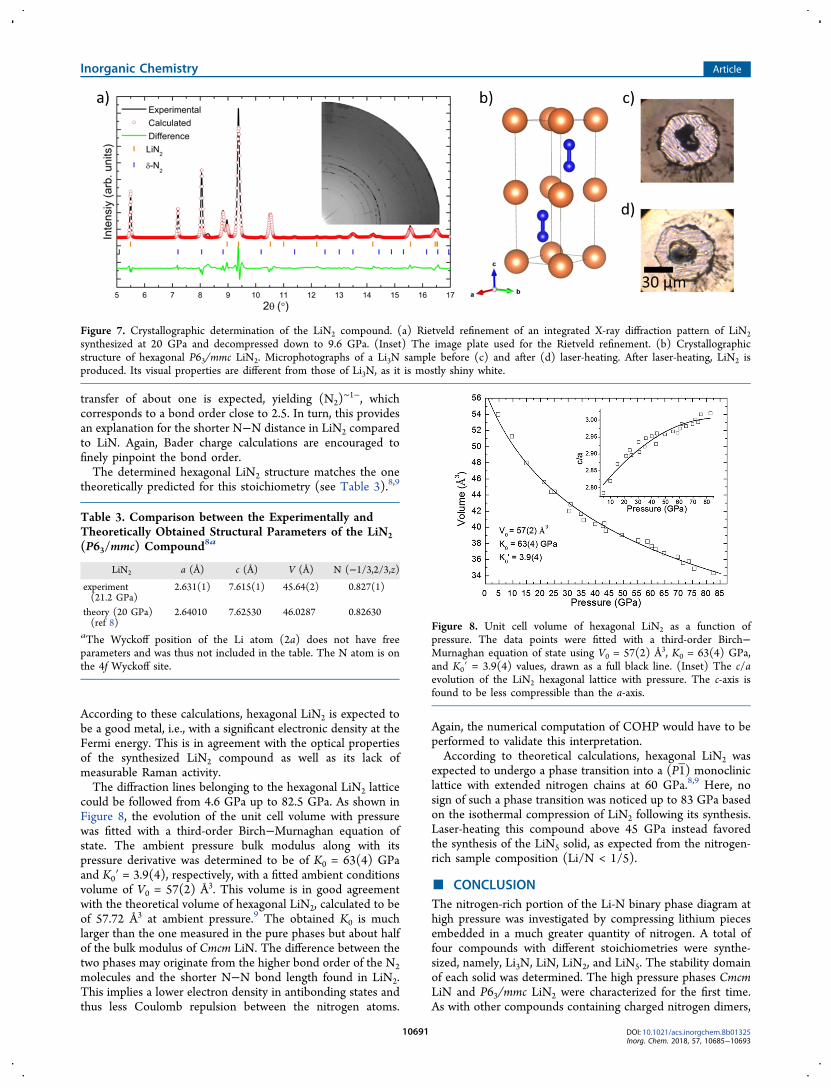
transfer of about one is expected, yielding (N2)∼1−, which
corresponds to a bond order close to 2.5. In turn, this providesan explanation for the shorter N−N distance in LiN2 comparedto LiN. Again, Bader charge calculations are encouraged tofinely pinpoint the bond order.The determined hexagonal LiN2 structure matches the one
theoretically predicted for this stoichiometry (see Table 3).8,9
According to these calculations, hexagonal LiN2 is expected tobe a good metal, i.e., with a significant electronic density at theFermi energy. This is in agreement with the optical propertiesof the synthesized LiN2 compound as well as its lack ofmeasurable Raman activity.The diffraction lines belonging to the hexagonal LiN2 lattice
could be followed from 4.6 GPa up to 82.5 GPa. As shown inFigure 8, the evolution of the unit cell volume with pressurewas fitted with a third-order Birch−Murnaghan equation ofstate. The ambient pressure bulk modulus along with itspressure derivative was determined to be of K0 = 63(4) GPaand K0′ = 3.9(4), respectively, with a fitted ambient conditionsvolume of V0 = 57(2) Å3. This volume is in good agreementwith the theoretical volume of hexagonal LiN2, calculated to beof 57.72 Å3 at ambient pressure.9 The obtained K0 is muchlarger than the one measured in the pure phases but about halfof the bulk modulus of Cmcm LiN. The difference between thetwo phases may originate from the higher bond order of the N2molecules and the shorter N−N bond length found in LiN2.This implies a lower electron density in antibonding states andthus less Coulomb repulsion between the nitrogen atoms.
Again, the numerical computation of COHP would have to beperformed to validate this interpretation.According to theoretical calculations, hexagonal LiN2 was
expected to undergo a phase transition into a (P1) monocliniclattice with extended nitrogen chains at 60 GPa.8,9 Here, nosign of such a phase transition was noticed up to 83 GPa basedon the isothermal compression of LiN2 following its synthesis.Laser-heating this compound above 45 GPa instead favoredthe synthesis of the LiN5 solid, as expected from the nitrogen-rich sample composition (Li/N < 1/5).
■ CONCLUSIONThe nitrogen-rich portion of the Li-N binary phase diagram athigh pressure was investigated by compressing lithium piecesembedded in a much greater quantity of nitrogen. A total offour compounds with different stoichiometries were synthe-sized, namely, Li3N, LiN, LiN2, and LiN5. The stability domainof each solid was determined. The high pressure phases CmcmLiN and P63/mmc LiN2 were characterized for the first time.As with other compounds containing charged nitrogen dimers,
Figure 7. Crystallographic determination of the LiN2 compound. (a) Rietveld refinement of an integrated X-ray diffraction pattern of LiN2synthesized at 20 GPa and decompressed down to 9.6 GPa. (Inset) The image plate used for the Rietveld refinement. (b) Crystallographicstructure of hexagonal P63/mmc LiN2. Microphotographs of a Li3N sample before (c) and after (d) laser-heating. After laser-heating, LiN2 isproduced. Its visual properties are different from those of Li3N, as it is mostly shiny white.
Table 3. Comparison between the Experimentally andTheoretically Obtained Structural Parameters of the LiN2(P63/mmc) Compound8a
LiN2 a (Å) c (Å) V (Å) N (−1/3,2/3,z)experiment(21.2 GPa)
2.631(1) 7.615(1) 45.64(2) 0.827(1)
theory (20 GPa)(ref 8)
2.64010 7.62530 46.0287 0.82630
aThe Wyckoff position of the Li atom (2a) does not have freeparameters and was thus not included in the table. The N atom is onthe 4f Wyckoff site.
Figure 8. Unit cell volume of hexagonal LiN2 as a function ofpressure. The data points were fitted with a third-order Birch−Murnaghan equation of state using V0 = 57(2) Å3, K0 = 63(4) GPa,and K0′ = 3.9(4) values, drawn as a full black line. (Inset) The c/aevolution of the LiN2 hexagonal lattice with pressure. The c-axis isfound to be less compressible than the a-axis.
Inorganic Chemistry Article
DOI: 10.1021/acs.inorgchem.8b01325Inorg. Chem. 2018, 57, 10685−10693
10691
a correlation between a low N2 bond order and a lowcompressibility was established. Interestingly, the Li-Nchemistry seems to be dictated by lithium’s electronic chargetransfer. Indeed, a direct correlation between the extra chargeper nitrogen atom (dependent on the compound’s stoichiom-etry) and the number of bonded nitrogen atoms is found. Inthe Li3N solid, there is an extra 3 e− per N atom which resultsin an atomic arrangement of nitrogen. For the LiN and LiN2solids, where there is a 1 e− per N and 0.5 e− per N,respectively, charged dimers are instead preferred. At still lowercharge per nitrogen, the lithium atoms are found to stabilize aN3
− chain in LiN3 (−1/3 e− per N). Finally, at a 0.2 e− per Natom, the pentazolate anion is formed in LiN5. These resultssuggest that, in the case of the Li-N2 system, longer nitrogenarrangements are favored by a small electron densitytransfer.The discovery of various stable compounds in theLi-N system under pressure illustrates that nitrogen-richnitrides in metal-N systems are a particularly compellingclass of materials to be explored at high pressure.
■ AUTHOR INFORMATIONCorresponding Author*E-mail: [email protected] Laniel: 0000-0002-6889-9820Paul Loubeyre: 0000-0002-1778-3510NotesThe authors declare no competing financial interest.
■ ACKNOWLEDGMENTSThe authors gratefully acknowledge the Centre Nationald’Etudes Spatiales (CNES) and the Natural Sciences andEngineering Research Council of Canada (NSERC) forfinancially supporting the Ph.D. of D.L. The authors alsoacknowledge the European Synchrotron Radiation Facility(ESRF) for provision of beamtime at the ID27 beamline underproposal HC-3387. We wish to thank G. Garbarino, V. Svitlyk,and M. Mezouar for their assistance with the X-ray diffractionexperiments.
■ REFERENCES(1) Donges, E. Alkali Metals. In Handbook of Preparative InorgativeChemistry; Brauer, G., Ed.; Academic Press: London, 1963; Vol. 1, p984.(2) Rabenau, A. Lithium Nitride and Related Materials Case Studyof the Use of Modern Solid State Research Techniques. Solid StateIonics 1982, 6 (4), 277−293.(3) Shodai, T.; Okada, S.; Tobishima, S.; Yamaki, J. AnodePerformance of a New Layered Nitride Li3_ CoxN (X = 0.2−0.6).J. Power Sources 1997, 68, 515−518.(4) Sun, Y.; Li, Y.; Sun, J.; Li, Y.; Pei, A.; Cui, Y. Stabilized Li3N forEfficient Battery Cathode Prelithiation. Energy Storage Mater. 2017, 6,119−124.(5) Chen, P.; Xiong, Z.; Luo, J.; Lin, J.; Tan, K. L. Interaction ofHydrogen with Metal Nitrides and Imides. Nature 2002, 420 (6913),302−304.(6) O’Loughlin, J. L.; Wallace, C. H.; Knox, M. S.; Kaner, R. B.Rapid Solid-State Synthesis of Tantalum, Chromium, and Molybde-num Nitrides. Inorg. Chem. 2001, 40 (10), 2240−2245.(7) Fair, H. D.; Walker, R. F. Energetic Materials; Plenum Press: NewYork, 1977.(8) Peng, F.; Yao, Y.; Liu, H.; Ma, Y. Crystalline LiN5 Predictedfrom First-Principles as a Possible High-Energy Material. J. Phys.Chem. Lett. 2015, 6, 2363−2366.
(9) Shen, Y.; Oganov, A. R.; Qian, G.; Dong, H.; Zhu, Q.; Zhou, Z.;Zhang, J. Novel Lithium-Nitrogen Compounds at Ambient and HighPressures. Sci. Rep. 2015, 5, 14204.(10) Prasad, D. L. V. K.; Ashcroft, N. W.; Hoffmann, R. EvolvingStructural Diversity and Metallicity in Compressed Lithium Azide. J.Phys. Chem. C 2013, 117, 20838−20846.(11) Zhang, M.; Yan, H.; Wei, Q.; Wang, H.; Wu, Z. Novel High-Pressure Phase with Pseudo-Benzene N6Molecule of LiN3. EPL2013, 101 (101), 26004.(12) Beister, H.; Haag, S.; Kniep, R.; Strossner, K.; Syassen, K. PhaseTransformations of Lithium Nitride under Pressure. Angew. Chem.,Int. Ed. Engl. 1988, 27 (8), 1101−1103.(13) Lazicki, A.; Maddox, B.; Evans, W. J.; Yoo, C. S.; McMahan, A.K.; Pickett, W. E.; Scalettar, R. T.; Hu, M. Y.; Chow, P. New CubicPhase of Li3N: Stability of the N3- Ion to 200 GPa. Phys. Rev. Lett.2005, 95, 165503.(14) Ho, A. C.; Granger, M. K.; Ruoff, A. L.; Van Camp, P. E.; VanDoren, V. E. Experimental and Theoretical Study of Li3N at HighPressure. Phys. Rev. B: Condens. Matter Mater. Phys. 1999, 59 (9),6083−6086.(15) Medvedev, S. A.; Trojan, I. A.; Eremets, M. I.; Palasyuk, T.;Klapotke, T. M.; Evers, J. Phase Stability of Lithium Azide atPressures up to 60 GPa. J. Phys.: Condens. Matter 2009, 21 (19),195404.(16) Schneider, S. B.; Frankovsky, R.; Schnick, W. LithiumDiazenide High-Pressure Synthesis and Characterization of the AlkaliDiazenide Li2N2. Angew. Chem., Int. Ed. 2012, 51, 1873−1875.(17) Laniel, D.; Weck, G.; Gaiffe, G.; Garbarino, G.; Loubeyre, P.High-Pressure Synthesized Lithium Pentazolate Compound Meta-stable under Ambient Conditions. J. Phys. Chem. Lett. 2018, 9, 1600−1604.(18) Takemura, K.; Dewaele, A. Isothermal Equation of State forGold with a He-Pressure Medium. Phys. Rev. B: Condens. MatterMater. Phys. 2008, 78, 104119.(19) Dewaele, A.; Torrent, M.; Loubeyre, P.; Mezouar, M.Compression Curves of Transition Metals in the Mbar Range:Experiments and Projector Augmented-Wave Calculations. Phys. Rev.B: Condens. Matter Mater. Phys. 2008, 78 (10), 104102.(20) Ohta, K.; Ichimaru, K.; Einaga, M.; Kawaguchi, S.; Shimizu, K.;Matsuoka, T.; Hirao, N.; Ohishi, Y. Phase Boundary of Hot DenseFluid Hydrogen. Sci. Rep. 2015, 5, 16560.(21) Desgreniers, S.; Lagarec, K. XRDA : A Program for Energy-Dispersive X-Ray Diffraction Analysis on a PC. J. Appl. Crystallogr.1994, 27 (3), 432−434.(22) Prescher, C.; Prakapenka, V. B. DIOPTAS: A Program forReduction of Two-Dimensional X-Ray Diffraction Data and DataExploration. High Pressure Res. 2015, 35 (3), 223−230.(23) Rodriguez-Carvajal, J. Recent Advances in Magnetic StructureDetermination Neutron Powder Diffraction. Phys. B 1993, 192 (1),55−69.(24) Weck, G.; Datchi, F.; Garbarino, G.; Ninet, S.; Queyroux, J.-A.;Plisson, T.; Mezouar, M.; Loubeyre, P. Melting Curve and LiquidStructure of Nitrogen Probed by X-Ray Diffraction to 120 GPa. Phys.Rev. Lett. 2017, 119, 235701.(25) Benedetti, L. R.; Loubeyre, P. Temperature Gradients,Wavelength-Dependent Emissivity, and Accuracy of High and Very-High Temperatures Measured in the Laser-Heated Diamond Cell.High Pressure Res. 2004, 24 (4), 423−445.(26) Chandrasekhar, H.; Bhattacharya, G.; Migoni, R.; Bilz, H.Infrared and Raman Spectra and Lattice Dynamics of the SuperionicConductor Li3N. Phys. Rev. B: Condens. Matter Mater. Phys. 1978, 17(2), 884−893.(27) Eremets, M. I.; Gavriliuk, A. G.; Serebryanaya, N. R.; Trojan, I.A.; Dzivenko, D. A.; Boehler, R.; Mao, H. K.; Hemley, R. J. StructuralTransformation of Molecular Nitrogen to a Single-Bonded AtomicState at High Pressures. J. Chem. Phys. 2004, 121 (22), 11296−11300.(28) Schneider, S. B.; Frankovsky, R.; Schnick, W. Synthesis ofAlkaline Earth Diazenides MAEN2 (MAE = Ca, Sr, Ba) by Controlled
Inorganic Chemistry Article
DOI: 10.1021/acs.inorgchem.8b01325Inorg. Chem. 2018, 57, 10685−10693
10692

Thermal Decomposition of Azides under High Pressure. Inorg. Chem.2012, 51 (4), 2366−2373.(29) Auffermann, G.; Prots, Y.; Kniep, R. SrN and SrN 2: Diazenidesby Synthesis under. Angew. Chem., Int. Ed. 2001, 40 (3), 547−549.(30) Young, A. F.; Sanloup, C.; Gregoryanz, E.; Scandolo, S.;Hemley, R. J.; Mao, H. K. Synthesis of Novel Transition MetalNitrides IrN2 and OsN2. Phys. Rev. Lett. 2006, 96, 155501.(31) Crowhurst, J. C.; Goncharov, A. F.; Sadigh, B.; Evans, C. L.;Morrall, P. G.; Ferreira, J. L.; Nelson, A. J. Synthesis andCharacterization of the Nitrides of Platinum and Iridium. Science2006, 311, 1275−1278.(32) Crowhurst, J. C.; Goncharov, A. F.; Sadigh, B.; Zaug, J. M.;Aberg, D.; Meng, Y.; Prakapenka, V. B. Synthesis and Character-ization of Nitrides of Iridium and Palladium. J. Mater. Res. 2008, 23(1), 1−5.(33) Niwa, K.; Dzivenko, D.; Suzuki, K.; Riedel, R.; Troyan, I.;Eremets, M.; Hasegawa, M. High Pressure Synthesis of Marcasite-Type Rhodium Pernitride. Inorg. Chem. 2014, 53 (2), 697−699.(34) Niwa, K.; Suzuki, K.; Muto, S.; Tatsumi, K.; Soda, K.;Kikegawa, T.; Hasegawa, M. Discovery of the Last Remaining BinaryPlatinum-Group Pernitride RuN2. Chem. - Eur. J. 2014, 20 (43),13885−13888.(35) Niwa, K.; Terabe, T.; Kato, D.; Takayama, S.; Kato, M.; Soda,K.; Hasegawa, M. Highly Coordinated Iron and Cobalt NitridesSynthesized at High Pressures and High Temperatures. Inorg. Chem.2017, 56, 6410−6418.(36) Bhadram, V. S.; Kim, D. Y.; Strobel, T. A. High-PressureSynthesis and Characterization of Incompressible Titanium Perni-tride. Chem. Mater. 2016, 28 (6), 1616−1620.(37) Laniel, D.; Dewaele, A.; Garbarino, G. High Pressure and HighTemperature Synthesis of the Iron Pernitride FeN 2. Inorg. Chem.2018, 57 (11), 6245−6251.(38) Wessel, M.; Dronskowski, R. Nature of N-N Bonding withinHigh-Pressure Noble-Metal Pernitrides and the Prediction ofLanthanum Pernitride. J. Am. Chem. Soc. 2010, 132, 2421−2429.(39) Niwa, K.; Ogasawara, H.; Hasegawa, M. Pyrite Form of Group-14 Element Pernitrides Synthesized at High Pressure and HighTemperature. Dalt. Trans. 2017, 46, 9750−9754.(40) Hanfland, M.; Loa, I.; Syassen, K.; Schwarz, U.; Takemura, K.Equation of State of Lithium to 21 GPa. Solid State Commun. 1999,112, 123−127.(41) Olijnyk, H. High Pressure X-Ray Diffraction Studies on SolidN2 up to 43.9 GPa. J. Chem. Phys. 1990, 93 (12), 8968.(42) Laniel, D.; Dewaele, A.; Anzellini, S.; Guignot, N. Study of theIron Nitride FeN into the Megabar Regime. J. Alloys Compd. 2018,733, 53−58.(43) Gregoryanz, E.; Sanloup, C.; Somayazulu, M.; Badro, J.; Fiquet,G.; Mao, H.; Hemley, R. J. Synthesis and Characterization of a BinaryNoble Metal Nitride. Nat. Mater. 2004, 3 (5), 294−297.(44) Zhang, M.; Cheng, K.; Yan, H.; Wei, Q.; Zheng, B. ElectronicBonding Analyses and Mechanical Strengths of IncompressibleTetragonal Transition Metal Dinitrides TMN2 (TM = Ti, Zr, andHf). Sci. Rep. 2016, 6 (1), 36911.(45) Dronskowski, R.; Blochl, P. E. Crystal Orbital HamiltonPopulations (COHP). Energy-Resolved Visualization of ChemicalBonding in Solids Based on Density-Functional Calculations. J. Phys.Chem. 1993, 97, 8617−8624.(46) Xu, B.; Wang, Q.; Tian, Y. Bulk Modulus for Polar CovalentCrystals. Sci. Rep. 2013, 3 (1), 3068.(47) Stinton, G. W.; Loa, I.; Lundegaard, L. F.; McMahon, M. I. TheCrystal Structures of δ and δ Nitrogen. J. Chem. Phys. 2009, 131 (10),104511.(48) Eremets, M. I.; Gavriliuk, A. G.; Trojan, I. A.; Dzivenko, D. A.;Boehler, R. Single-Bonded Cubic Form of Nitrogen. Nat. Mater. 2004,3, 558−563.(49) Schneider, H.; Hafner, W.; Wokaun, A.; Olijnyk, H. RoomTemperature Raman Scattering Studies of External and InternalModes of Solid Nitrogen at Pressures 8 ≤ P ≤ 54 GPa. J. Chem. Phys.1992, 96 (11), 8046.
(50) Young, A. F.; Montoya, J. A.; Sanloup, C.; Lazzeri, M.;Gregoryanz, E.; Scandolo, S. Interstitial Dinitrogen Makes PtN2 anInsulating Hard Solid. Phys. Rev. B: Condens. Matter Mater. Phys.2006, 73 (15), 153102.
Inorganic Chemistry Article
DOI: 10.1021/acs.inorgchem.8b01325Inorg. Chem. 2018, 57, 10685−10693
10693


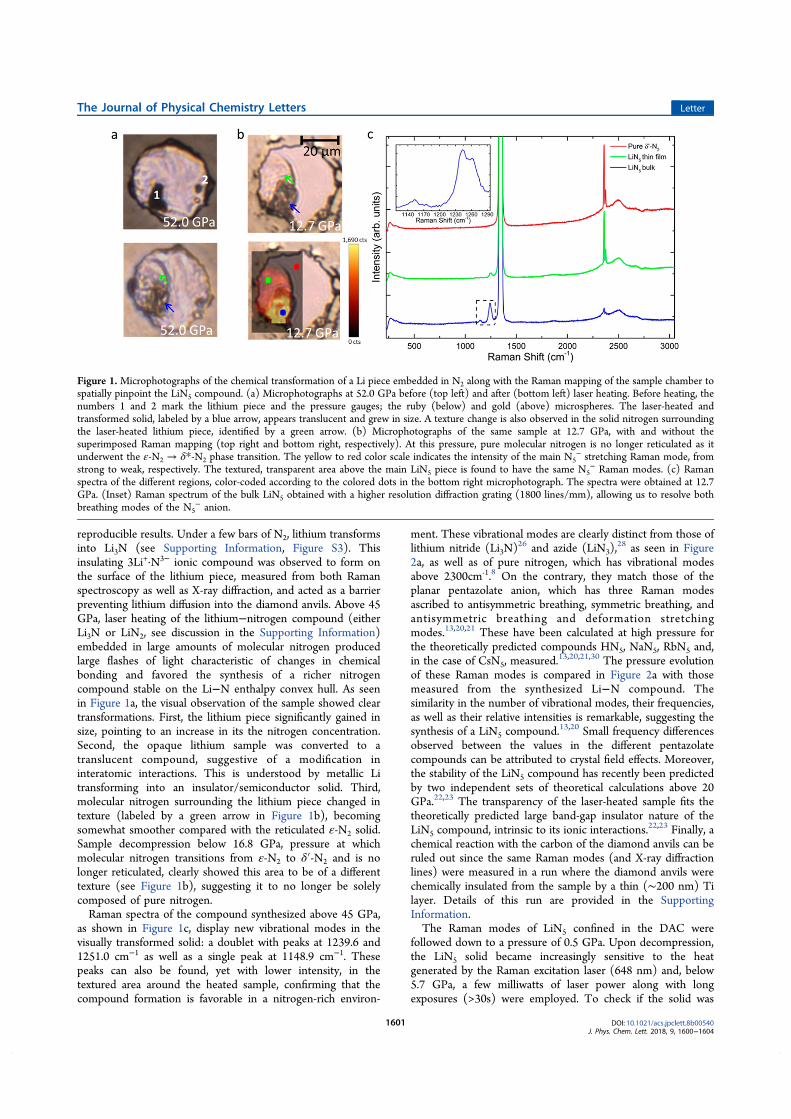


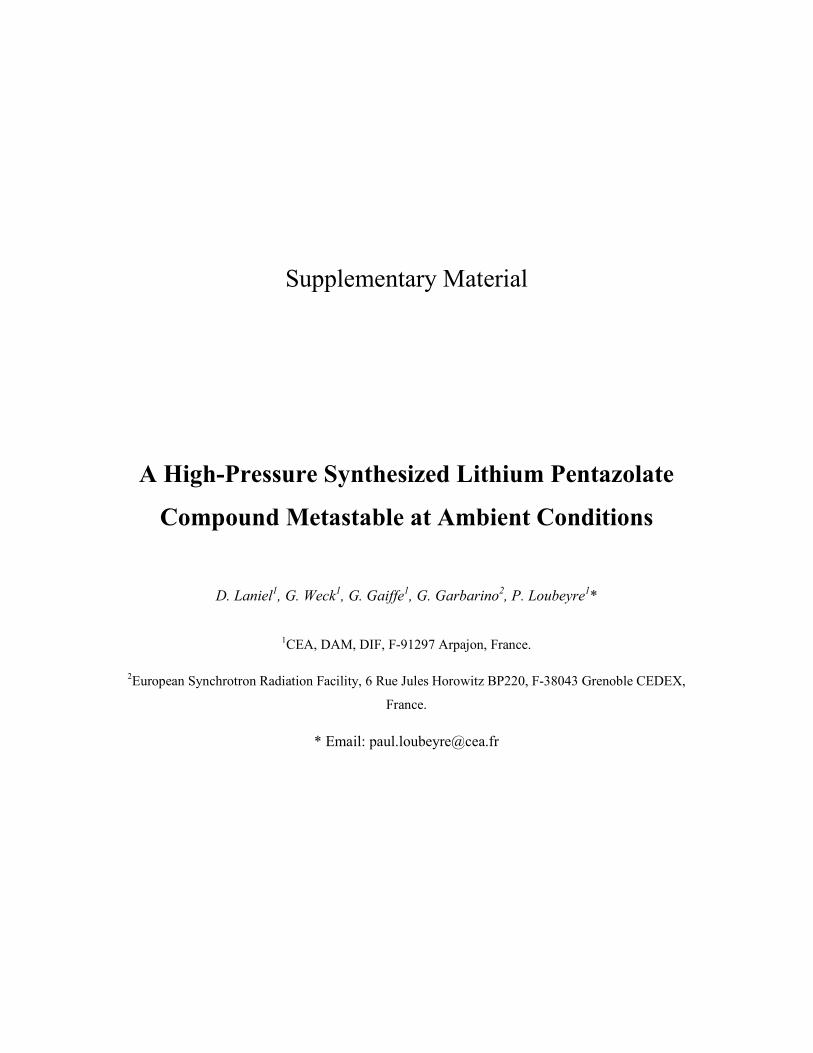
Supplementary Material
A High-Pressure Synthesized Lithium Pentazolate
Compound Metastable at Ambient Conditions
D. Laniel1, G. Weck
1, G. Gaiffe
1, G. Garbarino
2, P. Loubeyre
1*
1CEA, DAM, DIF, F-91297 Arpajon, France.
2European Synchrotron Radiation Facility, 6 Rue Jules Horowitz BP220, F-38043 Grenoble CEDEX,
France.
* Email: [email protected]

Materials and Methods
Figures S1-S7
Tables S1
Experimental method
A few pure lithium flakes of typically about 10x10x5 µm3 in size were positioned on
one of the diamond anvils, with culet diameter of 150 to 300 µm, in a glovebox under argon
gas. Rhenium was used as the gasket material. A small ruby chip or gold micrograin was with
the sample and used to determine the pressure inside the experimental chamber.1,2 The
diamond anvil cell (DAC) sample chamber was then loaded with pure molecular nitrogen
(1400 bars) in a high pressure vessel. Pure nitrogen, acting as both a pressure transmitting
medium and a reagent, was always largely in excess with respect to lithium. It was verified by
Raman spectroscopy that no water contamination of the lithium sample had occurred during
the loading process.
In one run, titanium was sputtered as a thin layer (200 nm) on both diamond anvils to
act as a chemical insulator.3 The same Raman modes and X-ray diffraction patterns were
measured, confirming the formation of the LiN5 compound.
Raman Spectroscopy
Confocal Raman spectroscopy measurements were performed using an Alpha300M+
(WITec). Sample excitation was done with a continuous Ar-Kr laser employing the 647.1 nm
line, focused down to less than 1 µm. The Stokes Raman signal was collected in back-
scattering geometry by a CCD coupled, unless state otherwise, to a 600 lines/mm grating,

allowing a spectral resolution of approximately 8 cm-1. Automated motorized sample
positioning with piezo-driven X-Y scan stages of submicron accuracy allowed for precise
Raman mapping of the sample. A laser power of about 60 mW (measured before entering the
DAC) was typically used, except upon decompressing LiN5 down to low pressures (< 20
GPa), for which it was reduced down to 10 mW in order not to damage or melt the LiN5
compound. Typical acquisition times were of 30 seconds with 60 mW and 4 minutes with 10
mW of laser power.
Mass spectrometry
Flow injection analysis (FIA) electrospray ionization mass spectrometry (ESI-MS)
was performed on a TSQ Quantum Access MAX mass spectrometer (Thermo Scientific). The
instrument was run in the negative ion mode with the capillary voltage at -2500 V. All
samples were dissolved in 50 µL of methanol, which were injected 15 µL at a time in the 10
µL injection loop and then carried into mass spectrometer through a continuous flow of 200
µL/min of methanol. In order to fine tune the experimental parameters and the sample
preparation method, initial tests were performed on dehydrated LiN3 samples, prepared in the
argon-filled glovebox. At first, a macroscopic quantity of LiN3 was dissolved in 50 µL of
methanol and ran through the mass spectrometer, which gave an intense signal. Then, a
microscopic LiN3 sample (~ 20x20x5 µm3), closer in size to the LiN5 samples, was put on a
small quartz plate which was subsequently dropped in a bottle containing 50 µL of methanol.
While the measured signal was significantly weaker, the N3- mass was unambiguously
recorded at 42.5 Da. For the LiN5 measurements, the DAC was carefully opened up in the
glovebox, releasing left-over pressure and gaseous N2, and the heterogeneous sample
containing the LiN5 compound was picked up from the diamond anvils and put on a quartz
plate, which was then dropped in a bottle containing 50 µL of methanol. Reference samples
were made up of a quartz plate submerged in 50 µL of methanol. Correspondingly to its
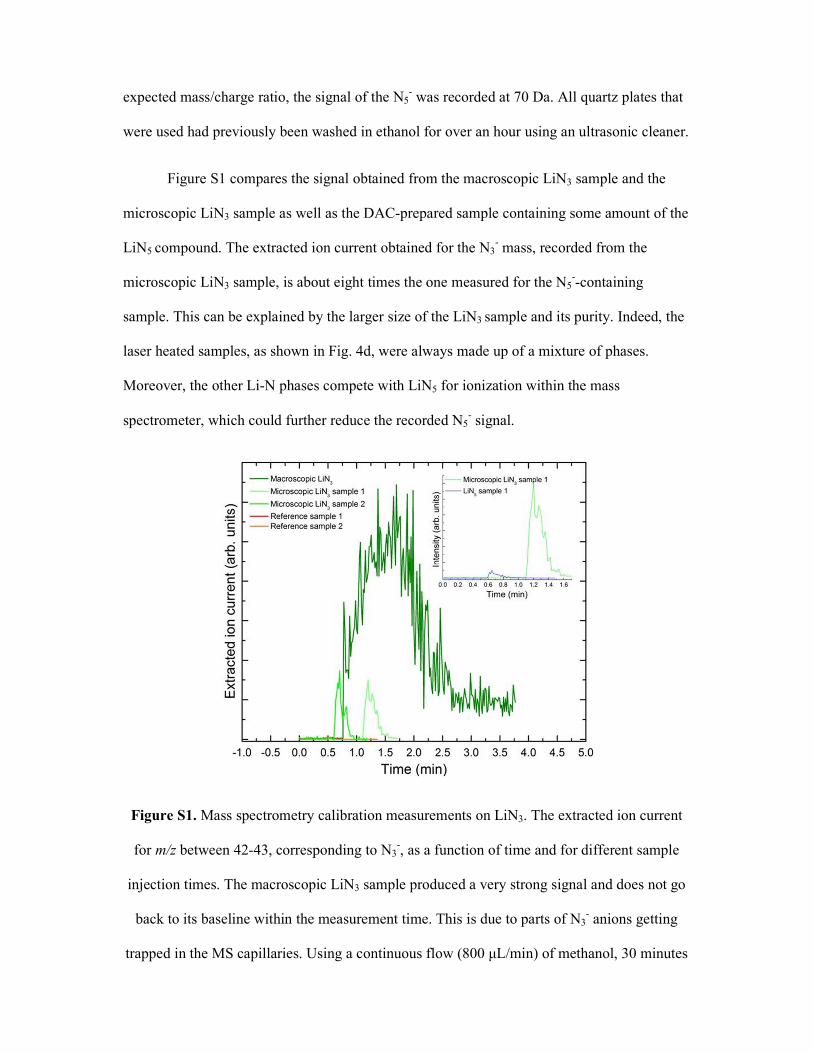
expected mass/charge ratio, the signal of the N5- was recorded at 70 Da. All quartz plates that
were used had previously been washed in ethanol for over an hour using an ultrasonic cleaner.
Figure S1 compares the signal obtained from the macroscopic LiN3 sample and the
microscopic LiN3 sample as well as the DAC-prepared sample containing some amount of the
LiN5 compound. The extracted ion current obtained for the N3- mass, recorded from the
microscopic LiN3 sample, is about eight times the one measured for the N5--containing
sample. This can be explained by the larger size of the LiN3 sample and its purity. Indeed, the
laser heated samples, as shown in Fig. 4d, were always made up of a mixture of phases.
Moreover, the other Li-N phases compete with LiN5 for ionization within the mass
spectrometer, which could further reduce the recorded N5- signal.
Figure S1. Mass spectrometry calibration measurements on LiN3. The extracted ion current
for m/z between 42-43, corresponding to N3-, as a function of time and for different sample
injection times. The macroscopic LiN3 sample produced a very strong signal and does not go
back to its baseline within the measurement time. This is due to parts of N3- anions getting
trapped in the MS capillaries. Using a continuous flow (800 µL/min) of methanol, 30 minutes

were needed to remove the left-over N3-. The signal recorded from the microscopic LiN3
samples was unsurprisingly much weaker and did go back to its baseline. (Inset) Comparison
of the intensity measured from the microscopic LiN3 sample and the LiN5-containing sample.
In part due to its greater quantity, the N3- signal is about six times stronger than that of N5
-.
Figure S2 shows the raw spectra for the methanol reference sample, LiN3 and the LiN5
sample, all with an identically-prepared small quartz plate. While the spectra are undoubtedly
polluted with contaminants, probably picked up from the glove box manipulations, it is noted
that all three of them contain the same parasitic peaks, observed at similar intensities.
However, there is indubitably a peak appearing at the m/z ratio corresponding to LiN5 when
injecting the LiN5 sample, peak that is not apparent in the LiN3 and reference (solely
methanol) samples. Four sets of LiN5 samples, produced from two separate diamond anvil cell
experiments, were tested out. The results presented in Fig. 3 of the manuscript are the (time)
integrated averages of these samples, shown along with the reference samples. These averages
clearly show the presence of a peak corresponding to the m/z ratio of the N5- ion. Of course,
we also clearly see from the spectra shown in Fig. S2 the strong peak of the N3- ion from the
LiN3 sample, marked by an arrow.
Luckily, the N5- anion has a very unique mass/charge ratio. Upon looking-up common
databases such as massbank.jp and mzcloud.org, no plausible, common or less common,
compounds that could be in the glovebox or in the diamond anvil cell are found, even with
high tolerances (± 1 m/z) on the search parameters.

Figure S2. Raw mass spectrometry spectra. The reference (methanol), LiN3 and LiN5 samples
were all prepared with quartz plates. a) The black, blue and red spectra were acquired during
the injection of the reference, LiN3 and LiN5 samples, respectively. b) Enlargement of the 65-
73.5 m/z ratio zone. Upon the injection of the LiN5 sample, a peak appears in the region of
interest (a m/z of 70).
X-ray diffraction
X-ray diffraction measurements were performed on the ID27 beamline of the ESRF in
angular-dispersive mode. The X-ray beam, with λ = 0.3738 Å, was focused by two
Kirkpatrick-Baez mirrors and cleaned by one pinhole to a ~5x5 µm2 spot on the sample. The
sample to detector distance was calibrated using a CeO2 reference sample. X-ray powder
diffraction patterns collected on a MAR-CCD detector were integrated using DIOPTAS and
analyzed using the XRDA as well as the FULLPROF softwares.4–6

Laser-heating
The double-sided sample laser-heating was performed at the ESRF ID27 beamline and
at our laboratory, using either YLF lasers. Pure lithium or LiN2, both metals, were used as
YLF laser absorbers. Temperature was not accurately determined because the synthesis of
LiN5 produces very large and brief emissions of light which perturb the pyrometric
measurements. Still it was estimated that temperatures above 1200 K were needed to initiate
the chemical reaction.
Other observed Li-N phases
While the full data on these phases will be presented elsewhere, more information on
the synthesized Li-N phases are given below to support our claims.
Li3N
Li3N, typically produced by burning lithium under an atmosphere of N2,7 was found to
be produced spontaneously from pure lithium and molecular nitrogen under pressure. The
Raman spectra, measured at pressures as low as 4 GPa (see Fig. S2), show peaks
characteristic of Li3N.8,9 However, a complete transformation does not occur as the sample
does not become translucent upon undergoing the β→γ phase transition, as observed in pure
β-Li3N.7,10–12 Therefore Li3N is thought to form on the surface of the pure Li piece; at the pure
Li/pure N2 interface. This protecting Li3N layer prevents the diffusion of lithium, otherwise
known to corrode and break diamond anvils at about 20 GPa.13

Figure S3. Raman spectra of Li3N at various pressures. Raman modes measured after loading
the sample and increasing the pressure on the pure lithium embedded in pure molecular
nitrogen. The measured modes all belong to Li3N, as neither pure N2 nor pure metallic Li
have measurable vibrational modes in this frequency range, below 16 GPa.14 The spectra at
20.9 GPa has a slightly larger peak at about 400 cm-1, due to the overlapping ε-N2 lattice
modes.15 (Inset) Microphotograph of the Li3N sample at 4.0 GPa.
LiN2
Laser-heating the Li3N-covered lithium sample between 20 and 45 GPa was found to
produce a previously unreported phase. The lattice was determined to be hexagonal and adopt
the P63/mmc space group. This assignment matches perfectly a theoretically predicted phase
with the LiN2 stoichiometry.16,17 Table S1 shows the LiN2 compound crystallographic
parameters at 9.6 GPa, including the position of both Li and N atoms. The Rietveld
refinement shown in Fig. S3a validates the crystal structure described above, which is drawn
in Fig. S3b. The lattice parameters of LiN2 could be obtained from 4.6 to 82.5 GPa.
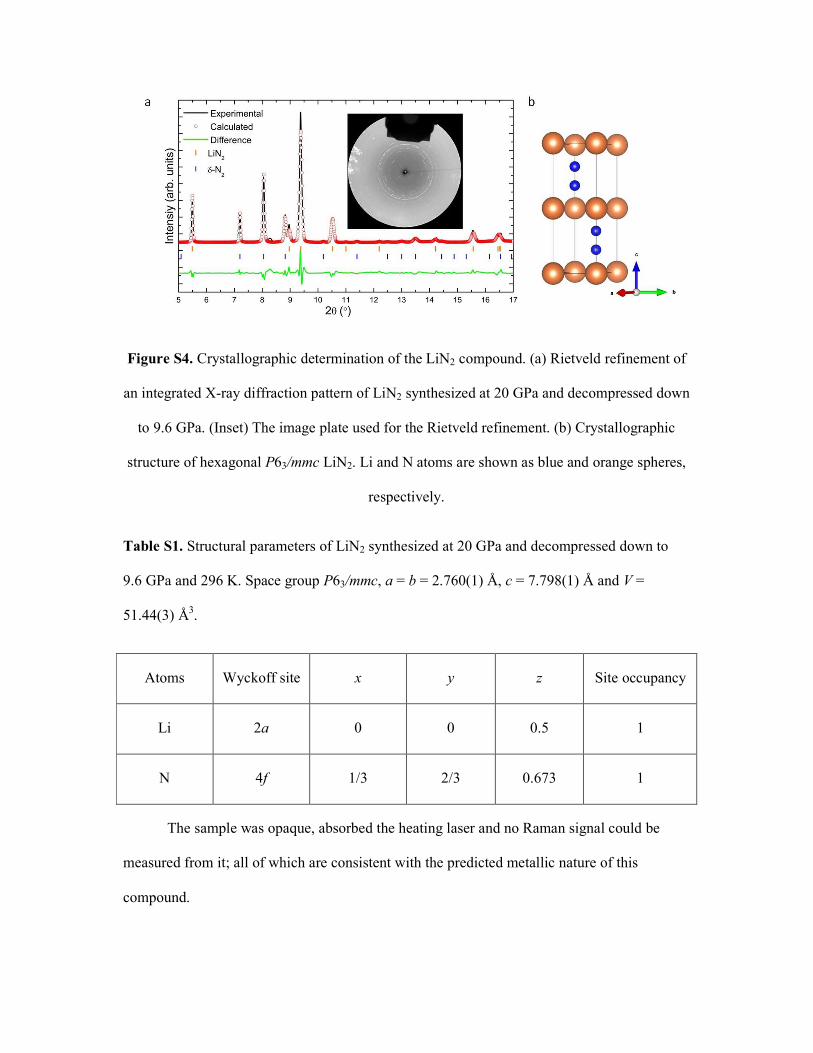
Figure S4. Crystallographic determination of the LiN2 compound. (a) Rietveld refinement of
an integrated X-ray diffraction pattern of LiN2 synthesized at 20 GPa and decompressed down
to 9.6 GPa. (Inset) The image plate used for the Rietveld refinement. (b) Crystallographic
structure of hexagonal P63/mmc LiN2. Li and N atoms are shown as blue and orange spheres,
respectively.
Table S1. Structural parameters of LiN2 synthesized at 20 GPa and decompressed down to
9.6 GPa and 296 K. Space group P63/mmc, a = b = 2.760(1) Å, c = 7.798(1) Å and V =
51.44(3) Å3.
Atoms Wyckoff site x y z Site occupancy
Li 2a 0 0 0.5 1
N 4f 1/3 2/3 0.673 1
The sample was opaque, absorbed the heating laser and no Raman signal could be
measured from it; all of which are consistent with the predicted metallic nature of this
compound.

LiNx
While the orthorhombic LiNx compound was sometimes measured in small amounts
by X-ray diffraction after laser-heating at 25.2 GPa, it was always produced in significant
quantities upon laser-heating the samples above 45 GPa. By an X-ray diffraction
characterization, it was found fairly homogeneously across the sample albeit on its edges
where it was mixed with LiN5 and therefore of slightly weaker intensity. The LiNx compound
is interpreted as being of intermediate stoichiometry, between that of LiN2 and LiN5. Indeed,
LiNx was found favored in regions of the lithium sample in contact with a lower nitrogen
quantity, whereas LiN5 is definitely found in the high-nitrogen concentration regions. Figure
S4 shows a Le Bail refinement of its orthorhombic (Pca/21) unit cell at 73.6 GPa. The sample
had previously been laser-heated at 20.0 GPa, producing LiN2, and laser-heated again at 73.6
GPa. The data quality did not allow to determine the content of its lattice. Its unit cell
parameters were followed down to 14.5 GPa. The diffraction lines associated with the LiNx
compound were checked against all predicted Li-N solids but no match could be made.

Figure S5. Le Bail refinement of an integrated X-ray diffraction pattern obtained from a
sample at 73.6 GPa, after laser-heating. The Li-N compound with a stoichiometry LiNx was
determined to have an orthorhombic (Pca21) lattice with parameters of a = 6.898(1) Å, b =
3.748(1) Å and c = 3.238(1) Å, giving a volume of V = 83.71(2) Å3. An arrow indicates a
diffraction lines attributed to ζ-N2, recognizable on the image plate by its distinct texture.18
LiN5
Despite many attempts, a clean diffraction pattern containing solely the diffraction
lines of the LiN5 compound could not be obtained. This can be explained by a number of
reasons. First, due to molecular nitrogen concentration and temperature gradients across the
sample during laser-heating, the synthesis of a variety of Li-N phases is possible. This results
in the observed sample heterogeneity. Second, the focused X-ray beam probes a 10 µm2
sample region over which it is difficult to isolate a pure LiN5 phase. In order to improve
sample homogeneity, very small lithium pieces were loaded in the DAC, increasing the
amount of lithium in contact with molecular nitrogen. Unfortunately, these samples produced
mostly thin films of LiN5, which were either poorly crystalized or too fine to provide a

sufficient X-ray diffraction signal. Obviously, Raman spectroscopy, with a less-than micron
probed area, of poor sensitivity towards metallic phases (like LiN2) and with very clear, non-
overlapping characteristic vibrational modes, did not as much suffer from the lack of chemical
homogeneity.
Figure S6. Evolution of the LiN5 diffraction lines with pressure. Blue dashed lines are guides
for the eye. The (hkl) assignment, corresponding to a monoclinic (P2) lattice is given for each
peak.
As shown in Fig. S5, the diffraction lines characteristic of LiN5 were followed from
73.6 GPa down to 6.4 GPa, through multiple samples. Other diffraction lines belonging to the
LiN5 compound were hidden by the diffraction peaks of the other phases such as LiN2, LiNx,
Li3N as well as pure nitrogen. From one sample, studied uniquely at 73.6 GPa by X-ray
diffraction, a higher quality diffraction pattern was obtained and nine diffraction lines allowed

the suggestion of a unit cell for the LiN5 compound. This diffraction pattern is shown in Fig.
4d.
Experimental run with titanium-covered diamond anvils
The diamond anvils were coated with a layer of about 200 nm in thickness. The
lithium sample was gently positioned directly on top of the Ti layer on the anvil. The sample
was compressed up to 59.8 GPa, pressure at which it was laser-heated. The sample was then
brought to the synchrotron where X-ray diffraction was performed. Figure S7a shows an X-
ray diffraction pattern, where the two main peaks of LiN5 are distinctly visible and identified.
As always, LiNx and LiN2 along with pure N2 peaks are also observed. The sample was
decompressed down to 48.5 GPa, after which Raman spectroscopy measurements were
performed. A spectrum at 16.7 GPa is provided in Fig. S7b. The three vibrational modes of
the pentazolate anion are observed. Microphotographs of the sample are shown in Fig. 4 of
the main paper.
Figure S7. a) X-ray diffraction pattern of a Li-N sample laser-heated at 59.8 GPa with
diamonds coated with a thin Ti layer. After laser-heating, new diffraction peaks were

observed. The peaks marked with an asterisk belong to LiN5 while the empty and full circles
correspond to LiN2 and LiNx, respectively. b) Raman spectrum of the sample after its
decompression down to 16.7 GPa. The three signature Raman modes of LiN5 are visible.

References
(1) Takemura, K.; Dewaele, A. Isothermal Equation of State for Gold with a He-Pressure
Medium. Phys. Rev. B 2008, 78, 104119.
(2) Dewaele, A.; Torrent, M.; Loubeyre, P.; Mezouar, M. Compression Curves of
Transition Metals in the Mbar Range: Experiments and Projector Augmented-Wave
Calculations. Phys. Rev. B 2008, 78, 104102.
(3) Ohta, K.; Ichimaru, K.; Einaga, M.; Kawaguchi, S.; Shimizu, K.; Matsuoka, T.; Hirao,
N.; Ohishi, Y. Phase Boundary of Hot Dense Fluid Hydrogen. Nat. Sci. Reports 2015,
5, 16560.
(4) Desgreniers, S.; Lagarec, K. XRDA : A Program for Energy-Dispersive X-Ray
Diffraction Analysis on a PC. J. Appl. Crystallogr. 1994, 27, 432–434.
(5) Prescher, C.; Prakapenka, V. B. DIOPTAS : A Program for Reduction of Two-
Dimensional X-Ray Diffraction Data and Data Exploration. High Press. Res. 2015, 35,
223–230.
(6) Rodriguez-Carvajal, J. Recent Advances in Magnetic Structure Determination Neutron
Powder Diffraction. Phys. B Condens. Matter 1993, 192, 55–69.
(7) Dönges, E. Alkali Metals. In Handbook of preparative inorgative chemistry; Brauer,
G., Ed.; Academic Press: London, 1963; Vol. 1, p 984.
(8) Kress, W.; Grimm, H.; Press, W.; Lefebvre, J. Lattice Vibrations in Lithium Nitride,
Li3N. Phys. Rev. B 1980, 22, 4620–4625.
(9) Chandrasekhar, H.; Bhattacharya, G.; Migoni, R.; Bilz, H. Infrared and Raman Spectra
and Lattice Dynamics of the Superionic Conductor Li3N. Phys. Rev. B 1978, 17, 884–

893.
(10) Ho, A. C.; Granger, M. K.; Ruoff, A. L.; Van Camp, P. E.; Van Doren, V. E.
Experimental and Theoretical Study of Li3N at High Pressure. Phys. Rev. B 1999, 59,
6083–6086.
(11) Lazicki, A.; Maddox, B.; Evans, W. J.; Yoo, C. S.; McMahan, A. K.; Pickett, W. E.;
Scalettar, R. T.; Hu, M. Y.; Chow, P. New Cubic Phase of Li3N: Stability of the N3-
Ion to 200 GPa. Phys. Rev. Lett. 2005, 95, 165503.
(12) Beister, H.; Haag, S.; Kniep, R.; Strössner, K.; Syassen, K. Phase Transformations of
Lithium Nitride under Pressure. Angew. Chem. Int. Ed. Engl. 1988, 27, 1101–1103.
(13) Hanfland, M.; Loa, I.; Syassen, K.; Schwarz, U.; Takemura, K. Equation of State of
Lithium to 21 GPa. Solid State Commun. 1999, 112, 123–127.
(14) Scheerboom, M. I. M.; Schouten, J. A. Orientational Behavior of Solid Nitrogen at
High Pressures Investigated by Vibrational Raman Spectroscopy. J. Chem. Phys. 1996,
105, 2553–2560.
(15) Goncharov, A. F.; Gregoryanz, E.; Mao, H. K.; Liu, Z.; Hemley, R. J. Optical Evidence
for a Nonmolecular Phase of Nitrogen above 150 GPa. Phys. Rev. Lett. 2000, 85,
1262–1265.
(16) Peng, F.; Yao, Y.; Liu, H.; Ma, Y. Crystalline LiN5 Predicted from First-Principles as a
Possible High-Energy Material. J. Phys. Chem. Lett. 2015, 6, 2363–2366.
(17) Shen, Y.; Oganov, A. R.; Qian, G.; Dong, H.; Zhu, Q.; Zhou, Z. Novel Lithium-
Nitrogen Compounds at Ambient and High Pressures. Sci. Rep. 2015, 5, 1–8.
(18) Gregoryanz, E.; Goncharov, A. F.; Sanloup, C.; Somayazulu, M.; Mao, H. K.; Hemley,

R. J. High P-T Transformations of Nitrogen to 170 GPa. J. Chem. Phys. 2007, 126,
184505.

204
205
CONCLUSIONS
Polynitrogen compounds are seen as top performers to store chemical energy
and would be the ultimate high energy density materials (HEDM), if recoverable at
ambient conditions. Over the past decade, after many attempts testing various
thermodynamical compression and decompression paths, it is now recognized that
polymeric nitrogen is not recoverable at ambient pressure after its high pressure
synthesis. The aim of this thesis was to search for polynitrogen compounds produced
under pressure which could approach the properties of polymeric nitrogen but be
obtained at less stringent conditions and recoverable at ambient pressure. The crux of
our strategy was to mix nitrogen to another element. Doing so, various effects can be
tuned such as chemical pre-compression, electron density transfer, topochemistry,
change of concentration, etc. Mixtures best covering the range of these effects were
selected for investigation. As such, the N2-Xe, N2-H2 and N2-Li systems were studied. We
discuss below the efficiency of these various physicochemical effects offered by the
addition of one element to nitrogen. Then, some future studies and ideas to progress
will be presented.
Exploring the phase diagram of pure nitrogen is useful to gain insights on the
behavior and chemical reactivity of the nitrogen molecule under pressure. At pressures
below 100 GPa, pure nitrogen solid presents a rich polymorphism with the lower
pressure structures (< 50 GPa) governed by the quadrupole-quadrupole (QQ) van der
Waals interaction. Similarly, the binary phase diagrams of N2 with H2 and N2 with Xe
show stoichiometric compounds of which the structure is driven by the QQ interaction.
Specifically, in the case of N2-H2 mixtures remarkable clathrate host- guest structures
have been discovered. In the Xe-N2 system, the cubic to tetragonal martensitic phase
transition in Xe(N2)2 is similar to the β→δ phase transition in pure solid nitrogen. Two
such phases were known so far, cg-N at 110 GPa and LP-N at 125 GPa. In fact, many
forms of polynitrogens are expected to exist at sufficient pressure, one of which was
discovered in this thesis. Pure molecular nitrogen compressed to 244 GPa and laser-
heated to a temperature of 3300 K resulted in the synthesis of a novel form of polymeric
nitrogen (HLP-N) composed of sp3 bonded N atoms forming layers of linked nitrogen

206
hexagons. In Xe-N2, it is only around 150 GPa that a polymeric Xe-N compound is
produced, based on new diffraction lines as well as low frequency Raman modes.
Compression of a N2(H2)2 single crystal resulted in a chemical reaction near 50 GPa. The
reaction products were determined to be mainly composed of NH3, accompanied with a
lower proportion of longer azanes, considered as promising high energy density
entities. Last but not least, the LiN5 solid was produced from Li-N2 above 45 GPa. Unlike
the other novel polynitrogen forms, lithium pentazolate did not decompose during
pressure release and was retained down to ambient conditions. Both N2-H2 and Li-N2
systems are clear demonstrations that mixing nitrogen with an interacting element (i.e.
not noble gases) is an adequate pathway for the synthesis of polynitrogen compounds at
pressures lower than for pure N2. This is in accordance with theoretical calculations
[23,47,56,48–55] as well as recent experimental work, as in the case of the high
pressure synthesis of CsN5, N8 and ReN8·xN2 from CsN3-N2, hydrazinium azide and Re-
N2, respectively [48,265,266]. Moreover, as it will be justified below, the ambient
conditions metastability of a compound might not be as critical as initially supposed.
Two of the studied systems, Xe-N2 and Li-N2, relied on the chemical
precompression effect to observe novel polynitrogen geometries. In both mixtures,
interesting results were obtained. In the case of xenon-nitrogen mixtures, it was found
that Xe(N2)2 has N2-N2 distances that, at only 30 GPa, match the intermolecular length
found in pure N2 at about 80 GPa [127]. This intermolecular closeness was also felt in
the N2 stretching modes of Xe(N2)2 as a distinct redshift was detected starting at that
pressure. In analogy with pure nitrogen, it is generally accepted that the redshift
measured indicates the weakening of the N2 triple bond due to a redistribution of
electronic density, with electrons shifting from the covalent bond to the intermolecular
zone. However, is the bond really weakened? If so, is it actually significant? Based on the
formula describing the Raman modes frequencies,2 a decrease in ωr is undoubtedly the
sign of a bond weakening as the mass at play do not change. However, even in Xe(N2)2
where the bond frequency goes down to 2200 cm-1 (2330 cm-1 at ambient conditions in
pure N2), it is still very far from even a N=N double bond which has a Raman frequency
of about 1300−1550 cm-1. To provide further perspective, at ambient conditions the
nitrogen triple-bond has a cohesive energy of 942 kJ/mol while it is of 418 kJ/mol for a
double-bond. Thus, the N2 bond in Xe(N2)2 (or the SXe alloy, for that matter) is by no
means weak and while it is indeed weakened, the energy required to break it is still
significant. Indeed, the formation of the polymeric Xe-N solid occurs at pressures higher
than that of cg-N. As such, the effect of chemical precompression by an element with a
2 In the previous sections, the formula
was introduced, where ωr is the Raman
frequency, K is the spring constant (related to the bond strength) and δ is the effective mass of the system.

207
large atomic radii, while it negligibly weakens the N-N triple bond, does not seem to be
the most efficient route for obtained polynitrogen compounds.
On the other hand, the results obtained with the Li-N2 system tell us a
completely different story on the effect of chemical precompression. In that case
however, the chemical precompression effect is achieved through an electronic density
transfer. This methods appears unquestionably more efficient as for a Li/N ratio of 3
(Li3N), the N2 molecule is completely broken up at ambient pressure, as well as for a
Li/N ratio of 1 and 0.5 (LiN and LiN2) low bond order pernitrides are formed. Even in
the case of LiN5, with a Li/N ratio of only 0.2, a pentazolate anion is formed, albeit at 45
GPa. What would happen if molecular nitrogen were to be mixed with an element that
can provide not one, but two electrons, like alkaline earth metals? Moreover, what of
transition metals, such as iron, since they are known to have a wide range of oxidation
states, reaching even 7+ [267]? Preliminary answers to these questions will be given
below.
The chemical change in the N2-H2 mixture, although at lower pressure than in
pure N2, is not due to chemical pre-compression but probably to the quantum effect of
the hydrogen. Indeed, the nitrogen molecules appear unperturbed (i.e. not chemically
interacting) up to about 50 GPa as their vibrational modes were not observed to be
redshifted. Nonetheless, a chemical reaction spontaneously occurs, without even the
need for laser-heating to cross an energy barrier, and a variety of azanes (with mainly
NH3) are determined to be produced. Hydrogen is one of the few elements for which
quantum tunneling was observed to play an active role in solid state transformations at
ambient or near ambient temperatures [268,269]. This is explained by its small mass,
making hydrogen more mobile than other atoms in the solid. As such, it can more easily
explore the energy landscape around a given structural arrangement. Having in mind
the structure of the N2(H2)2 compound (as well as the (N2)6(H2)7), it is possible that a
combination of sample topology and proton tunneling promotes a chemical reaction.
With increasing pressure changing the energy landscape, as soon as the energy barrier
is low and thin enough, the hydrogen atoms would shifts towards this (local) minima ‒
of lower energy than the van der Waals compounds ‒ and induce a chemical
transformation of the whole sample. This type of local diffusion and transformation
could explain the variety of azanes, as each segment of the N2(H2)2 molecular nitrogen
sublattice would be more favorable for forming either an NH3 or a longer azane. An
investigation of N2-D2 mixtures seems to validate this theory as no chemical reaction
was reported up to 70 GPa, which could thus be attributed to the mass of deuterium
which makes quantum tunneling less probable and pushes back the pressure of
chemical reaction [270]. It has to be considered that perhaps a global energy minimum
for the system could be obtained through laser-heating. Theoretical simulations provide

208
further weight to this hypothesis as they predict compounds that were not
experimentally observed, such as ones containing the energetic N5-.
FROM THEORETICAL PREDICTIONS TO EXPERIMENTS
Theoretical calculations, and especially enthalpy convex hulls, are a great help to
guide experimentalists towards the most profitable systems to investigate, the
concentration and pressure range under which these systems should be studied and the
compounds that can be expected. Additionally, the X-ray diffraction data quality is often
far from optimal for solids synthesized under high pressure and high temperature, as
discussed above, and while their lattices may reliably be determined, their full
structural resolution is often difficult. In these circumstances, calculations are of further
utility. Indeed, with the insight provided by the theoretical calculations, the structure of
N32, Cmcm LiN and LiN2 (along with those of FeN and FeN2 presented in the Annex)
could be fully solved.
However, these calculations have a few shortcomings and still are a ways off
from removing the need to perform experiments. A problematic assumption for high
pressure-high temperature syntheses is that the calculations are performed at the
temperature of absolute zero, henceforth removing the temperature-entropy (-TS) term
from the Gibbs free energy equation. For systems in which a small enthalpy gaps exists
between two structures, accounting for this extra term can shift the presumed stable
compound to unstable. This is especially concerning as significant laser-heating is
typically needed to cross activation barriers between two compounds.
Of related nature, enthalpy-based theoretical calculations usually fail at
predicting the van der Waals compounds’ stability. This is the case for both the N2-H2
and the Xe-N2 systems, where the (N2)6(H2)7, N2(H2)2 as well as the Xe(N2)2 compounds
were not expected by the calculations, despite investigating the pressure domain at
which they are experimentally shown to be stable [18,21,23]. Such van der Waals
compounds were previously demonstrated to be largely stabilized due to entropy
considerations [190]. The entropic term’s importance is further exacerbated in the case
of N2(H2)2 and Xe(N2)2 where the nitrogen molecules are rotationally disordered. The
presence of the van der Waals compound provides an explanation as to why, in the case
of N2-H2 mixtures, the experimental results are so far off the theoretical calculations.
Of course, other issues may prevent accurate theoretical calculations such as the
limitations on the unit cell lattice size, unaccounted compound stoichiometries,

209
inadequate functionals, quantum contributions (especially in the case of hydrogen), a
complex Gibbs free energy landscape (polymorphism), etc. This sort of complications
could justify the discrepancies between two sets of calculations performed at zero
kelvin and with different codes as well as with experiments ‒ as in the case of the
structure prediction for the LiN5 compound and the high pressure polymeric phases of
pure nitrogen [12,28,29].
Thus, to improve both experimental efficiency and the theoretical calculations’
reliability, a close interaction between the two disciplines is essential.
HIGH PRESSURE SYNTHESIS OF POLYNITROGEN COMPOUNDS: THE
NEXT STEPS.
In this thesis, we have successfully demonstrated that the pressure parameter is
an efficient tool for discovering new forms of polynitrogen. While the LiN5 solid is a
promising first step, where should we go from there in order to produce even better
poly-N solids? Given the current state of research, suggestions will be made. However,
hurdles are currently impeding the applicability of high pressure syntheses for real-
world applications. Notably, these are metastability issues as well as very high pressure
of syntheses; accurate and large throughput compound prediction; and the
experimental characterization of the produced solids. Hereafter, we will also describe
recent and upcoming advancements that allow to overcome these obstacles and that
could help propel high pressure chemistry at the forefront of industrial applications.
Polynitrogen compounds: where to now?
Based on the success obtained by mixing lithium and molecular nitrogen, it
would seem that the reduction of N2 is the most efficient pathway to the low pressure
synthesis of a high energy density polynitrogen solid. This begs the question: would
mixing nitrogen with elements having even higher oxidation state than lithium yield
longer anionic single-bonded N-N chains obtainable at still moderate pressures?
Theoretical calculations on alkaline earth-nitrogen mixtures indicate the answer to this
question to be a resounding yes. At only 40 GPa, a BeN4 solid containing a charged 3D
puckered [N10]1.7- with single-bonded N-N atoms is predicted to be stable [52,271].
Similarly anionic polynitrogen arrangements are also expected from high density Mg-N2
and Ca-N2 mixtures [49,272]. What then of transition metals, which have a wide range
of oxidation states? The answer here is not as clear. While charged N2 dimers have been

210
observed to form in many N2-transition metal mixtures (Fe, Ti, Cu, Pt, Ir, Os) up to
pressures of about 70 GPa [123,161,273–275], there is only one reported case of longer-
than two single-bonded nitrogen chains: the ReN8·xN2 inclusion compound [266].
However, that solid was produced at pressures over 100 GPa; similar to that of cg-N.
This indicates that while they can reach high oxidation states, they are not sufficiently
reactive (i.e. willing to part with a fraction of their electronic density) to promote at
moderate pressures single-bonded N-N forms.
While the mixtures described above aimed at stabilizing anionic polynitrogen
arrangements, cationic geometries are also predicted to be stable, such as N4+, N5
+ N9+
[35,36]. In particular, N5+ was synthesized in the N5AsF6 and N5SbF6 compounds and the
latter was even determined as stable at ambient conditions [38]. So far, the N2-halogens
binary phase diagram is completely uncharted at high pressures, with the exception of
the fluorine-rich side of the N2-F binary phase diagram, which was investigated by
theoretical calculations up to 300 GPa [276]. The high pressure oxidization of molecule
N2 could prove to be an interesting pathway for novel polynitrogens.
Last but not least, further experiments could be performed on pure molecular
nitrogen. As previously described, cg-N is calculated to be stable above 50 GPa but a
very large activation barrier needs to be crossed to observe its transformation from its
molecular form. Moreover, laser-heating fails at polymerizing nitrogen since entropy
favors the molecular phases [135]. Mechanochemistry and photochemistry ‒ by
employing a rotational diamond anvil cell and exciting molecular N2 with extreme
ultraviolet photons, respectively ‒ can both provide additional energy to the system
without heating it. As such, both methods could potentially enable the moderate
pressure synthesis of cg-N.
All of the aforementioned experiments can be performed with the current
technical capabilities. In the next sections, we will discuss the future developments that
will largely shape the future of polynitrogen syntheses.
Producing high pressure phases at “ambient conditions”
Diamond, which is a high pressure phase of carbon (> 10 GPa), is routinely
produced at near ambient pressure [277]. These synthetic diamonds are grown by
chemical vapor deposition (CVD) through the exposition a 1% CH4-99% H2 mixture to a
hot filament (1200 K) in a reactor at a pressure of 2700 Pa [278]. In a similar fashion, in
2017 a team claimed to have grown thin rods (few nanometers) of cg-N. Radio-
frequency plasma enhanced CVD was successfully employed by flowing a mixture of 1:1

211
molecular nitrogen and argon over bulk β-sodium azide [279]. As such, it is
demonstrated that this method can allow the ambient conditions productions of
metastable high pressure phases. While it can not yet be applied to all compounds, the
rapid development of this field is undoubtedly promising.
Chemical vapor deposition is not the only method permitting this. Indeed,
another technique was also demonstrated to be able to produce high pressure
polymorphs. In 2011, a phase of aluminum predicted stable above 380 GPa was
obtained by an ultrafast laser-induced microexplosion confined inside the bulk of a
sapphire ( -Al2O3) [280]. This is explained by the fact that the laser pulse causes the
solid to superheat and form a plasma. The confined plasma then explodes and generates
a powerful shock wave that expands and compresses the surrounding material. The
transformed material is preserved on account of the compressed sapphire surrounding
it. This is all performed using a tabletop apparatus. According to other reports, this
shock wave can generate pressures of over 10 TPa [281]. With this in mind, not only
could static high pressure phases be produced at “ambient conditions”, but this could be
extended to phases synthesized in the terapascal regime.
Machine learning
The CAS (Chemical Abstract Service) registry contains more than 142 million
unique organic and inorganic chemical substances (alloys, minerals, mixtures, polymers,
salts) [282]. On average, 15000 compounds are added daily. What kind of method,
technique or person could go through all of these compounds and extract correlation
and trends? Data mining and machine learning are the key to this challenge. Through
data mining, huge amount information can be gathered, processed and analyzed by a
computer, after which with machine learning, it is able to make predictions. For
example, as discussed in the introduction of this thesis, the conditions for the
metastability of a compound were provided based on a data mining study that looked at
29902 compounds, including 15097 ambient conditions metastable compounds [46].
The trends observed matched common physico-chemistry notions (for example, that
there is a strong link between metastability and the cohesion energy of a material) but it
also allowed to find that while polymorphs with a larger amount of components have
both a lower activation barrier and a lower propensity to form, compounds resulting
from a phase separation have a much higher activation barrier and higher probability to
be produced.
The same team then used machine learning to predict novel metastable
nitrogen-rich nitrides [51]. To do so, it fed the data mined nitrides compounds (both

212
stable and metastable) to a computer which, through statistical methods, was trained to
search for the metastable phases. Afterwards, it was able to predict a multitude of
nitrogen-rich compounds, including the FeN2 pernitride (which we experimentally
obtained, as detailed in the Annex). What's important to understand is that the training
data set based on which the computer later makes his predictions critically needs to
have "good" and "bad" data. When the researchers wanted to determine novel
metastable nitrogen-rich nitrides, they also provided in the training data set nitrogen-
poor stable compounds. Basically, machine learning allows us to learn from our
mistakes as much as from our successes.
In the end, data mining and machine learning are very promising tools for an
accurate, very high throughput prediction of compounds with specific properties,
whether its metastability, precise band gap value, high superconductivity, high energy
density or a combination of characteristics. Henceforth, this will contribute to a much
faster convergence towards the most appropriate material for given circumstances as
well as permit more complex systems (multi-elements) to be investigated.
Development of experimental techniques
With high predictability and ambient conditions production, all that is left is the
step in between: the high pressure synthesis and characterization, validating the
compound’s stability, structure and properties. In that regard as well, critical
advancements are taking place which will allow for higher pressures, more accurate
structural determinations and the high pressure implementation of new
characterization methods.
First on the list is the improvement of synchrotron-generated light. For example,
with the upcoming fourth generation synchrotrons, large gains in X-ray spot size (from
a few micrometers down to a few hundred of nanometers) along with an increase in
brilliance are expected. This will drastically augment the spatial resolution ‒ which will
definitely in obtaining single phase diffraction images of an inhomogeneous laser-
heated sample ‒ as well as permit the study of smaller samples sizes. The latter is
particularly helpful since as of now, new diamond anvil geometries (described in the
Experimental Techniques in High Pressure Physics section) have been developed but the
very tiny sample sizes were prohibitive for their X-ray diffraction characterization
[79,80].
Still on the subject of X-ray diffraction characterization, the conjunction of
improved single crystal data analysis software and an elaborate data post-treatment

213
now enables the single crystal X-ray diffraction structural resolving of novel high
pressure phases produced by short burst laser-heating [115]. Indeed, this technique is
highly advantageous due to the intrinsic precision of single crystal X-ray diffraction and
since a compound transformed by brief laser-heating typically forms multiple
nanocrystals discernable from the powdery untransformed solid. This method was
recently validated by fully resolving the structure of a ReN8·xN2 inclusion compound
above 100 GPa and 2300K, without the support of theoretical calculations [266]. As the
experimental high pressure structure solving has become more and more reliant on
theory, this approach critically allows for experiments to regain their self-sufficiency.
In a similar line of thought, novel laser-heating anvil geometries are also under
development. The boron-doped diamond disks acting as laser absorbers described
earlier are being improved such as a pure diamond disk with a thin metal absorbing
layer protected by a thin diamond coating is underway. The advantage over the boron-
doped diamond disks is that those disks' exterior will be exclusively constituted of
diamond, which is highly chemically inert. This means that it will be possible to
uniformly heat non-absorbing samples ‒ hence enabling homogenous samples in their
thermodynamic global minima ‒ without being concerned of inducing a parasitic
chemical reaction.
With the ever progressing technological developments, the future of high
pressure chemistry ‒ and in particular of polynitrogen syntheses ‒ is just in its infancy.
Eventually, it is bound to become as versatile and accomplished as conventional
ambient conditions chemistry.

214

215
ANNEX
I. HIGH PRESSURE INVESTIGATION OF IRON AND NITROGEN: THE
SEARCH FOR AN IRON PERNITRIDE
In parallel with the investigations performed in the context of my thesis, a study
on the high pressure and high temperature behavior of iron and nitrogen mixtures was
also completed. This research was motivated by the fact that transition metal nitrides
have been known for a while to be a large group of industrially relevant compounds
with outstanding physical properties: hardness, high bulk modulus and high melting
point [283,284]. For example, steel nitrides form at the surface of steels through a high
temperature reaction with a nitrogen-rich gas; this layer improves the fatigue and
corrosion resistance of the material. These solids typically have a metal-nitrogen ratio
greater than one [274]. Moreover, these studies undertaken on the Fe-N system were
also motivated by recent studies which have shown that a new class of compounds can
be formed by the application of extreme pressures and temperatures: transition metal
pernitrides.
The transition metal pernitrides are particularly interesting as the pernitrides –
charged nitrogen dimmers – are known to lead to a high bulk modulus, leading in some
cases to ultrahigh incompressibilities [124,161,285–288]. The unique characteristic of
nitrogen pernitrides is attributed to the significant transition metal-nitrogen charge
transfer and the lower than three bonding order of the N-N dimer [124,161,274]. In
turn, this leads to the filling of N-N antibonding molecular orbitals (1πg*) concomitantly
with the progressive transfer of electronic density from the transition-metal element to
the N2 dimer. Filled molecular antibonding states result in an increased repulsion
between the two N atoms, thus leading to the higher bulk modulus [55,289]. The most
famous among them, as well as the very first to be synthesized, is PtN2 which as a bulk
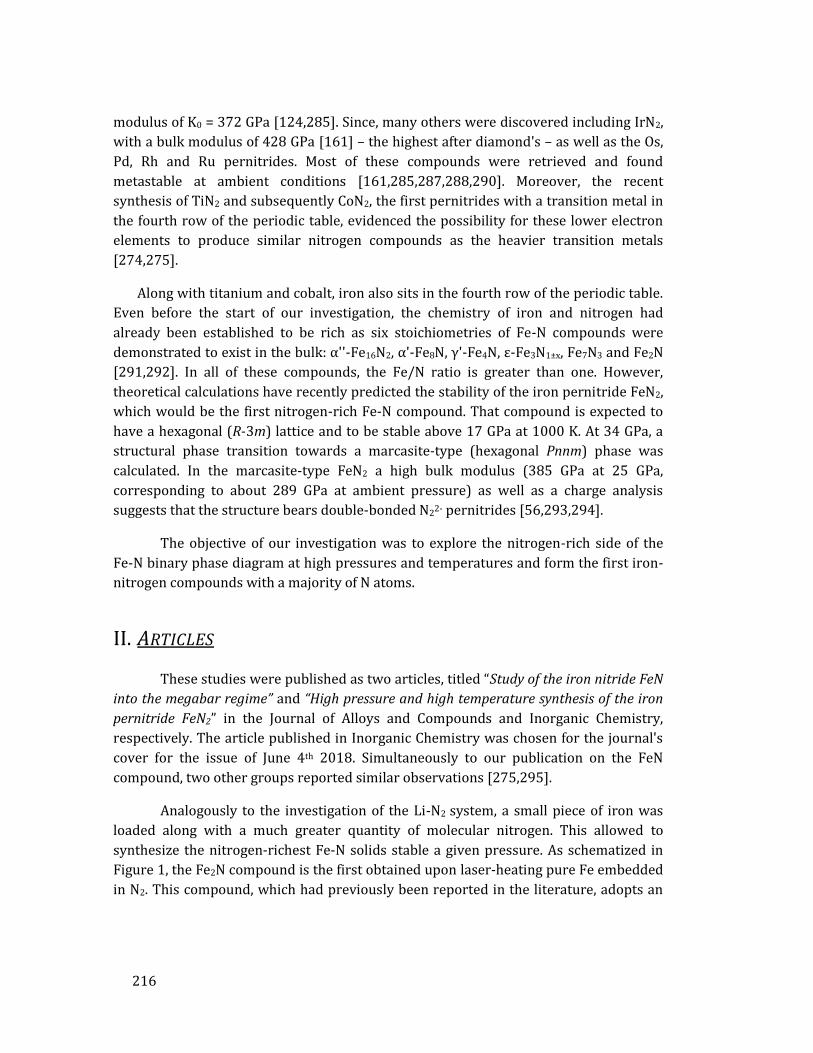
216
modulus of K0 = 372 GPa [124,285]. Since, many others were discovered including IrN2,
with a bulk modulus of 428 GPa [161] – the highest after diamond's – as well as the Os,
Pd, Rh and Ru pernitrides. Most of these compounds were retrieved and found
metastable at ambient conditions [161,285,287,288,290]. Moreover, the recent
synthesis of TiN2 and subsequently CoN2, the first pernitrides with a transition metal in
the fourth row of the periodic table, evidenced the possibility for these lower electron
elements to produce similar nitrogen compounds as the heavier transition metals
[274,275].
Along with titanium and cobalt, iron also sits in the fourth row of the periodic table.
Even before the start of our investigation, the chemistry of iron and nitrogen had
already been established to be rich as six stoichiometries of Fe-N compounds were
demonstrated to exist in the bulk: ''-Fe16N2, '-Fe8N, γ'-Fe4N, ε-Fe3N1±x, Fe7N3 and Fe2N
[291,292]. In all of these compounds, the Fe/N ratio is greater than one. However,
theoretical calculations have recently predicted the stability of the iron pernitride FeN2,
which would be the first nitrogen-rich Fe-N compound. That compound is expected to
have a hexagonal (R-3m) lattice and to be stable above 17 GPa at 1000 K. At 34 GPa, a
structural phase transition towards a marcasite-type (hexagonal Pnnm) phase was
calculated. In the marcasite-type FeN2 a high bulk modulus (385 GPa at 25 GPa,
corresponding to about 289 GPa at ambient pressure) as well as a charge analysis
suggests that the structure bears double-bonded N22- pernitrides [56,293,294].
The objective of our investigation was to explore the nitrogen-rich side of the
Fe-N binary phase diagram at high pressures and temperatures and form the first iron-
nitrogen compounds with a majority of N atoms.
II. ARTICLES
These studies were published as two articles, titled “Study of the iron nitride FeN
into the megabar regime” and “High pressure and high temperature synthesis of the iron
pernitride FeN2” in the Journal of Alloys and Compounds and Inorganic Chemistry,
respectively. The article published in Inorganic Chemistry was chosen for the journal's
cover for the issue of June 4th 2018. Simultaneously to our publication on the FeN
compound, two other groups reported similar observations [275,295].
Analogously to the investigation of the Li-N2 system, a small piece of iron was
loaded along with a much greater quantity of molecular nitrogen. This allowed to
synthesize the nitrogen-richest Fe-N solids stable a given pressure. As schematized in
Figure 1, the Fe2N compound is the first obtained upon laser-heating pure Fe embedded
in N2. This compound, which had previously been reported in the literature, adopts an
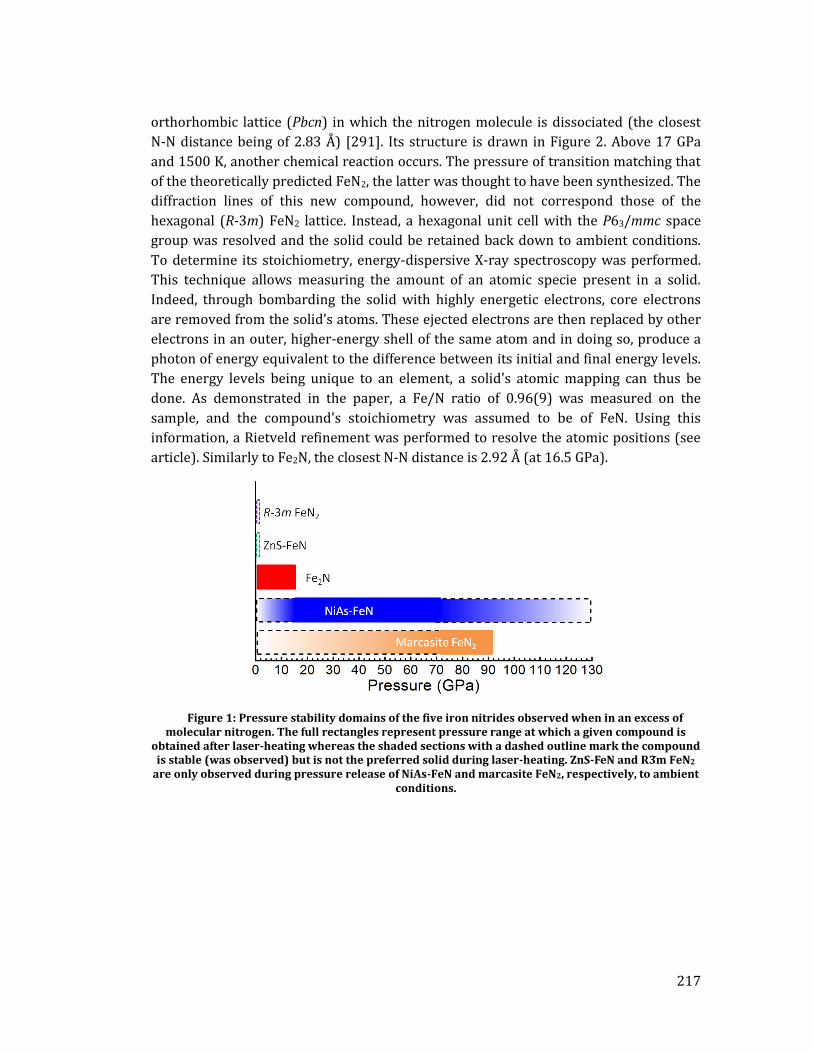
217
orthorhombic lattice (Pbcn) in which the nitrogen molecule is dissociated (the closest
N-N distance being of 2.83 Å) [291]. Its structure is drawn in Figure 2. Above 17 GPa
and 1500 K, another chemical reaction occurs. The pressure of transition matching that
of the theoretically predicted FeN2, the latter was thought to have been synthesized. The
diffraction lines of this new compound, however, did not correspond those of the
hexagonal (R-3m) FeN2 lattice. Instead, a hexagonal unit cell with the P63/mmc space
group was resolved and the solid could be retained back down to ambient conditions.
To determine its stoichiometry, energy-dispersive X-ray spectroscopy was performed.
This technique allows measuring the amount of an atomic specie present in a solid.
Indeed, through bombarding the solid with highly energetic electrons, core electrons
are removed from the solid’s atoms. These ejected electrons are then replaced by other
electrons in an outer, higher-energy shell of the same atom and in doing so, produce a
photon of energy equivalent to the difference between its initial and final energy levels.
The energy levels being unique to an element, a solid's atomic mapping can thus be
done. As demonstrated in the paper, a Fe/N ratio of 0.96(9) was measured on the
sample, and the compound's stoichiometry was assumed to be of FeN. Using this
information, a Rietveld refinement was performed to resolve the atomic positions (see
article). Similarly to Fe2N, the closest N-N distance is 2.92 Å (at 16.5 GPa).
Figure 1: Pressure stability domains of the five iron nitrides observed when in an excess of molecular nitrogen. The full rectangles represent pressure range at which a given compound is
obtained after laser-heating whereas the shaded sections with a dashed outline mark the compound is stable (was observed) but is not the preferred solid during laser-heating. nS-FeN and R m FeN2
are only observed during pressure release of NiAs-FeN and marcasite FeN2, respectively, to ambient conditions.

218
Figure 2: Structure of the Fe-N compound. a) Structure of Fe2N. b) Structure of FeN. c) Structure of FeN2, containing pernitrides. The pale blue and gold spheres represent N and Fe atoms,
respectively.
The equation of state of FeN was measured from ambient pressure up to 128
GPa. A K0 = 200(5) GPa and K0’ = 5.3(2) was obtained. The bulk modulus for FeN is
slightly higher than what was found in nitrogen-poor iron nitrides, such as Fe4N (155
GPa), Fe7N3 (168 GPa), Fe2N (190 (9) GPa as well as pure hcp iron (165
GPa).[291,292,296] This follows the trend of an increasing bulk modulus along with
nitrogen concentration due to an increase in the crystals’ covalency. As seen below, this
tendency is further confirmed with the high bulk modulus of FeN2. Up to the maximum
pressure reached on FeN, the solid was laser-heated up to 2000 K at regular pressure
intervals and no phase transition was observed. These experiments were performed in
the context of the testing of the laser-heating setup at the I15 beamline of the Diamond
synchrotron (United Kingdom) where reaching higher temperatures proved to be
difficult.
However, on a sample studied at a later date at the ID27 beamline of the ESRF
synchrotron, it was found that above 72 GPa and 2200 K, FeN chemically reacts. The
new diffraction peaks this time closely matched the orthorhombic (Pnnm) FeN2
structure predicted by the theoretical calculations [51,293,294]. As drawn in Figure 2,
the structure contains N2 dimers with an intramolecular distance of 1.32 Å. This
distance, determined from the Rietveld refinement of an integrated X-ray diffraction
pattern is not that reliable because of the gap in atomic scattering power between Fe (Z
= 26) and N (N = 7). As such, the intensities measured from the X-ray diffraction pattern
are much more dependent of the iron atoms than of the nitrogen atoms, as
demonstrated in the article. The accurate determination of the N-N bond length is
important to then be able to infer the electronic charge density transferred from the
iron atoms to those of nitrogen. Luckily, Raman modes could be measured off of the
FeN2 solid, further suggesting a high iono-covalency provided by the N2 dimer. The main
Raman mode of FeN2 was detected at a frequency of 1056 cm-1 at ambient pressure.

219
Based on this frequency, a N-N bond order close to 1.5 is expected, implying a charge of
3- for the N2 pernitride. The bulk modulus of FeN2 ‒ extracted from fitting the pressure-
volume data between ambient pressure and 91 GPa by a second order Birch-
Murnaghan equation of state ‒ was found to be of K0 = 344 GPa. As a testament to the
low N-N bond order (and thus the filling of the N-N antibonding states), FeN2 has an
ultrahigh incompressibility compared to the previous nitrogen-poor Fe-N solids.
Moreover, it represents an astounding increase of about 208% from pure iron and
exhibits largest increase in bulk modulus of any other pernitrides over the pure
transition metal. Owing to its high bulk modulus and its ambient conditions
metastability, FeN2 could be an attractive solid for the industry.
Both the FeN2 and FeN solids, while metastable to ambient conditions, were
found to partially transform into another structure of the same stoichiometry upon the
release of the molecular N2 gas. Indeed, FeN2 partly becomes a hexagonal (R-3m) solid
while a cubic (F-43m) FeN structure is detected. This is interesting since neither of
these phase are the thermodynamically stable Fe-N solid at ambient conditions and in
air. This attests to the fact that the activation barrier for a change of structure and
stoichiometry is greater than the energy needed to undergo a simple structural
transformation.

220
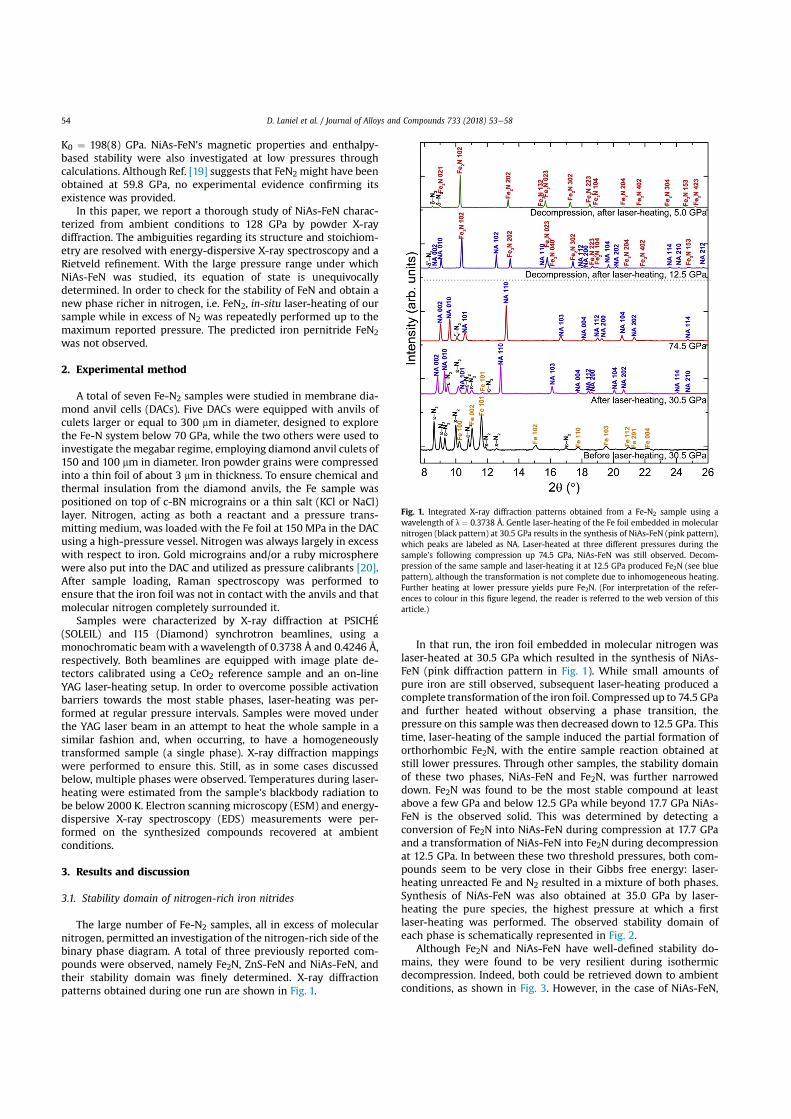


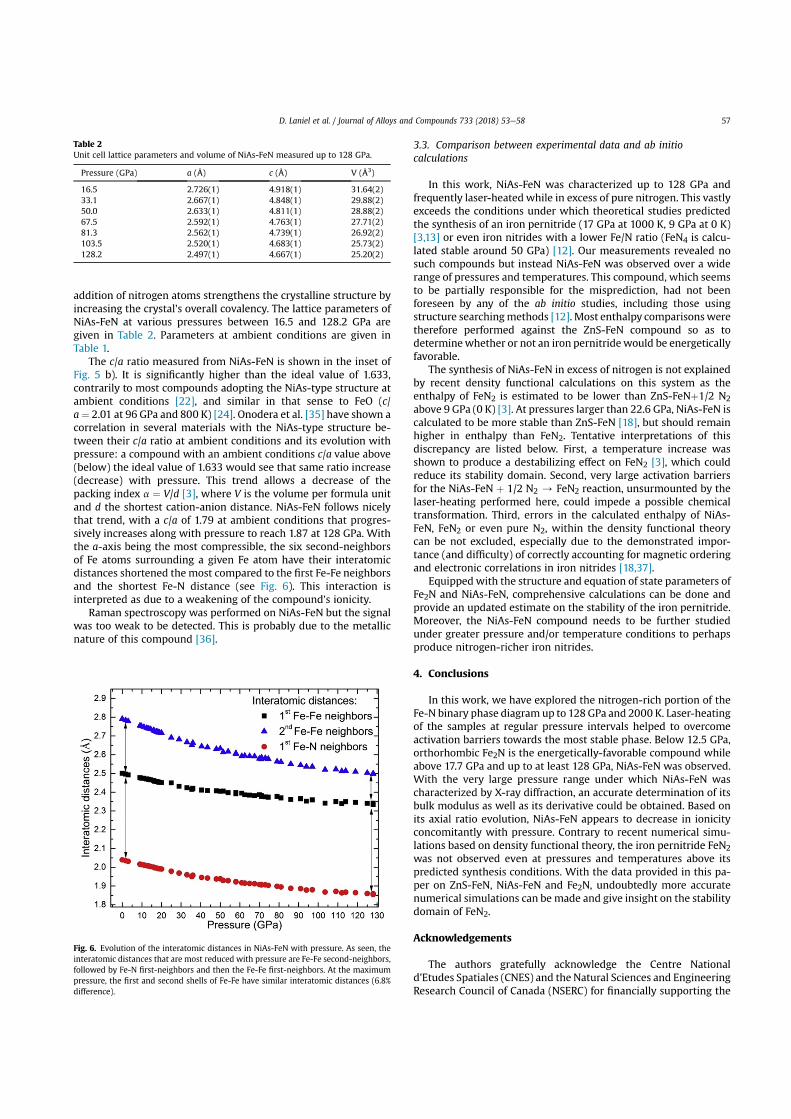


High Pressure and High Temperature Synthesis of the Iron PernitrideFeN2
Dominique Laniel,*,† Agnes Dewaele,† and Gaston Garbarino‡
†CEA, DAM, DIF, F-91297 Arpajon, France‡European Synchrotron Radiation Facility, 6 Rue Jules Horowitz BP220, F-38043 Grenoble CEDEX, France
ABSTRACT: The high pressure chemistry of transitionmetals and nitrogen was recently discovered to be richerthan previously thought, due to the synthesis of severaltransition metal pernitrides. Here, we explore the pressure-temperature domain of iron with an excess of nitrogen up to91 GPa and 2200 K. Above 72 GPa and 2200 K, the ironpernitride FeN2 is produced in a laser-heated diamond anvilcell. This iron-nitrogen compound is the first with a N/Fe ratiogreater than 1. The FeN2 samples were characterized from the maximum observed pressure down to ambient conditions bypowder X-ray diffraction and Raman spectroscopy measurements. The crystal structure of FeN2 is resolved to be a Pnnmmarcasite structure, analogously to other transition metal pernitrides. On the basis of the lattice’s axial ratios and the recorded N-N vibrational modes of FeN2, a bond order of 1.5 for the nitrogen dimer is suggested. The bulk modulus of the iron pernitride isdetermined to be of K0 = 344(13) GPa, corresponding to an astounding increase of about 208% from pure iron. Upondecompression to ambient conditions, a partial structural phase transition to the theoretically predicted R3m FeN2 is detected.
■ INTRODUCTION
The chemistry of nitrogen-based compounds is a rich researchfield due to their potential as high-energy density materials,1−7
their refractory, superconducting as well as catalytic proper-ties,8,9 their applications for planetary sciences10−14 and evenfor hydrogen storage.15 Transition metal pernitrides recentlyfound significant interest in the field of material sciences asultrahard solids.16,17 In 2004, platinum pernitride was obtainedby a direct reaction between elements in a laser-heateddiamond anvil cell.18 This first study assigned the stoichiometryPtN to this compound, but it was later correctly identified asPtN2 with a pyrite structure.19−22 It was determined to possessan extremely high bulk modulus (K0 = 372 GPa), explained byits single-bonded nitrogen dimer, as well as to be recoverable toambient conditions.19,20 Since this first synthesis, a large varietyof theoretical and experimental works have been performed andlead to the discovery of several other transition metalpernitrides, such as IrN2, with a bulk modulus of 428GPa23the highest bulk modulus after diamond’sas wellas the Os, Pd, Rh, and Ru pernitrides. Most of thesecompounds were retrieved and found metastable at ambientconditions.20,23−26 The recent synthesis of TiN2 and sub-sequently CoN2, the first pernitrides with a transition metal inthe fourth row of the periodic table, evidenced the possibilityfor these lower electron elements to produce nitrogencompounds similar to those formed with heavier transitionmetals.27,28
Iron is one of the elements sharing the fourth row of theperiodic table with titanium and cobalt. Unlike for these, a largevariety of iron nitrides exists, totaling seven stoichiometries:α′′-Fe16N2, α′-Fe8N, γ′-Fe4N, ε-Fe3N1±x, Fe7N3, Fe2N, and,
more recently discovered, FeN.28−32 Interestingly, the bulkmodulus of these compounds was observed to steadily increasewith nitrogen content, reaching 200 GPa for NiAs-FeN.32
Recent theoretical calculations have predicted that new iron-nitrogen compounds with a never seen before N/Fe ratiogreater than 1 are stable under pressure. The iron pernitrideFeN2 is one of them. A hexagonal (R3 m) phase was anticipatedstable above 17 GPa at 1000 K while a marcasite-type phasewas determined favored from 34 GPa at the same temperature.Marcasite FeN2 was calculated to have a high bulk modulus,and charge analysis suggests that the structure bears double-bonded N2
2− dimers.33−35 While the NiAs-FeN compound wasobserved to be stable up to 128 GPa and 2000 K,32 we haveextended the scanned temperature range in the search for iron-nitrogen compounds with a higher N/Fe ratio. Indeed, hightemperatures can be necessary to cross possible large activationbarriers impeding the synthesis of compounds with newstoichiometries.Here, we report the synthesis of the first iron-nitrogen
compound with the N/Fe ratio greater than 1, FeN2, obtainedabove 72 GPa and 2200 K. This new pernitride wascharacterized by powder X-ray diffraction and Raman spec-troscopy down to ambient conditions. The structure of FeN2 isresolved and insight on the nature of the N-N dimer is obtainedthrough the measurement of FeN2 vibrational modes as well asupon comparison of its lattice axial ratios, previously shown asrepresentative of the dimer’s valence state. Furthermore, thebulk modulus of the iron pernitride is determined during
Received: January 6, 2018Published: March 5, 2018
Article
pubs.acs.org/ICCite This: Inorg. Chem. 2018, 57, 6245−6251
© 2018 American Chemical Society 6245 DOI: 10.1021/acs.inorgchem.7b03272Inorg. Chem. 2018, 57, 6245−6251

sample decompression and found to be extremely large. Anexplanation based on previous theoretical calculations isprovided. Finally, upon the complete release of pressure, apartial phase transition in FeN2 is detected and verified tomatch the predicted low pressure phase of FeN2.
■ EXPERIMENTAL METHODIron and nitrogen were studied in membrane diamond anvil cells(DACs) equipped with anvil’s culet of 150 or 100 μm in diameter,designed to explore the Fe-N system beyond 70 GPa. Iron powdergrains were compressed into a thin foil of about 1.5 μm in thickness.To ensure chemical and thermal insulation from the diamond anvils,the Fe foils were positioned on top of c-BN micrograins. Nitrogen,acting as both a reactant and a pressure transmitting medium, wasloaded with the Fe at 1400 bar in the DACs. With respect to iron,nitrogen was always largely in excess. Gold micrograins and a rubymicrosphere were also put into the DAC and utilized as pressurecalibrants.36
Confocal Raman spectroscopy was performed using anAlpha300M+ instrument (WITec). Immediately after sample loading,Raman measurements were done to ensure that the iron foil was not incontact with the anvils and that molecular nitrogen completelysurrounded it. Characterization of the reacted sample during itsdecompression was also achieved by Raman spectroscopy. Sampleexcitation was accomplished with a continuous Ar-Kr laser using the647.1 nm line with a focused laser spot of less than 1 μm. The StokesRaman signal was collected in a backscattering geometry by a CCDcoupled to a 600 l/mm grating, allowing a spectral resolution ofapproximately 6 cm−1. Automated motorized sample positioning withpiezo-driven scan stages of submicron accuracy allowed for preciseRaman spectral imaging of the samples.The X-ray diffraction characterization was performed at the ID27
beamline of the European Synchrotron Radiation Facility (ESRF) inangular-dispersive mode. The X-ray beam, with λ = 0.3738 Å, wasfocused by two Kirkpatrick−Baez mirrors and cleaned by one pinholeto an ∼3 × 3 μm2 spot on the sample. The beamline is equipped withan online YAG laser-heating setup and bidimensional detectors,calibrated using a CeO2 reference sample. In order to overcome
possible activation barriers, laser-heating was performed through bothopenings of the DACs, achieving temperatures over 2200 K in the bulkof the sample. Temperatures during laser-heating were accuratelymeasured from the sample’s blackbody radiation.37
■ RESULTS AND DISCUSSION
The pure iron flake surrounded by molecular nitrogen wascompressed to 75.4 GPa, a pressure at which the sample wasmoderately laser-heated (below 1200 K), resulting in thesynthesis of the well-known NiAs-FeN.28,31,32 A second roundof laser-heating, this time above 2200 K, resulted in thedetection of new diffraction lines that could not be attributed toany established Fe-N phase or the pure elements (see Figure1). The same sample was heated once more at 2200 K and 91.3GPa, resulting in the observation of the same diffraction lines. Asecond sample also heated at 2200 K and 72.5 GPa produced asimilar X-ray diffraction pattern to the one presented in Figure1. Through a Rietveld refinement (shown in Figure 1) done at75.4 GPa, these new peaks were found to be perfectly fitted bya marcasite (Pnnm) orthorhombic structure (a = 3.722(1) Å, b= 4.427(1) Å, and c = 2.430(1) Å), with the Fe and N atoms onthe 2a (0, 0, 0) and 4g (0.141, 0.406, 0) Wyckoff positions. TheN/Fe ratio of 2 corresponds to the FeN2 stoichiometry,expected to be stable under high pressure in excess nitrogen bytheoretical calculations.33−35 The proposed marcasite structureis isostructural to the theoretically predicted pseudo-marcasitestructure of FeN2, and the transformation from the latter to theformer is done through a simple change of the y parameter (y→ 0.5 − y) of the Wyckoff positions.33 The measured latticeparameters and Wyckoff positions closely match the forecastedstructure,33 as compared in Table 1. The marcasite structure iscommonly observed in other transition metal pernitrides, suchas OsN2 and RuN2,
23,26 whose metallic elements are just belowFe in the periodic table, as well as CoN2 and RhN2.
25,28 Thisatomic arrangement contains FeN6 octahedrons with a slight
Figure 1. (a) Rietveld refinement of a powder X-ray diffraction pattern obtained at 75.4 GPa. Lattice parameters of FeN2 at this pressure can befound in Table 2. (Inset) The diffraction pattern’s corresponding image plate, showing the fairly homogeneous powder diffraction rings. (b)Marcasite type structure of FeN2, where the pale blue and orange spheres represent the nitrogen and iron atoms, respectively.
Table 1. Comparison between Experimental and Theoretical Structural Parameters of Marcasite FeN2a
structure a (Å) b (Å) c (Å) V (Å3) N 4g (x,y,0)
marcasite FeN2 (28 GPa) (exp.) 3.722(1) 4.427(1) 2.430(1) 40.04(2) 0.141(1) 0.406(1)marcasite FeN2 (25 GPa) (theo.)33 3.8015 4.5258 2.4840 42.73 0.13016 0.40322difference (%) −2.1 −2.2 −2.2 −6.3
aThe predicted pseudo-marcasite structure was transformed into a regular marcasite structure.
Inorganic Chemistry Article
DOI: 10.1021/acs.inorgchem.7b03272Inorg. Chem. 2018, 57, 6245−6251
6246

distortion and rotation, allowing the N−N bonds (see Figure1).Further laser-heating of the sample did not allow a more
complete transformation into marcasite FeN2, which could beattributed to its formation at the iron−nitrogen interface andacting as a diffusion barrier to nitrogen into the bulk of the ironflake. This is a common occurrence in pernitrides as PtN2, IrN2,CoN2, and others were also synthesized in DACs as a minorityphase mixed with the unreacted reagents.20,23−28
On the basis of the refined atomic positions, the covalentlybonded nitrogen dimers have an intramolecular distance of 1.32Å in marcasite FeN2, which is closer to the expected length of adouble bond (∼1.2−1.3 Å)38−40 rather than a triple (∼1.1 Å)41or a single bond (∼1.4 Å).41 However, due to the large electronnumber difference between Fe (Z = 26) and N (Z = 7), theperformed Rietveld refinement is not very sensitive to thenitrogen atom’s position (nor its partial occupancy). Indeed,manually changing its position to (0.15, 0.1, 0), yielding a N−Ndistance of 1.41 Å that matches that of a single bond, results ina χ2 difference of only 0.4%, imperceptibly changing the qualityof the fit to the eyes. A similar result regarding the atomicpartial occupancies was obtained, with variations up to 14% forN, producing a 1% variation of χ2. Further insight on the natureof the N2 dimer covalent bond could be obtained based on theempirical relationship found between lattice axial ratios and thetransition metal valence state in marcasite-type M+y(X2)
−y
pnictides and chalcogenides (where M is a transition metal,the X is a pnictide or a chalcogenide, and y is the valencestate).42 Indeed, these compounds were observed to have thetransition metal valence state decrease concomitantly withincreasing c/a and c/b ratios, ranging from 4+ (lower axialratios) to 2+ (higher axial ratios). Rhodium pernitride has anaxial ratio in between compounds with a transition metalvalence state of 2+ and 4+ which suggests, according to thisrelationship, a valence state closer to 3+ for Rh and thus a N−N bond order of about 1.5. Raman spectroscopy measurementsvalidated the proposed bond order in RhN2.
42 Analogously, thec/a and c/b ratios for marcasite FeN2, plotted in Figure 2b,average 0.650 and 0.542, respectively, over pressure and fallclose to that of RhN2 (c/a = 0.685, c/b = 0.568), thusadvocating for a ∼(N2)
3− dimer with a bonding order of∼1.5.42Further insight into the nature of the N−N bond could also
be obtained by Raman spectroscopy measurements (see Figure
2). The spectra reveal three vibrational modes belonging toFeN2, all at frequencies below 1200 cm−1. That amount ofmeasured modes is within prediction based on group theoryanalysis, since the M+y(X2)
−y-type marcasite structure with X-Xdumbbells allows six Raman active modes (Γ = 2Ag + 2B1 + B2g+ B3g). The symmetric stretching mode (Ag), typically the mostintense, provides insight into the nature of the N−N covalentbond as its frequency strongly depends on the bonding order. Atriple-, double-, and single-bonded nitrogen dimer has a typicalfrequency of 2400, 1300−1550, and 700−850 cm−1,respectively, at ambient conditions.19,24,38−40,43−45 In ourcase, the measured value of the Ag mode is of 1056 cm−1 atambient pressure, which sits in between that of a single anddouble bond. This observation, along with the extremely highbulk modulus of marcasite FeN2 (see below), further suggests abond order of about 1.5. This analysis falls in line with resultson RhN2 which has a very similar Ag mode frequency (about1010 cm−1 near 12 GPa) and an assigned bond order of 1.5.25
Moreover, a (N2)3− radical formed at ambient conditions in
yttrium complexes was determined to have its vibrational modeat 989 cm−1.46 However, as thoroughly demonstrated in thestudy of the Li2Ca3[N2]3 compound, multiple techniques, suchas electron spin resonance and magnetic measurements, arevital to conclusively assert a N2 dimer’s bond order.47 Thesemeasurements would be very difficult to perform on the smallamount of sample synthesized here especially due to itscoexistence with magnetic NiAs-FeN.31
The measurement of Raman modes from marcasite FeN2suggests the compound’s nonmetallicity. The IrN2, PtN2 as wellas RhN2 pernitrides were also deemed nonmetallic based on theobservation of Raman modes.19,20,23,25
Interestingly, our experimental results regarding the (N2)3−
dimer with a bond order of about 1.5 and the samplenonmetallic nature contrast with conclusions based on ab initiocalculations. Bader charge analysis previously performed onFeN2
33 showed the Fe atom to transfer 1.6 electrons to the Ndimer. Due to the known underestimation of these types ofcalculations (finding a charge of +0.85 for the Na cation in theNaCl salt, for example),48 N2
−2 units, corresponding to a NNdouble bond, were expected and deemed reasonable. Thediscrepancy between theoretical and experimental resultsregarding the compound’s metallic or nonmetallic naturecould be explained by the larger than anticipated electrontransfer from the Fe atom to the N dimer (closer to 3 instead of
Figure 2. (a) Representative Raman spectrum of the marcasite FeN2 at 24.5 GPa. The most intense Raman mode, centered at 1097 cm−1,corresponds to the Ag symmetric stretching mode of the nitrogen dimer. (b) Evolution of the FeN2 lattice axial ratios with pressure. While the c/b isalmost constant, the c/a ratio slightly decreases with pressure, indicating a softer c (and b) axis.
Inorganic Chemistry Article
DOI: 10.1021/acs.inorgchem.7b03272Inorg. Chem. 2018, 57, 6245−6251
6247

1.6) which, in turn, could substantially modify the electrondensity of state computation and thus the compound’s bandgap calculations. The known underestimation of the densityfunctional theory gradient-corrected approximation (DFT-GGA) calculations of a material’s band gap, along with themisleading Bader charge calculations, could also be at play.49,50
The high pressure and high temperature synthesized FeN2samples were decompressed back to ambient pressure andcharacterized by Raman spectroscopy and X-ray diffraction(Figure 3). Table 2 provides the measured lattice parameters of
FeN2 at various pressures. The smooth evolution of the X-raydiffraction lines as well as of the vibrational modes reveals nophase transition in marcasite FeN2 along with its retrievabilitydown to ambient conditions.The volume−pressure data of marcasite FeN2 shown in
Figure 4, obtained with gold as a pressure calibrant, was fittedwith a third-order Birch−Murnaghan equation of state. Thecompound was determined to have an extremely high bulkmodulus of 344(13) GPa, with its pressure derivative fixed atK0′ = 4 and a refined V0 = 45.1(2) Å3. Even though the unit cellvolume was experimentally determined at ambient pressure, thelow number of diffraction lines used to calculate it yields alower accuracy. It is for this reason that the fitted value of V0was retained instead of the measured one. This fitted valueprovides a more conservative K0, which would otherwise havebeen of K0 = 360(5) GPa (with V0 fixed to 45.91 Å3). Theseparameters could be tweaked by performing further experi-ments.The bulk modulus of FeN2 is by far the largest of any other
Fe-N compound: Fe4N (155 GPa), Fe7N3 (168 GPa), Fe2N(190 GPa), and NiAs-FeN (200 GPa) as well as pure iron (165
GPa).29,30,32,51 Compared to other transition metal pernitrides,FeN2 has the third largest, only behind IrN2 (428 GPa) andOsN2 (358 GPa),
23 which values are not too far from the K0 oftheir pure metallic element Ir (365 GPa, 17% increase) and Os(395 GPa, 9% decrease), respectively. In comparison, theaddition of N dimers to pure Fe provides marcasite FeN2 withthe largest increase in bulk modulus (about 208%). Whilepernitrides are known to have a large K0, especially when single-bonded N-N dimers are formed, such a dramatic increase fromthe pure transition metal element was never previouslyobserved.Theoretical calculations forecasted a bulk modulus of 385 at
25 GPa, with V25 GPa = 42.75 Å3.33 In order for an adequatecomparison with the experimental results to be possible, thecorresponding bulk modulus and volume values wereextrapolated from 25 GPa to ambient pressure. Using K0′ =4, a K0 = 289 GPa and V0 = 46.056 Å3 are obtained (see Figure4). The discrepancy between calculated and experimental bulkmodulus values is in part due to the volume overestimation ofthe calculations at a given pressure. Indeed, if the equilibriumvolume is overestimated by ab initio calculations, the bulkmodulus is also underestimated.36 This can be corrected byutilizing the calculated bulk modulus at experimentalequilibrium value (45.1(2) Å3), here yielding 314 GPa. Thus,only a 9% discrepancy exists between the experimental and thecorrected theoretical predictions. This difference could beattributed to errors in the DFT.Theoretical calculations are insightful with regards to
explaining a pernitrides’ low compressibility in relation withthe N dimer; directly linked to the filling of N-N antibondingmolecular orbitals (1πg*) and the metal’s valence state, whichcan be modeled using crystal orbital Hamilton population(COHP) computations.45,52 These antibonding states areprogressively filled as the metallic element transfers to the Ndimer more electrons, i.e., as its valence state is higher. Filledmolecular antibonding states result in an increased repulsionbetween the two N atoms, leading to a higher bulk modulus.With this approach, the low bulk modulus of BaN2 and the highbulk modulus of TiN2 and PtN2 are well understood.
16,45 TheCOHP of the N-N dimer in marcasite FeN2 was calculated inref 33, and the N-N antibonding states are seen to be almost
Figure 3. Characterization of marcasite FeN2 upon its decompressionto ambient condition. (a) X-ray diffraction lines’ and (b) vibrationalmodes’ evolution with pressure.
Table 2. Unit Cell Parameters and Volume of MarcasiteFeN2 Measured up to 91 GPa
P (GPa) a (Å) b (Å) c (Å) V (Å3)
0 3.850(1) 4.636(1) 2.516(1) 44.91(2)21.3 3.797(1) 4.554(1) 2.482(1) 42.93(2)37.8 3.749(1) 4.516(1) 2.434(1) 41.20(2)55.2 3.722(1) 4.427(1) 2.430(1) 40.04(2)75.4 3.667(1) 4.384(1) 2.396(1) 38.52(2)91.3 3.662(1) 4.345(1) 2.348(1) 37.37(2)
Figure 4. Volume of the marcasite FeN2 lattice with respect topressure. The black squares represent the measured V−P data, fittedwith a third-order Birch−Murnaghan equation of state. Thetheoretically calculated values result in an overestimation thecompound’s volume at low pressure as well as an underestimation atpressures beyond 65 GPa, as shown with the red curve.
Inorganic Chemistry Article
DOI: 10.1021/acs.inorgchem.7b03272Inorg. Chem. 2018, 57, 6245−6251
6248

completely filled, similarly to what is observed in PtN2.45 This
leads to believe that these filled states are responsible for theextremely high bulk modulus of marcasite FeN2. Additionally,this further underlines the plausibility of a bond order of 1.5(over one of greater value) as it suggests a significant filling ofthe antibonding orbitals. Of course, as demonstrated in PtAs2,other parameters such as the structure and charge transferbehavior with pressure can also have an effect, although heredeemed minor, on a solid’s compressibility.53
Upon reaching ambient pressure during the sampledecompression, new low intensity X-ray diffraction lines weredetected, adding to those belonging to marcasite FeN2 andNiAs-FeN. These diffraction lines were unambiguouslydetermined to match a hexagonal (R3m) structure with a =2.855(1) Å and c = 10.605(1) Å, as shown through a Le Bailrefinement (Figure 5). The powder’s significant texture did not
allow for a Rietveld refinement. The proposed unit cellbothits lattice parameters and its determined space groupagreesvery well with the theoretically predicted R3 m FeN2 phase (seeTable 3).34 Thus, a phase transition from marcasite FeN2 to
R3m FeN2 is concluded to have occurred. This observation is inline with the enthalpies of R3m FeN2 and marcasite FeN2calculated within DFT: at 0 K, the R3m phase has a lowerenthalpy than the marcasite phase below 11−22 GPa,depending on the details of the calculation.33,34
Below 12.5 GPa, it was previously evidenced that Fe2N is thestable phase as it is produced directly from pure iron and excessnitrogen upon laser-heating.29,32 However here, it is observedthat while it is energetically unfavorable, marcasite FeN2 prefersto transform into the metastable R3m FeN2 under 10 GParather than decomposing into 1/2(Fe2N + 3/2N2). Thisobservation emphasizes that chemical reactions have non-
negligible energy barriers unlike martensitic phase trans-formations which are typically athermal and thus do notrequire heating to proceed. It also underlines that thethermodynamical pathway can be critical in synthesizing agiven phase; as shown here, the only approach producing R3 mFeN2 is the decompression of same-stoichiometry marcasiteFeN2. A similar observation was made for NiAs-type FeN andCoN compounds: upon decompression to ambient conditions,the NiAs structure spontaneously transforms to the ZnSstructure, instead of chemically reacting into the stable phasesunder these conditions.28,32
In the current work, laser-heating above 2200 K wasperformed between 72 and 91 GPa and marcasite FeN2 wasalways observed. In our previous experiments, iron sampleswere heated in an excess of N2 up to 130 GPa.
32 Combining theresults presented in this work with those reported in previousstudies allows an updated plot of the experimentallydetermined pressure stability domain of each known ironnitrides produced in excess of nitrogen, drawn in Figure 6. The
stability domain of marcasite FeN2 is tentatively set at 72.5GPa, while it could be lower as Niwa et al.28 reported a newphase appearing after laser-heating NiAs-FeN in an excess of N2at about 60 GPa. While the high pressure stability limit ofmarcasite FeN2 is not known, theoretical simulations predictnitrogen-richer FexNy compounds, i.e., FeN4.
33 This phasemight have been synthesized as part of our experiments onlaser-heated FeN2 at 91 GPa and above 2200 K as new faintdiffraction lines were observed, but the related phase could notbe sufficiently well characterized.
■ CONCLUSIONIn this work, iron and nitrogen were compressed to 72.5 GPaand laser-heated above 2200 K, temperature allowing toovercome the energy barrier toward the formation of themore stable compound FeN2. This is the first synthesis of aniron-nitrogen compound with a N/Fe ratio greater than 1. Theiron pernitride was structurally resolved and determined toadopt the common marcasite structure, matching the
Figure 5. Le Bail refinement at ambient conditions of a decompressedmarcasite FeN2 sample. New low intensity diffraction lines aredisplayed to be properly fitted by the theoretically predicted R3mFeN2 compound.
Table 3. Comparison between Experimental and TheoreticalStructural Parameters of R3m FeN2
structure a (Å) b (Å) c (Å) V (Å3)
R3m FeN2 (0 GPa)(exp.)
2.855(1) 2.855(1) 10.605(1) 64.62(2)
R3m FeN2 (0 GPa)(theo.)34
2.835 2.835 10.624 63.83
difference (%) 0.7 0.7 0.2 1.2
Figure 6. Pressure stability domains of the five iron nitrides observedwhen in an excess of molecular nitrogen, with the exception ofambient pressure where gaseous N2 escapes the DAC. The fullrectangles represent the experimentally measured stability domainswhile the shaded sections with a dashed outline mark the metastabilitypressure domains. ZnS-FeN and R3 m FeN2 are only observed duringpressure release of NiAs-FeN and marcasite FeN2, respectively, toambient conditions. The stability domain of Fe2N has beendetermined in our previous work.32 The pressure which delimits thestability domains of NiAs-FeN and marcasite-FeN2 has beententatively set to 72 GPa (see text).
Inorganic Chemistry Article
DOI: 10.1021/acs.inorgchem.7b03272Inorg. Chem. 2018, 57, 6245−6251
6249
theoretically predicted structure.33 Through lattice parameterslength ratio considerations as well as the measurement of itsRaman vibrational frequencies, the bond order of the nitrogendimer was determined to be of approximately 1.5, which isanalogous to that of rhodium pernitride.25,42 The detection ofthese Raman modes suggests marcasite FeN2 to be nonmetallic,differing from the theoretical prediction.33 The characterizationof marcasite FeN2 down to ambient conditions revealed anastoundingly large bulk modulus of 344(13) GPa, representinga 208% increase over pure iron’s bulk modulus. While thismakes FeN2 the iron nitride with the highest K0 value, it is alsothird compared to other transition metal pernitrides, onlybehind IrN2 and OsN2. A better theoretical understanding ofthe drastic gain in hardness discovered in marcasite FeN2 mightuncover new methods to produce high bulk modulus materials.Finally, at ambient pressure, a partial transition to R3 m FeN2 isdetected, implying this low pressure phase to be metastable andonly found through the decompression of marcasite FeN2. TheX-ray diffraction and Raman data indicate that marcasite FeN2is partially retained after complete decompression. Thedetermination of its metastability lifetime would provide anunderstanding of its decomposition pathway and eventuallyallow blocking this transformation. Only then could thispossible ultrahard compound be fully characterized andcontemplated for eventual industrial applications. Moreover,the synthesis of ternary compounds under pressure, for instancein the Fe-C-N system, is another possibility that needsextensive experimental studies and that could also result incompounds relevant for the industry.
■ AUTHOR INFORMATIONCorresponding Author*E-mail: [email protected] Laniel: 0000-0002-6889-9820NotesThe authors declare no competing financial interest.
■ ACKNOWLEDGMENTSThe authors gratefully acknowledge the Centre Nationald’Etudes Spatiales (CNES) and the Natural Sciences andEngineering Research Council of Canada (NSERC) forfinancially supporting the Ph.D. of D.L. The authors alsoacknowledge the European Synchrotron Radiation Facility(ESRF) for provision of beamtime at the ID27 beamline underproposal CH-5255.
■ REFERENCES(1) Peng, F.; Yao, Y.; Liu, H.; Ma, Y. Crystalline LiN5 Predicted fromFirst-Principles as a Possible High-Energy Material. J. Phys. Chem. Lett.2015, 6, 2363−2366.(2) Steele, B. A.; Stavrou, E.; Crowhurst, J. C.; Zaug, J. M.;Prakapenka, V. B.; Oleynik, I. I. High-Pressure Synthesis of aPentazolate Salt. Chem. Mater. 2017, 29 (2), 735−741.(3) Laniel, D.; Sebastiao, E.; Cook, C.; Murugesu, M.; Hu, A.; Zhang,F.; Desgreniers, S. Dense Nitrogen-Rich Energetic Materials: A Studyof 5,5′-bis(1H-Tetrazolyl)amine. J. Chem. Phys. 2014, 140, 184701.(4) Peng, F.; Wang, Y.; Wang, H.; Zhang, Y.; Ma, Y. Stable XenonNitride at High Pressures. Phys. Rev. B: Condens. Matter Mater. Phys.2015, 92, 094104.(5) Vaitheeswaran, G.; Babu, K. R. Metal Azides under Pressure : AnEmerging Class of High Energy. J. Chem. Sci. 2012, 124 (6), 1391−1398.
(6) Ciezak, J. A.; Rice, B. M. Polymeric Nitrogen: The Ultimate, GreenHigh Performing Energetic Material; U.S. Army Research Laboratory:Aberdeen Proving Ground, Maryland, 2006.(7) Zhang, L.; Wang, Y.; Lv, J.; Ma, Y. Materials Discovery at HighPressures. Nat. Rev. Mater. 2017, 2, 17005.(8) Salamat, A.; Hector, A. L.; Kroll, P.; McMillan, P. F. Nitrogen-Rich Transition Metal Nitrides. Coord. Chem. Rev. 2013, 257 (13−14),2063−2072.(9) Friedrich, A.; Winkler, B.; Juarez-Arellano, E. A.; Bayarjargal, L.Synthesis of Binary Transition Metal Nitrides, Carbides and Boridesfrom the Elements in the Laser-Heated Diamond Anvil Cell and TheirStructure-Property Relations. Materials 2011, 4 (10), 1648−1692.(10) Qian, G.-R.; Hu, C.-H.; Oganov, A. R.; Zeng, Q.; Zhou, H.-Y.;Niu, H. Diverse Chemistry of Stable Hydronitrogens, and Implicationsfor Planetary and Materials Sciences. Sci. Rep. 2016, 6, 25947.(11) Chidester, B. A.; Strobel, T. A. The Ammonia-Hydrogen Systemunder Pressure. J. Phys. Chem. A 2011, 115 (38), 10433−10437.(12) Goncharov, A. F.; Holtgrewe, N.; Qian, G.; Hu, C.; Oganov, A.R.; Somayazulu, M.; Stavrou, E.; Pickard, C. J.; Berlie, A.; Yen, F.; et al.Backbone N X H Compounds at High Pressures. J. Chem. Phys. 2015,142, 214308.(13) Palasyuk, T.; Troyan, I.; Eremets, M.; Drozd, V.; Medvedev, S.;Zaleski-Ejgierd, P.; Magos-Palasyuk, E.; Wang, H.; Bonev, S. a.;Dudenko, D.; et al. Ammonia as a Case Study for the SpontaneousIonization of a Simple Hydrogen-Bonded Compound. Nat. Commun.2014, 5, 3460.(14) Ninet, S.; Datchi, F.; Dumas, P.; Mezouar, M.; Garbarino, G.;Mafety, A.; Pickard, C. J.; Needs, R. J.; Saitta, A. M. Experimental andTheoretical Evidence for an Ionic Crystal of Ammonia at HighPressure. Phys. Rev. B: Condens. Matter Mater. Phys. 2014, 89 (17),174103.(15) Nakamori, Y.; Orimo, S. Li−N Based Hydrogen StorageMaterials. Mater. Sci. Eng., B 2004, 108 (1−2), 48−50.(16) Zhang, M.; Cheng, K.; Yan, H.; Wei, Q.; Zheng, B. ElectronicBonding Analyses and Mechanical Strengths of IncompressibleTetragonal Transition Metal Dinitrides TMN 2 (TM = Ti, Zr, andHf). Sci. Rep. 2016, 6, 36911.(17) Soto, G. Computational Study of Hf, Ta, W, Re, Ir, Os and PtPernitrides. Comput. Mater. Sci. 2012, 61, 1−5.(18) Gregoryanz, E.; Sanloup, C.; Somayazulu, M.; Badro, J.; Fiquet,G.; Mao, H.; Hemley, R. J. Synthesis and Characterization of a BinaryNoble Metal Nitride. Nat. Mater. 2004, 3 (5), 294−297.(19) Young, A. F.; Montoya, J. A.; Sanloup, C.; Lazzeri, M.;Gregoryanz, E.; Scandolo, S. Interstitial Dinitrogen Makes PtN2 anInsulating Hard Solid. Phys. Rev. B: Condens. Matter Mater. Phys. 2006,73 (15), 153102.(20) Crowhurst, J. C.; Goncharov, A. F.; Sadigh, B.; Evans, C. L.;Morrall, P. G.; Ferreira, J. L.; Nelson, A. J. Synthesis andCharacterization of the Nitrides of Platinum and Iridium. Science2006, 311, 1275.(21) Yu, R.; Zhang, X. F. Platinum Nitride with Fluorite Structure.Appl. Phys. Lett. 2005, 86 (12), 121913.(22) Yu, R.; Zhang, X. F. Family of Noble Metal Nitrides: FirstPrinciples Calculations of the Elastic Stability. Phys. Rev. B: Condens.Matter Mater. Phys. 2005, 72 (5), 054103.(23) Young, A. F.; Sanloup, C.; Gregoryanz, E.; Scandolo, S.;Hemley, R. J.; Mao, H. K. Synthesis of Novel Transition MetalNitrides IrN2 and OsN2. Phys. Rev. Lett. 2006, 96, 155501.(24) Crowhurst, J. C.; Goncharov, A. F.; Sadigh, B.; Zaug, J. M.;Aberg, D.; Meng, Y.; Prakapenka, V. B. Synthesis and Characterizationof Nitrides of Iridium and Palladium. J. Mater. Res. 2008, 23 (1), 1−5.(25) Niwa, K.; Dzivenko, D.; Suzuki, K.; Riedel, R.; Troyan, I.;Eremets, M.; Hasegawa, M. High Pressure Synthesis of Marcasite-Type Rhodium Pernitride. Inorg. Chem. 2014, 53 (2), 697−699.(26) Niwa, K.; Suzuki, K.; Muto, S.; Tatsumi, K.; Soda, K.; Kikegawa,T.; Hasegawa, M. Discovery of the Last Remaining Binary Platinum-Group Pernitride RuN2. Chem. - Eur. J. 2014, 20 (43), 13885−13888.
Inorganic Chemistry Article
DOI: 10.1021/acs.inorgchem.7b03272Inorg. Chem. 2018, 57, 6245−6251
6250

(27) Bhadram, V. S.; Kim, D. Y.; Strobel, T. A. High-PressureSynthesis and Characterization of Incompressible Titanium Pernitride.Chem. Mater. 2016, 28 (6), 1616−1620.(28) Niwa, K.; Terabe, T.; Kato, D.; Takayama, S.; Kato, M.; Soda,K.; Hasegawa, M. Highly Coordinated Iron and Cobalt NitridesSynthesized at High Pressures and High Temperatures. Inorg. Chem.2017, 56, 6410−6418.(29) Hasegawa, M.; Yagi, T. Systematic Study of Formation andCrystal Structure of 3d-Transition Metal Nitrides Synthesized in aSupercritical Nitrogen Fluid under 10 GPa and 1800 K UsingDiamond Anvil Cell and YAG Laser Heating. J. Alloys Compd. 2005,403 (1−2), 131−142.(30) Wriedt, H. A.; Gokcen, N. A.; Nafziger, R. H. The Fe−N (Iron−Nitrogen) System. Bull. Alloy Phase Diagrams 1987, 8, 355.(31) Clark, W. P.; Steinberg, S.; Dronskowski, R.; McCammon, C.;Kupenko, I.; Bykov, M.; Dubrovinsky, L.; Akselrud, L. G.; Schwarz, U.;Niewa, R. High-Pressure NiAs-Type Modification of FeN. Angew.Chem., Int. Ed. 2017, 56, 7302−7306.(32) Laniel, D.; Dewaele, A.; Anzellini, S.; Guignot, N. Study of theIron Nitride FeN into the Megabar Regime. J. Alloys Compd. 2018,733, 53−58.(33) Wang, Z.; Li, Y.; Li, H.; Harran, I.; Jia, M.; Wang, H.; Chen, Y.;Wang, H.; Wu, N. Prediction and Characterization of the MarcasitePhase of Iron Pernitride under High Pressure. J. Alloys Compd. 2017,702, 132−137.(34) Wessel, M.; Dronskowski, R. A New Phase in the Binary IronNitrogen System?-The Prediction of Iron Pernitride, FeN2. Chem. -Eur. J. 2011, 17 (9), 2598−2603.(35) Gupta, S. D.; Gupta, S. K.; Jha, P. K. Structural, Electronic andDynamical Stability of Heavy Metal Iron Pernitride: A Spin PolarizedFirst-Principles Study. Eur. Phys. J. B 2013, 86, 8.(36) Dewaele, A.; Torrent, M.; Loubeyre, P.; Mezouar, M.Compression Curves of Transition Metals in the Mbar Range:Experiments and Projector Augmented-Wave Calculations. Phys. Rev.B: Condens. Matter Mater. Phys. 2008, 78 (10), 104102.(37) Mezouar, M.; Giampaoli, R.; Garbarino, G.; Kantor, I.; Dewaele,A.; Weck, G.; Boccato, S.; Svitlyk, V.; Rosa, A. D.; Torchio, R.; et al.Methodology for in Situ Synchrotron X-Ray Studies in the Laser-Heated Diamond Anvil Cell. High Pressure Res. 2017, 37 (2), 170−180.(38) Schneider, S. B.; Frankovsky, R.; Schnick, W. Lithium DiazenideHigh-Pressure Synthesis and Characterization of the Alkali DiazenideLi2N2. Angew. Chem., Int. Ed. 2012, 51, 1873−1875.(39) Schneider, S. B.; Frankovsky, R.; Schnick, W. Synthesis ofAlkaline Earth Diazenides MAEN2 (MAE = Ca, Sr, Ba) by ControlledThermal Decomposition of Azides under High Pressure. Inorg. Chem.2012, 51 (4), 2366−2373.(40) Auffermann, G.; Prots, Y.; Kniep, R. SrN and SrN 2 : Diazenidesby Synthesis under. Angew. Chem., Int. Ed. 2001, 40 (3), 547−549.(41) Eremets, M. I.; Gavriliuk, A. G.; Serebryanaya, N. R.; Trojan, I.A.; Dzivenko, D. A.; Boehler, R.; Mao, H. K.; Hemley, R. J. StructuralTransformation of Molecular Nitrogen to a Single-Bonded AtomicState at High Pressures. J. Chem. Phys. 2004, 121 (22), 11296−11300.(42) Niwa, K.; Terabe, T.; Suzuki, K.; Shirako, Y.; Hasegawa, M.High-Pressure Stability and Ambient Metastability of Marcasite-TypeRhodium Pernitride. J. Appl. Phys. 2016, 119 (6), 065901.(43) Eremets, M. I.; Gavriliuk, A. G.; Trojan, I. A.; Dzivenko, D. A.;Boehler, R. Single-Bonded Cubic Form of Nitrogen. Nat. Mater. 2004,3, 558−563.(44) Schneider, H.; Hafner, W.; Wokaun, A.; Olijnyk, H. RoomTemperature Raman Scattering Studies of External and InternalModes of Solid Nitrogen at Pressures 8 ≤ P ≤ 54 GPa. J. Chem. Phys.1992, 96 (11), 8046.(45) Wessel, M.; Dronskowski, R. Nature of N-N Bonding withinHigh-Pressure Noble-Metal Pernitrides and the Prediction ofLanthanum Pernitride. J. Am. Chem. Soc. 2010, 132, 2421−2429.(46) Evans, W. J.; Fang, M.; Zucchi, G.; Furche, F.; Ziller, J. W.;Hoekstra, R. M.; Zink, J. I. Isolation of Dysprosium and YttriumComplexes of a Three-Electron Reduction Product in the Activation of
Dinitrogen, the (N2)-3 Radical. J. Am. Chem. Soc. 2009, 131, 11195−11202.(47) Schneider, S. B.; Seibald, M.; Deringer, V. L.; Stoffel, R. P.;Frankovsky, R.; Friederichs, G. M.; Laqua, H.; Duppel, V.; Jeschke, G.;Dronskowski, R.; et al. High-Pressure Synthesis and Characterizationof Li2Ca 3[N2]3-An Uncommon Metallic Diazenide with [N2]2-Ions. J. Am. Chem. Soc. 2013, 135 (44), 16668−16679.(48) Henkelman, G.; Arnaldsson, A.; Jonsson, H. A Fast and RobustAlgorithm for Bader Decomposition of Charge Density. Comput.Mater. Sci. 2006, 36 (3), 354−360.(49) Hasnip, P. J.; Refson, K.; Probert, M. I. J.; Yates, J. R.; Clark, S.J.; Pickard, C. J. Density Functional Theory in the Solid State. Philos.Trans. R. Soc., A 2014, 372, 20130270.(50) Perdew, J. P. Density Functional Theory and the Band GapProblem. Int. J. Quantum Chem. 1985, 28 (S19), 497−523.(51) Dewaele, A.; Loubeyre, P.; Occelli, F.; Mezouar, M.;Dorogokupets, P. I.; Torrent, M. Quasihydrostatic Equation of Stateof Iron above 2 Mbar. Phys. Rev. Lett. 2006, 97 (21), 215504.(52) Dronskowski, R.; Blochl, P. E. Crystal Orbital HamiltonPopulations (COHP). Energy-Resolved Visualization of ChemicalBonding in Solids Based on Density-Functional Calculations. J. Phys.Chem. 1993, 97, 8617−8624.(53) Tschauner, O.; Kiefer, B.; Tetard, F.; Tait, K.; Bourguille, J.;Zerr, A.; Dera, P.; McDowell, A.; Knight, J.; Clark, S. Elastic Moduliand Hardness of Highly Incompressible Platinum Perpnictide PtAs2.Appl. Phys. Lett. 2013, 103 (10), 101901.
Inorganic Chemistry Article
DOI: 10.1021/acs.inorgchem.7b03272Inorg. Chem. 2018, 57, 6245−6251
6251

234

235
III. DATA ON THE XE-N SOLID
Table 2: Measured X-ray diffraction peaks of the Xe-N solid from 170 GPa down to 74 GPa. The X-ray wavelength is λ = 0. 7 8 Å.
Pressure (GPa) 2 (°) d-spacing (Å) 170 2.76591 7.74402 170 4.99457 4.28944 170 5.77514 3.71008 170 6.6653 3.21505 170 8.30955 2.57968 170 8.64833 2.4788 170 8.79456 2.43767 170 9.10664 2.35429 170 9.19623 2.33141 167 2.76559 7.74491 167 8.35247 2.56644 167 8.82081 2.43043 155 2.73396 7.8345 155 3.96294 5.40544 155 4.95608 4.32274 155 5.80311 3.69221 155 6.70324 3.19687 155 8.29095 2.58545 155 8.70617 2.46237 155 8.57995 2.49852 155 9.07816 2.36166 146 2.72277 7.86668 146 3.93847 5.43901 146 4.94154 4.33545 146 5.78857 3.70148 146 6.66547 3.21496 146 8.23326 2.60354 146 8.54545 2.50859 146 8.67168 2.47214 146 9.08357 2.36026 137 2.71823 7.87982 137 3.88707 5.5109 137 3.91402 5.47297 137 4.94365 4.33361 137 5.76078 3.71932 137 6.64103 3.22678 137 8.13862 2.63376
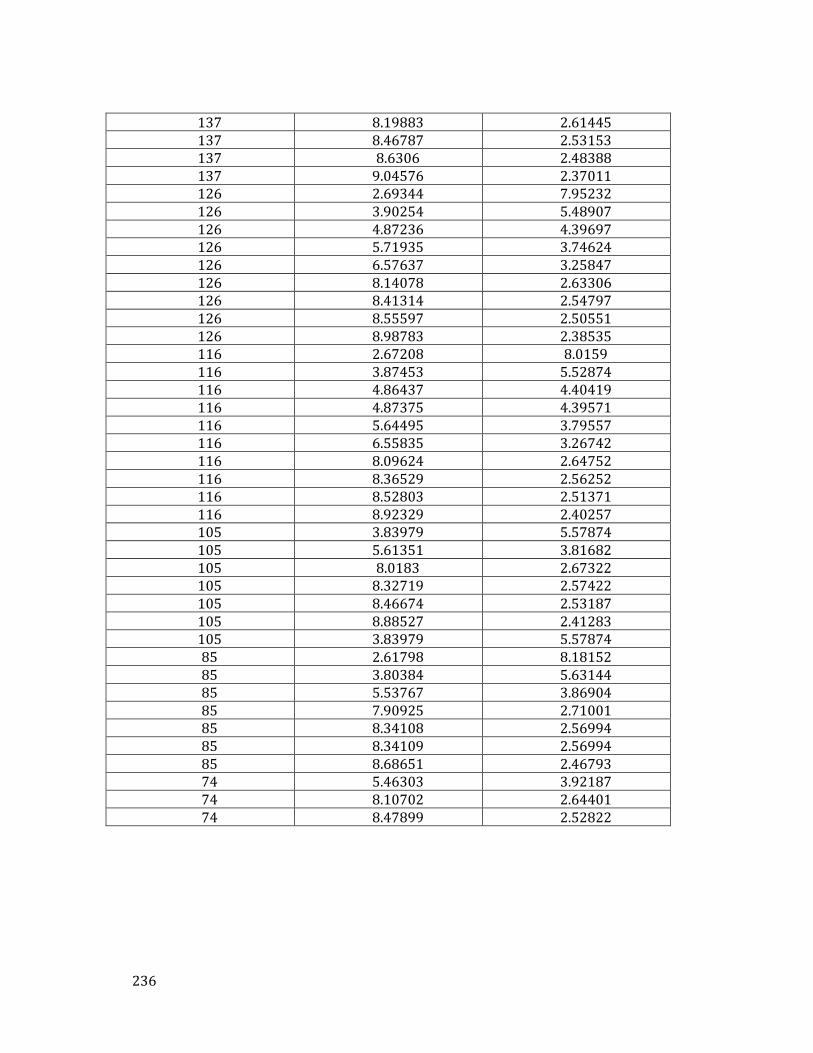
236
137 8.19883 2.61445 137 8.46787 2.53153 137 8.6306 2.48388 137 9.04576 2.37011 126 2.69344 7.95232 126 3.90254 5.48907 126 4.87236 4.39697 126 5.71935 3.74624 126 6.57637 3.25847 126 8.14078 2.63306 126 8.41314 2.54797 126 8.55597 2.50551 126 8.98783 2.38535 116 2.67208 8.0159 116 3.87453 5.52874 116 4.86437 4.40419 116 4.87375 4.39571 116 5.64495 3.79557 116 6.55835 3.26742 116 8.09624 2.64752 116 8.36529 2.56252 116 8.52803 2.51371 116 8.92329 2.40257 105 3.83979 5.57874 105 5.61351 3.81682 105 8.0183 2.67322 105 8.32719 2.57422 105 8.46674 2.53187 105 8.88527 2.41283 105 3.83979 5.57874 85 2.61798 8.18152 85 3.80384 5.63144 85 5.53767 3.86904 85 7.90925 2.71001 85 8.34108 2.56994 85 8.34109 2.56994 85 8.68651 2.46793 74 5.46303 3.92187 74 8.10702 2.64401 74 8.47899 2.52822

237
REFERENCES
[1] R. J. Hemley, Annu. Rev. Phys. Chem 51, 763 (2000).
[2] C. S. Yoo, AIP Conf. Proc. 1195, 11 (2009).
[3] J. A. Ciezak and B. M. Rice, Polymeric Nitrogen: The Ultimate, Green High Performing Energetic Material (2006).
[4] C. Mailhiot, L. Yang, and A. McMahan, Phys. Rev. B 46, 14419 (1992).
[5] A. F. Goncharov, E. Gregoryanz, H. Mao, and R. J. Hemley, Low Temp. Phys. 27, 866 (2001).
[6] E. Gregoryanz, A. Goncharov, R. Hemley, and H. Mao, Phys. Rev. B 64, 052103 (2001).
[7] E. Gregoryanz, A. Goncharov, R. Hemley, H. Mao, M. Somayazulu, and G. Shen, Phys. Rev. B 66, 224108 (2002).
[8] M. I. Eremets, R. J. Hemley, H. Mao, and E. Gregoryanz, Nature 411, 170 (2001).
[9] A. F. Goncharov, E. Gregoryanz, H. K. Mao, Z. Liu, and R. J. Hemley, Phys. Rev. Lett. 85, 1262 (2000).
[10] M. I. Eremets, A. G. Gavriliuk, I. A. Trojan, D. A. Dzivenko, and R. Boehler, Nat. Mater. 3, 558 (2004).
[11] N. W. Ashcroft, Phys. Rev. Lett. 92, 187002 (2004).
[12] X. Wang, Y. Wang, M. Miao, X. Zhong, J. Lv, T. Cui, J. Li, L. Chen, C. J. Pickard, and Y. Ma, Phys. Rev. Lett. 109, 175502 (2012).
238
[13] C. J. Pickard and R. J. Needs, Phys. Rev. Lett. 102, 1 (2009).
[14] Y. Ma, A. Oganov, Z. Li, Y. Xie, and J. Kotakoski, Phys. Rev. Lett. 102, 065501 (2009).
[15] W. Li, X. Huang, K. Bao, Z. Zhao, Y. Huang, L. Wang, G. Wu, B. Zhou, D. Duan, F. Li, Q. Zhou, B. Liu, and T. Cui, Sci. Rep. 7, 39249 (2016).
[16] X. Wang, F. Tian, L. Wang, X. Jin, D. Duan, X. Huang, B. Liu, and T. Cui, New J. Phys. 15, 013010 (2013).
[17] D. Tomasino, M. Kim, J. Smith, and C.-S. Yoo, Phys. Rev. Lett. 113, 205502 (2014).
[18] F. Peng, Y. Wang, H. Wang, Y. Zhang, and Y. Ma, Phys. Rev. B 92, 094104 (2015).
[19] Q. J. Liu, W. Zeng, F. S. Liu, and Z. T. Liu, Comput. Theor. Chem. 1014, 37 (2013).
[20] A. Hu and F. Zhang, J. Phys. Condens. Matter 23, 22203 (2011).
[21] G.-R. Qian, C.-H. Hu, A. R. Oganov, Q. Zeng, and H.-Y. Zhou, Sci. Rep. 6, 25947 (2014).
[22] K. Yin, Y. Wang, H. Liu, F. Peng, and L. Zhang, J. Mater. Chem. A 3, 4188 (2015).
[23] B. A. Steele and I. I. Oleynik, J. Phys. Chem. A 121, 1808 (2017).
[24] D. K. Spaulding, G. Weck, P. Loubeyre, F. Datchi, P. Dumas, and M. Hanfland, Nat. Commun. 5, 5739 (2014).
[25] A. F. Goncharov, N. Holtgrewe, G. Qian, C. Hu, A. R. Oganov, M. Somayazulu, E. Stavrou, C. J. Pickard, A. Berlie, F. Yen, M. Mahmood, S. S. Lobanov, Z. Konôpkova, and V. B. Prakapenka, J. Chem. Phys. 142, 214308 (2015).
[26] H. Wang, M. I. Eremets, I. Troyan, H. Liu, Y. Ma, and L. Vereecken, Sci. Rep. 5, 13239 (2015).
[27] D. Dirtu, L. Odochian, A. Pui, and I. Humelnicu, Cent. Eur. J. Chem. 4, 666 (2006).
[28] F. Peng, Y. Yao, H. Liu, and Y. Ma, J. Phys. Chem. Lett. 6, 2363 (2015).
[29] Y. Shen, A. R. Oganov, G. Qian, H. Dong, Q. Zhu, and Z. Zhou, Sci. Rep. 5, 1 (2015).
[30] D. L. V. K. Prasad, N. W. Ashcroft, and R. Hoffmann, J. Phys. Chem. C 117, 20838 (2013).
[31] M. Zhang, H. Yan, Q. Wei, H. Wang, and Z. Wu, EPL 101, 26004 (2013).
[32] C. Zhang, C. Yang, B. Hu, C. Yu, Z. Zheng, and C. Sun, Angew. Chemie - Int. Ed. 56, 4512 (2017).

239
[33] Y. Xu, Q. Wang, C. Shen, Q. Lin, P. Wang, and M. Lu, Nature 549, 78 (2017).
[34] C. Zhang, C. Sun, B. Hu, C. Yu, and M. Lu, Science 355, 374 (2017).
[35] P. C. Samartzis and A. M. Wodtke, Int. Rev. Phys. Chem. 25, 527 (2006).
[36] F. Cacace, G. de Petris, and A. Troiani, Science 295, 480 (2002).
[37] A. Vij, J. G. Pavlovich, W. W. Wilson, V. Vij, and K. O. Christe, Angew. Chemie - Int. Ed. 41, 3051 (2002).
[38] K. O. Christe, W. W. Wilson, J. A. Sheehy, and J. A. Boatz, Angew. Chemie Int. Ed. 38, 2004 (1999).
[39] T. Hager, The Alchemy of Air (Broadway Books, New York, 2008).
[40] P. M. Bell, H. K. Mao, and R. J. Hemley, Phys. B+C 139–140, 16 (1986).
[41] T. Zhang, S. Zhang, Q. Chen, and L.-M. Peng, Phys. Rev. B 73, 094105 (2006).
[42] V. E. Zarko, Combust. Explos. Shock Waves 46, 121 (2010).
[43] C. Pooley and E. LeBouthillier, Orbital Aspirations (CreateSpace Independent Publishing Platform, Washington, 2013).
[44] K. O. Christe, Propellants, Explos. Pyrotech. 32, 194 (2007).
[45] V. Ozolinš and A. Zunger, Phys. Rev. Lett. 82, 767 (1999).
[46] W. Sun, S. T. Dacek, S. P. Ong, G. Hautier, A. Jain, W. D. Richards, A. C. Gamst, K. A. Persson, and G. Ceder, Sci. Adv. 2, 1 (2016).
[47] B. A. Steele and I. I. Oleynik, Chem. Phys. Lett. 643, 21 (2016).
[48] Z. Wang, Y. Li, H. Li, I. Harran, M. Jia, H. Wang, Y. Chen, H. Wang, and N. Wu, J. Alloys Compd. 702, 132 (2017).
[49] B. A. Steele, E. Stavrou, J. C. Crowhurst, J. M. Zaug, V. B. Prakapenka, and I. I. Oleynik, Chem. Mater. 29, 735 (2017).
[50] S. Yu, B. Huang, Q. Zeng, A. R. Oganov, L. Zhang, and G. Frapper, J. Phys. Chem. C 121, 11037 (2017).
[51] S. Wei, D. Li, Z. Liu, X. Li, F. Tian, D. Duan, B. Liu, and T. Cui, J. Phys. Chem. Chem. Phys. 19, 9246 (2017).
[52] W. Sun, A. Holder, B. Orvañanos, E. Arca, A. Zakutayev, S. Lany, and G. Ceder, Chem. Mater. 29, 6936 (2017).
[53] S. Zhang, Z. Zhao, L. Liu, and G. Yang, J. Power Sources 365, 155 (2017).
240
[54] G. Soto, Comput. Mater. Sci. 61, 1 (2012).
[55] J. Zhang, A. R. Oganov, X. Li, and H. Niu, Phys. Rev. B 95, 020103 (2017).
[56] M. Wessel and R. Dronskowski, J. Am. Chem. Soc. 132, 2421 (2010).
[57] M. I. Eremets, A. G. Gavriliuk, N. R. Serebryanaya, I. A. Trojan, D. A. Dzivenko, R. Boehler, H. K. Mao, and R. J. Hemley, J. Chem. Phys. 121, 11296 (2004).
[58] D. Li, P. Zhu, J. Jiang, D. Xu, R. Liu, X. Wang, and Q. Cui, J. Phys. Commun. 1, 025002 (2017).
[59] D. Li, P. Zhu, J. Jiang, M. Li, Y. Chen, B. Liu, X. Wang, Q. Cui, and H. Zhu, J. Phys. Chem. C 120, 27013 (2016).
[60] M. Pravica, D. Sneed, Q. Smith, B. Billinghurst, T. May, M. White, and K. Dziubek, Cogent Phys. 3, 1169880 (2016).
[61] M. Pravica, D. Sneed, M. White, and Y. Wang, Cit. Rev. Sci. Instruments Chem. Phys 85, 086110 (2014).
[62] D. Sihachakr and P. Loubeyre, Phys. Rev. B 74, 064113 (2006).
[63] V. I. Levitas, Phys. Rev. B - Condens. Matter Mater. Phys. 70, 184118 (2004).
[64] V. I. Levitas and L. K. Shvedov, Phys. Rev. B - Condens. Matter Mater. Phys. 65, 104109 (2002).
[65] R. Bini and V. Schettino, Materials under Extreme Conditions (Imperial College Press , London, 2014).
[66] H.-K. Mao, B. Chen, J. Chen, K. Li, J.-F. Lin, W. Yang, and H. Zheng, Matter Radiat. Extrem. 1, 59 (2016).
[67] C. H. Polsky and E. Van Valkenburg, in Handb. Vib. Spectrosc. (John Wiley & Sons, Ltd, 2006), pp. 1352–1360.
[68] C. E. Weir, E. R. Lippincott, and N. E. Bunting, J. Res. Natl. Bur. Stand. - A. Phys. Chem. 63, 55 (1959).
[69] J. C. Jamieson, A. W. Lawson, and N. D. Nachtrier, Rev. Sci. Instrum. 30, 1016 (1959).
[70] R. Letoullec, J. P. Pinceaux, and P. Loubeyre, High Press. Res. 1, 77 (1988).
[71] W. B. Daniels and M. G. Ryschkewitsch, Rev. Sci. Instrum. 54, 115 (1983).
[72] R. Boehler and K. De Hantsetters, High Press. Res. 24, 391 (2004).
[73] A. Y. Liu and M. L. Cohen, Science 245, 841 (1989).

241
[74] J. E. Graebner, in Diam. Electron. Prop. Appl., edited by L. S. Pan and D. R. Kania (Springer US, Boston, 1995), pp. 285–318.
[75] A. Jayaraman, Rev. Mod. Phys. 55, 65 (1983).
[76] A. L. Ruoff, H. Xia, H. Luo, and Y. K. Vohra, Rev. Sci. Instrum. 61, 3830 (1990).
[77] B. Li, C. Ji, W. Yang, J. Wang, K. Yang, R. Xu, W. Liu, Z. Cai, J. Chen, and H. Mao, Proc. Natl. Acad. Sci. 115, 1713 (2018).
[78] H. W. Hayden, W. G. Moffat, and J. Wulff, The Structure and Properties of Materials (Wiley, New York, 1965).
[79] A. Dewaele, F. Occelli, and P. Loubeyre, ESRF Exp. Rep. (2015).
[80] N. Dubrovinskaia, L. Dubrovinsky, N. A. Solopova, A. Abakumov, S. Turner, M. Hanfland, E. Bykova, M. Bykov, C. Prescher, V. B. Prakapenka, S. Petitgirard, I. Chuvashova, B. Gasharova, Y.-L. Mathis, P. Ershov, I. Snigireva, and A. Snigirev, Sci. Adv. 2, e1600341 (2016).
[81] P. Loubeyre, R. Letoullec, and J. P. Pinceaux, 71, 12 (1993).
[82] J.-P. Pinceaux, J.-P. Maury, and J.-M. Besson, J. Phys. Lettres 40, 307 (1979).
[83] H. Olijnyk, J. Chem. Phys. 93, 8968 (1990).
[84] F. Schwabl, in Stat. Mech., 3rd ed. (Springer Science & Business Media, Berlin, 2002), pp. 231–236.
[85] A. White, Intermolecular Potentials of Mixed Systems: Testing the Lorentz-Berthelot Mixing Rules with Ab Initio Calculations (2000).
[86] J. O. Hischefelder, C. F. Curtiss, and R. B. Bird, Molecular Theory of Gases and Liquids (John Wiley and Sons Ltd, New York, 1964).
[87] Z. M. Geballe and R. Jeanloz, J. Appl. Phys. 111, 123518 (2012).
[88] R. Reichlin, K. E. Brister, A. K. McMahan, M. Ross, S. Martin, Y. K. Vohra, and A. L. Ruoff, Phys. Rev. Lett. 62, 669 (1989).
[89] M. Krisch, J. Raman Spectrosc. 34, 628 (2003).
[90] A. Polian, J. Raman Spectrosc. 34, 633 (2003).
[91] Y. Bi, H. Zhou, Z. Huang, H. Zhou, and X. Yang, Rev. Sci. Instrum. 85, 125002 (2014).
[92] C.-S. Zha, H. Mao, and R. J. Hemley, Proc. Natl. Acad. Sci. U. S. A. 97, 13494 (2000).
[93] K. K. Zhuravlev, A. F. Goncharov, S. N. Tkachev, P. Dera, and V. B. Prakapenka, J.

242
Appl. Phys. 113, 113503 (2013).
[94] J.-P. Poirier, Introduction to the Physics of the Earth’s Interior (Cambridge University Press, Cambridge, 1991).
[95] H. Takeuchi and H. Kanamori, J. Geophys. Res. 71, 3985 (1966).
[96] A. Dewaele, M. Torrent, P. Loubeyre, and M. Mezouar, Phys. Rev. B 78, 104102 (2008).
[97] H. K. Mao, P. M. Bell, J. W. Shaner, and D. J. Steinberg, J. Appl. Phys. 49, 3276 (1978).
[98] K. Takemura and A. Dewaele, Phys. Rev. B 78, 104119 (2008).
[99] S. Anzellini, A. Dewaele, F. Occelli, P. Loubeyre, and M. Mezouar, J. Appl. Phys. 115, 043511 (2014).
[100] Y. Akahama and H. Kawamura, J. Phys. Conf. Ser. 215, 012195 (2010).
[101] J. Als-Nielsen and D. McMorrow, in Elem. Mod. X-Ray Phys., Second Edi (John Wiley & Sons, Ltd, 2011), pp. 29–68.
[102] M. Mezouar, W. A. Crichton, S. Bauchau, F. Thurel, H. Witsch, F. Torrecillas, G. Blattmann, P. Marion, Y. Dabin, J. Chavanne, O. Hignette, C. Morawe, and C. Borel, J. Synchrotron Radiat. 12, 659 (2005).
[103] M. Mezouar, R. Giampaoli, G. Garbarino, I. Kantor, A. Dewaele, G. Weck, S. Boccato, V. Svitlyk, A. D. Rosa, R. Torchio, O. Mathon, O. Hignette, and S. Bauchau, High Press. Res. 37, 170 (2017).
[104] C. Prescher and V. B. Prakapenka, High Press. Res. 35, 223 (2015).
[105] A. Boultif and D. Louër, J. Appl. Crystallogr. 24, 987 (1991).
[106] J. Laugier and B. Bochu, Checkcell, LMGP-Suite of Programs for the Interpretation of
X-Ray Experiments. Laboratoire des Materiaux et du Génie Physique de l'Ecole
Supérieure de Physique de Grenoble, Laboratoire des Materiaux et du Genie, Saint Martind’Heres. http://www.ccp14.ac.in/tutorial/lmgp/ (2004).
[107] V. Favre-Nicolin and R. Černý, J. Appl. Crystallogr. 35, 734 (2002).
[108] A. Altomare, C. Cuocci, C. Giacovazzo, A. Moliterni, R. Rizzi, N. Corriero, and A. Falcicchio, J. Appl. Crystallogr. 46, 1231 (2013).
[109] J. Rodriguez-Carvajal, Phys. B Condens. Matter 192, 55 (1993).
[110] J. I. Langford and D. Lou, Reports Prog. Phys. 59, 131 (1996).
[111] A. Le Bail, H. Duroy, and J. L. Fourquet, Mater. Res. Bull. 23, 447 (1988).

243
[112] S. Desgreniers and K. Lagarec, J. Appl. Crystallogr. 27, 432 (1994).
[113] T. B. Ballaran, A. Kurnosov, and D. Trots, High Press. Res. 33, 453 (2013).
[114] D. F. Datchi and D. G. Weck, Zeitschrift Für Krist. – Cryst. Mater. 229, 135 (2014).
[115] E. Bykova, Single-Crystal X-Ray Diffraction at Extreme Conditions in Mineral Physics and Material Sciences, University of Bayreuth, 2015.
[116] CrysAlisPRO, Oxford Diffraction /Agilent Technologies UK Ltd, Yarnton, England. (2015).
[117] V. Petrícek, M. Dušek, and L. Palatinus, Zeitschrift Fur Krist. 229, 345 (2014).
[118] L. Palatinus and G. Chapuis, J. Appl. Crystallogr. 40, 786 (2007).
[119] M. C. Burla, R. Caliandro, M. Camalli, B. Carrozzini, G. L. Cascarano, L. De Caro, C. Giacovazzo, G. Polidori, and R. Spagna, J. Appl. Crystallogr. 38, 381 (2005).
[120] F. Birch, Phys. Rev. B 71, 809 (1947).
[121] P. Vinet, J. Ferrante, J. H. Rose, and J. R. Smith, J. Geophys. Res. 92, 9319 (1987).
[122] R. E. Cohen, O. Gülseren, and R. J. Hemley, Am. Mineral. 85, 338 (2000).
[123] E. Gregoryanz, C. Sanloup, M. Somayazulu, J. Badro, G. Fiquet, H. Mao, and R. J. Hemley, Nat. Mater. 3, 294 (2004).
[124] A. F. Young, J. A. Montoya, C. Sanloup, M. Lazzeri, E. Gregoryanz, and S. Scandolo, Phys. Rev. B 73, 2 (2006).
[125] G. W. Stinton, I. Loa, L. F. Lundegaard, and M. I. McMahon, J. Chem. Phys. 131, 104511 (2009).
[126] D. Laniel, V. Svitlyk, G. Weck, and P. Loubeyre, Phys. Chem. Chem. Phys. 20, 4050 (2018).
[127] D. Laniel, G. Weck, and P. Loubeyre, Phys. Rev. B 94, 174109 (2016).
[128] P. Chemistry, Methods Phys. Chem. (2012).
[129] B. Dietzek, D. Cialla, M. Schmitt, and J. Popp, in Confocal Raman Microsc., edited by T. Dieing, O. Hollricher, and J. Toporski (Springer, Berlin, 2010), pp. 21–27.
[130] A. F. Goncharov, Int. J. Spectrosc. 2012, 1 (2012).
[131] J. H. Eggert, K. A. Goettel, and I. F. Silvera, Appl. Phys. Lett. 53, 2489 (1988).
[132] A. D. Buckingham, C. Graham, and J. H. Williams, An Int. J. Interface Between Chem. Phys. Mol. Phys. 493, 703 (1983).

244
[133] P. Bündgen, F. Grein, and A. J. Thakkar, J. Mol. Struct. THEOCHEM 334, 7 (1995).
[134] A. Mulder, J. P. J. Michels, and J. A. Schouten, J. Chem. Phys. 105, 3235 (1996).
[135] A. Erba, L. Maschio, C. Pisani, and S. Casassa, Phys. Rev. B 84, 012101 (2011).
[136] G. Weck, F. Datchi, G. Garbarino, S. Ninet, J.-A. Queyroux, T. Plisson, M. Mezouar, and P. Loubeyre, Phys. Rev. Lett. 119, 235701 (2017).
[137] E. Gregoryanz, A. F. Goncharov, C. Sanloup, M. Somayazulu, H. K. Mao, and R. J. Hemley, J. Chem. Phys. 126, 184505 (2007).
[138] M. Frost, R. T. Howie, P. Dalladay-Simpson, A. F. Goncharov, and E. Gregoryanz, Phys. Rev. B 93, 024113 (2016).
[139] D. Schiferl, D. T. Cromer, R. R. Ryan, A. C. Larson, R. LeSar, and R. L. Mills, Acta Crystallogr. C 39, 1151 (1983).
[140] R. L. Mills, B. Olinger, and D. T. Cromer, J. Chem. Phys. 84, 2837 (1986).
[141] M. I. M. Scheerboom and J. A. Schouten, J. Chem. Phys. 105, 2553 (1996).
[142] H. Schneider, W. Ha fner, A. Wokaun, and H. Olijnyk, J. Chem. Phys. 96, 8046 (1992).
[143] H. Olijnyk and A. P. Jephcoat, Phys. Rev. Lett. 83, 332 (1999).
[144] D. T. Cromer, R. L. Mills, D. Schiferi, and L. A. Schwalbe, Acta Crystallogr. Sect. B Struct. Crystallogr. Cryst. Chem. B37, 8 (1981).
[145] M. I. M. Scheerboom and J. A. Schouten, Phys. Rev. Lett. 71, 2252 (1993).
[146] M. Hanfland, M. Lorenzen, C. Wassilew-Reul, and F. Zontone, Rev. High Press. Sci. Technol. 7, 787 (1998).
[147] R. Bini, M. Jordan, L. Ulivi, and H. J. Jodl, J. Chem. Phys. 108, 6849 (1998).
[148] R. Bini, L. Ulivi, J. Kreutz, and H. J. Jodl, J. Chem. Phys. 112, 8522 (2000).
[149] L. Mederos, E. Chacn, and P. Tarazona, Phys. Rev. B 42, 8571 (1990).
[150] S. Ninet, G. Weck, P. Loubeyre, and F. Datchi, Phys. Rev. B 83, 7 (2011).
[151] J. Hooper, A. Hu, F. Zhang, and T. K. Woo, Phys. Rev. B 80, 104117 (2009).
[152] T. W. Barbee III, Phys. Rev. B 48, 9327 (1993).
[153] R. Caracas, J. Chem. Phys. 1271, 144510 (2007).
[154] D. Tomasino, Z. Jenei, W. Evans, and C.-S. Yoo, J. Chem. Phys. 140, 244510 (2014).

245
[155] A. F. Goncharov, J. C. Crowhurst, V. V. Struzhkin, and R. J. Hemley, Phys. Rev. Lett. 101, 095502 (2008).
[156] A. R. Oganov and C. W. Glass, J. Chem. Phys. 124, 244704 (2006).
[157] G. D. Mukherjee and R. Boehler, Phys. Rev. Lett. 99, 225701 (2007).
[158] D. Donadio, L. Spanu, I. Duchemin, F. Gygi, and G. Galli, Phys. Rev. B - Condens. Matter Mater. Phys. 82, 1 (2010).
[159] P. Zaleski-Ejgierd, V. Labet, T. A. Strobel, R. Hoffmann, and N. W. Ashcroft, J. Phys. Condens. Matter 24, 155701 (2012).
[160] S. Jiang, X. Huang, D. Duan, S. Zheng, F. Li, X. Yang, Q. Zhou, B. Liu, and T. Cui, J. Phys. Chem. C 118, 3236 (2014).
[161] A. F. Young, C. Sanloup, E. Gregoryanz, S. Scandolo, R. J. Hemley, and H. K. Mao, Phys. Rev. Lett. 96, 155501 (2006).
[162] N. Bartlett and F. O. Sladky, in Chem. Monatomic Gases (Pergamon Press, New York, 1973), pp. 213–330.
[163] N. Bartlett, Proc. Chem. Soc. 218 (1960).
[164] H. H. Claassen, H. Selig, and J. G. Malm, J. Am. Chem. Soc. 84, 3593 (1962).
[165] J. Haner and G. J. Schrobilgen, Chem. Rev. 115, 1255 (2015).
[166] J. H. Burns, P. A. Agron, and H. A. Levy, Science 139, 1208 (1963).
[167] J. A. Ibers and W. C. Hamilton, Science 139, 1 (1963).
[168] J. G. Malm, C. L. Chernick, and S. M. Williamson, in Inorg. Synth., edited by H. F. Holtzlaw (John Wiley & Sons, Inc., Hoboken, 1966).
[169] J. G. Malm, I. Sheft, and C. L. Chernick, J. Am. Chem. Soc. 85, 110 (1963).
[170] R. Hoppe, W. Dabne, H. Mattauch, and K. Rodder, Angew. Chemie Int. Ed. English 1, 599 (1962).
[171] S. Hoyer, T. Emmler, and K. Seppelt, J. Fluor. Chem. 127, 1415 (2006).
[172] D. S. Brock, G. J. Schrobilgen, and B. Zemva, in Compr. Inorg. Chem., edited by J. Reedijk and K. Poeppelmeier, 1st ed. (Elsevier, Oxford, UK, 2013), p. 755.
[173] M. Ross, J. Chem. Phys. 56, 4651 (1972).
[174] H. Chacham, X. Zhu, and S. G. Louie, Europhys. Lett. 14, 65 (1991).
[175] M. Ross and A. K. McMahan, Phys. Rev. B 21, 1658 (1980).

246
[176] D. A. Nelson and A. L. Ruoff, Phys. Rev. Lett. 42, 383 (1979).
[177] K. Syassen, Phys. Rev. B 2, 6548 (1982).
[178] I. Makarenko, G. Weill, J. P. Itié, and J. M. Besson, Phys. Rev. B 26, 7113 (1982).
[179] A. N. Zisman, I. V. Aleksendrov, and S. M. Stishov, Pis’ma Zh. Eksp. Teor. Fiz. 40, 253 (1984).
[180] D. Schiferl, R. L. Mills, and L. E. Trimmer, Solid State Commun. 46, 783 (1983).
[181] A. P. Jephcoat, H.-K. Mao, L. W. Finger, D. E. Cox, R. J. Hemley, and C.-S. Zha, Phys. Rev. Lett. 59, 2670 (1987).
[182] M. Eremets, E. Gregoryanz, V. Struzhkin, H.-K. Mao, R. Hemley, N. Mulders, and N. Zimmerman, Phys. Rev. Lett. 85, 2797 (2000).
[183] H. Cynn, C. S. Yoo, B. Baer, V. Iota-Herbei, A. K. McMahan, M. Nicol, and S. Carlson, Phys. Rev. Lett. 86, 4552 (2001).
[184] S. Sasaki, N. Wada, T. Kume, and H. Shimizu, J. Raman Spectrosc. 40, 121 (2009).
[185] K. A. Goettel, J. H. Eggert, I. F. Silvera, and W. C. Moss, Phys. Rev. Lett. 62, 665 (1989).
[186] P. H. Lahr and W. G. Eversole, J. Chem. Eng. Data 7, 42 (1962).
[187] A. Dewaele, P. Loubeyre, P. Dumas, and M. Mezouar, Phys. Rev. B 86, 014103 (2012).
[188] W. Hume-Rothery, G. W. Mabbott, and C. Evans, R. Trans. Philos. Soc. Ser. A 233, 1 (1934).
[189] X. Cottin and P. A. Monson, J. Chem. Phys. 102, 3354 (1993).
[190] A.-P. Hynninen, L. Filion, and M. Dijkstra, J. Chem. Phys. 131, 064902 (2009).
[191] J. Zhu, C. Liu, L. Pike, and P. Liaw, Metall. Mater. Trans. A 30A, 1449 (1999).
[192] C. Sanloup, S. A. Bonev, M. Hochlaf, and H. E. Maynard-Casely, Phys. Rev. Lett. 110, 1 (2013).
[193] M. Somayazulu, P. Dera, A. F. Goncharov, S. A. Gramsch, P. Liermann, W. Yang, Z. Liu, H.-K. Mao, and R. J. Hemley, Nat. Chem. 2, 50 (2010).
[194] G. Weck, A. Dewaele, and P. Loubeyre, Phys. Rev. B 82, 014112 (2010).
[195] R. O. Pepin and D. Porcelli, Rev. Mineral. Geochemistry 47, 191 (2002).
[196] S. S. Shcheka and H. Keppler, Nature 490, 531 (2012).

247
[197] L. Zhu, H. Liu, C. J. Pickard, G. Zou, and Y. Ma, Nat. Chem. 6, 644 (2014).
[198] Q. Zhu, D. Y. Jung, A. R. Oganov, C. W. Glass, C. Gatti, and A. O. Lyakhov, Nat. Chem. 5, 61 (2013).
[199] A. Hermann and P. Schwerdtfeger, J. Phys. Chem. Lett. 5, 4336 (2014).
[200] A. Dewaele, N. Worth, C. J. Pickard, R. J. Needs, S. Pascarelli, O. Mathon, M. Mezouar, and T. Irifune, Nat. Chem. 8, 784 (2016).
[201] A. Dewaele, C. M. Pépin, G. Geneste, and G. Garbarino, High Press. Res. 37, 137 (2017).
[202] E. Stavrou, Y. Yao, A. F. Goncharov, S. Lobanov, J. M. Zaug, H. Liu, E. Greenberg, and V. B. Prakapenka, Phys. Rev. Lett. 120, 96001 (2018).
[203] Y. Wang, J. Lv, L. Zhu, and Y. Ma, Phys. Rev. B - Condens. Matter Mater. Phys. 82, 1 (2010).
[204] W. J. Evans, M. J. Lipp, C. S. Yoo, H. Cynn, J. L. Herberg, R. S. Maxwell, and M. F. Nicol, Chem. Mater. 18, 2520 (2006).
[205] R. T. Howie, R. Turnbull, J. Binns, M. Frost, P. Dalladay-Simpson, and E. Gregoryanz, Sci. Rep. 6, 34896 (2016).
[206] K. Niwa, F. Matsuzaki, and M. Hasegawa, Phys. Chem. Chem. Phys. 19, 59 (2017).
[207] J. Lin, O. Degtyareva, C. Prewitt, P. Dera, N. Sata, E. Gregoryanz, H. Mao, and R. Hemley, Nat. Mater. 3, 389 (2004).
[208] M. Pravica, L. Bai, and Y. Liu, Chem. Phys. Lett. 555, 115 (2013).
[209] E. Wigner and H. B. Huntington, J. Chem. Phys. 3, 764 (1935).
[210] J. McMinis, R. C. Clay, D. Lee, and M. A. Morales, Phys. Rev. Lett. 114, 1 (2015).
[211] E. G. Brovman, Y. Kagan, and A. Kholas, Zh. Eksp. Tear. Fiz 35, 1492 (1972).
[212] R. P. Dias and I. F. Silvera, Science 355, 715 (2017).
[213] M. I. Eremets and I. A. Troyan, Nat. Mater. 10, 927 (2011).
[214] H. Mao, R. Hemley, and M. Hanfland, Phys. Rev. Lett. 65, 484 (1990).
[215] N. K. Mao and R. J. Hemley, Science 244, 1462 (1989).
[216] I. F. Silvera and J. W. Cole, J. Phys. Conf. Ser. 215, 012194 (2010).
[217] N. Wibert, in Inorg. Chem., edited by N. Wiberg (Academic Press, New York, 2001), pp. 598–777.

248
[218] J. E. Troyan, Eng. Process Dev. 45, 2608 (1953).
[219] 1N Hydrazine Thruster, ArianeGroup, http://www.space-propulsion.com/spacecraft-propulsion/hydrazine-thrusters/1n-hydrazine-thruster.html (2018).
[220] D. S. Moore and S. D. Robinson, in Adv. Inorg. Chem. Radiochem., edited by H. J. Emeléus and A. G. Sharpe (Academic Press, London, 1986), pp. 1–68.
[221] M. Gauthier, P. Pruzan, J. C. Chervin, and J. M. Besson, Phys. Rev. B 37, (1988).
[222] S. Ninet, F. Datchi, A. M. Saitta, M. Lazzeri, and B. Canny, Phys. Rev. B - Condens. Matter Mater. Phys. 74, 1 (2006).
[223] B. A. Chidester and T. A. Strobel, J. Phys. Chem. A 115, 10433 (2011).
[224] J. G. O. Ojwang, R. S. McWilliams, X. Ke, and A. F. Goncharov, J. Chem. Phys. 137, 064507 (2012).
[225] S. Ninet, F. Datchi, P. Dumas, M. Mezouar, G. Garbarino, A. Mafety, C. J. Pickard, R. J. Needs, and A. M. Saitta, Phys. Rev. B 89, 174103 (2014).
[226] T. Kume, S. Sasaki, and H. Shimizu, J. Raman Spectrosc. 32, 383 (2001).
[227] J. Ciezak, T. Jenkins, and R. Hemley, AIP Conf. Proc. 1195, 1291 (2009).
[228] R. Chellappa, D. Dattelbaum, L. Daemen, and Z. Liu, J. Phys. Conf. Ser. 500, 052008 (2014).
[229] S. Ninet and F. Datchi, J. Chem. Phys. 128, 154508 (2008).
[230] T. Palasyuk, I. Troyan, M. Eremets, V. Drozd, S. Medvedev, P. Zaleski-Ejgierd, E. Magos-Palasyuk, H. Wang, S. a. Bonev, D. Dudenko, and P. Naumov, Nat. Commun. 5, 3460 (2014).
[231] C. J. Pickard and R. J. Needs, Nat. Mater. 7, 775 (2008).
[232] A. S. Williams, B. A. Steele, and I. I. Oleynik, J. Chem. Phys. 147, 234701 (2017).
[233] D. Laniel, G. Weck, G. Gaiffe, G. Garbarino, and P. Loubeyre, J. Phys. Chem. Lett. 9, 1600 (2018).
[234] J. C. Crowhurst, J. M. Zaug, H. B. Radousky, B. a Steele, A. C. Landerville, and I. I. Oleynik, J. Phys. Chem. A 118, 8695 (2014).
[235] S. A. Medvedev, M. I. Eremets, J. Evers, T. M. Klapötke, T. Palasyuk, and I. A. Trojan, Chem. Phys. 386, 41 (2011).
[236] S. A. Medvedev, T. Palasyuk, I. A. Trojan, P. G. Naumov, J. Evers, T. M. Klapötke, and M. I. Eremets, Vib. Spectrosc. 58, 188 (2012).
249
[237] P. Loubeyre, F. Occelli, and R. LeToullec, Nature 416, 613 (2002).
[238] M. Hanfland, I. Loa, K. Syassen, U. Schwarz, and K. Takemura, Solid State Commun. 112, 123 (1999).
[239] M. Hanfland, K. Syassen, N. E. Christensen, and D. L. Novikov, Nat. Lett. 408, 174 (2000).
[240] C. L. Guillaume, E. Gregoryanz, O. Degtyareva, M. I. Mcmahon, M. Hanfland, S. Evans, M. Guthrie, S. V Sinogeikin, and H.-K. Mao, Nat. Phys. 7, 211 (2011).
[241] T. Matsuoka and K. Shimizu, Nature 458, 186 (2009).
[242] J. B. Neaton and N. W. Ashcroft, Nature 400, 141 (1999).
[243] Z. Yu, H. Y. Geng, Y. Sun, and Y. Chen, Sci. Rep. 8, 3868 (2018).
[244] M. S. Miao and R. Hoffmann, Acc. Chem. Res. 47, 1311 (2014).
[245] A. M. J. Schaeffer, W. B. Talmadge, S. R. Temple, and S. Deemyad, Phys. Rev. Lett. 109, 185702 (2012).
[246] S. Deemyad and R. Zhang, Phys. C Supercond. Its Appl. 548, 68 (2018).
[247] F. A. Gorelli, S. F. Elatresh, C. L. Guillaume, M. Marqués, G. J. Ackland, M. Santoro, S. A. Bonev, and E. Gregoryanz, Phys. Rev. Lett. 108, 055501 (2012).
[248] Y. Feng, J. Chen, D. Alfè, X. Z. Li, and E. Wang, J. Chem. Phys. 142, 064506 (2015).
[249] E. Dönges, in Handb. Prep. Inorgative Chem., edited by G. Brauer, Second Edi (Academic Press, London, 1963), p. 984.
[250] A. Rabenau, Solid State Ionics 6, 277 (1982).
[251] T. Shodai, S. Okada, S. Tobishima, and J. Yamaki, J. Power Sources 68, 515 (1997).
[252] Y. Sun, Y. Li, J. Sun, Y. Li, A. Pei, and Y. Cui, Energy Storage Mater. 6, 119 (2017).
[253] P. Chen, Z. Xiong, J. Luo, J. Lin, and K. Lee Tan, Nature 420, 302 (2002).
[254] J. L. O’Loughlin, C. H. Wallace, M. S. Knox, and R. B. Kaner, Inorg. Chem. 40, 2240 (2001).
[255] H. D. Fair and R. F. Walker, Energetic Materials (Plenum Press, New York, 1977).
[256] H. Beister, S. Haag, R. Kniep, K. Strössner, and K. Syassen, Angew. Chem. Int. Ed. Engl. 27, 1101 (1988).
[257] A. Lazicki, B. Maddox, W. J. Evans, C. S. Yoo, A. K. McMahan, W. E. Pickett, R. T. Scalettar, M. Y. Hu, and P. Chow, Phys. Rev. Lett. 95, 165503 (2005).

250
[258] S. A. Medvedev, I. A. Trojan, M. I. Eremets, T. Palasyuk, T. M. Klapötke, and J. Evers, J. Phys. Condens. Matter 21, 195404 (2009).
[259] S. B. Schneider, R. Frankovsky, and W. Schnick, Angew. Chem. Int. Ed. 51, 1873 (2012).
[260] R. Huisgen and I. Ugi, Angew. Chemie 68, 96 (1956).
[261] B. Bazanov, U. Geiger, R. Carmieli, D. Grinstein, S. Welner, and Y. Haas, Angew. Chemie - Int. Ed. 55, 13233 (2016).
[262] L. Zhang, Y. Wang, J. Lv, and Y. Ma, Nat. Publ. Gr. 2, 1 (2017).
[263] R. Dronskowski and P. E. Blöchl, J. Phys. Chem. 97, 8617 (1993).
[264] A. C. Ho, M. K. Granger, A. L. Ruoff, P. E. Van Camp, and V. E. Van Doren, Phys. Rev. B 59, 6083 (1999).
[265] S. Duwal, Y.-J. Ryu, M. Kim, C.-S. Yoo, S. Bang, K. Kim, and N. H. Hur, J. Chem. Phys. 148, 134310 (2018).
[266] M. Bykov, E. Bykova, E. Koemets, T. Fedotenko, G. Aprilis, K. Glazyrin, H.-P. Liermann, A. V Ponomareva, J. Tidholm, F. Tasnádi, I. A. Abrikosov, N. Dubrovinskaia, and L. Dubrovinsky, Angew. Chemie Int. Ed. 10, (2018).
[267] Y. D. Perfiliev and V. K. Sharma, in ACS Symp. Ser. (American Chemical Society, Washington, DC, 2008), pp. 112–123.
[268] M. Benolt, D. Marx, and M. Parrinello, Nature 392, 258 (1998).
[269] R. T. Howie, T. Scheler, C. L. Guillaume, and E. Gregoryanz, Phys. Rev. B - Condens. Matter Mater. Phys. 86, 3 (2012).
[270] M. Kim and C. S. Yoo, J. Chem. Phys. 134, 044519 (2011).
[271] S. Wei, D. Li, Z. Liu, W. Wang, F. Tian, K. Bao, D. Duan, B. Liu, and T. Cui, J. Phys. Chem. C 121, 9766 (2017).
[272] S. Zhu, F. Peng, H. Liu, A. Majumdar, T. Gao, and Y. Yao, Inorg. Chem. 55, 7550 (2016).
[273] D. Laniel, A. Dewaele, and G. Garbarino, Inorg. Chem. 57, 6245 (2018).
[274] V. S. Bhadram, D. Y. Kim, and T. A. Strobel, Chem. Mater. 28, 1616 (2016).
[275] K. Niwa, T. Terabe, D. Kato, S. Takayama, M. Kato, K. Soda, and M. Hasegawa, Inorg. Chem. 56, 6410 (2017).
[276] D. Kurzydłowski and P. Zaleski-Ejgierd, Sci. Rep. 6, 1 (2016).

251
[277] T. Irifune, A. Kurio, S. Sakamoto, T. Inoue, H. Sumiya, and K. ichi Funakoshi, Phys. Earth Planet. Inter. 143, 593 (2004).
[278] N. M. Hwang, Non-Classical Crystallization of Thin Films and Nanostructures in CVD and PVD Processes (Springer Netherlands, Dordrecht, 2016).
[279] E. M. Benchafia, Z. Yao, G. Yuan, T. Chou, H. Piao, X. Wang, and Z. Iqbal, Nat. Commun. 8, 1 (2017).
[280] A. Vailionis, E. G. Gamaly, V. Mizeikis, W. Yang, A. V. Rode, and S. Juodkazis, Nat. Commun. 2, 445 (2011).
[281] S. Juodkazis, K. Nishimura, S. Tanaka, H. Misawa, E. G. Gamaly, B. Luther-Davies, L. Hallo, P. Nicolai, and V. T. Tikhonchuk, Phys. Rev. Lett. 96, 1 (2006).
[282] Chemical Abstracts Service (CAS) REGISTRY system, https://www.cas.org/support/documentation/chemical-substances (2018).
[283] A. Salamat, A. L. Hector, P. Kroll, and P. F. McMillan, Coord. Chem. Rev. 257, 2063 (2013).
[284] A. Friedrich, B. Winkler, E. A. Juarez-Arellano, and L. Bayarjargal, Materials (Basel). 4, 1648 (2011).
[285] J. C. Crowhurst, A. F. Goncharov, B. Sadigh, C. L. Evans, P. G. Morrall, J. L. Ferreira, and A. J. Nelson, Science 311, (2006).
[286] R. Yu, Q. Zhan, and L. C. De Jonghe, Angew. Chemie - Int. Ed. 46, 1136 (2007).
[287] K. Niwa, D. Dzivenko, K. Suzuki, R. Riedel, I. Troyan, M. Eremets, and M. Hasegawa, Inorg. Chem. 53, 697 (2014).
[288] K. Niwa, K. Suzuki, S. Muto, K. Tatsumi, K. Soda, T. Kikegawa, and M. Hasegawa, Chem. Eur. J. 20, 13885 (2014).
[289] M. Zhang, K. Cheng, H. Yan, Q. Wei, and B. Zheng, Sci. Rep. 6, 36911 (2016).
[290] J. C. Crowhurst, A. F. Goncharov, B. Sadigh, J. M. Zaug, D. Aberg, Y. Meng, and V. B. Prakapenka, J. Mater. Res. 23, 1 (2008).
[291] M. Hasegawa and T. Yagi, J. Alloys Compd. 403, 131 (2005).
[292] H. A. Wriedt, N. A. Gokcen, and R. H. Nafziger, Bull. Alloy Phase Diagr. 8, 355 (1987).
[293] M. Wessel and R. Dronskowski, Chem. Eur. J. 17, 2598 (2011).
[294] S. D. Gupta, S. K. Gupta, and P. K. Jha, Eur. Phys. J. B 86, 1 (2013).
[295] W. P. Clark, S. Steinberg, R. Dronskowski, C. McCammon, I. Kupenko, M. Bykov, L.

252
Dubrovinsky, L. G. Akselrud, U. Schwarz, and R. Niewa, Angew. Chemie - Int. Ed. 56, 7302 (2017).
[296] A. Dewaele, P. Loubeyre, F. Occelli, M. Mezouar, P. I. Dorogokupets, and M. Torrent, Phys. Rev. Lett. 97, 29 (2006).