von_scheffer.pdf - oatao - université de toulouse
TRANSCRIPT
En vue de l'obtention du
DOCTORAT DE L'UNIVERSITÉ DE TOULOUSEDélivré par :
Institut National Polytechnique de Toulouse (Toulouse INP)Discipline ou spécialité :
Surfaces Interfaces Continentales Hydrologie
Présentée et soutenue par :M. CLEMENS VON SCHEFFER
le mercredi 3 juillet 2019
Titre :
Unité de recherche :
Ecole doctorale :
Holocene human impact, climate and environment in the northern CentralAlps: A geochemical approach on mountain peatlands
Sciences de l'Univers de l'Environnement et de l'Espace (SDU2E)
Laboratoire Ecologie Fonctionnelle et Environnement ( ECOLAB)Directeur(s) de Thèse :
M. GAËL LE ROUXM. INGMAR UNKEL
Rapporteurs :Mme ANNE-VERONIQUE WALTER-SIMONNET, UNIVERSITE DE BOURGOGNE
Mme KARIN KOINIG, UNIVERSITY OF INNSBRUCK
Membre(s) du jury :M. RAINER DUTTMANN, CHRISTIAN ALBRECHTS UNIVERSITAT KIEL, Président
M. FRANCOIS DE VLEESCHOUWER, CNRS TOULOUSE, InvitéM. GAËL LE ROUX, TOULOUSE INP, Membre
M. INGMAR UNKEL, CHRISTIAN ALBRECHTS UNIVERSITAT KIEL, Membre
Supervisors:
Dr. Gaël Le Roux (Toulouse INP)
Prof. Dr. Ingmar Unkel (Kiel University)
Date of Disputation: 03.07.2019
Examination chairperson:
External reviewer 1:
External reviewer 2:
Place of Disputation: Kiel
I
------------------------------------------------------------------------------------------------------------------------------
Abstract (English)
Since the last deglaciation the European Alps have experienced several phases of human
colonisation from different directions and societies. However, the interaction of climate, human
impact and environment is still not fully understood in this high mountain region. In particular,
information on the time and scale of human impact in the northern Central Alps (NCA) during
the Holocene is missing. This study fills this gap by using geochemical, pollen and radiocarbon
analyses in comparison to regional archaeological and historical data. Mires in three areas of the
NCA were selected as study sites: Kleinwalser Valley (Vorarlberg, Austria), Piller Mire (Tyrol,
Austria) and upper Fimba Valley (Grisons, Switzerland), situated in an altitudinal range of 1100
to 2400 m a.s.l.
These mires were cored and analysed. The use of geochemical proxies (lithogenic elements,
trace metals) in peat is a well-established method to detect mineral input, erosion or
metallurgical activities. Despite an advantage of a fast sample preparation and measurement,
applying portable X-Ray-Fluorescence analysis (pXRF) on mountain mires is an uncommon
approach, mainly due to limitations by low count rates, matrix effects or lacking calibrations for
organic materials. By calibrating pXRF with measurements of quantitative Inductively Coupled
Plasma – Mass Spectrometry (ICP-MS), these issues could be overcome, showing that, Ti, Pb, Sr,
Zn, K, S, Fe, V, Zr, and - to some extent - Rb, Ca and Mn, can be successfully calibrated and used
as palaeoenvironmental proxies in peat. These proxies allow the following conclusions:
At high elevations, periglacial processes influence the deposition processes in the mires. Around
8200 and in the late 7th millennium BP, wetter and colder climate conditions prevail in the region.
The earliest land use is recorded in the Kleinwalser Valley around 5500 cal BP, with fire clearings,
pastoralism and hints at previously undetected regional metallurgy. Just before the Bronze Age
(c. 4300 cal BP), centuries before mining districts in the Eastern Alps boomed, metallurgy around
the Piller Mire is detected. The possibly strongest human land use in prehistoric times affects all
sites from the Mid to Late Bronze Age (3500-3000 cal BP), as shown by elevated erosion and
significant landscape alteration – from forests to agro-pastoral systems. Potential metal
enrichments are, however, masked by high mineral inputs. This period is followed by a phase of
lower land use, reaching well into the late Roman period (2800 cal BP to 250 cal CE). However,
a strong Pb enrichment factor (Pb EF) in the Kleinwalser Valley is recorded around 2700 cal BP.
Human impact increases in north-western Tyrol around 2400 cal BP. Periods of mining and
metallurgy are indicated by increased Pb EF in all mires during the Roman Empire but also right
after its collapse. Intensive human activities rise again with the fading Roman power after 250
II
cal CE in the Kleinwalser Valley but are interrupted by a climate deterioration after 500 cal CE
(Late Antique Little Ice Age). At the sites in higher elevations, land use intensification does not
take place before the High Middle Ages and is accompanied by rising Pb EF, indicating mining
activities after 1000 cal CE. While Pb EF keeps rising due to mining, industrialisation and leaded
fuel until 1980 cal CE, fluctuating human impact (deforestation, pasture management, drainage)
can be linked to a varying impact of climatic, cultural and demographic factors. Over the last
century, growing tourism and infrastructure construction increase erosion, but land use change
leads to a recovery of the studied mires in Kleinwalser Valley and Tyrol.
The results of this study add a new dimension to archaeological and historical data, by showing
the wider extent of human land use and its links to climate. Moreover, previously unknown
periods of prehistoric mining or metallurgy in the NCA are revealed, encouraging further
interdisciplinary research.
------------------------------------------------------------------------------------------------------------------------------
Abstract (Français)
Les Alpes européennes ont connu plusieurs phases de colonisation humaine. Cependant,
l'interaction entre climat et impacts humains sur l'environnement dans le passé n'est pas encore
totalement comprise dans cette région de haute montagne. Il existe notamment un manque de
connaissances sur la chronologie et l'ampleur des impacts humains dans les Alpes centrales du
nord (ACN) pendant l'Holocène, que cette étude comble en utilisant des analyses géochimiques,
de palynologiques et de datation radiocarbone comparées avec des données archéologiques et
historiques régionales. Des tourbières dans trois secteurs des ACN ont été choisies comme sites
d'étude: Petite Vallée de Walser (PVA, Autriche), Tourbière Piller (TP, Autriche), vallée de Fimba
(VF, Suisse).
La géochimie de séquences de tourbe est une méthode bien établie pour détecter les apports
minéraux, l'érosion ou les activités métallurgiques. L'application de l'analyse par fluorescence
des rayons X portable (pXRF) sur les tourbières de montagne reste une approche peu courante,
principalement en raison des limitations dues aux limites de détection, aux effets de matrice ou
à l'absence de calibration. En étalonnant la pXRF à l'aide de mesures de spectrométrie de masse
à plasma à couplage inductif (ICP-MS), cette étude montre que Ti, Pb, Sr, Zn, K, S, Fe, V, Zr et,
dans une certaine mesure Rb, Ca et Mn, peuvent être étalonnés dans la tourbe.
À haute altitude, les processus périglaciaires influencent les processus de dépôt dans les
tourbières. Vers 8200 et 6300 cal BP, les conditions climatiques sont plus froides et humides. La
III
première utilisation du sol a été enregistrée dans la PVA vers 5500 cal BP, avec de la
déforestation, du pastoralisme et des signes d’une métallurgie régionale jusqu’alors non-
détectée. Juste avant l'âge du bronze (environ 4300 cal BP), des siècles avant l'essor des régions
minières des Alpes de l'Est, la métallurgie autour la TP est donc détectée. L'utilisation des sols
par l'homme, probablement la plus forte de la préhistoire, affecte tous les sites d’études à l'âge
du bronze (3500-3000 cal BP), comme le montrent l'érosion élevée et la modification
significative du paysage - de la forêt aux systèmes agro-pastoraux. Les facteurs
d’enrichissements en métaux (Pb EF) sont toutefois masqués par des apports élevés en
minéraux. Cette période est suivie d'une phase d'utilisation plus faible des sols jusqu'à l'époque
romaine. Un fort Pb EF dans la PVW est cependant enregistré autour de 2700 cal BP et l'impact
humain augmente autour de la TP vers 2400 cal BP. L'exploitation minière romaine est indiquée
par une augmentation du Pb EF dans toutes les tourbières. Les activités humaines intensives
reprennent avec le déclin de la puissance romaine après 250 cal CE dans la PVW, mais sont
interrompues par une détérioration du climat après 500 cal CE. Sur les sites situés en altitude
plus hauts, l'intensification de l'utilisation des sols n'a pas lieu avant le haut Moyen Âge (1000
cal CE) et s'accompagne d'une augmentation du Pb EF. Alors que le Pb EF continue d'augmenter
en raison de l'exploitation minière, de l'industrialisation et des essences plombées jusqu'en
1980, les fluctuations de l'impact humain (défrichements, pâturages, drainage) peuvent être
liées à des facteurs climatiques, culturels et démographiques variables. Au cours du siècle
dernier, la croissance du tourisme et la construction d'infrastructures ont augmenté l'érosion,
mais le changement d'occupation des sols a entraîné une régénération des tourbières étudiées.
Les résultats de cette étude ajoutent une nouvelle dimension aux données archéologiques et
historiques, en montrant l'étendue plus large de l'utilisation humaine des sols et les liens avec
le climat. De plus, des périodes de métallurgie préhistoriques jusque-là inconnues, dans les ACN
sont révélées, ce qui encourage la poursuite des recherches interdisciplinaires associant
archéologie, paléobotanique et géochimie environnementale.
------------------------------------------------------------------------------------------------------------------------------
Abstract (German)
Seit dem Ende der letzten Eiszeit haben die europäischen Alpen mehrere Phasen der
menschlichen Kolonisation erlebt. Allerdings sind für diese Gebirgsregion die Wechselwirkungen
von Klima, menschlichem Einfluss und Umwelt noch nicht vollständig geklärt. Insbesondere das
Wissen über die Zeitpunkte und Ausmaße der menschlichen Auswirkungen in den nördlichen
Zentralalpen (NZA) während des Holozäns ist noch mangelhaft. Mit Hilfe von Geochemie-,
IV
Pollen- und Radiokohlenstoffanalysen und deren Vergleich mit regionalen archäologischen und
historischen Daten soll diese Arbeit zur Ausfüllung dieser Lücken beitragen. Dazu wurden
Bergmoore in drei Untersuchungsgebieten der NZA ausgewählt: Kleinwalsertal (Vorarlberg,
Österreich), Piller Moor (Tirol, Österreich) und oberes Fimbatal (Graubünden, Schweiz).
Aus diesen Mooren wurden Proben entnommen und untersucht. Die Verwendung
geochemischer Proxys (lithogene Elemente, Spurenmetalle) in Torfen ist dabei eine etablierte
Methode zum Nachweis von Mineraleintrag, Erosion oder metallurgischen Aktivitäten. Trotz der
Vorteile einer schnellen Probenvorbereitung und Messung ist der Einsatz der tragbaren
Röntgenfluoreszenzanalyse (pXRF) insbesondere für Moore selten: aufgrund von
Einschränkungen durch niedrige Zählraten, Matrixeffekte oder fehlende Kalibrierungen für
organische Materialien. Durch die Kalibrierung der pXRF mit Messungen der quantitativen
„Induktiv gekoppelten Plasma-Massenspektrometrie“ (ICP-MS) konnte dieses Problem gelöst
werden. Diese Studie zeigt, dass Ti, Pb, Sr, Zn, K, S, Fe, V, Zr und - zum Teil - Rb, Ca und Mn
erfolgreich kalibriert werden und als paläoökologische Proxys in Torf verwendet werden
können. Diese Proxys lassen folgende Schlüsse zu:
In hohen Lagen beeinflussen periglaziale Prozesse die Depositionsprozesse in den Mooren. Um
8200 und im späten 7. Jahrtausend cal BP herrschen feuchtere und kältere Klimabedingungen
im Untersuchungsgebiet. Die früheste Landnutzung ist im Kleinwalsertal um 5500 cal BP zu
verzeichnen, mit Brandrodungen, Viehzucht und Hinweisen auf bisher unentdeckte regionale
Metallurgie. Kurz vor der Bronzezeit (ca. 4300 cal BP), Jahrhunderte vor dem Boom der
Bergbaugebiete in den Ostalpen, sind metallurgische Spuren um das Piller Moor nachweisbar.
Die möglicherweise umfassendste prähistorische menschliche Landnutzung betrifft alle
Standorte von der mittleren bis zur späten Bronzezeit (3500-3000 cal BP) in Form erhöhter
Erosion und erheblicher Landschaftsveränderungen – von Wald- zur Weidelandschaft. Mögliche
Metallanreicherungen werden jedoch durch hohe Mineralstoffeinträge überdeckt. Dieser Zeit
folgt eine Phase geringerer Landnutzung, die bis weit in die römische Zeit reicht (2800 cal BP bis
250 cal CE). Im Kleinwalsertal wird jedoch um 2700 cal BP eine erhöhte Bleianreicherung
sichtbar, während in Nordwesttirol eine Zunahme des menschlichen Einflusses um 2400 cal BP
registriert wird. Der weit verbreitete römische Bergbau wird durch einen erhöhten
Bleianreicherungsfaktor (Pb EF) in allen untersuchten Mooren angezeigt. Eine kurze Zeit
regionaler Bergbauaktivitäten scheint auch unmittelbar nach dem Zusammenbruch des
Römischen Reiches stattgefunden zu haben. Intensivere menschliche Aktivitäten beginnen ab
ca. 250 cal CE mit dem Verfall Römischer Macht im Kleinwalsertal, werden aber durch eine
Klimaverschlechterung nach 500 cal CE unterbrochen. An den höher gelegenen Standorten
findet die Intensivierung der Landnutzung erst im Hochmittelalter (ca. 1000 cal CE) statt. Ein
V
steigender Pb EF deutet außerdem auf stärker werdende Bergbauaktivitäten hin. Während der
Pb EF aufgrund von Bergbau, Industrialisierung und verbleitem Brennstoff bis 1980 cal CE weiter
ansteigt, können menschliche Eingriffe in die Landschaft (Rodungen, Weidemanagement,
Entwässerung) mit unterschiedlichen Auswirkungen klimatischer, kultureller und
demografischer Faktoren verbunden werden. Im Laufe des letzten Jahrhunderts verstärken
wachsender Tourismus- und Infrastrukturbau die Erosion, doch eine veränderte Landnutzung
führte schlussendlich zu einer Erholung der untersuchten Moore im Kleinwalsertal und in Tirol.
Die Ergebnisse der vorgelegten Studie verleihen den archäologischen und historischen Daten
eine neue Dimension, indem sie das Ausmaß der menschlichen Landnutzung und dessen
Verbindungen zum Klima zeigen. Darüber hinaus werden bisher unbekannte Perioden des
prähistorischen Bergbaus oder der Metallurgie in den NZA aufgedeckt.

VI
Acknowledgements
First of all, I would like to thank my three supervisors for supporting me in every situation, from
the beginning to the end of the three years, and for giving me time and space but also for pushing
me forward when I needed it. Ingmar Unkel for encouraging me to apply for this PhD-position
in the first place. François De Vleeschouwer for making possible the cotutelle and especially for
hosting me during my visits in Toulouse: with good food, drinks and SP-episodes. Also, Gaël Le
Roux for advice in the lab, for involving me into fieldwork in the Pyrenees and for taking over
François’ position in the final phase. Particularly when hearing stories from other PhD-students,
I can say that I have been really lucky and that I am very grateful to have had them as my
supervisors.
During my stays at Ecolab in Toulouse, I met many very nice and kind people. Chuxian Li was not
just a PhD-comrade and a helping hand for peat core slicing and in one of the field campaigns,
but also became a dear friend to me. Besides being very kind, also Marie-Jo Tavella at Ecolab
has always been there to help in the lab and Annick Corrège overcame any of my issues with the
French bureaucracy. At Kiel University, I would like to thank Annika Lange for counting pollen,
Britta Witt for managing organisational issues and paperwork, Marcus Schütz and Mathias Bahns
for their support with technical issues and for rescuing a stuck corer, Alexander Suhm, Sandra
Kiesow and the international Master students for joining field work in the Alps in 2016 and 2017,
Joachim Schrautzer for the enthusiastic support in the Kleinwalser Valley and, of course, the
proof-readers. Special thanks are also going out to Karl Keßler from the landscape conservation
association of the Kleinwalser Valley for organising access to the mires, but also for a nice dinner
with the best Käsknöpfle I ever had. I would also like to thank Dr. Ernst Partl of the Kaunergrat
nature park in Tyrol. Besides life at universities, I would like to say thank you to my friends and
family for understanding that my time has been limited lately. Finally, I do not want to forget to
mention whomever I forgot to mention.
VII
Funding
I would like to express my gratitude for several travel grants and financial support, which greatly
contributed to the successful completion of this bi-national PhD-project:
- “Soutien à la Mobilité Internationale (SMI) 2016” from the Institut National Polytechnique de
Toulouse.
- PPP (Nr 57316724)/PHC-PROCOPE Nr 37646SG from DAAD/Campus-France (partly funded by
the BMBF – German Federal Ministry of Education and Research).
- Mobility grant from Deutsch-Französische Hochschule/université franco-allemande (DFH/UFA).
The PhD-project was co-funded by the Graduate School “Human development in landscapes” at
Kiel University (DFG-Excellence Initiative, GSC-208).
1 Inhalt
1 Introduction .......................................................................................................................... 1
1.1 Aims and key questions of this study ............................................................................ 2
2 Study area and background information .............................................................................. 4
2.1 Geology and geography ................................................................................................ 4
2.2 Climate and environment in the Central Alps ............................................................... 5
2.3 Population dynamics and human land use ................................................................... 6
2.4 Prehistoric mining and metallurgy ................................................................................ 7
2.5 Peatlands: functions and implications for palaeoenvironmental-research .................. 9
3 Methods .............................................................................................................................. 14
3.1 Coring techniques ....................................................................................................... 14
3.2 Core slicing and subsampling ...................................................................................... 16
3.3 Radiocarbon dating ..................................................................................................... 17
3.4 Geochemistry .............................................................................................................. 18
3.4.1 ICP-MS and ICP-OES ............................................................................................ 18
3.4.2 Portable XRF scanning ......................................................................................... 20
3.4.3 XRF core scanning ............................................................................................... 26
3.4.4 Carbon/Nitrogen ratio ......................................................................................... 28
3.4.5 Enrichment factors and mineral accumulation rates .......................................... 28
3.4.6 Principal Component Analysis ............................................................................. 31
3.5 Core descriptions and macrofossil analysis ................................................................ 31
3.6 Pollen........................................................................................................................... 32
3.7 Terminology of chronological classification ................................................................ 32
4 Kleinwalser Valley ............................................................................................................... 34
4.1 Introduction (Kleinwalser Valley) ................................................................................ 34
4.1.1 Geographical and geological setting (Kleinwalser Valley)................................... 36
4.1.2 Climate (Kleinwalser Valley) ................................................................................ 38
4.1.3 Coring sites description (Kleinwalser Valley) ...................................................... 38
4.1.4 Coring and subsampling (Kleinwalser Valley) ..................................................... 41
4.2 Results & discussion (Kleinwalser Valley) ................................................................... 42
4.2.1 Core descriptions (Kleinwalser Valley) ................................................................ 42
4.2.2 Radiocarbon dates and age-depth models (Kleinwalser Valley) ......................... 44
4.2.3 Geochemistry (Kleinwalser Valley)...................................................................... 47
4.2.4 Pollen (HFL) ......................................................................................................... 61
4.3 Chronological discussion (Kleinwalser Valley) ............................................................ 63
4.3.1 Mire formation .................................................................................................... 63
4.3.2 5800 to 3500 cal BP: early human occupation.................................................... 64
4.3.3 3500 cal BP to 2800 cal BP: Bronze Age .............................................................. 67
4.3.4 2800 cal BP to 600 cal CE: Iron Age and Roman period ...................................... 68
4.3.5 600 cal CE to 2016 CE: from Early Middle Ages to Modern Times ..................... 71
4.4 Conclusions on the Kleinwalser Valley ........................................................................ 75
5 Piller Mire ............................................................................................................................ 77
5.1 Introduction (Piller Mire) ............................................................................................ 77
5.1.1 Geographical and geological setting (Piller Mire) ............................................... 79
5.1.2 Climate (Piller Mire) ............................................................................................ 80
5.1.3 Coring site description (Piller Mire) .................................................................... 80
5.1.4 Coring and subsampling (Piller Mire) .................................................................. 82
5.2 Results & discussion (Piller Mire) ................................................................................ 83
5.2.1 Core description (Pi17, Piller Mire) ..................................................................... 83
5.2.2 Radiocarbon dates and age-depth models (Piller Mire) ..................................... 84
5.2.3 Geochemistry (Piller Mire) .................................................................................. 86
5.3 Chronological discussion (Piller Mire) ......................................................................... 94
5.3.1 4800 to 4000 cal BP: transition to the Bronze Age ............................................ 95
5.3.2 3900 to 2800 cal BP: Bronze Age ........................................................................ 97
5.3.3 2800 to 1950 cal BP: Iron Age to Roman Expansion ........................................... 99
5.3.4 1950 cal BP to 700 cal CE: Roman period and Early Middle Ages ..................... 100
5.3.5 700 cal CE to 2017 cal CE: Middle Ages and Modern Era ................................. 102
5.4 Conclusions on the Piller Mire .................................................................................. 106
6 Fimba Valley ...................................................................................................................... 108
6.1 Introduction (Fimba Valley) ...................................................................................... 108
6.1.1 Geographical and geological setting (Fimba Valley) ......................................... 109
6.1.2 Climate, vegetation and recent land use (Fimba Valley) .................................. 110
6.1.3 Coring site descriptions (Fimba Valley) ............................................................. 111
6.1.4 Coring and subsampling (Fimba Valley) ............................................................ 113
6.2 Results & discussion (Fimba Valley) .......................................................................... 114
6.2.1 Core descriptions (Fimba Valley) ...................................................................... 114
6.2.2 Radiocarbon dates and age-depth models (Fimba Valley) ............................... 117
6.2.3 Geochemistry (Fimba Valley) ............................................................................ 121
6.3 Chronological discussion (Fimba Valley) ................................................................... 128
6.3.1 Early to Mid-Holocene (10,500 to 6300 cal BP) ................................................ 129
6.3.2 6200 to 2800 cal BP ........................................................................................... 132
6.3.3 2800 to 1500 cal BP ........................................................................................... 136
6.3.4 450 cal CE until Modern Times ......................................................................... 138
6.4 Conclusions on the Fimba Valley .............................................................................. 141
7 Synthesis ........................................................................................................................... 144
7.1 Regression analysis comprising all samples .............................................................. 144
7.2 Integrated chronological discussion ......................................................................... 148
7.2.1 Early to Mid-Holocene: climate versus human impact ..................................... 149
7.2.2 4200 to 2000 cal BP: rise of human land use /land-management .................... 151
7.2.3 Roman period .................................................................................................... 153
7.2.4 Middle Ages and Modern Times ....................................................................... 155
7.2.5 Human impact and peat accumulation ............................................................. 158
8 Conclusions and perspectives ........................................................................................... 160
8.1 Analytical development of pXRF ............................................................................... 160
8.2 Site specific factors and proxy sensitivity ................................................................. 161
8.3 Multiproxy – multisite – multi disciplinary: the key to understanding a complex
changing mountain environment.......................................................................................... 162
9 References ......................................................................................................................... 165
10 Annex ............................................................................................................................ 194
List of figures
Figure 1: Overview of the northern Central Alps with study sites and ore deposits .................... 5
Figure 2: Subsampling sketch of Wardenaar, Usinger and Russian system................................ 17
Figure 3: pXRF with connected sampling chamber ..................................................................... 21
Figure 4: Regression analysis of CRMs vs pXRF measurements .................................................. 25
Figure 5: Map of the Kleinwalser Valley and surrounding areas with important sites ............... 37
Figure 6: Photo of Hoefle Mire ................................................................................................... 39
Figure 7: Surface vegetation and boreholes of HFL and LAD ...................................................... 39
Figure 8: Photo of HHA, showing the stream meandering through the mire............................. 40
Figure 9: Open profile of HHA and charred wood radiocarbon sample ..................................... 41
Figure 10: Eriophorum vaginatum spindles and Sphagnum leaf for dating ............................... 45
Figure 11: Age-depth models of HFL and LAD ............................................................................ 46
Figure 12: Regression analysis in HFL peat samples ................................................................... 49
Figure 13: Concentration profiles of HFL peat samples .............................................................. 53
Figure 14: HFL depth-profiles for Nd/Ti in HFL and for Pb and Zn in parallel core ..................... 55
Figure 15: Ti-Profile (pXRF) in HFL compared with Ti and Si (XRF) in a parallel core .................. 56
Figure 16: Elemental concentration profiles of calibrated pXRF in LAD ..................................... 58
Figure 17: PCA of the ICP-MS results of the complete core of HFL ............................................ 59
Figure 18: PCA of ICP-MS measurements in ombrotrophic section of HFL ................................ 60
Figure 19: Profiles of C:N and S in HFL ........................................................................................ 61
Figure 20: Pollen diagram of HFL Mire ........................................................................................ 62
Figure 21: Chronological profiles of Sr, C:N and Pb EF in HFL, MAR in HFL and LAD and pollen
groups in HFL ............................................................................................................................... 65
Figure 22: Enrichment factors in HFL of Pb, Cu, Zn and Sb ......................................................... 66
Figure 23: Map of region around the Piller Mire with relevant ore deposits/ancient mines ..... 77
Figure 24: Detailed aerial photo of Piller Mire and surroundings ............................................. 79
Figure 25: Photo of Piller Mire borehole with surface vegetation ............................................. 81
Figure 26: Photo with view on the open Piller Mire ................................................................... 82
Figure 27: Photo of Sphagnum stem with leaves in Pi17 sent for dating ................................... 85
Figure 28: Age-depth model of Pi17 ........................................................................................... 85
Figure 29: Regression analysis of ICP-MS and pXRF measurements in Pi17-sequence .............. 87
Figure 30: Elemesntal profiles in the Pi17 composite core ......................................................... 90
Figure 31: Core scanning profiles of Pb, Ti and Si of Pi17 ........................................................... 92
Figure 32: PCA of ICP-MS measurements in the Pi17 core ......................................................... 93
Figure 33: PCA of ICP-MS measurements in Pi17, older than 1000 cal BP ................................. 94
Figure 34: Chronological profiles of MAR, EF Pb, EF Zn, EF Cu and EF Sb in Pi17 ....................... 97
Figure 35: Aerial photo from 1974 CE of Piller Mire and peat mining facility ........ 104
Figure 36: Full profile of Pb EF in the Piller Mire ...................................................................... 105
Figure 37: Overview map of Fimba Valley and surroundings ................................................... 109
Figure 38: Photo of Upper and Lower Las Gondas (ULG and LLG) ............................................ 111
Figure 39: Satellite image of the upper Fimba Valley with cored sites ..................................... 112
Figure 40: Photo of western side of Fimba Valley .................................................................... 113
Figure 41: BWM core line scan ................................................................................................. 116
Figure 42: Heterogeneous LCM core, alternating peat and sediment layers ........................... 117
Figure 43: Brown moss from LLG sent for dating ..................................................................... 118
Figure 44: Age-depth model of LLG-A ....................................................................................... 119
Figure 45: Age-depth-model of MM-A ...................................................................................... 120
Figure 46: Age-depth model of BWM ....................................................................................... 120
Figure 47: Age-depth model of ULG.......................................................................................... 121
Figure 48: Regression analyses in LLG ....................................................................................... 122
Figure 49: Elemental profiles in LLG derived from ICP-MS and pXRF ....................................... 125
Figure 51: XRF core scanning profiles of Si and Pb in the MM core ......................................... 126
Figure 52: PCA of ICP-MS measurements in LLG ...................................................................... 128
Figure 53: Coarse sediment layer of the 8.2 ka event in LLG .................................................... 130
Figure 54: MAR, Pb EF, Zn EF, Cu EF, and Sb EF in LLG ............................................................. 134
Figure 55: Si, Pb/Si, Cu/Si and Zn/Si profiles in the MM-core-scan .......................................... 136
Figure 56: Cattle grazing paths on the slopes of the upper Fimba Valley ................................ 139
Figure 57: Combined regression analyses of HFL, Pi17 and LLG ............................................... 145
Figure 58: Summary of mineral accumulation, Si and Pb enrichment...................................... 154
Figure 59: Pb EF since the Late Middle Ages in all mires .......................................................... 157
Figure 60: Peat accumulation and growth rates in the investigated mires .............................. 159
Suppl. Figure 1: Line-scans of Kleinwalser Valley core-sequences ........................................... 197
Suppl. Figure 2: Line-scans of a composite Piller Mire core-sequence ..................................... 198
Suppl. Figure 3: Line-scans of Fimba Valley core-sequences .................................................... 199
List of tables
Table 1: Summary of all coring sites, coordinates and analyses carried out .............................. 14
Table 2: Quality control of pXRF measurements of CRMs .......................................................... 22
Table 3: UCC values of relevant elements .................................................................................. 29
Table 4: Chronological classification of cultural periods............................................................. 33
Table 5: Core description of the composite HFL peat sequence ................................................ 42
Table 6: Core description of the composite LAD sequence ........................................................ 43
Table 7: List of Kleinwalser Valley radiocarbon samples ............................................................ 44
Table 8: Settings in rbacon for the age-depth models of HFL and LAD ...................................... 46
Table 9: List of Piller Mire radiocarbon samples ......................................................................... 84
Table 10: Settings in rbacon for age-depth model of Pi17 ......................................................... 84
Table 11: Core description of LLG ............................................................................................. 114
Table 12: Core description of MM ........................................................................................... 116
Table 13: Core description of BWM .......................................................................................... 116
Table 14: List of Fimba Valley radiocarbon samples ................................................................ 117
Table 15: Settings in rbacon for LLG, MM and BWM ................................................................ 119
Suppl. Table 1: Quality control by measurements of organic CRMs by ICP-MS ....................... 194
List of abbreviations
a.s.l.: ...................................................................................................................... Above sea level
(B)CE: ........................................................................................................... (Before) Common Era
BP: .......................................................................................................................... Before Present
BWM: ............................................................................................................... Butterwiesen Mire
cal: .................................................................................................................................. Calibrated
Cert.: ................................................................................................................................. Certified
C:N: ............................................................................................................. Carbon:Nitrogen Ratio
CRM: ................................................................................................ Certified Reference Materials
DACP: ........................................................................................................... Dark Ages Cold Period
EF: ...................................................................................................................... Enrichment factor
HFL: .............................................................................................................................. Hoefle Mire
ICP-MS: ............................................................ Inductively Coupled Plasma – Mass Spectrometry
ICP-OES: ........................................ Inductively Coupled Plasma – Optical Emission Spectrometry
LAD: ........................................................................................................................... Ladstatt Mire
LALIA: .................................................................................................... Late Antique Little Ice Age
LIA: .............................................................................................................................. Little Ice Age
LLG: ............................................................................................................Lower Las Gondas Mire
LOD: ................................................................................................................... Limit of Detection
MAR: .................................................................................................... Mineral accumulation rate
MM: .......................................................................................................................... Marmot Mire
Pi17: ........................................................................................................................Piller Mire core
n: ........................................................................................................... Number of measurements
pXRF: ........................................................................................................................... Portable XRF
REE: .................................................................................................................. Rare earth element
sd: .................................................................................................................... Standard Deviation
UCC: .......................................................................................................... Upper continental crust
ULG: .......................................................................................................... Upper Las Gondas Mire
XRF: .................................................................................................... X-Ray-Fluorescence analysis
1 Introduction
1 Introduction
When the ice caps of the last glacial maximum disappeared, vegetation and game were
returning. Humans began to repopulate and use a landscape that had previously been barren or
inaccessible for thousands of years. Still today, high mountain areas like the Central Alps are
harsh environments with extreme conditions for life. The onset of human activity on high Alpine
passes, slopes, and valleys for travelling, trade, hunting (Leitner, 2015), agriculture, seasonal
pastoralism (Oeggl, 2015) and dairy production (Reitmaier et al., 2018), or mining and metallurgy
(e.g. Stöllner and Oeggl, 2015) is not yet fully understood. The impact radii of humans were
limited by sensitive climate feedbacks and the heterogeneous landscape’s morphology. Hence,
periods of colonisation or occupation climaxes did not happen contemporaneously and
originated from different regions and cultures (e.g. Carcaillet, 1998; Gulisano, 1995; Kutschera
et al., 2014; Oeggl and Nicolussi, 2009; Reitmaier, 2012; Vorren et al., 1993). The regional climate
conditions led to a half nomadic lifestyle or transhumance, which was and still is the basis for
seasonal livestock management systems in the European Alps (Reitmaier, 2017; Reitmaier et al.,
2018). Archaeological evidence for this ephemeral presence is, however, difficult to detect and
one of the reasons why there is no consistent narrative for the European Alps so far. Moreover,
strong erosive forces of ice and water are responsible for a general scarcity of suitable
palaeoenvironmental archives and archaeological sites in high mountain areas. Single
archaeological finds and historical documentation cannot provide continuous information and
may bias interpretations towards separate findings. Any approach to reconstruct the history of
land use has to be put together piece by piece, region by region and valley by valley from lowland
to summit. In particular, the complex relationships between humans and the development of
environmental and climatic conditions on local or regional scales still need detailed
investigation. Gaps need to be closed by research on various continuous palaeoenvironmental
archives, such as lakes, glaciers or mires.
Climate, environment and human impact in the Central Alps are variables in a complex system
that can interact in intricate ways. Reconstructing their past and recent development is
important to better understand such systems, also to prepare for future changes concerning
disaster management, infrastructure, agriculture, forestry etc. Thus, getting a better
understanding requires some background knowledge on the involved factors (the Alps, area,
climate, land use) as well as on the archives (peat) and tools (methods) that are available to
gather information about the past. Hence, they will be introduced in the following chapter after
defining the main research questions of this work.
2 Introduction
1.1 Aims and key questions of this study
Mires in the Central Alps are hardly used as a palaeoenvironmental archive when it comes to
the application of geochemical methods. Compared to lowland mires, mountain peatlands are
more heterogeneous and complex systems. They are dependent on geology, geomorphology,
altitude, exposition and climate, all of which are controlling hydrology, trophic state,
evapotranspiration and thus vegetation, peat growth and accumulation rates. Exploiting peat
sediment cores from mountain mires as palaeoenvironmental archives therefore needs to
consider many possible factors. As detailed geochemical studies have not been conducted so far
on any mires in the region, it is yet unknown how human or climatic impact would be reflected
in the samples. One of the aims of this work is, therefore, the detection of potential geochemical
signals in peat cores that can be used as proxies for erosion, mining, metallurgy or environmental
feedback. They can, thus, shed light on the interactions of climate, environment and human
impact on a local and regional scale in heterogeneous, elevated landscapes like the Alps. To
address this heterogeneity, this approach is applied on three different study areas at different
elevations in the northern Central Alps (Figure 1): the Kleinwalser Valley (Vorarlberg, Austria –
chapter 4), the Piller Mire (Tyrol, Austria – chapter 5) and the upper Fimba Valley (Canton of
Grisons, Switzerland – chapter 6).
The Kleinwalser Valley is both rural and touristic and a geographical gateway to the northern
Alpine Foreland. By the presence of farms, roads and villages in the centre of the valley and by
centuries of human activities, prehistoric traces were possibly overprinted. However, a few
archaeological sites on the slopes outlived these transformations. The Piller Mire and the Fimba
Valley are both located deeper within the Central Alps and further away from farms and
settlements, however, prehistoric sites of particular importance exist there as well. Nonetheless,
the histories of all the presented study areas are quite reduced to the last few centuries and
little is known about the extent of human impact on the landscape before the Late Middle Ages:
a research gap that this study is aiming to fill. It also aims at finding out if and how past human
activity was recorded in local mires. Since and until when have humans been present and is there
more information than archaeology and pollen could provide? What was the magnitude of their
impact on environment and landscape, how was it triggered and what was the role of climate?
These research questions are related, but different when it comes to the local characteristics of
the individual areas and sites and what is known about them already. One of the overarching
main criteria for the selection of the studied mire sites was their vicinity to either existing
archaeological sites or the availability of other complementing data. The three sites cover
different levels of altitude to capture effects that could be dependent on elevation. Investigating
3 Introduction
these spatially separated areas within a wider region allows, to some extent, to differentiate
which of the recorded signals are local and independent of each other, and which could be linked
by regional developments (e.g. climate) and impacts of e.g. population peaks. Furthermore, the
proximity to former ore mines (Figure 1) helps to resolve questions on the existence of
prehistoric mining or metallurgy in the region.
One of the basic requirements to be able to answer these questions is an efficient and reliable
method to analyse the geochemistry in peat samples. Therefore, the rarely used application of
a portable X-ray fluorescence (pXRF) on peat samples is critically assessed within this study. The
semi-quantitative pXRF results are calibrated element by element using certified reference
materials (CRM) and peat samples from the study areas, which are measured parallelly by
Inductively Coupled Plasma Mass Spectrometry or Optical Emission Spectrometry (ICP-
MS/OES). This approach allows listing elements that are quantifiable in peat by pXRF and
evaluating where the limitations of pXRF are within this study. Further analyses include direct
XRF-core-scanning, Carbon (C) and Nitrogen (N) analyses as well as pollen analysis. A
chronological framework is provided by Bayesian age-depth modelling of radiocarbon dates.
This enables careful interpretation of the acquired data and comparison to other studies from
connected disciplines like climatology, archaeology, palynology, dendrochronology and
historical sources. Is the data from the mires, for example the geochemistry, showing signals
contemporaneous with archaeological findings or pollen? What was behind these signals:
human activities or climate? Ultimately, the results assess the significance of the geochemical
data in these mountain mires and their potential use as palaeoenvironmental proxies to
eventually draw conclusions about the development of climate, human impact and
environmental conditions in these three study areas of the northern Central Alps.
4 Study area and background information
2 Study area and background information
2.1 Geology and geography
The Alps are the highest and largest mountain range in Europe in terms of elevation, going up
to 4800 m a.s.l., but also in terms of area, covering almost 191,000 km². Along the approximately
1000 km long alpine main ridge, they are often subdivided into Western and Eastern Alps. They
are shared at least partly between eight countries: Austria, France, Germany, Italy,
Liechtenstein, Monaco, Slovenia and Switzerland. The focus of this study is on the northern
Central Alps, the area amidst the eastern and western part, from the Alpine Rhine Valley to the
Zugspitze peak, until the Alpine Divide in the south, i.e. the main Alpine Ridge. All precipitation
and meltwater are collected within four different watersheds and end up in either the Rhine
(Northwest), Danube (Northeast), Rhône (Southwest) or Po (South).
In terms of geology, the orogenesis of the mountain range started at the end of the Cretaceous,
due to the colliding plates of the African and European continent, although the main phase of
uplift occurred around 30 million years ago. As a result of the complex collision tectonics, the
geology of the Alps is very complex. The main geological units are the Helvetic, Penninic, Eastern
and Southern Alpine Nappes (Fitzsimons and Veit, 2001). Going from north to south in the
central part of the Alps, the Helvetic Nappes (Mesozoic to Tertiary sedimentary rock) are
followed by Penninic Flysch, and then by the Eastern Alpine or Austroalpine Nappes (Geological
Survey of Austria, 2013). The latter are divided into the prominent Northern Limestone Alps and,
to the south of it, the Eastern Alpine Crystalline, consisting of metamorphic rock like Schist and
Gneiss (Egger et al., 1999). Recurring large glaciations over the Quaternary period strongly
shaped the Alps into their modern form (Fitzsimons and Veit, 2001).
The three study areas (Figure 1) are distributed over three consecutive altitudinal zones:
1. Kleinwalser Valley (Austria, 1200-1000 m a.s.l.) in the montane zone
2. Piller Mire (Austria, 1550 m a.s.l.) in the subalpine zone
3. upper Fimba Valley (Switzerland, 2400 m a.s.l.) in the alpine zone
They are all north of the Alpine main ridge, which is one of the few common features. The
Kleinwalser Valley is the northernmost site and shares parts of the Northern Calcareous Alps (or
Northern Limestone Alps), which belong to the Upper Eastern Alpine zone, but also to the
Helveticum and to subzones of the Penninic Nappes. The Piller Mire is the easternmost site and
separated from the limestone by the Inn Valley and already in the metamorphic eastern alpine
crystalline zone. Also, the Fimba Valley, being the southernmost site, is within this zone,
although the area around it belongs to the Penninic Nappes of the Engadine Window (Geological
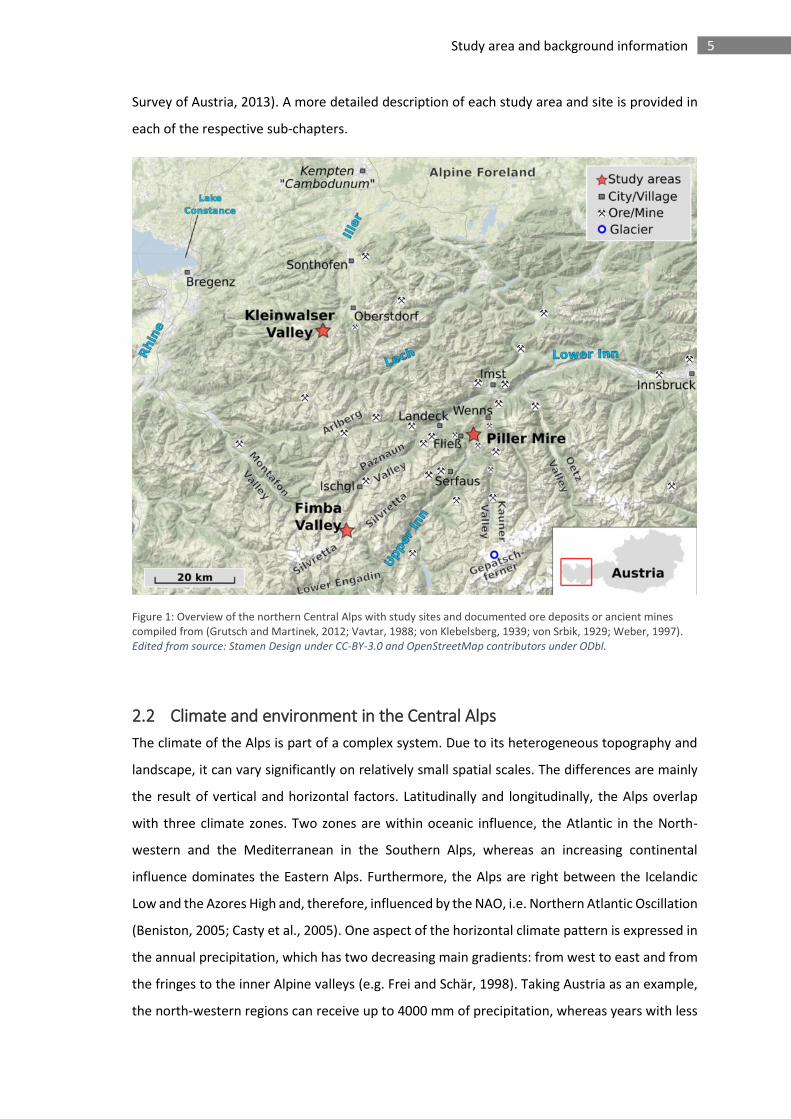
5 Study area and background information
Survey of Austria, 2013). A more detailed description of each study area and site is provided in
each of the respective sub-chapters.
Figure 1: Overview of the northern Central Alps with study sites and documented ore deposits or ancient mines compiled from (Grutsch and Martinek, 2012; Vavtar, 1988; von Klebelsberg, 1939; von Srbik, 1929; Weber, 1997). Edited from source: Stamen Design under CC-BY-3.0 and OpenStreetMap contributors under ODbl.
2.2 Climate and environment in the Central Alps
The climate of the Alps is part of a complex system. Due to its heterogeneous topography and
landscape, it can vary significantly on relatively small spatial scales. The differences are mainly
the result of vertical and horizontal factors. Latitudinally and longitudinally, the Alps overlap
with three climate zones. Two zones are within oceanic influence, the Atlantic in the North-
western and the Mediterranean in the Southern Alps, whereas an increasing continental
influence dominates the Eastern Alps. Furthermore, the Alps are right between the Icelandic
Low and the Azores High and, therefore, influenced by the NAO, i.e. Northern Atlantic Oscillation
(Beniston, 2005; Casty et al., 2005). One aspect of the horizontal climate pattern is expressed in
the annual precipitation, which has two decreasing main gradients: from west to east and from
the fringes to the inner Alpine valleys (e.g. Frei and Schär, 1998). Taking Austria as an example,
the north-western regions can receive up to 4000 mm of precipitation, whereas years with less
6 Study area and background information
than 700 mm are not unusual in parts of Eastern Austria (Frei and Schmidli, 2006). Moist air
masses from the Atlantic and Mediterranean, are the main factor behind this distribution, as
they precipitate after rising and cooling down at the slopes. Especially in the Northern and
Central Alps, the highest precipitation occurs during summer (Frei and Schär, 1998).
Moving on from the spatial perspective, climate is strongly bound to altitude or elevation as well
as exposure, which can be depicted with the Geiger-Köppen classification (Geiger, 1961). Based
on this classification, Rubel et al. (2017) describe the modern climate zonation of the Alps with
an alpine tundra climate prevailing above, and cool boreal climate below the theoretical
(natural) timber line (10°C isotherm). An alpine frost or polar climate prevails only in the highest
parts above the lower limit of the snow line (0°C isotherm).
However, these climate zones are not static. The current status is just a snapshot in time: The
conditions will change in the future within decades and did so in the past (Rubel et al., 2017).
Since the all-encompassing ice at the last glacial maximum melted away at the end of the
Pleistocene, forests began to occupy the slopes and valleys, with a varying upper limit due to
natural climate oscillation (e.g. Nicolussi, 2012; Nicolussi et al., 2005). Modern day’s climate
change will further change the environment, especially at higher elevations (Grabherr et al.,
2010) and in interaction with human land use practices (Theurillat and Guisan, 2001).
2.3 Population dynamics and human land use
Only vague estimates can be made about the population in the Alps during prehistoric times.
Supposing that most early communities were probably not bound to settlements and lived as
hunters and gatherers or nomads, people might have travelled between high slopes and the
lower Alpine Foreland in summer and winter. Estimated numbers for Switzerland of McEvedy
and Jones (1978) were 30,000 by 5500 cal BP and a four times higher population by the Late
Bronze Age around 3000 cal BP, which doubled again by 2000 cal BP. In Austria, their estimates
show a steeper development since 5500 cal BP from 20,000 people to already half a million by
2000 cal BP. A severe decline was documented in both areas during the Early and Late Middle
Ages. Austria lost almost 38 % of its population between 1300 and 1400 AD as a consequence
of the Black Death. Around 1900 AD, both countries together counted approximately 11 Million
inhabitants. By the year 2007, 14 Million people lived in the area of the Alps (Alpine-Convention,
2010), mainly in the lower areas and in touristic hot spots. Except for the south-eastern
Slovenian part and the south-western part of Italy, the overall population increased over the last
decades (Alpine-Convention, 2010). However, Bätzing et al. (1996) reported that, from 1870 to
7 Study area and background information
1990, only lower-lying valleys attracted population and grew while an adverse trend was
observed for higher elevated areas.
With increasing population, the use of land became an important factor in the development of
the Alps. Under the term “land use” an endless list of human activities and their consequences
concerning ecosystems worldwide was summarised by DeFries et al. (2004) and Foley et al.
(2005). Basic needs for food, fibre, water and shelter need to be satisfied and consume space
for crops, pasture, plantations, settlements. Concerning infrastructure, streets and railways for
trade and transportation, dams and pipelines for water as well as power lines for electricity are
necessary. Furthermore, all resources that are required to build and sustain the system need to
be harvested or mined from natural sources and deposits: wood, coal, oil, metals, stone, salt,
fertilisers, food (fish and game). It is undisputed that these human requirements threaten
ecosystems worldwide and, as pointed out by Foley et al. (2005), even endanger the earth’s
capacity of sustaining fundamental ecosystem services (Costanza et al., 1997). With the
development of mass tourism, a new factor of land use heavily affects the environment (Shaw
and Williams, 1994).
In the fragile landscape of the Alps, these types of land use and their consequences on nature
can be observed. It can be seen everywhere that their impact does not stop at higher elevations.
Nowadays, tourism is the most important economic pillar in otherwise weakly developed
regions and the impact of mass tourism replaces ‘traditional’ alpine economy and landscapes
(Barker, 1982). The economic transformation from pasture, animal husbandry and forestry, to
industry all the way to tourism was rapid (Lichtenberger, 1965). It led to a decline of animal
husbandry and reduced the number of mountain farms (in Austria partly by a decrease of 70 %
between 1970 and 1999) after they had flourished during High Middle Ages (Bender, 2010). The
types, distributions and intensities of land use are, of course, strongly associated to a
population’s size and change with its individual culture, economy and technology. These
anthropogenic activities are affecting the landscape and, thereby, vegetation cover and
sediment fluxes and patterns.
2.4 Prehistoric mining and metallurgy
A special type of land use is open mining. The chronicle of prehistoric to historic mining is long
and very complex as there are several factors which are complicating any attempts of
reconstructing a continuous development. Until today, metals have gained more and more
importance. Most ancient mining sites were probably destroyed by the demand of land of
following generations and cultures, exploiting the same ores at the same spots. Pits or other
8 Study area and background information
open sites are also prone to natural erosion, especially in the mountains, where processing
structures like ovens or slags are destroyed and carried away easily by natural forces. In addition,
metal artefacts found in an archaeological context may have been traded or re-casted and do
not have to be related to in-situ smelting or mining. Only with the invention and acceptance of
Pb-isotopic studies, these issues could be tackled (O’Brien, 2015).
Some very early indications for, partly even subterranean, mining activities date back as far as
the Middle Palaeolithic or the Late Pleistocene at different spots in the world: in Australia
(Bednarik, 1992), in South-Africa around 45,000 years ago (Dart, 1971) and in Egypt at least 50-
60,000 years ago (Vermeersch and Paulissen, 1993). Most people think of gold, silver or other
metals when hearing of mining. However, these early traces were related to chert or flint
deposits, exploited to produce tools and weapons. In Europe, Meso- to Neolithic flint mines
were reported for the Alps by Leitner et al. (2011). Besides flint and metal, the range of
extractable resources also comprises coal, peat, clay, salt and any kinds of rock.
Metallic ores were used a long time before smelting technologies were discovered, but again
differently than most people would think. Goethite (FeO(OH)) and Haematite (Fe2O3), forms of
iron (hydr-)oxides, were exploited as pigments (ochre) on the African continent as early as
200,000 years ago (Barham, 2002). First hints at the existence of smelting technology as early as
7450 cal BP were suggested for lead objects in ancient Egypt. In the eastern Mediterranean, a
metal hoard was dated to 5150 cal BP (Zwicker, 1989), slags in Israel at 5450 cal BP and copper
artefacts on Cyprus at the same time. For the period from 4640 to 4130 cal BP, Véron et al.
(2006) showed an immense Pb- pollution in bay sediments of ancient Alexandria.
One of the earliest direct evidence of copper smelting in Europe (Eastern Serbia) dates back to
7000 cal BP (Radivojević et al., 2010). The first copper objects spread from the Balkans through
Central Europe in the 7th millennium BP as suggested by Höppner et al. (2005). In north Tyrol,
near Brixlegg, a copper slag was dated back to a period between 6450-5590 cal BP by Bartelheim
et al. (2002) but could not be connected to any local mining or deposits. The same applies to the
lake-dwelling northern Alpine Pfyn- and Mondsee cultures, who produced copper tools in the
6th millennium BP (Höppner et al., 2005).
A continuous flow of new discoveries keeps the debate open, how the technology spread from
the Eastern Mediterranean to Western and Central Europe or if it developed independently. As
summarised by a review on prehistoric copper mining in Europe (O’Brien, 2015), copper metal
was found in Italy as early as 6300 cal BP. Metalworking and mining activities started almost
simultaneously around 5500 cal BP and were an established technology by 5250 cal BP in the
region of modern Italy, but it might have taken almost 1000 years more to reach the Iberian
9 Study area and background information
Peninsula via Southern France. However, this was lately challenged by a study by Martínez
Cortizas et al. (2016), suggesting early metallurgy around 5000 cal BP in Northern Spain. The use
of copper and the technology to mine and produce it could have spread from Southern France
and the Pyrenées over Atlantic France into Ireland, where arsenical copper was produced
between 2350-1850 cal BP, as hypothesised by O’Brien (2015). In Great Britain, Mighall et al.
(2009) found early hints for local metallurgy in Wales in the early 4th millennium BP, however,
widespread copper mining across the island was replaced by bronze metallurgy after 4150 cal
BP.
Returning to the Alps, particularly the Eastern Alps (Austria) became a very important prehistoric
district for copper extraction in Central Europe (Stöllner and Oeggl, 2015). First, it was mainly
produced from fahlores (Cu-sulphides, often associated with As, Zn, Fe and Sb) in the Bronze
Age (Goldenberg, 2015; Viehweider et al., 2013). Later, a purer type was produced from
chalcopyrite (CuFeS2), followed by an intensification of extraction from around 3500-3280 cal
BP until 2750 cal BP (O’Brien, 2015; Stöllner, 2015a). The Bronze Age was a period of generally
widespread metallurgic activities, not only across the Alps but also in adjacent areas, like South-
West Germany (Krause, 1987). Metallurgy probably never ceased completely since then, and
also salt became an important trade good and was mined by Celtic groups (Ebner et al., 1999).
Krause (1987) showed clusters of known exploited copper deposits and Early Bronze Age
settlements in the Northern Alps. However, an almost empty spot was left right between the
Eastern and Western Alps and this gap is still not closed (Stöllner, 2015b), despite a few
indications. Also, considerable polymetallic ore resources, including Pb, exist in the northern
Central Alps, of which some were being mined at least since the Late Middle Ages and partly
until the 20th century AD (Grutsch and Martinek, 2012; Hammer, 1915a; Hanneberg et al., 2009a;
Neuhauser, 2015; Vavtar, 1988; Weber et al., 1997). However, clear evidence or indications for
a prehistoric use of these ores are missing so far.
2.5 Peatlands: functions and implications for palaeoenvironmental-
research
Peatlands cover approximately 3 % of the earth’s landmass (Kivinen and Pakarinen, 1981). They
are concentrated in temperate to cold regions of the Northern Hemisphere (North-America,
Russia, Scandinavia), but also exist in (sub)tropical regions like South-East Asia (Limpens et al.,
2008), Africa (Dargie et al., 2017), and at high latitudes or in mountain chains of the Southern
Hemisphere (Cooper et al., 2010; Yu et al., 2010).
10 Study area and background information
Besides serving as a supply for combustible material since at least 2000 years (Succow, 2012) or
as an additive for agri- and horticulture, peatlands have rather been a nuisance to humanity and
were drained over centuries, to gain new land for agriculture, pasture, settlements and other
construction work. But over the last century, scientific efforts and discoveries have put
peatlands into proper light and highlighted benefits and important ecological functions (Maltby
and Proctor, 1996; Sjörs, 1980). Not only are wetlands and mires acting as a natural buffer for
the hydrological balance of a region and sustaining unique ecosystems, peat can also retain and
buffer or reduce the availability of anthropogenic pollutants like trace metals (Brown et al.,
2000; Chaney and Hundemann, 1979; Couillard, 1994) or an excess of nutrients (Johnston, 1991;
Kadlec, 1997). As climate change became part of scientific and public discourse, the role of peat
as the most important terrestrial carbon storage, despite its tiny fraction of earth surface cover,
became clear (Bragg and Lindsay, 2003; Page and Baird, 2016). However, human activities are
still threatening wet- and peatlands by peat mining, groundwater extraction, drainage and
cultivation for agricultural use. Pollution, droughts, induced fires, invasive species and
eutrophication are raising the pressure put on these vulnerable ecosystems and their functions
(Bragg and Lindsay, 2003; Brinson and Malvárez, 2002). For example, changing conditions like a
decrease of the water table or higher temperatures can induce the release of CO2 and dissolved
organic carbon (Dise, 2009; Freeman et al., 2001) or the mobilisation of potentially toxic trace
metals like As (Rothwell et al., 2009). Furthermore, the burning of tropical peatlands was held
responsible for the highest rise in atmospheric CO2 concentrations since the beginning of
measurements (Page et al., 2002). The emissions of degrading peatland soils below expanding
palm oil plantations are going to contribute steadily in the near future (Carlson et al., 2013).
To avoid any confusion in terminology, it is important to distinguish between peatlands, mires,
peat bogs and fens. While a mire is a wet peatland that still accumulates peat, a (raised) peat
bog is a special type of mire, which is – unlike a fen – very low in nutrients, acidic and only fed
by atmospheric input. A fen receives nutrients from the mineral base and/or is constantly
supplied with enriched surface or groundwater (Bragg and Lindsay, 2003; Dierßen and Dierßen,
2008). What all mires have in common is a mechanism that prevents or strongly limits the
mineralisation and humification of organic material. As long as the combination of the overall
decomposition process and compaction of buried material is slower than the biomass
production in the living layers (acrotelm), a mire is still growing because peat can accumulate.
The most important limiting mechanism on decomposition is the supply of oxygen. The
replenishment of O2 in the water-saturated lower part of the peat column (catotelm) is very
slow. Furthermore, this tiny amount of oxygen is used up rapidly by the high abundance of
decaying organic matter. Over time, most mires develop through different stages and rely on
11 Study area and background information
certain conditions, like a constant supply of water or humidity, which often involves a sufficient
amount of precipitation. Depending on the right conditions, e.g. water table and the water
chemistry (nutrient supply), the resulting type of vegetation partly controls the accumulation of
peat. The most important peat building species are mosses, which continuously grow on top of
their dead stems, whereas higher plants that grow within such an environment (e.g. Carex)
contribute mainly roots, since their superficial biomass decomposes before burial. Päivänen and
Vasander (1994) demonstrated that only 2-16 % of the organic material produced is preserved
by being buried in the catotelm.
At some point, fen type mires are theoretically making the transition from a minerotrophic fen
over oligotrophic to an ombrotrophic mire (bog). While the lower part was and still is influenced
by the basal sediment, the upper part has grown above the groundwater level and is out of
influence of dissolved nutrient supply from deeper layers. The term ‘raised mire’ implies that it
is elevated relatively to the surrounding area, often described as a convex surface form, while
an exemplary fen’s surface is concave. Hence, the convex bog incorporates only atmospheric
inputs and, to some extent, takes up (i.e. recycles) nutrients from decomposing material. While
minerotrophic fens range between 5 to 15 % of mineral matter (Shotyk, 1988), Tolonen (1984)
characterised ombrotrophic peat with an ash content around or rather below 5 %.
The earliest stage of a mire typically begins in a morphological depression or lake (pond, pool,
etc.), which is continuously filled by a mix of sediment and ingrowing and dying plant material
until the water level is reached and the vegetation can cover and overgrow it. In another
example setting, peat can start growing directly on an impermeable substrate, e.g. clay or even
bare rock, but only if a constant supply of water is available for instance, a close-by stream, a
slope water runoff, precipitation etc. In this setting, a growing body of mosses builds up a
sponge-like structure, which can buffer shortages in humidity by collecting and storing water. A
feature that is induced by the capillary forces within such a peat moss body.
However, a classification where only minerotrophic, ombrotrophic and maybe a transitional
oligotrophic state are distinguished would be a simplification. Dierßen and Dierßen (2008)
suggested a characterisation based on the hydrology and development history, the chemistry of
peat and soil water, stratigraphy and composition and the structure of current vegetation. For
example, definitions strongly depend on the geomorphology below and around the mire.
Nonetheless, mires are also dynamic systems and the classification can differ based on the
criteria that are considered (Moore, 2013). Even within a single mire complex, mixed or
transition types exist.
12 Study area and background information
For this study, the exact classification does not play a major role apart from a differentiation into
ombro- and minerotrophic. However, morphological, hydrological and vegetation features of a
mire must be considered for the interpretation of geochemical proxies. In this context, a raised
(ombrotrophic) bog is often dominated by Sphagnum (Huttunen and Tolonen, 2006) or by other
mosses, which are adapted to low nutrient availability and therefore often used locally as an
indicator plant for low pH and low nutrients. Due to this deficiency of mineral matter and
unbuffered production of acids by decay and proton release from Sphagnum mosses into their
environment, bogs are very acidic (Dierßen and Dierßen, 2008) and possess pronounced anoxic
conditions in the water-logged catotelm (Gorham, 1995; Shotyk, 1988). Besides the already
extreme conditions, the dominance of Sphagnum creates a microhabitat that most vascular
plants do not tolerate (Van Breemen, 1995). As roots of these vascular plants are often pathways
for oxygen transport into deeper layers, their growth inhibition limits further decomposition
(Koppisch, 2012), i.e. promotes peat accumulation.
Over the last century and particularly over the last decades, peat bogs have proven to be
excellent archives for a broad range of potential proxies for past climate, environmental
conditions, trends and events in different parts of the world (e.g. Barber, 1993; Bindler, 2006;
Chambers et al., 2012; Chambers and Charman, 2004; Rabassa et al., 2006). One of the great
advances is the possibility to establish radiocarbon based age-depth models (e.g. Piotrowska et
al., 2011). Nutrient-poor systems like bogs are decaying very slowly, because the biota’s activity
is inhibited by a lack of mineral nutrients and oxygen. Again, the dominance of Sphagnum in
these systems is another factor, because it produces decay resistant components (Dierßen and
Dierßen, 2008). The greatest advantage of this lies in a higher peat accumulation, which results
in a higher resolution that undecomposed and thus less compacted mires can offer for
palaeoenvironmental studies. These properties are also beneficial when the degree of
preservation facilitates the selection of macrofossil samples for radiocarbon dating or for the
determination of pollen or vegetation in a sample. Palaeoecology, including macrofossil,
charcoal and pollen/spore studies (i.e. palynology) are one of the classic research techniques in
peat (Erdtman, 1927; Firbas, 1923; Godwin, 1934; Van Geel, 1978). Methods to reconstruct past
surface wetness and water table variations include the investigation of testate amoebae
(Woodland et al., 1998), the ratio of Carbon (C) to Nitrogen (N) or other organic geochemical
approaches (Biester et al., 2014; McClymont et al., 2010; Schellekens et al., 2015).
Aside from these approaches, inorganic proxies are used increasingly. The above-mentioned
proton release of Sphagnum happens in exchange for metal- or other cations (of e.g. Na, Mg, Ca
as nutrients or Pb, Ca, Zn, Cd etc. passively) and is very effective due to the large specific area of
their leaves (Dierßen and Dierßen, 2008). Furthermore, humic and fulvic acids as decomposition
13 Study area and background information
products of lignin and other organic material, are abundant in peat and partly responsible for
complexation, adsorption and exchange of cations and molecules (Kerndorff and Schnitzer,
1980; Ma and Tobin, 2004).
Being fed almost solely by atmospheric input, the geochemical record retains traces of whatever
settled or precipitated on the bog's surface. Immobile elements and their isotopes thus
potentially serve as geochemical proxies for past conditions (Benoit et al., 1998; Damman, 1978;
Nieminen et al., 2002; Shotyk, 1996a). The chemical signature of these inputs can be derived
from aeolian dust (Shotyk et al., 2002), volcanic ash, also called tephra layers (Dugmore et al.,
1995; Kilian et al., 2003; Swindles et al., 2010), sea spray or all kinds of anthropogenic pollution
(De Vleeschouwer et al., 2007; Jones and Hao, 1993; Shotyk et al., 1998).
Among others, certain lithogenic elements are contained in their mineral matrix, and, therefore,
conservative and immobile in ombrotrophic peat (Aubert et al., 2006; Krachler et al., 2003;
Shotyk et al., 2001). Isotopes and elemental signatures were used for dust provenance tracing
by comparing the peat samples to patterns from potential sediment source areas or rocks
(Kylander et al., 2007; Vanneste et al., 2015). More specifically, in terms of anthropogenic traces,
the ability for cation complexation and retention of metals and other pollutants (Cloy et al.,
2009; Gao et al., 1999; Klavins et al., 2009; Ma and Tobin, 2004; Shotyk, 1996b, 1996a) opened
new possibilities in interdisciplinary research. Among others, it merges archaeology,
geochemistry and environmental studies by identifying and quantifying traces of ancient
activities of mining and metallurgy (Mighall et al., 2009; Monna et al., 2004). It allows
understanding of the natural and anthropogenic atmospheric fluxes and biogeochemical cycles
of trace metals and toxic elements like Pb and Sb (Shotyk et al., 2004, 1996). In a similar way,
total mineral accumulation rates, either of atmospheric input or of flushed in material, could be
inferred from certain lithogenic elements (Chambers et al., 2012) and sometimes linked to
human induced erosion (Hölzer and Hölzer, 1998; Lomas-Clarke and Barber, 2007; Schofield et
al., 2010).
Part of these proxies can also be applied in the northern Central Alps, where a wet and humid
climate, geological factors, but also human impact played a role in promoting mire development
(Steiner, 2005), which hence provides appropriate palaeoenvironmental archives.
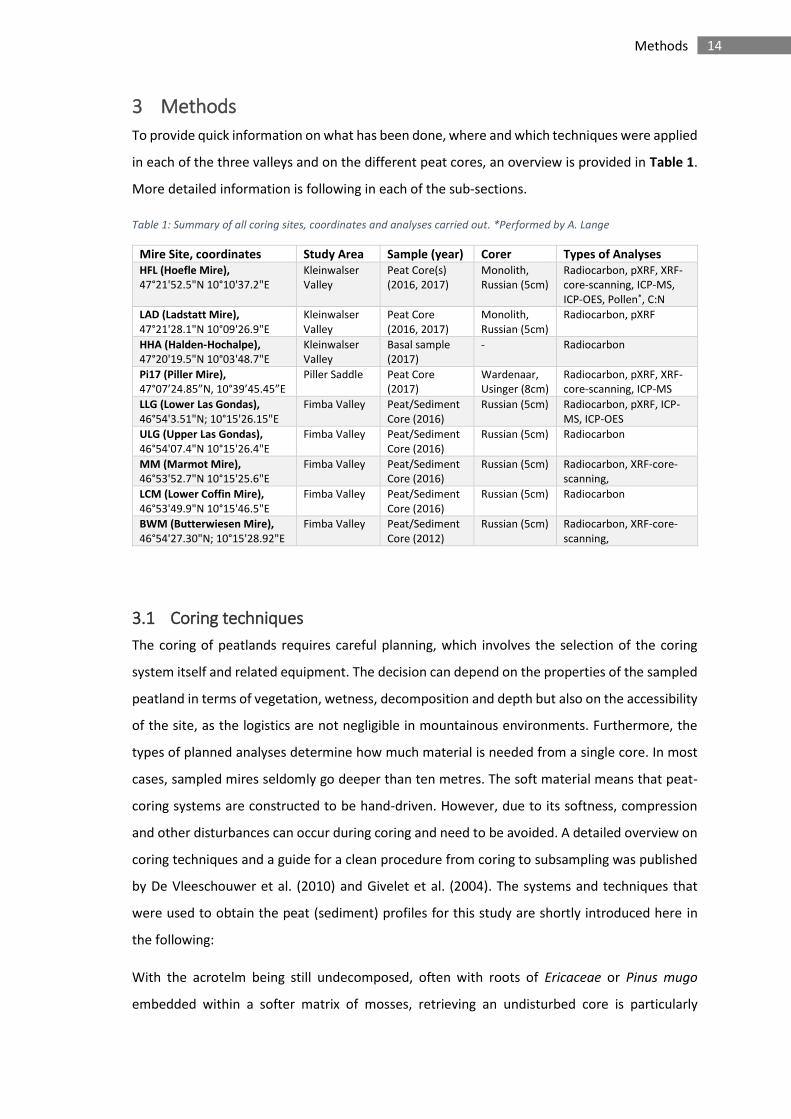
14 Methods
3 Methods
To provide quick information on what has been done, where and which techniques were applied
in each of the three valleys and on the different peat cores, an overview is provided in Table 1.
More detailed information is following in each of the sub-sections.
Table 1: Summary of all coring sites, coordinates and analyses carried out. *Performed by A. Lange
Mire Site, coordinates Study Area Sample (year) Corer Types of Analyses
HFL (Hoefle Mire),
47°21'52.5"N 10°10'37.2"E Kleinwalser Valley
Peat Core(s) (2016, 2017)
Monolith, Russian (5cm)
Radiocarbon, pXRF, XRF-core-scanning, ICP-MS, ICP-OES, Pollen*, C:N
LAD (Ladstatt Mire),
47°21'28.1"N 10°09'26.9"E Kleinwalser Valley
Peat Core (2016, 2017)
Monolith, Russian (5cm)
Radiocarbon, pXRF
HHA (Halden-Hochalpe),
47°20'19.5"N 10°03'48.7"E Kleinwalser Valley
Basal sample (2017)
- Radiocarbon
Pi17 (Piller Mire),
47°07’24.85”N, 10°39’45.45”E Piller Saddle Peat Core
(2017) Wardenaar, Usinger (8cm)
Radiocarbon, pXRF, XRF-core-scanning, ICP-MS
LLG (Lower Las Gondas),
46°54'3.51"N; 10°15'26.15"E Fimba Valley Peat/Sediment
Core (2016) Russian (5cm) Radiocarbon, pXRF, ICP-
MS, ICP-OES
ULG (Upper Las Gondas),
46°54'07.4"N 10°15'26.4"E Fimba Valley Peat/Sediment
Core (2016) Russian (5cm) Radiocarbon
MM (Marmot Mire),
46°53'52.7"N 10°15'25.6"E Fimba Valley Peat/Sediment
Core (2016) Russian (5cm) Radiocarbon, XRF-core-
scanning,
LCM (Lower Coffin Mire),
46°53'49.9"N 10°15'46.5"E Fimba Valley Peat/Sediment
Core (2016) Russian (5cm) Radiocarbon
BWM (Butterwiesen Mire),
46°54'27.30"N; 10°15'28.92"E Fimba Valley Peat/Sediment
Core (2012) Russian (5cm) Radiocarbon, XRF-core-
scanning,
3.1 Coring techniques
The coring of peatlands requires careful planning, which involves the selection of the coring
system itself and related equipment. The decision can depend on the properties of the sampled
peatland in terms of vegetation, wetness, decomposition and depth but also on the accessibility
of the site, as the logistics are not negligible in mountainous environments. Furthermore, the
types of planned analyses determine how much material is needed from a single core. In most
cases, sampled mires seldomly go deeper than ten metres. The soft material means that peat-
coring systems are constructed to be hand-driven. However, due to its softness, compression
and other disturbances can occur during coring and need to be avoided. A detailed overview on
coring techniques and a guide for a clean procedure from coring to subsampling was published
by De Vleeschouwer et al. (2010) and Givelet et al. (2004). The systems and techniques that
were used to obtain the peat (sediment) profiles for this study are shortly introduced here in
the following:
With the acrotelm being still undecomposed, often with roots of Ericaceae or Pinus mugo
embedded within a softer matrix of mosses, retrieving an undisturbed core is particularly
15 Methods
challenging. The simplest technique is the use of a serrated ceramic blade knife. Although the
penetration depth is limited, any compaction is negligible.
A more sophisticated system to tackle the issue of coring the topmost metre is the Wardenaar
corer (Wardenaar, 1987). The system has a rectangular 10x10x100 cm coring chamber, which is
composed out of two connected, but independently moving stainless steel halves. Each side’s
lower end is reversely furnished with an inclined, sharpened edge. By pushing each side down
stepwise and on a rotating basis, the corer can cut through the usually very fibrous acrotelm
with minimum compression. A pillow of air can be created at the lower end of the core before
pulling it out, which helps to disconnect the layers and to decrease suction at the lower end.
Another advantage is the large quantity of sample material. However, the instrument is less
suitable for dense (fen) peat or thick wood and root layers. It is easily damaged (bends, nicks)
and, therefore, cannot be driven down with too much force.
For deeper layers, the use of a Russian peat corer is required. This type of corer was first
introduced by Belokopytov and Beresnevich (1955) and further developed by Jowsey (1966). It
is the most commonly used corer for soft sediments like peat, as it avoids vertical compression
and is relatively easy to carry and to use. Theoretically, the maximum depth is limited only by
the number of extension rods and the strength of the coring team. It has a semi-cylindrical coring
chamber, which can be turned by a handle at the upper end by 180° around the attached blade
to close the coring chamber. When retrieving a consecutive second core from the borehole, it is
important to consider that the upper 10 cm could be disturbed by the metal tip of the Russian
corer. Therefore, the upper 10 cm should be avoided, and a parallel core should be taken with
a slight offset to obtain undisturbed material for this part.
The typical radius of the chamber can vary between 2.5 cm, 4 cm and 5 cm, with lengths of either
50 or 100 cm. Like the Wardenaar corer, it is pushed into the ground by hand or hammer blows,
with the chamber at 0° position. When the targeted depth is reached, the sharpened edge of
the chamber cuts horizontally through the peat. This design avoids vertical compaction, but
horizontal compression or an incomplete filling of the chamber can occur in very soft peat. The
Russian corer is, hence, most efficient for the catotelm.
Another method was deployed within this work: the Usinger coring system, which is a modified
piston coring system (e.g. Livingstone, 1955) initially developed for lake sediments. It was
developed further to be used for peat or other soft organic sediments and continuously refined
to reach higher depths. The schematic and setup are described in detail by Mingram et al. (2007).
It has an outer rod, which transmits the forces of pushing and pulling; and an inner rod, which
controls the piston and depth of opening the barrel. The coring chamber is a cylindrical, walled
16 Methods
barrel of 1 mm thickness (available diametre: 10, 8, 5.5 and 4 cm) with sharpened edges at the
lower end, which can cut through soft material like peat. The sediment (peat) is extruded from
the barrel into an open half-cylinder tube with a stamp, which is connected to a lever. The
Usinger system is the most complex method but has the advantages of a good depth control and
plenty of sample material. As with the Russian corer, the topmost layers in a consecutive core
segment could suffer from compaction and should not be used without having an independent
parallel core to verify any conducted measurements. Optimally, the upper part is taken with a
Wardenaar corer.
In this study, Russian Corers of 50 and 100 cm length with 5 and 8 cm chambers were used, while
barrels of 8 cm were chosen for the Usinger corer. Regardless of the system used, the coring
chambers were carefully cleaned and rinsed before retrieving the next core. After the extraction,
every section was wrapped in plastic film, transferred into a rigid casing and enclosed in a plastic
hose. This avoids loss of water, contamination and oxidation and provides protection during
transport and storage. All cores were put into cold storage at 3°C.
3.2 Core slicing and subsampling
Prior to subsampling, each core segment was deep-frozen for several days and then cut into
slices of approximately 1 cm thickness with a stainless-steel band saw. By carefully rinsing both
sides of every slice with MilliQ-water and cutting away its outer fringes, any possible
contamination has been removed. For cores from the Russian system, each slice was then
chopped into two or three triangular subsamples: half of it for geochemistry, a quarter for
macrofossils, pollen and dating and the last quarter as backup. Without a backup, the complete
other half has been stored for palynology and dating. For the Wardenaar and Usinger cores, at
least half of each slice has been used for geochemistry and the rest stored for palynology and
dating (Figure 2). The dimensions (length x width x height) of every geochemistry subsample
were measured with a Vernier calliper. To determine the dry bulk density of the peat, each
geochemistry subsample was weighed first before freeze-drying over a minimum of 72 h and
weighed again afterwards. Cores processed in this study resulted in a total number of 639
sample slices. All subsamples were transferred into pre-labelled plastic zip-bags before being
stored in a freezer again.
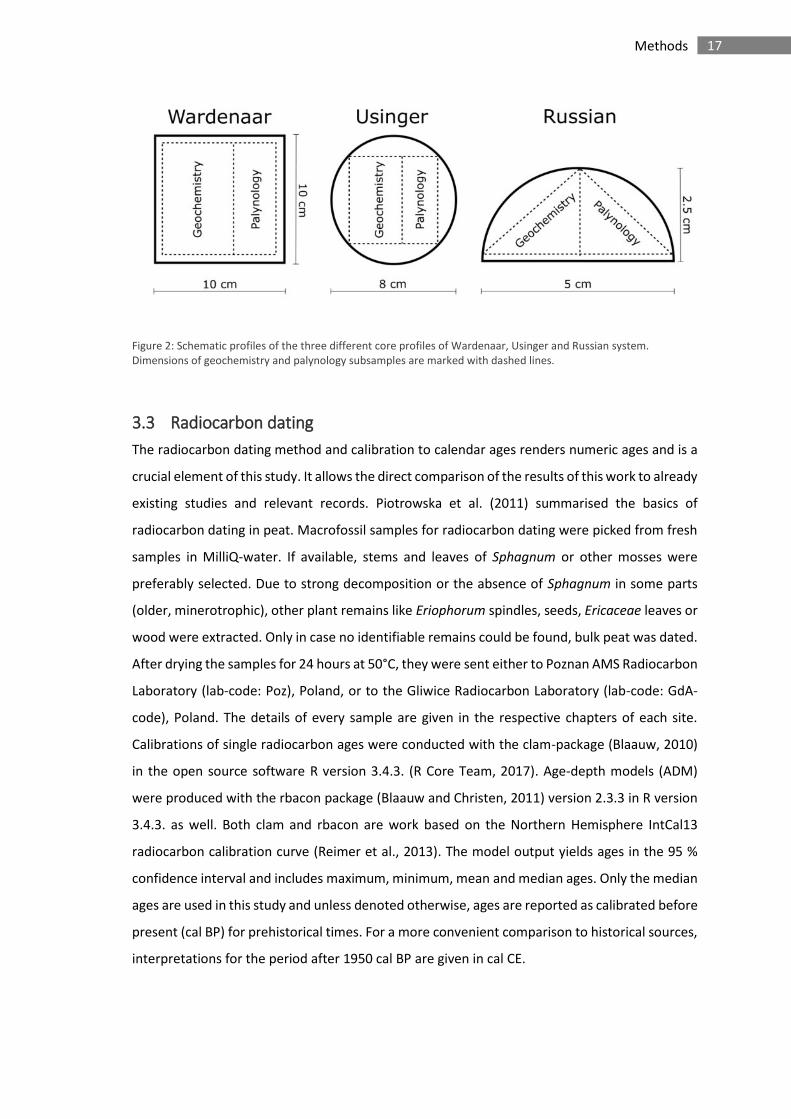
17 Methods
Figure 2: Schematic profiles of the three different core profiles of Wardenaar, Usinger and Russian system. Dimensions of geochemistry and palynology subsamples are marked with dashed lines.
3.3 Radiocarbon dating
The radiocarbon dating method and calibration to calendar ages renders numeric ages and is a
crucial element of this study. It allows the direct comparison of the results of this work to already
existing studies and relevant records. Piotrowska et al. (2011) summarised the basics of
radiocarbon dating in peat. Macrofossil samples for radiocarbon dating were picked from fresh
samples in MilliQ-water. If available, stems and leaves of Sphagnum or other mosses were
preferably selected. Due to strong decomposition or the absence of Sphagnum in some parts
(older, minerotrophic), other plant remains like Eriophorum spindles, seeds, Ericaceae leaves or
wood were extracted. Only in case no identifiable remains could be found, bulk peat was dated.
After drying the samples for 24 hours at 50°C, they were sent either to Poznan AMS Radiocarbon
Laboratory (lab-code: Poz), Poland, or to the Gliwice Radiocarbon Laboratory (lab-code: GdA-
code), Poland. The details of every sample are given in the respective chapters of each site.
Calibrations of single radiocarbon ages were conducted with the clam-package (Blaauw, 2010)
in the open source software R version 3.4.3. (R Core Team, 2017). Age-depth models (ADM)
were produced with the rbacon package (Blaauw and Christen, 2011) version 2.3.3 in R version
3.4.3. as well. Both clam and rbacon are work based on the Northern Hemisphere IntCal13
radiocarbon calibration curve (Reimer et al., 2013). The model output yields ages in the 95 %
confidence interval and includes maximum, minimum, mean and median ages. Only the median
ages are used in this study and unless denoted otherwise, ages are reported as calibrated before
present (cal BP) for prehistorical times. For a more convenient comparison to historical sources,
interpretations for the period after 1950 cal BP are given in cal CE.
18 Methods
3.4 Geochemistry
The geochemistry of peat cores or peat samples can be analysed with different methods. A
review and guideline of preparation techniques for different geochemical analyses was given by
Le Roux and De Vleeschouwer (2010). In this study, only full core X-Ray Fluorescence-scanning
would be completely non-destructive, whereas portable X-Ray Fluorescence Spectrometry
(pXRF) needs a dried and homogenised sample powder (at least in this study). In contrast,
Inductively Coupled Plasma Mass Spectrometry (ICP-MS) and Inductively Coupled Plasma
Optical Emission Spectrometry (ICP-OES) need a complete chemical digestion to obtain a
measuring solution.
A smaller number of samples for geochemical analysis with ICP-MS, ICP-OES and pXRF was
initially selected to obtain a general elemental trend in each core. The sample selection was
based on fluctuations in the density profile, which is giving a first idea about changes in the
evolution of the peatland (e.g. mineral content). Depending on the first results and on the
progressing quality of the age-depth models, more samples were picked to refine the data
resolution.
Before the geochemical analysis, the selected dry samples were transferred into Falcon™ tubes
of 15 or 50 cml and ground and homogenised with a FastPrep®-24. This was carried out by
adding eight glass beads of 4 mm into each tube and running them for three times over 20 s at
maximum speed (6m*s-1). Samples with wood were excluded or the wood was removed before
homogenisation. This method is quite efficient in terms of time, costs and cleanliness. In
comparison to other methods (e.g. mortar and pestle), it minimises the risks of cross-
contamination and material loss because the sample does not have to be transferred back and
forth into other containers, which also makes cleaning obsolete.
3.4.1 ICP-MS and ICP-OES
Both techniques have been used in palaeoenvironmental studies and yield quantitative results
for a broad range of inorganic elements. Procedures for quadrupole ICP-MS were proposed by
Krachler et al. (2002) and for ICP-OES by Sapkota et al. (2005). The main difference between the
two is that ICP-MS has a much lower detection limit and can thus measure trace- and ultra-trace
elements, resulting in a larger range of detectable elements. ICP-OES is therefore used for major,
minor and some trace elements (Al, Ca, Fe, K, Mg, Mn, Na, P, S, Sr, Ti, Zn, Pb, Cu) and can also
serve to determine the dilution factors for ICP-MS.
19 Methods
140 samples from the selected main sites (Suppl. Table 1) were processed in a class 100 clean
room at EcoLab (Toulouse, France), following the protocol in Vanneste et al. (2015): Using a
disposable plastic spatula, 100 ± 5 mg of the powdered peat were weighed into Savillex™ 30 mL
Standard Teflon® vials. A smaller amount was taken for samples with a visibly higher sediment
content or with high density (e.g. 90 mg for basal sediment). The basic goal of the complete wet
chemical digestion was to achieve a complete solution of carbonate and silicate minerals and
the removal of all organic compounds, because they would produce matrix effects, which can
affect the measured signals (e.g. Kralj and Veber, 2003).
The first step involved the addition of 2 ml of Suprapur® 65% nitric acid and 15 minutes of the
beakers in an ultrasonic bath. Afterwards, the samples were left to react at room temperature
over a minimum of 10 hours. The high degree of organic material provoked a strong exothermal
reaction, making it necessary to let the vials degas for a few minutes before adding 0.5 ml of HF
(Suprapur®) to every beaker. The vials were then put on a hotplate at 110°C to react for two
days. After evaporation at 50°C, 1 ml of H2O2 (Suprapur®) was added to oxidise the still organic
rich solution for a minimum of six hours until they were put into the ultrasonic bath for 15
minutes and evaporated slowly at 30°C. After adding 1 ml of 65% nitric acid, a 15-minute
ultrasonic bath and heating at 90°C for 48 hours, the samples were visually controlled for
particles and finally evaporated. Due to an incomplete digestion of a few samples, all were
treated with 1 ml of aqua regia for one day at 90°C and evaporated again. The residues were
dissolved again in 35 % HNO3 and diluted with Milli-Q-water to a 3 % measuring solution.
For ICP-MS, 50 µl of an In/Re spike (ratio of 0.403) were added to every sample. Furthermore,
an internal calibration with a multi-element standard in five different dilutions was run every
10th sample to correct for internal drift of the mass spectrometer during the measurement. For
ICP-OES, a multi element standard of four different dilutions was used and run at the end of
analysis. To verify the quality, precision and accuracy of the ICP-MS and ICP-OES results, five
different certified reference materials (CRM) with an organic matrix were processed with each
series of 21 samples. They were measured in regular intervals on both instruments (Suppl. Table
1). These CRMs were: GBW-07603 (bush branches and leaves), NIST-1515 (apple leaves), NIST-
1547a (peach leaves), NJV-941 (Carex/sedge peat) and NJV-942 (Sphagnum peat). Procedural
blanks were additionally processed throughout the digestion and measured to monitor possible
contamination or systematic errors during the digestion process. A total number of 168 solutions
(140 samples, 24 CRMs and 4 blanks) were measured on a Quadrupole-ICP-MS Agilent 7500 CE
(Q-ICP-MS) at Observatoire Midi-Pyrénées, Toulouse, France. Before that, 72 of them (60
samples, 9 CRMs, 3 blanks) were measured on an IRIS Intrepid II (Thermo Electron Corporation™)
ICP-OES at EcoLab, Toulouse, France.
20 Methods
The ICP-OES measurements allowed an estimate of the sample concentrations, which gave an
indication for the dilutions that had to be prepared for ICP-MS. Apart from Sulphur, all elements
that were measured with ICP-OES were covered by ICP-MS as well. Therefore, S is the only
element taken into account from ICP-OES. The spectroscopically measured concentrations in the
CRMs and their respective deviations from the certified values as well as the blanks are given in
Suppl. Table 1. None of the blanks showed any significantly elevated concentrations, which
demonstrates that no systematic contamination occurred during the sample preparation in the
clean laboratory or measurements.
Except for a few outliers, the measurements of Al, Ca, Ti, Pb, Zn, Rb, K, S, Sb, Sr (outlier of 48 %
in Nist1515 c), V (outlier -26.5 % in NIST1515 b) and Al (outlier of 81 % in NJV-941 d) deviated
less than 20 % from the certified values. Cu was systematically lower by -10 to -30 %, with larger
negative deviations at concentrations < 2 mg*kg-1. The lanthanides i.e. rare earth elements (REE)
Nd and Sm deviated less than -25 % from the certified values. The errors for As, Cr, Ni, Sc but
also Mn and Fe were higher but not systematically, so they should be considered with caution.
For the potential reference element Sc, Prohaska et al. (1999) observed spectral interferences
on ICP-MS. Stetzenbach et al. (1994) attributed possible interferences, which could affect the
measurement of Sc, to organic components. Although organic matter should have been
removed by the complete wet geochemical digestion, such an effect cannot be excluded.
A general observation is that most of the deviations are negative. A possible explanation could
be a dilution effect, caused by the uptake of air humidity of the powdered CRMs during longer
storage time and frequent use (opening and closing). However, this effect most likely did not
affect the peat samples, as they were processed shortly after freeze-drying.
3.4.2 Portable XRF scanning
Portable or handheld X-ray fluorescence scanners (pXRF) are common instruments for the quick
chemical analysis of all kinds of material. They were applied for archaeological artefacts (Liritzis
and Zacharias, 2011), in food safety (Palmer et al., 2009) and for the detection of pollution in
environmental samples, including soils and other sediments (Kalnicky and Singhvi, 2001). For
these purposes, the instrument uses internal calibrations that yield quantitative values.
The use of portable/handheld XRF to obtain geochemical data from peat or other highly organic
sediments is still rather scarce and only a handful of studies have evaluated the instrument’s
potential on samples with such a matrix (Kalnicky and Singhvi, 2001; Mejía-Piña et al., 2016;
Shand and Wendler, 2014; Shuttleworth et al., 2014). However, studies using pXRF on peat with
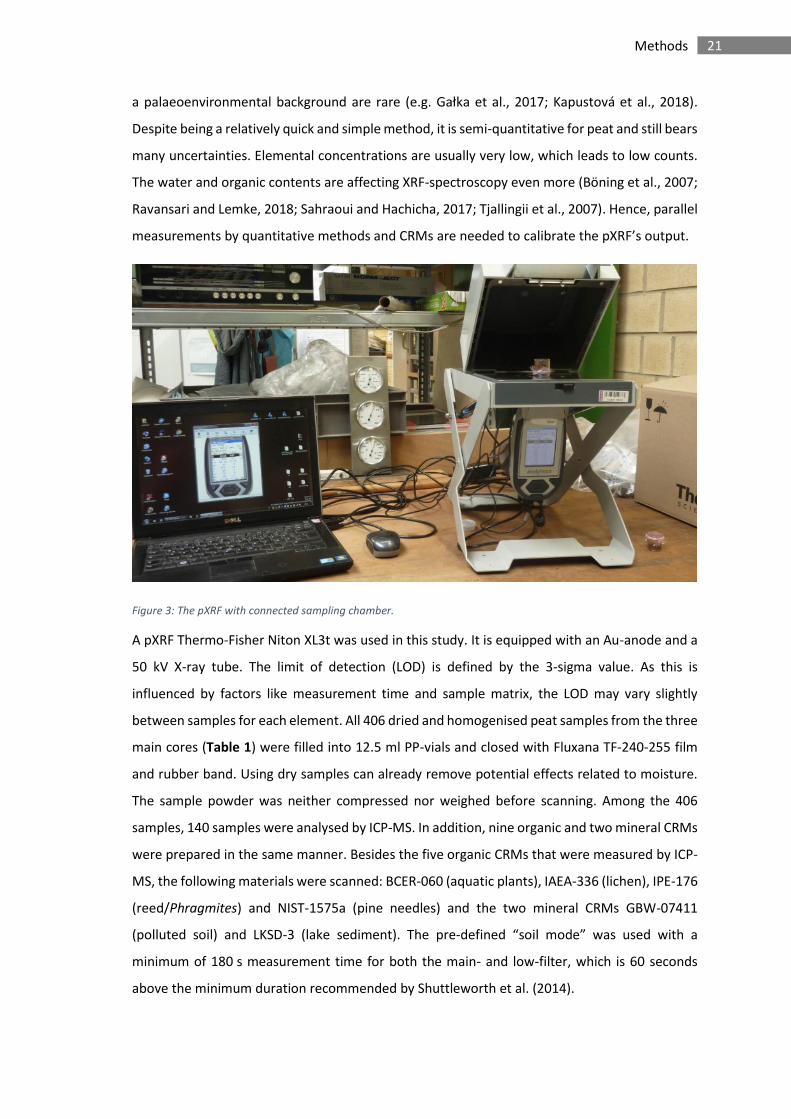
21 Methods
a palaeoenvironmental background are rare (e.g. Gałka et al., 2017; Kapustová et al., 2018).
Despite being a relatively quick and simple method, it is semi-quantitative for peat and still bears
many uncertainties. Elemental concentrations are usually very low, which leads to low counts.
The water and organic contents are affecting XRF-spectroscopy even more (Böning et al., 2007;
Ravansari and Lemke, 2018; Sahraoui and Hachicha, 2017; Tjallingii et al., 2007). Hence, parallel
measurements by quantitative methods and CRMs are needed to calibrate the pXRF’s output.
Figure 3: The pXRF with connected sampling chamber.
A pXRF Thermo-Fisher Niton XL3t was used in this study. It is equipped with an Au-anode and a
50 kV X-ray tube. The limit of detection (LOD) is defined by the 3-sigma value. As this is
influenced by factors like measurement time and sample matrix, the LOD may vary slightly
between samples for each element. All 406 dried and homogenised peat samples from the three
main cores (Table 1) were filled into 12.5 ml PP-vials and closed with Fluxana TF-240-255 film
and rubber band. Using dry samples can already remove potential effects related to moisture.
The sample powder was neither compressed nor weighed before scanning. Among the 406
samples, 140 samples were analysed by ICP-MS. In addition, nine organic and two mineral CRMs
were prepared in the same manner. Besides the five organic CRMs that were measured by ICP-
MS, the following materials were scanned: BCER-060 (aquatic plants), IAEA-336 (lichen), IPE-176
(reed/Phragmites) and NIST-1575a (pine needles) and the two mineral CRMs GBW-07411
(polluted soil) and LKSD-3 (lake sediment). The pre-defined “soil mode” was used with a
minimum of 180 s measurement time for both the main- and low-filter, which is 60 seconds
above the minimum duration recommended by Shuttleworth et al. (2014).
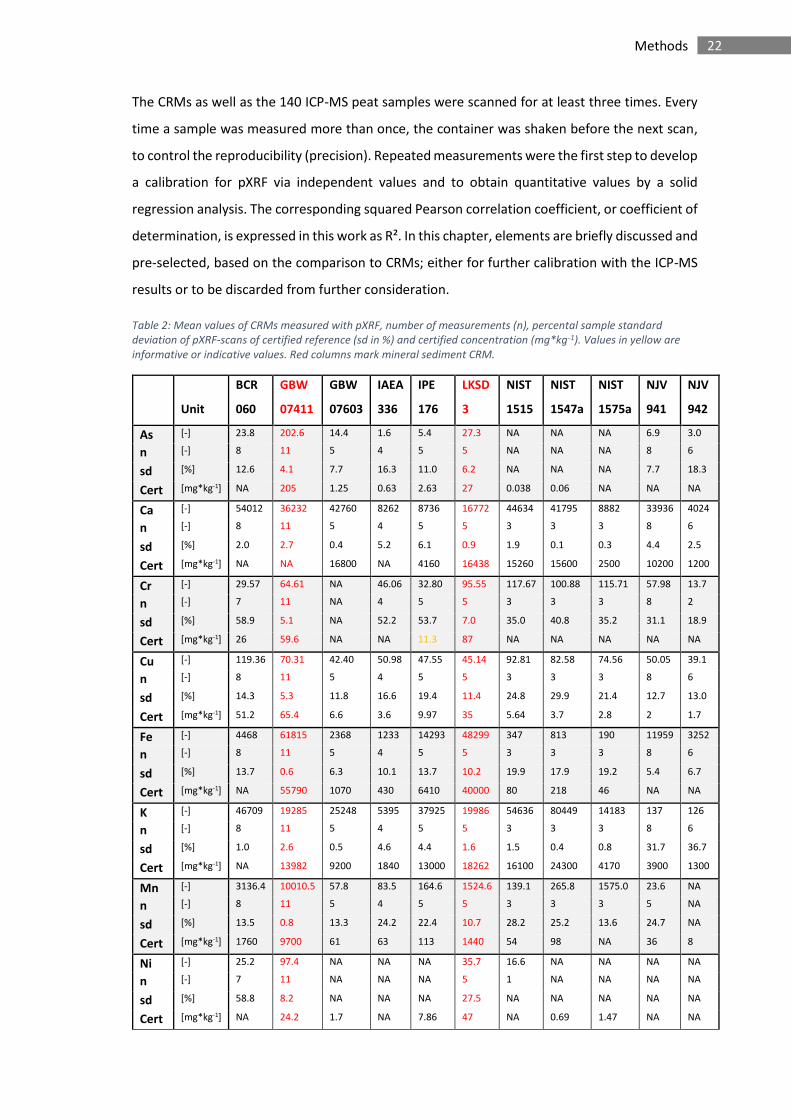
22 Methods
The CRMs as well as the 140 ICP-MS peat samples were scanned for at least three times. Every
time a sample was measured more than once, the container was shaken before the next scan,
to control the reproducibility (precision). Repeated measurements were the first step to develop
a calibration for pXRF via independent values and to obtain quantitative values by a solid
regression analysis. The corresponding squared Pearson correlation coefficient, or coefficient of
determination, is expressed in this work as R². In this chapter, elements are briefly discussed and
pre-selected, based on the comparison to CRMs; either for further calibration with the ICP-MS
results or to be discarded from further consideration.
Table 2: Mean values of CRMs measured with pXRF, number of measurements (n), percental sample standard
deviation of pXRF-scans of certified reference (sd in %) and certified concentration (mg*kg-1). Values in yellow are
informative or indicative values. Red columns mark mineral sediment CRM.
Unit
BCR
060
GBW
07411
GBW
07603
IAEA
336
IPE
176
LKSD
3
NIST
1515
NIST
1547a
NIST
1575a
NJV
941
NJV
942
As [-] 23.8 202.6 14.4 1.6 5.4 27.3 NA NA NA 6.9 3.0
n [-] 8 11 5 4 5 5 NA NA NA 8 6
sd [%] 12.6 4.1 7.7 16.3 11.0 6.2 NA NA NA 7.7 18.3
Cert [mg*kg-1] NA 205 1.25 0.63 2.63 27 0.038 0.06 NA NA NA
Ca [-] 54012 36232 42760 8262 8736 16772 44634 41795 8882 33936 4024
n [-] 8 11 5 4 5 5 3 3 3 8 6
sd [%] 2.0 2.7 0.4 5.2 6.1 0.9 1.9 0.1 0.3 4.4 2.5
Cert [mg*kg-1] NA NA 16800 NA 4160 16438 15260 15600 2500 10200 1200
Cr [-] 29.57 64.61 NA 46.06 32.80 95.55 117.67 100.88 115.71 57.98 13.7
n [-] 7 11 NA 4 5 5 3 3 3 8 2
sd [%] 58.9 5.1 NA 52.2 53.7 7.0 35.0 40.8 35.2 31.1 18.9
Cert [mg*kg-1] 26 59.6 NA NA 11.3 87 NA NA NA NA NA
Cu [-] 119.36 70.31 42.40 50.98 47.55 45.14 92.81 82.58 74.56 50.05 39.1
n [-] 8 11 5 4 5 5 3 3 3 8 6
sd [%] 14.3 5.3 11.8 16.6 19.4 11.4 24.8 29.9 21.4 12.7 13.0
Cert [mg*kg-1] 51.2 65.4 6.6 3.6 9.97 35 5.64 3.7 2.8 2 1.7
Fe [-] 4468 61815 2368 1233 14293 48299 347 813 190 11959 3252
n [-] 8 11 5 4 5 5 3 3 3 8 6
sd [%] 13.7 0.6 6.3 10.1 13.7 10.2 19.9 17.9 19.2 5.4 6.7
Cert [mg*kg-1] NA 55790 1070 430 6410 40000 80 218 46 NA NA
K [-] 46709 19285 25248 5395 37925 19986 54636 80449 14183 137 126
n [-] 8 11 5 4 5 5 3 3 3 8 6
sd [%] 1.0 2.6 0.5 4.6 4.4 1.6 1.5 0.4 0.8 31.7 36.7
Cert [mg*kg-1] NA 13982 9200 1840 13000 18262 16100 24300 4170 3900 1300
Mn [-] 3136.4 10010.5 57.8 83.5 164.6 1524.6 139.1 265.8 1575.0 23.6 NA
n [-] 8 11 5 4 5 5 3 3 3 5 NA
sd [%] 13.5 0.8 13.3 24.2 22.4 10.7 28.2 25.2 13.6 24.7 NA
Cert [mg*kg-1] 1760 9700 61 63 113 1440 54 98 NA 36 8
Ni [-] 25.2 97.4 NA NA NA 35.7 16.6 NA NA NA NA
n [-] 7 11 NA NA NA 5 1 NA NA NA NA
sd [%] 58.8 8.2 NA NA NA 27.5 NA NA NA NA NA
Cert [mg*kg-1] NA 24.2 1.7 NA 7.86 47 NA 0.69 1.47 NA NA
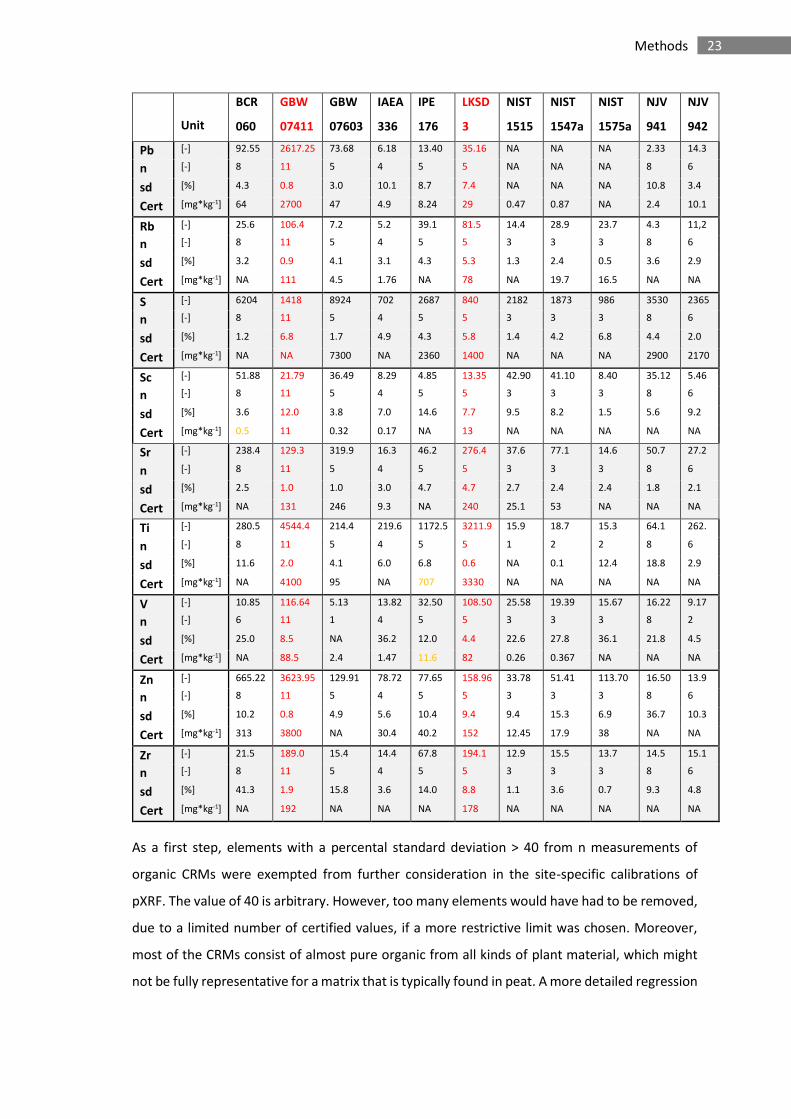
23 Methods
Unit
BCR
060
GBW
07411
GBW
07603
IAEA
336
IPE
176
LKSD
3
NIST
1515
NIST
1547a
NIST
1575a
NJV
941
NJV
942
Pb [-] 92.55 2617.25 73.68 6.18 13.40 35.16 NA NA NA 2.33 14.3
n [-] 8 11 5 4 5 5 NA NA NA 8 6
sd [%] 4.3 0.8 3.0 10.1 8.7 7.4 NA NA NA 10.8 3.4
Cert [mg*kg-1] 64 2700 47 4.9 8.24 29 0.47 0.87 NA 2.4 10.1
Rb [-] 25.6 106.4 7.2 5.2 39.1 81.5 14.4 28.9 23.7 4.3 11,2
n [-] 8 11 5 4 5 5 3 3 3 8 6
sd [%] 3.2 0.9 4.1 3.1 4.3 5.3 1.3 2.4 0.5 3.6 2.9
Cert [mg*kg-1] NA 111 4.5 1.76 NA 78 NA 19.7 16.5 NA NA
S [-] 6204 1418 8924 702 2687 840 2182 1873 986 3530 2365
n [-] 8 11 5 4 5 5 3 3 3 8 6
sd [%] 1.2 6.8 1.7 4.9 4.3 5.8 1.4 4.2 6.8 4.4 2.0
Cert [mg*kg-1] NA NA 7300 NA 2360 1400 NA NA NA 2900 2170
Sc [-] 51.88 21.79 36.49 8.29 4.85 13.35 42.90 41.10 8.40 35.12 5.46
n [-] 8 11 5 4 5 5 3 3 3 8 6
sd [%] 3.6 12.0 3.8 7.0 14.6 7.7 9.5 8.2 1.5 5.6 9.2
Cert [mg*kg-1] 0.5 11 0.32 0.17 NA 13 NA NA NA NA NA
Sr [-] 238.4 129.3 319.9 16.3 46.2 276.4 37.6 77.1 14.6 50.7 27.2
n [-] 8 11 5 4 5 5 3 3 3 8 6
sd [%] 2.5 1.0 1.0 3.0 4.7 4.7 2.7 2.4 2.4 1.8 2.1
Cert [mg*kg-1] NA 131 246 9.3 NA 240 25.1 53 NA NA NA
Ti [-] 280.5 4544.4 214.4 219.6 1172.5 3211.9 15.9 18.7 15.3 64.1 262.
n [-] 8 11 5 4 5 5 1 2 2 8 6
sd [%] 11.6 2.0 4.1 6.0 6.8 0.6 NA 0.1 12.4 18.8 2.9
Cert [mg*kg-1] NA 4100 95 NA 707 3330 NA NA NA NA NA
V [-] 10.85 116.64 5.13 13.82 32.50 108.50 25.58 19.39 15.67 16.22 9.17
n [-] 6 11 1 4 5 5 3 3 3 8 2
sd [%] 25.0 8.5 NA 36.2 12.0 4.4 22.6 27.8 36.1 21.8 4.5
Cert [mg*kg-1] NA 88.5 2.4 1.47 11.6 82 0.26 0.367 NA NA NA
Zn [-] 665.22 3623.95 129.91 78.72 77.65 158.96 33.78 51.41 113.70 16.50 13.9
n [-] 8 11 5 4 5 5 3 3 3 8 6
sd [%] 10.2 0.8 4.9 5.6 10.4 9.4 9.4 15.3 6.9 36.7 10.3
Cert [mg*kg-1] 313 3800 NA 30.4 40.2 152 12.45 17.9 38 NA NA
Zr [-] 21.5 189.0 15.4 14.4 67.8 194.1 12.9 15.5 13.7 14.5 15.1
n [-] 8 11 5 4 5 5 3 3 3 8 6
sd [%] 41.3 1.9 15.8 3.6 14.0 8.8 1.1 3.6 0.7 9.3 4.8
Cert [mg*kg-1] NA 192 NA NA NA 178 NA NA NA NA NA
As a first step, elements with a percental standard deviation > 40 from n measurements of
organic CRMs were exempted from further consideration in the site-specific calibrations of
pXRF. The value of 40 is arbitrary. However, too many elements would have had to be removed,
due to a limited number of certified values, if a more restrictive limit was chosen. Moreover,
most of the CRMs consist of almost pure organic from all kinds of plant material, which might
not be fully representative for a matrix that is typically found in peat. A more detailed regression
24 Methods
analysis is going to be conducted later in the site-specific chapters, when ICP-MS- and pXRF
measurements of peat samples are compared.
A high sd of 30 to 50 % was observed, for example, for Cr and Ni (Table 2). Contrastingly, Cr was
well measured in the mineral CRMs with a sd below 10 %. Beside these two elements, Cu, V,
Mn, Zn and K showed a relatively high sd of up to 30 % in some of the organic CRMs. However,
for Zn and K, this high sd was limited to the scans of NJV-941.
Most values that were acquired via pXRF from the organic CRMs were significantly elevated
compared to the certified concentrations. In contrast, the values for the mineral CRMs GBW-
07411 and LKSD-3 systematically were not too high and relatively much closer to their certified
values than the organic CRMs. Direct comparisons are shown in Figure 4 as cross-plots of pXRF-
values versus certified values of organic CRMs. Linear regression curves were plotted and
preliminary coefficients of determination (R²) are given. These are based only on very few data
points and the regression curves are therefore not likely to represent a stressable function.
Ti had one certified reference value in GBW-07603 (95 mg*kg-1). Only with an indicative
concentration (of IPE-176) a linear relationship could be established. These high concentrations
are however not representative for typical peat. After removing the mineral CRMs from the
regression, Pb, Ca, Rb, S, Zn, Sr, Fe, K and Mn had a promising R² of over 0.95. Also, Sc seemed
promising for organic materials with a R²=0.9. However, the unsatisfactory ICP-MS results for Sc
are obstructing a decent calibration of the element, despite its use as a conservative reference
element in peat (Shotyk et al., 2002). Measurements of As, V and Cu had a relatively high sd, at
least in the range of lower concentrations, which would be expected in peat samples. The same
is true for Cr, for which the regression analysis suggested that it could be used for sediments
with elevated Cr concentrations (> 25 mg*kg-1).
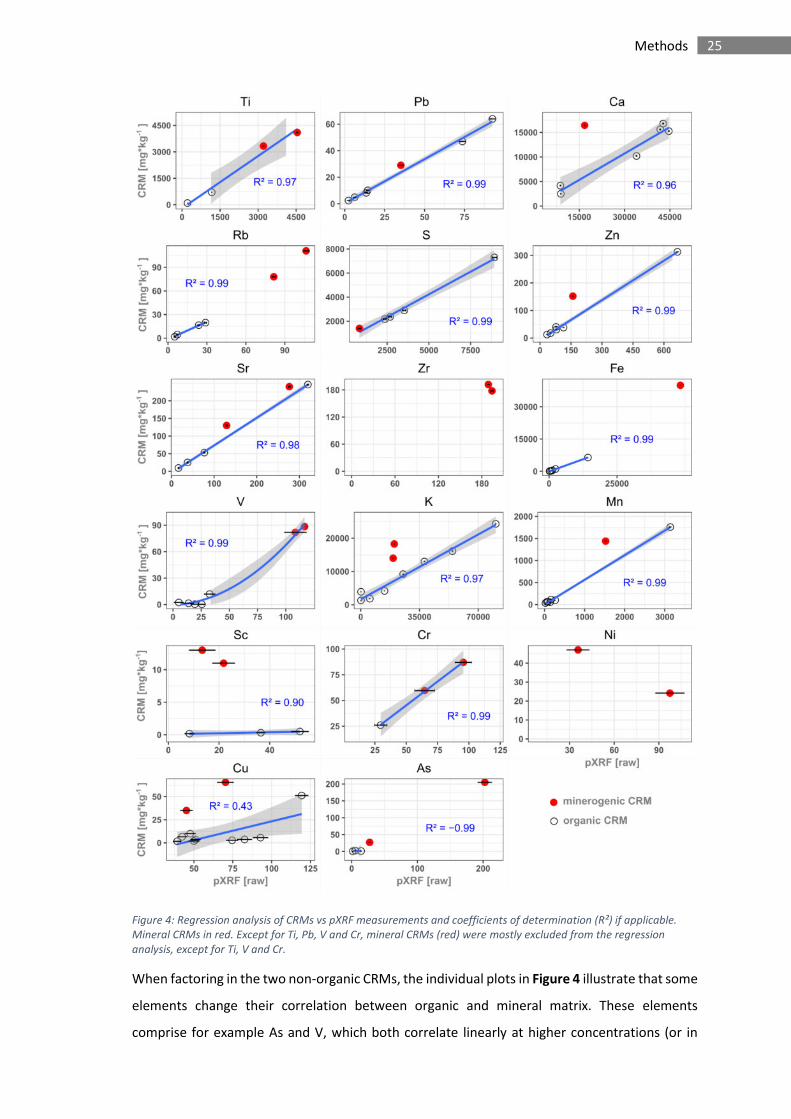
25 Methods
Figure 4: Regression analysis of CRMs vs pXRF measurements and coefficients of determination (R²) if applicable.
Mineral CRMs in red. Except for Ti, Pb, V and Cr, mineral CRMs (red) were mostly excluded from the regression
analysis, except for Ti, V and Cr.
When factoring in the two non-organic CRMs, the individual plots in Figure 4 illustrate that some
elements change their correlation between organic and mineral matrix. These elements
comprise for example As and V, which both correlate linearly at higher concentrations (or in
26 Methods
mineral sediments). Copper, on the other hand, shows a strong deviation between pXRF and
certified concentration in both organic and mineral material. For the elements Ca, K, Fe, Mn and
K, the mineral CRMs are outside of a possibly linear regression. The discrepancy between the fit
of organic and mineral materials is least pronounced for Pb, S and Sr and it can be suggested
that these elements are less affected by matrix effects. In particular, Ti, Rb, Fe and perhaps V
would need more samples (CRMs) in an intermediate range between maximum and minimum
concentrations so that the type of regression can be described. The regression curves of some
elements (potentially Ti, Rb, V) in Figure 4 leave the possibility of establishing a non-linear
function (polynomial of 2nd order). For Mn, Zn and Pb, intermediate concentrations are under-
represented in the CRMs as well.
Due to the issue of a limited concentration range in the available and investigated CRMs and
because site specific effects may appear from different factors, like the local geology or peat
type, the outcome of pXRF vs. ICP-MS/OES is addressed separately in each of the three study-
area chapters. Based on these individual regression analyses, it is possible to produce non-site-
specific transfer functions for certain elements, which could allow their quantification by pXRF-
measurements, even in peat samples of any source. A global evaluation with ICP-MS versus pXRF
of all peat samples is presented later in this thesis (Chapter 7.1).
3.4.3 XRF core scanning
XRF (core-)scanning is an established method used on marine- or lake sediment cores (Boyle,
2000), which is currently run on two different systems: the ITRAX-scanner (Bloemsma et al.,
2018; Croudace et al., 2006) and the Avaatech-scanner (Richter et al., 2006). It allows very
efficient geochemical analyses of sediment core profiles in high resolution (up to sub-mm).
Nevertheless, it has the disadvantage of being only semi-quantitative, measuring intensities,
translated to counts per second, instead of concentrations. Several attempts of cross calibrating
XRF-counts to quantitative methods have been carried out. But issues of varying organic content
(Chawchai et al., 2016; Löwemark et al., 2011), surface and particle inhomogeneity, pore water
content and matrix effects (Weltje and Tjallingii, 2008) are high obstacles that cannot be
overcome easily (Weltje et al., 2015). In peat cores, very low amounts of mineral matter lead to
low counts, while high water and organic matter content are producing noise. Therefore, the
scanning of peat cores is not very common and only few studies used it, either directly on the
wet core (Chawchai et al., 2016; Unkel et al., 2010) or on resin impregnated slices (De
Vleeschouwer et al., 2008). However, Poto et al. (2015) directly compared XRF-core (Avaatech-
system) with ICP-MS measurements on a split core of ombrotrophic peat and demonstrated high
27 Methods
correlation estimates of R² up to 1 for Pb, Cd, Cr, Sr, Ti and Zn, while Cu, Fe, Y, Ga and Ca were
still good or acceptable with R²>0.5. Another methodological study of Longman et al. (2018)
compared a core scanned with an ITRAX-system to ICP-OES measurements on the same material
and came to a similarly positive general conclusion, suggesting that results are best for Fe and
Ti. Despite their results, the quality still depends strongly on the condition of the core and the
available means to prepare it for scanning (e.g. clean and plain surface). As peat can be very
heterogeneous, already the presence of a wood particle or other larger macrofossils could
heavily influence the output.
For this study, four cores (Table 1) were scanned on an Avaatech XRF core scanner at the
Institute of Geosciences at Kiel University, Germany. The instrument is equipped with a Rh-
anode and a helium—flushed pillow between the beam-emitting chamber and the core. Scans
were performed on the core segments in a 10 mm resolution in two different settings. The
instrument was set to an excitation time of 10 s at 10 kV and 750 µA without filter, covering the
lighter elements Al, Si, S, K, Ca, Ti, Mn and to 20 s at 30 kV and 2000 µA with the Pd-Thick filter
setting for the heavier elements Fe, Ni, Cu, Zn, Se, Br, Rb, Sr, Zr and Pb. The filter cancels out
excitations from the light elements. Four powdered mineral standards were measured before
and after every scanning session (morning/evening) to monitor internal drift.
Unlike the ITRAX-, the Avaatech core-scanner is not designed to work on round surfaces. This is
of great importance for the 5-cm Russian cores. The flat side of these cores is most susceptible
to vertical cross-contamination, gets easily disturbed during transfer from corer to the storage
tube and is usually not plain. Any modification to get a levelled surface would lead to the loss of
more, already scarce, sample material. This is even more complicated in undecomposed peat or
when wood or roots are present. For the full Usinger core, it would require a lengthwise cut of
the full core (plus proper equipment), which would risk disturbing, breaking or contamination
of the core. The latter is also relevant for the full Usinger cores. As a consequence, the cores
were scanned as they were. Because peat is usually soft enough, the head of the scanner can
move onto the core without leaving an empty -air filled- space in between. Even if the peat
surface is slightly compressed, it allows scanning of the round core surfaces with the Avaatech.
The results are partly interpreted in form of ratios. For single element profiles, the signal should
be normalised to account for effects of matrix changes, for example, a changing proportion of
organic matter, which could dilute the signal (Löwemark et al., 2011). Aluminium (Al), which is
an often-used element for normalisation (e.g. Löwemark et al., 2011), needs long exposure
times and has a low detection limit, which is problematic for peat sediments and is therefore
not suitable in this study. Therefore, a normalisation to the total counts per second (tcps) was
chosen, as suggested for sediment cores by some studies (Chagué-Goff et al., 2016; Haenssler
28 Methods
et al., 2013; Ohlendorf et al., 2015). This method reduced otherwise prominent effects of surface
irregularities or smaller ruptures in the core, especially for the lighter element range.
3.4.4 Carbon/Nitrogen ratio
C and N analyses can provide information about the degree of decomposition and therefore
about wetter or drier episodes (Biester et al., 2014). The C:N ratio is strongly connected to the
type of peat, i.e. the vegetation (Koster and Favier, 2005), and age of the peat (Wang et al.,
2015). Its significance for palaeoclimatic interpretations is therefore debated and can be
ambiguous (Hansson et al., 2013), implying that C:N-data should not be interpreted on its own.
Here, 63 C:N-samples were selected from the already homogenised geochemistry peat sample
powder. Around 5 mg of each sample were weighed in for the final analysis on a EuroVector
Elemental Analyser 3000.
3.4.5 Enrichment factors and mineral accumulation rates
Enrichment factors (EF) are a way to illustrate either enrichment or depletion of a certain
elemental ratio in the respective layer of peat relative to the natural ratio in the local geology or
pre-anthropogenic sediment. Hence, they are a proxy to detect, interpret and discuss the
possible mechanisms behind fluctuations in this signal.
An EF is generally calculated by taking the ratio of the element A to a conservative reference
element B and divide it by the ratio of A to B that represents the Upper Continental Crust (UCC)
or the regional or local natural background. The elemental composition of the UCC was taken
from McLennan (2001).
𝐴 𝐸𝐹 = (𝐴 B⁄ )Sample(𝐴 𝐵⁄ )UCC or background
Concentrations of A and B in sample and UCC or background in mg*kg-1
To give an example, the enrichment factors of Pb (Pb EF), Sb (Sb EF), Cu (Cu EF) and Zn (Zn EF)
can be taken as indicators for anthropogenic pollution by mining, metallurgy or in some cases
for coal and leaded gasoline combustion (Nieminen et al., 2002; Shotyk, 1996a, 1996b; Weiss et
al., 1999). However, an EFA should only be calculated under the condition that element A is
immobile in the investigated peat section, if conclusions on the timing and time of deposition
are drawn. In ombrotrophic peat this requirement is fulfilled for the above-mentioned elements
(Novak et al., 2011). Otherwise, a different behaviour (dissolution and transport) in the
29 Methods
minerotrophic part of a core could lead to false interpretations (Shotyk, 1996a). A lower binding
capacity or less effective complexation of metals can be induced by the much higher presence
of competing binding partners, like Fe2+, Mg2+, Ca2+, for fulvic- or humic acids (Benedetti et al.,
1995; Iglesias et al., 2003; Zhou et al., 2005).
Table 3: UCC values of relevant elements from McLennan (2001)
Element Ti Pb Zn Cu Sb
UCC-value [mg*kg-1] 4100 17 71 25 0.2
Moreover, the reference element B has to meet a number of requirements. It needs to be
conservative and immobile in the peat column: It should not be affected by physicochemical
(e.g. dissolution and diffusion) or biological processes (e.g. plant cycling of nutrients) under
changing conditions of pH, water saturation, etc. Further, it must be equally distributed in
mineral source material without significant partitioning during (chemical) weathering,
entrainment, transport and sedimentation or in biological processes. Finally, precise and
accurate measuring of the element of choice must be ensured. Studies of i.a. Aubert et al.
(2006), Boës et al. (2011), Cloy et al. (2011), Krachler et al. (2003), Shotyk et al. (2001, 1992),
Shotyk (1988) and Zaccone et al. (2008) discussed the behaviour of several lithogenic elements
in terms of enrichment and mobility. As a quintessence of their results, Ti, Sc, Al, Pb, Y and REE,
Rb and V could be judged as immobile and conservative, at least in ombrotrophic peat, although
some results contrasted each other.
Yet, Weiss et al. (1997) underlined the importance of choosing the conservative element
individually in every study or location, since conditions may vary. Shotyk et al. (2001) reviewed
and predestined Sc as the most suitable lithogenic reference element for atmospheric
deposition, as it is not bound to any crustal rock or mineral in particular. It is, furthermore, only
used since recent times, e.g. in aerospace techniques (Røyset and Ryum, 2005), and is only
enriched in bauxite deposits (Binnemans et al., 2015). After Henderson (1982), it does not get
residually enriched or depleted in the crystallization of magma and in contrast to other
elements, chemical weathering affects the Sc inventory the least (Nesbitt and Markovics, 1997).
Krachler et al. (2003) proposed Al as the best reference after Sc and studies of Muller et al.
(2008) and Shotyk et al. (2001) backed this finding. Bennett et al. (1991) and Damman (1978)
reported some Al mobility in parts of the peat column. Furthermore Nesbitt and Markovics
(1997) observed an enrichment of Al in aerosols. The behaviour of REE in peat was discussed in
several studies (Aubert et al., 2006; Krachler et al., 2003; Kylander et al., 2007) and all agreed on
their immobility in peat. Unfortunately, the analytical quality of Sc in both ICP-MS and pXRF
30 Methods
analyses hampers its use in this study and neither Al nor REE or Y are covered by the pXRF soil-
mode spectrum. Therefore, Ti, Zr and V remain as possible choices.
Ti and Zr are not susceptible to dissolution (i.e. to leaching from minerals within the peat) but
can be subject to physical fractionation processes. They are most abundant in heavy accessory
minerals like rutile, ilmenite, titanite and zircon (Goldschmidt, 1954), which are resistant to
chemical weathering (Jackson and Sherman, 1953). The density of these minerals can lead to
sorting effects during weathering and transport, making them generally less abundant in small
and light particles (Schütz and Rahn, 1982). At the same time, Zr can be depleted relative to Ti
in clays and aerosols derived from weathering (Krachler et al. 2003), which would infer that Ti is
less affected. Furthermore, Zr gets more easily fractioned during transport and sedimentation
processes, due to its abundant occurrence in heavy minerals (Fralick and Kronberg, 1997). In
contrast, Ti has been widely used to quantify mineral inputs into peatlands (Sapkota et al., 2007)
and is, in contrast to Pb and V (Cloy et al., 2011), not enriched by anthropogenic pollution. It was
also used by Le Roux et al. (2004) as a reference element to calculate Pb EF in peat. In addition,
V has higher measurement errors and a lower correlation between ICP-MS and pXRF
measurements and the CRMs. As Zr is not covered by the organic CRMs and lacks an
independent control, Ti is used as the conservative reference element in this study. Now, to
finally calculate an EF, some of the relevant UCC-values can be found in Table 3. However, as
already suggested by Kempter et al. (1997), the combination of Ti and Pb is a powerful set of
proxies to detect metal emissions and changes in land use history.
Accordingly, Ti is chosen as a tracer for soil erosion. Knowing the element’s proportion in the
UCC, it allows quantifying the annual deposition of mineral matter on the mire’s surface. It can
be addressed as Mineral Accumulation Rate (MAR) or Atmospheric Soil Dust (ASD) in an
ombrotrophic mire. MAR is accounting for the total amount of mineral matter deposited on the
mires surface, whereas ASD is, as the name implies, a measure for material deposited solely by
the atmosphere. Even if the UCC may not be completely representative everywhere, Shotyk et
al. (2002) used the TiUCC value to quantify the annual atmospheric mineral input on a Swiss mire.
Thus, the same approach is used here to calculate the mineral accumulation rate (MAR in g*m-
2*a-1) with the following formula: 𝑀𝐴𝑅 = 100 0.41⁄ ∗ 𝑇𝑖 ∗ 𝛿 ∗ 𝑝𝑎
Ti concentration in sample (Ti in mg*kg-1); dry bulk density (δ in g*cm-³); peat accumulation rate (pa in cm*a-1)
As this calculation of deposition rates includes the factor of time (in the form of accumulation
rates drawn from the age-depth model), it overcomes the issues of looking at concentration
31 Methods
profiles versus depth or time only, because it normalises effects of decomposition, compaction
or lower peat accumulation.
3.4.6 Principal Component Analysis
Principal Component Analysis (PCA) is a statistical method allowing to handle big and complex
datasets with numerous variables and to reveal patterns and relations within it (Shlens 2014).
In brief, PCA filters out a component by rotating the coordinate axes of a multi-dimensional
dataset and aligning it along the vector with the highest variance of variables. The PCA approach
is used in all kinds of research fields. It has already been applied in palaeoclimatic and -
environmental studies in peat by i.a. Mauquoy et al. (2004), Muller et al. (2008) and Hansson et
al. (2013). Here, it is used to analyse relations within the available data, e.g. geochemical
elemental concentrations or ratios, but also depth, density and accumulation rate. The analysis
was computed with the open source software R version 3.4.2 (R Core Team, 2017) and the
internal “prcomp” package. For each run, the package centres and scales (i.e. normalises) the
variables to get a mean of zero and to account for large variations within the dataset.
3.5 Core descriptions and macrofossil analysis
Visual core descriptions were carried out on the fresh cores, aided by the high-resolution line
scan photos of the Avaatech core-scanner, which provides an adequate and uniform light source
to still detect colour changes. Besides, observations from macrofossil analysis (see below) is
considered in the description. In this way, it is possible to distinguish between certain peat layers
and to identify changes (e.g. of the vegetation) that are invisible for the eye on the core’s
surface. This is important because the quickly oxidising surface of the peat core blurs changes in
colour to a large extent. Furthermore, interchanging illumination in the field or other relative
factors (e.g. subjective vision) have to be considered as well.
A coarse macrofossil analysis was carried out on a minimum sample volume of 1-2 ml in a petri-
dish with bi-distilled water under a binocular microscope, partly in parallel to the picking of
samples for radiocarbon dating. Although it is a rather subjective approach, the content of
suspended organic matter and the state of preservation of plant remains (e.g. Sphagnum leaves)
gave an idea about the degree of decomposition and humification. Furthermore, the frequent
occurrence of charcoal and mineral grains yields information about local fires and increased
sediment content. The presence or absence and type of macrofossils (like wood particles, leaves,
32 Methods
needles, moss, Oribatidia, macro-charcoal, etc.) also add valuable information on past
vegetation and trophic status.
3.6 Pollen
A volume of 2 ml was taken from 14 samples of cores HFL-B and HFL-C in the overlapping section.
These samples were selected at depths were trends or events were visible in the preliminary
geochemical profiles. The samples were prepared for pollen analysis by following the method
described by Moore et al. (1991). The raw material was pre-treated in separate steps in 10 %
KOH and 10 % HCl to get rid of humic substances and carbonates. Macro remains were sieved
out with a 200-µm mesh. Afterwards, the samples were cooked for 4 minutes in a 9:1 solution
of acetic anhydride and concentrated sulphuric acid and then centrifuged. With ultrasonic
sieving, particles smaller than 6 µm were removed. Coarser siliciclastic sediment layers did not
occur in the analysed samples, so that the application of HF was not necessary. Pollen were
counted until a sum of 200 tree pollen grains was reached. Although this relatively low counting
rate might miss especially rare pollen, the general trends and higher signals should appear
clearly in the samples. In addition, Corylus pollen were not considered as tree pollen for the
definition of the point where to end pollen counting because they potentially bias the result due
to their high abundance when they were present in the area. Fern spores without perine were
counted as indeterminate pteridophytes.
3.7 Terminology of chronological classification
In the scientific disciplines of archaeology and history, temporal classification into cultural
periods is based on technological and cultural transitions. These terms are not globally
convertible to calendar ages but must be defined in the context of the investigated region and
the cultural level of the palaeo-communities. It means that a certain region already transitioned
from period A to B, while another region remained in period A. The transformation from
Mesolithic cultures sustaining themselves by hunting and gathering to the Neolithic is
supposed to be the point when humans started to alter their environment through agro-pastoral
activities. This is also the point when human presence should have started to leave
(geochemical) traces in palaeoenvironmental archives, which is important for the scope of this
study. Following a compilation published by Roepke and Krause (2013), the Neolithic began
around 7450 cal BP in the northern Central Alps. Their studied site in the northern Central Alps
(Montafon) region is south of the Kleinwalser Valley in the state of Vorarlberg in Austria and
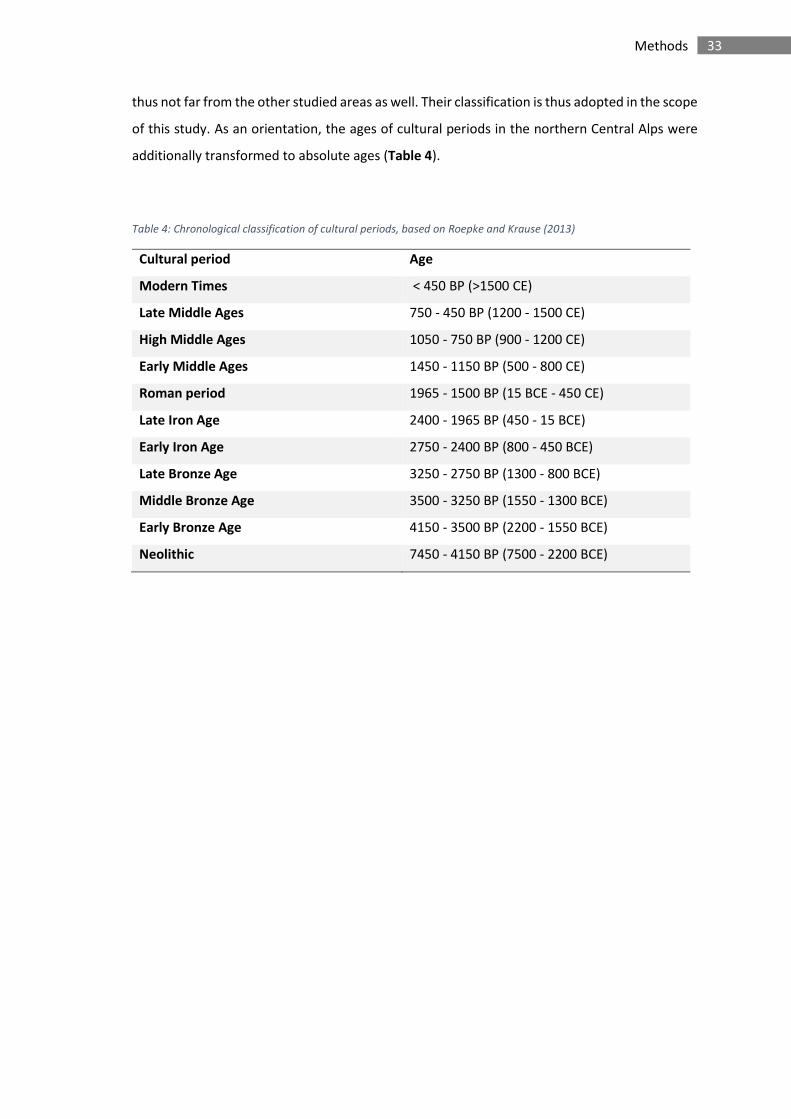
33 Methods
thus not far from the other studied areas as well. Their classification is thus adopted in the scope
of this study. As an orientation, the ages of cultural periods in the northern Central Alps were
additionally transformed to absolute ages (Table 4).
Table 4: Chronological classification of cultural periods, based on Roepke and Krause (2013)
Cultural period Age
Modern Times < 450 BP (>1500 CE)
Late Middle Ages 750 - 450 BP (1200 - 1500 CE)
High Middle Ages 1050 - 750 BP (900 - 1200 CE)
Early Middle Ages 1450 - 1150 BP (500 - 800 CE)
Roman period 1965 - 1500 BP (15 BCE - 450 CE)
Late Iron Age 2400 - 1965 BP (450 - 15 BCE)
Early Iron Age 2750 - 2400 BP (800 - 450 BCE)
Late Bronze Age 3250 - 2750 BP (1300 - 800 BCE)
Middle Bronze Age 3500 - 3250 BP (1550 - 1300 BCE)
Early Bronze Age 4150 - 3500 BP (2200 - 1550 BCE)
Neolithic 7450 - 4150 BP (7500 - 2200 BCE)
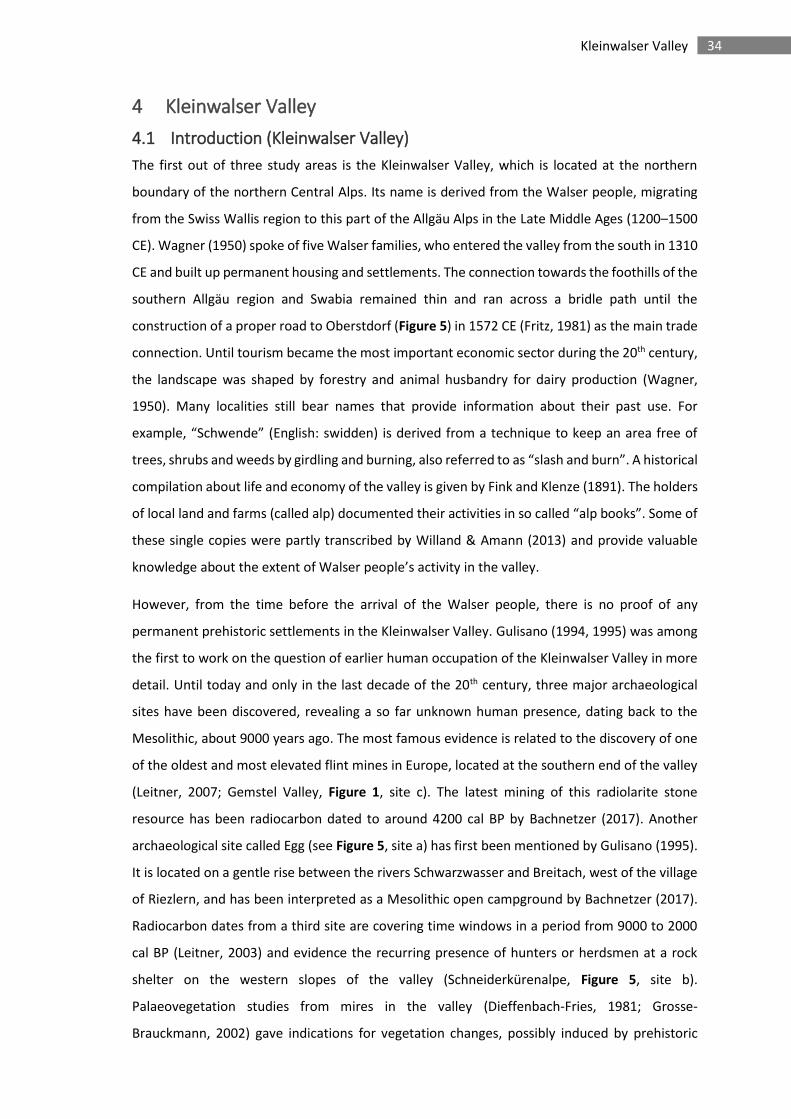
34 Kleinwalser Valley
4 Kleinwalser Valley
4.1 Introduction (Kleinwalser Valley)
The first out of three study areas is the Kleinwalser Valley, which is located at the northern
boundary of the northern Central Alps. Its name is derived from the Walser people, migrating
from the Swiss Wallis region to this part of the Allgäu Alps in the Late Middle Ages (1200–1500
CE). Wagner (1950) spoke of five Walser families, who entered the valley from the south in 1310
CE and built up permanent housing and settlements. The connection towards the foothills of the
southern Allgäu region and Swabia remained thin and ran across a bridle path until the
construction of a proper road to Oberstdorf (Figure 5) in 1572 CE (Fritz, 1981) as the main trade
connection. Until tourism became the most important economic sector during the 20th century,
the landscape was shaped by forestry and animal husbandry for dairy production (Wagner,
1950). Many localities still bear names that provide information about their past use. For
example, “Schwende” (English: swidden) is derived from a technique to keep an area free of
trees, shrubs and weeds by girdling and burning, also referred to as “slash and burn”. A historical
compilation about life and economy of the valley is given by Fink and Klenze (1891). The holders
of local land and farms (called alp) documented their activities in so called “alp books”. Some of
these single copies were partly transcribed by Willand & Amann (2013) and provide valuable
knowledge about the extent of Walser people’s activity in the valley.
However, from the time before the arrival of the Walser people, there is no proof of any
permanent prehistoric settlements in the Kleinwalser Valley. Gulisano (1994, 1995) was among
the first to work on the question of earlier human occupation of the Kleinwalser Valley in more
detail. Until today and only in the last decade of the 20th century, three major archaeological
sites have been discovered, revealing a so far unknown human presence, dating back to the
Mesolithic, about 9000 years ago. The most famous evidence is related to the discovery of one
of the oldest and most elevated flint mines in Europe, located at the southern end of the valley
(Leitner, 2007; Gemstel Valley, Figure 1, site c). The latest mining of this radiolarite stone
resource has been radiocarbon dated to around 4200 cal BP by Bachnetzer (2017). Another
archaeological site called Egg (see Figure 5, site a) has first been mentioned by Gulisano (1995).
It is located on a gentle rise between the rivers Schwarzwasser and Breitach, west of the village
of Riezlern, and has been interpreted as a Mesolithic open campground by Bachnetzer (2017).
Radiocarbon dates from a third site are covering time windows in a period from 9000 to 2000
cal BP (Leitner, 2003) and evidence the recurring presence of hunters or herdsmen at a rock
shelter on the western slopes of the valley (Schneiderkürenalpe, Figure 5, site b).
Palaeovegetation studies from mires in the valley (Dieffenbach-Fries, 1981; Grosse-
Brauckmann, 2002) gave indications for vegetation changes, possibly induced by prehistoric
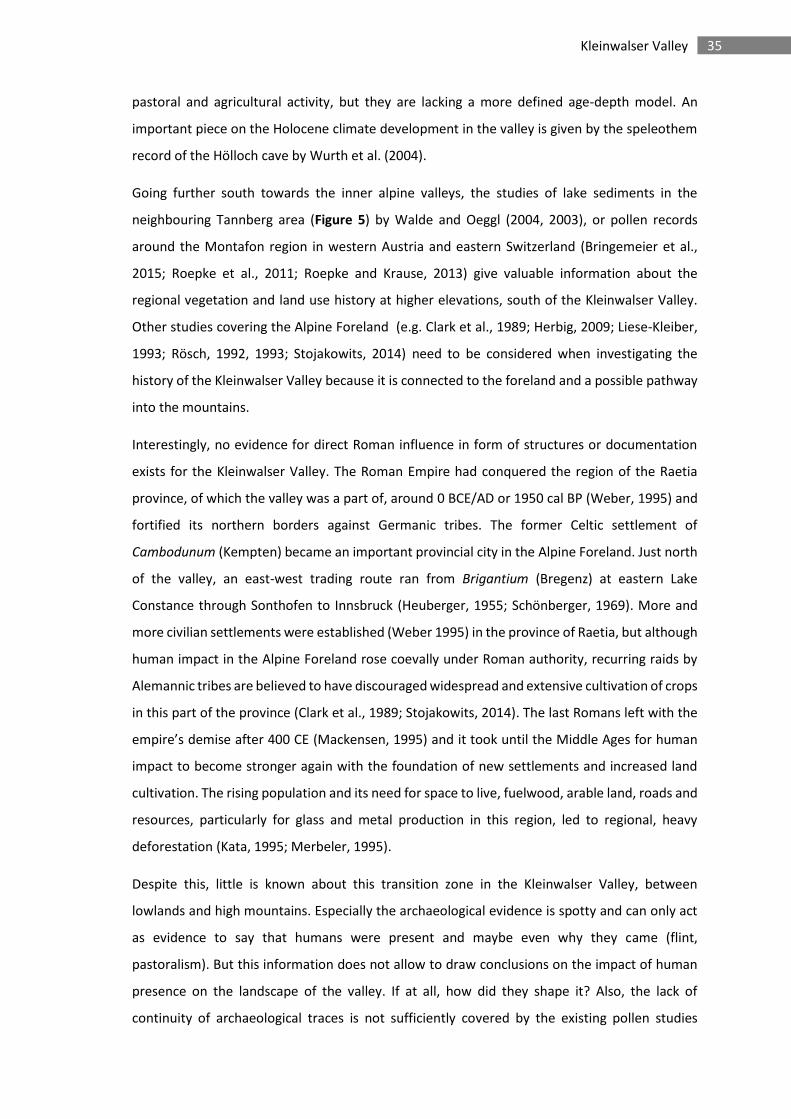
35 Kleinwalser Valley
pastoral and agricultural activity, but they are lacking a more defined age-depth model. An
important piece on the Holocene climate development in the valley is given by the speleothem
record of the Hölloch cave by Wurth et al. (2004).
Going further south towards the inner alpine valleys, the studies of lake sediments in the
neighbouring Tannberg area (Figure 5) by Walde and Oeggl (2004, 2003), or pollen records
around the Montafon region in western Austria and eastern Switzerland (Bringemeier et al.,
2015; Roepke et al., 2011; Roepke and Krause, 2013) give valuable information about the
regional vegetation and land use history at higher elevations, south of the Kleinwalser Valley.
Other studies covering the Alpine Foreland (e.g. Clark et al., 1989; Herbig, 2009; Liese-Kleiber,
1993; Rösch, 1992, 1993; Stojakowits, 2014) need to be considered when investigating the
history of the Kleinwalser Valley because it is connected to the foreland and a possible pathway
into the mountains.
Interestingly, no evidence for direct Roman influence in form of structures or documentation
exists for the Kleinwalser Valley. The Roman Empire had conquered the region of the Raetia
province, of which the valley was a part of, around 0 BCE/AD or 1950 cal BP (Weber, 1995) and
fortified its northern borders against Germanic tribes. The former Celtic settlement of
Cambodunum (Kempten) became an important provincial city in the Alpine Foreland. Just north
of the valley, an east-west trading route ran from Brigantium (Bregenz) at eastern Lake
Constance through Sonthofen to Innsbruck (Heuberger, 1955; Schönberger, 1969). More and
more civilian settlements were established (Weber 1995) in the province of Raetia, but although
human impact in the Alpine Foreland rose coevally under Roman authority, recurring raids by
Alemannic tribes are believed to have discouraged widespread and extensive cultivation of crops
in this part of the province (Clark et al., 1989; Stojakowits, 2014). The last Romans left with the
empire’s demise after 400 CE (Mackensen, 1995) and it took until the Middle Ages for human
impact to become stronger again with the foundation of new settlements and increased land
cultivation. The rising population and its need for space to live, fuelwood, arable land, roads and
resources, particularly for glass and metal production in this region, led to regional, heavy
deforestation (Kata, 1995; Merbeler, 1995).
Despite this, little is known about this transition zone in the Kleinwalser Valley, between
lowlands and high mountains. Especially the archaeological evidence is spotty and can only act
as evidence to say that humans were present and maybe even why they came (flint,
pastoralism). But this information does not allow to draw conclusions on the impact of human
presence on the landscape of the valley. If at all, how did they shape it? Also, the lack of
continuity of archaeological traces is not sufficiently covered by the existing pollen studies
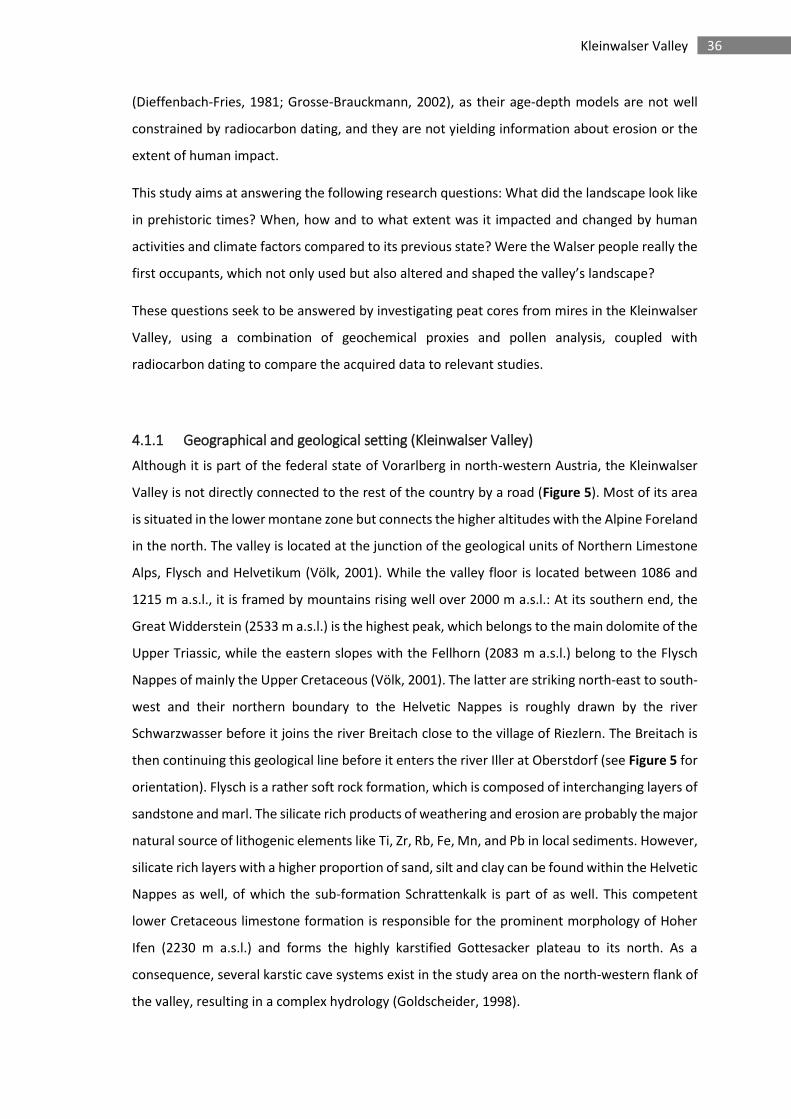
36 Kleinwalser Valley
(Dieffenbach-Fries, 1981; Grosse-Brauckmann, 2002), as their age-depth models are not well
constrained by radiocarbon dating, and they are not yielding information about erosion or the
extent of human impact.
This study aims at answering the following research questions: What did the landscape look like
in prehistoric times? When, how and to what extent was it impacted and changed by human
activities and climate factors compared to its previous state? Were the Walser people really the
first occupants, which not only used but also altered and shaped the valley’s landscape?
These questions seek to be answered by investigating peat cores from mires in the Kleinwalser
Valley, using a combination of geochemical proxies and pollen analysis, coupled with
radiocarbon dating to compare the acquired data to relevant studies.
4.1.1 Geographical and geological setting (Kleinwalser Valley)
Although it is part of the federal state of Vorarlberg in north-western Austria, the Kleinwalser
Valley is not directly connected to the rest of the country by a road (Figure 5). Most of its area
is situated in the lower montane zone but connects the higher altitudes with the Alpine Foreland
in the north. The valley is located at the junction of the geological units of Northern Limestone
Alps, Flysch and Helvetikum (Völk, 2001). While the valley floor is located between 1086 and
1215 m a.s.l., it is framed by mountains rising well over 2000 m a.s.l.: At its southern end, the
Great Widderstein (2533 m a.s.l.) is the highest peak, which belongs to the main dolomite of the
Upper Triassic, while the eastern slopes with the Fellhorn (2083 m a.s.l.) belong to the Flysch
Nappes of mainly the Upper Cretaceous (Völk, 2001). The latter are striking north-east to south-
west and their northern boundary to the Helvetic Nappes is roughly drawn by the river
Schwarzwasser before it joins the river Breitach close to the village of Riezlern. The Breitach is
then continuing this geological line before it enters the river Iller at Oberstdorf (see Figure 5 for
orientation). Flysch is a rather soft rock formation, which is composed of interchanging layers of
sandstone and marl. The silicate rich products of weathering and erosion are probably the major
natural source of lithogenic elements like Ti, Zr, Rb, Fe, Mn, and Pb in local sediments. However,
silicate rich layers with a higher proportion of sand, silt and clay can be found within the Helvetic
Nappes as well, of which the sub-formation Schrattenkalk is part of as well. This competent
lower Cretaceous limestone formation is responsible for the prominent morphology of Hoher
Ifen (2230 m a.s.l.) and forms the highly karstified Gottesacker plateau to its north. As a
consequence, several karstic cave systems exist in the study area on the north-western flank of
the valley, resulting in a complex hydrology (Goldscheider, 1998).
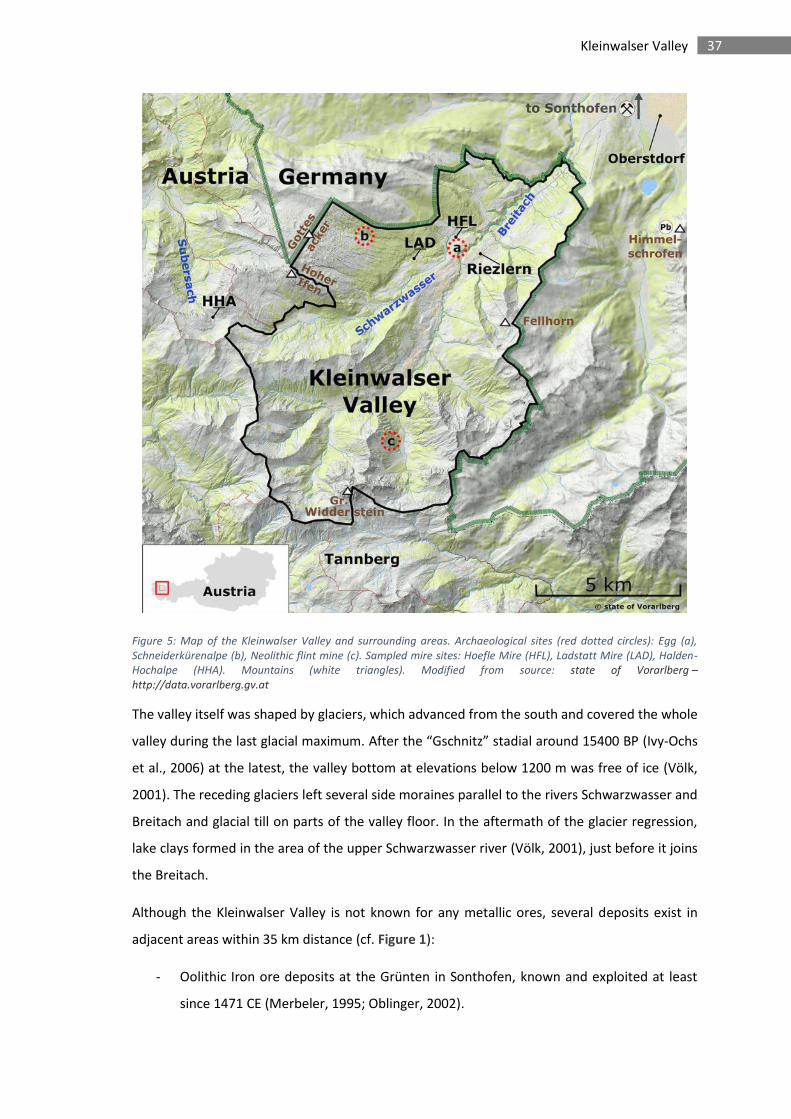
37 Kleinwalser Valley
Figure 5: Map of the Kleinwalser Valley and surrounding areas. Archaeological sites (red dotted circles): Egg (a),
Schneiderkürenalpe (b), Neolithic flint mine (c). Sampled mire sites: Hoefle Mire (HFL), Ladstatt Mire (LAD), Halden-
Hochalpe (HHA). Mountains (white triangles). Modified from source: state of Vorarlberg –
http://data.vorarlberg.gv.at
The valley itself was shaped by glaciers, which advanced from the south and covered the whole
valley during the last glacial maximum. After the “Gschnitz” stadial around 15400 BP (Ivy-Ochs
et al., 2006) at the latest, the valley bottom at elevations below 1200 m was free of ice (Völk,
2001). The receding glaciers left several side moraines parallel to the rivers Schwarzwasser and
Breitach and glacial till on parts of the valley floor. In the aftermath of the glacier regression,
lake clays formed in the area of the upper Schwarzwasser river (Völk, 2001), just before it joins
the Breitach.
Although the Kleinwalser Valley is not known for any metallic ores, several deposits exist in
adjacent areas within 35 km distance (cf. Figure 1):
- Oolithic Iron ore deposits at the Grünten in Sonthofen, known and exploited at least
since 1471 CE (Merbeler, 1995; Oblinger, 2002).
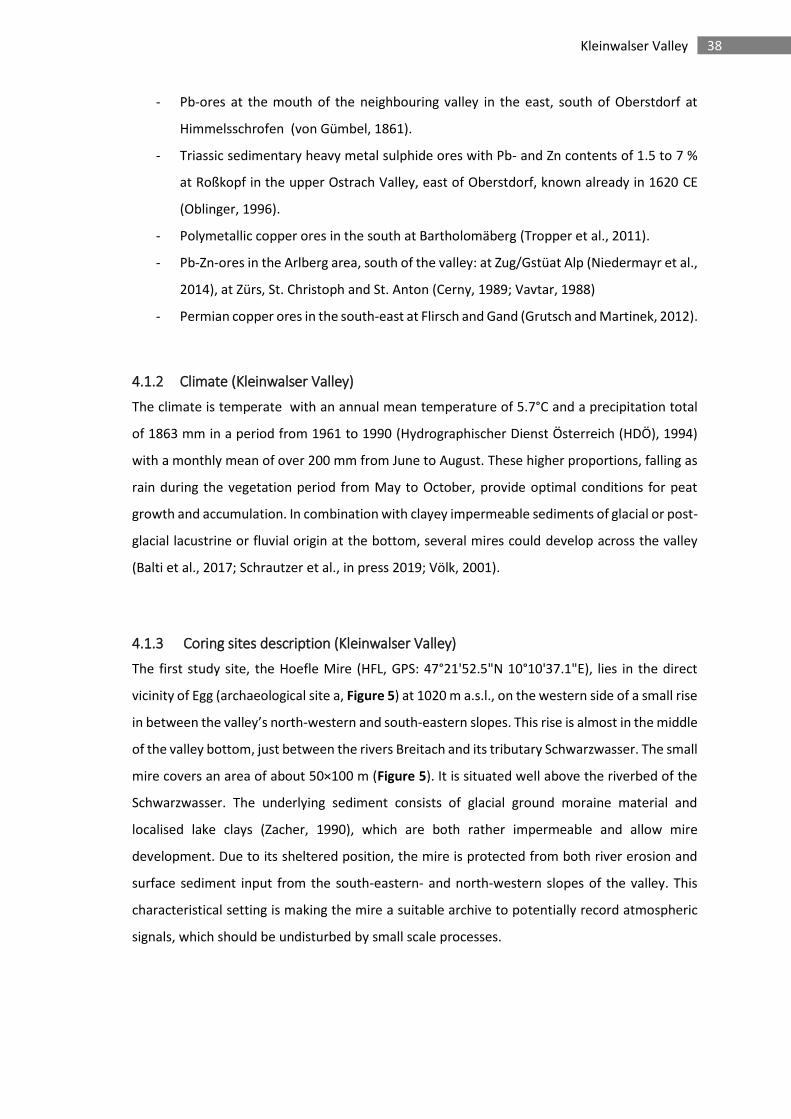
38 Kleinwalser Valley
- Pb-ores at the mouth of the neighbouring valley in the east, south of Oberstdorf at
Himmelsschrofen (von Gümbel, 1861).
- Triassic sedimentary heavy metal sulphide ores with Pb- and Zn contents of 1.5 to 7 %
at Roßkopf in the upper Ostrach Valley, east of Oberstdorf, known already in 1620 CE
(Oblinger, 1996).
- Polymetallic copper ores in the south at Bartholomäberg (Tropper et al., 2011).
- Pb-Zn-ores in the Arlberg area, south of the valley: at Zug/Gstüat Alp (Niedermayr et al.,
2014), at Zürs, St. Christoph and St. Anton (Cerny, 1989; Vavtar, 1988)
- Permian copper ores in the south-east at Flirsch and Gand (Grutsch and Martinek, 2012).
4.1.2 Climate (Kleinwalser Valley)
The climate is temperate with an annual mean temperature of 5.7°C and a precipitation total
of 1863 mm in a period from 1961 to 1990 (Hydrographischer Dienst Österreich (HDÖ), 1994)
with a monthly mean of over 200 mm from June to August. These higher proportions, falling as
rain during the vegetation period from May to October, provide optimal conditions for peat
growth and accumulation. In combination with clayey impermeable sediments of glacial or post-
glacial lacustrine or fluvial origin at the bottom, several mires could develop across the valley
(Balti et al., 2017; Schrautzer et al., in press 2019; Völk, 2001).
4.1.3 Coring sites description (Kleinwalser Valley)
The first study site, the Hoefle Mire (HFL, GPS: 47°21'52.5"N 10°10'37.1"E), lies in the direct
vicinity of Egg (archaeological site a, Figure 5) at 1020 m a.s.l., on the western side of a small rise
in between the valley’s north-western and south-eastern slopes. This rise is almost in the middle
of the valley bottom, just between the rivers Breitach and its tributary Schwarzwasser. The small
mire covers an area of about 50×100 m (Figure 5). It is situated well above the riverbed of the
Schwarzwasser. The underlying sediment consists of glacial ground moraine material and
localised lake clays (Zacher, 1990), which are both rather impermeable and allow mire
development. Due to its sheltered position, the mire is protected from both river erosion and
surface sediment input from the south-eastern- and north-western slopes of the valley. This
characteristical setting is making the mire a suitable archive to potentially record atmospheric
signals, which should be undisturbed by small scale processes.
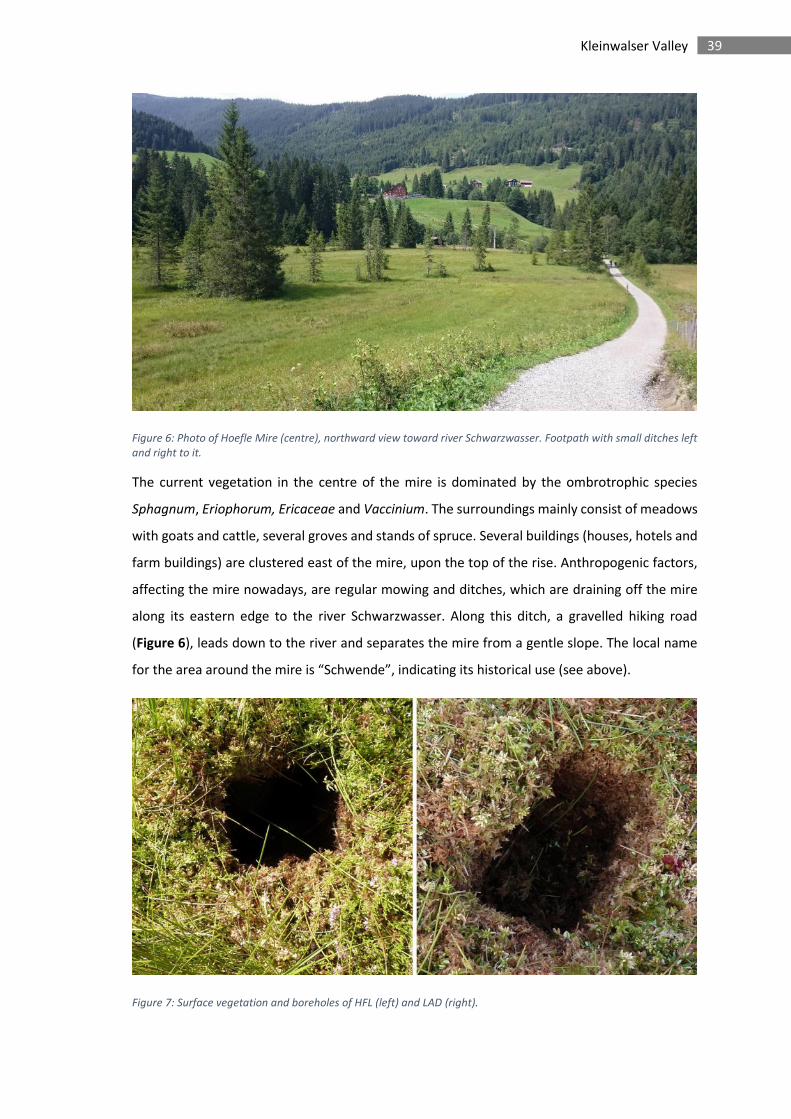
39 Kleinwalser Valley
Figure 6: Photo of Hoefle Mire (centre), northward view toward river Schwarzwasser. Footpath with small ditches left
and right to it.
The current vegetation in the centre of the mire is dominated by the ombrotrophic species
Sphagnum, Eriophorum, Ericaceae and Vaccinium. The surroundings mainly consist of meadows
with goats and cattle, several groves and stands of spruce. Several buildings (houses, hotels and
farm buildings) are clustered east of the mire, upon the top of the rise. Anthropogenic factors,
affecting the mire nowadays, are regular mowing and ditches, which are draining off the mire
along its eastern edge to the river Schwarzwasser. Along this ditch, a gravelled hiking road
(Figure 6), leads down to the river and separates the mire from a gentle slope. The local name
for the area around the mire is “Schwende”, indicating its historical use (see above).
Figure 7: Surface vegetation and boreholes of HFL (left) and LAD (right).
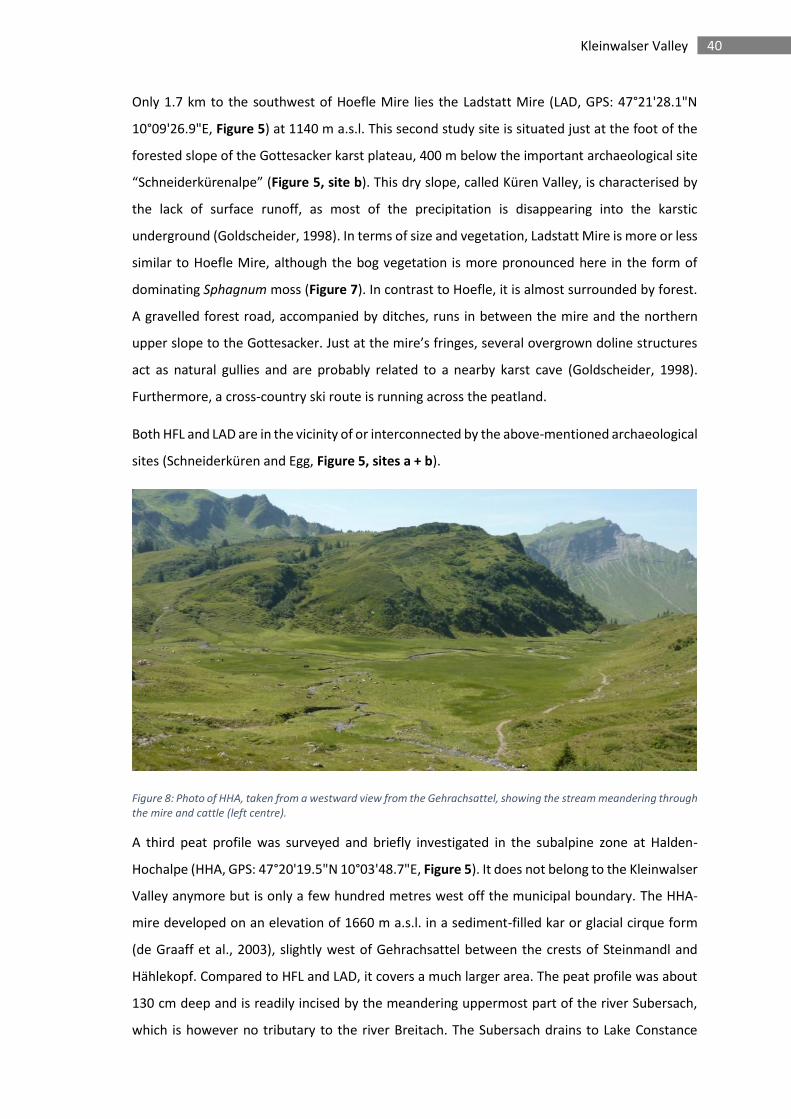
40 Kleinwalser Valley
Only 1.7 km to the southwest of Hoefle Mire lies the Ladstatt Mire (LAD, GPS: 47°21'28.1"N
10°09'26.9"E, Figure 5) at 1140 m a.s.l. This second study site is situated just at the foot of the
forested slope of the Gottesacker karst plateau, 400 m below the important archaeological site
“Schneiderkürenalpe” (Figure 5, site b). This dry slope, called Küren Valley, is characterised by
the lack of surface runoff, as most of the precipitation is disappearing into the karstic
underground (Goldscheider, 1998). In terms of size and vegetation, Ladstatt Mire is more or less
similar to Hoefle Mire, although the bog vegetation is more pronounced here in the form of
dominating Sphagnum moss (Figure 7). In contrast to Hoefle, it is almost surrounded by forest.
A gravelled forest road, accompanied by ditches, runs in between the mire and the northern
upper slope to the Gottesacker. Just at the mire’s fringes, several overgrown doline structures
act as natural gullies and are probably related to a nearby karst cave (Goldscheider, 1998).
Furthermore, a cross-country ski route is running across the peatland.
Both HFL and LAD are in the vicinity of or interconnected by the above-mentioned archaeological
sites (Schneiderküren and Egg, Figure 5, sites a + b).
Figure 8: Photo of HHA, taken from a westward view from the Gehrachsattel, showing the stream meandering through
the mire and cattle (left centre).
A third peat profile was surveyed and briefly investigated in the subalpine zone at Halden-
Hochalpe (HHA, GPS: 47°20'19.5"N 10°03'48.7"E, Figure 5). It does not belong to the Kleinwalser
Valley anymore but is only a few hundred metres west off the municipal boundary. The HHA-
mire developed on an elevation of 1660 m a.s.l. in a sediment-filled kar or glacial cirque form
(de Graaff et al., 2003), slightly west of Gehrachsattel between the crests of Steinmandl and
Hählekopf. Compared to HFL and LAD, it covers a much larger area. The peat profile was about
130 cm deep and is readily incised by the meandering uppermost part of the river Subersach,
which is however no tributary to the river Breitach. The Subersach drains to Lake Constance
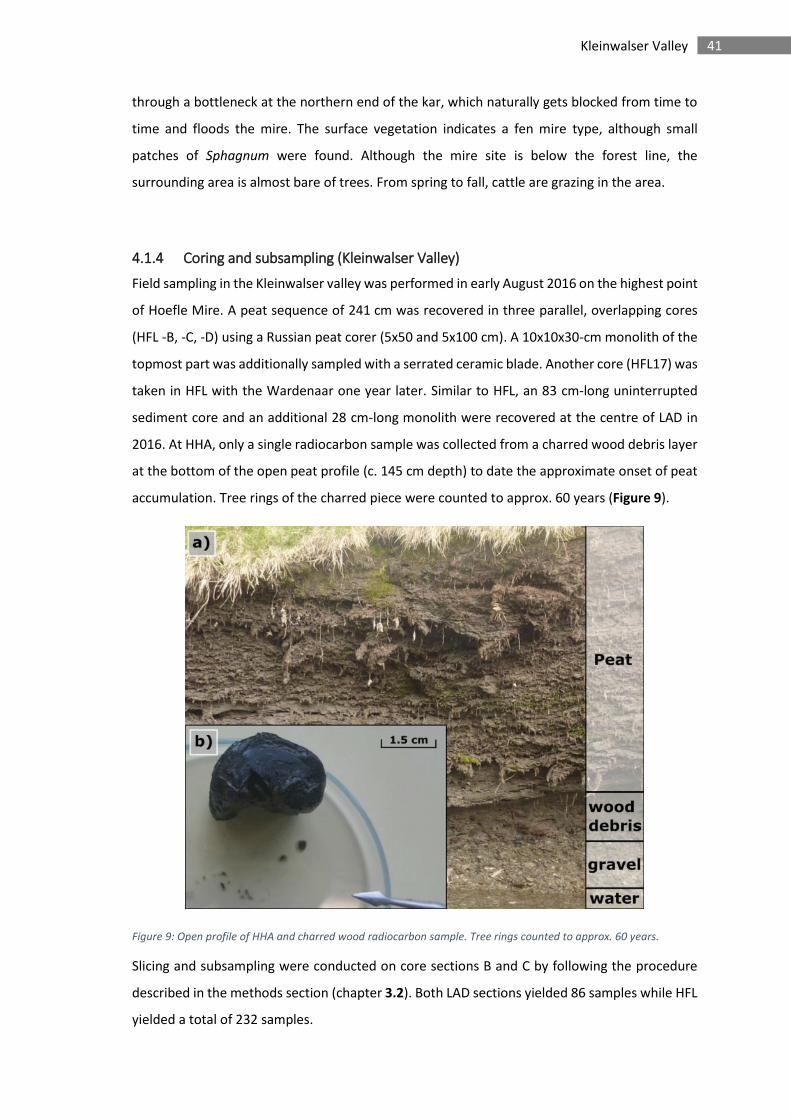
41 Kleinwalser Valley
through a bottleneck at the northern end of the kar, which naturally gets blocked from time to
time and floods the mire. The surface vegetation indicates a fen mire type, although small
patches of Sphagnum were found. Although the mire site is below the forest line, the
surrounding area is almost bare of trees. From spring to fall, cattle are grazing in the area.
4.1.4 Coring and subsampling (Kleinwalser Valley)
Field sampling in the Kleinwalser valley was performed in early August 2016 on the highest point
of Hoefle Mire. A peat sequence of 241 cm was recovered in three parallel, overlapping cores
(HFL -B, -C, -D) using a Russian peat corer (5x50 and 5x100 cm). A 10x10x30-cm monolith of the
topmost part was additionally sampled with a serrated ceramic blade. Another core (HFL17) was
taken in HFL with the Wardenaar one year later. Similar to HFL, an 83 cm-long uninterrupted
sediment core and an additional 28 cm-long monolith were recovered at the centre of LAD in
2016. At HHA, only a single radiocarbon sample was collected from a charred wood debris layer
at the bottom of the open peat profile (c. 145 cm depth) to date the approximate onset of peat
accumulation. Tree rings of the charred piece were counted to approx. 60 years (Figure 9).
Figure 9: Open profile of HHA and charred wood radiocarbon sample. Tree rings counted to approx. 60 years.
Slicing and subsampling were conducted on core sections B and C by following the procedure
described in the methods section (chapter 3.2). Both LAD sections yielded 86 samples while HFL
yielded a total of 232 samples.
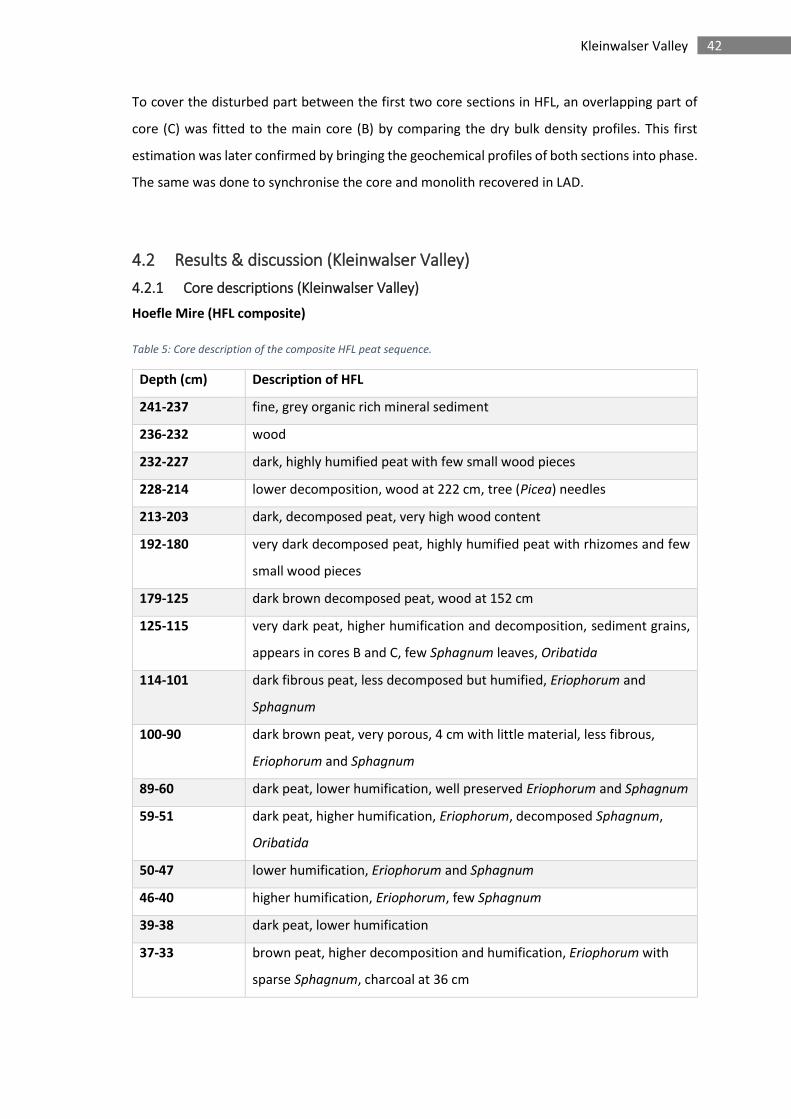
42 Kleinwalser Valley
To cover the disturbed part between the first two core sections in HFL, an overlapping part of
core (C) was fitted to the main core (B) by comparing the dry bulk density profiles. This first
estimation was later confirmed by bringing the geochemical profiles of both sections into phase.
The same was done to synchronise the core and monolith recovered in LAD.
4.2 Results & discussion (Kleinwalser Valley)
4.2.1 Core descriptions (Kleinwalser Valley)
Hoefle Mire (HFL composite)
Table 5: Core description of the composite HFL peat sequence.
Depth (cm) Description of HFL
241-237 fine, grey organic rich mineral sediment
236-232 wood
232-227 dark, highly humified peat with few small wood pieces
228-214 lower decomposition, wood at 222 cm, tree (Picea) needles
213-203 dark, decomposed peat, very high wood content
192-180 very dark decomposed peat, highly humified peat with rhizomes and few
small wood pieces
179-125 dark brown decomposed peat, wood at 152 cm
125-115 very dark peat, higher humification and decomposition, sediment grains,
appears in cores B and C, few Sphagnum leaves, Oribatida
114-101 dark fibrous peat, less decomposed but humified, Eriophorum and
Sphagnum
100-90 dark brown peat, very porous, 4 cm with little material, less fibrous,
Eriophorum and Sphagnum
89-60 dark peat, lower humification, well preserved Eriophorum and Sphagnum
59-51 dark peat, higher humification, Eriophorum, decomposed Sphagnum,
Oribatida
50-47 lower humification, Eriophorum and Sphagnum
46-40 higher humification, Eriophorum, few Sphagnum
39-38 dark peat, lower humification
37-33 brown peat, higher decomposition and humification, Eriophorum with
sparse Sphagnum, charcoal at 36 cm
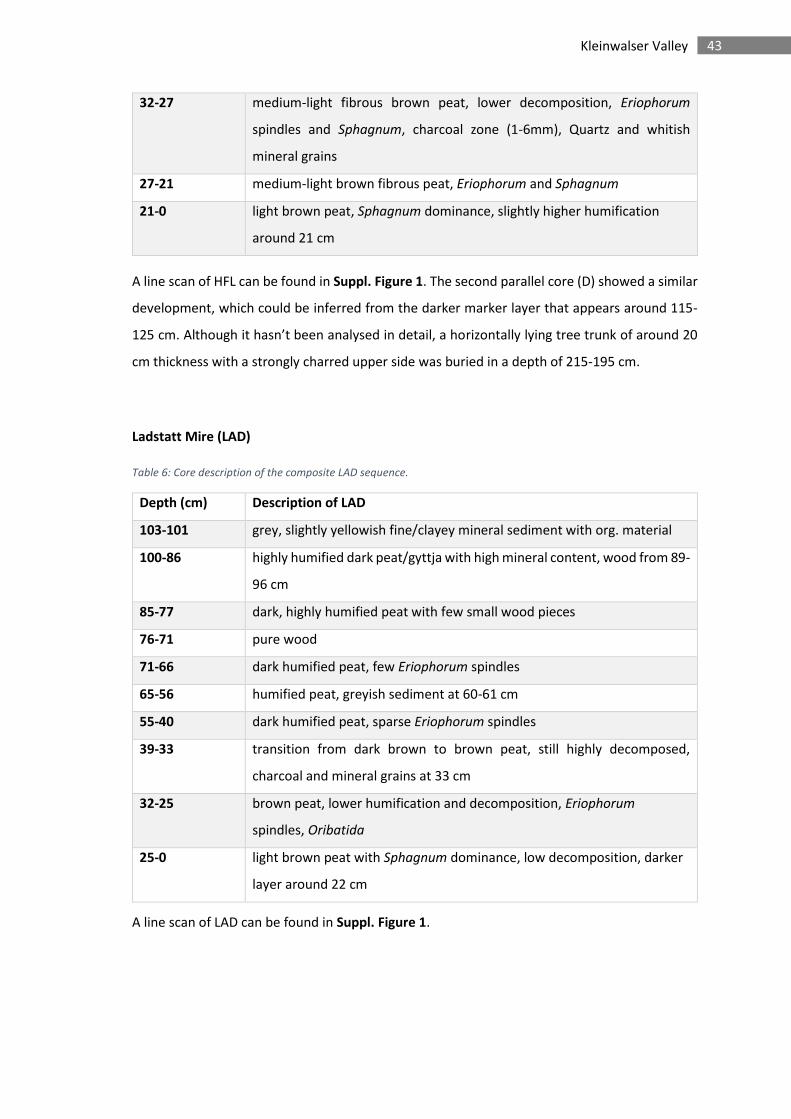
43 Kleinwalser Valley
32-27 medium-light fibrous brown peat, lower decomposition, Eriophorum
spindles and Sphagnum, charcoal zone (1-6mm), Quartz and whitish
mineral grains
27-21 medium-light brown fibrous peat, Eriophorum and Sphagnum
21-0 light brown peat, Sphagnum dominance, slightly higher humification
around 21 cm
A line scan of HFL can be found in Suppl. Figure 1. The second parallel core (D) showed a similar
development, which could be inferred from the darker marker layer that appears around 115-
125 cm. Although it hasn’t been analysed in detail, a horizontally lying tree trunk of around 20
cm thickness with a strongly charred upper side was buried in a depth of 215-195 cm.
Ladstatt Mire (LAD)
Table 6: Core description of the composite LAD sequence.
Depth (cm) Description of LAD
103-101 grey, slightly yellowish fine/clayey mineral sediment with org. material
100-86 highly humified dark peat/gyttja with high mineral content, wood from 89-
96 cm
85-77 dark, highly humified peat with few small wood pieces
76-71 pure wood
71-66 dark humified peat, few Eriophorum spindles
65-56 humified peat, greyish sediment at 60-61 cm
55-40 dark humified peat, sparse Eriophorum spindles
39-33 transition from dark brown to brown peat, still highly decomposed,
charcoal and mineral grains at 33 cm
32-25 brown peat, lower humification and decomposition, Eriophorum
spindles, Oribatida
25-0 light brown peat with Sphagnum dominance, low decomposition, darker
layer around 22 cm
A line scan of LAD can be found in Suppl. Figure 1.
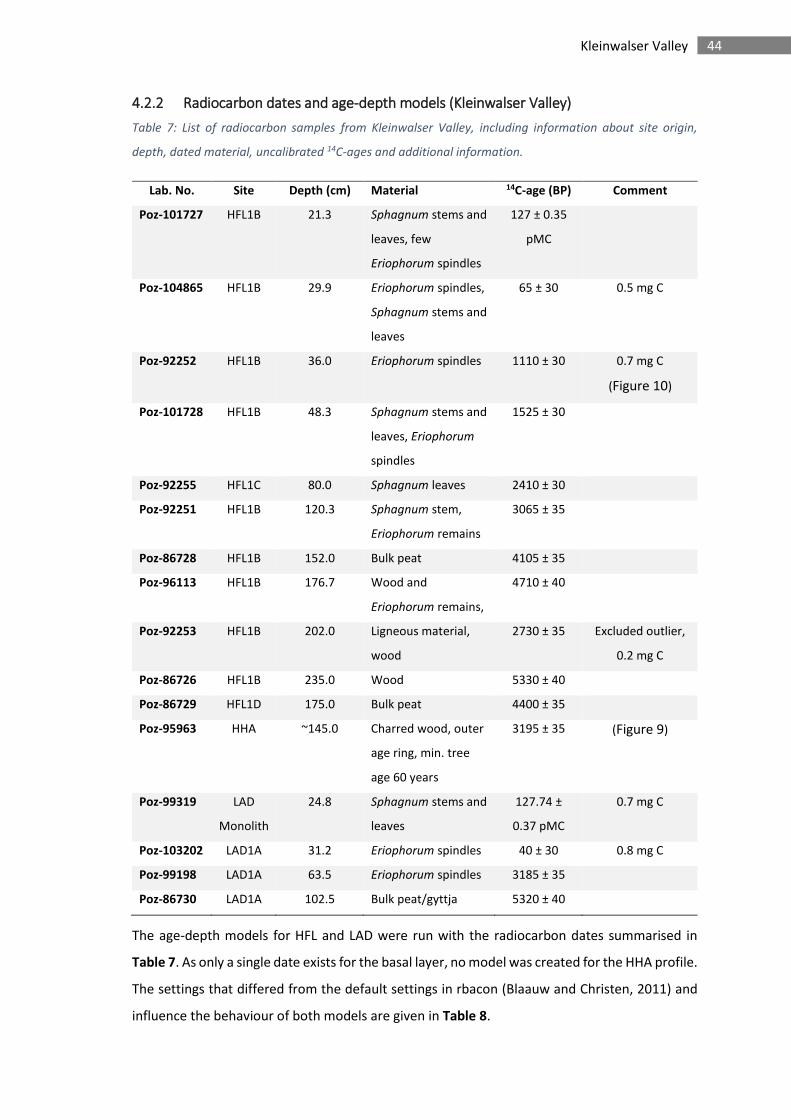
44 Kleinwalser Valley
4.2.2 Radiocarbon dates and age-depth models (Kleinwalser Valley)
Table 7: List of radiocarbon samples from Kleinwalser Valley, including information about site origin,
depth, dated material, uncalibrated 14C-ages and additional information.
Lab. No. Site Depth (cm) Material 14C-age (BP) Comment
Poz-101727 HFL1B 21.3 Sphagnum stems and
leaves, few
Eriophorum spindles
127 ± 0.35
pMC
Poz-104865 HFL1B 29.9 Eriophorum spindles,
Sphagnum stems and
leaves
65 ± 30 0.5 mg C
Poz-92252 HFL1B 36.0 Eriophorum spindles 1110 ± 30 0.7 mg C
(Figure 10)
Poz-101728 HFL1B 48.3 Sphagnum stems and
leaves, Eriophorum
spindles
1525 ± 30
Poz-92255 HFL1C 80.0 Sphagnum leaves 2410 ± 30
Poz-92251 HFL1B 120.3 Sphagnum stem,
Eriophorum remains
3065 ± 35
Poz-86728 HFL1B 152.0 Bulk peat 4105 ± 35
Poz-96113 HFL1B 176.7 Wood and
Eriophorum remains,
4710 ± 40
Poz-92253 HFL1B 202.0 Ligneous material,
wood
2730 ± 35 Excluded outlier,
0.2 mg C
Poz-86726 HFL1B 235.0 Wood 5330 ± 40
Poz-86729 HFL1D 175.0 Bulk peat 4400 ± 35
Poz-95963 HHA ~145.0 Charred wood, outer
age ring, min. tree
age 60 years
3195 ± 35 (Figure 9)
Poz-99319 LAD
Monolith
24.8 Sphagnum stems and
leaves
127.74 ±
0.37 pMC
0.7 mg C
Poz-103202 LAD1A 31.2 Eriophorum spindles 40 ± 30 0.8 mg C
Poz-99198 LAD1A 63.5 Eriophorum spindles 3185 ± 35
Poz-86730 LAD1A 102.5 Bulk peat/gyttja 5320 ± 40
The age-depth models for HFL and LAD were run with the radiocarbon dates summarised in
Table 7. As only a single date exists for the basal layer, no model was created for the HHA profile.
The settings that differed from the default settings in rbacon (Blaauw and Christen, 2011) and
influence the behaviour of both models are given in Table 8.
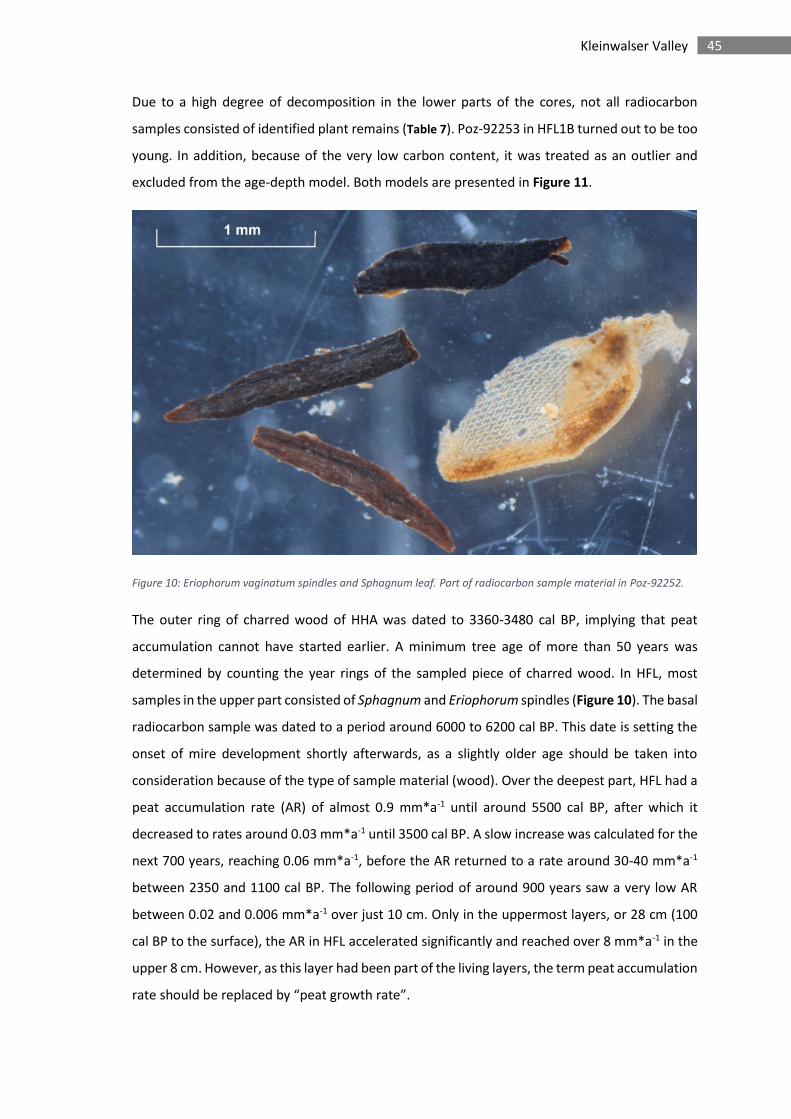
45 Kleinwalser Valley
Due to a high degree of decomposition in the lower parts of the cores, not all radiocarbon
samples consisted of identified plant remains (Table 7). Poz-92253 in HFL1B turned out to be too
young. In addition, because of the very low carbon content, it was treated as an outlier and
excluded from the age-depth model. Both models are presented in Figure 11.
Figure 10: Eriophorum vaginatum spindles and Sphagnum leaf. Part of radiocarbon sample material in Poz-92252.
The outer ring of charred wood of HHA was dated to 3360-3480 cal BP, implying that peat
accumulation cannot have started earlier. A minimum tree age of more than 50 years was
determined by counting the year rings of the sampled piece of charred wood. In HFL, most
samples in the upper part consisted of Sphagnum and Eriophorum spindles (Figure 10). The basal
radiocarbon sample was dated to a period around 6000 to 6200 cal BP. This date is setting the
onset of mire development shortly afterwards, as a slightly older age should be taken into
consideration because of the type of sample material (wood). Over the deepest part, HFL had a
peat accumulation rate (AR) of almost 0.9 mm*a-1 until around 5500 cal BP, after which it
decreased to rates around 0.03 mm*a-1 until 3500 cal BP. A slow increase was calculated for the
next 700 years, reaching 0.06 mm*a-1, before the AR returned to a rate around 30-40 mm*a-1
between 2350 and 1100 cal BP. The following period of around 900 years saw a very low AR
between 0.02 and 0.006 mm*a-1 over just 10 cm. Only in the uppermost layers, or 28 cm (100
cal BP to the surface), the AR in HFL accelerated significantly and reached over 8 mm*a-1 in the
upper 8 cm. However, as this layer had been part of the living layers, the term peat accumulation
rate should be replaced by “peat growth rate”.
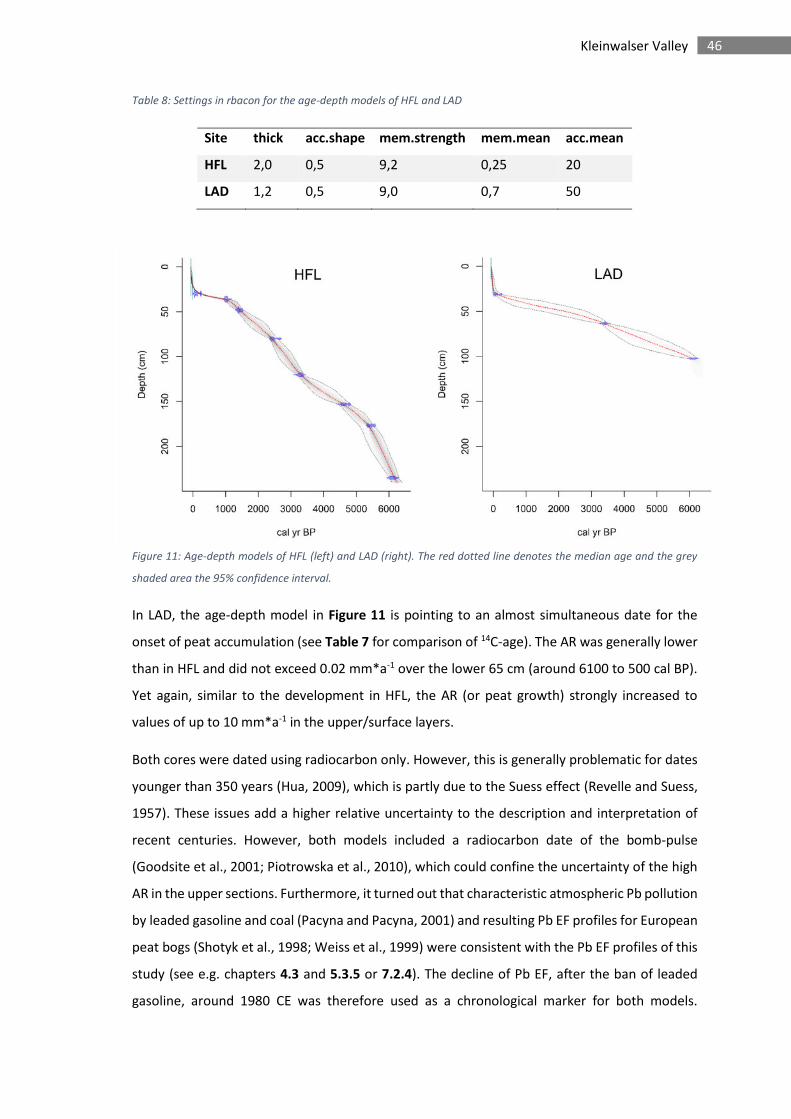
46 Kleinwalser Valley
Table 8: Settings in rbacon for the age-depth models of HFL and LAD
Site thick acc.shape mem.strength mem.mean acc.mean
HFL 2,0 0,5 9,2 0,25 20
LAD 1,2 0,5 9,0 0,7 50
Figure 11: Age-depth models of HFL (left) and LAD (right). The red dotted line denotes the median age and the grey
shaded area the 95% confidence interval.
In LAD, the age-depth model in Figure 11 is pointing to an almost simultaneous date for the
onset of peat accumulation (see Table 7 for comparison of 14C-age). The AR was generally lower
than in HFL and did not exceed 0.02 mm*a-1 over the lower 65 cm (around 6100 to 500 cal BP).
Yet again, similar to the development in HFL, the AR (or peat growth) strongly increased to
values of up to 10 mm*a-1 in the upper/surface layers.
Both cores were dated using radiocarbon only. However, this is generally problematic for dates
younger than 350 years (Hua, 2009), which is partly due to the Suess effect (Revelle and Suess,
1957). These issues add a higher relative uncertainty to the description and interpretation of
recent centuries. However, both models included a radiocarbon date of the bomb-pulse
(Goodsite et al., 2001; Piotrowska et al., 2010), which could confine the uncertainty of the high
AR in the upper sections. Furthermore, it turned out that characteristic atmospheric Pb pollution
by leaded gasoline and coal (Pacyna and Pacyna, 2001) and resulting Pb EF profiles for European
peat bogs (Shotyk et al., 1998; Weiss et al., 1999) were consistent with the Pb EF profiles of this
study (see e.g. chapters 4.3 and 5.3.5 or 7.2.4). The decline of Pb EF, after the ban of leaded
gasoline, around 1980 CE was therefore used as a chronological marker for both models.
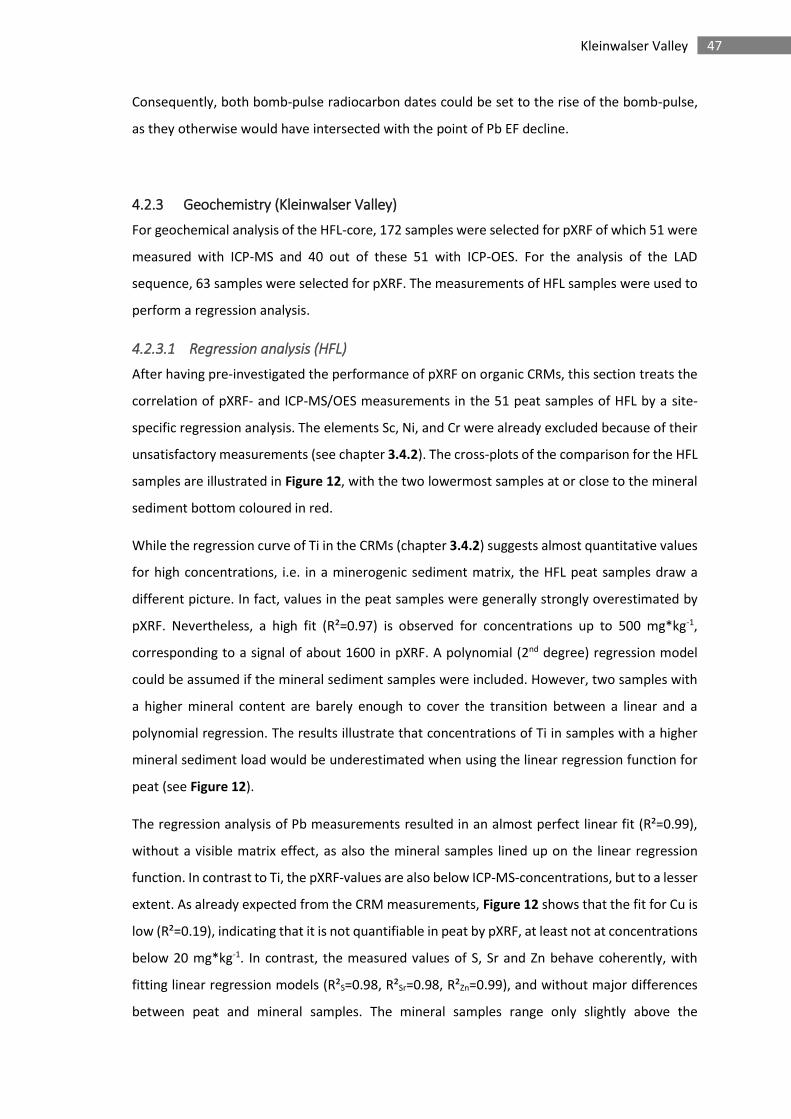
47 Kleinwalser Valley
Consequently, both bomb-pulse radiocarbon dates could be set to the rise of the bomb-pulse,
as they otherwise would have intersected with the point of Pb EF decline.
4.2.3 Geochemistry (Kleinwalser Valley)
For geochemical analysis of the HFL-core, 172 samples were selected for pXRF of which 51 were
measured with ICP-MS and 40 out of these 51 with ICP-OES. For the analysis of the LAD
sequence, 63 samples were selected for pXRF. The measurements of HFL samples were used to
perform a regression analysis.
4.2.3.1 Regression analysis (HFL)
After having pre-investigated the performance of pXRF on organic CRMs, this section treats the
correlation of pXRF- and ICP-MS/OES measurements in the 51 peat samples of HFL by a site-
specific regression analysis. The elements Sc, Ni, and Cr were already excluded because of their
unsatisfactory measurements (see chapter 3.4.2). The cross-plots of the comparison for the HFL
samples are illustrated in Figure 12, with the two lowermost samples at or close to the mineral
sediment bottom coloured in red.
While the regression curve of Ti in the CRMs (chapter 3.4.2) suggests almost quantitative values
for high concentrations, i.e. in a minerogenic sediment matrix, the HFL peat samples draw a
different picture. In fact, values in the peat samples were generally strongly overestimated by
pXRF. Nevertheless, a high fit (R²=0.97) is observed for concentrations up to 500 mg*kg-1,
corresponding to a signal of about 1600 in pXRF. A polynomial (2nd degree) regression model
could be assumed if the mineral sediment samples were included. However, two samples with
a higher mineral content are barely enough to cover the transition between a linear and a
polynomial regression. The results illustrate that concentrations of Ti in samples with a higher
mineral sediment load would be underestimated when using the linear regression function for
peat (see Figure 12).
The regression analysis of Pb measurements resulted in an almost perfect linear fit (R²=0.99),
without a visible matrix effect, as also the mineral samples lined up on the linear regression
function. In contrast to Ti, the pXRF-values are also below ICP-MS-concentrations, but to a lesser
extent. As already expected from the CRM measurements, Figure 12 shows that the fit for Cu is
low (R²=0.19), indicating that it is not quantifiable in peat by pXRF, at least not at concentrations
below 20 mg*kg-1. In contrast, the measured values of S, Sr and Zn behave coherently, with
fitting linear regression models (R²S=0.98, R²Sr=0.98, R²Zn=0.99), and without major differences
between peat and mineral samples. The mineral samples range only slightly above the
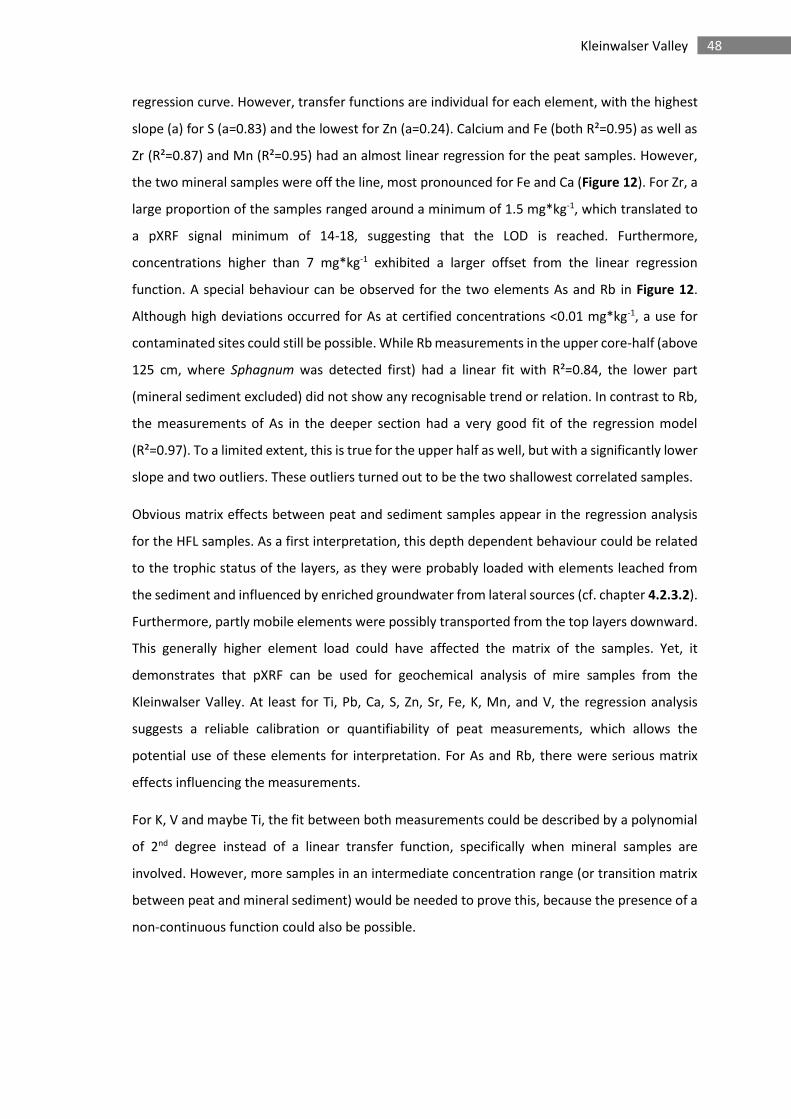
48 Kleinwalser Valley
regression curve. However, transfer functions are individual for each element, with the highest
slope (a) for S (a=0.83) and the lowest for Zn (a=0.24). Calcium and Fe (both R²=0.95) as well as
Zr (R²=0.87) and Mn (R²=0.95) had an almost linear regression for the peat samples. However,
the two mineral samples were off the line, most pronounced for Fe and Ca (Figure 12). For Zr, a
large proportion of the samples ranged around a minimum of 1.5 mg*kg-1, which translated to
a pXRF signal minimum of 14-18, suggesting that the LOD is reached. Furthermore,
concentrations higher than 7 mg*kg-1 exhibited a larger offset from the linear regression
function. A special behaviour can be observed for the two elements As and Rb in Figure 12.
Although high deviations occurred for As at certified concentrations <0.01 mg*kg-1, a use for
contaminated sites could still be possible. While Rb measurements in the upper core-half (above
125 cm, where Sphagnum was detected first) had a linear fit with R²=0.84, the lower part
(mineral sediment excluded) did not show any recognisable trend or relation. In contrast to Rb,
the measurements of As in the deeper section had a very good fit of the regression model
(R²=0.97). To a limited extent, this is true for the upper half as well, but with a significantly lower
slope and two outliers. These outliers turned out to be the two shallowest correlated samples.
Obvious matrix effects between peat and sediment samples appear in the regression analysis
for the HFL samples. As a first interpretation, this depth dependent behaviour could be related
to the trophic status of the layers, as they were probably loaded with elements leached from
the sediment and influenced by enriched groundwater from lateral sources (cf. chapter 4.2.3.2).
Furthermore, partly mobile elements were possibly transported from the top layers downward.
This generally higher element load could have affected the matrix of the samples. Yet, it
demonstrates that pXRF can be used for geochemical analysis of mire samples from the
Kleinwalser Valley. At least for Ti, Pb, Ca, S, Zn, Sr, Fe, K, Mn, and V, the regression analysis
suggests a reliable calibration or quantifiability of peat measurements, which allows the
potential use of these elements for interpretation. For As and Rb, there were serious matrix
effects influencing the measurements.
For K, V and maybe Ti, the fit between both measurements could be described by a polynomial
of 2nd degree instead of a linear transfer function, specifically when mineral samples are
involved. However, more samples in an intermediate concentration range (or transition matrix
between peat and mineral sediment) would be needed to prove this, because the presence of a
non-continuous function could also be possible.
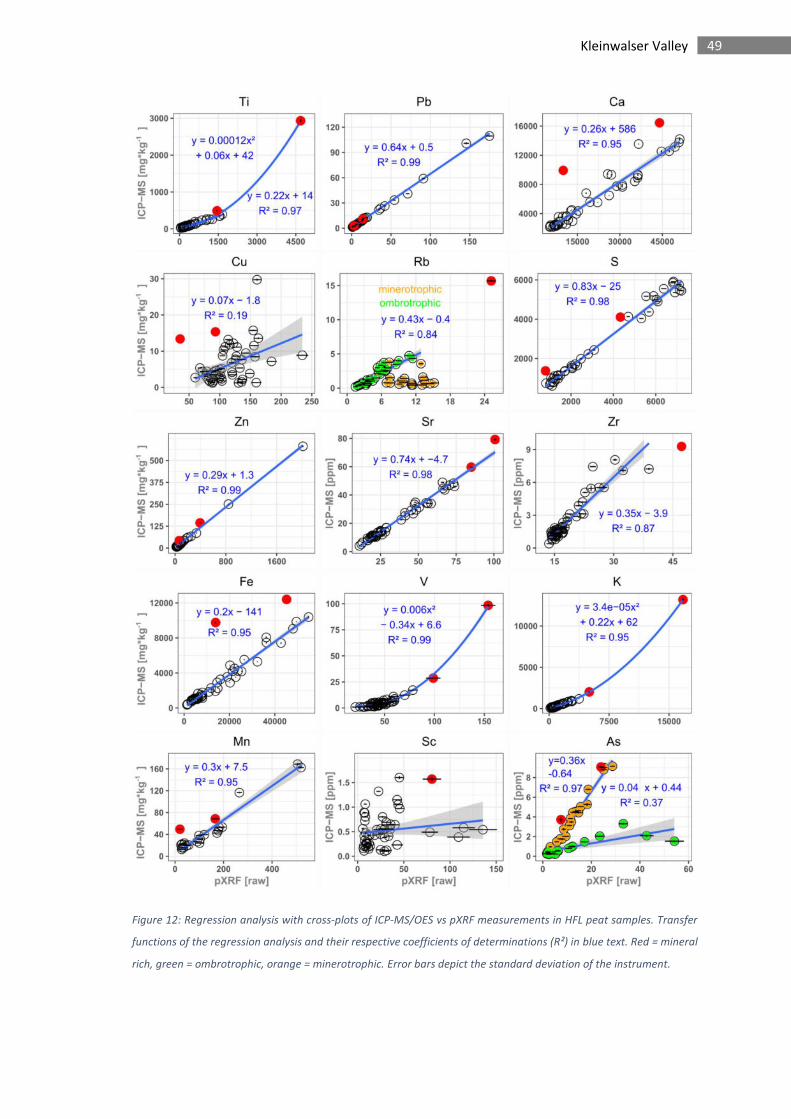
49 Kleinwalser Valley
Figure 12: Regression analysis with cross-plots of ICP-MS/OES vs pXRF measurements in HFL peat samples. Transfer
functions of the regression analysis and their respective coefficients of determinations (R²) in blue text. Red = mineral
rich, green = ombrotrophic, orange = minerotrophic. Error bars depict the standard deviation of the instrument.
50 Kleinwalser Valley
4.2.3.2 Elemental profiles in HFL
Before interpreting the elemental concentration profiles versus age regarding climate and
human impact in the valley, this chapter describes element concentration profiles versus depth
in Figure 13. First, in order to get an idea about the behaviour of each element with depth and
second, because data points in the uppermost part would be indistinguishable due to their
characteristical age-depth relations. If not indicated otherwise, all profiles are based on the pXRF
measurements which were transformed into concentrations by their respective transfer
functions (Figure 12). The errors of all pXRF measurements were transformed in the same way.
At first, the matrix effect is illustrated by Ca (Figure 13) where the bottom sediment
concentrations could not be calibrated with the transfer function given in Figure 12. The true
concentration (from ICP-MS) for the bottom sample is 10,000 (red-curve) instead of the
estimated 3000 mg*kg-1 (blue-curve). To a lesser extent, this underestimation also affects the
following three samples (cf. outliers of Ca in Figure 12). A similar behaviour can be observed in
the Fe-profile. Also, for Ti, Mn and Zr, the lowermost four samples are biased by an insufficient
depiction of mineral samples by the linear transfer functions.
Ca: Concentrations in the deeper peat samples (>175 cm) are still higher than in the mineral
sediment base. They decrease continuously from >14000 mg*kg-1 at 225 cm to below 6000
mg*kg-1 at around 122 cm. Above, the concentrations go below 4000 mg*kg-1 and to around
2500 mg*kg-1 in the upper 65 cm. The fact that the surface sample differentiates from the others
can be explained by its function as a biologically cycled macronutrient in vegetation. Taking all
of these observations into account, or can be stated that they suggest a post-depositional
leaching, which leads to an enrichment of Ca in the deeper peat layers (e.g. Shotyk, 1988).
Fe: Iron shows the same trends as Ca. It declines from over 10000 mg*kg-1 and keeps a level of
around 1000 mg*kg-1, interrupted only by a short increase to 3000 mg*kg-1 around 16 cm.
Sr: Not being affected by the matrix effect, Sr behaves similarly to Ca and Fe, with 70 mg*kg-1
at the bottom, decreasing towards 122 cm and keeping a level of 10 to 20 mg*kg-1 above.
S: Sulphur is very low in the mineral sample (500 mg*kg-1) but high in the peat layers up to 122
cm (4000 to 6000 mg*kg-1). An abrupt drop to less than 2000 mg*kg-1 was recorded until a
temporary rising trend at 50 cm and a climax at 25 cm (3000 mg*kg-1). Despite its generally
mobile character in peat (Novák et al., 2005), the comparison to the core-description shows that
a higher decomposition and humification could be related to a higher S content. This would be
in line with Lowe and Bustin (1985), who observed a positive correlation between
decomposition and S-content in peat.
51 Kleinwalser Valley
Mn: The profile of Mn is below the LOD (around 12 mg*kg-1) between 140 and 21 cm. As a
micronutrient, it strongly increases again in the living vegetation layers.
Cu: The ICP-MS derived concentrations of Cu illustrate its distribution in HFL. They are generally
elevated in the lower part (10-30 mg*kg-1) and decrease to concentrations mostly around the
range of 2 to 5 mg*kg-1 after 130 cm. A stable period of a still low signal from 100 to 50 cm is
followed by a rising trend with a maximum of 10 mg*kg-1 around 24 cm. As the concentrations
are generally above 2 mg*kg-1, larger deviations from the reference (see chapter 3.4.1) should
not be of great significance.
Zn: The concentrations in the deepest layers fluctuate strongly, from 35 to 484 mg*kg-1 and back
to values around 20 mg*kg-1 at 200 cm. Another peak (>100 mg*kg-1) appears from 184 to 181
cm. Afterwards, a slow decline down to 5 to 10 mg*kg-1 continues until 150 cm depth. This level
is kept until 47 cm, with short periods of elevated concentrations over 20 mg*kg-1 at 144 cm and
around 93 cm. Between 47 and 14 cm, a rising trend climaxes with 96 mg*kg-1 but decreases to
29 mg*kg-1 again at the surface.
All the above described elements (Ca, Sr, S, Fe, Mn, Cu and Zn) are elevated in the lower half of
the core, with a generally decreasing trend ending at approximately 122 cm. It is however
difficult to distinguish between an element load that is distributed by downwash from the upper
layers and elements that are transported upward by richer groundwater or originate from
dissolution from peat-mineral interfaces. It can however be stated that a post depositional
redistribution by diagenetic processes is likely for these seven considered elements. As the
decreasing trend of these elements stops at 122 cm, it can be assumed that the influence of
groundwater ends at this point as well. Particularly the markedly decrease of S suggests a change
in the geo-hydro-chemical regime. Already, Brown (1985) and Vitt and Chee (1990) observed
elevated S-concentrations in peat layers with a richer trophic status. The stabilisation on a lower
level above 122 cm points to the transition of HFL from fen to bog, i.e. from minerotrophic to
ombrotrophic or oligotrophic conditions, between 120 and 125 cm. This interpretation of the
Sr-profile was used in other studies as well (Le Roux et al., 2005; Shotyk and Krachler, 2004), and
is supported by the subsequent first appearance of Sphagnum in the macrofossils (chapter 4.2.1)
and pollen record (chapter 4.2.4) of HFL.
Having identified the transition point of mire development, the recorded signals of most
elements should reflect atmospheric input at the time of growth/deposition above 122 cm,
whereas concentrations in the lower part should be considered with caution. Although Cu and
Zn are both micronutrients, they can – like Pb – be used as proxies for past mining and
metallurgic activities in peat records (Martínez Cortizas et al., 2016; Mighall et al., 2002;
52 Kleinwalser Valley
Nieminen et al., 2002). However, Pb can be immobile, even under conditions of a fluctuating
water table (Rothwell et al., 2010), and original deposition signals can be conserved in
minerotrophic peat (Baron et al., 2005; Shotyk, 2002, 1996b). In contrast, Cu and Zn get more
easily mobilised from i.a. adsorption to Sphagnum and Carex peat under certain conditions
(Ringqvist and Öborn, 2002) and could thus be affected by post-depositional redistribution
(Dumontet et al., 1990). This would be even stronger in layers with a higher decomposition or
peat mineralisation (Biester et al., 2012), where they would be released from their bonds to
humic and fulvic substances and thus be available for biological cycling again. The effect of a
much higher competition for binding sites in organic matter of the minerotrophic peat probably
plays a major role as well (Benedetti et al., 1995; Impellitteri et al., 2002; Kinniburgh et al., 1999;
Ma and Tobin, 2003).
Rb: In the second row of Figure 13, both the pXRF and ICP-MS profiles of Rb are shown. Due to
the described issues of pXRF in the deeper part (chapter 4.2.3.1), the red curve (ICP-MS) shows
the real concentrations. The blue curve (pXRF) demonstrates, what the profile would look like if
the linear regression was applied on the whole core. Elevated concentrations (114 mg*kg-1) were
recorded in the mineral sediment, followed by a relatively stable profile until around 45 cm. Only
one noteworthy peak (6 mg*kg-1) appears around the fen to bog transition. Concentrations up
to 4.5 mg*kg-1 show from 60 to 25 cm. Except for lower concentrations around 23 cm and from
14 to 4 cm, the concentrations stay on an elevated level above 10 mg*kg-1.
Ti: The profile of Ti starts with almost 1000 mg*kg-1 in the basal sample, continues on a low level
(20 to 60 mg*kg-1) from 225 to 125 cm and ends with a major peak of 380 mg*kg-1 around 122
cm. Thereafter, moderately low Ti concentrations continue until 60 cm before a rise to 360
mg*kg-1 at 32 cm. This trend is interrupted briefly around 48 cm. After 31 cm, concentrations
decrease stepwise, to < 30 mg*kg-1 at the surface.
Zr: It shares the same trends and peaks with Ti, with maximum concentrations of 50 mg*kg-1 at
the bottom and 7.5 and 10 mg*kg-1 in the upper two peaks, pointing at similar input sources.
V: An ongoing decrease from the bottom to 200 cm suggests a slight mobility of V close to the
mineral base. The rest of the profile resembles the Ti and Zr profiles.
K: Despite its function as a macronutrient and an associated solubility and mobility, the
concentration profile of K does not suggest a significant upward migration from the mineral base
(13200 mg*kg-1). It rather resembles the course of Ti until 30 cm. The increase in the top layers
could be explained by a rising influence of living vegetation.
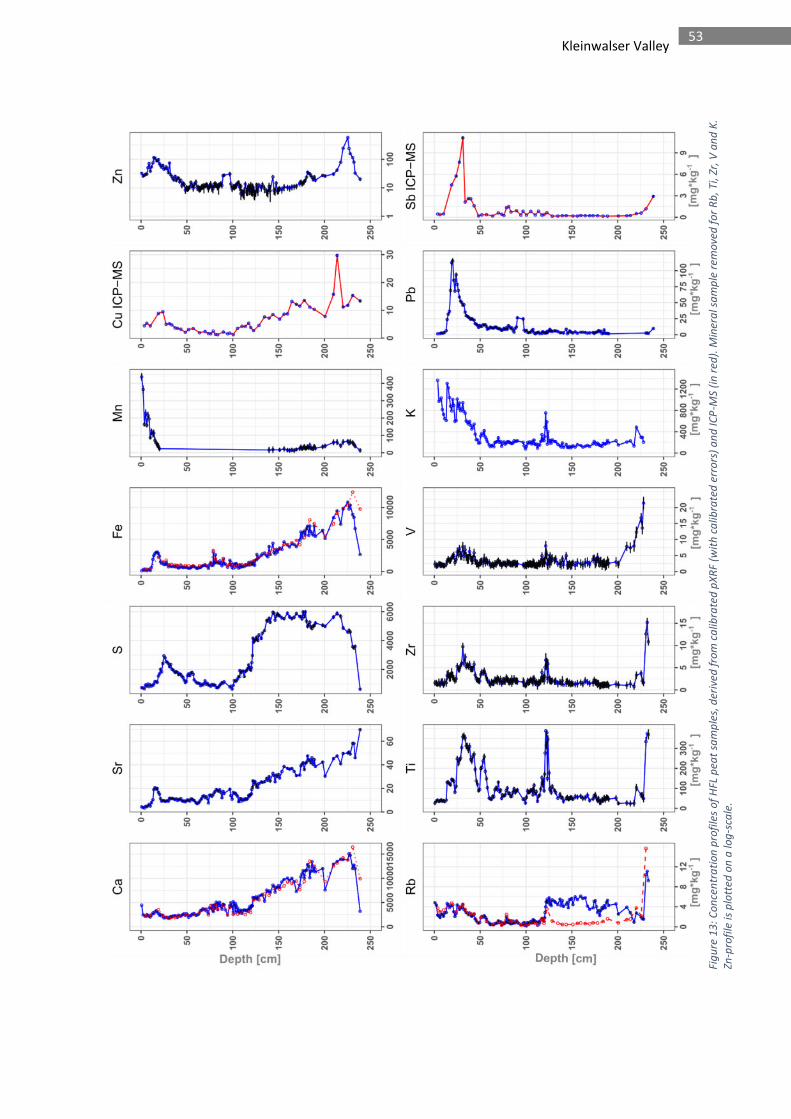
53 Kleinwalser Valley
Fig
ure
13
: C
on
cen
tra
tio
n p
rofi
les
of
HFL
pe
at
sam
ple
s, d
eri
ved
fro
m c
alib
rate
d p
XR
F (w
ith
ca
libra
ted
err
ors
) a
nd
IC
P-M
S (i
n r
ed
). M
ine
ral s
am
ple
re
mo
ved
fo
r R
b,
Ti,
Zr,
V a
nd
K.
Zn
-pro
file
is p
lott
ed
on
a lo
g-s
cale
.
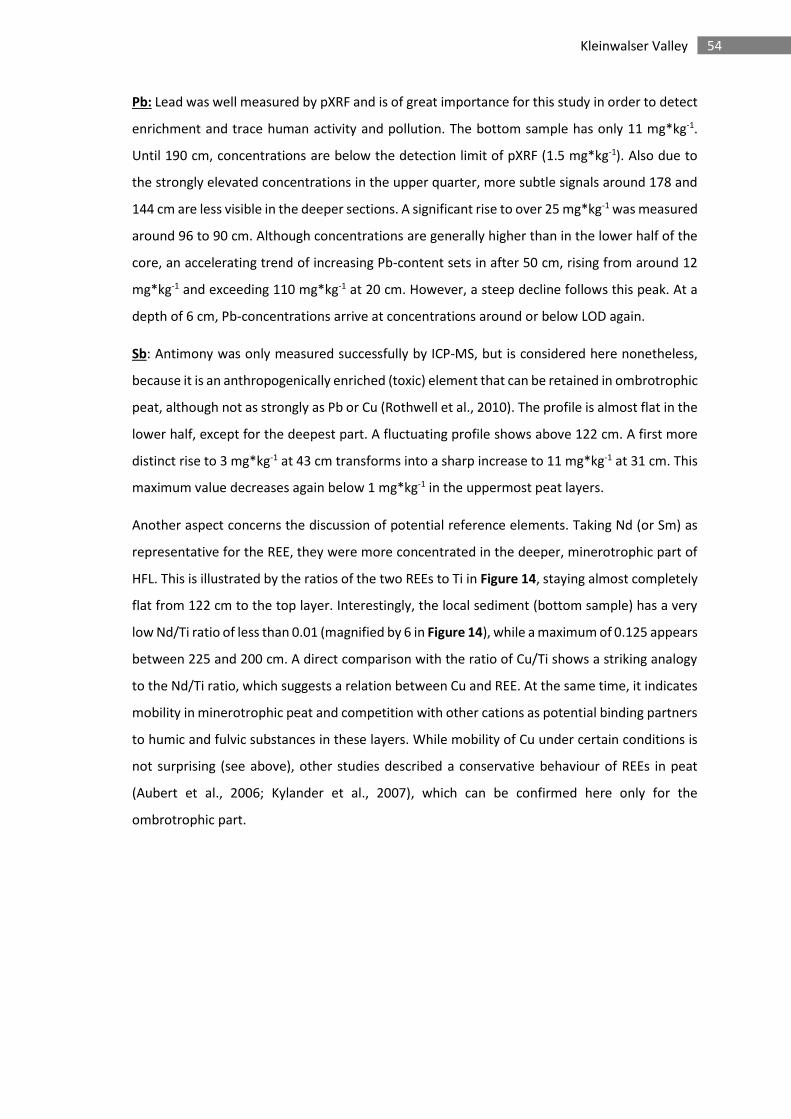
54 Kleinwalser Valley
Pb: Lead was well measured by pXRF and is of great importance for this study in order to detect
enrichment and trace human activity and pollution. The bottom sample has only 11 mg*kg-1.
Until 190 cm, concentrations are below the detection limit of pXRF (1.5 mg*kg-1). Also due to
the strongly elevated concentrations in the upper quarter, more subtle signals around 178 and
144 cm are less visible in the deeper sections. A significant rise to over 25 mg*kg-1 was measured
around 96 to 90 cm. Although concentrations are generally higher than in the lower half of the
core, an accelerating trend of increasing Pb-content sets in after 50 cm, rising from around 12
mg*kg-1 and exceeding 110 mg*kg-1 at 20 cm. However, a steep decline follows this peak. At a
depth of 6 cm, Pb-concentrations arrive at concentrations around or below LOD again.
Sb: Antimony was only measured successfully by ICP-MS, but is considered here nonetheless,
because it is an anthropogenically enriched (toxic) element that can be retained in ombrotrophic
peat, although not as strongly as Pb or Cu (Rothwell et al., 2010). The profile is almost flat in the
lower half, except for the deepest part. A fluctuating profile shows above 122 cm. A first more
distinct rise to 3 mg*kg-1 at 43 cm transforms into a sharp increase to 11 mg*kg-1 at 31 cm. This
maximum value decreases again below 1 mg*kg-1 in the uppermost peat layers.
Another aspect concerns the discussion of potential reference elements. Taking Nd (or Sm) as
representative for the REE, they were more concentrated in the deeper, minerotrophic part of
HFL. This is illustrated by the ratios of the two REEs to Ti in Figure 14, staying almost completely
flat from 122 cm to the top layer. Interestingly, the local sediment (bottom sample) has a very
low Nd/Ti ratio of less than 0.01 (magnified by 6 in Figure 14), while a maximum of 0.125 appears
between 225 and 200 cm. A direct comparison with the ratio of Cu/Ti shows a striking analogy
to the Nd/Ti ratio, which suggests a relation between Cu and REE. At the same time, it indicates
mobility in minerotrophic peat and competition with other cations as potential binding partners
to humic and fulvic substances in these layers. While mobility of Cu under certain conditions is
not surprising (see above), other studies described a conservative behaviour of REEs in peat
(Aubert et al., 2006; Kylander et al., 2007), which can be confirmed here only for the
ombrotrophic part.
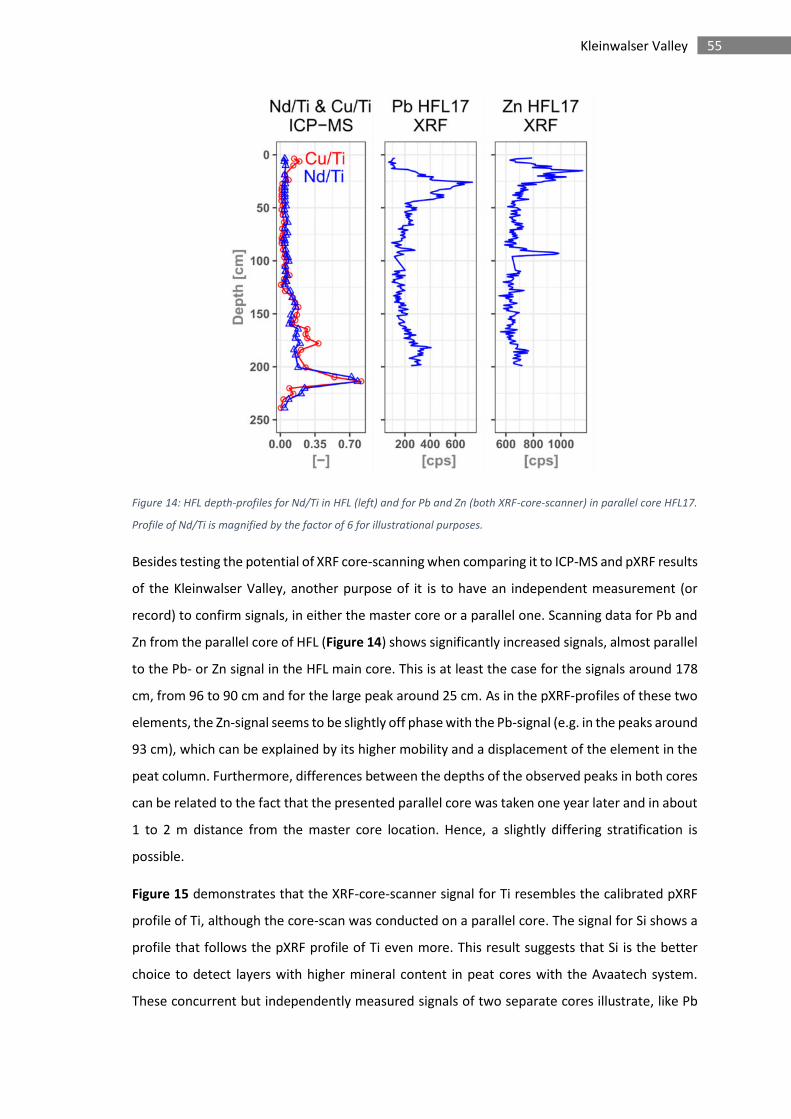
55 Kleinwalser Valley
Figure 14: HFL depth-profiles for Nd/Ti in HFL (left) and for Pb and Zn (both XRF-core-scanner) in parallel core HFL17.
Profile of Nd/Ti is magnified by the factor of 6 for illustrational purposes.
Besides testing the potential of XRF core-scanning when comparing it to ICP-MS and pXRF results
of the Kleinwalser Valley, another purpose of it is to have an independent measurement (or
record) to confirm signals, in either the master core or a parallel one. Scanning data for Pb and
Zn from the parallel core of HFL (Figure 14) shows significantly increased signals, almost parallel
to the Pb- or Zn signal in the HFL main core. This is at least the case for the signals around 178
cm, from 96 to 90 cm and for the large peak around 25 cm. As in the pXRF-profiles of these two
elements, the Zn-signal seems to be slightly off phase with the Pb-signal (e.g. in the peaks around
93 cm), which can be explained by its higher mobility and a displacement of the element in the
peat column. Furthermore, differences between the depths of the observed peaks in both cores
can be related to the fact that the presented parallel core was taken one year later and in about
1 to 2 m distance from the master core location. Hence, a slightly differing stratification is
possible.
Figure 15 demonstrates that the XRF-core-scanner signal for Ti resembles the calibrated pXRF
profile of Ti, although the core-scan was conducted on a parallel core. The signal for Si shows a
profile that follows the pXRF profile of Ti even more. This result suggests that Si is the better
choice to detect layers with higher mineral content in peat cores with the Avaatech system.
These concurrent but independently measured signals of two separate cores illustrate, like Pb
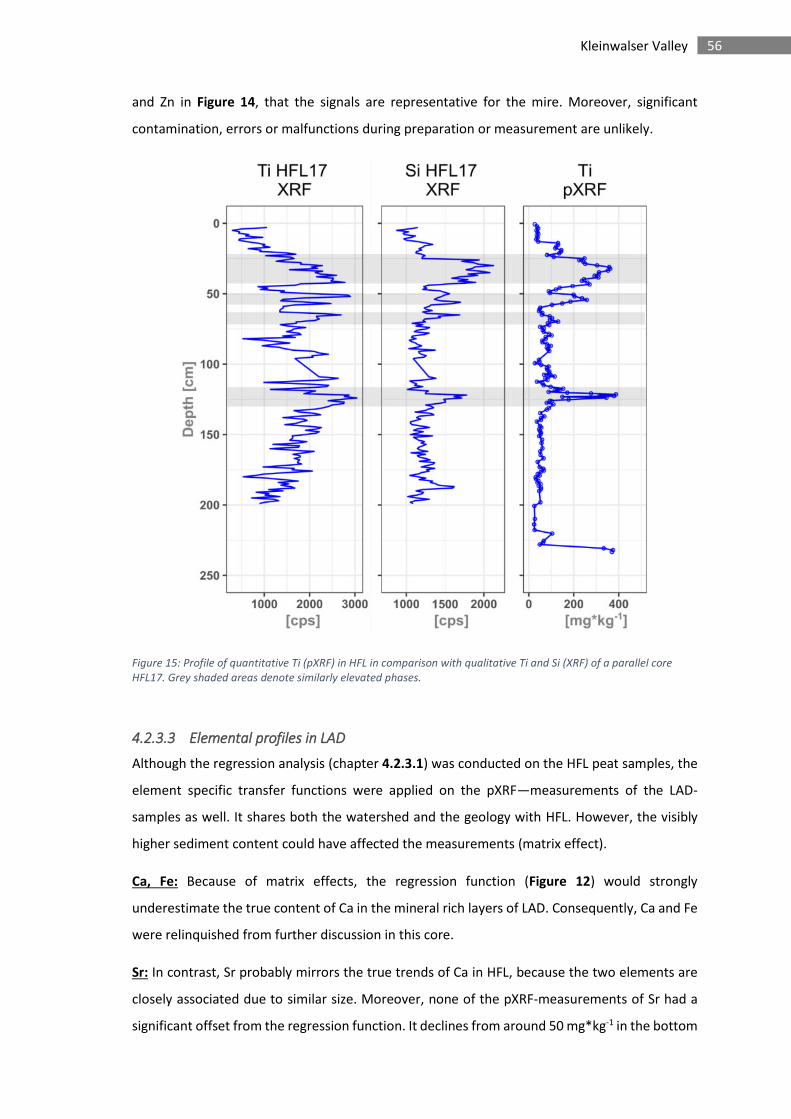
56 Kleinwalser Valley
and Zn in Figure 14, that the signals are representative for the mire. Moreover, significant
contamination, errors or malfunctions during preparation or measurement are unlikely.
Figure 15: Profile of quantitative Ti (pXRF) in HFL in comparison with qualitative Ti and Si (XRF) of a parallel core
HFL17. Grey shaded areas denote similarly elevated phases.
4.2.3.3 Elemental profiles in LAD
Although the regression analysis (chapter 4.2.3.1) was conducted on the HFL peat samples, the
element specific transfer functions were applied on the pXRF—measurements of the LAD-
samples as well. It shares both the watershed and the geology with HFL. However, the visibly
higher sediment content could have affected the measurements (matrix effect).
Ca, Fe: Because of matrix effects, the regression function (Figure 12) would strongly
underestimate the true content of Ca in the mineral rich layers of LAD. Consequently, Ca and Fe
were relinquished from further discussion in this core.
Sr: In contrast, Sr probably mirrors the true trends of Ca in HFL, because the two elements are
closely associated due to similar size. Moreover, none of the pXRF-measurements of Sr had a
significant offset from the regression function. It declines from around 50 mg*kg-1 in the bottom
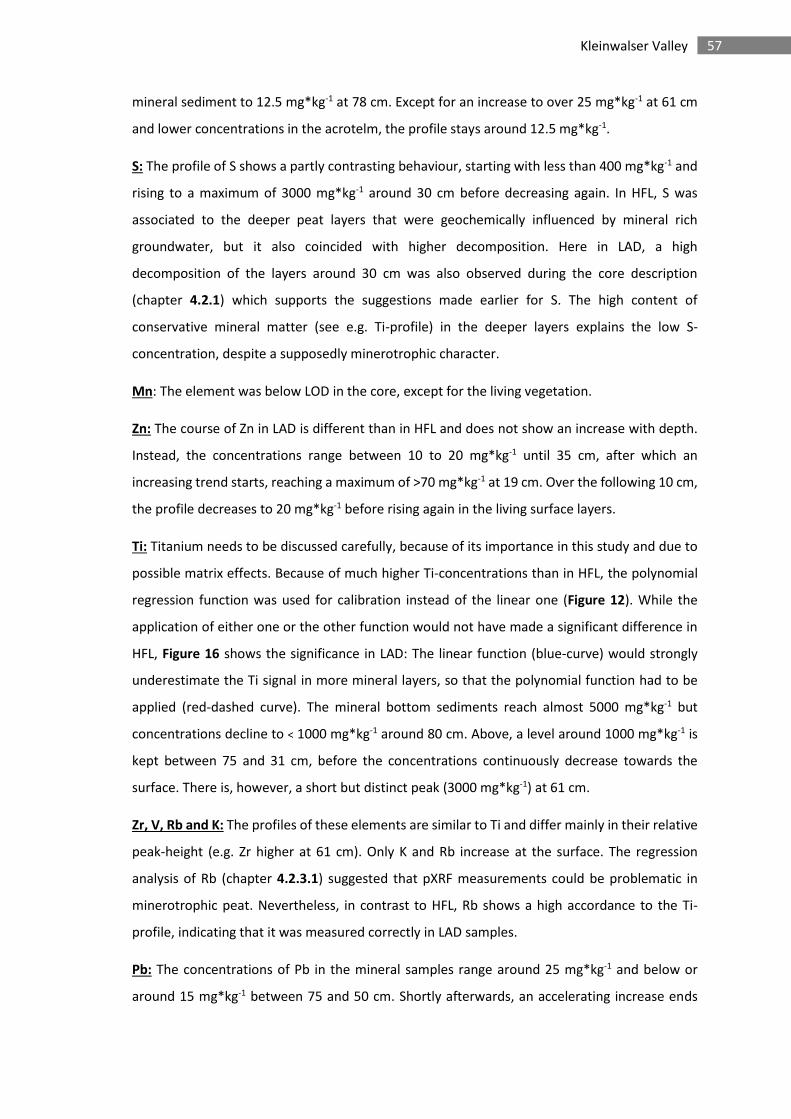
57 Kleinwalser Valley
mineral sediment to 12.5 mg*kg-1 at 78 cm. Except for an increase to over 25 mg*kg-1 at 61 cm
and lower concentrations in the acrotelm, the profile stays around 12.5 mg*kg-1.
S: The profile of S shows a partly contrasting behaviour, starting with less than 400 mg*kg-1 and
rising to a maximum of 3000 mg*kg-1 around 30 cm before decreasing again. In HFL, S was
associated to the deeper peat layers that were geochemically influenced by mineral rich
groundwater, but it also coincided with higher decomposition. Here in LAD, a high
decomposition of the layers around 30 cm was also observed during the core description
(chapter 4.2.1) which supports the suggestions made earlier for S. The high content of
conservative mineral matter (see e.g. Ti-profile) in the deeper layers explains the low S-
concentration, despite a supposedly minerotrophic character.
Mn: The element was below LOD in the core, except for the living vegetation.
Zn: The course of Zn in LAD is different than in HFL and does not show an increase with depth.
Instead, the concentrations range between 10 to 20 mg*kg-1 until 35 cm, after which an
increasing trend starts, reaching a maximum of >70 mg*kg-1 at 19 cm. Over the following 10 cm,
the profile decreases to 20 mg*kg-1 before rising again in the living surface layers.
Ti: Titanium needs to be discussed carefully, because of its importance in this study and due to
possible matrix effects. Because of much higher Ti-concentrations than in HFL, the polynomial
regression function was used for calibration instead of the linear one (Figure 12). While the
application of either one or the other function would not have made a significant difference in
HFL, Figure 16 shows the significance in LAD: The linear function (blue-curve) would strongly
underestimate the Ti signal in more mineral layers, so that the polynomial function had to be
applied (red-dashed curve). The mineral bottom sediments reach almost 5000 mg*kg-1 but
concentrations decline to < 1000 mg*kg-1 around 80 cm. Above, a level around 1000 mg*kg-1 is
kept between 75 and 31 cm, before the concentrations continuously decrease towards the
surface. There is, however, a short but distinct peak (3000 mg*kg-1) at 61 cm.
Zr, V, Rb and K: The profiles of these elements are similar to Ti and differ mainly in their relative
peak-height (e.g. Zr higher at 61 cm). Only K and Rb increase at the surface. The regression
analysis of Rb (chapter 4.2.3.1) suggested that pXRF measurements could be problematic in
minerotrophic peat. Nevertheless, in contrast to HFL, Rb shows a high accordance to the Ti-
profile, indicating that it was measured correctly in LAD samples.
Pb: The concentrations of Pb in the mineral samples range around 25 mg*kg-1 and below or
around 15 mg*kg-1 between 75 and 50 cm. Shortly afterwards, an accelerating increase ends
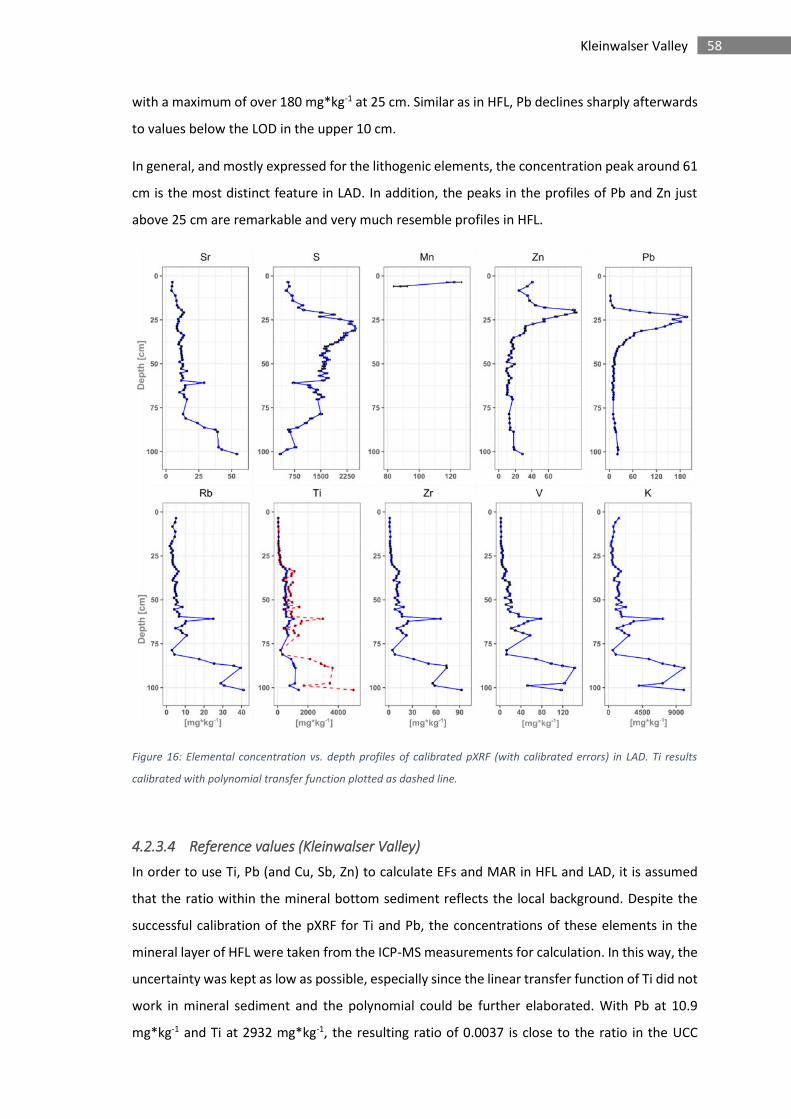
58 Kleinwalser Valley
with a maximum of over 180 mg*kg-1 at 25 cm. Similar as in HFL, Pb declines sharply afterwards
to values below the LOD in the upper 10 cm.
In general, and mostly expressed for the lithogenic elements, the concentration peak around 61
cm is the most distinct feature in LAD. In addition, the peaks in the profiles of Pb and Zn just
above 25 cm are remarkable and very much resemble profiles in HFL.
Figure 16: Elemental concentration vs. depth profiles of calibrated pXRF (with calibrated errors) in LAD. Ti results
calibrated with polynomial transfer function plotted as dashed line.
4.2.3.4 Reference values (Kleinwalser Valley)
In order to use Ti, Pb (and Cu, Sb, Zn) to calculate EFs and MAR in HFL and LAD, it is assumed
that the ratio within the mineral bottom sediment reflects the local background. Despite the
successful calibration of the pXRF for Ti and Pb, the concentrations of these elements in the
mineral layer of HFL were taken from the ICP-MS measurements for calculation. In this way, the
uncertainty was kept as low as possible, especially since the linear transfer function of Ti did not
work in mineral sediment and the polynomial could be further elaborated. With Pb at 10.9
mg*kg-1 and Ti at 2932 mg*kg-1, the resulting ratio of 0.0037 is close to the ratio in the UCC
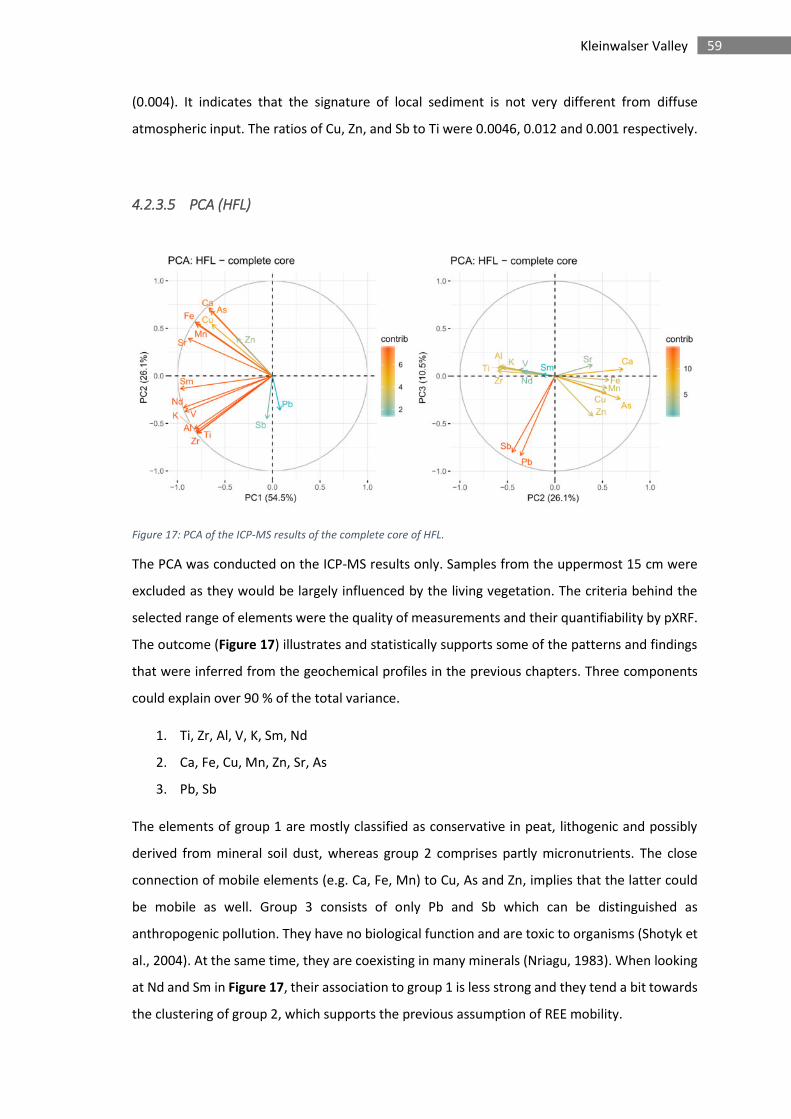
59 Kleinwalser Valley
(0.004). It indicates that the signature of local sediment is not very different from diffuse
atmospheric input. The ratios of Cu, Zn, and Sb to Ti were 0.0046, 0.012 and 0.001 respectively.
4.2.3.5 PCA (HFL)
Figure 17: PCA of the ICP-MS results of the complete core of HFL.
The PCA was conducted on the ICP-MS results only. Samples from the uppermost 15 cm were
excluded as they would be largely influenced by the living vegetation. The criteria behind the
selected range of elements were the quality of measurements and their quantifiability by pXRF.
The outcome (Figure 17) illustrates and statistically supports some of the patterns and findings
that were inferred from the geochemical profiles in the previous chapters. Three components
could explain over 90 % of the total variance.
1. Ti, Zr, Al, V, K, Sm, Nd
2. Ca, Fe, Cu, Mn, Zn, Sr, As
3. Pb, Sb
The elements of group 1 are mostly classified as conservative in peat, lithogenic and possibly
derived from mineral soil dust, whereas group 2 comprises partly micronutrients. The close
connection of mobile elements (e.g. Ca, Fe, Mn) to Cu, As and Zn, implies that the latter could
be mobile as well. Group 3 consists of only Pb and Sb which can be distinguished as
anthropogenic pollution. They have no biological function and are toxic to organisms (Shotyk et
al., 2004). At the same time, they are coexisting in many minerals (Nriagu, 1983). When looking
at Nd and Sm in Figure 17, their association to group 1 is less strong and they tend a bit towards
the clustering of group 2, which supports the previous assumption of REE mobility.
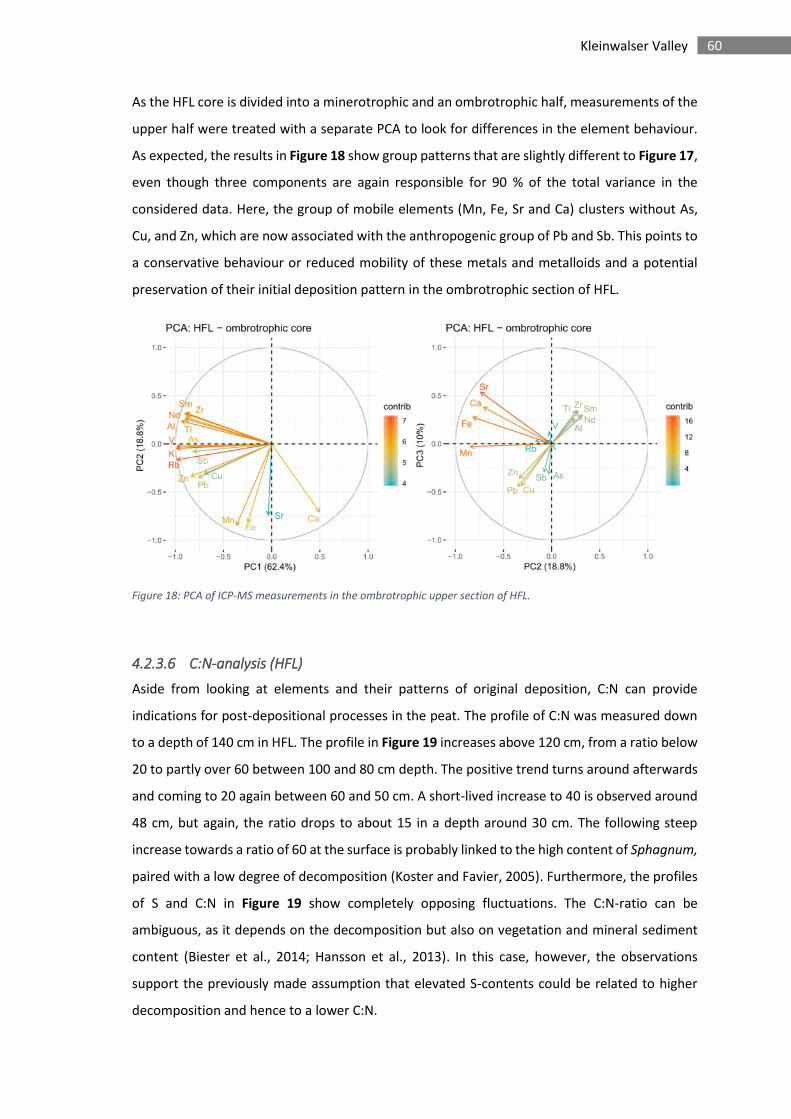
60 Kleinwalser Valley
As the HFL core is divided into a minerotrophic and an ombrotrophic half, measurements of the
upper half were treated with a separate PCA to look for differences in the element behaviour.
As expected, the results in Figure 18 show group patterns that are slightly different to Figure 17,
even though three components are again responsible for 90 % of the total variance in the
considered data. Here, the group of mobile elements (Mn, Fe, Sr and Ca) clusters without As,
Cu, and Zn, which are now associated with the anthropogenic group of Pb and Sb. This points to
a conservative behaviour or reduced mobility of these metals and metalloids and a potential
preservation of their initial deposition pattern in the ombrotrophic section of HFL.
Figure 18: PCA of ICP-MS measurements in the ombrotrophic upper section of HFL.
4.2.3.6 C:N-analysis (HFL)
Aside from looking at elements and their patterns of original deposition, C:N can provide
indications for post-depositional processes in the peat. The profile of C:N was measured down
to a depth of 140 cm in HFL. The profile in Figure 19 increases above 120 cm, from a ratio below
20 to partly over 60 between 100 and 80 cm depth. The positive trend turns around afterwards
and coming to 20 again between 60 and 50 cm. A short-lived increase to 40 is observed around
48 cm, but again, the ratio drops to about 15 in a depth around 30 cm. The following steep
increase towards a ratio of 60 at the surface is probably linked to the high content of Sphagnum,
paired with a low degree of decomposition (Koster and Favier, 2005). Furthermore, the profiles
of S and C:N in Figure 19 show completely opposing fluctuations. The C:N-ratio can be
ambiguous, as it depends on the decomposition but also on vegetation and mineral sediment
content (Biester et al., 2014; Hansson et al., 2013). In this case, however, the observations
support the previously made assumption that elevated S-contents could be related to higher
decomposition and hence to a lower C:N.
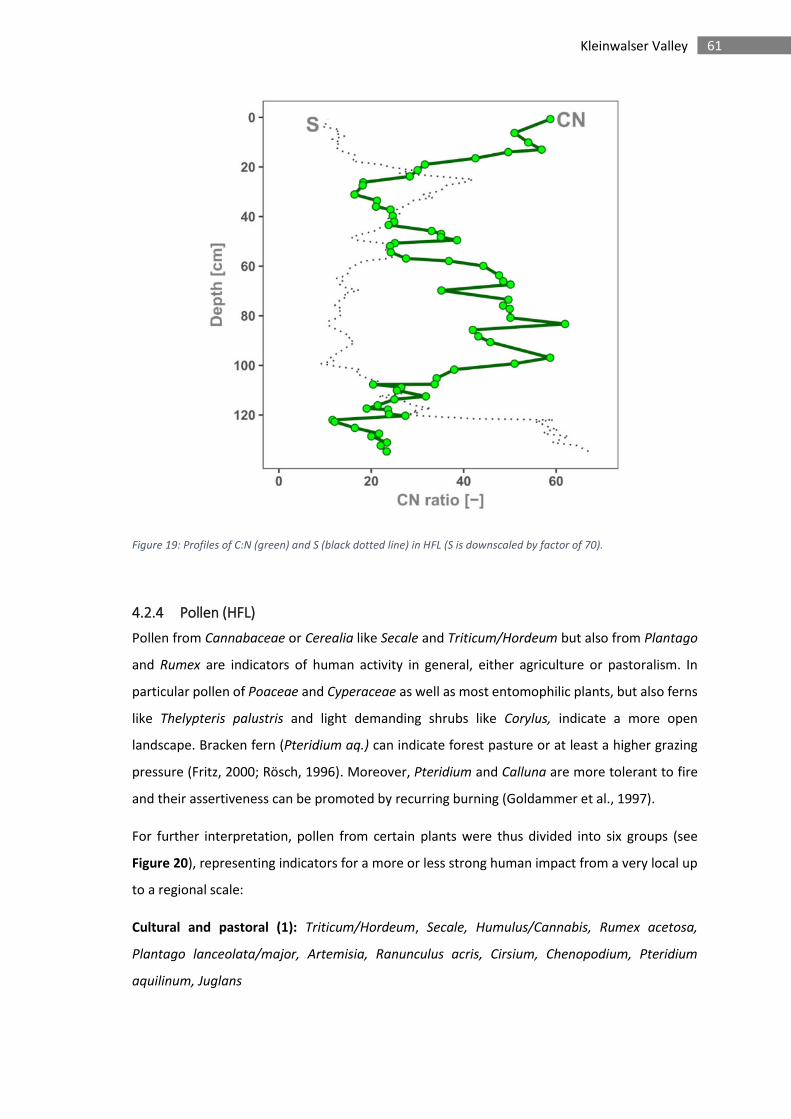
61 Kleinwalser Valley
Figure 19: Profiles of C:N (green) and S (black dotted line) in HFL (S is downscaled by factor of 70).
4.2.4 Pollen (HFL)
Pollen from Cannabaceae or Cerealia like Secale and Triticum/Hordeum but also from Plantago
and Rumex are indicators of human activity in general, either agriculture or pastoralism. In
particular pollen of Poaceae and Cyperaceae as well as most entomophilic plants, but also ferns
like Thelypteris palustris and light demanding shrubs like Corylus, indicate a more open
landscape. Bracken fern (Pteridium aq.) can indicate forest pasture or at least a higher grazing
pressure (Fritz, 2000; Rösch, 1996). Moreover, Pteridium and Calluna are more tolerant to fire
and their assertiveness can be promoted by recurring burning (Goldammer et al., 1997).
For further interpretation, pollen from certain plants were thus divided into six groups (see
Figure 20), representing indicators for a more or less strong human impact from a very local up
to a regional scale:
Cultural and pastoral (1): Triticum/Hordeum, Secale, Humulus/Cannabis, Rumex acetosa,
Plantago lanceolata/major, Artemisia, Ranunculus acris, Cirsium, Chenopodium, Pteridium
aquilinum, Juglans
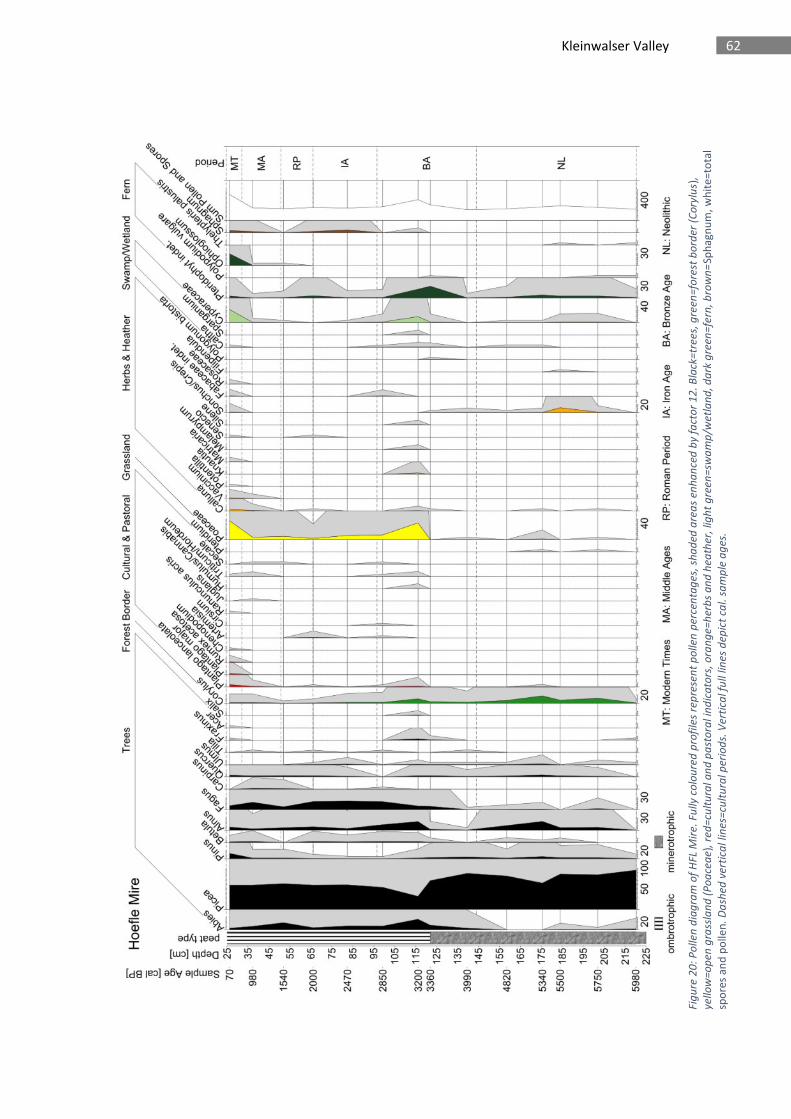
62 Kleinwalser Valley
Fig
ure
20
: P
olle
n d
iag
ram
of
HFL
Mir
e.
Fully
co
lou
red
pro
file
s re
pre
sen
t p
olle
n p
erc
en
tag
es,
sh
ad
ed
are
as
en
ha
nce
d b
y fa
cto
r 1
2.
Bla
ck=
tre
es,
gre
en
=fo
rest
bo
rde
r (C
ory
lus)
,
yello
w=
op
en
gra
ssla
nd
(P
oa
cea
e),
re
d=
cult
ura
l an
d p
ast
ora
l in
dic
ato
rs,
ora
ng
e=
he
rbs
an
d h
ea
the
r, li
gh
t g
ree
n=
swa
mp
/we
tla
nd
, d
ark
gre
en
=fe
rn,
bro
wn
=Sp
hag
nu
m, w
hit
e=to
tal
spo
res
and
po
llen
. D
ash
ed
ve
rtic
al l
ine
s=cu
ltu
ral p
eri
od
s. V
ert
ica
l fu
ll lin
es
de
pic
t ca
l. s
am
ple
ag
es.
63 Kleinwalser Valley
Open grassland (2): Poaceae
Herbs and heather (3): entomophilic herbs, Calluna vulgaris, Vaccinium
Forest border or patchy forest clearings (4): Corylus
Swamp/Wetland (5): local wetland vegetation with Cyperaceae and few entomophilic swamp
species
Ferns (6): All ferns except for Pteridium aquilinum
As shown in Figure 20, except for Modern Times and briefly during the late Middle Bronze Age,
tree pollen make up more than 50 % of the total pollen sum. Three periods of a generally more
open- and partly more cultivated landscape could be identified from 5800 to 5000 cal BP (Late
Neolithic), from 3400 to 2800 cal BP (Middle to Late Bronze Age) and from 1000 cal BP until
present (High Middle Ages until industrial era).
4.3 Chronological discussion (Kleinwalser Valley)
Figure 21 (see further below) shows the chronological profiles of proxies that are used in the
following discussion on mire development, climate and human impact in mires of the
Kleinwalser Valley.
4.3.1 Mire formation
The fine clayey sediments of probably glacial till followed by gyttja at the bottom of both HFL
and LAD indicate standing water conditions, which favoured the onset of peat formation.
Already Völk (2001) suspected lake clays in the area of the mires. However, angular stones below
the gyttja could also be interpreted as a mass movement with silting up or simply as moraine
material.
As indicated by the age-depth model, peat formation in HFL and LAD began around or shortly
after 6200 cal BP. Pollen proportions and the occurrence of tree needles in the following layers
suggest a Picea swamp in a densely forested valley at 6000 cal BP, fitting well to the findings of
Dieffenbach-Fries (1981). During approximately the same period, other studies report a wetter
and colder climate in the Central Alps (Haas et al., 1998; Van der Knaap et al., 2004; Wurth et
al., 2004). This phase could be addressed as the Rotmoos I cold phase, which was reflected in
glacier advances and forest line decreases (Ivy-Ochs et al., 2009).
Wyllie (2014) showed that the risk of land- or rockslides is elevated during wet and cold periods.
Ancient structures of rockfalls in the watershed exist mainly along the upper Schwarzwasser
64 Kleinwalser Valley
river around the Hoher Ifen (Schmidt-Thomé, 1960; Völk, 2001) and may have reorganised the
complex valley’s hydrology (Goldscheider, 1998). This could have further promoted mire
formation in certain places, as suggested by Grosse-Brauckmann (2002). But as of today, Völk
(2001) argued for an age of these rock-slides dating to an age between LGM and Holocene. A
connection between climate, rockfalls and mire formation in the Kleinwalser Valley would
therefore need more detailed investigations.
4.3.2 5800 to 3500 cal BP: early human occupation
Only little archaeological evidence suggests early human occupation in the area (Bachnetzer,
2017; Leitner, 2003). Similarly, little palaeoecological evidence exists on early local land use.
Regional studies show fire practices (Clark et al., 1989) and crop cultivation around Lake
Constance (Jacomet, 2009; Rösch, 1992) and at Oberstdorf, north of the valley (Figure 5)
(Dieffenbach-Fries, 1981). In HFL, a significant decrease of tree pollen, increasing Poaceae pollen
and the presence of Plantago as well as the emergence of Corylus suggest anthropogenic
landscape opening around 5550 cal BP. As Corylus prefers forest borders, a rather patchy forest
clearance is suggested. This interpretation is further strengthened by a significantly elevated
erosion signal (MAR) in HFL. Prehistoric fire practices in the valley can be inferred from the
presence of Pteridium and Calluna: species that are tolerant to and promoted by recurring fire
(Fritz, 2000; Goldammer et al., 1997; Rösch, 1996). While not dendrochronologically dated, a
charred tree trunk was pierced (horizontally) by the corer at parallel depth in the parallel HFL D
core (not analysed in detail). Although the cause of fire (anthropogenic or natural) cannot be
deciphered, it supports the other indicators, suggesting prehistoric patchy land clearances by
the use of fire, probably for livestock grazing. The main core (HFL-B) also showed a high content
of wood debris during that time. Moreover, a single date from an archaeological site coincides
with the early phase of the observed anthropogenic signals in HFL (Leitner, 2003). Many regional
studies from lower elevations to the north confirm an increased human impact around this
period with evidences for slash and burn as well as Cerealia cultivation (Clark et al., 1989;
Dieffenbach-Fries, 1981; Herbig, 2009; Jacomet, 2009; Rösch, 1992; Stojakowits, 2014).
Moreover, increased human impact was suggested at higher elevations of the Central Alps (Oetz
Valley) by Vorren et al. (1993).
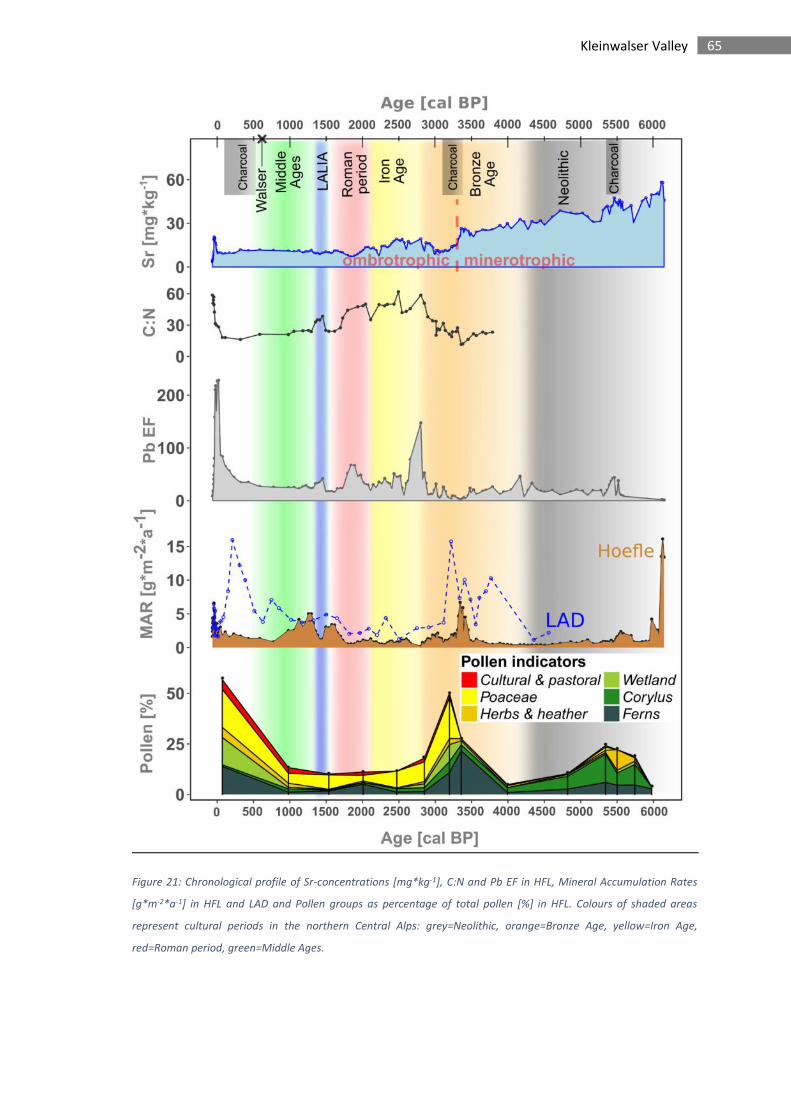
65 Kleinwalser Valley
Figure 21: Chronological profile of Sr-concentrations [mg*kg-1], C:N and Pb EF in HFL, Mineral Accumulation Rates
[g*m-2*a-1] in HFL and LAD and Pollen groups as percentage of total pollen [%] in HFL. Colours of shaded areas
represent cultural periods in the northern Central Alps: grey=Neolithic, orange=Bronze Age, yellow=Iron Age,
red=Roman period, green=Middle Ages.
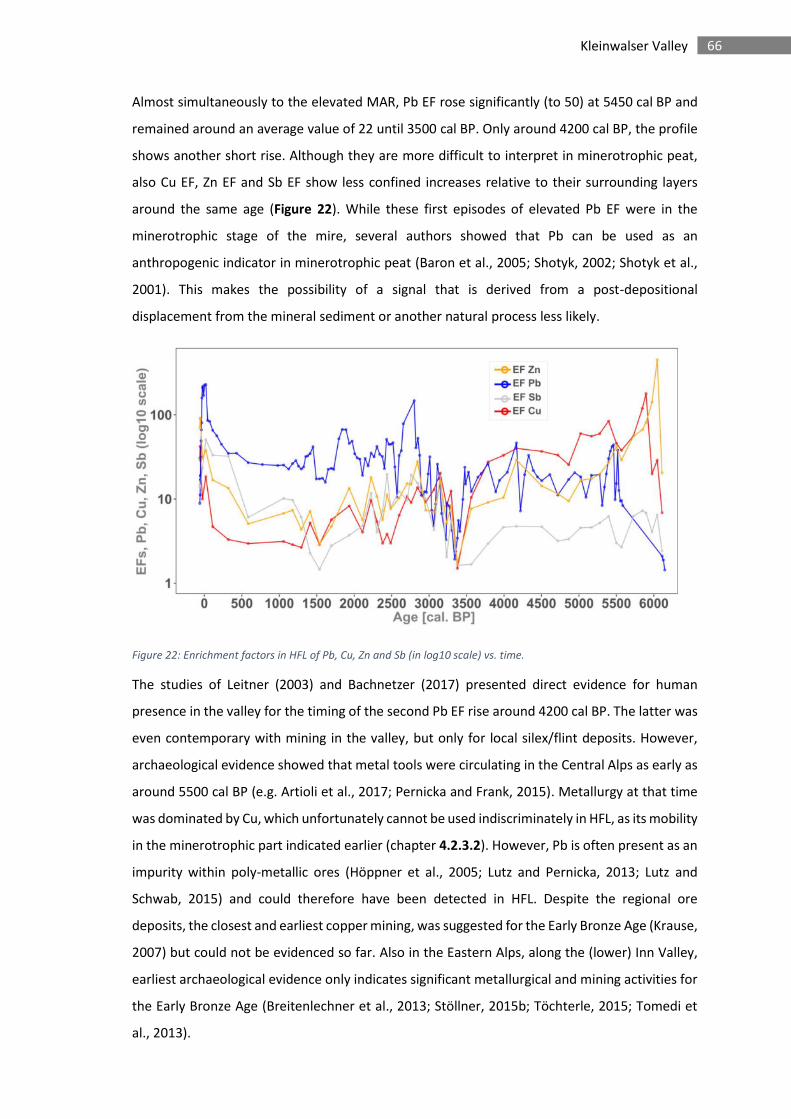
66 Kleinwalser Valley
Almost simultaneously to the elevated MAR, Pb EF rose significantly (to 50) at 5450 cal BP and
remained around an average value of 22 until 3500 cal BP. Only around 4200 cal BP, the profile
shows another short rise. Although they are more difficult to interpret in minerotrophic peat,
also Cu EF, Zn EF and Sb EF show less confined increases relative to their surrounding layers
around the same age (Figure 22). While these first episodes of elevated Pb EF were in the
minerotrophic stage of the mire, several authors showed that Pb can be used as an
anthropogenic indicator in minerotrophic peat (Baron et al., 2005; Shotyk, 2002; Shotyk et al.,
2001). This makes the possibility of a signal that is derived from a post-depositional
displacement from the mineral sediment or another natural process less likely.
Figure 22: Enrichment factors in HFL of Pb, Cu, Zn and Sb (in log10 scale) vs. time.
The studies of Leitner (2003) and Bachnetzer (2017) presented direct evidence for human
presence in the valley for the timing of the second Pb EF rise around 4200 cal BP. The latter was
even contemporary with mining in the valley, but only for local silex/flint deposits. However,
archaeological evidence showed that metal tools were circulating in the Central Alps as early as
around 5500 cal BP (e.g. Artioli et al., 2017; Pernicka and Frank, 2015). Metallurgy at that time
was dominated by Cu, which unfortunately cannot be used indiscriminately in HFL, as its mobility
in the minerotrophic part indicated earlier (chapter 4.2.3.2). However, Pb is often present as an
impurity within poly-metallic ores (Höppner et al., 2005; Lutz and Pernicka, 2013; Lutz and
Schwab, 2015) and could therefore have been detected in HFL. Despite the regional ore
deposits, the closest and earliest copper mining, was suggested for the Early Bronze Age (Krause,
2007) but could not be evidenced so far. Also in the Eastern Alps, along the (lower) Inn Valley,
earliest archaeological evidence only indicates significant metallurgical and mining activities for
the Early Bronze Age (Breitenlechner et al., 2013; Stöllner, 2015b; Töchterle, 2015; Tomedi et
al., 2013).
67 Kleinwalser Valley
The record of HFL strongly suggests that metallurgical activities in the area could already have
taken place around 5500 cal BP, which would be more than 1500 years earlier. These findings
are in agreement with other studies, which show that Alpine metallurgy had started well before
5000 cal BP (Bartelheim et al., 2002; Frank and Pernicka, 2012; Höppner et al., 2005).
Altogether, the combined data leads to the conclusion that humans were present in the
Kleinwalser Valley and had a significant impact on the landscape in the form of increased erosion
during the Neolithic period. As already hypothesised by Leitner (2007), people could have been
attracted by the flint/silex resources at the southern end of the valley, following fieldstones
upstream in the riverbed of the Breitach, eventually arriving at the flint mine. However, access
could have emanated from the south, as archaeological finds by Gulisano (1995, 1994) suggest.
Besides flint mining, the data of this study indicates so far unknown metal related activities
around 5450 cal BP, which would predate any existing evidence in this region.
4.3.3 3500 cal BP to 2800 cal BP: Bronze Age
The start of this period experienced the evolution from minerotrophic to ombrotrophic
conditions in HFL, characterised by the occurrence of Sphagnum, a stabilisation of Sr- and a
sudden drop of S-concentrations, suggesting an independence from bottom sediment influence.
The landscape opened, as shown by the emergence of Poaceae, Cyperaceae and Corylus, while
tree pollen sank below 50 %. Moreover, Calluna, Plantago and cultural pollen
(Triticum/Hordeum, Humulus/Cannabis) support the interpretation of an anthropogenic
landscape opening and human presence. A very distinct MAR peak in HFL and LAD between 3500
and 3200 cal BP suggests that deforestation and openness promoted soil and slope erosion.
Afterwards, another short period of an increased, but less strong erosion was recorded around
3050 cal BP. In line with the first larger peak, the partly charred wood debris layer below the
onset of peat growth below HHA was dated to an age between 3360 and 3480 cal BP. When
looking at the spatial distribution of the three investigated mires, this strongly points at a
widespread deforestation by fire and further supports the interpretation of an opened
landscape. For HHA, it even implies that the debris layers had blocked the kar’s outlet and
initiated the formation of the mire in the first place. Archaeological evidence, consisting of a
series of radiocarbon dates from charcoal and ovine bones from Schneiderkürenalpe (Figure 5),
also suggest more intensive pastoral activities in the valley (Leitner, 2003) from around 3500 to
3200 cal BP. This would have promoted soil erosion on the karstic western slopes above LAD
(Figure 5). On the same slopes, the speleothem record from the Hölloch Cave (Wurth et al.,
2004) registered a contemporaneous negative δ13C excursion, which could have been caused by
68 Kleinwalser Valley
an enhanced input of soil-derived carbon. Cultural indicators and pastoral weeds were also
observed locally around this time by Dieffenbach-Fries (1981) while Walde and Oeggl (2004)
documented fire clearings in the Tannberg area (Figure 5) between 3600 and 3300 cal BP. A
highly increased sedimentation rate was also observed in western Lake Constance by Rösch
(1993) at that time. However, other lakes and mires also recorded an increasing human impact
on the Central Alps’ landscape during the period around Middle to Late Bronze Age (Festi et al.,
2014; Schmidl and Oeggl, 2005a; Vorren et al., 1993; Wick and Tinner, 1997). In line with the
findings in this study, results of Dietre et al. (2017) show that fire management reappeared in
North-East Switzerland (Engadin). Only at the end of this period, pastoral impact decreased
again, as some studies show (Roepke and Krause, 2013). Contemporaneously, settlement
patterns changed after 3500 cal BP as a result of climatic deteriorations and new sites appeared
at higher elevations in the Central Alps (Della Casa, 2013). The same author saw technical and
agricultural innovations as a driver of higher human impact during the Middle to Late Bronze
Age. In terms of climate, a trend to wetter and colder conditions began after approximately
3300 cal BP (Hormes et al., 2001; Ivy-Ochs et al., 2009; Magny et al., 2009), which could have
promoted such erosive events by both descending the timberline and bringing more
precipitation on an already heavily open and disturbed landscape. While some studies suggested
that warmer conditions can promote human activities (Tinner et al., 2003; Vorren et al., 1993),
the HFL pollen record does not allow drawing conclusions about warmer or colder conditions.
Having arrived in the ombrotrophic part of the HFL-core, the metal record could now be used
for more profound interpretations, as also Cu and Zn should be less mobile. Potentially higher
EFs during this period were however masked by higher MAR, i.e. input from soils not enriched
in metals. Only in the aftermath, they rose again steadily towards the end of the Bronze Age.
It can however be argued that the large erosive event observed in the Kleinwalser Valley
between 3500 and 3200 cal BP and the specific cultural pollen assemblage were a direct
consequence of a strong and deliberate human land use rather than being the direct result of
climate factors. It also appears that this drastic deforestation and increase of erosion on the
slopes and sedimentation rates in the catchments had a formative influence on the landscape
and that they were of a larger regional extent. Despite intensive human activities, no clear
indications for metallurgy could be detected.
4.3.4 2800 cal BP to 600 cal CE: Iron Age and Roman period
The pressure of agro-pastoralism progressively disappeared from 2800 to 2500 cal BP as shown
by the disappearance of Artemisia, Fabacea, Cirsium and Plantago. Cerealia pollen
69 Kleinwalser Valley
(Hordeum/Triticum and Secale) also went missing around 2500 cal BP. Forests progressively
recovered in a stable landscape with minimum erosion, as also shown in the low MAR. The
decreasing human impact in the Kleinwalser Valley may have been triggered by a cold phase
(Haas et al., 1998; Ivy-Ochs et al., 2009; Joerin et al., 2006; Nicolussi, 2012; Nicolussi and Patzelt,
2000; Patzelt and Bortenschlager, 1973), making harsh mountain environments less attractive.
Declining cultural indicators were also documented at the same period in the Central Alps
(Vorren et al., 1993). In the Central and Eastern Alps lower human impact and a re-expansion of
forests was described by Oeggl (2015). Yet, this decline contrasts with continuous human impact
in the neighbouring Tannberg area (Walde and Oeggl, 2004, 2003) and charcoal layers not much
further south (Roepke et al., 2011). A more holistic or less climate deterministic approach to
resolve the reasons behind generally lower human activities during this period was also
suggested by several studies (Armit et al., 2014; Roepke et al., 2011; Tinner et al., 2003). Why
the human impact in the Kleinwalser Valley decreased remains therefore unclear at this stage.
It can however be hypothesised that humans have never abandoned the valley completely, as
the favourable warm and dry period, starting around 2000 cal BP (Büntgen et al., 2011), could
have attracted people again for hunting and pastoralism. This is suggested by pollen (Artemisia,
Plantago) and by archaeological evidence dating to the beginning of this period (Leitner, 2003).
While anthropogenic impact in the Kleinwalser Valley declined from 2800 to 2000 cal BP, Pb EF
suggests that metallurgical activities continued in the area. A Pb EF of up to 175 hints at intensive
mining or metallurgical activities not far from HFL between 2800 and 2600 cal BP. Synchronously
increased EFs of Zn and Sb around this period are supporting this interpretation (Figure 22). The
exact locations of these activities remain unclear, but they could be either local or regional, as
metallurgy from autochthonous ores became widespread in the Eastern Alps around 3500 cal
BP (Höppner et al., 2005; Lutz and Pernicka, 2013). At that time, copper was the most importamt
metal. However, a study of Tomedi et al. (2013) suggested that the technology advanced during
this period to produce alloys with Pb in the lower Inn Valley and Eastern Austria. However, the
only works made of pure Pb during that time were found in the south-eastern Alps (Gleirscher,
2015a). Afterwards (2600-2300 cal BP), short episodes of moderate Pb EF indicate ongoing
metallurgy in the region. While the earlier signals, starting with the transition from Bronze- to
Iron Age around 2800 cal BP, would be related to the Hallstatt culture, the signals in the second
half of the Iron Age would belong to the Celtic La Tène culture, as metal artefacts and metallurgy
evidences were found in the northern Central Alps (Bächtiger, 1982; Mansel, 1989). During early
Roman times (c. 2000 cal BP in this region) HFL and LAD recorded a low MAR, indicating little
erosion and therefore decreased land use, as already suggested by Walde and Oeggl (2004,
2003). This contrasts however with increased land use in the Alpine Foreland (Friedmann and
70 Kleinwalser Valley
Stojakowits, 2017). Later on, the study of Büntgen et al. (2011) suggested warm summers with
moderately low precipitation from 200 to 300 cal CE. Simultaneously, rising mineral input (MAR)
in HFL indicates increased land use in the Kleinwalser Valley. Such an early regional human
activity and connectivity of the valley can only be inferred from vague historical sources: Raetia’s
renown for cheese and wood and the renewal of Raetian mountain passages and roads under
Emperor Severus’ reign (Weber, 1995) could have generated an increased demand and
production in the region and promoted the development of an extensive local animal husbandry
and a more intense cutting of wood. Higher local land use is implied by the completion of the
Roman trade route Via Decia around 250 CE, which connected Brigantium (Bregenz at eastern
Lake Constance) with Veldidena (Innsbruck) and ran over Sonthofen, just north of the
Kleinwalser Valley (Figure 1). A possible Roman pathway from Sonthofen through the
Kleinwalser Valley to the region south of it was discussed by von Raiser (1830), with small local
outposts, whose stones were re-used later by the valley’s inhabitants. In addition, Dertsch
(1974) mentioned the Fideri Pass, on the south-eastern slopes, as the “oldest” connection to
Oberstdorf, and Fink and von Klenze (1891) described it as a “too well” constructed switchback
mountain path, deliberately suggesting Roman origin. Another lead is a Roman coin of the first
half of the 3rd century CE, found on the Gottesacker (Gulisano, 1995). However, no modern
studies could substantiate Roman presence in the valley so far, as more recent occupation
overprinted or reworked potential evidence. But alternative trading routes to the south were
needed, especially because the years from 200 to 300 CE were particularly violent, so that most
of the Roman territories north of the Alps and west to the river Iller (Figure 1) had to be given
up by 260 CE and any kind of agriculture was abandoned (Mackensen, 1995). These events may
have pushed trade, production and hence rural communities further up into the less populated
mountain valleys. It is therefore suggested here that people used the valley’s slopes, which led
to the observed MAR peak in both HFL and LAD around the 3rd century CE. If it was a direct
management by the Romans or not, cannot be corroborated. An elevated Pb EF around 100 cal
CE can, in contrast to a suggestion of Mackensen (1995), not be attributed to local Roman mining
around Sonthofen. As strong Pb-emissions of Roman origin were recorded in lakes and mires
across Europe (Allan et al., 2018; Brännvall et al., 2001; De Vleeschouwer et al., 2010b), the
enrichment of Pb in HFL is rather ascribed to diffuse distal sources.
After 400 cal CE, increased Abies alba pollen indicate forest expansion in cool and humid
conditions. The absence of herbs (e.g. Plantago) and Corylus suggests a low human influence in
the Kleinwalser Valley or at least no fresh cuttings and occupation of the adjacent area around
HFL. In parallel to the forest expansion and decreased anthropogenic pollen indicators, the MAR
dropped significantly in the first half of the 6th century CE, which is pointing to decreased
71 Kleinwalser Valley
landscape and soil disturbances. In addition, the C:N in HFL is showing a significant
contemporaneous increase. This hints at a higher effective humidity or water level in the bog,
which would have reduced decomposition. Furthermore, less intensive land use (e.g. by
livestock grazing) would have decreased disturbance and resulting decomposition of the mire’s
surface. Although not very pronounced, but in line with the observations in HFL, corresponding
pollen patterns were observed in the Kleinwalser Valley (Grosse-Brauckmann, 2002) as well as
north of it (Rösch, 1992; Stojakowits, 2014). Palaeoclimate studies showed, that a wetter climate
around 400 cal CE was directly followed by approximately 3°C colder summer temperatures
from 536 to 660 cal CE (Büntgen et al., 2016, 2011), being called the Late Antique Little Ice Age
(LALIA). The LALIA itself falls within the period that was termed “Dark Ages Cold Period” (DACP)
by Helama et al. (2017). Furthermore, Winckler (2012) outlined the general scarcity of
settlements in the mountain valleys but also the lack of written sources. Around the time frames
of these periods, Holzhauser et al. (2005) observed glacier advances in the Swiss Alps. The
studies of Büntgen et al. (2016) and Sigl et al. (2015) indicate that an Icelandic eruption (Loveluck
et al., 2018) at 536 CE was most likely among the triggers for this exceptionally cold climate
episode. The severe consequences on human population in the Alps can also be inferred from a
population decline in Austria by approx. 30 % (McEvedy and Jones, 1978).
The comparison of our data with the above cited palaeoclimate records suggests that, due to a
climatic deterioration between 500 and 600 cal CE, human activities in the Kleinwalser Valley
and its surroundings collapsed. Mineral input (i.e. erosion) temporarily decreased as a combined
result of forest expansion and soil stabilisation after it had been trending upwards at around 250
cal CE. Furthermore, the Pb EF in the HFL core recorded a metallurgical signal of Roman- but
rather not of local origin.
4.3.5 600 cal CE to 2016 CE: from Early Middle Ages to Modern Times
This period partly saw the expansion of the Frankish empire (Kaiser, 2010) to higher elevations,
but little is known about it in this part of the northern Central Alps, as neither Roman nor Middle
Age historical sources exist (Babucke, 1995). Only Alemannic line graves at the village of Fischen
(between Sonthofen and Oberstdorf, Figure 1) are among the rare evidence for human presence
before 700 to 800 CE, until the same village (and region) was referred to in 860 CE for the first
time by the Abbey of Saint Gall (Dertsch, 1974). Nevertheless, a growing human impact can be
observed in the HFL record in Figure 21, reflected in the MAR, which increased sharply after the
LALIA to peak around 700 cal CE, which is in accordance with observations in the Alps of Tinner
et al. (2003) and also with deforestation and settlement expansion in the Alpine Foreland
72 Kleinwalser Valley
(Friedmann and Stojakowits, 2017). However, a short lived but sharp drop was recorded at 770
cal CE, followed by a decreasing trend along the Medieval climatic optimum (900 to 1300 CE)
(Mann, 2002) until the onset of the Little Ice Age glacier progressions (1300 to 1950 CE)
(Matthews and Briffa, 2005).
Concerning the increase of MAR after LALIA, the study of Cheyette (2008) summarised the
setback of landscapes from arable to pastureland as a pan-European phenomenon, partly as a
result of a cooler climate after the Roman period. It could therefore be hypothesised that, except
for the special case of LALIA, the re-establishment of pastoralism in the Kleinwalser Valley
promoted erosion again, while previously recovered forests on the slopes were destroyed again
to generate larger pasture area.
Despite a decreasing MAR, increasing proportions of cultural pollen (Juglans, Cerealia, Plantago)
at 970 cal CE suggest human presence in the proximity of HFL. At first, these two proxies seem
to be contradicting each other. However, it can be argued that stronger human interventions
were already disturbing the soils and environment of the valley around the Early to High Middle
Ages and that the landscape stabilised in a pasture system, under ongoing but, at the same time,
less severe interventions and management of the area.
The MAR decrease together with cultural indicators suggest a landscape stabilisation. Historical
sources indeed suggest that the Kleinwalser Valley has been managed for hunting since the 11th
century CE. This information can be inferred from the first ever mentioning of the Kleinwalser
Valley in historical sources by a deed of Heinrich IV in 1059 CE, which had delegated a hunting
privilege to the bishop of Augsburg, putting the Widderstein and the Breitach river (Figure 5) as
a boundary (Amann, 2013a). Hunting would suggest that other land use, like forestry or animal
husbandry, were limited or forbidden in this area. However, the same deed also mentioned a
specific name (“gemeinbengunt”) of a cooperative alp (alpine pasture/farm) at the southern end
of the valley, which still exists under a similar name today (“Bärgunt”). Therefore, agro-pastoral
use must have existed already before 1059 CE. A direct proof for cattle drive from the southern
Allgaeu region into the valley was, however, documented at 1200 CE (Amann, 2013a) for the
first time.
The Walser arrived in the early 14th century CE (Wagner, 1950) and should have been responsible
for most of the changes since then. The presence of macro-charcoal (> 1 mm) in HFL after 1350
cal CE is in line with the onset of Walser settlements and indicates an intensive use of fire across
the valley. The uppermost pollen sample in HFL had the highest proportion of cultural and open
landscape indicators. However, the palynological resolution is coarse and the age-depth model
is limited for that period, placing this sample at the industrialisation period (ca 1880 cal CE). It is
73 Kleinwalser Valley
therefore assumed that the Walser intensified deforestation until the mid-19th century, as
illustrated on a land cover map from 1857 CE (VoGIS, State of Vorarlberg, 2018a). The MAR
progressively increased from the 13th century CE toward the Industrial period, reflecting ongoing
clearances by the Walser, growing population and increased agricultural activities (cheese and
meat production). This accelerating openness trend could, however, have been buffered by
early land (forest) management regulations (Amann, 2014; Fink and von Klenze, 1891),
mitigating further destabilisation of land cover.
In contrast to HFL, the MAR in LAD seems to have taken another development between Middle
Ages and industrialisation. Even if the accumulation rates in this part need to be considered with
caution, MAR appears to have risen quite strongly after around 1400 cal CE. Particularly this
western side of the valley started to be increasingly used for cattle grazing after 1450 CE (Amann,
2013b). Consequently, the vulnerable slopes suffered from erosion, induced by timber cutting
and cattle trampling. An important driver behind a high MAR (LAD), was most likely also the road
construction at 1572 CE, which was connected to extensive clearings (Fritz, 1981) and promoted
the development of the valley.
Pb EF and also the EFs of Cu, Zn and Sb increased after around 1400 cal CE. Part of this increase
may be attributed to the Sonthofen mining district, where exploitation was first documented for
1471 CE (Merbeler, 1995). Also elsewhere in the northern Central Alps, mining for silver, copper,
salt and other resources intensified (Brandstätter, 2015; Hanneberg et al., 2009b; Hofmann and
Wolkersdorfer, 2013). However, the emergence of widespread European mining activities in the
Middle Ages (e.g. Forel et al., 2010; Le Roux et al., 2005) did most likely contribute to the
observed signal in HFL. The interpretation of the Late Middle Ages in the Ladstatt record is
however limited by the age constrain. A more detailed discussion would therefore be
speculative. It is however observed that the trends that were described above for the Pb EF, the
MAR, and pollen in Hoefle, continued towards the 19th century. Moreover, several
interpretations from the geochemical data for the late 19th and 20th century are suggested: As a
result of heavy industry and the introduction of leaded gasoline in Europe, the Pb EF in HFL
strongly increased continuously from around 50 at 1850 cal CE to a maximum of 250 in the
1980s, which is perfectly fitting to the maximum use of Pb fuel and its subsequent ban (Pacyna
and Pacyna, 2001). The radiocarbon chronology of the last centuries is however not well
constrained when compared to historical documentation. This could have partly been caused by
drainage of Hoefle Mire, by temporarily reducing peat accumulation and enhancing
decomposition in intermediate depths. However, the Pb EF and Pb concentration profiles of HFL
and also LAD are strikingly similar to the well-dated Pb EF and Pb concentration profiles of
several Swiss mires (Shotyk et al., 1998; Weiss et al., 1999). It therefore provides a chronological
74 Kleinwalser Valley
constraint for the topmost part of the HFL- and LAD core. Hence, it can be said that, during the
first half of the 20th century, the MAR remained low in both mires. An intensification of tourism
in the valley (Fritz, 1981) and the construction of related infrastructure most likely promoted a
MAR increase in both mires again after 1950 cal CE over several decades. In the Swiss part of
the northern Central Alps, Schneeberger et al. (2007a) concluded that mainly increased road-
and house construction as well as a technological evolution towards the use of heavy machines
in agriculture/forestry induced a high rate of transformation for landscape changes during
exactly this period. A deceleration was however observed for the late 20th century
(Schneeberger et al., 2007b). Similar processes behind the observed signals in HFL and LAD
should therefore be transferable to the Kleinwalser Valley.
Another aspect that is concerning the mire development since the Late Middle Ages is observed
in the upper 35 cm of HFL and LAD. Either, there had been a serious decline in peat growth or
or post-growth decomposition took place, which affected or still affects the layers between
Middle Ages and Modern Times. Drainage that has most likely been installed along with a path
already before 1857 (VoGIS, State of Vorarlberg, 2018a), could have changed the established
conditions in the growing layer significantly. This change could have temporarily reduced peat
growth and, even more importantly, enhanced decomposition in intermediate near-surface
layers by aeration. Satellite imagery from 1980 (VoGIS, State of Vorarlberg, 2018b) even shows
that new ditches were opened at HFL and elsewhere in the valley. The theory of higher
decomposition would be supported by the recorded decrease to uncommonly low C:N after
1200-1300 cal CE. It strongly suggests that there is a connection to human impact (e.g. drainage)
by the Walser people. The contemporaneous onset of the Little Ice Age as a climatic driver
behind this observation is less likely, as colder conditions would have rather resulted in lower
decomposition (higher effective humidity) and consequently higher C:N. As another aspect of
human impact, the appearance of macro-charcoal in this part of the HFL core (1400-1800 cal CE)
could also indicate burning of the mire’s surface. So far, little is known about this phenomenon
of decreased peat accumulation during this time window, which is well known for mires across
Europe but was addressed in detail only by Sjögren et al. (2007) for several mires along an east-
west profile of the Alps. Their results are pointing to a mix of livestock trampling and drainage
as the driver, which could be valid for the Kleinwalser Valley too.
However, a Sphagnum moss growth boost of over 8 mm*a-1 was initiated in HFL and in LAD in
the late 20th century, which is rather unexpected in drained mires. Of course, the growth rate of
the living part of the acrotelm is not the same as the overall peat accumulation rate, because it
is not yet affected by decomposition and compaction by peat layers growing on top of it (Stivrins
et al., 2017). But even growth rates in this range are still very high for the montane setting.
75 Kleinwalser Valley
Longer growing seasons after the Little Ice Age could have played part of the role. Another,
additional, possibility is that an artificial lowering of the groundwater does not inhibit Sphagnum
peat growth here, because precipitation is high enough to retain a sufficient amount of water in
the upper layers and compensate the effect of drainage. Instead, an artificially lowered water
level could even keep away richer waters from below and might be one reason for a higher
productivity and assertiveness of peat forming vegetation like Sphagnum mosses
(ombrotrophication). The drainage channels accompanying the pathways along HFL and LAD
effectively inhibit any possibility of enriched ground- or soilwater inflow from the slope behind,
possibly leading to an anthropogenic ombrotrophication. The existence of such a mechanism
has been proven for example by Tahvanainen (2011). The use of the bog for grazing or hay
production would even further promote this effect, because the usually more competitive,
higher growing plants (e.g. reeds, shrubs, trees) are taken out and suppressed efficiently. In
addition, mowing or hay production removes nutrients from the system and promotes the
oligotrophication of rewetted fens (Zerbe et al., 2013). Hence, growth rates in natural bog- or
fen systems may be lower without management like mowing or grazing, especially nowadays,
when eutrophication via atmospheric input is ubiquitous (Bergström and Jansson, 2006), also in
the Alps (Rogora et al., 2006).
The last 1500 years are showing an increasing impact of human activities, either recorded as
changes in vegetation, as increased erosion during the High Middle Ages and again towards
present times. A very strong increase of Pb EF also happened during recent centuries. Besides,
a direct influence on the hydrology and ecology on HFL and LAD is reflected in a horizon of highly
increased compaction or decomposition, which is followed by a boost in Sphagnum growth
starting after 1950 cal CE.
4.4 Conclusions on the Kleinwalser Valley
This chapter presents two peat records of the Central Alps, which are covering the last 6200
years. By combining geochemical, palynological and chronological tools, it was possible to
understand the occupation and high human impact on the landscape in a valley of the northern
Central Alps and beyond. Calibrating a portable geochemical tool with ICP-MS also allowed the
quantification of geochemical elements in different peat types, from minerotrophic to
ombrotrophic. The geochemistry suggests that REE (Sm, Nd) are not fully conservative/immobile
in the minerotrophic part of the peat column and show - like Cu, Sr or other mobile elements -
an increasing ratio to Ti with depth. The data is furthermore pointing at the possible use of S as
a decomposition proxy as a marker to define the transition from minero- to ombrotrophic.
76 Kleinwalser Valley
A cooler and wetter climate around 6200 cal BP promoted mire formation in the Kleinwalser
Valley. Pollen spectra and erosion suggest human presence in the valley as early as around 5700
cal BP, lasting over several centuries, which is in line with studies on regional occupation.
Increased Pb EF values around the same time suggest metallurgical activities in the area, which
predates regional archaeological evidences by 1500 years. Large-scale deforestation and land
use (agro-pastoralism) took place between 3500 and 2800 cal BP causing a drastic landscape
opening and high erosion rates both at low and high elevation. At the end of this period, a
prominent Pb EF points to strong metallurgical activities in the area. However, landscape
stabilised and forests could recover thereafter until the early Roman period. A second period of
increased erosion and land use started after 230 cal CE and climaxed at around 700 cal CE. This
increased land use period was however interrupted by climatic deteriorations around 500 to
600 cal CE. Pb EF also saw an increase during the Roman period. It is however challenging to
pinpoint its origin as Roman Pb pollution had been widespread. The Middle Ages saw
progressive land management and the arrival of the Walser people. While historical data point
to a strong Walser influence on the area, our data only allow us to suggest that deforestation,
agriculture and pastoralism continued during that period. The extent of those activities remains
however unclear. A marked decline in the peat accumulation rate paired with low C:N after 1200
cal CE hints at a direct disturbance of HFL by either drainage, cattle trampling or burning.
The Pb EF increased during Late Middle Ages. It then rose faster during the industrial revolution
and peaked before leaded gasoline was banned, allowing its use as a chronological marker to
constrain the last century, which experienced increasing tourism and its consequences taking
place in the Kleinwalser Valley.
Sveral archaeological findings and sites give evidence for three prehistoric hot-spots of human
activity. Our pollen and geochemical data allow us to detail the evolution of local and regional
landscape and its use in the northern Central Alps. The combination of historical sources with
erosion- and pollen indicators points to local land use and human presence in the valley
thousands of years before the Walser people’s arrival. A landscape that had been shaped
strongly by humans before is probably the reason why the impact of the Walser was ultimately
less conspicuous than expected.
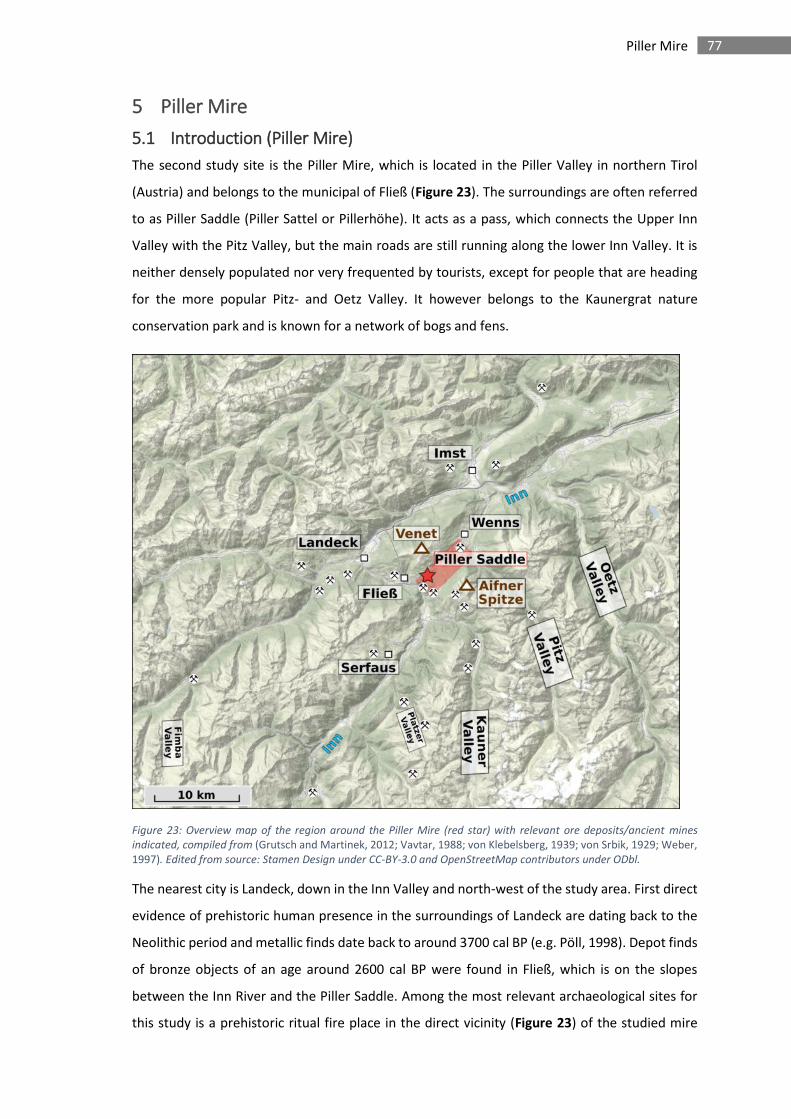
77 Piller Mire
5 Piller Mire
5.1 Introduction (Piller Mire)
The second study site is the Piller Mire, which is located in the Piller Valley in northern Tirol
(Austria) and belongs to the municipal of Fließ (Figure 23). The surroundings are often referred
to as Piller Saddle (Piller Sattel or Pillerhöhe). It acts as a pass, which connects the Upper Inn
Valley with the Pitz Valley, but the main roads are still running along the lower Inn Valley. It is
neither densely populated nor very frequented by tourists, except for people that are heading
for the more popular Pitz- and Oetz Valley. It however belongs to the Kaunergrat nature
conservation park and is known for a network of bogs and fens.
Figure 23: Overview map of the region around the Piller Mire (red star) with relevant ore deposits/ancient mines
indicated, compiled from (Grutsch and Martinek, 2012; Vavtar, 1988; von Klebelsberg, 1939; von Srbik, 1929; Weber, 1997). Edited from source: Stamen Design under CC-BY-3.0 and OpenStreetMap contributors under ODbl.
The nearest city is Landeck, down in the Inn Valley and north-west of the study area. First direct
evidence of prehistoric human presence in the surroundings of Landeck are dating back to the
Neolithic period and metallic finds date back to around 3700 cal BP (e.g. Pöll, 1998). Depot finds
of bronze objects of an age around 2600 cal BP were found in Fließ, which is on the slopes
between the Inn River and the Piller Saddle. Among the most relevant archaeological sites for
this study is a prehistoric ritual fire place in the direct vicinity (Figure 23) of the studied mire
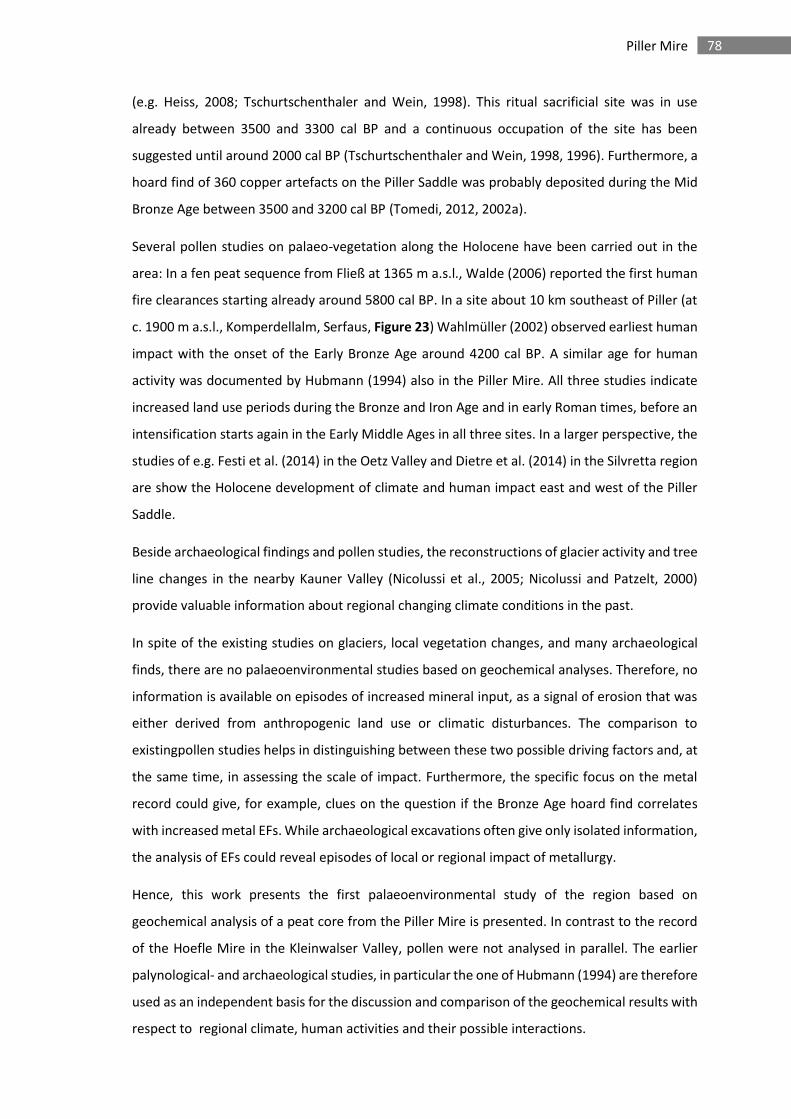
78 Piller Mire
(e.g. Heiss, 2008; Tschurtschenthaler and Wein, 1998). This ritual sacrificial site was in use
already between 3500 and 3300 cal BP and a continuous occupation of the site has been
suggested until around 2000 cal BP (Tschurtschenthaler and Wein, 1998, 1996). Furthermore, a
hoard find of 360 copper artefacts on the Piller Saddle was probably deposited during the Mid
Bronze Age between 3500 and 3200 cal BP (Tomedi, 2012, 2002a).
Several pollen studies on palaeo-vegetation along the Holocene have been carried out in the
area: In a fen peat sequence from Fließ at 1365 m a.s.l., Walde (2006) reported the first human
fire clearances starting already around 5800 cal BP. In a site about 10 km southeast of Piller (at
c. 1900 m a.s.l., Komperdellalm, Serfaus, Figure 23) Wahlmüller (2002) observed earliest human
impact with the onset of the Early Bronze Age around 4200 cal BP. A similar age for human
activity was documented by Hubmann (1994) also in the Piller Mire. All three studies indicate
increased land use periods during the Bronze and Iron Age and in early Roman times, before an
intensification starts again in the Early Middle Ages in all three sites. In a larger perspective, the
studies of e.g. Festi et al. (2014) in the Oetz Valley and Dietre et al. (2014) in the Silvretta region
are show the Holocene development of climate and human impact east and west of the Piller
Saddle.
Beside archaeological findings and pollen studies, the reconstructions of glacier activity and tree
line changes in the nearby Kauner Valley (Nicolussi et al., 2005; Nicolussi and Patzelt, 2000)
provide valuable information about regional changing climate conditions in the past.
In spite of the existing studies on glaciers, local vegetation changes, and many archaeological
finds, there are no palaeoenvironmental studies based on geochemical analyses. Therefore, no
information is available on episodes of increased mineral input, as a signal of erosion that was
either derived from anthropogenic land use or climatic disturbances. The comparison to
existingpollen studies helps in distinguishing between these two possible driving factors and, at
the same time, in assessing the scale of impact. Furthermore, the specific focus on the metal
record could give, for example, clues on the question if the Bronze Age hoard find correlates
with increased metal EFs. While archaeological excavations often give only isolated information,
the analysis of EFs could reveal episodes of local or regional impact of metallurgy.
Hence, this work presents the first palaeoenvironmental study of the region based on
geochemical analysis of a peat core from the Piller Mire is presented. In contrast to the record
of the Hoefle Mire in the Kleinwalser Valley, pollen were not analysed in parallel. The earlier
palynological- and archaeological studies, in particular the one of Hubmann (1994) are therefore
used as an independent basis for the discussion and comparison of the geochemical results with
respect to regional climate, human activities and their possible interactions.
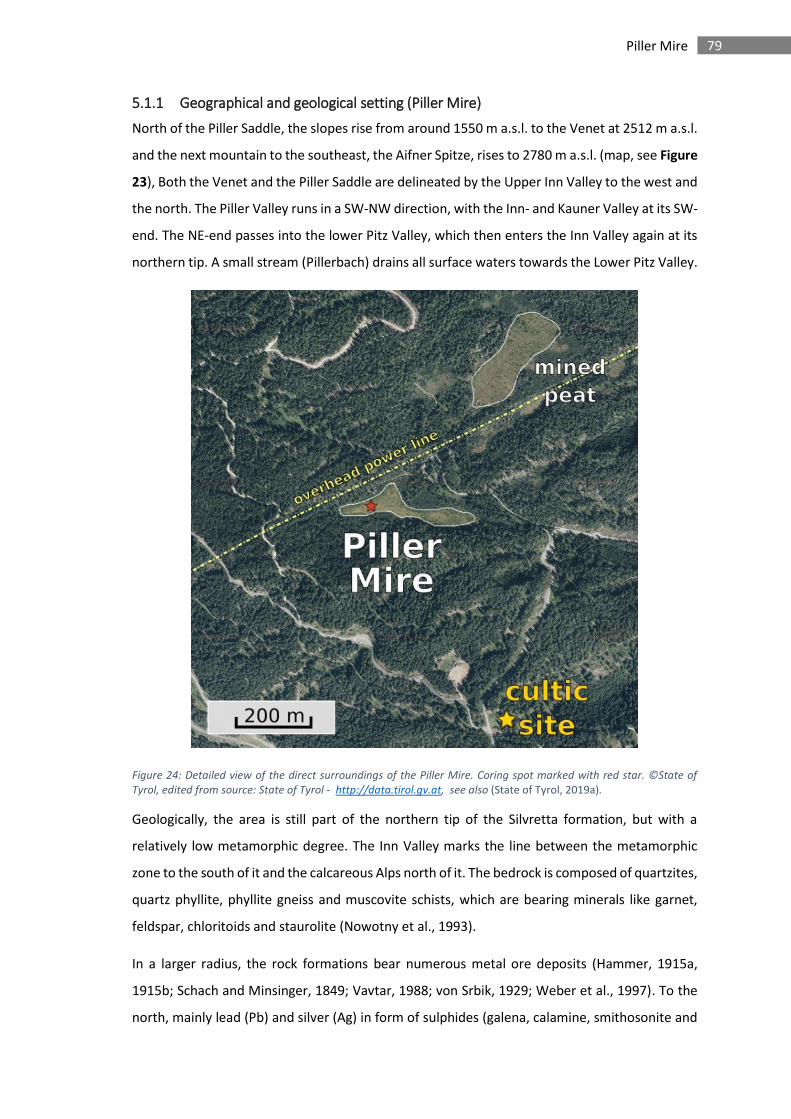
79 Piller Mire
5.1.1 Geographical and geological setting (Piller Mire)
North of the Piller Saddle, the slopes rise from around 1550 m a.s.l. to the Venet at 2512 m a.s.l.
and the next mountain to the southeast, the Aifner Spitze, rises to 2780 m a.s.l. (map, see Figure
23), Both the Venet and the Piller Saddle are delineated by the Upper Inn Valley to the west and
the north. The Piller Valley runs in a SW-NW direction, with the Inn- and Kauner Valley at its SW-
end. The NE-end passes into the lower Pitz Valley, which then enters the Inn Valley again at its
northern tip. A small stream (Pillerbach) drains all surface waters towards the Lower Pitz Valley.
Figure 24: Detailed view of the direct surroundings of the Piller Mire. Coring spot marked with red star. ©State of
Tyrol, edited from source: State of Tyrol - http://data.tirol.gv.at, see also (State of Tyrol, 2019a).
Geologically, the area is still part of the northern tip of the Silvretta formation, but with a
relatively low metamorphic degree. The Inn Valley marks the line between the metamorphic
zone to the south of it and the calcareous Alps north of it. The bedrock is composed of quartzites,
quartz phyllite, phyllite gneiss and muscovite schists, which are bearing minerals like garnet,
feldspar, chloritoids and staurolite (Nowotny et al., 1993).
In a larger radius, the rock formations bear numerous metal ore deposits (Hammer, 1915a,
1915b; Schach and Minsinger, 1849; Vavtar, 1988; von Srbik, 1929; Weber et al., 1997). To the
north, mainly lead (Pb) and silver (Ag) in form of sulphides (galena, calamine, smithosonite and
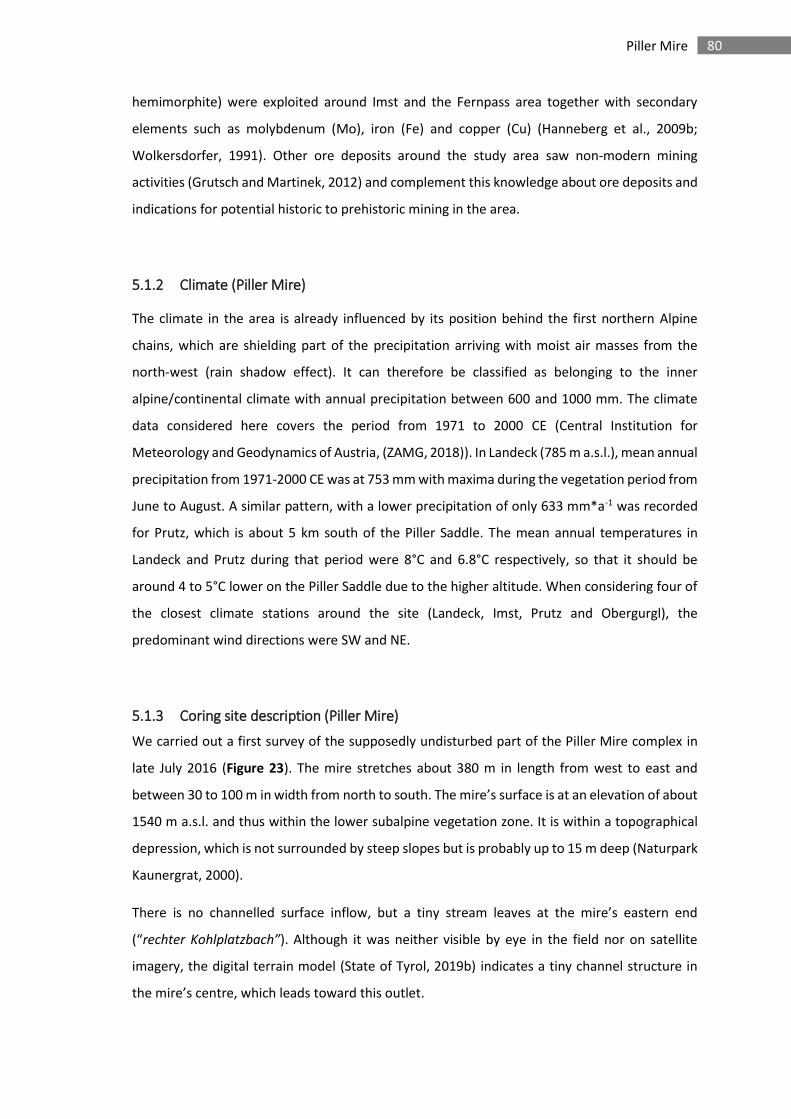
80 Piller Mire
hemimorphite) were exploited around Imst and the Fernpass area together with secondary
elements such as molybdenum (Mo), iron (Fe) and copper (Cu) (Hanneberg et al., 2009b;
Wolkersdorfer, 1991). Other ore deposits around the study area saw non-modern mining
activities (Grutsch and Martinek, 2012) and complement this knowledge about ore deposits and
indications for potential historic to prehistoric mining in the area.
5.1.2 Climate (Piller Mire)
The climate in the area is already influenced by its position behind the first northern Alpine
chains, which are shielding part of the precipitation arriving with moist air masses from the
north-west (rain shadow effect). It can therefore be classified as belonging to the inner
alpine/continental climate with annual precipitation between 600 and 1000 mm. The climate
data considered here covers the period from 1971 to 2000 CE (Central Institution for
Meteorology and Geodynamics of Austria, (ZAMG, 2018)). In Landeck (785 m a.s.l.), mean annual
precipitation from 1971-2000 CE was at 753 mm with maxima during the vegetation period from
June to August. A similar pattern, with a lower precipitation of only 633 mm*a-1 was recorded
for Prutz, which is about 5 km south of the Piller Saddle. The mean annual temperatures in
Landeck and Prutz during that period were 8°C and 6.8°C respectively, so that it should be
around 4 to 5°C lower on the Piller Saddle due to the higher altitude. When considering four of
the closest climate stations around the site (Landeck, Imst, Prutz and Obergurgl), the
predominant wind directions were SW and NE.
5.1.3 Coring site description (Piller Mire)
We carried out a first survey of the supposedly undisturbed part of the Piller Mire complex in
late July 2016 (Figure 23). The mire stretches about 380 m in length from west to east and
between 30 to 100 m in width from north to south. The mire’s surface is at an elevation of about
1540 m a.s.l. and thus within the lower subalpine vegetation zone. It is within a topographical
depression, which is not surrounded by steep slopes but is probably up to 15 m deep (Naturpark
Kaunergrat, 2000).
There is no channelled surface inflow, but a tiny stream leaves at the mire’s eastern end
(“rechter Kohlplatzbach”). Although it was neither visible by eye in the field nor on satellite
imagery, the digital terrain model (State of Tyrol, 2019b) indicates a tiny channel structure in
the mire’s centre, which leads toward this outlet.
81 Piller Mire
Figure 25: Piller Mire borehole, showing the high water level. Vegetation includes Sphagnum, Eriophorum and
Andromeda polifolata.
During three consecutive visits to the mire in 2016 and 2017 (July, August, September), the
observed water table was just a few centimetre below surface (see Figure 25), even during hot
and dry periods, which is hinting at permanently water-logged conditions.
The mire vegetation consists primarily of bog species like Sphagnum, Andromeda polifolata,
Drosera and Cyperaceae in the centred areas. Towards the margins, stands of Pinus mugo
rotundata (a mire subspecies) are dominating. All around the mire, the dryer slopes are
dominated by a dense Picea forest, mixed with Pinus and Larix (Heiss, 2008), which surrounds
the mire into all directions by almost one km the least.
Being part of a complex of several smaller mires, a nature path is leading along the northern
flank of the mire, which is declared a national “natural monument” of Austria since 1971. A
wooden watch tower was constructed recently between the path and the north-western side of
the Piller Mire. Parallel to the footpath and less than 50 m from the wooden tower, an overhead
power line was constructed some decades ago. No traces of peat extraction could be observed
at the coring site, even if it is only around 100 m south of a former peat mining facility to the
north-east (Figure 24). At least nowadays, agriculture or livestock grazing do not exist in the
direct vicinity. Their impact increases behind the dense forests on cleared areas, for example
upslope to the Venet or downslope towards Fließ or the villages in the lower Pitz and Kauner
Valley.
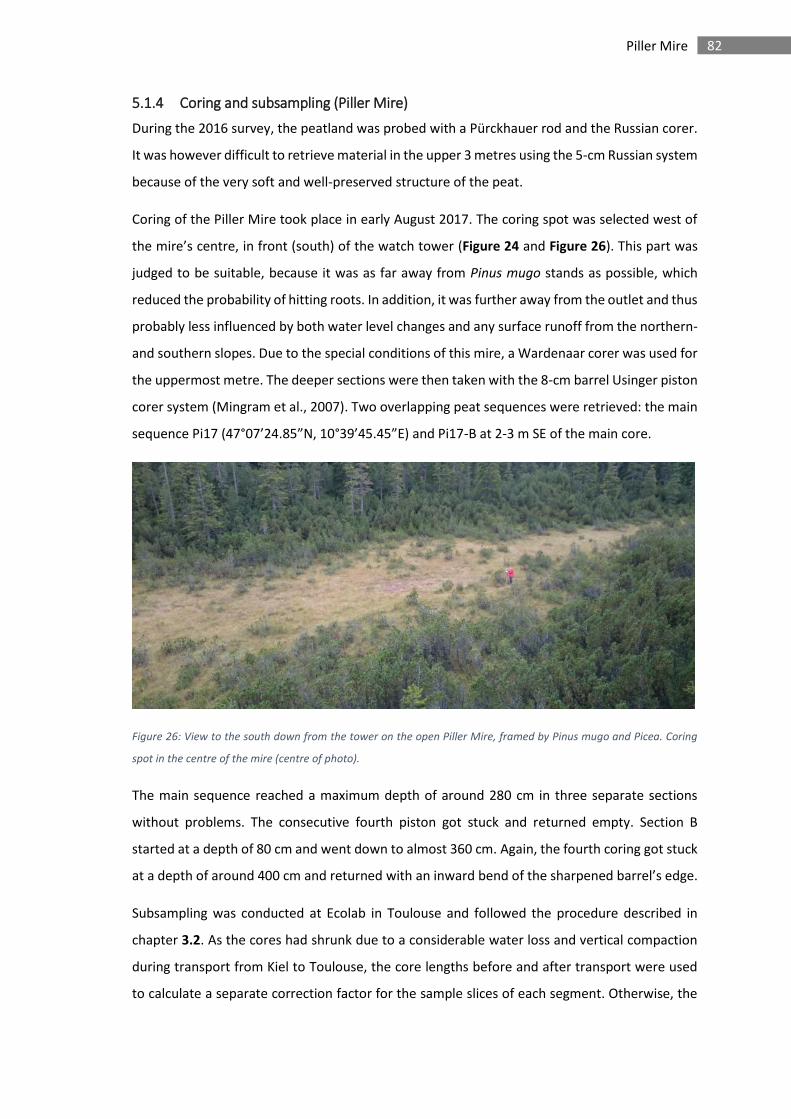
82 Piller Mire
5.1.4 Coring and subsampling (Piller Mire)
During the 2016 survey, the peatland was probed with a Pürckhauer rod and the Russian corer.
It was however difficult to retrieve material in the upper 3 metres using the 5-cm Russian system
because of the very soft and well-preserved structure of the peat.
Coring of the Piller Mire took place in early August 2017. The coring spot was selected west of
the mire’s centre, in front (south) of the watch tower (Figure 24 and Figure 26). This part was
judged to be suitable, because it was as far away from Pinus mugo stands as possible, which
reduced the probability of hitting roots. In addition, it was further away from the outlet and thus
probably less influenced by both water level changes and any surface runoff from the northern-
and southern slopes. Due to the special conditions of this mire, a Wardenaar corer was used for
the uppermost metre. The deeper sections were then taken with the 8-cm barrel Usinger piston
corer system (Mingram et al., 2007). Two overlapping peat sequences were retrieved: the main
sequence Pi17 (47°07’24.85”N, 10°39’45.45”E) and Pi17-B at 2-3 m SE of the main core.
Figure 26: View to the south down from the tower on the open Piller Mire, framed by Pinus mugo and Picea. Coring
spot in the centre of the mire (centre of photo).
The main sequence reached a maximum depth of around 280 cm in three separate sections
without problems. The consecutive fourth piston got stuck and returned empty. Section B
started at a depth of 80 cm and went down to almost 360 cm. Again, the fourth coring got stuck
at a depth of around 400 cm and returned with an inward bend of the sharpened barrel’s edge.
Subsampling was conducted at Ecolab in Toulouse and followed the procedure described in
chapter 3.2. As the cores had shrunk due to a considerable water loss and vertical compaction
during transport from Kiel to Toulouse, the core lengths before and after transport were used
to calculate a separate correction factor for the sample slices of each segment. Otherwise, the
83 Piller Mire
calculated mid-point depths of the slices would not be true to their respective original depth in
the mire. By doing so, also the dry bulk density and depending calculations were corrected.
5.2 Results & discussion (Piller Mire)
5.2.1 Core description (Pi17, Piller Mire)
Due to the absence of any distinct layers below the first metre, a systematic detailed description
of the Piller Mire core was difficult and did not prove to be helpful. Furthermore, ongoing colour
changing during the process of oxidation of the core surface was not fully completed at the time
of core-scanning and complicated the visual examination. A line scan of the Pi17 core can be
found in Suppl. Figure 2.
Except for the topmost part, the different core sections of Pi17 were very similar in their brown
colour and structure. They all had in common that the peat was very soft and wet. The degree
of decomposition was relatively low over the whole profile, which allowed the determination of
macro remains. The mire was dominated by Sphagnum and other bog species, which is
suggesting that ombrotrophic conditions prevailed permanently. Furthermore, light and fine but
very few muscovite flakes of mm-scale were found evenly dispersed along the whole profile’s
outside without being concentrated in any part of it. Mineral layers were neither observed in
the main nor in the parallel core B.
In the lower part, darker peat layers with an obviously lower humification were found at depths
of 338-339 cm, 328-329 cm, 301-302 cm, 253-257 cm and at 206 cm. A higher decomposition
was observed around 185 cm. In the upper part, darker layers showed up again at 160-162 cm
and at 100-101 cm. A generally darker and less soft or light peat with a higher decomposition
was observed at a depth between 92-87 cm, which got lesser until 68 cm. The layers above were
showing a decreasing humification up to 28 cm depth, with peat that was strongly dominated
by Sphagnum and Eriophorum. Along this gradient, the colour changed from dark brown to an
almost reddish/yellowish light brown. The upper 19 cm consisted almost solely of Sphagnum
without any visible humification.
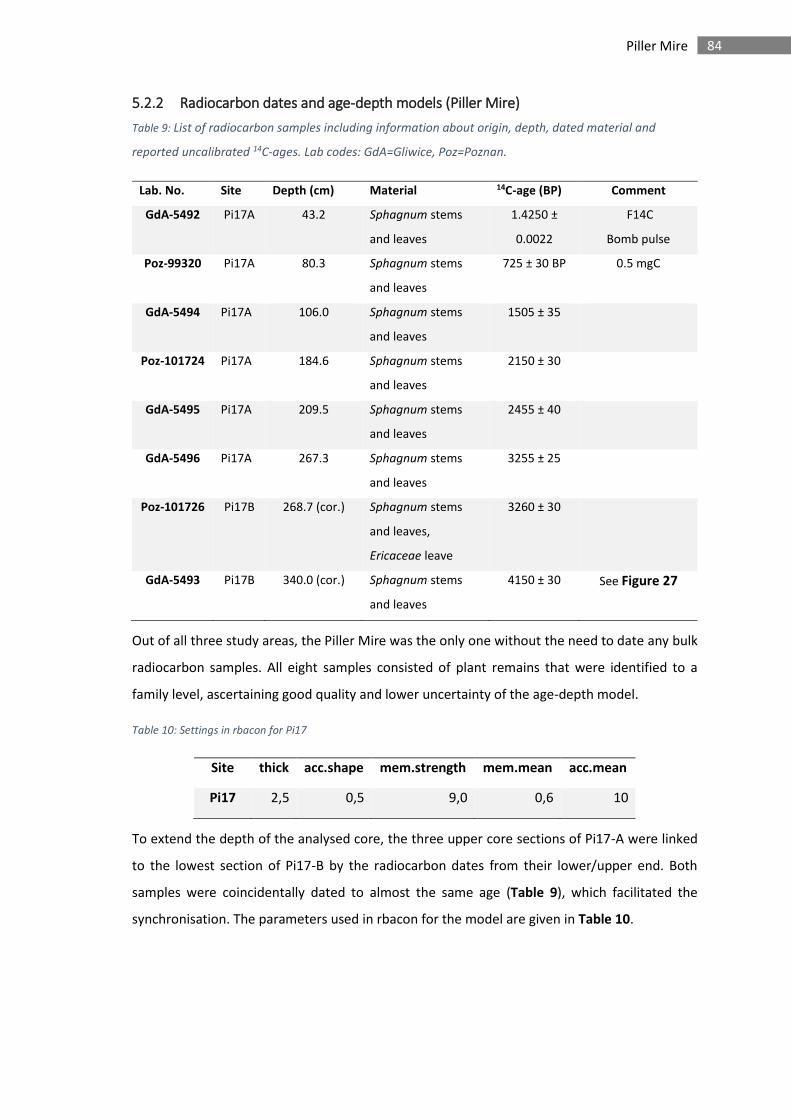
84 Piller Mire
5.2.2 Radiocarbon dates and age-depth models (Piller Mire)
Table 9: List of radiocarbon samples including information about origin, depth, dated material and
reported uncalibrated 14C-ages. Lab codes: GdA=Gliwice, Poz=Poznan.
Lab. No. Site Depth (cm) Material 14C-age (BP) Comment
GdA-5492 Pi17A 43.2 Sphagnum stems
and leaves
1.4250 ±
0.0022
F14C
Bomb pulse
Poz-99320 Pi17A 80.3 Sphagnum stems
and leaves
725 ± 30 BP 0.5 mgC
GdA-5494 Pi17A 106.0 Sphagnum stems
and leaves
1505 ± 35
Poz-101724 Pi17A 184.6 Sphagnum stems
and leaves
2150 ± 30
GdA-5495 Pi17A 209.5 Sphagnum stems
and leaves
2455 ± 40
GdA-5496 Pi17A 267.3 Sphagnum stems
and leaves
3255 ± 25
Poz-101726 Pi17B 268.7 (cor.) Sphagnum stems
and leaves,
Ericaceae leave
3260 ± 30
GdA-5493 Pi17B 340.0 (cor.) Sphagnum stems
and leaves
4150 ± 30 See Figure 27
Out of all three study areas, the Piller Mire was the only one without the need to date any bulk
radiocarbon samples. All eight samples consisted of plant remains that were identified to a
family level, ascertaining good quality and lower uncertainty of the age-depth model.
Table 10: Settings in rbacon for Pi17
Site thick acc.shape mem.strength mem.mean acc.mean
Pi17 2,5 0,5 9,0 0,6 10
To extend the depth of the analysed core, the three upper core sections of Pi17-A were linked
to the lowest section of Pi17-B by the radiocarbon dates from their lower/upper end. Both
samples were coincidentally dated to almost the same age (Table 9), which facilitated the
synchronisation. The parameters used in rbacon for the model are given in Table 10.
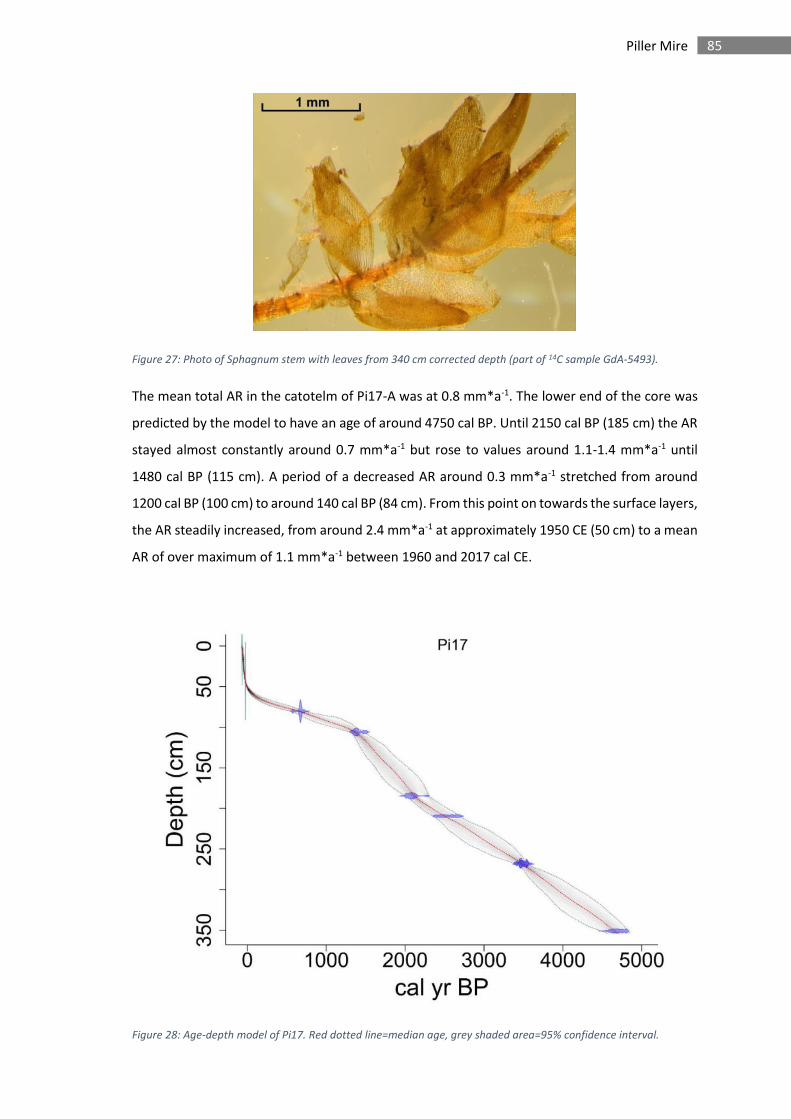
85 Piller Mire
Figure 27: Photo of Sphagnum stem with leaves from 340 cm corrected depth (part of 14C sample GdA-5493).
The mean total AR in the catotelm of Pi17-A was at 0.8 mm*a-1. The lower end of the core was
predicted by the model to have an age of around 4750 cal BP. Until 2150 cal BP (185 cm) the AR
stayed almost constantly around 0.7 mm*a-1 but rose to values around 1.1-1.4 mm*a-1 until
1480 cal BP (115 cm). A period of a decreased AR around 0.3 mm*a-1 stretched from around
1200 cal BP (100 cm) to around 140 cal BP (84 cm). From this point on towards the surface layers,
the AR steadily increased, from around 2.4 mm*a-1 at approximately 1950 CE (50 cm) to a mean
AR of over maximum of 1.1 mm*a-1 between 1960 and 2017 cal CE.
Figure 28: Age-depth model of Pi17. Red dotted line=median age, grey shaded area=95% confidence interval.
86 Piller Mire
Similarly as for the Kleinwalser Valley cores, the age-depth model in the upmost part was built
upon a single bomb-pulse radiocarbon date for the upper part, but the Pb EF profile (cf. Figure
36) helped again to confine this age: this time to the declining slope of the pulse (ca. -23 cal BP).
5.2.3 Geochemistry (Piller Mire)
Out of a total of 238 subsamples of the Pi17-sequence, 143 sub-samples were selected for
geochemical analysis by pXRF. Of these, 63 were measured with ICP-MS. All measurements were
carried out by following the procedures described in the methods chapter (3.4.1 to 3.4.3).
5.2.3.1 Regression Analysis (Piller Mire)
Mire site specific conditions (e.g. surrounding geology, vegetation) could have unknown effects
on the behaviour of the pXRF analysis. Therefore, an individual regression analysis in the 63
samples of the Pi17-profile was conducted and is presented and briefly discussed in this chapter
for the elements that are potentially measurable by pXRF (Figure 29) and of which some can act
as potential proxies.
The cross-plots in Figure 29 show that the maximum concentrations are lower than in HFL. The
regression function between ICP-MS and pXRF measurements of Ti is linear and has a very good
fit of the regression model with a R²=0.98. The values from pXRF are, however, systematically
higher than the ICP-MS results. Unlike HFL or the CRMs, the Piller Mire core did not contain
mineral sediment layers, but the linear regression is obviously valid for concentrations up to 630
mg*kg-1 of Ti. By removing the sample with the highest Ti concentration, the fit would increase
to an R² of almost 1. A similarly linear behaviour can be observed for Pb, although with a lower
overestimation and an R² of 0.99. The linear correlation of Ca works only for 75 % of the dataset,
whereas the other 25 % from samples of two separate parts in the core (100 to 160 and 190 to
230 cm) are far off the potential regression model. Without these sections, a fit of R²=0.75 would
be reached. With all samples included, the fit would decrease to a R² of 0.13. There were no
obvious differences in the material and also the other elements do not show irregularities in
samples of this part, which complicates the identification of a reason behind this behaviour of
Ca. Linear regressions with R² >0.96 are reported for Rb, Sr, and K while the fit for Zn is at
R²=0.93. With almost quantitative pXRF measurements, Sr is least influenced by the peat matrix.
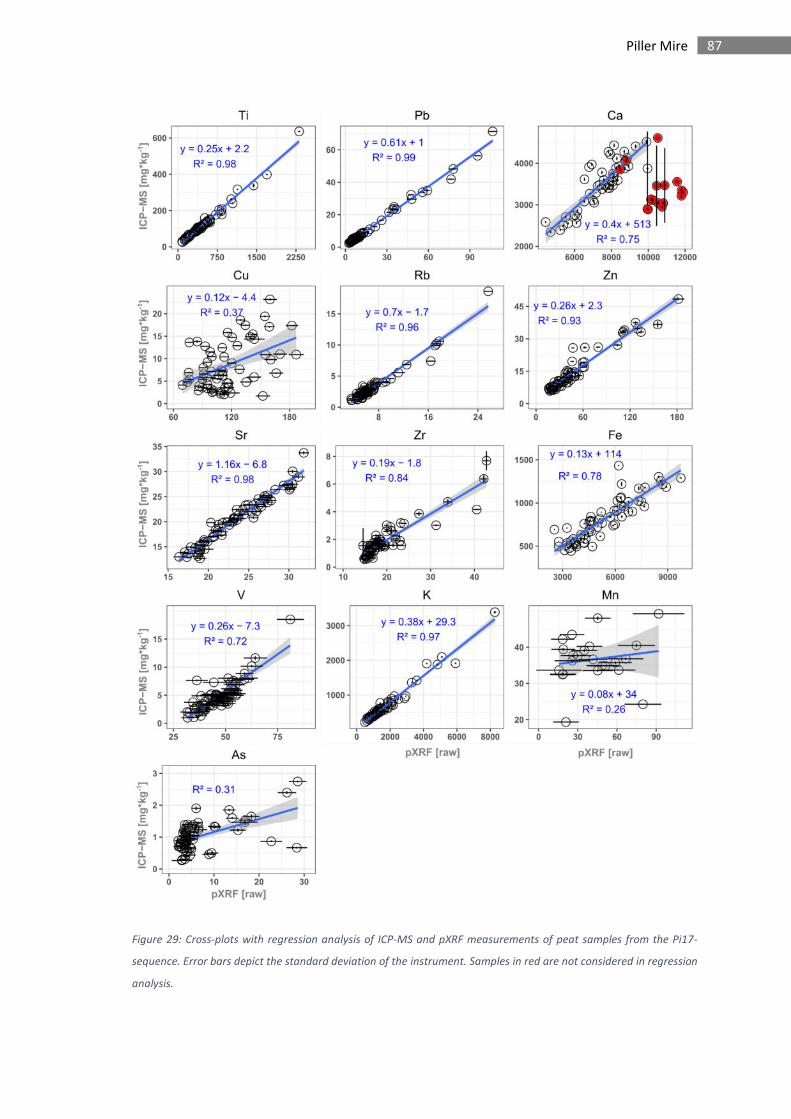
87 Piller Mire
Figure 29: Cross-plots with regression analysis of ICP-MS and pXRF measurements of peat samples from the Pi17-
sequence. Error bars depict the standard deviation of the instrument. Samples in red are not considered in regression
analysis.
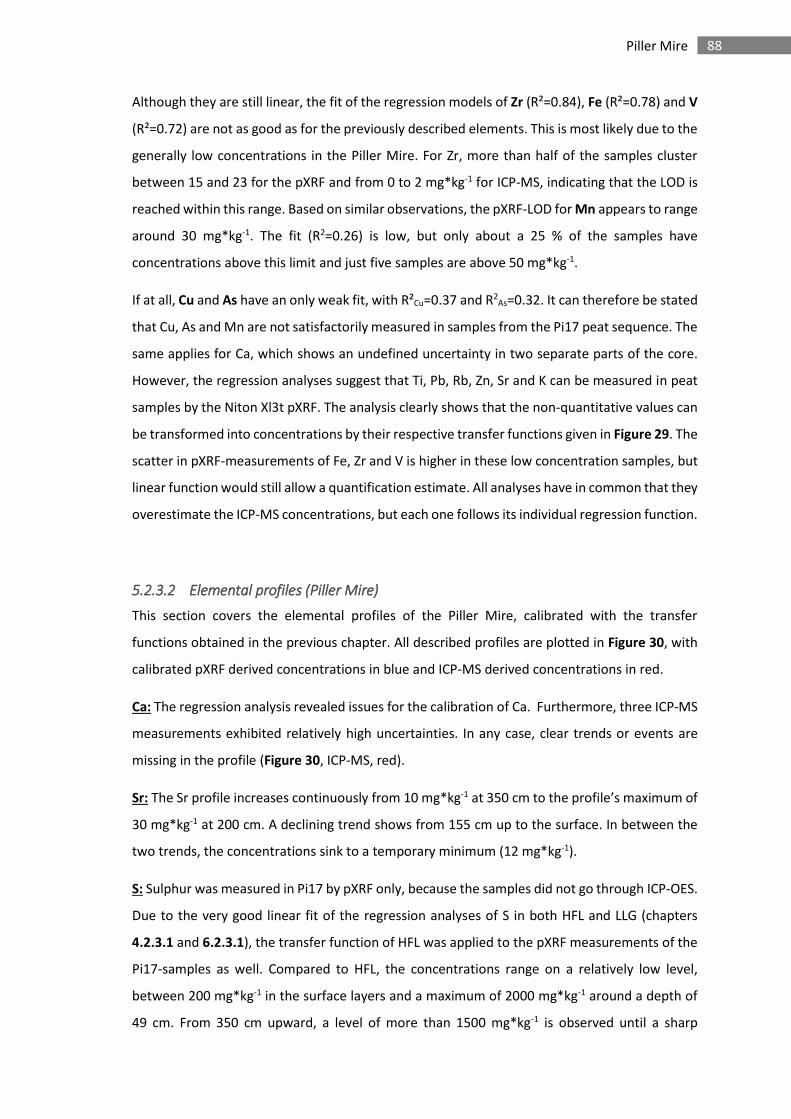
88 Piller Mire
Although they are still linear, the fit of the regression models of Zr (R²=0.84), Fe (R²=0.78) and V
(R²=0.72) are not as good as for the previously described elements. This is most likely due to the
generally low concentrations in the Piller Mire. For Zr, more than half of the samples cluster
between 15 and 23 for the pXRF and from 0 to 2 mg*kg-1 for ICP-MS, indicating that the LOD is
reached within this range. Based on similar observations, the pXRF-LOD for Mn appears to range
around 30 mg*kg-1. The fit (R2=0.26) is low, but only about a 25 % of the samples have
concentrations above this limit and just five samples are above 50 mg*kg-1.
If at all, Cu and As have an only weak fit, with R²Cu=0.37 and R2As=0.32. It can therefore be stated
that Cu, As and Mn are not satisfactorily measured in samples from the Pi17 peat sequence. The
same applies for Ca, which shows an undefined uncertainty in two separate parts of the core.
However, the regression analyses suggest that Ti, Pb, Rb, Zn, Sr and K can be measured in peat
samples by the Niton Xl3t pXRF. The analysis clearly shows that the non-quantitative values can
be transformed into concentrations by their respective transfer functions given in Figure 29. The
scatter in pXRF-measurements of Fe, Zr and V is higher in these low concentration samples, but
linear function would still allow a quantification estimate. All analyses have in common that they
overestimate the ICP-MS concentrations, but each one follows its individual regression function.
5.2.3.2 Elemental profiles (Piller Mire)
This section covers the elemental profiles of the Piller Mire, calibrated with the transfer
functions obtained in the previous chapter. All described profiles are plotted in Figure 30, with
calibrated pXRF derived concentrations in blue and ICP-MS derived concentrations in red.
Ca: The regression analysis revealed issues for the calibration of Ca. Furthermore, three ICP-MS
measurements exhibited relatively high uncertainties. In any case, clear trends or events are
missing in the profile (Figure 30, ICP-MS, red).
Sr: The Sr profile increases continuously from 10 mg*kg-1 at 350 cm to the profile’s maximum of
30 mg*kg-1 at 200 cm. A declining trend shows from 155 cm up to the surface. In between the
two trends, the concentrations sink to a temporary minimum (12 mg*kg-1).
S: Sulphur was measured in Pi17 by pXRF only, because the samples did not go through ICP-OES.
Due to the very good linear fit of the regression analyses of S in both HFL and LLG (chapters
4.2.3.1 and 6.2.3.1), the transfer function of HFL was applied to the pXRF measurements of the
Pi17-samples as well. Compared to HFL, the concentrations range on a relatively low level,
between 200 mg*kg-1 in the surface layers and a maximum of 2000 mg*kg-1 around a depth of
49 cm. From 350 cm upward, a level of more than 1500 mg*kg-1 is observed until a sharp
89 Piller Mire
decrease to around 1000 mg*kg-1 at 250 cm. Afterwards, a range between 1000 and 1500
mg*kg-1 is maintained before a rising trend climaxes at the above-mentioned depth of 49 cm.
Fe: The usually mobile Fe increases stepwise from the lower core’s end (600 mg*kg-1) and
doubles until 100 cm, just to decline by half again at the surface.
V: Vanadium stays between roughly 4 to 7 mg*kg-1 with only few outliers. A bold peak of 15
mg*kg-1 appears at about 200 cm, followed by a sharp decline to concentrations around 2 to 6
mg*kg-1 from 185 to 90 cm. Then, a period of concentrations of approx. 8 mg*kg-1 appears until
62 cm. Concentrations in the upmost 60 cm range around 2 mg*kg-1.
K: Potassium fluctuates between 300 to 700 mg*kg-1 in the lowermost 40 cm. A sharp peak of
>3000 mg*kg-1 is observed at 312.5 cm and a few layers with over 750 mg*kg-1 from 262 to 256
cm and around 228 cm. Then, a maximum of >3300 mg*kg-1 is reached around 200 cm. Two
smaller increases over 750 mg*kg-1 appear at 176 and 143 cm, before a stronger increase to
>2300 follows around 88 cm. The profile decreases again to less than 750 mg*kg-1 at 70 cm and
sharply rises again to over 1500 mg*kg-1 at 62 cm. Just afterwards, the concentrations stay
around 750 mg*kg-1 until 25 cm and increase towards the surface.
Rb: It behaves just like K with only slightly different levels of the peaks and maxima. The two
deeper peaks reach around 17 mg*kg-1 and the upper around 11 mg*kg-1 while otherwise, the
profile has < 5 mg*kg-1, with only minor exceptions around 259 and 143 cm and at the surface.
Ti: Titanium ranges mostly around 125 mg*kg-1. Considerably lower concentrations show at 340,
317, 251 and 171 cm as well as in the upper 50 cm. The peaks at 312.5 and around 200 cm reach
over 380 mg*kg-1 and over 600 mg*kg-1 respectively. Three smaller increases show around 330,
261 and at 143 cm. More than 400 mg*kg-1 are observed at 88 cm and at 62cm more than 260
mg*kg-1. For Zr, the highest peak is the one at 312.5 cm, with 12 mg*kg-1, while the next one at
200 cm shows only 9 mg*kg-1. The double peaks (88 and 62 cm) go up to 8 and to 4 mg*kg-1,
whereas the upmost 50 cm range around 1 mg*kg-1.
Pb: Lead is mostly on a level between 3 and 10 mg*kg-1 (Figure 30). A short phase with almost
20 mg*kg-1 shows around 328 cm, while smaller increases around 253, 200 and 143 cm are
subtle. Unlike the lithogenic elements, the Pb shows a triple- instead of a double peak in the
upper metre. Furthermore, the first peak is the smallest and the last peak has the strongest Pb-
concentration, illustrating that it cannot be bound to mineral input or soil dust. The first
significant increase from 5 to 35 mg*kg-1 is observed after 90 cm. The mid peak reaches 60
mg*kg-1 at 67 cm and the maximum elevation of almost 70 mg*kg-1 is at about 39 cm depth.
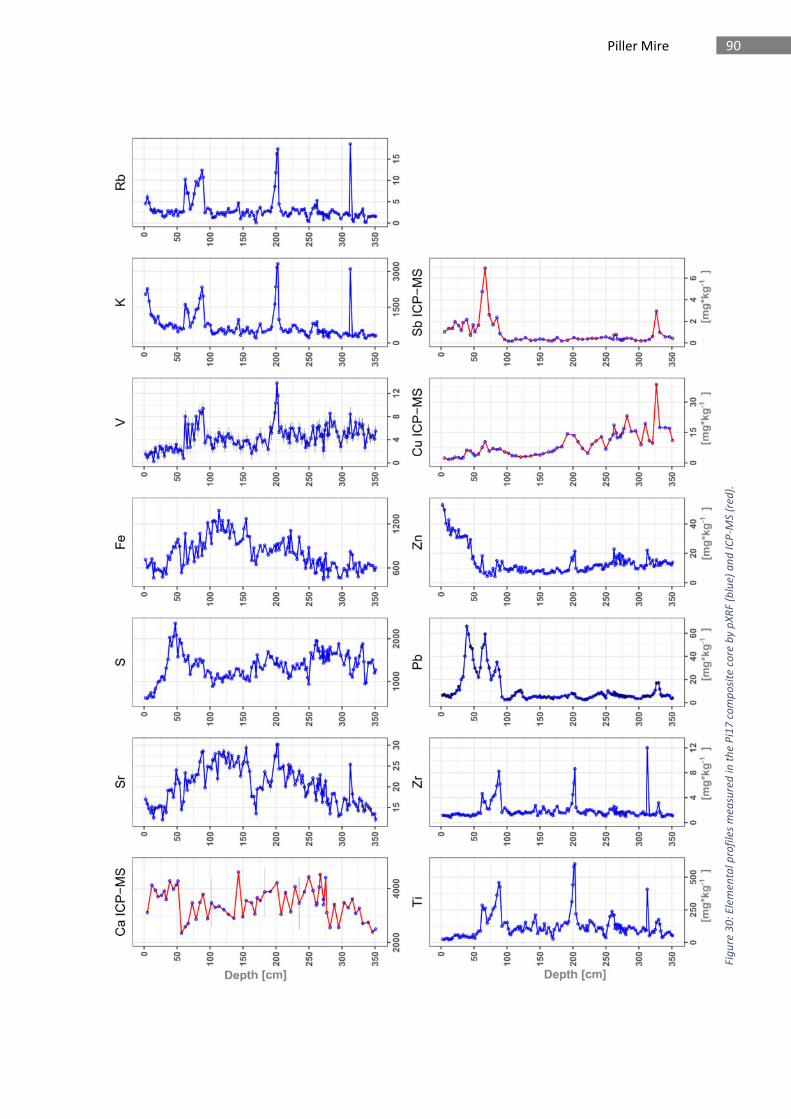
90 Piller Mire
Fig
ure
30
: E
lem
en
tal p
rofi
les
me
asu
red
in t
he
Pi1
7 c
om
po
site
co
re b
y p
XR
F (b
lue
) a
nd
IC
P-M
S (r
ed
).
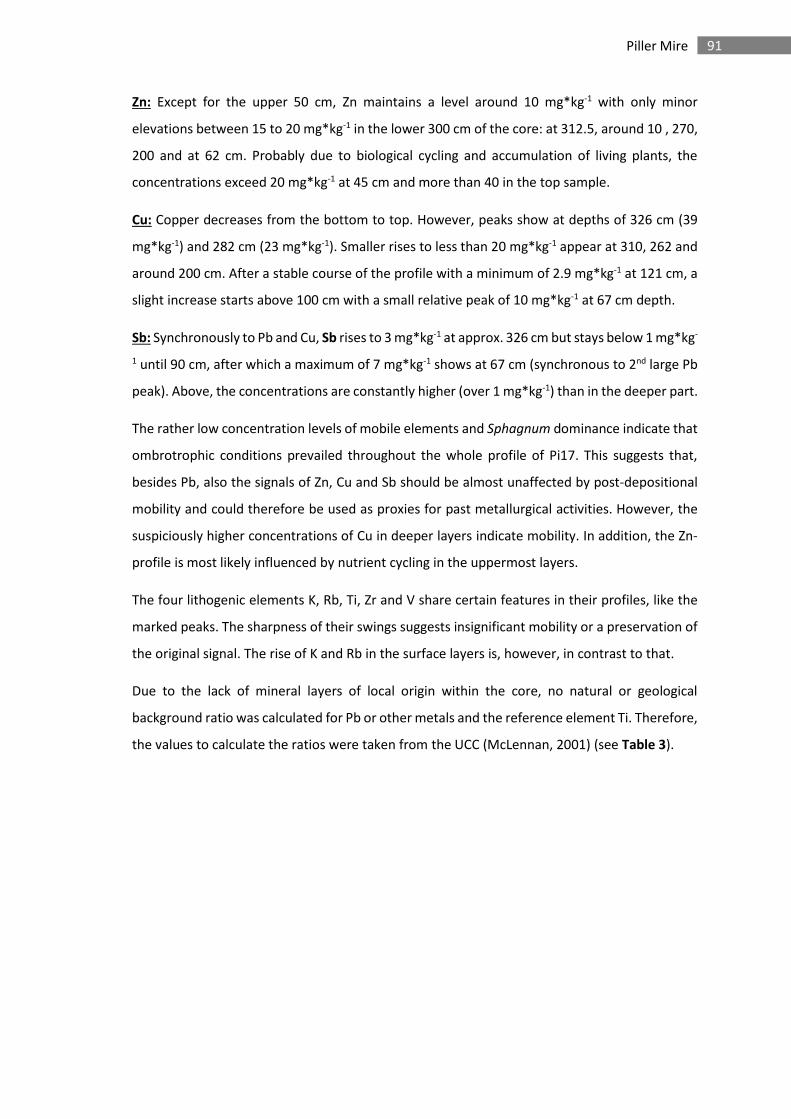
91 Piller Mire
Zn: Except for the upper 50 cm, Zn maintains a level around 10 mg*kg-1 with only minor
elevations between 15 to 20 mg*kg-1 in the lower 300 cm of the core: at 312.5, around 10 , 270,
200 and at 62 cm. Probably due to biological cycling and accumulation of living plants, the
concentrations exceed 20 mg*kg-1 at 45 cm and more than 40 in the top sample.
Cu: Copper decreases from the bottom to top. However, peaks show at depths of 326 cm (39
mg*kg-1) and 282 cm (23 mg*kg-1). Smaller rises to less than 20 mg*kg-1 appear at 310, 262 and
around 200 cm. After a stable course of the profile with a minimum of 2.9 mg*kg-1 at 121 cm, a
slight increase starts above 100 cm with a small relative peak of 10 mg*kg-1 at 67 cm depth.
Sb: Synchronously to Pb and Cu, Sb rises to 3 mg*kg-1 at approx. 326 cm but stays below 1 mg*kg-
1 until 90 cm, after which a maximum of 7 mg*kg-1 shows at 67 cm (synchronous to 2nd large Pb
peak). Above, the concentrations are constantly higher (over 1 mg*kg-1) than in the deeper part.
The rather low concentration levels of mobile elements and Sphagnum dominance indicate that
ombrotrophic conditions prevailed throughout the whole profile of Pi17. This suggests that,
besides Pb, also the signals of Zn, Cu and Sb should be almost unaffected by post-depositional
mobility and could therefore be used as proxies for past metallurgical activities. However, the
suspiciously higher concentrations of Cu in deeper layers indicate mobility. In addition, the Zn-
profile is most likely influenced by nutrient cycling in the uppermost layers.
The four lithogenic elements K, Rb, Ti, Zr and V share certain features in their profiles, like the
marked peaks. The sharpness of their swings suggests insignificant mobility or a preservation of
the original signal. The rise of K and Rb in the surface layers is, however, in contrast to that.
Due to the lack of mineral layers of local origin within the core, no natural or geological
background ratio was calculated for Pb or other metals and the reference element Ti. Therefore,
the values to calculate the ratios were taken from the UCC (McLennan, 2001) (see Table 3).
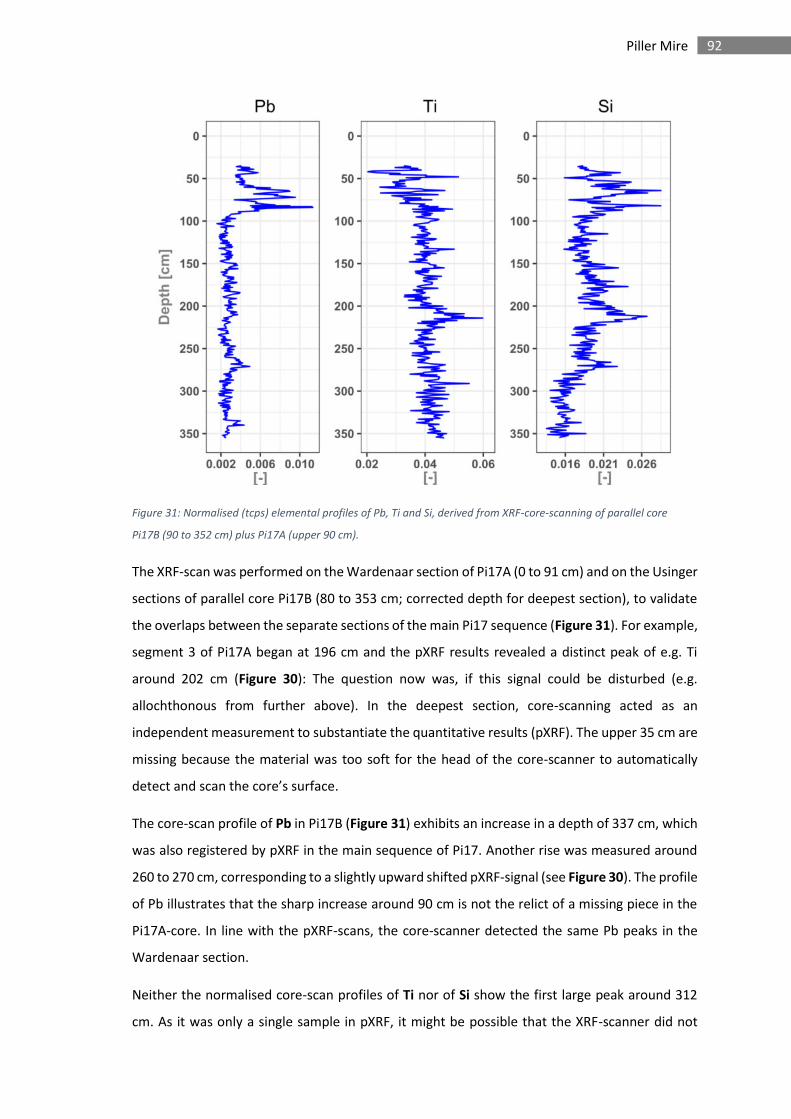
92 Piller Mire
Figure 31: Normalised (tcps) elemental profiles of Pb, Ti and Si, derived from XRF-core-scanning of parallel core
Pi17B (90 to 352 cm) plus Pi17A (upper 90 cm).
The XRF-scan was performed on the Wardenaar section of Pi17A (0 to 91 cm) and on the Usinger
sections of parallel core Pi17B (80 to 353 cm; corrected depth for deepest section), to validate
the overlaps between the separate sections of the main Pi17 sequence (Figure 31). For example,
segment 3 of Pi17A began at 196 cm and the pXRF results revealed a distinct peak of e.g. Ti
around 202 cm (Figure 30): The question now was, if this signal could be disturbed (e.g.
allochthonous from further above). In the deepest section, core-scanning acted as an
independent measurement to substantiate the quantitative results (pXRF). The upper 35 cm are
missing because the material was too soft for the head of the core-scanner to automatically
detect and scan the core’s surface.
The core-scan profile of Pb in Pi17B (Figure 31) exhibits an increase in a depth of 337 cm, which
was also registered by pXRF in the main sequence of Pi17. Another rise was measured around
260 to 270 cm, corresponding to a slightly upward shifted pXRF-signal (see Figure 30). The profile
of Pb illustrates that the sharp increase around 90 cm is not the relict of a missing piece in the
Pi17A-core. In line with the pXRF-scans, the core-scanner detected the same Pb peaks in the
Wardenaar section.
Neither the normalised core-scan profiles of Ti nor of Si show the first large peak around 312
cm. As it was only a single sample in pXRF, it might be possible that the XRF-scanner did not
93 Piller Mire
catch this very thin signal due to the 1 cm resolution. Above 275 cm, the first significant increase
corresponds well to an elevated signal of lithogenic elements in the pXRF—measurements of
the main sequence. The peak of Ti below 200 cm in Pi17A (top of core segment) was also
detected in Pi17B, although shifted about 10 cm deeper (as for Pb). It confirms that this signal
was not the result of disturbances (e.g. spread material). While the pXRF signal of Ti went up
significantly between 100 and 50 cm, the detected Ti in the core-scan decreased to a lower base
level in this part. Just as in HFL, the XRF-scaning data of Si seems to reflect the true Ti-signal
better than Ti (see Figure 31). Such very light peat with generally very low concentrations
(counts) probably hampers the correct measurement by the Avaatech-scanner.
5.2.3.3 PCA (Piller Mire)
A PCA for the Piller Mire profile was performed, based on ICP-MS, similarly to the PCA in HFL.
Here, the uppermost 25 cm were excluded to reduce influence of the living vegetation. Ca, Mn
and As were excluded, either due to issues in the analysis or an unsuccessful calibration. Three
components explain about 90 % of the total variance, but grouping the elements is not trivial
(Figure 32). Mainly Ti, Zr, V, Al and, in decreasing order, Nd, Sm, Rb, K, Sr, Fe and Cu determine
the largest and probably lithogenic component (PC1). The conformity of Sr and Fe is probably
due to their mobility in the peat column, whereas Pb and Sb group together as rather recent
anthropogenic pollutants. It appears that the trace metals Cu, Zn, Sb and Pb are responsible for
a large part of the total variance of PC3. However, no explanation can be presented for the
relation between Sm, Nd, Al and Cu.
Figure 32: PCA of ICP-MS measurements in the Pi17 core. Upper 25 cm (living vegetation) excluded.
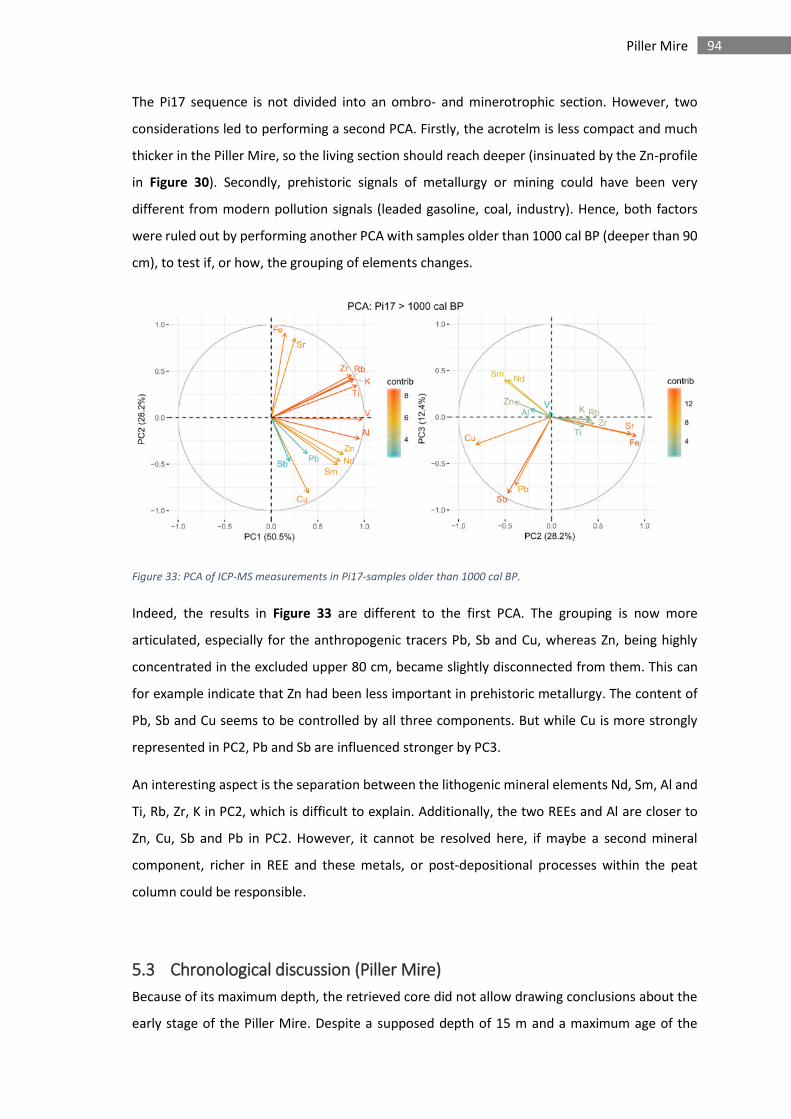
94 Piller Mire
The Pi17 sequence is not divided into an ombro- and minerotrophic section. However, two
considerations led to performing a second PCA. Firstly, the acrotelm is less compact and much
thicker in the Piller Mire, so the living section should reach deeper (insinuated by the Zn-profile
in Figure 30). Secondly, prehistoric signals of metallurgy or mining could have been very
different from modern pollution signals (leaded gasoline, coal, industry). Hence, both factors
were ruled out by performing another PCA with samples older than 1000 cal BP (deeper than 90
cm), to test if, or how, the grouping of elements changes.
Figure 33: PCA of ICP-MS measurements in Pi17-samples older than 1000 cal BP.
Indeed, the results in Figure 33 are different to the first PCA. The grouping is now more
articulated, especially for the anthropogenic tracers Pb, Sb and Cu, whereas Zn, being highly
concentrated in the excluded upper 80 cm, became slightly disconnected from them. This can
for example indicate that Zn had been less important in prehistoric metallurgy. The content of
Pb, Sb and Cu seems to be controlled by all three components. But while Cu is more strongly
represented in PC2, Pb and Sb are influenced stronger by PC3.
An interesting aspect is the separation between the lithogenic mineral elements Nd, Sm, Al and
Ti, Rb, Zr, K in PC2, which is difficult to explain. Additionally, the two REEs and Al are closer to
Zn, Cu, Sb and Pb in PC2. However, it cannot be resolved here, if maybe a second mineral
component, richer in REE and these metals, or post-depositional processes within the peat
column could be responsible.
5.3 Chronological discussion (Piller Mire)
Because of its maximum depth, the retrieved core did not allow drawing conclusions about the
early stage of the Piller Mire. Despite a supposed depth of 15 m and a maximum age of the
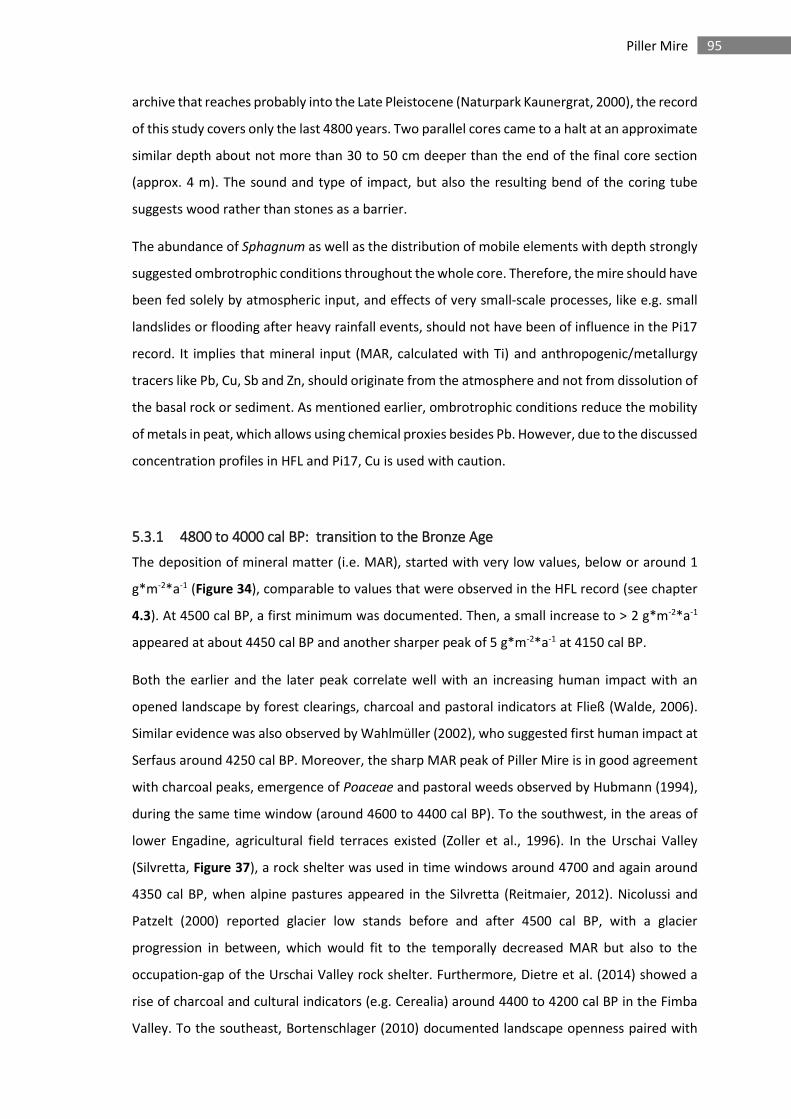
95 Piller Mire
archive that reaches probably into the Late Pleistocene (Naturpark Kaunergrat, 2000), the record
of this study covers only the last 4800 years. Two parallel cores came to a halt at an approximate
similar depth about not more than 30 to 50 cm deeper than the end of the final core section
(approx. 4 m). The sound and type of impact, but also the resulting bend of the coring tube
suggests wood rather than stones as a barrier.
The abundance of Sphagnum as well as the distribution of mobile elements with depth strongly
suggested ombrotrophic conditions throughout the whole core. Therefore, the mire should have
been fed solely by atmospheric input, and effects of very small-scale processes, like e.g. small
landslides or flooding after heavy rainfall events, should not have been of influence in the Pi17
record. It implies that mineral input (MAR, calculated with Ti) and anthropogenic/metallurgy
tracers like Pb, Cu, Sb and Zn, should originate from the atmosphere and not from dissolution of
the basal rock or sediment. As mentioned earlier, ombrotrophic conditions reduce the mobility
of metals in peat, which allows using chemical proxies besides Pb. However, due to the discussed
concentration profiles in HFL and Pi17, Cu is used with caution.
5.3.1 4800 to 4000 cal BP: transition to the Bronze Age
The deposition of mineral matter (i.e. MAR), started with very low values, below or around 1
g*m-2*a-1 (Figure 34), comparable to values that were observed in the HFL record (see chapter
4.3). At 4500 cal BP, a first minimum was documented. Then, a small increase to > 2 g*m-2*a-1
appeared at about 4450 cal BP and another sharper peak of 5 g*m-2*a-1 at 4150 cal BP.
Both the earlier and the later peak correlate well with an increasing human impact with an
opened landscape by forest clearings, charcoal and pastoral indicators at Fließ (Walde, 2006).
Similar evidence was also observed by Wahlmüller (2002), who suggested first human impact at
Serfaus around 4250 cal BP. Moreover, the sharp MAR peak of Piller Mire is in good agreement
with charcoal peaks, emergence of Poaceae and pastoral weeds observed by Hubmann (1994),
during the same time window (around 4600 to 4400 cal BP). To the southwest, in the areas of
lower Engadine, agricultural field terraces existed (Zoller et al., 1996). In the Urschai Valley
(Silvretta, Figure 37), a rock shelter was used in time windows around 4700 and again around
4350 cal BP, when alpine pastures appeared in the Silvretta (Reitmaier, 2012). Nicolussi and
Patzelt (2000) reported glacier low stands before and after 4500 cal BP, with a glacier
progression in between, which would fit to the temporally decreased MAR but also to the
occupation-gap of the Urschai Valley rock shelter. Furthermore, Dietre et al. (2014) showed a
rise of charcoal and cultural indicators (e.g. Cerealia) around 4400 to 4200 cal BP in the Fimba
Valley. To the southeast, Bortenschlager (2010) documented landscape openness paired with
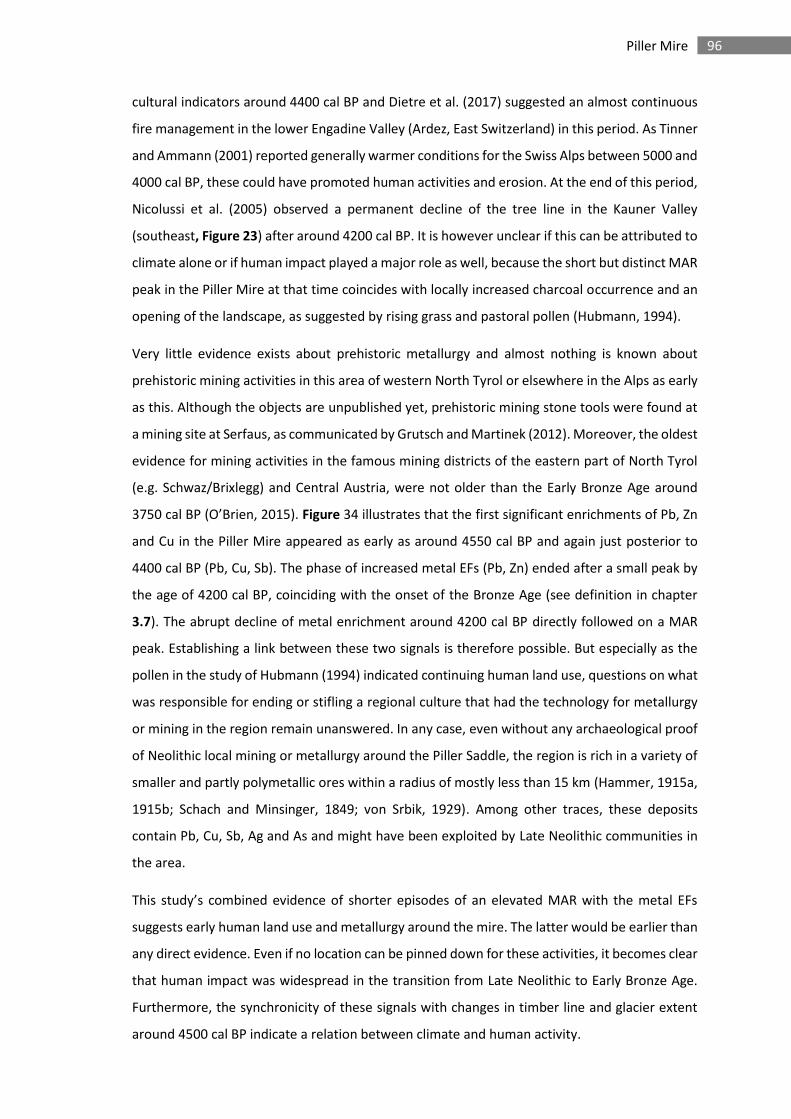
96 Piller Mire
cultural indicators around 4400 cal BP and Dietre et al. (2017) suggested an almost continuous
fire management in the lower Engadine Valley (Ardez, East Switzerland) in this period. As Tinner
and Ammann (2001) reported generally warmer conditions for the Swiss Alps between 5000 and
4000 cal BP, these could have promoted human activities and erosion. At the end of this period,
Nicolussi et al. (2005) observed a permanent decline of the tree line in the Kauner Valley
(southeast, Figure 23) after around 4200 cal BP. It is however unclear if this can be attributed to
climate alone or if human impact played a major role as well, because the short but distinct MAR
peak in the Piller Mire at that time coincides with locally increased charcoal occurrence and an
opening of the landscape, as suggested by rising grass and pastoral pollen (Hubmann, 1994).
Very little evidence exists about prehistoric metallurgy and almost nothing is known about
prehistoric mining activities in this area of western North Tyrol or elsewhere in the Alps as early
as this. Although the objects are unpublished yet, prehistoric mining stone tools were found at
a mining site at Serfaus, as communicated by Grutsch and Martinek (2012). Moreover, the oldest
evidence for mining activities in the famous mining districts of the eastern part of North Tyrol
(e.g. Schwaz/Brixlegg) and Central Austria, were not older than the Early Bronze Age around
3750 cal BP (O’Brien, 2015). Figure 34 illustrates that the first significant enrichments of Pb, Zn
and Cu in the Piller Mire appeared as early as around 4550 cal BP and again just posterior to
4400 cal BP (Pb, Cu, Sb). The phase of increased metal EFs (Pb, Zn) ended after a small peak by
the age of 4200 cal BP, coinciding with the onset of the Bronze Age (see definition in chapter
3.7). The abrupt decline of metal enrichment around 4200 cal BP directly followed on a MAR
peak. Establishing a link between these two signals is therefore possible. But especially as the
pollen in the study of Hubmann (1994) indicated continuing human land use, questions on what
was responsible for ending or stifling a regional culture that had the technology for metallurgy
or mining in the region remain unanswered. In any case, even without any archaeological proof
of Neolithic local mining or metallurgy around the Piller Saddle, the region is rich in a variety of
smaller and partly polymetallic ores within a radius of mostly less than 15 km (Hammer, 1915a,
1915b; Schach and Minsinger, 1849; von Srbik, 1929). Among other traces, these deposits
contain Pb, Cu, Sb, Ag and As and might have been exploited by Late Neolithic communities in
the area.
This study’s combined evidence of shorter episodes of an elevated MAR with the metal EFs
suggests early human land use and metallurgy around the mire. The latter would be earlier than
any direct evidence. Even if no location can be pinned down for these activities, it becomes clear
that human impact was widespread in the transition from Late Neolithic to Early Bronze Age.
Furthermore, the synchronicity of these signals with changes in timber line and glacier extent
around 4500 cal BP indicate a relation between climate and human activity.
97 Piller Mire
Figure 34: Chronological profiles of MAR, EF Pb (clipped at 10 % of max. EF), EF Zn, EF Cu and EF Sb in Pi17.
5.3.2 3900 to 2800 cal BP: Bronze Age
During the Early Bronze Age, the MAR had been stable on a low level around 1.5 g*m-2*a-1 until
a small increase was recorded directly prior to 3500 cal BP (Figure 34). A significant increase to
about 4 g*m-2*a-1 followed at 3400 cal BP but mineral input declined again, sinking to a minimum
of 0.3 g*m-2*a-1 at 3200 cal BP. Thereafter, it stayed relatively low around 1 g*m-2*a-1 with only
a slight increase towards 2800 cal BP.
Glacier progressions were documented in the Kauner Valley around 3600 cal BP (Nicolussi et al.,
2005) and the colder conditions could have hampered an earlier rise of human impact. In
contrast, receding glaciers in the Alps and a probably warming climate in a phase around 3640
to 3350 cal BP provided a better conditions and accessibility to the mountainous areas. Around
the age of 3450 cal BP, Hubmann (1994) found the first Cerealia pollen. Increasing human
activities in adjacent areas were also suggested by Wahlmüller (2002), Walde (2006) and
Hubmann (1994), who recorded rising pollen of grasses, herbs and pastoral indicators. The latter
also recorded a frequent use of fire by the presence of elevated charcoal values, which is in
accordance with generally increased fires in the Alps over the Bronze Age (Valese et al., 2014).
Direct archaeological evidence of a Bronze Age building in Fließ (Tomedi et al., 2009) and a Late
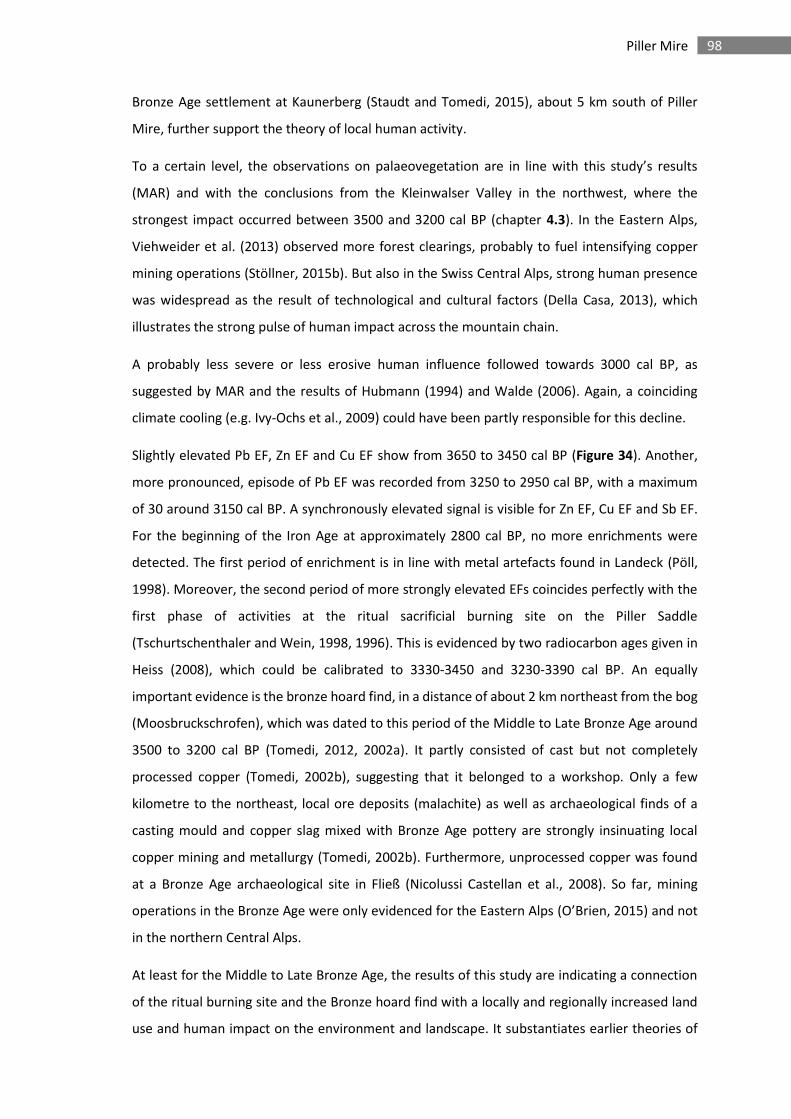
98 Piller Mire
Bronze Age settlement at Kaunerberg (Staudt and Tomedi, 2015), about 5 km south of Piller
Mire, further support the theory of local human activity.
To a certain level, the observations on palaeovegetation are in line with this study’s results
(MAR) and with the conclusions from the Kleinwalser Valley in the northwest, where the
strongest impact occurred between 3500 and 3200 cal BP (chapter 4.3). In the Eastern Alps,
Viehweider et al. (2013) observed more forest clearings, probably to fuel intensifying copper
mining operations (Stöllner, 2015b). But also in the Swiss Central Alps, strong human presence
was widespread as the result of technological and cultural factors (Della Casa, 2013), which
illustrates the strong pulse of human impact across the mountain chain.
A probably less severe or less erosive human influence followed towards 3000 cal BP, as
suggested by MAR and the results of Hubmann (1994) and Walde (2006). Again, a coinciding
climate cooling (e.g. Ivy-Ochs et al., 2009) could have been partly responsible for this decline.
Slightly elevated Pb EF, Zn EF and Cu EF show from 3650 to 3450 cal BP (Figure 34). Another,
more pronounced, episode of Pb EF was recorded from 3250 to 2950 cal BP, with a maximum
of 30 around 3150 cal BP. A synchronously elevated signal is visible for Zn EF, Cu EF and Sb EF.
For the beginning of the Iron Age at approximately 2800 cal BP, no more enrichments were
detected. The first period of enrichment is in line with metal artefacts found in Landeck (Pöll,
1998). Moreover, the second period of more strongly elevated EFs coincides perfectly with the
first phase of activities at the ritual sacrificial burning site on the Piller Saddle
(Tschurtschenthaler and Wein, 1998, 1996). This is evidenced by two radiocarbon ages given in
Heiss (2008), which could be calibrated to 3330-3450 and 3230-3390 cal BP. An equally
important evidence is the bronze hoard find, in a distance of about 2 km northeast from the bog
(Moosbruckschrofen), which was dated to this period of the Middle to Late Bronze Age around
3500 to 3200 cal BP (Tomedi, 2012, 2002a). It partly consisted of cast but not completely
processed copper (Tomedi, 2002b), suggesting that it belonged to a workshop. Only a few
kilometre to the northeast, local ore deposits (malachite) as well as archaeological finds of a
casting mould and copper slag mixed with Bronze Age pottery are strongly insinuating local
copper mining and metallurgy (Tomedi, 2002b). Furthermore, unprocessed copper was found
at a Bronze Age archaeological site in Fließ (Nicolussi Castellan et al., 2008). So far, mining
operations in the Bronze Age were only evidenced for the Eastern Alps (O’Brien, 2015) and not
in the northern Central Alps.
At least for the Middle to Late Bronze Age, the results of this study are indicating a connection
of the ritual burning site and the Bronze hoard find with a locally and regionally increased land
use and human impact on the environment and landscape. It substantiates earlier theories of
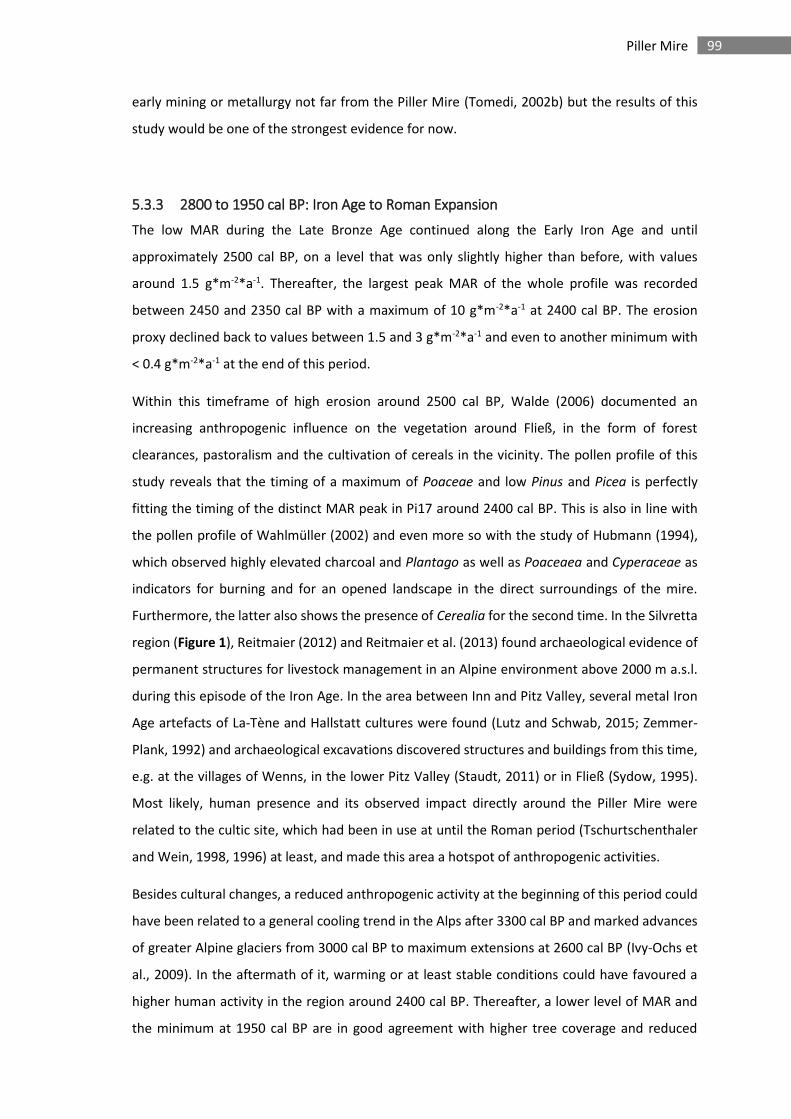
99 Piller Mire
early mining or metallurgy not far from the Piller Mire (Tomedi, 2002b) but the results of this
study would be one of the strongest evidence for now.
5.3.3 2800 to 1950 cal BP: Iron Age to Roman Expansion
The low MAR during the Late Bronze Age continued along the Early Iron Age and until
approximately 2500 cal BP, on a level that was only slightly higher than before, with values
around 1.5 g*m-2*a-1. Thereafter, the largest peak MAR of the whole profile was recorded
between 2450 and 2350 cal BP with a maximum of 10 g*m-2*a-1 at 2400 cal BP. The erosion
proxy declined back to values between 1.5 and 3 g*m-2*a-1 and even to another minimum with
< 0.4 g*m-2*a-1 at the end of this period.
Within this timeframe of high erosion around 2500 cal BP, Walde (2006) documented an
increasing anthropogenic influence on the vegetation around Fließ, in the form of forest
clearances, pastoralism and the cultivation of cereals in the vicinity. The pollen profile of this
study reveals that the timing of a maximum of Poaceae and low Pinus and Picea is perfectly
fitting the timing of the distinct MAR peak in Pi17 around 2400 cal BP. This is also in line with
the pollen profile of Wahlmüller (2002) and even more so with the study of Hubmann (1994),
which observed highly elevated charcoal and Plantago as well as Poaceaea and Cyperaceae as
indicators for burning and for an opened landscape in the direct surroundings of the mire.
Furthermore, the latter also shows the presence of Cerealia for the second time. In the Silvretta
region (Figure 1), Reitmaier (2012) and Reitmaier et al. (2013) found archaeological evidence of
permanent structures for livestock management in an Alpine environment above 2000 m a.s.l.
during this episode of the Iron Age. In the area between Inn and Pitz Valley, several metal Iron
Age artefacts of La-Tène and Hallstatt cultures were found (Lutz and Schwab, 2015; Zemmer-
Plank, 1992) and archaeological excavations discovered structures and buildings from this time,
e.g. at the villages of Wenns, in the lower Pitz Valley (Staudt, 2011) or in Fließ (Sydow, 1995).
Most likely, human presence and its observed impact directly around the Piller Mire were
related to the cultic site, which had been in use at until the Roman period (Tschurtschenthaler
and Wein, 1998, 1996) at least, and made this area a hotspot of anthropogenic activities.
Besides cultural changes, a reduced anthropogenic activity at the beginning of this period could
have been related to a general cooling trend in the Alps after 3300 cal BP and marked advances
of greater Alpine glaciers from 3000 cal BP to maximum extensions at 2600 cal BP (Ivy-Ochs et
al., 2009). In the aftermath of it, warming or at least stable conditions could have favoured a
higher human activity in the region around 2400 cal BP. Thereafter, a lower level of MAR and
the minimum at 1950 cal BP are in good agreement with higher tree coverage and reduced
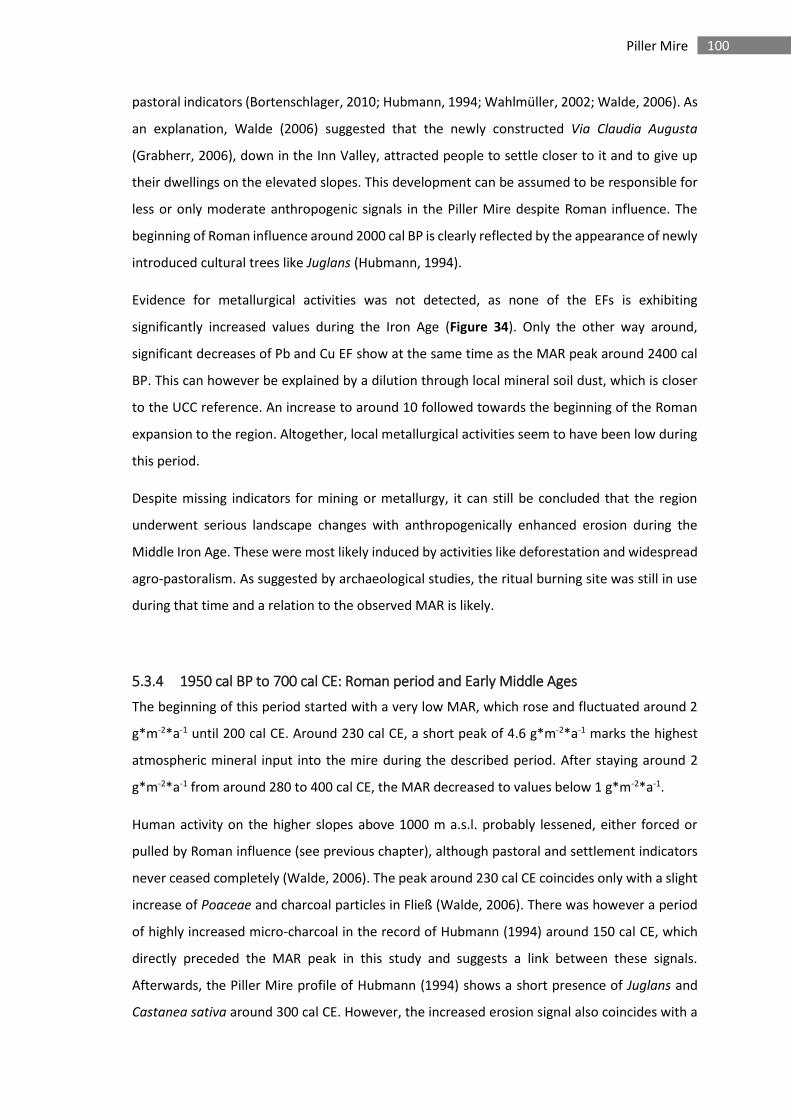
100 Piller Mire
pastoral indicators (Bortenschlager, 2010; Hubmann, 1994; Wahlmüller, 2002; Walde, 2006). As
an explanation, Walde (2006) suggested that the newly constructed Via Claudia Augusta
(Grabherr, 2006), down in the Inn Valley, attracted people to settle closer to it and to give up
their dwellings on the elevated slopes. This development can be assumed to be responsible for
less or only moderate anthropogenic signals in the Piller Mire despite Roman influence. The
beginning of Roman influence around 2000 cal BP is clearly reflected by the appearance of newly
introduced cultural trees like Juglans (Hubmann, 1994).
Evidence for metallurgical activities was not detected, as none of the EFs is exhibiting
significantly increased values during the Iron Age (Figure 34). Only the other way around,
significant decreases of Pb and Cu EF show at the same time as the MAR peak around 2400 cal
BP. This can however be explained by a dilution through local mineral soil dust, which is closer
to the UCC reference. An increase to around 10 followed towards the beginning of the Roman
expansion to the region. Altogether, local metallurgical activities seem to have been low during
this period.
Despite missing indicators for mining or metallurgy, it can still be concluded that the region
underwent serious landscape changes with anthropogenically enhanced erosion during the
Middle Iron Age. These were most likely induced by activities like deforestation and widespread
agro-pastoralism. As suggested by archaeological studies, the ritual burning site was still in use
during that time and a relation to the observed MAR is likely.
5.3.4 1950 cal BP to 700 cal CE: Roman period and Early Middle Ages
The beginning of this period started with a very low MAR, which rose and fluctuated around 2
g*m-2*a-1 until 200 cal CE. Around 230 cal CE, a short peak of 4.6 g*m-2*a-1 marks the highest
atmospheric mineral input into the mire during the described period. After staying around 2
g*m-2*a-1 from around 280 to 400 cal CE, the MAR decreased to values below 1 g*m-2*a-1.
Human activity on the higher slopes above 1000 m a.s.l. probably lessened, either forced or
pulled by Roman influence (see previous chapter), although pastoral and settlement indicators
never ceased completely (Walde, 2006). The peak around 230 cal CE coincides only with a slight
increase of Poaceae and charcoal particles in Fließ (Walde, 2006). There was however a period
of highly increased micro-charcoal in the record of Hubmann (1994) around 150 cal CE, which
directly preceded the MAR peak in this study and suggests a link between these signals.
Afterwards, the Piller Mire profile of Hubmann (1994) shows a short presence of Juglans and
Castanea sativa around 300 cal CE. However, the increased erosion signal also coincides with a
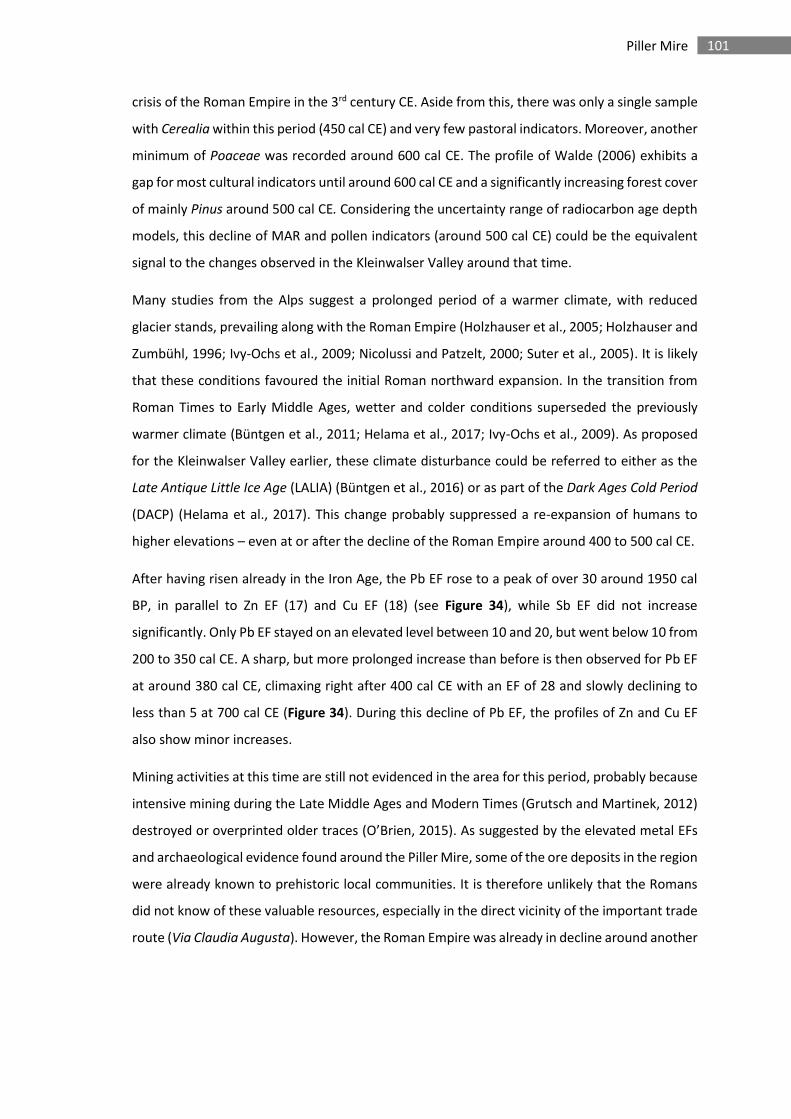
101 Piller Mire
crisis of the Roman Empire in the 3rd century CE. Aside from this, there was only a single sample
with Cerealia within this period (450 cal CE) and very few pastoral indicators. Moreover, another
minimum of Poaceae was recorded around 600 cal CE. The profile of Walde (2006) exhibits a
gap for most cultural indicators until around 600 cal CE and a significantly increasing forest cover
of mainly Pinus around 500 cal CE. Considering the uncertainty range of radiocarbon age depth
models, this decline of MAR and pollen indicators (around 500 cal CE) could be the equivalent
signal to the changes observed in the Kleinwalser Valley around that time.
Many studies from the Alps suggest a prolonged period of a warmer climate, with reduced
glacier stands, prevailing along with the Roman Empire (Holzhauser et al., 2005; Holzhauser and
Zumbühl, 1996; Ivy-Ochs et al., 2009; Nicolussi and Patzelt, 2000; Suter et al., 2005). It is likely
that these conditions favoured the initial Roman northward expansion. In the transition from
Roman Times to Early Middle Ages, wetter and colder conditions superseded the previously
warmer climate (Büntgen et al., 2011; Helama et al., 2017; Ivy-Ochs et al., 2009). As proposed
for the Kleinwalser Valley earlier, these climate disturbance could be referred to either as the
Late Antique Little Ice Age (LALIA) (Büntgen et al., 2016) or as part of the Dark Ages Cold Period
(DACP) (Helama et al., 2017). This change probably suppressed a re-expansion of humans to
higher elevations – even at or after the decline of the Roman Empire around 400 to 500 cal CE.
After having risen already in the Iron Age, the Pb EF rose to a peak of over 30 around 1950 cal
BP, in parallel to Zn EF (17) and Cu EF (18) (see Figure 34), while Sb EF did not increase
significantly. Only Pb EF stayed on an elevated level between 10 and 20, but went below 10 from
200 to 350 cal CE. A sharp, but more prolonged increase than before is then observed for Pb EF
at around 380 cal CE, climaxing right after 400 cal CE with an EF of 28 and slowly declining to
less than 5 at 700 cal CE (Figure 34). During this decline of Pb EF, the profiles of Zn and Cu EF
also show minor increases.
Mining activities at this time are still not evidenced in the area for this period, probably because
intensive mining during the Late Middle Ages and Modern Times (Grutsch and Martinek, 2012)
destroyed or overprinted older traces (O’Brien, 2015). As suggested by the elevated metal EFs
and archaeological evidence found around the Piller Mire, some of the ore deposits in the region
were already known to prehistoric local communities. It is therefore unlikely that the Romans
did not know of these valuable resources, especially in the direct vicinity of the important trade
route (Via Claudia Augusta). However, the Roman Empire was already in decline around another
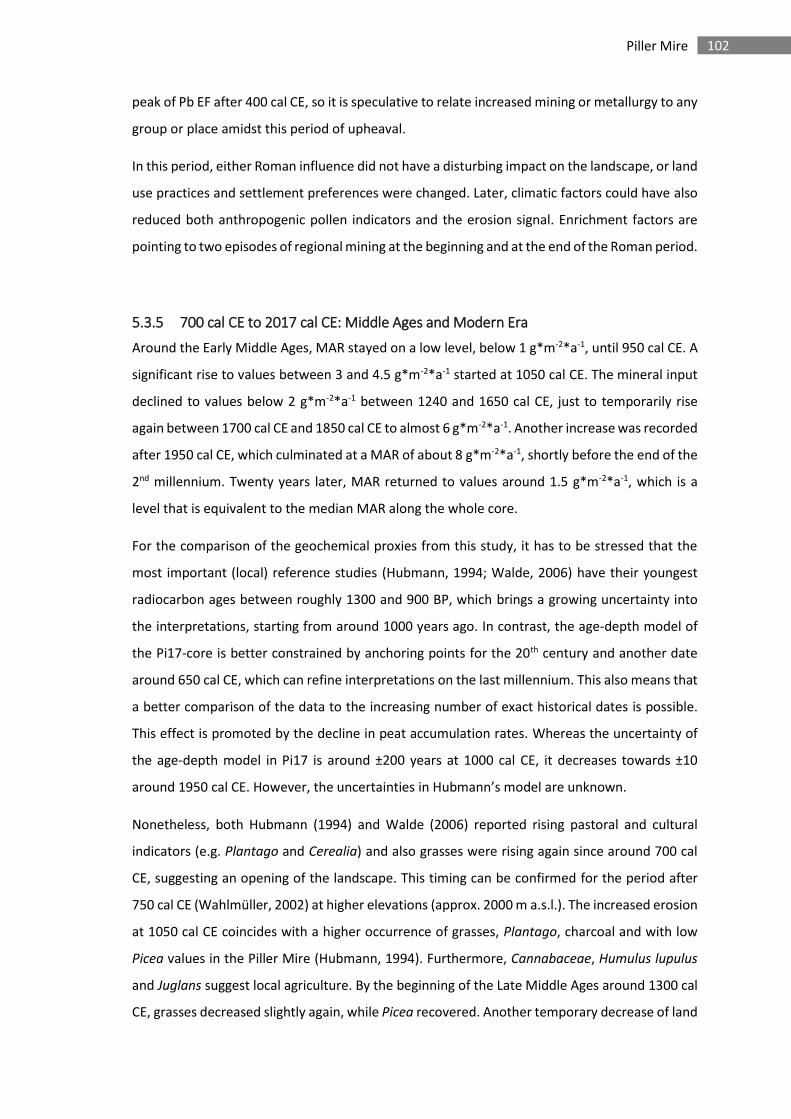
102 Piller Mire
peak of Pb EF after 400 cal CE, so it is speculative to relate increased mining or metallurgy to any
group or place amidst this period of upheaval.
In this period, either Roman influence did not have a disturbing impact on the landscape, or land
use practices and settlement preferences were changed. Later, climatic factors could have also
reduced both anthropogenic pollen indicators and the erosion signal. Enrichment factors are
pointing to two episodes of regional mining at the beginning and at the end of the Roman period.
5.3.5 700 cal CE to 2017 cal CE: Middle Ages and Modern Era
Around the Early Middle Ages, MAR stayed on a low level, below 1 g*m-2*a-1, until 950 cal CE. A
significant rise to values between 3 and 4.5 g*m-2*a-1 started at 1050 cal CE. The mineral input
declined to values below 2 g*m-2*a-1 between 1240 and 1650 cal CE, just to temporarily rise
again between 1700 cal CE and 1850 cal CE to almost 6 g*m-2*a-1. Another increase was recorded
after 1950 cal CE, which culminated at a MAR of about 8 g*m-2*a-1, shortly before the end of the
2nd millennium. Twenty years later, MAR returned to values around 1.5 g*m-2*a-1, which is a
level that is equivalent to the median MAR along the whole core.
For the comparison of the geochemical proxies from this study, it has to be stressed that the
most important (local) reference studies (Hubmann, 1994; Walde, 2006) have their youngest
radiocarbon ages between roughly 1300 and 900 BP, which brings a growing uncertainty into
the interpretations, starting from around 1000 years ago. In contrast, the age-depth model of
the Pi17-core is better constrained by anchoring points for the 20th century and another date
around 650 cal CE, which can refine interpretations on the last millennium. This also means that
a better comparison of the data to the increasing number of exact historical dates is possible.
This effect is promoted by the decline in peat accumulation rates. Whereas the uncertainty of
the age-depth model in Pi17 is around ±200 years at 1000 cal CE, it decreases towards ±10
around 1950 cal CE. However, the uncertainties in Hubmann’s model are unknown.
Nonetheless, both Hubmann (1994) and Walde (2006) reported rising pastoral and cultural
indicators (e.g. Plantago and Cerealia) and also grasses were rising again since around 700 cal
CE, suggesting an opening of the landscape. This timing can be confirmed for the period after
750 cal CE (Wahlmüller, 2002) at higher elevations (approx. 2000 m a.s.l.). The increased erosion
at 1050 cal CE coincides with a higher occurrence of grasses, Plantago, charcoal and with low
Picea values in the Piller Mire (Hubmann, 1994). Furthermore, Cannabaceae, Humulus lupulus
and Juglans suggest local agriculture. By the beginning of the Late Middle Ages around 1300 cal
CE, grasses decreased slightly again, while Picea recovered. Another temporary decrease of land
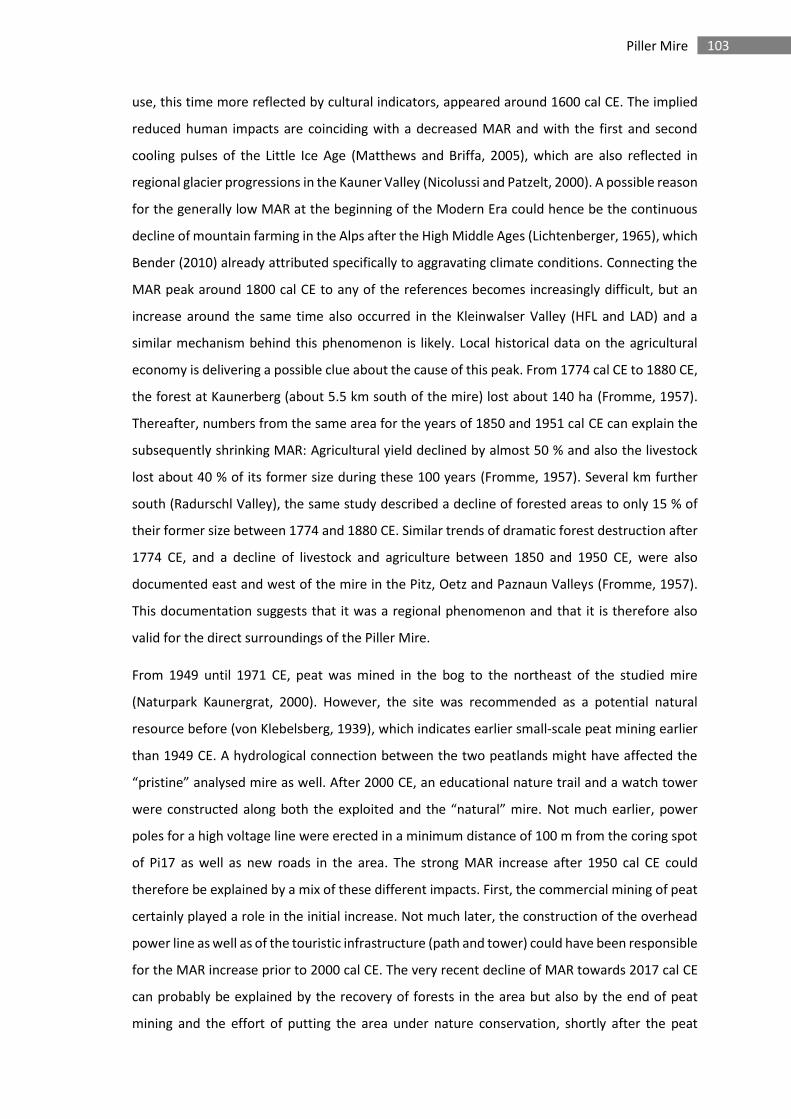
103 Piller Mire
use, this time more reflected by cultural indicators, appeared around 1600 cal CE. The implied
reduced human impacts are coinciding with a decreased MAR and with the first and second
cooling pulses of the Little Ice Age (Matthews and Briffa, 2005), which are also reflected in
regional glacier progressions in the Kauner Valley (Nicolussi and Patzelt, 2000). A possible reason
for the generally low MAR at the beginning of the Modern Era could hence be the continuous
decline of mountain farming in the Alps after the High Middle Ages (Lichtenberger, 1965), which
Bender (2010) already attributed specifically to aggravating climate conditions. Connecting the
MAR peak around 1800 cal CE to any of the references becomes increasingly difficult, but an
increase around the same time also occurred in the Kleinwalser Valley (HFL and LAD) and a
similar mechanism behind this phenomenon is likely. Local historical data on the agricultural
economy is delivering a possible clue about the cause of this peak. From 1774 cal CE to 1880 CE,
the forest at Kaunerberg (about 5.5 km south of the mire) lost about 140 ha (Fromme, 1957).
Thereafter, numbers from the same area for the years of 1850 and 1951 cal CE can explain the
subsequently shrinking MAR: Agricultural yield declined by almost 50 % and also the livestock
lost about 40 % of its former size during these 100 years (Fromme, 1957). Several km further
south (Radurschl Valley), the same study described a decline of forested areas to only 15 % of
their former size between 1774 and 1880 CE. Similar trends of dramatic forest destruction after
1774 CE, and a decline of livestock and agriculture between 1850 and 1950 CE, were also
documented east and west of the mire in the Pitz, Oetz and Paznaun Valleys (Fromme, 1957).
This documentation suggests that it was a regional phenomenon and that it is therefore also
valid for the direct surroundings of the Piller Mire.
From 1949 until 1971 CE, peat was mined in the bog to the northeast of the studied mire
(Naturpark Kaunergrat, 2000). However, the site was recommended as a potential natural
resource before (von Klebelsberg, 1939), which indicates earlier small-scale peat mining earlier
than 1949 CE. A hydrological connection between the two peatlands might have affected the
“pristine” analysed mire as well. After 2000 CE, an educational nature trail and a watch tower
were constructed along both the exploited and the “natural” mire. Not much earlier, power
poles for a high voltage line were erected in a minimum distance of 100 m from the coring spot
of Pi17 as well as new roads in the area. The strong MAR increase after 1950 cal CE could
therefore be explained by a mix of these different impacts. First, the commercial mining of peat
certainly played a role in the initial increase. Not much later, the construction of the overhead
power line as well as of the touristic infrastructure (path and tower) could have been responsible
for the MAR increase prior to 2000 cal CE. The very recent decline of MAR towards 2017 cal CE
can probably be explained by the recovery of forests in the area but also by the end of peat
mining and the effort of putting the area under nature conservation, shortly after the peat
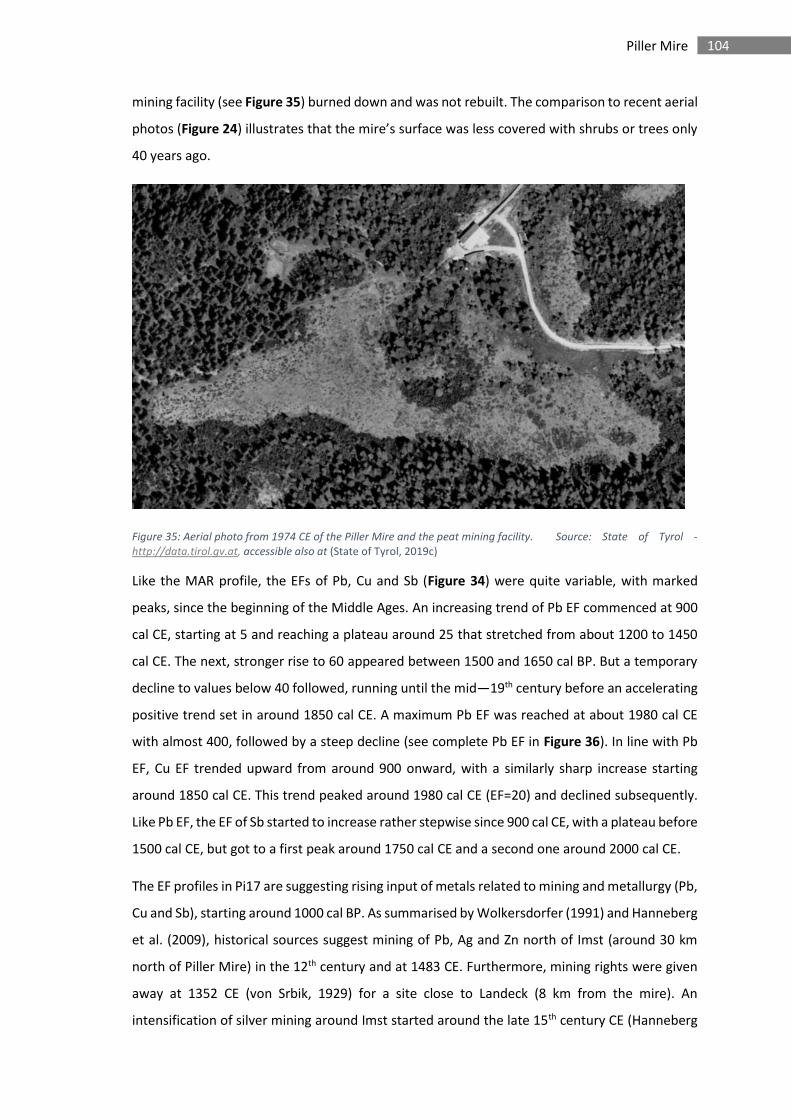
104 Piller Mire
mining facility (see Figure 35) burned down and was not rebuilt. The comparison to recent aerial
photos (Figure 24) illustrates that the mire’s surface was less covered with shrubs or trees only
40 years ago.
Figure 35: Aerial photo from 1974 CE of the Piller Mire and the peat mining facility. Source: State of Tyrol -
http://data.tirol.gv.at, accessible also at (State of Tyrol, 2019c)
Like the MAR profile, the EFs of Pb, Cu and Sb (Figure 34) were quite variable, with marked
peaks, since the beginning of the Middle Ages. An increasing trend of Pb EF commenced at 900
cal CE, starting at 5 and reaching a plateau around 25 that stretched from about 1200 to 1450
cal CE. The next, stronger rise to 60 appeared between 1500 and 1650 cal BP. But a temporary
decline to values below 40 followed, running until the mid—19th century before an accelerating
positive trend set in around 1850 cal CE. A maximum Pb EF was reached at about 1980 cal CE
with almost 400, followed by a steep decline (see complete Pb EF in Figure 36). In line with Pb
EF, Cu EF trended upward from around 900 onward, with a similarly sharp increase starting
around 1850 cal CE. This trend peaked around 1980 cal CE (EF=20) and declined subsequently.
Like Pb EF, the EF of Sb started to increase rather stepwise since 900 cal CE, with a plateau before
1500 cal CE, but got to a first peak around 1750 cal CE and a second one around 2000 cal CE.
The EF profiles in Pi17 are suggesting rising input of metals related to mining and metallurgy (Pb,
Cu and Sb), starting around 1000 cal BP. As summarised by Wolkersdorfer (1991) and Hanneberg
et al. (2009), historical sources suggest mining of Pb, Ag and Zn north of Imst (around 30 km
north of Piller Mire) in the 12th century and at 1483 CE. Furthermore, mining rights were given
away at 1352 CE (von Srbik, 1929) for a site close to Landeck (8 km from the mire). An
intensification of silver mining around Imst started around the late 15th century CE (Hanneberg
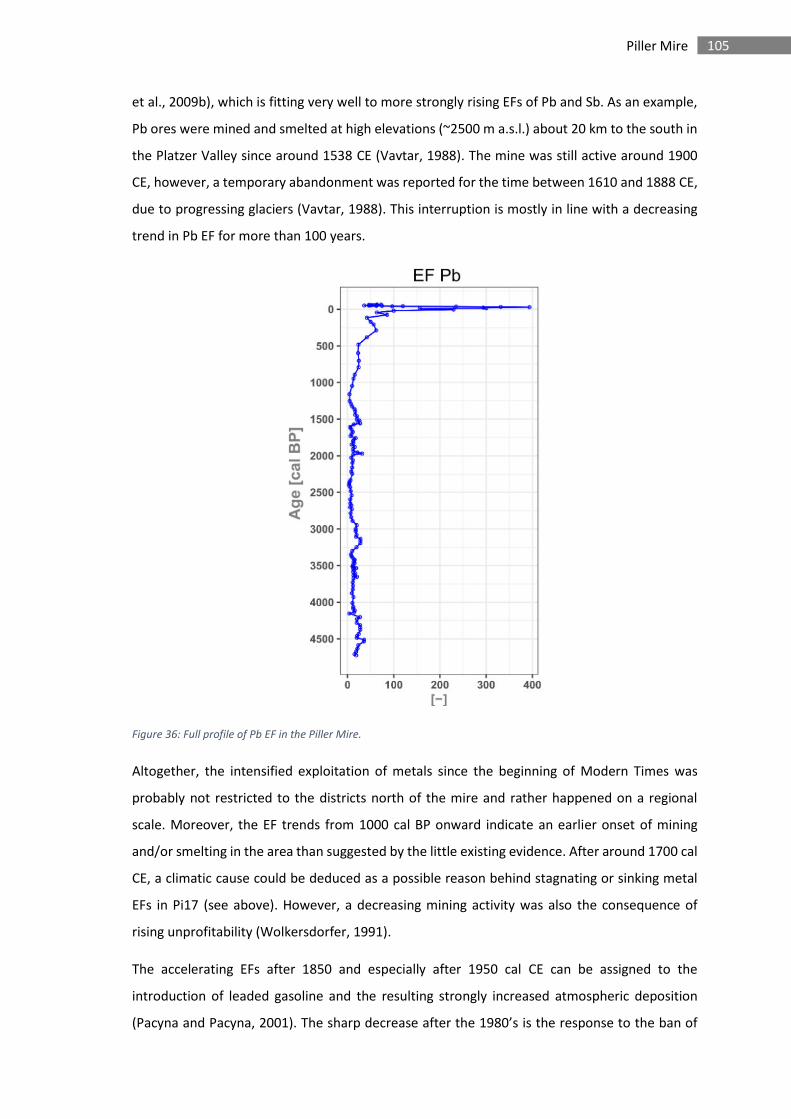
105 Piller Mire
et al., 2009b), which is fitting very well to more strongly rising EFs of Pb and Sb. As an example,
Pb ores were mined and smelted at high elevations (~2500 m a.s.l.) about 20 km to the south in
the Platzer Valley since around 1538 CE (Vavtar, 1988). The mine was still active around 1900
CE, however, a temporary abandonment was reported for the time between 1610 and 1888 CE,
due to progressing glaciers (Vavtar, 1988). This interruption is mostly in line with a decreasing
trend in Pb EF for more than 100 years.
Figure 36: Full profile of Pb EF in the Piller Mire.
Altogether, the intensified exploitation of metals since the beginning of Modern Times was
probably not restricted to the districts north of the mire and rather happened on a regional
scale. Moreover, the EF trends from 1000 cal BP onward indicate an earlier onset of mining
and/or smelting in the area than suggested by the little existing evidence. After around 1700 cal
CE, a climatic cause could be deduced as a possible reason behind stagnating or sinking metal
EFs in Pi17 (see above). However, a decreasing mining activity was also the consequence of
rising unprofitability (Wolkersdorfer, 1991).
The accelerating EFs after 1850 and especially after 1950 cal CE can be assigned to the
introduction of leaded gasoline and the resulting strongly increased atmospheric deposition
(Pacyna and Pacyna, 2001). The sharp decrease after the 1980’s is the response to the ban of
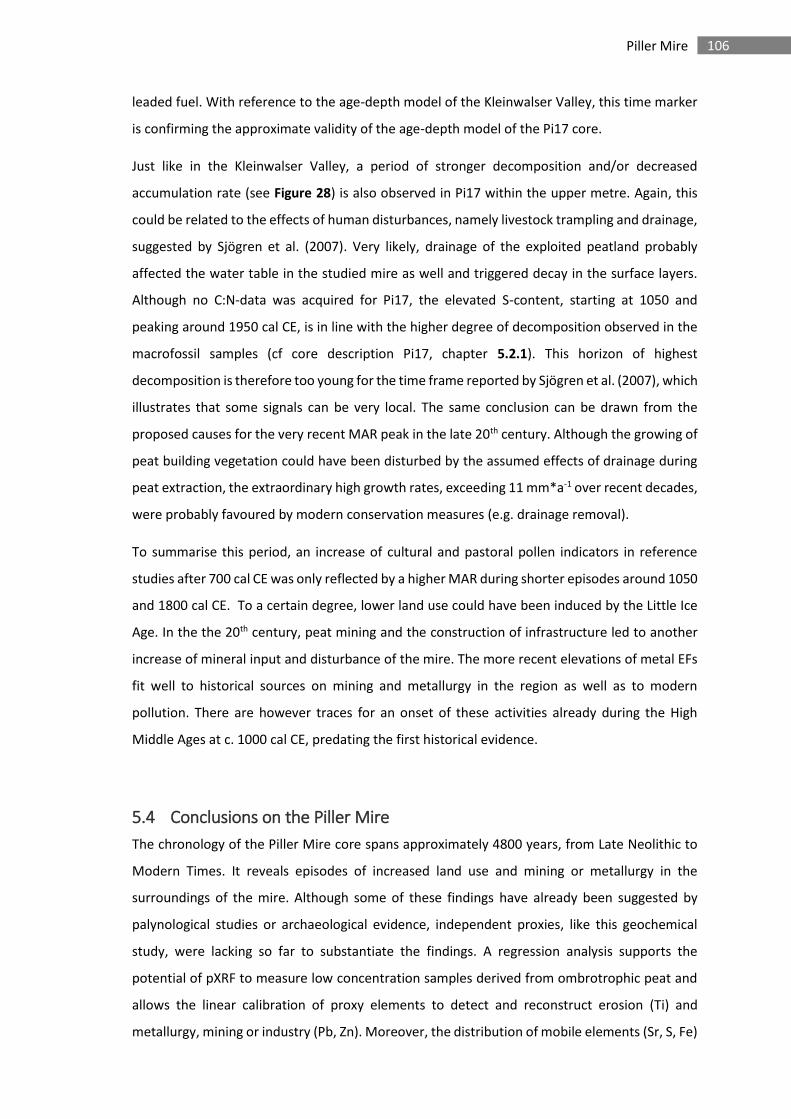
106 Piller Mire
leaded fuel. With reference to the age-depth model of the Kleinwalser Valley, this time marker
is confirming the approximate validity of the age-depth model of the Pi17 core.
Just like in the Kleinwalser Valley, a period of stronger decomposition and/or decreased
accumulation rate (see Figure 28) is also observed in Pi17 within the upper metre. Again, this
could be related to the effects of human disturbances, namely livestock trampling and drainage,
suggested by Sjögren et al. (2007). Very likely, drainage of the exploited peatland probably
affected the water table in the studied mire as well and triggered decay in the surface layers.
Although no C:N-data was acquired for Pi17, the elevated S-content, starting at 1050 and
peaking around 1950 cal CE, is in line with the higher degree of decomposition observed in the
macrofossil samples (cf core description Pi17, chapter 5.2.1). This horizon of highest
decomposition is therefore too young for the time frame reported by Sjögren et al. (2007), which
illustrates that some signals can be very local. The same conclusion can be drawn from the
proposed causes for the very recent MAR peak in the late 20th century. Although the growing of
peat building vegetation could have been disturbed by the assumed effects of drainage during
peat extraction, the extraordinary high growth rates, exceeding 11 mm*a-1 over recent decades,
were probably favoured by modern conservation measures (e.g. drainage removal).
To summarise this period, an increase of cultural and pastoral pollen indicators in reference
studies after 700 cal CE was only reflected by a higher MAR during shorter episodes around 1050
and 1800 cal CE. To a certain degree, lower land use could have been induced by the Little Ice
Age. In the the 20th century, peat mining and the construction of infrastructure led to another
increase of mineral input and disturbance of the mire. The more recent elevations of metal EFs
fit well to historical sources on mining and metallurgy in the region as well as to modern
pollution. There are however traces for an onset of these activities already during the High
Middle Ages at c. 1000 cal CE, predating the first historical evidence.
5.4 Conclusions on the Piller Mire
The chronology of the Piller Mire core spans approximately 4800 years, from Late Neolithic to
Modern Times. It reveals episodes of increased land use and mining or metallurgy in the
surroundings of the mire. Although some of these findings have already been suggested by
palynological studies or archaeological evidence, independent proxies, like this geochemical
study, were lacking so far to substantiate the findings. A regression analysis supports the
potential of pXRF to measure low concentration samples derived from ombrotrophic peat and
allows the linear calibration of proxy elements to detect and reconstruct erosion (Ti) and
metallurgy, mining or industry (Pb, Zn). Moreover, the distribution of mobile elements (Sr, S, Fe)
107 Piller Mire
and the concentration profiles of other elements (K, Rb, V, Zr) can be measured. But the results
also demonstrate the limits of pXRF for some elements (e.g. Ca, Cu, Mn) in this type of peat.
As suggested by the registered data, the area or region around the mire saw episodes of mining
or metallurgy between 4700 and 4200 cal BP, which would predate the earliest evidence in the
Eastern Alps (e.g. in the lower Inn Valley). Human activities can also be inferred from erosion
signals and the comparison to vegetation proxies from other studies. By the Mid to Late Bronze
Age (3500 to 3000 cal BP), a higher land use and metallurgical activities are evident by both
increased erosion and elevated EFs of Pb, Cu and Zn, which is in line with archaeological and
palynological findings. This episode and as well as a distinct erosion peak around 2400 cal BP can
be connected to important archaeological sites in the direct vicinity of the mire.
Despite proven influence of the Roman Empire in the region, their impact on the landscape was
relatively low and may have even decreased land use of local communities. Only a short peak of
MAR is observed in the 3rd century cal CE. However, metallurgical or mining activities are
recorded around 1950 cal BP and again around 450 cal CE. Towards the Early Middle Ages, all
available proxies indicate a generally decreasing human impact until both erosion and metal EFs
show renewed impact on the region after 1000 cal CE. While mining and metallurgy did almost
continuously increase, land use was low again until around 1750 cal BP. These low impact phases
concurred with a colder climate. Another episode of strong land use (deforestation, agriculture
and livestock) is suggested until 1850 cal CE again. The late 19th and the 20th century experienced
a drastically rising Pb EF until 1980 cal CE. Peat mining and the installation of touristic and power
infrastructure probably affected the mire’s hydrology and mineral input temporarily before
2000 cal CE. The good accordance of MAR and EFs to well documented developments and events
can minimise doubts about the proposed age-depth model and therefore supports the quality
of the conclusions drawn from the used proxies.
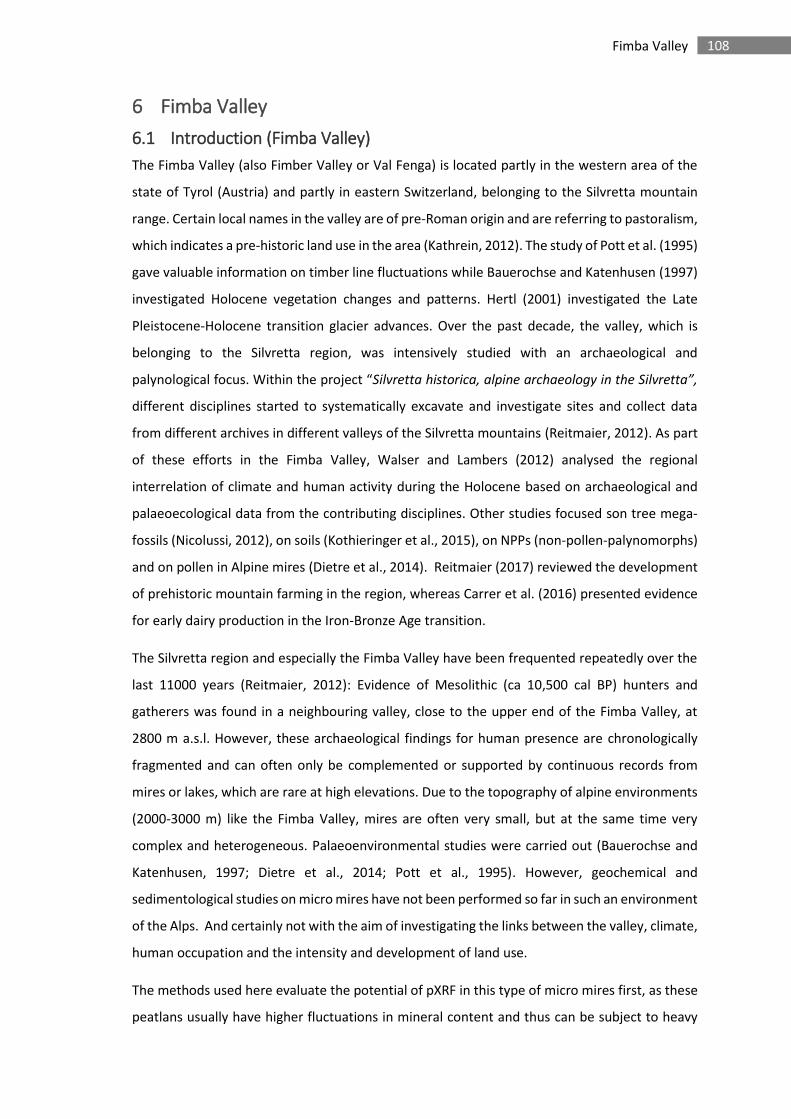
108 Fimba Valley
6 Fimba Valley
6.1 Introduction (Fimba Valley)
The Fimba Valley (also Fimber Valley or Val Fenga) is located partly in the western area of the
state of Tyrol (Austria) and partly in eastern Switzerland, belonging to the Silvretta mountain
range. Certain local names in the valley are of pre-Roman origin and are referring to pastoralism,
which indicates a pre-historic land use in the area (Kathrein, 2012). The study of Pott et al. (1995)
gave valuable information on timber line fluctuations while Bauerochse and Katenhusen (1997)
investigated Holocene vegetation changes and patterns. Hertl (2001) investigated the Late
Pleistocene-Holocene transition glacier advances. Over the past decade, the valley, which is
belonging to the Silvretta region, was intensively studied with an archaeological and
palynological focus. Within the project “Silvretta historica, alpine archaeology in the Silvretta”,
different disciplines started to systematically excavate and investigate sites and collect data
from different archives in different valleys of the Silvretta mountains (Reitmaier, 2012). As part
of these efforts in the Fimba Valley, Walser and Lambers (2012) analysed the regional
interrelation of climate and human activity during the Holocene based on archaeological and
palaeoecological data from the contributing disciplines. Other studies focused son tree mega-
fossils (Nicolussi, 2012), on soils (Kothieringer et al., 2015), on NPPs (non-pollen-palynomorphs)
and on pollen in Alpine mires (Dietre et al., 2014). Reitmaier (2017) reviewed the development
of prehistoric mountain farming in the region, whereas Carrer et al. (2016) presented evidence
for early dairy production in the Iron-Bronze Age transition.
The Silvretta region and especially the Fimba Valley have been frequented repeatedly over the
last 11000 years (Reitmaier, 2012): Evidence of Mesolithic (ca 10,500 cal BP) hunters and
gatherers was found in a neighbouring valley, close to the upper end of the Fimba Valley, at
2800 m a.s.l. However, these archaeological findings for human presence are chronologically
fragmented and can often only be complemented or supported by continuous records from
mires or lakes, which are rare at high elevations. Due to the topography of alpine environments
(2000-3000 m) like the Fimba Valley, mires are often very small, but at the same time very
complex and heterogeneous. Palaeoenvironmental studies were carried out (Bauerochse and
Katenhusen, 1997; Dietre et al., 2014; Pott et al., 1995). However, geochemical and
sedimentological studies on micro mires have not been performed so far in such an environment
of the Alps. And certainly not with the aim of investigating the links between the valley, climate,
human occupation and the intensity and development of land use.
The methods used here evaluate the potential of pXRF in this type of micro mires first, as these
peatlans usually have higher fluctuations in mineral content and thus can be subject to heavy
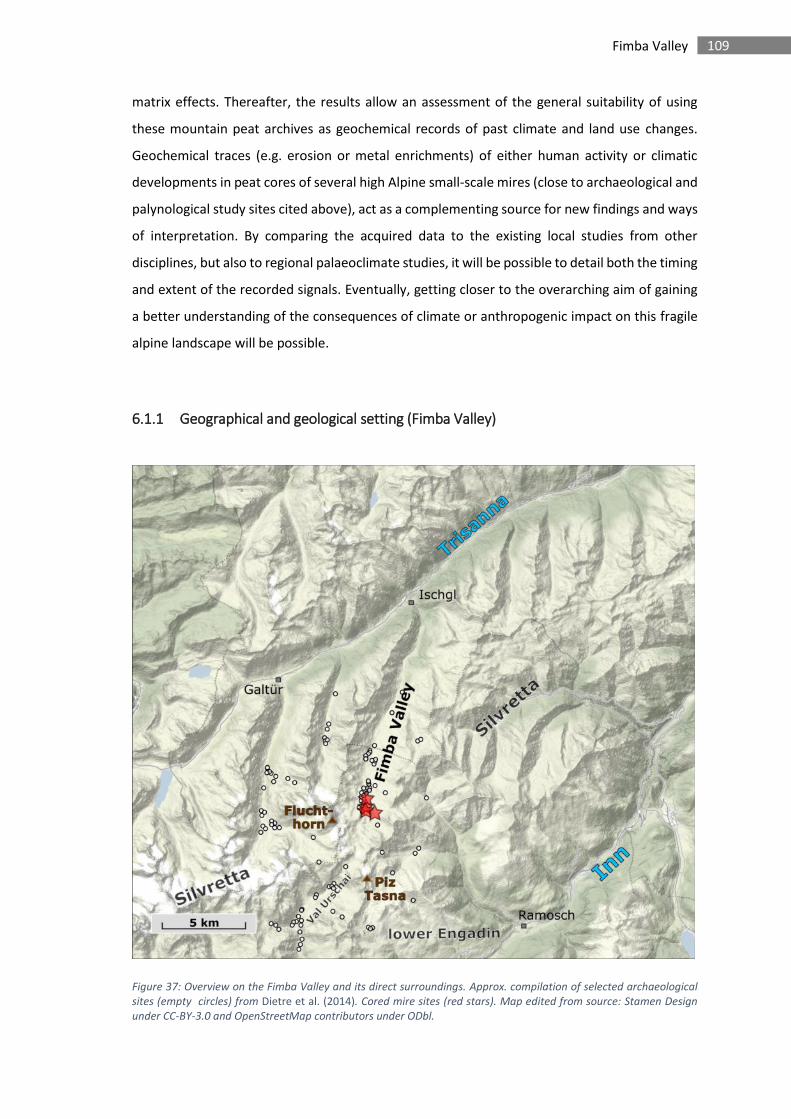
109 Fimba Valley
matrix effects. Thereafter, the results allow an assessment of the general suitability of using
these mountain peat archives as geochemical records of past climate and land use changes.
Geochemical traces (e.g. erosion or metal enrichments) of either human activity or climatic
developments in peat cores of several high Alpine small-scale mires (close to archaeological and
palynological study sites cited above), act as a complementing source for new findings and ways
of interpretation. By comparing the acquired data to the existing local studies from other
disciplines, but also to regional palaeoclimate studies, it will be possible to detail both the timing
and extent of the recorded signals. Eventually, getting closer to the overarching aim of gaining
a better understanding of the consequences of climate or anthropogenic impact on this fragile
alpine landscape will be possible.
6.1.1 Geographical and geological setting (Fimba Valley)
Figure 37: Overview on the Fimba Valley and its direct surroundings. Approx. compilation of selected archaeological
sites (empty circles) from Dietre et al. (2014). Cored mire sites (red stars). Map edited from source: Stamen Design
under CC-BY-3.0 and OpenStreetMap contributors under ODbl.
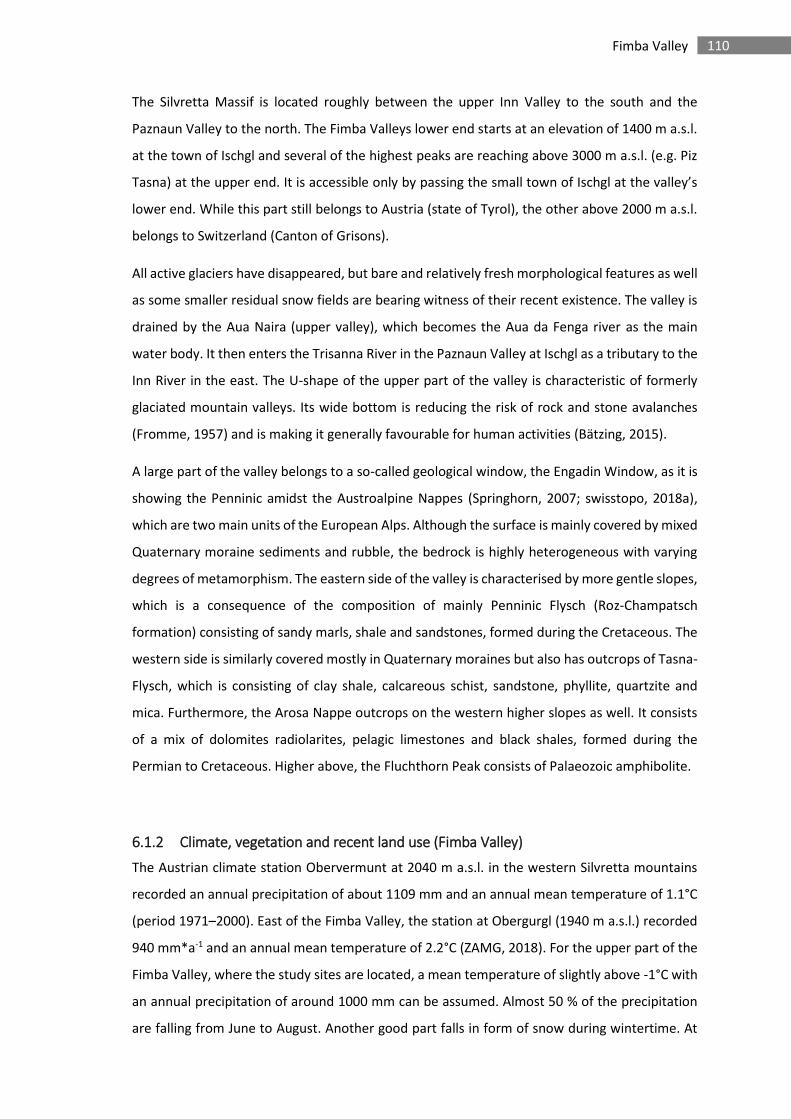
110 Fimba Valley
The Silvretta Massif is located roughly between the upper Inn Valley to the south and the
Paznaun Valley to the north. The Fimba Valleys lower end starts at an elevation of 1400 m a.s.l.
at the town of Ischgl and several of the highest peaks are reaching above 3000 m a.s.l. (e.g. Piz
Tasna) at the upper end. It is accessible only by passing the small town of Ischgl at the valley’s
lower end. While this part still belongs to Austria (state of Tyrol), the other above 2000 m a.s.l.
belongs to Switzerland (Canton of Grisons).
All active glaciers have disappeared, but bare and relatively fresh morphological features as well
as some smaller residual snow fields are bearing witness of their recent existence. The valley is
drained by the Aua Naira (upper valley), which becomes the Aua da Fenga river as the main
water body. It then enters the Trisanna River in the Paznaun Valley at Ischgl as a tributary to the
Inn River in the east. The U-shape of the upper part of the valley is characteristic of formerly
glaciated mountain valleys. Its wide bottom is reducing the risk of rock and stone avalanches
(Fromme, 1957) and is making it generally favourable for human activities (Bätzing, 2015).
A large part of the valley belongs to a so-called geological window, the Engadin Window, as it is
showing the Penninic amidst the Austroalpine Nappes (Springhorn, 2007; swisstopo, 2018a),
which are two main units of the European Alps. Although the surface is mainly covered by mixed
Quaternary moraine sediments and rubble, the bedrock is highly heterogeneous with varying
degrees of metamorphism. The eastern side of the valley is characterised by more gentle slopes,
which is a consequence of the composition of mainly Penninic Flysch (Roz-Champatsch
formation) consisting of sandy marls, shale and sandstones, formed during the Cretaceous. The
western side is similarly covered mostly in Quaternary moraines but also has outcrops of Tasna-
Flysch, which is consisting of clay shale, calcareous schist, sandstone, phyllite, quartzite and
mica. Furthermore, the Arosa Nappe outcrops on the western higher slopes as well. It consists
of a mix of dolomites radiolarites, pelagic limestones and black shales, formed during the
Permian to Cretaceous. Higher above, the Fluchthorn Peak consists of Palaeozoic amphibolite.
6.1.2 Climate, vegetation and recent land use (Fimba Valley)
The Austrian climate station Obervermunt at 2040 m a.s.l. in the western Silvretta mountains
recorded an annual precipitation of about 1109 mm and an annual mean temperature of 1.1°C
(period 1971–2000). East of the Fimba Valley, the station at Obergurgl (1940 m a.s.l.) recorded
940 mm*a-1 and an annual mean temperature of 2.2°C (ZAMG, 2018). For the upper part of the
Fimba Valley, where the study sites are located, a mean temperature of slightly above -1°C with
an annual precipitation of around 1000 mm can be assumed. Almost 50 % of the precipitation
are falling from June to August. Another good part falls in form of snow during wintertime. At
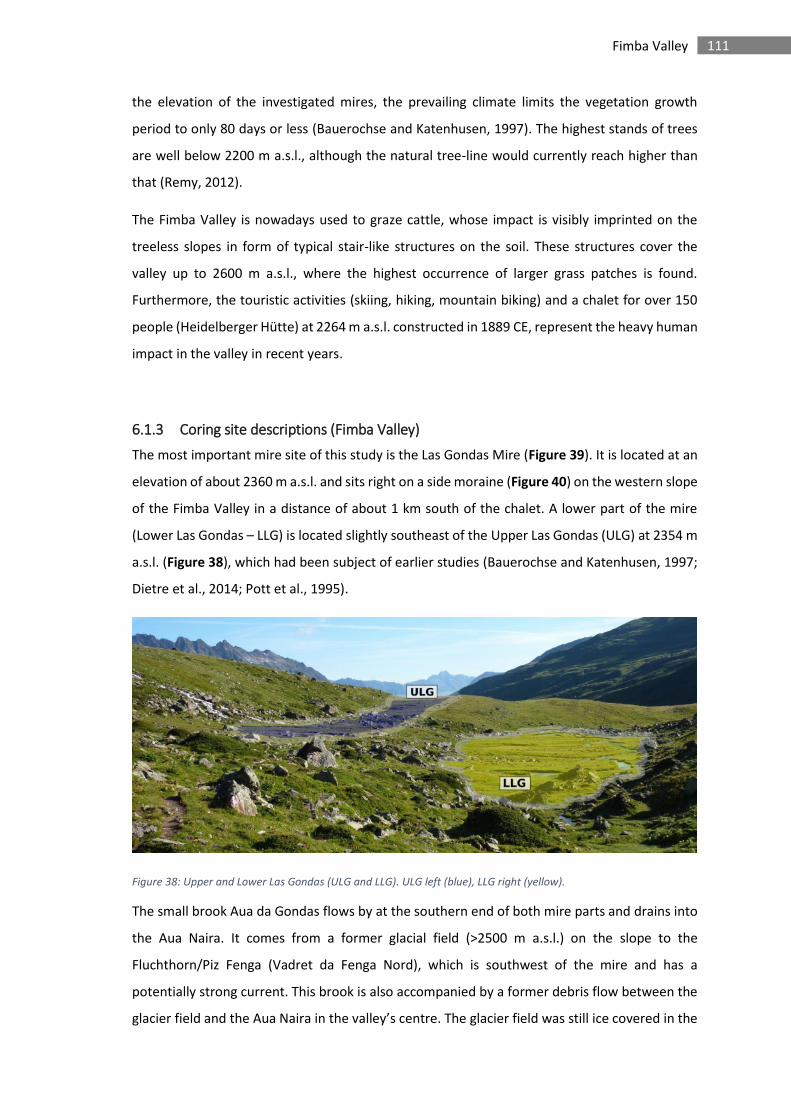
111 Fimba Valley
the elevation of the investigated mires, the prevailing climate limits the vegetation growth
period to only 80 days or less (Bauerochse and Katenhusen, 1997). The highest stands of trees
are well below 2200 m a.s.l., although the natural tree-line would currently reach higher than
that (Remy, 2012).
The Fimba Valley is nowadays used to graze cattle, whose impact is visibly imprinted on the
treeless slopes in form of typical stair-like structures on the soil. These structures cover the
valley up to 2600 m a.s.l., where the highest occurrence of larger grass patches is found.
Furthermore, the touristic activities (skiing, hiking, mountain biking) and a chalet for over 150
people (Heidelberger Hütte) at 2264 m a.s.l. constructed in 1889 CE, represent the heavy human
impact in the valley in recent years.
6.1.3 Coring site descriptions (Fimba Valley)
The most important mire site of this study is the Las Gondas Mire (Figure 39). It is located at an
elevation of about 2360 m a.s.l. and sits right on a side moraine (Figure 40) on the western slope
of the Fimba Valley in a distance of about 1 km south of the chalet. A lower part of the mire
(Lower Las Gondas – LLG) is located slightly southeast of the Upper Las Gondas (ULG) at 2354 m
a.s.l. (Figure 38), which had been subject of earlier studies (Bauerochse and Katenhusen, 1997;
Dietre et al., 2014; Pott et al., 1995).
Figure 38: Upper and Lower Las Gondas (ULG and LLG). ULG left (blue), LLG right (yellow).
The small brook Aua da Gondas flows by at the southern end of both mire parts and drains into
the Aua Naira. It comes from a former glacial field (>2500 m a.s.l.) on the slope to the
Fluchthorn/Piz Fenga (Vadret da Fenga Nord), which is southwest of the mire and has a
potentially strong current. This brook is also accompanied by a former debris flow between the
glacier field and the Aua Naira in the valley’s centre. The glacier field was still ice covered in the
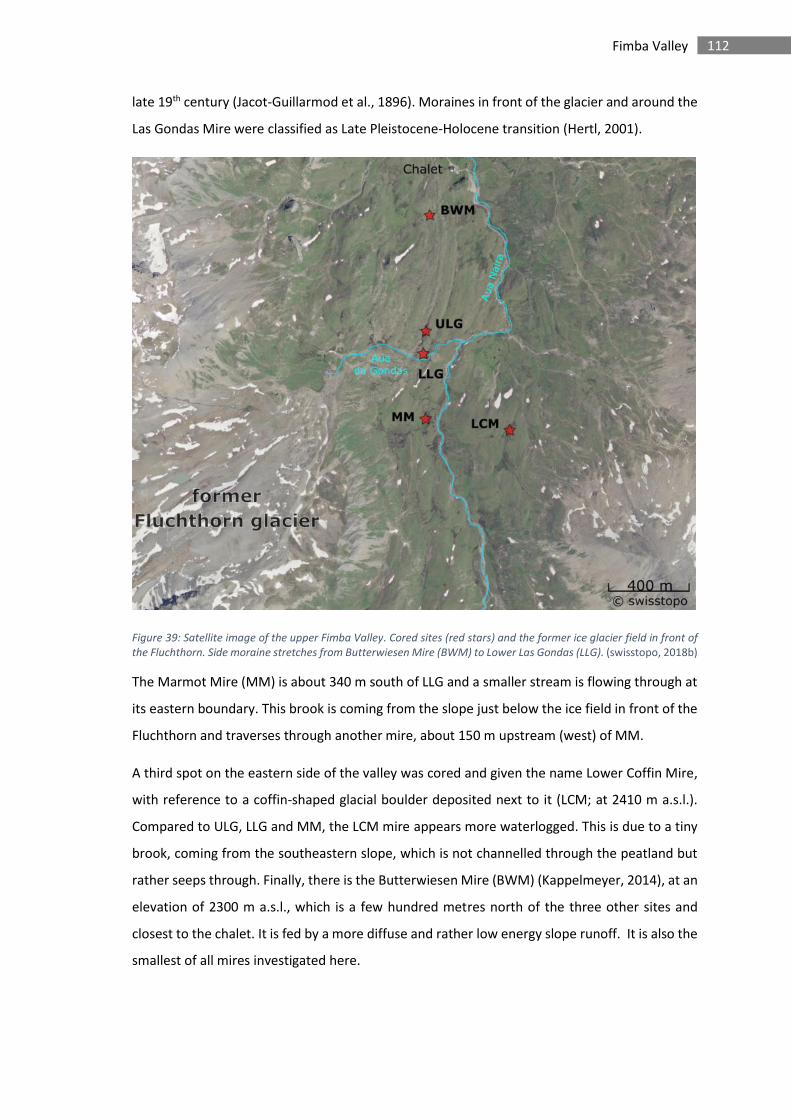
112 Fimba Valley
late 19th century (Jacot-Guillarmod et al., 1896). Moraines in front of the glacier and around the
Las Gondas Mire were classified as Late Pleistocene-Holocene transition (Hertl, 2001).
Figure 39: Satellite image of the upper Fimba Valley. Cored sites (red stars) and the former ice glacier field in front of
the Fluchthorn. Side moraine stretches from Butterwiesen Mire (BWM) to Lower Las Gondas (LLG). (swisstopo, 2018b)
The Marmot Mire (MM) is about 340 m south of LLG and a smaller stream is flowing through at
its eastern boundary. This brook is coming from the slope just below the ice field in front of the
Fluchthorn and traverses through another mire, about 150 m upstream (west) of MM.
A third spot on the eastern side of the valley was cored and given the name Lower Coffin Mire,
with reference to a coffin-shaped glacial boulder deposited next to it (LCM; at 2410 m a.s.l.).
Compared to ULG, LLG and MM, the LCM mire appears more waterlogged. This is due to a tiny
brook, coming from the southeastern slope, which is not channelled through the peatland but
rather seeps through. Finally, there is the Butterwiesen Mire (BWM) (Kappelmeyer, 2014), at an
elevation of 2300 m a.s.l., which is a few hundred metres north of the three other sites and
closest to the chalet. It is fed by a more diffuse and rather low energy slope runoff. It is also the
smallest of all mires investigated here.
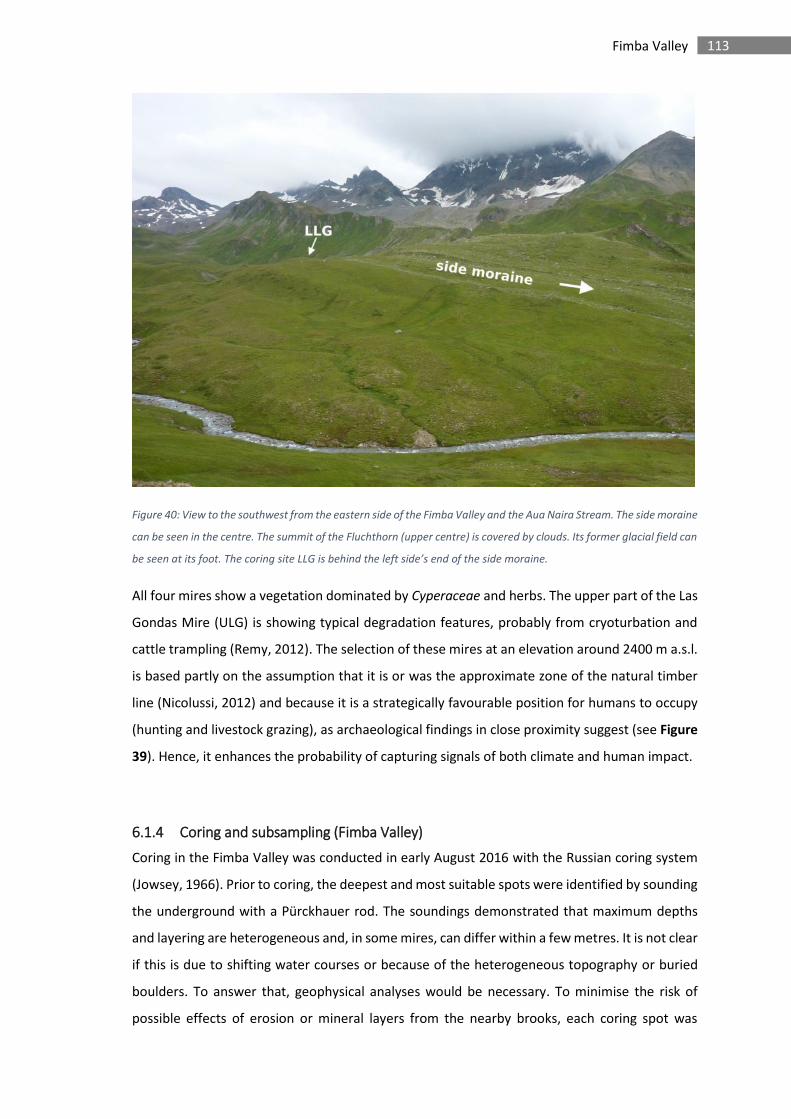
113 Fimba Valley
Figure 40: View to the southwest from the eastern side of the Fimba Valley and the Aua Naira Stream. The side moraine
can be seen in the centre. The summit of the Fluchthorn (upper centre) is covered by clouds. Its former glacial field can
be seen at its foot. The coring site LLG is behind the left side’s end of the side moraine.
All four mires show a vegetation dominated by Cyperaceae and herbs. The upper part of the Las
Gondas Mire (ULG) is showing typical degradation features, probably from cryoturbation and
cattle trampling (Remy, 2012). The selection of these mires at an elevation around 2400 m a.s.l.
is based partly on the assumption that it is or was the approximate zone of the natural timber
line (Nicolussi, 2012) and because it is a strategically favourable position for humans to occupy
(hunting and livestock grazing), as archaeological findings in close proximity suggest (see Figure
39). Hence, it enhances the probability of capturing signals of both climate and human impact.
6.1.4 Coring and subsampling (Fimba Valley)
Coring in the Fimba Valley was conducted in early August 2016 with the Russian coring system
(Jowsey, 1966). Prior to coring, the deepest and most suitable spots were identified by sounding
the underground with a Pürckhauer rod. The soundings demonstrated that maximum depths
and layering are heterogeneous and, in some mires, can differ within a few metres. It is not clear
if this is due to shifting water courses or because of the heterogeneous topography or buried
boulders. To answer that, geophysical analyses would be necessary. To minimise the risk of
possible effects of erosion or mineral layers from the nearby brooks, each coring spot was
114 Fimba Valley
selected at a distance of at least 10 m from the closest (present day) water channel. The very
dense mix of peat and mineral layers strongly increased traction and therefore the force needed
to drive down the corer and pull it out. Due to these circumstances, a barrel of 5 cm diameter
and 50 cm length was used.
In the lower part of the Las Gondas Mire (LLG; at 46°54'3.51"N; 10°15'26.15"E), two overlapping
cores were retrieved. The first (LLG-A) reached a depth of approx. 250 cm. A parallel core (LLG-
B) was taken less than 2 m away, covering 30 to 230 cm depth. As the surficial peat was very
dense compared to a regular moss peatland, compaction was negligible. Driving a Wardenaar
system in such dense peat is moreover practically impossible. No monolith was therefore
retrieved.
In the Marmot Mire, the first core (MM; 46°53'52.39"N; 10°15'25.53"E) was driven down to a
depth of 112 cm until hitting coarse impenetrable sediment. The second section taken from a
depth of 60 cm, to directly skip the potentially disturbed upper 10 cm of the Russian corer. The
parallel core MM-B was only taken from 30 to 80 cm depth, after clearing the upper 30 cm of
the borehole.
Three more cores were taken: one at the upper Las Gondas Mire (ULG; 46°54'07.4"N
10°15'26.4"E) and another one at Lower Coffin Mire (LCM; 46°53'49.9"N 10°15'46.5"E) on the
eastern side of the valley. They were however used only for dating the bottom layers to gain
information about the onset of peat growth. An additional core of 92 cm length was retrieved
with the Usinger system (8 cm barrel) already in 2012 in the “Butterwiesen Mire” (BWM; at
46°54'27.30"N; 10°15'28.92"E).
The upper metre of LLG-A was sliced and subsampled for geochemistry, density and radiocarbon
dating. The lower 150 cm were described and sampled for macrofossils (dating) only, as it mainly
consisted of mineral sediment, making it unsuitable for geochemical analysis. The cores of MM
and BWM were used for line- and XRF-core-scanning.
6.2 Results & discussion (Fimba Valley)
6.2.1 Core descriptions (Fimba Valley)
Las Gondas
Table 11: Core description of LLG(A).
Depth (cm) Description of LLG
251-190 mineral; fine grained light grey clay with very few black organic material
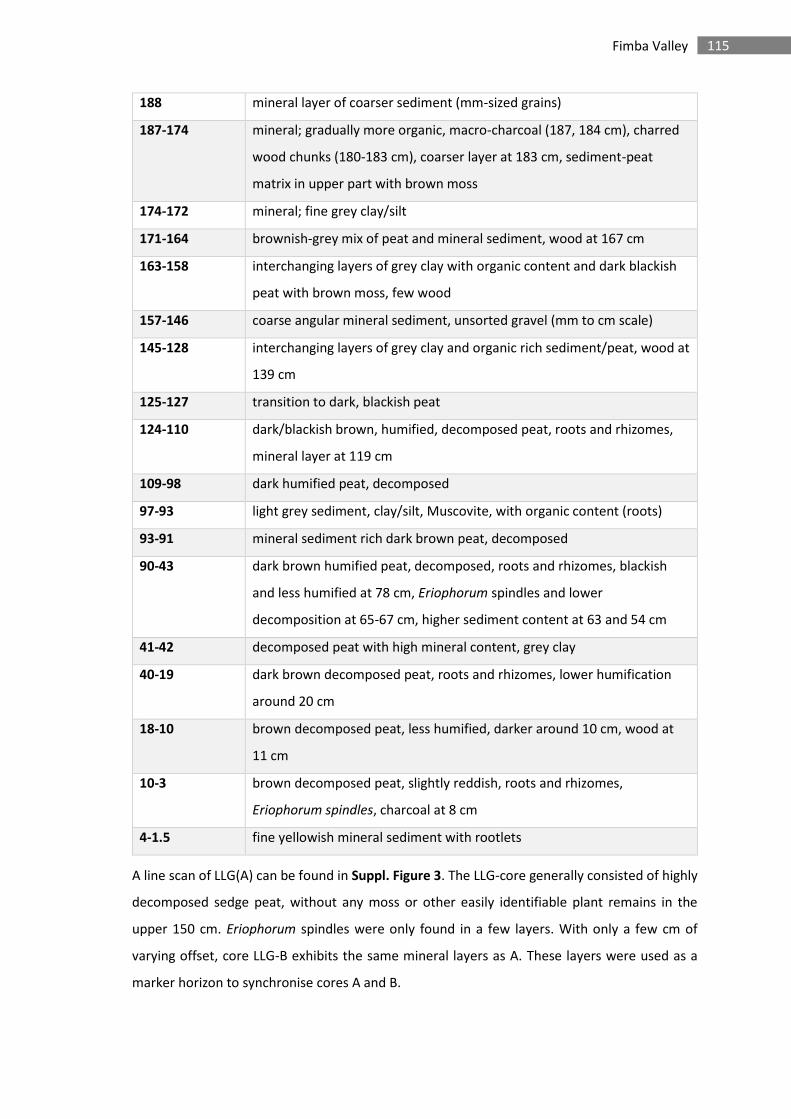
115 Fimba Valley
188 mineral layer of coarser sediment (mm-sized grains)
187-174 mineral; gradually more organic, macro-charcoal (187, 184 cm), charred
wood chunks (180-183 cm), coarser layer at 183 cm, sediment-peat
matrix in upper part with brown moss
174-172 mineral; fine grey clay/silt
171-164 brownish-grey mix of peat and mineral sediment, wood at 167 cm
163-158 interchanging layers of grey clay with organic content and dark blackish
peat with brown moss, few wood
157-146 coarse angular mineral sediment, unsorted gravel (mm to cm scale)
145-128 interchanging layers of grey clay and organic rich sediment/peat, wood at
139 cm
125-127 transition to dark, blackish peat
124-110 dark/blackish brown, humified, decomposed peat, roots and rhizomes,
mineral layer at 119 cm
109-98 dark humified peat, decomposed
97-93 light grey sediment, clay/silt, Muscovite, with organic content (roots)
93-91 mineral sediment rich dark brown peat, decomposed
90-43 dark brown humified peat, decomposed, roots and rhizomes, blackish
and less humified at 78 cm, Eriophorum spindles and lower
decomposition at 65-67 cm, higher sediment content at 63 and 54 cm
41-42 decomposed peat with high mineral content, grey clay
40-19 dark brown decomposed peat, roots and rhizomes, lower humification
around 20 cm
18-10 brown decomposed peat, less humified, darker around 10 cm, wood at
11 cm
10-3 brown decomposed peat, slightly reddish, roots and rhizomes,
Eriophorum spindles, charcoal at 8 cm
4-1.5 fine yellowish mineral sediment with rootlets
A line scan of LLG(A) can be found in Suppl. Figure 3. The LLG-core generally consisted of highly
decomposed sedge peat, without any moss or other easily identifiable plant remains in the
upper 150 cm. Eriophorum spindles were only found in a few layers. With only a few cm of
varying offset, core LLG-B exhibits the same mineral layers as A. These layers were used as a
marker horizon to synchronise cores A and B.
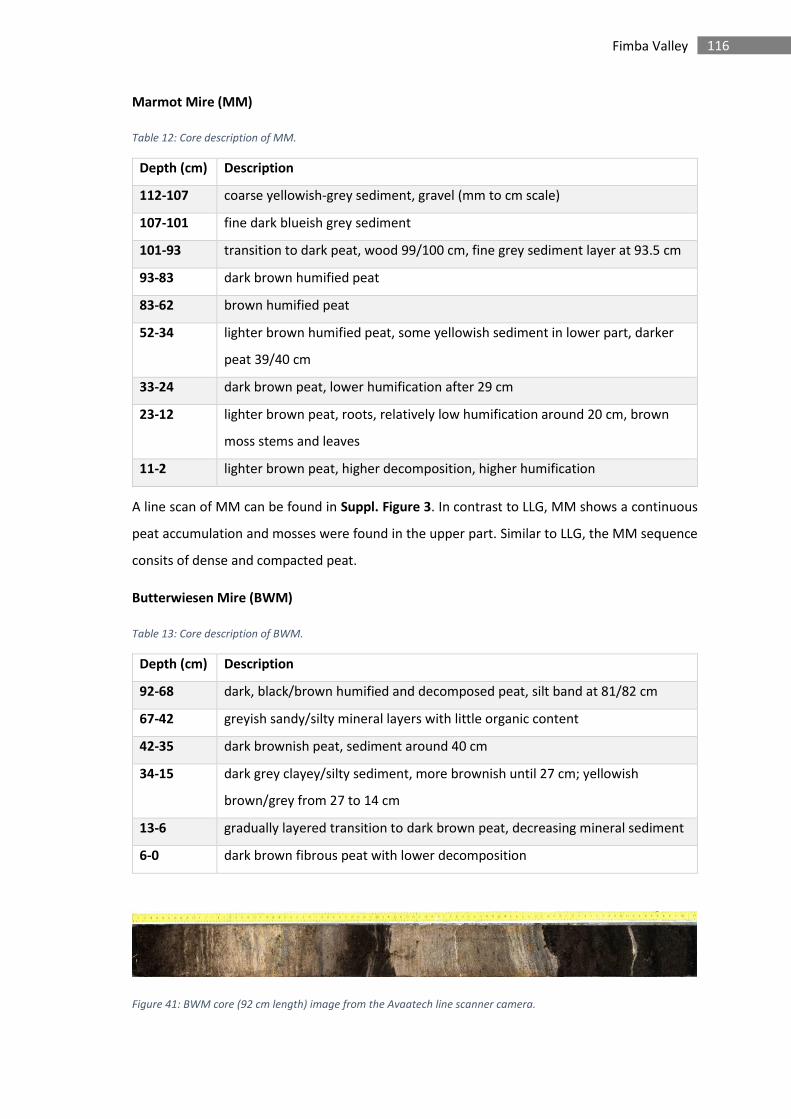
116 Fimba Valley
Marmot Mire (MM)
Table 12: Core description of MM.
Depth (cm) Description
112-107 coarse yellowish-grey sediment, gravel (mm to cm scale)
107-101 fine dark blueish grey sediment
101-93 transition to dark peat, wood 99/100 cm, fine grey sediment layer at 93.5 cm
93-83 dark brown humified peat
83-62 brown humified peat
52-34 lighter brown humified peat, some yellowish sediment in lower part, darker
peat 39/40 cm
33-24 dark brown peat, lower humification after 29 cm
23-12 lighter brown peat, roots, relatively low humification around 20 cm, brown
moss stems and leaves
11-2 lighter brown peat, higher decomposition, higher humification
A line scan of MM can be found in Suppl. Figure 3. In contrast to LLG, MM shows a continuous
peat accumulation and mosses were found in the upper part. Similar to LLG, the MM sequence
consits of dense and compacted peat.
Butterwiesen Mire (BWM)
Table 13: Core description of BWM.
Depth (cm) Description
92-68 dark, black/brown humified and decomposed peat, silt band at 81/82 cm
67-42 greyish sandy/silty mineral layers with little organic content
42-35 dark brownish peat, sediment around 40 cm
34-15 dark grey clayey/silty sediment, more brownish until 27 cm; yellowish
brown/grey from 27 to 14 cm
13-6 gradually layered transition to dark brown peat, decreasing mineral sediment
6-0 dark brown fibrous peat with lower decomposition
Figure 41: BWM core (92 cm length) image from the Avaatech line scanner camera.
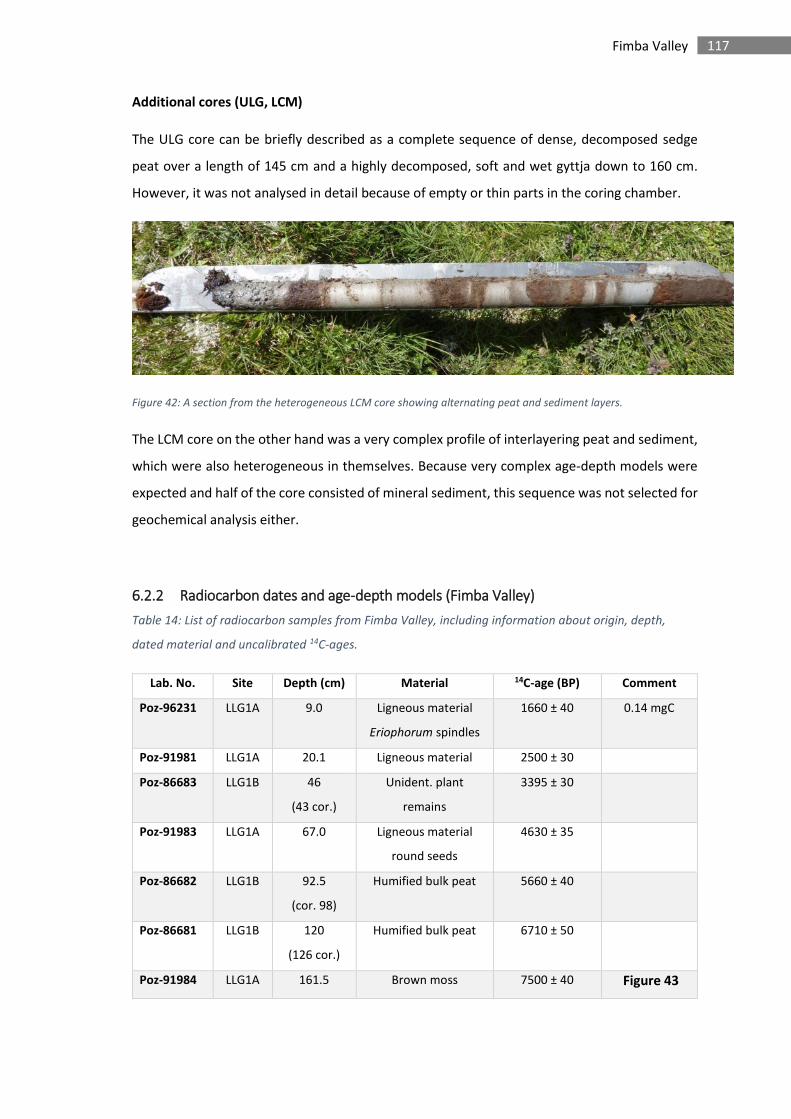
117 Fimba Valley
Additional cores (ULG, LCM)
The ULG core can be briefly described as a complete sequence of dense, decomposed sedge
peat over a length of 145 cm and a highly decomposed, soft and wet gyttja down to 160 cm.
However, it was not analysed in detail because of empty or thin parts in the coring chamber.
Figure 42: A section from the heterogeneous LCM core showing alternating peat and sediment layers.
The LCM core on the other hand was a very complex profile of interlayering peat and sediment,
which were also heterogeneous in themselves. Because very complex age-depth models were
expected and half of the core consisted of mineral sediment, this sequence was not selected for
geochemical analysis either.
6.2.2 Radiocarbon dates and age-depth models (Fimba Valley)
Table 14: List of radiocarbon samples from Fimba Valley, including information about origin, depth,
dated material and uncalibrated 14C-ages.
Lab. No. Site Depth (cm) Material 14C-age (BP) Comment
Poz-96231 LLG1A 9.0 Ligneous material
Eriophorum spindles
1660 ± 40 0.14 mgC
Poz-91981 LLG1A 20.1 Ligneous material 2500 ± 30
Poz-86683 LLG1B 46
(43 cor.)
Unident. plant
remains
3395 ± 30
Poz-91983 LLG1A 67.0 Ligneous material
round seeds
4630 ± 35
Poz-86682 LLG1B 92.5
(cor. 98)
Humified bulk peat 5660 ± 40
Poz-86681 LLG1B 120
(126 cor.)
Humified bulk peat 6710 ± 50
Poz-91984 LLG1A 161.5 Brown moss 7500 ± 40 Figure 43
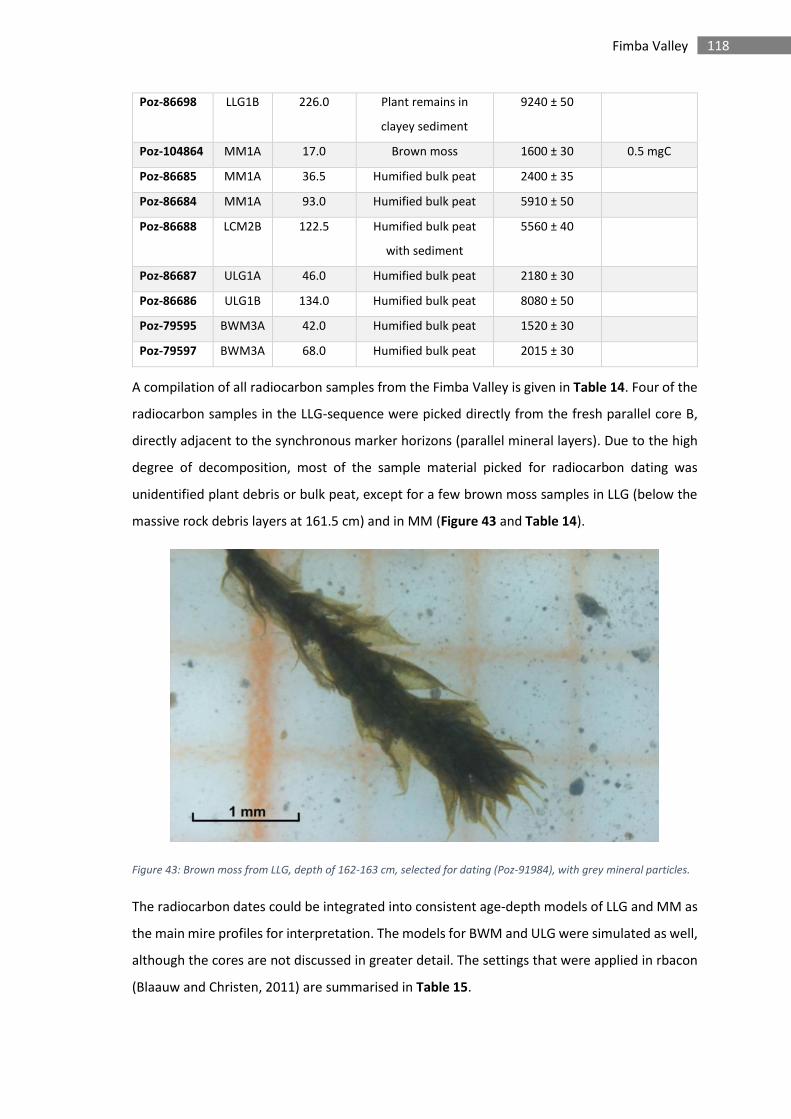
118 Fimba Valley
Poz-86698 LLG1B 226.0 Plant remains in
clayey sediment
9240 ± 50
Poz-104864 MM1A 17.0 Brown moss 1600 ± 30 0.5 mgC
Poz-86685 MM1A 36.5 Humified bulk peat 2400 ± 35
Poz-86684 MM1A 93.0 Humified bulk peat 5910 ± 50
Poz-86688 LCM2B 122.5 Humified bulk peat
with sediment
5560 ± 40
Poz-86687 ULG1A 46.0 Humified bulk peat 2180 ± 30
Poz-86686 ULG1B 134.0 Humified bulk peat 8080 ± 50
Poz-79595 BWM3A 42.0 Humified bulk peat 1520 ± 30
Poz-79597 BWM3A 68.0 Humified bulk peat 2015 ± 30
A compilation of all radiocarbon samples from the Fimba Valley is given in Table 14. Four of the
radiocarbon samples in the LLG-sequence were picked directly from the fresh parallel core B,
directly adjacent to the synchronous marker horizons (parallel mineral layers). Due to the high
degree of decomposition, most of the sample material picked for radiocarbon dating was
unidentified plant debris or bulk peat, except for a few brown moss samples in LLG (below the
massive rock debris layers at 161.5 cm) and in MM (Figure 43 and Table 14).
Figure 43: Brown moss from LLG, depth of 162-163 cm, selected for dating (Poz-91984), with grey mineral particles.
The radiocarbon dates could be integrated into consistent age-depth models of LLG and MM as
the main mire profiles for interpretation. The models for BWM and ULG were simulated as well,
although the cores are not discussed in greater detail. The settings that were applied in rbacon
(Blaauw and Christen, 2011) are summarised in Table 15.
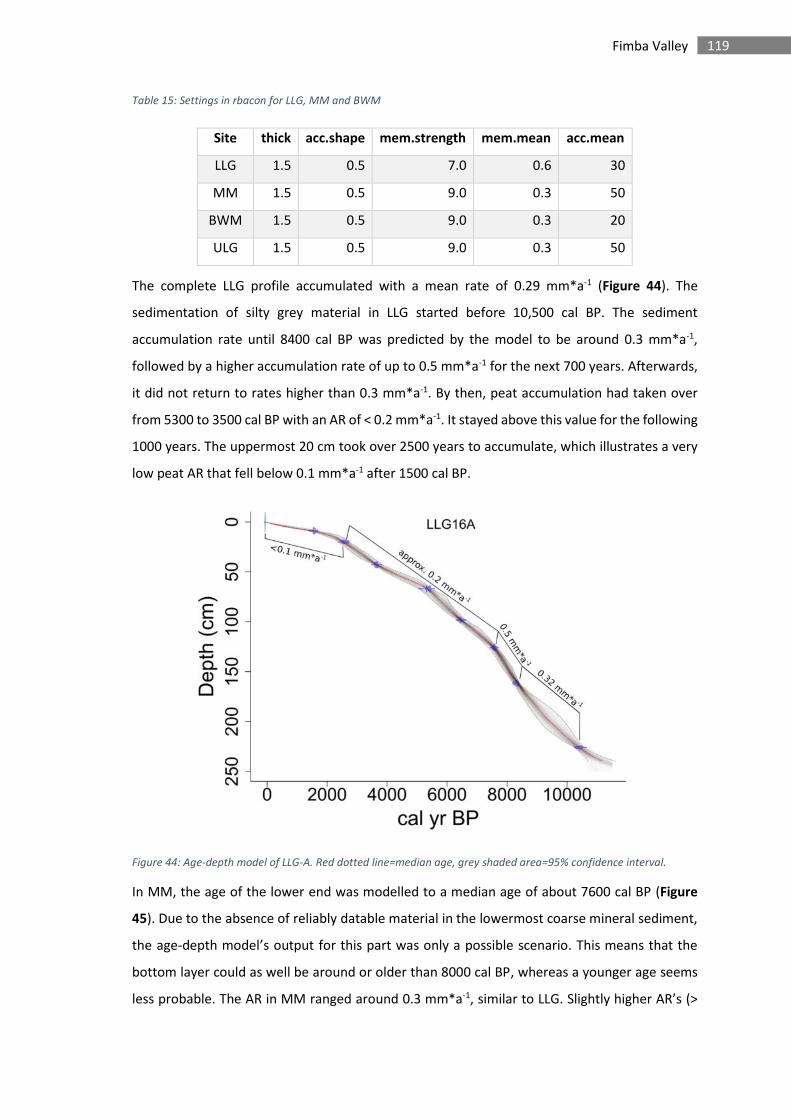
119 Fimba Valley
Table 15: Settings in rbacon for LLG, MM and BWM
Site thick acc.shape mem.strength mem.mean acc.mean
LLG 1.5 0.5 7.0 0.6 30
MM 1.5 0.5 9.0 0.3 50
BWM 1.5 0.5 9.0 0.3 20
ULG 1.5 0.5 9.0 0.3 50
The complete LLG profile accumulated with a mean rate of 0.29 mm*a-1 (Figure 44). The
sedimentation of silty grey material in LLG started before 10,500 cal BP. The sediment
accumulation rate until 8400 cal BP was predicted by the model to be around 0.3 mm*a-1,
followed by a higher accumulation rate of up to 0.5 mm*a-1 for the next 700 years. Afterwards,
it did not return to rates higher than 0.3 mm*a-1. By then, peat accumulation had taken over
from 5300 to 3500 cal BP with an AR of < 0.2 mm*a-1. It stayed above this value for the following
1000 years. The uppermost 20 cm took over 2500 years to accumulate, which illustrates a very
low peat AR that fell below 0.1 mm*a-1 after 1500 cal BP.
Figure 44: Age-depth model of LLG-A. Red dotted line=median age, grey shaded area=95% confidence interval.
In MM, the age of the lower end was modelled to a median age of about 7600 cal BP (Figure
45). Due to the absence of reliably datable material in the lowermost coarse mineral sediment,
the age-depth model’s output for this part was only a possible scenario. This means that the
bottom layer could as well be around or older than 8000 cal BP, whereas a younger age seems
less probable. The AR in MM ranged around 0.3 mm*a-1, similar to LLG. Slightly higher AR’s (>
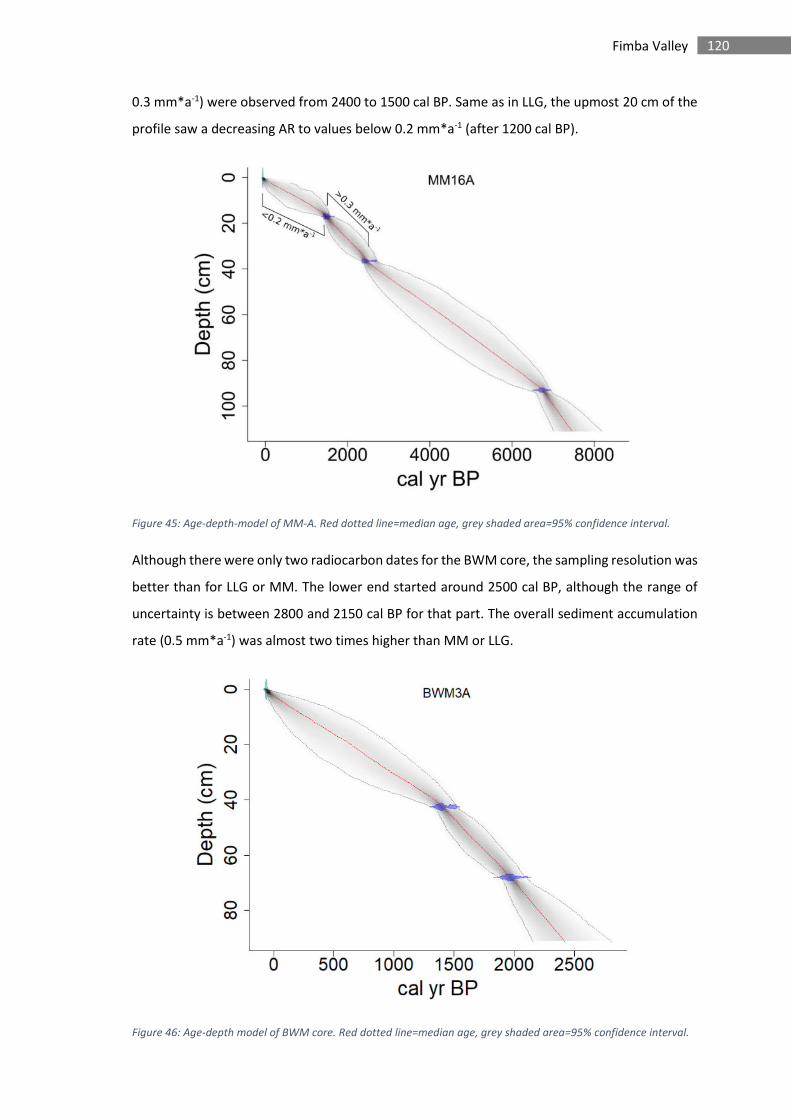
120 Fimba Valley
0.3 mm*a-1) were observed from 2400 to 1500 cal BP. Same as in LLG, the upmost 20 cm of the
profile saw a decreasing AR to values below 0.2 mm*a-1 (after 1200 cal BP).
Figure 45: Age-depth-model of MM-A. Red dotted line=median age, grey shaded area=95% confidence interval.
Although there were only two radiocarbon dates for the BWM core, the sampling resolution was
better than for LLG or MM. The lower end started around 2500 cal BP, although the range of
uncertainty is between 2800 and 2150 cal BP for that part. The overall sediment accumulation
rate (0.5 mm*a-1) was almost two times higher than MM or LLG.
Figure 46: Age-depth model of BWM core. Red dotted line=median age, grey shaded area=95% confidence interval.
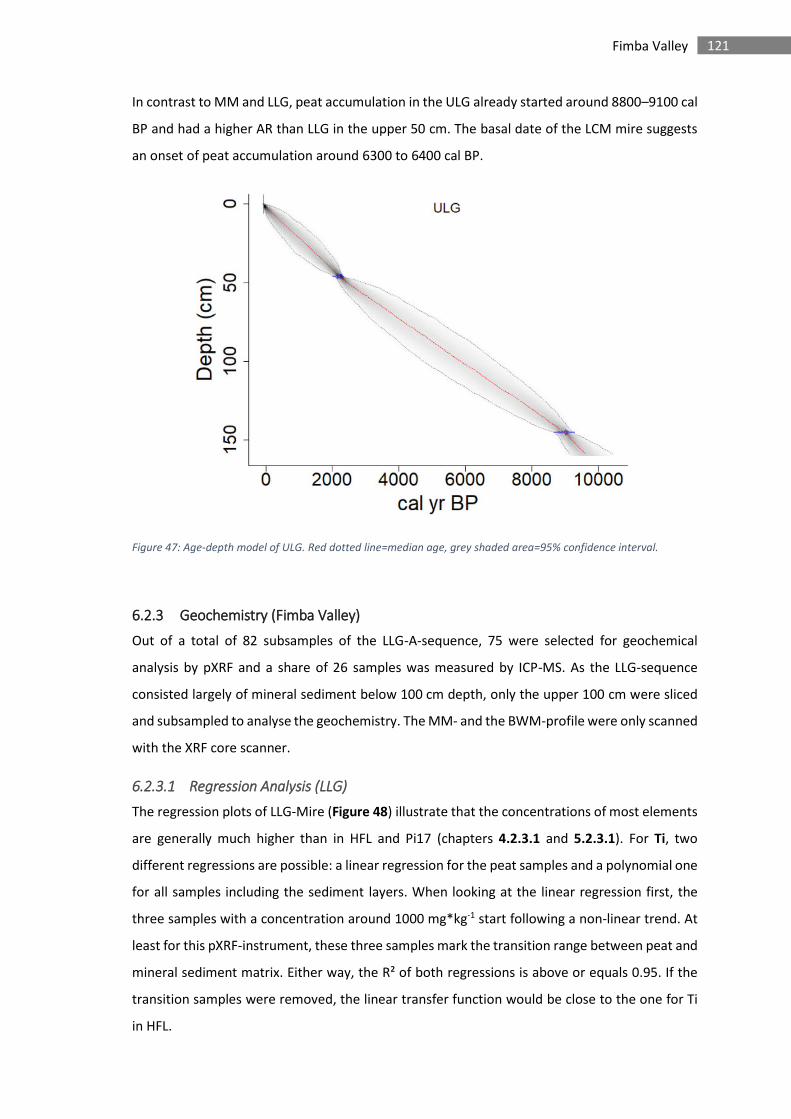
121 Fimba Valley
In contrast to MM and LLG, peat accumulation in the ULG already started around 8800–9100 cal
BP and had a higher AR than LLG in the upper 50 cm. The basal date of the LCM mire suggests
an onset of peat accumulation around 6300 to 6400 cal BP.
Figure 47: Age-depth model of ULG. Red dotted line=median age, grey shaded area=95% confidence interval.
6.2.3 Geochemistry (Fimba Valley)
Out of a total of 82 subsamples of the LLG-A-sequence, 75 were selected for geochemical
analysis by pXRF and a share of 26 samples was measured by ICP-MS. As the LLG-sequence
consisted largely of mineral sediment below 100 cm depth, only the upper 100 cm were sliced
and subsampled to analyse the geochemistry. The MM- and the BWM-profile were only scanned
with the XRF core scanner.
6.2.3.1 Regression Analysis (LLG)
The regression plots of LLG-Mire (Figure 48) illustrate that the concentrations of most elements
are generally much higher than in HFL and Pi17 (chapters 4.2.3.1 and 5.2.3.1). For Ti, two
different regressions are possible: a linear regression for the peat samples and a polynomial one
for all samples including the sediment layers. When looking at the linear regression first, the
three samples with a concentration around 1000 mg*kg-1 start following a non-linear trend. At
least for this pXRF-instrument, these three samples mark the transition range between peat and
mineral sediment matrix. Either way, the R² of both regressions is above or equals 0.95. If the
transition samples were removed, the linear transfer function would be close to the one for Ti
in HFL.
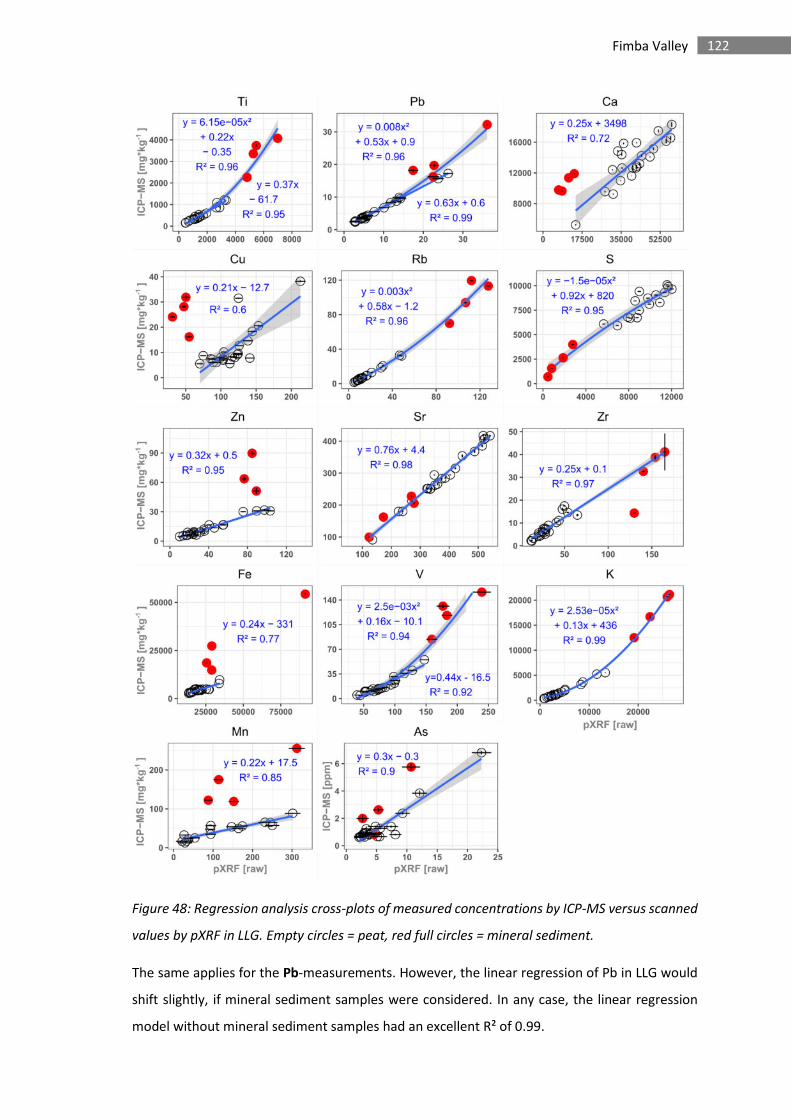
122 Fimba Valley
Figure 48: Regression analysis cross-plots of measured concentrations by ICP-MS versus scanned
values by pXRF in LLG. Empty circles = peat, red full circles = mineral sediment.
The same applies for the Pb-measurements. However, the linear regression of Pb in LLG would
shift slightly, if mineral sediment samples were considered. In any case, the linear regression
model without mineral sediment samples had an excellent R² of 0.99.
123 Fimba Valley
The measurements of Ca resulted in a linear regression, although the fit R² was only at 0.72 with
the mineral samples excluded. For Ca, the three peat-mineral-transitional samples plot above
the regression line (at 35,000 pXRF raw).
The transfer function of Rb in LLG is described by a linear function for concentrations up to 40
mg*kg-1 by using a 2nd degree polynomial with the mineral samples included (R²=0.96). Lower
concentrations were still overestimated by pXRF, but Rb was measured closer to quantitative
values the higher the mineral content in the sample was.
Compared to the mineral samples, the peat in LLG is high in S, but both measurements were
linearly correlated with an R² of 0.94 and a relatively low overestimation by pXRF. Very similar
to S is the behaviour of Sr, with a coefficient of determination (R²=0.98). The regression of Zn
was linear (R²=0.95) when excluding the mineral samples.
Probably attributable to the high concentrations of Zr, the regression analysis yielded an R² of
0.97 for the whole range of samples, although one outlier (mineral sample) had to be excluded
(see Figure 48). The Fe values show a linear regression, but only for the peat samples and with
a relatively low fit (R²=0.77). Despite higher errors, V shows a linear regression in peat (R²=0.92)
or a polynomial of 2nd order (R²=0.94) with including mineral samples. However, the transition
range between peat and minerogenic samples poses a problem here as well.
The regression analysis for K is depicted perfectly (R²=0.99) by a polynomial of 2nd degree with
a decreasing overestimation of pXRF with increasing concentration. With a fit of R²=0.85, Mn
appears to be quantifiable in peat samples as well. In contrast, Cu shows a weak fit again. Most
samples (5 to 10 mg*kg-1) scattered largely, indicating that the LOD was reached. Finally, As
shows a linear regression with a good fit of R²=0.9, but only without the mineral samples.
Furthermore, a large scatter shows in the median range of concentrations (0.5 to 1.5 mg*kg-1).
The generally elevated concentrations illustrate the matrix effect, which affects the pXRF
measurements relative to the mineral content in the sample. Similar to the regression analysis
of the HFL samples (chapter 4.2.3.1), the pXRF instrument overestimates most elements, but
with rising mineral content, the measurements are getting closer to their true concentrations.
This regression analysis demonstrates that pXRF measurements of Ti, Pb, Rb, S, Sr, Zn, K, V, Zr
and – with some limitations – of Fe, Mn and Ca in peat can be transferred into absolute
concentrations by transfer functions. For the elements Ti, Rb, S, Sr, Zr, and K, even the mineral
(rich) samples can be integrated into a single transfer function, which allows their quantification
in samples of these kinds of mires.
124 Fimba Valley
6.2.3.2 Elemental profiles (Lower Las Gondas, LLG)
Ca, Sr, S: As the regression analysis of Ca in LLG was strongly affected by changes between
mineral and peat matrix on the pXRF measurements, the ICP-MS results of Ca are presented in
Figure 49Fehler! Verweisquelle konnte nicht gefunden werden.. The concentrations are mostly h
igher than in HFL, with a maximum of around 18,000 mg*kg-1 in the lower third. Afterwards, a
declining trend can be observed, reaching concentrations below 10,000 mg*kg-1 in the upper 25
cm. Another minimum occurs in the mineral layers from 98 to 92 cm. The Sr-profile shows a
similar trend, with concentrations of up to 400 mg*kg-1 between 83 and 65 cm and minimum
concentrations of 100 to 120 mg*kg-1 in the top 6 cm and in the mineral layer around 95 cm.
This suggests that LLG is strongly influenced by rich groundwater or dissolution of Ca from the
recurring mineral particles and layers in the mire, which also points to a relatively high Ca-
content in the local geology. Also S had high concentrations of over 9000 mg*kg-1 in the peat
and around 2000 mg*kg-1 in the mineral layers.
Fe, Zn, V: In contrast to Sr and S, these elements are elevated in the mineral rich layers, which
is an almost inverse pattern. The calibrated pXRF results (blue lines, Figure 20) were significantly
underestimated in mineral layers because of the matrix effects in the calibration, illustrated in
comparison to the ICP-MS results in Figure 20 (red curves).
K, Rb, Ti, Zr: Showing main trends similar to the three elements above, K, Rb, Ti and Zr pXRF-
measurements could be calibrated. Their concentrations share a sharp maximum from around
97 to 93 cm and a decrease thereafter. Phases of relatively low content were recurringly
interrupted by sharp peaks at 62 and at 56 cm, from 44 to 40 and two smaller peaks at 38 and
33 cm, corresponding to visible sediment layers in the core. Variations within the peat layers
without visible mineral content (e.g. 82—63 cm and 32—6 cm) were small, relative to peaks in
the mineral layers around 95 cm or at the surface. The profiles of Ti and Zr also revealed smaller
periods of elevated mineral content or input, at 68.5, at 21 and around 16.5 cm. All these
elements share a sharp increase in the upper 6 cm.
Inferred from the profiles, it can be assumed that Fe, Zn, V, K, Rb, Ti and Zr represent mineral
input into LLG. Less distinct smaller peaks for Fe and Zn and a smoother profile in the peat layers
for K and Rb, however, indicates that these elements were affected by redistribution. Especially
for Fe and Zn, biological cycling by the vegetation is obvious in the upper layers. A general
observation is that the concentrations of the lithogenic components in this mire are generally
very high, when compared to the other study areas. Despite the continuous decline of Ca and Sr
in the upper 25 cm, the geochemistry is far from ombrotrophic conditions.
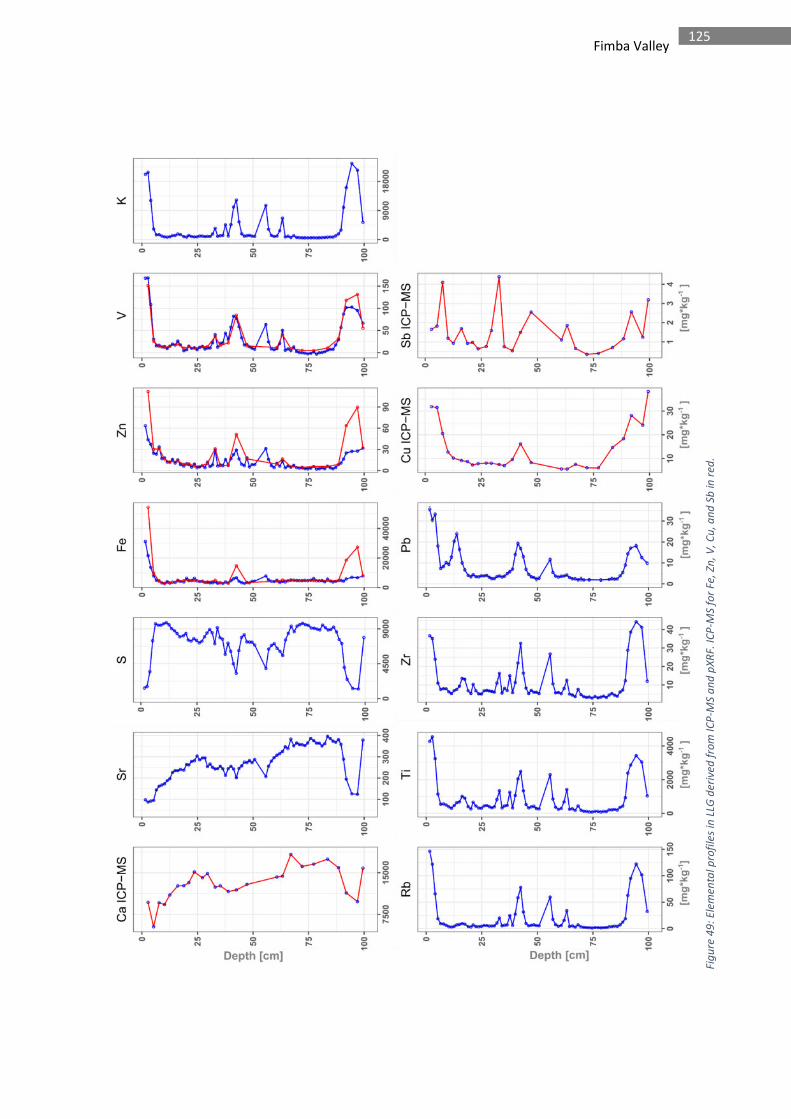
125 Fimba Valley
Fig
ure
49
: E
lem
en
tal p
rofi
les
in L
LG d
eri
ved
fro
m I
CP
-MS
an
d p
XR
F. I
CP
-MS
for
Fe,
Zn
, V
, C
u,
an
d S
b in
re
d.
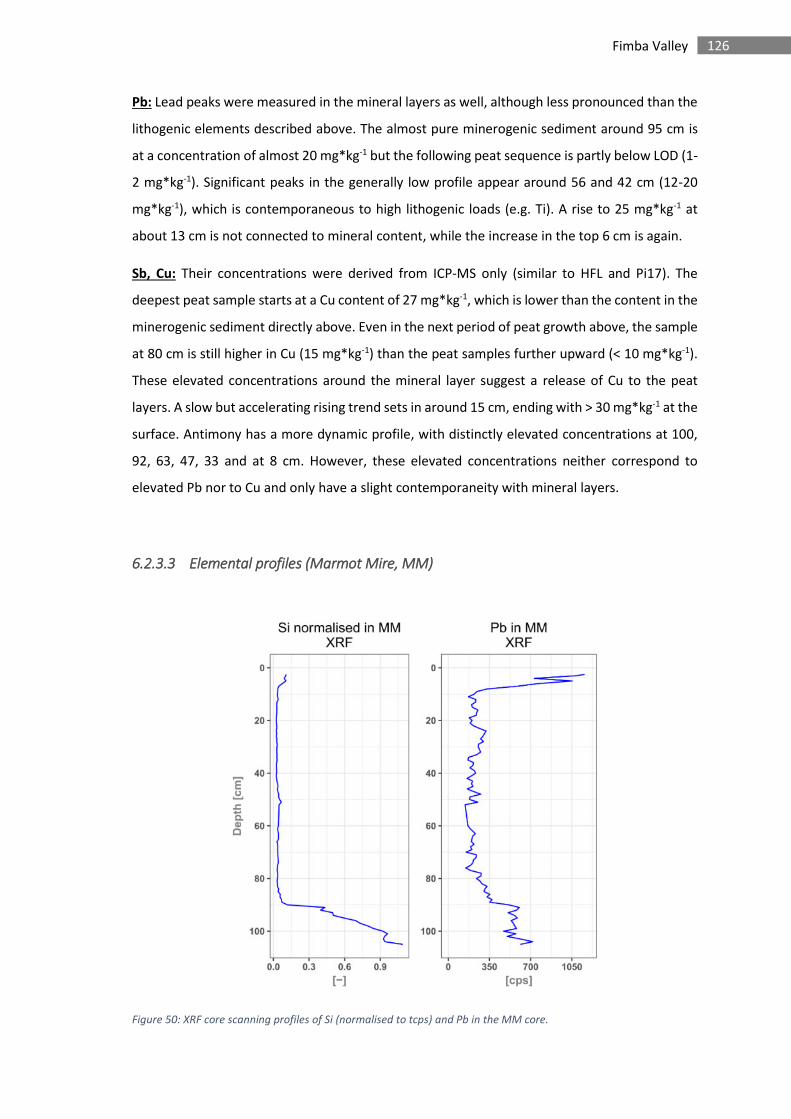
126 Fimba Valley
Pb: Lead peaks were measured in the mineral layers as well, although less pronounced than the
lithogenic elements described above. The almost pure minerogenic sediment around 95 cm is
at a concentration of almost 20 mg*kg-1 but the following peat sequence is partly below LOD (1-
2 mg*kg-1). Significant peaks in the generally low profile appear around 56 and 42 cm (12-20
mg*kg-1), which is contemporaneous to high lithogenic loads (e.g. Ti). A rise to 25 mg*kg-1 at
about 13 cm is not connected to mineral content, while the increase in the top 6 cm is again.
Sb, Cu: Their concentrations were derived from ICP-MS only (similar to HFL and Pi17). The
deepest peat sample starts at a Cu content of 27 mg*kg-1, which is lower than the content in the
minerogenic sediment directly above. Even in the next period of peat growth above, the sample
at 80 cm is still higher in Cu (15 mg*kg-1) than the peat samples further upward (< 10 mg*kg-1).
These elevated concentrations around the mineral layer suggest a release of Cu to the peat
layers. A slow but accelerating rising trend sets in around 15 cm, ending with > 30 mg*kg-1 at the
surface. Antimony has a more dynamic profile, with distinctly elevated concentrations at 100,
92, 63, 47, 33 and at 8 cm. However, these elevated concentrations neither correspond to
elevated Pb nor to Cu and only have a slight contemporaneity with mineral layers.
6.2.3.3 Elemental profiles (Marmot Mire, MM)
Figure 50: XRF core scanning profiles of Si (normalised to tcps) and Pb in the MM core.
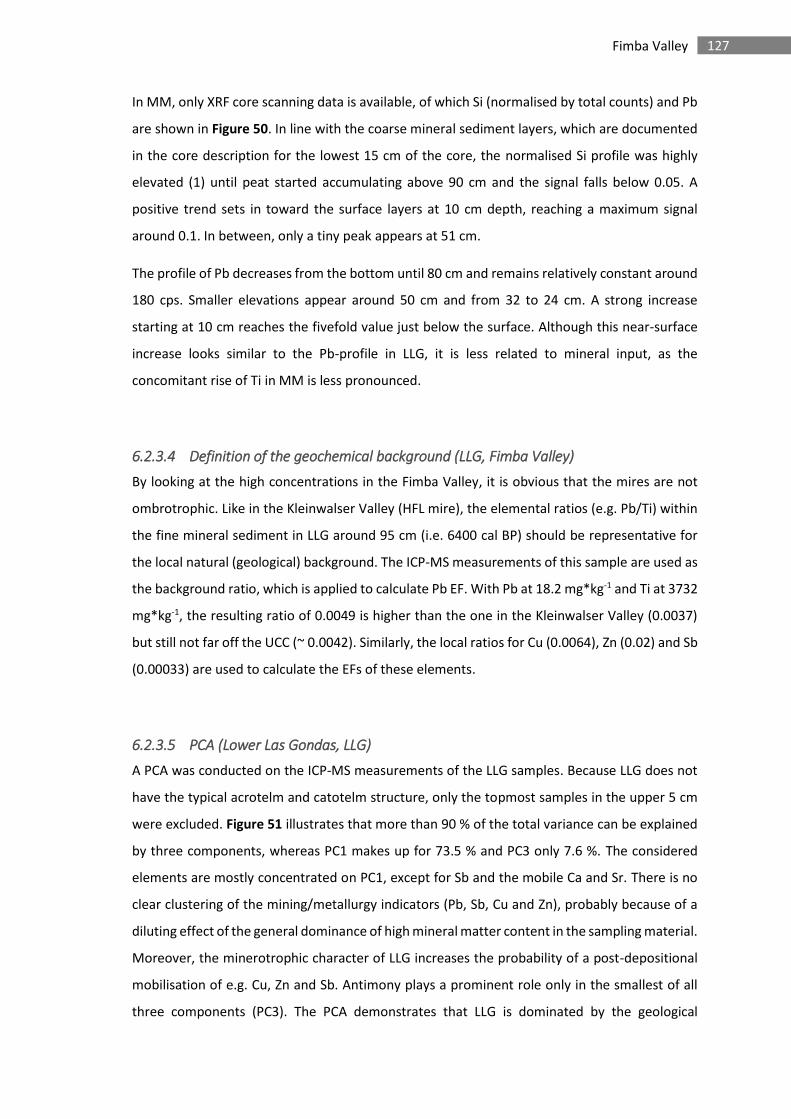
127 Fimba Valley
In MM, only XRF core scanning data is available, of which Si (normalised by total counts) and Pb
are shown in Figure 50. In line with the coarse mineral sediment layers, which are documented
in the core description for the lowest 15 cm of the core, the normalised Si profile was highly
elevated (1) until peat started accumulating above 90 cm and the signal falls below 0.05. A
positive trend sets in toward the surface layers at 10 cm depth, reaching a maximum signal
around 0.1. In between, only a tiny peak appears at 51 cm.
The profile of Pb decreases from the bottom until 80 cm and remains relatively constant around
180 cps. Smaller elevations appear around 50 cm and from 32 to 24 cm. A strong increase
starting at 10 cm reaches the fivefold value just below the surface. Although this near-surface
increase looks similar to the Pb-profile in LLG, it is less related to mineral input, as the
concomitant rise of Ti in MM is less pronounced.
6.2.3.4 Definition of the geochemical background (LLG, Fimba Valley)
By looking at the high concentrations in the Fimba Valley, it is obvious that the mires are not
ombrotrophic. Like in the Kleinwalser Valley (HFL mire), the elemental ratios (e.g. Pb/Ti) within
the fine mineral sediment in LLG around 95 cm (i.e. 6400 cal BP) should be representative for
the local natural (geological) background. The ICP-MS measurements of this sample are used as
the background ratio, which is applied to calculate Pb EF. With Pb at 18.2 mg*kg-1 and Ti at 3732
mg*kg-1, the resulting ratio of 0.0049 is higher than the one in the Kleinwalser Valley (0.0037)
but still not far off the UCC (~ 0.0042). Similarly, the local ratios for Cu (0.0064), Zn (0.02) and Sb
(0.00033) are used to calculate the EFs of these elements.
6.2.3.5 PCA (Lower Las Gondas, LLG)
A PCA was conducted on the ICP-MS measurements of the LLG samples. Because LLG does not
have the typical acrotelm and catotelm structure, only the topmost samples in the upper 5 cm
were excluded. Figure 51 illustrates that more than 90 % of the total variance can be explained
by three components, whereas PC1 makes up for 73.5 % and PC3 only 7.6 %. The considered
elements are mostly concentrated on PC1, except for Sb and the mobile Ca and Sr. There is no
clear clustering of the mining/metallurgy indicators (Pb, Sb, Cu and Zn), probably because of a
diluting effect of the general dominance of high mineral matter content in the sampling material.
Moreover, the minerotrophic character of LLG increases the probability of a post-depositional
mobilisation of e.g. Cu, Zn and Sb. Antimony plays a prominent role only in the smallest of all
three components (PC3). The PCA demonstrates that LLG is dominated by the geological
128 Fimba Valley
background, confirming the observations in the concentration profiles. The outcome of the PCA
was strongly influenced by the mineral layers within the profile, reducing its explanatory power
for the behaviour of elements in the peat samples.
Figure 51: PCA of ICP-MS measurements in LLG.
As for the chapters on the Kleinwalser Valley and Piller Mire, Ti represents the lithogenic mineral
component. Strong changes in the sample matrix and the minerotrophic character of LLG,
however, complicate the interpretation of metals, as their signals were quite weak and not
strongly associated to a separate PC.
6.3 Chronological discussion (Fimba Valley)
Which mechanisms are controlling an increased sediment input or peat development in the
Fimba Valley? These mechanisms can be anthropogenic, mainly changes in land use and land-
cover, or climatic, mainly variations in temperature or precipitation. During the Early Holocene,
the most important cause of erosion at this altitude was a changing climate without any human
interference. Hence, this chapter first compares the timing of changes in sedimentation with
known climate variations or events during this “undisturbed” period. In general, stable and
relatively warm conditions foster peat accumulation, whereas variable and rather cool
conditions could limit mire growth. Several studies used glacio-fluvial stream-bank mires to
reconstruct glacial activities by identifying and dating sediment layers from increased meltwater
input (e.g. Matthews et al., 2005; Shakesby et al., 2007).
129 Fimba Valley
6.3.1 Early to Mid-Holocene (10,500 to 6300 cal BP)
The earliest onset of minerogenic sedimentation and peat accumulation in the mires of the
upper Fimba Valley remains unclear and suggests a heterogeneous development between and
within the different sites. Starting with the (Upper) Las Gondas Mire, the study of Dietre et al.
(2014) suggested that peat started accumulating at 10,450 cal BP and that trees were present
around the Las Gondas site at that time. Bauerochse and Katenhusen (1997) dated the basal
peat of the mire to a range between 8050 and 7621 cal BP. In this study, the oldest radiocarbon
sample in Lower Las Gondas (LLG) taken in the basal clay deposits (pro-glacial lake or fluvial
deposits) at a depth around 225 cm provides an age of 10,260 to 10,520 cal BP, but no peat was
accumulated then. The first phase of peat growth dates to around 8750 cal BP, although the
peat (partly moss) was completely flushed and filled with sediment. The first phase of
undisturbed peat started around 7500 cal BP. In contrast, the Upper Las Gondas (ULG) core,
which was not analysed in detail, shows that peat accumulation had already started between
9150 and 8750 cal BP. This is however significantly younger than the 10,450 cal BP of Dietre et
al. (2014). For MM, a basal age range between 8600 to 7100 cal BP was modelled, although peat
accumulation did not start earlier than 7000 cal BP. The different dates for the onset of peat
accumulation in the mires demonstrate the heterogeneity of the mire.
A review on Alpine glaciers and timber line studies by Ivy-Ochs et al. (2009) puts the beginning
of a warmer period to around 10,500 cal BP, which would be in line with the earliest dates of
beginning sedimentation or peat growth in Las Gondas. Favourable conditions are also inferable
from human presence in the neighbouring valley at that time (Cornelissen and Reitmaier, 2016).
Coarse grained sediment (very fine gravel) amidst of the otherwise fine and clayey material at
about 9200 cal BP coincides with the 9.2 ka cold event (Fleitmann et al., 2008). A cooling just
prior to this age was suggested in the Western Alps by Tinner and Kaltenrieder (2005). It is,
therefore, suggested that the coarse layer itself is related to the culmination of a cold event or
to the beginning of glacier retreat in Eastern Switzerland (Joerin et al., 2008), which could have
temporarily increased sediment transport by glacial activity. Consequently, warmer and
probably more stable conditions are in line with wood pieces and a continuously increasing
organic content (peat/silt mix) after this event until around 8700 cal BP. At this point, a short
phase of glacier regression (Nicolussi and Patzelt, 2000) coincides with a layer of sediment with
less plant remains in LLG. Thereafter, wood pieces and the first small peat layers indicate a stable
and warm period again between 8500 and 8300 cal BP. This is in line with the presence of Pinus
cembra trees at the mire (Nicolussi, 2012) and also Tinner and Ammann (2001) are arguing for
a continuous warm period in the Alps from 9000 to 8200 cal BP.
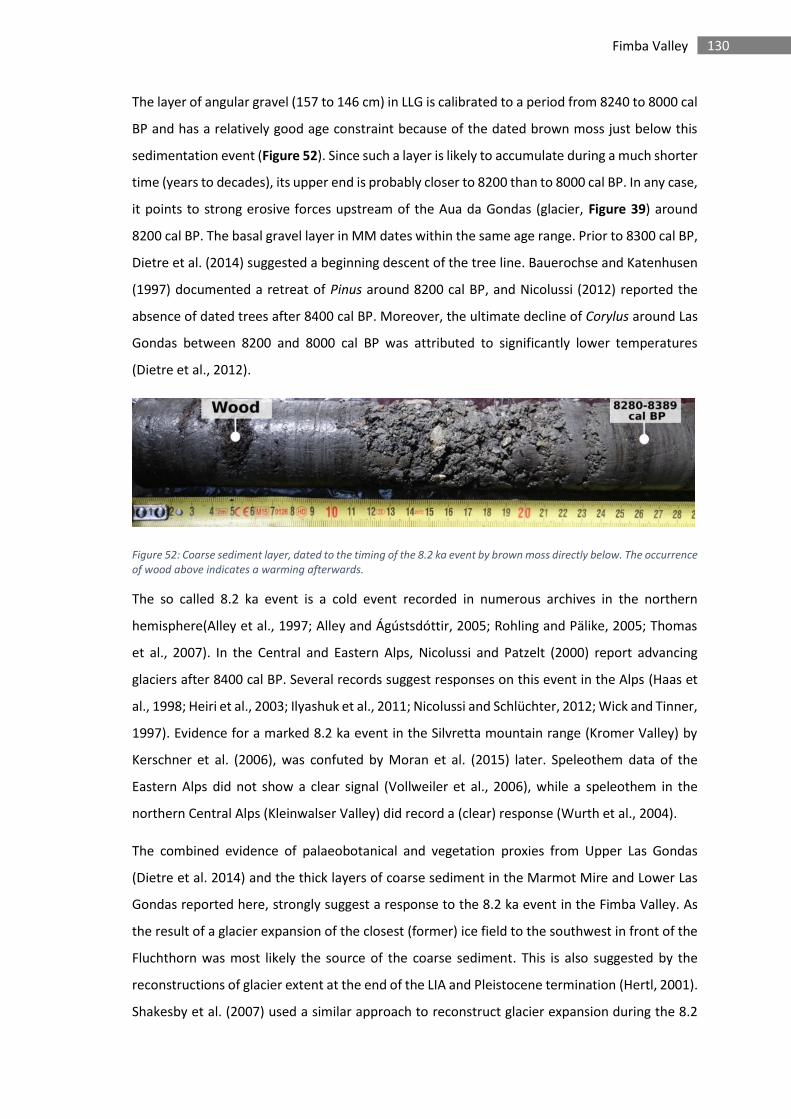
130 Fimba Valley
The layer of angular gravel (157 to 146 cm) in LLG is calibrated to a period from 8240 to 8000 cal
BP and has a relatively good age constraint because of the dated brown moss just below this
sedimentation event (Figure 52). Since such a layer is likely to accumulate during a much shorter
time (years to decades), its upper end is probably closer to 8200 than to 8000 cal BP. In any case,
it points to strong erosive forces upstream of the Aua da Gondas (glacier, Figure 39) around
8200 cal BP. The basal gravel layer in MM dates within the same age range. Prior to 8300 cal BP,
Dietre et al. (2014) suggested a beginning descent of the tree line. Bauerochse and Katenhusen
(1997) documented a retreat of Pinus around 8200 cal BP, and Nicolussi (2012) reported the
absence of dated trees after 8400 cal BP. Moreover, the ultimate decline of Corylus around Las
Gondas between 8200 and 8000 cal BP was attributed to significantly lower temperatures
(Dietre et al., 2012).
Figure 52: Coarse sediment layer, dated to the timing of the 8.2 ka event by brown moss directly below. The occurrence
of wood above indicates a warming afterwards.
The so called 8.2 ka event is a cold event recorded in numerous archives in the northern
hemisphere(Alley et al., 1997; Alley and Ágústsdóttir, 2005; Rohling and Pälike, 2005; Thomas
et al., 2007). In the Central and Eastern Alps, Nicolussi and Patzelt (2000) report advancing
glaciers after 8400 cal BP. Several records suggest responses on this event in the Alps (Haas et
al., 1998; Heiri et al., 2003; Ilyashuk et al., 2011; Nicolussi and Schlüchter, 2012; Wick and Tinner,
1997). Evidence for a marked 8.2 ka event in the Silvretta mountain range (Kromer Valley) by
Kerschner et al. (2006), was confuted by Moran et al. (2015) later. Speleothem data of the
Eastern Alps did not show a clear signal (Vollweiler et al., 2006), while a speleothem in the
northern Central Alps (Kleinwalser Valley) did record a (clear) response (Wurth et al., 2004).
The combined evidence of palaeobotanical and vegetation proxies from Upper Las Gondas
(Dietre et al. 2014) and the thick layers of coarse sediment in the Marmot Mire and Lower Las
Gondas reported here, strongly suggest a response to the 8.2 ka event in the Fimba Valley. As
the result of a glacier expansion of the closest (former) ice field to the southwest in front of the
Fluchthorn was most likely the source of the coarse sediment. This is also suggested by the
reconstructions of glacier extent at the end of the LIA and Pleistocene termination (Hertl, 2001).
Shakesby et al. (2007) used a similar approach to reconstruct glacier expansion during the 8.2
131 Fimba Valley
ka event in a Norwegian stream-bank mire. It remains however unclear, if the high load of
sediment was a direct result of a combined advance of the glacier and soil destabilisation due to
vegetation withdrawal, or if it was transported because to the force of increased meltwater
release.
The following period, until approximately 7600 cal BP, is characterised by interlayered mineral
rich peat and silty sediment in the LLG record, indicating a continuous flushing with silty
material. However, a small piece of wood embedded at 7850 cal BP suggests that the tree line
had already moved up again after the 8.2 ka cold event. After 7500 cal BP, an almost undisturbed
accumulation of peat is only interrupted by a silty layer at around 7300 cal BP, which would fit
to the end of glacier recession reported for south-eastern Switzerland between 7450 and 6650
cal BP (Joerin et al., 2008). In both cases, a connection to glacier activity would be responsible.
Another period of undisturbed peat accumulation thereafter suggests relatively warm and
stable conditions, until a thick minerogenic layer, deposited at c. 6400 to 6200 cal BP interrupts
this period. During this phase, the now incipient geochemical record of LLG (Figure 53) illustrates
the high mineral input with a maximum MAR of 225 g*m-2*a-1 centred around 6300 cal BP. The
almost synchronous date for the onset of peat accumulation directly after a coarse mineral
bottom layer with angular gravel (mm to cm) in the LCM core (Table 7) suggests a common
trigger. As the LCM mire is located on the eastern side of the Fimba Valley, it implies a
mechanism, which is not just a small-scale or site-specific signal.
An anthropogenic impact as the cause behind the deposition and accumulation regimes of
sediment and peat up to this point is rather unlikely. However, hunters and gatherers were
present in the upper part of this valley and in neighbouring ones around 8.2 ka (Cornelissen and
Reitmaier, 2016; Reitmaier, 2012). Reitmaier (2012) also showed archaeological evidence for
human presence at about 7500 cal BP and between 6850 and 6500 cal BP. Moreover, a
continuous phase of human activities in the valley was suggested after c. 7450 cal BP by
Kothieringer et al. (2015) and Dietre et al. (2014). These studies observed an increasing human
impact (fire, deforestation and maybe livestock) until around 6200 cal BP. This suggests that the
sedimentation pulse observed in LLG after around 6400 cal BP was partly induced by these
activities. However, a colder climate in the Fimba valley during this period is suggested by the
Las Gondas pollen record (Dietre et al. (2014). Evidence from glaciers and dendrochronological
studies also suggest cooler conditions in the Alps around this time (Bortenschlager, 2010; Haas
et al., 1998; Ivy-Ochs et al., 2009; Joerin et al., 2008, 2006; Nicolussi and Patzelt, 2000). Some of
these authors correlate this cooler phase with the Rotmoos-I phase, also known as the Piora-I
oscillation. Similar to the LLG record, concurring silt layers were found by Wahlmüller (2002) in
a mire at about 2000 m a.s.l. at Serfaus, 25 km northeast of the Fimba Valley (Figure 23).
132 Fimba Valley
Although the other local studies in the upper part of the Las Gondas Mire did present
dendrochronological and pollen evidence for a colder climate, they did not document such
distinct (coarse) mineral layers in their records, neither around 8200 nor 6300 cal BP. Again, this
highlights the heterogeneity of the mire(s), but it also shows that the selection of the coring site
can strongly influence the outcome of the study. In this case, the proximity of the LLG-core to
the Aua da Gondas brook and with it the direct connection to the Fluchthorn glacier field
probably made it more sensitive to glacial activities, corresponding to well-described cold events
that triggered erosion. This sensitivity is illustrated by an ancient debris flow, coming from the
Fluchthorn glacier field, passing by the LLG coring site and ending shortly downslope of it (aerial
photo, Figure 39).
Despite the unavailability of geochemical data for most of the time period discussed in this
section, the contemporaneous occurrence of prominent sediment layers, regional glacier
progressions and evidence from pollen studies suggests a relationship. It is therefore concluded
that several prominent cold events influenced the landscape and triggered glacial activity in the
upper Fimba Valley, most prominently during the 8.2 ka event but also around 6300 cal BP,
whereas human impact was rather negligible.
6.3.2 6200 to 2800 cal BP
After the preceding mineral layers of the cold period, an interval of low MAR 3 g*m-2*a-1 is
observed in LLG from 6100 to 5100 cal BP and only a brief small deterioration shows up at 5400
cal BP in Figure 53. After sinking below 5 g*m-2*a-1 again, another rise of MAR shows up directly
prior to 5000 cal BP and again at 4500 cal BP to 20 g*m-2*a-1. A period of increased MAR stretches
from 3700 to 3500 cal BP, with a maximum of over 30 g*m-2*a-1. Two smaller peaks around 14
g*m-2*a-1 were then recorded at 3380 and 3170 cal BP but a level below 5 g*m-2*a-1 is kept until
2800 cal BP. Only a slightly elevated phase of almost 5 g*m-2*a-1 is centred around 2900 cal BP.
In good agreement with the palynological data (less tree, but no increase in cultural or pastoral
pollen) and with the interpretation of Dietre et al. (2014), the MAR peak at 5400 cal BP could be
related to the Rotmoos-II cold period. Another peak around 5000 cal BP is in line with reviews
of major Alpine cold phases (CE-6) by Haas et al. (1998) or Ivy-Ochs et al. (2009). Thereafter, the
Fimba Valley itself and neighbouring valleys to the south experienced an increasing impact of
human activities due to the general transition from hunting to agro-pastoralism at c. 4800 cal
BP (Bauerochse and Katenhusen, 1997; Dietre et al., 2017, 2014; Kothieringer et al., 2015).
However, the MAR in LLG seems to be unaffected by the development at this point. Not much
later, the peak at 4500 cal BP agrees well with a rise in pastoral and cultural indicators in the Las
133 Fimba Valley
Gondas Mire (Dietre et al., 2014) but also coincides with short glacier advances in the Central
Alps (Joerin et al., 2006; Nicolussi and Patzelt, 2000).
During the Bronze Age, the first and highest of three MAR peaks around 3600 cal BP coincides
with another cold period (Haas et al., 1998), also reflected in a glacier maximum of the
Gepatschferner (Nicolussi and Patzelt, 2000), which is only 35 km to the east of the Fimba Valley
(see Figure 1). Several radiocarbon dated archaeological finds from around the mire indicate
human presence between approximately 4000 and 3600 cal BP (Reitmaier et al., 2018).
However, the pollen record of Dietre et al. (2014) shows a phase of very low pollen influx and a
trend to rather high percentages of tree pollen and a minimum of charcoal and pastoral
indicators at the end of this phase (3500 cal BP). A decline of fire management in the
neighbouring Lower Engadine Valley (Figure 37) towards 3650 cal BP was also suggested by
Dietre et al. (2017). Hence, an anthropogenic cause behind the first MAR peak around 3600 cal
BP signal is unlikely despite human presence. Thereafter, Hormes et al. (2001) suggested a
warmer period with retreating glaciers and the two following MAR peaks in LLG during the
Middle to Late Bronze Age coincided with rising pastoral indicators and a more open landscape,
indicating an artificial lowering of the timber line, paired with increasing livestock grazing around
the Las Gondas Mire (Bauerochse and Katenhusen, 1997; Dietre et al., 2014). Local
archaeological evidence for human presence also exists for this period (Reitmaier et al., 2018).
On the descent, south of the upper end of the Fimba Valley (Figure 37), an abri had been in use
around 3480 to 3370 cal BP (Reitmaier, 2012). In this area, belonging to the Lower Engadin,
Dietre et al. (2017) recorded a revival of fire management and agriculture from 3400 to 2800 cal
BP. Reitmaier et al. (2018) demonstrated that a change in livestock management – vertical
transhumance and a shift to the use of secondary animal products (dairy, wool, etc.) – happened
in the same time interval and area. Not far from the eastern boundary of the Silvretta mountains,
Wahlmüller (2002) documented stronger human impact, dated to around 3500 to 3350 cal BP.
Further east (Oetz Valley, e.g. Figure 23), Festi et al. (2014) concluded that the onset of strong
human impact (agro-pastoralism) began and prevailed in the Middle to Late Bronze Age. In the
opposite direction, west of the Fimba Valley, studies supposed an increased agro-pastoralism
before and around 3250 cal BP (Roepke et al., 2011; Roepke and Krause, 2013).
While some parts of the MM-core are chronologically less constrained, a first mineral peak
appeared around 3500 cal BP (Si signal, Figure 54). In this case, the peak in MM could either
correspond to the first, or to one of the latter MAR peaks in LLG. So far, the MM-core did not
receive increased mineral content synchronously with MAR peaks in LLG during the previously
suggested cold phases. This could be possibly due to the location of MM below another
upstream mire, which is acting as a buffer for higher sediment loads. Furthermore, the nearby
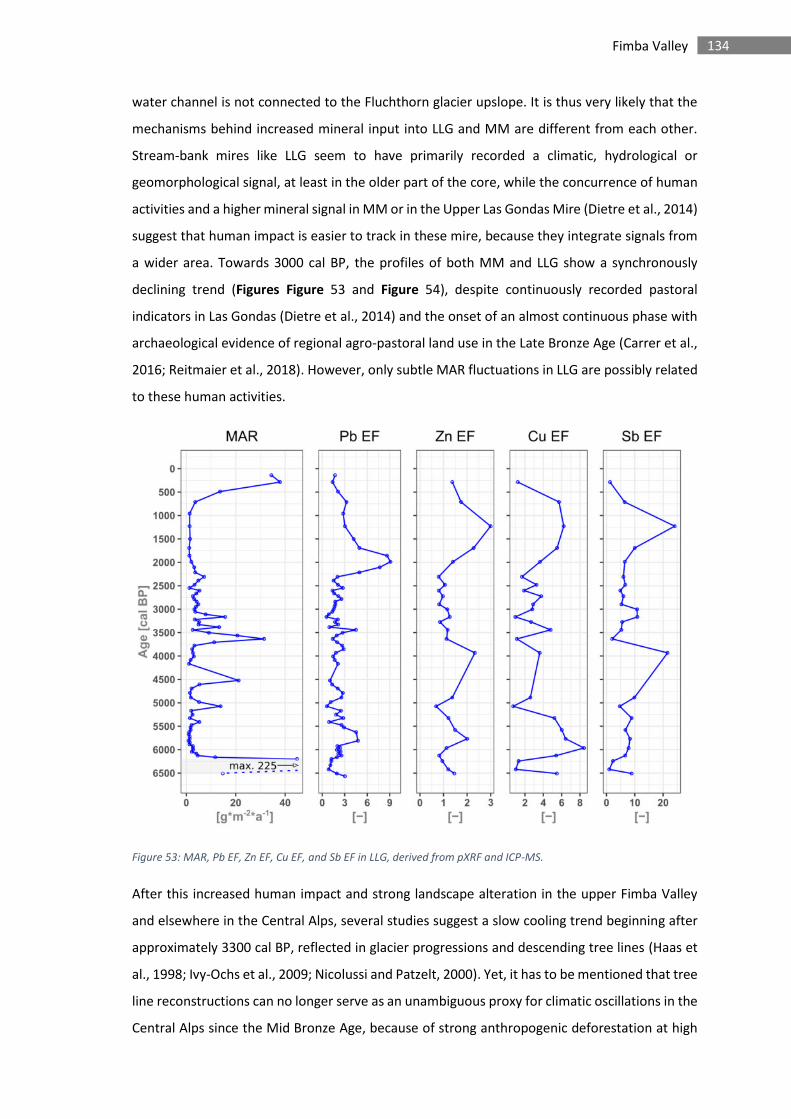
134 Fimba Valley
water channel is not connected to the Fluchthorn glacier upslope. It is thus very likely that the
mechanisms behind increased mineral input into LLG and MM are different from each other.
Stream-bank mires like LLG seem to have primarily recorded a climatic, hydrological or
geomorphological signal, at least in the older part of the core, while the concurrence of human
activities and a higher mineral signal in MM or in the Upper Las Gondas Mire (Dietre et al., 2014)
suggest that human impact is easier to track in these mire, because they integrate signals from
a wider area. Towards 3000 cal BP, the profiles of both MM and LLG show a synchronously
declining trend (Figures Figure 53 and Figure 54), despite continuously recorded pastoral
indicators in Las Gondas (Dietre et al., 2014) and the onset of an almost continuous phase with
archaeological evidence of regional agro-pastoral land use in the Late Bronze Age (Carrer et al.,
2016; Reitmaier et al., 2018). However, only subtle MAR fluctuations in LLG are possibly related
to these human activities.
Figure 53: MAR, Pb EF, Zn EF, Cu EF, and Sb EF in LLG, derived from pXRF and ICP-MS.
After this increased human impact and strong landscape alteration in the upper Fimba Valley
and elsewhere in the Central Alps, several studies suggest a slow cooling trend beginning after
approximately 3300 cal BP, reflected in glacier progressions and descending tree lines (Haas et
al., 1998; Ivy-Ochs et al., 2009; Nicolussi and Patzelt, 2000). Yet, it has to be mentioned that tree
line reconstructions can no longer serve as an unambiguous proxy for climatic oscillations in the
Central Alps since the Mid Bronze Age, because of strong anthropogenic deforestation at high
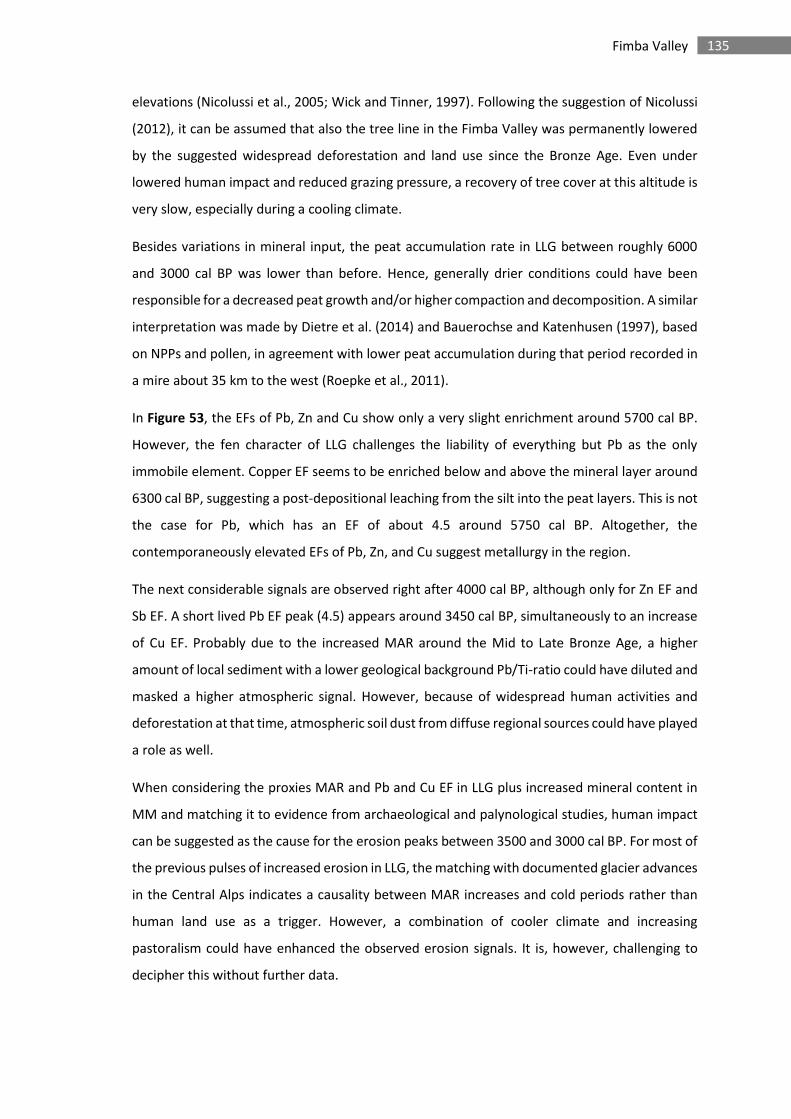
135 Fimba Valley
elevations (Nicolussi et al., 2005; Wick and Tinner, 1997). Following the suggestion of Nicolussi
(2012), it can be assumed that also the tree line in the Fimba Valley was permanently lowered
by the suggested widespread deforestation and land use since the Bronze Age. Even under
lowered human impact and reduced grazing pressure, a recovery of tree cover at this altitude is
very slow, especially during a cooling climate.
Besides variations in mineral input, the peat accumulation rate in LLG between roughly 6000
and 3000 cal BP was lower than before. Hence, generally drier conditions could have been
responsible for a decreased peat growth and/or higher compaction and decomposition. A similar
interpretation was made by Dietre et al. (2014) and Bauerochse and Katenhusen (1997), based
on NPPs and pollen, in agreement with lower peat accumulation during that period recorded in
a mire about 35 km to the west (Roepke et al., 2011).
In Figure 53, the EFs of Pb, Zn and Cu show only a very slight enrichment around 5700 cal BP.
However, the fen character of LLG challenges the liability of everything but Pb as the only
immobile element. Copper EF seems to be enriched below and above the mineral layer around
6300 cal BP, suggesting a post-depositional leaching from the silt into the peat layers. This is not
the case for Pb, which has an EF of about 4.5 around 5750 cal BP. Altogether, the
contemporaneously elevated EFs of Pb, Zn, and Cu suggest metallurgy in the region.
The next considerable signals are observed right after 4000 cal BP, although only for Zn EF and
Sb EF. A short lived Pb EF peak (4.5) appears around 3450 cal BP, simultaneously to an increase
of Cu EF. Probably due to the increased MAR around the Mid to Late Bronze Age, a higher
amount of local sediment with a lower geological background Pb/Ti-ratio could have diluted and
masked a higher atmospheric signal. However, because of widespread human activities and
deforestation at that time, atmospheric soil dust from diffuse regional sources could have played
a role as well.
When considering the proxies MAR and Pb and Cu EF in LLG plus increased mineral content in
MM and matching it to evidence from archaeological and palynological studies, human impact
can be suggested as the cause for the erosion peaks between 3500 and 3000 cal BP. For most of
the previous pulses of increased erosion in LLG, the matching with documented glacier advances
in the Central Alps indicates a causality between MAR increases and cold periods rather than
human land use as a trigger. However, a combination of cooler climate and increasing
pastoralism could have enhanced the observed erosion signals. It is, however, challenging to
decipher this without further data.
136 Fimba Valley
Figure 54: Si (normalised to total cps), Pb/Si, Cu/Si and Zn/Si in the MM-core, derived from XRF-core-scanning. The Si
profile is clipped at 10 % of the maximum of the signal.
6.3.3 2800 to 1500 cal BP
The MAR in LLG stayed relatively low (< 3 g*m-2*a-1) between 3000 and 1000 cal BP. Fluctuations
to values exceeding 5 and 7 g*m-2*a-1 are showing in the profile in Figure 53 around 2600 and
2300 cal BP respectively. A declining trend set in afterwards and reached minimum values
during the Roman period. Similar trends can be observed in the semi-quantitative Si-profile of
the MM-core (Figure 54): Smaller fluctuations during the Late Iron Age are followed by a stable
lower signal. A second increasing trend is parallel to MAR in LLG after 1200 cal CE and continues
until the surface layers. A limiting factor in the following interpretations is the decreasing peat
accumulation rate in LLG, which was steadily declining from 2800 cal BP onwards and hence
affected the sample resolution.
A significant cooling in the Alps around the Early Iron Age was suggested by several studies (Haas
et al., 1998; Ivy-Ochs et al., 2009; Joerin et al., 2006; Nicolussi, 2012; Nicolussi and Patzelt, 2000;
Patzelt and Bortenschlager, 1973). But unlike earlier MAR signals in LLG, the input did not
increase as strongly as earlier in response to the cooler climate. Only the small increase around
2600 cal BP would be in this range. Decreased anthropogenic erosion would be in good
agreement with sinking charcoal values, rising tree pollen and decreased pastoral indicators in
the first half of the Iron Age in the Las Gondas record of Dietre et al. (2014). Moreover, a
decreased human activity in the Silvretta region during the Iron Age compared to the Bronze
Age is suggested by Walser (2012). In contrast, the continuous use of an Iron Age pastoralist hut
137 Fimba Valley
was dated to the first half of the Iron Age (Carrer et al., 2016; Reitmaier et al., 2018). The slight
increase of MAR, starting after 2500 cal BP and peaking at 2300 cal BP, is in line with
palynological indicators for an intensified local land use around 2300 and 2000 cal BP
(Bauerochse and Katenhusen, 1997). Furthermore, clearances in the Oetz Valley were suggested
by Festi et al. (2014) between 2500 and 2100 cal BP. Archaeological sites are evidencing the
existence of permanent pastoralist hut and pen structures not far below LLG at 2283 m a.s.l.,
radiocarbon dated to 2760-2460 cal BP and to 2620-2340 cal BP (Reitmaier, 2012; Reitmaier et
al., 2013). This indicates a relation between human presence i.e. human land use and the
observed initial erosion in LLG. However, the MAR signal is less strong when compared to the
distinct peaks observed until the Bronze Age. This could possibly be explained by the already
anthropogenically shaped landscape (absence or low cover of trees) and stabilisation of an
extensive grassland or pasture system. Furthermore, the Iron Age hut, as the epicentre of
impact, was not as elevated as the analysed mires, making its potential impact less severe. At
this point, it has to be mentioned that the calibration of radiocarbon dates around the Mid Iron
Age (2450 BP) is subject to high uncertainties due to the 14C “Hallstatt plateau” (e.g. van der
Plicht, 2005), which would affect both the age model in LLG (cf. Table 14) and most of the
radiocarbon dates for the Iron Age hut (Reitmaier et al., 2018). This issue can explain
inconsistencies in the comparison of the different studies and their findings.
The MAR decline by the end of the Iron Age corresponded with a generally lower land use in the
upper valleys of the Silvretta Mountains during Roman times (Reitmaier, 2012; Walser, 2012). A
decreased human impact at higher elevations elsewhere in the Central Alps was also suggested
by Roepke and Krause (2013) and Walde (2006). These observations between 2500 BP and the
end of the Roman period are in accordance with observations made in the Kleinwalser Valley
and Piller Mire, although it is more pronounced in LLG. This is possibly due to its much higher
elevation. In contrast, Dietre et al. (2014) found local palynological evidence for a continued
pastoral activity around Las Gondas, whereas cultural indicators declined during the early
Roman period. Towards the end of it, the same study however recorded increased openness
and a return of cultural pollen (e.g. cereals).
No considerable EFs were documented until the Late Iron Age. However, increasing trends of Pb
EF, Zn EF and Cu EF in LLG started after 2250 cal BP. For Sb, the EF started rising about 300 years
later. While Pb EF reached a maximum of 9 around 2000 cal BP, a decline followed towards the
Middle Ages. In contrast, Zn, Cu and Sb increased steadily. In MM, the Pb/Si ratio increased
around 2250 cal BP as well, peaking around 1800 cal BP and declining thereafter. In contrast,
the mineral sediment matrix in BWM impeded interpretation of metal enrichment.
138 Fimba Valley
In particular, the Pb EFs and Pb/Si in LLG and MM respectively, are correlating with the well-
known and widely recorded peak of Roman mining activities (De Vleeschouwer et al., 2010b;
Klaminder et al., 2003; Mighall et al., 2002; Shotyk et al., 2002). Both the increase and the decline
are almost perfectly tracking the rise and fall of the Roman Empire. The generally rather low Pb
EF, compared to HFL and Pi17, can be explained by the high input (content) of mineral matter,
which diluted atmospheric input. Furthermore, potential spots of local mining and metallurgy in
the Silvretta and adjacent regions where ores exist (Grutsch and Martinek, 2012; Hofmann and
Wolkersdorfer, 2013; Tropper et al., 2011), were most probably too far away from the upper
Fimba Valley to emit significant amounts of metals to get deposited in the Fimba Valley. Only
the pan-European exploitation by the Romans released enough Pb into the atmosphere to reach
this elevation and to be detectable in peatlands all over Europe.
Deciphering between climate and human impact as the trigger behind the relatively low erosion
signals in the Fimba Valley during the Iron Age is challenging. Despite archaeological evidence
for human presence, the period from 2800 cal BP to 450 cal CE shows an array of palynological
and climatological evidence, pointing out to a climatic trigger behind slightly elevated MAR in
the Early Iron Age, whereas local human activities can be suggested as the cause of a MAR
increase during the Middle to Late Iron Age. Thereafter a reduced MAR coincides with decreased
human impact at high elevations during Roman times. Aside from that, Roman mining and
metallurgy are clearly visible by a distinctly increased Pb EF fingerprint.
6.3.4 450 cal CE until Modern Times
A low MAR around 1 g*m-2*a-1 was maintained until around 1000 cal CE in LLG. It then increased
strongly and reached almost 40 g*m-2*a-1 around 1700 cal CE (Figure 53). In MM, the Si-profile
started to increase after 700 cal CE (Figure 54). A second increase began parallel to LLG after
1200 cal CE and continued until the surface.
With the beginning of the Middle Ages, Bauerochse and Katenhusen (1997) saw signs of
eutrophication in Las Gondas Mire and suggested livestock trampling damage on the mire’s
surface. Furthermore, their study documented intensification of land use around 1000 cal CE
and again later at 1500 cal CE. Increasing cultural, pastoral and charcoal values were
documented by Dietre et al. (2014) since the High Middle Ages and until recent times as well. A
pen structure and a fireplace just a few hundred metres from Las Gondas were radiocarbon
dated to 420-550 cal CE and to 940-1040 cal CE respectively (Reitmaier, 2012), which is evidence
for human presence at this elevation and in line with the interpretations of Bauerochse and
Katenhusen (1997). Despite these findings, increased erosion is not indicated in LLG earlier than
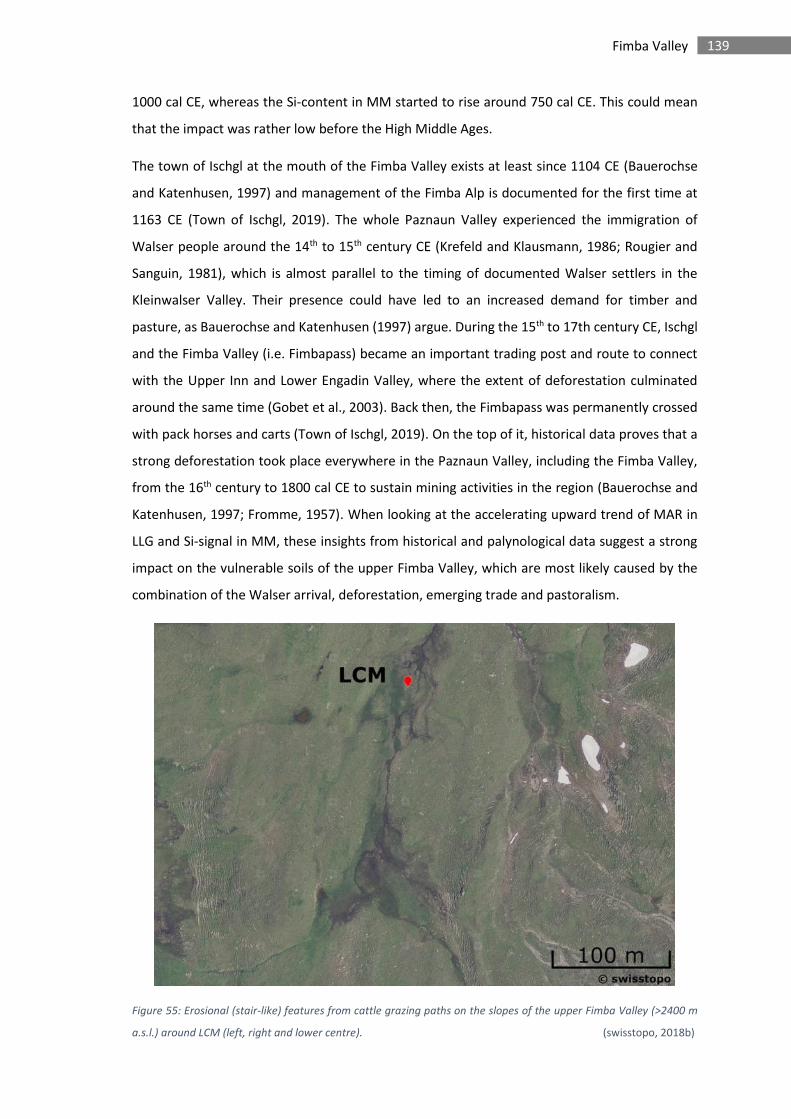
139 Fimba Valley
1000 cal CE, whereas the Si-content in MM started to rise around 750 cal CE. This could mean
that the impact was rather low before the High Middle Ages.
The town of Ischgl at the mouth of the Fimba Valley exists at least since 1104 CE (Bauerochse
and Katenhusen, 1997) and management of the Fimba Alp is documented for the first time at
1163 CE (Town of Ischgl, 2019). The whole Paznaun Valley experienced the immigration of
Walser people around the 14th to 15th century CE (Krefeld and Klausmann, 1986; Rougier and
Sanguin, 1981), which is almost parallel to the timing of documented Walser settlers in the
Kleinwalser Valley. Their presence could have led to an increased demand for timber and
pasture, as Bauerochse and Katenhusen (1997) argue. During the 15th to 17th century CE, Ischgl
and the Fimba Valley (i.e. Fimbapass) became an important trading post and route to connect
with the Upper Inn and Lower Engadin Valley, where the extent of deforestation culminated
around the same time (Gobet et al., 2003). Back then, the Fimbapass was permanently crossed
with pack horses and carts (Town of Ischgl, 2019). On the top of it, historical data proves that a
strong deforestation took place everywhere in the Paznaun Valley, including the Fimba Valley,
from the 16th century to 1800 cal CE to sustain mining activities in the region (Bauerochse and
Katenhusen, 1997; Fromme, 1957). When looking at the accelerating upward trend of MAR in
LLG and Si-signal in MM, these insights from historical and palynological data suggest a strong
impact on the vulnerable soils of the upper Fimba Valley, which are most likely caused by the
combination of the Walser arrival, deforestation, emerging trade and pastoralism.
Figure 55: Erosional (stair-like) features from cattle grazing paths on the slopes of the upper Fimba Valley (>2400 m
a.s.l.) around LCM (left, right and lower centre). (swisstopo, 2018b)
140 Fimba Valley
The results of Bauerochse and Katenhusen (1997) moreover indicated a slow cease of peat
accumulation in their Las Gondas record since the Late Middle Ages, which is in line with the
extremely low peat accumulation rates in the LLG profile. Especially in upland and riparian areas,
cattle, and probably carts and horses too, are a strong eroding and compacting force (Trimble
and Mendel, 1995). On mire surfaces, cattle trampling leads to disturbances, which can triple
the decomposition in the affected upper layers (Urbina and Benavides, 2015), due to higher
nutrient input and aeration. At the same time, it would also disturb the current vegetation and
lead to surface erosion. A higher decomposition is also indicated by the increased S-content in
the upper peat layers (not counting the mineral top layer). Grazing paths of cattle in the upper
valley were already described by Pott et al. (1995). As a result of the suggested cattle impact,
mineral sediment input, compaction and decomposition would have increased synchronously,
whereas the peat accumulation rate decreased. Depending on the intensity of trampling, it could
have even stopped or led to a surface erosion. This effect is suggested to be partly responsible
for the developments in LLG from the Middle Ages to Modern Times. Nowadays, cattle is still
omnipresent (illustrated in Figure 55), while the impact of carts and horses was replaced by
touristic activities since the late 19th century (hiking, skiing and mountain biking).
In addition to an obviously strong human impact, a cooling climate could have played a role for
the MAR as well. As indicated by much larger glaciers in the late 19th century around the
Fluchthorn (Jacot-Guillarmod et al., 1896), the Little Ice Age (Matthews and Briffa, 2005)
stopped travelling and freight hauling across the high passes (e.g. Jam Valley) already around
the 18th century (Town of Ischgl, 2019) and led to a decline of local economy. This coincides with
the simultaneously interrupted MAR increase in LLG and positive Si-content trend in MM.
However, in contrast to other regions in the Central Alps (e.g. around the Piller Mire), cattle
numbers increased, nonetheless, by 10 %, which happened uniquely in the Fimba Valley after
the 19th century (Fromme, 1957). Beside pastoralism and trade, a third factor controlling the
MAR could have been the colder climate at that time. The proxies investigated in this study do,
however, not allow to disentangle climate from human impact, leaving the possibility of
combined effects.
In terms of metal EFs in LLG, the Pb EF had been still higher than before the Roman peak, but a
decreasing trend - to values that are equal to the sediment layer around 6300 cal BP - set in after
around 1250 cal CE. Negative trends are also observed for Zn EF, Cu EF and Sb EF in Figure 53.
MM on the other hand shows an increase of Pb/Si after 950 cal CE (Figure 54). A peak at
approximately 1350 cal CE was followed by a decline until 1700 cal CE and another, smaller rise
thereafter.
141 Fimba Valley
The decrease of Pb EF in LLG between Middle Ages and the 20th century is contrary to what
would be expected for any mire in Europe. However, the time between 1800 cal CE and present
is hardly covered by LLG and MM and the modern leaded gasoline peak, which was clearly visible
in HFL, LAD and Pi17, is possibly not part of the core at all. Moreover, sediment input was
strongly rising in LLG, parallel to increasing mining and metallurgy around the Silvretta
(Hanneberg et al., 2009b; Hofmann and Wolkersdorfer, 2013; Neuhauser, 2015; Wolkersdorfer,
1991). The mineral materials consequently diluted any atmospheric input signal enriched in
metals. Certain mechanisms could have played a role in the unexpected decrease of metal EFs.
Indeed, Pb is physiochemically bound to organic matter (Vile et al., 1999) and could be released
due to the suggested almost complete decomposition or partial erosion of surface peat layers
(Rothwell et al., 2011, 2007). Without a considerable organic content at the surface,
atmospherically deposited metals would not even have been retained in the first place. These
effects should however be weaker in MM, as suggested by the relatively lower mineral signal
and the higher peat accumulation rate in the upper layers and finally by the increase in Pb/Ti in
the XRF-scanning data. Historical documentation also mentions the re-opening of silver mines
close to Ischgl in the 16th century (Fromme, 1957). Iron and Cu deposits around Ischgl were also
documented by Vavtar (1988). The observed Pb/Si ratio rise in MM could therefore be
connected to these mining activities in the Paznaun Valley, although silver mining operations
also intensified in the region east of the Fimba Valley (e.g. Imst, Platzer Valley; see Figure 23).
Altogether, the cores of the upper Fimba Valley are showing a strongly increasing anthropogenic
impact from pastoralism, deforestation but also directly from freight hauling on the landscape
of the upper Fimba Valley after around 1200 cal CE. However, not all of the recorded erosion
signal can be completely ascribed to a human influence, as also the Little Ice Age could have
interacted with land use and natural erosion in different ways.
6.4 Conclusions on the Fimba Valley
The longest record (LLG) of a total of four heterogeneous small-scale mires of the upper Fimba
Valley at an elevation around 2400 m a.s.l. covers a radiocarbon dated time frame of over
10,000 years, in which longer episodes of peat growth appeared only after around 7500 cal BP.
Geochemical data, from ICP-MS and pXRF for the LLG-core and XRF-core-scanning for MM is
available for approximately the last 6500 years. Both the core descriptions as well as part of the
geochemical data are coinciding with trends and events, indicated either from independent
regional or local studies on climate, palynology, archaeology or historical information.
142 Fimba Valley
A comparison of this study’s data to existing studies on the upper Fimba Valley shows that the
onset of peat accumulation did not start synchronously and was probably controlled by rather
local small-scale conditions and processes. The timing of certain layers, e.g. increased sediment
content or coarse mineral grains in LLG, suggests a linkage to regionally or globally proven
episodes of a colder climate (regional glacier activity). After such a layer around 9200 cal BP, the
following 1000 years are indicating more stable and probably warmer conditions, with a tree
line that was at or even above the elevation of 2350 m a.s.l. Subsequently, a prominent layer of
coarse sediment was dated to around 8200 cal BP. Although its impact in the Alps is still under
debate, the 8.2 ka cold event and its concurrence with the observed layer clearly point at a trans-
regional climate response. From a local perspective, glacier activity on the glacier field below
the Fluchthorn, west of the mire, is suggested to have been responsible for higher sediment
input into LLG by the nearest meltwater channel that is coming from this glacier. Another cold
event probably affected the upper Fimba Valley again, between c. 6400 and 6200 cal BP and an
increase of MAR around 5400 and 5000 cal BP points at two more. Another signal at 4500 cal BP
could have had, at least partly, an anthropogenic component. However, regional glacier
advances at exactly this age are not allowing an unambiguous interpretation. In accordance with
independent studies of the area, the same applies for the first of three temporary MAR increases
during the Bronze Age. While the first one around 3600 cal BP points to a climate deterioration
as a trigger, the following two at 3400 and 3200 cal BP are most likely caused by human land
use, as they are coinciding with increased cultural and pastoral indicators. Despite the
archaeologically proven presence of pastoralists around the mires, only subtle erosion signals
appeared during the Iron Age, probably due to the stabilisation of extensive pasture systems
after strong deforestation in the Mid to Late Bronze Age and a shift of the vegetation system.
From Roman Times until High Middle Ages, neither LLG nor MM recorded increased erosion.
With the Late Middle Ages, a declining peat accumulation plus an increased MAR were probably
caused by disturbances of both climate and a variety of human activities. While the Little Ice Age
initiated glacier advances in the Central Alps, the Fimba Valley experienced heavy anthropogenic
impact, consisting of heavy deforestation, livestock grazing and trade with the south. Indications
for mining or metallurgy were observed in Roman Times and possibly after 1000 cal CE again,
with a rather local to regional origin from operations around Ischgl and in the Paznaun Valley.
However, a diluting effect of high sediment input combined with strong decomposition and
metal release in LLG, probably masked and hampered the detection of metal EF signals.
The results from alpine small-scale mires of the upper Fimba Valley are demonstrating their
great potential. However, several factors are a challenge for data interpretation. The cores from
143 Fimba Valley
different mires show very heterogeneous patterns in their sedimentation regimes and low peat
accumulation rates are hampering high resolution sampling. Furthermore, the fen character of
these mires and the resulting higher decomposition complicates the selection of material for
radiocarbon dating. At the same time, more subtle geochemical information, like atmospheric
metal input, could be diluted or completely overprinted by strong local sediment input. Hence,
it aggravates the synchronisation to other cores or studies. Here, more than anywhere else, it is
therefore important to investigate more than one core and to focus on robust age-depth
models. In the field, it is important to understand basic geomorphological and hydrological
factors before selecting a coring spot. Moreover, information from other disciplines is absolutely
necessary to draw conclusions. Nevertheless, the mires of the Fimba Valley were able to indicate
climatic impact on the alpine landscape, before human activities became strong enough to be a
shaping factor.
144 Synthesis
7 Synthesis
7.1 Regression analysis comprising all samples
Three separate regression analyses were carried out for one mire in each of the three
investigated valleys. In this chapter, samples from all three studied areas (cores HFL, Pi17 and
LLG) that were measured by ICP-MS and pXRF (n=140), were combined within a single regression
analysis. It allowed a more general assessment of the potential of pXRF in analysing peat
samples. Furthermore, careful recommendations can be given for certain elements and their
respective conversion/transfer functions to get quantitative values and, as far as possible,
overcome some of the limitations of this technique. In the same fashion as in the site-specific
regression analyses, Figure 56 shows selected elements with the whole dataset of
measurements, the coefficients of determination as well as the transfer functions.
1. Ti: Ti is best depicted by the polynomial function (2nd degree) for peat samples with a high
mineral content or where higher mineral content can be expected (e.g. at the bottom, sediment,
tephra). In addition to the samples that were classified as mineral samples before, three more
samples of LLG were treated as mineral. These were in the transition zone of already high
inorganic matter content with a Ti-concentration around 1000 mg*kg*-1 (or around 2000 to 3000
pXRF raw) and where the regression curve started to get non-linear (cf. regression analysis LLG,
chapter 6.2.3.1). At least in this dataset, and to give another guide value, this threshold
corresponds to a density of roughly 0.2 g*cm-3, although other factors that are partly linked to
the density as well should play a more important role (e.g. grain size, ash). Reaching above this
range would be the case in mires at high elevations (mountains) or close to rivers. However, for
most of the peat samples i.e. where Ti-concentrations are below 1000 mg*kg*-1 (approx. 2000
raw), a linear function is appropriate. This would be the case in ombrotrophic and most other
peat types.
2. Pb: Lead could be calibrated with a linear regression for samples with a Pb-concentration
between approx. 2 mg*kg*-1 up to at least 110 mg*kg*-1 (or 175 pXRF raw). This behaviour
appears to be almost independent of the type of site, peat, vegetation or geology. Only a
negligible matrix effect, leading to a slightly underestimated concentration in mineral samples,
can be observed. An anthropogenic Pb-contamination is however suggested to be linearly
transformable and covered by the regression in Figure 56, if the samples are classified as peat.
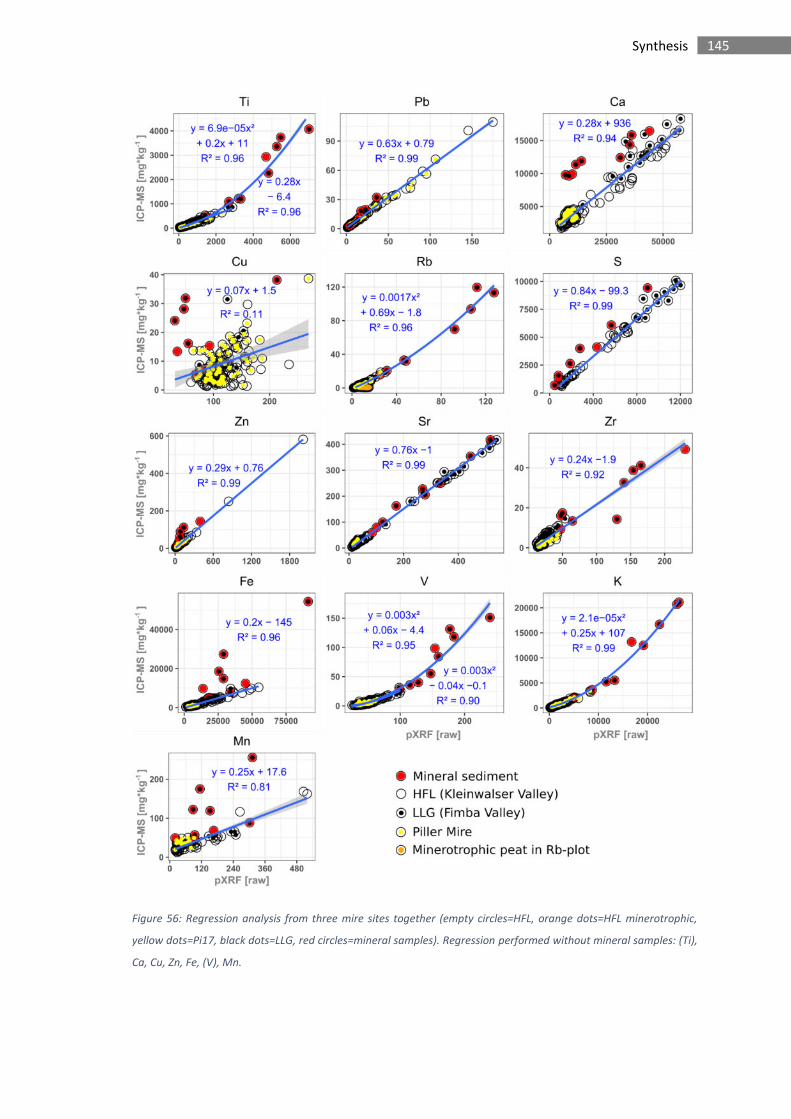
145 Synthesis
Figure 56: Regression analysis from three mire sites together (empty circles=HFL, orange dots=HFL minerotrophic,
yellow dots=Pi17, black dots=LLG, red circles=mineral samples). Regression performed without mineral samples: (Ti),
Ca, Cu, Zn, Fe, (V), Mn.
146 Synthesis
3. Ca: Calcium is scattered broadly around a linear regression, which is not clearly related to
matrix differences. Also, site-specific effects are obvious when intercomparing LLG, Pi17 and
HFL. Mineral and highly minerotrophic peat samples would be largely underestimated by the
linear regression function for peat samples (Figure 56). The almost systematic offset of the
mineral samples rather indicates that a separate function would be needed.
4. Rb: The consolidated Rb-measurements are represented by a polynomial function (2nd order),
except for the minerotrophic part of HFL (Figure 56, orange). Despite of the fen/minerotrophic
character of LLG with even higher concentrations than in HFL, the LLG samples do not show a
similar effect. A difference between the two mires is that the mineral matter in LLG was probably
deposited directly on its surface and is still existent in the form of mineral grains. In contrast,
the HFL samples have a higher inorganic content due to enriched groundwater or remobilisation
from the mineral bottom layers.
5. S: The linear regression’s fit for S is excellent (R²=0.99), even when including samples with
high concentrations (e.g. LLG). Mineral samples were measured almost true to their real
concentrations by pXRF, while the values for peat samples are only slightly too high. In other
words, mineral samples appear to have an almost parallel, i.e. offset, regression curve to the
peat samples. As discussed earlier, sulfur is a possible indicator for higher decomposition and a
marker for the transition from minerotrophic to ombrotrophic conditions. Therefore, the
successful measurement of S helps in the interpretation of other elements, like Cu or Zn.
6. Cu: Copper is not reliably quantified by pXRF in any of the analysed mires.
7. Zn: The pXRF device strongly overestimates the concentrations of Zn. A changing matrix effect
between peat and mineral rich samples is obvious. But apart from that, even high Zn-values (e.g.
anthropogenically enriched/contaminated) are measurable in peat and linearly transformable
with the function given in Figure 56.
8. Sr: The regression analysis of Sr yields a similar transfer function for HFL and LLG. It is
independent of the matrix and covers the sample range from mineral to ombrotrophic
Sphagnum peat. It is therefore suggesting a general applicability of the given function. However,
the ombrotrophic Pi17 core shows a slightly steeper slope (a) in Figure 29 (yellow). Although a
site-specific effect could be guessed, a look at the quality control of the ICP-MS results reveals
that lower concentrations of Sr, Ca and Mn in CRMs were systematically measured higher than
the certified concentrations during the analysing session of the Piller Mire samples (Suppl. Table
1, text grey highlighted). This could possibly be solved by recalibrating the ICP-MS results and
re-doing the regression analysis. Therefore, the linear transfer function for Sr is suggested to be
147 Synthesis
universally valid for all peat samples in this study. At the same time, this issue does not
compromise any of the interpretations concerning the trophic status of the affected Piller Mire,
as the concentrations would be only slightly higher, and the trends would remain the same
(chapter 5.2.3.2). Based on these observations, Sr should be preferably selected against Ca when
it comes to the detection of the point where minerotrophic conditions (i.e. groundwater
influence) cease.
9. Zr: The determination coefficient for Zr (R²=0.92) is promising. However, the scatter is
relatively high, especially when operating with smaller concentrations, which could be due to
the less pronounced peak shape of this element in the XRF spectrum. Without further
interpretation, a site-specific effect seems to play a role in the Pi17-samples as well.
10. Fe: Iron is unreservedly measured in peat samples and values can be calibrated with the
combined linear regression function. However, mineral samples need to be excluded, as they
would be, similarly to Ca, strongly underestimated. Unlike for Ti or Rb, this matrix effect cannot
be overcome via a polynomial regression function because the regression analysis indicated a
non-continuous function (similar to Ca).
11. V: For V, the scatter is relatively high at very low concentrations but the combination into
one single regression analysis indicates that a polynomial function (2nd order) can be used to
quantify pXRF-results for this element. As for Ti, a higher number of samples in the transitional
range between peat and mineral sediment would help to refine the equation of transformation.
V could be an alternative, in case that Ti cannot be measured. There are indications for its
immobility in peat (Cloy et al., 2011; Krachler et al., 2003; Shotyk, 1988). Furthermore, the
profiles of V in this study are quite similar to the behaviour of Ti, which is at least suggesting a
conservative behaviour. Its use is however limited by several factors: the relatively high standard
deviation during pXRF-scanning, a larger scatter, a concentration close to the LOD, and a possible
enrichment from modern oil combustion (Pacyna and Pacyna, 2001).
12. K: Like Ti, Rb and V, the measurements of K can be described by a polynomial regression
function of 2nd order. The cross-plot in Figure 56 furthermore suggests that a linear
transformation function would work for samples with K-concentrations up to 5000 mg*kg-1
(~12500 pXRF raw); without any noteworthy site specific effects or limitations.
13. Mn: As mentioned above, an overestimation of Mn in the Pi17 samples could be due to a
different calibration of the ICP-MS results. Aside from the calibration, concentrations that are
close to a detection limit between 20 and 35 mg*kg-1 are resulting in a high scatter in this range
and, moreover, all mineral samples are off the regression curve.
148 Synthesis
One of the general conclusions is, that the internal calibration of the pXRF is giving almost
quantitative values for mineral samples like soil, moraine or fluvial/lacustrine sediment. In
contrast, peat samples are yielding moderately to highly overestimated values. But as long as a
series of samples consists of peat samples only, element specific linear regression functions can
be applied for Ti, K, V, Pb, Zn, S, Sr, Fe, and, with some restrictions, for Rb, Zr, Ca and Mn. The
behaviour of some elements was mostly dependant on the sample matrix (organic/inorganic)
but site-specific effects could be another factor (e.g. geological background, vegetation). The
most problematic issue occurs in peat samples with a strongly elevated mineral content. This
results in a polynomial regression (2nd degree) for some elements (e.g. Ti, K, Rb and V).
Consequently, mires with recurring direct sediment influx, but also rich minerotrophic bottom
peat layers that are enriched in mobile elements like Ca, can be affected. In turn, this result
implies that these obvious limitations can be ignored in samples from ombrotrophic mires but
also in most peat that is not directly bordering mineral layers. Either the dry bulk density or the
Ti-concentration could help to decide, if the linear regression is still applicable: not only for Ti
itself but also for K, Rb and V.
Although this case study cannot go into the details of the observed behaviour of the pXRF
instrument, it demonstrates its great potential to analyse peat samples. While Shuttleworth et
al. (2014) focussed on heavily contaminated peatlands, it is demonstrated here that this method
works on peat samples with a very low Pb-concentration as well. Portable XRF is relatively time
and cost efficient when compared to methods that require wet chemistry. Hence, it allows a
high sampling resolution along a peat core. It furthermore circumvents the problems of
heterogeneity and water content that are unavoidable with XRF core scanning. However, strong
variations between mineral and organic content can bias the results if the regression analysis
and transfer function is not adjusted accordingly. The point where the linear regression fails or
changes to polynomial probably needs to be defined for every element individually. Finding an
approximate criterion to define this range of transition, based on a larger dataset, would
however be important for future studies to have calibrations available that are universally valid
for geochemical peat analysis by pXRF.
7.2 Integrated chronological discussion
The integration of proxies and interpretation from various individual Alpine valleys can be
achieved by taking into account several critical considerations. Signals of local climate can
manifest in many ways depending on a large variety of factors like exposure, slope, elevation,
geology, topography, etc. The same is true for human and environmental signals, which are both
149 Synthesis
influenced by climate themselves, but also depend on the landscape they live in. Mountain
environments can be specifically attractive for humans to settle or to use the resources, like in
the study areas presented in this work, for activities like agro-pastoralism, forestry and mining.
After having identified and interpreted signals of metallurgy and increased mineral input or
erosion (and vegetation changes in the Kleinwalser Valley) from a rather local perspective, this
chapter is going to consolidate the most important developments and events at all sites. Since
the impact of both human land use and climate can influence the amount of erosion, the
evaluation of this proxy’s signal from a larger, more regional perspective can substantiate
interpretations. Moreover, mining or metallurgical activities as reflected in the EFs of e.g. Pb
can vary from mire to mire and from valley to valley. In general, a broader view is also helpful
to assess the spatial significance and variability of all recorded signals. Figure 57 summarises and
illustrates the most important trends and events in all study areas and their interrelation with
Central Alpine glacier advances and cultural information.
7.2.1 Early to Mid-Holocene: climate versus human impact
The geochemical data from peat records of the Fimba and Kleinwalser Valley stretch back to
several hundreds of years before 6000 cal BP. However, the Fimba Valley’s sediment record of
LLG covers over 10,000 years. Even if the Early Holocene is only recorded in one of the sites (LLG)
without having a corresponding sequence from the two other valleys, it allows interpretations
that could be equally relevant for the Mid- and Late Holocene. As shown in Figure 57 and
discussed in the Fimba Valley chapter (chapter 6.3), cold events, illustrated by the progressions
of the glacier Gepatschferner glacier (Nicolussi and Patzelt, 2000) in the Tyrolean Central Alps
(Figure 1), are matching almost perfectly to episodes of strongly increased MAR in the Fimba
Valley (LLG). Following an approach that is basically similar to the one used by Shakesby et al.
(2007) or Matthews et al. (2005), the most compelling evidence for glacier activity is a coarse-
grained, but well dated layer within the timing of the 8.2 ka event. Only 2000 years later (within
the uncertainty range of the age-depth model), the profiles of almost all investigated cores show
a distinct peak of mineral matter input around the age of 6300 cal BP in the Fimba Valley,
whereas the records in the Kleinwalser Valley (HFL, LAD) were just starting peat accumulation a
few centuries later. Around this time window, a colder climate was reported from different
proxies in the Central Alps (Joerin et al., 2008, 2006; Nicolussi and Patzelt, 2000; Wurth et al.,
2004). It can therefore be concluded that strong and widespread natural climate deteriorations
in the form of colder and wetter conditions occurred in the northern Central Alps between
approximately 6400 to 6100 cal BP (see this study’s age-depth models in chapters 4.2.2, 5.2.2
150 Synthesis
and 6.2.2). This was reflected by increased erosion (sediment input), equally effective for
(sub)alpine and montane environments at two spatially separated locations in the Central Alps.
After this period, peat formation was (re)initiated synchronously in two different mires of the
Kleinwalser and Fimba Valley. A link between cold phases and increased sediment input is,
however, restricted to the glaciofluvial stream-bank mire LLG in the Fimba Valley. It is hence
suggested that this coring site was sensitive to glacier activity upslope of the mire (see chapter
6.3), similar to the findings in periglacial mires in Norway (Matthews et al., 2005; Shakesby et
al., 2007). This interpretation would imply that specific high-elevation mires could be more
prone to record climate fluctuations in general, because of a less stable vegetation and
particularly by their vicinity to erosive forces of glaciers and meltwater runoff loaded with
sediment.
As a result of generally smaller populations, potential impact and signals were probably faint
and thus less easily detected in these mires. The first unmistakeable signal of human impact in
the region shows up in the Kleinwalser Valley by a combined signal of pollen, charred wood and
increased MAR, from 5700 to 5500 cal BP (Figure 21). These first landscape changes are followed
by first indications for metallurgy (increased Pb EF) around 5450 cal BP. It is not surprising that
these signals were recorded at a lower elevation and that they were close to the foreland of the
Alps. It implies that a first occupation with stronger impact on the region had its origin in the
northern Alpine Foreland. A temporarily warmer climate at that time, indicated by higher tree
lines and receding glaciers (Hormes et al., 2001; Nicolussi et al., 2005; Schlüchter and Jörin,
2004), suggests that climate promoted this phase of human impact.
Evidence from the Piller Mire (chapter 5.3) suggests subtle human induced erosion just after a
possible cold phase recorded in the Fimba Valley at 4500 cal BP. Before and after this age,
elevated metal EFs in the Piller Mire suggest metallurgy and maybe mining in the region. Around
4350 cal BP, the first simultaneous increase of Pb EF was recorded in north-western Tyrol (Piller)
and in the Kleinwalser Valley, which indicates cultural activity spanning across valleys in the
Central Alps. For the timing of another MAR peak after 4200 cal BP in the Piller Mire, no samples
are available in the Fimba Valley records, but the concurrence with palynological anthropogenic
indicators in the mire (Hubmann, 1994) point to human induced local deforestation and land
use. In contrast, MAR in HFL remains on a low level, even though an increased Pb EF hints at
recurring metallurgical activities in the region.
151 Synthesis
7.2.2 4200 to 2000 cal BP: rise of human land use /land-management
For several centuries after the onset of the Bronze Age, neither of the proxies shows any
disturbances until c. 3650 cal BP, when for a short period glaciers advanced in the Central Alps
(Nicolussi and Patzelt, 2000) and sediment input increased in the Fimba Valley. From this point,
a strong pulse of human induced erosion is suggested for the Middle to Late Bronze Age. This
happened all over the northern Central Alps with a simultaneous MAR peak at all investigated
mire sites (LLG, MM, Pi17, HFL, LAD). The LLG profile suggests that this climax of human activities
in the Fimba Valley around 3400 to 3200 cal BP is framed by colder phases (e.g. glacier
progression, see Figure 57). However, the mineral input was generally higher during the Bronze
Age in the upper Fimba Valley, as shown in the MM and LLG profiles. The same is true for the
LAD profile in the Kleinwalser Valley, which can be explained by a higher sensitivity to landscape
disturbances because of its position at the slope. In the Kleinwalser Valley, charred wood debris
(HHA), dated to around 3400 cal BP, and the pollen signal illustrate a transition towards a human
shaped landscape that developed from a precedent phase of probably patchy forest clearances,
which opened the landscape for pastoralists (Figure 21). Then, with time and continued human
impact, open forest was replaced by meadows and cultural pollen evidence agricultural
activities. Similarly elevated patterns of agro-pastoral pollen indicators with increased charcoal
are also documented in other studies at many sites in the (northern) Centrals Alps (e.g. Dietre
et al., 2017, 2014; Festi et al., 2014; Hubmann, 1994; Roepke et al., 2011; Wahlmüller, 2002;
Walde, 2006; Walde and Oeggl, 2004) but also in the northern Alpine Foreland (Stojakowits,
2014). A generally higher sediment input into lakes of the north-western Alps was induced by a
mix of higher human impact and increased precipitation after 3500 cal BP (Arnaud et al., 2016).
In the Eastern Alps (Central Austria), the establishment of Alpine pasture is suggested for a warm
period between 3500 and 3200 cal BP (Schmidt et al., 2002). During this period, Della Casa (2013)
saw technological and cultural triggers behind an increased permanent human occupation of
the Central Alps and also Oeggl (2015) observed high human impact that had been independent
from climate factors. Well-investigated Bronze Age settlements, e.g. in the Montafon (Western
Austria), furthermore prove the existence of permanent, non-seasonal, occupation in the
Central Alps (Krause, 2007; Schmidl and Oeggl, 2005b). In the Kleinwalser Valley, Leitner (2003)
presented direct evidence for the presence of hunters and pastoralists not far from the analysed
mire sites. From that moment on, also the cultic site at the Piller Mire has been used
(Tschurtschenthaler and Wein, 1998, 1996).
As Roepke et al. (2011) suggested, initial phases of deforestation and pasture establishment are
accompanied by slope destabilisation and erosion before the landscape stabilises again in
152 Synthesis
another system (e.g. pasture, grass/shrubland). This can be adopted as the mechanism behind
the course of, relatively short but strongly, elevated MAR signals in all the sites.
The increased mineral input (soil dust or washed in sediment) into all mires during the Middle
to Late Bronze Age probably diluted possible signals of metallurgy and mining (mainly for
copper), which had been practiced extensively in the Eastern Alps (Goldenberg, 2015; O’Brien,
2015; Stöllner, 2015a). Around 5500 cal BP (chapter 4.3.2), pollen indicators and elevated MAR
came first in the Kleinwalser Valley, and not much later, an increased Pb EF was observed.
Around the Piller Mire, a similar succession could be suggested in the Middle to Late Bronze Age.
When populations began occupying a certain valley or region, large scale forest clearings opened
the landscape and made it accessible, pasturable and arable. If these initial clearings were
generated by using fire, as suggested in the Kleinwalser Valley, an uncontrolled destruction and
destabilisation of large areas was likely. Over time, depending on the cultural background of
people and on their knowledge and technology, they optimised the use of their surroundings
and developed more complex and diverse skills and activities (e.g. mining, metallurgy) besides
animal husbandry, hunting and gathering. Clearly in the Piller Mire, and more subtly in the
Kleinwalser Valley, elevated EFs of Pb, Sb and Cu around 3200 cal BP (following a peak in MAR)
support such an idea of human occupation in a specific valley or region. The combination of the
own results with other studies (cf. references above) suggests that climatic factors were not
directly triggering the observed signals during this period. Instead, cultural and technological
factors could have played a role as well. Instead, it could have been the most distinct
anthropogenic landscape deterioration of the Central Alps in prehistoric times.
After that, activities continued at a reduced pace until the onset of the Iron Age (2800 cal BP),
as suggested by continuously occurring pastoral and agricultural pollen in regional and local
studies (Dietre et al., 2017, 2014, 2012; Walde and Oeggl, 2004, 2003). However, a less intensive
land use and a re-stabilisation of soils and (forest) vegetation were probably responsible for a
decreasing erosion signal in all records. Although a correlation between cooling climate and
reduced human impact in the mountains is not easy to establish, a slow cooling trend
accompanied this development of decreasing anthropogenic indicators (Ivy-Ochs et al., 2009).
A similar interpretation was made by Roepke and Krause (2013) for an observed decline of
human activity south of the Kleinwalser Valley. The culmination of this cold period was dated to
around 2600 cal BP, accompanied by glacier advances (Nicolussi, 2012). This coincided with a
still low MAR in the Kleinwalser Valley and around the Piller Mire, and a small MAR rise in in the
upper Fimba Valley. During this period of the Iron and Bronze Age, human activities in the
mountains were probably less intense. The strongly elevated Pb EF in HFL around 2750 cal BP is,
153 Synthesis
however, pointing to metallurgical activities that included Pb-rich ores, close to the site at the
northern boundary of the Central Alps, but without any indication for the source of the signal.
Until around 2500 cal BP, no significant MAR changes were recorded. While this low level
remained stable in the Kleinwalser Valley, the eastern sites (LLG and Pi17) show a distinct rise in
mineral inputs between 2400 and 2300 cal BP. This suggests that this region experienced a
period of stronger human impact, reaching as high as the alpine zone. Again, a rather
widespread human impact is supported by other studies in the Alps (Festi et al., 2014; Koinig et
al., 2003; Moe et al., 2007). Except for a minor MAR response, the Kleinwalser Valley was most
likely not affected by strong land use. However, elevated EFs of Pb (and Cu, Sb) point to regional
mining or metallurgy and widespread regional land use is proven in other valleys of the Central
Alps (Roepke et al., 2011; Roepke and Krause, 2013; Walde and Oeggl, 2004, 2003).
7.2.3 Roman period
In contrast to what could be expected from the technological power of the Roman Empire, their
arrival and establishment of the Raetia province did not bring any significant increase in MAR.
As hypothesised in other studies (e.g. Walde, 2006; Walser and Lambers, 2012), the reasons
were probably cultural, which modified land use practice and settlement preferences.
Nevertheless, this phase of forest recovery and reduced land use at higher elevations came to
an end in the 3rd century cal CE, as suggested by the MAR reconstructions in the Kleinwalser
Valley and Piller Mire. While the signal in the latter was rather short lived (Figure 57), the 3rd
century cal CE was the onset of a longer lasting increased signal of mineral input in the
Kleinwalser Valley. This coincided with increasing instability of the Roman Empire, especially
close to its borders (e.g. Kleinwalser Valley), which could be interpreted as the return of local
populations from agriculture in the valleys back to pastoralism at higher elevations. This change
towards more erosive land use seems to have happened along with the slow decline of Roman
power. What all peat records share, is a significant increase in Pb EF (or Pb/Si) around or right
after 2000 cal BP (Figure 57). This peak in Pb is well known from other study sites (Allan et al.,
2018; Marx et al., 2016; Shotyk, 2002) and hence serves as an independent time marker, which
validates the age-depth models. Even though no direct archaeological or historical evidence is
available to uncover a contribution of local mining activities (Bode et al., 2015), there are
evidence and indicators for a Roman exploitation of existing ore resources in the Alps (Dolenz,
2015; Gleirscher, 2015b; Winckler, 2012).
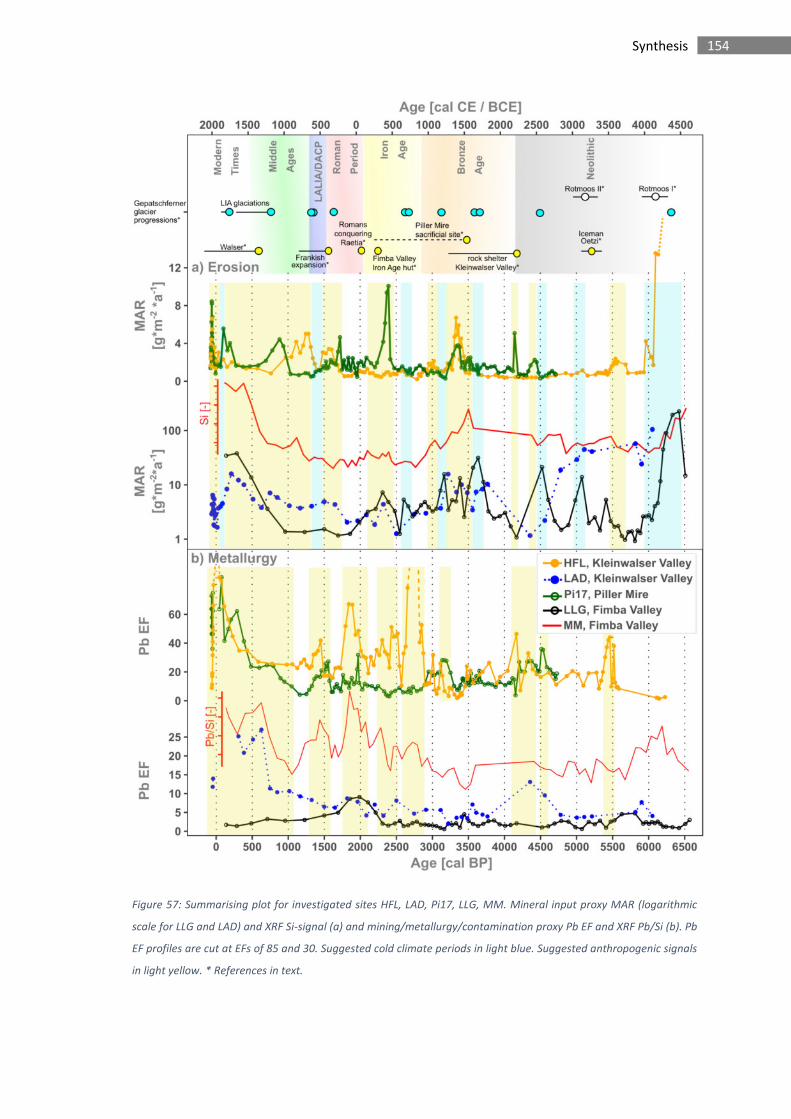
154 Synthesis
Figure 57: Summarising plot for investigated sites HFL, LAD, Pi17, LLG, MM. Mineral input proxy MAR (logarithmic
scale for LLG and LAD) and XRF Si-signal (a) and mining/metallurgy/contamination proxy Pb EF and XRF Pb/Si (b). Pb
EF profiles are cut at EFs of 85 and 30. Suggested cold climate periods in light blue. Suggested anthropogenic signals
in light yellow. * References in text.
155 Synthesis
7.2.4 Middle Ages and Modern Times
After around 500 cal CE, a significant climatic shift towards cold and wet conditions is suggested
to have either pushed human activities down to the lowlands or simply reduced anthropogenic
pressure by a generally decimated population (McEvedy and Jones, 1978), as discussed in
chapters 4.3.4 and 5.3.4. This can be inferred from a decrease of MAR in the ombrotrophic cores
of HFL and Pi17, where the timing coincides with LALIA and DACP (Büntgen et al., 2016; Helama
et al., 2017). Furthermore, advancing glaciers were reported for this period across the Alps
(Holzhauser et al., 2005; Nicolussi and Patzelt, 2000) concurrently to the significant population
decrease (McEvedy and Jones, 1978). Lower land use is also supported by increasing forest cover
and decreased agro-pastoral pollen indicators in the Kleinwalser Valley (HFL) and around the
Piller Mire (Hubmann, 1994; Walde, 2006). A strong recovery of erosive land use, probably in
the form of deforestation driven by growing monasteries (e.g. Friedmann and Stojakowits,
2017), occurred, however, in the Kleinwalser Valley (chapter 4.3.5), whereas the Piller Mire and
the Fimba Valley stayed rather undisturbed for several centuries.
The short, almost synchronous and similarly shaped increase of Pb EF around 500 cal CE in the
Kleinwalser Valley and in Piller (Tyrol) as well as the Pb/Si peak in the Silvretta record (MM) can
only partly be explained by a decreased mineral content. This Early Medieval Pb-peak is, so far,
the only indicator for possible mining activity in the region during the time of the expansion of
the Frankish Empire (Kaiser, 2010). The signal indicates mining or metallurgical activities on a
regional scale, because Bränvall et al. (2001) documented a generally declining signal of
anthropogenic lead deposition in Northern Europe between 400 and 900 cal CE.
While the Kleinwalser Valley experienced landscape changes and increasing mineral input, the
more elevated and less accessible sites of the Fimba Valley and Piller Saddle lagged behind in
this development after the Roman period. In the Piller Mire, a pulse of stronger erosion suggests
a strong landscape deterioration in the surroundings from around 1000 to 1250 cal CE. The
Fimba valley also recorded a higher mineral input starting at the same time, lasting until c. 1800
cal CE. In contrast, the MAR in HFL (Kleinwalser Valley) and on the Piller Saddle decreased after
1250 cal CE. To explain these contradictive trends, a link to a colder climate and progressing
glaciers as harbingers of the LIA (Büntgen et al., 2011; Holzhauser et al., 2005; Matthews and
Briffa, 2005; Nicolussi, 2012) is suggested. According to Büntgen et al. (2011), the “Great
Famine” and “Black Death” were part of the consequences of a shift to a colder and wetter
climate. And indeed, a severe drop in the populations of Austria, Germany and Switzerland (and
Europe in general) was caused by the plague or “Black Death” (McEvedy and Jones, 1978) around
1350 CE (Herlihy, 1997), which is assumed to have decreased pressure on the landscape and led
to a Europe-wide re-forestation (Yeloff and Van Geel, 2007). A generally declining trend in
156 Synthesis
mountain farming was already described by Bender (2010), but his results show also regional
differences and another possible explanation for the contrasting trends: In Switzerland (Fimba
Valley), the production of hard cheese (introduction of rennet) increased mountain farming,
whereas parts of the Austrian Alps experienced reforestation to serve as hunting grounds (cf.
chapter 4.3.5, Kleinwalser Valley). While the combined effects of these events at that time
reduced mineral input at lower elevations (Pi17, HFL and LAD temporarily), a combination of
advancing glaciers and increasing or ongoing pastoralism (mountain dairy farming) could have
induced higher mineral input into mires of the upper valleys, above the tree line (Fimba Valley).
A common cultural impact in the Kleinwalser and Fimba Valley was the immigration of the
Walser people around 1300 to 1400 CE (Bauerochse and Katenhusen, 1997; Wagner, 1950). A
trend to higher MARs was only subtle in HFL, but the mires that are closer to the more fragile
slopes are clearly showing an increasing trend (LAD in Kleinwalser Valley, MM and LLG in Fimba
Valley) during the respective period. Moreover, a more intensive use of less accessible areas at
higher elevations for livestock grazing and/or timber harvest can be inferred from Wagner
(1950) and Willand and Amann (2013). A high demand for wood was generated by mining and
production of salt, metals and glass around Innsbruck or in the Allgaeu during Late Middle Ages
and early Modern Times (Brandstätter et al., 2015; Kata, 1995).
Around 1500 cal CE, a lower mineral input continued in HFL and Pi17, which is in agreement with
the general decrease of Alpine farming and population since the High Middle Ages (Bender,
2010; Lichtenberger, 1965). Meanwhile, the Fimba Valley mires experienced a maximum MAR
before stagnating (end of record) on a high level until 1800 cal CE. Based on pollen (Bauerochse
and Katenhusen, 1997; Dietre et al., 2014) and historical data (Town of Ischgl, 2019), human
impact can be seen as the driving force behind this development. The MAR increase in Pi17 and
LAD around 1750 cal CE is attributable attributed to local intensifications of land use, whereas
the following decline at these sites coincides with another cold phase, expressed as glacier
progressions and related to the Little Ice Age (Matthews and Briffa, 2005; Nicolussi and Patzelt,
2000). Moreover Bender (2010) reported an abandoning of many mountain farms due to this
severe cold period. This ultimately stabilised the landscape and led to a, still ongoing, natural
reforestation of pasture grounds since around 1850 CE in, for example, the Eastern Central Alps
(Tasser et al., 2007). Economical numbers on agriculture and livestock for this interval and the
regions around Fimba Valley and Piller Mire (Fromme, 1957) support the idea that reduced land
use was probably responsible for a lower MAR (cf. chapters 5.3.5 and 6.3.4). The Fimba Valley
cores cannot resolve questions of land use later than around 1800 cal CE. However, another
strong rise of (atmospheric) mineral input into the ombrotrophic peat sections of the
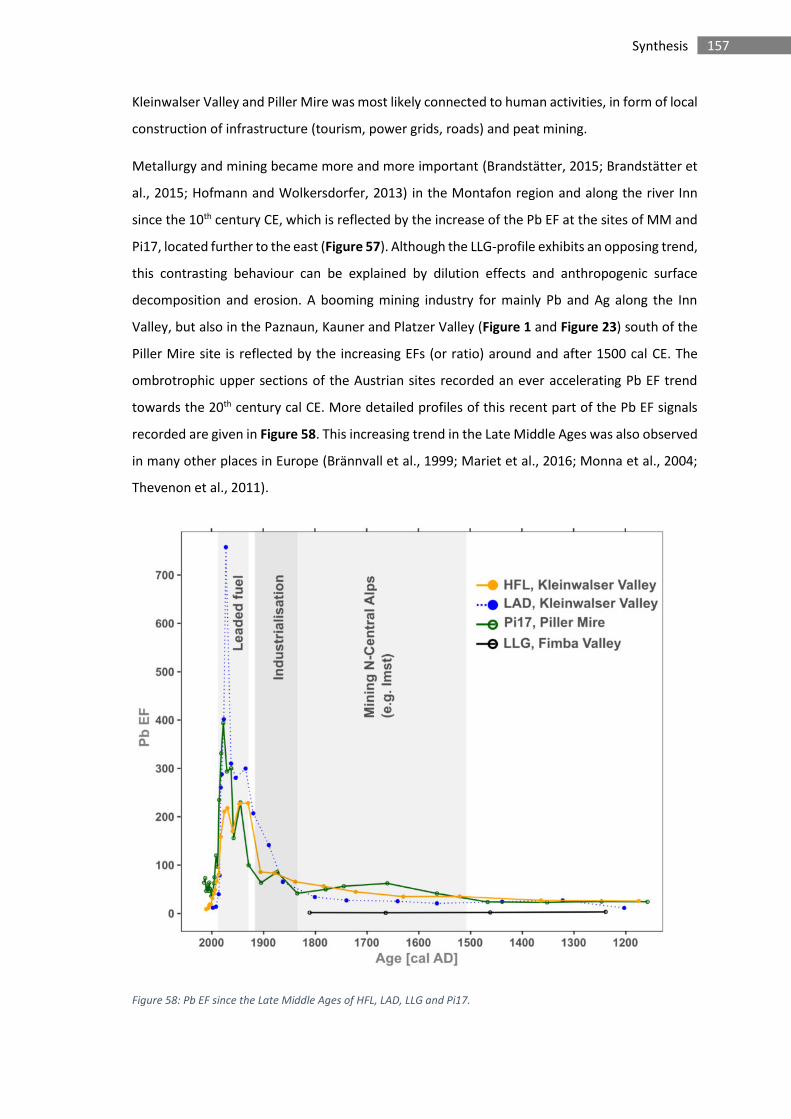
157 Synthesis
Kleinwalser Valley and Piller Mire was most likely connected to human activities, in form of local
construction of infrastructure (tourism, power grids, roads) and peat mining.
Metallurgy and mining became more and more important (Brandstätter, 2015; Brandstätter et
al., 2015; Hofmann and Wolkersdorfer, 2013) in the Montafon region and along the river Inn
since the 10th century CE, which is reflected by the increase of the Pb EF at the sites of MM and
Pi17, located further to the east (Figure 57). Although the LLG-profile exhibits an opposing trend,
this contrasting behaviour can be explained by dilution effects and anthropogenic surface
decomposition and erosion. A booming mining industry for mainly Pb and Ag along the Inn
Valley, but also in the Paznaun, Kauner and Platzer Valley (Figure 1 and Figure 23) south of the
Piller Mire site is reflected by the increasing EFs (or ratio) around and after 1500 cal CE. The
ombrotrophic upper sections of the Austrian sites recorded an ever accelerating Pb EF trend
towards the 20th century cal CE. More detailed profiles of this recent part of the Pb EF signals
recorded are given in Figure 58. This increasing trend in the Late Middle Ages was also observed
in many other places in Europe (Brännvall et al., 1999; Mariet et al., 2016; Monna et al., 2004;
Thevenon et al., 2011).
Figure 58: Pb EF since the Late Middle Ages of HFL, LAD, LLG and Pi17.
158 Synthesis
The industrialisation in Central Europe gained momentum after 1800 CE (Tilly, 2010) and is
reflected in form of strongly increasing anthropogenic Pb input at about this time. A second
increase around the middle 20th century can be attributed to the introduction of leaded gasoline.
These similar trends at most of the investigated sites are, are in good agreement with other sites
in Switzerland (Shotyk et al., 1998, 1996; Weiss et al., 1999) and in line with the global history
of anthropogenic Pb-deposition (Marx et al., 2016). These studies are underlining that the sharp
decline of Pb EF in the second half of the 20th century cal CE is corresponding to the fading out
of atmospheric Pb-emissions after the ban of leaded gasoline in the 1980s (Pacyna and Pacyna,
2001). These independent studies and the simultaneous trends of Pb EF in the records (e.g.
Roman signal, industrialisation) bring an extra chronological constrain in the age depth models
of the three valleys.
7.2.5 Human impact and peat accumulation
Indicators for erosion, mining and metallurgy or for other anthropogenic or climatic
developments are revealed by MAR and metal EFs. But as already mentioned earlier in the
subchapters, also the peat accumulation rate can offer valuable information, even if more
detailed investigations on this complex topic are needed. The rates in all mires ranged between
0.01 and 0.1 cm*a-1. But there are common trends between the mires as well. LLG and HFL both
show an extended period of relatively lower accumulation from 5500 to around 3500 cal BP with
a minimum around 4500 cal BP. Following the interpretation of Dietre et al. (2014), drier
conditions were responsible. Except for LAD, all investigated mires saw an almost simultaneous
phase of very low peat accumulation (Figure 59): beginning the earliest after 2500 cal BP in the
Fimba Valley (LLG) and the latest after around 700 cal CE in the Kleinwalser Valley (HFL), before
reaching a minimum at approximately 1500 cal CE. Although colder summers, longer winters or
droughts can act as a climate forcing behind such an observation, other mechanisms were
additionally suggested here to explain this effect. In line with the findings of Sjögren et al. (2007),
strong and long-term human impact can be suggested as the main responsible factor for this
phase of reduced or ceased peat accumulation. In the Kleinwalser Valley and at the Piller Mire,
partly still existing drainage could have played a role, but no date can be allocated to the initial
instalment at the moment. Especially in the upper Fimba Valley, cattle trampling was probably
the most important reason. Considering the Iron Age pastoral huts and pens (Reitmaier, 2012),
the earlier decline in LLG could have been a consequence of this early phase of Alpine farming
in the Fimba Valley.
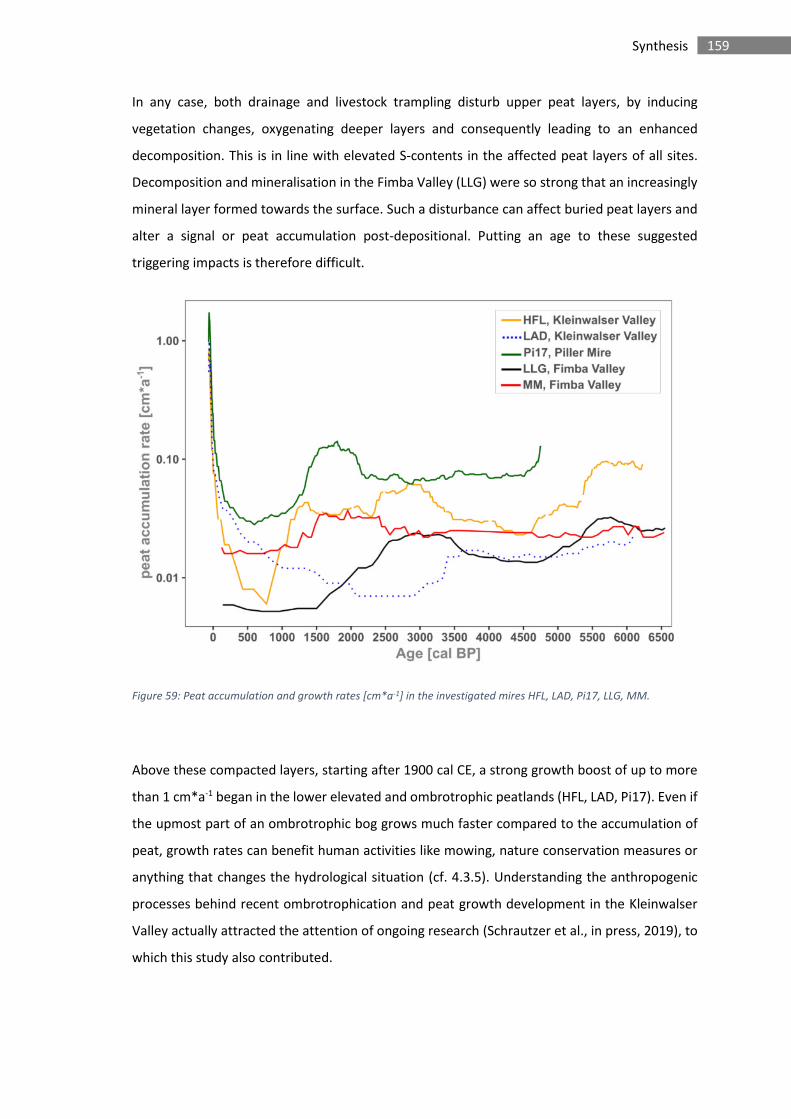
159 Synthesis
In any case, both drainage and livestock trampling disturb upper peat layers, by inducing
vegetation changes, oxygenating deeper layers and consequently leading to an enhanced
decomposition. This is in line with elevated S-contents in the affected peat layers of all sites.
Decomposition and mineralisation in the Fimba Valley (LLG) were so strong that an increasingly
mineral layer formed towards the surface. Such a disturbance can affect buried peat layers and
alter a signal or peat accumulation post-depositional. Putting an age to these suggested
triggering impacts is therefore difficult.
Figure 59: Peat accumulation and growth rates [cm*a-1] in the investigated mires HFL, LAD, Pi17, LLG, MM.
Above these compacted layers, starting after 1900 cal CE, a strong growth boost of up to more
than 1 cm*a-1 began in the lower elevated and ombrotrophic peatlands (HFL, LAD, Pi17). Even if
the upmost part of an ombrotrophic bog grows much faster compared to the accumulation of
peat, growth rates can benefit human activities like mowing, nature conservation measures or
anything that changes the hydrological situation (cf. 4.3.5). Understanding the anthropogenic
processes behind recent ombrotrophication and peat growth development in the Kleinwalser
Valley actually attracted the attention of ongoing research (Schrautzer et al., in press, 2019), to
which this study also contributed.
160 Conclusions and perspectives
8 Conclusions and perspectives
8.1 Analytical development of pXRF
The methodological approaches of this study, the application and intercomparison of
quantitative and semi-quantitative geochemical methods allow the calibration of results derived
from a pXRF-device for a wide number of elements with ICP-MS and ICP-OES measurements of
the same samples. A time and cost saving sampling of the peat cores is thereby made possible,
resulting in a higher resolution. Due to the heterogeneity of samples, especially with respect to
the mineral matter content, resulting from the respective mire types, their environment and
vegetation, site-specific effects appear during analysis. A general result of this study is that
elemental concentrations are significantly overestimated by pXRF. Regression analyses
demonstrate that linear calibrations of pXRF measurements are possible within a peat matrix,
whereas the addition of minerogenic samples introduces a matrix effect to the calibration
functions for most elements. This effect manifests in such a way that the pXRF-measurements
are getting closer to their real concentrations with rising mineral content. To reduce the
uncertainty for less organic peat samples, more exact criteria for the point where the regression
shifts from linear to polynomial shape should be defined in future studies. In addition to
considering the dry bulk density or Ti-concentrations as guidance, the ash-content is proposed
as a promising indicator to define this transition range. In any case, a thorough calibration of the
pXRF-device should be carried out at an early stage of the study: either by another reliable
independent method (e.g. ICP-MS or ICP-OES) or by a sufficient number of CRMs. Acquiring and
developing more CRMs with an organic, peat-like matrix and a wider concentration range before
using a pXRF-instrument is therefore highly recommended. Eventually, the development of
universally valid calibrations for the geochemical pXRF-analysis of peat should be targeted.
The results that were obtained by regression analyses in this study demonstrate that it is
possible to successfully quantify and reproduce potential geochemical palaeoenvironmental
proxies by using pXRF in different types of dried and homogenised peat samples. Among these
proxies are the elements Ti, Pb, Zn, S, K, Fe and Sr. With reservations, V, Rb, Mn and Zr can be
quantified as well. Altogether, these results open new opportunities for future
(palaeo)environmental or metal pollution studies in peatlands. This becomes particularly
apparent when looking at the great advantages of pXRF. Relative to ICP-MS, both the sample
preparation and analysis are fast and simple: The time and energy-consuming application of
dangerous acids during sample processing and measurement becomes obsolete. Furthermore,
pXRF is non-destructive, saving the material for other analyses. Relative to XRF-core-scanning,
the preparation is, of course, slower, but effects of water content and surface irregularities are
161 Conclusions and perspectives
circumvented. More importantly, the results of this work allow obtaining quantitative results
and are thus a good compromise between ICP-MS and XRF-core-scanning.
Beside pXRF, the application of an XRF-core-scanner (Avaatech) on wet peat cores can be an
effective tool to identify or confirm major geochemical signals, either of increased mineral
content (Si preferred before Ti) or of anthropogenically enriched heavy metals like Pb or Zn.
8.2 Site specific factors and proxy sensitivity
Another major outcome of the present study is that the elevation of a mire and the exact
position of it play an important role in what palaeoenvironmental or geochemical signals are
recorded. At high elevations around or above the tree line, mires that are close to a smaller
glacial meltwater discharge channel (proglacial stream-bank mires), could be more sensitive to
record climate oscillations without or with only limited anthropogenic disturbance. However,
the downside of this is, that a relatively higher mineral content, due to the geomorphologically
very active environment in these high alpine valleys, dilutes and potentially masks airborne
anthropogenic signals like (Pb) metal EFs. It is hence suggested that, at high elevations, detailed
geochemical analysis is less important than detailed radiocarbon dating, age-depth models, field
observations, core descriptions and sedimentology. Mires at lower elevations that are more
sheltered or further away from glaciogenic erosion processes have a higher potential of
detecting more subtle palaeoenvironmental signals. This is partly due to longer vegetation
periods, which favours a higher peat accumulation rate and thus increases the potential
resolution of sampling and chronology. Especially the problem of a decreasing resolution can be
a severe issue at mire sites that are close to human settlements, where impacts like drainage,
cattle trampling or even peat mining were or are disturbing factors. Nevertheless, despite their
heterogeneity and certain limitations, the general qualification of mostly small-scale mountain
mires as geoarchives of environmental change, climate, human impact, land use and land-cover,
mining and metallurgy were demonstrated by the synchronicity of geochemical proxies with
local pollen studies, archaeological findings, historical data, and regional palaeoclimate studies.
This also underlines the need for further interdisciplinary, multi-proxy approaches in such sites
to be able to validate and corroborate interpretations.
162 Conclusions and perspectives
8.3 Multiproxy – multisite – multi disciplinary: the key to understanding a
complex changing mountain environment
The study of multiple cores from three valleys the Central Alps revealed both regionally
synchronous and locally different palaeoenvironmental changes that can be linked to climate or
human impacts. This study contributes to understand and compare the responses of single
valleys or a culturally and environmentally important region to either anthropogenic or climatic
disturbances during the Holocene.
Colder and wetter conditions probably affected the high altitudes of the northern Central Alps
around 8200 cal BP and again between c. 6450 and 6100 cal BP, triggering the subsequent onset
of peat accumulation in the Kleinwalser Valley and increased sediment input in the Fimba Valley.
Although, a response to the 8.2 ka event in the Alps is still under discussion, it appears to have
affected the Fimba Valley. Cold periods with an influence on this valley are moreover suggested
for periods around 5100, 4500, 3650, 3100 and 2600 cal BP. The first significant anthropogenic
signal is detected in the Kleinwalser Valley around 5500 cal BP in the form of forest clearings,
which lead to a patchy landscape opening and increased erosion. For the same period, the peat
record also provides the earliest ever reported evidence for metallurgical or mining activities in
this part of the periphery of the northern Central Alps, where ores are scarce. Another phase of
increased land use is recorded between 4600 and 4000 cal BP around the Piller Mire, with
simultaneously elevated metal(loid) EFs (also in the Kleinwalser Valley at 4200 cal BP), which is
again earlier than the oldest archaeological evidence for metal production in this part of the
Alps. The most drastic human impact in prehistoric times encompassed large parts of the
northern Central Alps’ landscape during the Middle to Late Bronze Age, between c. 3500 and
3000 cal BP. This work demonstrates that deforestation, the establishment of pasture
management and agriculture led to a strong erosion of slopes and a large-scale transformation
of the landscape. In particular in the Kleinwalser Valley, human impact was almost as strong as
around 1850 CE. Decreasing human impact probably resulted in the recovery of forests and
consequently reduced the fluxes of mineral matter by stabilising the soils around the Early Iron
Age. Another period of increased land use started around 2500 cal BP in the area of the two
eastern sites, related to pastoralism (Fimba Valley) or settlements and a cultic site (Piller Mire).
In contrast, unassignable metallurgical activities were stronger around the Kleinwalser Valley
over the Early and Middle Iron Age, whereas no local or direct impact on the landscape can be
evidenced. While land use decreased in the whole region, the Roman lead mining peak is clearly
visible in all sites around 2000 cal BP. Probably proceeding from the lowlands, the Kleinwalser
Valley experienced the first visible anthropogenic impact again in the 3rd century cal CE. Not
much later, a severe climate deterioration around 500 cal CE (LALIA and DACP) dramatically
163 Conclusions and perspectives
interrupted human activities for more than a century. Larger landscape changes began, but were
not contemporaneous, during the Middle Ages. In the upper Fimba Valley, increased mineral
input could have been initiated by a mix of both colder climate (LIA) and more intensive land
use. Episodes of a probably more erosive land use returned around 1750 cal CE and again in the
second half of the 20th century (deforestation, pastoralism, drainage, infrastructure construction
and tourism). From the Late Middle Ages onward, a successive intensification of regional mining
and metallurgy was followed by emissions from industrialisation and fossil fuels, reflected in an
ever-increasing Pb EF until 1980 cal CE. The characteristic pattern of Pb-emissions and
enrichments in European sediment archives, provided an independent age-control for the 20th
century CE together with the bomb-pulse radiocarbon dates. Besides documented erosion and
metallurgy proxies, cattle trampling and drainage caused a high degree of decomposition and
compaction. This affected peat layers at least since the Middle Ages until today, although strong
peat growth was initiated again by changing land use practices and conservation measures after
around 1950 cal CE.
Opening an environmental archive can provide long-term information on past environmental
conditions, climate change and human impact, where archaeological findings are not as
continuous or even lacking. Taking, for example, several signals of elevated Pb EF in prehistory
or during Roman Times and in the Early Middle Ages, the signals presented here are suggesting
several undocumented episodes of local or regional metallurgy and/or mining around the
Kleinwalser Valley and the Piller Mire. The origin of these signals, however, could not be
pinpointed or connected to any known archaeological sites in the study area and would require
further investigation. Ideally, this would be in ombrotrophic mires in the vicinity of potential ore
deposits. Detailed analysis of Pb-isotopes (e.g. 206Pb/207Pb) in the peat samples and in natural
local sediments and their comparison to signatures of the closest mines or ores would also be a
strong tool to gaining knowledge on the origin of signals. A high-resolution pollen analysis on
the same cores that are used for geochemistry could also be a valuable complement to find
indicators for changes in land use connected to mining and smelting activities. Additional
investigations on mires from neighbouring areas are, furthermore, needed. These could test the
suggested climatic or anthropogenic signals derived from mineral input fluctuations that are less
distinct than, for example, the extensive landscape transformations during the Mid to Late
Bronze Age evidenced in this study.
As the chronological uncertainty in the uppermost peat layers is relatively high compared to
precise historical data, 210Pb-dating could help to refine the chronologies. This could thus test
the interpretations of recent developments in the mire and thereby, for example, assess the
164 Conclusions and perspectives
most recent human impact (e.g. drainage, mowing, grazing) and its effects on the mires’
ecohydrology, peat growth and decay in mountainous environments.
In order to gain the full picture, there are many more research questions that should be
addressed in the future. Nonetheless, the consolidation of this work’s geochemical results with
information from various other fields of scientific disciplines highlights the potential of using
mountain mires in unveiling past developments of human activity. The investigated mires are
not merely showing local human presence but are giving an idea about the character and extent
of human impact on the Alpine landscape during different periods of the Late Holocene.
Moreover, they are revealing previously unknown episodes of prehistoric to Medieval mining
and/or metallurgic activities in the northern Central Alps, where polymetallic ores are found.
Altogether, this study demonstrates the significance of pXRF-based geochemical studies in
mountain mires and emphasises the strengths of this approach, ultimately making it an
indispensable part of multidisciplinary, palaeoenvironmental studies in areas, where peatlands
exist.
165 References
9 References
Allan, M., Pinti, D.L., Ghaleb, B., Verheyden, S., Mattielli, N., Fagel, N., 2018. Reconstruction of Atmospheric Lead Pollution During the Roman Period Recorded in Belgian Ombrotrophic Peatlands Cores. Atmosphere (Basel). 9, 253. https://doi.org/10.3390/atmos9070253
Alley, R.B., Ágústsdóttir, A.M., 2005. The 8k event: cause and consequences of a major Holocene abrupt climate change. Quat. Sci. Rev. 24, 1123–1149. https://doi.org/10.1016/j.quascirev.2004.12.004
Alley, R.B., Mayewski, P.A., Sowers, T., Stuiver, M., Taylor, K.C., Clark, P.U., 1997. Holocene climatic instability: A prominent, widespread event 8200 yr ago. Geology 25, 483–486.
Alpine-Convention, 2010. Alpine Convention Reference Guide. Alpine Signals 1, 2nd ed. Permanent Secretariat of the Alpine Convention, Innsbruck/Bolzano.
Amann, A., 2014. Alpgenossenschaften im Kleinwalsertal – Eine Vignette aus früherer Zeit“ Berichte aus Alpbüchern des Alters 1592 AD “, in: Laurinkari, J., Schediwy, R., Todev, T. (Eds.), Genossenschaftswissenschaft Zwischen Theorie Und Geschichte: Festschrift Für Prof. Dr. Johann Brazda Zum 60. Geburtstag. BoD – Books on Demand, pp. 49–63.
Amann, A., 2013a. Alpleben im Walsertal - ein kulturhistorischer Abriss, in: Amann, A., Willand, D. (Eds.), “Das Buoch Soll Kraft Und Macht Haben”. Alpbücher Im Kleinwalsertal 1541-1914. Brüüge, Riezlern/Kleinwalsertal, pp. 11–80.
Amann, A., 2013b. Kaleidoskop der Alpbücher, in: Willand, D., Amann, A. (Eds.), Das Buoch Soll Kraft Und Macht Haben". Alpbücher Im Kleinwalsertal 1541-1914. Brüüge, Riezlern/Kleinwalsertal, pp. 103–164.
Armit, I., Swindles, G.T., Becker, K., Plunkett, G., Blaauw, M., 2014. Rapid climate change did not cause population collapse at the end of the European Bronze Age. Proc. Natl. Acad. Sci. 111, 17045–17049. https://doi.org/10.1073/pnas.1408028111
Arnaud, F., Poulenard, J., Giguet-Covex, C., Wilhelm, B., Révillon, S., Jenny, J.-P., Revel, M., Enters, D., Bajard, M., Fouinat, L., Doyen, E., Simonneau, A., Pignol, C., Chapron, E., Vannière, B., Sabatier, P., 2016. Erosion under climate and human pressures: An alpine lake sediment perspective. Quat. Sci. Rev. 152, 1–18. https://doi.org/10.1016/j.quascirev.2016.09.018
Artioli, G., Angelini, I., Kaufmann, G., Canovaro, C., Dal Sasso, G., Villa, I.M., 2017. Long-distance connections in the Copper Age: New evidence from the Alpine Iceman’s copper axe. PLoS One 12, e0179263. https://doi.org/10.1371/journal.pone.0179263
Aubert, D., Le Roux, G., Krachler, M., Cheburkin, A., Kober, B., Shotyk, W., Stille, P., 2006. Origin and fluxes of atmospheric REE entering an ombrotrophic peat bog in Black Forest (SW Germany): Evidence from snow, lichens and mosses. Geochim. Cosmochim. Acta 70, 2815–2826. https://doi.org/10.1016/j.gca.2006.02.020
Babucke, V., 1995. Das frühe Mittelalter, in: Czysz, W., Dietrich, H., Weber, G. (Eds.), Kempten Und Das Allgäu. Führer Zu Archäologischen Denkmälern in Deutschland 30. Theiss, Stuttgart, pp. 70–78.
Bachnetzer, T., 2017. Prähistorischer Feuersteinbergbau im Kleinwalsertal, Vorarlberg. Silex- und Bergkristallabbaustellen in Österreich. Praearchos 5.
Bächtiger, K., 1982. Die Erzvorkommen und Lagerstätten Graubündens und der ehemalige Bergbau. Mitteilungen, Verein der Freunde des Bergbaues Graubünden 21, 2–12.
166 References
Barber, K.E., 1993. Peatlands as scientific archives of past biodiversity. Biodivers. Conserv. 2, 474–489. https://doi.org/10.1007/BF00056743
Barham, L.S., 2002. Systematic Pigment Use in the Middle Pleistocene of South‐Central Africa. Curr. Anthropol. 43, 181–190. https://doi.org/10.1086/338292
Barker, M.L., 1982. Traditional Landscape and Mass Tourism in the Alps. Geogr. Rev. 72, 395. https://doi.org/10.2307/214593
Baron, S., Lavoie, M., Ploquin, A., Carignan, J., Pulido, M., De Beaulieu, J.L., 2005. Record of metal workshops in peat deposits: History and environmental impact on the Mont Lozère Massif, France. Environ. Sci. Technol. 39, 5131–5140. https://doi.org/10.1021/es048165l
Bartelheim, Martin, Eckstein, K., Huijsmans, M., Krauß, R., Pernicka, Ernst, 2002. Kupferzeitliche Metallgewinnung in Brixlegg, Österreich, in: Bartelheim, M., Pernicka, E., Krause, R. (Eds.), Die Anfänge Der Metallurgie in Der Alten Welt. Rahden, Westfalia: Verlag Marie Leidorf, Rahden, pp. 33–82.
Bätzing, W., 2015. Die Alpen: Geschichte und Zukunft einer europäischen Kulturlandschaft, 4th ed. C.H. Beck, Munich.
Bätzing, W., Perlik, M., Dekleva, M., 1996. Urbanization and depopulation in the Alps. Mt. Res. Dev. 335–350.
Bauerochse, A., Katenhusen, O., 1997. Reconstruction of Holocene landscape development and present vegetation of the Val Fenga (Tyrol/Grisons). Phytocoenologia 27, 353–453. https://doi.org/10.1127/phyto/27/1997/353
Bednarik, R.G., 1992. Early subterranean chert mining. The Artefact 15, 11–24.
Belokopytov, I.E., Beresnevich, V. V, 1955. Giktorf’s peat borers. Torfyanaya Promyshlennost 8, 9–10.
Bender, O., 2010. Entstehung, Entwicklung und Ende der alpinen Bergbauernkultur. Über das Entsteh. und die Endlichkeit Phys. Prozesse, Biol. Arten und Menschl. Kult. 113–137.
Benedetti, M.F., Milne, C.J., Kinniburgh, D.G., Van Riemsdijk, W.H., Koopal, L.K., 1995. Metal Ion Binding to Humic Substances: Application of the Non-Ideal Competitive Adsorption Model. Environ. Sci. Technol. 29, 446–457. https://doi.org/10.1021/es00002a022
Beniston, M., 2005. Mountain climates and climatic change: an overview of processes focusing on the European Alps. Pure Appl. Geophys. 162, 1587–1606.
Bennett, P.C., Siegel, D.I., Hill, B.M., Glaser, P.H., 1991. Fate of silicate minerals in a peat bog. Geology 19, 328–331.
Benoit, J.M., Fitzgerald, W.F., Damman, A.W.H., 1998. The Biogeochemistry of an Ombrotrophic Bog: Evaluation of Use as an Archive of Atmospheric Mercury Deposition. Environ. Res. 78, 118–133. https://doi.org/10.1006/enrs.1998.3850
Bergström, A.-K., Jansson, M., 2006. Atmospheric nitrogen deposition has caused nitrogen enrichment and eutrophication of lakes in the northern hemisphere. Glob. Chang. Biol. 12, 635–643. https://doi.org/10.1111/j.1365-2486.2006.01129.x
Biester, H., Hermanns, Y.M., Martinez Cortizas, A., 2012. The influence of organic matter decay on the distribution of major and trace elements in ombrotrophic mires - a case study from the Harz Mountains. Geochim. Cosmochim. Acta 84, 126–136. https://doi.org/10.1016/j.gca.2012.01.003
Biester, H., Knorr, K.-H.H., Schellekens, J., Basler, A., Hermanns, Y.-M.M., 2014. Comparison of
167 References
different methods to determine the degree of peat decomposition in peat bogs. Biogeosciences 11, 2691–2707. https://doi.org/10.5194/bg-11-2691-2014
Bindler, R., 2006. Mired in the past - looking to the future: Geochemistry of peat and the analysis of past environmental changes. Glob. Planet. Change 53, 209–221. https://doi.org/10.1016/j.gloplacha.2006.03.004
Binnemans, K., Jones, P.T., Blanpain, B., Van Gerven, T., Pontikes, Y., 2015. Towards zero-waste valorisation of rare-earth-containing industrial process residues: a critical review. J. Clean. Prod. 99, 17–38. https://doi.org/10.1016/j.jclepro.2015.02.089
Blaauw, M., 2010. Methods and code for ‘classical’ age-modelling of radiocarbon sequences. Quat. Geochronol. 5, 512–518. https://doi.org/10.1016/j.quageo.2010.01.002
Blaauw, M., Christen, J.A., 2011. Flexible paleoclimate age-depth models using an autoregressive gamma process. Bayesian Anal. 6, 457–474. https://doi.org/10.1214/11-BA618
Bloemsma, M., Croudace, I., Daly, J.S., Edwards, R.J., Francus, P., Galloway, J.M., Gregory, B.R.B., Huang, J.-J.S., Jones, A.F., Kylander, M., Löwemark, L., Luo, Y., Maclachlan, S., Ohlendorf, C., Patterson, R.T., Pearce, C., Profe, J., Reinhardt, E.G., Stranne, C., Tjallingii, R., Turner, J.N., 2018. Practical guidelines and recent advances in the Itrax XRF core-scanning procedure. Quat. Int. https://doi.org/https://doi.org/10.1016/j.quaint.2018.10.044
Bode, M., Hanel, N., Rothenhöfer, P., 2015. Die Versorgung des Alpenraums mit Blei in römischer Zeit, in: Stöllner, T., Oeggl, K. (Eds.), Bergauf Bergab. 10.000 Jahre Bergbau in Den Ostalpen. Deutsches Bergbau-Museum Bochum, Bochum, pp. 389–394.
Boës, X., Rydberg, J., Martinez-Cortizas, A., Bindler, R., Renberg, I., 2011. Evaluation of conservative lithogenic elements (Ti, Zr, Al, and Rb) to study anthropogenic element enrichments in lake sediments. J. Paleolimnol. 46, 75–87. https://doi.org/10.1007/s10933-011-9515-z
Böning, P., Bard, E., Rose, J., 2007. Toward direct, micron-scale XRF elemental maps and quantitative profiles of wet marine sediments. Geochemistry, Geophys. Geosystems 8, n/a-n/a. https://doi.org/10.1029/2006GC001480
Bortenschlager, S., 2010. Vegetationsgeschichte im Bereich des Rotmoostales. Glaziale und periglaziale Leb. im Raum Obergurgl 77–92.
Boyle, J.F., 2000. Rapid elemental analysis of sediment samples by isotope source XRF. J. Paleolimnol. 23, 213–221. https://doi.org/10.1023/A:1008053503694
Bragg, O., Lindsay, R., 2003. Strategy and action plan for mire and peatland conservation in Central Europe. Wetlands International, Wageningen.
Brandstätter, K., 2015. Spätmittelalterlicher Bergbau im Ostalpenraum, in: Stöllner, T., Oeggl, K. (Eds.), Bergauf Bergab. 10.000 Jahre Bergbau in Den Ostalpen. Deutsches Bergbau-Museum Bochum, Bochum, pp. 419–424.
Brandstätter, K., Neuhauser, G., Anzinger, B., 2015. Waldnutzung und Waldentwicklung in der Grafschaft tirol im Spätmittelalter und der Frühen neuzeit, in: Stöllner, T., Oeggl, K. (Eds.), Bergauf Bergab. 10.000 Jahre Bergbau in Den Ostalpen. Deutsches Bergbau-Museum Bochum, Bochum, pp. 547–552.
Brännvall, M.-L., Bindler, R., Emteryd, O., Renberg, I., 2001. Four thousand years of atmospheric lead pollution in northern Europe: a summary from Swedish lake sediments.
168 References
J. Paleolimnol. 25, 421–435. https://doi.org/10.1023/A:1011186100081
Brännvall, M.L., Bindler, R., Renberg, I., Emteryd, O., Bartnicki, J., Billström, K., 1999. The medieval metal industry was the cradle of modern large-scale atmospheric lead pollution in northern Europe. Environ. Sci. Technol. 33, 4391–4395. https://doi.org/10.1021/es990279n
Breitenlechner, E., Goldenberg, G., Lutz, J., Oeggl, K., 2013. The impact of prehistoric mining activities on the environment: A multidisciplinary study at the fen Schwarzenbergmoos (Brixlegg, Tyrol, Austria). Veg. Hist. Archaeobot. 22, 351–366. https://doi.org/10.1007/s00334-012-0379-6
Bringemeier, L., Krause, R., Stobbe, A., Röpke, A., 2015. expansions of bronze age pasture farming and environmental changes in the northern alps (montafon, austria and prättigau, switzerland) – an integrated palaeoenv ironmental and archaeological approach, in: Kneisel, J., Corso, M.D., Kirleis, W., Scholz, H., Taylor, N., Tiedtke, V. (Eds.), The Third Food Revolution? Setting the Bronze Age Table: Common Trends in Economic and Subsistence Strategies in Bronze Age Europe. Verlag Dr. Rudolph Habelt GmbH, Bonn, pp. 181–200.
Brinson, M.M., Malvárez, A.I., 2002. Temperate freshwater wetlands: types, status, and threats. Environ. Conserv. 29, 115–133. https://doi.org/10.1017/S0376892902000085
Brown, K.A., 1985. Sulphur distribution and metabolism in waterlogged peat. Soil Biol. Biochem. 17, 39–45. https://doi.org/10.1016/0038-0717(85)90088-4
Brown, P.., Gill, S.., Allen, S.., 2000. Metal removal from wastewater using peat. Water Res. 34, 3907–3916. https://doi.org/10.1016/S0043-1354(00)00152-4
Büntgen, U., Myglan, V.S., Ljungqvist, F.C., McCormick, M., Di Cosmo, N., Sigl, M., Jungclaus, J., Wagner, S., Krusic, P.J., Esper, J., Kaplan, J.O., De Vaan, M.A.C., Luterbacher, J., Wacker, L., Tegel, W., Kirdyanov, A. V., 2016. Cooling and societal change during the Late Antique Little Ice Age from 536 to around 660 AD. Nat. Geosci. 9, 231–236. https://doi.org/10.1038/ngeo2652
Büntgen, U., Tegel, W., Nicolussi, K., McCormick, M., Frank, D., Trouet, V., Kaplan, J.O., Herzig, F., Heussner, K.U., Wanner, H., Luterbacher, J., Esper, J., 2011. 2500 years of European climate variability and human susceptibility. Science (80-. ). 331, 578–582. https://doi.org/10.1126/science.1197175
Carcaillet, C., 1998. A spatially precise study of Holocene fire history, climate and human impact within the Maurienne valley, North French Alps. J. Ecol. 86, 384–396. https://doi.org/10.1046/j.1365-2745.1998.00267.x
Carlson, K.M., Curran, L.M., Asner, G.P., Pittman, A.M., Trigg, S.N., Marion Adeney, J., 2013. Carbon emissions from forest conversion by Kalimantan oil palm plantations. Nat. Clim. Chang. 3, 283–287. https://doi.org/10.1038/nclimate1702
Carrer, F., Colonese, A.C., Lucquin, A., Guedes, E.P., Thompson, A., Walsh, K., Reitmaier, T., Craig, O.E., 2016. Chemical analysis of pottery demonstrates prehistoric origin for high-altitude alpine dairying. PLoS One 11, 1–11. https://doi.org/10.1371/journal.pone.0151442
Casty, C., Wanner, H., Luterbacher, J., Esper, J., Böhm, R., 2005. Temperature and precipitation variability in the European Alps since 1500. Int. J. Climatol. 25, 1855–1880. https://doi.org/10.1002/joc.1216
Cerny, I., 1989. Die karbonatgebundenen Blei-Zink-Lagerstätten des alpinen und außeralpinen
169 References
Mesozoikums. Die Bedeutung ihrer Geologie, Stratigraphie und Faziesgebundenheit für Prospektion und Bewertung. Arch. Lagerstättenforsch. Geol. Bundesanst. 11, 5–125.
Chagué-Goff, C., Chan, J.C.H., Goff, J., Gadd, P., 2016. Late Holocene record of environmental changes, cyclones and tsunamis in a coastal lake, Mangaia, Cook Islands. Isl. Arc 25, 333–349. https://doi.org/10.1111/iar.12153
Chambers, F.M., Booth, R.K., De Vleeschouwer, F., Lamentowicz, M., Le Roux, G., Mauquoy, D., Nichols, J.E., van Geel, B., 2012. Development and refinement of proxy-climate indicators from peats. Quat. Int. 268, 21–33. https://doi.org/10.1016/j.quaint.2011.04.039
Chambers, F.M., Charman, D.J., 2004. Holocene environmental change: contributions from the peatland archive. The Holocene 14, 1–6. https://doi.org/10.1191/0959683604hl684ed
Chaney, R.L., Hundemann, P.T., 1979. Use of peat moss columns to remove cadmium from wastewaters. J. (Water Pollut. Control Fed. 51, 17–21.
Chawchai, S., Kylander, M.E., Chabangborn, A., Löwemark, L., Wohlfarth, B., 2016. Testing commonly used X-ray fluorescence core scanning-based proxies for organic-rich lake sediments and peat. Boreas 45, 180–189. https://doi.org/10.1111/bor.12145
Clark, J.S., Merkt, J., Muller, H., 1989. Post-Glacial Fire, Vegetation, and Human History on the Northern Alpine Forelands, South-Western Germany. J. Ecol. 77, 897. https://doi.org/10.2307/2260813
Cloy, J.M., Farmer, J.G., Graham, M.C., MacKenzie, A.B., 2011. Scottish peat bog records of atmospheric vanadium deposition over the past 150 years: comparison with other records and emission trends. J. Environ. Monit. 13, 58–65. https://doi.org/10.1039/C0EM00492H
Cloy, J.M., Farmer, J.G., Graham, M.C., MacKenzie, A.B., 2009. Retention of As and Sb in Ombrotrophic Peat Bogs: Records of As, Sb, and Pb Deposition at Four Scottish Sites. Environ. Sci. Technol. 43, 1756–1762. https://doi.org/10.1021/es802573e
Cooper, D.J., Wolf, E.C., Colson, C., Vering, W., Granda, A., Meyer, M., 2010. Alpine peatlands of the Andes, Cajamarca, Peru. Arctic, Antarct. Alp. Res. 42, 19–33. https://doi.org/10.1657/1938-4246-42.1.19
Cornelissen, M., Reitmaier, T., 2016. Filling the gap: Recent Mesolithic discoveries in the central and south-eastern Swiss Alps. Quat. Int. 423, 9–22. https://doi.org/10.1016/j.quaint.2015.10.121
Costanza, R., D’Arge, R., De Groot, R., Farber, S., Grasso, M., Hannon, B., Limburg, K., Naeem, S., O’neill, R. V, Paruelo, J., 1997. The value of the world’s ecosystem services and natural capital. Nature 387, 253. https://doi.org/0.1038/387253a0
Couillard, D., 1994. The use of peat in wastewater treatment. Water Res. 28, 1261–1274. https://doi.org/10.1016/0043-1354(94)90291-7
Croudace, I.W., Rindby, A., Rothwell, R.G., 2006. ITRAX: description and evaluation of a new multi-function X-ray core scanner. Geol. Soc. London, Spec. Publ. 267, 51–63. https://doi.org/10.1144/GSL.SP.2006.267.01.04
Damman, A.W.H., 1978. Distribution and Movement of Elements in Ombrotrophic Peat Bogs. Oikos 30, 480. https://doi.org/10.2307/3543344
Dargie, G.C., Lewis, S.L., Lawson, I.T., Mitchard, E.T.A., Page, S.E., Bocko, Y.E., Ifo, S.A., 2017. Age, extent and carbon storage of the central Congo Basin peatland complex. Nature 542, 86–90. https://doi.org/10.1038/nature21048
170 References
Dart, P.B., 1971. On a further radiocarbon date for ancient mining in Southern Africa. S. Afr. J. Sci. 67, 10–11.
de Graaff, L.W.S., de Jong, M.G.G., Busnach, T., Seijmonsbergen, A.C., 2003. Geomorphologische Studie hinterer Bregenzerwald. Bericht an das Amt der Vorarlberger Landesregierung, Abt. Raumplanung und Baurecht Landhaus Bregenz. Amsterdam.
De Vleeschouwer, F., Chambers, F.M., Swindles, G.T., 2010a. Coring and sub-sampling of peatlands for palaeoenvironmental research. Mires Peat 7, 1–10. https://doi.org/10.1016/j.ssi.2010.01.014
De Vleeschouwer, F., Gérard, L., Goormaghtigh, C., Mattielli, N., Le Roux, G., Fagel, N., 2007. Atmospheric lead and heavy metal pollution records from a Belgian peat bog spanning the last two millenia: Human impact on a regional to global scale. Sci. Total Environ. 377, 282–295. https://doi.org/10.1016/j.scitotenv.2007.02.017
De Vleeschouwer, F., Le Roux, G., Shotyk, W., 2010b. Peat as an archive of atmospheric pollution and environmental change: A case study of lead in Europe. PAGES Mag. 18, 20–22. https://doi.org/10.22498/pages.18.1.20
De Vleeschouwer, F., van Vliët-Lanoé, B., Fagel, N., Richter, T., Boës, X., 2008. Development and application of high-resolution petrography on resin-impregnated Holocene peat columns to detect and analyse tephras, cryptotephras, and other materials. Quat. Int. 178, 54–67. https://doi.org/10.1016/j.quaint.2006.12.021
DeFries, R.S., Foley, J.A., Asner, G.P., 2004. Land‐use choices: balancing human needs and ecosystem function. Front. Ecol. Environ. 2, 249–257. https://doi.org/10.1890/1540-9295(2004)002[0249:LCBHNA]2.0.CO;2
Della Casa, P., 2013. Switzerland and the Central Alps, in: Harding, A., Fokkens, H. (Eds.), The Oxford Handbook of the European Bronze Age. OUP Oxford, pp. 706–722.
Dertsch, R., 1974. Ortsnamensbuch des Landkreises Sonthofen. Historisches Ortsnamenbuch von Bayern. Schwaben. Bd. 7. Kommission für Bayerische Landesgeschichte, München.
Dieffenbach-Fries, H., 1981. Zur spät- und postglazialen Vegetationsentwicklung bei Oberstdorf (Oberallgäu) und im kleinen Walsertal (Vorarlberg). Technische Hochschule Darmstadt.
Dierßen, K., Dierßen, B., 2008. Moore, Ökologie Botanik. Ulmer.
Dietre, B., Anich, I., Reidl, D., Kappelmeyer, T., Haas, J.N., 2012. Erste Hirten und Bauern der Silvretta. Palynologie und Ethnobotanik Im Fimbertal und Paznaun, in: Reitmaier, T. (Ed.), Letzte Jäger, Erste Hirten - Hochalpine Archäologie in Der Silvretta. Archäologischer Dienst Graubünden, Chur, pp. 236–256.
Dietre, B., Walser, C., Kofler, W., Kothieringer, K., Hajdas, I., Lambers, K., Reitmaier, T., Haas, J.N., 2017. Neolithic to Bronze Age (4850–3450 cal. BP) fire management of the Alpine Lower Engadine landscape (Switzerland) to establish pastures and cereal fields. Holocene 27, 181–196. https://doi.org/10.1177/0959683616658523
Dietre, B., Walser, C., Lambers, K., Reitmaier, T., Hajdas, I., Haas, J.N., 2014. Palaeoecological evidence for Mesolithic to Medieval climatic change and anthropogenic impact on the Alpine flora and vegetation of the Silvretta Massif (Switzerland/Austria). Quat. Int. 353, 3–16. https://doi.org/10.1016/j.quaint.2014.05.001
Dise, N.B., 2009. Peatland response to global change. Science (80-. ). 326, 810–811.
Dolenz, H., 2015. Die Goldbarrengießerei in der Stadt auf dem Magdalensberg - Einblicke in einen kaiserlich römischen Hightec-Betrieb, in: Stöllner, T., Oeggl, K. (Eds.), Bergauf
171 References
Bergab. 10.000 Jahre Bergbau in Den Ostalpen. Deutsches Bergbau-Museum Bochum, Bochum, pp. 383–388.
Dugmore, A.J., Larsen, G., Newton, A.J., 1995. Seven tephra isochrones in Scotland. The Holocene 5, 257–266. https://doi.org/10.1177/095968369500500301
Dumontet, S., Lévesque, M., Mathur, S.P., 1990. Limited downward migration of pollutant metals (Cu, Zn, Ni, and Pb) in acidic virgin peat soils near a smelter. Water. Air. Soil Pollut. 49, 329–342. https://doi.org/10.1007/BF00507072
Ebner, F., Cerny, I., Eichhorn, R., Götzinger, M., Paar, W.H., Prochaska, W., Weber, L., 1999. Mineral resources in the Eastern Alps and adjoining areas. Mitteilungen der Österreichischen Geol. Gesellschaft 92, 157–184.
Egger, H., Krenmayr, H.G., Mandl, G.W., Matura, A., Nowotny, A., Pascher, G., Pestal, G., Pistotnik, J., ROCKENSCHAUB M & SCHNABEL, W., 1999. Geologische Übersichtskarte der Republik Österreich 1: 1500000. Wien Geol. Bundesanstalt.
El Balti, N., Christ, L., Kempke, M., Martens, T., Bork, H.-R., Schrautzer, J., 2017. Die Moore im Kleinwalsertal – Aktueller Zustand und Entwicklungsmöglichkeiten. Ina. – Forsch. online 40, 46.
Erdtman, G., 1927. Literature on Pollen-statistics published before 1927. Geol. Föreningen i Stock. Förhandlingar 49, 196–211. https://doi.org/10.1080/11035892709447030
Festi, D., Putzer, A., Oeggl, K., 2014. Mid and late holocene land-use changes in the Ötztal alps, territory of the neolithic iceman “Ötzi.” Quat. Int. 353, 17–33. https://doi.org/10.1016/j.quaint.2013.07.052
Fink, J., von Klenze, H., 1891. Der Mittelberg. Geschichte, Landes- und Volkskunde des ehemaligen gleichnamigen Gerichtes (Reprint). Kösel, Kempten.
Firbas, F., 1923. Pollenanalytische Untersuchungen einiger Moore der Ostalpen. Lotos 71, 187–242.
Fitzsimons, S.J., Veit, H., 2001. Geology and geomorphology of the European Alps and the Southern Alps of New Zealand. Mt. Res. Dev. 21, 340–350. https://doi.org/10.1659/0276-4741(2001)021[0340:GAGOTE]2.0.CO;2
Fleitmann, D., Mudelsee, M., Burns, S.J., Bradley, R.S., Kramers, J., Matter, A., 2008. Evidence for a widespread climatic anomaly at around 9.2 ka before present. Paleoceanogr. Paleoclimatology 23.
Foley, J.A., DeFries, R., Asner, G.P., Barford, C., Bonan, G., Carpenter, S.R., Chapin, F.S., Coe, M.T., Daily, G.C., Gibbs, H.K., Helkowski, J.H., Holloway, T., Howard, E.A., Kucharik, C.J., Monfreda, C., Patz, J.A., Prentice, I.C., Ramankutty, N., Snyder, P.K., 2005. Global Consequences of Land Use. Science (80-. ). 309, 570–574. https://doi.org/10.1126/science.1111772
Forel, B., Monna, F., Petit, C., Bruguier, O., Losno, R., Fluck, P., Begeot, C., Richard, H., Bichet, V., Chateau, C., 2010. Historical mining and smelting in the Vosges Mountains (France) recorded in two ombrotrophic peat bogs. J. Geochemical Explor. 107, 9–20. https://doi.org/10.1016/j.gexplo.2010.05.004
Fralick, P.W., Kronberg, B.I., 1997. Geochemical discrimination of clastic sedimentary rock sources. Sediment. Geol. 113, 111–124. https://doi.org/10.1016/S0037-0738(97)00049-3
Frank, C., Pernicka, E., 2012. Copper artefacts of the Mondsee group and their possible sources, in: Midgley, M.S., Sanders, J. (Eds.), Lake Dwellings after Robert Munro.
172 References
Proceedings from the Munro International Seminar: The Lake Dwellings of Europe. 22nd 23rd October 2010, University of Edinburgh. Sidestone press, Leiden, pp. 113–138.
Freeman, C., Evans, C.D., Monteith, D.T., Reynolds, B., Fenner, N., 2001. Export of organic carbon from peat soils. Nature 412, 785.
Frei, C., Schär, C., 1998. A precipitation climatology of the Alps from high-resolution rain-gauge observations. Int. J. Climatol. 18, 873–900. https://doi.org/10.1002/(SICI)1097-0088(19980630)18:8<873::AID-JOC255>3.0.CO;2-9
Frei, C., Schmidli, J., 2006. Das Niederschlagsklima der Alpen: Wo sich Extreme nahe kommen. promet 32, 61–67.
Friedmann, A., Stojakowits, P., 2017. Zur spät- und postglazialen Vegetationsgeschichte des Allgäu mit Alpenanteil. Kontrakpunkte: Festschrift für Manfred Rösch, Kontrakpunkte: Festschrift für Manfred Rösch, Universitätsforschungen zur prähistorischen Archäologie ; 300. Verlag Dr. Rudolf Habelt GmbH, Bonn, Bonn.
Fritz, A., 2000. Zur Vegetations-, Siedlungs und Klimageschichte des Millstätter Seentales. Carinthia II 110/160, 579–590.
Fritz, W., 1981. Kleinwalsertal einst und jetzt: heimatkundliche Betrachtungen. Verlag Walserdruck, Erich Stöckeler, Riezlern/Kleinwalsertal.
Fromme, G., 1957. Der Waldrückgang im Oberinntal (Tirol) Untersuchungen über das Ausmaß, die Ursachen und Folgeerscheinungen des Wald? rückganges in einem Gebirgslande sowie über die Aussichten der Wiederaufforstung von. Mitteilungen der Forstl. Bundesversuchsanstalt Mariabrunn 54, 3–222.
Gałka, M., Aunina, L., Feurdean, A., Hutchinson, S., Kołaczek, P., Apolinarska, K., 2017. Rich fen development in CE Europe, resilience to climate change and human impact over the last ca. 3500 years. Palaeogeogr. Palaeoclimatol. Palaeoecol. 473, 57–72. https://doi.org/10.1016/j.palaeo.2017.02.030
Gao, K., Pearce, J., Jones, J., Taylor, C., 1999. Interaction between peat, humic acid and aqueous metal ions. Environ. Geochem. Health 21, 13–26. https://doi.org/10.1023/A:1006592627852
Geiger, R., 1961. Überarbeitete Neuausgabe von Geiger, R. Köppen-Geiger/Klima der Erde.(Wandkarte 1 16 Mill.)–Klett-Perthes, Gotha.
Geological Survey of Austria, 2013. Geologie von Österreich - Posterkarte.
Givelet, N., Le Roux, G., Cheburkin, A., Chen, B., Frank, J., Goodsite, M.E., Kempter, H., Krachler, M., Noernberg, T., Rausch, N., 2004. Suggested protocol for collecting, handling and preparing peat cores and peat samples for physical, chemical, mineralogical and isotopic analyses. J. Environ. Monit. 6, 481–492.
Gleirscher, P., 2015a. Blei, der Glanz von Frög, in: Stöllner, T., Oeggl, K. (Eds.), Bergauf Bergab. 10.000 Jahre Bergbau in Den Ostalpen. Deutsches Bergbau-Museum Bochum, Bochum, pp. 369–372.
Gleirscher, P., 2015b. Keltisch-römischer Edelmetallbergbau in den Hohen Tauern?, in: Stöllner, T., Oeggl, K. (Eds.), Bergauf Bergab. 10.000 Jahre Bergbau in Den Ostalpen. Deutsches Bergbau-Museum Bochum, Bochum, pp. 373–376.
Gobet, E., Tinner, W., Hochuli, P.A., Van Leeuwen, J.F.N., Ammann, B., 2003. Middle to Late Holocene vegetation history of the Upper Engadine (Swiss Alps): the role of man and fire. Veg. Hist. Archaeobot. 12, 143–163.
173 References
Godwin, H., 1934. POLLEN ANALYSIS. AN OUTLINE OF THE PROBLEMS AND POTENTIALITIES OF THE METHOD. PART I. TECHNIQUE AND INTERPRETATION. New Phytol. 33, 278–305. https://doi.org/10.1111/j.1469-8137.1934.tb06815.x
Goldammer, J.G., Page, H., Prüter, J., 1997. Nutzung des Feuers in mittel- und nordeuropäischen Landschaften - Geschichte, Methoden, Probleme, Perspektiven, NNA Berichte. Feuereinsatz im Naturschutz. Niedersachsen.
Goldenberg, G., 2015. Prähistorische Kupfergewinnung aus Fahlerzen der Lagerstätte Schwaz-Brixlegg im Unterinntal, Nordtirol, in: Stöllner, T., Oeggl, K. (Eds.), Bergauf Bergab. 10.000 Jahre Bergbau in Den Ostalpen. Deutsches Bergbau-Museum Bochum, Bochum, pp. 151–163.
Goldscheider, N., 1998. Hydrogeologische Untersuchungen im alpinen Karstgebiet Gottesacker und Schwarzwassertal (Allgäu / Vorarlberg). Vor. Naturschau 4, 247–294.
Goodsite, M.E., Rom, W., Heinemeier, J., Lange, T., Ooi, S., Appleby, P.G., Shotyk, W., van der Knaap, W.O., Lohse, C., Hansen, T.S., 2001. High-resolution AMS 14 C dating of post-bomb peat archives of atmospheric pollutants. Radiocarbon 43, 495–515.
Gorham, E., 1995. The biogeochemistry of northern peatlands and its possible responses to global warming. Biot. Feed. Glob. Clim. Syst. Will Warm. Feed Warm. 169–187.
Grabherr, G., 2006. Die Via Claudia Augusta in Nordtirol, in: Walde, E., Grabherr, G. (Eds.), Via Claudia Augusta Und Römerstraßenforschung Im Östlichen Alpenraum. Athesia-Tyrolia Druck GmbH, Innsbruck, pp. 37–284.
Grabherr, G., Gottfried, M., Pauli, H., 2010. Climate change impacts in alpine environments. Geogr. Compass 4, 1133–1153.
Grosse-Brauckmann, G., 2002. Paläobotanische Befunde von zwei Mooren im Gebiet des Hohen Ifen, Vorarlberg (Österreich). Telma 32, 17–36.
Grutsch, C., Martinek, K.P., 2012. Die Nordtiroler Kupfererzvorkommen westlich von Schwaz als Rohstoffpotential der Bronzezeit, in: Oeggl, K., Schaffer, V. (Eds.), Die Geschichte Des Bergbaus in Tirol Und Seinen Angrenzenden Gebieten, Proceedings Zum 6. Milestone-Meeting Des SFB HiMAT Vom 3.-5.11.2011. innsbruck university press, Innsbruck, pp. 101–106.
Gulisano, G., 1995. Die Besiedlung des Kleinwalsertales und seiner angrenzenden Gebiete in Bayern und Vorarlberg von der Steinzeit bis zur Einwanderung der Walser. Archäologische Informationen 18, 53–65. https://doi.org/10.11588/ai.1995.1.35421
Gulisano, G., 1994. Neue mittelsteinzeitliche Fundplätze im oberen Illertal und im Kleinwalsertal. Archäologische Informationen 17, 79–84. https://doi.org/10.11588/ai.1994.1.35418
Haas, J.N., Richoz, I., Tinner, W., Wick, L., 1998. Synchronous holocene climatic oscillations recorded on the Swiss plateau and at timberline in the alps. Holocene 8, 301–309. https://doi.org/10.1191/095968398675491173
Haenssler, E., Nadeau, M.-J., Vött, A., Unkel, I., 2013. Natural and human induced environmental changes preserved in a Holocene sediment sequence from the Etoliko Lagoon, Greece: new evidence from geochemical proxies. Quat. Int. 308, 89–104.
Hammer, W., 1915a. Über Gelbbleierz im Oberinntal. Zeitschrift des Ferdinandeums für Tirol und Vor. 3, 270–277.
Hammer, W., 1915b. Über einige Erzvorkommen im Umkreis der Bündnerschiefer des
174 References
Oberinntales. Veröffentl. d. Museums Ferdinandeum 59, 63–94.
Hanneberg, A., Simon, P., Wolkersdorfer, C., 2009a. Galmei und schone Wulfenite: Der Blei-Zink-Bergbau rund um den Fernpass in Tirol. Lapis 34, 20.
Hanneberg, A., Simon, P., Wolkersdorfer, C., 2009b. Galmei und schöne Wulfenite: Der Blei-Zink-Bergbau rund um den Fernpass in Tirol. Lapis 34, 20.
Hansson, S. V., Rydberg, J., Kylander, M., Gallagher, K., Bindler, R., 2013. Evaluating paleoproxies for peat decomposition and their relationship to peat geochemistry. The Holocene 23, 1666–1671. https://doi.org/10.1177/0959683613508160
HDÖ, 1994. Die Niederschläge, Schneeverhältnisse und Lufttemperaturen in Österreich im Zeitraum 1981 – 1991. Beiträge zur Hydrographie Österreichs. Vienna.
Heiri, O., Lotter, A.F., Hausmann, S., Kienast, F., 2003. A chironomid-based Holocene summer air temperature reconstruction from the Swiss Alps. The Holocene 13, 477–484. https://doi.org/10.1191/0959683603hl640ft
Heiss, A.G., 2008. Weizen, Linsen, Opferbrote — Archäobotanische Analysen bronze- und eisenzeitlicher Brandopferplätze im mittleren Alpenraum (PhD-Thesis). Universität Innsbruck. https://doi.org/10.13140/RG.2.1.5185.5526
Helama, S., Jones, P.D., Briffa, K.R., 2017. Dark Ages Cold Period: A literature review and directions for future research. Holocene 27, 1600–1606. https://doi.org/10.1177/0959683617693898
Herbig, C., 2009. Recent archaeobotanical investigations into the range and abundance of Neolithic crop plants in settlements around Lake Constance and in Upper Swabia (south-west Germany) in relation to cultural influences. J. Archaeol. Sci. 36, 1277–1285. https://doi.org/10.1016/j.jas.2009.01.024
Herlihy, D., 1997. The Black Death and the transformation of the West. Harvard University Press.
Hertl, A., 2001. Untersuchungen zur spätglazialen Gletscher- und Klimageschichte der österreichischen Silvrettagruppe (PhD-Thesis). University of Innsbruck.
Heuberger, R., 1955. Der Bodenseeraum im Altertum, in: Büttner, H., Feger, O., Meyer, B. (Eds.), Aus Verfassungs- Und Landesgeschichte, Festschrift Für Theodor Mayer Zum 70. Geb. Band 2. Geschichtliche Landesforschung, Wirtschaftsgeschichte u. Hilfswissenschaften. Lindau/Konstanz, pp. 7–21.
Hofmann, J., Wolkersdorfer, C., 2013. Der historische Bergbau im Montafon, Montafoner Schriftenreihe. Heimatschutzverein Montafon, Schruns, Austria.
Hölzer, Adam, Hölzer, Amal, 1998. Silicon and titanium in peat profiles as indicators of human impact. The Holocene 8, 685–696. https://doi.org/10.1191/095968398670694506
Holzhauser, H., Magny, M., Zumbühl, H.J., 2005. Glacier and lake-level variations in west-central Europe over the last 3500 years. The Holocene 15, 789–801. https://doi.org/10.1191/0959683605hl853ra
Holzhauser, H., Zumbühl, H.J., 1996. To the history of the Lower Grindelwald Glacier during the last 2800 years-paleosols, fossil wood and historical pictorial records-new results. Zeitschrift fur Geomorphol. Suppl. 95–127.
Höppner, B., Bartelheim, M., Huijsman, M., Krauss, R., Martinek, K.-P., Pernicka, E., Schwab, R., 2005. Prehistoric copper production in the Inn Valley (Austria), and the earliest copper in
175 References
Cental Europe. Archaeometry 47, 293–315. https://doi.org/10.1111/j.1475-4754.2005.00203.x
Hormes, A., Müller, B.U., Schlüchter, C., 2001. The Alps with little ice: Evidence for eight holocene phases of reduced glacier extent in the Central Swiss Alps. Holocene 11, 255–265. https://doi.org/10.1191/095968301675275728
Hua, Q., 2009. Radiocarbon: a chronological tool for the recent past. Quat. Geochronol. 4, 378–390.
Hubmann, G., 1994. Palynologische Untersuchunger zweier Sedimentprofile aus dem Oberen Inntal, mit Augenmerk auf die anthropogene Beeinflussung (Diploma Thesis). University of Innsbruck.
Huttunen, A., Tolonen, K., 2006. Mire development history in Finland. Finl. L. mires.(Finnish Environ. 23) 79–88.
Iglesias, A., Lopez, R., Fiol, S., Antelo, J.M., Arce, F., 2003. Analysis of copper and calcium–fulvic acid complexation and competition effects. Water Res. 37, 3749–3755.
Ilyashuk, E.A., Koinig, K.A., Heiri, O., Ilyashuk, B.P., Psenner, R., 2011. Holocene temperature variations at a high-altitude site in the Eastern Alps: a chironomid record from Schwarzsee ob Sölden, Austria. Quat. Sci. Rev. 30, 176–191.
Impellitteri, C.A., Lu, Y., Saxe, J.K., Allen, H.E., Peijnenburg, W.J.G.M., 2002. Correlation of the partitioning of dissolved organic matter fractions with the desorption of Cd, Cu, Ni, Pb and Zn from 18 Dutch soils. Environ. Int. 28, 401–410.
Ivy-Ochs, S., Kerschner, H., Kubik, P.W., Schlüchter, C., 2006. Glacier response in the European Alps to Heinrich Event 1 cooling: the Gschnitz stadial. J. Quat. Sci. 21, 115–130. https://doi.org/10.1002/jqs.955
Ivy-Ochs, S., Kerschner, H., Maisch, M., Christl, M., Kubik, P.W., Schlüchter, C., 2009. Latest Pleistocene and Holocene glacier variations in the European Alps. Quat. Sci. Rev. 28, 2137–2149. https://doi.org/10.1016/j.quascirev.2009.03.009
Jacomet, S., 2009. Plant economy and village life in Neolithic lake dwellings at the time of the Alpine Iceman. Veg. Hist. Archaeobot. 18, 47–59. https://doi.org/10.1007/s00334-007-0138-2
Jacot-Guillarmod, C., Leuzinger, R., Bureau, S.E.T., (Wien), K.-K.M.-G.I., 1896. Samnaun. Topogr. Atlas der Schweiz [Kartenmaterial] 417,1896, Topographischer Atlas der Schweiz [Kartenmaterial] 417,1896.
Joerin, U.E., Nicolussi, K., Fischer, A., Stocker, T.F., Schlüchter, C., 2008. Holocene optimum events inferred from subglacial sediments at Tschierva Glacier, Eastern Swiss Alps. Quat. Sci. Rev. 27, 337–350. https://doi.org/10.1016/j.quascirev.2007.10.016
Joerin, U.E., Stocker, T.F., Schlüchter, C., 2006. Multicentury glacier fluctuations in the Swiss Alps during the Holocene. Holocene 16, 697–704. https://doi.org/10.1191/0959683606hl964rp
Johnston, C.A., 1991. Sediment and nutrient retention by freshwater wetlands: effects on surface water quality. Crit. Rev. Environ. Sci. Technol. 21, 491–565.
Jones, J.M., Hao, J., 1993. Ombrotrophic peat as a medium for historical monitoring of heavy metal pollution. Environ. Geochem. Health 15, 67–74. https://doi.org/10.1007/BF02627824
176 References
Jowsey, P.C., 1966. an Improved Peat Sampler. New Phytol. 65, 245–248. https://doi.org/10.1111/j.1469-8137.1966.tb06356.x
Kadlec, R.H., 1997. An autobiotic wetland phosphorus model. Ecol. Eng. 8, 145–172.
Kaiser, R., 2010. Das römische Erbe und das Merowingerreich, Enzyklopädie deutscher Geschichte. De Gruyter.
Kalnicky, D.J., Singhvi, R., 2001. Field portable XRF analysis of environmental samples. J. Hazard. Mater. 83, 93–122. https://doi.org/10.1016/S0304-3894(00)00330-7
Kappelmeyer, T., 2014. 7500 Jahre lokale und regionale Floren3 und Vegetationsentwicklung im Umkreis des Unteren Butterwiesenmoores (Fimbertal, Kanton Graubünden, Schweiz) im archäologischen und paläoklimatologischen Kontext. Leopold Franzens Universität Innsbruck.
Kapustová, V., Pánek, T., Hradecký, J., Zernitskaya, V., Hutchinson, S.M., Mulková, M., Sedláček, J., Bajer, V., 2018. Peat bog and alluvial deposits reveal land degradation during 16th‐and 17th‐century colonisation of the Western Carpathians (Czech Republic). L. Degrad. Dev. 29, 894–906. https://doi.org/10.1002/ldr.2909
Kata, B., 1995. Das Allgäu in Mittelalter und früher Neuzeit. Spätmittelalterliche und neuzeitliche Glashütten im Allgäu, in: Czysz, W., Dietrich, H., Weber, G. (Eds.), Kempten Und Das Allgäu. Führer Zu Archäologischen Denkmälern in Deutschland 30. Theiss, Stuttgart, pp. 95–98.
Kathrein, Y., 2012. Die Namen in der Silvretta, in: Reitmaier, T. (Ed.), Letzte Jäger, Erste Hirten - Hochalpine Archäologie in Der Silvretta. Archäologischer Dienst Graubünden, Chur, pp. 101–110.
Kempter, H., Görres, M., Frenzel, B., 1997. Ti and Pb concentrations in rainwater-fed bogs in Europe as indicators of past anthropogenic activities. Water. Air. Soil Pollut. 100, 367–377.
Kerndorff, H., Schnitzer, M., 1980. Sorption of metals on humic acid. Geochim. Cosmochim. Acta 44, 1701–1708.
Kerschner, H., Hertl, A., Gross, G., Ivy-Ochs, S., Kubik, P.W., 2006. Surface exposure dating of moraines in the Kromer valley (Silvretta Mountains, Austria)-evidence for glacial response to the 8.2 ka event in the Eastern Alps? The Holocene 16, 7–15. https://doi.org/10.1196/0959683606hl902rp
Kilian, R., Hohner, M., Biester, H., Wallrabe-Adams, H.J., Stern, C.R., 2003. Holocene peat and lake sediment tephra record from the southernmost Chilean Andes (53-55 S). Rev. Geol. Chile 30, 23–37.
Kinniburgh, D.G., van Riemsdijk, W.H., Koopal, L.K., Borkovec, M., Benedetti, M.F., Avena, M.J., 1999. Ion binding to natural organic matter: competition, heterogeneity, stoichiometry and thermodynamic consistency. Colloids Surfaces A Physicochem. Eng. Asp. 151, 147–166.
Kivinen, E., Pakarinen, P., 1981. Geographical distribution of peat resources and major peatland complex types in the world. Suomalainen tiedeakatemia.
Klaminder, J., Renberg, I., Bindler, R., Emteryd, O., 2003. Isotopic trends and background fluxes of atmospheric lead in northern Europe: analyses of three ombrotrophic bogs from south Sweden. Global Biogeochem. Cycles 17.
Klavins, M., Silamikele, I., Nikodemus, O., Kalnina, L., Kuske, E., Rodinov, V., Purmalis, O., 2009.
177 References
Peat properties, major and trace element accumulation in bog peat in Latvia. Baltica 22, 37–49.
Koinig, K., Shotyk, W., Lotter, A., Ohlendorf, C., 2003. 9000 Years of Geochemical Evolution of Lithogenic Major and Trace Elements in the Sediment of an alpine lake – the role of climate, vegetation, and land- use history. J. Paleolimnol. 4, 307–320. https://doi.org/10.1023/a:1026080712312
Koppisch, D., 2012. Torfbildung, in: Joosten, H., Succow, M. (Eds.), Landschaftsökologische Moorkunde. Schweizerbart Science Publishers, Stuttgart, Germany, pp. 9–17.
Koster, E.A., Favier, T., 2005. Peatlands, Past and Present, in: Koster, E.A. (Ed.), The Physical Geography of Western Europe, Oxford Regional Environments. OUP Oxford, pp. 161–182.
Kothieringer, K., Walser, C., Dietre, B., Reitmaier, T., Haas, J.N., Lambers, K., 2015. High impact: early pastoralism and environmental change during the Neolithic and Bronze Age in the Silvretta Alps (Switzerland/Austria) as evidenced by archaeological, palaeoecological and pedological proxies. Zeitschrift für Geomorphol. Suppl. Issues 59, 177–198.
Krachler, M., Mohl, C., Emons, H., Shotyk, W., 2003. Two thousand years of atmospheric rare earth element (REE) deposition as revealed by an ombrotrophic peat bog profile, Jura Mountains, Switzerland. J. Environ. Monit. 5, 111–121. https://doi.org/10.1039/b208355h
Krachler, M., Mohl, C., Emons, H., Shotyk, W., 2002. Analytical procedures for the determination of selected trace elements in peat and plant samples by inductively coupled plasma mass spectrometry. Spectrochim. Acta - Part B At. Spectrosc. 57, 1277–1289. https://doi.org/10.1016/S0584-8547(02)00068-X
Kralj, P., Veber, M., 2003. Investigations into nonspectroscopic effects of organic compounds in inductively coupled plasma mass spectrometry. Acta Chim. Slov. 50, 633–644.
Krause, R., 2007. The prehistoric settlement of the inneralpine valley of Montafon in Vorarlberg (Austria). Preist. Alp. 12, 119–136.
Krause, R., 1987. Early tin and copper metallurgy in south-western Germany at the beginning of the Early Bronze Age, in: Old World Archaeometallurgy: Proceedings of the International Symposium “Old World Archaeometallurgy,” Heidelberg. pp. 25–32.
Krefeld, T., Klausmann, H., 1986. Romanische und rätoromanische Reliktwörter im Arlberggebiet, in: Holtus, G., Ringger, K. (Eds.), RAETIA ANTIQUA ET MODERNA, W. Theodor Elwert Zum 80. Geburtstag. Max Niemeyer Verlag, Tübingen, pp. 121–146.
Kutschera, W., Patzelt, G., Wild, E.M., Haas-Jettmar, B., Kofler, W., Lippert, A., Oeggl, K., Pak, E., Priller, A., Steier, P., Wahlmüller-Oeggl, N., Zanesco, A., 2014. Evidence for Early Human Presence at High Altitudes in the Ötztal Alps (Austria/Italy). Radiocarbon 56, 923–947. https://doi.org/10.2458/56.17919
Kylander, M.E., Muller, J., Wüst, R.A.J., Gallagher, K., Garcia-Sanchez, R., Coles, B.J., Weiss, D.J., 2007. Rare earth element and Pb isotope variations in a 52 kyr peat core from Lynch’s Crater (NE Queensland, Australia): Proxy development and application to paleoclimate in the Southern Hemisphere. Geochim. Cosmochim. Acta 71, 942–960. https://doi.org/10.1016/j.gca.2006.10.018
Le Roux, G., Aubert, D., Stille, P., Krachler, M., Kober, B., Cheburkin, A., Bonani, G., Shotyk, W., 2005. Recent atmospheric Pb deposition at a rural site in southern Germany assessed using a peat core and snowpack, and comparison with other archives. Atmos. Environ. 39, 6790–6801. https://doi.org/10.1016/j.atmosenv.2005.07.026
178 References
Le Roux, G., De Vleeschouwer, F., 2010. Preparation of peat samples for inorganic geochemistry used as palaeoenvironmental proxies. Mires Peat 7, 1–9.
Le Roux, G., Weiss, D., Grattan, J., Givelet, N., Krachler, M., Cheburkin, A., Rausch, N., Kober, B., Shotyk, W., 2004. Identifying the sources and timing of ancient and medieval atmospheric lead pollution in England using a peat profile from Lindow bog, Manchester. J. Environ. Monit. 6, 502–510. https://doi.org/10.1039/B401500B
Leitner, W., 2015. Jägerische Archäologie im Hochgebirge, in: Stöllner, T., Oeggl, K. (Eds.), Bergauf Bergab. 10.000 Jahre Bergbau in Den Ostalpen. Deutsches Bergbau-Museum Bochum, Bochum, pp. 53–57.
Leitner, W., 2007. Der Weg der Feuersteine . Spuren zum ältesten Bergwerk Europas | Online- Artikel. Walserheimat 81, 6–7.
Leitner, W., 2003. Der Felsüberhang auf der Schneiderkürenalpe - Ein Jäger- und Hirtenlager der Vorzeit. Bergschau 1–32.
Leitner, W., Bachnetzer, T., Staudt, M., 2011. Die Anfänge des Abbaus mineralischer Rohstoffe in der Steinzeit, in: Goldenberg, G., Töchterle, U., Oeggl, K., Krenn-Leeb, A. (Eds.), Archäologie Österreichs Spezial. Forschungsprogramm HiMAT. Neues Zur Bergbaugeschichte Der Ostalpen. Wien, pp. 19–29.
Lichtenberger, E., 1965. Das Bergbauernproblem in den Österreichischen Alpen Perioden und Typen der Entsiedlung (The Problem of Mountain Farming in the Austrian Alps). Erdkunde 19, 39–57.
Liese-Kleiber, H., 1993. Settlement and landscape history at the Federsee, south-west Germany, as reflected in pollen diagrams. Veg. Hist. Archaeobot. 2, 37–46. https://doi.org/10.1007/BF00191704
Limpens, J., Berendse, F., Blodau, C., Canadell, J.G., Freeman, C., Holden, J., Roulet, N., Rydin, H., Schaepman-Strub, G., 2008. Peatlands and the carbon cycle: from local processes to global implications-a synthesis. Biogeosciences 5, 1475–1491.
Liritzis, I., Zacharias, N., 2011. Portable XRF of archaeological artifacts: current research, potentials and limitations, in: X-Ray Fluorescence Spectrometry (XRF) in Geoarchaeology. Springer, pp. 109–142.
Livingstone, D.A., 1955. A lightweight piston sampler for lake deposits. Ecology 36, 137–139.
Lomas-Clarke, S.H., Barber, K.E., 2007. Human impact signals from peat bogs–a combined palynological and geochemical approach. Veg. Hist. Archaeobot. 16, 419–429.
Longman, J., Veres, D., Wennrich, V., 2018. Utilisation of XRF core scanning on peat and other highly organic sediments. Quat. Int. 0–1. https://doi.org/10.1016/j.quaint.2018.10.015
Loveluck, C.P., McCormick, M., Spaulding, N.E., Clifford, H., Handley, M.J., Hartman, L., Hoffmann, H., Korotkikh, E. V, Kurbatov, A. V, More, A.F., Sneed, S.B., Mayewski, P.A., 2018. Alpine ice-core evidence for the transformation of the European monetary system, AD 640–670. Antiquity 1–15. https://doi.org/10.15184/aqy.2018.110
Lowe, L.E., Bustin, R.M., 1985. Distribution of sulphur forms in six facies of peats of the Fraser River Delta. Can. J. Soil Sci. 65, 531–541.
Löwemark, L., Chen, H.F., Yang, T.N., Kylander, M., Yu, E.F., Hsu, Y.W., Lee, T.Q., Song, S.R., Jarvis, S., 2011. Normalizing XRF-scanner data: A cautionary note on the interpretation of high-resolution records from organic-rich lakes. J. Asian Earth Sci. 40, 1250–1256. https://doi.org/10.1016/j.jseaes.2010.06.002
179 References
Lutz, J., Pernicka, E., 2013. Prehistoric copper from the Eastern Alps. Open J. Archaeom. 1, 25. https://doi.org/10.4081/arc.2013.e25
Lutz, J., Schwab, R., 2015. Eisenzeitliche Nutzung alpiner Kupferlagerstätten, in: Stöllner, T., Oeggl, K. (Eds.), Bergauf Bergab. 10.000 Jahre Bergbau in Den Ostalpen. Deutsches Bergbau-Museum Bochum, Bochum, pp. 113–116.
Ma, W., Tobin, J.M., 2004. Determination and modelling of effects of pH on peat biosorption of chromium, copper and cadmium. Biochem. Eng. J. 18, 33–40.
Ma, W., Tobin, J.M., 2003. Development of multimetal binding model and application to binary metal biosorption onto peat biomass. Water Res. 37, 3967–3977.
Mackensen, M., 1995. Die spätrömische Grenze im Gebiet von Cambidano-Kempten, in: Czysz, W., Dietrich, H., Weber, G. (Eds.), Kempten Und Das Allgäu. Führer Zu Archäologischen Denkmälern in Deutschland 30. Theiss, Stuttgart, pp. 61–69.
Magny, M., Galop, D., Bellintani, P., Desmet, M., Didier, J., Haas, J.N., Martinelli, N., Pedrotti, A., Scandolari, R., Stock, A., Vannière, B., 2009. Late-Holocene climatic variability south of the Alps as recorded by lake-level fluctuations at Lake Ledro, Trentino, Italy. Holocene 19, 575–589. https://doi.org/10.1177/0959683609104032
Maltby, E., Proctor, M.C.F., 1996. Peatlands: their nature and role in the biosphere.
Mann, M.E., 2002. Medieval Climatic Optimum. Encycl. Glob. Environ. Chang. 1, 514–516.
Mansel, K., 1989. Ein latènezeitlicher Schlüssel mit Stierplastik aus Sonthofen im Allgäu. Germania 67, 572–587.
Mariet, A.-L., Bégeot, C., Gimbert, F., Gauthier, J., Fluck, P., Walter-Simonnet, A.-V., 2016. Past mining activities in the Vosges Mountains (eastern France): Impact on vegetation and metal contamination over the past millennium. The Holocene 26, 1225–1236. https://doi.org/10.1177/0959683616638419
Martínez Cortizas, A., López-Merino, L., Bindler, R., Mighall, T., Kylander, M.E., 2016. Early atmospheric metal pollution provides evidence for Chalcolithic/Bronze Age mining and metallurgy in Southwestern Europe. Sci. Total Environ. 545–546, 398–406. https://doi.org/10.1016/j.scitotenv.2015.12.078
Marx, S.K., Rashid, S., Stromsoe, N., 2016. Global-scale patterns in anthropogenic Pb contamination reconstructed from natural archives. Environ. Pollut. 213, 283–298.
Matthews, J.A., Berrisford, M.S., Quentin Dresser, P., Nesje, A., Olaf Dahl, S., Elisabeth Bjune, A., Bakke, J., John, H., Birks, B., Lie, Ø., Dumayne-Peaty, L., Barnett, C., 2005. Holocene glacier history of Bjørnbreen and climatic reconstruction in central Jotunheimen, Norway, based on proximal glaciofluvial stream-bank mires. Quat. Sci. Rev. 24, 67–90. https://doi.org/10.1016/j.quascirev.2004.07.003
Matthews, J.A., Briffa, K.R., 2005. The “Little Ice Age”: Re-evaluation of an evolving concept. Geogr. Ann. Ser. A Phys. Geogr. 87, 17–36. https://doi.org/10.1111/j.0435-3676.2005.00242.x
McClymont, E., Pendall, E., Nichols, J.E., 2010. Stable isotopes and organic geochemistry in peat: Tools to investigate past hydrology, temperature and biogeochemistry. PAGES news 18, 15–18. https://doi.org/10.1002/jqs.1295.Mitchell
McEvedy, C., Jones, R., 1978. Atlas of world population history. Penguin Books Ltd, Harmondsworth, Middlesex, England.
180 References
McLennan, S.M., 2001. Relationships between the trace element composition of sedimentary rocks and upper continental crust. Geochemistry, Geophys. Geosystems 2. https://doi.org/10.1029/2000GC000109
Mejía-Piña, K.G., Huerta-Diaz, M.A., González-Yajimovich, O., 2016. Calibration of handheld X-ray fluorescence (XRF) equipment for optimum determination of elemental concentrations in sediment samples. Talanta 161, 359–367. https://doi.org/10.1016/j.talanta.2016.08.066
Merbeler, J., 1995. Erzbergbau und Verhüttung im Starzlachtal, in: Czysz, W., Dietrich, H., Weber, G. (Eds.), Kempten Und Das Allgäu. Führer Zu Archäologischen Denkmälern in Deutschland 30. Theiss, Stuttgart, pp. 149–152.
Mighall, T.M., Grattan, J.P., Timberlake, S., Lees, J.A., Forsyth, S., 2002. An atmospheric pollution history for lead–zinc mining from the Ystwyth Valley, Dyfed, mid-Wales, UK as recorded by an upland blanket peat. Geochemistry Explor. Environ. Anal. 2, 175–184.
Mighall, T.M., Timberlake, S., Foster, I.D.L., Krupp, E., Singh, S., 2009. Ancient copper and lead pollution records from a raised bog complex in Central Wales, UK. J. Archaeol. Sci. 36, 1504–1515. https://doi.org/10.1016/j.jas.2009.03.005
Mingram, J., Negendank, J.F.W., Brauer, A., Berger, D., Hendrich, A., Köhler, M., Usinger, H., 2007. Long cores from small lakes - Recovering up to 100 m-long lake sediment sequences with a high-precision rod-operated piston corer (Usinger-corer). J. Paleolimnol. 37, 517–528. https://doi.org/10.1007/s10933-006-9035-4
Moe, D., Fedele, F.G., Maude, A.E., Kvamme, M., 2007. Vegetational changes and human presence in the low-alpine and subalpine zone in Val Febbraro, upper Valle di Spluga (Italian central Alps), from the Neolithic to the Roman period. Veg. Hist. Archaeobot. 16, 431–451. https://doi.org/10.1007/s00334-006-0088-0
Monna, F., Petit, C., Guillaumet, J.-P., Jouffroy-Bapicot, I., Blanchot, C., Dominik, J., Losno, R., Richard, H., Lévêque, J., Chateau, C., 2004. History and Environmental Impact of Mining Activity in Celtic Aeduan Territory Recorded in a Peat Bog (Morvan, France). Environ. Sci. Technol. 38, 665–673. https://doi.org/10.1021/es034704v
Moore, P., Webb, J., Collinson, M., 1991. Pollen Analysis. Blackwell Scientific Publications Ltd, Oxford.
Moore, P D, 2013. European Mires, in: Moore, Peter D. (Ed.), . Academic Press, pp. 1–10. https://doi.org/10.1016/C2013-0-11194-4
Moran, A.P., Kerschner, H., Ochs, S.I., 2015. Redating the moraines in the Kromer Valley (Silvretta Mountains) – New evidence for an early Holocene glacier advance. Holocene 26, 655–664. https://doi.org/10.1177/0959683615612571
Muller, J., Kylander, M., Martinez-cortizas, A., Wu, R.A.J., Weiss, D., Blake, K., Coles, B., Garcia-sanchez, R., 2008. The use of principle component analyses in characterising trace and major elemental distribution in a 55 kyr peat deposit in tropical Australia : Implications to paleoclimate 72, 449–463. https://doi.org/10.1016/j.gca.2007.09.028
Naturpark Kaunergrat, 2000. Naturwanderführer durch die Piller Moore.
Nesbitt, H.W., Markovics, G., 1997. Weathering of granodioritic crust, long-term storage of elements in weathering profiles, and petrogenesis of siliciclastic sediments. Geochim. Cosmochim. Acta 61, 1653–1670. https://doi.org/https://doi.org/10.1016/S0016-7037(97)00031-8
181 References
Neuhauser, G., 2015. ,,Argentifodinam seu montem dictum Mùntafùne ,, - 1000 Jahre Bergbau im südlichen Vorarlberg, in: Stöllner, T., Oeggl, K. (Eds.), Bergauf Bergab. 10.000 Jahre Bergbau in Den Ostalpen. Deutsches Bergbau-Museum Bochum, Bochum, pp. 447–454.
Nicolussi Castellan, S., Tomedi, G., Lachberger, R., 2008. Das bronzezeitliche Haus von Fließ-Silberplan, in: Oeggl, K., Schaffer, V. (Eds.), Die Geschichte Des Bergbaus in Tirol Und Seinen Angrenzenden Gebieten. Proceedings Zum 3. Milestone Meeting Des SFB HiMAT. p. 2008.
Nicolussi, K., 2012. Jahrringdaten zur nacheiszeitlichen Waldverbreitung in der Silvretta, in: Reitmaier, T. (Ed.), Letzte Jäger, Erste Hirten - Hochalpine Archäologie in Der Silvretta. Archäologischer Dienst Graubünden, Chur, pp. 87–98.
Nicolussi, K., Kaufmann, M., Patzelt, G., Van Der Plicht, J., Thurner, A., 2005. Holocene tree-line variability in the Kauner Valley, Central Eastern Alps, indicated by dendrochronological analysis of living trees and subfossil logs. Veg. Hist. Archaeobot. 14, 221–234. https://doi.org/10.1007/s00334-005-0013-y
Nicolussi, K., Patzelt, G., 2000. Untersuchungen zur holozänen Gletscherentwicklung von Pasterze und Gepatschferner (Ostalpen). Zeitschrift für Gletscherkd. und Glazialgeol. 36, 1–87.
Nicolussi, K., Schlüchter, C., 2012. The 8.2 ka event—Calendar-dated glacier response in the Alps. Geology 40, 819–822.
Niedermayr, G., Auer, C., Berger, A., Bernhard, F., Bojar, H.-P., BRANDSTÄTTER, F., Fink, R., Hollerer, C.E., Kolitsch, U., MÖRTL, J., Postl, W., Prasnik, H., Schabereiter, H., Schillhammer, H., Steinwender, C., Strobl, M., Walter, F., Taucher, J., 2014. Neue Mineralfunde aus Österreich LXIII. Carinthia II 204, 65–146.
Nieminen, T.M., Ukonmaanaho, L., Shotyk, W., 2002. Enrichment of Cu, Ni, Zn, Pb and As in an ombrotrophic peat bog near a Cu-Ni smelter in Southwest Finland. Sci. Total Environ. 292, 81–89.
Novák, M., Adamová, M., Wieder, R.K., Bottrell, S.H., 2005. Sulfur mobility in peat. Appl. Geochemistry 20, 673–681. https://doi.org/10.1016/j.apgeochem.2004.11.009
Novak, M., Zemanova, L., Voldrichova, P., Stepanova, M., Adamova, M., Pacherova, P., Komarek, A., Krachler, M., Prechova, E., 2011. Experimental evidence for mobility/immobility of metals in peat. Environ. Sci. Technol. 45, 7180–7187. https://doi.org/10.1021/es201086v
Nowotny, A., Pestal, G., Rockenschaub, M., 1993. Der geologische Bau des nördlichen Silvrettamasse und die Problematik der geologischen Stellung der Zone von Puschlin. Geol. des Oberinntaler Raumes - Schwerpkt. Blatt 144 Landeck. Arbeitstagung Geol. Bundesanstalt Österreich 55–91.
Nriagu, J.O., 1983. Lead and lead poisoning in antiquity, Lead and lead poisoning in antiquity. John Wiley, New York.
O’Brien, W., 2015. Prehistoric Copper Mining in Europe: 5500-500 BC. Oxford University Press.
Oblinger, H., 2002. Rohstoffe aus Schwabens Boden und ihre geologischen Grundlagen. Berichte des Naturwissenschaftlichen Vereins für Schwaben e.V. 106, 2–31.
Oblinger, H., 1996. Blei- und Zinkerz am Roßkopf (Ostrachtal/Allgäuer Alpen). Berichte des Naturwissenschaftlichen Vereins für Schwaben e.V. 100, 85–90.
Oeggl, K., 2015. Vegetationsgeschichte und Landnutzung, in: Stöllner, T., Oeggl, K. (Eds.),
182 References
Bergauf Bergab. 10.000 Jahre Bergbau in Den Ostalpen. Deutsches Bergbau-Museum Bochum, Bochum, pp. 43–49.
Oeggl, K., Nicolussi, K., 2009. Prähistorische Besiedlung von zentralen Alpentälern in Bezug zur Klimaentwicklung, in: Roland Psenner, Reinhard Lackner, A.B. (Ed.), Klimawandel in Österreich: Die Letzten 20.000 Jahre ... Und Ein Blick Voraus. innsbruck university press, pp. 77–86.
Ohlendorf, C., Wennrich, V., Enters, D., 2015. Experiences with XRF-scanning of long sediment records, in: Croudace, I.W., Rothwell, R.G. (Eds.), Micro-XRF Studies of Sediment Cores: Applications of a Non-Destructive Tool for the Environmental Sciences (Developments in Paleoenvironmental Research). Springer, pp. 351–372.
Pacyna, J.M., Pacyna, E.G., 2001. An assessment of global and regional emissions of trace metals to the atmosphere from anthropogenic sources worldwide. Environ. Rev. 9, 269–298. https://doi.org/10.1139/er-9-4-269
Page, S.E., Baird, A.J., 2016. Peatlands and global change: response and resilience. Annu. Rev. Environ. Resour. 41, 35–57. https://doi.org/10.1146/annurev-environ-110615-085520
Page, S.E., Siegert, F., Rieley, J.O., Boehm, H.-D. V, Jaya, A., Limin, S., 2002. The amount of carbon released from peat and forest fires in Indonesia during 1997. Nature 420, 61.
Päivänen, J., Vasander, H., 1994. Carbon balance in mire ecosystems, in: World Resource Review. pp. 102–111.
Palmer, P.T., Jacobs, R., Baker, P.E., Ferguson, K., Webber, S., 2009. Use of field-portable XRF analyzers for rapid screening of toxic elements in FDA-regulated products. J. Agric. Food Chem. 57, 2605–2613.
Patzelt, G., Bortenschlager, S., 1973. 1973: Die postglazialen Gletscherund Klimaschwankungen in der Venedigergruppe (Hohe Tauern, Ostalpen). Zeitschrift für Geomorphologie Neue Folge 16, Supplement, 25-72.
Pernicka, E., Frank, C., 2015. Das Kupfer der Mondseegruppe, in: Stöllner, T., Oeggl, K. (Eds.), Bergauf Bergab. 10.000 Jahre Bergbau in Den Ostalpen. Deutsches Bergbau-Museum Bochum, Bochum, pp. 77–83.
Piotrowska, N., Blaauw, M., Mauquoy, D., Chambers, F.M., 2011. Constructing deposition chronologies for peat deposits using radiocarbon dating. Mires Peat 7, 1–14.
Piotrowska, N., De Vleeschouwer, F., Sikorski, J., Pawlyta, J., Fagel, N., Le Roux, G., Pazdur, A., 2010. Intercomparison of radiocarbon bomb pulse and 210Pb age models. A study in a peat bog core from North Poland. Nucl. Instruments Methods Phys. Res. Sect. B Beam Interact. with Mater. Atoms 268, 1163–1166.
Pöll, J., 1998. Urgeschichte und Römerzeit in Landeck, in: Baeck, P. (Ed.), Stadtbuch Landeck. Landeck, pp. 53–66.
Poto, L., Gabrieli, J., Crowhurst, S., Agostinelli, C., Spolaor, A., Cairns, W.R.L., Cozzi, G., Barbante, C., 2015. Cross calibration between XRF and ICP-MS for high spatial resolution analysis of ombrotrophic peat cores for palaeoclimatic studies. Anal. Bioanal. Chem. 407, 379–385. https://doi.org/10.1007/s00216-014-8289-3
Pott, R., Hüppe, J., Remy, D., Bauerochse, A., Katenhusen, O., 1995. Paläoökologische Untersuchungen zu holozänen Waldgrenzschwankungen im oberen Fimbertal (Val Fenga, Silvretta, Ostschweiz). Phytocoenologia 25, 363–398. https://doi.org/10.1127/phyto/25/1995/363
183 References
Prohaska, T., Hann, S., Latkoczy, C., Stingeder, G., 1999. Determination of rare earth elements U and Th in environmental samples by inductively coupled plasma double focusing sectorfield mass spectrometry (ICP-SMS). J. Anal. At. Spectrom. 14, 1–8. https://doi.org/10.1039/a806720a
R Core Team, 2017. R: A Language and Environment for Statistical Computing.
Rabassa, J., Coronato, A., Heusser, C.J., Roig Juñent, F., Borromei, A., Roig, C., Quattrocchio, M., 2006. Chapter 6 The peatlands of Argentine Tierra del Fuego as a source for paleoclimatic and paleoenvironmental information. pp. 129–144. https://doi.org/10.1016/S0928-2025(06)09006-7
Radivojević, M., Rehren, T., Pernicka, E., Šljivar, D., Brauns, M., Borić, D., 2010. On the origins of extractive metallurgy: new evidence from Europe. J. Archaeol. Sci. 37, 2775–2787.
Ravansari, R., Lemke, L.D., 2018. Portable X-ray fluorescence trace metal measurement in organic rich soils: pXRF response as a function of organic matter fraction. Geoderma 319, 175–184. https://doi.org/10.1016/j.geoderma.2018.01.011
Reimer, P.J., Bard, E., Bayliss, A., Beck, J.W., Blackwell, P.G., Ramsey, C.B., Buck, C.E., Cheng, H., Edwards, R.L., Friedrich, M., Grootes, P.M., Guilderson, T.P., Haflidason, H., Hajdas, I., Hatté, C., Heaton, T.J., Hoffmann, D.L., Hogg, A.G., Hughen, K.A., Kaiser, K.F., Kromer, B., Manning, S.W., Niu, M., Reimer, R.W., Richards, D.A., Scott, E.M., Southon, J.R., Staff, R.A., Turney, C.S.M., van der Plicht, J., 2013. IntCal13 and Marine13 Radiocarbon Age Calibration Curves 0–50,000 Years cal BP. Radiocarbon 55, 1869–1887. https://doi.org/10.2458/azu_js_rc.55.16947
Reitmaier, T., 2017. Prähistorische Alpwirtschaft. Eine archäologische Spurensuche in der Silvretta (CH/A), 2007–2016., in: Archäologie Schweiz 100. Archäologie Schweiz, Basel, pp. 7–53.
Reitmaier, T., 2012. Letzte Jäger, erste Hirten, in: Reitmaier, T. (Ed.), Letzte Jäger, Erste Hirten - Hochalpine Archäologie in Der Silvretta. Archäologischer Dienst Graubünden, Chur, pp. 9–65.
Reitmaier, T., Doppler, T., Pike, A.W.G., Deschler-Erb, S., Hajdas, I., Walser, C., Gerling, C., 2018. Alpine cattle management during the Bronze Age at Ramosch-Mottata, Switzerland. Quat. Int. 484, 19–31. https://doi.org/10.1016/j.quaint.2017.02.007
Reitmaier, T., Lambers, K., Walser, C., Zingman, I., Haas, J.N., Dietre, B., Reidl, D., Hajdas, I., Nicolussi, K., Kathrein, Y., 2013. Alpine Archäologie in der Silvretta. Archäologie Schweiz 36, 4–15.
Remy, D., 2012. Waldgrenze und Waldgrenzschwankungen in der Silvretta / Zentralalpen - Funde von Pinus cembra oberhalb der potentiellen Waldgrenze im Oberen Fimbertal. Berichte der Reinhold-Tüxen Gesellschaft e.V. 24, 61–75.
Revelle, R., Suess, H.E., 1957. Carbon dioxide exchange between atmosphere and ocean and the question of an increase of atmospheric CO2 during the past decades. Tellus 9, 18–27.
Richter, T.O., van der Gaast, S., Koster, B., Vaars, A., Gieles, R., de Stigter, H.C., De Haas, H., van Weering, T.C.E., 2006. The Avaatech XRF Core Scanner: technical description and applications to NE Atlantic sediments. Geol. Soc. London, Spec. Publ. 267, 39–50. https://doi.org/10.1144/GSL.SP.2006.267.01.03
Ringqvist, L., Öborn, I., 2002. Copper and zinc adsorption onto poorly humified Sphagnum and Carex peat. Water Res. 36, 2233–2242. https://doi.org/10.1016/S0043-1354(01)00431-6
184 References
Roepke, A., Krause, R., 2013. High montane-subalpine soils in the Montafon Valley (Austria, northern Alps) and their link to land-use, fire and settlement history. Quat. Int. 308–309, 178–189. https://doi.org/10.1016/j.quaint.2013.01.022
Roepke, A., Stobbe, A., Oeggl, K., Kalis, A.J., Tinner, W., 2011. Late-Holocene land-use history and environmental changes at the high altitudes of St Antönien (Switzerland, Northern Alps): Combined evidence from pollen, soil and tree-ring analyses. The Holocene 21, 485–498. https://doi.org/10.1177/0959683610385727
Rogora, M., Mosello, R., Arisci, S., Brizzio, M.C., Barbieri, A., Balestrini, R., Waldner, P., Schmitt, M., Stähli, M., Thimonier, A., Kalina, M., Puxbaum, H., Nickus, U., Ulrich, E., Probst, A., 2006. An Overview of Atmospheric Deposition Chemistry over the Alps: Present Status and Long-term Trends. Hydrobiologia 562, 17–40. https://doi.org/10.1007/s10750-005-1803-z
Rohling, E.J., Pälike, H., 2005. Centennial-scale climate cooling with a sudden cold event around 8,200 years ago. Nature 434, 975.
Rösch, M., 1996. Archäobotanische Untersuchungen in der spätbronzezeitlichen Ufersiedlung Hagnau-Burg (Bodenseekreis), Siedlungsarchäologie im Alpenvorland IV. Die Spätbronzezeit am nordwestlichen Bodensee Taucharchäologische Untersuchungen in Hagnau und Unteruhldingen 1982-1989. Theiss, Stuttgart.
Rösch, M., 1993. Prehistoric land use as recorded in a lake-shore core at Lake Constance. Veg. Hist. Archaeobot. 2, 213–232. https://doi.org/10.1007/BF00198163
Rösch, M., 1992. Human impact as registered in the pollen record: some results from the western Lake Constance region, Southern Germany. Veg. Hist. Archaeobot. 1, 101–109. https://doi.org/10.1007/BF00206090
Rothwell, J.J., Evans, M.G., Liddaman, L.C., Allott, T.E.H., 2007. The role of wildfire and gully erosion in particulate Pb export from contaminated peatland catchments in the southern Pennines, U.K. Geomorphology 88, 276–284. https://doi.org/10.1016/j.geomorph.2006.11.011
Rothwell, J.J., Taylor, K.G., Ander, E.L., Evans, M.G., Daniels, S.M., Allott, T.E.H., 2009. Arsenic retention and release in ombrotrophic peatlands. Sci. Total Environ. 407, 1405–1417. https://doi.org/10.1016/j.scitotenv.2008.10.015
Rothwell, J.J., Taylor, K.G., Chenery, S.R.N., Cundy, A.B., Evans, M.G., Allott, T.E.H., 2010. Storage and behavior of As, Sb, Pb, and Cu in ombrotrophic peat bogs under contrasting water table conditions. Environ. Sci. Technol. 44, 8497–8502. https://doi.org/10.1021/es101150w
Rothwell, J.J., Taylor, K.G., Evans, M.G., Allott, T.E.H., 2011. Contrasting controls on arsenic and lead budgets for a degraded peatland catchment in Northern England. Environ. Pollut. 159, 3129–3133. https://doi.org/10.1016/j.envpol.2011.05.026
Rougier, H., Sanguin, A.-L., 1981. Deux zones franches au cœur des Alpes Centrales: Livigno et Samnaun. Rev. géographie Alp. 69, 543–560.
Røyset, J., Ryum, N., 2005. Scandium in aluminium alloys. Int. Mater. Rev. 50, 19–44. https://doi.org/10.1179/174328005X14311
Rubel, F., Brugger, K., Haslinger, K., Auer, I., 2017. The climate of the European Alps: Shift of very high resolution Köppen-Geiger climate zones 1800-2100. Meteorol. Zeitschrift 26, 115–125. https://doi.org/10.1127/metz/2016/0816
185 References
Sahraoui, H., Hachicha, M., 2017. Effect of soil moisture on trace elements concentrations using portable x-ray fluorescence spectrometer. J. Fundam. Appl. Sci. 9, 468–484.
Sapkota, A., Cheburkin, A.K., Bonani, G., Shotyk, W., 2007. Six millennia of atmospheric dust deposition in southern South America (Isla Navarino, Chile). The Holocene 17, 561–572.
Sapkota, A., Krachler, M., Scholz, C., Cheburkin, A.K., Shotyk, W., 2005. Analytical procedures for the determination of selected major (Al, Ca, Fe, K, Mg, Na, and Ti) and trace (Li, Mn, Sr, and Zn) elements in peat and plant samples using inductively coupled plasma-optical emission spectrometry. Anal. Chim. Acta 540, 247–256. https://doi.org/10.1016/j.aca.2005.03.008
Schach, C., Minsinger, S., 1849. Geognostische Karte Tirols 1:115.200.
Schellekens, J., Bindler, R., Martínez-Cortizas, A., McClymont, E.L., Abbott, G.D., Biester, H., Pontevedra-Pombal, X., Buurman, P., 2015. Preferential degradation of polyphenols from Sphagnum–4-Isopropenylphenol as a proxy for past hydrological conditions in Sphagnum-dominated peat. Geochim. Cosmochim. Acta 150, 74–89.
Schlüchter, C., Jörin, U., 2004. Holz-und Torffunde als Klimaindikatoren. Alpen ohne Gletscher? Die Alpen 80, 34–47.
Schmidl, A., Oeggl, K., 2005a. Land Use in the Eastern Alps During the Bronze Age — an Archaeobotanical Case Study of a Hilltop Settlement in the Montafon (Western Austria) 2, 455–470.
Schmidl, A., Oeggl, K., 2005b. Subsistence strategies of two Bronze Age hill-top settlements in the eastern Alps—Friaga/Bartholomäberg (Vorarlberg, Austria) and Ganglegg/Schluderns (South Tyrol, Italy). Veg. Hist. Archaeobot. 14, 303–312. https://doi.org/10.1007/s00334-005-0088-5
Schmidt-Thomé, P., 1960. Zur Geologie und Morphologie des Ifengebirgsstockes (Allgäu): Erläuterungen zur topographisch-morphologischen Kartenprobe VI 3: Alpiner Karst und Bergsturz (On the Geology and Morphology of the Hohe Ifen). Erdkunde 14, 181–195.
Schmidt, R., Koinig, K.A., Thompson, R., Kamenik, C., 2002. A multi proxy core study of the last 7000 years of climate and alpine land-use impacts on an Austrian mountain lake (Unterer Landschitzsee, Niedere Tauern). Palaeogeogr. Palaeoclimatol. Palaeoecol. 187, 101–120.
Schneeberger, N., Bürgi, M., Hersperger, A.M., Ewald, K.C., 2007a. Driving forces and rates of landscape change as a promising combination for landscape change research—An application on the northern fringe of the Swiss Alps. Land use policy 24, 349–361. https://doi.org/10.1016/j.landusepol.2006.04.003
Schneeberger, N., Bürgi, M., Kienast, P.D.F., 2007b. Rates of landscape change at the northern fringe of the Swiss Alps: Historical and recent tendencies. Landsc. Urban Plan. 80, 127–136. https://doi.org/10.1016/j.landurbplan.2006.06.006
Schofield, J.E., Edwards, K.J., Mighall, T.M., Martínez Cortizas, A., Rodríguez-Racedo, J., Cook, G., 2010. An integrated geochemical and palynological study of human impacts, soil erosion and storminess from southern Greenland since c. AD 1000. Palaeogeogr. Palaeoclimatol. Palaeoecol. 295, 19–30. https://doi.org/10.1016/j.palaeo.2010.05.011
Schönberger, H., 1969. The Roman frontier in Germany: an archaeological survey. J. Rom. Stud. 59, 144–197. https://doi.org/10.2307/299853
Schrautzer, J., Bork, H.-R., Christ, L., El-Balti, N., Martens, T., Kempke, M., von Scheffer, C., Unkel, I., n.d. Classification, ecological characterization and development of montane
186 References
mires. Phytocoenologia - J. Veg. Ecol.
Shakesby, R.A., Smith, J.G., Matthews, J.A., Winkler, S., Dresser, P.Q., Bakke, J., Dahl, S.-O., Lie, Ø., Nesje, A., 2007. Reconstruction of Holocene glacier history from distal sources: glaciofluvial stream-bank mires and a glaciolacustrine sediment core near Sota Sæter, Breheimen, southern Norway. The Holocene 17, 729–745. https://doi.org/10.1177/0959683607080514
Shand, C.A., Wendler, R., 2014. Portable X-ray fluorescence analysis of mineral and organic soils and the influence of organic matter. J. Geochemical Explor. 143, 31–42. https://doi.org/10.1016/j.gexplo.2014.03.005
Shaw, G., Williams, A.M., 1994. Critical issues in tourism: a geographical perspective. Blackwell Publishers.
Shotyk, W., 2002. The chronology of anthropogenic, atmospheric Pb deposition recorded by peat cores in three minerogenic peat deposits from Switzerland. Sci. Total Environ. 292, 19–31. https://doi.org/10.1016/s0048-9697(02)00030-x
Shotyk, W., 1996a. Natural and anthropogenic enrichments of As, Cu, Pb, Sb, and Zn in ombrotrophic versus minerotrophic peat bog profiles, Jura Mountains, Switzerland. Water. Air. Soil Pollut. 90, 375–405. https://doi.org/10.1007/BF00282657
Shotyk, W., 1996b. Peat bog archives of atmospheric metal deposition: geochemical evaluation of peat profiles, natural variations in metal concentrations, and metal enrichment factors. Environ. Rev. 4, 149–183. https://doi.org/10.1139/a96-010
Shotyk, W., 1988. Review of the inorganic geochemistry of peats and peatland waters. Earth Sci. Rev. 25, 95–176. https://doi.org/10.1016/0012-8252(88)90067-0
Shotyk, W., Cheburkin, A.K., Appleby, P.G., Fankhauser, A., Kramers, J.D., 1996. Two thousand years of atmospheric arsenic, antimony, and lead deposition recorded in an ombrotrophic peat bog profile, Jura Mountains, Switzerland. Earth Planet. Sci. Lett. 145, E1–E7. https://doi.org/10.1016/S0012-821X(96)00197-5
Shotyk, W., Krachler, M., 2004. Atmospheric deposition of silver and thallium since 12370 14 C years BP recorded by a Swiss peat bog profile, and comparison with lead and cadmium. J. Environ. Monit. 6, 427–433.
Shotyk, W., Krachler, M., Chen, B., 2004. Antimony in recent, ombrotrophic peat from Switzerland and Scotland: Comparison with natural background values (5,320 to 8,020 14 C yr BP) and implications for the global atmospheric Sb cycle. Global Biogeochem. Cycles 18. https://doi.org/10.1029/2003GB002113
Shotyk, W., Krachler, M., Martinez-Cortizas, A., Cheburkin, A.K., Emons, H., 2002. A peat bog record of natural, pre-anthropogenic enrichments of trace elements in atmospheric aerosols since 12 370 14 C yr BP, and their variation with Holocene climate change. Earth Planet. Sci. Lett. 199, 21–37. https://doi.org/10.1016/S0012-821X(02)00553-8
Shotyk, W., Nesbitt, H.W., Fyfe, W.S., 1992. Natural and antropogenic enrichments of trace metals in peat profiles. Int. J. Coal Geol. 20, 49–84. https://doi.org/https://doi.org/10.1016/0166-5162(92)90004-G
Shotyk, W., Weiss, D., Appleby, P.G., Cheburkin, A.K., Frei, R., Gloor, M., Kramers, J.D., Reese, S., Van der Knaap, W.O., 1998. History of atmospheric lead depostion since 12,37014C yr BP from a Peat bog, Jura Mountains, Switzerland. Science (80-. ). 281, 1635–1640. https://doi.org/10.1126/science.281.5383.1635
187 References
Shotyk, W., Weiss, D., Kramers, J.D., Frei, R., Cheburkin, A.K., Gloor, M., Reese, S., 2001. Geochemistry of the peat bog at Etang de la Gruère, Jura Mountains, Switzerland, and its record of atmospheric pb and lithogenic trace metals (Sc, Ti, Y, Zr, and REE) since 12,37014C yr bp. Geochim. Cosmochim. Acta 65, 2337–2360. https://doi.org/10.1016/S0016-7037(01)00586-5
Shuttleworth, E.L., Evans, M.G., Hutchinson, S.M., Rothwell, J.J., 2014. Assessment of lead contamination in peatlands using field portable XRF. Water. Air. Soil Pollut. 225. https://doi.org/10.1007/s11270-013-1844-2
Sigl, M., Winstrup, M., McConnell, J.R., Welten, K.C., Plunkett, G., Ludlow, F., Büntgen, U., Caffee, M., Chellman, N., Dahl-Jensen, D., 2015. Timing and climate forcing of volcanic eruptions for the past 2,500 years. Nature 523, 543. https://doi.org/10.1038/nature14565
Sjögren, P., Knaap, W.O. Van Der, Leeuwen, J.F.N. Van, Andrič, M., Grünig, a, 2007. The occurrence of an upper decomposed peat layer, or “kultureller Trockenhorizont”, in the Alps and Jura Mountains. Mires Peat 2, 1-14 ST-The occurrence of an upper decomposed p. https://doi.org/Mires and Peat, Volume 2 (2007), Article 05, http://www.mires-and-peat.net/, ISSN 1819-754X
Sjörs, H., 1980. Peat on earth: multiple use or conservation? Ambio 303–308.
Springhorn, R., 2007. Geology of the Engadine Window, especially the upper Val Fenga (East Switzerland) [Geologie des Engadiner Fensters unter besonderer Berücksichtigung des oberen Val Fenga (Ost-Schweiz)]. Zeitschrift der Dtsch. Gesellschaft für Geowissenschaften 158, 67–87. https://doi.org/10.1127/1860-1804/2007/0158-0067
State of Tyrol, 2019a. Aerial photography 2010 [WWW Document]. Laser- & Luftbildatlas Tirol. URL https://portal.tirol.gv.at/LBAWeb/luftbilduebersicht.show (accessed 2.28.19).
State of Tyrol, 2019b. digitales Geländemodell / digital elevation model [WWW Document]. TIRIS. URL https://maps.tirol.gv.at/ (accessed 9.27.18).
State of Tyrol, 2019c. Aerial photography 1974 [WWW Document]. Laser- & Luftbildatlas Tirol. URL https://portal.tirol.gv.at/LBAWeb/luftbilduebersicht.show (accessed 2.28.19).
State of Vorarlberg, 2018a. VoGIS, Vorarlberg Atlas [WWW Document]. Urmappe 1857. URL http://vogis.cnv.at/ (accessed 8.17.18).
State of Vorarlberg, 2018b. Aerial photo 1980. VoGIS.
Staudt, M., 2011. Rätisches Haus in Wenns. Fundbericihte aus Österreich 49, 144–165.
Staudt, M., Tomedi, G., 2015. Zur Besiedlungsgeschichte der Ostalpen in der Mittel-bis Spätbronzezeit: Bestand, Kolonisation und wirtschaftlicher Neuanfang in der mittleren und späten Bronzezeit in Nordtirol, in: Stöllner, T., Oeggl, K. (Eds.), Bergauf Bergab. 10.000 Jahre Bergbau in Den Ostalpen. Deutsches Bergbau-Museum Bochum, Bochum, pp. 135–144.
Steiner, G.M., 2005. Die Moorverbreitung in Österreich. Moore von Sib. bis Feuerland. Stapfia 85, 55–96.
Stetzenbach, K.J., Amano, M., Kreamer, D.K., Hodge, V.F., 1994. Testing the Limits of ICP‐MS: Determination of Trace Elements in Ground Water at the Part‐Per‐Trillion Level. Groundwater 32, 976–985.
Stivrins, N., Ozola, I., Gałka, M., Kuske, E., Alliksaar, T., Andersen, T.J., Lamentowicz, M., Wulf, S., Reitalu, T., 2017. Drivers of peat accumulation rate in a raised bog: impact of drainage,
188 References
climate, and local vegetation composition. Mires Peat 19, UNSP 08. https://doi.org/10.19189/MaP.2016.OMB.262
Stojakowits, P., 2014. Pollenanalytische Untersuchungen zur Rekonstruktion der Vegetationsgeschichte im südlichen Iller-Wertach-Jungmoränengebiet seit dem Spätglazial (PhD-Thesis). Universität Augsburg.
Stöllner, T., 2015a. Der Mitterberg als Großproduzent für Kupfer in der Bronzezeit, in: Stöllner, T., Oeggl, K. (Eds.), Bergauf Bergab. 10.000 Jahre Bergbau in Den Ostalpen. Deutsches Bergbau-Museum Bochum, Bochum, pp. 175–186.
Stöllner, T., 2015b. die alpinen Kupfererzreviere: Aspekte ihrer zeitlichen, technologischen und wirtschaftlichen Entwicklung im zweiten Jahrtausend vor christus, in: Stöllner, T., Oeggl, K. (Eds.), Bergauf Bergab. 10.000 Jahre Bergbau in Den Ostalpen. Deutsches Bergbau-Museum Bochum, Bochum, pp. 99–104.
Stöllner, T., Oeggl, K., 2015. Bergauf Bergab. 10.000 Jahre Bergbau in den Ostalpen. Deutsches Bergbau-Museum Bochum, Bochum.
Succow, M., 2012. Kurzer Abriß der Nutzungsgeschichte mitteleuropäischer Moore, in: Joosten, H.. M.S.H. (Ed.), Landschaftsökologische Moorkunde. Schweizerbart Science Publishers, Stuttgart, Germany, pp. 404–406.
Suter, P.J., Hafner, A., Glauser, K., 2005. Lenk-Schnidejoch. Funde aus dem Eis–ein vor-und frühgeschichtlicher Passübergang. Archäologie im Kant. Bern 6, 499–522.
Swindles, G.T., De Vleeschouwer, F., Plunkett, G., 2010. Dating peat profiles using tephra : stratigraphy , geochemistry and chronology 7, 1–9.
swisstopo, 2018a. GeoCover datasets V2 1:25000, Compilation, Samnau-Ischgl, nr.1179. Geocover.
swisstopo, 2018b. SWISSIMAGE Orthofoto [WWW Document]. SWISSIMAGE. URL https://map.geo.admin.ch/ (accessed 1.28.18).
Sydow, W., 1995. Der hallstattzeitliche Bronzehort von Fliess im Oberinntal, Tirol, Fundberichte aus Österreich, Materialhefte A. Berger.
Tahvanainen, T., 2011. Abrupt ombrotrophication of a boreal aapa mire triggered by hydrological disturbance in the catchment. J. Ecol. no-no. https://doi.org/10.1111/j.1365-2745.2010.01778.x
Tasser, E., Walde, J., Tappeiner, U., Teutsch, A., Noggler, W., 2007. Land-use changes and natural reforestation in the Eastern Central Alps. Agric. Ecosyst. Environ. 118, 115–129. https://doi.org/https://doi.org/10.1016/j.agee.2006.05.004
Theurillat, J.-P., Guisan, A., 2001. Potential impact of climate change on vegetation in the European Alps: a review. Clim. Change 50, 77–109.
Thevenon, F., Guédron, S., Chiaradia, M., Loizeau, J.-L., Poté, J., 2011. (Pre-) historic changes in natural and anthropogenic heavy metals deposition inferred from two contrasting Swiss Alpine lakes. Quat. Sci. Rev. 30, 224–233. https://doi.org/10.1016/j.quascirev.2010.10.013
Thomas, E.R., Wolff, E.W., Mulvaney, R., Steffensen, J.P., Johnsen, S.J., Arrowsmith, C., White, J.W.C., Vaughn, B., Popp, T., 2007. The 8.2 ka event from Greenland ice cores. Quat. Sci. Rev. 26, 70–81.
Tilly, R.H., 2010. Industrialization as an historical process [WWW Document]. Eur. Hist. Online.
189 References
URL www.ieg-ego.eu/tillyr-2010-en (accessed 1.23.19).
Tinner, W., Ammann, B., 2001. Timberline paleoecology in the Alps. Pages News 9, 9–11.
Tinner, W., Kaltenrieder, P., 2005. Rapid responses of high‐mountain vegetation to early Holocene environmental changes in the Swiss Alps. J. Ecol. 93, 936–947.
Tinner, W., Lotter, A.F., Ammann, B., Conedera, M., Hubschmid, P., Van Leeuwen, J.F.N., Wehrli, M., 2003. Climatic change and contemporaneous land-use phases north and south of the Alps 2300 BC to 800 AD. Quat. Sci. Rev. 22, 1447–1460. https://doi.org/10.1016/S0277-3791(03)00083-0
Tjallingii, R., Röhl, U., Kölling, M., Bickert, T., 2007. Influence of the water content on X-ray fluorescence corescanning measurements in soft marine sediments. Geochemistry, Geophys. Geosystems 8, 1–12. https://doi.org/10.1029/2006GC001393
Töchterle, U., 2015. Die Besiedlungsgeschichte der Ostalpen in der Früh- bis Mittelbronzezeit: Kolonisation und wirtschaftlicher Neuanfang. Teil 2, in: Stöllner, T., Oeggl, K. (Eds.), Bergauf Bergab. 10.000 Jahre Bergbau in Den Ostalpen. Deutsches Bergbau-Museum Bochum, Bochum, pp. 129–134.
Tolonen, K., 1984. Interpretation of changes in the ash content of ombrotrophic peat layers. Bull. Geol. Soc. Finl. 56, 207–219.
Tomedi, G., 2012. Der mittelbronzezeitliche Schatzfund vom Piller., in: Hansen, S., Neumann, D., Vachta, T. (Eds.), Hort Und Raum: Aktuelle Forschungen Zu Bronzezeitlichen Deponierungen in Mitteleuropa. Walter de Gruyter, Berlin, pp. 151–168.
Tomedi, G., 2002a. Zur Datierung des Depotfundes vom Piller 4.
Tomedi, G., 2002b. Hinweise zu einem lokalen Bronzehandwerk aus dem Depotfund vom Moosbruckschrofen am Piller. Archaeo Tirol. Kleine Schriften 4 - Schriften zur Archäologischen Landeskd. Tirols 4, 77–82.
Tomedi, G., Castellan, S.N., Lachberger, R., 2009. Denkmalschutzgrabungen am bronzezeitlichen Haus von Fliess-Silberplan, Jahresbericht. Das Zentrum für Alte Kulturen. Innsbruck, Austria.
Tomedi, G., Staudt, M., Töchterle, U., 2013. Zur Bedeutung des prähistorischen Bergbaus auf Kupfererze im Raum Schwaz-Brixlegg, in: Oeggl, K., Schaffer, V. (Eds.), Cuprum Tyrolense - 5550 Jahre Bergbau Und Kupferverhüttung in Tirol. Edition Tirol, pp. 55–70.
Town of Ischgl, 2019. Abriss der Chronik [WWW Document]. URL http://www.ischgl.tirol.gv.at/Abriss_der_Chronik (accessed 1.25.19).
Trimble, S.W., Mendel, A.C., 1995. The cow as a geomorphic agent — A critical review, in: Hupp, C.R., Osterkamp, W.R., Howard, A.D. (Eds.), Biogeomorphology, Terrestrial and Freshwater Systems. Elsevier, Amsterdam, pp. 233–253. https://doi.org/https://doi.org/10.1016/B978-0-444-81867-6.50019-8
Tropper, P., Bechter, D., Zambanini, J., Kaindl, R., Vavtar, F., Lutz, J., 2011. Montangeschichte, Mineralogie, Geochemie und Petrologie der Kupferlagerstätte Bartholomäberg/Silbertal (Montafon, Vorarlberg). Geo. Alp 8, 20–44.
Tschurtschenthaler, M., Wein, U., 1998. Das Heiligtum auf der Pillerhöhe und seine Beziehungen zur Via Claudia Augusta, in: Walde, E. (Ed.), Via Claudia : Neue Forschungen. Innsbruck : Inst. für Klassische Archäologie, Innsbruck, pp. 227–259.
Tschurtschenthaler, M., Wein, U., 1996. Kontinuität und Wandel eines alpinen Heiligtums im
190 References
Laufe seiner 1.800‐jährigen Geschichte. Archäologie Österreichs 5, 14–28.
Unkel, I., Fernandez, M., Björck, S., Ljung, K., Wohlfarth, B., 2010. Records of environmental changes during the Holocene from Isla de los Estados (54.4 S), southeastern Tierra del Fuego. Glob. Planet. Change 74, 99–113.
Urbina, J.C., Benavides, J.C., 2015. Simulated small scale disturbances increase decomposition rates and facilitates invasive species encroachment in a high elevation tropical Andean peatland. Biotropica 47, 143–151.
Valese, E., Conedera, M., Held, A.C., Ascoli, D., 2014. Fire, humans and landscape in the European Alpine region during the Holocene. Anthropocene 6, 63–74. https://doi.org/10.1016/j.ancene.2014.06.006
Van Breemen, N., 1995. How Sphagnum bogs down other plants. Trends Ecol. Evol. 10, 270–275. https://doi.org/10.1016/0169-5347(95)90007-1
Van der Knaap, W.O., van Leeuwen, J.F.N., Ammann, B., 2004. The first rise and fall of Fagus sylvatica and interactions with Abies alba at Faulenseemoos (Weiss Plateau) 6900–6000 cal yr BP. Acta Palaeobot 44, 249–266.
van der Plicht, J., 2005. Radiocarbon, the Calibration Curve and Scythian Chronology, in: Marian Scott, E., Alekseev, A.Y., Zaitseva, G. (Eds.), Impact of the Environment on Human Migration in Eurasia. Springer Netherlands, Dordrecht, pp. 45–61.
Van Geel, B., 1978. A palaeoecological study of Holocene peat bog sections in Germany and the Netherlands, based on the analysis of pollen, spores and macro-and microscopic remains of fungi, algae, cormophytes and animals. Rev. Palaeobot. Palynol. 25, 1–120.
Vanneste, H., De Vleeschouwer, F., Martínez-Cortizas, A., von Scheffer, C., Piotrowska, N., Coronato, A., Le Roux, G., 2015. Late-glacial elevated dust deposition linked to westerly wind shifts in southern South America. Sci. Rep. 5. https://doi.org/10.1038/srep11670
Vavtar, F., 1988. Die Erzanreicherungen im Nordtiroler Stubai-, Ötztal- und Silvrettakristallin, in: Archiv Für Lagerstättenforschung. Archiv für Lagerstättenforschung. Geologisches Bundesamt Österreich, Wien, pp. 103–153.
Vermeersch, P., Paulissen, E., 1993. Palaeolithic chert quarrying and mining in Egypt.
Véron, A., Goiran, J.P., Morhange, C., Marriner, N., Empereur, J.Y., 2006. Pollutant lead reveals the pre-Hellenistic occupation and ancient growth of Alexandria, Egypt. Geophys. Res. Lett. 33, L06409. https://doi.org/10.1029/2006GL025824
Viehweider, B., Feichter-Haid, A., Koch Waldner, T., Masur, A., 2013. Mining-related land use changes since the Neolithic in the region of Kitzbühel (Tyrol). Metalla 20, 52–55.
Vile, M. a, Wieder, R.K., Novák, M., 1999. Mobility of Pb in Sphagnum -derived peat 35–52.
Vitt, D.H., Chee, W.-L., 1990. The relationships of vegetation to surface water chemistry and peat chemistry in fens of Alberta, Canada. Vegetatio 89, 87–106.
Völk, H.R., 2001. Geomorphologie des Kleinwalsertales und seiner Gebirgsumrahmung. Landschaftsformen zur Eiszeit und Nacheiszeit unter Einbeziehung der geologischen Verhältnisse. Vor. Naturschau 10, 7–95.
Vollweiler, N., Scholz, D., Mühlinghaus, C., Mangini, A., Spötl, C., 2006. A precisely dated climate record for the last 9 kyr from three high alpine stalagmites, Spannagel Cave, Austria. Geophys. Res. Lett. 33, 1–5. https://doi.org/10.1029/2006GL027662
von Gümbel, C.W., 1861. Geognostische Beschreibung des Königreichs Bayern: Geognostische
191 References
Beschreibung des bayerischen Alpengebirges und seines Vorlandes. bayer. Staatsministerium der der Finanzen., Gotha.
von Klebelsberg, R., 1939. Nutzbare Bodenvorkommnisse in Nordtirol. Veröff. d. Museum Ferdinandeum Innsbruck, Bd 19, 1–56.
von Raiser, J.N., 1830. Der Ober-Donau-Kreis des Königreichs Bayern unter den Römern. Die Römer-Male von Augusta rauracum bis Augusta Vindelicorum: 1. Kranzfelder, Augsburg.
von Srbik, R., 1929. Überblick des Bergbaues von Tirol und Vorarlberg in Vergangenheit und Gegenwart. Bericht des naturwissenschaftlich - medizinischen Vereins zu Innsbruck 41, 113–277.
Vorren, K.-D., Mørkved, B., Bortenschlager, S., 1993. Human impact on the Holocene forest line in the Central Alps. Veg. Hist. Archaeobot. 2, 145–156. https://doi.org/10.1007/BF00198585
Wagner, G., 1950. Rund um Hochifen und Gottesackergebiet. Verlag der Hohenloheschen Buchhandlung Ferdinand Rau, Öhringen.
Wahlmüller, N., 2002. Die Komperdellalm im Wandel der Jahrtausende. Ein Beitrag zur Vegetationsund Besiedlungsgeschichte des Oberen Gerichts, in: Klien, R. (Ed.), Serfaus. Athesia-Tyrolia Druck GmbH, Innsbruck: Gemeinde Serfaus, pp. 71–83.
Walde, C., 2006. Die Vegetations-und Siedlungsgeschichte im Oberen Gericht-Pollenanalytische Untersuchungen des Plemun-Weihers (Fließ, Tirol), in: Walde, E., Grabherr, G. (Eds.), Via Claudia Augusta Und Römerstraßenforschung Im Östlichen Alpenraum. Ikarus 1. Innsbruck University Press, pp. 394–407.
Walde, C., Oeggl, K., 2004. Neue Ergebnisse zur Siedlungsgeschichte am Tannberg. Die Pollenanalysen aus dem Körbersee. Walserheimat Vor. , Tirol und Liechtenstein 75, 4–7.
Walde, C., Oeggl, K., 2003. Blütenstaub enthüllt 3000-jährige Siedlungsgeschichte im Tannberggebiet. Walserheimat Vor. , Tirol und Liechtenstein 73, 1–6.
Walser, C., 2012. Kalt-Warm. Klima und Besiedlungsdynamik in der Silvretta, in: Reitmaier, T. (Ed.), Letzte Jäger, Erste Hirten - Hochalpine Archäologie in Der Silvretta. Archäologischer Dienst Graubünden, Chur, pp. 205–218.
Walser, C., Lambers, K., 2012. Human Activity in the Silvretta Massif and Climatic Developments throughout the Holocene. Landsc. Archaeol. Proc. Int. Conf. Held Berlin, 6th - 8th June 2012 (eTopoi. J. Anc. Stud. Spec. Vol. 3) 3, 55–62.
Wang, M., Moore, T.R., Talbot, J., Riley, J.L., 2015. The stoichiometry of carbon and nutrients in peat formation. Global Biogeochem. Cycles 29, 113–121. https://doi.org/10.1002/2014GB005000
Wardenaar, E.C.P., 1987. A new hand tool for cutting peat profiles. Can. J. Bot. 65, 1772–1773.
Weber, L., 1997. Die neue Metallogenetische Karte von Osterreich 1: 500 000 unter Einbeziehung der Industrieminerale und Energierohstoffe. Bhm-b. und Huttenmann. Monatshefte 142, 420–424.
Weber, L., Cerny, I., Ebner, F., Fritz, I., Göd, R., Götzinger, M.A., Gräf, W., Paar, W.H., Prohaska, W., Sachsenhofer, R.F., 1997. Metallogenetische Karte von Österreich 1: 500.000. Arch. für Lagerstättenforsch.
Weber, M., 1995. Die frühe und mittlere römische Kaiserzeit, in: Czysz, W., Dietrich, H., Weber, G. (Eds.), Kempten Und Das Allgäu. Führer Zu Archäologischen Denkmälern in
192 References
Deutschland 30. Theiss, Stuttgart, pp. 49–60.
Weiss, D., Shotyk, W., Appleby, P.G., Kramers, J.D.A.N.D., Cheburkin, A.K., Weiss, D., Shotyk, W., Appleby, P.G., Kramers, J.D.A.N.D., Cheburkin, A.K., Weiss, D., Shotyk, W., Appleby, P.G., Kramers, J.D.A.N.D., Cheburkin, A.K., 1999. Atmospheric Pb deposition since the industrial revolution recorded by five Swiss peat profiles: Enrichment factors, fluxes, isotopic composition, and sources. Environ. Sci. Technol. 33, 1340–1352. https://doi.org/10.1021/es980882q
Weiss, D., Shotyk, W., Cheburkin, A.K., Gloor, M., Reese, S., 1997. Atmospheric Lead Deposition from 12,400 to ca. 2,000 yrs BP in a Peat Bog Profile, Jura Mountains, Switzerland. Water. Air. Soil Pollut. 100, 311–324. https://doi.org/10.1023/A:1018341029549
Weltje, G.J., Bloemsma, M.R., Tjallingii, R., Heslop, D., Röhl, U., Croudace, I.W., 2015. Prediction of geochemical composition from XRF core scanner data: a new multivariate approach including automatic selection of calibration samples and quantification of uncertainties, in: Micro-XRF Studies of Sediment Cores. Springer, pp. 507–534.
Weltje, G.J., Tjallingii, R., 2008. Calibration of XRF core scanners for quantitative geochemical logging of sediment cores: theory and application. Earth Planet. Sci. Lett. 274, 423–438.
Wick, L., Tinner, W., 1997. Vegetation Changes and Umbertine Fluctuations in the Central Alps as Indicators of Holocene Climatic Oscillations. Arct. Alp. Res. 29, 445–458. https://doi.org/10.2307/1551992
Willand, D., Amann, A., 2013. “Das Buoch soll Kraft und Macht haben”. Alpbücher im Kleinwalsertal 1541-1914. Brüüg, Riezlern/Kleinwalsertal.
Winckler, K., 2012. Die Alpen im Frühmittelalter: die Geschichte eines Raumes in den Jahren 500 bis 800. Böhlau.
Wolkersdorfer, C., 1991. Geschichte des Bergbaus im westlichen Mieminger Gebirge/Tirol. Aufschluss 42, 359–379.
Woodland, W.A., Charman, D.J., Sims, P.C., 1998. Quantitative estimates of water tables and soil moisture in Holocene peatlands from testate amoebae. Holocene 8, 261–273. https://doi.org/10.1191/095968398667004497
Wurth, G., Niggemann, S., Richter, D.K., Mangini, A., 2004. The Younger Dryas and Holocene climate record of a stalagmite from Hölloch Cave (Bavarian Alps, Germany). J. Quat. Sci. 19, 291–298. https://doi.org/10.1002/jqs.837
Wyllie, D.C., 2014. Rock fall engineering. CRC Press.
Yeloff, D., Van Geel, B., 2007. Abandonment of farmland and vegetation succession following the Eurasian plague pandemic of ad 1347–52. J. Biogeogr. 34, 575–582.
Yu, Z., Loisel, J., Brosseau, D.P., Beilman, D.W., Hunt, S.J., 2010. Global peatland dynamics since the Last Glacial Maximum 37, 1–5. https://doi.org/10.1029/2010GL043584
Zaccone, C., Cocozza, C., Cheburkin, A.K., Shotyk, W., Miano, T.M., 2008. Distribution of As, Cr, Ni, Rb, Ti and Zr between peat and its humic fraction along an undisturbed ombrotrophic bog profile (NW Switzerland). Appl. Geochemistry 23, 25–33. https://doi.org/10.1016/j.apgeochem.2007.09.002
Zacher, W., 1990. Geologische Karte von Österreich: Blatt 113 Mittelberg 1:50000. Geologische Bundesanstalt, Wien.
193 References
ZAMG, 2018. ZAMG [WWW Document]. Klimadaten von Österreich, 1971 - 2000. URL http://www.zamg.ac.at/fix/klima/oe71-00/klima2000/klimadaten_oesterreich_1971_frame1.htm (accessed 9.24.18).
Zemmer-Plank, L., 1992. Ein Waffenopfer der Fritzens-Sanzeno-Kultur in Wenns im Pitztal. Veröffentlichungen des Tiroler Landesmuseum 72, 231–249.
Zerbe, S., Steffenhagen, P., Parakenings, K., Timmermann, T., Frick, A., Gelbrecht, J., Zak, D., 2013. Ecosystem service restoration after 10 years of rewetting peatlands in NE Germany. Environ. Manage. 51, 1194–1209. https://doi.org/10.1007/s00267-013-0048-2
Zhou, P., Yan, H., Gu, B., 2005. Competitive complexation of metal ions with humic substances. Chemosphere 58, 1327–1337.
Zoller, H., Erny-Rodmann, C., Punchakunnel, P., 1996. The history of vegetation and land use in the Lower Engadine (Switzerland). Pollen records of the last 13000 years. Natl. der Schweiz.
Zwicker, U., 1989. Untersuchungen zur Herstellung von Kupfer und Kupferlegierungen im Bereich des östlichen Mittelmeeres (3500-1000 v. Chr.), in: Hauptmann, A., Pernicka, E., Wagner, G.A. (Eds.), Old world archaeometallurgy : proceedings of the International Symposium “Old World Archaeometallurgy,” Heidelberg 1987. Selbstverlag des Deutschen Bergbau-Museums, Bochum, pp. 191–201.
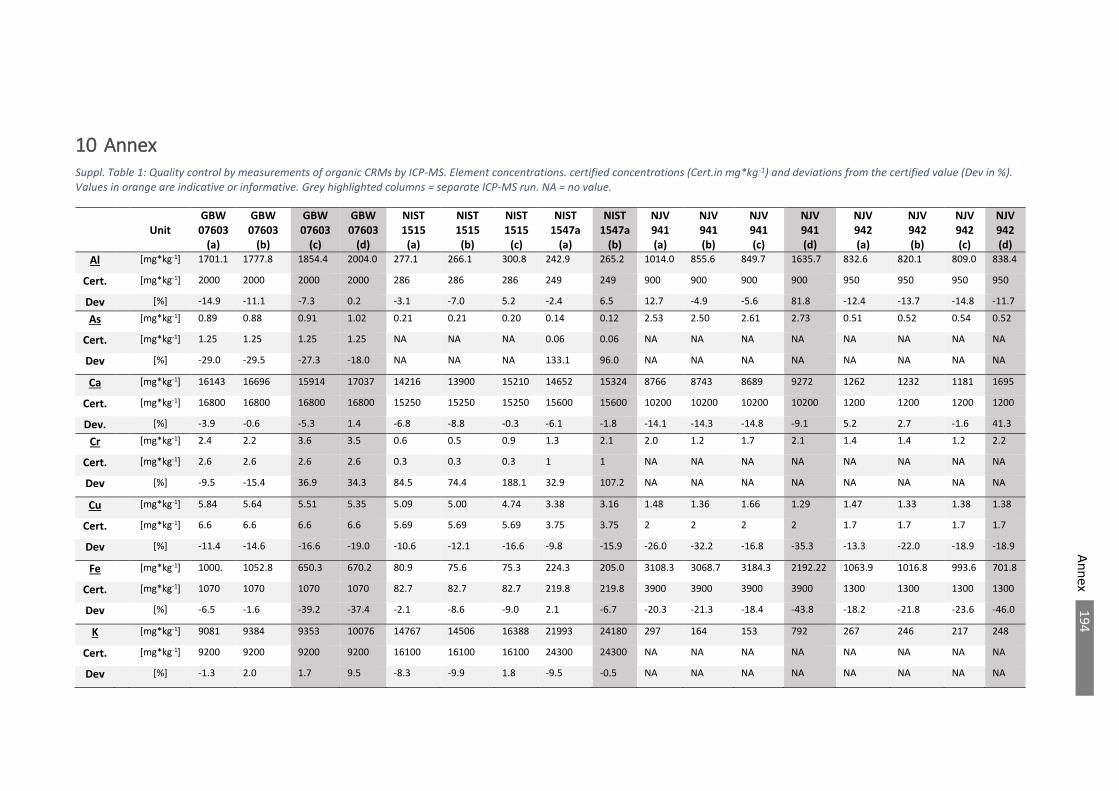
An
nex
194
10 Annex
Suppl. Table 1: Quality control by measurements of organic CRMs by ICP-MS. Element concentrations. certified concentrations (Cert.in mg*kg-1) and deviations from the certified value (Dev in %).
Values in orange are indicative or informative. Grey highlighted columns = separate ICP-MS run. NA = no value.
Unit
GBW
07603
(a)
GBW
07603
(b)
GBW
07603
(c)
GBW
07603
(d)
NIST
1515
(a)
NIST
1515
(b)
NIST
1515
(c)
NIST
1547a
(a)
NIST
1547a
(b)
NJV
941
(a)
NJV
941
(b)
NJV
941
(c)
NJV
941
(d)
NJV
942
(a)
NJV
942
(b)
NJV
942
(c)
NJV
942
(d)
Al [mg*kg-1] 1701.1 1777.8 1854.4 2004.0 277.1 266.1 300.8 242.9 265.2 1014.0 855.6 849.7 1635.7 832.6 820.1 809.0 838.4
Cert. [mg*kg-1] 2000 2000 2000 2000 286 286 286 249 249 900 900 900 900 950 950 950 950
Dev [%] -14.9 -11.1 -7.3 0.2 -3.1 -7.0 5.2 -2.4 6.5 12.7 -4.9 -5.6 81.8 -12.4 -13.7 -14.8 -11.7
As [mg*kg-1] 0.89 0.88 0.91 1.02 0.21 0.21 0.20 0.14 0.12 2.53 2.50 2.61 2.73 0.51 0.52 0.54 0.52
Cert. [mg*kg-1] 1.25 1.25 1.25 1.25 NA NA NA 0.06 0.06 NA NA NA NA NA NA NA NA
Dev [%] -29.0 -29.5 -27.3 -18.0 NA NA NA 133.1 96.0 NA NA NA NA NA NA NA NA
Ca [mg*kg-1] 16143 16696 15914 17037 14216 13900 15210 14652 15324 8766 8743 8689 9272 1262 1232 1181 1695
Cert. [mg*kg-1] 16800 16800 16800 16800 15250 15250 15250 15600 15600 10200 10200 10200 10200 1200 1200 1200 1200
Dev. [%] -3.9 -0.6 -5.3 1.4 -6.8 -8.8 -0.3 -6.1 -1.8 -14.1 -14.3 -14.8 -9.1 5.2 2.7 -1.6 41.3
Cr [mg*kg-1] 2.4 2.2 3.6 3.5 0.6 0.5 0.9 1.3 2.1 2.0 1.2 1.7 2.1 1.4 1.4 1.2 2.2
Cert. [mg*kg-1] 2.6 2.6 2.6 2.6 0.3 0.3 0.3 1 1 NA NA NA NA NA NA NA NA
Dev [%] -9.5 -15.4 36.9 34.3 84.5 74.4 188.1 32.9 107.2 NA NA NA NA NA NA NA NA
Cu [mg*kg-1] 5.84 5.64 5.51 5.35 5.09 5.00 4.74 3.38 3.16 1.48 1.36 1.66 1.29 1.47 1.33 1.38 1.38
Cert. [mg*kg-1] 6.6 6.6 6.6 6.6 5.69 5.69 5.69 3.75 3.75 2 2 2 2 1.7 1.7 1.7 1.7
Dev [%] -11.4 -14.6 -16.6 -19.0 -10.6 -12.1 -16.6 -9.8 -15.9 -26.0 -32.2 -16.8 -35.3 -13.3 -22.0 -18.9 -18.9
Fe [mg*kg-1] 1000. 1052.8 650.3 670.2 80.9 75.6 75.3 224.3 205.0 3108.3 3068.7 3184.3 2192.22 1063.9 1016.8 993.6 701.8
Cert. [mg*kg-1] 1070 1070 1070 1070 82.7 82.7 82.7 219.8 219.8 3900 3900 3900 3900 1300 1300 1300 1300
Dev [%] -6.5 -1.6 -39.2 -37.4 -2.1 -8.6 -9.0 2.1 -6.7 -20.3 -21.3 -18.4 -43.8 -18.2 -21.8 -23.6 -46.0
K [mg*kg-1] 9081 9384 9353 10076 14767 14506 16388 21993 24180 297 164 153 792 267 246 217 248
Cert. [mg*kg-1] 9200 9200 9200 9200 16100 16100 16100 24300 24300 NA NA NA NA NA NA NA NA
Dev [%] -1.3 2.0 1.7 9.5 -8.3 -9.9 1.8 -9.5 -0.5 NA NA NA NA NA NA NA NA
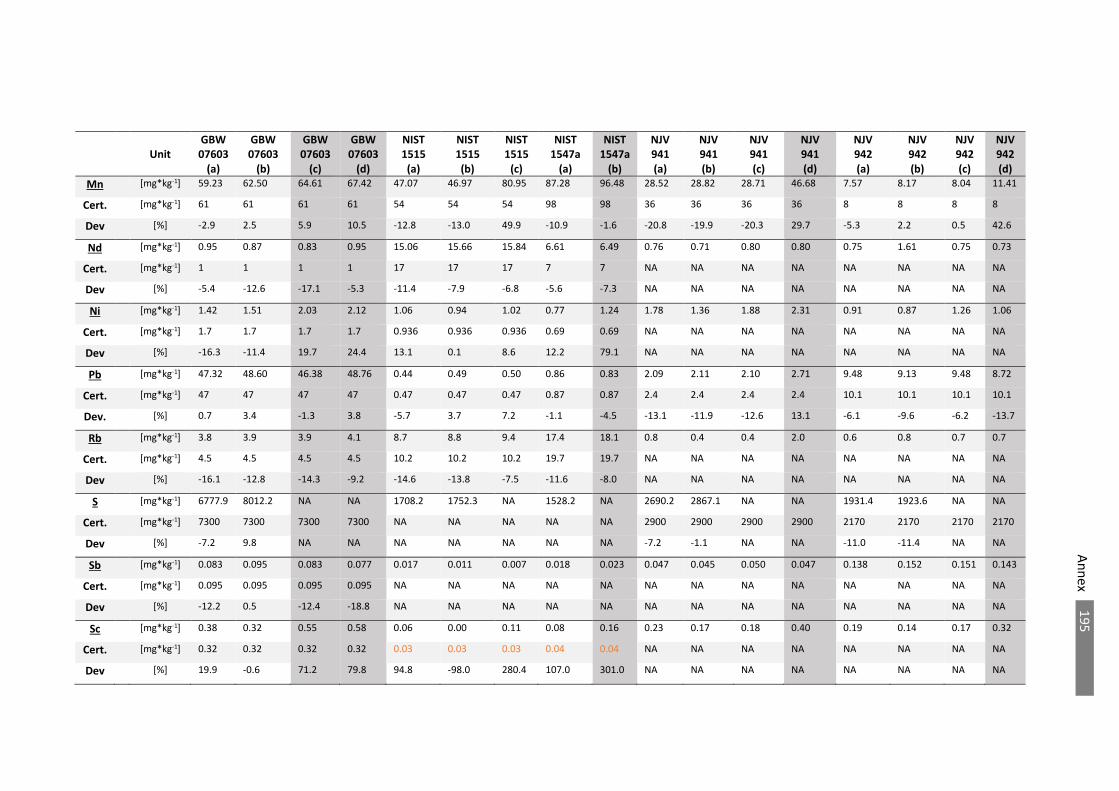
An
nex
195
Unit
GBW
07603
(a)
GBW
07603
(b)
GBW
07603
(c)
GBW
07603
(d)
NIST
1515
(a)
NIST
1515
(b)
NIST
1515
(c)
NIST
1547a
(a)
NIST
1547a
(b)
NJV
941
(a)
NJV
941
(b)
NJV
941
(c)
NJV
941
(d)
NJV
942
(a)
NJV
942
(b)
NJV
942
(c)
NJV
942
(d)
Mn [mg*kg-1] 59.23 62.50 64.61 67.42 47.07 46.97 80.95 87.28 96.48 28.52 28.82 28.71 46.68 7.57 8.17 8.04 11.41
Cert. [mg*kg-1] 61 61 61 61 54 54 54 98 98 36 36 36 36 8 8 8 8
Dev [%] -2.9 2.5 5.9 10.5 -12.8 -13.0 49.9 -10.9 -1.6 -20.8 -19.9 -20.3 29.7 -5.3 2.2 0.5 42.6
Nd [mg*kg-1] 0.95 0.87 0.83 0.95 15.06 15.66 15.84 6.61 6.49 0.76 0.71 0.80 0.80 0.75 1.61 0.75 0.73
Cert. [mg*kg-1] 1 1 1 1 17 17 17 7 7 NA NA NA NA NA NA NA NA
Dev [%] -5.4 -12.6 -17.1 -5.3 -11.4 -7.9 -6.8 -5.6 -7.3 NA NA NA NA NA NA NA NA
Ni [mg*kg-1] 1.42 1.51 2.03 2.12 1.06 0.94 1.02 0.77 1.24 1.78 1.36 1.88 2.31 0.91 0.87 1.26 1.06
Cert. [mg*kg-1] 1.7 1.7 1.7 1.7 0.936 0.936 0.936 0.69 0.69 NA NA NA NA NA NA NA NA
Dev [%] -16.3 -11.4 19.7 24.4 13.1 0.1 8.6 12.2 79.1 NA NA NA NA NA NA NA NA
Pb [mg*kg-1] 47.32 48.60 46.38 48.76 0.44 0.49 0.50 0.86 0.83 2.09 2.11 2.10 2.71 9.48 9.13 9.48 8.72
Cert. [mg*kg-1] 47 47 47 47 0.47 0.47 0.47 0.87 0.87 2.4 2.4 2.4 2.4 10.1 10.1 10.1 10.1
Dev. [%] 0.7 3.4 -1.3 3.8 -5.7 3.7 7.2 -1.1 -4.5 -13.1 -11.9 -12.6 13.1 -6.1 -9.6 -6.2 -13.7
Rb [mg*kg-1] 3.8 3.9 3.9 4.1 8.7 8.8 9.4 17.4 18.1 0.8 0.4 0.4 2.0 0.6 0.8 0.7 0.7
Cert. [mg*kg-1] 4.5 4.5 4.5 4.5 10.2 10.2 10.2 19.7 19.7 NA NA NA NA NA NA NA NA
Dev [%] -16.1 -12.8 -14.3 -9.2 -14.6 -13.8 -7.5 -11.6 -8.0 NA NA NA NA NA NA NA NA
S [mg*kg-1] 6777.9 8012.2 NA NA 1708.2 1752.3 NA 1528.2 NA 2690.2 2867.1 NA NA 1931.4 1923.6 NA NA
Cert. [mg*kg-1] 7300 7300 7300 7300 NA NA NA NA NA 2900 2900 2900 2900 2170 2170 2170 2170
Dev [%] -7.2 9.8 NA NA NA NA NA NA NA -7.2 -1.1 NA NA -11.0 -11.4 NA NA
Sb [mg*kg-1] 0.083 0.095 0.083 0.077 0.017 0.011 0.007 0.018 0.023 0.047 0.045 0.050 0.047 0.138 0.152 0.151 0.143
Cert. [mg*kg-1] 0.095 0.095 0.095 0.095 NA NA NA NA NA NA NA NA NA NA NA NA NA
Dev [%] -12.2 0.5 -12.4 -18.8 NA NA NA NA NA NA NA NA NA NA NA NA NA
Sc [mg*kg-1] 0.38 0.32 0.55 0.58 0.06 0.00 0.11 0.08 0.16 0.23 0.17 0.18 0.40 0.19 0.14 0.17 0.32
Cert. [mg*kg-1] 0.32 0.32 0.32 0.32 0.03 0.03 0.03 0.04 0.04 NA NA NA NA NA NA NA NA
Dev [%] 19.9 -0.6 71.2 79.8 94.8 -98.0 280.4 107.0 301.0 NA NA NA NA NA NA NA NA
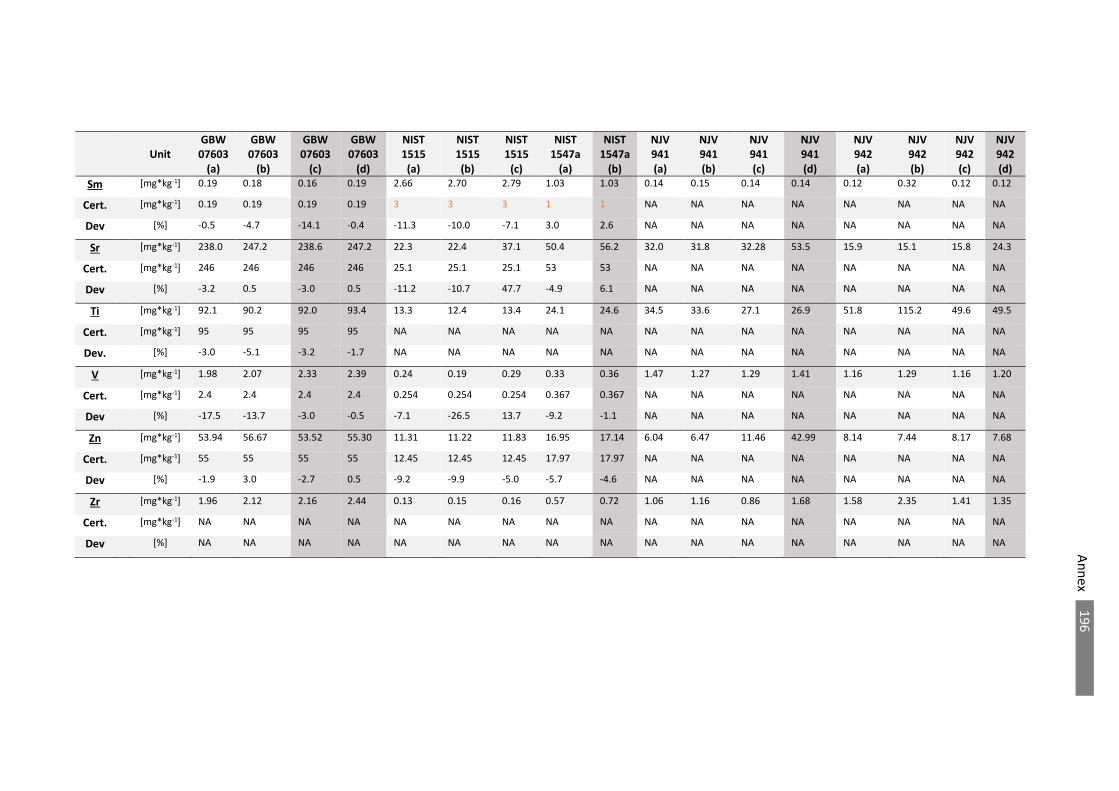
An
nex
196
Unit
GBW
07603
(a)
GBW
07603
(b)
GBW
07603
(c)
GBW
07603
(d)
NIST
1515
(a)
NIST
1515
(b)
NIST
1515
(c)
NIST
1547a
(a)
NIST
1547a
(b)
NJV
941
(a)
NJV
941
(b)
NJV
941
(c)
NJV
941
(d)
NJV
942
(a)
NJV
942
(b)
NJV
942
(c)
NJV
942
(d)
Sm [mg*kg-1] 0.19 0.18 0.16 0.19 2.66 2.70 2.79 1.03 1.03 0.14 0.15 0.14 0.14 0.12 0.32 0.12 0.12
Cert. [mg*kg-1] 0.19 0.19 0.19 0.19 3 3 3 1 1 NA NA NA NA NA NA NA NA
Dev [%] -0.5 -4.7 -14.1 -0.4 -11.3 -10.0 -7.1 3.0 2.6 NA NA NA NA NA NA NA NA
Sr [mg*kg-1] 238.0 247.2 238.6 247.2 22.3 22.4 37.1 50.4 56.2 32.0 31.8 32.28 53.5 15.9 15.1 15.8 24.3
Cert. [mg*kg-1] 246 246 246 246 25.1 25.1 25.1 53 53 NA NA NA NA NA NA NA NA
Dev [%] -3.2 0.5 -3.0 0.5 -11.2 -10.7 47.7 -4.9 6.1 NA NA NA NA NA NA NA NA
Ti [mg*kg-1] 92.1 90.2 92.0 93.4 13.3 12.4 13.4 24.1 24.6 34.5 33.6 27.1 26.9 51.8 115.2 49.6 49.5
Cert. [mg*kg-1] 95 95 95 95 NA NA NA NA NA NA NA NA NA NA NA NA NA
Dev. [%] -3.0 -5.1 -3.2 -1.7 NA NA NA NA NA NA NA NA NA NA NA NA NA
V [mg*kg-1] 1.98 2.07 2.33 2.39 0.24 0.19 0.29 0.33 0.36 1.47 1.27 1.29 1.41 1.16 1.29 1.16 1.20
Cert. [mg*kg-1] 2.4 2.4 2.4 2.4 0.254 0.254 0.254 0.367 0.367 NA NA NA NA NA NA NA NA
Dev [%] -17.5 -13.7 -3.0 -0.5 -7.1 -26.5 13.7 -9.2 -1.1 NA NA NA NA NA NA NA NA
Zn [mg*kg-1] 53.94 56.67 53.52 55.30 11.31 11.22 11.83 16.95 17.14 6.04 6.47 11.46 42.99 8.14 7.44 8.17 7.68
Cert. [mg*kg-1] 55 55 55 55 12.45 12.45 12.45 17.97 17.97 NA NA NA NA NA NA NA NA
Dev [%] -1.9 3.0 -2.7 0.5 -9.2 -9.9 -5.0 -5.7 -4.6 NA NA NA NA NA NA NA NA
Zr [mg*kg-1] 1.96 2.12 2.16 2.44 0.13 0.15 0.16 0.57 0.72 1.06 1.16 0.86 1.68 1.58 2.35 1.41 1.35
Cert. [mg*kg-1] NA NA NA NA NA NA NA NA NA NA NA NA NA NA NA NA NA
Dev [%] NA NA NA NA NA NA NA NA NA NA NA NA NA NA NA NA NA
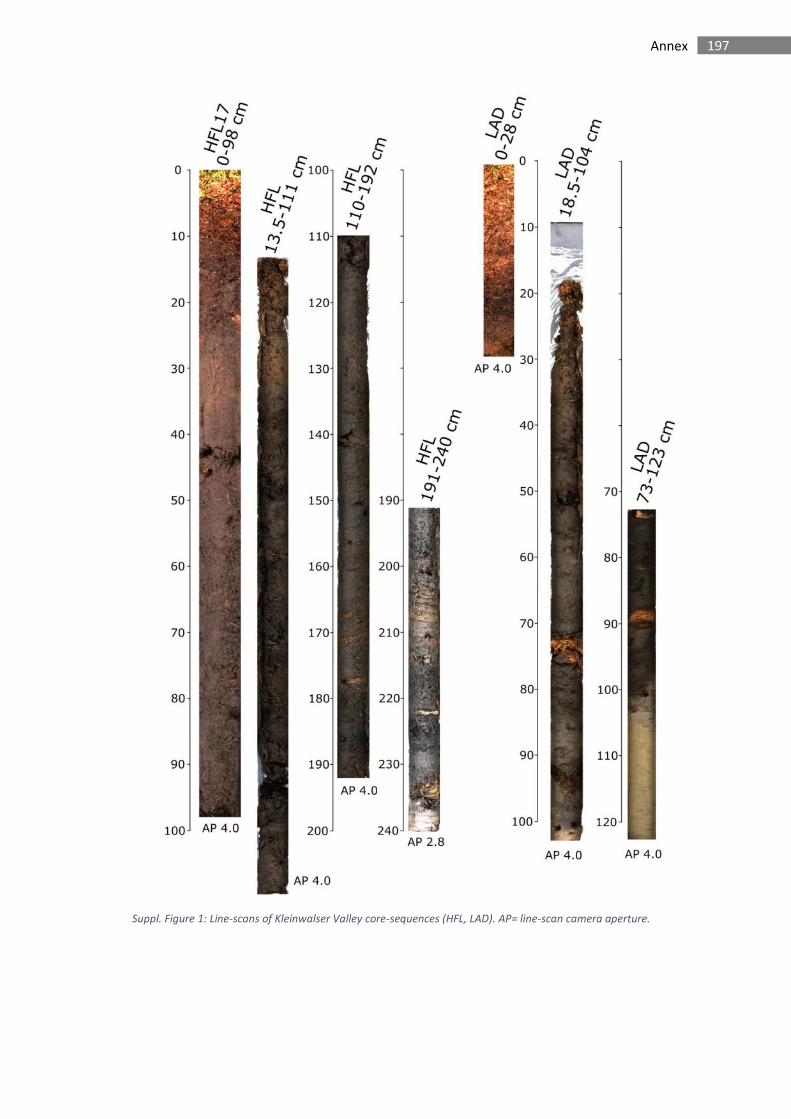
197 Annex
Suppl. Figure 1: Line-scans of Kleinwalser Valley core-sequences (HFL, LAD). AP= line-scan camera aperture.
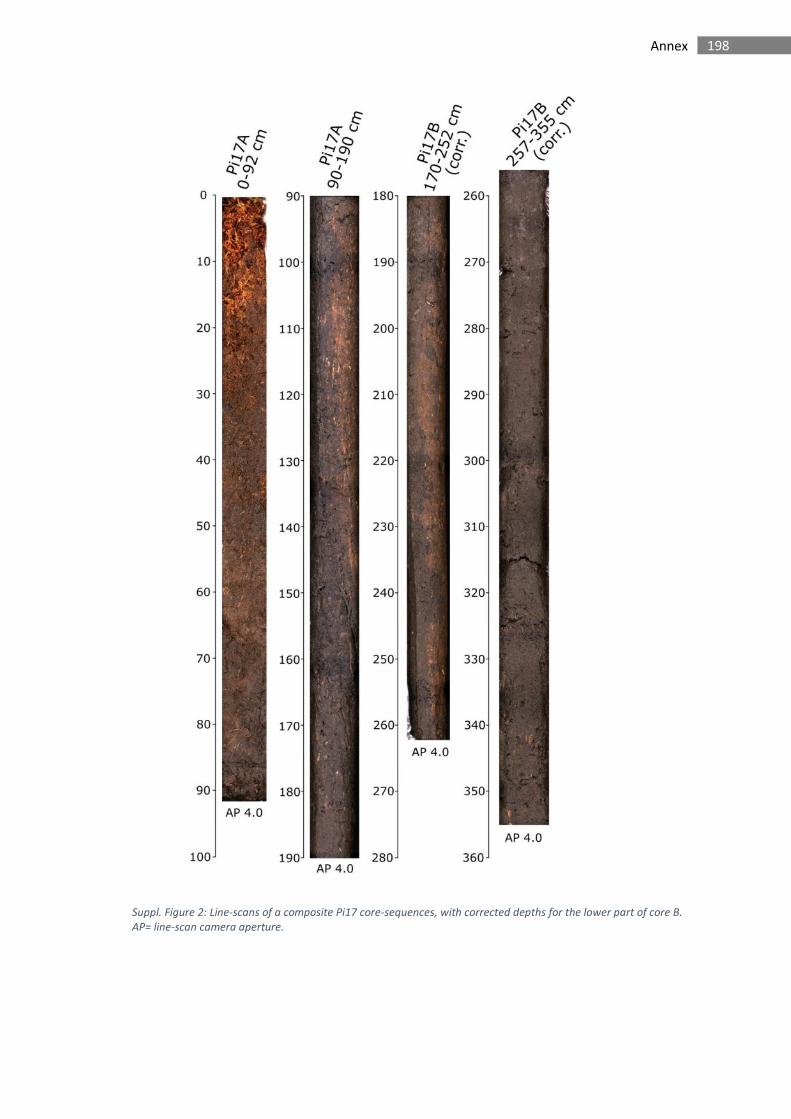
198 Annex
Suppl. Figure 2: Line-scans of a composite Pi17 core-sequences, with corrected depths for the lower part of core B.
AP= line-scan camera aperture.
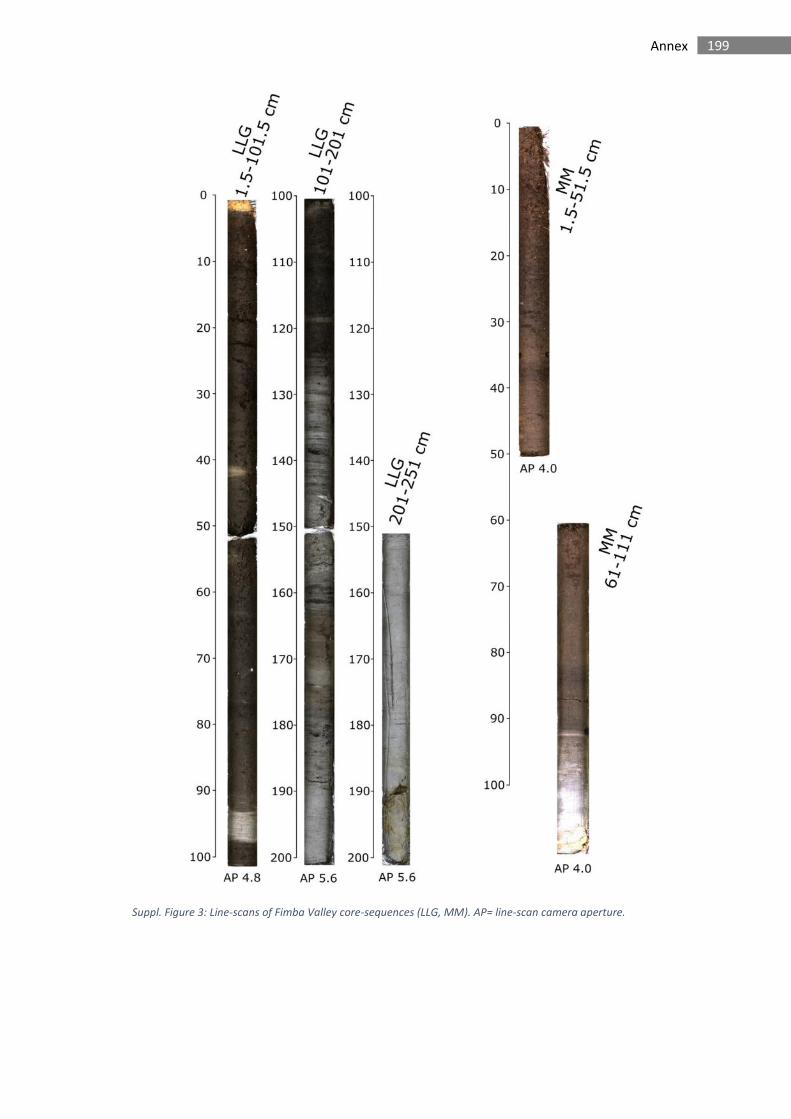
199 Annex
Suppl. Figure 3: Line-scans of Fimba Valley core-sequences (LLG, MM). AP= line-scan camera aperture.
Declaration
Herewith, the author of this dissertation (Clemens von Scheffer) declares and confirms the following:
1. Apart from the supervisors‘ guidance, the content and design of the thesis is all the doctoral
researcher’s own work, only using the sources listed.
2. The thesis has been submitted neither partially nor wholly as part of a doctoral examination
procedure to another examining body and has not been published or submitted for
publication.
3. The thesis has been prepared subject to the Rules of Good Scientific Practice of thee German
Research Foundation.
4. No academic degree has ever been withdrawn.
----------------------------------------
Date, signature