soil water content dependent wetting front characteristics in sands
TRANSCRIPT
Soil water content dependent wetting front characteristics in sands
T.W.J. Bautersa, D.A. DiCarlob, T.S. Steenhuisa,* , J.-Y. Parlangea
aDepartment of Agricultural and Biological Engineering, Cornell University, Ithaca, NY 14853, USAbDepartment of Petroleum Engineering, Stanford University, Stanford, CA 94305, USA
Received 2 April 1999; accepted 13 August 1999
Abstract
The initial soil water content affects wetting front instability. A series of experiments were conducted where water wasinfiltrated into a 20/30 sand with initial volumetric water contents of 0, 0.005, 0.01, 0.015, 0.02, 0.03, 0.04 and 0.047 cm3/cm3.Both water content and matric potential were measured. Water content was measured with Synchrotron X-rays at the CornellHigh Energy Synchrotron Source (CHESS) and matric potential with fast responding tensiometers. The flow field changedgradually from unstable fingered flow at 0% initial water content to a wetting pattern that can be described with Richards’equation without hysteresis. For unstable flow, the matric potential and water content decreased a short distance behind thewetting front. Except in the initially dry soil, the finger pattern began to widen immediately after infiltration. The pressure andwater content of the wetting front were hyperbolically related to the initial water content. In general, this research showed thatin coarse soils when an unstable wetting front occurs both the matric potential and water content drop behind the wetting frontwhile, when a stable Richards’ type wetting front forms, the matric potential and water content increase (slightly) behind thewetting front.q 2000 Elsevier Science B.V. All rights reserved.
Keywords: Vadose zone; Unstable front; Fingered flow; Infiltration
1. Introduction
Since the early 1960s, the occurrence of unstablefingered flow has been observed in initially dry sandysoil by Miller and Gardner (1962), Peck (1965) andHill and Parlange (1972). Theory for unstable fingeredwetting fronts was developed by Raats (1973),Parlange and Hill (1976), Glass et al. (1989), Selkeret al. (1992b), Kapoor (1996) and Yao and Hendrickx(1996). Bauters et al. (1998) showed that the finger-like pattern in water repellent soil had many similaritieswith unstable wetting fronts in air dry coarse-grained
soils. Despite the abundance of research in wettingfront behavior for initially dry soil, studies of unstableflow in initially moist coarse or hydrophobic soils(Ritsema et al., 1998) are very limited: Diment andWatson (1982) carried out infiltration experiments insands with different water contents and reported thatwater contents.0.01 cm3/cm3 had an inhibitingeffect on the development of frontal instabilitypatterns in coarse sands. Liu et al. (1994) infiltratedwater in experimental chambers with a dry soil on topand a capillary fringe at the bottom. They showedfingers, formed in the top section, increased in widthin the capillary fringe. Because of the lack of systema-tic research in this area, the objective of this paper isto examine how initial water content affects infiltra-tion patterns. Specifically, the wetting front behavior
Journal of Hydrology 231–232 (2000) 244–254www.elsevier.com/locate/jhydrol
0022-1694/00/$ - see front matterq 2000 Elsevier Science B.V. All rights reserved.PII: S0022-1694(00)00198-0
* Corresponding author. Tel.:11-607-255-2489; fax:11-607-255-4080.
E-mail address:[email protected] (T.S. Steenhuis).
and the water content and matric potential behind thewetting front will be characterized during water infil-tration at different initial soil water contents betweenair dry and field capacity.
2. Materials and methods
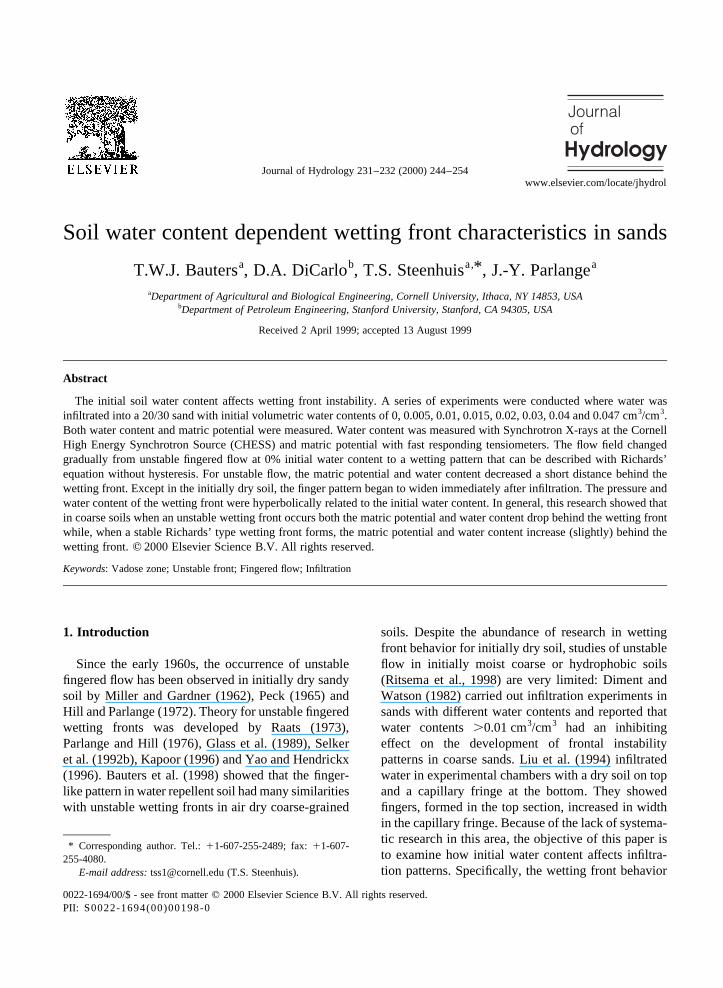
Infiltration experiments were performed in the F-2hutch of the Cornell High Energy Synchrotron Source(CHESS). Distilled water was applied as a pointsource at the surface in a 0.94 cm thick, 30 cm wide,and 55 cm long polycarbonate chamber filled withclean, 20–30 (US sieve sizes; compared to sieveopenings of 0.850/0.600 mm as upper/lower limit,respectively) quartz sand (Unimin Corporation1)(Fig. 1) with initial water contents ranging from 0 to0.047 cm3/cm3. Excess water drained out of the cham-ber through a manifold of five fluid ports. 0.005%FD&C blue #1 (Warner–Jenkinson Co, Inc.1) wasdissolved in the infiltrating water to make the wettingfront more visible.
Depending on the initial water content, differentprocedures were used for filling the chamber. Forthe 0 cm3/cm3 volumetric water content, sand wasadded by pouring it continuously through a numberof randomized screens. For the 0.047 cm3/cm3 watercontent, the same filling procedure was used but then
the chamber was saturated from the bottom at a flowrate of 3 cm3 min21. Once the water level reached thetop, it was drained to a residual water content of0.047 cm3/cm3 (measured with X-rays and confirmedgravimetrically in a separate experiment). For theremaining water contents, 0.005, 0.01, 0.015, 0.02,0.03 and 0.04 cm3/cm3, 1.73 kg of 20/30 sand wasmixed manually with the 5, 10, 15, 20, 30 and 40 mldistilled water, respectively. The chamber was filledin layers of 3 cm and then tamped by raising anddropping five times a polycarbonate board (29.5 cmwide, 70 cm tall, and 0.47 cm thick) 10 cm above thesand. This procedure resulted in a smooth packing anda repeatable density of 1.73 g/cm3. The tampingcaused the chamber to bulge in the middle whichaffected X-ray attenuation. The procedure to compen-sate for the chamber’s thickness variation and deter-mination of the moisture content is discussed later.
Infiltrating experiments were performed by inject-ing distilled water at a rate of 2 cm3 min21 through ahypodermic needle located near the sand surface. Inthe experiments in which small fingers formed, up tothree infiltrations were carried out at different loca-tions in the same packed chamber.
Matric potentials were measured with three fastresponding miniature tensiometers (Selker et al.,1992a) positioned flush with the wall, 8.5 cm apartand 32 cm from the bottom (Fig. 1). The tensiometersconsisted of a body, machined out of brass, and astainless steel porous plate (20mm pore size). Thetensiometers were filled with degassed, distilledwater and connected with nylon tubing through athree-way valve. The three outlets were connectedeither to a calibration tube, a pressure transducer, ora 60 cc syringe, holding the degassed, distilled waterfor filling the tensiometers. The voltages of the pres-sure transducers were filtered, amplified, integratedover 1 s and electronically recorded. Before eachexperiment, the tensiometers were calibrated by vary-ing the height in the calibration tube with knownwater levels using the syringe.
Water content was measured with high intensity X-rays. The initial white X-ray beam reflected off a Si-Crystal, producing a beam with a fundamental energyof 25 keV. The beam coming in the F-2 hutch wascollimated with tantalum slits to a size of 1 mm verti-cal by 10 mm horizontal. The beam passed through53 cm of open air, an argon filled ion chamber, 53 cm
T.W.J. Bauters et al. / Journal of Hydrology 231–232 (2000) 244–254 245
Fig. 1. The experimental chamber with point source infiltration, X-ray height, miniature tensiometers, and exit ports. All measurementsare in cm.
1 Mentioning of product names does not suggest an endorsementof the product.
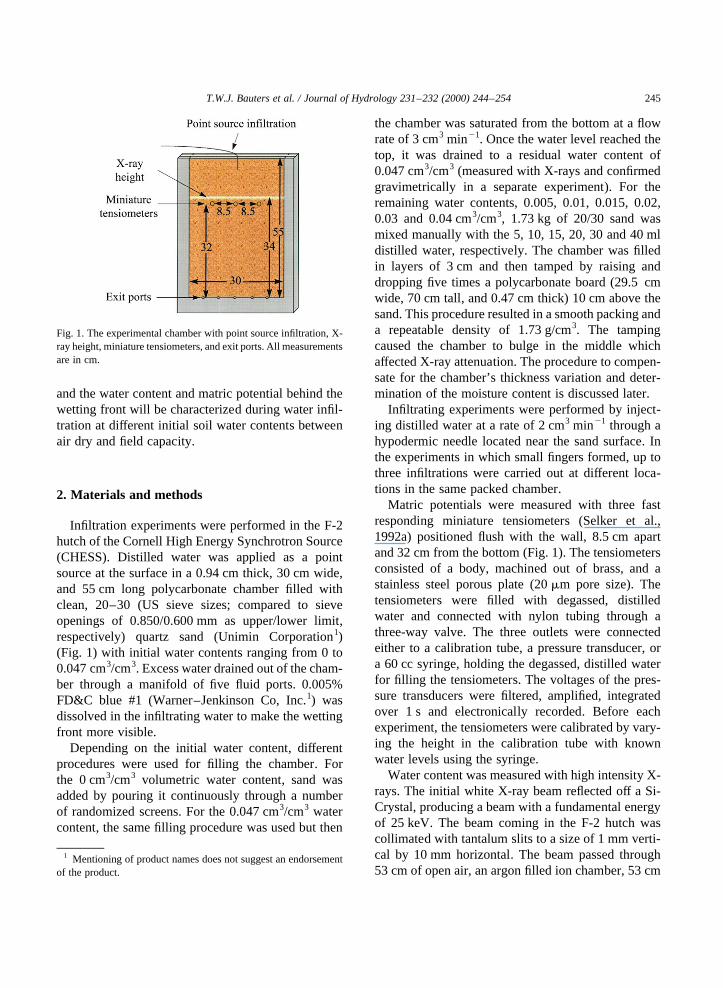
of open air, the sample chamber, another argon filledion chamber at 69 cm from the sample chamber, and70 cm more open air before hitting the beam stop (Fig.2). The details of this setup are discussed in DiCarlo etal. (1997).
The chamber was mounted on a movablex, y plat-form so that measurements could be taken at any posi-tion within the chamber. The horizontal scans in thechamber were taken every 5 mm for all experiments.Stationary data to document the water content withinthe finger were collected 2 cm above the tensiometers(34 cm above the chamber bottom) (Fig. 1). Thefinger widths were calculated from the horizontalscans at a height of 34 cm. The finger width for theunstable fingered flow regime was taken at the maxi-mum water content while, for the stable flow cases,the width of the wetting front was measured where thewater content became constant. The width at the tailof the finger was also taken at a height of 34 cm, justbefore the infiltration was stopped.
Infiltration patterns were recorded with a CCDcamera, connected to a Panasonic AG 6720 videocassette recorder. The blue dye aided in better visua-lization of the infiltrating water. The view of the lower15 cm was obstructed by the X-ray detector. In addi-tion, space limitations in the F-2 hutch only allowedus to record the wetting front pattern approximately15 cm from the top. The recorded images were
digitized with a frame grabber from Data Transla-tions. Global Labs Imaging software was used intransferring the grabbed images to tiff-format whichwere then imported into Adobe Photoshop 4.0 toobtain the wetting front positions. In Photoshop, theimages were first filtered with a median filter to reducethe noise, then thresholded at gray level 100, andtransformed to a black and white image. All theimages were then combined to make a time series ofthe wetting front location (Fig. 3). The velocities ofthe tip of the wetting front were calculated from theseimages.
Determination of the water content by X-rayattenuation requires a precise knowledge of the thick-ness of the chamber. Since the chamber width wasonly affected by the tamping and did not changeduring the experiment, we can use the initial X-rayscan before the water was infiltrated to find the cham-ber width in the experiments where tamping was usedto fill the chamber (0.005, 0.01, 0.015, 0.02, 0.03 and0.04 cm3/cm3). Using and adjusting Eq. (2) fromDiCarlo et al. (1997) we find the distance of sandand initial water traversed (X) by the X-rays as:
X�x� � 2Ai�x�2 A0
Us�1 2 n�1 Uwui�1�
where Ai�x� is the measured X-ray attenuation forsand and initial water as a function of the horizontalpositionx; A0 the X-ray attenuation for empty cham-ber;Us the attenuation constant of sand per unit width;n the porosity;�1 2 n� is volumetric sand content;Uw
the attenuation constant of water per unit width;ui theinitial volumetric water content of sand.
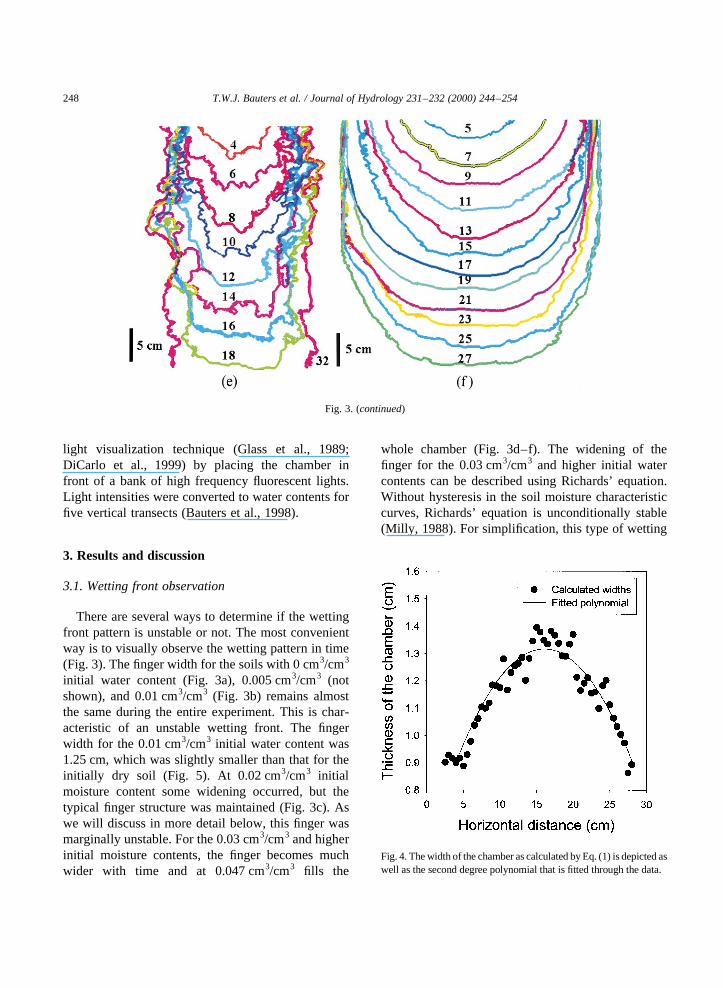
In a separate experiment with a rigid sand filledchamber, the porosity was measured as 0.348 cm3/cm3 which is identical to that of Schroth et al.(1996). Since there was variation in local porositydue to arrangement of the sand grains within the 1by 10 mm X-ray window, a second order polynomialwas fitted through the width data obtained with Eq. (1)(Fig. 4 is an example for the 0.015 cm3/cm3 moistsand). The fitted distances, X, were used in all conse-quent calculations to find the water content at a parti-cular location in the chamber as follows:
u � 2A�x�2 Ai�x�
UwX�x� 1 ui �2�
whereu is the volumetric water content;A the X-ray
T.W.J. Bauters et al. / Journal of Hydrology 231–232 (2000) 244–254246
Fig. 2. A schematic of the experimental setup at the F-2 hutch ofCHESS. The monochrometer transforms the white X-ray beam intoa beam with a fundamental energy of 25 keV. Ion chambersmeasure the total intensity of the X-ray beam (no energy resolution).The sample chamber is mounted on a movable platform allowingmeasurements from many different positions within the chamber.All measurements are in cm.
attenuation with sand and both the initial and infiltrat-ing water.
The static wetting branches of the soil characteristiccurve were determined for the sands at different watercontents. The moist sand was put into the chamber
with the procedures described above. Water wasimbibed from the bottom through the manifold withfive fluid ports with a constant head of 5 cm from thebottom of the chamber. After 24 h of equilibration, thewater contents were determined with the full field
T.W.J. Bauters et al. / Journal of Hydrology 231–232 (2000) 244–254 247
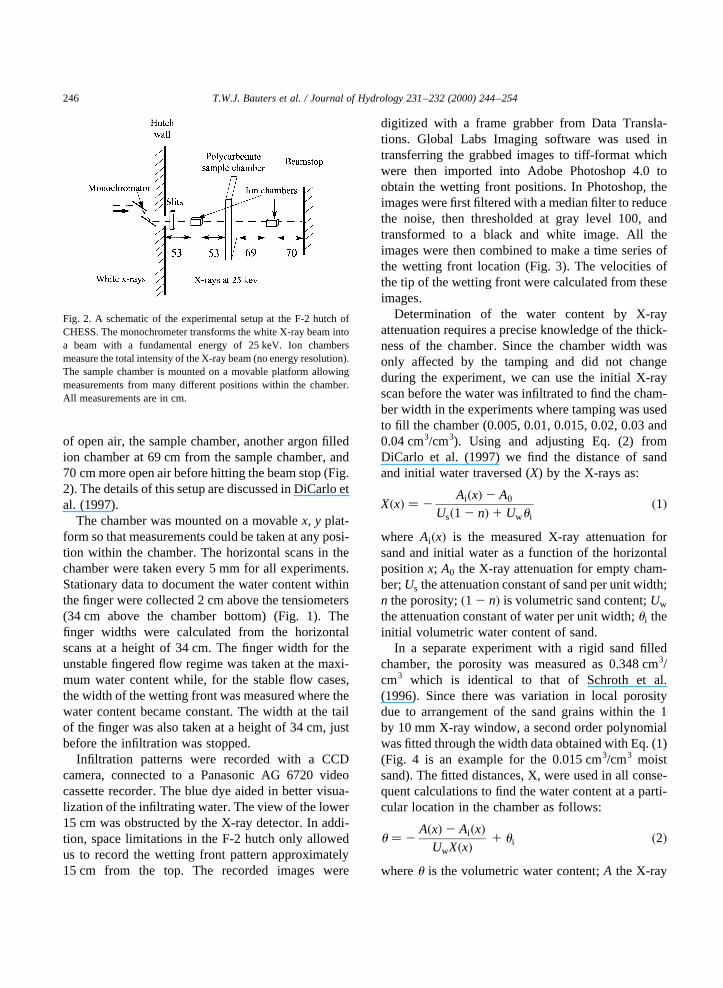
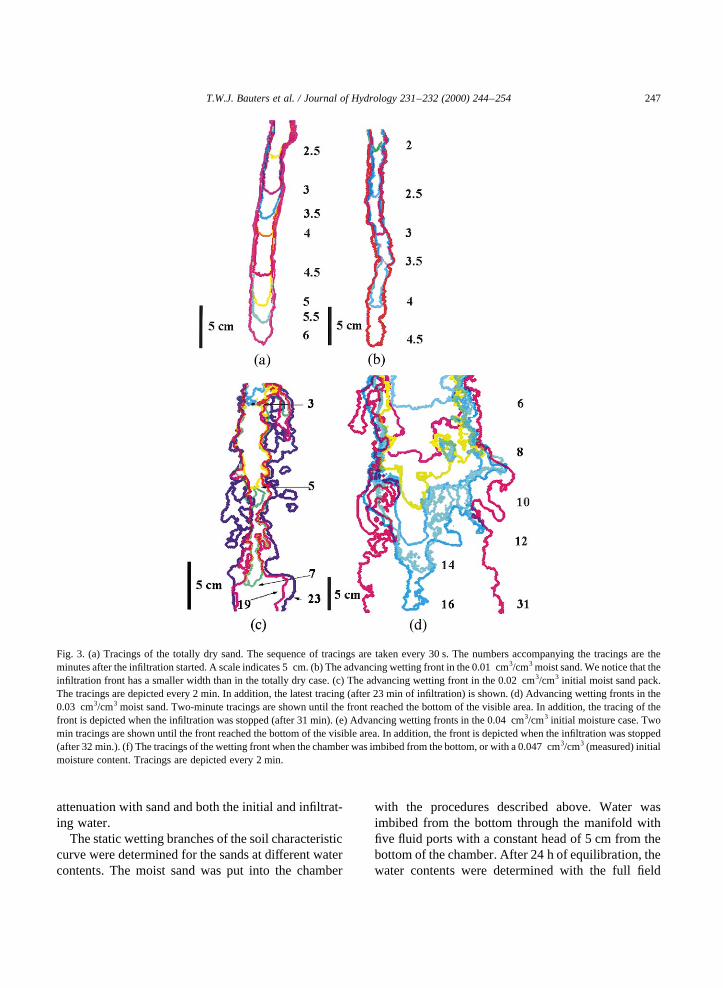
Fig. 3. (a) Tracings of the totally dry sand. The sequence of tracings are taken every 30 s. The numbers accompanying the tracings are theminutes after the infiltration started. A scale indicates 5 cm. (b) The advancing wetting front in the 0.01 cm3/cm3 moist sand. We notice that theinfiltration front has a smaller width than in the totally dry case. (c) The advancing wetting front in the 0.02 cm3/cm3 initial moist sand pack.The tracings are depicted every 2 min. In addition, the latest tracing (after 23 min of infiltration) is shown. (d) Advancing wetting fronts in the0.03 cm3/cm3 moist sand. Two-minute tracings are shown until the front reached the bottom of the visible area. In addition, the tracing of thefront is depicted when the infiltration was stopped (after 31 min). (e) Advancing wetting fronts in the 0.04 cm3/cm3 initial moisture case. Twomin tracings are shown until the front reached the bottom of the visible area. In addition, the front is depicted when the infiltration was stopped(after 32 min.). (f) The tracings of the wetting front when the chamber was imbibed from the bottom, or with a 0.047 cm3/cm3 (measured) initialmoisture content. Tracings are depicted every 2 min.
light visualization technique (Glass et al., 1989;DiCarlo et al., 1999) by placing the chamber infront of a bank of high frequency fluorescent lights.Light intensities were converted to water contents forfive vertical transects (Bauters et al., 1998).
3. Results and discussion
3.1. Wetting front observation
There are several ways to determine if the wettingfront pattern is unstable or not. The most convenientway is to visually observe the wetting pattern in time(Fig. 3). The finger width for the soils with 0 cm3/cm3
initial water content (Fig. 3a), 0.005 cm3/cm3 (notshown), and 0.01 cm3/cm3 (Fig. 3b) remains almostthe same during the entire experiment. This is char-acteristic of an unstable wetting front. The fingerwidth for the 0.01 cm3/cm3 initial water content was1.25 cm, which was slightly smaller than that for theinitially dry soil (Fig. 5). At 0.02 cm3/cm3 initialmoisture content some widening occurred, but thetypical finger structure was maintained (Fig. 3c). Aswe will discuss in more detail below, this finger wasmarginally unstable. For the 0.03 cm3/cm3 and higherinitial moisture contents, the finger becomes muchwider with time and at 0.047 cm3/cm3 fills the
whole chamber (Fig. 3d–f). The widening of thefinger for the 0.03 cm3/cm3 and higher initial watercontents can be described using Richards’ equation.Without hysteresis in the soil moisture characteristiccurves, Richards’ equation is unconditionally stable(Milly, 1988). For simplification, this type of wetting
T.W.J. Bauters et al. / Journal of Hydrology 231–232 (2000) 244–254248
Fig. 3. (continued)
Fig. 4. The width of the chamber as calculated by Eq. (1) is depicted aswell as the second degree polynomial that is fitted through the data.
front will be referred to as “Richards’ wetting front”.For water infiltration resulting in the formation ofunstable wetting fronts with fingers, the terms“unstable wetting front” and “fingered flow” will beused interchangeably.
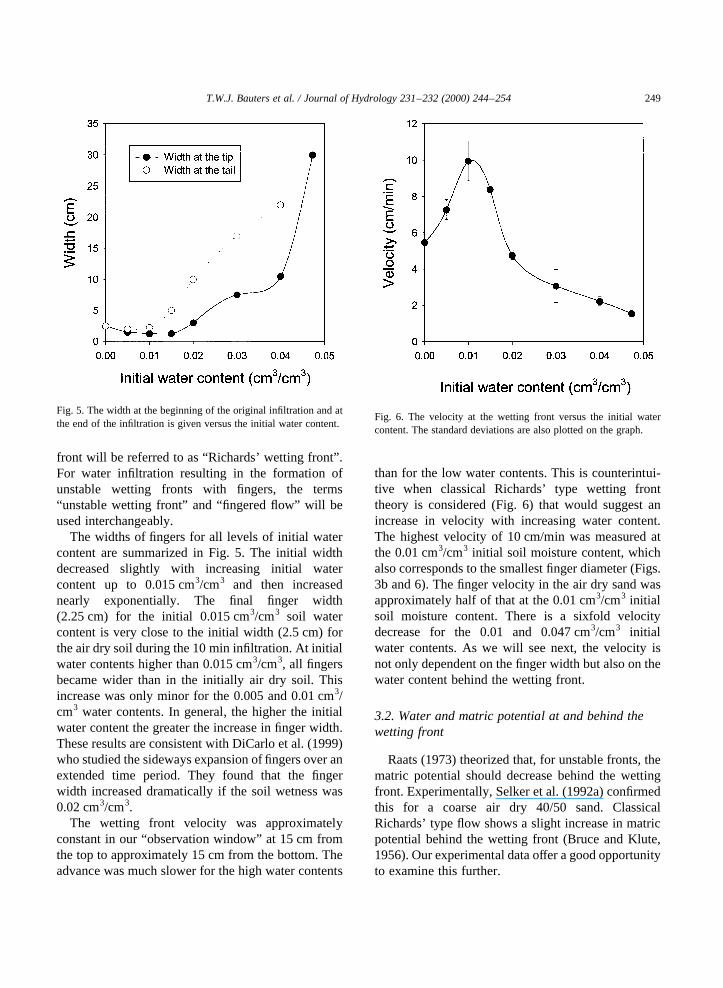
The widths of fingers for all levels of initial watercontent are summarized in Fig. 5. The initial widthdecreased slightly with increasing initial watercontent up to 0.015 cm3/cm3 and then increasednearly exponentially. The final finger width(2.25 cm) for the initial 0.015 cm3/cm3 soil watercontent is very close to the initial width (2.5 cm) forthe air dry soil during the 10 min infiltration. At initialwater contents higher than 0.015 cm3/cm3, all fingersbecame wider than in the initially air dry soil. Thisincrease was only minor for the 0.005 and 0.01 cm3/cm3 water contents. In general, the higher the initialwater content the greater the increase in finger width.These results are consistent with DiCarlo et al. (1999)who studied the sideways expansion of fingers over anextended time period. They found that the fingerwidth increased dramatically if the soil wetness was0.02 cm3/cm3.
The wetting front velocity was approximatelyconstant in our “observation window” at 15 cm fromthe top to approximately 15 cm from the bottom. Theadvance was much slower for the high water contents
than for the low water contents. This is counterintui-tive when classical Richards’ type wetting fronttheory is considered (Fig. 6) that would suggest anincrease in velocity with increasing water content.The highest velocity of 10 cm/min was measured atthe 0.01 cm3/cm3 initial soil moisture content, whichalso corresponds to the smallest finger diameter (Figs.3b and 6). The finger velocity in the air dry sand wasapproximately half of that at the 0.01 cm3/cm3 initialsoil moisture content. There is a sixfold velocitydecrease for the 0.01 and 0.047 cm3/cm3 initialwater contents. As we will see next, the velocity isnot only dependent on the finger width but also on thewater content behind the wetting front.
3.2. Water and matric potential at and behind thewetting front
Raats (1973) theorized that, for unstable fronts, thematric potential should decrease behind the wettingfront. Experimentally, Selker et al. (1992a) confirmedthis for a coarse air dry 40/50 sand. ClassicalRichards’ type flow shows a slight increase in matricpotential behind the wetting front (Bruce and Klute,1956). Our experimental data offer a good opportunityto examine this further.
T.W.J. Bauters et al. / Journal of Hydrology 231–232 (2000) 244–254 249
Fig. 6. The velocity at the wetting front versus the initial watercontent. The standard deviations are also plotted on the graph.
Fig. 5. The width at the beginning of the original infiltration and atthe end of the infiltration is given versus the initial water content.
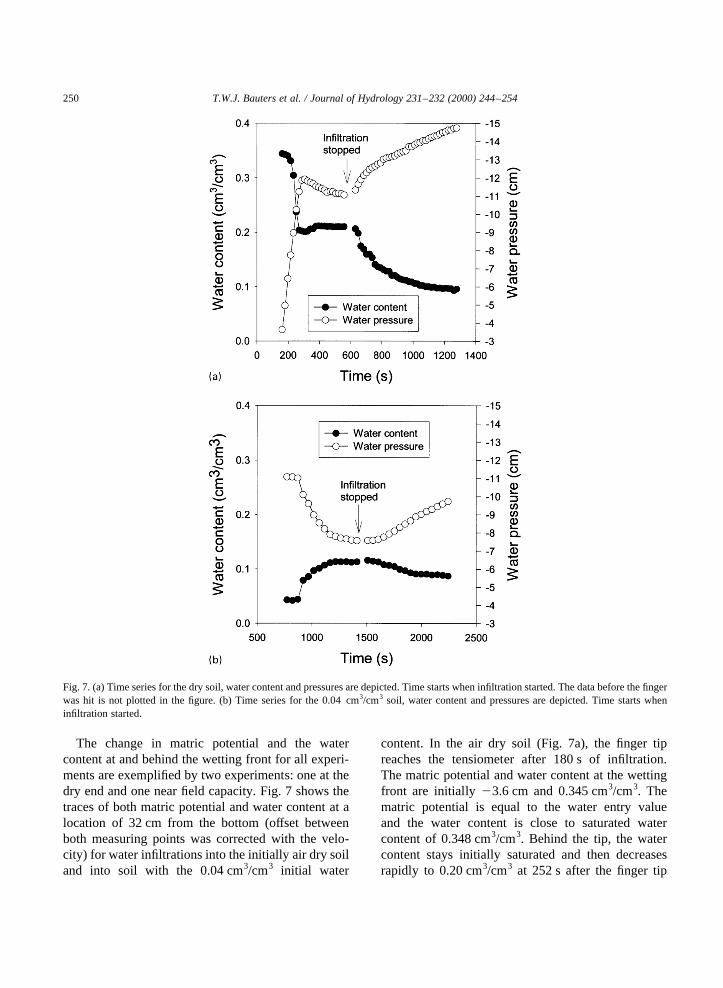
The change in matric potential and the watercontent at and behind the wetting front for all experi-ments are exemplified by two experiments: one at thedry end and one near field capacity. Fig. 7 shows thetraces of both matric potential and water content at alocation of 32 cm from the bottom (offset betweenboth measuring points was corrected with the velo-city) for water infiltrations into the initially air dry soiland into soil with the 0.04 cm3/cm3 initial water
content. In the air dry soil (Fig. 7a), the finger tipreaches the tensiometer after 180 s of infiltration.The matric potential and water content at the wettingfront are initially 23.6 cm and 0.345 cm3/cm3. Thematric potential is equal to the water entry valueand the water content is close to saturated watercontent of 0.348 cm3/cm3. Behind the tip, the watercontent stays initially saturated and then decreasesrapidly to 0.20 cm3/cm3 at 252 s after the finger tip
T.W.J. Bauters et al. / Journal of Hydrology 231–232 (2000) 244–254250
Fig. 7. (a) Time series for the dry soil, water content and pressures are depicted. Time starts when infiltration started. The data before the fingerwas hit is not plotted in the figure. (b) Time series for the 0.04 cm3/cm3 soil, water content and pressures are depicted. Time starts wheninfiltration started.
reaches the bottom of the chamber. The moisturecontent remains approximately constant until thewater is turned off at 558 s when the moisture contentagain starts to decrease. Thus, the matric potential
behind the wetting front decreases to211 cm andwhen the finger reaches the bottom of the chamberthe matric potential increases. After the water appli-cation stops, the matric potential decreases too. Forwater infiltrating into the soil with the 0.04 cm3/cm3
water content (Fig. 7b), the matric potential and watercontent exhibit the typical Richards’ pattern. Thewater content at the front is nearly 0.09 cm3/cm3
(unsaturated!) and then gradually increases to0.12 cm3/cm3. The matric potential also increasedslightly from 210.11 cm at the front to27.6 cm atthe time the water was turned off at 1410 s. Conse-quently, here for the same soil the initial unstablewetting front in dry soil becomes the Richards’ typeof wetting front when the soil is near field capacity. Toexamine how the change from unstable fingered flowto a Richards’ type wetting front occurs, we will nextcompare the difference in matric potential and moist-ure content between the tip and tail for all initial watercontents.
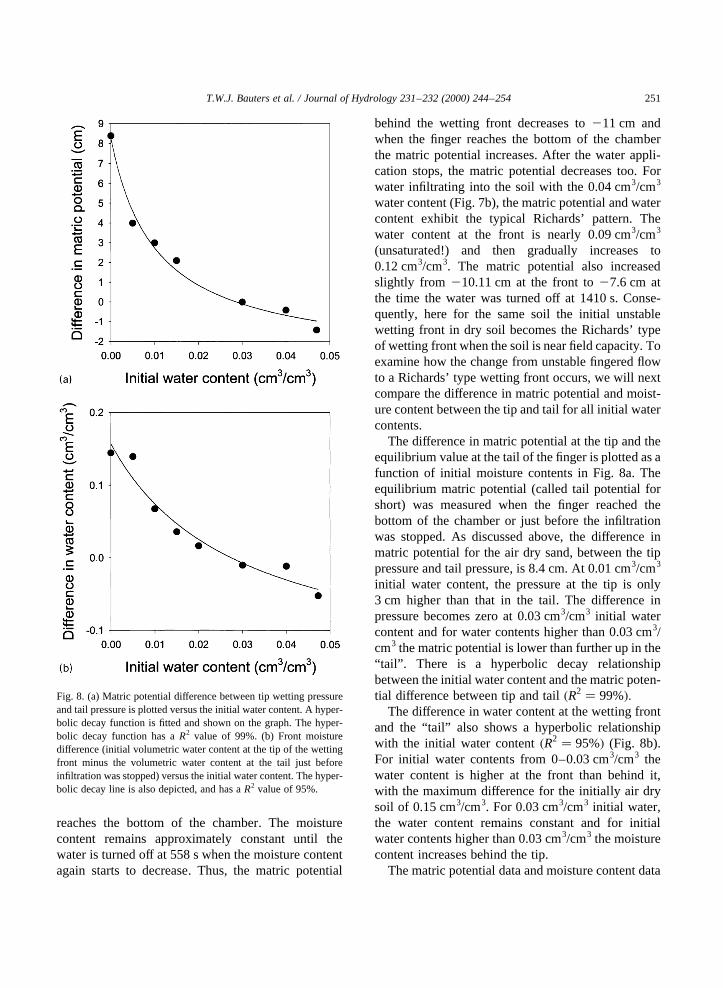
The difference in matric potential at the tip and theequilibrium value at the tail of the finger is plotted as afunction of initial moisture contents in Fig. 8a. Theequilibrium matric potential (called tail potential forshort) was measured when the finger reached thebottom of the chamber or just before the infiltrationwas stopped. As discussed above, the difference inmatric potential for the air dry sand, between the tippressure and tail pressure, is 8.4 cm. At 0.01 cm3/cm3
initial water content, the pressure at the tip is only3 cm higher than that in the tail. The difference inpressure becomes zero at 0.03 cm3/cm3 initial watercontent and for water contents higher than 0.03 cm3/cm3 the matric potential is lower than further up in the“tail”. There is a hyperbolic decay relationshipbetween the initial water content and the matric poten-tial difference between tip and tail�R2 � 99%�:
The difference in water content at the wetting frontand the “tail” also shows a hyperbolic relationshipwith the initial water content�R2 � 95%� (Fig. 8b).For initial water contents from 0–0.03 cm3/cm3 thewater content is higher at the front than behind it,with the maximum difference for the initially air drysoil of 0.15 cm3/cm3. For 0.03 cm3/cm3 initial water,the water content remains constant and for initialwater contents higher than 0.03 cm3/cm3 the moisturecontent increases behind the tip.
The matric potential data and moisture content data
T.W.J. Bauters et al. / Journal of Hydrology 231–232 (2000) 244–254 251
Fig. 8. (a) Matric potential difference between tip wetting pressureand tail pressure is plotted versus the initial water content. A hyper-bolic decay function is fitted and shown on the graph. The hyper-bolic decay function has aR2 value of 99%. (b) Front moisturedifference (initial volumetric water content at the tip of the wettingfront minus the volumetric water content at the tail just beforeinfiltration was stopped) versus the initial water content. The hyper-bolic decay line is also depicted, and has aR2 value of 95%.
in Figs. 7 and 8, together with the finger width data,shows that the fingers in air dry soil are “typical”unstable fingers as we have seen them in previousresearch (Glass et al., 1989; Selker et al., 1992b; Liuet al., 1994). The wetting front in the soil at fieldcapacity (0.047 cm3/cm3) has the typical stableRichards’ properties. The wetting front patterns forthe other initial water contents have properties ofboth. The fingers in the 0.005 and 0.01 cm3/cm3 initialwater contents have all the properties of an unstablewetting front, except that the moisture content at thefront is not saturated. The fingers formed in the 0.02and 0.03 cm3/cm3 initial water contents are inter-mediate between unstable and Richards’: the fingersexpand while the moisture content and matricpotential are nearly independent of the positionof the wetting front. For the 0.04 and 0.047 cm3/cm3 initial water contents, the fingers expand andmoisture content and matric potential increase behindthe front.
3.3. Soil water properties
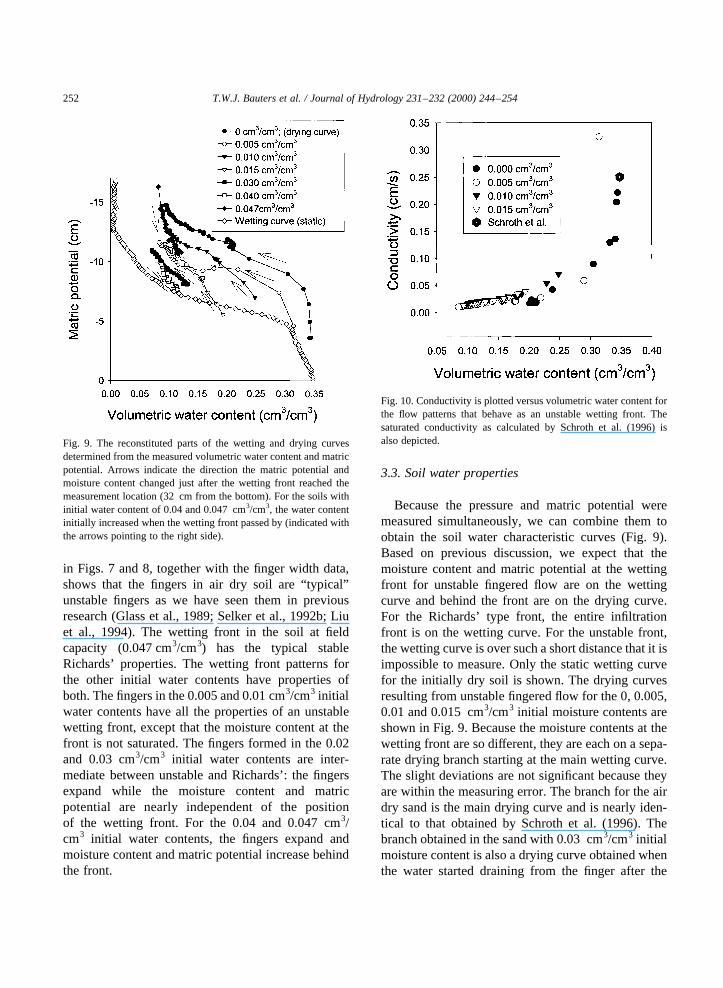
Because the pressure and matric potential weremeasured simultaneously, we can combine them toobtain the soil water characteristic curves (Fig. 9).Based on previous discussion, we expect that themoisture content and matric potential at the wettingfront for unstable fingered flow are on the wettingcurve and behind the front are on the drying curve.For the Richards’ type front, the entire infiltrationfront is on the wetting curve. For the unstable front,the wetting curve is over such a short distance that it isimpossible to measure. Only the static wetting curvefor the initially dry soil is shown. The drying curvesresulting from unstable fingered flow for the 0, 0.005,0.01 and 0.015 cm3/cm3 initial moisture contents areshown in Fig. 9. Because the moisture contents at thewetting front are so different, they are each on a sepa-rate drying branch starting at the main wetting curve.The slight deviations are not significant because theyare within the measuring error. The branch for the airdry sand is the main drying curve and is nearly iden-tical to that obtained by Schroth et al. (1996). Thebranch obtained in the sand with 0.03 cm3/cm3 initialmoisture content is also a drying curve obtained whenthe water started draining from the finger after the
T.W.J. Bauters et al. / Journal of Hydrology 231–232 (2000) 244–254252
Fig. 9. The reconstituted parts of the wetting and drying curvesdetermined from the measured volumetric water content and matricpotential. Arrows indicate the direction the matric potential andmoisture content changed just after the wetting front reached themeasurement location (32 cm from the bottom). For the soils withinitial water content of 0.04 and 0.047 cm3/cm3, the water contentinitially increased when the wetting front passed by (indicated withthe arrows pointing to the right side).
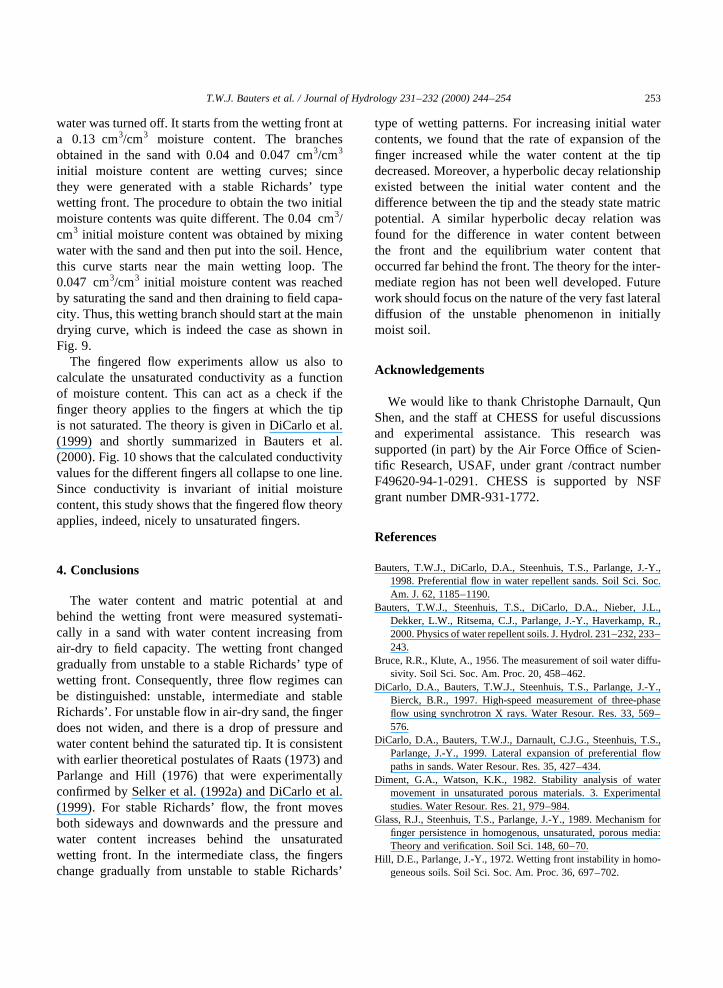
Fig. 10. Conductivity is plotted versus volumetric water content forthe flow patterns that behave as an unstable wetting front. Thesaturated conductivity as calculated by Schroth et al. (1996) isalso depicted.
water was turned off. It starts from the wetting front ata 0.13 cm3/cm3 moisture content. The branchesobtained in the sand with 0.04 and 0.047 cm3/cm3
initial moisture content are wetting curves; sincethey were generated with a stable Richards’ typewetting front. The procedure to obtain the two initialmoisture contents was quite different. The 0.04 cm3/cm3 initial moisture content was obtained by mixingwater with the sand and then put into the soil. Hence,this curve starts near the main wetting loop. The0.047 cm3/cm3 initial moisture content was reachedby saturating the sand and then draining to field capa-city. Thus, this wetting branch should start at the maindrying curve, which is indeed the case as shown inFig. 9.
The fingered flow experiments allow us also tocalculate the unsaturated conductivity as a functionof moisture content. This can act as a check if thefinger theory applies to the fingers at which the tipis not saturated. The theory is given in DiCarlo et al.(1999) and shortly summarized in Bauters et al.(2000). Fig. 10 shows that the calculated conductivityvalues for the different fingers all collapse to one line.Since conductivity is invariant of initial moisturecontent, this study shows that the fingered flow theoryapplies, indeed, nicely to unsaturated fingers.
4. Conclusions
The water content and matric potential at andbehind the wetting front were measured systemati-cally in a sand with water content increasing fromair-dry to field capacity. The wetting front changedgradually from unstable to a stable Richards’ type ofwetting front. Consequently, three flow regimes canbe distinguished: unstable, intermediate and stableRichards’. For unstable flow in air-dry sand, the fingerdoes not widen, and there is a drop of pressure andwater content behind the saturated tip. It is consistentwith earlier theoretical postulates of Raats (1973) andParlange and Hill (1976) that were experimentallyconfirmed by Selker et al. (1992a) and DiCarlo et al.(1999). For stable Richards’ flow, the front movesboth sideways and downwards and the pressure andwater content increases behind the unsaturatedwetting front. In the intermediate class, the fingerschange gradually from unstable to stable Richards’
type of wetting patterns. For increasing initial watercontents, we found that the rate of expansion of thefinger increased while the water content at the tipdecreased. Moreover, a hyperbolic decay relationshipexisted between the initial water content and thedifference between the tip and the steady state matricpotential. A similar hyperbolic decay relation wasfound for the difference in water content betweenthe front and the equilibrium water content thatoccurred far behind the front. The theory for the inter-mediate region has not been well developed. Futurework should focus on the nature of the very fast lateraldiffusion of the unstable phenomenon in initiallymoist soil.
Acknowledgements
We would like to thank Christophe Darnault, QunShen, and the staff at CHESS for useful discussionsand experimental assistance. This research wassupported (in part) by the Air Force Office of Scien-tific Research, USAF, under grant /contract numberF49620-94-1-0291. CHESS is supported by NSFgrant number DMR-931-1772.
References
Bauters, T.W.J., DiCarlo, D.A., Steenhuis, T.S., Parlange, J.-Y.,1998. Preferential flow in water repellent sands. Soil Sci. Soc.Am. J. 62, 1185–1190.
Bauters, T.W.J., Steenhuis, T.S., DiCarlo, D.A., Nieber, J.L.,Dekker, L.W., Ritsema, C.J., Parlange, J.-Y., Haverkamp, R.,2000. Physics of water repellent soils. J. Hydrol. 231–232, 233–243.
Bruce, R.R., Klute, A., 1956. The measurement of soil water diffu-sivity. Soil Sci. Soc. Am. Proc. 20, 458–462.
DiCarlo, D.A., Bauters, T.W.J., Steenhuis, T.S., Parlange, J.-Y.,Bierck, B.R., 1997. High-speed measurement of three-phaseflow using synchrotron X rays. Water Resour. Res. 33, 569–576.
DiCarlo, D.A., Bauters, T.W.J., Darnault, C.J.G., Steenhuis, T.S.,Parlange, J.-Y., 1999. Lateral expansion of preferential flowpaths in sands. Water Resour. Res. 35, 427–434.
Diment, G.A., Watson, K.K., 1982. Stability analysis of watermovement in unsaturated porous materials. 3. Experimentalstudies. Water Resour. Res. 21, 979–984.
Glass, R.J., Steenhuis, T.S., Parlange, J.-Y., 1989. Mechanism forfinger persistence in homogenous, unsaturated, porous media:Theory and verification. Soil Sci. 148, 60–70.
Hill, D.E., Parlange, J.-Y., 1972. Wetting front instability in homo-geneous soils. Soil Sci. Soc. Am. Proc. 36, 697–702.
T.W.J. Bauters et al. / Journal of Hydrology 231–232 (2000) 244–254 253

Kapoor, V., 1996. Criterion for instability of steady-state unsatu-rated flows. Transport in Porous Media 25, 313–334.
Liu, Y., Steenhuis, T.S., Parlange, J.-Y., 1994. Formation andpersistence of fingered flow fields in coarse grained soilsunder different moisture contents. J. Hydrol. 159, 187–195.
Miller, D.E., Gardner, W.H., 1962. Water infiltration into stratifiedsoil. Soil Sci. Am. Proc. 26, 115–118.
Milly, P.C.D., 1988. Advances in modeling of water in the unsatu-rated zone. Transport in Porous Media 3, 491–514.
Parlange, J.-Y., Hill, D.E., 1976. Theoretical analysis of wettingfront instability in soils. Soil Sci. 122, 236–239.
Peck, A.J., 1965. Moisture profile development and air compressionduring water uptake by bounded porous bodies. 3. Verticalcolumns. Soil Sci. 100, 44–51.
Raats, P.A.C., 1973. Unstable wetting fronts in uniform and nonuni-form soils. Soil Sci. Soc. Am. Proc. 37, 681–685.
Ritsema, C.J., Dekker, L.W., Nieber, J.L., Steenhuis, T.S., 1998.Modeling and field evidence of finger formation and fingerrecurrence in a water repellent sandy soil. Water Resour. Res.34, 555–567.
Schroth, M.H., Ahearn, S.J., Selker, J.S., Istok, J.D., 1996. Char-acterization of Miller-similar silica sands for laboratory hydro-logic studies. Soil Sci. Soc. Am. J. 60, 1331–1339.
Selker, J.S., Leclerq, P., Parlange, J.-Y., Steenhuis, T.S., 1992a.Fingered flow in two dimensions. 1. Measurement of matricpotential. Water Resour. Res. 28, 2513–2521.
Selker, J.S., Steenhuis, T.S., Parlange, J.-Y., 1992b. Fingered flowin two dimensions. 2. Predicting finger moisture profile. WaterResour. Res. 28, 2523–2528.
Yao, T.M., Hendrickx, J.M.H., 1996. Stability of wetting fronts indry homogeneous soils under low infiltration rates. Soil Sci.Soc. Am. J. 60, 20–28.
T.W.J. Bauters et al. / Journal of Hydrology 231–232 (2000) 244–254254