soil and bedrock distribution estimated from gully form and frequency: a gis-based decision-tree...
TRANSCRIPT
This article was published in an Elsevier journal. The attached copyis furnished to the author for non-commercial research and
education use, including for instruction at the author’s institution,sharing with colleagues and providing to institution administration.
Other uses, including reproduction and distribution, or selling orlicensing copies, or posting to personal, institutional or third party
websites are prohibited.
In most cases authors are permitted to post their version of thearticle (e.g. in Word or Tex form) to their personal website orinstitutional repository. Authors requiring further information
regarding Elsevier’s archiving and manuscript policies areencouraged to visit:
http://www.elsevier.com/copyright
Author's personal copy
Soil and bedrock distribution estimated from gully form andfrequency: A GIS-based decision-tree model for Lebanon
Rania Bou Kheir a,⁎, Jean Chorowicz b, Chadi Abdallah a, Damien Dhont c
a Lebanese National Council for Scientific Research/Remote Sensing Center, P.O. Box 11-8281, Beirut, Lebanonb Université Pierre & Marie Curie, Laboratoire de Tectonique, case 129, 4 place Jussieu, F 75252 Paris cedex 05, Francec Université de Pau et des Pays de l'Adour, CNRS UMR5251, Modélisation et Imagerie en Géosciences Pau, CURS–IPRA,
BP 1155 F64013 Pau cedex, France
Received 11 August 2006; received in revised form 15 March 2007; accepted 19 March 2007Available online 1 April 2007
Abstract
Torrential rainfall and relatively sparse vegetation in the Mediterranean region result in the development of gully systems andland degradation, notably on lands with specific types of soil and bedrock. This paper proposes a decision-tree model to predict thedistribution of soil and bedrock susceptible to gully erosion (white Rendzinas and marly rocks) from the form and frequency ofgullies. The study area is located in Lebanon and the model is linked to GIS. V-fold cross-validation of the pruned model indicatesthat gully features including cross-section size and shape, network frequency, types of meandering, and catchment area can explain80% of variance in soil/rock properties. The overall accuracy of the soil/rock map was estimated to be ca. 87%. The proposedmodel is relatively simple, and may also be applied to other areas. It is particularly useful when information about soil and rockobtained from conventional field surveys is limited.© 2007 Elsevier B.V. All rights reserved.
Keywords: Gully systems; Decision-tree model; Rendzina soil; Marly rock; GIS; Land degradation
1. Introduction
Long spells of drought interrupted by intensiveprecipitation intervals often cause land degradation inthe Mediterranean region. Rapid channeling processes atdifferent scalesmay cause gully erosion and the formationof badlands. Gully erosion significantly contributes to soilloss in the Mediterranean region (Vandekerckhove et al.,2000; Martinez-Casasnovas et al., 2003; Vanwalleghemet al., 2005). For instance, in SE Spain, SE Portugal andcentral Belgium, ephemeral gully erosion generatessediments of 3.4 to 9.7 m3 ha−1 yr−1 representing 44%
to 83% of total sediment production from agriculturallands (Poesen et al., 1998). In the Moroccan and Algerianmountains, gully erosion can transport 10- to 100-foldmore sediment than sheet erosion (Heusch, 1970; Rooseet al., 2000). Like most of the Mediterranean countries,Lebanon has many badlands especially in areas coveredby physically weak soils and rocks which occur in a 35%area of the country (Darwish and Zurayk, 1997; BouKheir, 2002). Badlands underlain by marly rocks andRendzina soils are difficult to map using standardconventional techniques such as the interpretation ofaerial photographs and satellite imageries as well as fieldanalysis (Buol et al., 1997; Rodgers, 2000). Rendzinasoils are immature and derived from weathering ofdisintegration products of soft limestone. The return of
Available online at www.sciencedirect.com
Geomorphology 93 (2008) 482–492www.elsevier.com/locate/geomorph
⁎ Corresponding author. Tel.: +961 4 409845/6; fax: +961 4 409847.E-mail address: [email protected] (R. Bou Kheir).
0169-555X/$ - see front matter © 2007 Elsevier B.V. All rights reserved.doi:10.1016/j.geomorph.2007.03.010
Author's personal copy
calcium to the soil profile by evaporating water, andretardation of leaching by a low permeability of softlimestone are also major factors preventing developmentand maturation of these soils (Reinfenberg, 1952; Tarziand Paeth, 1975). They have been historically excludedfrom soil resource inventories due to the huge investmentof time and resources required tomap them, specifically inwide areas with difficult access and rugged topography.However, the cross-sectional size and shape of ephemeralgullies can be detected and measured easily, and thereforedesigned as predictor variables for differentiating Ren-dzina soils from mixed marly lithological formations inlarge badlands areas. In fact, the erosive force in gullies isan important soil-forming condition that can preventpodzolization and andolization, and because of concen-trated water in gullies soils are subject to continuouswetness.
This study proposes a statistical decision-tree model topredict the geographic distribution of soils and rocksbased on the analysis of gully properties, in the frame ofGeographic Information Systems (GIS) for a simple,realistic and practical method. It comprises a set of rules toclassify (predict) a categorical dependent target variable(soil or rock distribution), using the values of independentpredictor variables. These predictors comprise thegeomorphic characteristics of gullies including bothnumerical (e.g. cross-section size) and categorical (e.g.cross-section shape) features. The machine-learning,probabilistic, non-parametric decision-tree method hasbeen extensively exploited for vegetation mapping (Leesand Ritman, 1991), ecological modeling (Michaelsenet al., 1994) and remote sensing studies such as land useclassification based on threshold values of various banddata (Huang and Jensen, 1997; Friedl et al., 1999). It isessentially an exploratory method (Bayes and Mackey,1991; Venables and Ripley, 1994), and it has been usedpredictively (Franklin, 1998) without the need ofspecifying the form of the function to be fitted to thedata. The resulting soil/rock map, at 1:50,000 cartograph-ic scale, serves as a pedological and geological inventoryuseful for land-use management and environmentaldecision-making.
2. The study area
The study area (173 km2), situated at the southerncoastal part of Lebanon, is chosen because it comprisesa mixture of white Rendzina soils and soft marls thatwitnesses major gullies. This mixture, covering 32% ofits total area, is attributed to the faulted Senoniangeological formation (c6) (Dubertret, 1955) and hasbeen selected for developing and testing the decision-
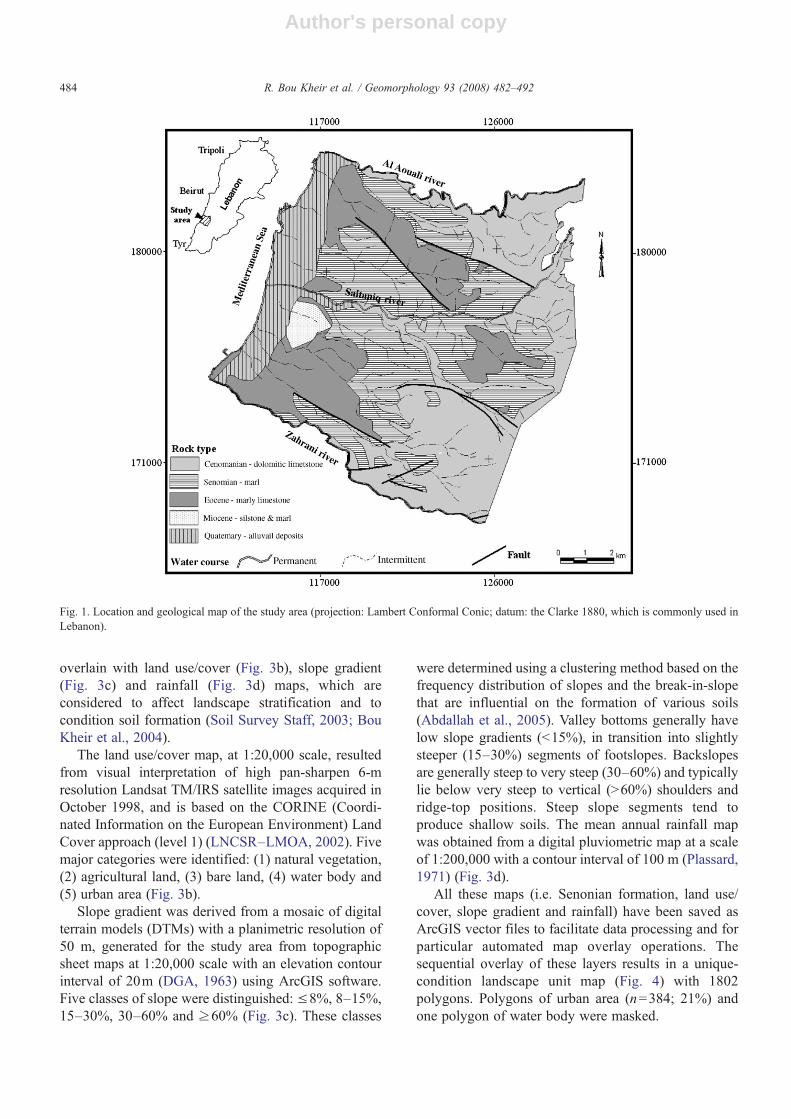
tree methodology. The area is bounded to the west bythe Mediterranean Sea, to the north and south by the Al-Aouali and Zahrani rivers respectively, and to the east bythe water divide (Fig. 1). Three perennial (Al-Aouali,Saitaniq, and Zahrani) and several seasonal coastalrivers cross or border the study area, flowing seawardwith an approximately E–W orientation.
The natural vegetation cover occupies the largestportion of the study area (34%), with 16% dedicated toshrubs and 18% to herbaceous vegetation, whilst it maybe regularly grazed by sheep and goats. Agriculturallands (27%) are slightly less widespread than naturalvegetation. They include field crops, orchards (decidu-ous fruit trees, citrus, bananas, olives and grapevines),vegetables and greenhouses. Bare lands (8%) areascribed to the unexploited terrains dominated by barerocks and soils including beaches. Human practices arereflected by discontinuous and continuous urban areasand road networks. Retaining walls and terraces are alsocommon but most of them are of small dimensions.
The climate is typically Mediterranean, with a meanannual precipitation between 600 and 1000 mm, and asignificant amount of rain (75–80%) falls in the winterperiod (November to March). The terrains are oftenunprotected during winter, the critical period for watererosion because of the lack of dense vegetation. The 20–25% of remaining precipitation corresponds to thunder-storms in autumn and rain showers in spring (CAL, 1982).Evaluation of erosion risk in Lebanon reflects adominance of high soil loss rates (Bou Kheir et al., 2006).
3. Modeling approach
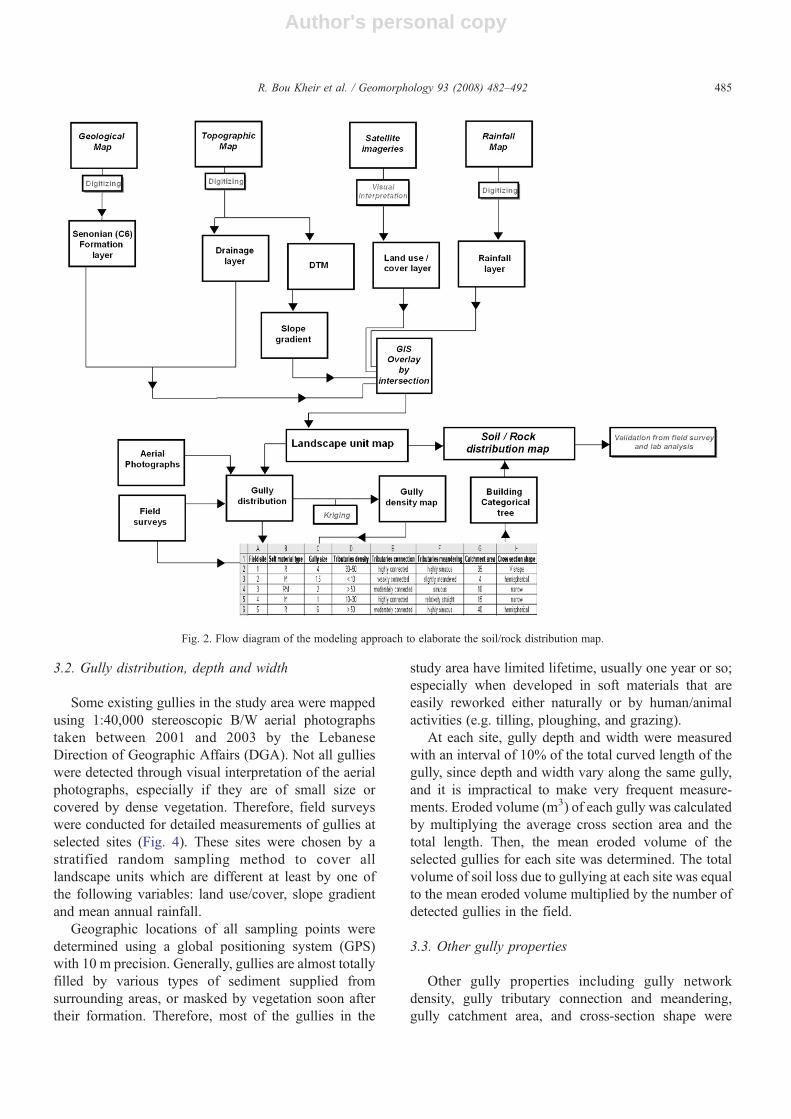
The mapping of soil/rock distribution was realizedin several steps (Fig. 2). Some base maps were used toproduce the landscape unit map. It was combined withfield surveys and aerial photograph interpretation forallocating gullies and defining their properties. Adecision-tree model was then explored on the col-lected gully properties, and this model was used formapping soils/rocks within the Senonian formationusing GIS.
3.1. Classification of landscape units
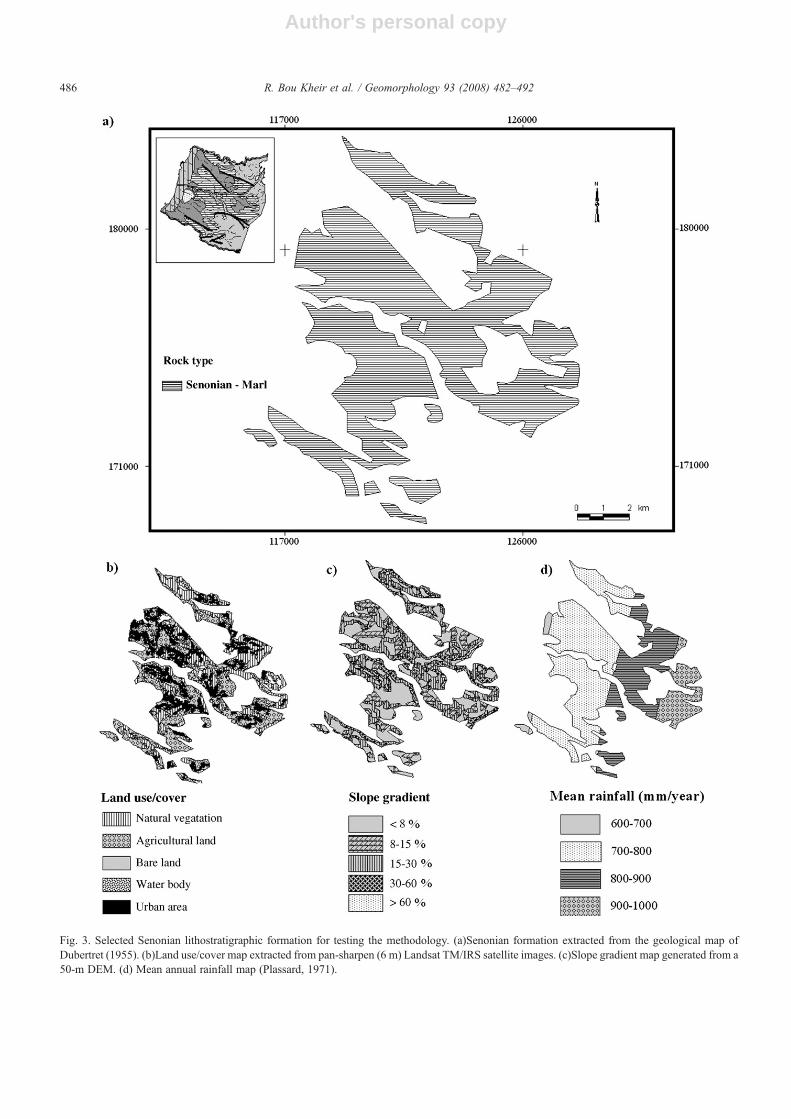
The selected Senonian lithostratigraphic formation(Fig. 3a) which is prone to gully erosion has alreadybeen mapped in the study area (the geological map Saidasheet at 1:50,000 scale; Dubertret, 1955), but withoutdifferentiating the soil/rock distribution variation. Thepolygon layer of this formation has been extracted fromthe scanned and registered geological map. Then it was
483R. Bou Kheir et al. / Geomorphology 93 (2008) 482–492
Author's personal copy
overlain with land use/cover (Fig. 3b), slope gradient(Fig. 3c) and rainfall (Fig. 3d) maps, which areconsidered to affect landscape stratification and tocondition soil formation (Soil Survey Staff, 2003; BouKheir et al., 2004).
The land use/cover map, at 1:20,000 scale, resultedfrom visual interpretation of high pan-sharpen 6-mresolution Landsat TM/IRS satellite images acquired inOctober 1998, and is based on the CORINE (Coordi-nated Information on the European Environment) LandCover approach (level 1) (LNCSR–LMOA, 2002). Fivemajor categories were identified: (1) natural vegetation,(2) agricultural land, (3) bare land, (4) water body and(5) urban area (Fig. 3b).
Slope gradient was derived from a mosaic of digitalterrain models (DTMs) with a planimetric resolution of50 m, generated for the study area from topographicsheet maps at 1:20,000 scale with an elevation contourinterval of 20m (DGA, 1963) using ArcGIS software.Five classes of slope were distinguished: ≤8%, 8–15%,15–30%, 30–60% and ≥60% (Fig. 3c). These classes
were determined using a clustering method based on thefrequency distribution of slopes and the break-in-slopethat are influential on the formation of various soils(Abdallah et al., 2005). Valley bottoms generally havelow slope gradients (b15%), in transition into slightlysteeper (15–30%) segments of footslopes. Backslopesare generally steep to very steep (30–60%) and typicallylie below very steep to vertical (N60%) shoulders andridge-top positions. Steep slope segments tend toproduce shallow soils. The mean annual rainfall mapwas obtained from a digital pluviometric map at a scaleof 1:200,000 with a contour interval of 100 m (Plassard,1971) (Fig. 3d).
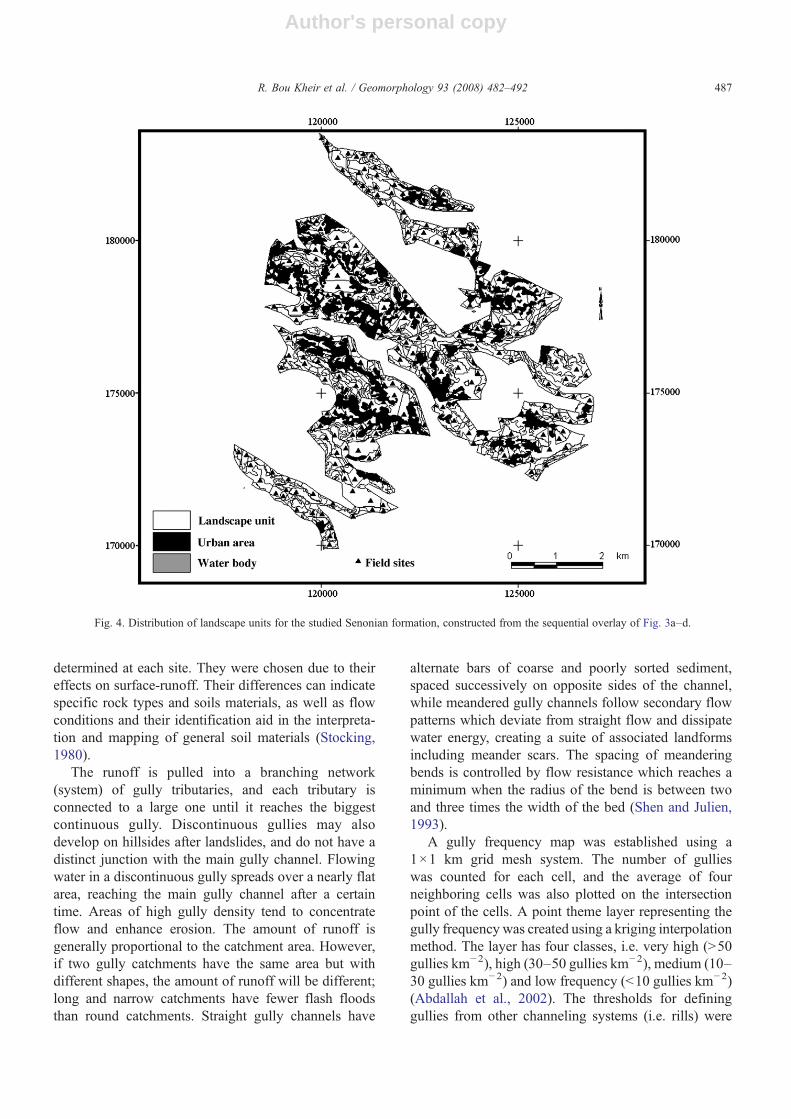
All these maps (i.e. Senonian formation, land use/cover, slope gradient and rainfall) have been saved asArcGIS vector files to facilitate data processing and forparticular automated map overlay operations. Thesequential overlay of these layers results in a unique-condition landscape unit map (Fig. 4) with 1802polygons. Polygons of urban area (n=384; 21%) andone polygon of water body were masked.
Fig. 1. Location and geological map of the study area (projection: Lambert Conformal Conic; datum: the Clarke 1880, which is commonly used inLebanon).
484 R. Bou Kheir et al. / Geomorphology 93 (2008) 482–492
Author's personal copy
3.2. Gully distribution, depth and width
Some existing gullies in the study area were mappedusing 1:40,000 stereoscopic B/W aerial photographstaken between 2001 and 2003 by the LebaneseDirection of Geographic Affairs (DGA). Not all gullieswere detected through visual interpretation of the aerialphotographs, especially if they are of small size orcovered by dense vegetation. Therefore, field surveyswere conducted for detailed measurements of gullies atselected sites (Fig. 4). These sites were chosen by astratified random sampling method to cover alllandscape units which are different at least by one ofthe following variables: land use/cover, slope gradientand mean annual rainfall.
Geographic locations of all sampling points weredetermined using a global positioning system (GPS)with 10 m precision. Generally, gullies are almost totallyfilled by various types of sediment supplied fromsurrounding areas, or masked by vegetation soon aftertheir formation. Therefore, most of the gullies in the
study area have limited lifetime, usually one year or so;especially when developed in soft materials that areeasily reworked either naturally or by human/animalactivities (e.g. tilling, ploughing, and grazing).
At each site, gully depth and width were measuredwith an interval of 10% of the total curved length of thegully, since depth and width vary along the same gully,and it is impractical to make very frequent measure-ments. Eroded volume (m3) of each gully was calculatedby multiplying the average cross section area and thetotal length. Then, the mean eroded volume of theselected gullies for each site was determined. The totalvolume of soil loss due to gullying at each site was equalto the mean eroded volume multiplied by the number ofdetected gullies in the field.
3.3. Other gully properties
Other gully properties including gully networkdensity, gully tributary connection and meandering,gully catchment area, and cross-section shape were
Fig. 2. Flow diagram of the modeling approach to elaborate the soil/rock distribution map.
485R. Bou Kheir et al. / Geomorphology 93 (2008) 482–492
Author's personal copy
Fig. 3. Selected Senonian lithostratigraphic formation for testing the methodology. (a)Senonian formation extracted from the geological map ofDubertret (1955). (b)Land use/cover map extracted from pan-sharpen (6 m) Landsat TM/IRS satellite images. (c)Slope gradient map generated from a50-m DEM. (d) Mean annual rainfall map (Plassard, 1971).
486 R. Bou Kheir et al. / Geomorphology 93 (2008) 482–492
Author's personal copy
determined at each site. They were chosen due to theireffects on surface-runoff. Their differences can indicatespecific rock types and soils materials, as well as flowconditions and their identification aid in the interpreta-tion and mapping of general soil materials (Stocking,1980).
The runoff is pulled into a branching network(system) of gully tributaries, and each tributary isconnected to a large one until it reaches the biggestcontinuous gully. Discontinuous gullies may alsodevelop on hillsides after landslides, and do not have adistinct junction with the main gully channel. Flowingwater in a discontinuous gully spreads over a nearly flatarea, reaching the main gully channel after a certaintime. Areas of high gully density tend to concentrateflow and enhance erosion. The amount of runoff isgenerally proportional to the catchment area. However,if two gully catchments have the same area but withdifferent shapes, the amount of runoff will be different;long and narrow catchments have fewer flash floodsthan round catchments. Straight gully channels have
alternate bars of coarse and poorly sorted sediment,spaced successively on opposite sides of the channel,while meandered gully channels follow secondary flowpatterns which deviate from straight flow and dissipatewater energy, creating a suite of associated landformsincluding meander scars. The spacing of meanderingbends is controlled by flow resistance which reaches aminimum when the radius of the bend is between twoand three times the width of the bed (Shen and Julien,1993).
A gully frequency map was established using a1×1 km grid mesh system. The number of gullieswas counted for each cell, and the average of fourneighboring cells was also plotted on the intersectionpoint of the cells. A point theme layer representing thegully frequency was created using a kriging interpolationmethod. The layer has four classes, i.e. very high (N50gullies km−2), high (30–50 gullies km−2), medium (10–30 gullies km−2) and low frequency (b10 gullies km−2)(Abdallah et al., 2002). The thresholds for defininggullies from other channeling systems (i.e. rills) were
Fig. 4. Distribution of landscape units for the studied Senonian formation, constructed from the sequential overlay of Fig. 3a–d.
487R. Bou Kheir et al. / Geomorphology 93 (2008) 482–492
Author's personal copy
taken from the literature (Souchère, 1995; Poesen et al.,1998; Roose et al., 2000): a minimum cross-sectionalarea of 0.1 m2 and a minimum incision depth of 30 cm.
The connection between gully tributaries and themajor gully stream was evaluated visually on the gullymap. Three tributaries connection classes were distin-guished: more than 75% of gully tributaries areconnected to the major gully stream, between 25 and75%, and less than 25%. On the same gully map,tributary meandering based on sinuosity, i.e. the ratio ofchannel length to valley length (Chow, 1959), wasdivided in four classes: highly sinuous (N2.5), sinuous(1.5–2.5), slightly meandered (0.5–1.5) and relativelystraight (b0.5) (Meyer andMartinez-Casasnovas, 1999).
The catchments area for each gully system wascalculated. Gully cross-section shape was determinedbased on the classification of Way (1978). Four gullyshape classes were distinguished: V-shape, hemispher-ical U-shape, narrow rectangular ditch and naturalirregular channel shapes. These shapes reflect thetextural composition and cohesiveness of the sur-rounding soils. V-shaped gullies develop where thesubsoil has more resistance against erosion than thetopsoil. This gully form is commonly found in terracesand outwash plains, indicating unconsolidated materi-als of a granular texture. U-shaped gullies with verticalwalls on both sides are formed where the topsoil andsubsoil have the same resistance against erosion, andare indicative of bedrocks or moderately cohesiveweakly cemented sand-clays spread in coastal plains.Gullies with a narrow rectangular ditch shape can beformed where the gully bottom is made of moreresistant material than the topsoil, being specific tomoderately cohesive silty soils. Irregular channelshapes are common where cohesive and silty claydeposits are found on the ground (e.g. lake beds andmarine terraces).
3.4. Statistical analysis
An ASCII point data file for the field samplelocations was constructed. This file comprises severalcolumns: geographic site coordinates (x, y), the softmaterial type [Rendzina soil (R) or marly rock (M)], andvarious gully properties being both continuous (gullyvolume and catchments area) and categorical withclasses (gully network frequency, tributaries connectionand meandering level). A decision tree-model wasexplored using this file with several steps: (1) find thebest split through the examination of each predictor, (2)create two child nodes, (3) determine into which childnode each field location goes, and (4) continue the
process until the criterion of the minimum node size isfulfilled.
The number of splits to be evaluated is equal to2(k − 1)−1, where k is the number of categorical classesof predictor variables (Breiman, 2001). For example, ifwe consider the tributaries connection variable withthree classes, three splits need to be tried; if four classes(e.g. tributaries meandering), seven splits. With theincrease of the number of classes, there is an exponentialgrowth of splits and computation time. The latter maybecome problematic if there are more than 12 predictorcategorical classes (Clarke and Pregibon, 1992), whichis not the case in our study. We considered differences inthe value of a continuous variable up to 1% of the wholerange, which is equivalent to ten thousand classes (Lohand Shih, 1997).
The algorithm used for evaluating the quality of theconstructed tree is the Gini splitting method, which isconsidered as the default method (Breiman, 2001). Eachsplit is chosen in order to maximize the heterogeneity(node impurity) of the classes of a target variable inchild nodes. The Gini method has been consideredslightly better than the Entropy tree fitting algorithm(Loh and Shih, 1997; Breiman, 2001). The Ginicoefficient is used to measure the degree of inequalityof a variable in terms of frequency distribution. It rangesbetween 0 (perfect equality) and 1 (perfect inequality).The Gini mean difference (GMD) is defined as the meanof the difference between each observation and everyother observation (Breiman, 2001):
GMD ¼ 1N 2
XN
j¼1
XN
k¼1
fjXj � Xk jg ð1Þ
Where X is cumulative percentage (or fractions) oftheir respective values ( j and k), and N is the number ofelements (observations).
A minimum node size of ten was applied in thisstudy, since a simpler tree is easier to understand andfaster to use, and more importantly, smaller treesprovide greater predictive accuracy for unseen data.This number has also been used in other studies(Murphy et al., 1994; Zhang and Burton, 1999).
The maximum tree elevation or size was not specifiedin this study. A too large tree needs to be pruned back toits optimal size (i.e. backward pruning) on the basis of aV-fold cross-validation (Berk, 2003) with severalassumptions such as random-row-holdback validation,fixed number of terminal nodes and smooth minimumspikes. It does not require a separate, independent datasetwhich would reduce the data used to build the tree. It
488 R. Bou Kheir et al. / Geomorphology 93 (2008) 482–492
Author's personal copy
partitions the used dataset to build the referenceunpruned tree into a number of groups (i.e. folds). A10 V-folds value was adopted in this study, since a largervalue increases computation time and may not result in amore optimal tree. After the ten test trees were built, theirclassification error rate (known as cross validation cost)as a function of tree size was averaged. The tree size thatproduces the minimum cross validation cost (error)corresponds to the optimal tree.
3.5. Construction of soil/rock distribution map
Using the pruned decision tree-model, the landscapeunit map was converted into a predictive map of soil/rock distribution under a GIS environment. If differentend results (Rendzina soil or marly rock) characterizefield sites within a given landscape unit, new sub-polygons were delineated. In the case of similar results,unit polygons were joined. This map was validated
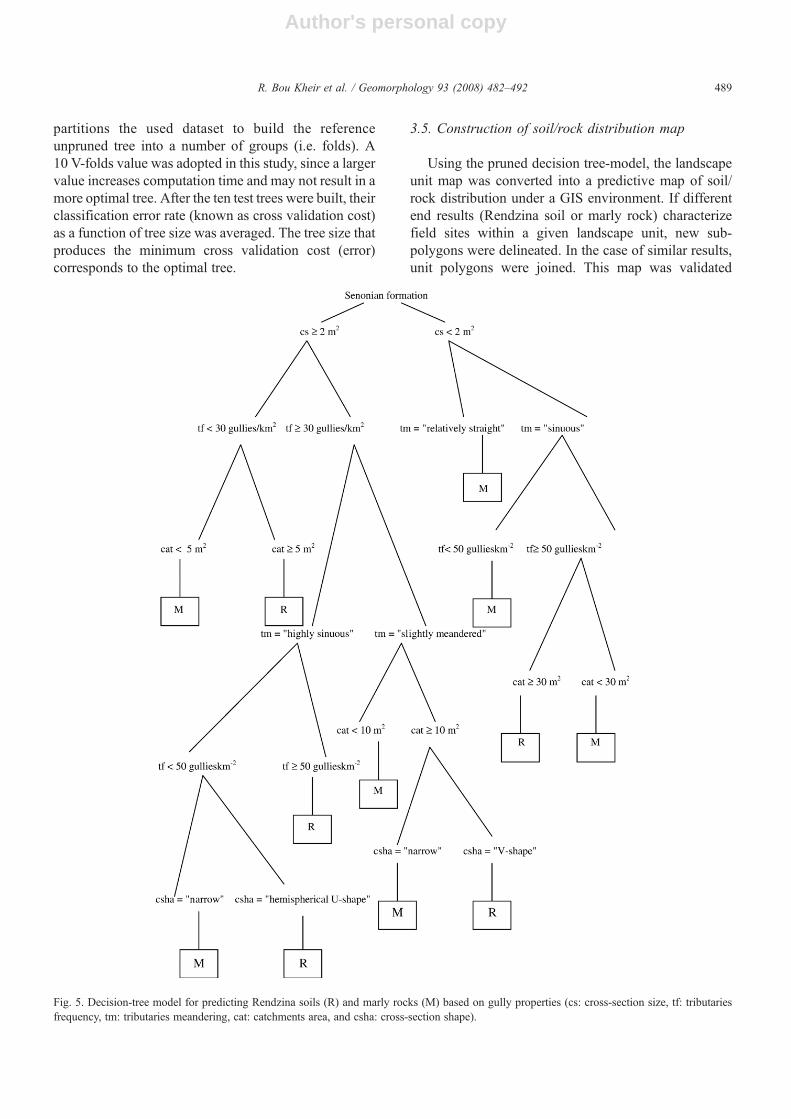
Fig. 5. Decision-tree model for predicting Rendzina soils (R) and marly rocks (M) based on gully properties (cs: cross-section size, tf: tributariesfrequency, tm: tributaries meandering, cat: catchments area, and csha: cross-section shape).
489R. Bou Kheir et al. / Geomorphology 93 (2008) 482–492
Author's personal copy
based on field surveys. An independent dataset has beenchosen randomly in all landscape units, consisting of30% (60 sites) of the total number of field sites, and anerror matrix was established.
4. Results and discussion
4.1. Model performance evaluation
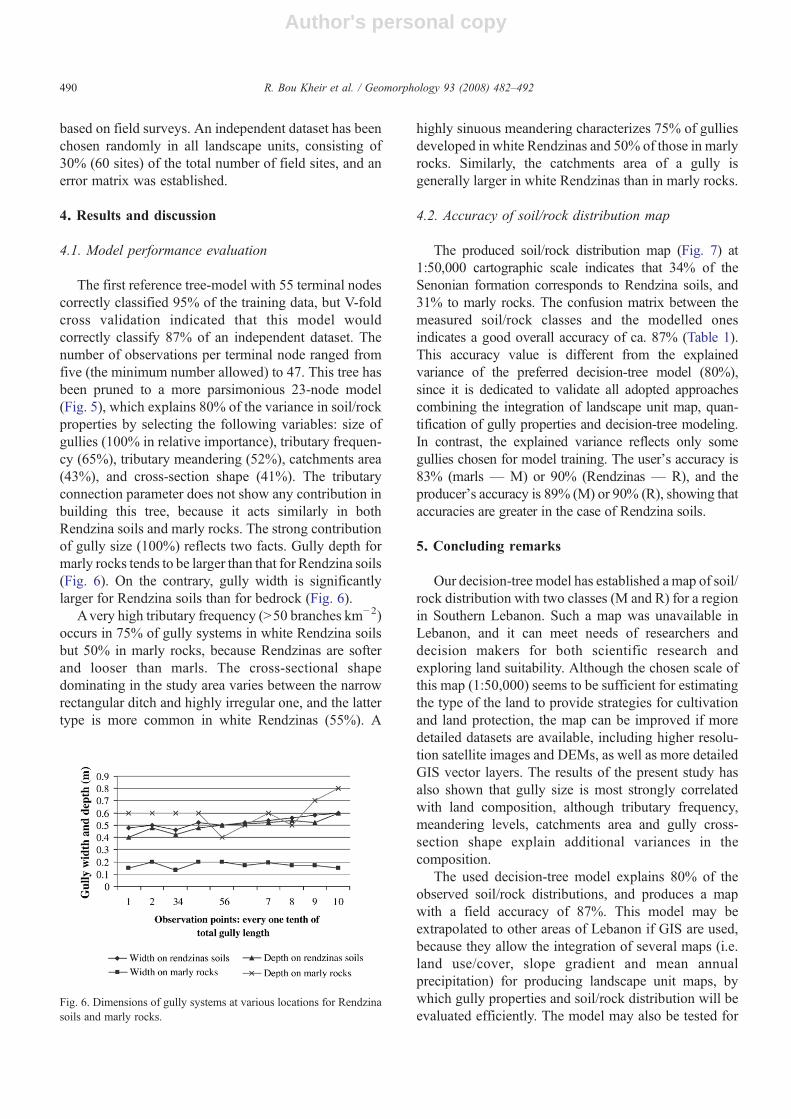
The first reference tree-model with 55 terminal nodescorrectly classified 95% of the training data, but V-foldcross validation indicated that this model wouldcorrectly classify 87% of an independent dataset. Thenumber of observations per terminal node ranged fromfive (the minimum number allowed) to 47. This tree hasbeen pruned to a more parsimonious 23-node model(Fig. 5), which explains 80% of the variance in soil/rockproperties by selecting the following variables: size ofgullies (100% in relative importance), tributary frequen-cy (65%), tributary meandering (52%), catchments area(43%), and cross-section shape (41%). The tributaryconnection parameter does not show any contribution inbuilding this tree, because it acts similarly in bothRendzina soils and marly rocks. The strong contributionof gully size (100%) reflects two facts. Gully depth formarly rocks tends to be larger than that for Rendzina soils(Fig. 6). On the contrary, gully width is significantlylarger for Rendzina soils than for bedrock (Fig. 6).
Avery high tributary frequency (N50 branches km−2)occurs in 75% of gully systems in white Rendzina soilsbut 50% in marly rocks, because Rendzinas are softerand looser than marls. The cross-sectional shapedominating in the study area varies between the narrowrectangular ditch and highly irregular one, and the lattertype is more common in white Rendzinas (55%). A
highly sinuous meandering characterizes 75% of gulliesdeveloped in white Rendzinas and 50% of those in marlyrocks. Similarly, the catchments area of a gully isgenerally larger in white Rendzinas than in marly rocks.
4.2. Accuracy of soil/rock distribution map
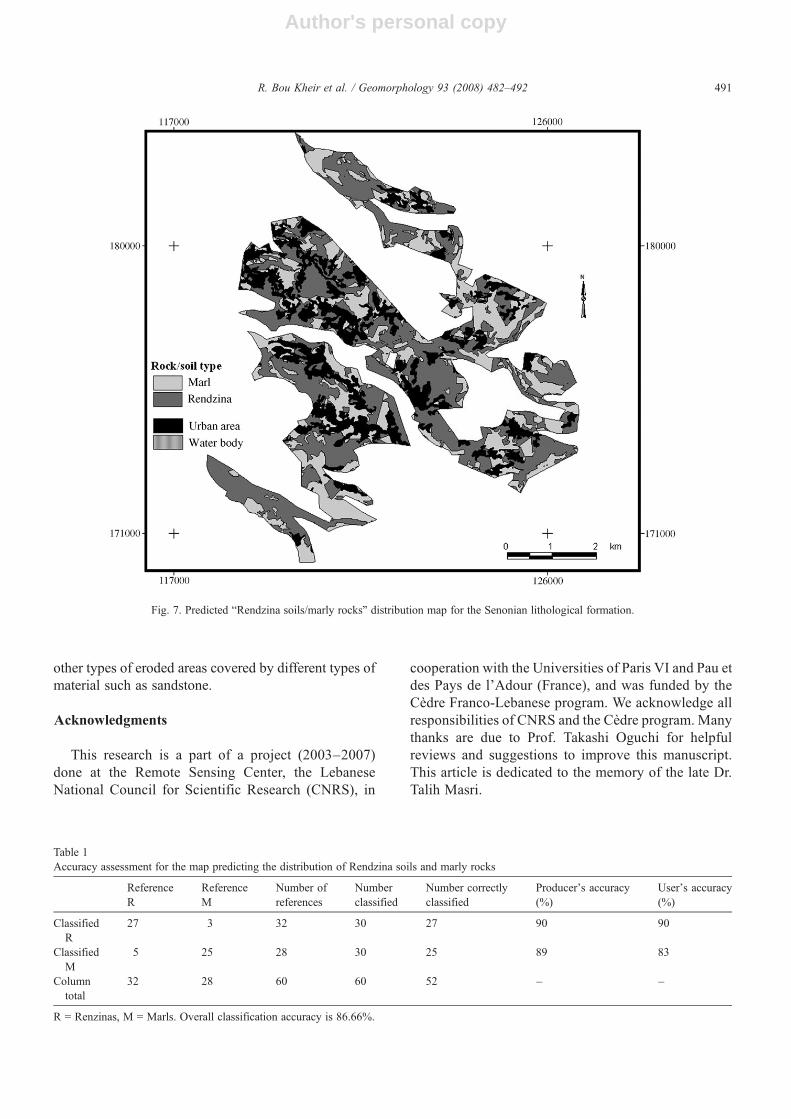
The produced soil/rock distribution map (Fig. 7) at1:50,000 cartographic scale indicates that 34% of theSenonian formation corresponds to Rendzina soils, and31% to marly rocks. The confusion matrix between themeasured soil/rock classes and the modelled onesindicates a good overall accuracy of ca. 87% (Table 1).This accuracy value is different from the explainedvariance of the preferred decision-tree model (80%),since it is dedicated to validate all adopted approachescombining the integration of landscape unit map, quan-tification of gully properties and decision-tree modeling.In contrast, the explained variance reflects only somegullies chosen for model training. The user's accuracy is83% (marls — M) or 90% (Rendzinas — R), and theproducer's accuracy is 89% (M) or 90% (R), showing thataccuracies are greater in the case of Rendzina soils.
5. Concluding remarks
Our decision-tree model has established a map of soil/rock distribution with two classes (M and R) for a regionin Southern Lebanon. Such a map was unavailable inLebanon, and it can meet needs of researchers anddecision makers for both scientific research andexploring land suitability. Although the chosen scale ofthis map (1:50,000) seems to be sufficient for estimatingthe type of the land to provide strategies for cultivationand land protection, the map can be improved if moredetailed datasets are available, including higher resolu-tion satellite images and DEMs, as well as more detailedGIS vector layers. The results of the present study hasalso shown that gully size is most strongly correlatedwith land composition, although tributary frequency,meandering levels, catchments area and gully cross-section shape explain additional variances in thecomposition.
The used decision-tree model explains 80% of theobserved soil/rock distributions, and produces a mapwith a field accuracy of 87%. This model may beextrapolated to other areas of Lebanon if GIS are used,because they allow the integration of several maps (i.e.land use/cover, slope gradient and mean annualprecipitation) for producing landscape unit maps, bywhich gully properties and soil/rock distribution will beevaluated efficiently. The model may also be tested for
Fig. 6. Dimensions of gully systems at various locations for Rendzinasoils and marly rocks.
490 R. Bou Kheir et al. / Geomorphology 93 (2008) 482–492
Author's personal copy
other types of eroded areas covered by different types ofmaterial such as sandstone.
Acknowledgments
This research is a part of a project (2003–2007)done at the Remote Sensing Center, the LebaneseNational Council for Scientific Research (CNRS), in
cooperation with the Universities of Paris VI and Pau etdes Pays de l'Adour (France), and was funded by theCèdre Franco-Lebanese program. We acknowledge allresponsibilities of CNRS and the Cèdre program. Manythanks are due to Prof. Takashi Oguchi for helpfulreviews and suggestions to improve this manuscript.This article is dedicated to the memory of the late Dr.Talih Masri.
Table 1Accuracy assessment for the map predicting the distribution of Rendzina soils and marly rocks
ReferenceR
ReferenceM
Number ofreferences
Numberclassified
Number correctlyclassified
Producer's accuracy(%)
User's accuracy(%)
ClassifiedR
27 3 32 30 27 90 90
ClassifiedM
5 25 28 30 25 89 83
Columntotal
32 28 60 60 52 – –
R = Renzinas, M = Marls. Overall classification accuracy is 86.66%.
Fig. 7. Predicted “Rendzina soils/marly rocks” distribution map for the Senonian lithological formation.
491R. Bou Kheir et al. / Geomorphology 93 (2008) 482–492
Author's personal copy
References
Abdallah, C., Khawlie, M., Shaban, A., 2002. Utilization of remotesensing and GIS to assign a model for infiltration capacity andwater potentiality in Occidental Lebanon. Workshop on mathe-matical models for sustainable water resources development andtheir role in decision making, Rabat, Morocco. 18–20/12/2002.
Abdallah, C., Chorowicz, J., Bou Kheir, R., Khawlie, M., 2005.Detecting major terrain parameters relating to mass movements'occurrence using GIS, remote sensing and statistical correlations,case study Lebanon. Remote Sensing of Environment 99, 448–461.
Bayes, A.J., Mackey, B.G., 1991. Algorithms for monotonic functionsand their application to ecological studies in vegetation science.Ecological Modelling 56, 135–159.
Berk,R.A., 2003.An Introduction toEnsembleMethods forDataAnalysis.Technical Report. Department of Statistics, UCLA, Los Angeles.
Bou Kheir, R., 2002. Study of soil–water erosion risk by remote sensingand GIS: application to a representative region of Lebanon. Ph.D.thesis, AgronomicNational Institute of Paris-Grignon, France. 261 pp.
Bou Kheir, R., Girard, M.-C., Khawlie, M., 2004. Utilisation d'uneclassification structurale OASIS pour la cartographie d'unités depaysage dans une région représentative du Liban. Canadian Journalof Remote Sensing 30 (4), 1–14.
BouKheir, R., Cerdan, O., Abdallah, C., 2006. Regional soil erosion riskassessment in Lebanon. Geomorphology 82, 347–359.
Breiman, L., 2001.Decision-tree forests.MachineLearning 45 (1), 5–32.Buol, S.W., Hole, F.D., McCracken, R.J., 1997. Soil Genesis and Clas-
sication, 4th edition. Iowa State University Press, Amsterdam. 527 pp.CAL, 1982. Climatic Atlas of Lebanon. Meteorological Service,
Ministry of Public Affairs and Transports, Tome I, 52 pp.Chow, V.T., 1959. Open-Channel Hydraulics. McGraw-Hill, New York.Clarke, L.A., Pregibon, D., 1992. Tree-basedmodels. In: Chambers, J.M.,
Hastie, T.J. (Eds.), Statistical Models. Chapman & Hall, New York,pp. 377–419.
Darwish, T., Zurayk, R., 1997. Distribution and nature of RedMediterranean soils in Lebanon along an altitudinal sequence.Catena 28, 191–202.
DGA, 1963. Topographic maps at a scale of 1:50,000. Direction ofGeographic Affairs, Republic of Lebanon.
Dubertret, L., 1955. Geological maps of Lebanon at 1:50,000 scale.Ministry of Public Affairs, Republic of Lebanon.
Franklin, J., 1998. Predicting the distributions of shrub species inCalifornia chaparral and coastal stage communities from climate andterrain-derived variables. Journal of Vegetation Science 9, 733–748.
Friedl,M.A., Brodley, C.E., Strahler, A.H., 1999.Maximizing land coverclassification accuracies produced by decision trees at continental toglobal scales. IEEE Transactions on Geoscience Remote Sensing 37,969–977.
Heusch, R.B., 1970. L'érosion du pré-rif. Une étude quantitative.Annales de la recherche forestière du Maroc 12, 9–176.
Huang,X., Jensen, J.R., 1997.Amachine-learning approach to automatedknowledge-base building for remote sensing image analysis with GISdata. Photogrammetric Engineering and Remote Sensing 63,1185–1194.
Lees, B.G., Ritman, K., 1991. Decision-tree and rule-induction approachto integration of remotely sensed andGIS data inmapping vegetationin disturbed or hilly environments. Environmental Management 15,823–831.
LNCSR–LMOA, 2002. Land use/cover map of Lebanon at a scale of1:20,000. Lebanese National Council for Scientific Research andLebanese Ministry of Agriculture.
Loh, W.Y., Shih, Y.S., 1997. Split selection methods for classificationtrees. Statistica Sinica 7, 815–840.
Martinez-Casasnovas, J.A., Anton-Fernandez, C., Ramos, M.C., 2003.Sediment production in large gullies of the Mediterranean area (NESpain) from high-resolution digital elevation models and geograph-ical information systems analysis. Earth Surface Processes andLandforms 28, 443–456.
Meyer, A., Martinez-Casasnovas, J.A., 1999. Prediction of existing gullyerosion in Vineyard parcels of the NE Spain: a logistic modelingapproach. Soil Tillage Resources 50, 319–331.
Michaelsen, J., Schimel, D.S., Friedl, M.A., Davis, F.W., Dubayah, R.C.,1994. Regression tree analysis of satellite and terrain data to guidevegetation sampling and surveys. Journal of Vegetation Science 5,673–686.
Murphy, P., Patrick, M., Michael, J.P., 1994. Exploring the decisionforest: an empirical investigation of Occam's Razor in decision-treeinduction. Journal of Artificial Intelligence Research 1, 257–275.
Plassard, J., 1971. Pluviometric map of Lebanon at a scale of 1:200,000.General Direction of Civil Navigation, Ministry of Public Affairs,Republic of Lebanon.
Poesen, J., Vandaele, K., van Wesemael, B., 1998. Gully erosion: impor-tance and model implications. In: Boardman, J., Favis-Mortlock, D.(Eds.), Modeling Soil Erosion by Water. Springer-Verlag, BerlinHeidelberg, pp. 285–311.
Reinfenberg, A., 1952. The soils of Syria and Lebanon. Soil Science 3,66–88.
Rodgers, T.M., 2000. Modeling soils of the Sawtooth and Pasaytenwilderness areas with a GIS.MS thesis.Washington State University,Pullman, USA. 110pp.
Roose, E., Chebbani, R., Bourougaa, L., 2000. Ravinement en Algérie.Typologie, facteurs de contrôle, quantification et réhabilitation.Sécheresse 11, 317–326.
Shen,H.W., Julien, P., 1993.Erosion and sediment transport. In:Maidment,D. (Ed.), Handbook of Hydrology. McGraw-Hill, New York.
Soil Survey Staff, 2003. Keys to soil taxonomy. 9th USDA–NCRS. U.S.Gov. Print. Office, Washington. 332 pp.
Souchère, V., 1995. Modélisation spatiale du ruissellement à des finsd'aménagement contre l'érosion de talweg. Ph.D. thesis, InstitutNational Agronomique Paris-Grignon, France. 196 pp.
Stocking, M.A., 1980. Examination of the factors controlling gullygrowth. In: Boodt, M., Gabriels, D. (Eds.), Assessment of Erosion.John Wiley and Sons, Chichester, pp. 505–520.
Tarzi, J., Paeth, R., 1975. Genesis of a Mediterranean red and a whiterendzina soil from Lebanon. Journal of Soil Science 120, 272–277.
Vandekerckhove, L., Poesen, J., OostwoudWijdenes, D.J., Gyssels, G.,Beuselinck, L., de Luna, E., 2000. Characteristics and controllingfactors of bank gullies in two semi-arid Mediterranean environ-ments. Geomorphology 33, 37–58.
Vanwalleghem, T., Poesen, J., Nachtergaele, J., Verstraeten, G., 2005.Characteristics, controlling factors and importance of deep gulliesunder cropland on loess-derived soils. Geomorphology 69, 76–91.
Venables, W.M., Ripley, B.D., 1994. Modern Applied Statistics withS-Plus. Springer, New York.
Way, D.S., 1978. Terrain Analysis. McGraw-Hill Inc, NewYork. 438 pp.Zhang, H., Burton, S., 1999. Recursive Partitioning in the Health
Sciences. Springer, New York. 226 pp.
492 R. Bou Kheir et al. / Geomorphology 93 (2008) 482–492