singlesweep analysis of the theta frequency band during an auditory oddball task
TRANSCRIPT
METHODOLOGY
Single-sweep analysis of the theta frequency bandduring an auditory oddball task
JULIANA YORDANOVA and VASIL KOLEVInstitute of Physiology, Bulgarian Academy of Sciences, Sofia, Bulgaria
Abstract
The P300 component and the oscillatory 4–7 Hz electroencephalographic activity of auditory event-related brainpotentials~ERPs! were assessed to study differences between passive and oddball task conditions. Theta responses from15 adults were analyzed for single-sweep amplitude, phase locking, and enhancement against prestimulus activity. ERPswere characterized by enhanced and strongly phase-locked theta oscillations in the early~0–300 ms! poststimulusepoch, with only the late~300–600 ms! theta responses at Fz and Pz affected by the oddball condition. P300 wasstrongly associated not only with the concurrent theta oscillations but also with the evoked theta activity preceding P300~0–300 ms!. It was concluded that single theta response parameters can reveal specific functional differences betweenpassive and oddball conditions and that a strong relationship exists between the theta frequency component and the timedomain P300 ERP component.
Descriptors: Event-related potentials, P3~00!, Single-sweep analysis, Theta response, Phase locking,Brain oscillatory responses
Time domain analysis of event-related potentials~ERPs! has beenconventionally used to study information processing in the brain.In addition, frequency domain analysis has demonstrated that theevoked oscillatory electroencephalographic~EEG! responses indifferent frequency bands also vary with sensory and cognitiveprocesses~e.g., Bas(ar & Bullock, 1992; Pantev, Elbert, & Lütken-höner, 1994!. The stimulus-related EEG oscillations are defined asthe EEG frequency responses or the frequency ERP componentsand can be extracted from the ERP by appropriate filtering proce-dures ~Bas(ar, 1980; Cook & Miller, 1992; Farwell, Martinerie,Bashore, Rapp, & Goddard, 1993; Pantev, 1995!. It has been as-sumed that the EEG frequency responses originate from a stimulus-induced reorganization~e.g., frequency stabilization, frequencyselective enhancement or damping, and phase reordering! of thespontaneous~ongoing! EEG~Bas(ar, 1980; Parvin, Torres, & John-son, 1980; Sayers, Beagley, & Henshall, 1974! and give rise to thetime domain ERP components~Bas(ar, 1992!. In this framework,analysis of both the time and frequency components of the ERPmay contribute to a better neurophysiological understanding ofstimulus-related brain functioning.
The time domain analysis of ERPs has demonstrated that spe-cific brain mechanisms are activated during the processing of in-
frequently occurring target stimulus events. Such events producethe parietal endogenous P300~P3! ERP component, with largerP300 amplitudes obtained under task-relevant stimuli than underpassive processing conditions~Johnson, 1986, 1988; Picton, 1992;Polich, 1993; Pritchard, 1981!, and higher brain processes of at-tention allocation and memory updating thought to underlie P300generation~Donchin & Coles, 1988; Polich & Kok, 1995!.
In the frequency domain, higher cognitive and associative brainprocesses have been most consistently correlated with the EEGtheta~4–7 Hz! activity ~Inouye, Shinosaki, Iyama, Matsumoto, &Toi, 1994; Lang, Lang, Diekmann, & Kornhuber, 1989; Mizuki,Masotoshi, Isozaki, Nishijima, & Inanaga, 1980; Mizuki, Takii,Nishijima, & Inanaga, 1983!. The EEG theta response has alsobeen found to manifest sensitivity to those task variables that aremajor determinants of the P300 component~Bas(ar-Eroglu, Bas(ar,Demiralp, & Schürmann, 1992; Klimesch, 1995; Klimesch,Schimke, & Schwaiger, 1994!. For example, attended and highlyrelevant stimuli in both the auditory and visual modality haveproduced, in the first 250 ms after stimulation, significantly highertheta response amplitudes than task-irrelevant stimuli in passiveconditions~Demiralp & Bas(ar, 1992!. Further, oddball ERPs havemanifested larger theta and delta EEG frequency components com-pared with passive ERPs~Stampfer & Bas(ar, 1985!. Enhancedtheta responses with a prolongation up to 500 ms have also beenobserved for oddball target stimuli but not for passive stimuli~Bas(ar-Eroglu et al., 1992!, with a similar prolongation of thetaoscillations up to 800 ms found when auditory perceptual diffi-culty was manipulated~Kolev & Schürmann, 1992!. Visual stimuliinducing episodic memory processes have produced event-relatedtheta synchronization that suggests a strong connection betweentheta activity and memory operations~Klimesch et al., 1994; Kli-mesch, Doppelmayr, Russeger, & Pachinger, 1996!. These findings
This research was supported by the National Scientific Research Fundat the Ministry of Education, Science, and Technologies, Sofia, Bulgaria,contracts B-217 and B-225.
We thank Dr. A. Vankov and Dr. T. Demiralp for software development.Special thanks are due to Dr. John Polich for most helpful comments anddiscussions.
Address reprint requests to: Vasil Kolev, Institute of Physiology, Bul-garian Academy of Sciences, Acad. G. Bonchev str., bl. 23, 1113 Sofia,Bulgaria. E-mail: [email protected].
Psychophysiology, 35~1998!, 116–126. Cambridge University Press. Printed in the USA.Copyright © 1998 Society for Psychophysiological Research
116
imply that the EEG theta responses in early and late poststimulusepochs are functionally related to the cognitive processing in taskcondition, and that a relationship may exist between the EEG thetaresponse and P300 ERP component. The aim of the present studywas to examine the effect of “oddball” task processing on the earlyand late theta ERP components and their association with the P300typically elicited in this condition~Johnson, 1986!.
Despite the overall consistency of the findings from averagedtask-related ERPs, however, both single EEG response amplitudesand phase locking have modified the averaged brain potential am-plitude ~Brandt, Jansen, & Carbonari, 1991; Jervis, Nichols, John-son, Allen, & Hudson, 1983; McGillem & Aunon, 1987; Ruchkin,1988; Woody, 1967!. This finding has functional significance be-cause single-sweep activity has been shown to reflect specificaspects of stimulus information processing that can be obscured bythe averaging procedure~Ford, White, Lim, & Pfefferbaum, 1994;Unsal & Segalowitz, 1995; Yordanova, Kolev, & Bas(ar, 1996!.Hence, whether task effects on the evoked theta activity originatefrom a stronger phase locking of theta responses to relevant than toirrelevant stimuli, to enhanced single-sweep amplitudes, or to somecombination of these factors is as yet unclear. Further analysis ofsingle-sweep EEG responses in the theta frequency range can pro-vide a more precise evaluation of these task-related effects. Toinvestigate differences between ERPs elicited by passive and ac-tive ~“oddball”! paradigms, the present study assessed EEG thetaresponses at the level of single sweeps. To analyze single-sweepactivity, three parameters were studied.~a! Single-sweep ampli-tude was used to measure the intensity of the responding system inthe theta frequency channel during relevant and irrelevant process-ing. ~b! EEG phase reordering or stimulus-induced phase lockingwas quantified to reflect the stability of the evoked theta patternsindependently of amplitude measures.~c! Enhancement relative toprestimulus activity was evaluated to assess event-related varia-tions in the resonant properties of the responding theta system~Bas(ar, 1980, 1992!. Specifically, the single-sweep parameters ofearly and late theta responses and their association with the pre-stimulus theta activity were investigated.
Concerning the relationship between EEG frequency responsesand P300 ERP component, many authors agree that the main powerof P300 is in the delta~0.1–4 Hz! range ~Duncan-Johnson &Donchin, 1979; Pfefferbaum, Christensen, Ford, & Kopell, 1986;Stampfer and Bas(ar, 1985!. However, despite the similar func-tional responsiveness of P300 and EEG theta response mentionedabove, the association between these two time and frequency ERPcomponents has not been evaluated systematically. In the presentstudy, the hypothesis of the relationship between P300 and elicitedtheta activity ~Bas(ar-Eroglu et al., 1992; Intriligator & Polich,1994; Klimesch et al., 1994! was addressed by correlating P300measures with single theta response parameters.
Methods
ParticipantsFifteen healthy volunteers~nine women, six men! 18–30 years ofage~M 5 24.3,SD5 2.1!, participated. They were colleagues andstudents from the Sofia Medical University; they were right handed,drug free, and without any history of neurologic, psychiatric dis-orders, or hearing problems.
Stimuli and ProcedureThe participants were assessed in a dimly lit, electrically shieldedroom and were monitored by means of a closed-loop TV and
telephone system. The auditory stimuli were generated by an IBM-486 computer, filtered, amplified, and reproduced by a loud-speaker in a free-sound field. All stimuli were presented at 60 dBSPL, with a duration of 50 ms~rise and fall5 10 ms!. The stimuliwere delivered with random interstimulus intervals~3.5–6.5 s! intwo different task situations.~a! Tone bursts of 800-Hz frequency~n550! were presented in a passive listening condition, with par-ticipants instructed only to relax silently. Before the recordingsession, they were told that the stimuli would be delivered fortesting the technical equipment and would be of no relevance forthem.~b! Auditory target and nontarget stimuli were presented inan oddball task. During the oddball condition, 100 high and lowfrequency tones~1200 Hz and 800 Hz! were delivered randomly,with p 5 .75 for the high tones andp 5 .25 for the low tones.Participants were required to press a button with their dominanthand as quickly and accurately as possible in response only to thelow tones. Reaction times and error rate were recorded. In both thepassive and oddball conditions, the participants were instructed tokeep their eyes closed.
Data Collection and ProcessingElectrodes.The EEG data were recorded with Ag0AgCl disc
electrodes placed on midline frontal, central, and parietal sites~Fz,Cz, and Pz!, with linked mastoids as the reference. The groundelectrode was positioned on the forehead. The electrooculogram~EOG! was recorded bipolarly with electrodes placed below and atthe outer canthus of the left eye. Electrode impedance did notexceed 8 kV.
EEG recording, ADC, and data storage.EEG was amplifiedwith band limits of 0.5 and 70 Hz by means of a Nihon KohdenElectroencephalograph~Model EEG-4314F!. Stop-band filtering~band limits5 48–52 Hz! was used for eliminating interference.The amplified EEG analog signals were digitized with a samplingfrequency of 250 Hz and stored on the computer hard disk, with anepoch length of 1,024 ms pre- and 1,024 ms poststimulus.
Artifact rejection.The stored raw single sweeps were inspectedvisually off-line to eliminate EEG segments contaminated withblink, muscular, or any other type of artifact activity. Also, anyEEG or EOG trial exceeding650 mV was excluded from furtheranalysis.
Data AnalysisERP component analysis in both the time and frequency domainswas used for the averaged and single-sweep potentials.
Time Domain AnalysisAveraged unfiltered ERPs were obtained to measure the time-
domain components, in particular the P300 component~Fig-ure 1a!. The number of artifact-free sweeps averaged for eachparticipant in each condition was between 35–45 for the passiveand between 22–25 for the target ERPs.
Analysis of Event-Related Theta ActivityTo verify the presence of event-related theta activity~theta
response!, three methods were used in addition to single-sweepanalysis:~a! estimation of event-related power in the theta range,~b! calculation of amplitude–frequency characteristics~AFCs! ofaveraged ERPs, and~c! response adaptive digital filtering of av-eraged potentials.
Event-related theta power.The existence of event-related re-sponsiveness of the EEG activity in a given frequency band can be
Single-sweep theta response 117
demonstrated by the presence of stimulus-induced power changes.To study whether power changes in the global~e.g., phase lockedand nonphase locked! theta activity occur after stimulus presenta-tion, the instantaneous power in the 4–7-Hz frequency range wascalculated according to the formula
P~k! 51
N (i51
N
$xF~i,k!%2,
whereP~k! 5 averaged power estimation of bandpass filtered data~averaged over all single sweeps!, XF~i,k! 5 kth sample of thei thsweep~trial! of bandpass filtered data, andN 5 number of thesingle sweeps~Kalcher & Pfurtscheller, 1995!.
Single sweeps of each participant, stimulus type, and electrodelocation were bandpass filtered in the theta range~4–7 Hz!, and thesamples were squared and then averaged over trials. Theta powerchanges are shown in Figure 1b.
Amplitude–frequency characteristics.Another way to verifythe presence of time-locked theta responses after stimulation is tocompute the AFCs of the averaged ERPs~Bas(ar, 1980; Röschke,Mann, Riemann, Frank, & Fell, 1995!. The AFC describes thebrain system’s transfer properties, for example, excitability andsusceptibility, by revealing resonant and salient frequencies. Thus,it does not simply represent the spectral power density character-izing the transient signal in the frequency domain but the predictedbehavior of the system~brain! if sinusoidally modulated inputsignals of defined frequencies were applied as stimulation. Asreflecting the amplification in a given frequency channel, the AFCis expressed in relative units. Hence, the presence of a peak in theAFC reveals the resonant frequencies interpreted as the most pre-
ferred oscillations of the system during stimulus response. To cal-culate the AFCs, auditory ERPs were first averaged~Figure 1a!and then transformed to the frequency domain by means of aone-sided Fourier transform~Laplace transform! of the followingform ~Basar, 1980; Solodovnikov, 1960!:
G~ jv! 5 E0
` d$c~t!%
dtexp~2jvt!dt,
whereG~ jv! 5 complex representation of the Fourier-transformedtime series~ERP! known as frequency characteristics of the sys-tem,c~t! 5 transient step response of the system~in this case, theERP!, v 5 2pf, the angular frequency,f 5 frequency of the inputsignal, andj 5 #21, the imaginary unit. From the complex func-tion, G~ jv! 5 RE1 jIM , whereREandIM represent the real andimaginary part of the function, respectively, the AFC can be cal-culated as a function off:
AFC~ f ! 5 _G~ jv!_ 5 %RE2 1 IM 2,
or in a digital form:
AFC~ f !
5 !S(r51
N
~cos2pftn!Dc~tn!D2
1 S(n51
N
~sin2pftn!Dc~tn!D2
.
Here, Dc~tn! represents the first derivative of the transient stepresponse of the system~in this case, the ERP! at different samplingpoints tn, ranging from 1 toN. Although this transform is validonly for linear systems, it can be applied to nonlinear systems asa first approximation because errors due to system nonlinearities
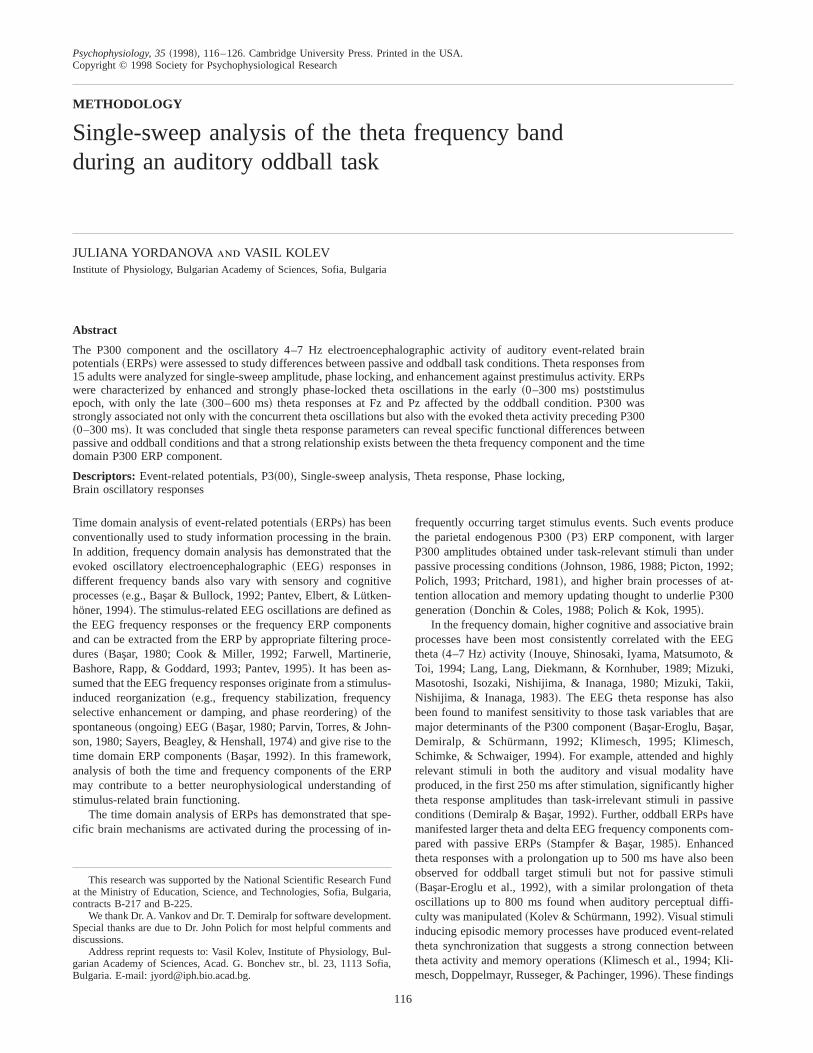
Figure 1. Time and frequency domain presentations of event-related activity from the passive task and oddball target stimuli at Fz,Cz, and Pz.~a! Unfiltered grand average event-related potentials~ERPs!. ~b! Group mean event-related theta power calculated fromthe instantaneous power measurements in the 4–7-Hz range.~c! Group mean amplitude–frequency characteristics. Along the abscissais the frequency in logarithmic scale; along the ordinate is the relative response amplitude in decibels. The curves are normalized suchthat the amplitude at 0 Hz5 1 ~or 20 log10 1 5 0!. ~d! Grand average ERPs filtered in the 4–7-Hz frequency range. Stimulus occursat 0 ms.
118 J. Yordanova and V. Kolev
are smaller than errors resulting from the length of measurementsand rapid transitions in brain activity~Bas(ar, 1980!.
The AFCs of the averaged ERPs were calculated for the0–600-ms~150 data points! epoch after stimulus and then normal-ized such that the amplitude ratio at 0 Hz was equal to 1. To enabledemonstration of peaks in different frequency ranges includingtheta, a log-log presentation of AFCs was used~Figure 1c!.
Digital filtering. To demonstrate further the presence of onlyphase-locked theta activity, single sweeps in each series were dig-itally bandpass filtered in the frequency range of 4–7 Hz and thenaveraged to reduce the nonphase-locked theta components~Kal-cher & Pfurtscheller, 1995!. Grand average filtered ERPs are il-lustrated in Figure 1d. To provide a zero-phase shift, a modifiedlinear bandpass filter was used, whose weights were based onbinomial coefficients~Wastell, 1979!. The filter band width wasgreater than 5% from the total analyzed frequency band, whichwas experimentally tested to minimize filtering artifacts. To achievethis ratio, the original signals were resampled with a samplingfrequency of 125 Hz, which introduced no distortion in the signal.The exact half-power frequencies of the digital filter were 3.91 and7.32 Hz, referred to as 4 and 7 Hz in the text. The length of thefiltered single-sweep epochs was 2,048 ms~21,024,11,024 ms!so that possible edge effects did not alter the analyzed epoch.
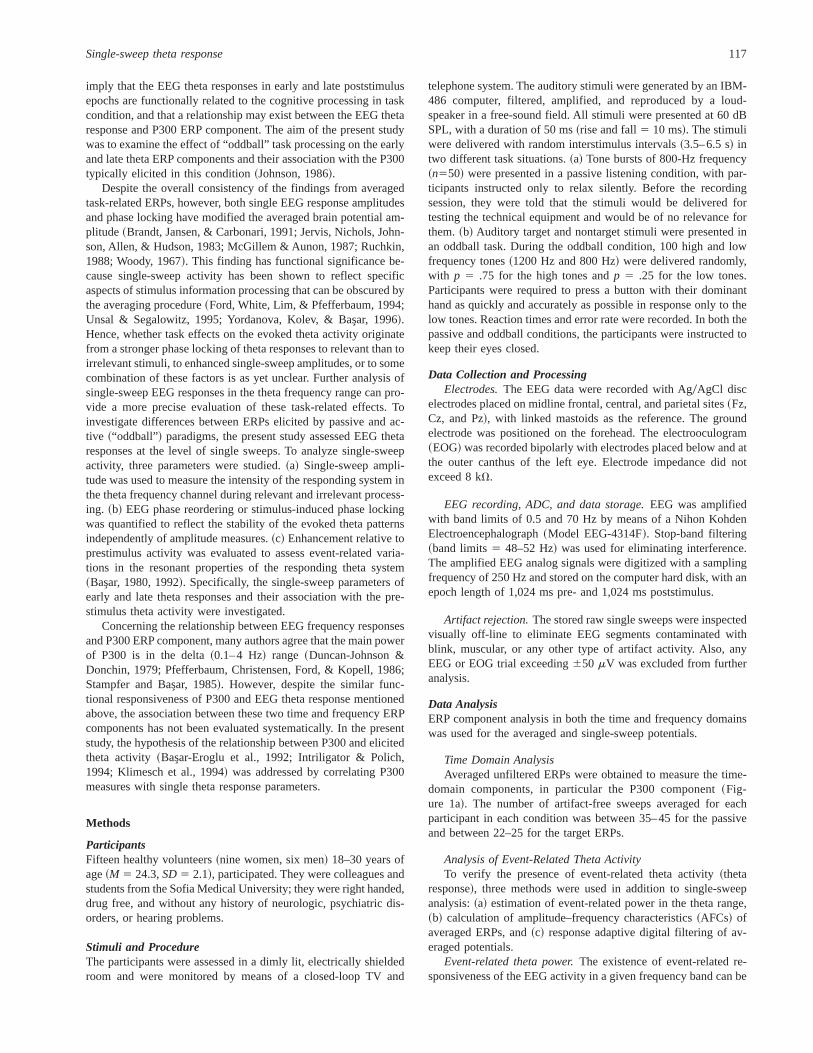
Single sweep analysisAs illustrated in Figure 2, three parameters of the single-sweep
theta responses were analyzed for two time windows, early~0–300 ms! and late~300–600 ms!: ~a! maximal amplitude,~b! phaselocking, and~c! amplitude enhancement against the prestimulustheta activity.
The maximal peak-to-peak amplitude of the single-sweep thetaresponses was measured, and for each participant, stimulus type,and electrode location, the mean value of the maximal peak-to-peaktheta amplitude in each of the two time windows was calculated.
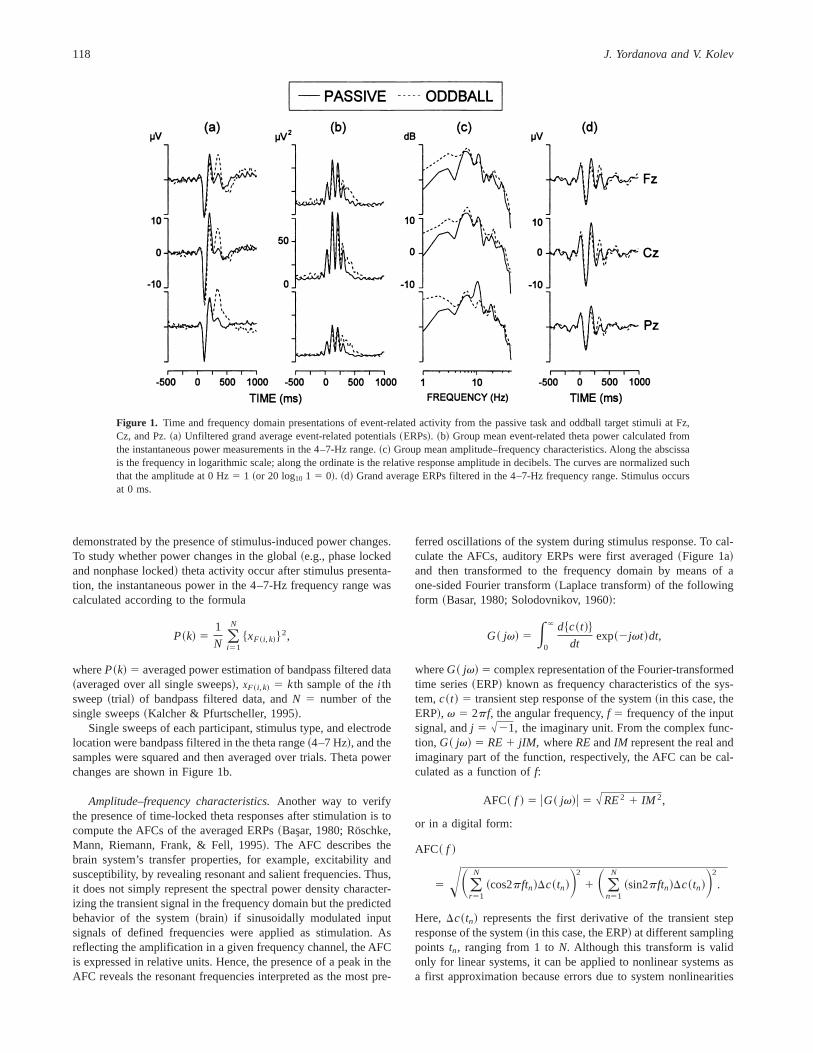
For a quantitative evaluation of the phase locking of singlesweeps, a modification of the single-sweep wave identification~SSWI! method was applied~Kolev & Daskalova, 1990; Kolev &Yordanova, 1997; Yordanova & Kolev, 1996!. Figure 3 schemat-ically illustrates the analysis procedure, which included the fol-lowing steps.
First, as shown in Figure 3a, all extrema~minima and maxima!were identified in the filtered~4–7 Hz! single sweeps. Maximawere replaced with11 and minima with21. The latency andcoded amplitude values of the identified extrema were stored. Thedetected points along the time axis are presented without the sig-nals ~Figure 3b!, and the averaged curve is shown in Figure 3c.
Second, as illustrated in Figure 3d, after summing of codedextrema across trials, a histogram of the number of phase-lockedsingle theta waves~SSWI-histogram! can be obtained. To performdata reduction, the analysis epoch was divided into time intervalsof 20 ms, which was also within the Nyquist theorem limits forestimation of the frequencies of interest~Dt # 102F, whereF 5maximal frequency in the signal, 7 Hz in this case, andDt 5sampling interval!. Thus, for each 20-ms time interval, the sum ofthe identified coded~11, 21! extrema in the trial set was calcu-lated and the number of the phase-locked waves was determined.The obtained value was represented in the corresponding histo-gram bar.
Figure 3e presents an example of single theta responses re-corded in the passive condition from the Cz lead and visualizes thecongruence between sweeps after stimulus. Figure 3f illustrates thecorresponding SSWI-histogram. In the prestimulus period, the phasesare random, whereas in the first 600 ms after stimulus presentationthe phases are time and phase locked. Comparing Figures 3e and3f demonstrates a dissociation between amplitude and phase lock-ing for the late~T 2! period: although single theta amplitudes in T 2are comparable to those in the prestimulus epoch, the responses arerandom before but phase locked after stimulation.
Third, quantitative evaluation of single-sweep phase lockingwas performed. The SSWI-histogram was normalized by dividingthe bar values by the number of single sweeps included. The his-togram was then rectified~Figure 3h!, and the sum of absolute barvalues was calculated for the time windows 0–300 and 300–600 ms poststimulus, thereby providing information about thestrength of the single-sweep phase-locking in each time window.These measurements were performed for each participant, stimulustype, and electrode site. In addition, to control for effects related topossible changes in frequency, the number of theta waves in eachtime window was measured at the level of single sweeps, and meanindividual counts were similarly obtained for each stimulus typeand electrode.
RMSRMS
Figure 2. Schematic illustration of the method-ology and parameters for single-sweep analysis.~1! Maximal peak-to-peak amplitudes of digi-tally filtered single sweeps~on the left; six sweepsfiltered in the 4–7-Hz range are shown as exam-ples!. ~2! Phase locking estimated on the base ofthe integral value~sum of absolute bar values! ofsingle-sweep wave identification~SSWI! histo-grams ~superimposed single sweeps and thecorresponding SSWI-histogram are shown as ex-amples!. ~3! Enhancement factor~EF! of eachfiltered single sweep as a measure of the maxi-mal amplitude ratio between post- and prestim-ulus theta activity. The formula for EF calculationis given and illustrated at the top. T1 and T2designate early~0–300 ms! and late ~300–600 ms! time windows.
Single-sweep theta response 119
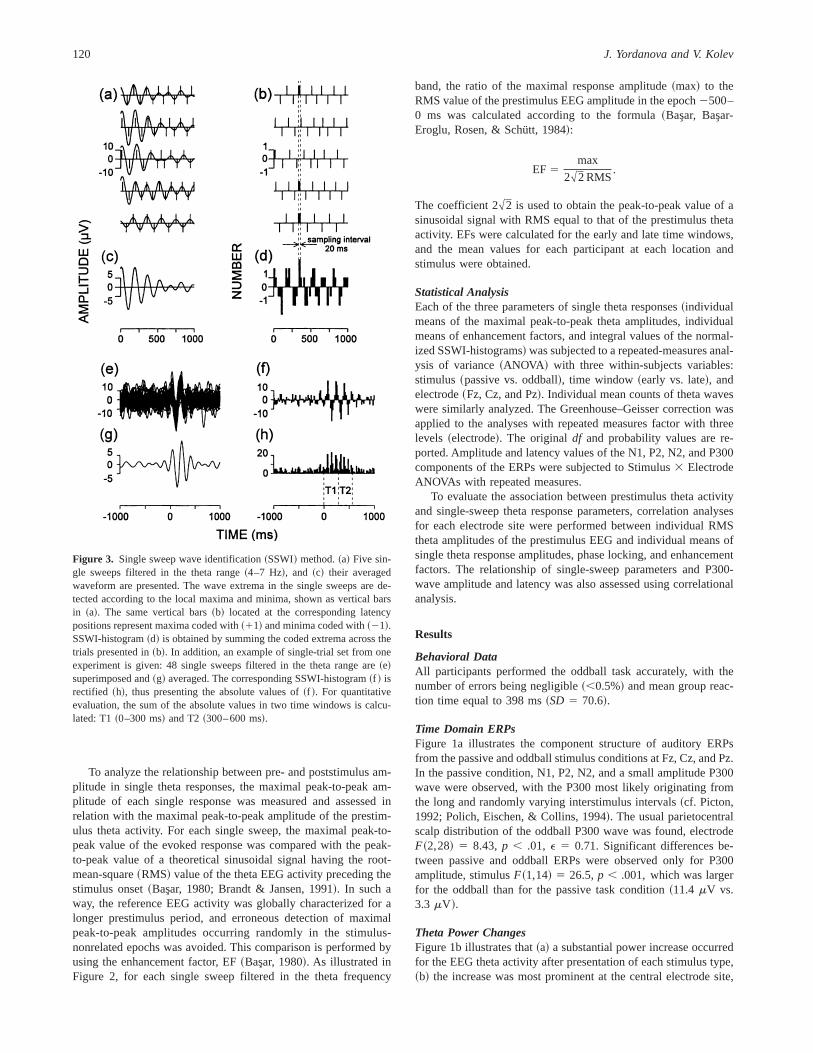
To analyze the relationship between pre- and poststimulus am-plitude in single theta responses, the maximal peak-to-peak am-plitude of each single response was measured and assessed inrelation with the maximal peak-to-peak amplitude of the prestim-ulus theta activity. For each single sweep, the maximal peak-to-peak value of the evoked response was compared with the peak-to-peak value of a theoretical sinusoidal signal having the root-mean-square~RMS! value of the theta EEG activity preceding thestimulus onset~Bas(ar, 1980; Brandt & Jansen, 1991!. In such away, the reference EEG activity was globally characterized for alonger prestimulus period, and erroneous detection of maximalpeak-to-peak amplitudes occurring randomly in the stimulus-nonrelated epochs was avoided. This comparison is performed byusing the enhancement factor, EF~Bas(ar, 1980!. As illustrated inFigure 2, for each single sweep filtered in the theta frequency
band, the ratio of the maximal response amplitude~max! to theRMS value of the prestimulus EEG amplitude in the epoch2500–0 ms was calculated according to the formula~Bas(ar, Bas(ar-Eroglu, Rosen, & Schütt, 1984!:
EF 5max
2#2 RMS.
The coefficient 2#2 is used to obtain the peak-to-peak value of asinusoidal signal with RMS equal to that of the prestimulus thetaactivity. EFs were calculated for the early and late time windows,and the mean values for each participant at each location andstimulus were obtained.
Statistical AnalysisEach of the three parameters of single theta responses~individualmeans of the maximal peak-to-peak theta amplitudes, individualmeans of enhancement factors, and integral values of the normal-ized SSWI-histograms! was subjected to a repeated-measures anal-ysis of variance~ANOVA ! with three within-subjects variables:stimulus~passive vs. oddball!, time window ~early vs. late!, andelectrode~Fz, Cz, and Pz!. Individual mean counts of theta waveswere similarly analyzed. The Greenhouse–Geisser correction wasapplied to the analyses with repeated measures factor with threelevels ~electrode!. The originaldf and probability values are re-ported. Amplitude and latency values of the N1, P2, N2, and P300components of the ERPs were subjected to Stimulus3 ElectrodeANOVAs with repeated measures.
To evaluate the association between prestimulus theta activityand single-sweep theta response parameters, correlation analysesfor each electrode site were performed between individual RMStheta amplitudes of the prestimulus EEG and individual means ofsingle theta response amplitudes, phase locking, and enhancementfactors. The relationship of single-sweep parameters and P300-wave amplitude and latency was also assessed using correlationalanalysis.
Results
Behavioral DataAll participants performed the oddball task accurately, with thenumber of errors being negligible~,0.5%! and mean group reac-tion time equal to 398 ms~SD 5 70.6!.
Time Domain ERPsFigure 1a illustrates the component structure of auditory ERPsfrom the passive and oddball stimulus conditions at Fz, Cz, and Pz.In the passive condition, N1, P2, N2, and a small amplitude P300wave were observed, with the P300 most likely originating fromthe long and randomly varying interstimulus intervals~cf. Picton,1992; Polich, Eischen, & Collins, 1994!. The usual parietocentralscalp distribution of the oddball P300 wave was found, electrodeF~2,28! 5 8.43, p , .01, E 5 0.71. Significant differences be-tween passive and oddball ERPs were observed only for P300amplitude, stimulusF~1,14! 5 26.5,p , .001, which was largerfor the oddball than for the passive task condition~11.4 mV vs.3.3 mV !.
Theta Power ChangesFigure 1b illustrates that~a! a substantial power increase occurredfor the EEG theta activity after presentation of each stimulus type,~b! the increase was most prominent at the central electrode site,
Figure 3. Single sweep wave identification~SSWI! method.~a! Five sin-gle sweeps filtered in the theta range~4–7 Hz!, and ~c! their averagedwaveform are presented. The wave extrema in the single sweeps are de-tected according to the local maxima and minima, shown as vertical barsin ~a!. The same vertical bars~b! located at the corresponding latencypositions represent maxima coded with~11! and minima coded with~21!.SSWI-histogram~d! is obtained by summing the coded extrema across thetrials presented in~b!. In addition, an example of single-trial set from oneexperiment is given: 48 single sweeps filtered in the theta range are~e!superimposed and~g! averaged. The corresponding SSWI-histogram~f ! isrectified ~h!, thus presenting the absolute values of~f !. For quantitativeevaluation, the sum of the absolute values in two time windows is calcu-lated: T1~0–300 ms! and T2~300–600 ms!.
120 J. Yordanova and V. Kolev
and ~c! the increase lasted longer and was therefore more pro-nounced for the 300–600-ms epoch of the target relative to passiveERPs.
Amplitude–Frequency CharacteristicsAFCs of grand average ERPs at the three electrode locations arepresented in Figure 1c. The AFCs of both the passive and oddballERPs were characterized by a 4–8.5-Hz frequency componentpeaking at around 6 Hz. AFC components in the slow~1–3.5-Hz!frequency band were also expressed. A prominent peak was seen ataround 10 Hz in response to both types of stimuli. The figureshows that the values for the slower~delta and theta! ranges weregreater than those for the target ERPs.
Filtered (4–7 Hz) ERPsGrand average ERPs filtered in the theta frequency range~4–7 Hz!are presented in Figure 1d and illustrate that in the first 250–300 ms pronounced theta responses were elicited by both stimulustypes. Higher amplitudes of the late~after 300 ms! theta responseswere elicited by the oddball stimuli. Significant effects from sta-tistical analyses are illustrated graphically in Figure 4.
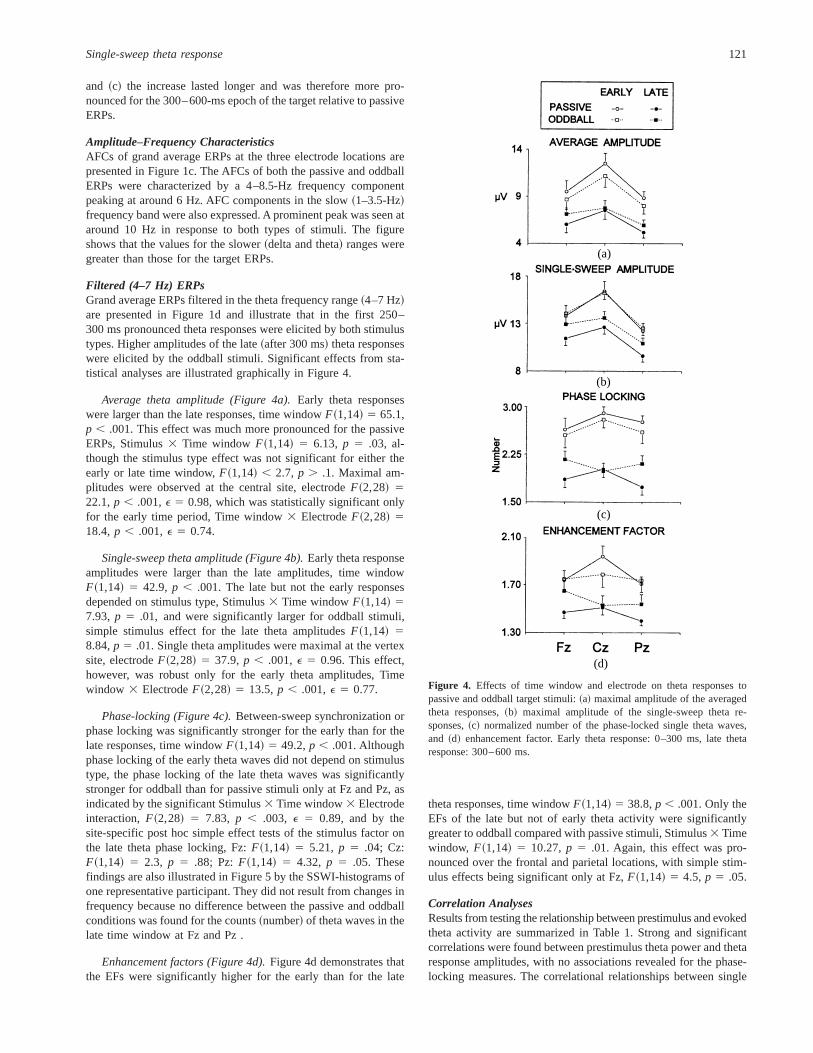
Average theta amplitude (Figure 4a).Early theta responseswere larger than the late responses, time windowF~1,14! 5 65.1,p , .001. This effect was much more pronounced for the passiveERPs, Stimulus3 Time window F~1,14! 5 6.13, p 5 .03, al-though the stimulus type effect was not significant for either theearly or late time window,F~1,14! , 2.7, p . .1. Maximal am-plitudes were observed at the central site, electrodeF~2,28! 522.1,p , .001,E 5 0.98, which was statistically significant onlyfor the early time period, Time window3 ElectrodeF~2,28! 518.4,p , .001,E 5 0.74.
Single-sweep theta amplitude (Figure 4b).Early theta responseamplitudes were larger than the late amplitudes, time windowF~1,14! 5 42.9, p , .001. The late but not the early responsesdepended on stimulus type, Stimulus3 Time windowF~1,14! 57.93, p 5 .01, and were significantly larger for oddball stimuli,simple stimulus effect for the late theta amplitudesF~1,14! 58.84,p 5 .01. Single theta amplitudes were maximal at the vertexsite, electrodeF~2,28! 5 37.9,p , .001, E 5 0.96. This effect,however, was robust only for the early theta amplitudes, Timewindow 3 ElectrodeF~2,28! 5 13.5,p , .001,E 5 0.77.
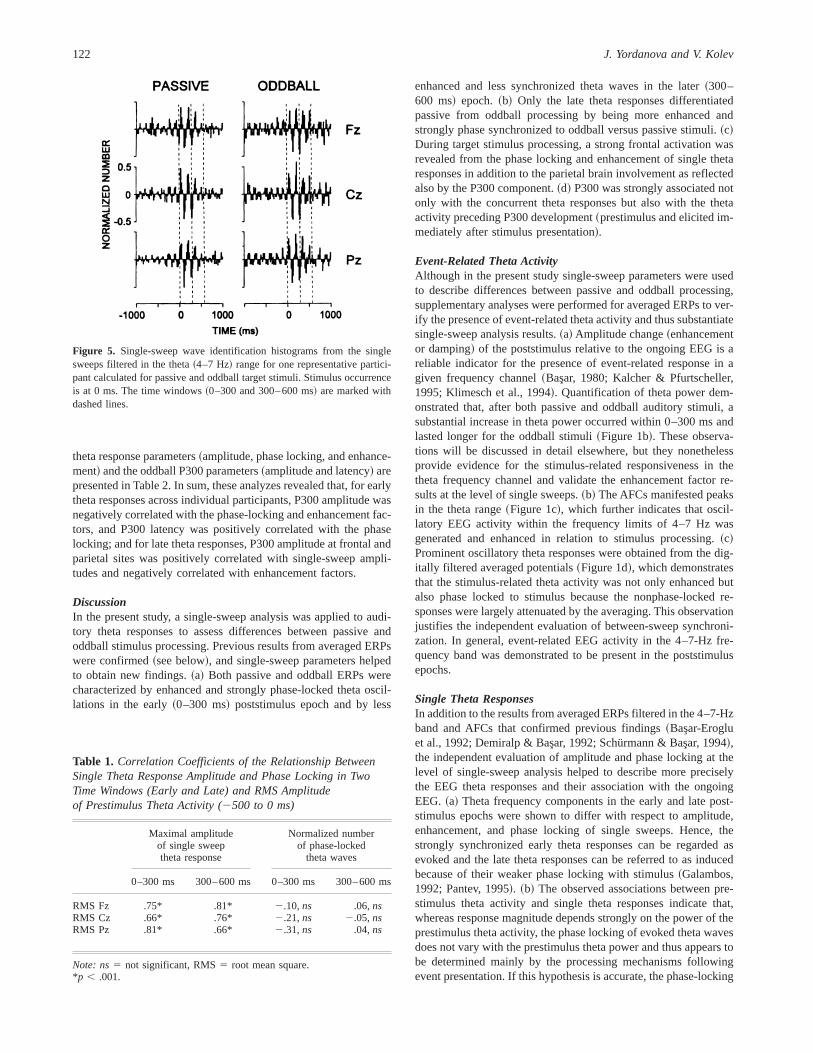
Phase-locking (Figure 4c).Between-sweep synchronization orphase locking was significantly stronger for the early than for thelate responses, time windowF~1,14! 5 49.2,p , .001. Althoughphase locking of the early theta waves did not depend on stimulustype, the phase locking of the late theta waves was significantlystronger for oddball than for passive stimuli only at Fz and Pz, asindicated by the significant Stimulus3 Time window3 Electrodeinteraction,F~2,28! 5 7.83, p , .003, E 5 0.89, and by thesite-specific post hoc simple effect tests of the stimulus factor onthe late theta phase locking, Fz:F~1,14! 5 5.21, p 5 .04; Cz:F~1,14! 5 2.3, p 5 .88; Pz:F~1,14! 5 4.32, p 5 .05. Thesefindings are also illustrated in Figure 5 by the SSWI-histograms ofone representative participant. They did not result from changes infrequency because no difference between the passive and oddballconditions was found for the counts~number! of theta waves in thelate time window at Fz and Pz .
Enhancement factors (Figure 4d).Figure 4d demonstrates thatthe EFs were significantly higher for the early than for the late
theta responses, time windowF~1,14! 5 38.8,p , .001. Only theEFs of the late but not of early theta activity were significantlygreater to oddball compared with passive stimuli, Stimulus3 Timewindow, F~1,14! 5 10.27,p 5 .01. Again, this effect was pro-nounced over the frontal and parietal locations, with simple stim-ulus effects being significant only at Fz,F~1,14! 5 4.5, p 5 .05.
Correlation AnalysesResults from testing the relationship between prestimulus and evokedtheta activity are summarized in Table 1. Strong and significantcorrelations were found between prestimulus theta power and thetaresponse amplitudes, with no associations revealed for the phase-locking measures. The correlational relationships between single
(d)
(c)
(b)
(a)
Figure 4. Effects of time window and electrode on theta responses topassive and oddball target stimuli:~a! maximal amplitude of the averagedtheta responses,~b! maximal amplitude of the single-sweep theta re-sponses,~c! normalized number of the phase-locked single theta waves,and ~d! enhancement factor. Early theta response: 0–300 ms, late thetaresponse: 300–600 ms.
Single-sweep theta response 121
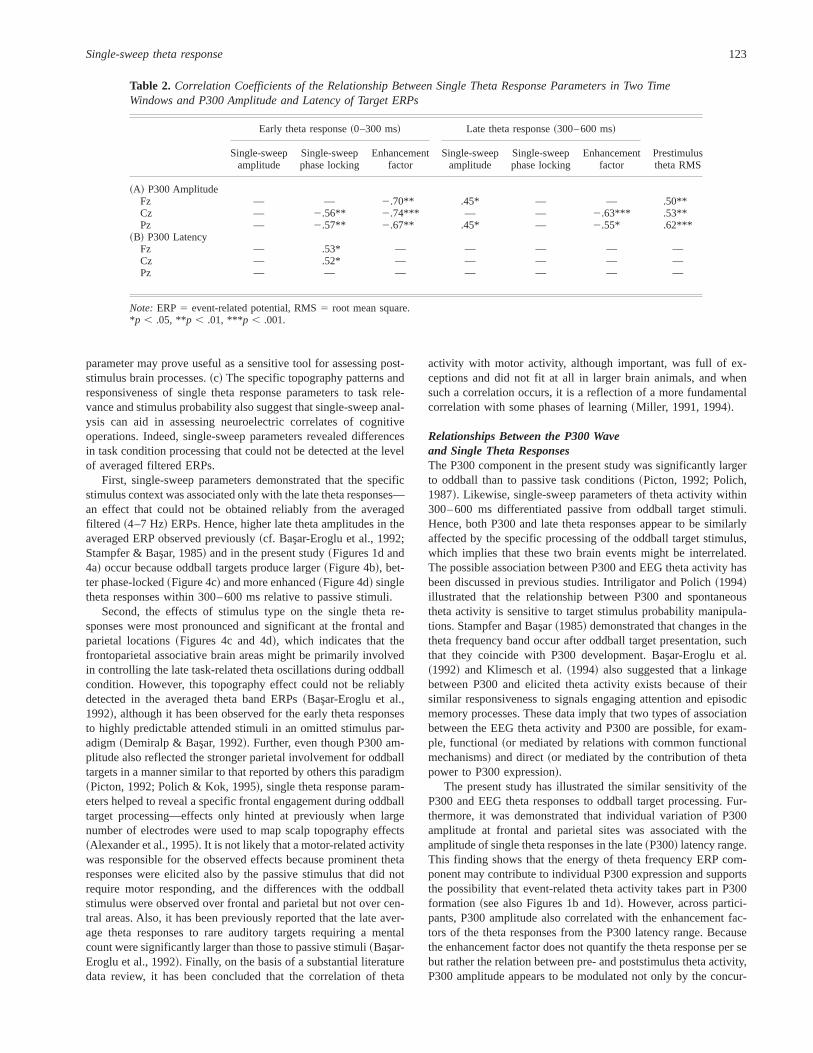
theta response parameters~amplitude, phase locking, and enhance-ment! and the oddball P300 parameters~amplitude and latency! arepresented in Table 2. In sum, these analyzes revealed that, for earlytheta responses across individual participants, P300 amplitude wasnegatively correlated with the phase-locking and enhancement fac-tors, and P300 latency was positively correlated with the phaselocking; and for late theta responses, P300 amplitude at frontal andparietal sites was positively correlated with single-sweep ampli-tudes and negatively correlated with enhancement factors.
DiscussionIn the present study, a single-sweep analysis was applied to audi-tory theta responses to assess differences between passive andoddball stimulus processing. Previous results from averaged ERPswere confirmed~see below!, and single-sweep parameters helpedto obtain new findings.~a! Both passive and oddball ERPs werecharacterized by enhanced and strongly phase-locked theta oscil-lations in the early~0–300 ms! poststimulus epoch and by less
enhanced and less synchronized theta waves in the later~300–600 ms! epoch.~b! Only the late theta responses differentiatedpassive from oddball processing by being more enhanced andstrongly phase synchronized to oddball versus passive stimuli.~c!During target stimulus processing, a strong frontal activation wasrevealed from the phase locking and enhancement of single thetaresponses in addition to the parietal brain involvement as reflectedalso by the P300 component.~d! P300 was strongly associated notonly with the concurrent theta responses but also with the thetaactivity preceding P300 development~prestimulus and elicited im-mediately after stimulus presentation!.
Event-Related Theta ActivityAlthough in the present study single-sweep parameters were usedto describe differences between passive and oddball processing,supplementary analyses were performed for averaged ERPs to ver-ify the presence of event-related theta activity and thus substantiatesingle-sweep analysis results.~a! Amplitude change~enhancementor damping! of the poststimulus relative to the ongoing EEG is areliable indicator for the presence of event-related response in agiven frequency channel~Bas(ar, 1980; Kalcher & Pfurtscheller,1995; Klimesch et al., 1994!. Quantification of theta power dem-onstrated that, after both passive and oddball auditory stimuli, asubstantial increase in theta power occurred within 0–300 ms andlasted longer for the oddball stimuli~Figure 1b!. These observa-tions will be discussed in detail elsewhere, but they nonethelessprovide evidence for the stimulus-related responsiveness in thetheta frequency channel and validate the enhancement factor re-sults at the level of single sweeps.~b! The AFCs manifested peaksin the theta range~Figure 1c!, which further indicates that oscil-latory EEG activity within the frequency limits of 4–7 Hz wasgenerated and enhanced in relation to stimulus processing.~c!Prominent oscillatory theta responses were obtained from the dig-itally filtered averaged potentials~Figure 1d!, which demonstratesthat the stimulus-related theta activity was not only enhanced butalso phase locked to stimulus because the nonphase-locked re-sponses were largely attenuated by the averaging. This observationjustifies the independent evaluation of between-sweep synchroni-zation. In general, event-related EEG activity in the 4–7-Hz fre-quency band was demonstrated to be present in the poststimulusepochs.
Single Theta ResponsesIn addition to the results from averaged ERPs filtered in the 4–7-Hzband and AFCs that confirmed previous findings~Bas(ar-Erogluet al., 1992; Demiralp & Bas(ar, 1992; Schürmann & Bas(ar, 1994!,the independent evaluation of amplitude and phase locking at thelevel of single-sweep analysis helped to describe more preciselythe EEG theta responses and their association with the ongoingEEG. ~a! Theta frequency components in the early and late post-stimulus epochs were shown to differ with respect to amplitude,enhancement, and phase locking of single sweeps. Hence, thestrongly synchronized early theta responses can be regarded asevoked and the late theta responses can be referred to as inducedbecause of their weaker phase locking with stimulus~Galambos,1992; Pantev, 1995!. ~b! The observed associations between pre-stimulus theta activity and single theta responses indicate that,whereas response magnitude depends strongly on the power of theprestimulus theta activity, the phase locking of evoked theta wavesdoes not vary with the prestimulus theta power and thus appears tobe determined mainly by the processing mechanisms followingevent presentation. If this hypothesis is accurate, the phase-locking
Figure 5. Single-sweep wave identification histograms from the singlesweeps filtered in the theta~4–7 Hz! range for one representative partici-pant calculated for passive and oddball target stimuli. Stimulus occurrenceis at 0 ms. The time windows~0–300 and 300–600 ms! are marked withdashed lines.
Table 1. Correlation Coefficients of the Relationship BetweenSingle Theta Response Amplitude and Phase Locking in TwoTime Windows (Early and Late) and RMS Amplitudeof Prestimulus Theta Activity (2500 to 0 ms)
Maximal amplitudeof single sweeptheta response
Normalized numberof phase-locked
theta waves
0–300 ms 300–600 ms 0–300 ms 300–600 ms
RMS Fz .75* .81* 2.10,ns .06,nsRMS Cz .66* .76* 2.21,ns 2.05,nsRMS Pz .81* .66* 2.31,ns .04,ns
Note: ns5 not significant, RMS5 root mean square.*p , .001.
122 J. Yordanova and V. Kolev
parameter may prove useful as a sensitive tool for assessing post-stimulus brain processes.~c! The specific topography patterns andresponsiveness of single theta response parameters to task rele-vance and stimulus probability also suggest that single-sweep anal-ysis can aid in assessing neuroelectric correlates of cognitiveoperations. Indeed, single-sweep parameters revealed differencesin task condition processing that could not be detected at the levelof averaged filtered ERPs.
First, single-sweep parameters demonstrated that the specificstimulus context was associated only with the late theta responses—an effect that could not be obtained reliably from the averagedfiltered ~4–7 Hz! ERPs. Hence, higher late theta amplitudes in theaveraged ERP observed previously~cf. Bas(ar-Eroglu et al., 1992;Stampfer & Bas(ar, 1985! and in the present study~Figures 1d and4a! occur because oddball targets produce larger~Figure 4b!, bet-ter phase-locked~Figure 4c! and more enhanced~Figure 4d! singletheta responses within 300–600 ms relative to passive stimuli.
Second, the effects of stimulus type on the single theta re-sponses were most pronounced and significant at the frontal andparietal locations~Figures 4c and 4d!, which indicates that thefrontoparietal associative brain areas might be primarily involvedin controlling the late task-related theta oscillations during oddballcondition. However, this topography effect could not be reliablydetected in the averaged theta band ERPs~Bas(ar-Eroglu et al.,1992!, although it has been observed for the early theta responsesto highly predictable attended stimuli in an omitted stimulus par-adigm~Demiralp & Bas(ar, 1992!. Further, even though P300 am-plitude also reflected the stronger parietal involvement for oddballtargets in a manner similar to that reported by others this paradigm~Picton, 1992; Polich & Kok, 1995!, single theta response param-eters helped to reveal a specific frontal engagement during oddballtarget processing—effects only hinted at previously when largenumber of electrodes were used to map scalp topography effects~Alexander et al., 1995!. It is not likely that a motor-related activitywas responsible for the observed effects because prominent thetaresponses were elicited also by the passive stimulus that did notrequire motor responding, and the differences with the oddballstimulus were observed over frontal and parietal but not over cen-tral areas. Also, it has been previously reported that the late aver-age theta responses to rare auditory targets requiring a mentalcount were significantly larger than those to passive stimuli~Bas(ar-Eroglu et al., 1992!. Finally, on the basis of a substantial literaturedata review, it has been concluded that the correlation of theta
activity with motor activity, although important, was full of ex-ceptions and did not fit at all in larger brain animals, and whensuch a correlation occurs, it is a reflection of a more fundamentalcorrelation with some phases of learning~Miller, 1991, 1994!.
Relationships Between the P300 Waveand Single Theta ResponsesThe P300 component in the present study was significantly largerto oddball than to passive task conditions~Picton, 1992; Polich,1987!. Likewise, single-sweep parameters of theta activity within300–600 ms differentiated passive from oddball target stimuli.Hence, both P300 and late theta responses appear to be similarlyaffected by the specific processing of the oddball target stimulus,which implies that these two brain events might be interrelated.The possible association between P300 and EEG theta activity hasbeen discussed in previous studies. Intriligator and Polich~1994!illustrated that the relationship between P300 and spontaneoustheta activity is sensitive to target stimulus probability manipula-tions. Stampfer and Bas(ar ~1985! demonstrated that changes in thetheta frequency band occur after oddball target presentation, suchthat they coincide with P300 development. Bas(ar-Eroglu et al.~1992! and Klimesch et al.~1994! also suggested that a linkagebetween P300 and elicited theta activity exists because of theirsimilar responsiveness to signals engaging attention and episodicmemory processes. These data imply that two types of associationbetween the EEG theta activity and P300 are possible, for exam-ple, functional~or mediated by relations with common functionalmechanisms! and direct~or mediated by the contribution of thetapower to P300 expression!.
The present study has illustrated the similar sensitivity of theP300 and EEG theta responses to oddball target processing. Fur-thermore, it was demonstrated that individual variation of P300amplitude at frontal and parietal sites was associated with theamplitude of single theta responses in the late~P300! latency range.This finding shows that the energy of theta frequency ERP com-ponent may contribute to individual P300 expression and supportsthe possibility that event-related theta activity takes part in P300formation ~see also Figures 1b and 1d!. However, across partici-pants, P300 amplitude also correlated with the enhancement fac-tors of the theta responses from the P300 latency range. Becausethe enhancement factor does not quantify the theta response per sebut rather the relation between pre- and poststimulus theta activity,P300 amplitude appears to be modulated not only by the concur-
Table 2. Correlation Coefficients of the Relationship Between Single Theta Response Parameters in Two TimeWindows and P300 Amplitude and Latency of Target ERPs
Early theta response~0–300 ms! Late theta response~300–600 ms!
Single-sweepamplitude
Single-sweepphase locking
Enhancementfactor
Single-sweepamplitude
Single-sweepphase locking
Enhancementfactor
Prestimulustheta RMS
~A! P300 AmplitudeFz — — 2.70** .45* — — .50**Cz — 2.56** 2.74*** — — 2.63*** .53**Pz — 2.57** 2.67** .45* — 2.55* .62***
~B! P300 LatencyFz — .53* — — — — —Cz — .52* — — — — —Pz — — — — — — —
Note: ERP5 event-related potential, RMS5 root mean square.*p , .05, **p , .01, *** p , .001.
Single-sweep theta response 123
rent theta oscillations but also by other processes associated withthe theta frequency of the EEG. Thus, as indicated by the latterresult, the association between the EEG theta activity and P300may also be functional.
Such a conclusion is further supported by both the present andprevious results of the relationship between P300 amplitude andprestimulus0spontaneous theta power~Intriligator & Polich, 1995;Polich, 1997!. Furthermore, in this study~Table 2!, significant cor-relations were obtained between P300~a positive wave occurringabout 340 ms poststimulus! and single theta response phase lockingand enhancement in the latency range preceding P300 wave~0–300 ms!. This strong correlation may relate to memory processesbecause~a! strong synchronization~amplitude enhancement! of thetaactivity within 375 ms after stimulus has been specifically associ-ated with increased demands toward episodic memory~Klimeschet al., 1994! and ~b! the linkage between P300 amplitude and la-tency measures and working memory processes has also been es-tablished~Fabiani, Karis, & Donchin, 1990; Howard & Polich, 1985;Pratt, Michalewski, Barrett, & Starr, 1989; Sanquist, Rohrbaugh,Syndulko, & Lindsley, 1980; Scheffers & Johnson, 1994!.
Although the origin of the correlation between P300 and EEGtheta frequency needs further elucidation, the present findings dem-onstrate that individual P300 parameters are associated and mod-ified by the theta-related processes that precede and occur withP300 generation. Thus, in addition to the well-documented majorcontribution of delta frequency component to P300 developmentand scalp topography~Duncan-Johnson & Donchin, 1979; Schür-mann, Bas(ar-Eroglu, Kolev, & Bas(ar, 1995; Stampfer & Basar,1985; Verleger & Wascher, 1995!, the role of stimulus-related thetaactivity for P300 is strongly emphasized by the present results.
Theoretical ImplicationsSingle theta responses to passive and oddball stimuli can be viewedin the context of the diffuse theta networks distributed in the brain~Bas(ar, 1992; Lopes da Silva, 1993; Miller, 1991, 1994!. In thisframework, the present findings from the three single-sweep pa-rameters~larger amplitude, stronger phase locking, and enhance-ment of late theta response to oddball vs. passive task conditions!may indicate that, in the later poststimulus period~300–600 ms!,a larger number of “traced” or “facilitated” theta networks can becoactivated simultaneously during task-related than during passivestimulus processing~Bas(ar, 1980; Pfurtscheller, Steffan, & Maresch,1988!. Recent theoretical suggestions imply that the scalp thetaEEG activity originates from the interplay between the limbicstructures~hippocampus! and associative neocortex~frontal! of thebrain ~Bas(ar-Eroglu et al., 1992; Demiralp & Bas(ar, 1992; Miller,1991, 1994!. Because the stimulus-type effects reported in thepresent study were most pronounced at the frontal and parietallocations, the proposed activation of corticohippocampal feedbackloops may be manifested by enhanced and phase-locked singletheta responses.
It may be further hypothesized that two functional aspects ofthe event-related theta activity may accompany stimulus process-
ing. This assumption is based on the following present and previ-ous findings.~a! Evidence exists for the presence of pronouncedearly theta response after stimulation. According to the presentresults, the earlier~0–300 ms! theta response were more enhancedand more strongly synchronized than the later~300–600 ms! re-sponses for both the passive and oddball ERPs. Enhanced thetawaves in the early~up to 250 ms! epochs of visual and auditoryERPs also have been described in the studies of Bas(ar ~1980!,Stampfer and Bas(ar ~1985!, Schürmann and Bas(ar ~1994!, andYordanova et al.~1996!. The early theta responses have manifestedmodality-specific effects because to auditory stimuli they are max-imal and best phase locked over the vertex~Figure 4!, whereasoccipital areas were strongly involved for visual stimuli~Bas(ar &Schürmann, 1994; Klimesch et al., 1994!. However, it has alsobeen reported that, in experiments designed to engage predomi-nantly either semantic or episodic memory, an increase in thetasynchronization in the first 375 ms occurred only after presentationof episodic-memory-related stimuli~Klimesch et al., 1994!. If earlytheta synchronization~power enhancement! reflects episodic mem-ory activation, the enhanced and strongly synchronized early thetaERP component may indicate that each presented stimulus entrainssome episodic memory processes, with the modality-specific areasbeing primarily involved.~b! Evidence exists for the presence oftask effects on the latency of frontoparietal theta responses. In boththe visual and auditory modalities, enhanced theta amplitudes overfrontal and parietal regions have been observed for the early butnot for the late responses when the stimuli were highly expectedand 100% predictable~Demiralp & Bas(ar, 1992!. In contrast andas found in the present study, late but not early theta responses atfrontal and parietal locations differentiated passive from oddballstimuli. Also, enhanced average theta amplitudes in the late timewindow ~250–500 ms! were obtained for oddball but not for pas-sive or predictable stimuli~Bas(ar-Eroglu et al., 1992!. Thus, thetask-related effect on frontoparietal theta responses seems to occurwith less delay with the easier condition.
In the context of a parallel sensory–cognitive processing~Goldman-Rakic, 1988!, it may be hypothesized that a “primary”and “modality-related” theta response is evoked on stimulus pre-sentation, which develops in parallel with the concurrent sensoryprocessing such that the incoming sensory information can beintegrated into a general environmental context~Miller, 1991, 1994!.A second-order functional engagement or reorganization of thetheta response may occur under the control of the associative~fron-tal and parietal! cortical areas if a necessity for further processingis imposed by a specific task or a subjective or environmentalrequirement. Further, this second-order theta synchronization maybe switched on with a varying delay or run simultaneously with theearly theta processes if the presented stimuli demand less addi-tional processing by being, for example, highly probable and easilyrecognizable. However, further experiments are required to studywhether event-related theta activity reflects specific functional stagesof stimulus and context processing or a common theta oscillatoryresponse varies with changing processing demands.
REFERENCES
Alexander, J. E., Porjesz, B., Bauer, L., Kuperman, S., Morzorati, S.,O’Connor, S., Rohrbaugh, J., Begleiter, H., & Polich, J.~1995!. P300hemispheric amplitude asymmetries from a visual oddball task.Psy-chophysiology, 32, 467–475.
Bas(ar, E. ~1980!. EEG brain dynamics. Relation between EEG and brainevoked potentials. Amsterdam: Elsevier.
Bas(ar, E. ~1992!. Brain natural frequencies are causal factors for reso-
nances and induced rhythms. In E. Bas(ar & T. H. Bullock ~Eds.!,Induced rhythms in the brain~pp. 425–467!. Boston: Birkhäuser.
Bas(ar, E., Bas(ar-Eroglu, C., Rosen, B., & Schütt, A.~1984!. A new approachto endogenous event-related potentials in man: Relation between EEGand P300-wave.International Journal of Neuroscience, 24, 1–21.
Bas(ar, E., & Bullock T. H. ~Eds.!. ~1992!. Induced rhythms in the brain.Boston: Birkhäuser.
124 J. Yordanova and V. Kolev
Bas(ar, E., & Schürmann, M.~1994!. Functional aspects of evoked alphaand theta responses in humans and cats. Occipital recordings in “crossmodality” experiments.Biological Cybernetics, 72, 175–183.
Bas(ar-Eroglu, C., Bas(ar, E., Demiralp, T., & Schürmann, M.~1992!. P300-response: Possible psychophysiological correlates in delta and thetafrequency channels. A review.International Journal of Psychophysiol-ogy, 13, 161–179.
Brandt, M., & Jansen, B.~1991!. The relationship between prestimulusalpha amplitude and visual evoked potential amplitude.InternationalJournal of Neuroscience, 61, 261–268.
Brandt, M., Jansen, B., & Carbonari, J.~1991!. Pre-stimulus spectral EEGpatterns and the visual evoked response.Electroencephalography andClinical Neurophysiology, 80, 16–20.
Cook E. W., III, & Miller, G. A. ~1992!. Digital filtering: Background andtutorial for psychophysiologists.Psychophysiology, 29, 350–367.
Demiralp, T., & Bas(ar, E. ~1992!. Theta rhythmicities following expectedvisual and auditory targets.International Journal of Psychophysiology,13, 147–160.
Donchin, E., & Coles, M. G. H.~1988!. Is the P300 component a mani-festation of context updating?Behavioral and Brain Sciences, 11, 357–374.
Duncan-Johnson, C. C., & Donchin, E.~1979!. The time constant in P300recording.Psychophysiology, 16, 53–55.
Fabiani, M., Karis, D., & Donchin, E.~1990!. Effects of mnemonic strategymanipulation in a Van Restorff paradigm.Electroencephalography andClinical Neurophysiology, 75, 22–35.
Farwell, L. A., Martinerie, J. M., Bashore, T. R., Rapp, P. E., & Goddard,P. H. ~1993!. Optimal digital filters for long-latency components of theevent-related brain potential.Psychophysiology, 30, 306–315.
Ford, J., White, P., Lim, K., & Pfefferbaum, A.~1994!. Schizophrenicshave fewer and smaller P300s: A single-trial analysis.Biological Psy-chiatry, 35, 96–103.
Galambos, R.~1992!. A comparison of certain gamma band~40–Hz! brainrhythms in cat and man. In E. Bas(ar & T. H. Bullock ~Eds.!, Inducedrhythms in the brain~pp. 201–216!. Boston: Birkhäuser.
Goldman-Rakic, P.~1988!. Topography of cognition: Parallel distributednetworks in primate association cortex.Annual Reviews in Neurosci-ence, 11, 137–156.
Howard, L., & Polich, J.~1985!. P300 latency and memory span develop-ment.Developmental Psychology, 21, 283–289.
Intriligator, J., & Polich, J.~1994!. On the relationship between backgroundEEG and the P300 event-related potential.Biological Psychology, 37,207–218.
Intriligator, J., & Polich, J.~1995!. On the relationship between EEG andERP variability.International Journal of Psychophysiology, 20, 59–74.
Inouye, T., Shinosaki, K., Iyama, A., Matsumoto, Y., & Toi, S.~1994!.Moving potential field of frontal midline theta activity during a mentaltask.Cognitive Brain Research, 2, 87–92.
Jervis, B. W., Nichols, M. J., Johnson, T. E., Allen, E., & Hudson, N. R.~1983!. A fundamental investigation of the composition of auditoryevoked potentials.IEEE Transaction on Biomedical Engineering, BME-30, 43–49.
Johnson, R.~1986!. A triarchic model of P300 amplitude.Psychophysiol-ogy, 23, 367–384.
Johnson, R.~1988!. The amplitude of the P300 component of the event-related potential: review and synthesis. In P. Ackles, J. R. Jennings, &M. G. H. Coles ~Eds.!, Advances in psychophysiology: A researchannual ~Vol. 3, pp. 69–137!. Greenwich, CT: JAI Press.
Kalcher, J., & Pfurtscheller, G.~1995!. Discrimination between phase-locked and non-phase-locked event-related EEG activity.Electroenceph-alography and Clinical Neurophysiology, 94, 381–384.
Klimesch, W.~1995!. The P300 and band power in the theta and delta range.Psycoloquy@On-line serial#, 6~44!. Available: 95.6.44.memory-brain.5.
Klimesch, W., Doppelmayr, M., Russeger, H., & Pachinger, Th.~1996!.Theta band power in the human scalp EEG and the encoding of newinformation.NeuroReport, 7, 1235–1240.
Klimesch, W., Schimke, H., & Schwaiger, J.~1994!. Episodic and semanticmemory: An analysis in the EEG theta and alpha band.Electroenceph-alography and Clinical Neurophysiology, 91, 428–441.
Kolev, V., & Daskalova, M.~1990!. Recognition and analysis of singleevoked potentials.Proceedings of the North Sea Conference on Bio-medical Engineering, Antwerp, Belgium.
Kolev, V., & Schürmann, M.~1992!. Event-related prolongation of inducedEEG rhythmicities in experiments with a cognitive task.InternationalJournal of Neuroscience, 67, 199–213.
Kolev, V., & Yordanova, J.~1997!. Analysis of phase-locking is informa-tive for studying event-related EEG activity.Biological Cybernetics,76, 229–235.
Lang, M., Lang, W., Diekmann, V., & Kornhuber, H. H.~1989!. The frontaltheta rhythm indicating motor and cognitive learning. In R. Johnson,Jr., J. Rohrbaugh & R. Parasuraman~Eds.!, Current trends in event-related potential research. Electroencephalography and Clinical Neuro-physiology, Suppl. 40.Amsterdam: Elsevier.
Lopes da Silva, F. H.~1993!. Dynamics of EEG as signals of neuronalpopulations: Models and theoretical considerations. In E. Niedermeyer& F. H. Lopes da Silva~Eds.!, Electroencephalography: Basic princi-ples, clinical applications, and related fields~3rd ed., pp. 63–77!. Bal-timore: Williams & Wilkins.
McGillem, C. D., & Aunon, J. I.~1987!. Analysis of event-related poten-tials. In A. Gevins & A. Rémond~Eds.!, Methods for analysis of brainelectrical and magnetic signals, EEG Handbook~Rev. series, Vol. 1,pp. 131–169!. Amsterdam: Elsevier.
Miller, R. ~1991!. Cortico-hippocampal interplay and the representation ofcontexts in the brain. Berlin: Springer.
Miller, R. ~1994!. Cortico-hippocampal interplay: Synopsis of theory. In C.Pantev, T. Elbert, & B. Lütkenhöner~Eds.!, Oscillatory event-relatedbrain dynamics~NATO ASI Series, Vol. 271, pp. 43–52!. New York:Plenum Press.
Mizuki, Y., Masotoshi, T., Isozaki, H., Nishijima, H., & Inanaga, K.~1980!.Periodic appearance of theta rhythm in the frontal midline area duringperformance of a mental task.Electroencephalography and ClinicalNeurophysiology, 49, 345–351.
Mizuki, Y., Takii, O., Nishijima, H., & Inanaga, K.~1983!. The relationshipbetween the appearance of frontal midline theta activity~Fmu! andmemory function.Electroencephalography and Clinical Neurophysiol-ogy, 56, 56P.
Pantev, C.~1995!. Evoked and induced gamma-band activity of the humancortex.Brain Topography, 7, 321–330.
Pantev, C., Elbert, T., & Lütkenhöner, B.~Eds.!. ~1994!. Oscillatory event-related brain dynamics. New York: Plenum Press.
Parvin, C., Torres, F., & Johnson, E.~1980!. Synchronization of singleevoked response components: Estimation and interrelation of reproduc-ibility measures. In G. Pfurtscheller, P. Busser, F. H. Lopes da Silva, &H. Petsche~Eds.!, Rhythmic EEG activities and cortical functioning~pp. 203–217!. Amsterdam: Elsevier.
Pfefferbaum, A., Christensen, C., Ford, J., & Kopell, B. S.~1986!. Ap-parent response incompatibility effects on P3 latency depend on thetask.Electroencephalography and Clinical Neurophysiology, 64, 424–437.
Pfurtscheller, G., Steffan, J., & Maresch, H.~1988!. ERD mapping andfunctional topography: Temporal and spatial aspects. In G. Pfurtscheller& F. H. Lopes da Silva~Eds.!, Functional brain imaging~pp. 117–130!. Toronto: Huber.
Picton, T. W.~1992!. The P300 wave of the human event-related potential.Journal of Clinical Neurophysiology, 9, 456–479.
Polich, J.~1987!. Comparison of P300 from a passive tone sequence par-adigm and an active discrimination task.Psychophysiology, 24, 41–46.
Polich, J. ~1993!. P300 in clinical applications: meaning, method, andmeasurements. In E. Niedermeyer & F. H. Lopes da Silva~Eds.!,Electroencephalography: Basic principles, clinical applications, andrelated fields~3rd ed., pp. 1005–1018!. Baltimore: Williams & Wilkins.
Polich, J.~1997!. On the relationship between EEG and P300: Individualdifferences, aging, and ultradian rhythms.International Journal of Psy-chophysiology, 26, 299–317.
Polich, J., Eischen, S., & Collins, G.~1994!. P300 from a single auditorystimulus.Electroencephalography and Clinical Neurophysiology, 92,253–261.
Polich, J., & Kok, A. ~1995!. Cognitive and biological determinants ofP300: An integrative review.Biological Psychology, 41, 103–146.
Pratt, H., Michalewski, H. J., Barrett, G., & Starr, A.~1989!. Brain poten-tials in a memory-scanning task. I. Modality and task effects on potentialsto the probes.Electroencephalography and Clinical Neurophysiology,72, 407–421.
Pritchard, W. S.~1981!. Psychophysiology of the P300.PsychologicalBulletin, 89, 506–540.
Röschke, J., Mann, K., Riemann, D., Frank, C., & Fell, J.~1995!. Sequen-tial analysis of the brain’s transfer properties during consecutive REMepisodes.Electroencephalography and Clinical Neurophysiology, 96,390–397.
Ruchkin, D.~1988!. Measurement of event-related potentials: Signal ex-
Single-sweep theta response 125
traction. In T. Picton~Ed.!, Human event-related potentials, Handbookof EEG ~Rev. series, Vol. 3, pp. 7–43!. Amsterdam: Elsevier.
Sanquist, Th. F., Rohrbaugh, J. W., Syndulko, K., & Lindsley, D. B.~1980!.Electrocortical signs of levels of processing: Perceptual analysis andrecognition memory.Psychophysiology, 17, 568–576.
Sayers, B. McA., Beagley, H. A., & Henshall, W. R.~1974!. The mecha-nism of auditory evoked EEG responses.Nature, 247, 481–483.
Scheffers, M. K., & Johnson, R., Jr.~1994!. Recognition memory andsearch for attended letters: An event-related potential analysis.Journalof Psychophysiology, 8, 328–347.
Schürmann, M., & Bas(ar, E.~1994!. Topography of alpha and theta oscil-latory responses upon auditory and visual stimuli in humans.BiologicalCybernetics, 72, 161–174.
Schürmann, M., Bas(ar-Eroglu, C., Kolev, V., & Bas(ar, E. ~1995!. A newmetric for analyzing single-trial event-related potentials. Application tohuman visual P300 delta response.Neuroscience Letters, 197, 167–170.
Solodovnikov, V. V. ~1960!. Introduction to the statistical dynamics ofautomatic control systems. New York: Dover.
Stampfer, G. H., & Bas(ar, E.~1985!. Does frequency analysis lead to betterunderstanding of human event-related potentials.International Journalof Neuroscience, 26, 181–196.
Unsal, A., & Segalowitz, S.~1995!. Sources of P300 attenuation after headinjury: Single-trial amplitude, latency jitter, and EEG power.Psycho-physiology, 32, 249–256.
Verleger, R., & Wascher, E.~1995!. Fitting ex-Gauss functions to P3 wave-shapes: An attempt at distinguishing between real and apparent changesof P3 latency.Journal of Psychophysiology, 9, 146–158.
Wastell, D. G.~1979!. The application of low-pass linear filters to evokedpotential data: Filtering without phase distortion.Electroencephalog-raphy and Clinical Neurophysiology, 46, 355–356.
Woody, C. D.~1967!. Characterization of an adaptive filter for the analysisof variable latency neuroelectric signals.Medical and Biological En-gineering, 5, 539–553.
Yordanova, J., Kolev, V., & Bas(ar, E. ~1996!. Evoked brain rhythms arealtered markedly in middle-aged subjects: Single-sweep analysis.In-ternational Journal of Neuroscience, 85, 155–163.
Yordanova, J., & Kolev, V.~1996!. Developmental changes in the alpharesponse system in children.Electroencephalography and Clinical Neuro-physiology, 99, 527–538.
~Received June 11, 1996;Accepted February 5, 1997!
126 J. Yordanova and V. Kolev