ketamine effects on brain function — simultaneous fmri/eeg during a visual oddball task
TRANSCRIPT
NeuroImage 58 (2011) 508–525
Contents lists available at ScienceDirect
NeuroImage
j ourna l homepage: www.e lsev ie r.com/ locate /yn img
Ketamine effects on brain function — Simultaneous fMRI/EEG during a visualoddball task
Francesco Musso a,b,1, Jürgen Brinkmeyer a,b,1, Daniel Ecker c, Markus K. London c,Giesela Thieme c, Tracy Warbrick a, Hans-Jörg Wittsack d, Andreas Saleh d,Wolfgang Greb c, Peter de Boer e, Georg Winterer a,f,⁎a Institute of Neurosciences and Medicine, Helmholtz Research Center, Jülich, Germanyb Department of Psychiatry, Heinrich-Heine University, Düsseldorf, Germanyc FOCUS Clinical Drug Development GmbH, Neuss, Germanyd Institute of Radiology, Heinrich-Heine University, Düsseldorf, Germanye Janssen Pharmaceutica, Johnson & Johnson Pharmaceutical Research & Development, Beerse, Belgiumf Cologne Center for Genomics (CCG), University of Cologne, Germany
⁎ Corresponding author at: Cologne Center for GenomWeyertal Str. 115b 50931 Cologne Germany. Fax: +49
E-mail address: [email protected] (G. WURL: http://www.ccg.uni-koeln.de (G. Winterer).
1 These authors contributed equally.
1053-8119/$ – see front matter © 2011 Elsevier Inc. Aldoi:10.1016/j.neuroimage.2011.06.045
a b s t r a c t
a r t i c l e i n f oArticle history:
Received 31 January 2011Revised 9 June 2011Accepted 17 June 2011Available online 29 June 2011Keywords:KetamineSchizophreniaPharmacoimagingFunctional biomarkerP300Simultaneous fMRI/EEG
Background: Behavioral and electrophysiological human ketamine models of schizophrenia are used fortesting compounds that target the glutamatergic system. However, corresponding functional neuroimagingmodels are difficult to reconcile with functional imaging and electrophysiological findings in schizophrenia.Resolving the discrepancies between different observational levels is critical to understand the complexpharmacological ketamine action and its usefulness for modeling schizophrenia pathophysiology.Methods: We conducted a within-subject, randomized, placebo-controlled pharmacoimaging study intwenty-four male volunteers. Subjects were given low-dose S-ketamine (bolus prior to functional imaging:0.1 mg/kg during 5 min, thereafter continuous infusion: 0.015625 mg/kg/min reduced by 10% every tenminutes) or placebo while performing a visual oddball task during simultaneous functional magneticresonance imaging (fMRI) with continuous recording of event-related potentials (P300) and electrodermalactivity (EDA). Before and after intervention, psychopathological status was assessed using the Positive andNegative Syndrome Scale (PANSS) and the Altered State of Consciousness (5D-ASC) Rating Scale.
Results: P300 amplitude and corresponding BOLD responses were diminished in the ketamine condition incortical regions being involved in sensory processing/selective attention. In both measurement modalitiesseparation of drug conditions was achieved with area under the curve (AUC) values of up to 0.8–0.9. Ketamineeffects were also observed in the clinical, behavioral and peripheral physiological domains (Positive andNegative Syndrome Scale, reaction hit and false alarm rate, electrodermal activity and heart rate) which werein part related to the P300/fMRI measures.Conclusion: The findings from our ketamine experiment are consistent across modalities and directly relatedto observations in schizophrenia supporting the validity of the model. Our investigation provides the firstprototypic example of a pharmacoimaging study using simultaneously acquired fMRI/EEG.© 2011 Elsevier Inc. All rights reserved.
Introduction
The non-competitive N-methyl-D-aspartate (NMDA) glutamatereceptor antagonist ketamine is used to model schizophrenia-associated symptoms (Newcomer and Krystal, 2001). When admin-istered in subanesthetic doses to healthy volunteers, the “dissociative”drug ketamine induces positive and negative symptoms as well as
ics (CCG) University of Cologne221 478 96866.interer).
l rights reserved.
cognitive deficits including impairments of attention (Krystal et al.,1994; Morgan et al., 2004; Newcomer et al., 1999; Umbricht et al.,2000). Since ketamine also mimics behavioral responses in laboratoryanimals that resemble symptoms of schizophrenia, the ketaminemodel is regarded as a suitable model for preclinical experiments andearly studies in clinical drug development (Javitt et al., 2008; Krystalet al., 2005).
When combined with ketamine challenge, positron emissiontomography (PET), functional magnetic resonance imaging (fMRI)and/or electrophysiology (EEG) may serve as useful functionalbiomarkers in the process of developing drugs that counteractketamine effects (DiMasi et al., 2003; Javitt, 2008; Javitt et al.,2008). Among several reasons, the most important rationale for using
509F. Musso et al. / NeuroImage 58 (2011) 508–525
functional biomarkers as surrogate outcomemeasures in early clinicaldrug trials is related to the recognition that the process of traditionaloutcome-based drug discovery and development can be long,expensive and uncertain (DiMasi et al., 2003; Littman and Williams,2005; Rawlins, 2004; Winterer, 2009). Knowledge as obtained fromscreening with biomarkers at an early time point during this processmay help to speed-up decision-making about drug candidateselection and therapeutic concepts which will facilitate the develop-ment process by ensuring that if we are to fail, we fail fast (Borsooket al., 2006). The critical question in this context, however, is whetherany functional biomarker is a useful and valid surrogate endpointmeasure. This issue was extensively discussed on a meeting withMATRICS convened representatives from NIMH, academia, andindustry in Potomac, Maryland 2004 (Cho et al., 2005). With regardto drug development of schizophrenia cognitive enhancers, partici-pants from industry clearly expressedwhat they consider to be useful,i.e., reliable measures of brain activity associated with cognition thatcan provide early indication of efficacy.
At present, functional imaging models of ketamine effects aredifficult to reconcile with findings in schizophrenia. Also, ketamine-induced inconsistencies across imaging modalities are difficult tointerpret which limits the application of functional imaging assurrogate endpoint measure in drug trials. Resting state ketaminePET (positron emission tomography) studies have consistentlyobserved increased activation in the anterior cingulate and prefrontalcortices in healthy volunteers being correlated with the severity ofpsychotic symptoms (Breier et al., 1997; Holcomb et al., 2001; Lahtiet al., 1995; Vollenweider et al., 1997). These findings were regardedas compatible with the notion that the effects of subanestheticdoses of NMDA antagonists result from preferential inhibition ofGABAergic interneurons over the activity of principal neurons leadingto disinhibition of glutamatergic neurons, i.e. increased glutamaterelease (Krystal et al., 2003; Maccaferri and Dingledine, 2002).However, there are several reasons calling this notion of ketamine-induced activation in question. Thus, these PET findings are not easilyreconciled with functional imaging data (without ketamine chal-lenge) from schizophrenia patients showing mostly decreasedcortical activation — in particular in those patients with predomi-nantly negative symptoms (Hill et al., 2004). To make things morecomplicated, a recently conducted resting state fMRI ketamine studyin healthy volunteers reported both prefrontal hypoactivation whichstrongly predicted its dissociative effects and hyperactivation inposterior cingulate and temporal cortex (Deakin et al., 2008). In fact,there is increasing evidence that schizophrenia patients can displayboth cortical hypo- and hyperactivation during cognitive tasks whichgave rise to the notion that pathophysiologically unaffected patches ofcortex may actually be overactivated for compensatory reasons —
perhaps mostly in high-functioning patients (Callicott et al., 2000,2003; Manoach et al., 1999, 2000). While these fMRI studies providegood evidence that this may be true, they are only of limited helpwhen trying to align the findings from ketamine studies usingfunctional imaging during cognitive tasks. This is because greateractivation – with limited evidence for concomitant hypoactivation –
was mostly seen with ketamine in various cortical regions in mostfMRI studies that were conducted during cognitive demand (Daumannet al., 2010; Fu et al., 2005; Honey et al., 2004, 2005; Northoff et al.,2005). Saying this, it is acknowledged that there is some evidence insupport of the notion that ketamine under varying task conditions or inconjunction with different aspects of certain tasks may induce hypo- orhyperactivation – if not both concomitantly – as for instance recentlydemonstrated by Stone et al. (2010).
Electrophysiological studies of ketamine effects on event-relatedpotentials (ERPs) are more easily integrated with findings inschizophrenia. Upon subanesthetic ketamine challenge, a reductionof ERP-amplitudes across different task conditions including oddballP300 (Oranje et al., 2000, 2009; Watson et al., 2009) and mismatch
negativity MMN (Javitt et al., 2008; Umbricht et al., 2000, 2002) hasbeen reported essentially without exception and reduced MMN andP300 amplitudes are generally seen in schizophrenia — largelyindependent of clinical subgroups (Javitt et al., 2008; Turetsky et al.,2007; Winterer and McCarley, 2011). fMRI studies using auditory andvisual oddball task conditions are compatible with these electrophys-iological findings and mostly described diminished cortical activationin multiple regions in schizophrenia (Gur et al., 2007; Kiehl andLiddle, 2001; Kiehl et al., 2005; Laurens et al., 2005; Morey et al., 2005;Wolf et al., 2008). This suggests that an oddball imaging paradigmmight be an attractive candidate to be put in place as a humanketamine model — in particular when ERP and fMRI information issimultaneously acquired (Brinkmeyer et al., 2010; Musso et al., 2010;Warbrick et al., 2009) for cross-validation given that ERPs are a directmeasure of postsynaptic brain activity whereas fMRI only provides anindirect measure. The importance of such combined measurementsbecomes even more obvious when considering recent resting statePET studies (Långsjö et al., 2003, 2005) showing that ketamine-induced global increase in regional cerebral blood flow wasaccompanied by decreased regional oxygen extraction and increasedcerebral glucose metabolism. Also, a direct vascular ketamine effect,independent of the N-methyl-D-aspartate (NMDA) receptor, has beenreported (Noh et al., 2009). These various ketamine effects, perhapsinteracting with task conditions, make any prediction of ketamine neteffects an arduous task.
During the past years, we have successfully established simulta-neous fMRI/EEG data acquisition/analysis across different taskconditions (Brinkmeyer et al., 2010; Mobascher et al., 2009; Mussoet al., 2010; Warbrick et al., 2009). In the present study, we sought toclarify and quantify the relationship of direct and indirect ketamineeffects on brain function by simultaneously acquiring electrophysio-logical (P300) and BOLD (blood oxygenation level dependent)responses and to explore the utility of simultaneous fMRI/EEG asfunctional biomarker in a ketamine model [as opposed to most EEGoddball investigations in schizophrenia, visual was preferred overauditory stimulation because it is more easily conducted in the MR-scanner environment and because P300-amplitude and related BOLD-responses were reported to be reduced in both modalities inschizophrenia (see introduction)].
Methods and materials
The study was conducted in compliance with the declaration ofHelsinki and in agreement with the Good Clinical Practice (ICH-GCP)guidelines and the EU Clinical Trial Directive 2001/20/EC and relevantlegal regulations of the German Medicines Law (Arzneimittelgesetz).The study was approved by the local ethics committee (ÄrztekammerNordrhein, Düsseldorf, Germany) and by the German federal drugagency (Bundesinstitut für Arzneimittel and Medizinprodukte,BfArM).
Participants
Participants were recruited by newspaper and website. Afterhaving obtainedwritten informed consent andwithin three days priorto study inclusion, all participants underwent a full medical,neurological and psychiatric examination by a board certifiedneurologist and psychiatrist within three weeks prior to studyinclusion. Eligibility criteria were confirmed on the day prior tostudy inclusion (see below). The psychiatric examination included thestructured clinical interview (SCID) for the assessment of lifetimeDSM-IV Axis I/II diagnoses (First et al., 1995). In total, N=24 healthymale volunteers (age: 27.0±4.74 years, range: 20–35) participated.All subjects except two were right-handed. Eight subjects weresmokers, 16 were non-smokers. Mean body mass index (BMI) was24.2 kg/m2 (SD=2.5), range: 19.0–30.8.
510 F. Musso et al. / NeuroImage 58 (2011) 508–525
Inclusion criteria: male, age range between 18 and 35 years, supinepulse rate between 45 and 90/min, systolic blood pressure between100 and 140 mmHg, diastolic blood pressure between 50 and90 mmHg. Normal electrocardiogram (ECG), blood and urine labora-tory values. Negative urine drug screen (opioides, amphetamine,cannabinoids, benzodiazepine, barbiturate, cocaine), no drug treat-ment within four weeks prior to study inclusion, written informedconsent.
Exclusion criteria: present or past diagnosis of a DSM-IV Axis-I orAxis-II psychiatric disorder including drug abuse within six monthsprior to study inclusion, first or second degree relative with adiagnosis of schizophrenia. History of clinically significant medical/neurological illnesses including cardiovascular, respiratory, gastroin-testinal and endocrinological diseases, glaucoma, renal and hepaticdiseases. Clinically significant abnormalities in routine laboratorytests, ECG or physical examination. Peripheral oxygen saturation(SPO2)b90 mmHg. Positive HIV1/2 test, positive hepatitis B antigen,positive hepatitis C antibody. Abnormal T3, T4, TSH values. History ofhypersensitivity or severe side effects associated with any kind ofdrug including S-ketamine. Claustrophobia, metal implants, cardiacpacemaker. Participation in clinical trials within three months prior tostudy inclusion.
Study design
This was a randomized, double-blind, placebo-controlled cross-over trial. All participants were investigated twice at least one weekapart receiving either S-ketamine or placebo in random order. Allclinicians involved in study-related assessments were blinded to therandomization condition.
The evening before the day of investigation, participants wereadmitted to the Clinical Research Unit (CRU) of FOCUS DrugDevelopment GmbH, an experienced hospital-based Clinical ResearchOrganization (CRO) in Neuss, Germany for Clinical Phase-I/IIa drugtrials (http://www.focus-cdd.de). After staying over-night in the CRU,participants underwent the drug-challenge investigation with simul-taneously acquired fMRI/EEG during the following day in the nearbyInstitute of Radiology, Heinrich-Heine University Hospital, Düsseldorf,Germany (http://www.uniklinik-duesseldorf.de/radiologie). After thedrug-challenge investigation, participants spent 24 h in the CRUunder medical supervision including monitoring of safety parameters(ECG, pulse rate, blood pressure) and assessment of adverse eventsbefore discharge after a final medical, neurological and psychiatricexamination.
Ketamine–placebo experiment
Volunteers were prepared for the investigation including placingan i.v. line and fixing electrodes for measurements of EEG (see below).For continuous safety monitoring of vital functions, electrodes for 12-lead ECG, blood pressure, peripheral oxygen (O2) saturation andpartial pressure of carbon dioxide (CO2) in the respiratory gases(capnography) were attached to the body of the proband using MR-compatible equipment (Schiller Medical S.A.S. MAGLIFE C®). Afterplacing the proband into the scanner for fMRI measurements (seebelow), drug challenge (see below) and monitoring of vital functionswas conducted by a board certified anesthesist.
A subanesthetic dose of S-Ketamine HCl (Esketaminhydrochlorid)[Ketanest® S, Pfizer] was administered intravenously in 0.9% NaClusing a perfusor. As of its pharmacokinetic properties, S-ketaminewasadministered as a bolus (0.1 mg/kg during 5 min) immediately beforemeasurements in the MRI scanner. Thereafter, the infusion wasstopped for one minute. During the subsequent MR measurements, acontinuous infusion of S-ketamine (0.015625 mg/kg/min for theduration of the investigation, i.e., 1 h maximum) was carried out.Because ketamine plasma levels slowly increase with continuous
infusion (Feng et al., 1995) the administered dosage was reduced by10% every 10 min (Umbricht et al., 2000). Placebo was administeredanalogously as 0.9% NaCl infusion.
Clinical interview
Before drug (placebo/S-ketamine) challenge imaging investigationand immediately thereafter, psychopathogical evaluation was con-ducted by the psychiatrist who rated the volunteers on the Positiveand Negative Syndrome Scale (PANSS) (Kay et al., 1987). The AlteredState of Consciousness (5D-ASC) Rating Scale (Dittrich, 1998; Dittrichet al., 1985) was administered to evaluate internal states andperceptual experiences during ketamine. The 5D-ASC questionnaireis a visual-analog scale (VAS) consisting of 94 items assessing five keydimensions of altered states of consciousness (ASC). The scale waspreviously shown to be sensitive to the psychological effects ofpsilocybin in humans (Vollenweider, 1998).
Data acquisition
After subjects were placed in the scanner as comfortably aspossible, they received a structural MRI scan (7 min). Thereafter,subjects performed a visual oddball task (black and white checker-board reversal) consisting of 64 target and 256 nontarget stimuli(27 min). Stimuli were presented using Presentation version 11.3(Neurobehavioural systems, Albany, CA, USA®) via a screen situatedin front of the scanner. Subjects were able to view the screen via amirror mounted on the head coil. Subjects' responses (reaction time,false alarms and reaction hits) were recorded using Lumitouch keypads (Photon Control Inc, Burnaby, BC, Canada®). Subjects respondedto target stimuli with their right index finger; they were asked torespond quickly and accurately to each target stimulus and theirmotor reaction was recorded. Stimuli were presented with a durationof 1000 ms and a pseudorandomized interstimulus interval of 4000(±2500)ms. The visual oddball task was followed by a resting stateinvestigation (20 min) which will be reported elsewhere.
fMRI data acquisition
Functional MR-images were acquired using a 3T scanner (Trio,Siemens, Erlangen, Germany). In order to minimize head movements,the head of each subject was secured using sponge pads. Using echoplanar imaging (EPI), 630 volumes were obtained applying thefollowing EPI parameters: 33 slices, slice thickness 3 mm, FOV200×200 mm, 64×64 matrix, repetition time 2000 ms, echo time30 ms, flip angle 90°. To facilitate localization and co-registration offunctional data, structural scans were acquired at the beginning of theimaging session using T1-weighted MRI sequences (magnetizationprepared rapid gradient echo (MP-RAGE)): TR/TE=2250/3.03 ms,flip angle=9°, 176 sagittal slices, FOV 200×200 mm, 64×64 matrix,voxel size 1×1×1 mm.
EEG data acquisition
EEG data were recorded using a 32-channel MR compatible EEGsystem (Brain Products, Gilching, Germany®). The EEG cap (BrainCapMR, EasyCap GmbH, Breitbrunn, Germany®) consisted of 30 scalpelectrodes distributed according to the 10–20 system and twoadditional electrodes, one of which was attached to the subjects'back for recording the electrocardiogram (ECG), while the other wasattached on the outer canthi of the left eye for detection of ocularartifacts. Data were recorded relative to an FCz reference and a groundelectrode was located at Iz (10–5 electrode system) (Oostenveld andPraamstra, 2001). Data were sampled at 5000 Hz, with a bandpass of0.016–250 Hz. Impedance at all recording electrodes was b10 kΩ.
511F. Musso et al. / NeuroImage 58 (2011) 508–525
EDA data acquisition
Electrodermal activity (EDA) was measured as skin conductanceresponse (SCR) in constant voltage technique. Silver–silver chlorideelectrodeswere placed at the palmarmiddle phalanges of the index andmiddle finger of the right hand. The measurement site was prepared,following recommendations given by Fowles et al. (1981), electrodepaste, and the MR capable sensor (Brain Products GmbH Gilching,Germany®) were applied. The SCR signal was recorded in DC mode bymeans of a bipolar BrainAmp ExG MR amplifier (Brain Products GmbHGilching, Germany®) simultaneously with ongoing EEG.
fMRI data analysis
fMRI-analysis was performed with FSL (FMRIB's Software Library,www.fmrib.ox.ac.uk/fsl), employing different modules of the FSL-software package, non-brain removal using BET (Smith, 2002),spatial smoothing using a Gaussian kernel of FWHM=8 mm,mean-based intensity normalization of all volumes by the samefactor, and highpass temporal filtering (σ=125 s). General linearmodel (GLM) time-series statistical analysis of individual data setswas carried out using FILM (FMRIB's Improved Linear Model) withlocal autocorrelation correction (Woolrich et al., 2001). Motioncorrection and registration of functional images to high resolutionstructural images was done with FLIRT (Forman et al., 1995;Jenkinson et al., 2002). Explanatory variables were convolved witha gamma hemodynamic response function. Main explanatoryvariable was target stimuli (vs non-target stimuli). Group levelmixed effect analyses (placebo vs ketamine based on the differencescores target vs non-target) were conducted using FLAME (FMRIB'sLocal Analysis of Mixed Effects) (Behrens et al., 2003) with spatialnormalization to MNI (Montreal Neurological Institute) space andapplying the default cluster (familywise error rate, FWE) significancethreshold of ZN2.3, pb0.01 (Forman et al., 1995; Friston et al., 1994;Worsley et al., 1992). In additional group-level analyses of theplacebo and ketamine condition, orthogonalized co-variate explan-atory variables like PANSS-Scores, EDA etc. were entered in themodel. Functional data were imported to MRIcron for visual displaypurposes (Rorden et al., 2007).
Region-of-interest (ROI) analyses (mean Z-value) were conductedand selected as previously described by us for largely identical taskconditions (Warbrick et al., 2009). Accordingly, we chose regions thatare known to elicit the strongest BOLD-responses during a visualoddball task, i.e., the anterior cingulate cortex (ACC)/medial prefron-tal cortex, the visual cortex and temporoparietal cortex (planumtemporale). For ROI definition, masks were created based on thecombined group BOLD-responses for the placebo and ketaminecondition.
EEG data analysis
EEG data were processed offline using BrainVision Analyzer 2(Brain Products, Gilching, Germany®). For standard P300 analysis,the averaged P300 amplitude and latency was determined forelectrode position Pz (peak positive amplitude in a window from300 to 450 ms post stimulus which typically contains the visualP300). The (visual) P300 ERP at electrode position Pz is generallyused for clinical P300 analyses (Warbrick et al., 2009) and isgenerated by distributed electromagnetic sources from frontal,temporal and parietal cortices as well as occipital cortex (with visualstimulation) as assessed with intracortical electrodes (Baudena et al.,1995; Halgren et al., 1995a, 1995b).
Gradient artifact correction was performed using modifiedversions of the algorithms proposed by Allen et al. (2000), where agradient artifact template is subtracted from the EEG using a baselinecorrected sliding average of 20 MR-volumes. Data were then down-
sampled to 250 Hz. Following gradient artifact correction, the datawere corrected for cardioballistic artifacts. An average artifactsubtraction method was implemented in Brain Vision Analyzer. Thismethod involves subtracting the artifact on a second by second basisusing heartbeat events (R peaks) detected in the previous 10s. As suchit requires accurate detection of R peaks which is aided by theemployment of a moving average low pass filter and a finite impulseresponse high pass filter (Allen et al., 1998). In this study, the R peakswere detected semi-automatically, with manual adjustment for peaksmisidentified by the software. To average the artifact in the EEGchannels, the R peaks are transferred from the ECG to the EEG over aselectable time delay. The average artifact was then subtracted fromthe EEG. Data were then visually inspected for remaining cardiobal-listic artifacts as well as artifacts resulting from eye blink or othermuscular sources, and any epoch containing a voltage change of morethan 150 μV was rejected. For the target condition: a mean N of trialsof 54.70 (SD 2.33) for the placebo condition and 54.46 (SD 2.50) forthe ketamine condition (repeated measure t=0.34, p=0.739) werekept for further standard ERP and single trial (ST) analysis. Likewise,for the non-target condition: a mean N of trials of 224.52 (SD 2.56)for the placebo condition and 224.73 (SD 2.88) for the ketaminecondition (repeated measure t=0.25, p=0.801) were kept forfurther analysis. The EEG data were re-referenced to commonaverage, segmented into 1000 ms epochs (−200 ms to 800 ms, targetand non-target), baseline corrected and averaged. The averagedP300 and ST P300 parameters were extracted from the data foreach subject by identifying the peak positive amplitude in a windowfrom 300 to 450 ms post stimulus. P300 group comparisonsbetween drug conditions (ketamine vs placebo) are based on thedifference score between target and non-target condition (targetminus non-target).
LORETAFunctional neuroimaging current density (CD) analyses were
performed of the event-related EEG in 3-D Talairach space using thesLORETA (Standardized Low Resolution Electromagnetic Tomogra-phy) software package (Pascual-Marqui, 1999, 2002; Pascual-Marquiet al., 1994). Current density was calculated for the target and non-target P300 amplitude (±12 ms peak amplitude). Thereafter, P300 CDdifference scores (target minus non-target) were used for furtheranalyses.
The LORETA minimum norm approach is based on the neurophys-iological observation of coherent firing of neighboring neurons andassumes that the smoothest of all activity distributions is mostplausible. LORETA images represent the electrical activity as ampli-tude of the computed current density (μA/mm2), i.e., the amount ofcurrent that flows through a square millimeter [using vector calculusnotation, the “current source density” (μA/mm3) is defined as thedivergence of the current density, i.e., the divergence is a spatialderivative]. In contrast, sLORETA is dimensionless, because itstandardizes the current density (the denominator has the sameunits as the numerator), i.e., sLORETA units are simply units ofstandardized current density. As a consequence of the smoothnessconstraint, the characteristic feature of the resulting solution inLORETA/sLORETA is a relatively low spatial resolutionwith a “blurred-localized” image of a point source. The version of sLORETA employedin the present study used the digitized Talairach atlas estimating thecurrent density distribution of brain electrical activity on a dense gridof 6430 voxels at 5 mm spatial resolution (Pascual-Marqui, 2002). Thesolution space (the three dimensional space where the inverseproblem is solved)was restricted to the graymatter and hippocampusin the Talairach space. Registration between spherical and realistichead geometry used EEG-electrode coordinates reported by Towle etal. (1993). A voxel was labeled as gray matter if it met the followingthree conditions: its probability of being gray matter was higher thanthat of being white matter, its probability of being gray matter was
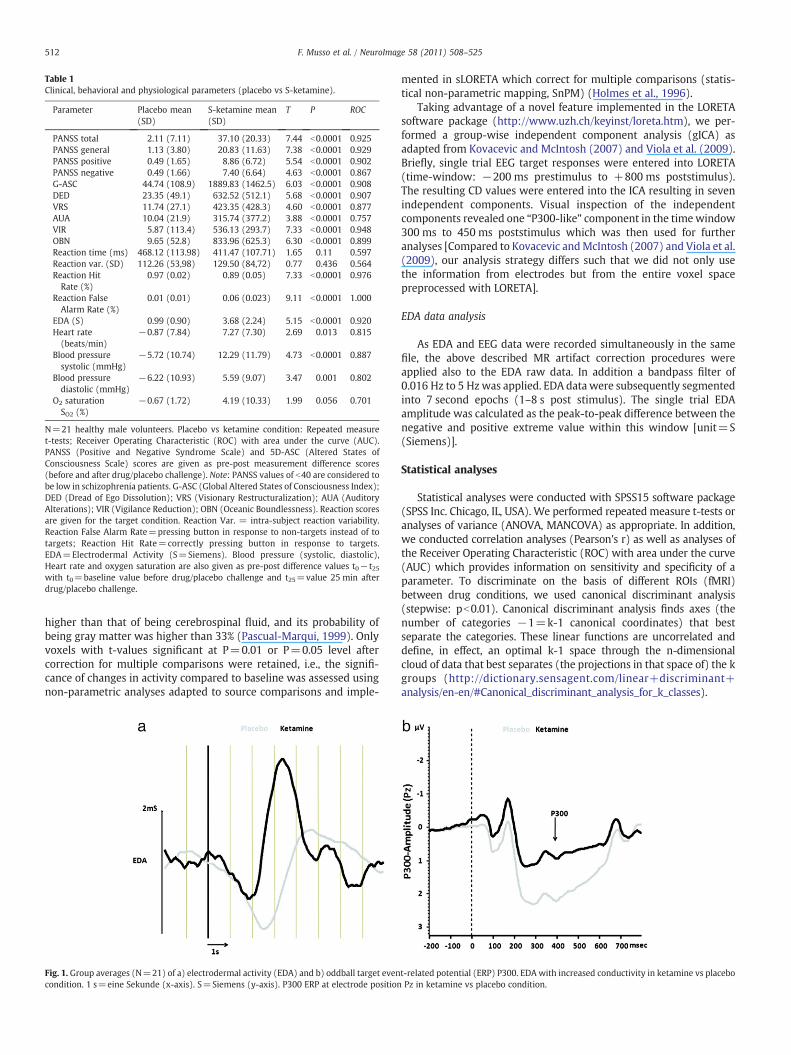
Table 1Clinical, behavioral and physiological parameters (placebo vs S-ketamine).
Parameter Placebo mean(SD)
S-ketamine mean(SD)
T P ROC
PANSS total 2.11 (7.11) 37.10 (20.33) 7.44 b0.0001 0.925PANSS general 1.13 (3.80) 20.83 (11.63) 7.38 b0.0001 0.929PANSS positive 0.49 (1.65) 8.86 (6.72) 5.54 b0.0001 0.902PANSS negative 0.49 (1.66) 7.40 (6.64) 4.63 b0.0001 0.867G-ASC 44.74 (108.9) 1889.83 (1462.5) 6.03 b0.0001 0.908DED 23.35 (49.1) 632.52 (512.1) 5.68 b0.0001 0.907VRS 11.74 (27.1) 423.35 (428.3) 4.60 b0.0001 0.877AUA 10.04 (21.9) 315.74 (377.2) 3.88 b0.0001 0.757VIR 5.87 (113.4) 536.13 (293.7) 7.33 b0.0001 0.948OBN 9.65 (52.8) 833.96 (625.3) 6.30 b0.0001 0.899Reaction time (ms) 468.12 (113.98) 411.47 (107.71) 1.65 0.11 0.597Reaction var. (SD) 112.26 (53,98) 129.50 (84,72) 0.77 0.436 0.564Reaction HitRate (%)
0.97 (0.02) 0.89 (0.05) 7.33 b0.0001 0.976
Reaction FalseAlarm Rate (%)
0.01 (0.01) 0.06 (0.023) 9.11 b0.0001 1.000
EDA (S) 0.99 (0.90) 3.68 (2.24) 5.15 b0.0001 0.920Heart rate(beats/min)
−0.87 (7.84) 7.27 (7.30) 2.69 0.013 0.815
Blood pressuresystolic (mmHg)
−5.72 (10.74) 12.29 (11.79) 4.73 b0.0001 0.887
Blood pressurediastolic (mmHg)
−6.22 (10.93) 5.59 (9.07) 3.47 0.001 0.802
O2 saturationSO2 (%)
−0.67 (1.72) 4.19 (10.33) 1.99 0.056 0.701
N=21 healthy male volunteers. Placebo vs ketamine condition: Repeated measuret-tests; Receiver Operating Characteristic (ROC) with area under the curve (AUC).PANSS (Positive and Negative Syndrome Scale) and 5D-ASC (Altered States ofConsciousness Scale) scores are given as pre-post measurement difference scores(before and after drug/placebo challenge). Note: PANSS values of b40 are considered tobe low in schizophrenia patients. G-ASC (Global Altered States of Consciousness Index);DED (Dread of Ego Dissolution); VRS (Visionary Restructuralization); AUA (AuditoryAlterations); VIR (Vigilance Reduction); OBN (Oceanic Boundlessness). Reaction scoresare given for the target condition. Reaction Var. = intra-subject reaction variability.Reaction False Alarm Rate=pressing button in response to non-targets instead of totargets; Reaction Hit Rate=correctly pressing button in response to targets.EDA=Electrodermal Activity (S=Siemens). Blood pressure (systolic, diastolic),Heart rate and oxygen saturation are also given as pre-post difference values t0− t25with t0=baseline value before drug/placebo challenge and t25=value 25 min afterdrug/placebo challenge.
512 F. Musso et al. / NeuroImage 58 (2011) 508–525
higher than that of being cerebrospinal fluid, and its probability ofbeing gray matter was higher than 33% (Pascual-Marqui, 1999). Onlyvoxels with t-values significant at P=0.01 or P=0.05 level aftercorrection for multiple comparisons were retained, i.e., the signifi-cance of changes in activity compared to baseline was assessed usingnon-parametric analyses adapted to source comparisons and imple-
Fig. 1. Group averages (N=21) of a) electrodermal activity (EDA) and b) oddball target evencondition. 1 s=eine Sekunde (x-axis). S=Siemens (y-axis). P300 ERP at electrode position
mented in sLORETA which correct for multiple comparisons (statis-tical non-parametric mapping, SnPM) (Holmes et al., 1996).
Taking advantage of a novel feature implemented in the LORETAsoftware package (http://www.uzh.ch/keyinst/loreta.htm), we per-formed a group-wise independent component analysis (gICA) asadapted from Kovacevic and McIntosh (2007) and Viola et al. (2009).Briefly, single trial EEG target responses were entered into LORETA(time-window: −200 ms prestimulus to +800 ms poststimulus).The resulting CD values were entered into the ICA resulting in sevenindependent components. Visual inspection of the independentcomponents revealed one “P300-like” component in the timewindow300 ms to 450 ms poststimulus which was then used for furtheranalyses [Compared to Kovacevic andMcIntosh (2007) and Viola et al.(2009), our analysis strategy differs such that we did not only usethe information from electrodes but from the entire voxel spacepreprocessed with LORETA].
EDA data analysis
As EDA and EEG data were recorded simultaneously in the samefile, the above described MR artifact correction procedures wereapplied also to the EDA raw data. In addition a bandpass filter of0.016 Hz to 5 Hzwas applied. EDA data were subsequently segmentedinto 7 second epochs (1–8 s post stimulus). The single trial EDAamplitude was calculated as the peak-to-peak difference between thenegative and positive extreme value within this window [unit=S(Siemens)].
Statistical analyses
Statistical analyses were conducted with SPSS15 software package(SPSS Inc. Chicago, IL, USA). We performed repeated measure t-tests oranalyses of variance (ANOVA, MANCOVA) as appropriate. In addition,we conducted correlation analyses (Pearson's r) as well as analyses ofthe Receiver Operating Characteristic (ROC) with area under the curve(AUC) which provides information on sensitivity and specificity of aparameter. To discriminate on the basis of different ROIs (fMRI)between drug conditions, we used canonical discriminant analysis(stepwise: pb0.01). Canonical discriminant analysis finds axes (thenumber of categories −1=k-1 canonical coordinates) that bestseparate the categories. These linear functions are uncorrelated anddefine, in effect, an optimal k-1 space through the n-dimensionalcloud of data that best separates (the projections in that space of) the kgroups (http://dictionary.sensagent.com/linear+discriminant+analysis/en-en/#Canonical_discriminant_analysis_for_k_classes).
t-related potential (ERP) P300. EDA with increased conductivity in ketamine vs placeboPz in ketamine vs placebo condition.
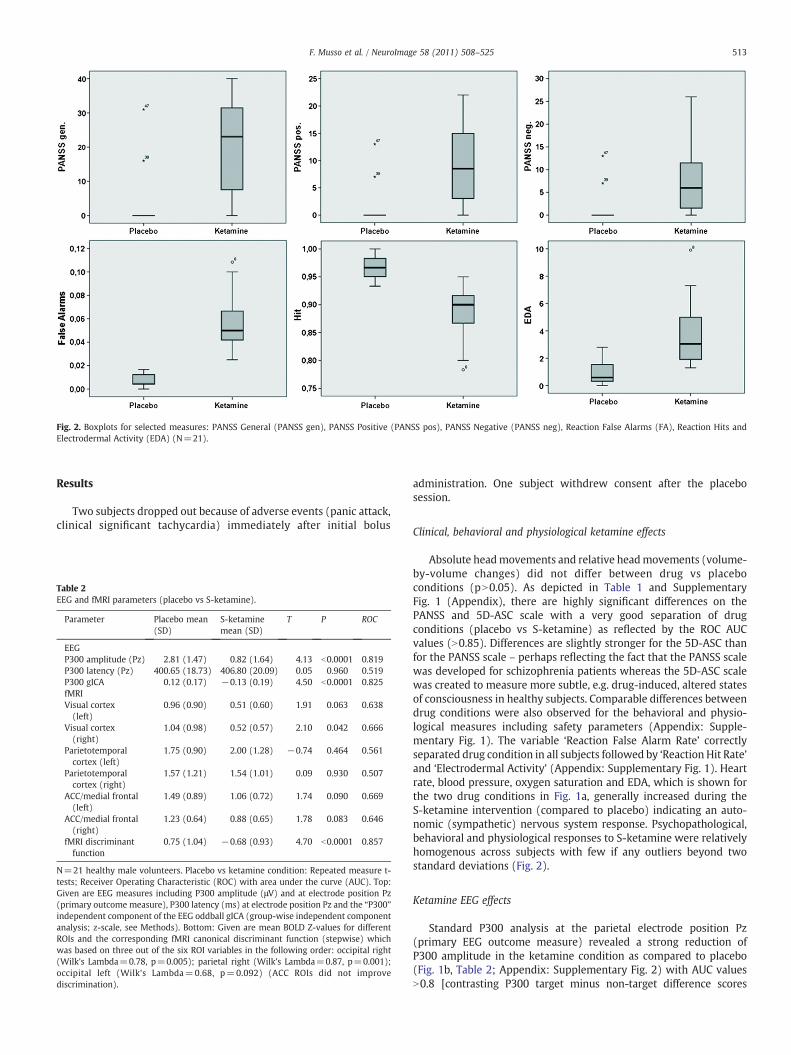
Fig. 2. Boxplots for selected measures: PANSS General (PANSS gen), PANSS Positive (PANSS pos), PANSS Negative (PANSS neg), Reaction False Alarms (FA), Reaction Hits andElectrodermal Activity (EDA) (N=21).
513F. Musso et al. / NeuroImage 58 (2011) 508–525
Results
Two subjects dropped out because of adverse events (panic attack,clinical significant tachycardia) immediately after initial bolus
Table 2EEG and fMRI parameters (placebo vs S-ketamine).
Parameter Placebo mean(SD)
S-ketaminemean (SD)
T P ROC
EEGP300 amplitude (Pz) 2.81 (1.47) 0.82 (1.64) 4.13 b0.0001 0.819P300 latency (Pz) 400.65 (18.73) 406.80 (20.09) 0.05 0.960 0.519P300 gICA 0.12 (0.17) −0.13 (0.19) 4.50 b0.0001 0.825fMRIVisual cortex(left)
0.96 (0.90) 0.51 (0.60) 1.91 0.063 0.638
Visual cortex(right)
1.04 (0.98) 0.52 (0.57) 2.10 0.042 0.666
Parietotemporalcortex (left)
1.75 (0.90) 2.00 (1.28) −0.74 0.464 0.561
Parietotemporalcortex (right)
1.57 (1.21) 1.54 (1.01) 0.09 0.930 0.507
ACC/medial frontal(left)
1.49 (0.89) 1.06 (0.72) 1.74 0.090 0.669
ACC/medial frontal(right)
1.23 (0.64) 0.88 (0.65) 1.78 0.083 0.646
fMRI discriminantfunction
0.75 (1.04) −0.68 (0.93) 4.70 b0.0001 0.857
N=21 healthy male volunteers. Placebo vs ketamine condition: Repeated measure t-tests; Receiver Operating Characteristic (ROC) with area under the curve (AUC). Top:Given are EEG measures including P300 amplitude (μV) and at electrode position Pz(primary outcome measure), P300 latency (ms) at electrode position Pz and the “P300”independent component of the EEG oddball gICA (group-wise independent componentanalysis; z-scale, see Methods). Bottom: Given are mean BOLD Z-values for differentROIs and the corresponding fMRI canonical discriminant function (stepwise) whichwas based on three out of the six ROI variables in the following order: occipital right(Wilk's Lambda=0.78, p=0.005); parietal right (Wilk's Lambda=0.87, p=0.001);occipital left (Wilk's Lambda=0.68, p=0.092) (ACC ROIs did not improvediscrimination).
administration. One subject withdrew consent after the placebosession.
Clinical, behavioral and physiological ketamine effects
Absolute headmovements and relative headmovements (volume-by-volume changes) did not differ between drug vs placeboconditions (pN0.05). As depicted in Table 1 and SupplementaryFig. 1 (Appendix), there are highly significant differences on thePANSS and 5D-ASC scale with a very good separation of drugconditions (placebo vs S-ketamine) as reflected by the ROC AUCvalues (N0.85). Differences are slightly stronger for the 5D-ASC thanfor the PANSS scale – perhaps reflecting the fact that the PANSS scalewas developed for schizophrenia patients whereas the 5D-ASC scalewas created to measure more subtle, e.g. drug-induced, altered statesof consciousness in healthy subjects. Comparable differences betweendrug conditions were also observed for the behavioral and physio-logical measures including safety parameters (Appendix: Supple-mentary Fig. 1). The variable ‘Reaction False Alarm Rate’ correctlyseparated drug condition in all subjects followed by ‘Reaction Hit Rate’and ‘Electrodermal Activity’ (Appendix: Supplementary Fig. 1). Heartrate, blood pressure, oxygen saturation and EDA, which is shown forthe two drug conditions in Fig. 1a, generally increased during theS-ketamine intervention (compared to placebo) indicating an auto-nomic (sympathetic) nervous system response. Psychopathological,behavioral and physiological responses to S-ketamine were relativelyhomogenous across subjects with few if any outliers beyond twostandard deviations (Fig. 2).
Ketamine EEG effects
Standard P300 analysis at the parietal electrode position Pz(primary EEG outcome measure) revealed a strong reduction ofP300 amplitude in the ketamine condition as compared to placebo(Fig. 1b, Table 2; Appendix: Supplementary Fig. 2) with AUC valuesN0.8 [contrasting P300 target minus non-target difference scores
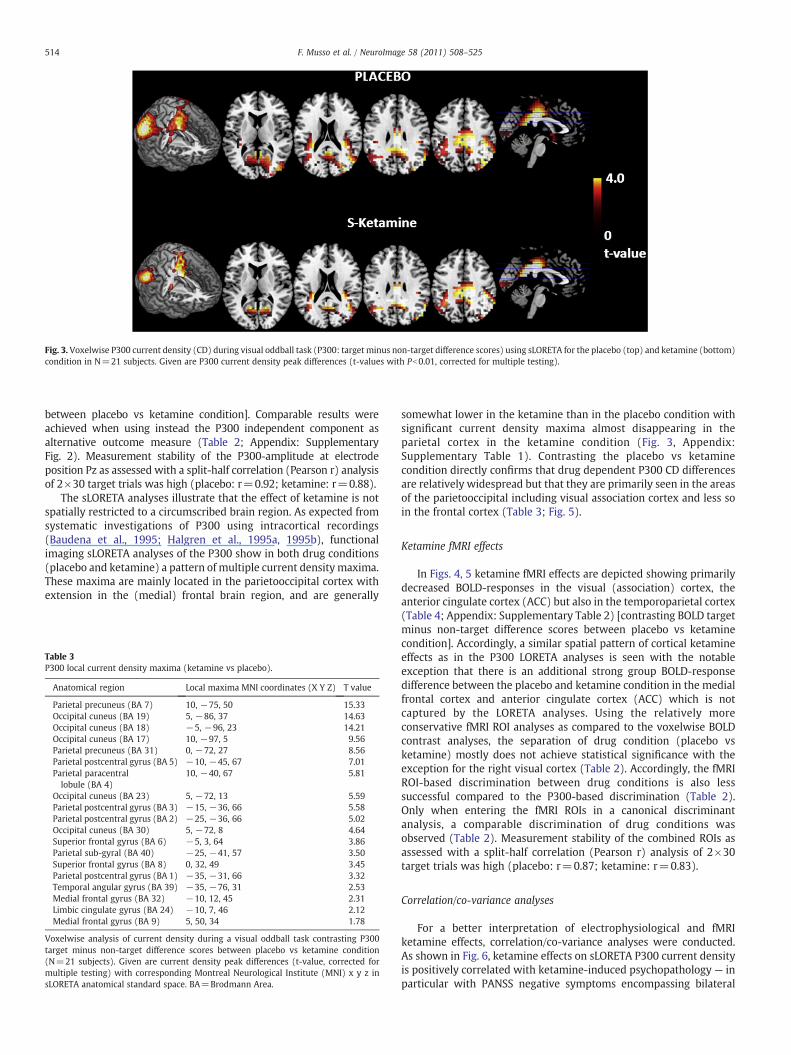
Fig. 3. Voxelwise P300 current density (CD) during visual oddball task (P300: target minus non-target difference scores) using sLORETA for the placebo (top) and ketamine (bottom)condition in N=21 subjects. Given are P300 current density peak differences (t-values with Pb0.01, corrected for multiple testing).
514 F. Musso et al. / NeuroImage 58 (2011) 508–525
between placebo vs ketamine condition]. Comparable results wereachieved when using instead the P300 independent component asalternative outcome measure (Table 2; Appendix: SupplementaryFig. 2). Measurement stability of the P300-amplitude at electrodeposition Pz as assessed with a split-half correlation (Pearson r) analysisof 2×30 target trials was high (placebo: r=0.92; ketamine: r=0.88).
The sLORETA analyses illustrate that the effect of ketamine is notspatially restricted to a circumscribed brain region. As expected fromsystematic investigations of P300 using intracortical recordings(Baudena et al., 1995; Halgren et al., 1995a, 1995b), functionalimaging sLORETA analyses of the P300 show in both drug conditions(placebo and ketamine) a pattern of multiple current densitymaxima.These maxima are mainly located in the parietooccipital cortex withextension in the (medial) frontal brain region, and are generally
Table 3P300 local current density maxima (ketamine vs placebo).
Anatomical region Local maxima MNI coordinates (X Y Z) T value
Parietal precuneus (BA 7) 10, −75, 50 15.33Occipital cuneus (BA 19) 5, −86, 37 14.63Occipital cuneus (BA 18) −5, −96, 23 14.21Occipital cuneus (BA 17) 10, −97, 5 9.56Parietal precuneus (BA 31) 0, −72, 27 8.56Parietal postcentral gyrus (BA 5) −10, −45, 67 7.01Parietal paracentrallobule (BA 4)
10, −40, 67 5.81
Occipital cuneus (BA 23) 5, −72, 13 5.59Parietal postcentral gyrus (BA 3) −15, −36, 66 5.58Parietal postcentral gyrus (BA 2) −25, −36, 66 5.02Occipital cuneus (BA 30) 5, −72, 8 4.64Superior frontal gyrus (BA 6) −5, 3, 64 3.86Parietal sub-gyral (BA 40) −25, −41, 57 3.50Superior frontal gyrus (BA 8) 0, 32, 49 3.45Parietal postcentral gyrus (BA 1) −35, −31, 66 3.32Temporal angular gyrus (BA 39) −35, −76, 31 2.53Medial frontal gyrus (BA 32) −10, 12, 45 2.31Limbic cingulate gyrus (BA 24) −10, 7, 46 2.12Medial frontal gyrus (BA 9) 5, 50, 34 1.78
Voxelwise analysis of current density during a visual oddball task contrasting P300target minus non-target difference scores between placebo vs ketamine condition(N=21 subjects). Given are current density peak differences (t-value, corrected formultiple testing) with corresponding Montreal Neurological Institute (MNI) x y z insLORETA anatomical standard space. BA=Brodmann Area.
somewhat lower in the ketamine than in the placebo condition withsignificant current density maxima almost disappearing in theparietal cortex in the ketamine condition (Fig. 3, Appendix:Supplementary Table 1). Contrasting the placebo vs ketaminecondition directly confirms that drug dependent P300 CD differencesare relatively widespread but that they are primarily seen in the areasof the parietooccipital including visual association cortex and less soin the frontal cortex (Table 3; Fig. 5).
Ketamine fMRI effects
In Figs. 4, 5 ketamine fMRI effects are depicted showing primarilydecreased BOLD-responses in the visual (association) cortex, theanterior cingulate cortex (ACC) but also in the temporoparietal cortex(Table 4; Appendix: Supplementary Table 2) [contrasting BOLD targetminus non-target difference scores between placebo vs ketaminecondition]. Accordingly, a similar spatial pattern of cortical ketamineeffects as in the P300 LORETA analyses is seen with the notableexception that there is an additional strong group BOLD-responsedifference between the placebo and ketamine condition in the medialfrontal cortex and anterior cingulate cortex (ACC) which is notcaptured by the LORETA analyses. Using the relatively moreconservative fMRI ROI analyses as compared to the voxelwise BOLDcontrast analyses, the separation of drug condition (placebo vsketamine) mostly does not achieve statistical significance with theexception for the right visual cortex (Table 2). Accordingly, the fMRIROI-based discrimination between drug conditions is also lesssuccessful compared to the P300-based discrimination (Table 2).Only when entering the fMRI ROIs in a canonical discriminantanalysis, a comparable discrimination of drug conditions wasobserved (Table 2). Measurement stability of the combined ROIs asassessed with a split-half correlation (Pearson r) analysis of 2×30target trials was high (placebo: r=0.87; ketamine: r=0.83).
Correlation/co-variance analyses
For a better interpretation of electrophysiological and fMRIketamine effects, correlation/co-variance analyses were conducted.As shown in Fig. 6, ketamine effects on sLORETA P300 current densityis positively correlated with ketamine-induced psychopathology — inparticular with PANSS negative symptoms encompassing bilateral
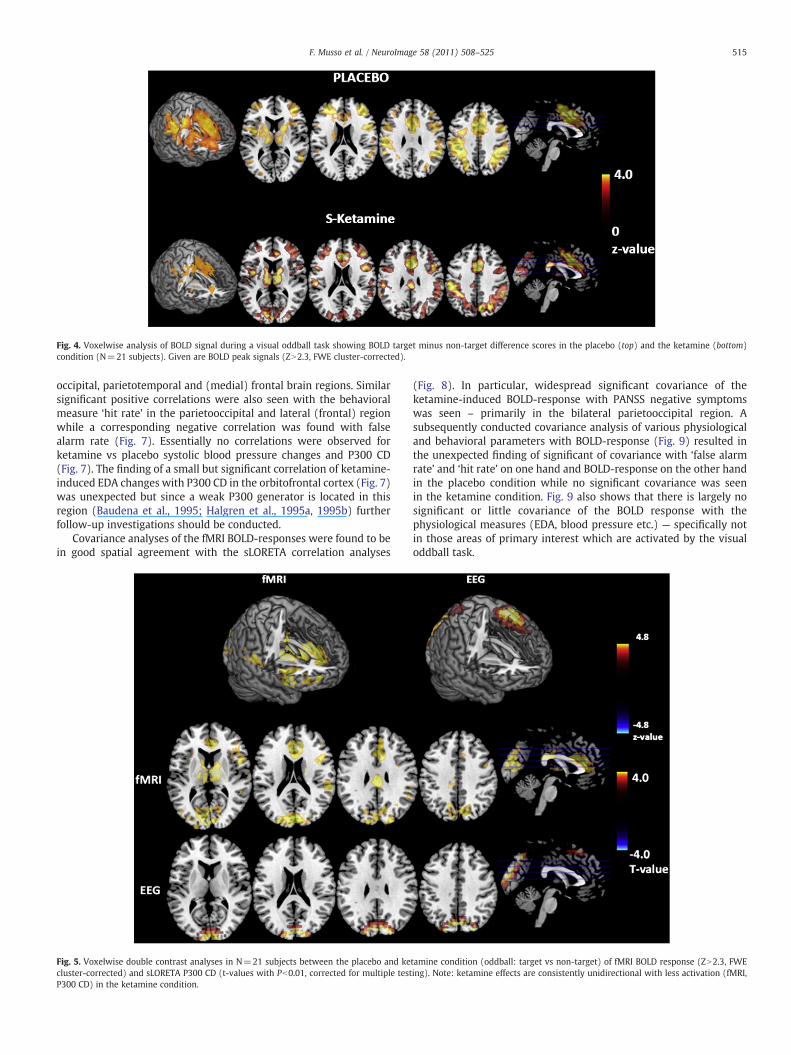
Fig. 4. Voxelwise analysis of BOLD signal during a visual oddball task showing BOLD target minus non-target difference scores in the placebo (top) and the ketamine (bottom)condition (N=21 subjects). Given are BOLD peak signals (ZN2.3, FWE cluster-corrected).
515F. Musso et al. / NeuroImage 58 (2011) 508–525
occipital, parietotemporal and (medial) frontal brain regions. Similarsignificant positive correlations were also seen with the behavioralmeasure ‘hit rate’ in the parietooccipital and lateral (frontal) regionwhile a corresponding negative correlation was found with falsealarm rate (Fig. 7). Essentially no correlations were observed forketamine vs placebo systolic blood pressure changes and P300 CD(Fig. 7). The finding of a small but significant correlation of ketamine-induced EDA changes with P300 CD in the orbitofrontal cortex (Fig. 7)was unexpected but since a weak P300 generator is located in thisregion (Baudena et al., 1995; Halgren et al., 1995a, 1995b) furtherfollow-up investigations should be conducted.
Covariance analyses of the fMRI BOLD-responses were found to bein good spatial agreement with the sLORETA correlation analyses
Fig. 5. Voxelwise double contrast analyses in N=21 subjects between the placebo and kecluster-corrected) and sLORETA P300 CD (t-values with Pb0.01, corrected for multiple testP300 CD) in the ketamine condition.
(Fig. 8). In particular, widespread significant covariance of theketamine-induced BOLD-response with PANSS negative symptomswas seen – primarily in the bilateral parietooccipital region. Asubsequently conducted covariance analysis of various physiologicaland behavioral parameters with BOLD-response (Fig. 9) resulted inthe unexpected finding of significant of covariance with ‘false alarmrate’ and ‘hit rate’ on one hand and BOLD-response on the other handin the placebo condition while no significant covariance was seenin the ketamine condition. Fig. 9 also shows that there is largely nosignificant or little covariance of the BOLD response with thephysiological measures (EDA, blood pressure etc.) — specifically notin those areas of primary interest which are activated by the visualoddball task.
tamine condition (oddball: target vs non-target) of fMRI BOLD response (ZN2.3, FWEing). Note: ketamine effects are consistently unidirectional with less activation (fMRI,
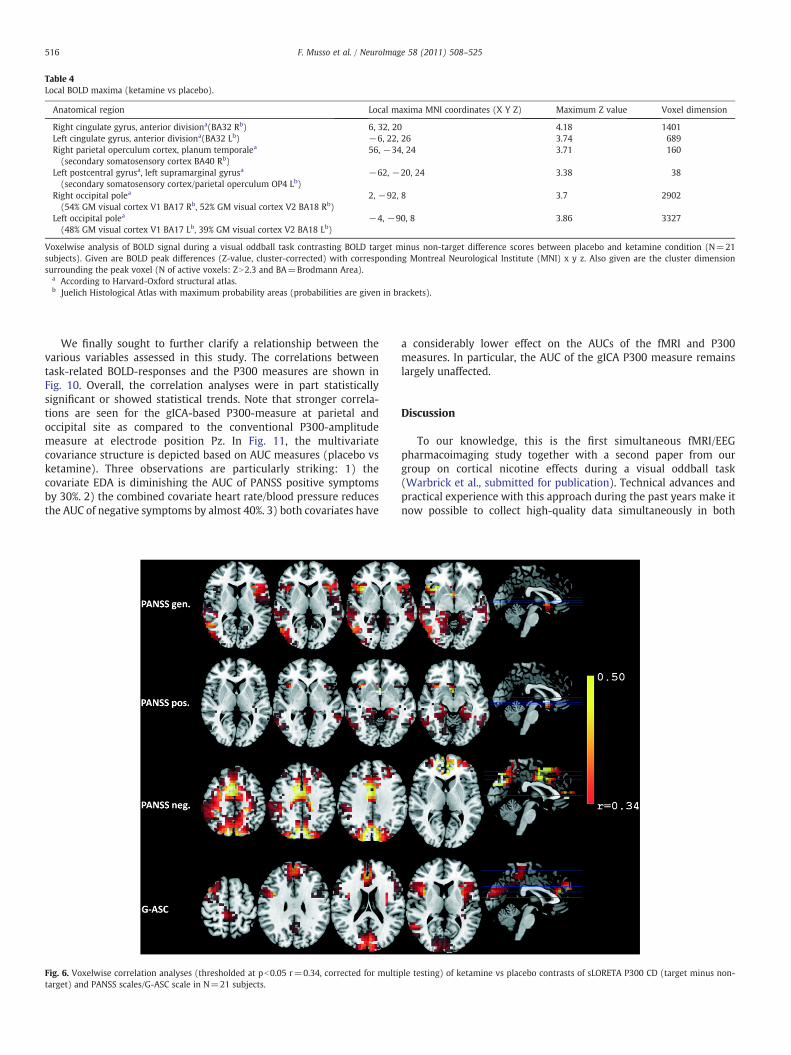
Table 4Local BOLD maxima (ketamine vs placebo).
Anatomical region Local maxima MNI coordinates (X Y Z) Maximum Z value Voxel dimension
Right cingulate gyrus, anterior divisiona(BA32 Rb) 6, 32, 20 4.18 1401Left cingulate gyrus, anterior divisiona(BA32 Lb) −6, 22, 26 3.74 689Right parietal operculum cortex, planum temporalea
(secondary somatosensory cortex BA40 Rb)56, −34, 24 3.71 160
Left postcentral gyrusa, left supramarginal gyrusa
(secondary somatosensory cortex/parietal operculum OP4 Lb)−62, −20, 24 3.38 38
Right occipital polea
(54% GM visual cortex V1 BA17 Rb, 52% GM visual cortex V2 BA18 Rb)2, −92, 8 3.7 2902
Left occipital polea
(48% GM visual cortex V1 BA17 Lb, 39% GM visual cortex V2 BA18 Lb)−4, −90, 8 3.86 3327
Voxelwise analysis of BOLD signal during a visual oddball task contrasting BOLD target minus non-target difference scores between placebo and ketamine condition (N=21subjects). Given are BOLD peak differences (Z-value, cluster-corrected) with corresponding Montreal Neurological Institute (MNI) x y z. Also given are the cluster dimensionsurrounding the peak voxel (N of active voxels: ZN2.3 and BA=Brodmann Area).
a According to Harvard-Oxford structural atlas.b Juelich Histological Atlas with maximum probability areas (probabilities are given in brackets).
516 F. Musso et al. / NeuroImage 58 (2011) 508–525
We finally sought to further clarify a relationship between thevarious variables assessed in this study. The correlations betweentask-related BOLD-responses and the P300 measures are shown inFig. 10. Overall, the correlation analyses were in part statisticallysignificant or showed statistical trends. Note that stronger correla-tions are seen for the gICA-based P300-measure at parietal andoccipital site as compared to the conventional P300-amplitudemeasure at electrode position Pz. In Fig. 11, the multivariatecovariance structure is depicted based on AUC measures (placebo vsketamine). Three observations are particularly striking: 1) thecovariate EDA is diminishing the AUC of PANSS positive symptomsby 30%. 2) the combined covariate heart rate/blood pressure reducesthe AUC of negative symptoms by almost 40%. 3) both covariates have
Fig. 6. Voxelwise correlation analyses (thresholded at pb0.05 r=0.34, corrected for multitarget) and PANSS scales/G-ASC scale in N=21 subjects.
a considerably lower effect on the AUCs of the fMRI and P300measures. In particular, the AUC of the gICA P300 measure remainslargely unaffected.
Discussion
To our knowledge, this is the first simultaneous fMRI/EEGpharmacoimaging study together with a second paper from ourgroup on cortical nicotine effects during a visual oddball task(Warbrick et al., submitted for publication). Technical advances andpractical experience with this approach during the past years make itnow possible to collect high-quality data simultaneously in both
ple testing) of ketamine vs placebo contrasts of sLORETA P300 CD (target minus non-
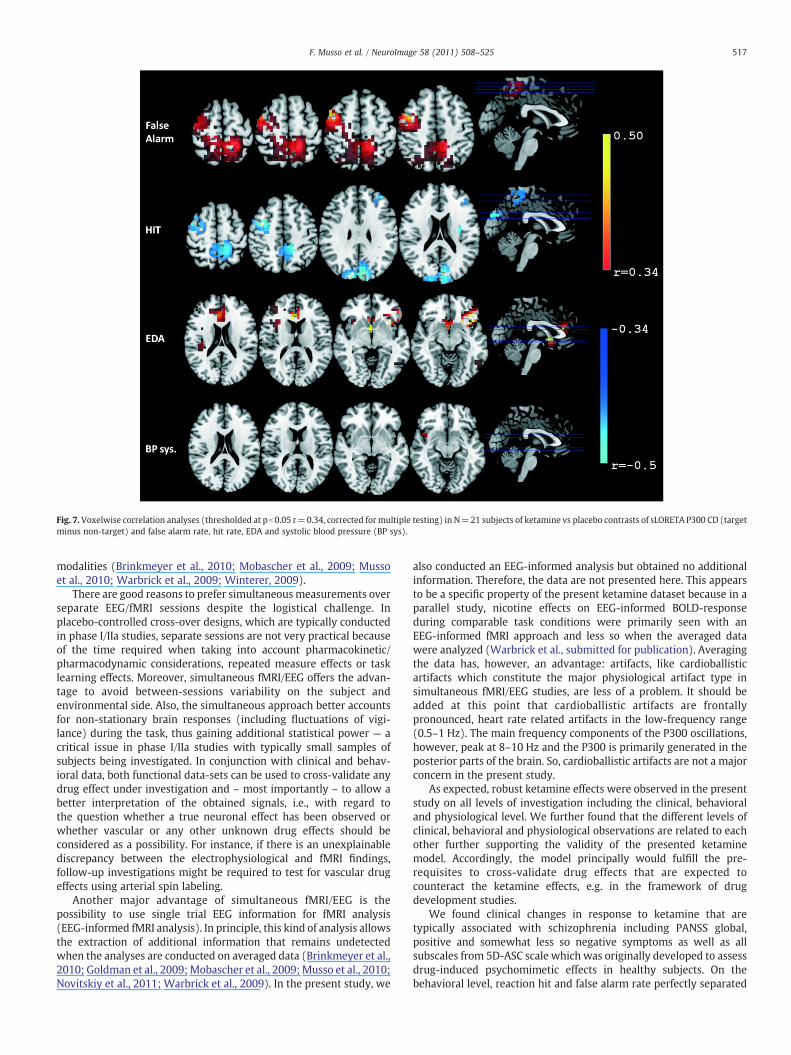
Fig. 7. Voxelwise correlation analyses (thresholded at pb0.05 r=0.34, corrected formultiple testing) in N=21 subjects of ketamine vs placebo contrasts of sLORETA P300 CD (targetminus non-target) and false alarm rate, hit rate, EDA and systolic blood pressure (BP sys).
517F. Musso et al. / NeuroImage 58 (2011) 508–525
modalities (Brinkmeyer et al., 2010; Mobascher et al., 2009; Mussoet al., 2010; Warbrick et al., 2009; Winterer, 2009).
There are good reasons to prefer simultaneousmeasurements overseparate EEG/fMRI sessions despite the logistical challenge. Inplacebo-controlled cross-over designs, which are typically conductedin phase I/IIa studies, separate sessions are not very practical becauseof the time required when taking into account pharmacokinetic/pharmacodynamic considerations, repeated measure effects or tasklearning effects. Moreover, simultaneous fMRI/EEG offers the advan-tage to avoid between-sessions variability on the subject andenvironmental side. Also, the simultaneous approach better accountsfor non-stationary brain responses (including fluctuations of vigi-lance) during the task, thus gaining additional statistical power — acritical issue in phase I/IIa studies with typically small samples ofsubjects being investigated. In conjunction with clinical and behav-ioral data, both functional data-sets can be used to cross-validate anydrug effect under investigation and – most importantly – to allow abetter interpretation of the obtained signals, i.e., with regard tothe question whether a true neuronal effect has been observed orwhether vascular or any other unknown drug effects should beconsidered as a possibility. For instance, if there is an unexplainablediscrepancy between the electrophysiological and fMRI findings,follow-up investigations might be required to test for vascular drugeffects using arterial spin labeling.
Another major advantage of simultaneous fMRI/EEG is thepossibility to use single trial EEG information for fMRI analysis(EEG-informed fMRI analysis). In principle, this kind of analysis allowsthe extraction of additional information that remains undetectedwhen the analyses are conducted on averaged data (Brinkmeyer et al.,2010; Goldman et al., 2009;Mobascher et al., 2009;Musso et al., 2010;Novitskiy et al., 2011; Warbrick et al., 2009). In the present study, we
also conducted an EEG-informed analysis but obtained no additionalinformation. Therefore, the data are not presented here. This appearsto be a specific property of the present ketamine dataset because in aparallel study, nicotine effects on EEG-informed BOLD-responseduring comparable task conditions were primarily seen with anEEG-informed fMRI approach and less so when the averaged datawere analyzed (Warbrick et al., submitted for publication). Averagingthe data has, however, an advantage: artifacts, like cardioballisticartifacts which constitute the major physiological artifact type insimultaneous fMRI/EEG studies, are less of a problem. It should beadded at this point that cardioballistic artifacts are frontallypronounced, heart rate related artifacts in the low-frequency range(0.5–1 Hz). The main frequency components of the P300 oscillations,however, peak at 8–10 Hz and the P300 is primarily generated in theposterior parts of the brain. So, cardioballistic artifacts are not a majorconcern in the present study.
As expected, robust ketamine effects were observed in the presentstudy on all levels of investigation including the clinical, behavioraland physiological level. We further found that the different levels ofclinical, behavioral and physiological observations are related to eachother further supporting the validity of the presented ketaminemodel. Accordingly, the model principally would fulfill the pre-requisites to cross-validate drug effects that are expected tocounteract the ketamine effects, e.g. in the framework of drugdevelopment studies.
We found clinical changes in response to ketamine that aretypically associated with schizophrenia including PANSS global,positive and somewhat less so negative symptoms as well as allsubscales from 5D-ASC scale which was originally developed to assessdrug-induced psychomimetic effects in healthy subjects. On thebehavioral level, reaction hit and false alarm rate perfectly separated
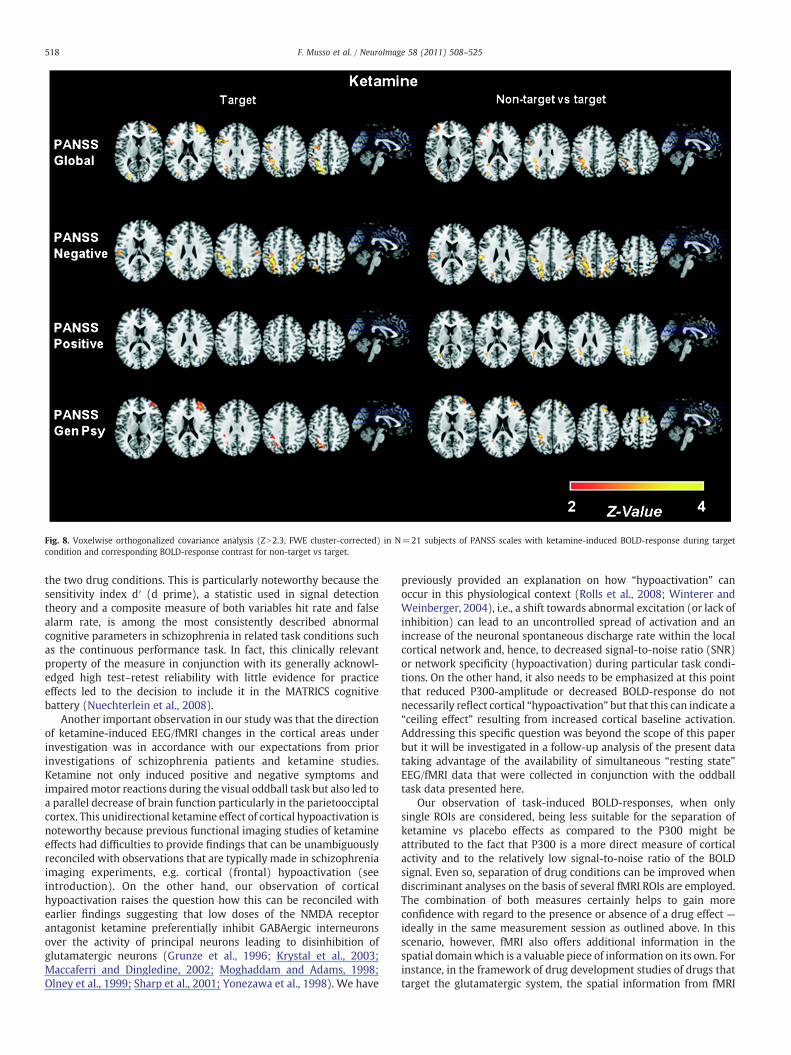
Fig. 8. Voxelwise orthogonalized covariance analysis (ZN2.3, FWE cluster-corrected) in N=21 subjects of PANSS scales with ketamine-induced BOLD-response during targetcondition and corresponding BOLD-response contrast for non-target vs target.
518 F. Musso et al. / NeuroImage 58 (2011) 508–525
the two drug conditions. This is particularly noteworthy because thesensitivity index d′ (d prime), a statistic used in signal detectiontheory and a composite measure of both variables hit rate and falsealarm rate, is among the most consistently described abnormalcognitive parameters in schizophrenia in related task conditions suchas the continuous performance task. In fact, this clinically relevantproperty of the measure in conjunction with its generally acknowl-edged high test–retest reliability with little evidence for practiceeffects led to the decision to include it in the MATRICS cognitivebattery (Nuechterlein et al., 2008).
Another important observation in our study was that the directionof ketamine-induced EEG/fMRI changes in the cortical areas underinvestigation was in accordance with our expectations from priorinvestigations of schizophrenia patients and ketamine studies.Ketamine not only induced positive and negative symptoms andimpairedmotor reactions during the visual oddball task but also led toa parallel decrease of brain function particularly in the parietoocciptalcortex. This unidirectional ketamine effect of cortical hypoactivation isnoteworthy because previous functional imaging studies of ketamineeffects had difficulties to provide findings that can be unambiguouslyreconciled with observations that are typically made in schizophreniaimaging experiments, e.g. cortical (frontal) hypoactivation (seeintroduction). On the other hand, our observation of corticalhypoactivation raises the question how this can be reconciled withearlier findings suggesting that low doses of the NMDA receptorantagonist ketamine preferentially inhibit GABAergic interneuronsover the activity of principal neurons leading to disinhibition ofglutamatergic neurons (Grunze et al., 1996; Krystal et al., 2003;Maccaferri and Dingledine, 2002; Moghaddam and Adams, 1998;Olney et al., 1999; Sharp et al., 2001; Yonezawa et al., 1998). We have
previously provided an explanation on how “hypoactivation” canoccur in this physiological context (Rolls et al., 2008; Winterer andWeinberger, 2004), i.e., a shift towards abnormal excitation (or lack ofinhibition) can lead to an uncontrolled spread of activation and anincrease of the neuronal spontaneous discharge rate within the localcortical network and, hence, to decreased signal-to-noise ratio (SNR)or network specificity (hypoactivation) during particular task condi-tions. On the other hand, it also needs to be emphasized at this pointthat reduced P300-amplitude or decreased BOLD-response do notnecessarily reflect cortical “hypoactivation” but that this can indicate a“ceiling effect” resulting from increased cortical baseline activation.Addressing this specific question was beyond the scope of this paperbut it will be investigated in a follow-up analysis of the present datataking advantage of the availability of simultaneous “resting state”EEG/fMRI data that were collected in conjunction with the oddballtask data presented here.
Our observation of task-induced BOLD-responses, when onlysingle ROIs are considered, being less suitable for the separation ofketamine vs placebo effects as compared to the P300 might beattributed to the fact that P300 is a more direct measure of corticalactivity and to the relatively low signal-to-noise ratio of the BOLDsignal. Even so, separation of drug conditions can be improved whendiscriminant analyses on the basis of several fMRI ROIs are employed.The combination of both measures certainly helps to gain moreconfidence with regard to the presence or absence of a drug effect —ideally in the same measurement session as outlined above. In thisscenario, however, fMRI also offers additional information in thespatial domainwhich is a valuable piece of information on its own. Forinstance, in the framework of drug development studies of drugs thattarget the glutamatergic system, the spatial information from fMRI
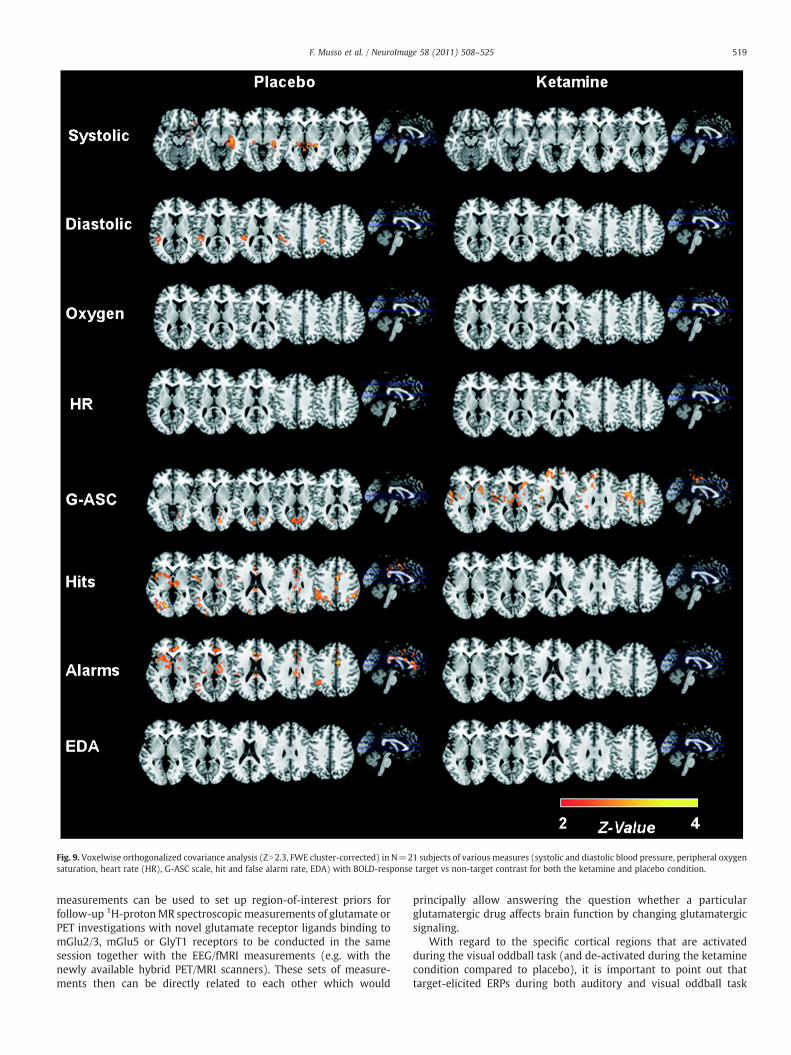
Fig. 9. Voxelwise orthogonalized covariance analysis (ZN2.3, FWE cluster-corrected) in N=21 subjects of various measures (systolic and diastolic blood pressure, peripheral oxygensaturation, heart rate (HR), G-ASC scale, hit and false alarm rate, EDA) with BOLD-response target vs non-target contrast for both the ketamine and placebo condition.
519F. Musso et al. / NeuroImage 58 (2011) 508–525
measurements can be used to set up region-of-interest priors forfollow-up 1H-protonMR spectroscopic measurements of glutamate orPET investigations with novel glutamate receptor ligands binding tomGlu2/3, mGlu5 or GlyT1 receptors to be conducted in the samesession together with the EEG/fMRI measurements (e.g. with thenewly available hybrid PET/MRI scanners). These sets of measure-ments then can be directly related to each other which would
principally allow answering the question whether a particularglutamatergic drug affects brain function by changing glutamatergicsignaling.
With regard to the specific cortical regions that are activatedduring the visual oddball task (and de-activated during the ketaminecondition compared to placebo), it is important to point out thattarget-elicited ERPs during both auditory and visual oddball task
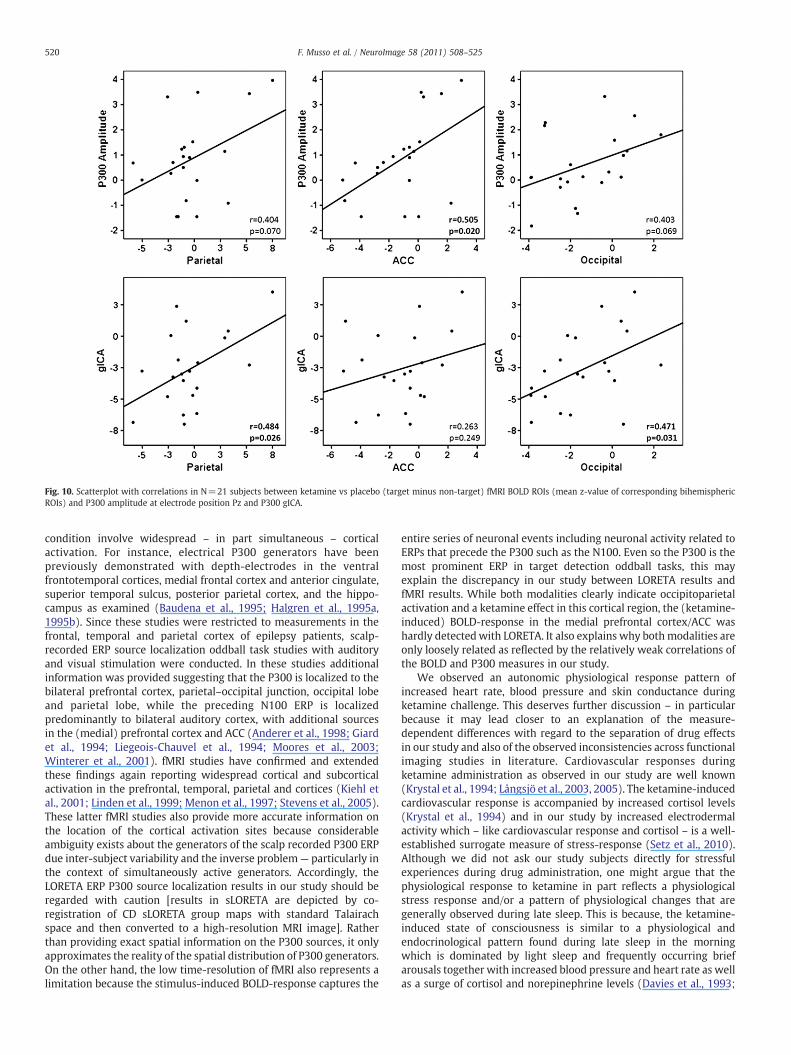
Fig. 10. Scatterplot with correlations in N=21 subjects between ketamine vs placebo (target minus non-target) fMRI BOLD ROIs (mean z-value of corresponding bihemisphericROIs) and P300 amplitude at electrode position Pz and P300 gICA.
520 F. Musso et al. / NeuroImage 58 (2011) 508–525
condition involve widespread – in part simultaneous – corticalactivation. For instance, electrical P300 generators have beenpreviously demonstrated with depth-electrodes in the ventralfrontotemporal cortices, medial frontal cortex and anterior cingulate,superior temporal sulcus, posterior parietal cortex, and the hippo-campus as examined (Baudena et al., 1995; Halgren et al., 1995a,1995b). Since these studies were restricted to measurements in thefrontal, temporal and parietal cortex of epilepsy patients, scalp-recorded ERP source localization oddball task studies with auditoryand visual stimulation were conducted. In these studies additionalinformation was provided suggesting that the P300 is localized to thebilateral prefrontal cortex, parietal–occipital junction, occipital lobeand parietal lobe, while the preceding N100 ERP is localizedpredominantly to bilateral auditory cortex, with additional sourcesin the (medial) prefrontal cortex and ACC (Anderer et al., 1998; Giardet al., 1994; Liegeois-Chauvel et al., 1994; Moores et al., 2003;Winterer et al., 2001). fMRI studies have confirmed and extendedthese findings again reporting widespread cortical and subcorticalactivation in the prefrontal, temporal, parietal and cortices (Kiehl etal., 2001; Linden et al., 1999; Menon et al., 1997; Stevens et al., 2005).These latter fMRI studies also provide more accurate information onthe location of the cortical activation sites because considerableambiguity exists about the generators of the scalp recorded P300 ERPdue inter-subject variability and the inverse problem— particularly inthe context of simultaneously active generators. Accordingly, theLORETA ERP P300 source localization results in our study should beregarded with caution [results in sLORETA are depicted by co-registration of CD sLORETA group maps with standard Talairachspace and then converted to a high-resolution MRI image]. Ratherthan providing exact spatial information on the P300 sources, it onlyapproximates the reality of the spatial distribution of P300 generators.On the other hand, the low time-resolution of fMRI also represents alimitation because the stimulus-induced BOLD-response captures the
entire series of neuronal events including neuronal activity related toERPs that precede the P300 such as the N100. Even so the P300 is themost prominent ERP in target detection oddball tasks, this mayexplain the discrepancy in our study between LORETA results andfMRI results. While both modalities clearly indicate occipitoparietalactivation and a ketamine effect in this cortical region, the (ketamine-induced) BOLD-response in the medial prefrontal cortex/ACC washardly detectedwith LORETA. It also explains why bothmodalities areonly loosely related as reflected by the relatively weak correlations ofthe BOLD and P300 measures in our study.
We observed an autonomic physiological response pattern ofincreased heart rate, blood pressure and skin conductance duringketamine challenge. This deserves further discussion – in particularbecause it may lead closer to an explanation of the measure-dependent differences with regard to the separation of drug effectsin our study and also of the observed inconsistencies across functionalimaging studies in literature. Cardiovascular responses duringketamine administration as observed in our study are well known(Krystal et al., 1994; Långsjö et al., 2003, 2005). The ketamine-inducedcardiovascular response is accompanied by increased cortisol levels(Krystal et al., 1994) and in our study by increased electrodermalactivity which – like cardiovascular response and cortisol – is a well-established surrogate measure of stress-response (Setz et al., 2010).Although we did not ask our study subjects directly for stressfulexperiences during drug administration, one might argue that thephysiological response to ketamine in part reflects a physiologicalstress response and/or a pattern of physiological changes that aregenerally observed during late sleep. This is because, the ketamine-induced state of consciousness is similar to a physiological andendocrinological pattern found during late sleep in the morningwhich is dominated by light sleep and frequently occurring briefarousals together with increased blood pressure and heart rate as wellas a surge of cortisol and norepinephrine levels (Davies et al., 1993;
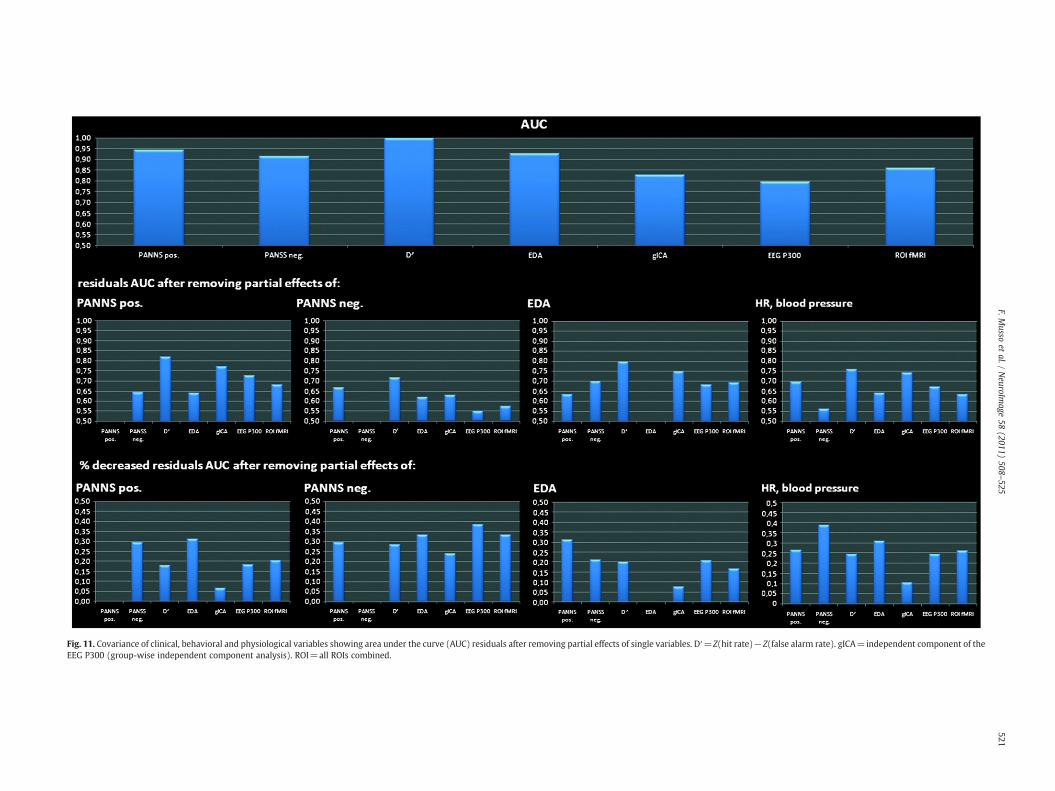
Fig. 11. Covariance of clinical, behavioral and physiological variables showing area under the curve (AUC) residuals after removing partial effects of single variables. D′=Z(hit rate)−Z(false alarm rate). gICA=independent component of theEEG P300 (group-wise independent component analysis). ROI=all ROIs combined.
521F.M
ussoet
al./NeuroIm
age58
(2011)508
–525
522 F. Musso et al. / NeuroImage 58 (2011) 508–525
Holsboer et al., 1988; Redwine et al., 2000). The notion thatsubanesthetic ketamine induces light sleep is consistent with PETstudies during light sleep (Kjaer et al., 2002) as well as resting EEGstudies during ketamine challenge (Ehrlichman et al., 2009; Honget al., 2010; Lazarewicz et al., 2010; Maksimow et al., 2007) andduring the transition between wake and sleep (Anderer et al., 2005;Malinowska et al., 2009; Roth, 1961). Both during light sleep (stage-I)and during subanesthetic ketamine administration, an increase ofcerebral blood flow and high-frequency EEG-oscillations is seenwhich can be easily confused with a physiological systems levelcondition of increased arousal during wake state. Together, thissuggests that ketamine induces a physiological state that resembles apattern of “stress-like” autonomic changes during light sleep which isaccompanied by and increased global cerebral blood flow. Even if onedoes not follow the notion that ketamine is at least to some extent astressor, it is obvious from our findings of considerable partialeffects of EDA and heart rate/blood pressure on positive and negativesymptoms that any pharmacological ketamine model (e.g. ofschizophrenia pathophysiology) should account for potential (auto-nomic) confounders that are not necessarily related to the coresymptoms of schizophrenia — even so stress, electrodermal activityand psychosis are not entirely independent in schizophrenia(Nuechterlein and Dawson, 1984). Thus, any functional biomarker(e.g. electrophysiological, neuroimaging) when used as surrogatemeasure in clinical trials should be monitored and tested for this kindof autonomic partial effects. This would help to assess whether aparticular study compound thought to reverse the ketamine effectsprimarily affects autonomic system response or clinical symptomsand/or brain function measures that are thought to be associatedmore closely with schizophrenia pathophysiology. Therefore, it alsowould be interesting to know whether the observed ketamine-induced autonomic system response accounts for the consistentlyobserved increased blood flow and metabolic rate in resting state PETinvestigations (Breier et al., 1997; Holcomb et al., 2001; Lahti et al.,1995; Vollenweider et al., 1997). By extension, similar considerationsapply to those fMRI-based imaging studies that observed increasedBOLD-responses (Daumann et al., 2010; Fu et al., 2005; Honey et al.,2004, 2005; Northoff et al., 2005; Stone et al., 2010) — in particularunder conditions when relatively challenging and stressful cognitivetasks have been used which might interact with the autonomicresponse. In any case, whereas in our study the autonomic responsepattern of increased EDA and increased heart rate/blood pressureexplained some considerable amount of variance of the clinical andbehavioral variables, hardly any variance of the functional brainmeasures was explained — most notably not of the P300 measurebased on independent component analysis. This suggests that ourbrain function measures are relatively robust with regard toautonomic partial effects of ketamine. On the other hand, while theelectrophysiological and fMRI findings were essentially unrelated tothese ketamine-induced autonomic changes, both the elctrophysio-logical and fMRI measures were clearly related to psychopathologicaland behavioral changes. So, ketamine does different things— howeverin the context of drug trials not every ketamine-induced change (andits reversal by a novel compound) is of interest. In this scenario, it ishelpful to have a set of variables (clinical, imaging, electrophysiology)that unequivocally cross-validate a drug induced change (and itsreversal) in the expected direction which is relevant (e.g. with regardto negative symptoms) and not just an epiphenomenon (e.g. withregard to stress-response).
There are several limitations of this study. First of all, the clinicaleffects of ketamine are so obvious that the double-blind conditionwas not met. Even so, the statistical analyses were conducted blindly.We also did not establish test–retest reliability of our ketamineparadigm before conducting the study. One important reason not todo this was that most subjects don't like the ketamine experienceand it would have been difficult to convince study participants to
have this experience twice. On the other hand, the relatively highAUC values across measurement parameters and the convergence offindings provide strong evidence that the paradigm is valid. Fortechnical reasons, we have preferred to use a visual instead of anauditory oddball task. Most P300 studies in schizophrenia, however,used auditory stimulation. On other hand, parietal P300-amplitudereduction in schizophrenia has also been described with visualstimulation (e.g. Lee et al., 2010; Mathalon et al., 2010). Similarly,one might argue that the interstimulus interval (ISI) typically used inelectrophysiological studies greatly differs from the one used in thepresent fMRI study. The ISI employed in this fMRI study is a technicalrequirement, i.e., considerably shorter ISIs do not allow the analysisof the BOLD signal due to ceiling effects. Most importantly, however,Mathalon and Ford (2002) previously showed that compared to ashorter ISI of 1.5 s. an ISI of comparable length as in the present studyhad no impact on target P300-amplitude in schizophrenia and onlyslightly decreased P300-amplitude in controls. A further limitation ofthe present study is MR-scanner induced ballistocardiogram artifactsin the EEG signal which particularly affect low-frequency compo-nents such as the P300. This type of artifact still represents achallenge for currently available filter techniques. However, im-proved novel filters will soon be available (personal communication,Brain Products).
In summary, we present a novel ketamine model of schizophreniabased on simultaneous fMRI/EEG during a visual oddball task. The dataobtained with this model fulfill the prerequisites for drug developmentstudies of new compounds that target the glutamatergic system.
Disclosure
GW has received sponsorship to attend scientific meetings,speaker honoraria and consultancy fees from pharmaceutical compa-nies engaged in drug development of cognitive enhancers (JanssenPharmaceutica, Johnson & Johnson Pharmaceutical Research &Development; Pfizer Inc.). He is also contractor and consultant ofthe independent contract research organization (CRO) FOCUS DrugDevelopment GmbH. WG, DE, MKL and GT are employees of FOCUSDrug Development GmbH which is contractor of Janssen Pharmaceu-tica, Johnson & Johnson Pharmaceutical Research & Development.However, these engagements do not constitute a conflict of interestwith the present work which has been conducted for the purpose toexplore the utility of simultaneous EEG/fMRI as functional biomarkersin a ketamine model. The other authors declare not to have anypotential conflicts of interest.
Supplementarymaterials related to this article can be found onlineat doi:10.1016/j.neuroimage.2011.06.045.
Acknowledgments
This investigator-initiated study (Phase-0 Clinical Trial) wasfunded/sponsored by Janssen Pharmaceutica, Johnson & JohnsonPharmaceutical Research & Development (Beerse, Belgium). Wethank A Svojanovsky, Brain Products GmbH, Gilching, Germany fortechnical support/equipment with simultaneous fMRI/EEG acquisi-tion, RD Pascual-Marqui from the Key Institute (Zurich, Switzerland)for his support with novel features of the LORETA software packageand A Dittrich (Psychologisches Institut für Beratung und Forschungin Zurich, Switzerland) for providing us with the 5D-ASC Rating Scale.
References
Allen, P., Poliz, G., Krakow, K., Fish, D.R., Lemieux, L., 1998. Identification of EEG Eventsin the MR scanner: the problem of pulse artifact and a method for its subtraction.NeuroImage 8, 229–239.
Allen, P., Josephs, O., Turner, R., 2000. A method for removing imaging artifact fromcontinuous EEG recorded during functional MRI. NeuroImage 1, 230–239.
523F. Musso et al. / NeuroImage 58 (2011) 508–525
Anderer, P., Pascual-Marqui, R.D., Semlitsch, H.V., Saletu, B., 1998. Differentialeffects of normal aging on sources of standard N1, target N1 and target P300auditory event-related brain potentials revealed by low resolution electro-magnetic tomography (LORETA). Electroencephalogr. Clin. Neurophysiol. 108,160–174.
Anderer, P., Gruber, G., Parapatics, S., Woertz, M., Miazhynskaia, T., Klosch, G., Saletu, B.,Zeitlhofer, J., Barbanoj, M.J., Danker-Hopfe, H., Himanen, S.L., Kemp, B., Penzel, T.,Grozinger, M., Kunz, D., Rappelsberger, P., Schlogl, A., Dorffner, G., 2005. An E-health solution for automatic sleep classification according to Rechtschaffen andKales: validation study of the Somnolyzer 24×7 utilizing the Siesta database.Neuropsychobiology 51, 115–133.
Baudena, P., Halgren, E., Heit, G., Clarke, J.M., 1995. Intracerebral potentials to raretarget and distractor auditory and visual stimuli. III. Frontal cortex. Electroence-phalogr. Clin. Neurophysiol. 94, 251–264.
Behrens, T., Woolrich, M.W., Smith, S., 2003. Multi-Testing Using a Fully Subject NullHypothesis Bayesian Framework: Theory. Human Brain Mapping Meeting, NewYork City.
Borsook, D., Becerra, L., Hargreaves, R., 2006. A role for fMRI in optimizing CNS drugdevelopment. Nat. Rev. Drug Discovery 5, 411–424.
Breier, A., Malhotra, A.K., Pinals, D.A., Weisenfeld, N.I., Pickar, D., 1997. Association ofketamine-induced psychosis with focal activation of the prefrontal cortex inhealthy volunteers. Am. J. Psychiatry 154, 805–811.
Brinkmeyer, J., Mobascher, A., Warbrick, T., Musso, F., Wittsack, H.J., Saleh, A.,Schnitzler, A., Winterer, G., 2010. Dynamic EEG-informed fMRI modeling of thepain matrix using 20-ms root mean square segments. Hum. Brain Mapp. 31,1702–1712.
Callicott, J.H., Bertolino, A., Mattay, V.S., Langheim, F.J., Duyn, J., Coppola, R., Goldberg, T.E.,Weinberger, D.R., 2000. Physiological dysfunction of the dorsolateral prefrontalcortex in schizophrenia revisited. Cereb. Cortex 10, 1078–1092.
Callicott, J.H., Mattay, V.S., Verchinski, B.A., Marenco, S., Egan, M.F., Weinberger, D.R.,2003. Complexity of prefrontal cortical dysfunction in schizophrenia: more than upor down. Am. J. Psychiatry 160, 2209–2215.
Cho, R.Y., Ford, J.M., Krystal, J.H., Laruelle, M., Cuthbert, B., Carter, C.S., 2005. Functionalneuroimaging and electrophysiology biomarkers for clinical trials for cognition inschizophrenia. Schizophr. Bull. 31, 865–869.
Daumann, J., Wagner, D., Heekeren, K., Neukirch, A., Thiel, C., Gouzoulis-Mayfrank, E.,2010. Neuronal correlates of visual and auditory alertness in the DMT and ketaminemodel of psychosis. J. Psychopharmacol. 24, 1515–1524.
Davies, R.J.O., Belt, P.J., Roberts, S.J., Ali, N.J., Stradling, J.R., 1993. Arterial blood pressureresponses to graded transient arousal from sleep in normal humans. J. Appl.Physiol. 74, 1123–1130.
Deakin, J.F., Lees, J., McKie, S., Hallak, J.E., Williams, S.R., Dursun, S.M., 2008. Glutamateand the neural basis of the subjective effects of ketamine: a pharmaco-magneticresonance imaging study. Arch. Gen. Psychiatry 65, 154–164.
DiMasi, J.A., Hansen, R.W., Grabowski, H.G., 2003. The price of innovation: newestimates of drug development costs. J. Health Econ. 22, 151–185.
Dittrich, A., 1998. The standardized psychometric assessment of altered states ofconsciousness (ASCs) in humans. Pharmacopsychiatry 31, 80–84.
Dittrich, A., von Arx, S., Staub, S., 1985. International study on altered states ofconsciousness (ISASC). Summary of the results. Germ. J. Psych. 9, 319–339.
Ehrlichman, R.S., Gandal, M.J., Maxwell, C.R., Lazarewicz, M.T., Finkel, L.H., Contreras, D.,Turetsky, B.I., Siegel, S.J., 2009. N-methyl-d-aspartic acid receptor antagonist-induced frequency oscillations in mice recreate pattern of electrophysiologicaldeficits in schizophrenia. Neuroscience 158, 705–712.
Feng, N., Vollenweider, F.X., Minder, E.L., Rentsch, K., Grampp, T., Vonderschmitt, D.J.,1995. Development of gas chromatography-mass spectroscopy method fordetermination of ketamine in plasma and its application to human samples. Ther.Drug Monit. 17, 95–100.
First, M.B., Spitzer, R.L., Gibbon, M., Williams, J.B., 1995. Structured Clinical Interview forDSM-IV Axis I Disorders — Patient Edition (SCID - I/P, Version 2.0). BiometricsResearch Department, New York State Psychiatric Institute, New York.
Forman, S.D., Cohen, J.D., Fitzgerald, M., Eddy, W.F., Mintun, M.A., Noll, D.C., 1995.Improved assessment of significant activation in functional magnetic reso-nance imaging (fMRI): use of a cluster-size threshold. Magn. Reson. Med. 33,636–647.
Fowles, D.C., Christie, M.J., Edelberg, R., Grings, W.W., Lykken, D.T., Venables, P.H., 1981.Committee report. Publication recommendations for electrodermal measurements.Psychophysiology 18, 232–239.
Friston, K.J., Worsley, K.J., Frackowiak, R.S.J., Mazziotta, J.C., Evans, A.C., 1994. Assessingthe significance of focal activations using their spatial extent. Hum. Brain Mapp. 1,214–220.
Fu, C.H., Suckling, J., Williams, S.C., Andrew, C.M., Vythelingum, G.N., McGuire, P.K.,2005. Effects of psychotic state and task demand on prefrontal function inschizophrenia: an fMRI study of overt verbal fluency. Am. J. Psychiatry 162,485–494.
Giard, M.H., Perrin, F., Echallier, J.F., Thevenet, M., Froment, J.C., Pernier, J., 1994.Dissociation of temporal and frontal components in the human auditory N1wave: ascalp current density and dipole model analysis. Electroencephalogr. Clin.Neurophysiol. 92, 238–252.
Goldman, R.I., Wei, C.Y., Philiastides, M.G., Gerson, A.D., Friedman, D., Brown, T.R., Sajda,P., 2009. Single-trial discrimination for integrating simultaneous EEG and fMRI:identifying cortical areas contributing to trial-to-trial variability in the auditoryoddball task. NeuroImage 47, 136–147.
Grunze, H.C., Rainnie, D.G., Hasselmo, M.E., Barkai, E., Hearn, E.F., McCarley, R.W.,Greene, R.W., 1996. NMDA dependent modulation of CA1 local circuit inhibition.J. Neurosci. 16, 2034–2043.
Gur, R.E., Turetsky, B.I., Loughead, J., Snyder, W., Kohler, C., Elliott, M., Pratiwadi, R.,Ragland, J.D., Bilker, W.B., Siegel, S.J., Kanes, S.J., Arnold, S.E., Gur, R.C., 2007. Visualattention circuitry in schizophrenia investigated with oddball event-relatedfunctional magnetic resonance imaging. Am. J. Psychiatry 164, 442–449.
Halgren, E., Baudena, P., Clarke, J.M., Heit, G., Liégeois, C., Chauvel, P., Musolino, A.,1995a. Intracerebral potentials to rare target and distractor auditory and visualstimuli. I. Superior temporal plane and parietal lobe. Electroencephalogr. Clin.Neurophysiol. 94, 191–220.
Halgren, E., Baudena, P., Clarke, J.M., Heit, G., Marinkovic, K., Devaux, B., Vignal, J.-P.,Biraben, A., 1995b. Intracerebral potentials to rare target and distractor auditoryand visual stimuli. II. Medial, lateral and posterior temporal lobe. Electroencepha-logr. Clin. Neurophysiol. 94, 229–250.
Hill, K., Mann, L., Laws, K.R., Stephenson, C.M., Nimmo-Smith, I., McKenna, P.J., 2004.Hypofrontality in schizophrenia: a meta-analysis of functional imaging studies.Acta Psychiatr. Scand. 110, 243–256.
Holcomb, H.H., Lahti, A.C., Medoff, D.R., Weiler, M., Tamminga, C.A., 2001.Sequential regional cerebral blood flow brain scans using PET with H2(15) Odemonstrate ketamine actions in CNS dynamically. Neuropsychopharmacology25, 165–172.
Holmes, A.P., Blair, R.C., Watson, J.D., Ford, I., 1996. Nonparametric analysis ofstatistical images from functional mapping experiments. J. Cereb. Blood FlowMetab. 16, 7–12.
Holsboer, F., von Bardeleben, U., Steiger, A., 1988. Effects of intravenous corticotropin-releasing hormone upon sleep-related growth hormone surge and EEG sleep inman. Neuroendocrinology 48, 32–38.
Honey, R.A.E., Honey, G.D., O'Loughlin, C., Sharar, S.R., Kumaran, D., Bullmore, E.T.,Menon, D.K., Donovan, T., Lupson, V.C., Bisbrown-Chippendale, R., Fletcher, P.C.,2004. Acute ketamine administration alters the brain responses to executivedemands in a verbal working memory task: an fMRI study. Neuropsychopharma-cology 29, 1203–1214.
Honey, G.D., Honey, R.A.E., O'Loughlin, C., Sharar, S.R., Kumaran, D., Suckling, J., Menon,D.K., Sleator, C., Bullmore, E.T., Fletcher, P.C., 2005. Ketamine disrupts frontal andhippocampal contribution to encoding and retrieval of episodic memory: an fMRIstudy. Cereb. Cortex 15, 749–759.
Hong, L.E., Summerfelt, A., Buchanan, R.W., O'Donnell, P., Thaker, G.K., Weiler, M.A.,Lahti, A.C., 2010. Gamma and delta neural oscillations and association with clinicalsymptoms under subanesthetic ketamine. Neuropsychopharmacology 35,632–640.
Javitt, D.C., 2008. Phenomenology, aetiology and treatment of schizophrenia. NovartisFound Symp. 289, 4–16.
Javitt, D.C., Spencer, K.M., Thaker, G.K., Winterer, G., Hajós, M., 2008. Neurophysiolog-ical biomarkers for drug development in schizophrenia. Nat. Rev. Drug Discov. 7,68–83.
Jenkinson, M., Bannister, P., Brady, J., Smith, S., 2002. Improved optimization for therobust and accurate linear registration and motion correction of brain images.NeuroImage 17, 825–841.
Kay, S.R., Fiszbein, A., Opler, L.A., 1987. The positive and negative syndrome scale(PANSS) for schizophrenia. Schizophr. Bull. 13, 261–276.
Kiehl, K.A., Liddle, P.F., 2001. An event-related functional magnetic resonanceimaging study of an auditory oddball task in schizophrenia. Schizophr. Res. 48,159–171.
Kiehl, K.A., Laurens, K.R., Duty, T.L., Forster, B.B., Liddle, P.F., 2001. An event-related fMRIstudy of visual and auditory oddball tasks. J. Psychophysiol. 21, 221–240.
Kiehl, K.A., Stevens, M.C., Celone, K., Kurtz, M., Krystal, J.H., 2005. Abnormalhemodynamics in schizophrenia during an auditory oddball task. Biol. Psychiatry57, 1029–1040.
Kjaer, T.W., Law, I., Wiltschiøtz, G., Paulson, O.B., Madsen, P.L., 2002. Regional cerebralblood flow during light sleep–a H(2)(15)O-PET study. J. Sleep Res. 11, 201–207.
Kovacevic, N., McIntosh, A.R., 2007. Groupwise independent component decompositionof EEG data and partial least square analysis. NeuroImage 35, 1103–1112.
Krystal, J.H., Karper, L.P., Seibyl, J.P., Freeman, G.K., Delaney, R., Bremner, J.D., Heninger,G.R., Bowers Jr., M.B., Charney, D.S., 1994. Subanesthetic effects of the noncompe-titive NMDA receptor antagonist, ketamine, in humans: psychotomimetic,perceptual, cognitive, and neuroendocrine responses. Arch. Gen. Psychiatry 51,199–214.
Krystal, J.H., D'Souza, D.C., Mathalon, D., Perry, E., Belger, A., Hoffman, R.E., 2003. NMDAreceptor antagonist effects, cortical glutamatergic function, and schizophrenia:toward a paradigm shift in medication development. Psychopharmacology 169,215–233.
Krystal, J.H., Abi-Saab, W., Perry, E., D'Souza, D.C., Liu, N., Gueorguieva, R., McDougall, L.,Hunsberger, T., Belger, A., Levine, L., Breier, A., 2005. Preliminary evidence ofattenuation of the disruptive effects of the NMDA glutamate receptor antagonist,ketamine, on working memory by pretreatment with the group II metabotropicglutamate receptor agonist, LY354740, in healthy human subjects. Psychopharma-cology 179, 303–309.
Lahti, A.C., Holcomb, H.H., Medoff, D.R., Tamminga, C.A., 1995. Ketamine activatespsychosis and alters limbic blood flow in schizophrenia. Neuroreport 6,869–872.
Långsjö, J.W., Kaisti, K.K., Aalto, S., Hinkka, S., Aantaa, R., Oikonen, V., Sipilä, H., Kurki, T.,Silvanto, M., Scheinin, H., 2003. Effects of subanesthetic doses of ketamine onregional cerebral blood flow, oxygen consumption, and blood volume in humans.Anesthesiology 99, 614–623.
Långsjö, J.W., Maksimow, A., Salmi, E., Kaisti, K., Aalto, S., Oikonen, V., Hinkka, S., Aantaa,R., Sipilä, H., Viljanen, T., Parkkola, R., Scheinin, H., 2005. S-ketamine anesthesiaincreases cerebral blood flow in excess of the metabolic needs in humans.Anesthesiology 103, 258–268.
524 F. Musso et al. / NeuroImage 58 (2011) 508–525
Laurens, K.R., Kiehl, K.A., Ngan, E.T., Liddle, P.F., 2005. Attention orienting dysfunctionduring salient novel stimulus processing in schizophrenia. Schizophr. Res. 75,159–171.
Lazarewicz, M.T., Ehrlichman, R.S., Maxwell, C.R., Gandal, M.J., Finkel, L.H., Siegel, S.J.,2010. Ketamine modulates theta and gamma oscillations. J. Cogn. Neurosci. 22,1452–1464.
Lee, S.Y., Namkoong, K., Cho, H.H., Song, D.H., An, S.K., 2010. Reduced visual P300amplitudes in individuals at ultra-high risk for psychosis and first-episodeschizophrenia. Neurosci. Lett. 486, 156–160.
Liegeois-Chauvel, C., Musolino, A., Badier, J.M., Marquis, P., Chauvel, P., 1994. Evokedpotentials recorded from the auditory cortex in man: evaluation and topography of themiddle latency components. Electroencephalogr. Clin. Neurophysiol. 92, 204–214.
Linden, D.E., Prvulovic, D., Formisano, E., Voellinger, M., Zanella, F.E., Goebel, R., Dierks,T., 1999. The functional neuroanatomy of target detection: an fMRI study of visualand auditory oddball tasks. Cereb. Cortex 9, 815–823.
Littman, B.H., Williams, S.H., 2005. The ultimate model organism: progress inexperimental medicine. Nat. Rev. Drug Discov. 4, 631–638.
Maccaferri, G., Dingledine, R., 2002. Control of feedforward dendritic inhibition byNMDA receptor-dependent spike timing in hippocampal interneurons. J. Neurosci.22, 5462–5472.
Maksimow, A., Särkelä, M., Långsjö, J.W., Salmi, E., Kaisti, K.K., Yli-Hankala, A., Hinkka-Yli-Salomäki, S., Scheinin, H., Jääskeläinen, S.K., 2007. Increase in high frequencyEEG activity explains the poor performance of EEG spectral entropy monitor duringS-ketamine anesthesia. Clin. Neurophysiol. 117, 1660–1668.
Malinowska, U., Klekowicz, H., Wakarow, A., Niemcewicz, S., Durka, P.J., 2009. Fullyparametric sleep staging compatible with the classical criteria. Neuroinformatics 7,245–253.
Manoach, D.S., Press, D.Z., Thangaraj, V., Searl, M.M., Goff, D.C., Halpern, E., Saper, C.B.,Warach, S., 1999. Schizophrenic subjects activate dorsolateral prefrontal cortexduring a working memory task, as measured by fMRI. Biol. Psychiatry 45,1128–1137.
Manoach, D.S., Gollub, R.L., Benson, E.S., Searl, M.M., Goff, D.C., Halpern, E., Saper, C.B.,Rauch, S.L., 2000. Schizophrenic subjects show aberrant fMRI activation ofdorsolateral prefrontal cortex and basal ganglia during working memoryperformance. Biol. Psychiatry 48, 99–109.
Mathalon, D.H., Ford, J.M., 2002. The long and the short of it: influence of interstimulusinterval on auditory P300 abnormalities in schizophrenia. Clin. Electroencephalogr.33, 125–135.
Mathalon, D.H., Hoffman, R.E., Watson, T.D., Miller, R.M., Roach, B.J., Ford, J.M., 2010.Neurophysiological distinction between schizophrenia and schizoaffective disor-der. Front. Hum. Neurosci. 3, 70.
Menon, V., Ford, J.M., Lim, K.O., Glover, G.H., Pfefferbaum, A., 1997. Combined event-related fMRI and EEG evidence for temporal-parietal cortex activation during targetdetection. Neuroreport 8, 3029–3037.
Mobascher, A., Brinkmeyer, J., Warbrick, T., Musso, F., Wittsack, H.J., Saleh, A., Schnitzler,A., Winterer, G., 2009. Laser-evoked potential P2 single-trial amplitudes covarywith the fMRI BOLD response in the medial pain system and interconnectedsubcortical structures. NeuroImage 45, 917–926.
Moghaddam, B., Adams, B.W., 1998. Reversal of phencyclidine effects by a group IImetabotropic glutamate receptor agonist in rats. Science 281, 1349–1352.
Moores, K.A., Clark, C.R., Hadfield, J.L., Brown, G.C., Taylor, D.J., Fitzgibbon, S.P., Lewis, A.C.,Weber, D.L., Greenblatt, R., 2003. Investigating the generators of the scalp recordedvisuo-verbal P300 using cortically constrained source localization. Hum. Brain Mapp.18, 53–77.
Morey, R.A., Inan, S., Mitchell, T.V., Perkins, D.O., Lieberman, J.A., Belger, A., 2005.Imaging frontostriatal function in ultra-high-risk, early, and chronic schizophreniaduring executive processing. Arch. Gen. Psychiatry 62, 254–262.
Morgan, C.J., Mofeez, A., Brandner, B., Bromley, L., Curran, H.V., 2004. Acute effects ofketamine on memory systems and psychotic symptoms in healthy volunteers.Neuropsychopharmacology 29, 208–218.
Musso, F., Brinkmeyer, J., Mobascher, A., Warbrick, T., Winterer, G., 2010. Spontaneousbrain activity and EEG microstates. A novel EEG/fMRI analysis approach to exploreresting-state networks. NeuroImage 52, 1149–1161.
Newcomer, J.W., Krystal, J.H., 2001. NMDA receptor regulation of memory and behaviorin humans. Hippocampus 11, 529–542.
Newcomer, J.W., Farber, N.B., Jevtovic-Todorovic, V., Selke, G., Melson, A.K., Hershey,T., Craft, S., Olney, J.W., 1999. Ketamine-induced NMDA receptor hypofunctionas a model of memory impairment and psychosis. Neuropsychopharmacology20, 106–118.
Noh, H.J., Bae, Y.M., Park, S.H., Kim, J.G., Kim, B., Kim, Y.S., Kim, S.H., Cho, S.I., Woo, N.S.,2009. The vasodilatory effect of ketamine is independent of the N-methyl-D-aspartate receptor: lack of functional N-methyl-D-aspartate receptors in ratmesenteric artery smooth muscle. Eur. J. Anaesthesiol. 26, 676–682.
Northoff, G., Richter, A., Bermpohl, F., Grimm, S., Martin, E., Marcar, V.L., Wahl, C., Hell,D., Boeker, H., 2005. NMDA hypofunction in the posterior cingulate as a model forschizophrenia: an exploratory ketamine administration study in fMRI. Schizophr.Res. 72, 235–248.
Novitskiy, N., Ramautar, J.R., Vanderperren, K., De Vos, M., Mennes, M., Mijovic, B.,Vanrumste, B., Stiers, P., Van den Bergh, B., Lagae, L., Sunaert, S., Van Huffel, S.,Wagemans, J., 2011. The BOLD correlates of the visual P1 and N1 in single-trialanalysis of simultaneous EEG-fMRI recordings during a spatial detection task.NeuroImage 54, 824–835.
Nuechterlein, K.H., Dawson, M.E., 1984. A heuristic vulnerability/stress model ofschizophrenic episodes. Schizophr. Bull. 10, 300–312.
Nuechterlein, K.H., Green, M.F., Kern, R.S., Baade, L.E., Barch, D.M., Cohen, J.D., Essock,S., Fenton, W.S., Frese III, F.J., Gold, J.M., Goldberg, T., Heaton, R.K., Keefe, R.S.,
Kraemer, H., Mesholam-Gately, R., Seidman, L.J., Stover, E., Weinberger, D.R.,Young, A.S., Zalcman, S., Marder, S.R., 2008. The MATRICS Consensus CognitiveBattery, part 1: test selection, reliability, and validity. Am. J. Psychiatry 165,203–213.
Olney, J.W., Newcomer, J.W., Farber, N.B., 1999. NMDA receptor hypofunction model ofschizophrenia. J. Psychiatr. Res. 33, 523–533.
Oostenveld, R., Praamstra, P., 2001. The five percent electrode system for high-resolution EEG and ERP measurement. Clin. Neurophysiol. 112, 713–719.
Oranje, B., van Berckel, B.N., Kemner, C., van Ree, J.M., Kahn, R.S., Verbaten, M.N., 2000.The effects of a sub-anaesthetic dose of ketamine on human selective attention.Neuropsychopharmacology 22, 293–302.
Oranje, B., Gispen deWied, C.C., Westenberg, H.G., Kemner, C., Verbaten, M.N., Kahn, R.S.,2009. Haloperidol counteracts the ketamine-induced disruption of processingnegativity, but not that of the P300 amplitude. Int. J. Neuropsychopharmacol. 12,823–832.
Pascual-Marqui, R.D., 1999. Review of methods for solving the EEG inverse problem. Int.J. Bioelectromagnetism 1, 75–86.
Pascual-Marqui, R.D., 2002. Standardized low-resolution brain electromagnetictomography (sLORETA): technical details. Methods Find. Exp. Clin. Pharmacol. 24(Suppl D), 5–12.
Pascual-Marqui, R.D., Michel, C.M., Lehmann, D., 1994. Low resolution electromagnetictomography: a new method for localizing electrical activity in the brain. Int. J.Psychophysiol. 18, 49–65.
Rawlins, M.D., 2004. Cutting the cost of drug development? Nat. Rev. Drug Discov. 3,360–364.
Redwine, L., Hauger, R.L., Gillin, J.C., Irwin, M., 2000. Effects of sleep and sleepdeprivation on interleukin-6, growth hormone, cortisol, and melatonin levels inhumans. J. Clin. Endocrinol. Metab. 85, 3597–3603.
Rolls, E.T., Loh, M., Deco, G., Winterer, G., 2008. Computational models ofschizophrenia and dopamine modulation in the prefrontal cortex. Nat. Rev.Neurosci. 9, 696–709.
Rorden, C., Karnath, H.O., Bonilha, L., 2007. Improving lesion-symptom mapping.J. Cogn. Neurosci. 19, 1081–1088.
Roth, B., 1961. The clinical and theoretical importance of EEG rhythms corresponding tostates of lowered vigilance. EEG Clin. Neurophysiol. 13, 395–399.
Setz, C., Arnrich, B., Schumm, J., La Marca, R., Tröster, G., Ehlert, U., 2010. Discriminatingstress from cognitive load using a wearable EDA device. IEEE Trans. Inf. Technol.Biomed. 14, 410–417.
Sharp, F.R., Tomitaka, M., Bernaudin, M., Tomitaka, S., 2001. Psychosis: pathologicalactivation of limbic thalamocortical circuits by psychomimetics and schizophrenia?Trends Neurosci. 24, 330–334.
Smith, S., 2002. Fast robust automated brain extraction. Hum. Brain Mapp. 17, 143–155.Stevens, M.C., Calhoun, V.D., Kiehl, K.A., 2005. Hemispheric differences in hemody-
namics elicited by auditory oddball stimuli. NeuroImage 26, 782–792.Stone, J.M., Abel, K.M., Allen, M.P., van Haren, N., Matsumoto, K., McGuire, P.K., Fu, C.H.,
2010. Ketamine-induced disruption of verbal self-monitoring linked to superiortemporal activation. Pharmacopsychiatry 44, 33–48.
Towle, V.L., Bolanos, J., Suarez, D., Tan, K., Grzeszcuk, R., Levin, D.N., Cakmur, R., Frank, S.A.,Spire, J.-P., 1993. The spatial location of EEG electrodes: locating the best-fitting sphererelative to cortical anatomy. Electroencephalogr. Clin. Neurosci. 86, 1–6.
Turetsky, B.I., Calkins, M.E., Light, G.A., Olincy, A., Radant, A.D., Swerdlow, N.R., 2007.Neurophysiological endophenotypes of schizophrenia: the viability of selectedcandidate measures. Schizophr. Bull. 33, 69–94.
Umbricht, D., Schmid, L., Koller, R., Vollenweider, F.X., Hell, D., Javitt, D., 2000.Ketamine-induced deficits in auditory and visual context-dependent processing inhealthy volunteers: implications for models of cognitive deficits in schizophrenia.Arch. Gen. Psychiatry 57, 1139–1147.
Umbricht, D., Koller, R., Vollenweider, F.X., Schmid, L., 2002. Mismatch negativitypredicts psychotic experiences induced by NMDA receptor antagonist in healthyvolunteers. Biol. Psychiatry 51, 400–406.
Viola, F.C., Thorne, J., Edmonds, B., Schneider, T., Eichele, T., Debener, S., 2009. Semi-automatic identification of independent components representing EEG artifact.Clin. Neurophysiol. 120, 868–877.
Vollenweider, F.X., 1998. Advances and pathophysiological models of hallucinogendrug actions in humans: a preamble to schizophrenia research. Pharmacopsychia-try 31, 92–103.
Vollenweider, F.X., Leenders, K.L., Scharfetter, C., Maguire, P., Stadelmann, O., Angst, J.,1997. Metabolic hyperfrontality and psychopathology in the ketamine model ofpsychosis using positron emission tomography (PET) and [18F] fluorodeoxyglu-cose (FDG). Eur. Neuropsychopharmacol. 7, 9–24.
Warbrick, T., Mobascher, A., Brinkmeyer, J., Musso, F., Richter, N., Stoecker, T., Fink, G.R.,Shah, N.J., Winterer, G., 2009. Single-trial P3 amplitude and latency informedevent-related fMRI models yield different BOLD response patterns to a targetdetection task. NeuroImage 47, 1532–1544.
Warbrick, T., Mobascher, A., Brinkmeyer, J., Musso, F., Stoecker, T., Shah, N.J., Fink, G.,Winterer, G., submitted for publication. Using single trial EEG-fMRI to investigatenicotine effects on brain and behavioural responses to a visual oddball task.
Watson, T.D., Petrakis, I.L., Edgecombe, J., Perrino, A., Krystal, J.H., Mathalon, D.H., 2009.Modulation of the cortical processing of novel and target stimuli by drugs affectingglutamate and GABA neurotransmission. Int. J. Neuropsychopharmacol. 12,357–370.
Winterer, G., 2009. Translational medicine: functional biomarkers for drug develop-ment of “cognitive enhancers” in schizophrenia. In: Ritsner, M. (Ed.), Neuropsy-chiatric Biomarkers, Endophenotypes, and Genes: Promises, Advances andChallenges. Neuropsychological Endophenotypes and Biomarkers, I. Springer,Berlin, pp. 57–86.

525F. Musso et al. / NeuroImage 58 (2011) 508–525
Winterer, G., McCarley, R.W., 2011. Electrophysiology of schizophrenia. In:Weinberger, D.R., Harrison, P.J. (Eds.), Schizophrenia. Blackwell Publishing,Oxford.
Winterer, G., Weinberger, D.R., 2004. Genes, dopamine and cortical signal-to-noiseratio in schizophrenia. Trends Neurosci. 27, 683–690.
Winterer, G., Mulert, C., Mientus, S., Gallinat, J., Schlattmann, P., Dorn, H., Herrmann,W.M.,2001. P300 and LORETA: comparison of normal subjects and schizophrenic patients.Brain Topogr. 13, 299–313.
Wolf, D.H., Turetsky, B.I., Loughead, J., Elliott, M.A., Pratiwadi, R., Gur, R.E., Gur, R.C.,2008. Auditory oddball fMRI in schizophrenia: association of negative symp-
toms with regional hypoactivation to novel distractors. Brain Imaging Behav. 2,132–145.
Woolrich, M.W., Ripley, B.D., Brady, M., Smith, S.M., 2001. Temporal autocorrelation inunivariate linear modelling of fMRI data. NeuroImage 14, 1370–1386.
Worsley, K.J., Evans, A.C., Marrett, S., Neelin, P., 1992. A three-dimensional statisticalanalysis for CBF activation studies in human brain. J. Cereb. Blood Flow Metab.12, 900–918.
Yonezawa, Y., Kuroki, T., Kawahara, T., Tashiro, N., Uchimura, H., 1998. Involvement ofgamma-aminobutyric acid neurotransmission in phencyclidine-induced dopaminerelease in the medial prefrontal cortex. Eur. J. Pharmacol. 341, 45–56.