acoustic oddball during nrem sleep: a combined eeg/fmri study
TRANSCRIPT
Acoustic Oddball during NREM Sleep: A Combined EEG/fMRI StudyMichael Czisch*, Renate Wehrle, Andrea Stiegler, Henning Peters, Katia Andrade, Florian Holsboer,
Philipp G. Samann
Max Planck Institute of Psychiatry, Munich, Germany
Abstract
Background: A condition vital for the consolidation and maintenance of sleep is generally reduced responsiveness to externalstimuli. Despite this, the sleeper maintains a level of stimulus processing that allows to respond to potentially dangerousenvironmental signals. The mechanisms that subserve these contradictory functions are only incompletely understood.
Methodology/Principal Findings: Using combined EEG/fMRI we investigated the neural substrate of sleep protection byapplying an acoustic oddball paradigm during light NREM sleep. Further, we studied the role of evoked K-complexes (KCs),an electroencephalographic hallmark of NREM sleep with a still unknown role for sleep protection. Our main results were: (1)Other than in wakefulness, rare tones did not induce a blood oxygenation level dependent (BOLD) signal increase in theauditory pathway but a strong negative BOLD response in motor areas and the amygdala. (2) Stratification of rare tones bythe presence of evoked KCs detected activation of the auditory cortex, hippocampus, superior and middle frontal gyri andposterior cingulate only for rare tones followed by a KC. (3) The typical high frontocentral EEG deflections of KCs were notparalleled by a BOLD equivalent.
Conclusions/Significance: We observed that rare tones lead to transient disengagement of motor and amygdala responsesduring light NREM sleep. We interpret this as a sleep protective mechanism to delimit motor responses and to reduce thesensitivity of the amygdala towards further incoming stimuli. Evoked KCs are suggested to originate from a brain state withrelatively increased stimulus processing, revealing an activity pattern resembling novelty processing as previously reportedduring wakefulness. The KC itself is not reflected by increased metabolic demand in BOLD based imaging, arguing thatevoked KCs result from increased neural synchronicity without altered metabolic demand.
Citation: Czisch M, Wehrle R, Stiegler A, Peters H, Andrade K, et al. (2009) Acoustic Oddball during NREM Sleep: A Combined EEG/fMRI Study. PLoS ONE 4(8):e6749. doi:10.1371/journal.pone.0006749
Editor: Benedikt Grothe, Ludwig Maximilians University Munich, Germany
Received March 10, 2009; Accepted July 19, 2009; Published August 25, 2009
Copyright: � 2009 Czisch et al. This is an open-access article distributed under the terms of the Creative Commons Attribution License, which permitsunrestricted use, distribution, and reproduction in any medium, provided the original author and source are credited.
Funding: The authors have no support or funding to report.
Competing Interests: The authors have declared that no competing interests exist.
* E-mail: [email protected]
Introduction
Sleep, as compared to wakefulness, is characterized by altered
and reduced reactivity to external stimulation, but the brain
mechanisms underlying these fundamental changes are not yet
fully disclosed. On the other hand, some stimulus processing must
be preserved allowing the sleeper to be aroused by personally
meaningful or threatening stimuli. So far, mostly electrophysio-
logical techniques, especially averaged event-related potentials
(ERPs), have been used to investigate the brain’s responsiveness to
external stimuli, since electrophysiological measures are indepen-
dent of behavioral responses or conscious awareness. In NREM
sleep, several large amplitude ERP components are thought to
reflect inhibition of information processing and may reflect the
brain’s capacity to generate delta frequency EEG activity, a
marker of deep slow wave sleep [1].
The oddball paradigm, being a simple discrimination task, has
been widely used to probe attentiveness in different vigilance states
[1–5]. While active detection of stimulus deviance is associated with
a P300 component during wakefulness, this component is not
detectable when subjects either ignore or fail to detect the rare tone,
or in consolidated NREM sleep [1,5]. Similar, a mismatch
negativity reflecting pre-attentive stimulus discrimination processes
can be recorded during wakefulness, but is strongly reduced or
absent in light NREM sleep [6,7]. Furthermore, during NREM
sleep an attenuation of the early N1 component has been observed,
while P2 is enhanced, hypothesized to reflect decreased cortical
excitability and increased inhibitory processes [1,5,8,9]. In addition,
sleep specific late ERP components such as the N350, P450, N550
and P900 arise. These components are most enhanced subsequent
to rare stimuli, and have been found strongest with increased sleep
pressure during the first half of the night [4] or following sleep
fragmentation or sleep deprivation [10–12]. Taken together, it has
been suggested that these late ERP components reflect inhibitory
processes minimizing cognitive processing.
The late components N550 and P900 in NREM sleep are a
reflection of the so called K-complex (KC), first described by Loomis
et al. [13] as a prominent element of the human sleep EEG (for
recent reviews, see e. g. [14,15]). KCs may appear spontaneously,
but can also be evoked by external stimuli. The functional
significance of KCs, however, is still a matter of debate. As KCs
can be elicited by cortical, thalamic or sensory stimuli, they are
PLoS ONE | www.plosone.org 1 August 2009 | Volume 4 | Issue 8 | e6749
obviously involved in some form of information processing during
NREM sleep. This has led to the notion of KCs being reactive
micro-arousal processes without awakening [16]. Compatible with
this notion, cortical reactivity was found increased in periods
preceding KCs [17]. In turn, it has been hypothesized that KCs may
also serve as a sleep protective mechanism by triggering anti-arousal
reactions that support the consolidation and maintenance of sleep
[15,18–20]. Furthermore, Amzica and Steriade [21] suggested that
KCs may represent the alternation between a state in which the
cortical network would be ready to operate in case of danger
(depolarizing phase) and a state where the brain is at rest, allowing
replenishing of cellular energetic stores (hyperpolarizing phase).
First fMRI studies performed during NREM sleep applying
acoustic stimulation showed contradictory results: Portas et al. [22]
as well as Redcay et al. [23] and Wilke et al. [24] identified
preserved activation of the primary auditory cortex in light NREM
sleep in adults and children, respectively. However, these studies did
not include EEG measurements to validate sleep during the actual
fMRI data acquisition. The use of simultaneous EEG recordings
and analysis of epochs directly related to sound presentation is
mandatory to objectify sleep stages and to affirm sleep continuity.
Other groups showed reduced or even inverted BOLD responses in
the auditory cortex [25–27] in electrophysiologically verified sleep
stages 1 and 2, respectively. All studies used different acoustic
stimuli, e.g. personally relevant stimuli with strong arousal capacity
such as the subject’s own name, or less arousing stimuli like classical
music or pure tones. In our earlier studies we observed a negative
BOLD response (NBR) to acoustic stimuli presented in a block
design during light NREM sleep, with paralleled increases in
occurrence of KCs and delta activity [26,27]. Using a different
sensory modality, an NBR has also been obtained by Born et al. [28]
for the primary and secondary visual cortex in response to
appropriate visual stimuli during early NREM sleep. We proposed
this NBR to reflect sleep inhibitory processes that eventually renders
a function in consolidation and deepening of sleep.
Extending previous findings utilizing a block-presentation of
stimulation, the present study aimed at a more precise description
of auditory processing during light NREM sleep stage 2. To do so,
an event-related acoustic oddball paradigm with rare tones
interspersed in more frequent tones was applied. Experiments
were designed to test the following hypotheses:
1. Response to the oddball paradigm during sleep is altered as
compared to wakefulness. Especially, we hypothesize a reduced
or even inverted BOLD response in the auditory cortex.
2. Based on our previous findings, a general sleep defensive
mechanism is postulated to be triggered by rare tones which
should be reflected by an crossmodal NBR also in brain areas
not directly targeted by the acoustic paradigm.
3. The oddball paradigm has been shown to evoke KCs during
sleep stage 2. By separating rare tone segments with or without
KCs we aimed at identifying the neuronal representation of
evoked KCs in BOLD based functional imaging. KC related
cerebral activity is predicted mainly to be located in frontal and
central brain areas, as evidenced by the frontocentral
maximum of KCs in surface EEG recordings.
Materials and Methods
Ethics StatementThe study protocol followed the guidelines of the Declaration of
Helsinki and was approved by the local ethical committee
(Bayrische Landesarztekammer, Germany, Nr. 01102).
SubjectsYoung healthy subjects were recruited by public advertising and
they gave written informed consent prior to the study. All
participants underwent a careful screening including a structured
clinical interview, a medical examination, routine blood tests and
drug screening, clinical MRI and EEG including polysomnographic
recordings. Exclusion criteria were any lifetime axis I psychiatric
diagnosis according to a computerized DSM-IV version of the
Munich-Composite International Diagnostic Interview [29], sleep-
related disorders or circadian rhythms exceeding intermediate or
moderate morning- or evening-types [30], consumption of drugs,
consumption of more than 2 cups of coffee per day or more than 5
alcoholic drinks per week, any regular medication, crossing of time
zones during the 3 months before the study and any contraindi-
cations to MRI. All subjects were right-handed and non-smokers.
In total, 18 volunteers (9 m/9 f, mean age 25.462.5 years)
underwent the study protocol. Subjects had to follow a regular
sleep-wake-schedule for one week before the experiments. The first
experimental session was recorded during wakefulness (starting at
about 17:00 hrs, duration: 39400 minutes), and the second session
was recorded while subjects were trying to fall asleep in the MRI
scanner (start at about 21:00 hrs, 269400 minutes). To increase
sleep pressure, subjects were asked to get up three hours earlier
than usually. If the subject was unable to fall asleep during the first
run as visible in the online simultaneous EEG, the sleep
experiment was immediately repeated a second time.
Acoustic stimulationFor acoustic stimulation we used a passive two tone oddball
paradigm programmed using the Presentations Software (Neuro-
behavioral Systems, Albany, USA). The paradigm has been chosen
because it has been frequently described in ERP studies to assess
sleep specific responses to frequent and rare tones. Furthermore, it
was favored over simple presentations of rare tones only due to a
more homogenous acoustic background created by the frequent
tones, supposed to have less adverse effects on sleep continuity. In
our paradigm, rare odd tones (1500 Hz, duration 50 ms) appeared
with 20% probability against the background of frequent tones
(1000 Hz, duration 50 ms). The interstimulus interval was set to
2000 ms as this period allows to catch potentially elicited KC events
in the ERP data, and assigned with a random jitter of60, 6100 or
6200 ms. The order of the tones was randomly assigned. Still, two
consecutive rare tones were always separated by at least two
frequent tones and the 20% rare tone probability had to be fulfilled
in subsets of 20 tones. Acoustic stimuli were delivered by a
magnetostatic headphone (MR-Confon, Magdeburg, Germany). In
addition, subjects wore foam ear plugs for safety reasons. To adjust
loudness of the acoustic stimuli, a preparation scan was performed
during which subjects had to repeatedly decide whether or not they
perceived the tones as loud as the fMRI scanner sound. This
resulted in a defined level of subjectively identical loudness of tones
and scanner noise. For the final experiment, tones were delivered
3 dB louder for better perception (within an absolute range of 80–
85 dB). The main acoustic frequency component of the fMRI
sequence was about 800 Hz, outside the acoustic spectrum of
frequent and rare tones. After the loudness adjustment, subjects
were instructed to listen to the tones without focussing on different
tone types. We also explained that no active response is requested.
Last, in the sleep condition, subjects were told that falling asleep was
part of the experiment and should not be actively prevented.
FMRI acquisitionWhole brain functional images were acquired on a 1.5T GE
Signa Excite System (Milwaukee, USA) using an 8-channel phased
Oddball during NREM Sleep
PLoS ONE | www.plosone.org 2 August 2009 | Volume 4 | Issue 8 | e6749
array head coil. 25 slices (64664 points, 3 mm thickness, 1 mm
gap, AC-PC orientation) were recorded per EPI volume (TR 2 s,
TE 40 ms). In total, 800 fMRI volumes were measured while the
subject was falling asleep during oddball presentation. For
comparison, independent data were recorded in a separate session
during wakefulness by applying the same acoustic paradigm
without requesting a response (passive oddball). Here, two
consecutive fMRI experiments of 39400 minutes each were
collected in all n = 18 subjects. All fMRI data were collected with
simultaneous EEG recordings.
Polysomnographic recordingFor simultaneous polysomnographic recording, special hard-
ware compatible with the magnetic field was used (MRplus 32-
channels, Brain Products, Gilching, Germany). 19 EEG surface
electrodes were placed according to the international standard 10/
20 system, with additional electrooculogram (EOG), mental/
submental electromyogram (EMG) and a two-lead electrocardio-
gram (ECG) (32 channels cap modified for sleep recordings, Easy
Cap, Herrsching-Breitbrunn, Germany), referenced against FCz.
Data were continuously sampled throughout the experiment at
5 kHz. To allow for optimal artifact correction, EEG recordings
and fMRI were synchronized using the scanner’s 10 MHz master
clock [31]. Electrode impedance was below 5 kV Raw data were
stored without any filtering for later processing. In addition, trigger
pulses from the MRI system as well as from the stimulus
presentation device were recorded for subsequent off-line artifact
correction and identification of tone events, respectively.
EEG data analysisData preprocessing and identification of K-
complexes. Data were analyzed with Brain Vision Analyzer,
Version 1.05 (Brain Products, Gilching, Germany). EEG
recordings were corrected for gradient artifacts using the
implemented algorithm based on subtraction of adaptive artifact
templates, and downsampled to 250 Hz. To remove pulse
artifacts, EEG signals were transformed using independent
component analysis (ICA), and components with activity
synchronous to the ECG recording were excluded prior to back
transformation. EEG traces were re-referenced against linked
mastoid electrodes. EEG data were subsequently band-filtered
(0.5–70 Hz; EOG: 0.1–30 Hz, EMG: 16–250 Hz), with an
additional notch filter set to 50 Hz. The corrected
polysomnographic recordings were analyzed using visual scoring
of sleep stages according to the Rechtschaffen & Kales criteria
(1968). For each subject, a continuous episode with steady sleep
stage 2 was selected from the complete fMRI time series for further
analysis. KCs were then identified visually as strictly biphasic
waves of a total duration.500 ms, starting with a negative wave
(500 to 800 ms following stimulus onset [1]), immediately followed
by a positive deflection. As an amplitude criterion, the negative-
positive deflections had to reach voltage differences of at least
50 mV (instead of 75 mV [32] since ERPs have been shown to be
reduced in amplitude in the fMRI environment [33]). Similar to
Colrain et al. [32], other evoked responses with increased
amplitudes (.50 mV as described in literature; .35 mV to
account for the fMRI environment) but not fulfilling the criteria
for a KC (also referred to as unspecific responses) were also
identified but excluded from further analysis. This latter category
may include vertex sharp waves, delta waves and other low
frequency components. For wakefulness, same EEG preprocessing
steps were performed.
Analysis of evoked potentials. Averages of evoked
potentials were calculated (time window of 2200 ms to
1800 ms) with the tone onset defined as time 0 ms, separately
for epochs following frequent and rare tones. Furthermore, rare
epochs in sleep stage 2 were subdivided into trials with and without
evoked KCs (rareKC and rarew/oKC, respectively). A baseline
correction was applied (baseline 2200 to 0 ms), followed by DC
detrending of the EEG signal. Finally, the resulting EEG traces
were averaged for each individual channel using the three event
types: frequent, rareKC and rarew/oKC. Distinct local maxima were
labeled according to their latency, following the classification by
[1]: N1 as negative peak between 90 and 110 ms, P2 as positive
peak between 170 and 230 ms, N350 as negative peak between
250 and 400 ms, P450 as positive peak between 360 and 540 ms,
and N550 as negative peak between 500 and 800 ms. For each
subject, the maximum amplitude of the averaged responses in the
respective time window was extracted for rareKC, rarew/oKC and
frequent tones for the central electrodes Fz, Cz and Pz. Statistical
analysis of amplitudes comprised each two factorial analysis of
variance (3-level-factors electrode and trial-type) for the N1, P2,
N350, P450 and N550 component. Main effects and the
electrode6trial-type interaction were analyzed and post-hoc
(LSD) tests applied if appropriate. The MMN, involved in
passive deviant detection, is best observed in a subtraction
waveform of rare and frequent tone averages. The MMN has
been reported to occur in this subtraction waveform as a negative
peak between 100–250 ms after tone presentation [34]. Due to the
effective sampling rate of 250 Hz (corresponding to 4 ms
resolution) in our EEG data after preprocessing, we have chosen
the post-stimulus window 108–260 ms for MMN analysis,
subdivided into three frames of 48 ms each. The average of the
subtraction waveform in the 48 ms prestimulus period served as
zero amplitude baseline. For each frame, the minimum amplitude
was determined, likely reflecting the MMN, and subjected to one-
tailed t-tests (with negative directionality assumed).
Analysis of stimulation-induced EEG frequency
shifts. To interrogate if rare tones or KCs induce changes in
sleep depth, particularly arousal reactions, we employed EEG
frequency analysis of periods preceding and following the rare tone
presentations. For this, spectral power of the delta (1–4 Hz), theta
(4.5–7.5 Hz), alpha (8–11 Hz), sigma (11.5–16 Hz) and beta
(16.5–25 Hz) frequency bands were compared between frequent
epochs before (frequentpre) and after (frequentpost) each rare epoch
with the time window defined to 100–1100 ms after frequent tone
presentation. For each channel and frequency band, the difference
(frequentpost–frequentpre) of spectral power induced by the rare
tone was tested for its deviation from zero (10 subjects, one-sample
t-test). The group t-test was performed for all rare tones (rareKC
and rarew/oKC) and separately for rareKC and rarew/oKC. In
analogy to the ERP analysis, events with unspecific slow responses
were excluded.
EEG components of no interest. Only few KCs showed
subsequent visually identifiable sleep spindles [35] in our
experiment. To avoid any contamination by possibly KC-induced
activity in individual segments, we introduced alpha and spindle
activity as regressors of no interest in the later fMRI models. To do
so, FFT based spectral power of the alpha (8–11 Hz, at position O1
and O2) and spindle frequency band (11.5–16 Hz, at position Cz
and Fz) were extracted from segments of 2 s length (overlap of 1 s).
For each frequency band, power values were summed up and
assigned to the middle of the respective temporal window.
fMRI data analysisAll MR analysis steps were performed on Linux workstations
using the SPM software (http://www.fil.ion.ucl.ac.uk/spm, version
SPM5). First, data were corrected for slice time differences to
Oddball during NREM Sleep
PLoS ONE | www.plosone.org 3 August 2009 | Volume 4 | Issue 8 | e6749
compensate for different acquisition times due to the interleaved
slice acquisition scheme in each volume. Afterwards, a realignment
step was performed using rigid body transformation. Movements
less than 2 mm were accepted. Data were then normalized to a
standard EPI template in MNI space (SPM5 distribution), resliced
to a voxel resolution of 26262 mm3 (5th degree spline interpola-
tion), and smoothed using an isotropic Gaussian kernel with full
width half maximum of 8 mm. As mentioned above, only periods
showing continuous sleep stage 2 were considered for further
analysis.
Tone trials were separated into seven regressors representing rare
tones evoking i) a KC (rareKC), ii) another response type (rareX), iii)
no obvious high amplitude EEG response (rarew/oKC); frequent
tones evoking iv) KCs (frequentKC), v) another response type
(frequentX), vi) no high amplitude EEG response (frequentw/oKC);
and vii) KCs not directly associated to any tone (N550 compo-
nent.0.8 s after preceding tone presentation. Regressor vi) was
orthogonalized with respect to all other regressors (i–v; vii). Beside
regressors of interest, the model comprised the following set of
nuisance regressors (NR): NR1 and NR2: total white matter
intensity and cerebrospinal fluid (CSF) intensity per fMRI volume.
NR3 and NR4: Alpha power (8–11 Hz) and spindle power (11.5–
16 Hz) extracted as described above and convoluted by the HRF.
NR6–NR11: parameters of the rigid body motion correction, and
NR12–NR17: Differential motion correction parameters to account
for relative motion between the ith and (i-1)th volume.
Positive and negative T-contrasts were evaluated for all rare
tones (rareKC, rarew/oKC, and both regressors combined), as well
as for the differential contrast (rareKC – rarew/oKC).
Second level analyses. 2nd level random effect analyses were
performed across subjects for sleep trials (one sample t-tests). When
comparing all rare tone against frequent tones significance was set to
FDR corrected pFDR,0.05, extent 10 voxels, for both wakefulness
and sleep stage 2. A mask defining task specific activation in
wakefulness was built using this threshold. For sleep stage 2,
significance in the differential contrast rareKC vs rarew/oKC was
accepted for p-values,0.001, uncorrected, and an extent threshold
of 10 voxels. Anatomical location of significant clusters was
determined from comparison with a canonical T1-weighted image
in MNI space and by automated assignment of clusters to Brodmann
areas and brain regions in MNI space (http://www.fil.ion.ucl.ac.uk/
spm/ext/#MSU). To evaluate task specific activation during sleep
the mask described above was applied and activated voxels were
collected at a threshold of p,0.05. These latter results were
presented as corrected p-values on a cluster level (pcluster).
Results
All 18 subjects were included for the analysis performed during
wakefulness. For the sleep trial, one participant was not able to fall
asleep at all and six participants only reached sleep stage 1 or spent
less than 3 minutes continuously in stage 2. Another participant
showed movement artifacts outside the tolerated range during the
sleep recording. These subjects were excluded from further
analysis. Finally, data from ten subjects (5 m/5 f, mean age
25.562.7 years) were used for further fMRI/EEG analyses
focusing on sleep stage 2. Of these ten subjects, two subjects
reached sleep stage 1 after less than one minute, three subjects
after 3 minutes and five subjects after more than 5 minutes.
Consolidated sleep stage 2 was reached after a mean latency of
109130659550 min (range 09440–179390 minutes). fMRI volumes
were extracted for continuous episodes in sleep stage 2 with an
average duration of 14955066900 minutes (range 89540–26900
minutes).
Appearance of KCsWithin selected sleep stage 2 fMRI episodes, we observed a
median of 31 well-defined KC complexes (range 19–160) with an
average density of 3.461.8 KCs/min. KCs evoked by tones
occurred with a median of 21 (range 9–125). Of these, a median of
16 KCs (range: 5–109) were elicited by rare tones, while a median
of 6 KCs (range: 4–16) occurred after frequent tones. As
compared to all rare and frequent tones presented per individual
this reflects an appearance of KCs in 23% of rare tones (range: 5–
75%) and 2% of frequent tones (range: 1–4%), respectively. In
addition, a median of 33 (range: 10–71) unspecific responses
(2.460.87/min) were identified. Finally, a median of 13 KCs
(range: 1–35) arose which where not related to tone presentation,
i. e. appearing outside the above described temporal detection
window.
Event-related potentials (ERP)Comparing rare and frequent tones during wakefulness, ERP
amplitudes were significantly larger for P300 (p,0.001) following
rare tones, but not for N1 and P2 (Figure 1A). A significant effect
of EEG channel was found for P300, with higher amplitude in
more parietal electrodes. Similar, a significant effect for MMN was
found in Pz in the time window 160–208 ms (20.86162.025 mV;
p = 0.022), as expected for pre-attentive stimulus discrimination
(see Figure S1).
As described in [1], ERPs during sleep showed a decrease in N1
amplitude, an increased amplitude of P2, as well as appearance of
a small N350 and a large-amplitude N550, the latter representing
the KC (Figure 1B). During selected sleep stage 2 epochs,
differences of ERP amplitudes between trial types (rareKC,
rarew/oKC, frequent) were significant for components N1, P2,
P450, N550 and P900, all p-values,0.001, and non-significant for
N350 and MMN. All components in rareKC trials were higher in
(absolute) amplitudes than in frequent or rarew/oKC trials, and
rareKC differed significantly in P2, N550 and P900 from the other
two trial types. Post-hoc comparisons demonstrated that for P450,
also rarew/oKC trials differed significantly from frequent trials. The
difference between rarew/oKC and frequent trials was absent for
the P2, N550 and P900 response, highlighting specificity of the
latter components for KCs.
Electrode6trial type interactions were found for all analyzed
components, reflecting generally higher sensitivity for the more
anterior electrodes for amplitude differences (Figure 2B).
Effect of rare tones on sleep depthFor all rare tones, spurious spectral power changes were
detected in a limited number of frequency bands at a significance
threshold of 0.05 (uncorrected; P7: delta increase; O2: theta
decrease and beta increase), not robust against multiple test
correction. When separated by the appearance of a KC, no
changes of frequency bands were detected for rarew/oKC, and
spurious changes, mostly increases, of theta (O2, F8, T8 and P7)
and delta (O2) activity for rareKC, again not robust against
multiple test correction. No changes were detected in either
analysis for the alpha and sigma frequency band at uncorrected
p,0.05.
fMRI resultsPassive oddball task during wakefulness and S2. The
overall response to the passive oddball task during wakefulness is
given in Figure 1A (detailed in Table 1), along with the grand
average ERPs for rare and frequent tones measured at the Cz
derivation. During wakefulness, positive BOLD responses
Oddball during NREM Sleep
PLoS ONE | www.plosone.org 4 August 2009 | Volume 4 | Issue 8 | e6749
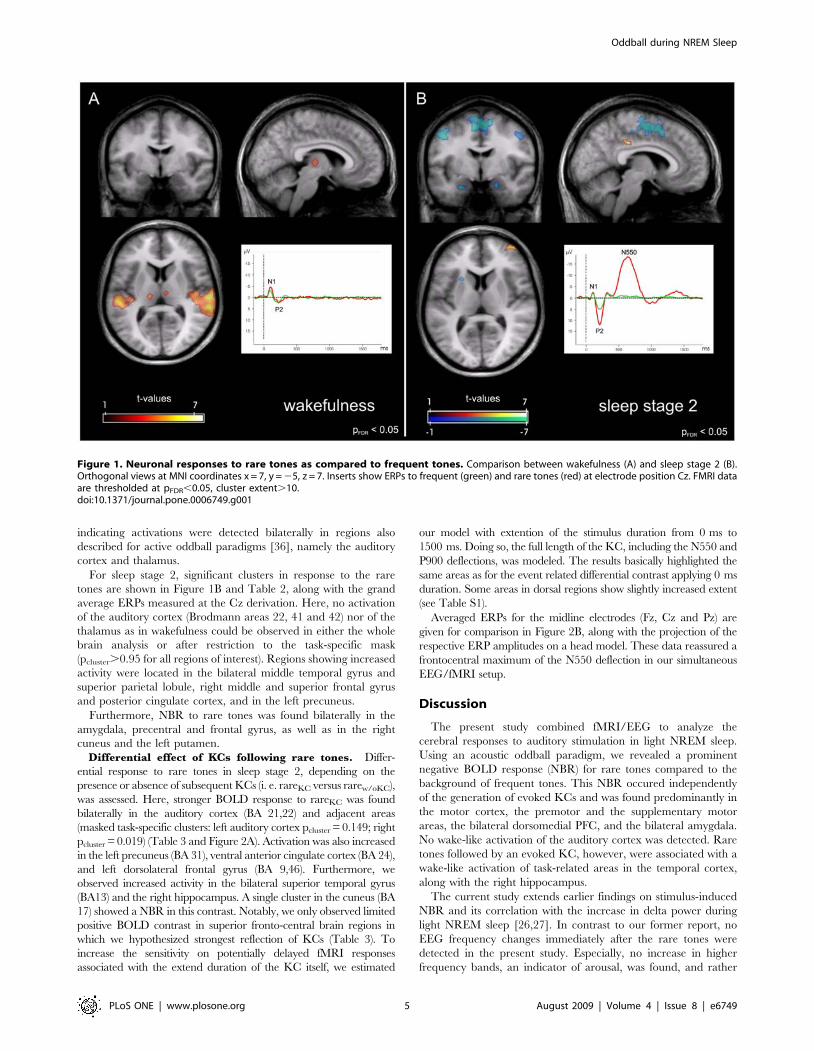
indicating activations were detected bilaterally in regions also
described for active oddball paradigms [36], namely the auditory
cortex and thalamus.
For sleep stage 2, significant clusters in response to the rare
tones are shown in Figure 1B and Table 2, along with the grand
average ERPs measured at the Cz derivation. Here, no activation
of the auditory cortex (Brodmann areas 22, 41 and 42) nor of the
thalamus as in wakefulness could be observed in either the whole
brain analysis or after restriction to the task-specific mask
(pcluster.0.95 for all regions of interest). Regions showing increased
activity were located in the bilateral middle temporal gyrus and
superior parietal lobule, right middle and superior frontal gyrus
and posterior cingulate cortex, and in the left precuneus.
Furthermore, NBR to rare tones was found bilaterally in the
amygdala, precentral and frontal gyrus, as well as in the right
cuneus and the left putamen.
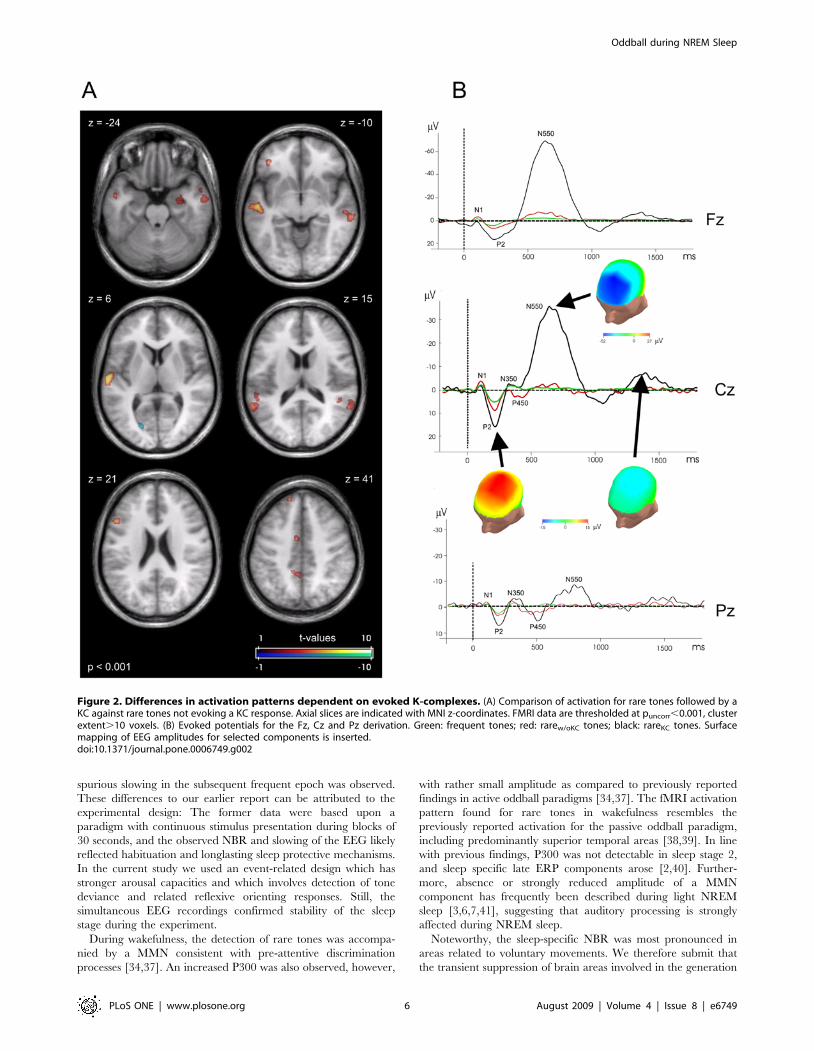
Differential effect of KCs following rare tones. Differ-
ential response to rare tones in sleep stage 2, depending on the
presence or absence of subsequent KCs (i. e. rareKC versus rarew/oKC),
was assessed. Here, stronger BOLD response to rareKC was found
bilaterally in the auditory cortex (BA 21,22) and adjacent areas
(masked task-specific clusters: left auditory cortex pcluster = 0.149; right
pcluster = 0.019) (Table 3 and Figure 2A). Activation was also increased
in the left precuneus (BA 31), ventral anterior cingulate cortex (BA 24),
and left dorsolateral frontal gyrus (BA 9,46). Furthermore, we
observed increased activity in the bilateral superior temporal gyrus
(BA13) and the right hippocampus. A single cluster in the cuneus (BA
17) showed a NBR in this contrast. Notably, we only observed limited
positive BOLD contrast in superior fronto-central brain regions in
which we hypothesized strongest reflection of KCs (Table 3). To
increase the sensitivity on potentially delayed fMRI responses
associated with the extend duration of the KC itself, we estimated
our model with extention of the stimulus duration from 0 ms to
1500 ms. Doing so, the full length of the KC, including the N550 and
P900 deflections, was modeled. The results basically highlighted the
same areas as for the event related differential contrast applying 0 ms
duration. Some areas in dorsal regions show slightly increased extent
(see Table S1).
Averaged ERPs for the midline electrodes (Fz, Cz and Pz) are
given for comparison in Figure 2B, along with the projection of the
respective ERP amplitudes on a head model. These data reassured a
frontocentral maximum of the N550 deflection in our simultaneous
EEG/fMRI setup.
Discussion
The present study combined fMRI/EEG to analyze the
cerebral responses to auditory stimulation in light NREM sleep.
Using an acoustic oddball paradigm, we revealed a prominent
negative BOLD response (NBR) for rare tones compared to the
background of frequent tones. This NBR occured independently
of the generation of evoked KCs and was found predominantly in
the motor cortex, the premotor and the supplementary motor
areas, the bilateral dorsomedial PFC, and the bilateral amygdala.
No wake-like activation of the auditory cortex was detected. Rare
tones followed by an evoked KC, however, were associated with a
wake-like activation of task-related areas in the temporal cortex,
along with the right hippocampus.
The current study extends earlier findings on stimulus-induced
NBR and its correlation with the increase in delta power during
light NREM sleep [26,27]. In contrast to our former report, no
EEG frequency changes immediately after the rare tones were
detected in the present study. Especially, no increase in higher
frequency bands, an indicator of arousal, was found, and rather
Figure 1. Neuronal responses to rare tones as compared to frequent tones. Comparison between wakefulness (A) and sleep stage 2 (B).Orthogonal views at MNI coordinates x = 7, y = 25, z = 7. Inserts show ERPs to frequent (green) and rare tones (red) at electrode position Cz. FMRI dataare thresholded at pFDR,0.05, cluster extent.10.doi:10.1371/journal.pone.0006749.g001
Oddball during NREM Sleep
PLoS ONE | www.plosone.org 5 August 2009 | Volume 4 | Issue 8 | e6749
spurious slowing in the subsequent frequent epoch was observed.
These differences to our earlier report can be attributed to the
experimental design: The former data were based upon a
paradigm with continuous stimulus presentation during blocks of
30 seconds, and the observed NBR and slowing of the EEG likely
reflected habituation and longlasting sleep protective mechanisms.
In the current study we used an event-related design which has
stronger arousal capacities and which involves detection of tone
deviance and related reflexive orienting responses. Still, the
simultaneous EEG recordings confirmed stability of the sleep
stage during the experiment.
During wakefulness, the detection of rare tones was accompa-
nied by a MMN consistent with pre-attentive discrimination
processes [34,37]. An increased P300 was also observed, however,
with rather small amplitude as compared to previously reported
findings in active oddball paradigms [34,37]. The fMRI activation
pattern found for rare tones in wakefulness resembles the
previously reported activation for the passive oddball paradigm,
including predominantly superior temporal areas [38,39]. In line
with previous findings, P300 was not detectable in sleep stage 2,
and sleep specific late ERP components arose [2,40]. Further-
more, absence or strongly reduced amplitude of a MMN
component has frequently been described during light NREM
sleep [3,6,7,41], suggesting that auditory processing is strongly
affected during NREM sleep.
Noteworthy, the sleep-specific NBR was most pronounced in
areas related to voluntary movements. We therefore submit that
the transient suppression of brain areas involved in the generation
Figure 2. Differences in activation patterns dependent on evoked K-complexes. (A) Comparison of activation for rare tones followed by aKC against rare tones not evoking a KC response. Axial slices are indicated with MNI z-coordinates. FMRI data are thresholded at puncorr,0.001, clusterextent.10 voxels. (B) Evoked potentials for the Fz, Cz and Pz derivation. Green: frequent tones; red: rarew/oKC tones; black: rareKC tones. Surfacemapping of EEG amplitudes for selected components is inserted.doi:10.1371/journal.pone.0006749.g002
Oddball during NREM Sleep
PLoS ONE | www.plosone.org 6 August 2009 | Volume 4 | Issue 8 | e6749
and execution of motion activity is one of the factors that allows
further consolidation of sleep. Reduced activity in the amygdala
points towards altered processing of the emotional salience of the
incoming stimulus during sleep [42]. In the passive oddball
condition during wakefulness, the amygdala generally does not
show specific activation for rare tones [43]. However, it was shown
earlier that unpredictable irregularities in acoustic stimulus series
as well as rare tones embedded in trains of frequent tones may lead
to activation of the amygdala [44]. The amygdala has also been
reported to constitute part of a network activated in the active
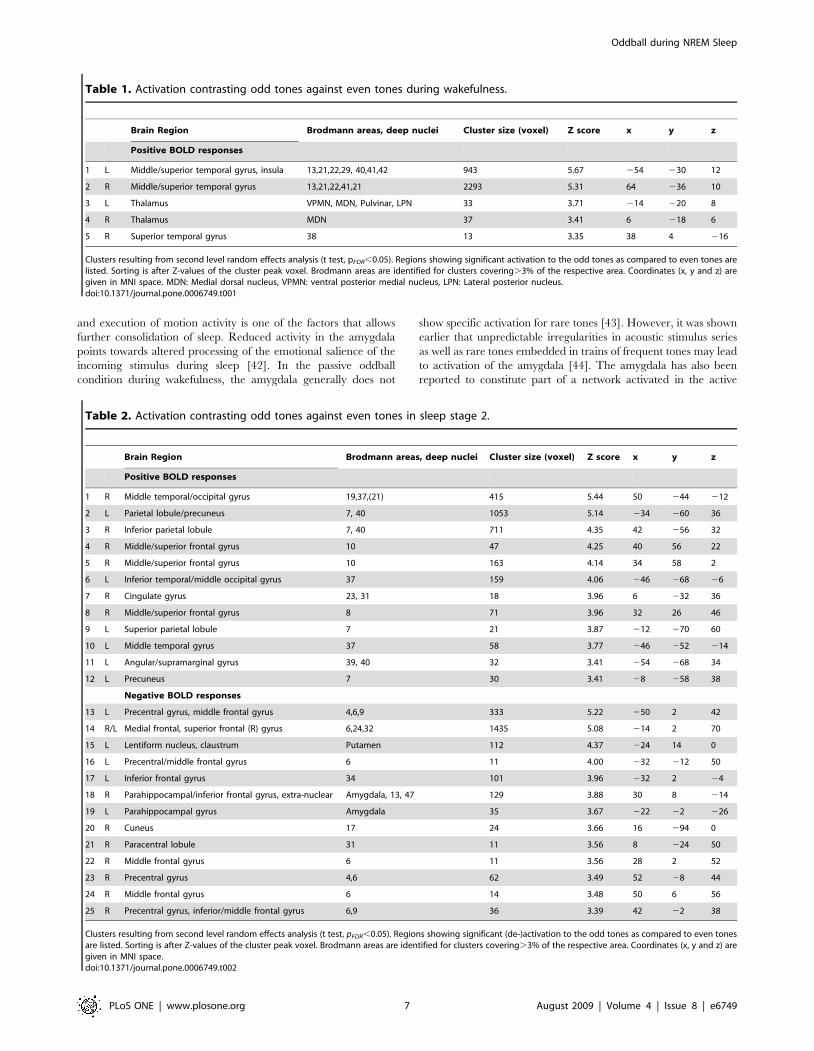
Table 1. Activation contrasting odd tones against even tones during wakefulness.
Brain Region Brodmann areas, deep nuclei Cluster size (voxel) Z score x y z
Positive BOLD responses
1 L Middle/superior temporal gyrus, insula 13,21,22,29, 40,41,42 943 5.67 254 230 12
2 R Middle/superior temporal gyrus 13,21,22,41,21 2293 5.31 64 236 10
3 L Thalamus VPMN, MDN, Pulvinar, LPN 33 3.71 214 220 8
4 R Thalamus MDN 37 3.41 6 218 6
5 R Superior temporal gyrus 38 13 3.35 38 4 216
Clusters resulting from second level random effects analysis (t test, pFDR,0.05). Regions showing significant activation to the odd tones as compared to even tones arelisted. Sorting is after Z-values of the cluster peak voxel. Brodmann areas are identified for clusters covering.3% of the respective area. Coordinates (x, y and z) aregiven in MNI space. MDN: Medial dorsal nucleus, VPMN: ventral posterior medial nucleus, LPN: Lateral posterior nucleus.doi:10.1371/journal.pone.0006749.t001
Table 2. Activation contrasting odd tones against even tones in sleep stage 2.
Brain Region Brodmann areas, deep nuclei Cluster size (voxel) Z score x y z
Positive BOLD responses
1 R Middle temporal/occipital gyrus 19,37,(21) 415 5.44 50 244 212
2 L Parietal lobule/precuneus 7, 40 1053 5.14 234 260 36
3 R Inferior parietal lobule 7, 40 711 4.35 42 256 32
4 R Middle/superior frontal gyrus 10 47 4.25 40 56 22
5 R Middle/superior frontal gyrus 10 163 4.14 34 58 2
6 L Inferior temporal/middle occipital gyrus 37 159 4.06 246 268 26
7 R Cingulate gyrus 23, 31 18 3.96 6 232 36
8 R Middle/superior frontal gyrus 8 71 3.96 32 26 46
9 L Superior parietal lobule 7 21 3.87 212 270 60
10 L Middle temporal gyrus 37 58 3.77 246 252 214
11 L Angular/supramarginal gyrus 39, 40 32 3.41 254 268 34
12 L Precuneus 7 30 3.41 28 258 38
Negative BOLD responses
13 L Precentral gyrus, middle frontal gyrus 4,6,9 333 5.22 250 2 42
14 R/L Medial frontal, superior frontal (R) gyrus 6,24,32 1435 5.08 214 2 70
15 L Lentiform nucleus, claustrum Putamen 112 4.37 224 14 0
16 L Precentral/middle frontal gyrus 6 11 4.00 232 212 50
17 L Inferior frontal gyrus 34 101 3.96 232 2 24
18 R Parahippocampal/inferior frontal gyrus, extra-nuclear Amygdala, 13, 47 129 3.88 30 8 214
19 L Parahippocampal gyrus Amygdala 35 3.67 222 22 226
20 R Cuneus 17 24 3.66 16 294 0
21 R Paracentral lobule 31 11 3.56 8 224 50
22 R Middle frontal gyrus 6 11 3.56 28 2 52
23 R Precentral gyrus 4,6 62 3.49 52 28 44
24 R Middle frontal gyrus 6 14 3.48 50 6 56
25 R Precentral gyrus, inferior/middle frontal gyrus 6,9 36 3.39 42 22 38
Clusters resulting from second level random effects analysis (t test, pFDR,0.05). Regions showing significant (de-)activation to the odd tones as compared to even tonesare listed. Sorting is after Z-values of the cluster peak voxel. Brodmann areas are identified for clusters covering.3% of the respective area. Coordinates (x, y and z) aregiven in MNI space.doi:10.1371/journal.pone.0006749.t002
Oddball during NREM Sleep
PLoS ONE | www.plosone.org 7 August 2009 | Volume 4 | Issue 8 | e6749
oddball paradigm, both for rare and deviant tones [36]. Amygdala
activation, however, is not prerequisite for target detection as
demonstrated from lesion studies in epileptic patients [45–47].
Rather, it was suggested that salient stimuli lead to a reflexive
orienting response with consequent preparative engagement of
additional brain regions, including the amygdala, for the case of
further sensory income [36]. During wakefulness, such an
orienting reflex has been shown to be associated with an increased
level of arousal, as reflected by EEG desynchronization, increased
skin conductance and modulation of heart rate [48]. During sleep,
autonomous arousal reaction may be suppressed in order to
maintain and consolidate sleep. Accordingly, our EEG analysis
during sleep did not reveal signs of such arousal reactions. Thus,
we interpret the NBR in the amygdala as a sleep specific response,
and submit that it reflects suppression of a reflexive orienting
responses to the non-alarming, but unpredictable rare tone,
supporting sleep protection by delimiting arousal reactions. We
did neither observe activation of the auditory pathway nor the
thalamus, in line with our previous work [26,27] and data shown
by Tanaka et al. in sleep stage 1 [25]. The opposed findings of
Portas and colleagues [22], who reported preserved activation of
the auditory cortex and thalamic regions during light NREM
sleep, may originate from the use of more salient, especially
personal stimuli such as the own names. Awakenings are highly
likely to occur upon such stimuli and have indeed been reported
by the authors for 30–50% of trials [22]. In addition, transient
arousals during fMRI data acquisition may have remained
undetected as EEG signals during scanning were not evaluated.
When segregating the rare tone with respect to appearance or
non-appearance of an evoked KCs as the brain’s prominent EEG
response upon external stimulation, we found activation in the
bilateral auditory cortex and the left middle and superior frontal
cortex, precuneus, posterior cingulate, bilateral superior temporal
cortex and the right hippocampus. As a whole, this network largely
overlapped with the response to a novel (task-irrelevant) stimulus
as compared to rare tones during wakefulness [36], with exception
of the cingulate cortex and the right hippocampus. As anticipated
by Sallinen [17], the sleeping brain may in fact be transiently more
responsive to sensory events preceding a KC than preceding a
non-KC response to a stimulus. The similarity of our results with
the novelty oddball paradigm suggests an orienting response, in
which the stimulus characteristics of the rare tone undergo a re-
evaluation during sleep. This view is supported by a recent study
reporting direct intrahippocampal ERP measurements in 16
epilepsy patients during a passive oddball paradigm. This study
revealed involvement of hippocampal and parahippocampal
structures in the preattentive processing of sound deviance during
wakefulness [49]. Since the hippocampal potentials were shown to
be reduced upon repetitive presentation of the rare tones, the
authors proposed that they may be regarded as a central marker of
an orienting response, facilitating the detection of sound deviance
when sound discrimination becomes more difficult. Hippocampal
and temporolateral activation as observed in our study may signify
an update of stimulus characteristics during sleep. In summary, the
general response to rare tones is reduced during sleep, however, a
transiently more responsive brain state appears to occur in
association with the generation of KC.
The precuneus, obviously playing a pivotal role in integrated
tasks, reduces its activity during sleep [50,51]. Thus, increased
activity in the precuneus (and cingulate cortex) in response to rare
tones eliciting KCs may be conceived as an additional signature of
intensified stimulus processing.
Furthermore, we only observed BOLD activation in the
superior frontocentral regions associated with KCs in a small
number of areas. Given that KCs are the strongest of any evoked
potentials recorded in humans [1], the finding that rareKC events
do not show a stronger correlate in the BOLD signal as compared
to rarew/oKC warrants further discussion. The strong topograph-
ical similarity of the NBR for both rareKC and rarew/oKC tones
suggests common responses to the stimuli at the level of fMRI as
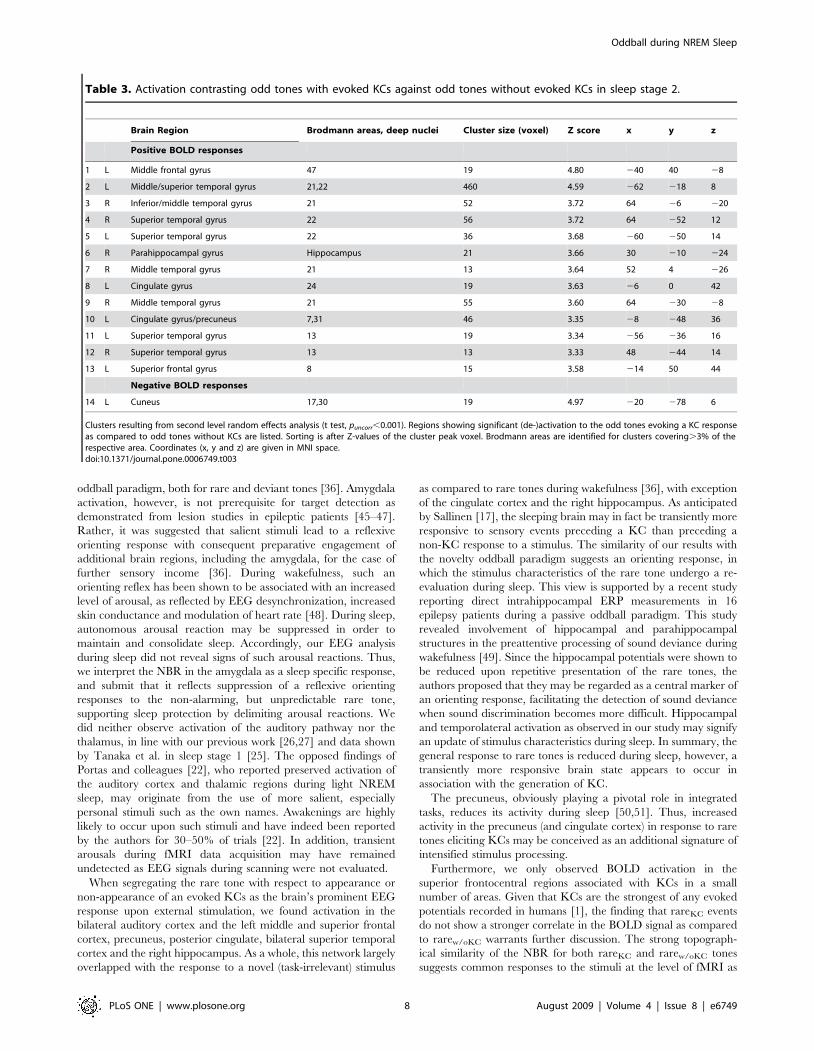
Table 3. Activation contrasting odd tones with evoked KCs against odd tones without evoked KCs in sleep stage 2.
Brain Region Brodmann areas, deep nuclei Cluster size (voxel) Z score x y z
Positive BOLD responses
1 L Middle frontal gyrus 47 19 4.80 240 40 28
2 L Middle/superior temporal gyrus 21,22 460 4.59 262 218 8
3 R Inferior/middle temporal gyrus 21 52 3.72 64 26 220
4 R Superior temporal gyrus 22 56 3.72 64 252 12
5 L Superior temporal gyrus 22 36 3.68 260 250 14
6 R Parahippocampal gyrus Hippocampus 21 3.66 30 210 224
7 R Middle temporal gyrus 21 13 3.64 52 4 226
8 L Cingulate gyrus 24 19 3.63 26 0 42
9 R Middle temporal gyrus 21 55 3.60 64 230 28
10 L Cingulate gyrus/precuneus 7,31 46 3.35 28 248 36
11 L Superior temporal gyrus 13 19 3.34 256 236 16
12 R Superior temporal gyrus 13 13 3.33 48 244 14
13 L Superior frontal gyrus 8 15 3.58 214 50 44
Negative BOLD responses
14 L Cuneus 17,30 19 4.97 220 278 6
Clusters resulting from second level random effects analysis (t test, puncorr,0.001). Regions showing significant (de-)activation to the odd tones evoking a KC responseas compared to odd tones without KCs are listed. Sorting is after Z-values of the cluster peak voxel. Brodmann areas are identified for clusters covering.3% of therespective area. Coordinates (x, y and z) are given in MNI space.doi:10.1371/journal.pone.0006749.t003
Oddball during NREM Sleep
PLoS ONE | www.plosone.org 8 August 2009 | Volume 4 | Issue 8 | e6749
e. g. reflected by the early N350 component with maximal values
over vertex regions [32]. Bastien and Campbell [52] discussed
whether evoked KCs are an all-or-none phenomenon: An external
stimulus either elicits a KC or it does not, as averaging trials not
showing an N550-P900 amplitude difference of at least 75 mV did
not reveal any evidence of a N550 deflection at all. It was
suggested that ’although the KC may occur in association with
other indices of a defensive response, defensive responses also
occur in the absence of the KC’ [52]. Sleep defensive responses
upon external stimulation as reflected by heart-rate acceleration
was reported by Church et al. [53] to be independent of the
occurrence of KCs [54]. This notion is now further supported by
the present combined fMRI/EEG measurements that revealed an
NBR response upon tone presentation, irrespective of the
appearance of an evoked KC.
The discrepancy of a small difference in NBR between rareKC
and rarew/oKC and a strong electrophysiological difference may
further be related to the degree of synchronicity of the firing of
cortical areas. While response to both types of rare tones may be
associated with comparable metabolic demands, the electrophys-
iological response may not mount to a surface KC in the case of
asynchronous firing. A recent computational study simulated KCs
in terms of a mean field cortical model [55]. The authors
interpreted the appearance of a KC as a momentary excursion of
the cortex from a stable low-firing state to an unstable sleep
specific high-firing state upon a small excitation. They observe a
critical threshold for external disturbances, above which KCs are
evoked, in accordance with the ‘all-or-none’ hypothesis. The
momentarily increased stimulus transmission and processing may
allow external stimuli to exceed this critical cortical threshold and
may eventually lead to initiation of an evoked KC. However, our
data suggest that the overall metabolic cerebral demand in regions
showing highest EEG deflection during KCs is not strongly altered
when the threshold for a KC is exceeded.
KCs have been postulated to have a diffuse cortical generator
and represent a sleep specific, but modality independent response.
This response does not depend on activation of the auditory
pathway in the case of acoustic stimulation, or activation of the
primary sensory pathway when elicited by inspiratory occlusion
[14]. Therefore, increased activation of task-specific auditory
pathways associated with evoked KC is unlikely to reflect the
neural representation of the KC itself. Future studies should test
this hypothesis by applying stimuli of different sensory modalities
during NREM sleep fMRI experiments. Another option may be to
target spontaneous KCs in undisturbed sleep without any external
stimulation. However, to observe truly spontaneous KCs is
technically demanding due to the noise during fMRI experiments.
Finally, our data only allow an indirect interpretation of the
functional significance of KCs. We found that a brain state in
which stimuli provoke an intensified brain activation (most closely
resembling active novelty processing) is prone to generation of
subsequent KCs. However, the passive oddball data collected
during wakefulness do not directly support this notion. Still, it
should be noted that the passive listening condition during
wakefulness and the ‘passive’ condition of the subject while falling
asleep and during established NREM sleep have categorically
different qualities: During wakefulness, the subject retains
awareness and can be instructed not to focus on deviant tones,
while during sleep conscious control as necessary to follow task
instruction cannot be maintained. Therefore, responses become
automated and independent of any instruction. As these
automated processes take over during sleep, external stimuli may
be sporadically (re-)evaluated with respect to the level of novelty or
deviation from the background. Our data show that rare tones
followed by a KC exhibit signatures of increased activity,
comparable with novelty processing as described by Kiehl et al.
[36] during wakefulness. However, since EEG analysis did not
reveal signs of arousal, we propose that the subsequently evoked
KCs may rather reflect maintainance and consolidation of sleep
than an arousal reaction.
The refractory period of KCs is roughly 10 seconds. Our design
using an ISI of 2 seconds was optimized to measure KCs evoked by
rare tones with a probability of 20%, thus roughly matching the
refractory period. We intentionally avoided longer ISIs due to
potential arousing effects of sparsely delivered tones. As a drawback
of our design, we did not collect a sufficient number of KCs evoked
by frequent tones, or spontaneous KCs, for fMRI analysis
comparing different types of KCs. Regarding activation changes
related to individual ERP components, the temporal resolution of
BOLD signal changes in the order of several seconds did not allow
to dissect the contribution of individual ERP components in our
sample. Even more, if N550 and P900 represent opposing up and
down states, the individual contributions may lead to a destructive
interference of BOLD signal changes on the time-scale of fMRI
measurements. Unfortunately, the limited number of KCs in our
data do not allow to dissect contributions of these two ERP
components. Further studies with larger numbers of KC events are
required to disentangle possible different functional brain states
associated with individual ERP components.
It has been shown earlier that the scanner noise leads to reduced
ERP amplitudes, prolonged reaction times and decreased hit rates
in active oddball paradigms [56,57]. Generally reduced ampli-
tudes in the electrophysiological measures during fMRI due the
main magnetic field [33] have been accounted for by lowering the
absolute amplitude threshold for identification of KCs during
sleep. Otherwise, the influence of the scanner sound was
considered to introduce similar reductions in ERP amplitudes
during both wakefulness and sleep, still allowing for comparison of
the respective ERP signals. However, our observations of rather
small P300 amplitude differences between rare and frequent tones
during wakefulness may in part be related to interference with the
fMRI background noise.
Due to reduced quality of fMRI data caused by susceptibility
artifacts in ventral frontal brain regions, we cannot fully exclude
that such artifacts might delimit detection of KC related activity in
ventral brain areas. However, as we observed significant activation
changes in other basal brain regions like amygdala and
hippocampus, a total loss of fMRI information in ventral frontal
regions seems unlikely.
In conclusion, our data indicate altered acoustic processing during
light NREM sleep in an oddball paradigm, showing strongly reduced
activity of the auditory system in response to rare tones. We interpret
a negative BOLD response in sensory motor areas and the amygdala
as a sleep defensive mechanism delimiting reflexive orienting
responses. Events followed by evoked KCs revealed increased
activation of the auditory system and hippocampal and temporal
structures probably reflecting increased responsiveness to the external
stimuli and an updating of stimulus characteristics. However, other
than expected, the strong electrophyiological signature of the K-
complexes in frontocentral areas was not paralleled by corresponding
BOLD increases. This dissociation between electrophysiological and
metabolic correlates of KCs argues for increased cortical synchroni-
zation without additional metabolic demand.
Supporting Information
Table S1 Activation contrasting odd tones evoking KCs vs odd
tones without evoked KC in sleep stage 2. Assumed stimulus
Oddball during NREM Sleep
PLoS ONE | www.plosone.org 9 August 2009 | Volume 4 | Issue 8 | e6749
duration 1500 ms. Clusters resulting from second level random
effects analysis (t test, puncorr,0.001) of the model assuming a event
duration of 1500 ms. Regions showing significant (de-)activation to
the odd tones evoking a KC response as compared to odd tones
without KCs are listed. Sorting is after Z- values of the cluster peak
voxel. Brodmann areas are identified for clusters covering.3% of
the respective area. Coordinates (x, y and z) are given in MNI space.
Found at: doi:10.1371/journal.pone.0006749.s001 (0.04 MB
DOC)
Figure S1 Mismatch negativity analysis. Subtraction waveform
of rare and frequent tone averages, as used for analysis of MMN,
measured at Pz. Green curve: wakefulness. Red and black curves:
sleep stage 2, separated according to responses without and with
evoked KCs, respectively. Position of the MMN in wakefulness is
indicated. Negative deflections at 100 ms during sleep may be
attributed to changes in N1 amplitude rather than occurance of a
MMN during sleep.
Found at: doi:10.1371/journal.pone.0006749.s002 (5.75 MB TIF)
Acknowledgments
We thank our volunteers for participation in the study. We owe our special
gratitude to Natalya Chechko and Christoph Schmidt for subjects’
screening, and Rosa Schirmer and Armin Mann for continuous technical
support. We are grateful to Victor Spoormaker for critical review of the
manuscript.
Author Contributions
Conceived and designed the experiments: MC RW PGS. Performed the
experiments: MC RW AS HP KA. Analyzed the data: MC RW AS HP
KA PGS. Wrote the paper: MC RW KA FH PGS.
References
1. Colrain IM, Campbell KB (2007) The use of evoked potentials in sleep research.Sleep Med Rev 11: 277–293.
2. Cote KA (2002) Probing awareness during sleep with the auditory odd-ball
paradigm. Int J Psychophysiol 46: 227–241.
3. Atienza M, Cantero JL, Escera C (2001) Auditory information processing during
human sleep as revealed by event-related brain potentials. Clin Neurophysiol112: 2031–2045.
4. Yang CM, Wu CS (2007) The effects of sleep stages and time of night on NREM
sleep ERPs. Int J Psychophysiol 63: 87–97.
5. Campbell KB, Colrain IM (2002) Event-related potential measures of the
inhibition of information processing: II. The sleep onset period.Int J Psychophysiol 46: 197–214.
6. Nittono H, Momose D, Hori T (2001) The vanishing point of the mismatch
negativity at sleep onset. Clin Neurophysiol 112: 732–739.
7. Ruby P, Caclin A, Boulet S, Delpuech C, Morlet D (2008) Odd soundprocessing in the sleeping brain. J Cogn Neurosci 20: 296–311.
8. Bastuji H, Garcia-Larrea L (1999) Evoked potentials as a tool for theinvestigation of human sleep. Sleep Med Rev 3: 23–45.
9. Crowley KE, Colrain IM (2004) A review of the evidence for P2 being an
independent component process: age, sleep and modality. Clin Neurophysiol115: 732–744.
10. Yang CM, Lo HS (2007) ERP evidence of enhanced excitatory and reducedinhibitory processes of auditory stimuli during sleep in patients with primary
insomnia. Sleep 30: 585–592.
11. Nicholas CL, Trinder J, Colrain IM (2002) Increased production of evoked andspontaneous K-complexes following a night of fragmented sleep. Sleep 25:
882–887.
12. Peszka J, Harsh J (2002) Effect of sleep deprivation on NREM sleep ERPs and
related activity at sleep onset. Int J Psychophysiol 46: 275–286.
13. Loomis AL, Harvey N, Hobart GA (1938) Distribution of disturbance patternsin the human electroencephalogram, with special reference to sleep.
J Neurophysiol 1: 413–430.
14. Colrain IM (2005) The K-complex: a 7-decade history. Sleep 28: 255–273.
15. Halasz P (2005) K-complex, a reactive EEG graphoelement of NREM sleep: an
old chap in a new garment. Sleep Med Rev 9: 391–412.
16. Halasz P (1998) Hierarchy of micro-arousals and the microstructure of sleep.Neurophysiol Clin 28: 461–475.
17. Sallinen M, Kaartinen J, Lyytinen H (1997) Precursors of the evoked K-complex
in event-related brain potentials in stage 2 sleep. Electroencephalogr Clin
Neurophysiol 102: 363–373.
18. De Gennaro L, Ferrara M, Bertini M (2000) The spontaneous K-complexduring stage 2 sleep: is it the ‘forerunner’ of delta waves? Neurosci Lett 291:
41–43.
19. Amzica F, Steriade M (1997) The K-complex: its slow (,1-Hz) rhythmicity and
relation to delta waves. Neurology 49: 952–959.
20. Halasz P, Bodizs R, Terzano M, Parrino L (2005) Functional MRI during sleep:arousal and anti-arousal responses. Sleep Med 6: 183.
21. Amzica F, Steriade M (2002) The functional significance of K-complexes. Sleep
Med Rev 6: 139–149.
22. Portas CM, Krakow K, Allen P, Josephs O, Armony JL, et al. (2000) Auditory
processing across the sleep-wake cycle: simultaneous EEG and fMRI monitoringin humans. Neuron 28: 991–999.
23. Redcay E, Kennedy DP, Courchesne E (2007) fMRI during natural sleep as a
method to study brain function during early childhood. Neuroimage 38:696–707.
24. Wilke M, Holland SK, Ball WS, Jr (2003) Language processing during naturalsleep in a 6-year-old boy, as assessed with functional MR imaging. AJNR
Am J Neuroradiol 24: 42–44.
25. Tanaka H, Fujita N, Takanashi M, Hirabuki N, Yoshimura H, et al. (2003)Effect of stage 1 sleep on auditory cortex during pure tone stimulation:
evaluation by functional magnetic resonance imaging with simultaneous EEG
monitoring. AJNR Am J Neuroradiol 24: 1982–1988.
26. Czisch M, Wetter TC, Kaufmann C, Pollmacher T, Holsboer F, et al. (2002)
Altered processing of acoustic stimuli during sleep: reduced auditory activationand visual deactivation detected by a combined fMRI/EEG study. NeuroImage
16: 251–258.
27. Czisch M, Wehrle R, Kaufmann C, Wetter TC, Holsboer F, et al. (2004)
Functional MRI during sleep: BOLD signal decreases and their electrophysi-ological correlates. Eur J Neurosci 20: 566–574.
28. Born AP, Law I, Lund TE, Rostrup E, Hanson LG, et al. (2002) Corticaldeactivation induced by visual stimulation in human slow-wave sleep. NeuroImage
17: 1325–1335.
29. Wittchen HU, Lachner G, Wunderlich U, Pfister H (1998) Test-retest reliability of
the computerized DSM-IV version of the Munich-Composite InternationalDiagnostic Interview (M-CIDI). Soc Psychiatry Psychiatr Epidemiol 33: 568–578.
30. Horne JA, Ostberg O (1976) A self-assessment questionnaire to determine
morningness-eveningness in human circadian rhythms. Int J Chronobiol 4:
97–110.
31. Mandelkow H, Halder P, Boesiger P, Brandeis D (2006) Synchronizationfacilitates removal of MRI artefacts from concurrent EEG recordings and
increases usable bandwidth. Neuroimage 32: 1120–1126.
32. Colrain IM, Webster KE, Hirst G, Campbell KB (2000) The roles of vertex
sharp waves and K-complexes in the generation of N300 in auditory andrespiratory-related evoked potentials during early stage 2 NREM sleep. Sleep 23:
97–106.
33. Mulert C, Jager L, Schmitt R, Bussfeld P, Pogarell O, et al. (2004) Integration of
fMRI and simultaneous EEG: towards a comprehensive understanding oflocalization and time-course of brain activity in target detection. NeuroImage
22: 83–94.
34. Sabri M, Campbell KB (2005) Is the failure to detect stimulus deviance during
sleep due to a rapid fading of sensory memory or a degradation of stimulusencoding? J Sleep Res 14: 113–122.
35. Rechtschaffen A, Kales A (1968) A manual of standardized terminology,techniques and scoring system for sleep stages of human subjects. Washington D
C: NIH publication no 204.
36. Kiehl KA, Stevens MC, Laurens KR, Pearlson G, Calhoun VD, et al. (2005) An
adaptive reflexive processing model of neurocognitive function: supportingevidence from a large scale (n = 100) fMRI study of an auditory oddball task.
Neuroimage 25: 899–915.
37. Tse CY, Penney TB (2008) On the functional role of temporal and frontal cortex
activation in passive detection of auditory deviance. Neuroimage 41: 1462–1470.
38. Sabri M, Kareken DA, Dzemidzic M, Lowe MJ, Melara RD (2004) Neural
correlates of auditory sensory memory and automatic change detection.Neuroimage 21: 69–74.
39. Doeller CF, Opitz B, Mecklinger A, Krick C, Reith W, et al. (2003) Prefrontal
cortex involvement in preattentive auditory deviance detection: neuroimaging
and electrophysiological evidence. Neuroimage 20: 1270–1282.
40. Hull J, Harsh J (2001) P300 and sleep-related positive waveforms (P220, P450,and P900) have different determinants. J Sleep Res 10: 9–17.
41. Atienza M, Cantero JL, Dominguez-Marin E (2002) Mismatch negativity(MMN): an objective measure of sensory memory and long-lasting memories
during sleep. Int J Psychophysiol 46: 215–225.
42. LeDoux J (2003) The emotional brain, fear, and the amygdala. Cell Mol
Neurobiol 23: 727–738.
43. Sabri M, Kareken DA, Dzemidzic M, Lowe MJ, Melara RD (2004) Neuralcorrelates of auditory sensory memory and automatic change detection.
Neuroimage 21: 69–74.
44. Herry C, Bach DR, Esposito F, Di Salle F, Perrig WJ, et al. (2007) Processing of
temporal unpredictability in human and animal amygdala. J Neurosci 27:5958–5966.
Oddball during NREM Sleep
PLoS ONE | www.plosone.org 10 August 2009 | Volume 4 | Issue 8 | e6749
45. Johnson R, Jr (1988) Scalp-recorded P300 activity in patients following unilateral
temporal lobectomy. Brain 111 (Pt 6): 1517–1529.46. Johnson R, Jr (1989) Auditory and visual P300s in temporal lobectomy patients:
evidence for modality-dependent generators. Psychophysiology 26: 633–650.
47. Hirayasu Y, Ohta H, Fukao K, Ogura C, Mukawa J (1995) Transient P300abnormality of event-related potentials following unilateral temporal lobectomy.
Psychiatry Clin Neurosci 49: 223–226.48. Sokolov EN (1963) Higher nervous functions; the orienting reflex. Annu Rev
Physiol 25: 545–580.
49. Rosburg T, Trautner P, Ludowig E, Schaller C, Kurthen M, et al. (2007)Hippocampal event-related potentials to tone duration deviance in a passive
oddball paradigm in humans. Neuroimage 37: 274–281.50. Cavanna AE, Trimble MR (2006) The precuneus: a review of its functional
anatomy and behavioural correlates. Brain 129: 564–583.51. Kaufmann C, Wehrle R, Wetter TC, Holsboer F, Auer DP, et al. (2006) Brain
activation and hypothalamic functional connectivity during human non-rapid
eye movement sleep: an EEG/fMRI study. Brain 129: 655–667.
52. Bastien C, Campbell K (1992) The evoked K-complex: all-or-none phenom-
enon? Sleep 15: 236–245.53. Church MW, Johnson LC, Seales DM (1978) Evoked K-complexes and
cardiovascular responses to spindle-synchronous and spindle-asynchronous
stimulus clicks during NREM sleep. Electroencephalogr Clin Neurophysiol 45:443–453.
54. Johnson LC, Karpan WE (1968) Autonomic correlates of the spontaneous K-complex. Psychophysiology 4: 444–452.
55. Wilson MT, Steyn-Ross DA, Sleigh JW, Steyn-Ross ML, Wilcocks LC, et al.
(2006) The K-complex and slow oscillation in terms of a mean-field corticalmodel. J Comput Neurosci 21: 243–257.
56. Novitski N, Maess B, Tervaniemi M (2006) Frequency specific impairment ofautomatic pitch change detection by fMRI acoustic noise: an MEG study.
J Neurosci Methods 155: 149–159.57. Novitski N, Tervaniemi M, Huotilainen M, Naatanen R (2004) Frequency
discrimination at different frequency levels as indexed by electrophysiological
and behavioral measures. Brain Res Cogn Brain Res 20: 26–36.
Oddball during NREM Sleep
PLoS ONE | www.plosone.org 11 August 2009 | Volume 4 | Issue 8 | e6749