short and medium latency muscle responses evoked by electrical vestibular stimulation are a...
TRANSCRIPT
RESEARCH ARTICLE
Short and medium latency muscle responses evokedby electrical vestibular stimulation are a composite of allstimulus frequencies
Christopher J. Dakin • John Timothy Inglis •
Jean-Sebastien Blouin
Received: 29 October 2010 / Accepted: 10 January 2011 / Published online: 28 January 2011
� Springer-Verlag 2011
Abstract Electrical vestibular stimulation produces
biphasic responses in muscles maintaining balance. The
two components of these muscle responses (termed the
short latency and medium latency components) are
believed to be independent and elicited by vestibular
stimuli of different frequencies. We tested these hypotheses
by determining (a) if frequency-specific stimulation pro-
tocols could evoke independently the short and medium
latency responses and (b) whether these two components
are triggered by distinct brain regions with a fixed time
delay, interacting around 10 Hz. First, subjects were pro-
vided 10–25 Hz, 0–10 Hz, and 0–25 Hz vestibular stimuli
to selectively modulate the short latency, medium latency,
or both components of the response; and second, they were
provided twenty sinusoidal stimuli from 1 to 20 Hz with a
0–20 Hz control trial, designed to determine whether an
interaction between the short and medium latency respon-
ses occurs at a specific stimulation frequency. Both the
0–10 Hz and 10–25 Hz vestibular stimuli elicited multi-
phasic waveforms, suggesting the short and medium
latency components were not modulated independently by
the frequency-specific stimuli. Sinusoidal vestibular stimuli
evoked responses at the stimulated frequency but no evi-
dence of a reflex component interaction was observed.
Instead, summation of the responses evoked by each of the
sinusoidal stimuli resembled the biphasic response to broad
bandwidth stimuli. Due to the lack of interaction and linear
contribution of all stimulus frequencies to both the short
and medium latency responses, the present results support
the use of broad bandwidth electrical vestibular signal for
physiological or clinical testing.
Keywords Vestibular � Stochastic � Bandwidth � Balance
Introduction
Galvanic and stochastic vestibular stimulation (GVS and
SVS) entail the transmastoidal percutaneous application of a
small electric current, which is used to probe vestibular
function (GVS: Coats 1973; Nashner and Wolfson 1974; for
review see Fitzpatrick and Day 2004; SVS: Fitzpatrick et al.
1996; Dakin et al. 2007). The applied electric current
modulates the firing rate of the underlying vestibular affer-
ents producing responses in muscles active in the mainte-
nance of balance. In lower limb muscles, these responses
exhibit a biphasic pattern with two opposing peaks, termed
short (50–70 ms) and medium (100–120 ms) latency com-
ponents (Britton et al. 1993; Dakin et al. 2007, 2010; Fitz-
patrick and Day 2004; Fitzpatrick et al. 1994; Iles and Pisini
1992; Lee Son et al. 2008; Nashner and Wolfson 1974;
Reynolds 2010). While the exact physiological mechanisms
underlying these two peaks remain unclear, results from
C. J. Dakin � J. T. Inglis � J.-S. Blouin (&)
School of Human Kinetics, University of British Columbia,
210-6081 University Boul., Vancouver, BC V6T1Z1, Canada
e-mail: [email protected]
C. J. Dakin
e-mail: [email protected]
J. T. Inglis
e-mail: [email protected]
J. T. Inglis � J.-S. Blouin
Brain Research Center, University of British Columbia,
Vancouver, BC, Canada
J. T. Inglis
International Collaboration on Repair Discoveries,
University of British Columbia, Vancouver, BC, Canada
123
Exp Brain Res (2011) 209:345–354
DOI 10.1007/s00221-011-2549-7
previous studies indicate they may derive from independent
sources (Britton et al. 1993; Cathers et al. 2005; Dakin et al.
2007). Two main hypotheses have been formulated to
account for the biphasic vestibulo-motor response: the short
and medium latency components may originate from two
distinct regions in the brain (the vestibulo and reticulospinal
systems; see Britton et al. 1993) or from the stimulation of
afferents from the otoliths and semicircular canals (Cathers
et al. 2005). Recently, we proposed these two components
may be preferentially elicited by specific vestibular stimulus
frequency bandwidths (Dakin et al. 2007), which could
provide a simple and effective way to assess the function and
physiological relevance of the short and medium latency
components in humans. In the present experiment, we
developed specific electrical stimuli to determine whether
altering the frequency content of an electrical vestibular
stimulus could prove useful in dissociating the two vestib-
ular response components.
The two components of the biphasic vestibulo-myogenic
response may receive independent contributions from
specific stimulus frequency bandwidths, as suggested by
two regions (2–10 Hz and 11–20 Hz) of stronger coupling
between SVS and muscle activity (Dakin et al. 2007). The
time lags estimated by the slope of the SVS muscle phase
function within these two bandwidths indicate that the
2–10 Hz bandwidth contributes primarily to the medium
latency component and the 11–20 Hz bandwidth to the
short latency component. These findings predict that an
SVS stimulus within either the 0–10 Hz or 10–20 Hz
bandwidth should modulate selectively either the short
(10–20 Hz) or medium latency (0–10 Hz) peak of the
vestibulo-myogenic response. Selective modulation of
either response component would provide further support
for the independence of the two components of the ves-
tibular response. Therefore, the first aim of the current
study was to determine whether distinct stimulus frequency
bandwidths contribute to the individual peaks of the
biphasic muscle response. We tested this hypothesis by
designing stimuli within each of the two previously iden-
tified bandwidths in order to exclusively modulate the short
(10–25 Hz stimulus) or medium latency (0–10 Hz stimu-
lus) lower limb vestibulo-myogenic responses. We
hypothesized that the short latency component of the
muscle response would be triggered by the 10–25 Hz
vestibular signals and the medium latency component by
the 0–10 Hz signals.
The second aim of this study was to test the indepen-
dence of the two components of the vestibulo-myogenic
response by determining whether activation of distinct
brain regions with a fixed central delay, as proposed by
Britton et al. (1993), could account for the presence of a
biphasic vestibulo-myogenic response. Assuming linear
transmission of reflexes, a consequence of examining a
system exhibiting two distinct reflexive responses triggered
by brain regions with a fixed delay is that the two reflex
components will exhibit a temporal overlap (described as
reflex component interaction) at specific frequencies of
stimulation. Specifically, the interaction of these reflex
components will depend on the time delay that exists
between these components. Matthews (1993) used this
rationale to examine the components of the human stretch
reflex, identifying perturbation frequencies (around 20 Hz)
for the wrist muscles at which the short and long latency
components of the stretch reflex exhibit a temporal overlap.
This interaction between short and long latency stretch
reflex components was demonstrated in two ways: (a) as
abrupt changes in the phase frequency relationship between
sinusoidal stimuli and associated electromyographic
response and (b) as modulation of electromyographic
activity at a frequency other than at the stimulation fre-
quency. A similar interaction between the two vestibular
response components may occur at specific frequencies of
stimulation if the vestibulo-myogenic response originates
from two independent central sources exhibiting a fixed
delay between them (as proposed by Britton et al. 1993).
For example, SVS–muscle coherence decreases at 10 Hz
and exhibits a small inflection in phase at this frequency
(Dakin et al. 2007), potentially reflecting an interaction
between the short and medium latency vestibular response.
The approximate 50 ms delay between the short and
medium latency response components in the leg muscles
(Britton et al. 1993) could be produced by two inputs to the
motor neuron pool that are out of phase, resulting in
destructive interference of the response to a 10 Hz ves-
tibular stimulus. To test this second hypothesis, subjects
were exposed to a series of sinusoidal stimuli (1–20 Hz)
from which we examined the stimulus–EMG correlations
and phase frequency function on a frequency by frequency
basis. We hypothesized that, for vestibular stimuli around
10 Hz, an interaction between the short and medium
latency response components would be observed, yielding
an abrupt shift in phase of the stimulus—EMG phase fre-
quency function as well as EMG modulation at frequencies
other than the stimulus frequency.
Methods
Subjects
Twelve healthy subjects (7 men, 5 women) between the
ages of 20 and 34 years, with no known history of neu-
rological disease or injury participated in this study. The
experimental protocol was explained to each subject and
their written, informed consent was obtained. All proce-
dures used in this study conformed to the standards of the
346 Exp Brain Res (2011) 209:345–354
123
Declaration of Helsinki and were approved by the Uni-
versity of British Columbia’s clinical research ethics
board.
Vestibular stimuli
Vestibular stimulation was delivered using a binaural
bipolar electrode configuration. Carbon rubber electrodes
(9 cm2), coated with Spectra 360 electrode gel (Parker
Laboratories, Fairfield, USA), were secured over partici-
pants’ mastoid processes with an elastic headband. Test-
ing was performed in two separate experimental sessions
(see below). Vestibular stimuli were generated on a PC
computer using Labview software (National Instruments,
Austin, USA) and were sent directly to a constant current
isolation unit (Model 2200 Analog Stimulus Isolator: AM
Systems, Carlsborg, WA) via a multifunction data
acquisition board (PXI-6289, National Instruments, Aus-
tin, USA). The 0–10 Hz, 10–25 Hz, and 0–25 Hz sto-
chastic signals were delivered as two 105 s trials that
were normalized to provide similar amplitude at each
frequency component, resulting in different RMS ampli-
tudes for each bandwidth stimuli: 0.65 mA (0–10 Hz),
0.73 mA (10–25 Hz), and 0.98 mA (0–25 Hz). Frequency
normalization of the stimuli ensured equal contribution
for each frequency within the stimulus. Sinusoidal stimuli,
on the other hand, had amplitudes of ±2 mA and were
90 s in length, while the comparison 0–20 Hz stochastic
stimuli were also 90 s in length but ±4 mA in amplitude.
The sinusoidal stimuli were provided with amplitudes of
±2 mA to ensure adequate responses at all frequencies
but also small enough to limit the uncomfortable effects
of the vestibular stimulus. The 0–20 Hz stochastic stimuli
control trial was provided with an amplitude of ±4 mA to
ensure an adequate response magnitude for comparison
with the average of the sinusoidal stimuli (Dakin et al.
2007).
Testing protocol
During each testing session, participants were required to
stand with their feet 2–3 cm apart (as measured at the
medial malleoli). For each trial, participants were asked to
keep their arms at their sides, stand relaxed, and keep their
head turned to the right and eyes level, parallel to the floor.
To maintain head position, participants were asked to focus
on a target to the right of them. By maintaining this head
position, the postural response to the vestibular stimulus
was primarily aligned to the anterior–posterior directions,
along the line of action of the left gastrocnemius (Cathers
et al. 2005; Day and Fitzpatrick 2005; Lund and Broberg
1983). Electromyography (EMG) was collected for the left
medial gastrocnemius as vestibular-evoked muscle
responses are larger in the leg opposite to the direction the
head is turned (Britton et al. 1993; Dakin et al. 2007).
To test our first hypothesis, ten subjects were exposed to
three vestibular stimuli: a 0–10 Hz stimulus to modulate
preferentially the medium latency response, a 10–25 Hz
stimulus to modulate the short latency vestibular-evoked
response, and a 0–25 Hz stimulus as a control. The bandwidths
of the 0–10 Hz and 10–25 Hz stimuli were chosen based on
the frequency range identified by the two slopes of the phase
estimate described previously (Dakin et al. 2007). Participants
were provided a total of six trials: two trials for each of the
three stimulus bandwidths. Rest periods were provided at the
request of the participant to avoid any sign of fatigue.
To test our second hypothesis, five participants
(including two new participants) were provided twenty
sinusoidal stimuli spanning 1–20 Hz and a 0–20 Hz SVS
comparison control trial. Participants were tested for a total
of twenty one trials which were collected on a separate day
from the first experimental session. To reduce the number
of vestibular stimuli for participants, we limited the sinu-
soidal stimuli to the 1–20 Hz bandwidth since SVS–muscle
coherence is largest in this region (Dakin et al. 2007, 2010)
and it encompasses the frequencies at which an interaction
between reflex components may occur (*10 Hz).
Data collection and analysis
EMG was amplified (Gain 95,000–20,000; Grass P511,
Grass–Telefactor, West Warwick, USA) and band-pass
filtered (30–1,000 Hz) prior to being digitized at 5,000 Hz
for the stochastic stimuli and 8,192 Hz for the sinusoidal
stimuli and associated 0–20-Hz control trial. EMG was
sampled at 8,192 Hz for the sinusoids to allow Fast Fourier
Transform (FFT) windows of a power of two (8,192
points). Using this sampling frequency and FFT window
length, frequency values occur at each integer frequency,
congruent with the sinusoidal stimuli that were delivered at
integer frequencies. SVS trials within each testing session
were time-locked to SVS onset and concatenated within
each condition for each participant. The sinusoidal stimuli
were delivered as a single trial and therefore within par-
ticipant concatenation was not necessary. EMG data were
full-wave rectified, concatenated within subjects, and
concatenated across all subjects. Concatenated data were
then used to estimate cross-covariance and phase functions
between SVS (or sinusoidal stimuli) signal and EMG. For
statistical analysis, dependent variables were extracted
from the cross-covariance and phase functions estimated
using concatenated data within participants, whereas the
functions estimated using concatenated data across all
participants were used for illustrative purposes only.
Within subject cross-covariance and phase estimates pro-
vided timing and amplitude information regarding the
Exp Brain Res (2011) 209:345–354 347
123
time-domain characteristics of the identified coherent fre-
quencies (Dakin et al. 2007; Rosenberg et al. 1989).
Cross-covariance functions and phase estimates were
calculated using a Matlab script based on the method
described by Rosenberg and colleagues (Rosenberg et al.
1989; Halliday et al. 1995). SVS–EMG cross-covariance
functions were analyzed with resolutions of 0.076 Hz
(13.1 s/segment) to identify the low frequency contribu-
tions. Sinusoidal data were analyzed with a resolution of
1 Hz (1 s/segment) to correspond to the frequency content
of the sinusoidal stimuli which were at integer frequencies.
By convention, anode right/cathode left currents are rep-
resented as a positive vestibular signal. Hence, a positive
cross-covariance function indicates that anode right/cath-
ode left currents induced muscle facilitation. The local
maxima and minima in the muscle responses were esti-
mated from the cross-covariance functions computed from
the data concatenated for individual subjects.
To address our first hypothesis, the polarity and timing
of the peaks (and troughs) obtained from the cross-
covariance function for the 0–10 Hz and 10–25 Hz band-
widths were compared to those obtained following the
broad bandwidth (0–25 Hz) vestibular signals. This com-
parison was made to determine whether a single compo-
nent of the biphasic muscle response was triggered by the
narrow bandwidth stimuli. Similarity between the 0–10 Hz
and 0–25 Hz covariance functions were assessed using
paired t-tests (statistical significance was set at P = 0.05).
To address our second hypothesis, phase estimates were
calculated for both the sinusoidal stimuli and the 0–20 Hz
stochastic control stimuli. The phase estimates for the
sinusoidal stimuli were extracted at each stimulus fre-
quency, concatenated across frequencies, and realigned by
values of 2p using the 1 Hz trial as a reference to obtain a
continuous phase estimate. For illustrative purposes, the
phase values obtained for the 0–20 Hz stochastic control
trials are displayed as a continuous function of frequency
(unwrapped) to provide an uninterrupted slope. As a sec-
ondary measure, we examined changes in EMG power to
the sinusoidal stimuli. Similarly to Matthews (1993), if the
two reflex components interact, it should be apparent as an
increase in EMG power at frequencies other than the
stimulus frequencies.
Results
Do 0–10 Hz and 10–25 Hz vestibular stimuli contribute
independently to the short and medium latency
components of the vestibulo-myogenic response?
The time-domain correlations between SVS and left medial
gastrocnemius EMG revealed that the 0–10 Hz and
10–25 Hz bandwidth stimuli contribute to the shape and
timing of both components of the vestibulo-myogenic
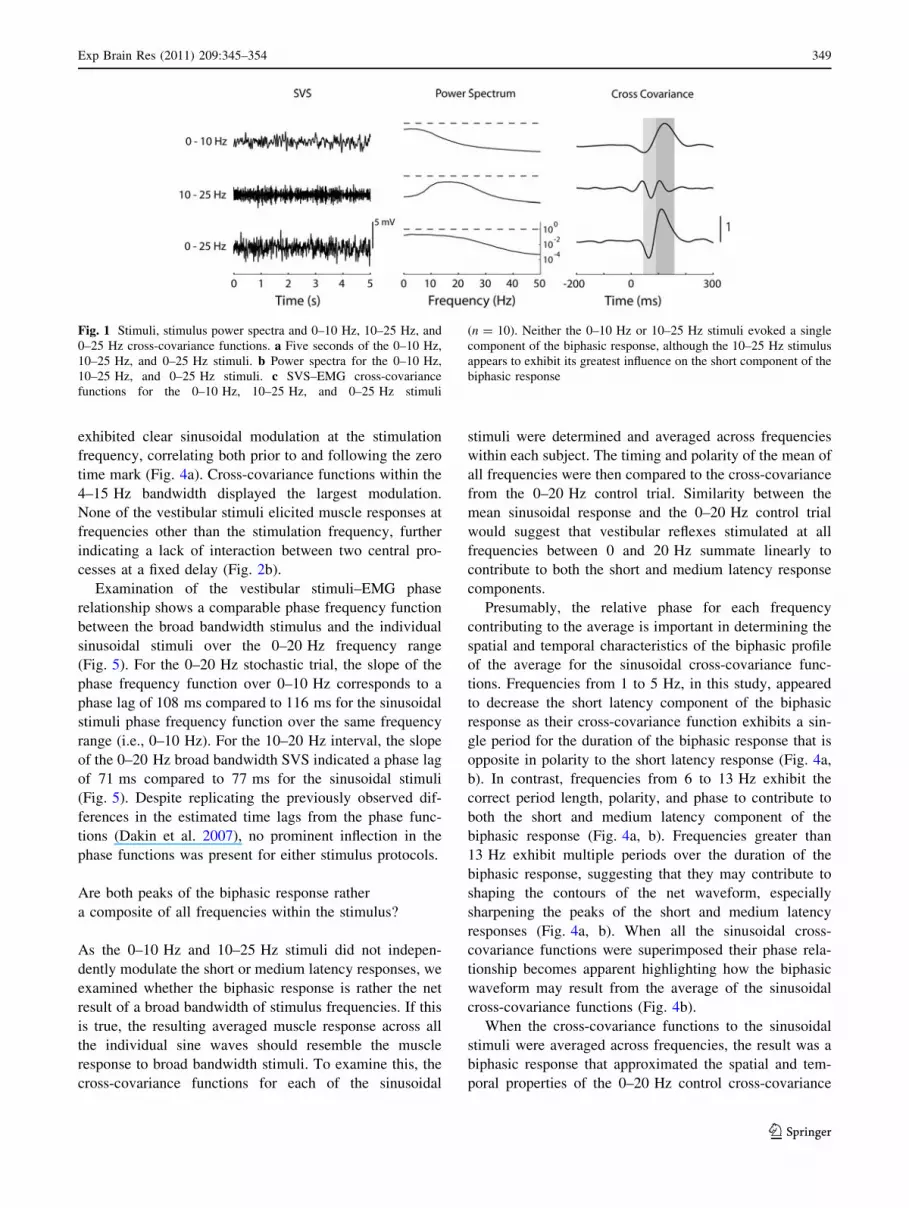
response. The EMG–SVS cross-covariance obtained for the
0–10 Hz bandwidth exhibited spatial properties similar to
those obtained for the 0–25 Hz vestibular stimuli, with
both stimuli eliciting biphasic responses (Fig. 1). The
timing of the two peaks, however, differed between stimuli.
The short latency component of the 0–10 Hz cross-
covariance occurred earlier than the corresponding peak for
the 0–25 Hz control (50 ± 18 vs. 65 ± 6 ms), while the
medium latency component of the 0–10 Hz response was
later than the medium latency component of 0–25 Hz
control (127 ± 18 vs. 115 ± 14 ms). This resulted in a
longer period between the short latency peak and medium
latency peak for the 0–10 Hz stimuli compared to the
0–25 Hz stimuli (77 ± 6 vs. 50 ± 13 ms; t(10) = 8.61,
P \ 0.05). On the other hand, the cross-covariance for the
10–25 Hz vestibular stimuli exhibited a triphasic response
and was therefore not compared to the broad bandwidth
responses (42 ± 7, 73 ± 5 and 106 ± 6 ms). The spatial
and temporal characteristics of the second and third peaks
of the triphasic response triggered by 10–25 Hz stimuli
appear to contribute mainly to the short and medium
latency components of the muscle response observed fol-
lowing 0–25 Hz stimuli (Fig. 1). Overall, neither the
0–10 Hz or 10–25 Hz stimuli independently contributed to
short or medium latency component of the biphasic muscle
response.
Are the two components of the vestibulo-myogenic
response caused by a fixed central delay?
To test our second hypothesis, sinusoidal stimuli with
frequencies ranging from 1 to 20 Hz were provided. We
examined the phase between the muscle responses and
vestibular stimuli as well as EMG power for indications of
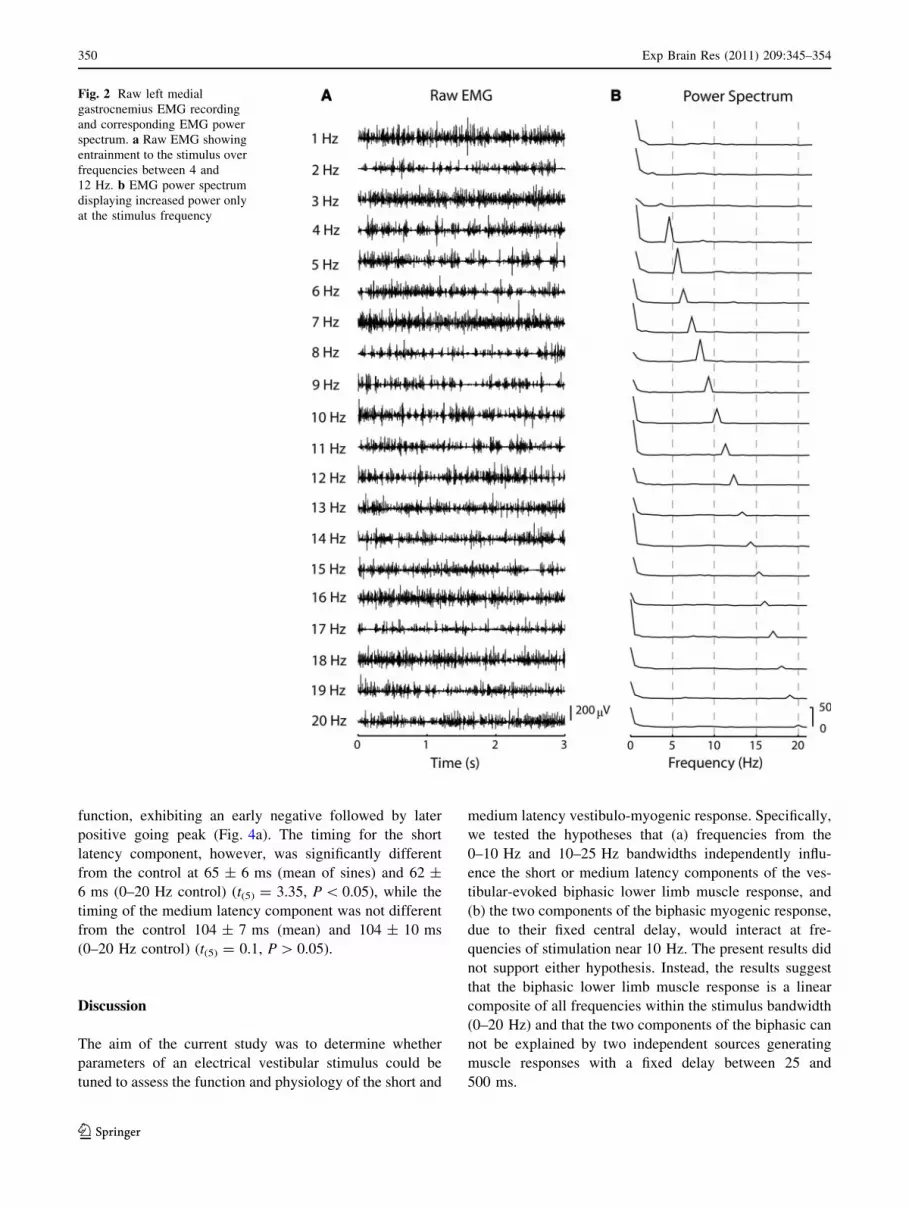
interactions in the vestibular-evoked muscle responses. All
stimulus frequencies yielded increases in EMG power
isolated to the stimulus frequency and not multiple fre-
quencies as would be suggested by an interaction (Fig. 2b).
However, stimulus frequencies between 4 and 12 Hz
exhibited stronger entrainment of lower limb EMG than
stimulus frequencies outside of this bandwidth (Figs. 2, 3).
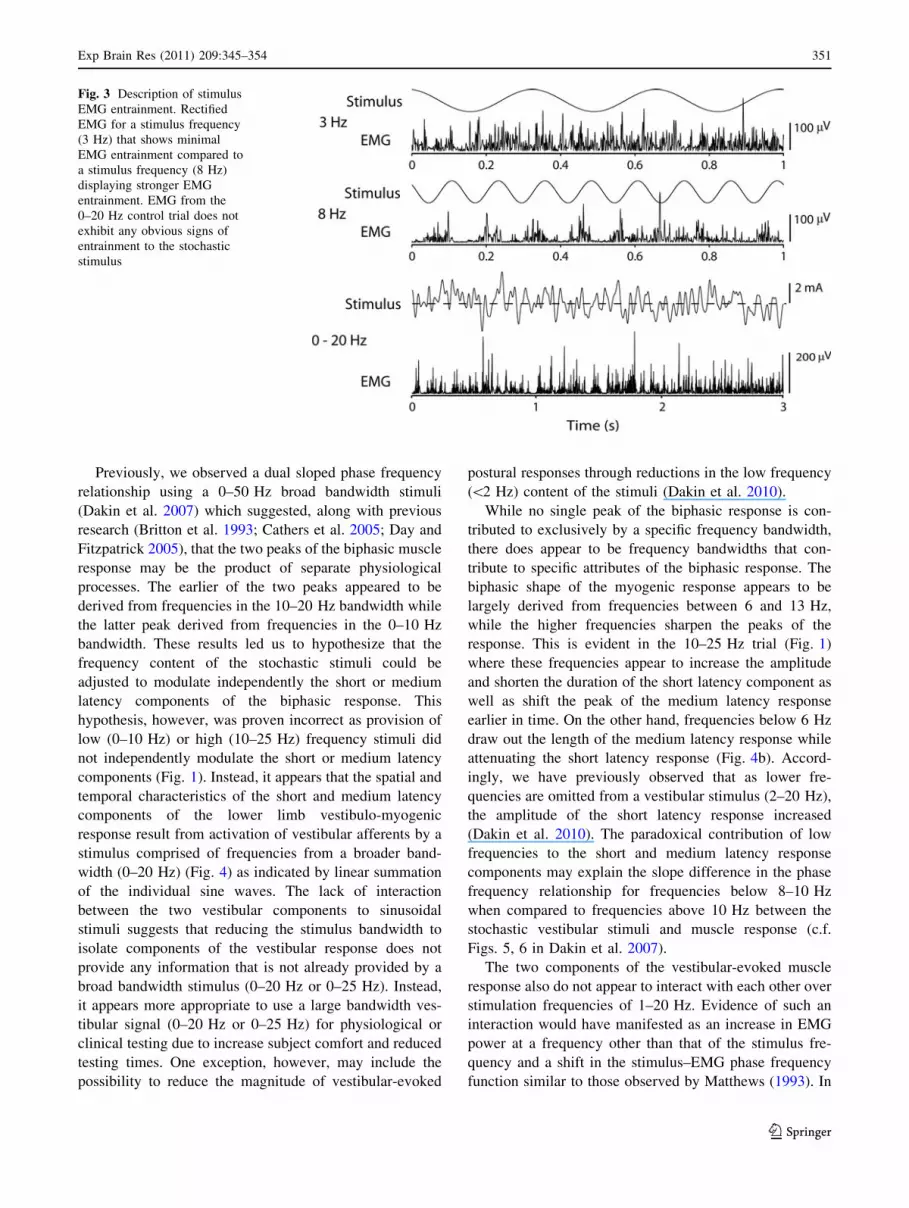
For stimulus frequencies exhibiting obvious entrainment,
the association between the vestibular stimulus and the
muscle response was detectable in the raw data (Fig. 3): an
anode right/cathode left vestibular stimulus was associated
with increased muscle activity about 90–100 ms later,
while anode left/cathode right currents yielded a decrease
(or absence) in gastrocnemius muscle activity with a sim-
ilar delay. Similar entrainment was not evident in the
0–20 Hz stochastic trials (Fig. 3). All cross-covariance for
the 1–20 Hz sinusoidal stimuli and associated EMG
348 Exp Brain Res (2011) 209:345–354
123
exhibited clear sinusoidal modulation at the stimulation
frequency, correlating both prior to and following the zero
time mark (Fig. 4a). Cross-covariance functions within the
4–15 Hz bandwidth displayed the largest modulation.
None of the vestibular stimuli elicited muscle responses at
frequencies other than the stimulation frequency, further
indicating a lack of interaction between two central pro-
cesses at a fixed delay (Fig. 2b).
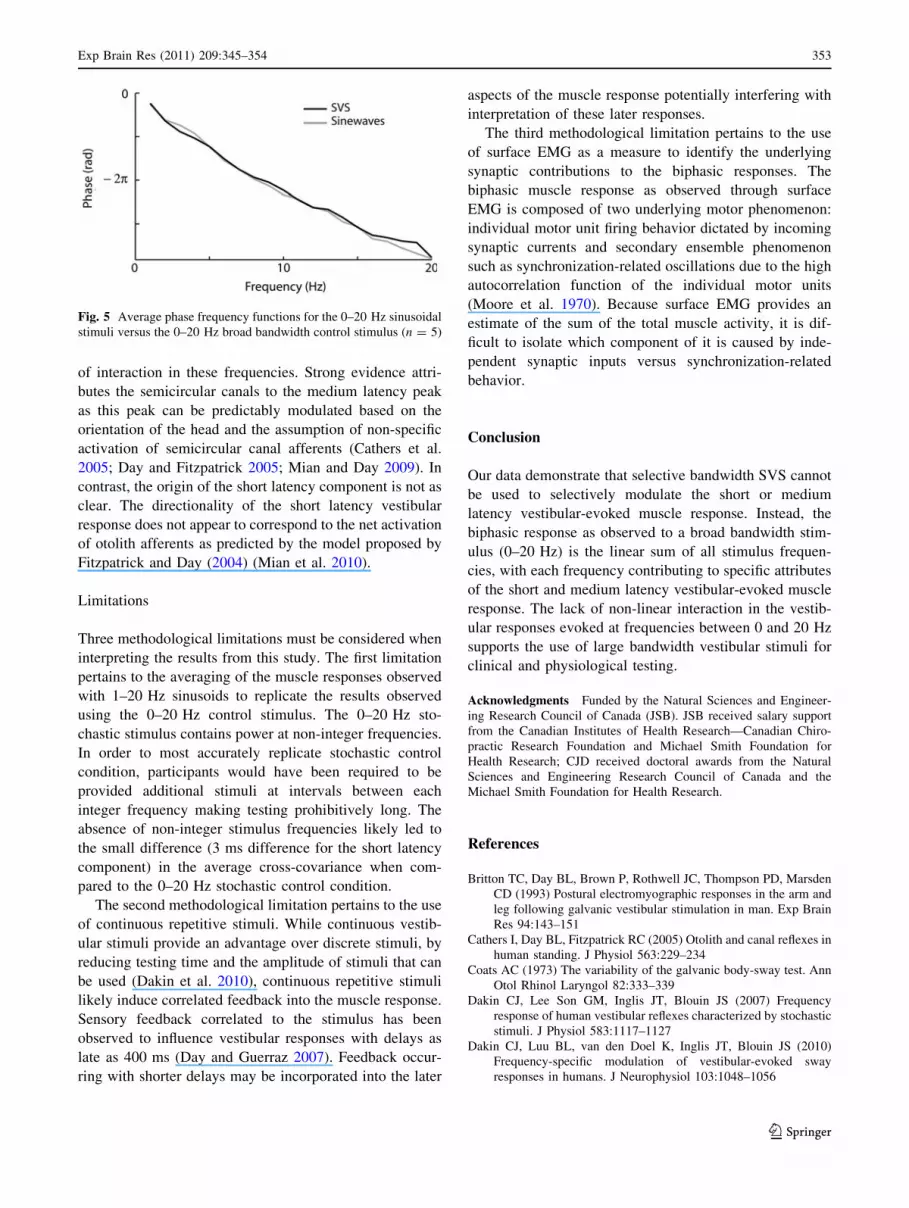
Examination of the vestibular stimuli–EMG phase
relationship shows a comparable phase frequency function
between the broad bandwidth stimulus and the individual
sinusoidal stimuli over the 0–20 Hz frequency range
(Fig. 5). For the 0–20 Hz stochastic trial, the slope of the
phase frequency function over 0–10 Hz corresponds to a
phase lag of 108 ms compared to 116 ms for the sinusoidal
stimuli phase frequency function over the same frequency
range (i.e., 0–10 Hz). For the 10–20 Hz interval, the slope
of the 0–20 Hz broad bandwidth SVS indicated a phase lag
of 71 ms compared to 77 ms for the sinusoidal stimuli
(Fig. 5). Despite replicating the previously observed dif-
ferences in the estimated time lags from the phase func-
tions (Dakin et al. 2007), no prominent inflection in the
phase functions was present for either stimulus protocols.
Are both peaks of the biphasic response rather
a composite of all frequencies within the stimulus?
As the 0–10 Hz and 10–25 Hz stimuli did not indepen-
dently modulate the short or medium latency responses, we
examined whether the biphasic response is rather the net
result of a broad bandwidth of stimulus frequencies. If this
is true, the resulting averaged muscle response across all
the individual sine waves should resemble the muscle
response to broad bandwidth stimuli. To examine this, the
cross-covariance functions for each of the sinusoidal
stimuli were determined and averaged across frequencies
within each subject. The timing and polarity of the mean of
all frequencies were then compared to the cross-covariance
from the 0–20 Hz control trial. Similarity between the
mean sinusoidal response and the 0–20 Hz control trial
would suggest that vestibular reflexes stimulated at all
frequencies between 0 and 20 Hz summate linearly to
contribute to both the short and medium latency response
components.
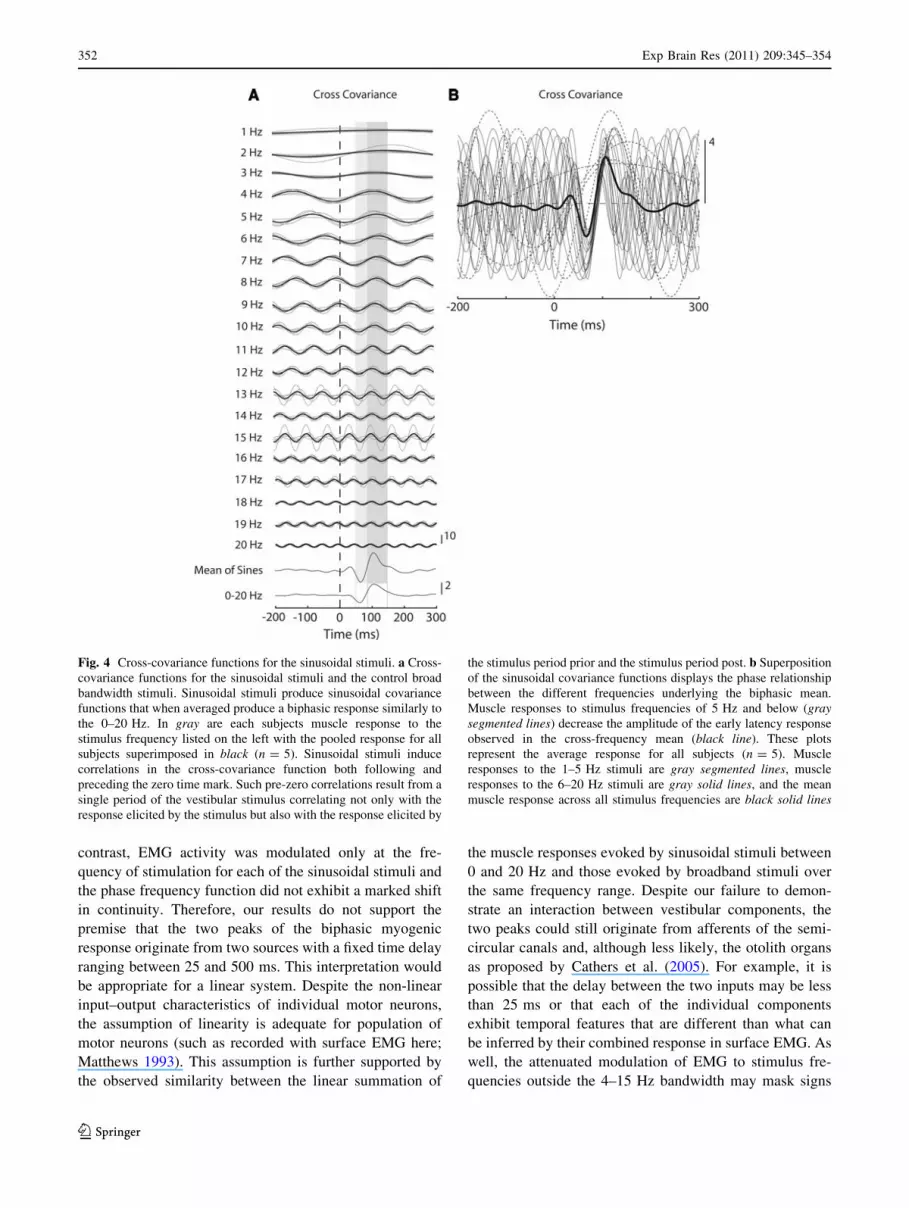
Presumably, the relative phase for each frequency
contributing to the average is important in determining the
spatial and temporal characteristics of the biphasic profile
of the average for the sinusoidal cross-covariance func-
tions. Frequencies from 1 to 5 Hz, in this study, appeared
to decrease the short latency component of the biphasic
response as their cross-covariance function exhibits a sin-
gle period for the duration of the biphasic response that is
opposite in polarity to the short latency response (Fig. 4a,
b). In contrast, frequencies from 6 to 13 Hz exhibit the
correct period length, polarity, and phase to contribute to
both the short and medium latency component of the
biphasic response (Fig. 4a, b). Frequencies greater than
13 Hz exhibit multiple periods over the duration of the
biphasic response, suggesting that they may contribute to
shaping the contours of the net waveform, especially
sharpening the peaks of the short and medium latency
responses (Fig. 4a, b). When all the sinusoidal cross-
covariance functions were superimposed their phase rela-
tionship becomes apparent highlighting how the biphasic
waveform may result from the average of the sinusoidal
cross-covariance functions (Fig. 4b).
When the cross-covariance functions to the sinusoidal
stimuli were averaged across frequencies, the result was a
biphasic response that approximated the spatial and tem-
poral properties of the 0–20 Hz control cross-covariance
Fig. 1 Stimuli, stimulus power spectra and 0–10 Hz, 10–25 Hz, and
0–25 Hz cross-covariance functions. a Five seconds of the 0–10 Hz,
10–25 Hz, and 0–25 Hz stimuli. b Power spectra for the 0–10 Hz,
10–25 Hz, and 0–25 Hz stimuli. c SVS–EMG cross-covariance
functions for the 0–10 Hz, 10–25 Hz, and 0–25 Hz stimuli
(n = 10). Neither the 0–10 Hz or 10–25 Hz stimuli evoked a single
component of the biphasic response, although the 10–25 Hz stimulus
appears to exhibit its greatest influence on the short component of the
biphasic response
Exp Brain Res (2011) 209:345–354 349
123
function, exhibiting an early negative followed by later
positive going peak (Fig. 4a). The timing for the short
latency component, however, was significantly different
from the control at 65 ± 6 ms (mean of sines) and 62 ±
6 ms (0–20 Hz control) (t(5) = 3.35, P \ 0.05), while the
timing of the medium latency component was not different
from the control 104 ± 7 ms (mean) and 104 ± 10 ms
(0–20 Hz control) (t(5) = 0.1, P [ 0.05).
Discussion
The aim of the current study was to determine whether
parameters of an electrical vestibular stimulus could be
tuned to assess the function and physiology of the short and
medium latency vestibulo-myogenic response. Specifically,
we tested the hypotheses that (a) frequencies from the
0–10 Hz and 10–25 Hz bandwidths independently influ-
ence the short or medium latency components of the ves-
tibular-evoked biphasic lower limb muscle response, and
(b) the two components of the biphasic myogenic response,
due to their fixed central delay, would interact at fre-
quencies of stimulation near 10 Hz. The present results did
not support either hypothesis. Instead, the results suggest
that the biphasic lower limb muscle response is a linear
composite of all frequencies within the stimulus bandwidth
(0–20 Hz) and that the two components of the biphasic can
not be explained by two independent sources generating
muscle responses with a fixed delay between 25 and
500 ms.
Fig. 2 Raw left medial
gastrocnemius EMG recording
and corresponding EMG power
spectrum. a Raw EMG showing
entrainment to the stimulus over
frequencies between 4 and
12 Hz. b EMG power spectrum
displaying increased power only
at the stimulus frequency
350 Exp Brain Res (2011) 209:345–354
123
Previously, we observed a dual sloped phase frequency
relationship using a 0–50 Hz broad bandwidth stimuli
(Dakin et al. 2007) which suggested, along with previous
research (Britton et al. 1993; Cathers et al. 2005; Day and
Fitzpatrick 2005), that the two peaks of the biphasic muscle
response may be the product of separate physiological
processes. The earlier of the two peaks appeared to be
derived from frequencies in the 10–20 Hz bandwidth while
the latter peak derived from frequencies in the 0–10 Hz
bandwidth. These results led us to hypothesize that the
frequency content of the stochastic stimuli could be
adjusted to modulate independently the short or medium
latency components of the biphasic response. This
hypothesis, however, was proven incorrect as provision of
low (0–10 Hz) or high (10–25 Hz) frequency stimuli did
not independently modulate the short or medium latency
components (Fig. 1). Instead, it appears that the spatial and
temporal characteristics of the short and medium latency
components of the lower limb vestibulo-myogenic
response result from activation of vestibular afferents by a
stimulus comprised of frequencies from a broader band-
width (0–20 Hz) (Fig. 4) as indicated by linear summation
of the individual sine waves. The lack of interaction
between the two vestibular components to sinusoidal
stimuli suggests that reducing the stimulus bandwidth to
isolate components of the vestibular response does not
provide any information that is not already provided by a
broad bandwidth stimulus (0–20 Hz or 0–25 Hz). Instead,
it appears more appropriate to use a large bandwidth ves-
tibular signal (0–20 Hz or 0–25 Hz) for physiological or
clinical testing due to increase subject comfort and reduced
testing times. One exception, however, may include the
possibility to reduce the magnitude of vestibular-evoked
postural responses through reductions in the low frequency
(\2 Hz) content of the stimuli (Dakin et al. 2010).
While no single peak of the biphasic response is con-
tributed to exclusively by a specific frequency bandwidth,
there does appear to be frequency bandwidths that con-
tribute to specific attributes of the biphasic response. The
biphasic shape of the myogenic response appears to be
largely derived from frequencies between 6 and 13 Hz,
while the higher frequencies sharpen the peaks of the
response. This is evident in the 10–25 Hz trial (Fig. 1)
where these frequencies appear to increase the amplitude
and shorten the duration of the short latency component as
well as shift the peak of the medium latency response
earlier in time. On the other hand, frequencies below 6 Hz
draw out the length of the medium latency response while
attenuating the short latency response (Fig. 4b). Accord-
ingly, we have previously observed that as lower fre-
quencies are omitted from a vestibular stimulus (2–20 Hz),
the amplitude of the short latency response increased
(Dakin et al. 2010). The paradoxical contribution of low
frequencies to the short and medium latency response
components may explain the slope difference in the phase
frequency relationship for frequencies below 8–10 Hz
when compared to frequencies above 10 Hz between the
stochastic vestibular stimuli and muscle response (c.f.
Figs. 5, 6 in Dakin et al. 2007).
The two components of the vestibular-evoked muscle
response also do not appear to interact with each other over
stimulation frequencies of 1–20 Hz. Evidence of such an
interaction would have manifested as an increase in EMG
power at a frequency other than that of the stimulus fre-
quency and a shift in the stimulus–EMG phase frequency
function similar to those observed by Matthews (1993). In
Fig. 3 Description of stimulus
EMG entrainment. Rectified
EMG for a stimulus frequency
(3 Hz) that shows minimal
EMG entrainment compared to
a stimulus frequency (8 Hz)
displaying stronger EMG
entrainment. EMG from the
0–20 Hz control trial does not
exhibit any obvious signs of
entrainment to the stochastic
stimulus
Exp Brain Res (2011) 209:345–354 351
123
contrast, EMG activity was modulated only at the fre-
quency of stimulation for each of the sinusoidal stimuli and
the phase frequency function did not exhibit a marked shift
in continuity. Therefore, our results do not support the
premise that the two peaks of the biphasic myogenic
response originate from two sources with a fixed time delay
ranging between 25 and 500 ms. This interpretation would
be appropriate for a linear system. Despite the non-linear
input–output characteristics of individual motor neurons,
the assumption of linearity is adequate for population of
motor neurons (such as recorded with surface EMG here;
Matthews 1993). This assumption is further supported by
the observed similarity between the linear summation of
the muscle responses evoked by sinusoidal stimuli between
0 and 20 Hz and those evoked by broadband stimuli over
the same frequency range. Despite our failure to demon-
strate an interaction between vestibular components, the
two peaks could still originate from afferents of the semi-
circular canals and, although less likely, the otolith organs
as proposed by Cathers et al. (2005). For example, it is
possible that the delay between the two inputs may be less
than 25 ms or that each of the individual components
exhibit temporal features that are different than what can
be inferred by their combined response in surface EMG. As
well, the attenuated modulation of EMG to stimulus fre-
quencies outside the 4–15 Hz bandwidth may mask signs
Fig. 4 Cross-covariance functions for the sinusoidal stimuli. a Cross-
covariance functions for the sinusoidal stimuli and the control broad
bandwidth stimuli. Sinusoidal stimuli produce sinusoidal covariance
functions that when averaged produce a biphasic response similarly to
the 0–20 Hz. In gray are each subjects muscle response to the
stimulus frequency listed on the left with the pooled response for all
subjects superimposed in black (n = 5). Sinusoidal stimuli induce
correlations in the cross-covariance function both following and
preceding the zero time mark. Such pre-zero correlations result from a
single period of the vestibular stimulus correlating not only with the
response elicited by the stimulus but also with the response elicited by
the stimulus period prior and the stimulus period post. b Superposition
of the sinusoidal covariance functions displays the phase relationship
between the different frequencies underlying the biphasic mean.
Muscle responses to stimulus frequencies of 5 Hz and below (graysegmented lines) decrease the amplitude of the early latency response
observed in the cross-frequency mean (black line). These plots
represent the average response for all subjects (n = 5). Muscle
responses to the 1–5 Hz stimuli are gray segmented lines, muscle
responses to the 6–20 Hz stimuli are gray solid lines, and the mean
muscle response across all stimulus frequencies are black solid lines
352 Exp Brain Res (2011) 209:345–354
123
of interaction in these frequencies. Strong evidence attri-
butes the semicircular canals to the medium latency peak
as this peak can be predictably modulated based on the
orientation of the head and the assumption of non-specific
activation of semicircular canal afferents (Cathers et al.
2005; Day and Fitzpatrick 2005; Mian and Day 2009). In
contrast, the origin of the short latency component is not as
clear. The directionality of the short latency vestibular
response does not appear to correspond to the net activation
of otolith afferents as predicted by the model proposed by
Fitzpatrick and Day (2004) (Mian et al. 2010).
Limitations
Three methodological limitations must be considered when
interpreting the results from this study. The first limitation
pertains to the averaging of the muscle responses observed
with 1–20 Hz sinusoids to replicate the results observed
using the 0–20 Hz control stimulus. The 0–20 Hz sto-
chastic stimulus contains power at non-integer frequencies.
In order to most accurately replicate stochastic control
condition, participants would have been required to be
provided additional stimuli at intervals between each
integer frequency making testing prohibitively long. The
absence of non-integer stimulus frequencies likely led to
the small difference (3 ms difference for the short latency
component) in the average cross-covariance when com-
pared to the 0–20 Hz stochastic control condition.
The second methodological limitation pertains to the use
of continuous repetitive stimuli. While continuous vestib-
ular stimuli provide an advantage over discrete stimuli, by
reducing testing time and the amplitude of stimuli that can
be used (Dakin et al. 2010), continuous repetitive stimuli
likely induce correlated feedback into the muscle response.
Sensory feedback correlated to the stimulus has been
observed to influence vestibular responses with delays as
late as 400 ms (Day and Guerraz 2007). Feedback occur-
ring with shorter delays may be incorporated into the later
aspects of the muscle response potentially interfering with
interpretation of these later responses.
The third methodological limitation pertains to the use
of surface EMG as a measure to identify the underlying
synaptic contributions to the biphasic responses. The
biphasic muscle response as observed through surface
EMG is composed of two underlying motor phenomenon:
individual motor unit firing behavior dictated by incoming
synaptic currents and secondary ensemble phenomenon
such as synchronization-related oscillations due to the high
autocorrelation function of the individual motor units
(Moore et al. 1970). Because surface EMG provides an
estimate of the sum of the total muscle activity, it is dif-
ficult to isolate which component of it is caused by inde-
pendent synaptic inputs versus synchronization-related
behavior.
Conclusion
Our data demonstrate that selective bandwidth SVS cannot
be used to selectively modulate the short or medium
latency vestibular-evoked muscle response. Instead, the
biphasic response as observed to a broad bandwidth stim-
ulus (0–20 Hz) is the linear sum of all stimulus frequen-
cies, with each frequency contributing to specific attributes
of the short and medium latency vestibular-evoked muscle
response. The lack of non-linear interaction in the vestib-
ular responses evoked at frequencies between 0 and 20 Hz
supports the use of large bandwidth vestibular stimuli for
clinical and physiological testing.
Acknowledgments Funded by the Natural Sciences and Engineer-
ing Research Council of Canada (JSB). JSB received salary support
from the Canadian Institutes of Health Research—Canadian Chiro-
practic Research Foundation and Michael Smith Foundation for
Health Research; CJD received doctoral awards from the Natural
Sciences and Engineering Research Council of Canada and the
Michael Smith Foundation for Health Research.
References
Britton TC, Day BL, Brown P, Rothwell JC, Thompson PD, Marsden
CD (1993) Postural electromyographic responses in the arm and
leg following galvanic vestibular stimulation in man. Exp Brain
Res 94:143–151
Cathers I, Day BL, Fitzpatrick RC (2005) Otolith and canal reflexes in
human standing. J Physiol 563:229–234
Coats AC (1973) The variability of the galvanic body-sway test. Ann
Otol Rhinol Laryngol 82:333–339
Dakin CJ, Lee Son GM, Inglis JT, Blouin JS (2007) Frequency
response of human vestibular reflexes characterized by stochastic
stimuli. J Physiol 583:1117–1127
Dakin CJ, Luu BL, van den Doel K, Inglis JT, Blouin JS (2010)
Frequency-specific modulation of vestibular-evoked sway
responses in humans. J Neurophysiol 103:1048–1056
Fig. 5 Average phase frequency functions for the 0–20 Hz sinusoidal
stimuli versus the 0–20 Hz broad bandwidth control stimulus (n = 5)
Exp Brain Res (2011) 209:345–354 353
123
Day BL, Fitzpatrick RC (2005) Virtual head rotation reveals a process
of route reconstruction from human vestibular signals. J Physiol
567:591–597
Day BL, Guerraz M (2007) Feedforward versus feedback modulation
of human vestibular-evoked balance responses by visual self-
motion information. J Physiol 582:153–161
Fitzpatrick RC, Day BL (2004) Probing the human vestibular system
with galvanic stimulation. J Appl Physiol 96:2301–2316
Fitzpatrick R, Burke D, Gandevia SC (1994) Task-dependent reflex
responses and movement illusions evoked by galvanic vestibular
stimulation in standing humans. J Physiol 478:363–372
Fitzpatrick R, Burke D, Gandevia SC (1996) Loop gain of reflexes
controlling human standing measures with the use of postural
and vestibular disturbances. J Neurophysiol 76:3994–4008
Halliday DM, Rosenberg JR, Amjad AM, Breeze P, Conway BA,
Farmer SF (1995) A framework for the analysis of mixed time
series/point process data- theory and application to the study of
physiological tremor, single motor unit discharges and electr-
omyograms. Prog Biophys Mol Biol 64:237–278
Iles JF, Pisini JV (1992) Vestibular-evoked postural reactions in man
and modulation of transmission in spinal reflex pathways.
J Physiol 455:407–424
Lee Son GM, Blouin JS, Inglis JT (2008) Short duration galvanic
vestibular stimulation evokes prolonged balance responses.
J Appl Physiol 105:1207–1210
Lund S, Broberg C (1983) Effects of different head positions on
postural sway in man induced by a reproducible vestibular error
signal. Acta Physiol Scand 117:307–309
Matthews PBC (1993) Interaction between short and long latency
components of the human stretch reflex during sinusoidal
stretching. J Physiol 462:503–527
Mian OS, Day BL (2009) Determining the direction of vestibular-
evoked balance responses using stochastic vestibular stimula-
tion. J Physiol 587:2869–2873
Mian OS, Dakin CJ, Blouin JS, Fitzpatrick RC, Day BL (2010) Lack
of otolith involvement in balance responses evoked by mastoid
electric stimulation. J Physiol 588:4441–4451
Moore GP, Segundo JP, Perkel DH, Levitan H (1970) Statistical signs
of synaptic interaction in neurons. Biophys J 10:876–900
Nashner LM, Wolfson P (1974) Influence of head position and
proprioceptive cues on short latency postural reflexes evoked by
galvanic stimulation of the human labyrinth. Brain Res
67:255–268
Reynolds RC (2010) The effect of voluntary sway control on the early
and late components of the vestibular-evoked postural response.
Exp Brain Res 201:133–139
Rosenberg JR, Amjad AM, Breeze P, Brillinger DR, Halliday DM
(1989) The fourier approach to the identification of functional
coupling between neuronal spike trains. Prog Biophys Mol Biol
53:1–31
354 Exp Brain Res (2011) 209:345–354
123