practical large-scale latency estimation
TRANSCRIPT
This article appeared in a journal published by Elsevier. The attachedcopy is furnished to the author for internal non-commercial researchand education use, including for instruction at the authors institution
and sharing with colleagues.
Other uses, including reproduction and distribution, or selling orlicensing copies, or posting to personal, institutional or third party
websites are prohibited.
In most cases authors are permitted to post their version of thearticle (e.g. in Word or Tex form) to their personal website orinstitutional repository. Authors requiring further information
regarding Elsevier’s archiving and manuscript policies areencouraged to visit:
http://www.elsevier.com/copyright
Author's personal copy
Practical large-scale latency estimation
Michal Szymaniak a,*, David Presotto b, Guillaume Pierre a, Maarten van Steen a
a Vrije Universiteit Amsterdam, Department of Computer Science, De Boelelaan 1081A, 1081HV Amsterdam, The Netherlandsb Google Inc., Mountain View, CA, United States
Received 17 July 2006; received in revised form 21 May 2007; accepted 20 November 2007Available online 29 January 2008
Responsible Editor: I.F. Akyildiz
Abstract
We present the implementation of a large-scale latency estimation system based on GNP and incorporated into theGoogle content delivery network. Our implementation employs standard features of contemporary Web clients, and care-fully controls the overhead incurred by latency measurements using a scalable centralized scheduler. It also requires only asmall number of CDN modifications, which makes it attractive for any CDN interested in large-scale latency estimation.
We investigate the issue of coordinate stability over time and show that coordinates drift away from their initial valueswith time, so that 25% of node coordinates become inaccurate by more than 33 ms after one week. However, daily re-com-putations make 75% of the coordinates stay within 6 ms of their initial values. Furthermore, we demonstrate that usingcoordinates to decide on client-to-replica re-direction leads to selecting replicas closest in term of measured latency in86% of all cases. In another 10% of all cases, clients are re-directed to replicas offering latencies that are at most two timeslonger than optimal. Finally, collecting a huge volume of latency data and using clustering techniques enable us to estimatelatencies between globally distributed Internet hosts that have not participated in our measurements at all. The results aresufficiently promising that Google may offer a public interface to the latency estimates in the future.� 2008 Elsevier B.V. All rights reserved.
Keywords: Large-scale distributed systems; Network modeling; Latency estimation
1. Introduction
Modern large-scale distributed applications canbenefit from information about latencies observedbetween their various components. Knowing suchlatencies, a distributed application can organize itsoperation such that the communication delays
between its components are minimized [1–3]. Forexample, a content delivery network can place itshosted data such that its clients are serviced at theirproximal datacenters [4,5]. In addition to improvingthe client-experienced latency, reducing the overalllength of client-to-replica network paths allowsone to localize the communication, leading to lowerbackbone and inter-ISP link utilization. Analogousbenefits can be achieved for other large-scale distrib-uted applications such as peer-to-peer overlays oronline gaming platforms.
1389-1286/$ - see front matter � 2008 Elsevier B.V. All rights reserved.
doi:10.1016/j.comnet.2007.11.022
* Corresponding author. Tel.: +31 20 598 7748; fax: +31 20 5987653.
E-mail address: [email protected] (M. Szymaniak).
Available online at www.sciencedirect.com
Computer Networks 52 (2008) 1343–1364
www.elsevier.com/locate/comnet
Author's personal copy
The effectiveness of latency-driven techniques inimproving the application performance depends onthe accuracy of the latency information. A simplesolution consists of periodically probing eachlatency the application needs to know [6]. However,such an approach makes sense only in relativelysmall systems, as continuous probing of pair-wiselatencies is clearly not feasible when the number ofnodes is very large. For example, re-directing clientsto their nearest datacenters would require Google tomaintain latency information from virtually everyWeb client in the Internet to each of its datacenters[7]. Also, the high dynamics of the Internet causesrecently measured latencies to not always be a goodindication of their current counterparts, as onelatency measurement result is not a good predictorof a subsequent identical measurement. These twoproblems drive the need for scalable and accuratelatency estimation techniques.
A promising approach to the problem of scalablelatency estimation is GNP, which models Internetlatencies in a multi-dimensional geometric space[8]. Given a small number of ‘‘base” latency mea-surements to a number of dedicated ‘‘landmark”
nodes, GNP associates each node with its coordi-nates in that space. The latency between any pairof nodes can then be approximated with the Euclid-ean distance between their corresponding coordi-nates. What makes GNP scalable is the constantlow number of measurements necessary to positioneach machine, which enables GNP to estimate all-pair latencies between a large number of machinesat low cost.
The attractiveness of GNP has resulted in its var-ious aspects being investigated for several years.However, whereas numerous theoretical propertiesof GNP have been described in detail [9–14], noGNP implementation has been demonstrated towork in a large-scale environment of a commercialcontent delivery network.
The common property of existing GNP imple-mentations that hinders their deployment is activeparticipation of positioned nodes, which are respon-sible for measuring and propagating their own baselatencies [15–18]. Such an approach has several dis-advantages. First, it introduces problems with mali-cious nodes lying about their base latencies.Handling such nodes is usually very hard, and typ-ically comes at the expense of increased system com-plexity. Second, independent measurements of baselatencies performed by many active nodes mightoverload both the network and the landmarks. This,
in turn, might lead to numerous measurement inac-curacies affecting the GNP performance. Finally,active participation typically requires that some spe-cial positioning software is deployed on a significantfraction of positioned nodes. This condition mightbe infeasible to meet, for example, in content deliv-ery networks, where most nodes are unmodifiablethird-party Web browsers.
This article presents a GNP implementation thataddresses all these issues. Our solution is based ontwo key observations. First, instead of relying onremote nodes to measure and report their base laten-cies, one can simply trigger some standard applica-tion-level communication between these nodes andthe landmarks, allowing the latter to measure laten-cies passively on their side. This eliminates the needfor customizing the remote nodes and ensures theintegrity of measurement results. Second, insteadof allowing remote nodes to independently performtheir measurements, one can trigger measurementsindividually using a central, yet scalable, scheduler.This prevents landmarks from overloads andreduces the overall network overhead in general, asthe scheduler triggers only the measurements thatare really necessary. We demonstrate the feasibilityof our approach by incorporating GNP into the con-tent delivery network operated by Google, whichenables us to position millions of Google clients.
Compared to the previous GNP implementa-tions, our approach has several advantages. First,it greatly facilitates system deployment, as onlythe landmarks and the scheduler need to be instru-mented. Second, it removes the problem of mali-cious nodes, as all the instrumented nodes are keptunder full control of Google. Third, it eliminatesthe risk of overloading the landmarks, as the sched-uler effectively adjusts the measurement volume tothe landmark capacity.
Implementing our system at the scale of millionsof clients requires one to address a number of subtleissues. For example, it is necessary to transparentlyand efficiently schedule measurements such thatthey do not affect the client-perceived browsing per-formance. Also, implementing a centralized sched-uler is far from trivial when millions of Webclients are serviced by thousands of globally-distrib-uted Web servers [19]. Finally, producing GNPcoordinates that can remain representative for along time requires that some special preprocessingtechniques are applied to base latencies.
Within the first 2 months of operation, our posi-tioning system performed more than 75 million
1344 M. Szymaniak et al. / Computer Networks 52 (2008) 1343–1364
Author's personal copy
latency measurements to more than 22 millionunique Google clients. Using host clustering tech-niques allowed us to compute the coordinates ofmore than 200 million Internet hosts falling intomore than 880,000 of /24 networks. To our bestknowledge, this is the largest experiment involvingnetwork positioning performed so far.
Our study confirms many earlier results, andadds to them by extensively investigating the issueof coordinate stability over time. Stability of resultsis important from the perspective of maintaining alarge-scale distributed system, in which decisionsbased on latency information often have long-last-ing effects. This is what happens, for example, whenclients are re-directed using DNS, which can cacheand re-use re-directing decisions for a long time.We show that coordinates drift away from their ini-tial values with time, making 25% of the coordinatesto be off by more than 33 ms after one week. How-ever, daily re-computations make 75% of the coor-dinates stay within 6 ms of their initial values. Wealso recommend to derive daily coordinates frombase latencies measured until around 10 pm UTC,as it results in coordinates remaining representativethroughout the most of the next 24 hours.
Our another contribution to understanding thepractical applicability of GNP in real-life systemsis the performance analysis of coordinate-based cli-ent re-direction. We demonstrate that using latencyestimates to decide on client-to-replica re-directionleads to selecting replicas closest in term of mea-
sured latency in 86% of all cases. In another 10%of all cases, clients are re-directed to replicas offeringlatencies that are at most two times longer thanoptimal. Also, we show that positioning Google cli-ents makes it possible to estimate latencies betweenglobally distributed Internet hosts that have notparticipate in our measurements. We treat thisresult as an incentive to develop a new publiclyavailable Google service providing pairwise latencyestimates for Internet hosts.
The remainder of this article is structured as fol-lows: We discuss a number of related research effortsin Section 2. Then follows the description of our sys-tem: Section 3 describes how we integrated GNPinto the Google infrastructure, Section 4 showshow to compute stable coordinates, and Section 5discusses our experience with GNP-based client re-direction. Section 6 evaluates the performance ofour system as an application-independent latencyestimation service. Finally, Section 7 concludes bysummarizing our future development plans.
2. Related work
2.1. Internet node positioning
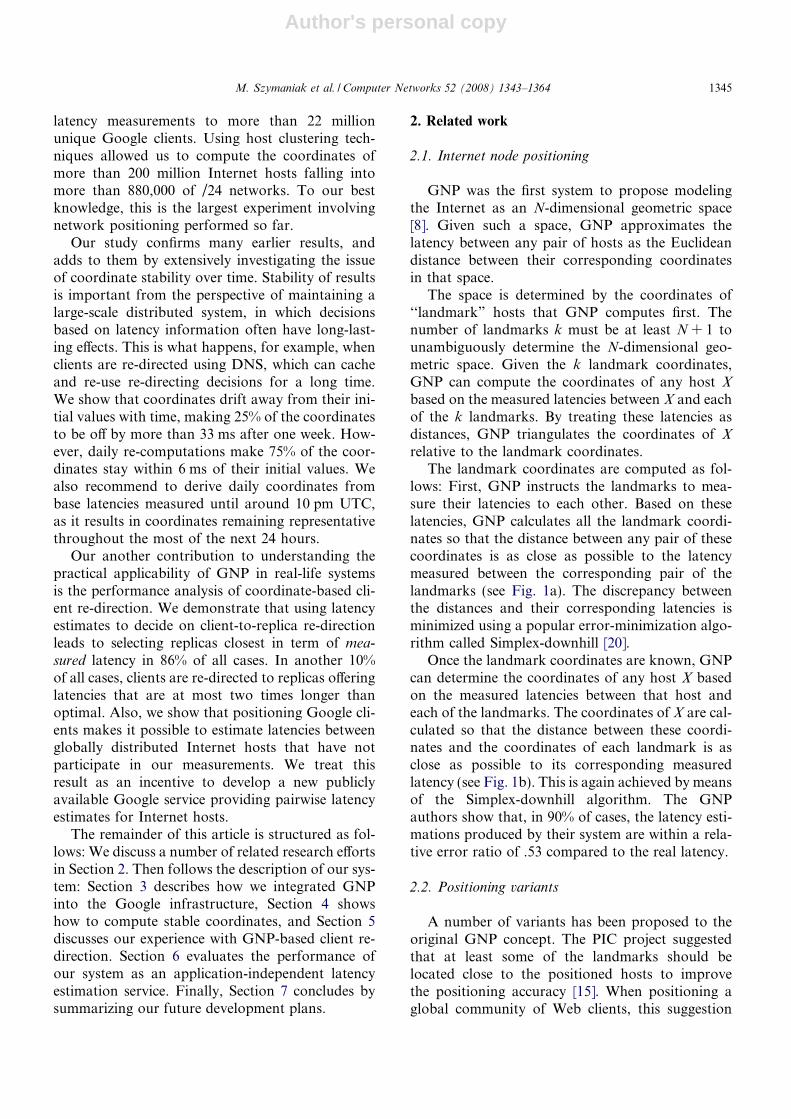
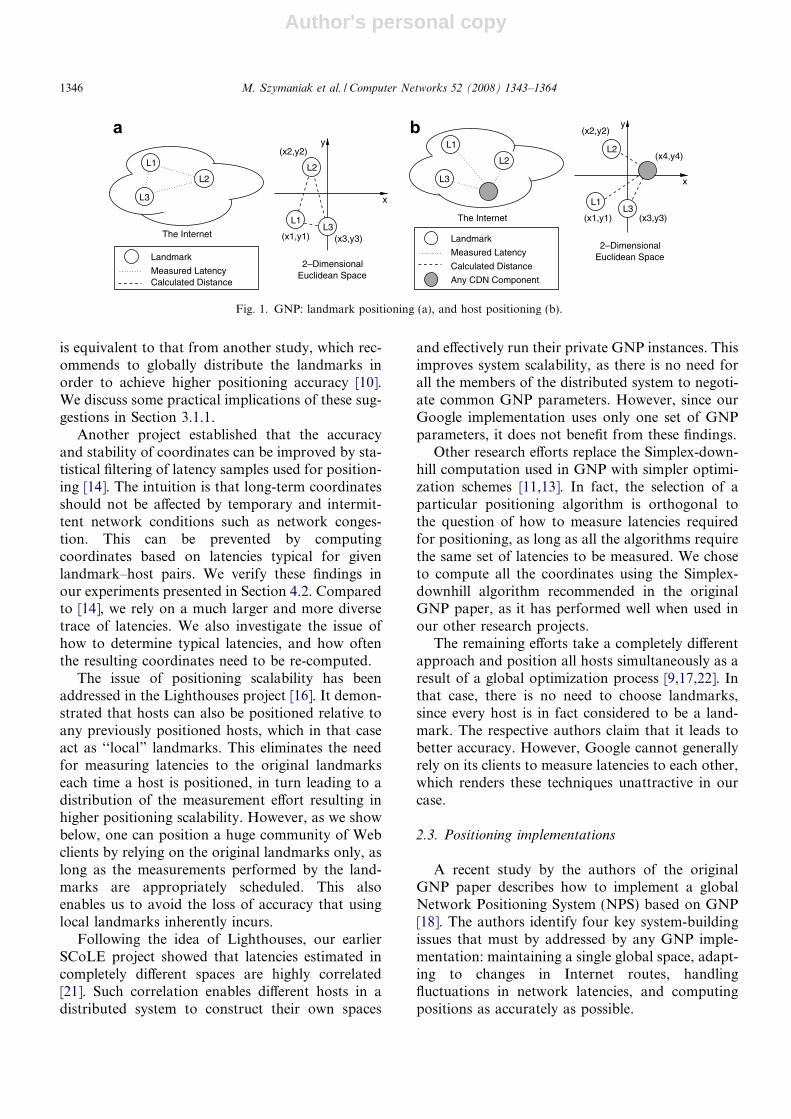
GNP was the first system to propose modelingthe Internet as an N-dimensional geometric space[8]. Given such a space, GNP approximates thelatency between any pair of hosts as the Euclideandistance between their corresponding coordinatesin that space.
The space is determined by the coordinates of‘‘landmark” hosts that GNP computes first. Thenumber of landmarks k must be at least N + 1 tounambiguously determine the N-dimensional geo-metric space. Given the k landmark coordinates,GNP can compute the coordinates of any host X
based on the measured latencies between X and eachof the k landmarks. By treating these latencies asdistances, GNP triangulates the coordinates of X
relative to the landmark coordinates.The landmark coordinates are computed as fol-
lows: First, GNP instructs the landmarks to mea-sure their latencies to each other. Based on theselatencies, GNP calculates all the landmark coordi-nates so that the distance between any pair of thesecoordinates is as close as possible to the latencymeasured between the corresponding pair of thelandmarks (see Fig. 1a). The discrepancy betweenthe distances and their corresponding latencies isminimized using a popular error-minimization algo-rithm called Simplex-downhill [20].
Once the landmark coordinates are known, GNPcan determine the coordinates of any host X basedon the measured latencies between that host andeach of the landmarks. The coordinates of X are cal-culated so that the distance between these coordi-nates and the coordinates of each landmark is asclose as possible to its corresponding measuredlatency (see Fig. 1b). This is again achieved by meansof the Simplex-downhill algorithm. The GNPauthors show that, in 90% of cases, the latency esti-mations produced by their system are within a rela-tive error ratio of .53 compared to the real latency.
2.2. Positioning variants
A number of variants has been proposed to theoriginal GNP concept. The PIC project suggestedthat at least some of the landmarks should belocated close to the positioned hosts to improvethe positioning accuracy [15]. When positioning aglobal community of Web clients, this suggestion
M. Szymaniak et al. / Computer Networks 52 (2008) 1343–1364 1345
Author's personal copy
is equivalent to that from another study, which rec-ommends to globally distribute the landmarks inorder to achieve higher positioning accuracy [10].We discuss some practical implications of these sug-gestions in Section 3.1.1.
Another project established that the accuracyand stability of coordinates can be improved by sta-tistical filtering of latency samples used for position-ing [14]. The intuition is that long-term coordinatesshould not be affected by temporary and intermit-tent network conditions such as network conges-tion. This can be prevented by computingcoordinates based on latencies typical for givenlandmark–host pairs. We verify these findings inour experiments presented in Section 4.2. Comparedto [14], we rely on a much larger and more diversetrace of latencies. We also investigate the issue ofhow to determine typical latencies, and how oftenthe resulting coordinates need to be re-computed.
The issue of positioning scalability has beenaddressed in the Lighthouses project [16]. It demon-strated that hosts can also be positioned relative toany previously positioned hosts, which in that caseact as ‘‘local” landmarks. This eliminates the needfor measuring latencies to the original landmarkseach time a host is positioned, in turn leading to adistribution of the measurement effort resulting inhigher positioning scalability. However, as we showbelow, one can position a huge community of Webclients by relying on the original landmarks only, aslong as the measurements performed by the land-marks are appropriately scheduled. This alsoenables us to avoid the loss of accuracy that usinglocal landmarks inherently incurs.
Following the idea of Lighthouses, our earlierSCoLE project showed that latencies estimated incompletely different spaces are highly correlated[21]. Such correlation enables different hosts in adistributed system to construct their own spaces
and effectively run their private GNP instances. Thisimproves system scalability, as there is no need forall the members of the distributed system to negoti-ate common GNP parameters. However, since ourGoogle implementation uses only one set of GNPparameters, it does not benefit from these findings.
Other research efforts replace the Simplex-down-hill computation used in GNP with simpler optimi-zation schemes [11,13]. In fact, the selection of aparticular positioning algorithm is orthogonal tothe question of how to measure latencies requiredfor positioning, as long as all the algorithms requirethe same set of latencies to be measured. We choseto compute all the coordinates using the Simplex-downhill algorithm recommended in the originalGNP paper, as it has performed well when used inour other research projects.
The remaining efforts take a completely differentapproach and position all hosts simultaneously as aresult of a global optimization process [9,17,22]. Inthat case, there is no need to choose landmarks,since every host is in fact considered to be a land-mark. The respective authors claim that it leads tobetter accuracy. However, Google cannot generallyrely on its clients to measure latencies to each other,which renders these techniques unattractive in ourcase.
2.3. Positioning implementations
A recent study by the authors of the originalGNP paper describes how to implement a globalNetwork Positioning System (NPS) based on GNP[18]. The authors identify four key system-buildingissues that must by addressed by any GNP imple-mentation: maintaining a single global space, adapt-ing to changes in Internet routes, handlingfluctuations in network latencies, and computingpositions as accurately as possible.
Calculated DistanceMeasured Latency
Landmark
The Internet
L3
L2
L1
(x3,y3)
(x2,y2)
(x1,y1)
2–Dimensional
y
x
L1
L2
L3
Euclidean Space
x
y
(x1,y1)
(x2,y2)
(x3,y3)
(x4,y4)
L1
L2
L3The Internet
Landmark
Measured Latency
Calculated Distance
Any CDN Component
L1
L2
L3
2–DimensionalEuclidean Space
a b
Fig. 1. GNP: landmark positioning (a), and host positioning (b).
1346 M. Szymaniak et al. / Computer Networks 52 (2008) 1343–1364
Author's personal copy
NPS addresses the key building issues by orga-nizing hosts interested in positioning into a distrib-uted infrastructure in which each host periodicallyrecalculates its own coordinates. All the coordinatesare calculated in the same geometric space, deter-mined by a fixed set of global landmarks. NPS pre-vents these landmarks from becoming performancebottlenecks by allowing the hosts to position them-selves relative not only to the landmarks, but also toany other ‘‘reference” hosts whose coordinates arealready known. In that sense, NPS generalizes theconcept of local landmarks introduced by Light-houses. On top of that, NPS enables each of thelandmarks to compute its coordinates locally bymeans of a special scheme for decentralized land-mark positioning, and exploits some other distrib-uted algorithms to synchronize positions computedby different hosts.
The distributed nature of NPS results in improvedscalability. However, it also forces NPS to deal witha number of problems that result from the distribu-tion itself, such as preventing malicious hosts frombeing used as positioning references, synchronizingdistributed latency probing to prevent referencehosts from being overloaded, or triggering host re-positioning to maintain global consistency of coordi-nates. Solving these problems makes NPS relativelycomplex. On the other hand, following our central-ized approach enables one to avoid all these prob-lems without limiting the system scalability. As aresult, our solutions to the four key building issuesidentified by NPS are much simpler.
3. System architecture
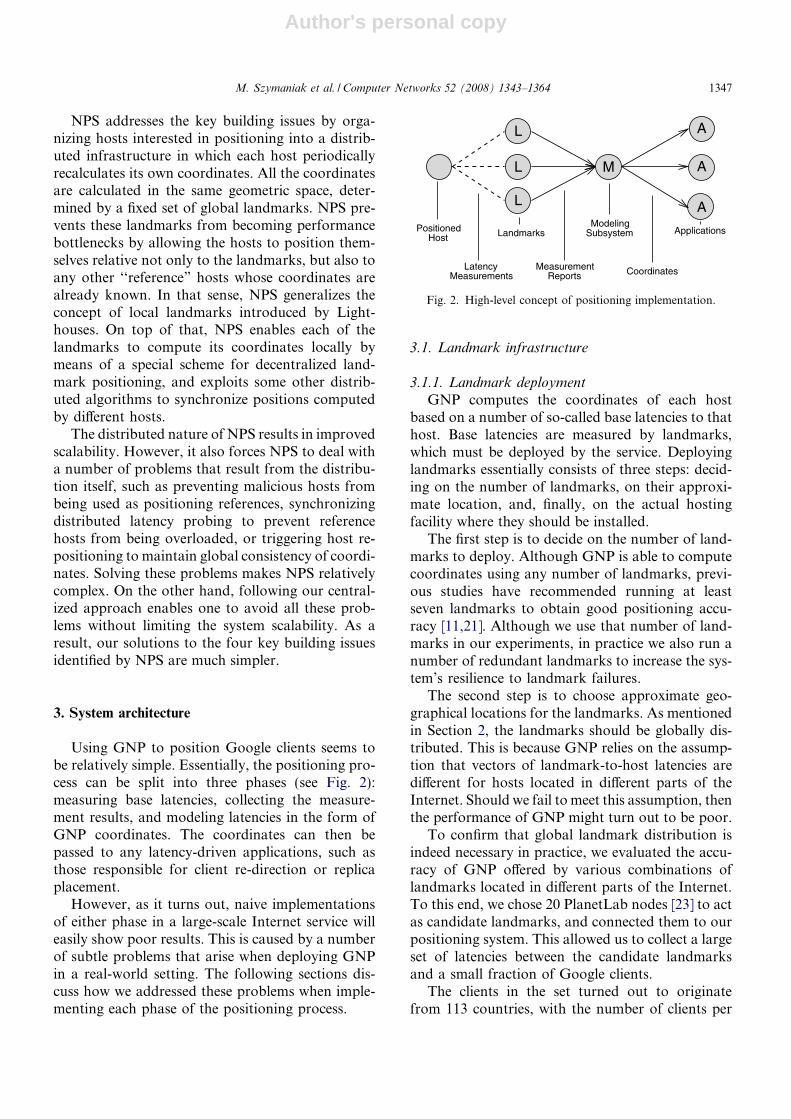
Using GNP to position Google clients seems tobe relatively simple. Essentially, the positioning pro-cess can be split into three phases (see Fig. 2):measuring base latencies, collecting the measure-ment results, and modeling latencies in the form ofGNP coordinates. The coordinates can then bepassed to any latency-driven applications, such asthose responsible for client re-direction or replicaplacement.
However, as it turns out, naive implementationsof either phase in a large-scale Internet service willeasily show poor results. This is caused by a numberof subtle problems that arise when deploying GNPin a real-world setting. The following sections dis-cuss how we addressed these problems when imple-menting each phase of the positioning process.
3.1. Landmark infrastructure
3.1.1. Landmark deployment
GNP computes the coordinates of each hostbased on a number of so-called base latencies to thathost. Base latencies are measured by landmarks,which must be deployed by the service. Deployinglandmarks essentially consists of three steps: decid-ing on the number of landmarks, on their approxi-mate location, and, finally, on the actual hostingfacility where they should be installed.
The first step is to decide on the number of land-marks to deploy. Although GNP is able to computecoordinates using any number of landmarks, previ-ous studies have recommended running at leastseven landmarks to obtain good positioning accu-racy [11,21]. Although we use that number of land-marks in our experiments, in practice we also run anumber of redundant landmarks to increase the sys-tem’s resilience to landmark failures.
The second step is to choose approximate geo-graphical locations for the landmarks. As mentionedin Section 2, the landmarks should be globally dis-tributed. This is because GNP relies on the assump-tion that vectors of landmark-to-host latencies aredifferent for hosts located in different parts of theInternet. Should we fail to meet this assumption, thenthe performance of GNP might turn out to be poor.
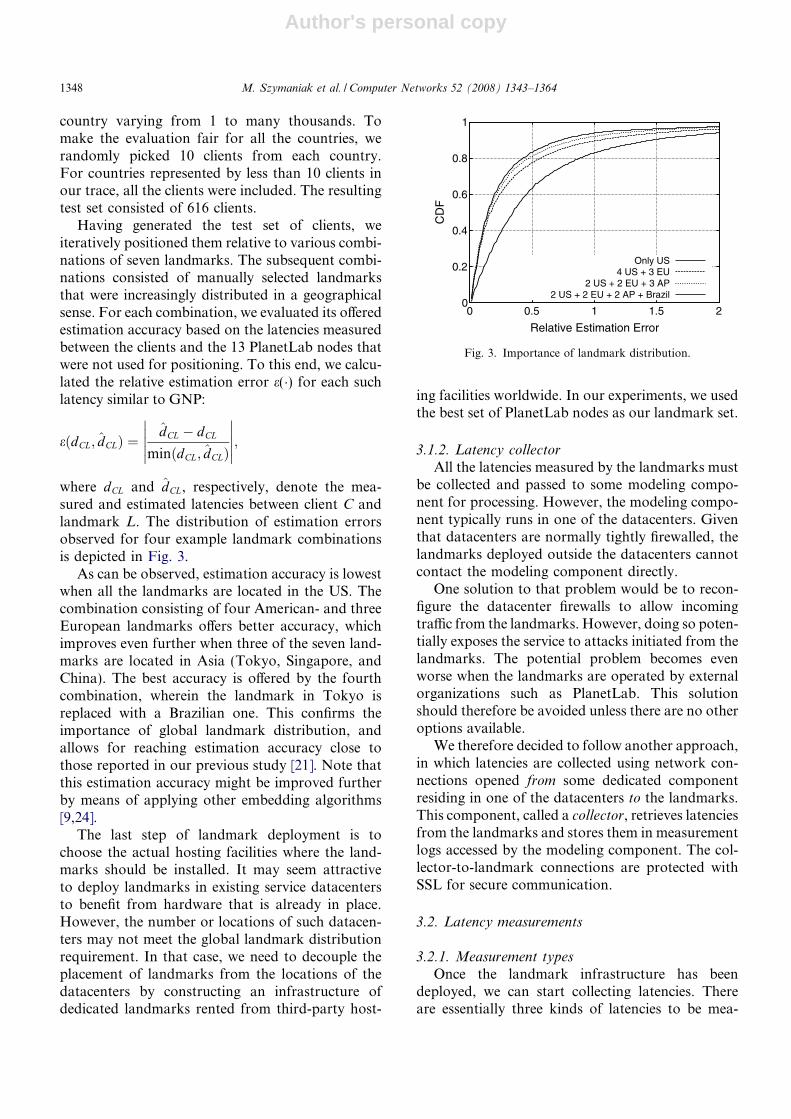
To confirm that global landmark distribution isindeed necessary in practice, we evaluated the accu-racy of GNP offered by various combinations oflandmarks located in different parts of the Internet.To this end, we chose 20 PlanetLab nodes [23] to actas candidate landmarks, and connected them to ourpositioning system. This allowed us to collect a largeset of latencies between the candidate landmarksand a small fraction of Google clients.
The clients in the set turned out to originatefrom 113 countries, with the number of clients per
PositionedHost Landmarks
ModelingSubsystem Applications
MeasurementReports CoordinatesLatency
Measurements
M
L
L
L
A
A
A
Fig. 2. High-level concept of positioning implementation.
M. Szymaniak et al. / Computer Networks 52 (2008) 1343–1364 1347
Author's personal copy
country varying from 1 to many thousands. Tomake the evaluation fair for all the countries, werandomly picked 10 clients from each country.For countries represented by less than 10 clients inour trace, all the clients were included. The resultingtest set consisted of 616 clients.
Having generated the test set of clients, weiteratively positioned them relative to various combi-nations of seven landmarks. The subsequent combi-nations consisted of manually selected landmarksthat were increasingly distributed in a geographicalsense. For each combination, we evaluated its offeredestimation accuracy based on the latencies measuredbetween the clients and the 13 PlanetLab nodes thatwere not used for positioning. To this end, we calcu-lated the relative estimation error e(�) for each suchlatency similar to GNP:
eðdCL; d̂CLÞ ¼d̂CL � dCL
minðdCL; d̂CLÞ
�����
�����;
where dCL and d̂CL, respectively, denote the mea-sured and estimated latencies between client C andlandmark L. The distribution of estimation errorsobserved for four example landmark combinationsis depicted in Fig. 3.
As can be observed, estimation accuracy is lowestwhen all the landmarks are located in the US. Thecombination consisting of four American- and threeEuropean landmarks offers better accuracy, whichimproves even further when three of the seven land-marks are located in Asia (Tokyo, Singapore, andChina). The best accuracy is offered by the fourthcombination, wherein the landmark in Tokyo isreplaced with a Brazilian one. This confirms theimportance of global landmark distribution, andallows for reaching estimation accuracy close tothose reported in our previous study [21]. Note thatthis estimation accuracy might be improved furtherby means of applying other embedding algorithms[9,24].
The last step of landmark deployment is tochoose the actual hosting facilities where the land-marks should be installed. It may seem attractiveto deploy landmarks in existing service datacentersto benefit from hardware that is already in place.However, the number or locations of such datacen-ters may not meet the global landmark distributionrequirement. In that case, we need to decouple theplacement of landmarks from the locations of thedatacenters by constructing an infrastructure ofdedicated landmarks rented from third-party host-
ing facilities worldwide. In our experiments, we usedthe best set of PlanetLab nodes as our landmark set.
3.1.2. Latency collector
All the latencies measured by the landmarks mustbe collected and passed to some modeling compo-nent for processing. However, the modeling compo-nent typically runs in one of the datacenters. Giventhat datacenters are normally tightly firewalled, thelandmarks deployed outside the datacenters cannotcontact the modeling component directly.
One solution to that problem would be to recon-figure the datacenter firewalls to allow incomingtraffic from the landmarks. However, doing so poten-tially exposes the service to attacks initiated from thelandmarks. The potential problem becomes evenworse when the landmarks are operated by externalorganizations such as PlanetLab. This solutionshould therefore be avoided unless there are no otheroptions available.
We therefore decided to follow another approach,in which latencies are collected using network con-nections opened from some dedicated componentresiding in one of the datacenters to the landmarks.This component, called a collector, retrieves latenciesfrom the landmarks and stores them in measurementlogs accessed by the modeling component. The col-lector-to-landmark connections are protected withSSL for secure communication.
3.2. Latency measurements
3.2.1. Measurement types
Once the landmark infrastructure has beendeployed, we can start collecting latencies. Thereare essentially three kinds of latencies to be mea-
0
0.2
0.4
0.6
0.8
1
0 0.5 1 1.5 2
CD
F
Relative Estimation Error
Only US4 US + 3 EU
2 US + 2 EU + 3 AP2 US + 2 EU + 2 AP + Brazil
Fig. 3. Importance of landmark distribution.
1348 M. Szymaniak et al. / Computer Networks 52 (2008) 1343–1364
Author's personal copy
sured. First, the landmarks must measure latenciesbetween each other, as GNP requires this informa-tion to construct its geometric space. This can easilybe achieved by means of periodical active probing,which is the simplest way of discovering latenciesbetween any two machines under our control.
Second, the landmarks must measure their laten-cies to each datacenter so that the datacenters can bepositioned as well. Computing the coordinates ofdatacenters is necessary to estimate client–datacen-ter latencies, which can then be used during clientre-direction. Given that datacenters are operatedby the service, the landmarks can discover theirlatencies to the datacenters by actively probing themjust like they probe each other.
Third, the landmarks must determine their laten-cies to Google clients so that the coordinates of theseclients can be computed as well. However, we cannotuse active probing this time, as it is likely to triggervarious intrusion–detection systems deployed onthe client side. This could result in numerous clientcomplaints affecting the service reputation.
Rather than actively probing clients, the land-marks can measure their latencies to the clientswithout initiating any traffic to these clients. To thisend, the landmarks must rely on passive latency dis-covery, wherein latency measurements can beobtained by monitoring the service traffic and deriv-ing the client latencies from the dynamics of packetsconstituting that traffic.
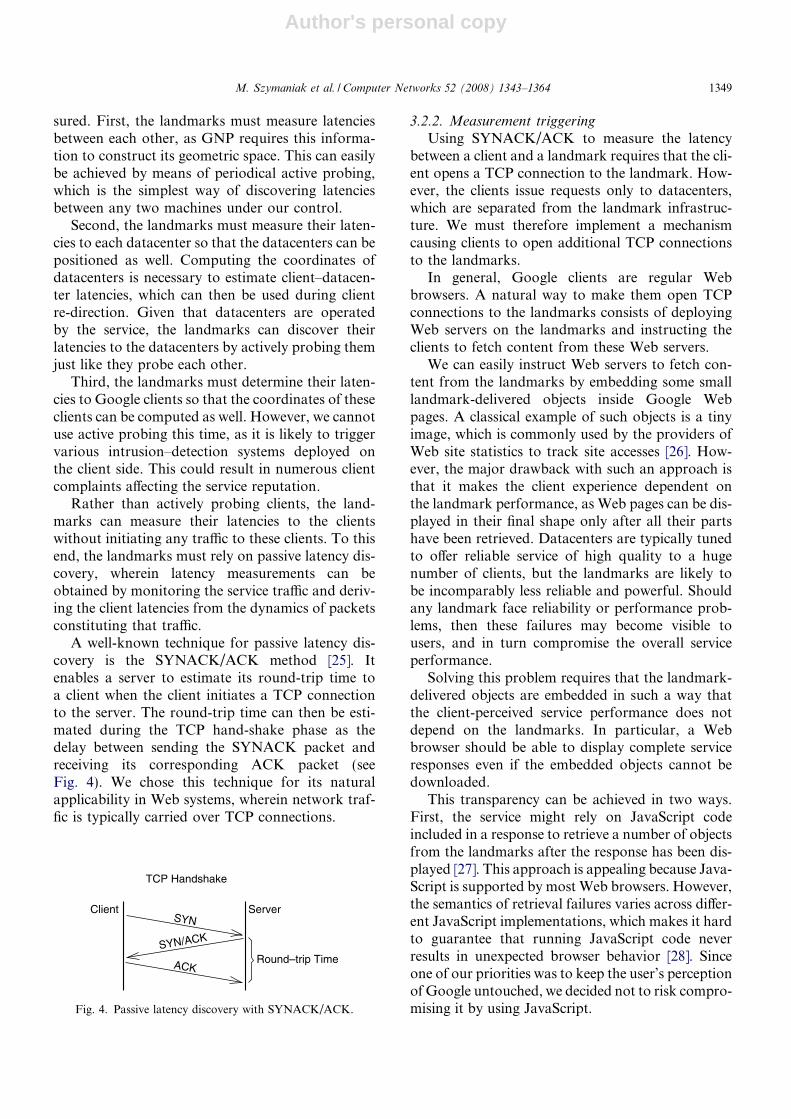
A well-known technique for passive latency dis-covery is the SYNACK/ACK method [25]. Itenables a server to estimate its round-trip time toa client when the client initiates a TCP connectionto the server. The round-trip time can then be esti-mated during the TCP hand-shake phase as thedelay between sending the SYNACK packet andreceiving its corresponding ACK packet (seeFig. 4). We chose this technique for its naturalapplicability in Web systems, wherein network traf-fic is typically carried over TCP connections.
3.2.2. Measurement triggering
Using SYNACK/ACK to measure the latencybetween a client and a landmark requires that the cli-ent opens a TCP connection to the landmark. How-ever, the clients issue requests only to datacenters,which are separated from the landmark infrastruc-ture. We must therefore implement a mechanismcausing clients to open additional TCP connectionsto the landmarks.
In general, Google clients are regular Webbrowsers. A natural way to make them open TCPconnections to the landmarks consists of deployingWeb servers on the landmarks and instructing theclients to fetch content from these Web servers.
We can easily instruct Web servers to fetch con-tent from the landmarks by embedding some smalllandmark-delivered objects inside Google Webpages. A classical example of such objects is a tinyimage, which is commonly used by the providers ofWeb site statistics to track site accesses [26]. How-ever, the major drawback with such an approach isthat it makes the client experience dependent onthe landmark performance, as Web pages can be dis-played in their final shape only after all their partshave been retrieved. Datacenters are typically tunedto offer reliable service of high quality to a hugenumber of clients, but the landmarks are likely tobe incomparably less reliable and powerful. Shouldany landmark face reliability or performance prob-lems, then these failures may become visible tousers, and in turn compromise the overall serviceperformance.
Solving this problem requires that the landmark-delivered objects are embedded in such a way thatthe client-perceived service performance does notdepend on the landmarks. In particular, a Webbrowser should be able to display complete serviceresponses even if the embedded objects cannot bedownloaded.
This transparency can be achieved in two ways.First, the service might rely on JavaScript codeincluded in a response to retrieve a number of objectsfrom the landmarks after the response has been dis-played [27]. This approach is appealing because Java-Script is supported by most Web browsers. However,the semantics of retrieval failures varies across differ-ent JavaScript implementations, which makes it hardto guarantee that running JavaScript code neverresults in unexpected browser behavior [28]. Sinceone of our priorities was to keep the user’s perceptionof Google untouched, we decided not to risk compro-mising it by using JavaScript.
TCP Handshake
Client Server
Round–trip TimeSYN/ACK
SYN
ACK
Fig. 4. Passive latency discovery with SYNACK/ACK.
M. Szymaniak et al. / Computer Networks 52 (2008) 1343–1364 1349
Author's personal copy
Another transparent way of embedding objects isto use server-directed prefetching capabilities of cer-tain browsers [29]. This technique enables a Web ser-ver to instruct browsers to retrieve a given objectafter the entire response has been displayed. Prefetch-ing is typically used to accelerate the download ofWeb documents that clients are likely to be request-ing next [30]. However, it can also be used to triggerthe retrieval of landmark-delivered objects.
The service can pass prefetching instructions toWeb browsers in the form of special HTTP headersor HTML tags embedded inside its responses [31].Each such instruction contains the URL of anobject that a Web browser should retrieve. In con-trast to regular object retrieval, however, Webbrowsers keep their users unaware of any delaysor failures that might occur during prefetching. Thisguarantees that prefetching does not affect client-perceived service performance.
We decided to employ prefetching to trigger theretrieval of landmark-delivered objects. To thisend, we modified Google Web servers to embed pre-fetching instructions inside their responses such thateach tag points at an object hosted by some land-mark. This causes the clients to open HTTP connec-tions to the landmarks, which can then performpassive latency discovery.
A potential limitation of prefetching is that it iscurrently supported only by the Mozilla FirefoxWeb browser [32]. This means that Google can onlytrigger prefetching requests from approximately13% of its clients [33]. However, prefetching featuresare planned to be supported by the future releases ofInternet Explorer browser as well [34]. Also, mea-suring latencies to a fraction of all the clients mightturn out to be enough to position all Internet hosts,as we discuss next.
3.3. Measurement scheduling
The above sections have discussed two mecha-nisms that enable the service to trigger latency mea-surements: active probing and embedding ofprefetching instructions. Whereas the configurationof active probing is relatively straightforward,deciding on how to trigger measurements with pre-fetching is much harder.
Obviously, the service needs to trigger all the mea-surements necessary to position its clients. However,while doing so, it should respect the following threeconditions: First, it should trigger only as many mea-surements as each of the landmarks can handle, as
overloaded landmarks cannot measure latenciesaccurately. Second, it should also keep the total num-ber of measurements low to reduce client-side over-head. Third, it should avoid triggering redundantmeasurements to minimize network usage.
The following sections describe how our systemmeets each of these three requirements using a cen-tralized scheduling policy. We then propose howsuch a policy can be implemented in a large-scalesystem in which responses are simultaneously gener-ated by the thousands of Web servers that constitutethe Google infrastructure [19].
3.3.1. Landmark load
In a naive approach, the service could includeprefetching tags in all its responses to perform asmany measurements as possible. However, doingso would most likely lead to overloading the net-work connections to the landmarks, resulting inlatencies being measured with high inaccuracies.
Overloading the landmarks can be avoided bylimiting the number of measurements performedby each landmark. To this end, the service canenforce some delay between subsequent measure-ments scheduled to each landmark such that thelandmark capacity is never exceeded. The distin-guishing property of this time-sharing scheme is thatit can be easily distributed over multiple schedulingcomponents, which we benefit from below. It is alsovery easy to implement, as it only needs to maintaina timestamp of the most recent measurement sched-uled to each landmark.
3.3.2. Client clustering
Scheduling individual measurements should ulti-mately result in collecting all the latencies necessaryto position all the clients. However, since the clientsmight consider measurements to be an unnecessaryburden, the service should strive to minimize thatburden by reducing the number of measurements.
We decided to reduce the number of measure-ments issued to the clients by means of clustering,which is a popular technique for reducing the num-ber of operations performed in a distributed system.In principle, clustering groups machines into so-called clusters, and performs the operations on aper-cluster rather than on a per-machine basis. Inour case, clustering reduces the number of measure-ments by grouping clients whose latencies to a givenlandmark are very similar.
Efficient scheduling requires that clustering is fast,which limits the selection of clustering schemes to
1350 M. Szymaniak et al. / Computer Networks 52 (2008) 1343–1364
Author's personal copy
very simple ones. An example of such a scheme isclustering of machines whose IP addresses share thesame 24-bit prefix. We call each such cluster a /24 net-work, and identify each such network with its 24-bitprefix. Given that each /24 network can contain up to254 machines, /24 clustering can reduce the numberof measurements by up to two orders of magnitude.
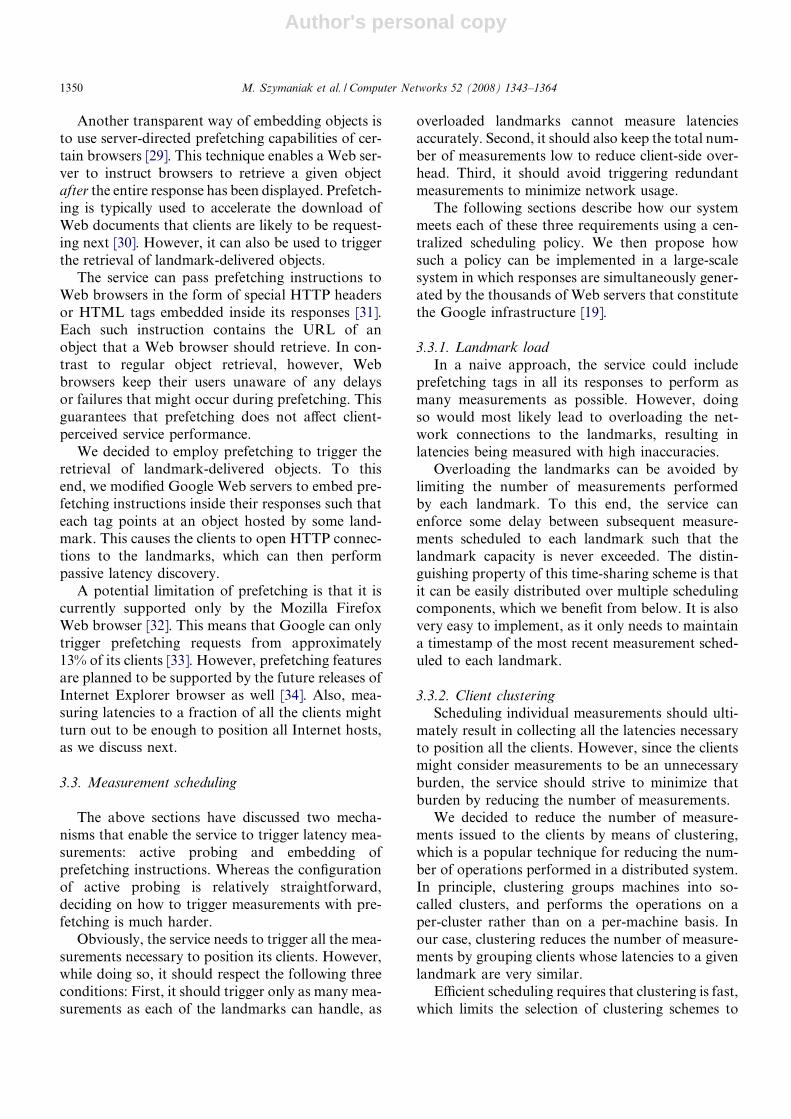
However, relying on /24 clustering when per-forming latency measurement is possible only iflatencies measured to the clustered machines aresimilar. To validate whether this condition is metin the Internet, we calculated 10–90 percentileranges for latencies measured to different clients inthe same /24 networks.
The percentile ranges were calculated based onthe latency trace collected by our system. First, weextracted latencies measured by the landmark run-ning at MIT during a two-week period. The dura-tion of two weeks was chosen to limit the impactof routing changes on the observed latencies. Sec-ond, we identified all the /24 networks containingat least three different clients in the two-week trace.The number of such networks turned out to be28,540. Third, we obtained an indication of thelandmark’s latency to each client by calculating amedian for each landmark–client pair. Finally, forall the clients in each network, we evaluated howclose their median latencies are to each other. Tothis end, we calculated the 10–90 percentile rangeover the set of medians, and divided that range bythe mean median latency for that network. Theresulting distribution of 10–90 percentile range coef-ficients is depicted in Fig. 5.
As can be observed, in over 91% of /24 networks,the coefficient of the 10–90 percentile range is lowerthan.2. This means that, in 91% of /24 networks,
median latencies to 80% of clients differ by at most20%. Such a low variation enables the landmarks tomeasure their latencies to any client in a network,and treat these latencies as representative for anyother clients in that network. Note that /24 cluster-ing enables to position all the clients in a given /24network only if at least one of them supports pre-fetching. According to our data, this condition ismet by about 85% of /24 networks containing Goo-gle clients. The remaining clients can be positionedwhen a more aggressive clustering scheme is used,as we discuss in Section 6.
3.3.3. Redundant measurements
Positioning a /24 network requires measuringlatencies between that network and all the land-marks. This can be achieved by triggering measure-ments from a given /24 network to the landmarks ina round-robin fashion. To this end, subsequent ser-vice responses sent to each network contain pre-fetching tags pointing at objects hosted bysubsequent landmarks.
A potential problem is that starting all the round-robin sequences from the same landmark is likely tocause that landmark to be fully loaded. In that case,the mechanism responsible for limiting the land-mark load will prevent many measurements frombeing performed. The service can avoid this prob-lem by using random initial landmarks in round-robin sequences specific to different /24 networks.
Another problem with round-robin scheduling isthat it keeps triggering measurements from a givennetwork even after a complete set of landmarklatencies to that network has been collected. Theredundant measurements are of little use to the posi-tioning system and might prevent the service fromtriggering more useful latencies when the landmarkload increases.
We chose to avoid triggering redundant measure-ments by simply limiting the number of round-robinsessions to a given network. For example, once acomplete set of latencies has been collected for agiven network, no other measurements are triggeredto that network for some time. The duration of theinterval between sessions generally depends on howoften new coordinates are being computed. In thecurrent setup, we allow only one round-robin ses-sion per /24 network every hour.
3.3.4. Scheduling policy
The complete scheduling policy consists of threesteps taking place every time a measurement can
0
0.1
0.2
0.3
0.4
0.5
0.6
0.7
0.8
0.9
1
0 0.2 0.4 0.6 0.8 1
CD
F
10-90 percentile range (divided by mean)
Fig. 5. Variation of latencies to hosts within a /24 network.
M. Szymaniak et al. / Computer Networks 52 (2008) 1343–1364 1351
Author's personal copy
be triggered to some client. First, the policy deter-mines the client’s /24 network by dropping the last8 bits of the client’s IP address.
Next, the policy inspects the round-robin statespecific to that network and checks whether anymore measurements should be performed to it inits current round-robin session. If not, then no mea-surement is triggered. Otherwise, the policy identi-fies the next landmark that should perform themeasurement.
Finally, the policy verifies the approximate loadof the selected landmark. If that landmark is cur-rently overloaded, then no measurement is trig-gered. Otherwise, the policy updates both theround-robin state and the landmark load informa-tion, and instructs the service to trigger a measure-ment between the client and the landmark.
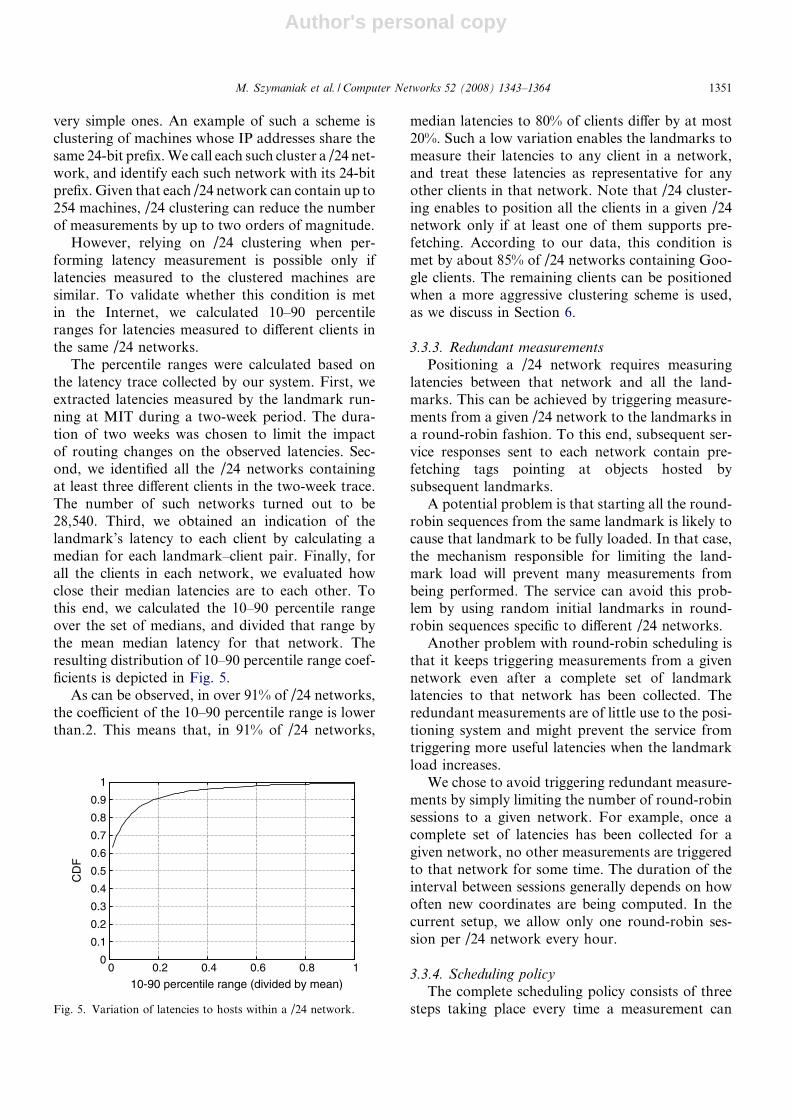
3.3.5. Scheduler separation
Although the scheduling policy is conceptuallysimple, it is not obvious how to implement it in alarge-scale Web system. This is because it requiresthe service to maintain state for round-robin land-mark selection and an approximation of landmarks’load. The service needs this information to decidewhich of its generated Web pages should containprefetching instructions.
Unfortunately, given the large number and wide-area distribution of Web servers in a large-scaleWeb system, it is unlikely that they can efficientlyshare state among them [19]. This is because of fre-quent updates that make the state difficult to keepconsistent without degrading the scheduling perfor-mance, even though the state itself is relatively small(about 8 bytes for round-robin information percluster, plus another 8 bytes per landmark for theload information).
We decided to solve this problem by splitting themeasurement-triggering mechanism into two parts(see Fig. 6): First, while responding to regular clientrequests, the Web servers implementing the serviceinclude static prefetching tags into a small fractionof their responses. Static prefetching tags do notpoint at any particular landmark. Instead, theypoint at a dedicated cluster of Web servers takingcare of measurement scheduling.
The second part of the triggering mechanism isimplemented by the scheduling cluster. Eachmachine in the cluster maintains its local schedulingstate, and processes an even share of all the requeststriggered by the static prefetching tags. For eachsuch request, it invokes the scheduling policy toselect the target landmark for the measurement thatthe request can potentially trigger.
The scheduling policy might sometimes decidenot to trigger any measurement for a given prefetch-ing request, for example when all the landmarks areoverloaded. In that case, the prefetching request isserviced locally by the scheduling cluster. Note thatthe scheduling cluster could even exploit the perfor-mance-neutral nature of prefetching requests anddrop them completely.
Typically, however, the scheduling policy returnsthe address of some landmark. The scheduling clus-ter can then re-direct the prefetching request to thatlandmark using an HTTP-302 response [31]. Thiscauses the clients to re-issue the prefetching requestto the landmark exactly as if the landmark addresswas put in the prefetching tag embedded inside theoriginal service response. Note that although thecontent prefetched from the landmarks is never dis-played to the users, it can still contain some briefinformation about the measurements being per-formed. This helps preventing users from becoming
static prefetching tags
Prefetching request
Scheduling cluster
Client Web browser
Regular client request
Prefetching request
Landmark
(redirected)
1
2
3
4
5
6
Service Web server
Response containing
S
B
W
L
HTTP redirection Short HTTP response
Fig. 6. Two-phase measurement triggering.
1352 M. Szymaniak et al. / Computer Networks 52 (2008) 1343–1364
Author's personal copy
suspicious about the prefetching requests after theyare detected by client-side firewalls.
3.3.6. Web server logicEmbedding static prefetching tags prevents the
regular Web servers from maintaining any schedul-ing state, as all the prefetching tags always point atthe URL of the scheduling cluster. However, theWeb servers must still be able to decide whether agiven response should carry a static prefetchingtag, or not. For now, we assume that Web serversinsert at most one prefetching tag per response.
One way of enabling the Web servers to decideon insertion of prefetching tags would be to relyon client identifiers embedded in service cookies.In that case, the Web servers would include pre-fetching tags in responses sent to clients holdingcookies with identifiers meeting the condition that
IDclient % X ¼ 0;
where X denotes some divisor value, which can beused to adjust the number of generated prefetchingtags to the capacity of the scheduling cluster. Anattractive property of this approach is that it keepstriggering measurements from the same clients,which should intuitively result in quickly collectingmultiple measurements required to position theseclients.
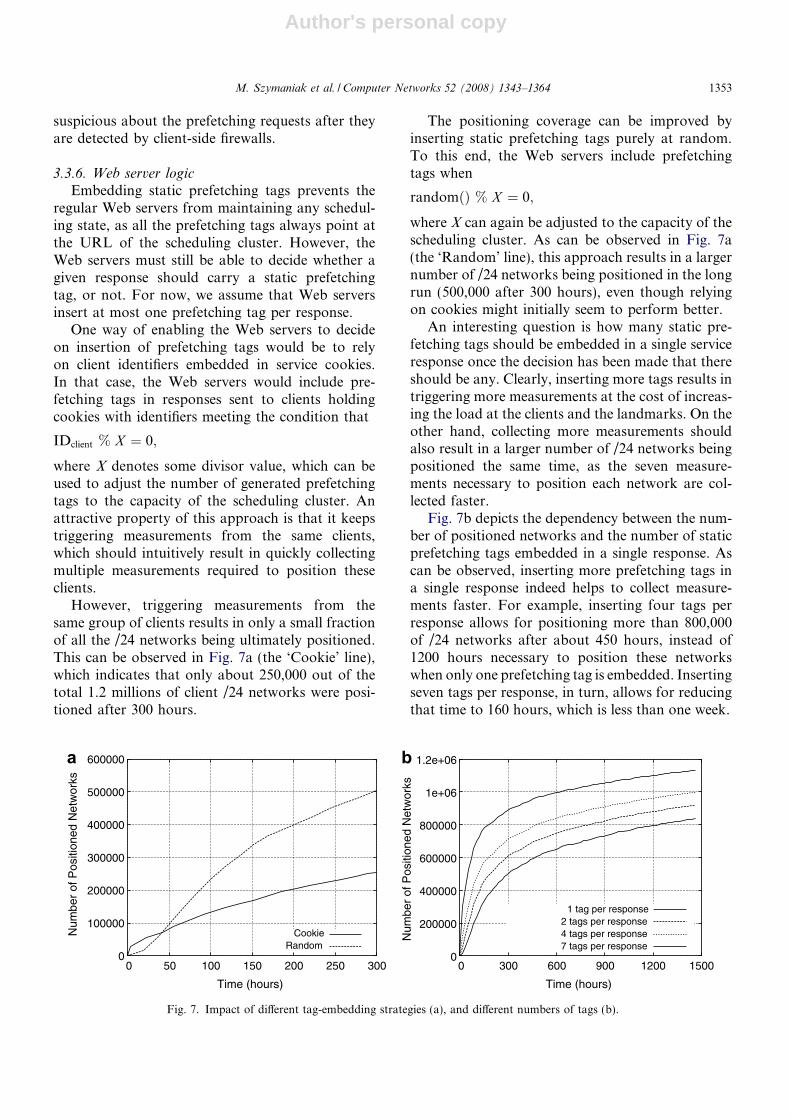
However, triggering measurements from thesame group of clients results in only a small fractionof all the /24 networks being ultimately positioned.This can be observed in Fig. 7a (the ‘Cookie’ line),which indicates that only about 250,000 out of thetotal 1.2 millions of client /24 networks were posi-tioned after 300 hours.
The positioning coverage can be improved byinserting static prefetching tags purely at random.To this end, the Web servers include prefetchingtags when
randomðÞ % X ¼ 0;
where X can again be adjusted to the capacity of thescheduling cluster. As can be observed in Fig. 7a(the ‘Random’ line), this approach results in a largernumber of /24 networks being positioned in the longrun (500,000 after 300 hours), even though relyingon cookies might initially seem to perform better.
An interesting question is how many static pre-fetching tags should be embedded in a single serviceresponse once the decision has been made that thereshould be any. Clearly, inserting more tags results intriggering more measurements at the cost of increas-ing the load at the clients and the landmarks. On theother hand, collecting more measurements shouldalso result in a larger number of /24 networks beingpositioned the same time, as the seven measure-ments necessary to position each network are col-lected faster.
Fig. 7b depicts the dependency between the num-ber of positioned networks and the number of staticprefetching tags embedded in a single response. Ascan be observed, inserting more prefetching tags ina single response indeed helps to collect measure-ments faster. For example, inserting four tags perresponse allows for positioning more than 800,000of /24 networks after about 450 hours, instead of1200 hours necessary to position these networkswhen only one prefetching tag is embedded. Insertingseven tags per response, in turn, allows for reducingthat time to 160 hours, which is less than one week.
0
100000
200000
300000
400000
500000
600000
0 50 100 150 200 250 300
Num
ber
of P
ositi
oned
Net
wor
ks
Time (hours)
CookieRandom
0
200000
400000
600000
800000
1e+06
1.2e+06
0 300 600 900 1200 1500
Num
ber
of P
ositi
oned
Net
wor
ks
Time (hours)
1 tag per response2 tags per response4 tags per response7 tags per response
a b
Fig. 7. Impact of different tag-embedding strategies (a), and different numbers of tags (b).
M. Szymaniak et al. / Computer Networks 52 (2008) 1343–1364 1353

Author's personal copy
3.4. Final architecture
The final system architecture is depicted in Fig. 8.Latency measurements to the clients are triggeredby service Web servers, which embed static prefetch-ing tags inside a fraction of their responses.
The prefetching tags cause the clients to issueprefetching requests to the scheduling cluster, whichre-directs these requests to the landmarks accordingto the scheduling policy. This causes the clients tore-issue the requests to the landmarks, which per-form latency measurements while delivering a shortsystem description. All the measured latencies arereported to the collector.
Once the latencies have been collected, they arestored in measurement logs. These logs are periodi-cally retrieved by a special component called mod-
eler, which processes the latencies and computesnew sets of coordinates, as we discuss next.
4. Latency modeling
The modeler essentially performs two types oftasks: First, it creates a geometric space by comput-ing the landmark coordinates. Second, it computesall the other coordinates relative to the landmark
coordinates. Since both these tasks require someset of latencies as the input, it is tempting to directlyapply the positioning algorithm to the base latenciesstored in the measurement logs.
However, GNP requires its input to contain onlyone indication of latency between a given pair ofmachines. On the other hand, the measurement logsproduced by the controller are likely to contain mul-tiple such indications, as each landmark typicallymeasures its latency to the same /24 network manytimes. Since subsequent latency measurementsbetween the same pair of nodes are likely to returnfluctuating results, the modeler must preprocess themeasurement logs before their contents can bepassed to the GNP implementation.
4.1. Stable latencies
In principle, latencies measured between a givenlandmark–node pair can fluctuate for two types ofreasons. The first types are temporary intermittentconditions that do not affect long-term latenciesbetween landmarks and nodes, such as networkcongestion and high CPU load. The second typesare route changes, which can permanently changelatencies between nodes. The goal of a good latency
Service Web server
static prefetching tagsResponse containing
Prefetching request
Scheduling cluster
Regular client request
Client Web browser
Prefetching request(redirected)
Landmark Collector
HTTP redirection
Short HTTP response
Measured latencies
Coordinates
Modeler
Application
Measurementlog files
W
B
S L C
M
A
1
2 3
4
5
6
7
Fig. 8. Final system architecture.
1354 M. Szymaniak et al. / Computer Networks 52 (2008) 1343–1364
Author's personal copy
preprocessor is to eliminate fluctuations caused bythe intermittent conditions while remaining reactiveto permanent latency changes.
Clearly, network congestion can affect theobserved latencies. If the path between the land-mark and the node is saturated, the measurementpackets are delayed by routers on the path, causingthe observed latency to be longer. Note that the ser-vice should strive to reduce the impact of networkcongestion by avoiding it on the landmark side. Thiscan be achieved by deploying the landmarks in host-ing facilities providing hard bandwidth guarantees.
Apart from network congestion, latencies canalso fluctuate because of high CPU load on eitherthe node or the landmark. The problem with highCPU load on the node is that it might prevent thenode from immediately responding to packets sentby the landmark. This can result in observed laten-cies being longer than they really are. On the otherhand, since the packets exploited by both ICMPprobing and SYNACK/ACK are handled entirelyby the operating system kernels, the delay causedby high load of the node’s CPU is likely to benegligible.
High load on the landmark presents a biggerproblem, as it can prevent the packet sniffer runningon the landmark from timestamping measurementpackets accurately. The resulting inaccuraciesstrongly depend on sniffer implementation. Wetherefore assume that the observed latencies cannot only be higher, but also lower than they reallyare.
Given that temporary intermittent conditionsoccur only occasionally, their resulting measure-ment inaccuracies can be eliminated through statis-tical filtering. To this end, the modeler couldmaintain a history of latencies measured betweeneach landmark–node pair, and identify the reallatency for that pair as the one occurring most com-monly in the history. This could be achieved bymeans of medians, for example.
However, median latencies can change over timeas well. This is caused by long-lasting conditions,such as route changes. As the route between thelandmark and the node changes, its correspondinghistory of latencies contains more and more groupsof latencies, each measured for a different route. Inthat case, medians calculated over complete latencyhistories are not guaranteed to indicate current reallatencies.
We decided to detect route changes by applyingthe sliding percentile concept to the latency history
[14]. To this end, it keeps only a specific numberof most recent measurements in each history, whichshould result in history medians being closer to theactual observed latencies.
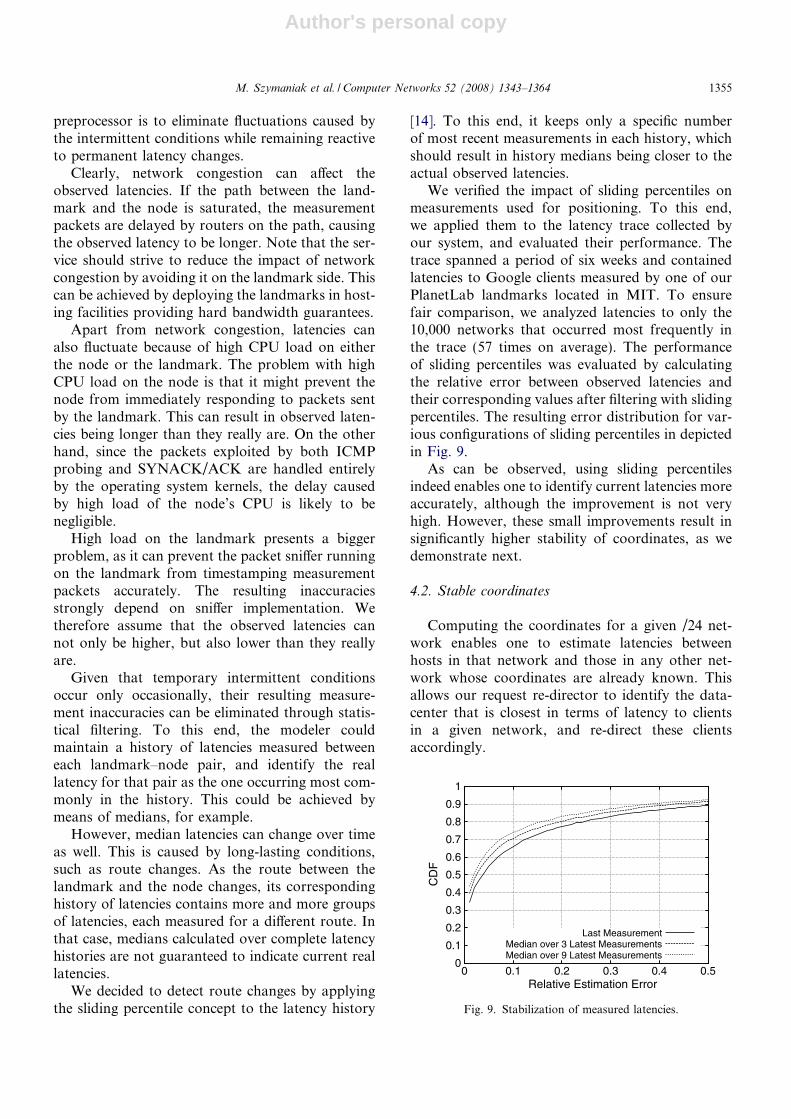
We verified the impact of sliding percentiles onmeasurements used for positioning. To this end,we applied them to the latency trace collected byour system, and evaluated their performance. Thetrace spanned a period of six weeks and containedlatencies to Google clients measured by one of ourPlanetLab landmarks located in MIT. To ensurefair comparison, we analyzed latencies to only the10,000 networks that occurred most frequently inthe trace (57 times on average). The performanceof sliding percentiles was evaluated by calculatingthe relative error between observed latencies andtheir corresponding values after filtering with slidingpercentiles. The resulting error distribution for var-ious configurations of sliding percentiles in depictedin Fig. 9.
As can be observed, using sliding percentilesindeed enables one to identify current latencies moreaccurately, although the improvement is not veryhigh. However, these small improvements result insignificantly higher stability of coordinates, as wedemonstrate next.
4.2. Stable coordinates
Computing the coordinates for a given /24 net-work enables one to estimate latencies betweenhosts in that network and those in any other net-work whose coordinates are already known. Thisallows our request re-director to identify the data-center that is closest in terms of latency to clientsin a given network, and re-direct these clientsaccordingly.
0
0.1
0.2
0.3
0.4
0.5
0.6
0.7
0.8
0.9
1
0 0.1 0.2 0.3 0.4 0.5
CD
F
Relative Estimation Error
Last MeasurementMedian over 3 Latest MeasurementsMedian over 9 Latest Measurements
Fig. 9. Stabilization of measured latencies.
M. Szymaniak et al. / Computer Networks 52 (2008) 1343–1364 1355
Author's personal copy
However, latency fluctuations cause the coordi-nates to change over time. The degree of thesechanges determines how useful the coordinates areto make long-term decisions, which are importantfor the above applications. For example, when cli-ent requests are re-directed using DNS, it can cachethe responses produced by the re-directing DNSservers for several hours, which causes the re-direct-ing decisions based on coordinates produced by oursystem to remain in effect for a relatively long time.
To investigate the influence of latency fluctua-tions on GNP coordinates, we evaluated the stabil-ity of coordinates produced by our system. We usedthe trace of latencies between the landmarks and the10,000 most popular /24 networks selected for theprevious experiment. We split the six-week traceinto two parts. The first part was two-weeks longand was used as a basis to compute the initial coor-dinates of all the /24 networks. The remaining partof four weeks was used as a test trace, based on
which we investigated how the coordinates of /24networks change over time in terms of distance totheir initial counterparts. To this end, for every testtrace hour, we re-computed the coordinates of allthe /24 networks for which latency measurementswere performed within that hour. This resulted inre-positioning on average 1271 networks everyhour.
Ideally, at each hour, we would compute the dis-tance between the current- and initial coordinates ofeach /24 network. In many cases, however, due tothe lack of latency measurement within the lasthour, it is impossible to compute the current coordi-nates directly. However, this does not mean thatthese coordinates did not change during that hour,but just that we did not measure latencies frequentlyenough.
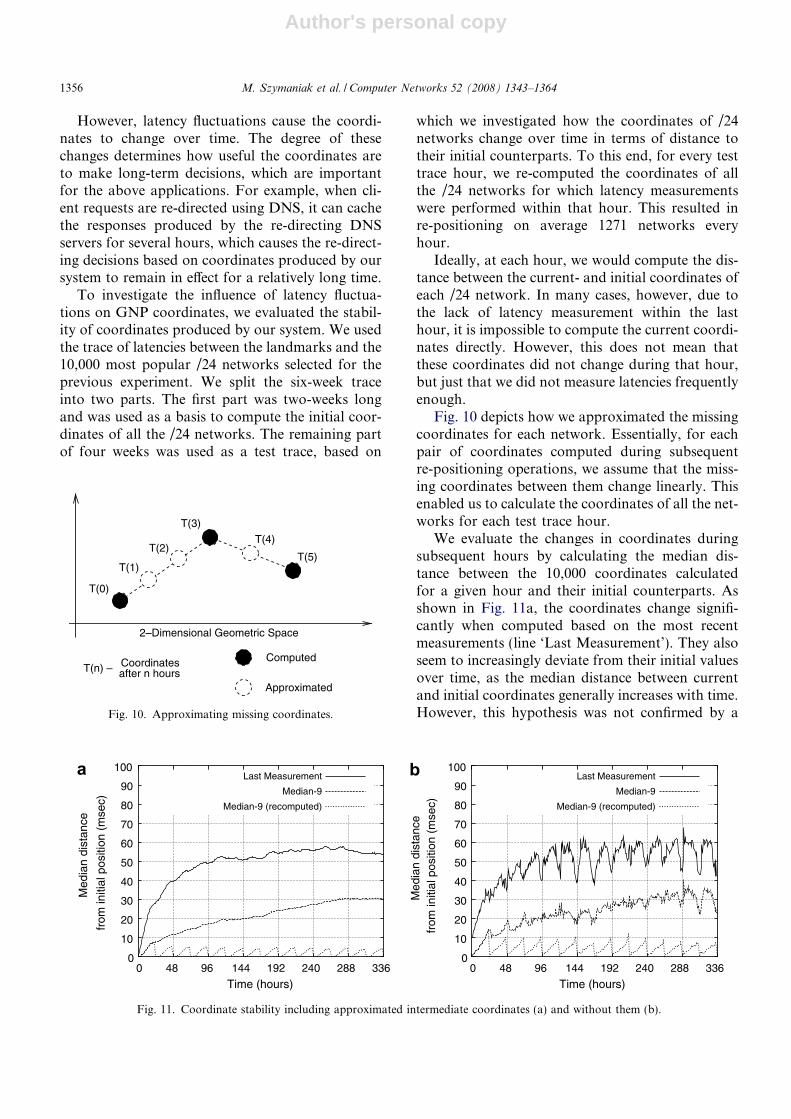
Fig. 10 depicts how we approximated the missingcoordinates for each network. Essentially, for eachpair of coordinates computed during subsequentre-positioning operations, we assume that the miss-ing coordinates between them change linearly. Thisenabled us to calculate the coordinates of all the net-works for each test trace hour.
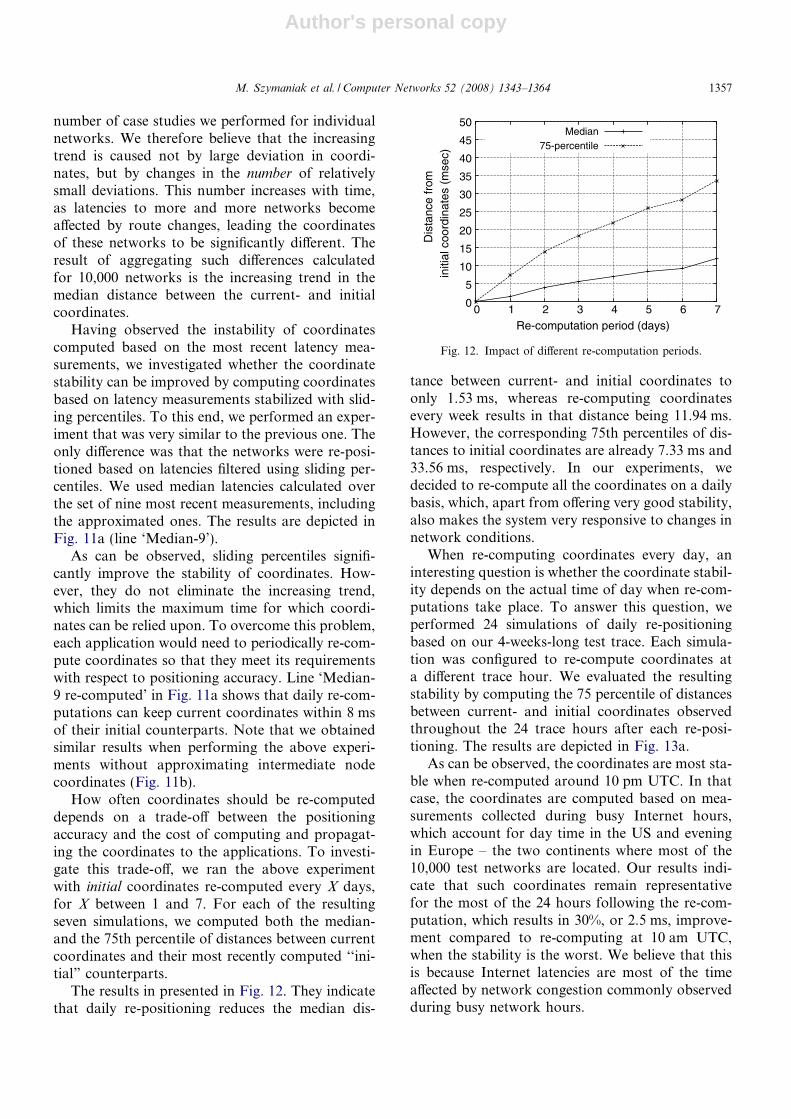
We evaluate the changes in coordinates duringsubsequent hours by calculating the median dis-tance between the 10,000 coordinates calculatedfor a given hour and their initial counterparts. Asshown in Fig. 11a, the coordinates change signifi-cantly when computed based on the most recentmeasurements (line ‘Last Measurement’). They alsoseem to increasingly deviate from their initial valuesover time, as the median distance between currentand initial coordinates generally increases with time.However, this hypothesis was not confirmed by a
T(0)
T(1)
T(2)
T(3)
T(4)
T(5)
2–Dimensional Geometric Space
T(n) – after n hoursCoordinates Computed
Approximated
Fig. 10. Approximating missing coordinates.
0
10
20
30
40
50
60
70
80
90
100
0 48 96 144 192 240 288 336
Med
ian
dist
ance
from
initi
al p
ositi
on (
mse
c)
Time (hours)
Last Measurement
Median-9
Median-9 (recomputed)
0
10
20
30
40
50
60
70
80
90
100
0 48 96 144 192 240 288 336
Med
ian
dist
ance
from
initi
al p
ositi
on (
mse
c)
Time (hours)
Last Measurement
Median-9
Median-9 (recomputed)
a b
Fig. 11. Coordinate stability including approximated intermediate coordinates (a) and without them (b).
1356 M. Szymaniak et al. / Computer Networks 52 (2008) 1343–1364
Author's personal copy
number of case studies we performed for individualnetworks. We therefore believe that the increasingtrend is caused not by large deviation in coordi-nates, but by changes in the number of relativelysmall deviations. This number increases with time,as latencies to more and more networks becomeaffected by route changes, leading the coordinatesof these networks to be significantly different. Theresult of aggregating such differences calculatedfor 10,000 networks is the increasing trend in themedian distance between the current- and initialcoordinates.
Having observed the instability of coordinatescomputed based on the most recent latency mea-surements, we investigated whether the coordinatestability can be improved by computing coordinatesbased on latency measurements stabilized with slid-ing percentiles. To this end, we performed an exper-iment that was very similar to the previous one. Theonly difference was that the networks were re-posi-tioned based on latencies filtered using sliding per-centiles. We used median latencies calculated overthe set of nine most recent measurements, includingthe approximated ones. The results are depicted inFig. 11a (line ‘Median-9’).
As can be observed, sliding percentiles signifi-cantly improve the stability of coordinates. How-ever, they do not eliminate the increasing trend,which limits the maximum time for which coordi-nates can be relied upon. To overcome this problem,each application would need to periodically re-com-pute coordinates so that they meet its requirementswith respect to positioning accuracy. Line ‘Median-9 re-computed’ in Fig. 11a shows that daily re-com-putations can keep current coordinates within 8 msof their initial counterparts. Note that we obtainedsimilar results when performing the above experi-ments without approximating intermediate nodecoordinates (Fig. 11b).
How often coordinates should be re-computeddepends on a trade-off between the positioningaccuracy and the cost of computing and propagat-ing the coordinates to the applications. To investi-gate this trade-off, we ran the above experimentwith initial coordinates re-computed every X days,for X between 1 and 7. For each of the resultingseven simulations, we computed both the median-and the 75th percentile of distances between currentcoordinates and their most recently computed ‘‘ini-tial” counterparts.
The results in presented in Fig. 12. They indicatethat daily re-positioning reduces the median dis-
tance between current- and initial coordinates toonly 1.53 ms, whereas re-computing coordinatesevery week results in that distance being 11.94 ms.However, the corresponding 75th percentiles of dis-tances to initial coordinates are already 7.33 ms and33.56 ms, respectively. In our experiments, wedecided to re-compute all the coordinates on a dailybasis, which, apart from offering very good stability,also makes the system very responsive to changes innetwork conditions.
When re-computing coordinates every day, aninteresting question is whether the coordinate stabil-ity depends on the actual time of day when re-com-putations take place. To answer this question, weperformed 24 simulations of daily re-positioningbased on our 4-weeks-long test trace. Each simula-tion was configured to re-compute coordinates ata different trace hour. We evaluated the resultingstability by computing the 75 percentile of distancesbetween current- and initial coordinates observedthroughout the 24 trace hours after each re-posi-tioning. The results are depicted in Fig. 13a.
As can be observed, the coordinates are most sta-ble when re-computed around 10 pm UTC. In thatcase, the coordinates are computed based on mea-surements collected during busy Internet hours,which account for day time in the US and eveningin Europe – the two continents where most of the10,000 test networks are located. Our results indi-cate that such coordinates remain representativefor the most of the 24 hours following the re-com-putation, which results in 30%, or 2.5 ms, improve-ment compared to re-computing at 10 am UTC,when the stability is the worst. We believe that thisis because Internet latencies are most of the timeaffected by network congestion commonly observedduring busy network hours.
0
5
10
15
20
25
30
35
40
45
50
0 1 2 3 4 5 6 7
Dis
tanc
e fr
omin
itial
coo
rdin
ates
(m
sec)
Re-computation period (days)
Median75-percentile
Fig. 12. Impact of different re-computation periods.
M. Szymaniak et al. / Computer Networks 52 (2008) 1343–1364 1357
Author's personal copy
For the sake of completeness, we also checkedhow different re-positioning hours influence the sta-bility of coordinates re-computed every 2 days ormore. To this end, we again simulated coordinatere-computations every N days (for N from 1 to 7)based on our test trace. We performed two simula-tions, each configured to re-compute positions at adifferent hour: 10 pm UTC and 10 am UTC. Theresults are presented in Fig. 13b. As can beobserved, the improvement of 2.5 ms remainsroughly constant irrespective of how often coordi-nates are re-computed, which reduces its impact toapproximately 10% when re-computing coordinatesevery 4 days or more.
5. Coordinate-based client re-direction
Deploying the positioning system enables Googleto implement various latency-driven applicationsthat shall improve access latency for its clients.One of such applications is client re-direction: basedon the coordinates produced by GNP, we can re-direct each client to a replica that is closest to thatclient in terms of latency. To this end, we calculatethe distance between the coordinates of the clientand the coordinates of each replica, and select thereplica with the shortest distance to the client.
5.1. Absolute performance
We verified the efficiency of coordinate-based re-direction. To this end, we positioned the 10,000 /24networks based on the median latencies measuredbetween these networks and 20 candidate land-marks deployed on PlanetLab nodes over a period
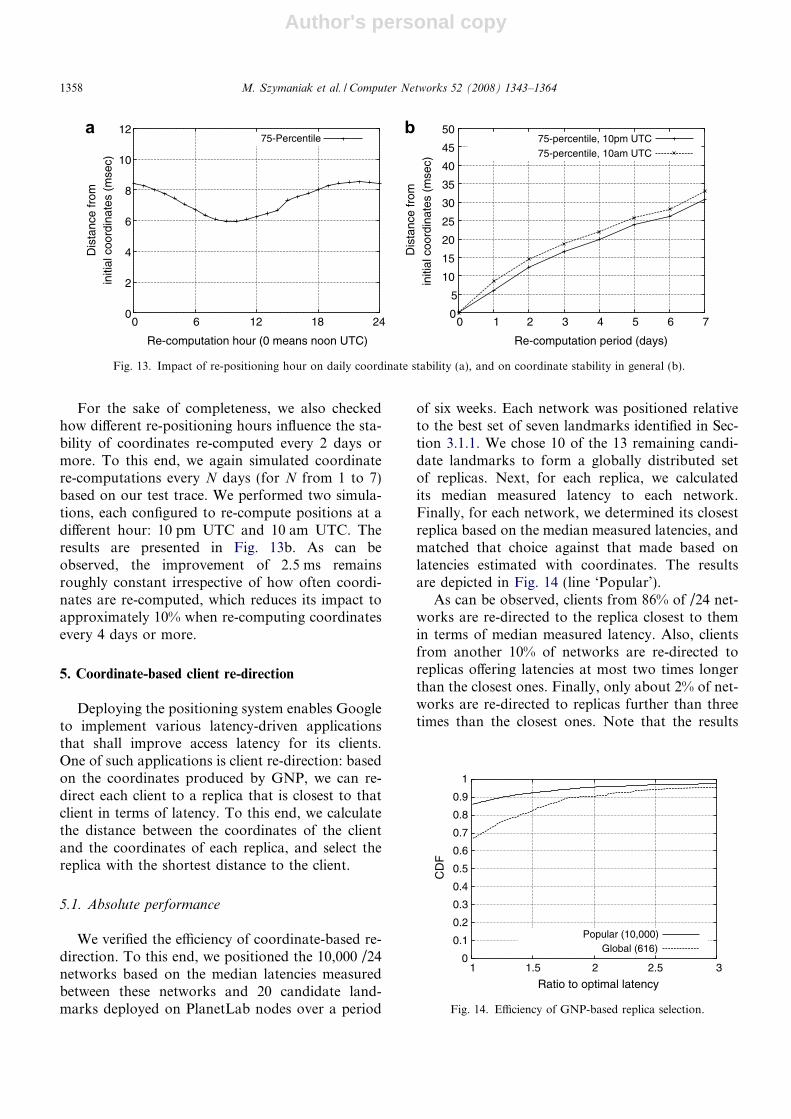
of six weeks. Each network was positioned relativeto the best set of seven landmarks identified in Sec-tion 3.1.1. We chose 10 of the 13 remaining candi-date landmarks to form a globally distributed setof replicas. Next, for each replica, we calculatedits median measured latency to each network.Finally, for each network, we determined its closestreplica based on the median measured latencies, andmatched that choice against that made based onlatencies estimated with coordinates. The resultsare depicted in Fig. 14 (line ‘Popular’).
As can be observed, clients from 86% of /24 net-works are re-directed to the replica closest to themin terms of median measured latency. Also, clientsfrom another 10% of networks are re-directed toreplicas offering latencies at most two times longerthan the closest ones. Finally, only about 2% of net-works are re-directed to replicas further than threetimes than the closest ones. Note that the results
0
2
4
6
8
10
12
0 6 12 18 24
Dis
tanc
e fr
omin
itial
coo
rdin
ates
(m
sec)
Re-computation hour (0 means noon UTC)
75-Percentile
0
5
10
15
20
25
30
35
40
45
50
0 1 2 3 4 5 6 7
Dis
tanc
e fr
omin
itial
coo
rdin
ates
(m
sec)
Re-computation period (days)
75-percentile, 10pm UTC75-percentile, 10am UTC
a b
Fig. 13. Impact of re-positioning hour on daily coordinate stability (a), and on coordinate stability in general (b).
0
0.1
0.2
0.3
0.4
0.5
0.6
0.7
0.8
0.9
1
1 1.5 2 2.5 3
CD
F
Ratio to optimal latency
Popular (10,000)Global (616)
Fig. 14. Efficiency of GNP-based replica selection.
1358 M. Szymaniak et al. / Computer Networks 52 (2008) 1343–1364
Author's personal copy
presented in [24] indicate that employing alternativeembedding schemes might further improve the per-formance of coordinate-based client re-direction.
We have also performed the above experimentfor the set of 616 globally-distributed clients thatwe constructed in Section 3.1.1. The results are alsodepicted in Fig. 14 (line ‘Global’). It shows thatcoordinate-based re-direction selects the closest rep-lica for clients in about 67% of globally-distributed/24 networks, and replicas offering latencies at mosttwo times higher than optimal in for clients inanother 24% of such networks. We believe thatthe suboptimal replica selection in the remainingcases is caused by node mispositioning. Nodes aretypically mispositioned when they have long laten-cies to all the landmarks, or when the latencies oftheir network paths to the landmarks are self-incon-sistent from the perspective of GNP, for example,because of multi-homing [35]. Another reason forsuboptimal client re-direction decisions might beshort latencies between the client and more thanone replica. As discussed in Section 6.2, GNP posi-tioning has a lower accuracy for low-latency estima-tions. However, for such clients located close to thereplicas, one may consider that any re-directiondecision is acceptable.
5.2. Relative performance
Although GNP-based re-direction seems to per-form well in terms of absolute latency values, ithas recently been suggested that absolute metricsare not enough to completely evaluate re-directionefficiency [36]. This is because re-directed clientssometimes care more about relative dependencies
between latencies to different replicas, rather thanabout their absolute values. Such situations mightoccur when relative ordering of nodes influencesthe application behavior in terms of, for example,data propagation strategy (e.g., gossiping order ormulti-cast tree structure).
The relative performance of GNP-based re-direc-tion can be measured by means of another metric,called Relative Rank Loss (rrl). For each client, itcreates two replica rankings: one calculated basedon measured client-to-replica latencies, and anotherbased on latency estimates provided by GNP. Giventhe two rankings, the rrl of each client C can becomputed according to the following formula:
rrlðC;RÞ ¼ fðx; yÞjx 6¼ y and swapped ðx; yÞgjRjðjRj � 1Þ ;
where R is the set of replicas, (x,y) are elements ofR � R, and swapped(x,y) is true when the relativeordering of x and y is different in the two rankingscreated for client C. rrl can also be interpreted asthe probability that swapped(x,y) is true for anytwo different replicas.
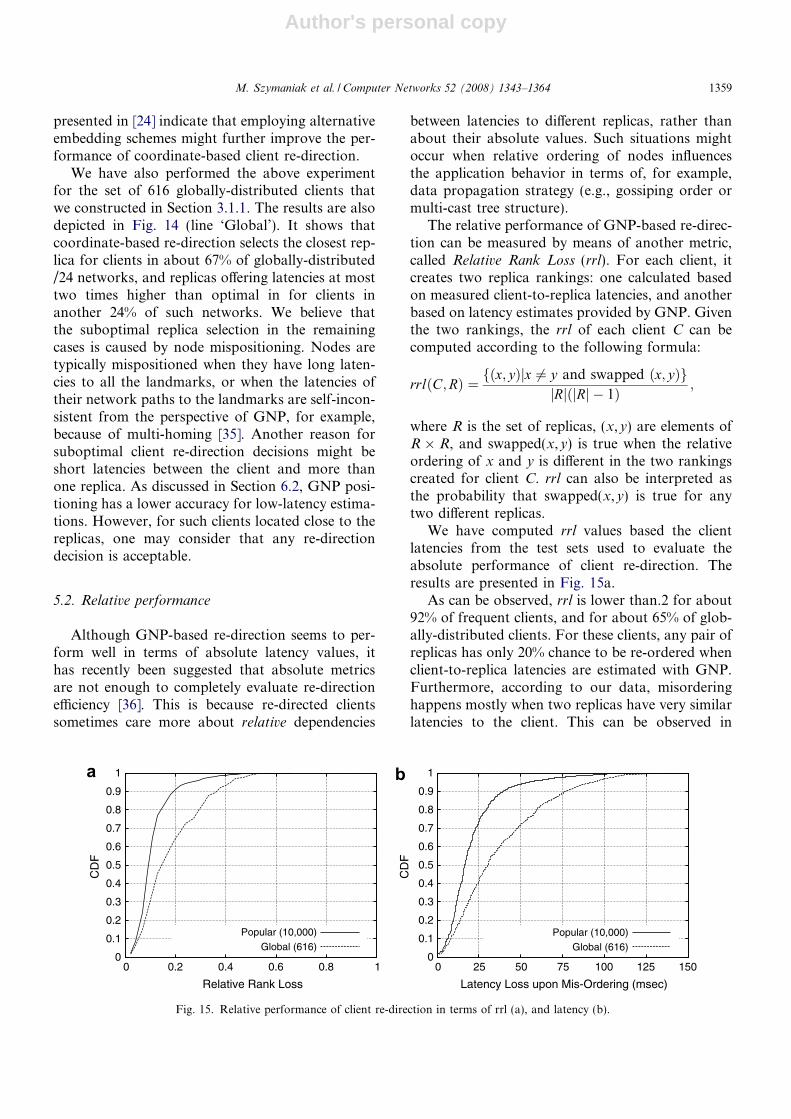
We have computed rrl values based the clientlatencies from the test sets used to evaluate theabsolute performance of client re-direction. Theresults are presented in Fig. 15a.
As can be observed, rrl is lower than.2 for about92% of frequent clients, and for about 65% of glob-ally-distributed clients. For these clients, any pair ofreplicas has only 20% chance to be re-ordered whenclient-to-replica latencies are estimated with GNP.Furthermore, according to our data, misorderinghappens mostly when two replicas have very similarlatencies to the client. This can be observed in
0
0.1
0.2
0.3
0.4
0.5
0.6
0.7
0.8
0.9
1
0 0.2 0.4 0.6 0.8 1
CD
F
Relative Rank Loss
Popular (10,000)Global (616)
0
0.1
0.2
0.3
0.4
0.5
0.6
0.7
0.8
0.9
1
0 25 50 75 100 125 150
CD
F
Latency Loss upon Mis-Ordering (msec)
Popular (10,000)Global (616)
a b
Fig. 15. Relative performance of client re-direction in terms of rrl (a), and latency (b).
M. Szymaniak et al. / Computer Networks 52 (2008) 1343–1364 1359
Author's personal copy
Fig. 15b, which depicts the distribution of differ-ences in client-to-replica latencies when a misorder-ing occurs. It shows that loss in client-to-replicalatency resulting from misordering is less than50 ms for 95% of frequent- and 73% of globally-dis-tributed clients.
5.3. DNS considerations
A potential problem when using client coordi-nates for request re-direction is that large-scaleInternet services typically re-direct their clients usingDNS. In that case, the re-directing decisions aremade based on the addresses of client-side DNSservers rather than on these of end clients themselves[37]. Meanwhile, our positioning system can com-pute coordinates only for /24 networks that containat least one Web client, which is relatively uncom-mon for networks used by client-side DNS servers.This means that the service might be unable to deter-mine the coordinates of a DNS server, which in turnmakes it impossible to select the best replica for theservice clients which access that server.
We solve this problem by associating networkscontaining Google clients with networks containingDNS servers these clients use. To this end, onecould rely on network-aware clustering, which iden-tifies co-located /24 networks as those falling withinthe same BGP prefix [38]. However, this solutionimplicitly assumes that clients typically use DNSservers that belong to the same BGP prefix, whichhas been shown to be false in most cases [39]. Wetherefore exploit a proprietary mechanism that pre-cisely discovers which DNS server is used by eachGoogle client. The details of this mechanism areout of scope of this article.
6. Generic latency estimation service
Given that our system collects latency informa-tion about millions of Internet hosts, it can poten-tially be used to predict latencies between arbitrarymachines in the Internet, which are not necessarilyGoogle clients. Such a generic latency estimationservice could be useful for any application thatneeds to estimate end-to-end latencies betweenInternet hosts, such as a peer-to-peer overlay or athird-party content delivery network.
In this section, we investigate to what extent oursystem succeeds in predicting such latencies. To thisend, we evaluate the accuracy of latency estimatespredicted for hosts that have never been involved
in any operation performed by our system. Such anon-involvement means that these hosts have neverbeen instrumented by our system, and that we havenever measured their base latencies in any way.Instead, we determine the coordinates of these hostsby simply taking the coordinates of their co-locatedGoogle clients.
A potential problem at this stage is that our sys-tem can estimate latencies only between /24 net-works containing Google clients. However, whileusing /24 clustering allows us to position a hugenumber of Internet hosts, there are also many hoststhat cannot be positioned when such an approach isfollowed. This is true for network servers, for exam-ple, which are typically deployed in different net-works than user machines. We circumvent thisproblem by clustering Google clients into BGP pre-fixes, and not into /24 networks. Such coarse-grainclustering enables us to position more hosts at theexpense of potential loss in estimation accuracy, aslatencies to machines located in the same BGP pre-fixes are likely to be more diverse than those tomachines located in the same /24 networks.
Fair accuracy evaluation requires that latency esti-mates produced by our system are compared againsttheir corresponding measured latencies. We use twodatasets of measured latencies derived from third-party latency traces, called PlanetLab and RIPE.Both these datasets contain matrices of all-pair laten-cies measured between a number of machines duringsubsequent hours in November 2006. Each matrix isspecific to a different hour and contains minimumlatencies observed for given pairs of machinesthroughout that hour. We chose to use minimumlatency values because they correspond to the ‘‘emptypath” latencies that our system is striving to estimate.
The estimation accuracy is evaluated by measur-ing the relative difference between latencies found ineach dataset against their estimated counterparts.To ensure the fairness of comparison, all the esti-mates are computed based on the data collectedbefore their corresponding measurements wereperformed.
6.1. PlanetLab latencies
The PlanetLab dataset contains latencies mea-sured between 489 PlanetLab nodes. It was derivedfrom the latency trace collected by Jeremy Striblingfor his ‘‘all-pair pings” project [40]. To this end, weaggregated the original latencies (measured every15 min) into hourly all-pair matrices.
1360 M. Szymaniak et al. / Computer Networks 52 (2008) 1343–1364
Author's personal copy
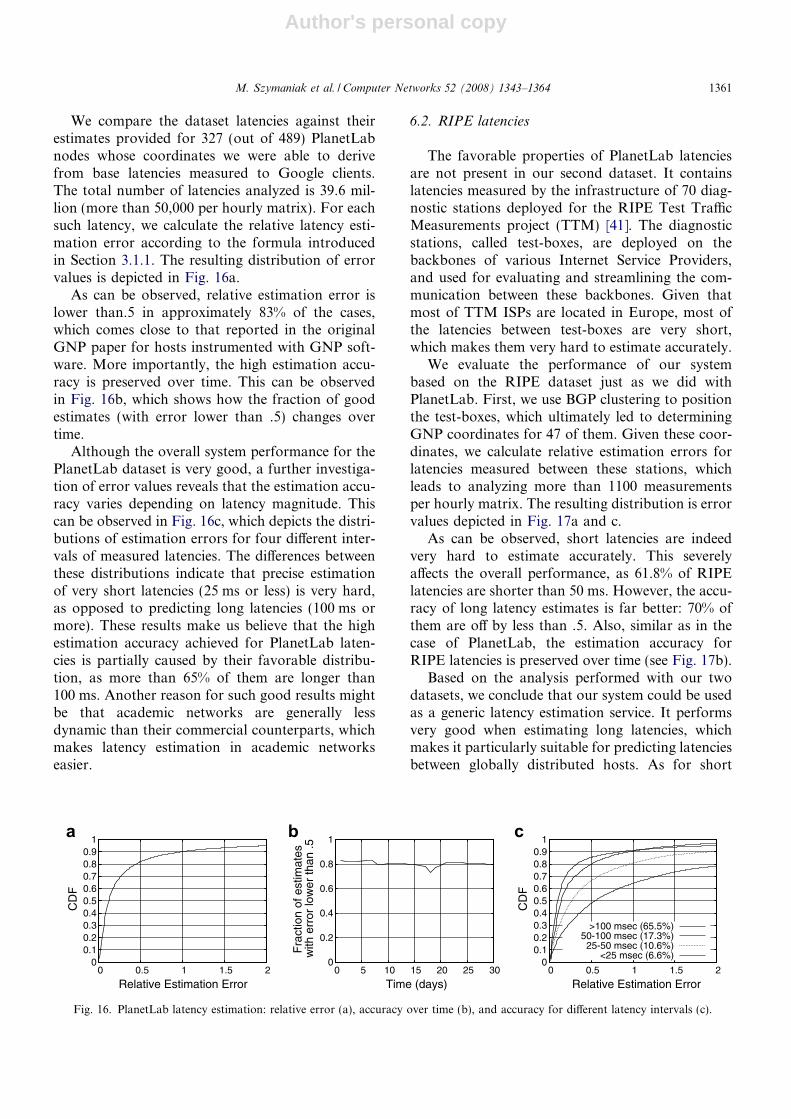
We compare the dataset latencies against theirestimates provided for 327 (out of 489) PlanetLabnodes whose coordinates we were able to derivefrom base latencies measured to Google clients.The total number of latencies analyzed is 39.6 mil-lion (more than 50,000 per hourly matrix). For eachsuch latency, we calculate the relative latency esti-mation error according to the formula introducedin Section 3.1.1. The resulting distribution of errorvalues is depicted in Fig. 16a.
As can be observed, relative estimation error islower than.5 in approximately 83% of the cases,which comes close to that reported in the originalGNP paper for hosts instrumented with GNP soft-ware. More importantly, the high estimation accu-racy is preserved over time. This can be observedin Fig. 16b, which shows how the fraction of goodestimates (with error lower than .5) changes overtime.
Although the overall system performance for thePlanetLab dataset is very good, a further investiga-tion of error values reveals that the estimation accu-racy varies depending on latency magnitude. Thiscan be observed in Fig. 16c, which depicts the distri-butions of estimation errors for four different inter-vals of measured latencies. The differences betweenthese distributions indicate that precise estimationof very short latencies (25 ms or less) is very hard,as opposed to predicting long latencies (100 ms ormore). These results make us believe that the highestimation accuracy achieved for PlanetLab laten-cies is partially caused by their favorable distribu-tion, as more than 65% of them are longer than100 ms. Another reason for such good results mightbe that academic networks are generally lessdynamic than their commercial counterparts, whichmakes latency estimation in academic networkseasier.
6.2. RIPE latencies
The favorable properties of PlanetLab latenciesare not present in our second dataset. It containslatencies measured by the infrastructure of 70 diag-nostic stations deployed for the RIPE Test TrafficMeasurements project (TTM) [41]. The diagnosticstations, called test-boxes, are deployed on thebackbones of various Internet Service Providers,and used for evaluating and streamlining the com-munication between these backbones. Given thatmost of TTM ISPs are located in Europe, most ofthe latencies between test-boxes are very short,which makes them very hard to estimate accurately.
We evaluate the performance of our systembased on the RIPE dataset just as we did withPlanetLab. First, we use BGP clustering to positionthe test-boxes, which ultimately led to determiningGNP coordinates for 47 of them. Given these coor-dinates, we calculate relative estimation errors forlatencies measured between these stations, whichleads to analyzing more than 1100 measurementsper hourly matrix. The resulting distribution is errorvalues depicted in Fig. 17a and c.
As can be observed, short latencies are indeedvery hard to estimate accurately. This severelyaffects the overall performance, as 61.8% of RIPElatencies are shorter than 50 ms. However, the accu-racy of long latency estimates is far better: 70% ofthem are off by less than .5. Also, similar as in thecase of PlanetLab, the estimation accuracy forRIPE latencies is preserved over time (see Fig. 17b).
Based on the analysis performed with our twodatasets, we conclude that our system could be usedas a generic latency estimation service. It performsvery good when estimating long latencies, whichmakes it particularly suitable for predicting latenciesbetween globally distributed hosts. As for short
0 0.1 0.2 0.3 0.4 0.5 0.6 0.7 0.8 0.9
1
0 0.5 1 1.5 2
CD
F
Relative Estimation Error
0
0.2
0.4
0.6
0.8
1
0 5 10 15 20 25 30
Fra
ctio
n of
est
imat
esw
ith e
rror
low
er th
an .5
Time (days)
0 0.1 0.2 0.3 0.4 0.5 0.6 0.7 0.8 0.9
1
0 0.5 1 1.5 2
CD
F
Relative Estimation Error
>100 msec (65.5%)50-100 msec (17.3%)25-50 msec (10.6%)
<25 msec (6.6%)
a b c
Fig. 16. PlanetLab latency estimation: relative error (a), accuracy over time (b), and accuracy for different latency intervals (c).
M. Szymaniak et al. / Computer Networks 52 (2008) 1343–1364 1361
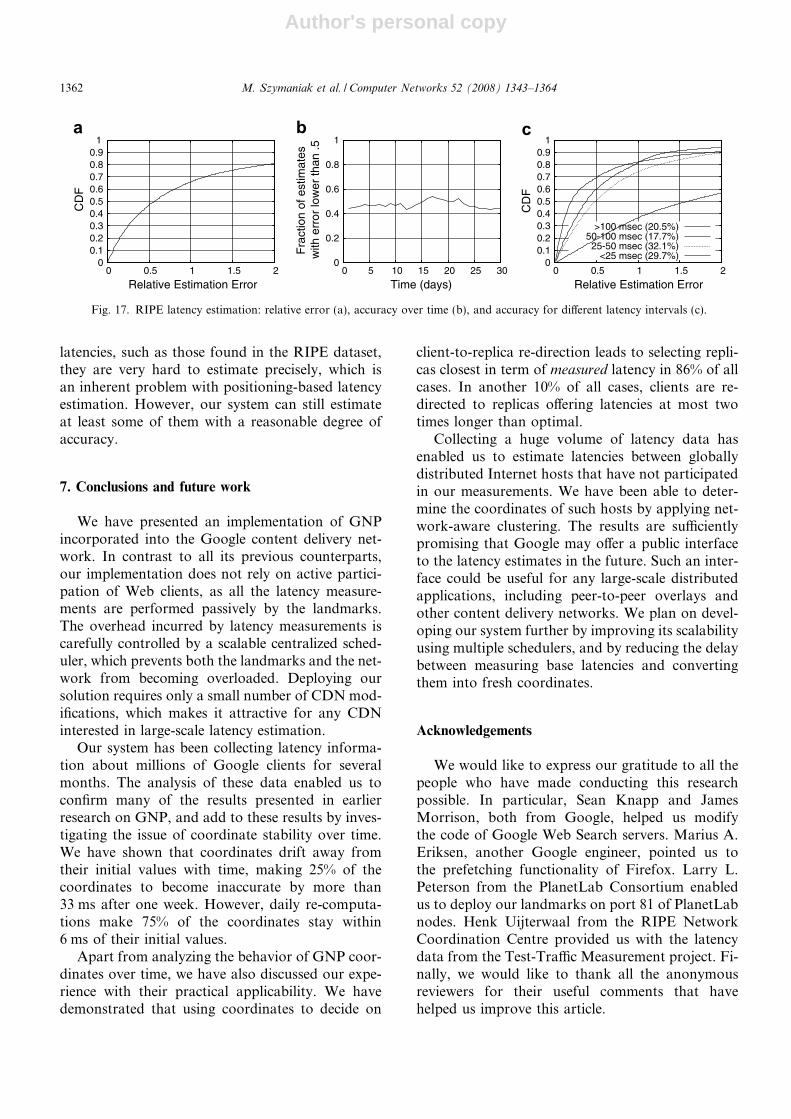
Author's personal copy
latencies, such as those found in the RIPE dataset,they are very hard to estimate precisely, which isan inherent problem with positioning-based latencyestimation. However, our system can still estimateat least some of them with a reasonable degree ofaccuracy.
7. Conclusions and future work
We have presented an implementation of GNPincorporated into the Google content delivery net-work. In contrast to all its previous counterparts,our implementation does not rely on active partici-pation of Web clients, as all the latency measure-ments are performed passively by the landmarks.The overhead incurred by latency measurements iscarefully controlled by a scalable centralized sched-uler, which prevents both the landmarks and the net-work from becoming overloaded. Deploying oursolution requires only a small number of CDN mod-ifications, which makes it attractive for any CDNinterested in large-scale latency estimation.
Our system has been collecting latency informa-tion about millions of Google clients for severalmonths. The analysis of these data enabled us toconfirm many of the results presented in earlierresearch on GNP, and add to these results by inves-tigating the issue of coordinate stability over time.We have shown that coordinates drift away fromtheir initial values with time, making 25% of thecoordinates to become inaccurate by more than33 ms after one week. However, daily re-computa-tions make 75% of the coordinates stay within6 ms of their initial values.
Apart from analyzing the behavior of GNP coor-dinates over time, we have also discussed our expe-rience with their practical applicability. We havedemonstrated that using coordinates to decide on
client-to-replica re-direction leads to selecting repli-cas closest in term of measured latency in 86% of allcases. In another 10% of all cases, clients are re-directed to replicas offering latencies at most twotimes longer than optimal.
Collecting a huge volume of latency data hasenabled us to estimate latencies between globallydistributed Internet hosts that have not participatedin our measurements. We have been able to deter-mine the coordinates of such hosts by applying net-work-aware clustering. The results are sufficientlypromising that Google may offer a public interfaceto the latency estimates in the future. Such an inter-face could be useful for any large-scale distributedapplications, including peer-to-peer overlays andother content delivery networks. We plan on devel-oping our system further by improving its scalabilityusing multiple schedulers, and by reducing the delaybetween measuring base latencies and convertingthem into fresh coordinates.
Acknowledgements
We would like to express our gratitude to all thepeople who have made conducting this researchpossible. In particular, Sean Knapp and JamesMorrison, both from Google, helped us modifythe code of Google Web Search servers. Marius A.Eriksen, another Google engineer, pointed us tothe prefetching functionality of Firefox. Larry L.Peterson from the PlanetLab Consortium enabledus to deploy our landmarks on port 81 of PlanetLabnodes. Henk Uijterwaal from the RIPE NetworkCoordination Centre provided us with the latencydata from the Test-Traffic Measurement project. Fi-nally, we would like to thank all the anonymousreviewers for their useful comments that havehelped us improve this article.
0 0.1 0.2 0.3 0.4 0.5 0.6 0.7 0.8 0.9
1
0 0.5 1 1.5 2
CD
F
Relative Estimation Error
0
0.2
0.4
0.6
0.8
1
0 5 10 15 20 25 30
Fra
ctio
n of
est
imat
esw
ith e
rror
low
er th
an .5
Time (days)
0 0.1 0.2 0.3 0.4 0.5 0.6 0.7 0.8 0.9
1
0 0.5 1 1.5 2
CD
F
Relative Estimation Error
>100 msec (20.5%)50-100 msec (17.7%)
25-50 msec (32.1%)<25 msec (29.7%)
a b c
Fig. 17. RIPE latency estimation: relative error (a), accuracy over time (b), and accuracy for different latency intervals (c).
1362 M. Szymaniak et al. / Computer Networks 52 (2008) 1343–1364
Author's personal copy
References
[1] M. Zari, H. Saiedian, M. Naeem, Understanding andreducing Web delays, IEEE Computer 34 (12) (2001)30–37.
[2] F. Dabek, J. Li, E. Sit, J. Robertson, F. Kaashoek, R.Morris, Designing a DHT for low latency and highthroughput, in: Proceedings of the 1st Symposium onNetworked Systems Design and Implementation, USENIX,March 2004.
[3] J. Pereira, L. Rodrigues, A. Pinto, R. Oliveira, Low latencyprobabilistic broadcast in wide area networks, in: Proceed-ings of the 23rd International Symposium on ReliableDistributed Systems, IEEE Computer Society, New York,October 2004.
[4] M. Szymaniak, G. Pierre, M. van Steen, Latency-drivenreplica placement, in: Proceedings of the 2005 InternationalSymposium on Applications and the Internet, IEEE Com-puter Society, New York, February 2005.
[5] L. Amini, H. Schulzrinne, Client clustering for traffic andlocation estimation, in: Proceedings of the 24th InternationalConference on Distributed Computing Systems, IEEEComputer Society, New York, March 2004.
[6] R. Wolski, N. Spring, J. Hayes, The network weatherservice: a distributed resource performance forecastingservice for metacomputing, Future Generation ComputerSystems 15 (5–6) (1999) 757–768.
[7] S. Brin, L. Page, The anatomy of a large-scale hypertextualWeb search engine, Computer Networks and ISDN Systems30 (1–7) (1998) 107–117.
[8] T.S. Eugene Ng, H. Zhang, Predicting Internet networkdistance with coordinates-based approaches, in: Proceedingsof the 21st INFOCOM Conference, IEEE Computer Soci-ety, New York, June 2002.
[9] Y. Shavitt, T. Tankel, Big-bang simulation for embeddingnetwork distances in Euclidean space, in: Proceedings of the22nd INFOCOM Conference, IEEE Computer Society, NewYork, April 2003.
[10] S. Srinivasan, E. Zegura, An empirical evaluation oflandmark placement on Internet coordinate schemes, in:Proceedings of the International Conference on ComputerCommunications and Networks, IEEE Computer Society,New York, October 2004.
[11] L. Tang, M. Crovella, Virtual landmarks for the Internet, in:Proceedings of the Internet Measurement Conference, ACM,New York, October 2003.
[12] R. Cox, F. Dabek, F. Kaashoek, J. Li, R. Morris, Practical,distributed network coordinates, in: Proceedings of the 2ndWorkshop on Hot Topics in Networks, ACM, New York,November 2003.
[13] H. Lim, J. Hou, C. Choi, Constructing Internet coordinatesystem based on delay measurements, in: Proceedings of theInternet Measurement Conference, ACM, New York, Octo-ber 2003.
[14] P. Pietzuch, J. Ledlie, M. Seltzer, Supporting networkcoordinates on PlanetLab, in: Proceedings of the 2ndWorkshop on Real, Large Distributed Systems, USENIX,December 2005.
[15] M. Castro, M. Costa, P. Key, A. Rowstron, PIC: PracticalInternet coordinates for distance estimation, TechnicalReport MSR-TR-2003-53, Microsoft Research, September2003.
[16] M. Pias, J. Crowcroft, S. Wilbur, T. Harris, S. Bhatti,Lighthouses for scalable distributed location, in: Proceedingsof the 2nd International Workshop on Peer-to-Peer Systems,February 2003.
[17] F. Dabek, R. Cox, F. Kaashoek, R. Morris, Vivaldi: adecentralized network coordinate system, in: Proceedings ofthe SIGCOMM Conference, ACM, New York, August2004.
[18] T.S. Eugene Ng, H. Zhang, A network positioning systemfor the Internet, in: Proceedings of the 4th Symposium onInternet Technologies and Systems, USENIX, June2004.
[19] L. Barroso, J. Dean, U. Holzle, Architecture, Web search fora planet: the Google cluster, IEEE Micro 23 (2) (2003) 22–28.
[20] J. Nelder, R. Mead, A simplex method for functionminimization, The Computer Journal 4 (7) (1965)308.
[21] M. Szymaniak, G. Pierre, M. van Steen, Scalable cooperativelatency estimation, in: Proceedings of the 10th InternationalConference on Parallel and Distributed Systems, IEEEComputer Society, New York, July 2004.
[22] M. Waldvogel, R. Rinaldi, Efficient topology-aware overlaynetwork, in: Proceedings of the 1st Workshop on Hot Topicsin Networks, ACM, New York, October 2002.
[23] The PlanetLab Project Web page, <http://www.planet-lab.org/> (accessed: 21.05.07).
[24] Y. Shavitt, T. Tankel, The curvature of the Internet and itsusage for overlay construction and distance estimation, in:Proceedings of the 23rd INFOCOM Conference, IEEEComputer Society, New York, April 2004.
[25] M. Andrews, B. Shepherd, A. Srinivasan, P. Winkler, F.Zane, Clustering and server selection using passive monitor-ing, in: Proceedings of the 21st INFOCOM Conference,IEEE Computer Society, New York, June 2002.
[26] The Site Meter Web page, <http://www.sitemeter.com/>(accessed: 21.05.07).
[27] R. Kokku, P. Yalagandula, A. Venkataramani, M. Dahlin,NPS: A non-interfering deployable Web prefetching system,in: Proceedings of the 4th Symposium on Internet Technol-ogies and Systems, USENIX, March 2003.
[28] C. Wootton, JavaScript Weirdness, Web Developer’s Jour-nal, 1999, <http://www.webdevelopersjournal.com/>.
[29] D. Fisher, G. Saksena, SYNOPSIS: Link prefetching inMozilla: a server-driven approach, in: Proceedings of the 8thInternational Workshop on Web Content Caching andDistribution, IBM Research, September 2003.
[30] D. Duchamp, Prefetching hyperlinks, in: Proceedings of the2nd Symposium on Internet Technologies and Systems,USENIX, October 1999.
[31] R. Fielding, J. Gettys, J. Mogul, H. Frystyk, L. Masinter, P.Leach, T. Berners-Lee, Hypertext transfer protocol – HTTP/1.1. RFC 2616, IETF, June 1999.
[32] The Mozilla Firefox Web page, <http://www.mozilla.com/firefox/> (accessed: 21.05.07).
[33] N. Brinkman, Mozilla’s browsers global usage share is stillgrowing, Onestat.com, July 2006.
[34] V. Kudallur, IE7 networking improvements in contentcaching and decompression, MSDN Blog, October2005.
[35] H. Zheng, E. Keong Lua, M. Pias, T. Griffin, Internetrouting policies and round-trip times, in: Proceedings of the
M. Szymaniak et al. / Computer Networks 52 (2008) 1343–1364 1363
Author's personal copy
Passive and Active Measurement Workshop, Springer, NewYork, March 2005.
[36] E. Keong Lua, T. Griffin, M. Pias, H. Zheng, J. Crowcroft,On the accuracy of embeddings for Internet coordinatesystems, in: Proceedings of the Internet MeasurementConference, ACM, New York, October 2005.
[37] A. Shaikh, R. Tewari, M. Agrawal, On the effectiveness ofDNS-based server selection, in: Proceedings of the 20thINFOCOM Conference, IEEE Computer Society, NewYork, April 2001.
[38] B. Krishnamurthy, J. Wang, On network-aware clustering ofWeb clients, in: Proceedings of the SIGCOMM Conference,ACM, New York, August 2000.
[39] Z. Morley Mao, C. Cranor, F. Douglis, M. Rabinovich, O.Spatscheck, J.A. Wang, Precise and efficient evaluation ofthe proximity between Web clients and their local DNSservers, in: Proceedings of the Annual Technical Conference,USENIX, June 2002.
[40] J. Stribling, All-pairs Ping Data for PlanetLab, <http://pdos.csail.mit.edu/~strib/pl_app/> January 2006.
[41] F. Georgatos, F. Gruber, D. Karrenberg, M. Santcroos, A.Susanj, H. Uijterwaal, R. Wilhelm, Providing active mea-surements as a regular service for ISP’s, in: Proceedings ofthe Passive and Active Measurements Workshop, RIPE,April 2001.
Michal Szymaniak is a Ph.D., candidatein the Computer Systems group at theVrije Universiteit Amsterdam. Hisresearch focuses on large-scale distrib-uted systems for content delivery in theInternet. He is a student member of theIEEE and the ACM. He holds a doubleMSc in Computer Science from WarsawUniversity (Poland) and from the VrijeUniversiteit Amsterdam.
Dr David Presotto holds the title ofFashion Icon at Google. He is headwrangler for the Google flamingo herdand in his spare time is responsible forGoogle’s load balancing, DNS, andCDN. He obtained a high schooldiploma from The Boston Latin School.David has the twin distinction of beingdeported from both Switzerland andYugoslavia (pre break up).
Guillaume Pierre is an assistant professorin the Computer Systems group at theVrije Universiteit Amsterdam. He hasbeen working in the field of Web-basedsystems for many years. He is a memberof the IEEE and an editorial boardmember of IEEE DSonline. He holds anMSc and a Ph.D., in Computer Sciencefrom the University of d’Evry-vald’Essonne (France).
Maarten van Steen is a full professor in theComputer Systems group at the VrijeUniversiteit Amsterdam. He is head of aresearch team developing large-scale dis-tributed systems. Besides Web-based sys-tems, his research interests include peer-to-peer and gossip-based distributed sys-tems. He is senior member of the IEEEand member of the ACM. He holds anMSc in Applied Mathematics fromTwente University and a Ph.D., in Com-
puter Science from Leiden University.
1364 M. Szymaniak et al. / Computer Networks 52 (2008) 1343–1364