shear behavior of high strength fiber reinforced concrete beams subjected to axial compression...
TRANSCRIPT

SHEAR BEHAVIOR OF HIGH STRENGTH FIBER REINFORCED CONCRETE BEAMS SUBJECTED TO
AXIAL COMPRESSION FORCES
Ibrahim G. Shaaban Associate Professor, Zagazig University, Banha Branch
ABSTRACT An experimental and analytical investigation was conducted in order to study the effect of axial compression forces on the shear behavior of high strength fiber reinforced concrete (HSFRC) beams. To the author’s knowledge, the effect of applying axial compression forces, to the HSFRC beams, has not yet been studied. Nineteen simply supported HSFRC beams were subjected to axial compression forces and tested under two-point vertical loading for three values of shear span to depth ratio. The studied beams contained variable amount of fiber content, two types of fibers (corrugated shape and hooked-end), and variable amount of web reinforcement. It was found that the shear strength of beams subjected to axial compression stress level equals 0.1, is higher than that in the literature for beams tested without applying axial stress by a range of 22-98%. In addition, increasing the axial compression stress level to 0.2 led to an increase in the first crack load, ultimate load by 24% and 10%, a reduction in the deflection by (19-30%), compared with those subjected to axial compression stress level equals 0.1. A combination of web reinforcement and fibers resulted in a significant increase in the cracking and ultimate loads by 123% and 59%, respectively, over those of the reference beam. A new formula is proposed for predicting the shear strength of HSFRC beams subjected to axial compression. The results obtained by the proposed formula are in good agreement with the test results.
:ملخص البحثمسلحة عالية يهدف هذا البحث إلى دراسة تأثير قوى الضغط المحورية على سلوك القص للكمرات الخرسانية ال
حيث أنه لم يعثر على مثل هذه الدراسة فى )HSFRC(المقاومة والتى تحتوى على ألياف صلب قصيرة يتضمن البحث اختبار تسعة عشر كمرة بسيطة االرتكاز تم تحميلها بحملين رأسيين متماثلين .األبحاث المنشورة
تغيرات مثل نوع وكمية األلياف، والتسليح فى وجود تأثير قوى ضغط محورية وذلك لقياس تأثير عدد من الموجد أن مقاومة القص . الجذعى، ونسبة بحر القص إلى عمق الكمرة، وذلك على سلوك تلك الكمرات فى القص
أعلى من تلك الغير معرضة ألى قوى ضغط . ,١فى الكمرات المعرضة الجهادات ضغط محورية تعادل زيادة مستوى اجهادات الضغط المحورية الواقع %. ٩٨-٢٢اوح من والمختبرة من قبل باحثين آخرين بنسبة تتر
أدى إلى زيادة حمل الشرخ األول وكذلك الحمل األقصى عنهما فى حالة الكمرات . ,٢على الكمرات المختبرة إلى أظهرت النتائج أن تأثير قوى الضغط %. ١٠و % ٢٤بنسبة . ,١المعرضة الجهادات ضغط محورية تعادل
و لوحظ أن وجود تسليح جذعى %. ١, ٥إلى . ,٥ل بزيادة نسبة األلياف بالكمرات المختبرة من المحورية يق% ١٢٣باإلضافة إلى األلياف فى الكمرات ينتج عنه زيادة فى حمل الشرخ األول وكذلك الحمل األقصى بمقدار
القصوى للكمرات تم استنباط معادلة جديدة لحساب مقاومة القص . بالنسبة الى كمرة المقارنة% ٥٩و )HSFRC (فى وجود قوى ضغط محورية، وقد أظهرت نتائجها تطابقا مع النتائج المعملية .

INTRODUCTION High Strength Concrete (HSC) is considered to be a relatively brittle material since the slope of the post-peak portion of the stress-strain diagram is very sharp [1 and 2]. When added to concrete mixes, steel fibers distribute randomly through the mix at much closer spacings than conventional reinforcing steel and act to arrest cracking by decreasing the stress intensity factor at the tip of inherent internal cracks [3]. This leads to increasing the shear-friction strength of concrete and also improves the ultimate tensile strength and toughness (ductility) because a lot of energy is absorbed in debonding and pulling out of fibers from the concrete before complete separation and failure of concrete occurs [3]. Swamy and Bahia [4] showed that fibers act as effective shear reinforcement, much like the legs of regularly spaced stirrups, and are more effective in arresting crack propagation and maintaining the integrity of the surrounding concrete. Ashour et al. [2], Imam [5], Noghabai [6], Farahat [7] and Craig [8] showed that it is possible to replace stirrups partially or completely with fibers in beams of HSC to resist shear under transverse loading. The ACI Committee 544 [9] defined fiber reinforced concrete (FRC) as a concrete with increased strain capacity, impact resistance, energy absorption, and tensile strength. Design codes [10-12] generally specify a minimum amount of shear reinforcement to prevent sudden collapse upon the formation of diagonal cracking. Krauthammer [13] defined the minimum amount of shear reinforcement as; the amount which provides the same magnitude of shear transfer as that for full aggregate interlock action. It has been clearly shown that for beams reinforced with a fixed amount of minimum shear reinforcement, irrespective of concrete strength, the reserve shear strength diminishes as the concrete strength gets higher [14 and 15]. Therefore, the minimum shear reinforcement for HSC either in the form of stirrups, fibers or both need more investigations.
Despite that the behavior of reinforced concrete beams in flexure and shear was examined in the literature using an independent test specimen without restraints, reinforced concrete beams in real concrete structures are members in a frame structure and they behave differently from such idealized members because of the axial restraint imposed by adjacent members [16]. Based on experiments and analyses, researchers [17 and 18] have concluded that reinforced concrete member’s characteristics, such as capacity and failure pattern in the presence of compression, are significantly different under restraint conditions. From a study performed by Yang et al. [16] it was shown that the flexural and shear behavior characteristics and the failure pattern of reinforced concrete flexural members is governed by the intensity of axial restraints. El-Dodo [19] carried out an experimental and analytical research to study the effect of axial force on shear strength of reinforced concrete elements. Abdoun [20] studied the effect of axial compression forces on the behavior of HSC beams with web reinforcement. To the author’s knowledge, an organized and comprehensive evaluation considering the effect of applying axial compression forces, to the fiber reinforced HSC beams with and without web reinforcement, has not yet been attempted.

OBJECTIVE AND SCOPE In this paper, nineteen HSC beams reinforced with longitudinal reinforcement had steel fibers of varying types and amounts as shear reinforcement. Twelve beams had no web reinforcement but only fibers of different amounts and types. A single reference beam specimen had neither transverse reinforcement nor fibers. Three beams had web reinforcement only and three had web reinforcement and fibers. All beams were subjected to axial compression forces and then tested by two-point transverse loading at shear span-to-depth ratios 2, 3 and 4. The terms ‘axial’ and ‘transverse’ are defined in this paper as the longitudinal and vertical directions of the beam, respectively. The resulting first-crack loads and ultimate shear loads of the studied beams were compared with those of the reference beam to assess the effect of varying the fiber type and fiber content. Shear strength results were compared with those sited in literature in order to evaluate the effect of axial compression forces applied to the studied beams. A new formula is proposed for the prediction of shear strength of the tested beams.
EXPERIMENTAL PROGRAM Materials The tested specimens were produced from ordinary Portland cement, natural sand and crushed basalt with a maximum size of 15 mm. Silica fume and superplastisizer were added to increase strength. Mixing was performed in a rotating mixer in the Concrete Research Laboratory at Cairo University. Mix proportions for concrete used in this study are shown in Table 1. The water / cementitious ratio of the mix was 0.29 in order to produce HSC. Steel fibers of varying amounts and types (see Table 2) were added during mixing of concrete. Two types of fibers were used, namely, hooked-end and corrugated steel fibers of yield strength, 400 MPa. The aspect ratio of the two types of fibers was constant (Lf / Df = 50 mm /1 mm =50). Beams were demolded after 24 hrs from casting, covered with wet burlap, and stored under laboratory conditions for 28 days. In addition, three 150-mm cubes were cast from each beam mix and tested for compressive strength after a water-curing period of 28 days. The mean compressive strength of concrete is tabulated in Table 2.
Table 1 Mix Constituents Proportions for Studied Beams
Characteristic Strength, fcu
Proportions, kg/m3
Cement Sand Crushed Basalt
Silica Fume
Water Superplasticizer Liter/ m3
80 MPa 550 600 1250 55 150 23 Specimen Details Specimens used in this research consisted of nineteen HSC beams 10 cm by 17.5 cm cross-sections, 170 cm in length and a clear span of 150 cm. The studied beams were reinforced with 4 Φ 16 (fy = 360 MPa) as bottom longitudinal reinforcement to prevent
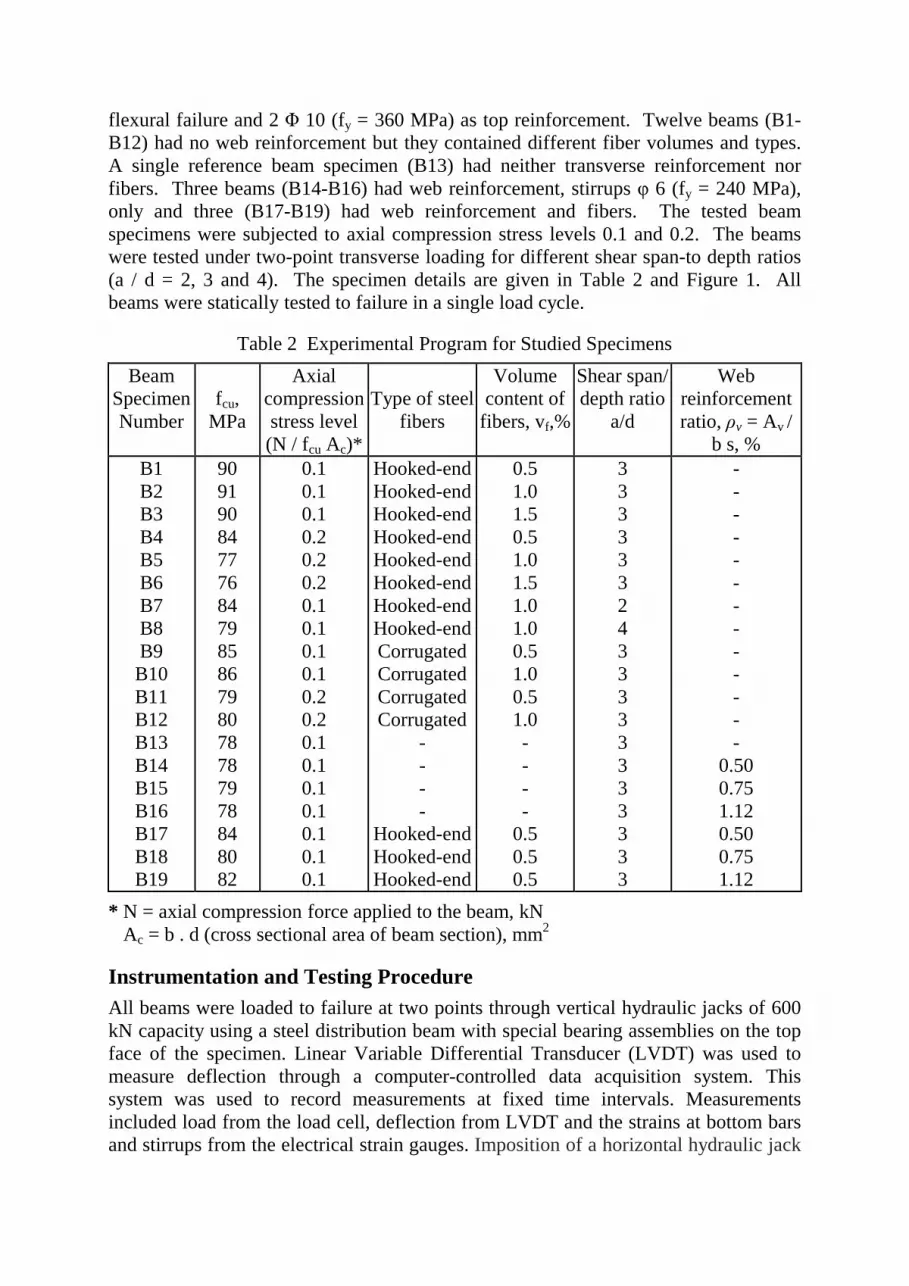
flexural failure and 2 Φ 10 (fy = 360 MPa) as top reinforcement. Twelve beams (B1-B12) had no web reinforcement but they contained different fiber volumes and types. A single reference beam specimen (B13) had neither transverse reinforcement nor fibers. Three beams (B14-B16) had web reinforcement, stirrups φ 6 (fy = 240 MPa), only and three (B17-B19) had web reinforcement and fibers. The tested beam specimens were subjected to axial compression stress levels 0.1 and 0.2. The beams were tested under two-point transverse loading for different shear span-to depth ratios (a / d = 2, 3 and 4). The specimen details are given in Table 2 and Figure 1. All beams were statically tested to failure in a single load cycle.
Table 2 Experimental Program for Studied Specimens
Beam Specimen Number
fcu,
MPa
Axial compression stress level (N / fcu Ac)*
Type of steel fibers
Volume content of
fibers, vf,%
Shear span/ depth ratio
a/d
Web reinforcement ratio, ρv = Av /
b s, % B1 B2 B3 B4 B5 B6 B7 B8 B9 B10 B11 B12 B13 B14 B15 B16 B17 B18 B19
90 91 90 84 77 76 84 79 85 86 79 80 78 78 79 78 84 80 82
0.1 0.1 0.1 0.2 0.2 0.2 0.1 0.1 0.1 0.1 0.2 0.2 0.1 0.1 0.1 0.1 0.1 0.1 0.1
Hooked-end Hooked-end Hooked-end Hooked-end Hooked-end Hooked-end Hooked-end Hooked-end Corrugated Corrugated Corrugated Corrugated
- - - -
Hooked-end Hooked-end Hooked-end
0.5 1.0 1.5 0.5 1.0 1.5 1.0 1.0 0.5 1.0 0.5 1.0 - - - -
0.5 0.5 0.5
3 3 3 3 3 3 2 4 3 3 3 3 3 3 3 3 3 3 3
- - - - - - - - - - - - -
0.50 0.75 1.12 0.50 0.75 1.12
* N = axial compression force applied to the beam, kN Ac = b . d (cross sectional area of beam section), mm2
Instrumentation and Testing Procedure All beams were loaded to failure at two points through vertical hydraulic jacks of 600 kN capacity using a steel distribution beam with special bearing assemblies on the top face of the specimen. Linear Variable Differential Transducer (LVDT) was used to measure deflection through a computer-controlled data acquisition system. This system was used to record measurements at fixed time intervals. Measurements included load from the load cell, deflection from LVDT and the strains at bottom bars and stirrups from the electrical strain gauges. Imposition of a horizontal hydraulic jack
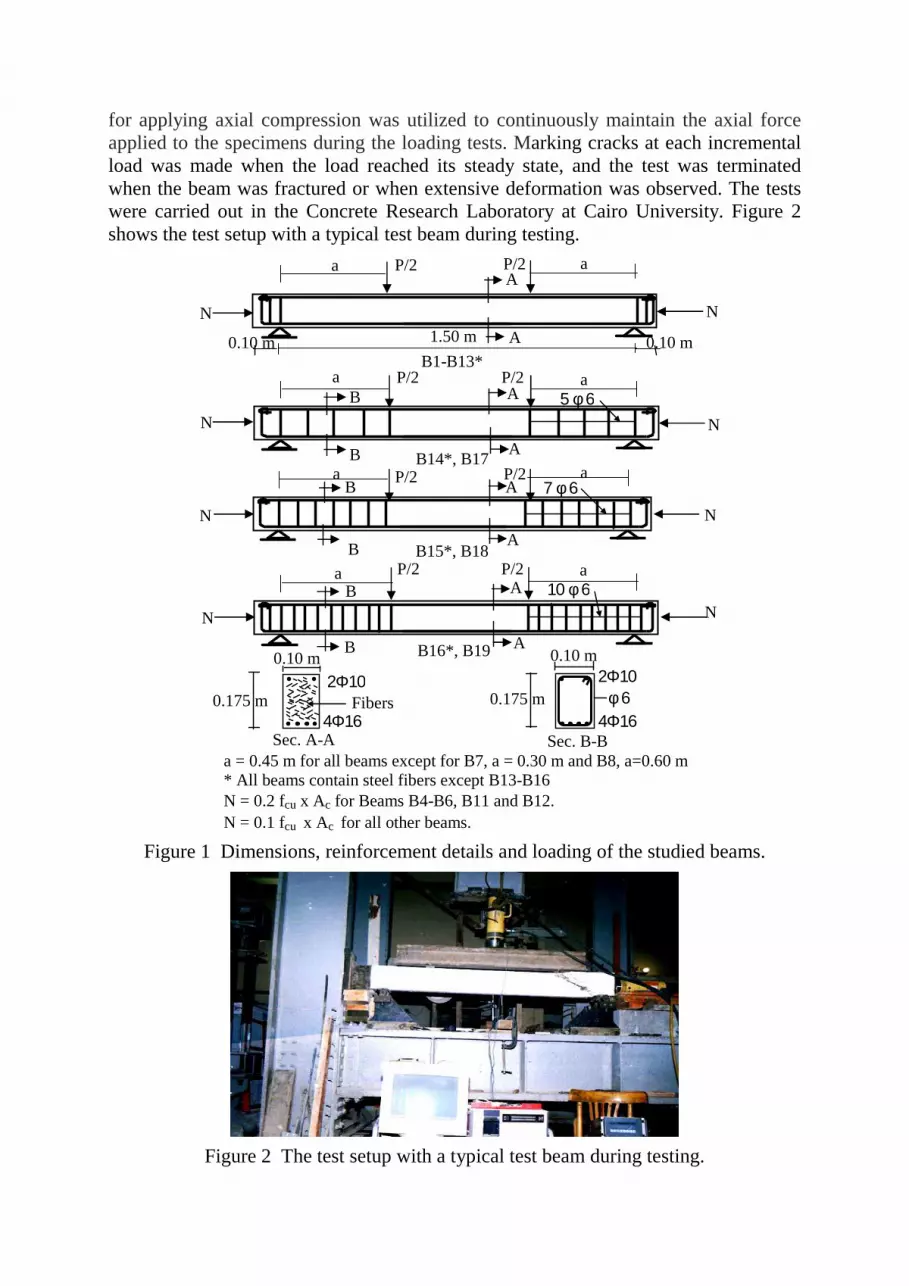
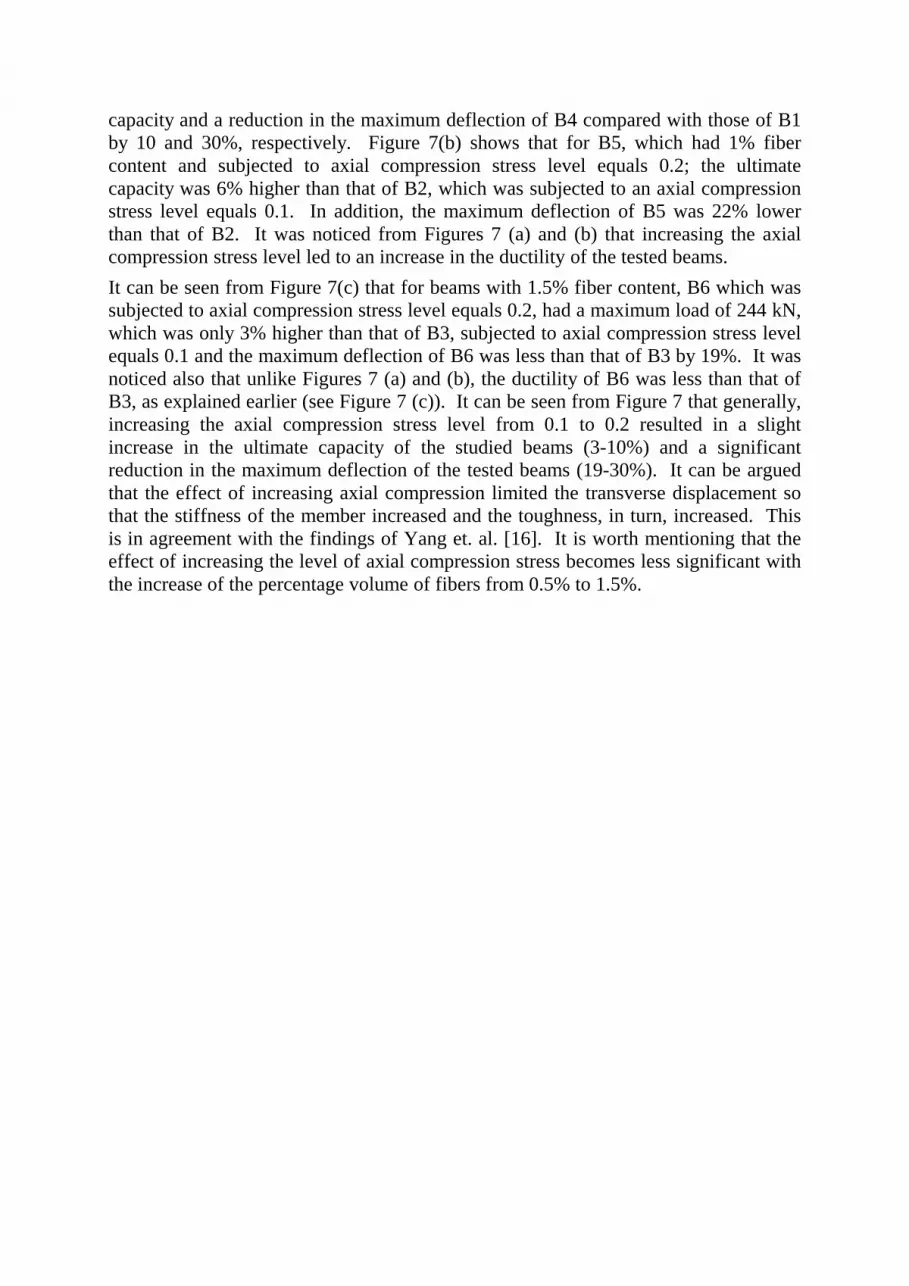
for applying axial compression was utilized to continuously maintain the axial force applied to the specimens during the loading tests. Marking cracks at each incremental load was made when the load reached its steady state, and the test was terminated when the beam was fractured or when extensive deformation was observed. The tests were carried out in the Concrete Research Laboratory at Cairo University. Figure 2 shows the test setup with a typical test beam during testing.
Figure 1 Dimensions, reinforcement details and loading of the studied beams.
Figure 2 The test setup with a typical test beam during testing.
2Φ10 Fibers
4Φ16 0.175 m
N
7 φ 6
N N
B A
A
P/2 a
N
P/2 a
1.50 m 0.10 m 0.10 m
A
A
N
B1-B13*
a = 0.45 m for all beams except for B7, a = 0.30 m and B8, a=0.60 m * All beams contain steel fibers except B13-B16 N = 0.2 fcu x Ac for Beams B4-B6, B11 and B12. N = 0.1 fcu x Ac for all other beams.
a a
B14*, B17 a a
B16*, B19 B
P/2 P/2
P/2 P/2
P/2 P/2
Sec. B-B
0.10 m
Sec. A-A
a a B15*, B18 B
N
0.10 m
4Φ16
2Φ10 φ 6 0.175 m
5 φ 6 N
B
B A
A
10 φ 6
N
B A
A

EXPERIMENTAL RESULTS AND DISCUSSION Overall Behavior, Crack Pattern and Failure Mode Figure 3 shows the cracking pattern and failure mode for all the tested beams. The first crack load, ultimate load capacity and modes of failure for the tested beams are listed in Table 3. It should be noted that all beams were over-designed in flexure to ensure shear failure. Generally, the first crack for all beams occurred diagonally in the shear region. Despite that, the type and amount of steel fibers did not change the mode of failure, they improved the beams ductility, or in other words, they raised the value of the first crack and ultimate loads as shown in Table 3. Increasing the amount of fibers led to a further increase in the cracking and ultimate loads. This was explained by Ashour et. al. [2] who reported that steel fibers become effective after shear cracks form and continue to resist the principal tensile stresses until the complete pullout of all fibers occurs at one critical crack. It was observed also that beams without web reinforcement had only a major single diagonal crack on one end of the beam extending throughout the shear span (Beams B1-B13). Table 3 shows that adding hooked-end fibers to the mix of the tested beams led to a slight improvement of the first crack load and the ultimate load over those of the beams contained corrugated steel fibers. Balaguru and Shah [21] reported the superior properties of hooked-end fibers over the other steel fibers configuration.
Table 3 Cracking, Maximum Shear Load, and Failure Mode of the Test Beams
Beam
fcu, MPa
a/d
Fiber type & content,
vf,%
ACSL
ρv, %
Pcr, kN
Pu, kN
Failure Mode
B1 90 3 HE, 0.5 0.1 -- 121 186 Shear B2 91 3 HE, 1.0 0.1 -- 132 200 Shear B3 90 3 HE, 1.5 0.1 -- 149 236 Shear B4 84 3 HE, 0.5 0.2 -- 150 205 Shear B5 77 3 HE, 1.0 0.2 -- 155 212 Shear B6 76 3 HE, 1.5 0.2 -- 166 244 Shear B7 84 2 HE, 1.0 0.1 -- 180 288 Shear B8 79 4 HE, 1.0 0.1 -- 93 152 Shear B9 85 3 CR, 0.5 0.1 -- 117 185 Shear B10 86 3 CR, 1.0 0.1 -- 130 194 Shear B11 79 3 CR, 0.5 0.2 -- 132 197 Shear-Compression B12 80 3 CR, 1.0 0.2 -- 157 201 Shear-Compression B13 78 3 -- 0.1 -- 106 159 Shear B14* 78 3 -- 0.1 0.5 160 199 Shear-Compression B15* 79 3 -- 0.1 0.75 174 234 Shear B16* 78 3 -- 0.1 1.12 210 236 Compression B17* 84 3 HE, 0.5 0.1 0.5 192 215 Shear B18* 80 3 HE, 0.5 0.1 0.75 227 249 Compression B19* 82 3 HE, 0.5 0.1 1.12 236 253 Compression
ACSL = axial compression stress level, ρv, % = web reinforcement ratio, Pcr = cracking load, Pu = ultimate load, HE= hooked-end fibers, and CR = corrugated steel fibers. * Beams with web reinforcement “stirrups”

B1 B2
B3 B4
B5 B6
B7 B8
B9 B10
B11 B12
B13 B14
B15 B16
B17 B18
B19
Figure 3 Cracking pattern and failure mode for studied beam specimens.
It was observed that the number of inclined cracks increased with the presence of web reinforcement, indicating an enhanced redistribution of internal forces (Beams B14-B19). The combination of fibers and web reinforcement (B17-B19) resulted in a significant increase in the cracking loads (81-123%) and ultimate loads (35-59%) over those of the reference specimen B13. This is in agreement with the findings of Johnson and Ramirez [14]. For Beam B14, the mode of failure was shear-compression. Adding steel fibers did not change the failure mode but it became more ductile since the first crack load and ultimate load for B17 were higher than those of B14 by 20% and 8%, respectively. Increasing the amount of transverse reinforcement for B15 resulted in propagation of flexural cracks in the beam but the mode of failure was shear. Adding fibers to the mix, B18 led to improving the shear behavior and changing of failure mode and the beam failed in flexure due to concrete crushing and

yielding of compression steel in top of the beam. Further increase to the web reinforcement, B16, led to decreasing the crack spacing, increasing the number of cracks and changing the failure mode to compression failure, since the tension zone was well reinforced. In addition, increasing the applied axial compression stress level from 0.1 to 0.2 led to increasing the first cracking load and ultimate load. For example, increasing the applied axial compression stress level from 0.1 for B1, B2 and B3 to 0.2 for B4, B5 and B6 led to increasing the cracking loads by 24%, 17% and 11% and ultimate loads by 10%, 6% and 3%, for these beams. It is interesting to notice that the effect of increase in axial compression stress level becomes less significant with the increase of percentage volume of fibers from 0.5% to 1.5%.
Load-Deflection
Effect of fiber content
The load-deflection curves for beams without web reinforcement but with different volume percentages of fibers are shown in Figure 4 for two levels of axial compression stress. The reference specimen B13 is shown in the figure for comparison. Figure 4 (a) shows that, for beams subjected to axial compression stress level of 0.1, adding 0.5% of fibers to the beam led to increasing both of the first crack load and ultimate load for B1 by 14% and 17% compared with those of the reference specimen B13. Increasing the volume percentage of fibers to 1% for B2 resulted in increasing the first crack load by 24% and the ultimate load increased by 26% over those of the reference specimen B13. A further increase of fiber content to 1.5% for B3 resulted in a significant increase of both of the first crack load to 41%, and the ultimate load to 48%, compared with those of B13.
Figure 4 (b) shows that increasing the applied axial compression stress level to 0.2 resulted in a significant improvement in the first crack load and the ultimate load of the tested beams. The first crack load for beams contain 0.5% (B4), 1% (B5) and 1.5% (B6) fibers was higher than that of the reference beam specimen B13 by 42%, 46% and 57%, respectively. The ultimate loads of B4, B5 and B6 were higher than that of the reference specimen, B13, by 29%, 34% and 53%, respectively. It is clear from Figure 4 that the effect of adding fibers, significantly improved the toughness (ductility) of the studied beam specimens, measured by the area under the load-deflection curve. Increasing the volume of fibers led to a further improvement in the behavior of studied beams. Yang et. al. [16] correlated this improvement in the behavior to the increased bending stiffness of the member as a result of limiting the transverse displacement due to the applied level of axial compression stress. However, the ductility of B6 (contains 1.5% fibers and subjected to axial compression stress level equals 0.2) was smaller than that of B3 (contains 1.5% fibers and subjected to axial compression stress level equals 0.1). This may be attributed to the fact that internal stresses formed as a result of the combination of increasing the axial compression forces and debonding of fibers reduced the ductility of this specimen.
Effect of shear-span to depth ratio
Figure 5 shows the load-deflection curves for Beams, B7, B2 and B8 having 1% hooked-end fibers and of shear-span to depth ratio, a/d, equals 2, 3 and 4, respectively. It can be seen from the figure that decreasing a/d led to an improvement of the overall

behavior of the tested beam, i.e. reduction in deflection and enhancement in ultimate capacity. For example, the ultimate capacity of B8 (a/d = 4) was 152 kN at a deflection of 8 mm while B2 (a/d = 3) and B7 (a/d = 2) had 5.7 and 3.5 mm deflections, respectively, at the same load. In addition, it was noticed that the ultimate capacities of B2 and B7 were 200 and 288 kN, respectively. This is in agreement with the findings in the literature [22]. However, despite that B8 (a/d =4) had the minimum ultimate capacity, toughness (ductility) of this beam was high, as a result of adding fibers, compared with similar beams in the literature having the same a/d but without fibers [9, 23].
Effect of fiber type Figure 6 shows the load-deflection relations for the beams with the two types of fibers used in this investigation. The reference beam B13 was included in the figure for comparison purposes. It can be seen from the figure that hooked-end fibers showed slightly better behavior than the corrugated steel fibers in terms of increasing the capacity and ductility of the tested beams. This improvement in the behavior becomes more significant with the increase of fiber content or the axial compression stress level. For beams of 0.5% fiber content and subjected to axial compression stress level equals 0.1, Beams B1 (hooked-end fibers) and B9 (corrugated fibers) showed nearly the same ultimate load which is higher than that of the reference specimen, B13, by 17% (see Figure 6(a)). Increasing the fiber content to 1% for Beams B2 (hooked-end fibers) and B10 (corrugated fibers), led to a higher increase in the ultimate capacity of these beams, 26% and 22% higher than that of the reference specimen B13 (see Figure 6 (a)).
The effect of fiber type becomes more significant with increasing the level of axial compression stress as mentioned before. For the beams of fiber content 0.5% and subjected to axial compression stress level equals 0.2 (Figure 6(b)), the ultimate capacities of Beams B4 (hooked-end fibers) and B11 (corrugated fibers) were higher than that of B13 (with no fibers) by 29% and 24%, respectively. Increasing the fiber content to 1% resulted in a further improvement of the ultimate capacity and ductility of studied beams. For example, B5 (hooked-end fibers) and B12 (corrugated steel fibers) showed ultimate capacity higher than that of the reference specimen B13 by approximately 33% and 26%, respectively. It was noticed also that increasing axial compression stress level applied to the beams from 0.1 in Figure 6(a) to 0.2 in Figure 6(b) resulted in a reduction in the maximum deflection by a range of (3-34)%, a slight increase in the ultimate capacity (10%) and an improvement in the toughness of the specimens measured by the area under the load-deflection curve (see Figures 6,a and b). It is interesting to note that increasing the axial compression stress level from 0.1 to 0.2 has almost the same effect as increasing the fiber content from 0.5 to 1% on the ultimate capacity of the tested beams. For example, B10 had almost the same ultimate capacity as that of B11.
Effect of axial compression stress level Figure 7 shows the load-deflection curves for beams containing hooked-end fibers of different fiber contents and subjected to axial compression stress levels 0.1 and 0.2. It can be seen from Figure 7(a) that for fiber volume percentage of 0.5%, increasing the axial compression stress level from 0.1 to 0.2 led to an increase in the ultimate
capacity and a reduction in the maximum deflection of B4 compared with those of B1 by 10 and 30%, respectively. Figure 7(b) shows that for B5, which had 1% fiber content and subjected to axial compression stress level equals 0.2; the ultimate capacity was 6% higher than that of B2, which was subjected to an axial compression stress level equals 0.1. In addition, the maximum deflection of B5 was 22% lower than that of B2. It was noticed from Figures 7 (a) and (b) that increasing the axial compression stress level led to an increase in the ductility of the tested beams.
It can be seen from Figure 7(c) that for beams with 1.5% fiber content, B6 which was subjected to axial compression stress level equals 0.2, had a maximum load of 244 kN, which was only 3% higher than that of B3, subjected to axial compression stress level equals 0.1 and the maximum deflection of B6 was less than that of B3 by 19%. It was noticed also that unlike Figures 7 (a) and (b), the ductility of B6 was less than that of B3, as explained earlier (see Figure 7 (c)). It can be seen from Figure 7 that generally, increasing the axial compression stress level from 0.1 to 0.2 resulted in a slight increase in the ultimate capacity of the studied beams (3-10%) and a significant reduction in the maximum deflection of the tested beams (19-30%). It can be argued that the effect of increasing axial compression limited the transverse displacement so that the stiffness of the member increased and the toughness, in turn, increased. This is in agreement with the findings of Yang et. al. [16]. It is worth mentioning that the effect of increasing the level of axial compression stress becomes less significant with the increase of the percentage volume of fibers from 0.5% to 1.5%.

Effect of presence of web reinforcement
Figure 8 shows the effect of presence of variable amount of web reinforcement in beams containing a fixed amount of hooked-end fibers of volume percentage equals 0.5%, and subjected to axial compression stress level equals 0.1. It can be seen from Figure 8 that generally the beams with web reinforcement had higher ultimate capacity and maximum deflection, and in turn, higher ductility than those of the reference specimen B13. Adding fibers to the beams with transverse reinforcement led to a slight increase in the ultimate capacity of the beams and to a significant increase in the ductility indicated by the increase of the area under the load-deflection curves. Figure 8(a) shows that the ultimate capacity of B14 (with stirrups of volume percentage equals 0.5%) was higher than that of the reference beam B13 by 25% and adding fibers to the beam (B17) led to a further increase in the ultimate capacity by 8%. It can be seen from Figure 8(b) that for B15 of web reinforcement volume percentage equals 0.75%, the ultimate capacity was higher than that of B13 by 47% and adding fibers resulted in an increase in the ultimate capacity of B18 by 7% over that of B15. Figure 8(c) shows that the ultimate capacity, of B16 of web reinforcement volume percentage equals 1.12%, was higher than that of the reference beam B13 by 48%. Adding fibers results in a further increase in the ultimate capacity of B19 by 8% higher than that of B16. It can be seen from Figure 8 that the combination of web reinforcement and fibers give the benefit of both high capacity and ductility.
Strain in Bottom Tension Reinforcement The variations of strain in tension reinforcement with the increase of the applied load are shown in Figure 9 for Beams B1, B4, B9, and B11. Each two beams with the same level of axial compression and same amount of fibers but with different fiber types were compared in Figure 9. It can be seen from the figure that there is a reduction in the steel strain for the specimens included hooked-end fiber compared with those contained corrugated steel fibers at the same load level and for the same amount of fibers. For example, Figure 9(a) shows that for axial compression stress level equals 0.1, the strain in tension reinforcement of B1 reduced by 25% compared with that of Beam B9 at load level equals 185 kN. This may be attributed to the fact that part of the applied load is transferred to the fibers and resisted by debonding and stretching. Since the hooked-end fibers have better bonding than corrugated steel fibers due to their ends and shape, their share in resisting load is greater than those of corrugated steel fibers. This is in agreement with the findings of Gopalaratnam et. al. [24].
Increasing the axial compression stress level to 0.2 (Figure 9(b)) led to a slight increase in the ultimate capacity and a significant increase in strain of tension steel reinforcement of the studied beams. For example, B4 (contained hooked-end fibers) had ultimate load and steel strain higher than those of B1 by 10% and 25%, respectively. The tested beam, B11, which contained corrugated steel fibers, had ultimate load and steel strain higher than those of B9 by 7% and 23%, respectively (see Figure 9). The crack pattern and failure mode shown in Figure 3 supports this observation since the photo shows vertical cracks for B9 in the flexural region prior to shear failure of the beam while B11 which was subjected to axial compression stress level equals 0.2 did not show any vertical flexural cracks and the shear failure was accompanied with compression failure at the top of the beam.

Strain in Stirrups Figure 10 shows the variations of strain in the stirrups with the increase in loading for six beams (B14-B19). Slight increase in the ultimate load was noticed with the addition of fibers for beams with web reinforcement, of a maximum percentage value of 8%. Figures 10(a) and 10(b) show the increase in the stirrups’ strains of B17 (0.5% web reinforcement) and B18 (0.75% web reinforcement) by 63% and 13% over those of beams without fibers (B14 and B15), respectively. However, the beneficial effect of the combination of web reinforcement and steel fibers is shown in Figure 10(c) for B19 (contains 1.12% web reinforcement and 0.5% hooked-end fibers) as a large reduction in stirrups’ strain compared with that of B16 (contains 1.12% web reinforcement only). This may be attributed to the fact that the high volume percentage of web reinforcement accompanied with reasonable amount of fibers (0.5%) carried larger share of load and, in turn, arrested the cracks [3].
The stirrup strain readings correlated well with the crack pattern observations. For Beam B14, the first diagonal tension crack was formed at 160 kN. Increasing web reinforcement for B15 led to delaying the first diagonal tension crack to 174 kN while a further increase to the web reinforcement for B16 resulted in a diagonal tension crack at 210 kN. In all three beams, all the stirrups crossed by the main diagonal crack and the ultimate loads for B14, B15 and B16 were 199, 234 and 236 kN, respectively. It was noticed that none of the stirrups showed yield at diagonal tension cracking. The crack surfaces were observed to be very smooth in the HSC beams, indicating that the contribution of aggregate interlock to the shear strength of such beams was probably diminished. The diminished contribution of aggregate interlock resulted in an increase on the share of the load of the remaining components of the shear failure mechanism such as dowel action, shear carried across the flexural compression zone, and web reinforcement. Figure 10 shows that adding fibers to the studied beams resulted in improving the shear behavior since the bond between fibers and concrete compensates for the diminished contribution of aggregate interlock.

PREDICTION OF SHEAR STRENGTH Shear failure occurs from diagonal tension cracking in a uniform stress field or bond splitting along the longitudinal reinforcement towards the support. Crushing of an inclined compression strut or failure associated with the bearing zone is often the cause of shear failure [25]. The concrete contribution is conveniently taken as the shear force at the onset of diagonal cracking and represents the sum of the shear forces carried by at least three mechanisms [26], namely, the aggregate interlock action; dowel action of longitudinal bars; and the shear force carried by the compression zone. Most design code methods in treating shear rely on empirical formulas. Numerous predictive equations for the shear strength of fiber-reinforced concrete beams have been proposed in the literature [27 and 28]. More information to the background of the predictive equations is stated herein and the others can be found elsewhere [28].
Review of Prediction of Shear Strength Sharma [29] proposed the following equation; in an attempt to predict the ultimate shear strength of FRC beams, as follows:
vu = 0.67 f t́ (d/a)0.25 (MPa) (1a)
f t́ = 0.6 √f´c (MPa) (1b)
where f´t is the tensile strength of concrete (based on splitting cylinder tension tests of fiber concrete) which depends on fiber type and content, and a/d is the effective shear span-depth ratio.
f´c is the compressive strength of cylinder specimens, MPa
Narayanan and Darwish [30] developed another equation to predict the ultimate shear strength for mortar medium to high strength FRC beams:
vu = e ( 0.24 ft́ + 80 ρ d/a) + vb (MPa) (2a) and vb = 0.41 τ F (MPa) (2b) where
e = 1.0 when a/d > 2.8 and 2.8 (d/a) when a/d ≤ 2.8 ρ = percentage of area of tensile steel to area of concrete. a = shear span, mm d = depth of tension steel in section, mm F = fiber factor (= Lf / Df) vf df Df = fiber diameter, mm L f = fiber length, mm df = factor accounts for differing bond characteristics of fibers and equals 0.5 for round fibers, 0.75 for crimped fibers, and 1.0 for fibers with deformed ends. vf = volume percentage of fibers, percent. vb is an extra resisting component provided by the shear strength of the fiber and was added to the original strength (fiber-pullout stress).
τ is the average fiber matrix interfacial bond stress, = 4.15 MPa.
Ashour et. al. [2] developed two equations, which are modifications of the ACI Building Code [12] and Zsutty’s [31] equations, to predict the shear strength of singly reinforced HSFRC beams without stirrups. The first equation is:

vu = (0.7 √ f´c + 7F) d / a + 17.2 ρ d / a (MPa) (3)
Where the fiber factor F was proposed by Narayanan and Darwish [30] and was defined earlier in Equation (2b). The multiplier of 0.7 reflects the behavior of HSC. The second equation is reported as:
vu = (2.11 3√ f´c + 7F) (ρ d / a)0.333 for a/d > 2.5 (MPa) (4a)
vu = [Eq. (4a)] 2.5 /(a/d) + vb (2.5 – a/d) for a/d < 2.5 (MPa) (4b)
Oh et. al. [32] proposed an equation to predict the shear strength for FRC beams as; Vu = Vuc + Vus + Vfy (5a)
Where the contribution of concrete, Vuc, the contribution of the stirrups, Vus=Avfyd/ s, and the contribution of steel fibers, Vfy = F1 (h – c)/d were considered in the analysis. Thus the equation of shear strength was written as;
Vu = (10 ρ f´c d /a)1/3 bd + Av fy d/s + F1(h – c)/d for a /d ≥ 2.5 kN (5b)
Vu = (160 ρ f´c)1/3 (d /a)4/3 bd + Av fy d/s + F1 (h – c)/d for a /d < 2.5 kN (5c)
where a is the shear span, mm b is the breadth of beam section, mm Av = area of stirrups, mm2 s is the spacing of the stirrups, mm fy is the yield strength of the stirrups, MPa
F1 is the ultimate force sustained by the steel fibers per unit area of crack at failure.
h is the total height of the beam, mm c is the neutral axis depth, mm
It is worth mentioning that (h-c) was approximated by (0.9 d) as suggested by Khuntia et. al. [28] and Casanova et. al. [33] for simplicity.
Farahat [7] proposed two equations, based originally on Narayanan and Darwish [30] and Shin et. al. [34] equations, to predict the shear strength of HSFRC beams with or without stirrups:
vu = [(0.132 + 0.28 F) √ f´c + 217 ρ d/a + ρv fy] for a/d < 3 (MPa) (6a)
vu = [(0.114 + 0.28 F) √ f´c + 93 ρ d/a + ρv fy] for a/d ≥3 (MPa) (6b)
The contribution of web reinforcement, shown in Equations (5 and 6) should be added to Equations (1-4) before using these equations in predicting the experimental results since these equations (1-4) were originally developed for FRC beams without web reinforcement.
Experimental Results Against Shear Strength Prediction Equations The experimental shear strength results obtained in this study were predicted by the ACI Building Code equation [12], ECCS equation [35] and the empirical equations proposed by other researchers and presented before (Equations 1 to 6). The comparisons are presented in Table 4 and Figure 11. Based on the limited test data given herein, it can be seen from Table 4 that the ACI, Sharma and ECCS equations [12, 29 and 35] are conservative especially for FRC beams without stirrups (B1-B12).

The equations become less conservative, but still overestimating, for the reference beam and beams with stirrups (B13-B19). This led to the high scatter in results shown in Table 4 and Figure 11 (their standard deviations were 0.60, 0.53 and 0.49, respectively). This may be attributed to the fact that despite the code equations included the effect of axial compression forces applied to the beams they were originally developed for normal strength concrete beams without fibers. Despite that Sharma’s equation [29] was developed for normal strength FRC, it did not include the contributions of longitudinal reinforcement, steel fibers and axial compression forces. Table 4 shows also that the ECCS equation [35] is less conservative than the ACI equation [12] and Sharma’s one [29]. For example, the mean ratios of the present test data with the ECCS equation [35] were 1.94 with a standard deviation equals 0.49 which are better than the corresponding mean ratios of the test results to the predicted values obtained using the ACI equation [12] (mean = 2.47 and standard deviation= 0.6) and Sharma’s equation [29] (mean = 2.36 and standard deviation = 0.53).
Table 4 and Figure 11 show that the empirical equations stated earlier (from 2 to 6), generally, overestimate the results but with lower standard deviations (mean ratios ranged from 1.77 to 2.07 and standard deviations ranged from 0.22 to 0.28) compared with those of the ACI, Sharma and ECCS equations [12, 29 and 35]. It can be argued that these equations included the contributions of longitudinal reinforcement, web reinforcement, type and content of steel fibers, which led to the low standard deviation of the predicted results, while the effect of axial compression forces applied to the beams was not taken into consideration which resulted in the overestimation in predicting the results. In order to assess this effect, a comparison was made in Table 4
between the shear strength results in the current investigation and those tested by Farahat [7] under no axial compression forces. It can be seen that shear strength results for beams subjected to axial compression forces are higher than those tested without applying axial forces by a range of 22-98%. It is clear from Table 4 that the prediction using empirical equations was good for beams not subjected to axial compression forces. Therefore, it is essential to include the effect of axial compression forces in the empirical equations as will be discussed in the following section.
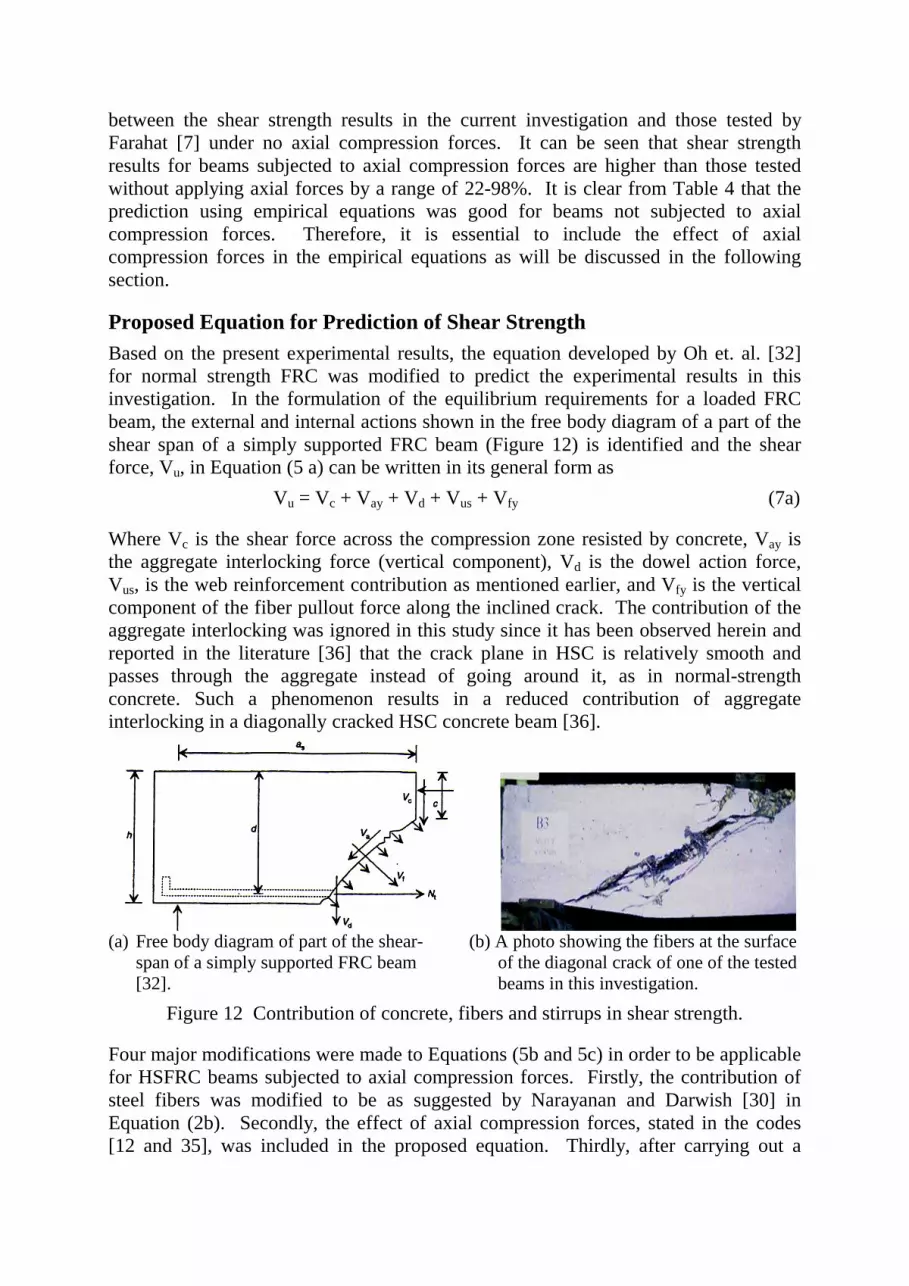
Proposed Equation for Prediction of Shear Strength Based on the present experimental results, the equation developed by Oh et. al. [32] for normal strength FRC was modified to predict the experimental results in this investigation. In the formulation of the equilibrium requirements for a loaded FRC beam, the external and internal actions shown in the free body diagram of a part of the shear span of a simply supported FRC beam (Figure 12) is identified and the shear force, Vu, in Equation (5 a) can be written in its general form as
Vu = Vc + Vay + Vd + Vus + Vfy (7a)
Where Vc is the shear force across the compression zone resisted by concrete, Vay is the aggregate interlocking force (vertical component), Vd is the dowel action force, Vus, is the web reinforcement contribution as mentioned earlier, and Vfy is the vertical component of the fiber pullout force along the inclined crack. The contribution of the aggregate interlocking was ignored in this study since it has been observed herein and reported in the literature [36] that the crack plane in HSC is relatively smooth and passes through the aggregate instead of going around it, as in normal-strength concrete. Such a phenomenon results in a reduced contribution of aggregate interlocking in a diagonally cracked HSC concrete beam [36].
(a) Free body diagram of part of the shear- (b) A photo showing the fibers at the surface span of a simply supported FRC beam of the diagonal crack of one of the tested [32]. beams in this investigation.
Figure 12 Contribution of concrete, fibers and stirrups in shear strength.
Four major modifications were made to Equations (5b and 5c) in order to be applicable for HSFRC beams subjected to axial compression forces. Firstly, the contribution of steel fibers was modified to be as suggested by Narayanan and Darwish [30] in Equation (2b). Secondly, the effect of axial compression forces, stated in the codes [12 and 35], was included in the proposed equation. Thirdly, after carrying out a

regression analysis for the beams tested in this study, the multipliers 10 and 160 were changed to be 23 and 660 in order to reflect the behavior of HSC. Finally, the contribution of the web reinforcement “stirrups”, Vus, was multiplied by a reduction factor, 0.9, since the steel fibers share the stirrups in resisting shear strength. Therefore the proposed equation becomes:
for a / d ≥ 2.5:
Vu = [(23 ρ f´c d/a)1/3 b.d + 0.9 Av fy d/s + 0.41 τ F] (1+ 0.07 N/Ac) kN (7b)
& for a / d < 2.5:
Vu = [(660 ρ f´c) 1/3 (d/a)4/3 b.d + 0.9 Av fy d/s + 0.41τF](1+ 0.07 N/Ac) kN (7c)
Table 5 Comparison between the Proposed Equation and Equations in Literature, modified to count for axial loading, in Predicting Shear Strength
Beam
Level of
axial comp. Stress
fcu, MPa
Observed shear
strength, vuo, MPa
Experimental/Predicted shear strength, vuo/vp Narayanan
and Darwish [30],
Eq. (2)
Ashour et. al. [2],
Eq. (3)
Farahat
[7], Eq. (6)
Proposed
Eq. (7) B1 0.1 90 6.2 1.21 1.29 1.15 1.05 B2 0.1 91 6.7 1.15 1.15 1.04 1.01 B3 0.1 90 7.9 1.22 1.18 1.07 1.09 B4 0.2 84 6.8 1.02 1.1 0.98 0.90 B5 0.2 77 7.1 0.99 1.01 0.92 0.89 B6 0.2 76 8.1 1.02 1.0 0.92 0.93 B7 0.1 84 9.6 1.23 1.17 0.75 1.01 B8 0.1 79 5.1 1.0 1.28 0.98 0.91 B9 0.1 85 6.2 1.27 1.42 1.26 1.14 B10 0.1 86 6.5 1.17 1.27 1.14 1.08 B11 0.2 79 6.6 1.04 1.17 1.03 0.93 B12 0.2 80 6.7 0.94 1.02 0.91 0.86 B13 0.1 78 5.3 1.36 1.56 1.33 1.14 B14 0.1 78 6.6 1.15 1.26 1.13 1.05 B15 0.1 79 7.8 1.16 1.25 1.14 1.08 B16 0.1 78 7.9 0.97 1.04 0.96 0.94 B17 0.1 84 7.2 1.03 1.11 1.02 0.98 B18 0.1 80 8.3 1.08 1.15 1.07 1.05 B19 0.1 82 8.5 0.93 0.98 0.92 0.92
Mean 1.1 1.18 1.04 1.0 Standard Deviation 0.12 0.15 0.14 0.08
Table 5 shows a comparison between the modified equations in the literature, which were originally proposed by Ashour et al. [2], Farahat [7], Narayanan and Darwish [30], and the proposed equation in predicting the experimental results in this investigation. The equations in the literature were modified by multiplying their predictions by the factor, (1 + 0.07 N / Ac) in order to include the effect of axial compression forces. This factor was included in the ACI Building Code equation [12]

and ECCS Code equation [35]. It can be seen from Table 5 that the equations developed by Ashour et. al. [2], Farahat [7] and Narayanan and Darwish [30] improved greatly after including the effect of axial compression forces. The ratio of the experimental to the predicted shear strength by the modified equation developed earlier by Farahat [7], has a mean of 1.04 and a standard deviation of 0.14, while that of Narayanan and Darwish equation [30] has a mean of 1.1 with a standard deviation of 0.12 and Ashour et. al. equation [2] predicted the results with a mean ratio of 1.18 and a standard deviation equals 0.15. The proposed equation predicted the results very accurately with a mean of the experimental to the predicted results equals 1.0 and the standard deviation was 0.08 only.
Prediction of Test Results of Others Using The Proposed Equation The proposed equation was used for predicting other results in the literature in order to extend its validity for prediction of shear strength for beams of different shear span-depth ratios, different longitudinal and web reinforcement ratios. The prediction was made for beams tested by Swamy and Bahia [4], Shin et. al. [34], Cho and Kim [37], Ashour et. al. [2] and Farahat [7] beside the beams tested in this study. These beams had a range of concrete strength (44-101 MPa), different amounts of fiber content (0 to 2%), fiber aspect ratio (50 to 133), shear span-depth ratio (1.3 to 6), longitudinal reinforcement ratio (2.9-5.4%) and web reinforcement ratio (0-1.12%). Figure 13 shows the ratio of the experimental to results predicted using the proposed equation versus fiber content for 70 beams. It can be seen from the figure that the analytical predictions using the proposed equation are reasonably close to the test results of other researchers. Although the overall statistics are good, the equation is not conservative for a/d = 6 (Ashour specimens [2]) as shown in Figure 13. Cho and Kim [37] observed similar findings in their study. This results from the empirical formulation and the representation of more slender beam behavior.

CONCLUSIONS A total of 19 HSFRC beams, containing longitudinal reinforcement and subjected to axial compression forces, were tested in order to study the effect of axial compression force on their shear behavior. Twelve beams had no web reinforcement but they contained different fiber volume and types. A single reference beam specimen had neither transverse reinforcement nor fibers. Three beams had web reinforcement only and three had web reinforcement and fibers. Hooked end steel fibers and corrugated steel fibers of aspect ratio 50 were used as fiber reinforcement. Based on the experimental results and the analytical models reported in this research, the following conclusions can be drawn:
1. Test results indicated that the addition of steel fibers enhanced initial stiffness, cracking loads, ultimate loads, shear strength, and the ductility of the studied beams. Adding 0.5% fibers by volume resulted in an increase in the cracking and ultimate loads by 14 and 17%, over those of the reference beam. Increasing the fiber volume to 1.5% led to a further increase in the cracking and ultimate loads by 41 and 48%, compared with those of the reference beam. Regardless of the failure mode, fibrous concrete beams eventually collapsed from the severely localized deformations at one or two major cracks.
2. It was found that fiber reinforcement can reduce the amount of shear stirrups required, and that a combination of web reinforcement and fibers resulted in a beneficial effect of both; high capacity and ductility. This combination resulted in a significant increase in the cracking and ultimate loads by 123 and 59% over those of the reference beam specimen. In addition, a large reduction in stirrups’ strain was observed for HSFRC beams contain 1.12% web reinforcement. This is probably due to the large share of load carried by such high volume of web reinforcement accompanied with fibers.
3. The beams contained hooked-end fibers showed slightly better ductility than those contained corrugated steel fibers especially with the increase of fiber content or the increase in axial compression stress level. In addition, the strains in tension reinforcement of beams containing hooked-end fibers reduced by 25% compared with that of beams containing corrugated steel fibers. This may be attributed to the fact that the hooked-end fibers have better bonding than corrugated steel fibers due to their ends and shape, and therefore, their share in resisting load is greater than those of corrugated steel fibers.
4. It was found that the shear strength results of beams subjected to axial compression stress level of 0.1 are 22-98% higher than those tested by Farahat [7] without applying axial compression stress. Increasing the applied axial compression stress level from 0.1 to 0.2 led to an increase in the first crack load, ultimate load by 24, 10%, and a reduction of the deflection by (19-30%) and it has almost the same effect as increasing the fiber content from 0.5 to 1% on the ultimate shear capacity of the tested beams. The effect of increase in axial compression stress level becomes less significant with the increase of percentage volume of fibers from 0.5% to 1.5%.

5. A review of the previous equations in literature for predicting shear strength was introduced. These empirical equations were modified by including the effect of axial compression stress level. Hence, the prediction of the experimental results has improved greatly and the ratio of the experimental to the predicted shear strength had a mean ranging from 1.04 to 1.18 and a standard deviation ranging from 0.12 to 0.14.
6. A proposed equation was developed to predict the shear strength of HSFRC beams with and without stirrups and subjected to different levels of axial compression stress. The results obtained using this equation were in good agreement with the experimental results of the tested beams and other results reported in the literature for a practical range of concrete strength, different amounts of fiber content, fiber type, fiber aspect ratio, shear span-depth ratio (including deep beams), longitudinal reinforcement ratio and web reinforcement ratio. The results obtained by the proposed equation were in better agreement with the test results (mean equals 1.0 and standard deviation equals 0.08) when compared with the predictions based on the empirical equations proposed by other investigators.
ACKNOWLEDGEMENT The staff members and technicians of the Reinforced Concrete Testing Laboratory at Cairo University are acknowledged for their great help.
REFERENCES 1. Noghabai, K., “Beams of Fibrous Concrete in Shear and Bending: Experiment and
Model” Journal of Structural Engineering, ASCE, Vol. 126, No. 2, February, 2000, pp. 243-251.
2. Ashour, S. A., Hasanain, G.S., and Wafa, F.F., “Shear Behavior of High-Strength Fiber Reinforced Concrete Beams,” ACI Structural Journal, Vol. 89, No. 2, 1992, pp. 176-184.
3. El-Niema, E. I., “Reinforced Concrete Beams with Steel Fibers under Shear,” ACI Structural Journal, Vol. 88, No. 2, March-April, 1991, pp. 178-183.
4. Swamy, R. N., and Bahia, H. M., “Effectiveness of Steel Fibers as Shear Reinforcement,” Concrete International: Design and Construction, Vol. 7, No. 3, Mar. 1985, pp. 35-40.
5. Imam, M., “Shear-Moment Interaction of Steel Fiber High Strength Concrete,” Ph.D. Thesis, 1995, Katholieke Universiteit Leuven, Leuven, Belgium.
6. Noghabai, K., “Effect of Tension Softening on the Performance of Concrete Structures: Experimental, Computational and Analytical Studies,” Ph.D. Thesis, 1998, Lulea University of Technology, Lulea, Sweden.
7. Farahat, A. M., “Effectiveness of Steel Fibers on the Shear Resistance of High-Strength Reinforced Concrete Beams,” Engineering Research Journal, Helwan University, Vol. 91, Feb. 2003, pp. 35-55.

8. Craig, R. John, “Structural Applications of Reinforced Fibrous Concrete,” Concrete International: Design & Construction, Vol. 6, No. 12, Dec. 1984, pp. 28-32.
9. ACI 544.4R-88, “Design Considerations for Steel Fiber Reinforced Concrete,” State of the Art Report by ACI Committee 544, Reapproved 1999.
10. British Standard Institution, “BS 8110: Structural Use of Concrete, Part 1: Code of Practice for Design and Construction,” London, 1997.
11. Canadian Standard Association, “Design of Concrete Structures,” CSA A23.3-94, Rexdale, Ontario, 1994, 199p.
12. ACI Committee 318, “Building Code Requirements for Structural Concrete (ACI 318-99) and Commentary (318R-99),” American Concrete Institute, Farmington Hills, Mich., 1999, 391 pp.
13. Krauthammer, T., “Minimum Shear Reinforcement Based on Interface Shear Transfer,” ACI Structural Journal, Vol. 89, No. 1, Jan-Feb. 1992, pp. 99-105.
14. Johnson, M. K., and Ramirez, J. A., “Minimum Shear Reinforcement in Beams with Higher-Strength Concrete,” ACI Structural Journal, Vol. 86, No. 4, July-Aug. 1989, pp. 376-382.
15. Yoon, Y. S., Cook, W. D, and Mitchell, D., “Minimum Shear Reinforcement in Normal, Medium and High-Strength Concrete Beams,” ACI Structural Journal, Vol. 93, No. 5, Sept.-Oct. 1996, pp. 576-584.
16. Yang, E. I., Yi, S. T., and Morita, S., “Effect of Axial Restraint on Flexural and Shear Behavior of High-Strength Concrete Members,” Magazine of Concrete Research, Vol. 56, No. 2, March, 2004, pp. 63-72.
17. Wight J. K. (ed.), “Earthquake Effects on Reinforced Concrete Structures,” ACI Special Publication, SP84, 1985.
18. Megget L. M. and Fenwick R. C., “Seismic Behavior of a Reinforced Concrete Portal Frame Sustaining Gravity Loads,” Bulletin of the New Zealand National Society for Earthquake Engineering, 1989, 22, No. 1, 39–49.
19. El-Dodo, G. E., “Effect of Axial Force on Shear Strength of Reinforced Concrete Elements,” Cairo University, Ph.D. Thesis, 1992, Cairo University, Egypt.
20. Abdoun, S. G., “Effect of Axial Compressive Stresses on Shear Strength of High Strength Concrete Beams with Web Reinforcement “, Ph.D. Thesis, 1998, Cairo University, Egypt.
21. Balaguru, P. N. and Shah, S. P., “Fiber Reinforced Cement Composites,” McGraw-Hill, Inc., 1992, 196 p.
22. Kotsovos, M. D., “Compressive Force Path Concept: Basis for Reinforced Concrete Ultimate Limit State Design,” ACI Structural Journal, Vol. 85, No. 1, Jan.-Feb. 1988, pp. 68-75.
23. Kotsovos, M. D., “Behavior of Beams with Shear Span-to-Depth Ratios Greater Than 2.5,” ACI Journal, Vol. 83, No. 6, Nov.-Dec., 1986, pp. 1026-1034.

24. Gopalaratnam, V. S., Shah, S. P., Batson, G., Griswell, M., Ramakrishnan, V., and Wecharatana, M., “Fracture Toughness of Fiber Reinforced Concrete,” ACI Materials Journal, Vol. 88, No. 4, July-Aug. 1991, pp. 339-353.
25. Joint ACI-ASCE Committee 445, “Recent Approaches to Shear Design of Structural Concrete,” Journal of Structural Engineering, ASCE, Vol. 124, No. 12, Dec. 1998, pp. 1375-1417.
26. Joint ACI-ASCE Committee 426, “Shear Strength of Reinforced Concrete Members,” Journal of Structural Division, Proceedings of ASCE, Vol. 99, No. ST6, June 1973, pp. 1091-1188.
27. Adebar, P., Mindess, S., St.-Pierre, D., and Olund, B., “Shear Tests of Fiber Concrete Beams without Stirrups,” ACI Structural Journal, Vol. 94, No. 1, Jan-Feb. 1997, pp. 68-76.
28. Khuntia, M., Stojadinovic, B., and Goel, S. C., “Shear Strength of Normal and High-Strength Fiber Reinforced Concrete Beams without Stirrups,” ACI Structural Journal, Vol. 96, No. 2, Mar.-Apr. 1999, pp. 282-289.
29. Sharma, A. K., “Shear Strength of Steel Fiber Reinforced Concrete Beams,” ACI Journal, Proceedings Vol. 83, No. 4, July-Aug. 1986, pp. 624-628.
30. Narayanan, R., and Darwish, I. Y. S., “Use of Steel Fibers as Shear Reinforcement,” ACI Structural Journal, Vol. 84, No. 3, May-June 1987, pp. 216-227.
31. Zsutty, T. C., “Beam Shear Strength Prediction by Analysis of Existing Data,” ACI Journal, Proceedings Vol. 65, No. 11, Nov. 1968, pp. 943-951.
32. Oh, B. H., Lim, D. H., Yoo, S. W. and Kim, E. S., “Shear Behavior and Shear Analysis of Reinforced Concrete Beams Containing Steel Fibers,” Magazine of Concrete Research, Vol. 50, No. 4, Dec. 1998, pp. 283-291.
33. Casanova, P., Rossi, P., and Schaller, I., “Can Steel Fibers Replace Transverse Reinforcements in Reinforced Concrete Beams?,” ACI Materials Journal, Vol. 94, No. 5, Sept.-Oct. 1997, pp. 341-354.
34. Shin, S. W., Oh, J., and Ghosh, S. K., “Shear Behavior of Laboratory-Sized High-Strength Concrete Beams Reinforced with Bars and Steel Fibers,” Fiber Reinforced Concrete Developments and Innovations, SP-142, ACI, Farmington Hills, 1994, pp. 181-200.
35. ECCS 203-2001, “Egyptian Code for Design and Construction of Concrete Structures”, Cairo, Egypt, 2001.
36. Mphonde, A. G., “Aggregate Interlock in High-Strength Reinforced Concrete Beams,” Proceedings of Institution of Civil Engineer: Part 2, Vol. 85, Sept. 1988, pp. 397-413.
37. Cho, S. and Kim, Y., “Effects of Steel Fibers on Short Beams Loaded in Shear,” ACI Structural Journal, Vol. 100, No. 6, Nov.-Dec. 2003, pp. 765-774.