seward marine terminal expansion planning
TRANSCRIPT
S e w a r d M a r i n e Te r m i n a l E x p a n s i o n P l a n n i n g
F r e i g h t Tr a f f i c S t u d yMay 2017

This page left intentionally blank.
Seward Marine Terminal Expansion Planning
FREIGHT TRAFFIC STUDY
Prepared for:
Prepared by:
With support by:
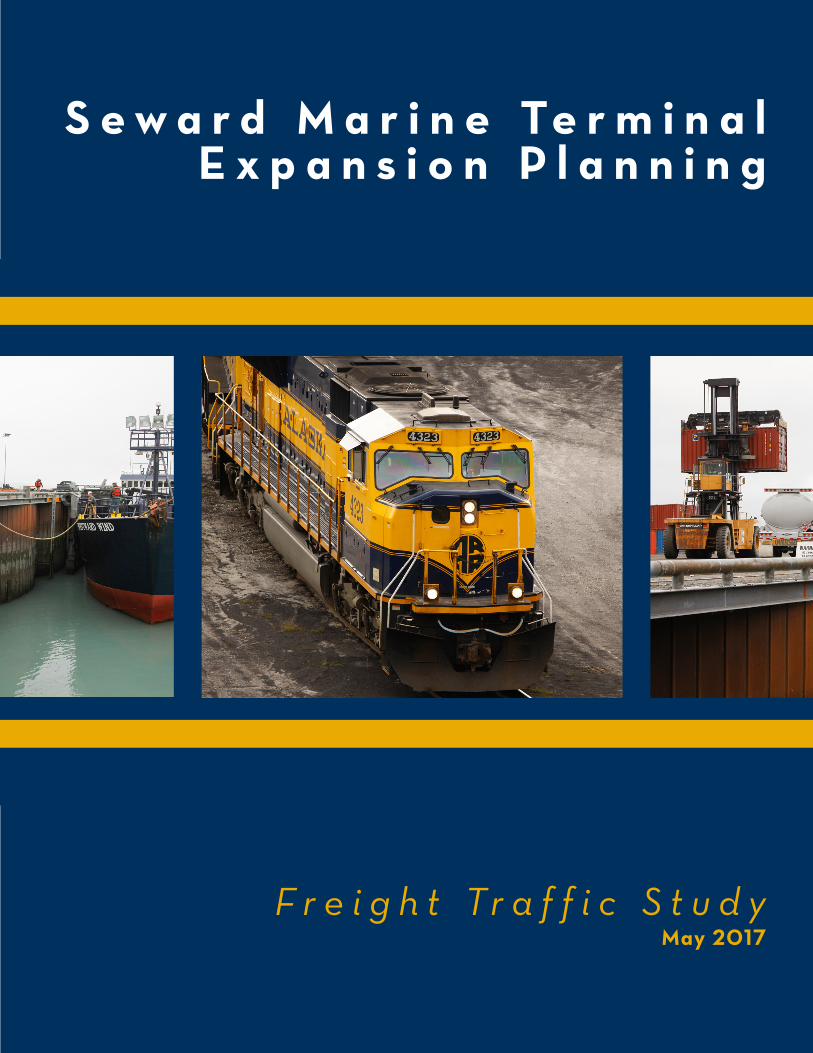
Cover Photos courtesy of Judy Patrick Photography

This page left intentionally blank.
Freight Traffic Study
Table of Contents
EXECUTIVE SUMMARY IExecutive Summary ..............................................................................................................................................................................I
Introduction ............................................................................................................................................................................................I
Background and Issues ...................................................................................................................................................................... II
Approach ............................................................................................................................................................................................... II
Improvement Options ....................................................................................................................................................................... III
Freight Dock ........................................................................................................................................................................................ III
Seward Loading Facility ...................................................................................................................................................................IV
Permit Area Inside Freight Dock Fence .......................................................................................................................................IV
Permit Area Outside Freight Dock Fence ....................................................................................................................................V
New Laydown Area .............................................................................................................................................................................V
Freight Building ...................................................................................................................................................................................V
Railyard ..................................................................................................................................................................................................V
Real Estate Enhancements with a Freight Focus .......................................................................................................................V
Next Steps ............................................................................................................................................................................................VI
1. INTRODUCTION 1
1.1 Seward Marine Terminal Expansion Planning Project Structure ............................................................................. 1
1.2 Project Vision ........................................................................................................................................................................ 2
1.3 Background Information .................................................................................................................................................... 2
1.3.1 Project Funding ........................................................................................................................................................... 2
1.3.2 Alaska Railroad Corporation .................................................................................................................................. 3
1.3.3 Seward Marine Terminal .......................................................................................................................................... 3
1.4 Study Objectives ..................................................................................................................................................................4
2. EXISTING CONDITIONS 52.1 Alaska Railroad Network .................................................................................................................................................... 5
2.1.1 Freight Services .......................................................................................................................................................... 5
2.1.2 Seward Freight Facilities .........................................................................................................................................6
2.1.3 Freight Dock ................................................................................................................................................................ 7
2.1.4 Seward Loading Facility ........................................................................................................................................... 7
2.1.5 Permit Area Inside Freight Dock Fence ...............................................................................................................9
2.1.6 Permit Area Outside Freight Dock Fence .........................................................................................................10
2.1.7 New Laydown Area ....................................................................................................................................................11
2.1.8 Freight Building .........................................................................................................................................................12
2.1.9 Railyard ........................................................................................................................................................................12
Freight Traffic Study
3. COMMUNITY INVOLVEMENT AND ENGAGEMENT 15 3.1 Visioning Process ...........................................................................................................................................................15
3.2 Stakeholder Outreach ................................................................................................................................................15
3.2.1 Internal and External Stakeholder Meetings ...........................................................................................13
3.2.2 Anchorage Transportation Fair ..................................................................................................................16
3.2.3 Additional Stakeholder Outreach Efforts ................................................................................................16
3.3 Key Issues .......................................................................................................................................................................17
3.4 Ongoing Community Engagement .........................................................................................................................21
3.4.1 Internal Stakeholder Workshops .................................................................................................................21
3.4.2 External Stakeholder Follow-Up Presentations .....................................................................................21
3.4.3 Seward Public Meeting No. 1 .......................................................................................................................21
3.4.4 Agencies and Other Governmental Outreach ......................................................................................21
3.4.5 Additional Outreach ..................................................................................................................................21
4. MARKET ANALYSIS 234.1 Port of Seward ....................................................................................................................................................................23
4.1.1 Location and Setting ...............................................................................................................................................23
4.1.2 Infrastructure ............................................................................................................................................................23
4.1.3 Transportation ..........................................................................................................................................................24
4.1.4 Freight Operations ..................................................................................................................................................24
4.1.5 Origin and Destination of Freight .......................................................................................................................24
4.1.6 Freight Businesses ...................................................................................................................................................26
4.1.7 Seasonality of Business Activity ...........................................................................................................................27
4.2 Comparison of Other Southcentral Port Facilities ...................................................................................................27
4.2.1 Port of Whittier .........................................................................................................................................................27
4.2.2 Port of Anchorage ...................................................................................................................................................30
4.2.3 Port MacKenzie.........................................................................................................................................................33
4.2.4 Port of Valdez ........................................................................................................................................................... 34
4.2.5 Port of Homer ............................................................................................................................................................32
4.2.6 Port of Kodiak ...........................................................................................................................................................36
4.3 Competitive Analysis .........................................................................................................................................................37
4.3.1 Rail Service ................................................................................................................................................................37
4.3.2 Truck Service .............................................................................................................................................................37
4.3.3 Port Rates ...................................................................................................................................................................38
4.3.4 Stevedoring Services ...............................................................................................................................................38
4.4 Trends Analysis ...................................................................................................................................................................38
4.4.1 Coal ..............................................................................................................................................................................38
4.4.2 Oil and Gas ...............................................................................................................................................................40
4.4.3 Mining .......................................................................................................................................................................... 41
Freight Traffic Study
5 .WHAT ARE THE ISSUES? 475.1 Future of Freight for Alaska Railroad Corporation ..................................................................................................47
5.2 Issues at Seward Marine Terminal .................................................................................................................................47
5.2.1 Train Services ........................................................................................................................................................... 47
5.2.2 Freight Dock ............................................................................................................................................................. 48
5.2.3 Seward Loading Facility ........................................................................................................................................ 48
5.2.4 Permit Area Inside Freight Dock Fence ............................................................................................................ 49
5.2.5 Permit Area Outside Freight Dock Fence ........................................................................................................ 49
5.2.6 New Laydown Area ................................................................................................................................................. 49
5.2.7 Freight Building ....................................................................................................................................................... 49
5.2.8 Railyard ...................................................................................................................................................................... 49
6. PROJECT DEVELOPMENT 516.1 Project Identification...................................................................................................................................................................51
6.2 Preliminary Project Screening .................................................................................................................................................51
6.3 Project Evaluation Workshop .................................................................................................................................................52
6.4 Project Selection Workshop ...................................................................................................................................................52
6.5 Economic Analysis – Real Estate Stimulus Projects ..........................................................................................................53
6.6 Project Refinement ....................................................................................................................................................................53
6.7 Cornerstone Review Workshop ..............................................................................................................................................53
6.8 Terminal and Dock Option Presentation ............................................................................................................................ 54
7. PASSENGER TRAFFIC FACILITY PROJECT OPTIONS 557.1 Freight Dock ........................................................................................................................................................................55
7.1.1 Option F-FD1: Freight Dock Extension and Expansion ..................................................................................55
7.1.2 Option F-FD2: Extend Freight Dock Double Track .........................................................................................57
7.1.3 Option F-FD3: Freight Dock Rail Improvements .............................................................................................58
7.1.4 Option F-FD4: Freight Dock and Area Identity Cards ..................................................................................59
7.2 Seward Loading Facility ..................................................................................................................................................60
7.2.1 Option F-SL1: Water Line – Seward Loading Facility Dock .........................................................................60
7.2.2 Option F-SL2: Fuel Lines – Seward Loading Facility Dock ..........................................................................60
7.2.3 Option F-SL3: Seward Loading Facility Removal .............................................................................................61
7.2.4 Option F-SL4: Redevelop Seward Loading Facility Land .............................................................................63
7.3 Permit Area Inside Freight Dock Fence .......................................................................................................................65
7.3.1 Option F-PI1: Eliminate Blind Spots and Widen Gates on Freight Dock Fence......................................65
4.4.4 Seafood ....................................................................................................................................................................... 41
4.5 Comparison with Competitors ...................................................................................................................................... 43
4.6 What are Seward’s Economic Advantages and Challenges? ................................................................................ 45
4.6.1 Seward’s Economic Advantages .......................................................................................................................... 45
4.6.2 Seward’s Economic Challenges ........................................................................................................................... 45
Freight Traffic Study
8. NEXT STEPS 79
7.4 Permit Area Outside Freight Dock Fence ...................................................................................................................66
7.4.1 Option F-PO2: Vessel Haul-Out Area ................................................................................................................ 66
7.4.2 Option F-PO3: Freight Dock At-Grade Rail Crossing ....................................................................................67
7.5 New Laydown Area ............................................................................................................................................................68
7.5.1 Option F-NL1: Track #1 Alignment and Switches ............................................................................................ 68
7.6 Freight Building ...................................................................................................................................................................69
7.6.1 Option F-FB1: Freight Building Restrooms ........................................................................................................69
7.6.2 Option F-FB2: Combined Freight Building and Communications Shelter ..............................................70
7.7 Railyard ..................................................................................................................................................................................71
7.7.1 Option F-RY1: Increase Rail Weight Limits ........................................................................................................71
7.8 Real Estate Enhancements With a Freight Focus .....................................................................................................72
7.8.1 Option F-RE1: Uplands Utility Upgrades ...........................................................................................................72
7.8.2 Option F-RE2: Freight Uplands Improvements ................................................................................................74
7.8.3 Option F-RE3: Laydown Area ...............................................................................................................................76
7.8.4 Option F-RE4: Refined Fuel Distributor .............................................................................................................76
7.8.5 Option F-RE5: Marine Repair and Maintenance Facility ..............................................................................76
7.8.6 Option F-RE6: Seafood Processing .....................................................................................................................77
Freight Traffic Study
TablesTable 2-1: ARRC Freight Fleet 5
Table 3-1: Internal and External Stakeholder Comments 17
Table 4-1: Port of Seward Inbound Freight (thousands of tons) 25
Table 4-2: Port of Seward Outbound Freight (thousands of tons) 25
Table 4-3: Percentage of Total Year Freight Invoice Value by Month 2013-2016 27
Table 4-4: Port of Whittier Inbound Freight (thousands of tons) 29
Table 4-5: Port of Whittier Outbound Freight (thousands of tons) 29
Table 4-6: Port of Anchorage Inbound Freight (thousands of tons) 31
Table 4-7: Port of Anchorage Outbound Freight (thousands of tons) 32
Table 4-8: Rail Transport Costs for Machinery and Other Articles, 2016 37
Table 4-9: Truck Rates Between Southcentral Ports and Fairbanks, 2016 38
Table 4-10: Usibelli Coal Exports by Destination (metric tons) 39
Table 4-11: Total Inbound Freight to Southcentral Alaska Ports 44
Table 4-12: Total Outbound Freight from Southcentral Alaska Ports (Excluding Coal and Petroleum) 44
Table 7-1: Cost Estimate for Demolition of SLF 62
Table 7-2: Cost Estimate to Construct Roads on SLF Land 64
Table 7-3: Cost Estimate to Construct Utilities on SLF Land 64
Table 7-4: Cost Estimate for Water and Seward Infrastructure Upgrade in Area Outside of Freight
Dock Fence 73
Freight Traffic Study
FiguresFigure ES-1: Seward Marine Terminal Site Showing Freight Facilities I
Figure 1-1: ARRC Revenue Sources in 2015 3
Figure 1-2: Seward Marine Terminal Site 4
Figure 2-1: Alaska Railroad Network and Land Holdings 5
Figure 2-2: Freight Facilities and Locations at Seward Marine Terminal 6
Figure 2-3: Components of SLF 8
Figure 2-4: Permit Area Inside Freight Dock Fence 8
Figure 2-5: Permit Area Outside of Freight Dock Fence 9
Figure 2-6: Permit Area Locations Outside of Freight Dock Fence 10
Figure 2-7: Barge Basin 10
Figure 2-8: New Laydown Area Plan 11
Figure 2-9: Seward Marine Terminal Track Map 13
Figure 4-1: Comparison of the Ports of Seward, Anchorage and Whittier 43
Figure 6-1: Project Screening Matrix 51
Figure 7-1: Dock Facility Master Plan Freight Dock Extension and Expansion Option 55
Figure 7-2: Freight Dock Extension to Accommodate Cruise Ships – Phases I & II 56
Figure 7-3: Freight Track Improvements 57
Figure 7-4: Indicative Locations for Freight Dock and Permit Area Access Control 59
Figure 7-5: Typical Section of the SLF at Bents Showing Pipelines 61
Figure 7-6: Typical Section of the SLF at Horizontal Support Member (midpoint of each span)
Showing Pipelines 61
Figure 7-7: SLF Land Area Available for Redevelopment to Alternative Uses 63
Figure 7-8: Potential Improvements to Permit Area Layout 65
Figure 7-9: Proposed Vessel Haul-Out Area 66
Figure 7-10: Location of Existing Port Avenue At-Grade Crossing 67
Figure 7-11: Track #1 Realignment 68
Figure 7-12: Yard Track Improvements 71
Figure 7-13: Existing Utilities and Proposed Utility Extensions 72
Figure 7-14: Freight Uplands Improvements Area 74
Freight Traffic Study
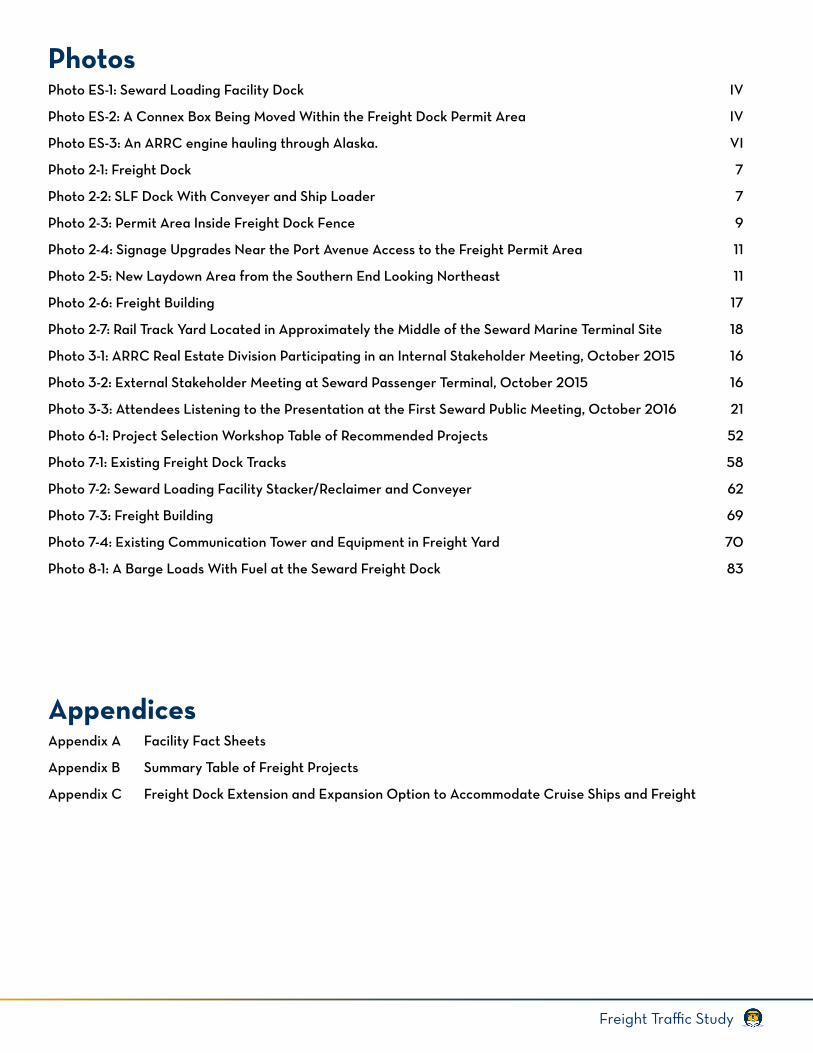
PhotosPhoto ES-1: Seward Loading Facility Dock IV
Photo ES-2: A Connex Box Being Moved Within the Freight Dock Permit Area IV
Photo ES-3: An ARRC engine hauling through Alaska. VI
Photo 2-1: Freight Dock 7
Photo 2-2: SLF Dock With Conveyer and Ship Loader 7
Photo 2-3: Permit Area Inside Freight Dock Fence 9
Photo 2-4: Signage Upgrades Near the Port Avenue Access to the Freight Permit Area 11
Photo 2-5: New Laydown Area from the Southern End Looking Northeast 11
Photo 2-6: Freight Building 17
Photo 2-7: Rail Track Yard Located in Approximately the Middle of the Seward Marine Terminal Site 18
Photo 3-1: ARRC Real Estate Division Participating in an Internal Stakeholder Meeting, October 2015 16
Photo 3-2: External Stakeholder Meeting at Seward Passenger Terminal, October 2015 16
Photo 3-3: Attendees Listening to the Presentation at the First Seward Public Meeting, October 2016 21
Photo 6-1: Project Selection Workshop Table of Recommended Projects 52
Photo 7-1: Existing Freight Dock Tracks 58
Photo 7-2: Seward Loading Facility Stacker/Reclaimer and Conveyer 62
Photo 7-3: Freight Building 69
Photo 7-4: Existing Communication Tower and Equipment in Freight Yard 70
Photo 8-1: A Barge Loads With Fuel at the Seward Freight Dock 83
AppendicesAppendix A Facility Fact Sheets
Appendix B Summary Table of Freight Projects
Appendix C Freight Dock Extension and Expansion Option to Accommodate Cruise Ships and Freight
Freight Traffic Study
Acronyms
AGDC Alaska Gasline Development CorporationAML Alaska Marine LinesARRC Alaska Railroad CorporationASAP Alaska Stand Alone PipelineASMI Alaska Seafood Marketing Institutebbl/hr barrels per hourCatalyst Catalyst Marine EngineeringCV Calorific ValueDOT&PF State of Alaska Department of Transportation and Public FacilitiesDWT Dead Weight TonsFAA Federal Aviation AdministrationFTE Full Time EquivalentHCV High Capacity VehicleIcicle Icicle SeafoodsJBER Joint Base Elmendorf Richardsonlb/yd pound(s) per yardLNG Liquefied Natural GasLO/LO Lift-on/Lift-offMARAD Maritime AdministrationMLLW Mean Low Low WaterMT Metric TonMSB Matanuska-Susitna BoroughMUTCD Manual of Uniform Traffic Control DevicesNAR Net as ReceivedOPEC Ogranization of the Petroleum Exporting CountriesPOA Port of AnchoragePTC Positive Train ControlPTZ pan-tilt-zoomRO/RO Roll-on/Roll-offSLF Seward Loading FacilitySMIC Seward Marine Industrial CenterTAPS Trans-Alaska Pipeline SystemTesoro Tesoro Alaska CompanyTIGER Transportation Investment Generating Economic GrowthTWIC Transportation Worker Identification CredentialUKMP Upper Kobuk Mineral ProjectULSD Ultra Low Sulfur DieselUSACE United States Army Corps of EngineersUSCG United States Coast GuardUSDOT United States Department of TransportationUSFWS United States Fish and Wildlife ServiceUsibelli Usibelli Coal MineVigor Vigor Industrial LLC Alaska
IFreight Traffic Study
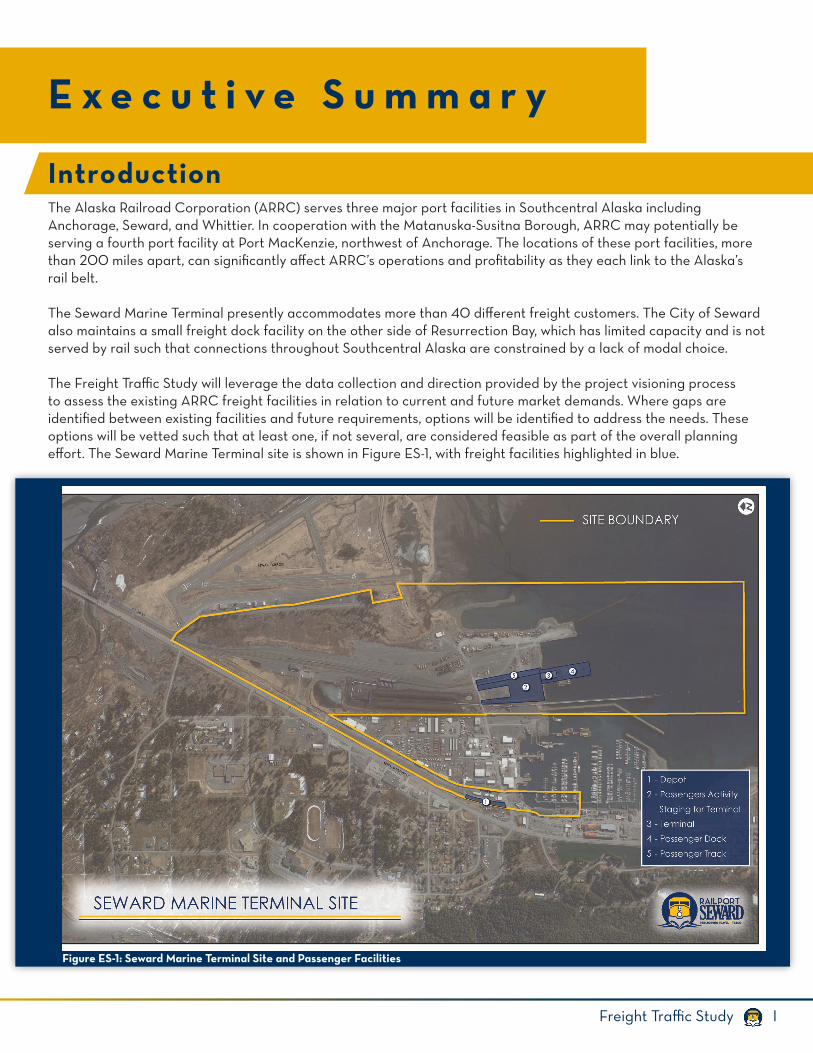
The Alaska Railroad Corporation (ARRC) serves three major port facilities in Southcentral Alaska including Anchorage, Seward, and Whittier. In cooperation with the Matanuska-Susitna Borough, ARRC may potentially be serving a fourth port facility at Port MacKenzie, northwest of Anchorage. The locations of these port facilities, more than 200 miles apart, can significantly affect ARRC’s operations and profitability as they each link to the Alaska’s rail belt.
The Seward Marine Terminal presently accommodates more than 40 different freight customers. The City of Seward also maintains a small freight dock facility on the other side of Resurrection Bay, which has limited capacity and is not served by rail such that connections throughout Southcentral Alaska are constrained by a lack of modal choice.
The Freight Traffic Study will leverage the data collection and direction provided by the project visioning process to assess the existing ARRC freight facilities in relation to current and future market demands. Where gaps are identified between existing facilities and future requirements, options will be identified to address the needs. These options will be vetted such that at least one, if not several, are considered feasible as part of the overall planning effort. The Seward Marine Terminal site is shown in Figure ES-1, with freight facilities highlighted in blue.
M A S T E R P L A NE x e c u t i v e S u m m a r y
Introduction
Figure ES-1: Seward Marine Terminal Site and Passenger Facilities
II Freight Traffic Study
The Freight Traffic Study forms one component of the Seward Marine Terminal Expansion Planning effort, which is guided by the following vision statement.
Other components of the planning effort are detailed below.
• The Passenger Traffic Study considers ARRC passenger facilities and activities at the Seward Marine Terminal.
• The Transportation Connectivity Study considers the intermodal connections that occur at the site (i.e. passenger and freight) and the various connections within the site and from the site to other significant transportation facilities to get to Seward and Southcentral Alaska.
• The Project Visioning Report summarizes the stakeholder outreach and public involvement activities undertaken for the project.
• The Economic Analysis Report details the baseline for economic activities influencing business at the Seward Marine Terminal, looking at local, regional, state, national and global trends.
All of these studies and reports will inform the development of the Seward Marine Terminal Expansion Master Plan, which will set out a 20-year plan for the development of the Seward Marine Terminal.
The Seward Marine Terminal is owned and operated by ARRC. It was established at its current location at the head of Resurrection Bay in 1964, following the Good Friday earthquake. The first asset constructed at the site was the dock now referred to as the passenger dock and the associated building known as the Dale R. Lindsey Intermodal Terminal building. The passenger dock and terminal now primarily provide facilities for cruise lines that land at Seward during the summer cruise season. Since the 1960s, activities have grown at the site with the addition of the Seward Loading Facility (SLF) in 1984, which primarily provides for the loading of coal; the freight dock, which was constructed in 2000 to provide for barges and freight ships; and a range of other buildings and facilities that cater to passengers, freight, and real estate activities at the site.
A Dock Facilities Master Plan was developed by ARRC’s Real Estate division in 2013 and updated in 2014, which outlined an ambitious plan to widen and extend the freight dock to enhance the service offering to freight customers. In 2013, an application from the Transportation Investment Generating Economic Recovery, or TIGER Discretionary Grant Program, was sought to facilitate the freight dock extension and expansion. This application was not awarded a grant as no comprehensive master planning effort was available to support investment in the facilities at Seward. In 2014, ARRC applied for two TIGER grants, one for the freight dock extension and expansion and the other to undertake the Seward Marine Terminal Expansion Planning Effort. ARRC was fortunate to receive a generous award to proceed with the planning effort, and this Freight Traffic Study is part of the planning effort.
As part of the study, a comprehensive analysis of ARRC’s facilities at the Seward Marine Terminal was undertaken to understand the quality of the facilities, whether they were meeting existing needs, and what improvements were required. Extensive community involvement and engagement was undertaken to understand the current deficiencies and concerns around freight movement and use of the site. Input was gathered from people and businesses that use and have a relationship to the facilities including internal stakeholders from across ARRC departments and external stakeholders comprised of current ARRC customers, local elected officials, Seward citizen planning commissions, and commercial property owners and leaseholders near the Seward Marine Terminal. Over the course of 60 stakeholder meetings, extensive information was gathered about the use of the site and facilities and improvements that could occur.
Background and Issues
“”
Reimagining travel and trade to enhance economic vitality and increase opportunities in the region by balancing port, rail, and real estate to meet transportation demands.
IIIFreight Traffic Study
A market analysis was also conducted to understand what ARRC’s freight market is, both in terms of its port operations and also its rail operations. This analysis highlighted that historically the majority of Seward’s freight operations have been based around coal shipment using the SLF. Worldwide demand for coal has substantially decreased due to changing global market conditions, and in 2016 only one shipment of coal was processed through the SLF. No coal shipments are scheduled for 2017. The SLF has now been shut down and placed in permanent cold storage until a decision is made on its future. Other freight shipped through Seward is limited and comprises only three percent of the total freight shipped to or from Alaska. The changing coal market, combined with the limited existing and future forecast freight operations at Seward, present a significant challenge in terms of maintaining the port facility and diversifying the range of freight and other business operations at the site.
In drawing these analyses together, a number of key issues were identified and the major highlights are as follows.
• Seward Loading Facility: Demand for coal from Alaska has all but ceased globally, and the future demand analysis appears bleak, with limited demand for coal and a significant oversupply worldwide over the next several years. This raises the questions about the viability of maintaining the SLF at Seward or whether the land would be better converted to an alternative use.
• Freight Dock: The freight dock is a relatively new facility and in good condition. The dock is fit for current freight operations and also to service forecasted growth at Seward. The dock’s characteristics, in particular, its length and width present operational limitations if the dock was to be called on to support major freight operations in the event the Port of Anchorage is not available or a major project such as Alaska LNG was to proceed.
• Uplands Area: Seward has significant uplands reserve available, which is valuable for a range of freight uses. Currently, only a small proportion of the uplands area is used for port operations or laydown and the land reserve could be made available to alternative uses on a leased basis.
• Train Services: There is no scheduled freight train service operated to and from Seward. When trains are required, these are constructed to fit the needs of the freight customer. Owing to the grade differential between Seward and Anchorage, additional locomotives are required to support freight services which makes trains from Seward more expensive than trains from the Port of Whittier, which has a slighter grade differential and a shorter overall travel distance.
To address the freight traffic issues and needs at the Seward Marine Terminal, 79 individual projects were identified by the project team. Through an iterative screening process, a total of 21 projects were identified for further consideration. A comprehensive screening process was carried out to vet the project options, involving multiple iterations of matrix-based screening, workshops, and presentations to ARRC executives.
Freight Dock
• Option F-FD1 - Freight Dock Extension and Expansion: Widen the freight dock to the edge of the ‘bump out’ on the east side, extend the bulkhead north and dredge the east side of the freight dock. Move the sediment groin eastward and lengthen to provide shelter for the barge basin area. Install a notch in the freight dock for barge ramps.
• Option F-FD2 - Extend Freight Dock Double Track: Extend double track from freight dock into uplands areas inside and outside of freight dock gate.
• Option F-FD3 - Freight Dock Rail Improvements: Replace subgrade beneath freight dock rail with a material that has a lower fines content to reduce frost heaving of tracks; and increase weight capacity of freight dock tracks.
Approach
Improvement Options
IV Freight Traffic Study
• Option F-FD4 - Freight Dock And Area Identity Cards: Provide frequent freight customers with identity cards (such as TWIC cards or similar) that they can use to access the fenced area. Ideally, the cards could provide access to multiple ports.
Seward Loading Facility
• Option F-SL1 - Water Line – Seward Loading Facility Dock: Install a fresh water line on the dock.
• Option F-SL2 - Fuel Lines – Seward Loading Facility Dock: Install fuel lines on the dock (in and out).
• Option F-SL3 - Seward Loading Facility Removal: Remove the Seward Loading Facility coal bunker, conveyer, buildings and repurpose the site.
• Option F-SL4 - Redevelop Seward Loading Facility Land: Install roads, infrastructure and identify lease areas for redevelopment into leases consistent with or complementary to other activities at the Seward Marine Terminal.
Permit Area Inside Freight Dock Fence
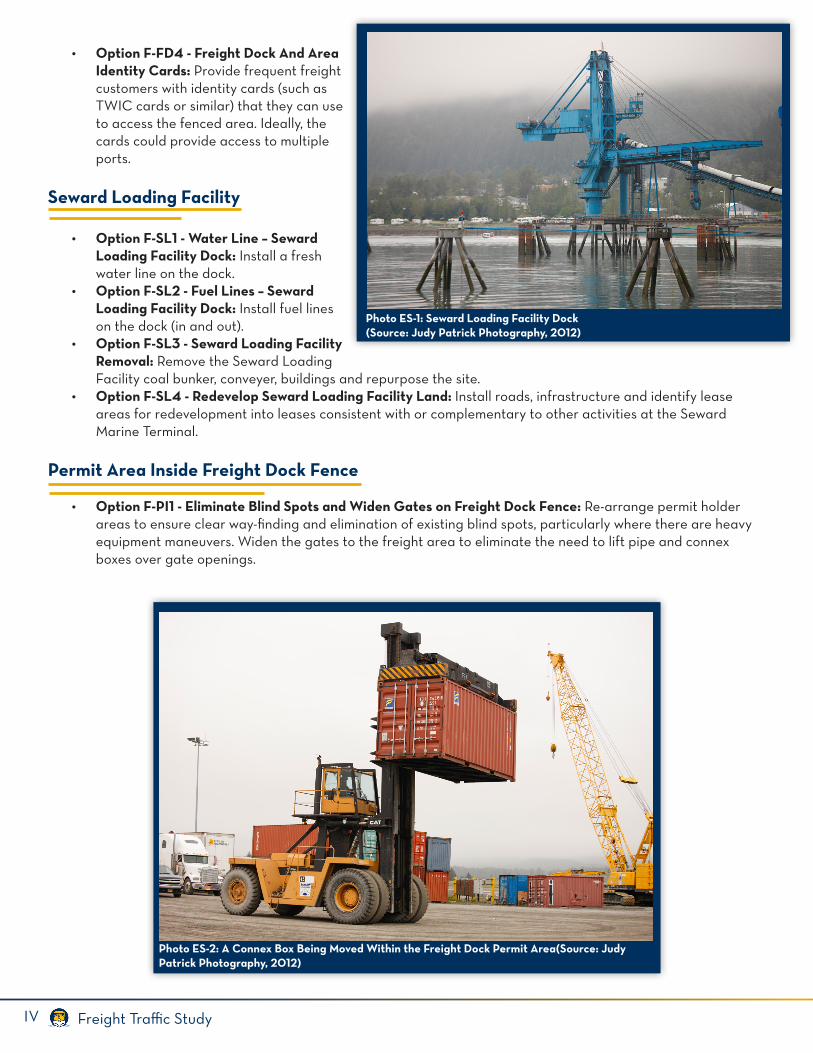
• Option F-PI1 - Eliminate Blind Spots and Widen Gates on Freight Dock Fence: Re-arrange permit holder areas to ensure clear way-finding and elimination of existing blind spots, particularly where there are heavy equipment maneuvers. Widen the gates to the freight area to eliminate the need to lift pipe and connex boxes over gate openings.
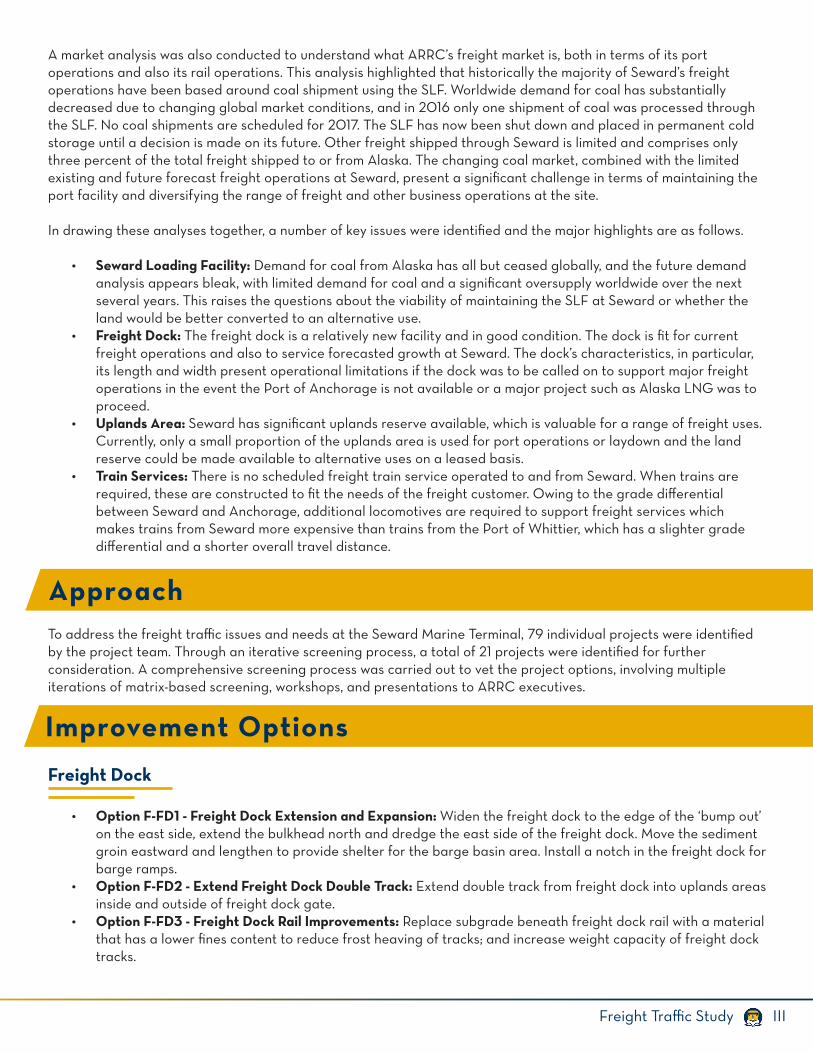
Photo ES-1: Seward Loading Facility Dock (Source: Judy Patrick Photography, 2012)
Photo ES-2: A Connex Box Being Moved Within the Freight Dock Permit Area(Source: Judy Patrick Photography, 2012)
VFreight Traffic Study
Permit Area Outside Freight Dock Fence
• Option F-PO1 - Vessel Haul-out Area: Provide an area adjacent to the barge basin (east side of freight dock) for vessels to be hauled out and stored for marine maintenance purposes. Area should be sufficiently sized and graded to provide for the use of marine air bags.
• Option F-PO2 - Freight Dock At-grade Rail Crossing: Improve the Port Avenue at-grade rail crossing located near the freight dock.
New Laydown Area
• Option F-NL1 - Track #1 Alignment and Switches: Evaluate the alignment and switch locations of Track #1 to optimize the use of the surrounding uplands.
Freight Building
• Option F-FB1 - Freight Building Restrooms: Renovate the freight building to provide separate access to the restrooms for general permit holder use. The restrooms would need to be separate to the lease arrangements for the remainder of the building and have separate metering, etc.
• Option F-FB2 - Combined Freight Building and Communications Shelter: Construct a new freight building co-located with a communications shelter. Include offices, bathroom facilities, and workshop space, with garage doors on the ground floor level, etc. Locate the building on or near the existing communications building on the site.
Railyard
• Option F-RY1 - Increase Rail Weight Limits: Replace 70-pound rail with 115-pound rail in sections of the ladder track, where it is required, to increase weight limits and flexibility of use of the yard.
Real Estate Enhancements with a Freight Focus
• Option F-RE1 - Uplands Utility Upgrades: Bury existing overhead utilities including phone, fiber-optic, and power. Extend phone, fiber-optic, and power infrastructure to leaseholder area for leaseholder extension. Provide city sewer to the freight building, roundhouse, and SLF buildings. Provide water and sewer to upland areas to create leasing and development opportunities. To leverage mobilization and bidding costs, combine with road projects. Repair potholes and improve drainage throughout the area. Provide better lighting throughout the uplands area. Project may be staged on an area-by-area basis, dependent on need and demand.
• Option F-RE2 - Freight Uplands Improvements: Improve road width and structure to accommodate Liquefied Natural Gas (LNG) modules (22 feet wide plus other metrics on weight and design vehicle) along internal roads between the freight dock, permit areas and the new laydown area. Build a road to the barge uplands area to access pull-out equipment. Level and prepare uplands areas throughout the site. Create additional container storage in the northeast area. Top all working surfaces with asphalt concrete to eliminate potholes and reduce dust issues. Develop a landscaping plan for the area and create natural buffers between wetlands and natural areas to the east and northeast of the site. Provide a fence or concrete barriers to differentiate lease lots and provide secured areas. Project may be staged on an area-by-area basis or as need arises.
• Option F-RE3 - Laydown Area: Establish large continuous laydown areas for large projects.• Option F-RE4 - Refined Fuel Distributor: Build a depot and facilities for a refined fuel distributor.• Option F-RE5 - Marine Repair and Maintenance Facility: Provide a marine repair and maintenance facility
including boat storage.• Option F-RE6 - Seafood Processing: Provide a seafood processing facility including dedicated new plant,
dedicated dock, and accommodations for 100 people.
VI Freight Traffic Study
Next StepsThe information presented in the Freight Traffic Study has been prepared to inform the development of the Seward Marine Terminal Expansion Master Plan. Further information on recommended approaches to site development, potential funding arrangements, and prioritization of projects will be addressed as part of the master plan.
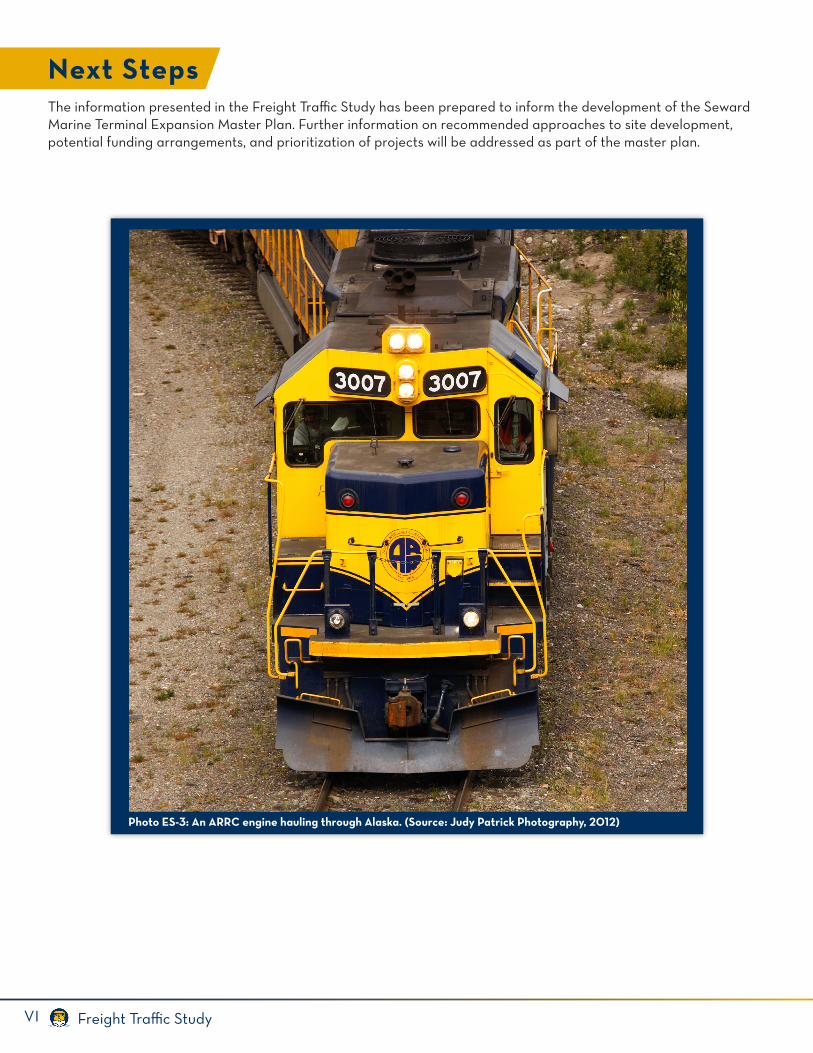
Photo ES-3: An ARRC engine hauling through Alaska. (Source: Judy Patrick Photography, 2012)
1Freight Traffic Study
1 . Introduction
1.1 Seward Marine Terminal Expansion Planning Project StructureThe Freight Traffic Study is one of three major study reports that inform the Seward Marine Terminal Expansion Master Plan. It focuses on all freight transportation activities and facilities at the Seward Marine Terminal, which are generally provided by barge, train, and High Capacity Vehicle (HCV) trucks. Two other studies complete the major study reports.
• The Passenger Traffic Study considers the Alaska Railroad Corporation (ARRC) passenger facilities and activities at the Seward Marine Terminal. The passenger facilities are concentrated in two separate locations: at the Seward depot near the corner of Port Avenue and Fourth Avenue, where schedule passenger services on trains are located, and at the Dale R. Lindsey Intermodal Terminal (terminal), where cruise ships land and passengers transfer to other modes of transportation. Passenger activities include trains, cruise ships, coaches, and charter vehicles and provide motor vehicle movements to and from the site, and around the terminal building.
• The Transportation Connectivity Study considers the intermodal connections that occur at the site (i.e., passenger and freight), and the various connections within the site and from the site to other significant transportation facilities to get to Seward and Southcentral Alaska. The study characterizes the existing connections, analyzes gaps, and proposes improvements, with a particular focus on separating conflict between passenger and freight traffic movements within and from the site.
In addition to these studies, the following additional reports have been prepared in support of the Seward Marine Terminal Expansion Master Plan.
• The Project Visioning Report summarizes the stakeholder outreach and public involvement activities undertaken for the project. It details the process for the development of the project vision and branding, together with the feedback received from stakeholders and how this has been incorporated into the Seward Marine Terminal Expansion Master Plan.
• The Economic Analysis Report details the baseline for economic activities influencing business at the Seward Marine Terminal looking at local, regional, state, national, and global trends. It considers how economic stimulus projects could inform how to best make use of available real estate at the site. The analysis will support project recommendations in the Freight Traffic Study and also site layout and staging in the Seward Marine Terminal Expansion Master Plan.
The Seward Marine Terminal Expansion Master Plan will set out the selected options from the Passenger, Freight, and Connectivity Studies and present them in a 20-year development plan, inclusive of concepts, designs and recommendations. To enable clarity across the large site, the plan will be divided into the following four cornerstones:
• Cornerstone 1: Passenger• Cornerstone 2: Freight• Cornerstone 3: Real estate and land development• Cornerstone 4: Infrastructure
2 Freight Traffic Study
The analysis will guide the assimilation of the projects into ARRC’s existing terminal operations and consider constructability to meet current and future demand, enable operations to continue, first cost vs. life-cycle costs, and the balancing of short- and long-term infrastructure needs with modal demands and space availability. The Master Plan will also focus on ensuring integration as much as practicable into the local Seward community and transportation network.
In response to stakeholder input, the project team crafted a vision statement to guide the project studies. The statement is a living guide for the planning process as the project looks at Seward and the region’s transportation needs. It takes into account stakeholder input, the ARRC’s core values, economic forecasting, and the requirements of the project’s Transportation Investment Generating Economic Recovery (TIGER) grant funding. The vision statement for the Seward Marine Terminal Expansion Master Plan project is as follows.
The vision statement provides a concise purpose for prospective design alternatives and assists planners in considering the best uses of the ARRC’s assets in Seward. The statement will continue to evolve and serve ARRC through planning and beyond to ensure this nationally- and regionally-significant port continues to meet current and future demand.
The Freight Traffic Study assesses the existing ARRC freight facilities in relation to current and future demands. Where gaps are identified between existing facilities and future requirements, options have been identified to address the needs. This report documents the existing study area characteristics and deficiencies and carries out an analysis to forecast future demands and facility requirements. Options have been developed and evaluated with respect to these demands and the preferred options are set out as recommendations to be taken forward in the Seward Marine Terminal Expansion Master Plan. The above vision statement has guided the project development, evaluation, and recommendation process.
The Seward Marine Terminal Expansion Planning project – also known as Railport Seward – is funded by a generous TIGER VI (National Infrastructure Investments) grant from the United States Department of Transportation (USDOT) Maritime Administration (MARAD). The MARAD-administered grant is in the amount of $2.5 million. ARRC is providing $500,000 as required for total matching funds. The total project cost is $3 million.
The Transportation Investment Generating Economic Recovery, or TIGER Discretional Grant program provides a unique opportunity for USDOT to invest in road, rail, transit, and port projects that promise to achieve national objectives. Since 2009, Congress has dedicated nearly $4.6 billion for seven rounds of TIGER to fund projects that have a significant impact on the nation, a region, or a metropolitan area.
The TIGER grant program is highly sought after, and USDOT examines all applications on their merits to ensure that taxpayers are getting the highest value for every dollar invested in TIGER grants. Applicants must detail the benefits their project would deliver for five long-term outcomes: safety, economic competitiveness, state of good repair, quality of life, and environmental sustainability. USDOT also evaluates projects on innovation, partnerships, project readiness, benefit cost analysis, and cost share. The TIGER grant program was launched in 2009, and as part of TIGER VI, 41 capital projects and 31 planning projects were awarded grant funding.
1.2 Project Vision
Reimagining travel and trade to enhance economic vitality and increase opportunities in the region by balancing port, rail, and real estate to meet transportation demands.
Seward Marine Terminal Expansion Master Plan Vision Statement:
1.3 Background Information1.3.1 Project Funding
3Freight Traffic Study
The Alaska Central Railway (later renamed “The Alaska Railroad”) built the first railroad in Alaska in 1903. It started in Seward and extended 50 miles to the north. Over the years, the railroad grew and expanded until 1985, when the State of Alaska purchased the railroad and incorporated it as a self-supporting, state-owned entity responsible for the operation and maintenance of this important mode of transportation. ARRC currently provides regularly-scheduled passenger services along 580 miles of track and also operates freight service along the mainline and additional spur lines.
The ARRC’s mission is: “Through excellent customer service and sound business practices, the Alaska Railroad Corporation (ARRC) provides safe, efficient and economical transportation and real estate services that support and grow economic development opportunities for the State of Alaska.”
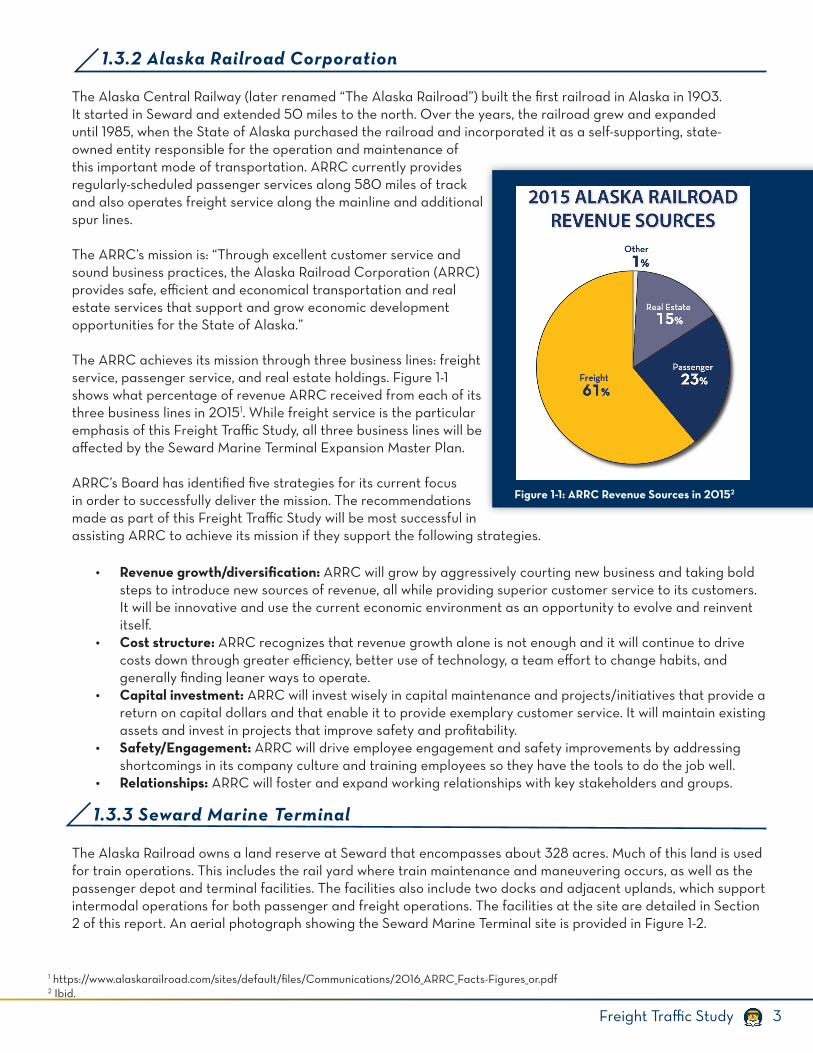
The ARRC achieves its mission through three business lines: freight service, passenger service, and real estate holdings. Figure 1-1 shows what percentage of revenue ARRC received from each of its three business lines in 20151. While freight service is the particular emphasis of this Freight Traffic Study, all three business lines will be affected by the Seward Marine Terminal Expansion Master Plan.
ARRC’s Board has identified five strategies for its current focus in order to successfully deliver the mission. The recommendations made as part of this Freight Traffic Study will be most successful in assisting ARRC to achieve its mission if they support the following strategies.
• Revenue growth/diversification: ARRC will grow by aggressively courting new business and taking bold steps to introduce new sources of revenue, all while providing superior customer service to its customers. It will be innovative and use the current economic environment as an opportunity to evolve and reinvent itself.
• Cost structure: ARRC recognizes that revenue growth alone is not enough and it will continue to drive costs down through greater efficiency, better use of technology, a team effort to change habits, and generally finding leaner ways to operate.
• Capital investment: ARRC will invest wisely in capital maintenance and projects/initiatives that provide a return on capital dollars and that enable it to provide exemplary customer service. It will maintain existing assets and invest in projects that improve safety and profitability.
• Safety/Engagement: ARRC will drive employee engagement and safety improvements by addressing shortcomings in its company culture and training employees so they have the tools to do the job well.
• Relationships: ARRC will foster and expand working relationships with key stakeholders and groups.
The Alaska Railroad owns a land reserve at Seward that encompasses about 328 acres. Much of this land is used for train operations. This includes the rail yard where train maintenance and maneuvering occurs, as well as the passenger depot and terminal facilities. The facilities also include two docks and adjacent uplands, which support intermodal operations for both passenger and freight operations. The facilities at the site are detailed in Section 2 of this report. An aerial photograph showing the Seward Marine Terminal site is provided in Figure 1-2.
1.3.2 Alaska Railroad Corporation
Figure 1-1: ARRC Revenue Sources in 20152
1 https://www.alaskarailroad.com/sites/default/files/Communications/2016_ARRC_Facts-Figures_or.pdf2 Ibid.
1.3.3 Seward Marine Terminal
4 Freight Traffic Study
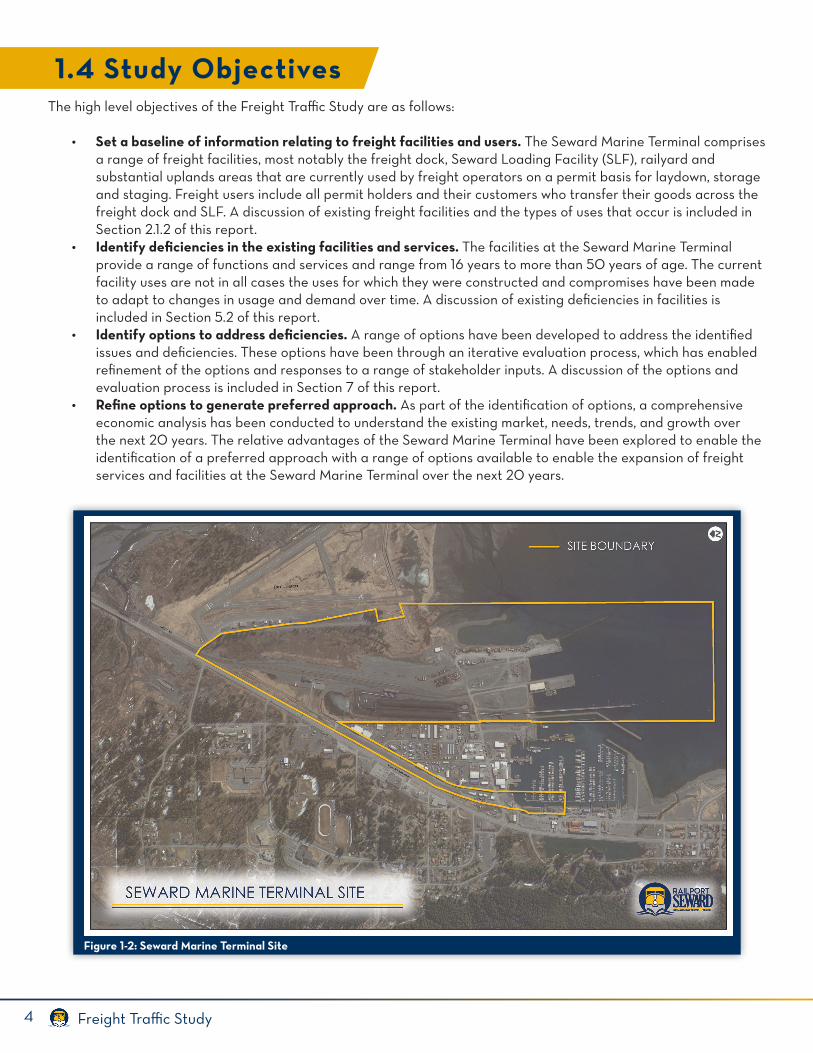
The high level objectives of the Freight Traffic Study are as follows:
• Set a baseline of information relating to freight facilities and users. The Seward Marine Terminal comprises a range of freight facilities, most notably the freight dock, Seward Loading Facility (SLF), railyard and substantial uplands areas that are currently used by freight operators on a permit basis for laydown, storage and staging. Freight users include all permit holders and their customers who transfer their goods across the freight dock and SLF. A discussion of existing freight facilities and the types of uses that occur is included in Section 2.1.2 of this report.
• Identify deficiencies in the existing facilities and services. The facilities at the Seward Marine Terminal provide a range of functions and services and range from 16 years to more than 50 years of age. The current facility uses are not in all cases the uses for which they were constructed and compromises have been made to adapt to changes in usage and demand over time. A discussion of existing deficiencies in facilities is included in Section 5.2 of this report.
• Identify options to address deficiencies. A range of options have been developed to address the identified issues and deficiencies. These options have been through an iterative evaluation process, which has enabled refinement of the options and responses to a range of stakeholder inputs. A discussion of the options and evaluation process is included in Section 7 of this report.
• Refine options to generate preferred approach. As part of the identification of options, a comprehensive economic analysis has been conducted to understand the existing market, needs, trends, and growth over the next 20 years. The relative advantages of the Seward Marine Terminal have been explored to enable the identification of a preferred approach with a range of options available to enable the expansion of freight services and facilities at the Seward Marine Terminal over the next 20 years.
Figure 1-2: Seward Marine Terminal Site
1.4 Study Objectives
5Freight Traffic Study
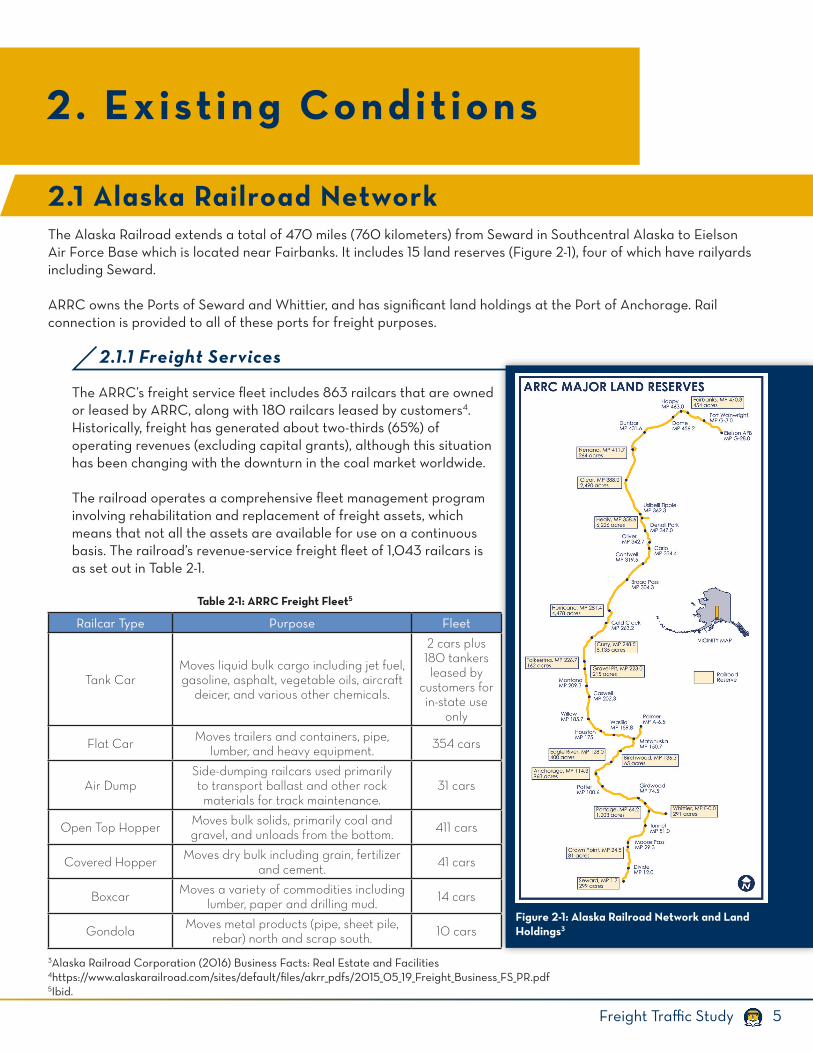
The Alaska Railroad extends a total of 470 miles (760 kilometers) from Seward in Southcentral Alaska to Eielson Air Force Base which is located near Fairbanks. It includes 15 land reserves (Figure 2-1), four of which have railyards including Seward.
ARRC owns the Ports of Seward and Whittier, and has significant land holdings at the Port of Anchorage. Rail connection is provided to all of these ports for freight purposes.
The ARRC’s freight service fleet includes 863 railcars that are owned or leased by ARRC, along with 180 railcars leased by customers4. Historically, freight has generated about two-thirds (65%) of operating revenues (excluding capital grants), although this situation has been changing with the downturn in the coal market worldwide.
The railroad operates a comprehensive fleet management program involving rehabilitation and replacement of freight assets, which means that not all the assets are available for use on a continuous basis. The railroad’s revenue-service freight fleet of 1,043 railcars is as set out in Table 2-1.
2.1.1 Freight Services
2. Existing Conditions
2.1 Alaska Railroad Network
Figure 2-1: Alaska Railroad Network and Land Holdings3
3Alaska Railroad Corporation (2016) Business Facts: Real Estate and Facilities4https://www.alaskarailroad.com/sites/default/files/akrr_pdfs/2015_05_19_Freight_Business_FS_PR.pdf5Ibid.
Railcar Type Purpose Fleet
Tank CarMoves liquid bulk cargo including jet fuel, gasoline, asphalt, vegetable oils, aircraft
deicer, and various other chemicals.
2 cars plus 180 tankers leased by
customers for in-state use
only
Flat Car Moves trailers and containers, pipe, lumber, and heavy equipment. 354 cars
Air DumpSide-dumping railcars used primarily to transport ballast and other rock materials for track maintenance.
31 cars
Open Top Hopper Moves bulk solids, primarily coal and gravel, and unloads from the bottom. 411 cars
Covered Hopper Moves dry bulk including grain, fertilizer and cement. 41 cars
Boxcar Moves a variety of commodities including lumber, paper and drilling mud. 14 cars
Gondola Moves metal products (pipe, sheet pile, rebar) north and scrap south. 10 cars
Table 2-1: ARRC Freight Fleet5
6 Freight Traffic Study
Annual freight volumes have dropped 44 percent over the last eight years, with the total tonnage moved dropping from 6.6 million tons in 2008 to 3.7 million tons in 20166. Freight train operations have reduced due to lower demand, with scheduled freight operating between Fairbanks and Anchorage being lowered from two trains, seven days per week to one train, five days per week in 20177.
There are currently no scheduled freight services operating to and from Seward. Freight trains are constructed on an as-needed basis, dependent on customer requirements and demand. Prior to 2015 there were regular coal trains moving between the Usibelli coal mine in Healy and the Seward Marine Terminal. Additional freight cars could be added to these trains when required. With the coal market downturn there are no coal trains scheduled to visit Seward in 2017.
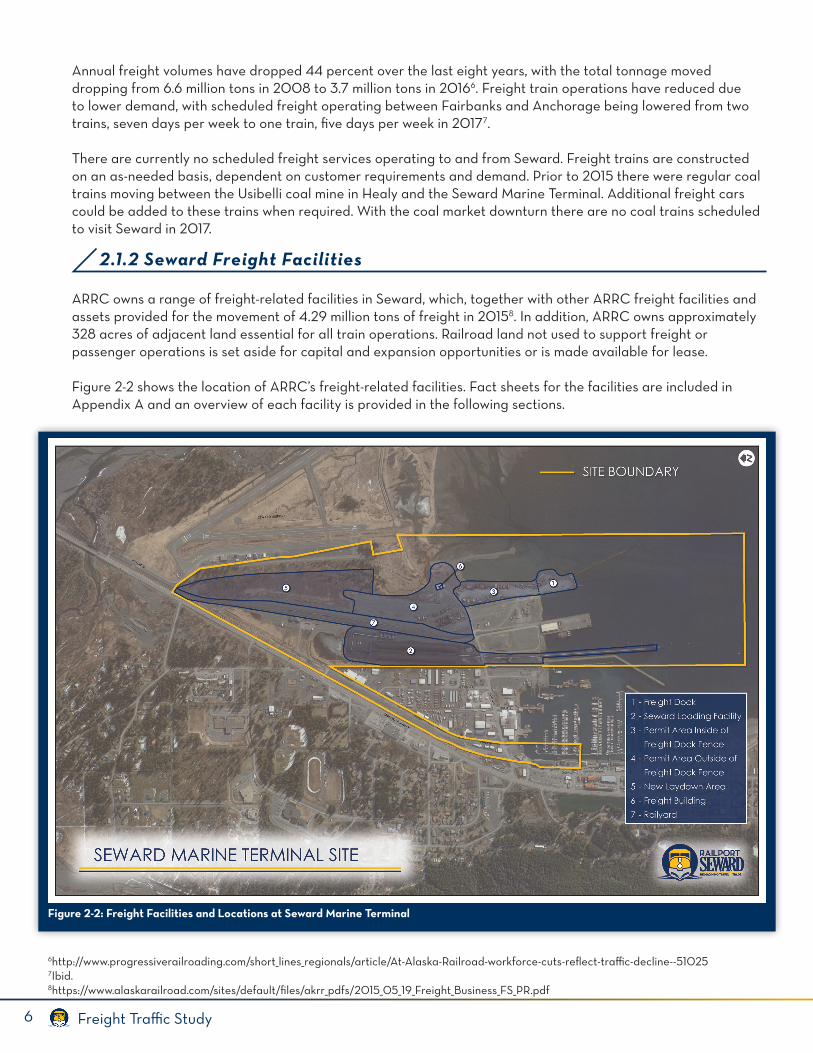
ARRC owns a range of freight-related facilities in Seward, which, together with other ARRC freight facilities and assets provided for the movement of 4.29 million tons of freight in 20158. In addition, ARRC owns approximately 328 acres of adjacent land essential for all train operations. Railroad land not used to support freight or passenger operations is set aside for capital and expansion opportunities or is made available for lease.
Figure 2-2 shows the location of ARRC’s freight-related facilities. Fact sheets for the facilities are included in Appendix A and an overview of each facility is provided in the following sections.
2.1.2 Seward Freight Facilities
Figure 2-2: Freight Facilities and Locations at Seward Marine Terminal
6http://www.progressiverailroading.com/short_lines_regionals/article/At-Alaska-Railroad-workforce-cuts-reflect-traffic-decline--510257Ibid.8https://www.alaskarailroad.com/sites/default/files/akrr_pdfs/2015_05_19_Freight_Business_FS_PR.pdf
7Freight Traffic Study
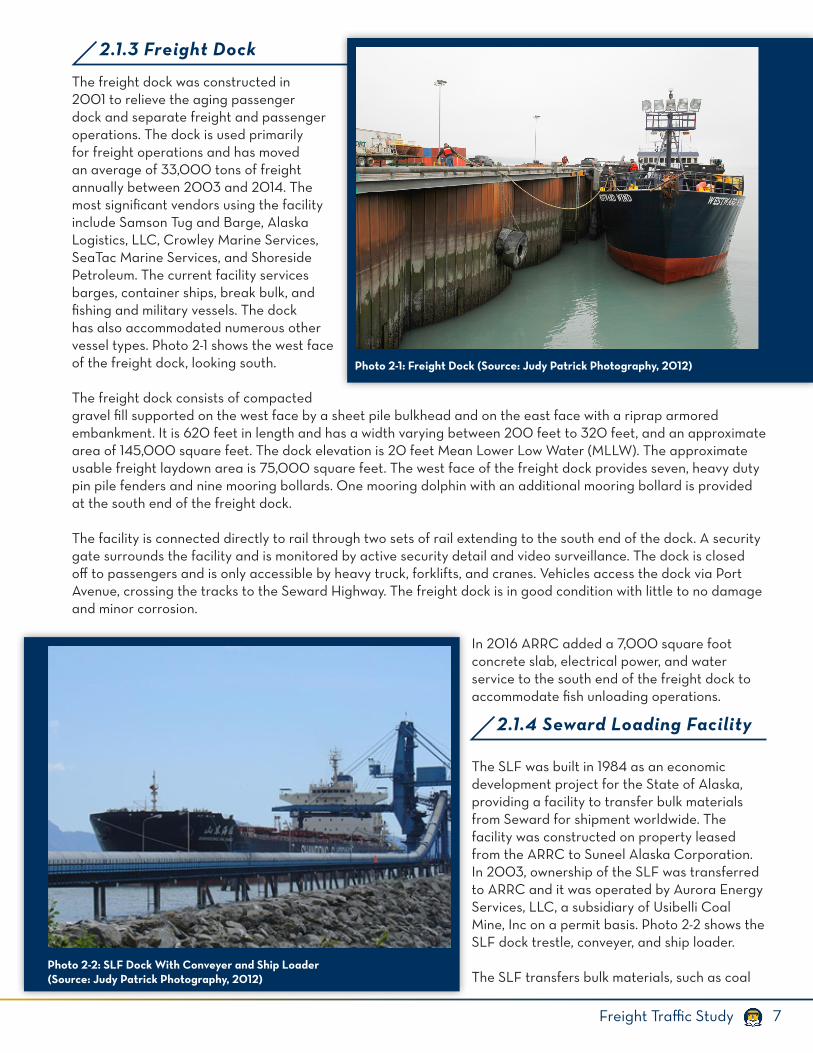
The freight dock was constructed in 2001 to relieve the aging passenger dock and separate freight and passenger operations. The dock is used primarily for freight operations and has moved an average of 33,000 tons of freight annually between 2003 and 2014. The most significant vendors using the facility include Samson Tug and Barge, Alaska Logistics, LLC, Crowley Marine Services, SeaTac Marine Services, and Shoreside Petroleum. The current facility services barges, container ships, break bulk, and fishing and military vessels. The dock has also accommodated numerous other vessel types. Photo 2-1 shows the west face of the freight dock, looking south.
The freight dock consists of compacted gravel fill supported on the west face by a sheet pile bulkhead and on the east face with a riprap armored embankment. It is 620 feet in length and has a width varying between 200 feet to 320 feet, and an approximate area of 145,000 square feet. The dock elevation is 20 feet Mean Lower Low Water (MLLW). The approximate usable freight laydown area is 75,000 square feet. The west face of the freight dock provides seven, heavy duty pin pile fenders and nine mooring bollards. One mooring dolphin with an additional mooring bollard is provided at the south end of the freight dock.
The facility is connected directly to rail through two sets of rail extending to the south end of the dock. A security gate surrounds the facility and is monitored by active security detail and video surveillance. The dock is closed off to passengers and is only accessible by heavy truck, forklifts, and cranes. Vehicles access the dock via Port Avenue, crossing the tracks to the Seward Highway. The freight dock is in good condition with little to no damage and minor corrosion.
In 2016 ARRC added a 7,000 square foot concrete slab, electrical power, and water service to the south end of the freight dock to accommodate fish unloading operations.
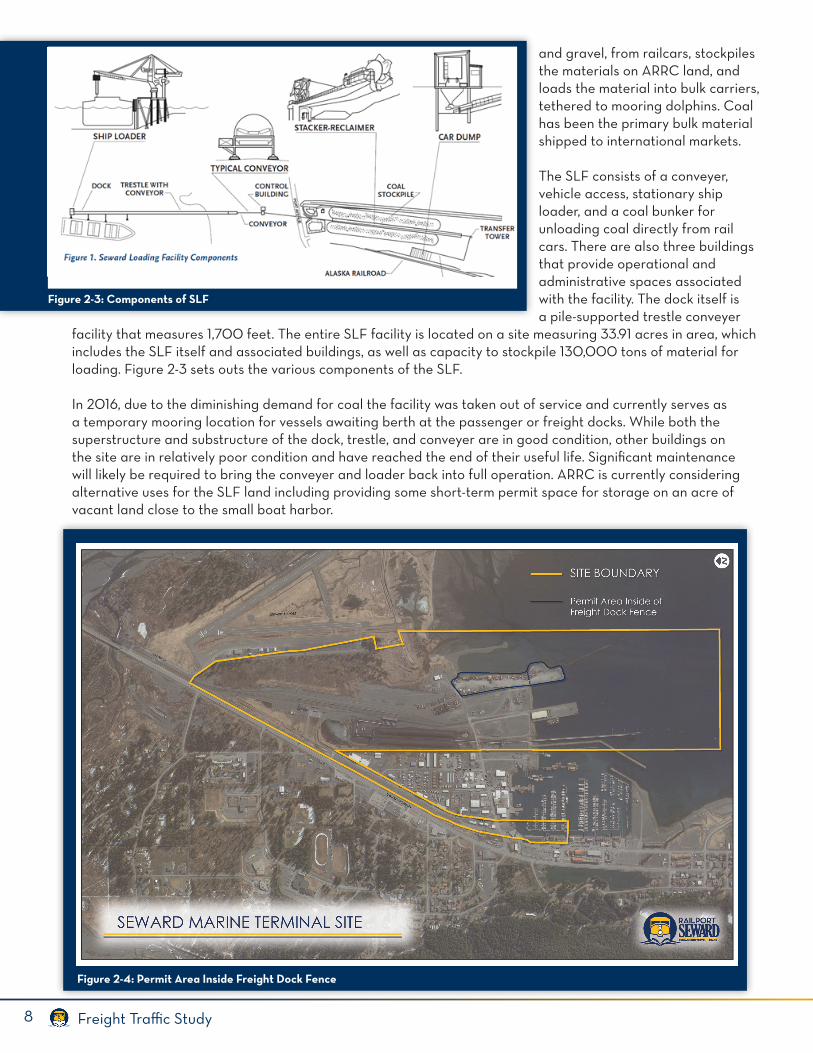
The SLF was built in 1984 as an economic development project for the State of Alaska, providing a facility to transfer bulk materials from Seward for shipment worldwide. The facility was constructed on property leased from the ARRC to Suneel Alaska Corporation. In 2003, ownership of the SLF was transferred to ARRC and it was operated by Aurora Energy Services, LLC, a subsidiary of Usibelli Coal Mine, Inc on a permit basis. Photo 2-2 shows the SLF dock trestle, conveyer, and ship loader.
The SLF transfers bulk materials, such as coal
2.1.3 Freight Dock
Photo 2-1: Freight Dock (Source: Judy Patrick Photography, 2012)
2.1.4 Seward Loading Facility
Photo 2-2: SLF Dock With Conveyer and Ship Loader(Source: Judy Patrick Photography, 2012)
8 Freight Traffic Study
and gravel, from railcars, stockpiles the materials on ARRC land, and loads the material into bulk carriers, tethered to mooring dolphins. Coal has been the primary bulk material shipped to international markets.
The SLF consists of a conveyer, vehicle access, stationary ship loader, and a coal bunker for unloading coal directly from rail cars. There are also three buildings that provide operational and administrative spaces associated with the facility. The dock itself is a pile-supported trestle conveyer
facility that measures 1,700 feet. The entire SLF facility is located on a site measuring 33.91 acres in area, which includes the SLF itself and associated buildings, as well as capacity to stockpile 130,000 tons of material for loading. Figure 2-3 sets outs the various components of the SLF.
In 2016, due to the diminishing demand for coal the facility was taken out of service and currently serves as a temporary mooring location for vessels awaiting berth at the passenger or freight docks. While both the superstructure and substructure of the dock, trestle, and conveyer are in good condition, other buildings on the site are in relatively poor condition and have reached the end of their useful life. Significant maintenance will likely be required to bring the conveyer and loader back into full operation. ARRC is currently considering alternative uses for the SLF land including providing some short-term permit space for storage on an acre of vacant land close to the small boat harbor.
Figure 2-3: Components of SLF
Figure 2-4: Permit Area Inside Freight Dock Fence
9Freight Traffic Study
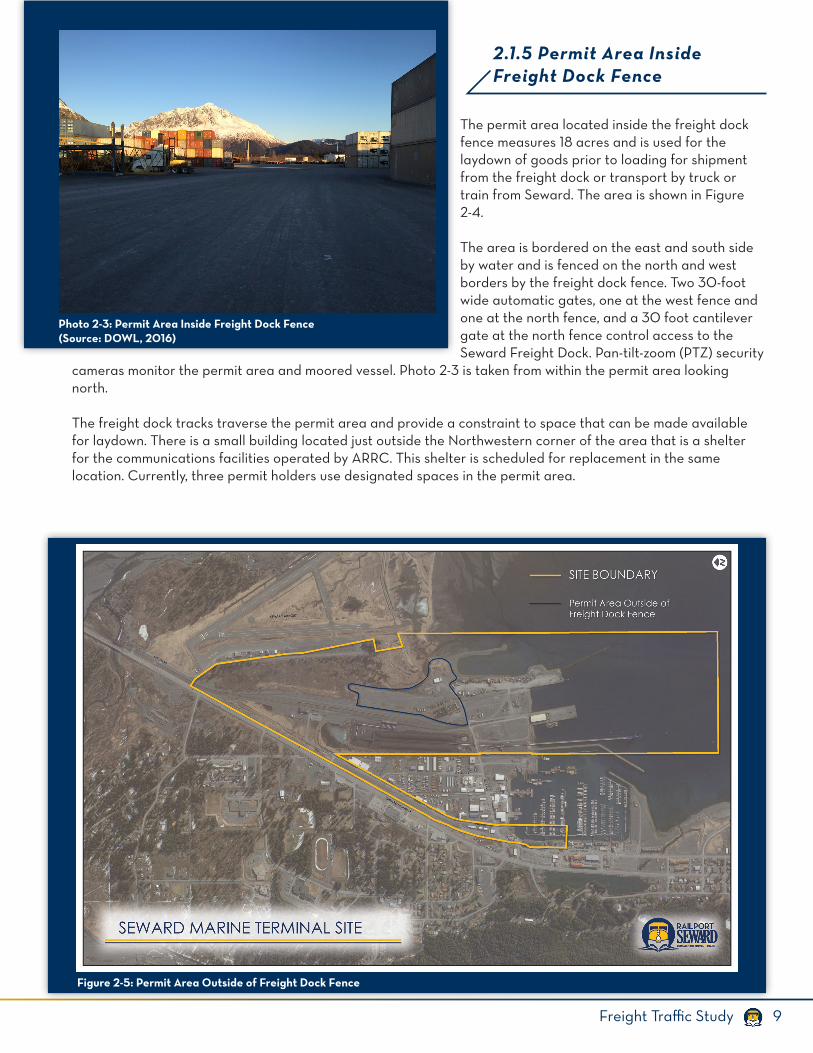
The permit area located inside the freight dock fence measures 18 acres and is used for the laydown of goods prior to loading for shipment from the freight dock or transport by truck or train from Seward. The area is shown in Figure 2-4.
The area is bordered on the east and south side by water and is fenced on the north and west borders by the freight dock fence. Two 30-foot wide automatic gates, one at the west fence and one at the north fence, and a 30 foot cantilever gate at the north fence control access to the Seward Freight Dock. Pan-tilt-zoom (PTZ) security
cameras monitor the permit area and moored vessel. Photo 2-3 is taken from within the permit area looking north.
The freight dock tracks traverse the permit area and provide a constraint to space that can be made available for laydown. There is a small building located just outside the Northwestern corner of the area that is a shelter for the communications facilities operated by ARRC. This shelter is scheduled for replacement in the same location. Currently, three permit holders use designated spaces in the permit area.
Photo 2-3: Permit Area Inside Freight Dock Fence(Source: DOWL, 2016)
2.1.5 Permit Area Inside Freight Dock Fence
Figure 2-5: Permit Area Outside of Freight Dock Fence
10 Freight Traffic Study
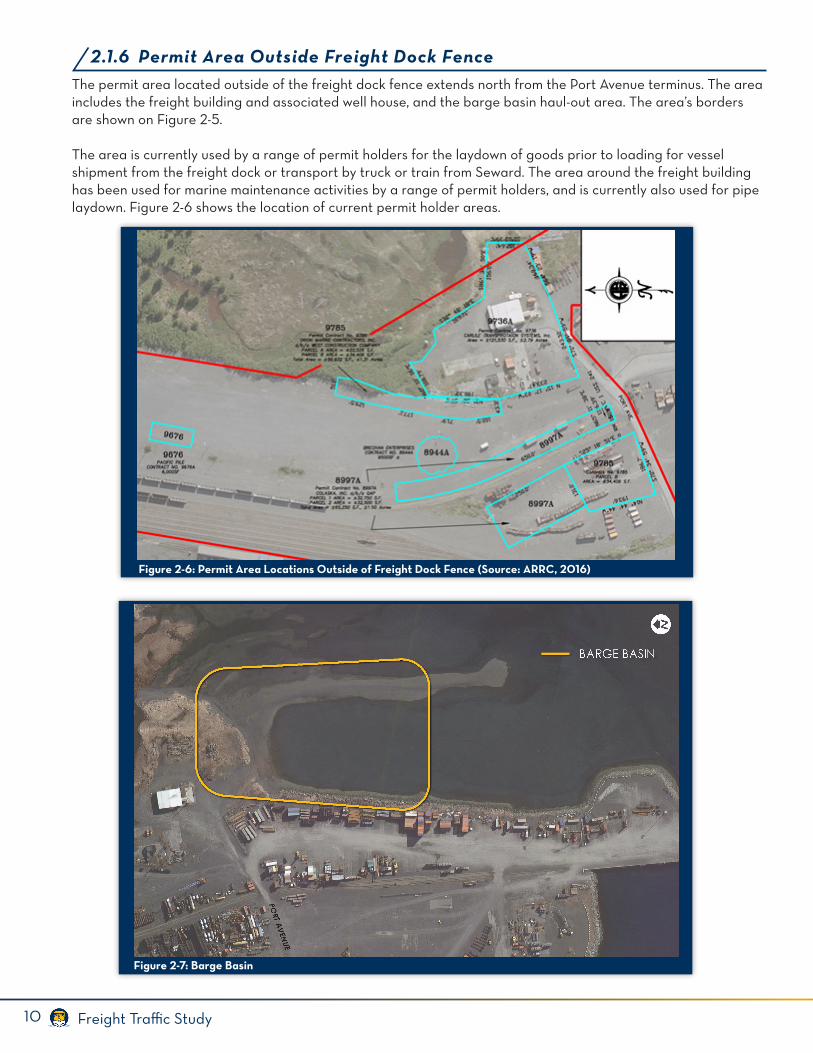
The permit area located outside of the freight dock fence extends north from the Port Avenue terminus. The area includes the freight building and associated well house, and the barge basin haul-out area. The area’s borders are shown on Figure 2-5.
The area is currently used by a range of permit holders for the laydown of goods prior to loading for vessel shipment from the freight dock or transport by truck or train from Seward. The area around the freight building has been used for marine maintenance activities by a range of permit holders, and is currently also used for pipe laydown. Figure 2-6 shows the location of current permit holder areas.
Figure 2-6: Permit Area Locations Outside of Freight Dock Fence (Source: ARRC, 2016)
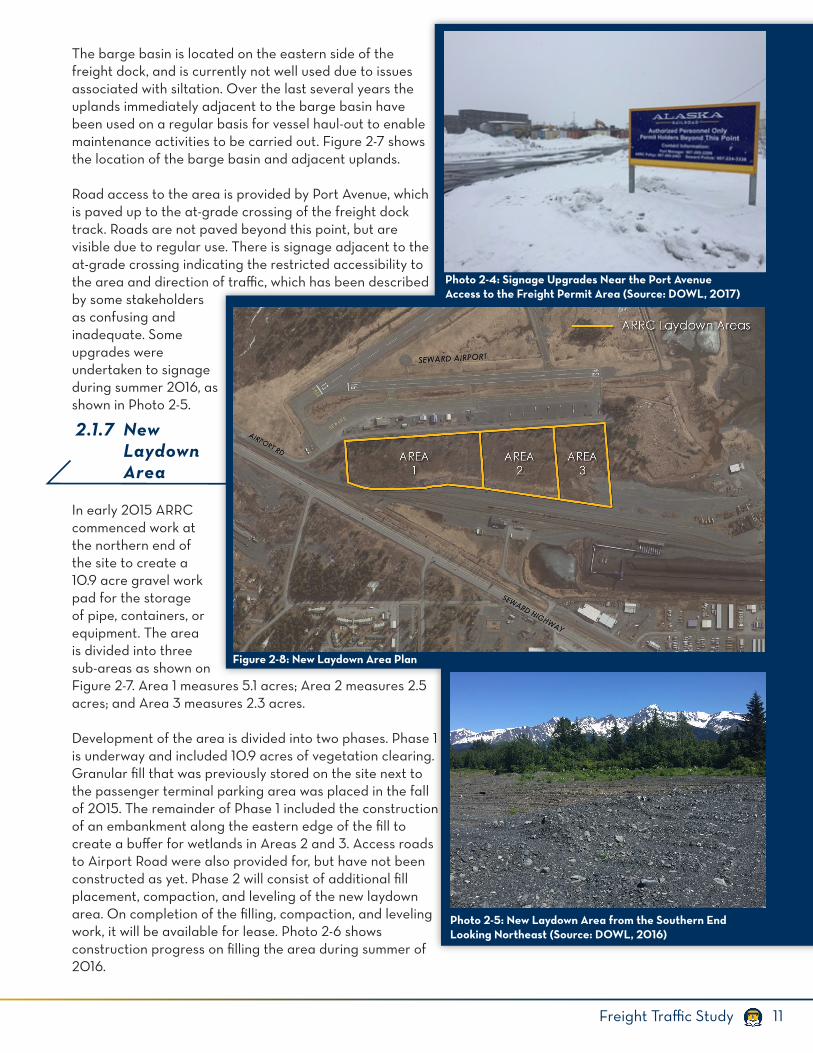
Figure 2-7: Barge Basin
2.1.6 Permit Area Outside Freight Dock Fence
11Freight Traffic Study
The barge basin is located on the eastern side of the freight dock, and is currently not well used due to issues associated with siltation. Over the last several years the uplands immediately adjacent to the barge basin have been used on a regular basis for vessel haul-out to enable maintenance activities to be carried out. Figure 2-7 shows the location of the barge basin and adjacent uplands.
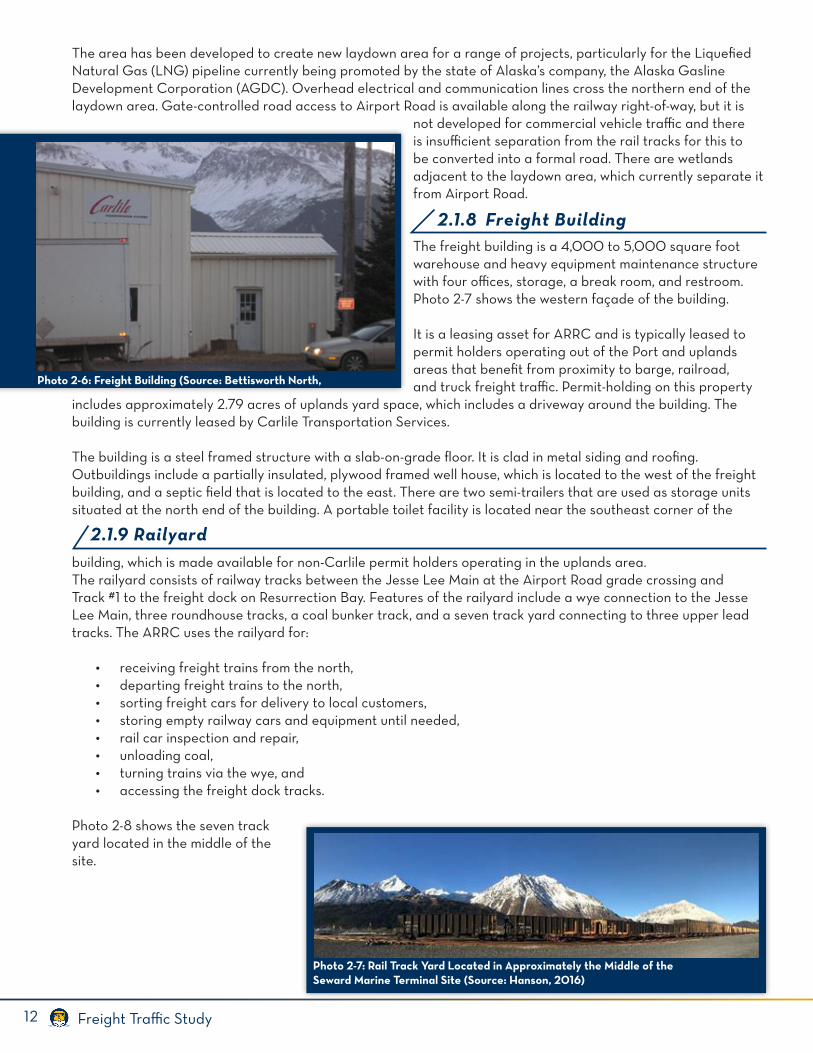
Road access to the area is provided by Port Avenue, which is paved up to the at-grade crossing of the freight dock track. Roads are not paved beyond this point, but are visible due to regular use. There is signage adjacent to the at-grade crossing indicating the restricted accessibility to the area and direction of traffic, which has been described by some stakeholders as confusing and inadequate. Some upgrades were undertaken to signage during summer 2016, as shown in Photo 2-5.
In early 2015 ARRC commenced work at the northern end of the site to create a 10.9 acre gravel work pad for the storage of pipe, containers, or equipment. The area is divided into three sub-areas as shown on Figure 2-7. Area 1 measures 5.1 acres; Area 2 measures 2.5 acres; and Area 3 measures 2.3 acres.
Development of the area is divided into two phases. Phase 1 is underway and included 10.9 acres of vegetation clearing. Granular fill that was previously stored on the site next to the passenger terminal parking area was placed in the fall of 2015. The remainder of Phase 1 included the construction of an embankment along the eastern edge of the fill to create a buffer for wetlands in Areas 2 and 3. Access roads to Airport Road were also provided for, but have not been constructed as yet. Phase 2 will consist of additional fill placement, compaction, and leveling of the new laydown area. On completion of the filling, compaction, and leveling work, it will be available for lease. Photo 2-6 shows construction progress on filling the area during summer of 2016.
2.1.7 New Laydown Area
Photo 2-5: New Laydown Area from the Southern End Looking Northeast (Source: DOWL, 2016)
Photo 2-4: Signage Upgrades Near the Port Avenue Access to the Freight Permit Area (Source: DOWL, 2017)
Figure 2-8: New Laydown Area Plan
12 Freight Traffic Study
The area has been developed to create new laydown area for a range of projects, particularly for the Liquefied Natural Gas (LNG) pipeline currently being promoted by the state of Alaska’s company, the Alaska Gasline Development Corporation (AGDC). Overhead electrical and communication lines cross the northern end of the laydown area. Gate-controlled road access to Airport Road is available along the railway right-of-way, but it is
not developed for commercial vehicle traffic and there is insufficient separation from the rail tracks for this to be converted into a formal road. There are wetlands adjacent to the laydown area, which currently separate it from Airport Road.
The freight building is a 4,000 to 5,000 square foot warehouse and heavy equipment maintenance structure with four offices, storage, a break room, and restroom. Photo 2-7 shows the western façade of the building.
It is a leasing asset for ARRC and is typically leased to permit holders operating out of the Port and uplands areas that benefit from proximity to barge, railroad, and truck freight traffic. Permit-holding on this property
includes approximately 2.79 acres of uplands yard space, which includes a driveway around the building. The building is currently leased by Carlile Transportation Services.
The building is a steel framed structure with a slab-on-grade floor. It is clad in metal siding and roofing. Outbuildings include a partially insulated, plywood framed well house, which is located to the west of the freight building, and a septic field that is located to the east. There are two semi-trailers that are used as storage units situated at the north end of the building. A portable toilet facility is located near the southeast corner of the
building, which is made available for non-Carlile permit holders operating in the uplands area.The railyard consists of railway tracks between the Jesse Lee Main at the Airport Road grade crossing and Track #1 to the freight dock on Resurrection Bay. Features of the railyard include a wye connection to the Jesse Lee Main, three roundhouse tracks, a coal bunker track, and a seven track yard connecting to three upper lead tracks. The ARRC uses the railyard for:
• receiving freight trains from the north,• departing freight trains to the north,• sorting freight cars for delivery to local customers,• storing empty railway cars and equipment until needed,• rail car inspection and repair,• unloading coal,• turning trains via the wye, and• accessing the freight dock tracks.
Photo 2-8 shows the seven track yard located in the middle of the site.
2.1.8 Freight Building
Photo 2-6: Freight Building (Source: Bettisworth North,
Photo 2-7: Rail Track Yard Located in Approximately the Middle of the Seward Marine Terminal Site (Source: Hanson, 2016)
2.1.9 Railyard
13Freight Traffic Study
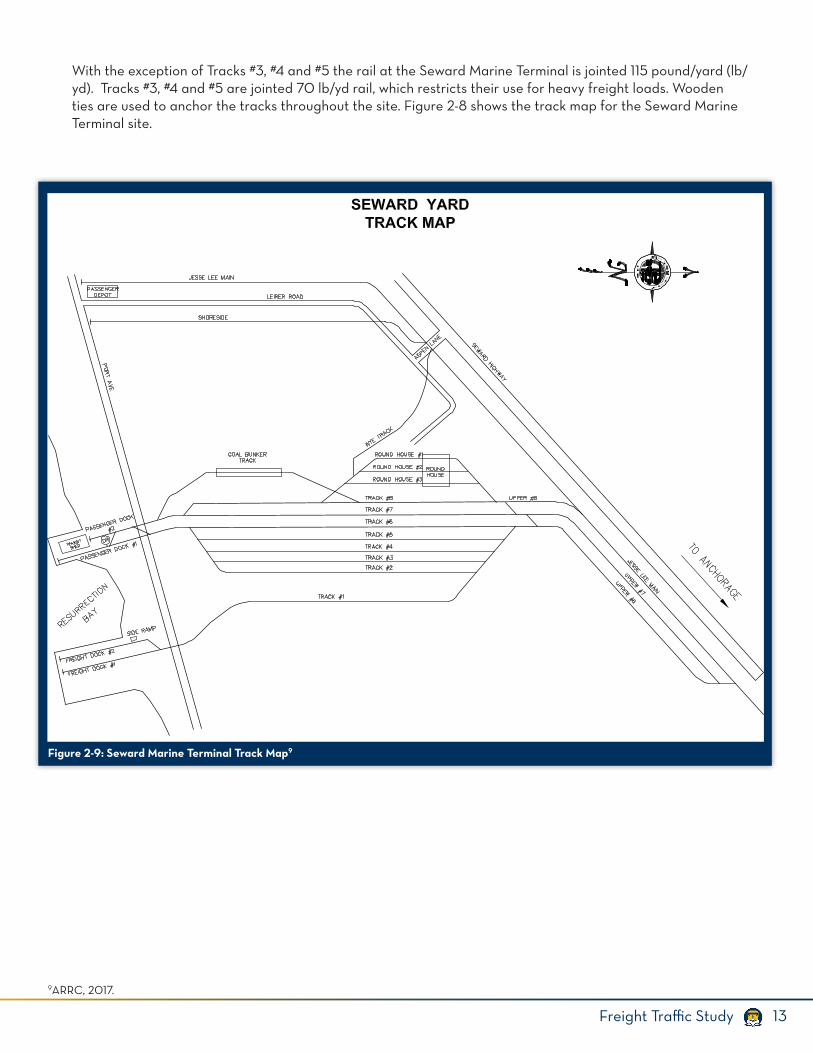
With the exception of Tracks #3, #4 and #5 the rail at the Seward Marine Terminal is jointed 115 pound/yard (lb/yd). Tracks #3, #4 and #5 are jointed 70 lb/yd rail, which restricts their use for heavy freight loads. Wooden ties are used to anchor the tracks throughout the site. Figure 2-8 shows the track map for the Seward Marine Terminal site.
2.1.8 Freight Building
Figure 2-9: Seward Marine Terminal Track Map9
9ARRC, 2017.

This page left intentionally blank.
15Freight Traffic Study
To identify current deficiencies and concerns around freight movement and services at the Alaska Railroads Seward Marine Terminal, the project team gathered input from people and businesses that use or have a relationship with the facilities. Two types of stakeholders were identified: internal stakeholders across company-wide ARRC departments and external stakeholders comprised of current ARRC customers, local elected officials, Seward citizen planning commissions, and commercial property owners and leaseholders near the Seward Marine Reserve. Meetings, surveys, email and telephone correspondence, workshops, newsletters, and a website were used to initiate and maintain outreach during the course of the planning process. The sections below detail the stakeholder engagement process, identify the individual stakeholders involved, and describe specific outreach activities conducted and key priorities observed.
Stakeholder outreach sought to identify common goals between the ARRC and the local community in an effort to prioritize local infrastructure investment needs. Efforts began by establishing a project brand and logo in order to identify the project to stakeholders. In-person meetings, surveys, email and telephone correspondence, workshops, newsletters, and a website were used to initiate and maintain outreach during the course of the planning process. Throughout visioning, outreach sought to educate stakeholders about the project, inform stakeholders how and when they could provide input, obtain meaningful feedback to guide development of the vision statement, and establish points of contact with subject matter experts.
The project documented stakeholder data on passenger traffic demands, modes and flow in Seward and throughout Southcentral Alaska, and gathered ideas on how to improve ARRC’s facilities and real estate to serve the region and state. For the purpose of continuing to meet local and global economic fluctuations, visioning has remained an ongoing activity throughout the life of the project.
To ensure consistent and appropriate qualitative stakeholder data, meeting materials included planning-level PowerPoint presentations, a survey questionnaire, and a tabletop aerial map of the project area to orient and document stakeholder comments around the Seward Marine Terminal assets. The survey questionnaire was provided to stakeholders in hard copy format at each meeting and also emailed as a fillable PDF. A total of seven internal and 53 external stakeholder visioning meetings occurred in October 2015 through July 2016 in person or via teleconference. Copies of meeting materials and presentations are included as part of the Stakeholder Visioning Report.
All stakeholder meetings were documented with meeting minutes and aerial map notes. Survey questionnaires allowed for follow-up comments or comments in lieu of meeting participation. Stakeholders were encouraged to forward or share the survey questionnaires with personnel in their department or organization with subject matter expertise. A total of three internal and 19 external stakeholder survey questionnaires were returned. Additional emailed comments, meeting minutes, and returned surveys are included in an appendix to the Stakeholder Visioning Report. In addition to the stakeholder meetings, the project team traveled to Seward on November 16, 2015, to meet with ARRC on-site staff for a three-day work session. The purpose was to view and discuss the operation of the facilities, conduct a site walk-over, and inventory existing facilities.
3. Community Involvement and Engagement
3.2 Stakeholder Outreach
3.1 Visioning Process
16 Freight Traffic Study
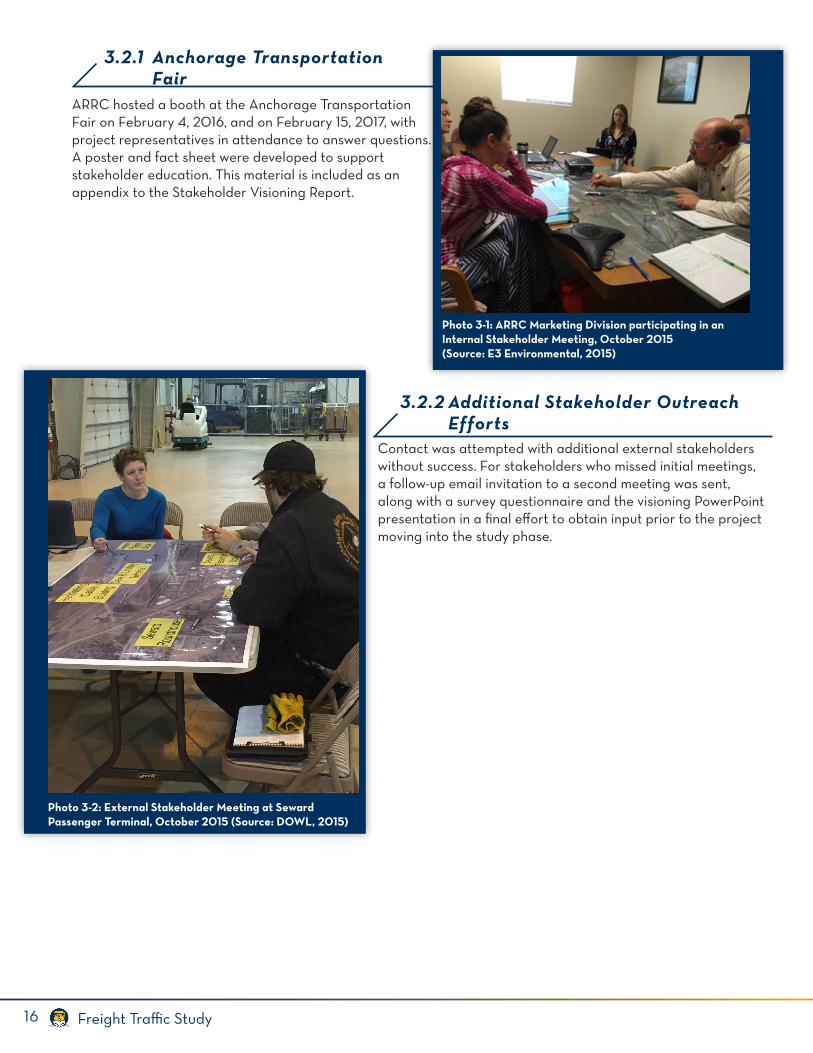
ARRC hosted a booth at the Anchorage Transportation Fair on February 4, 2016, and on February 15, 2017, with project representatives in attendance to answer questions. A poster and fact sheet were developed to support stakeholder education. This material is included as an appendix to the Stakeholder Visioning Report.
3.2.1 Anchorage Transportation Fair
Photo 3-1: ARRC Marketing Division participating in an Internal Stakeholder Meeting, October 2015(Source: E3 Environmental, 2015)
3.2.2 Additional Stakeholder Outreach Efforts
Photo 3-2: External Stakeholder Meeting at Seward Passenger Terminal, October 2015 (Source: DOWL, 2015)
Contact was attempted with additional external stakeholders without success. For stakeholders who missed initial meetings, a follow-up email invitation to a second meeting was sent, along with a survey questionnaire and the visioning PowerPoint presentation in a final effort to obtain input prior to the project moving into the study phase.
17Freight Traffic Study
3.2.2 Additional Stakeholder Outreach Efforts
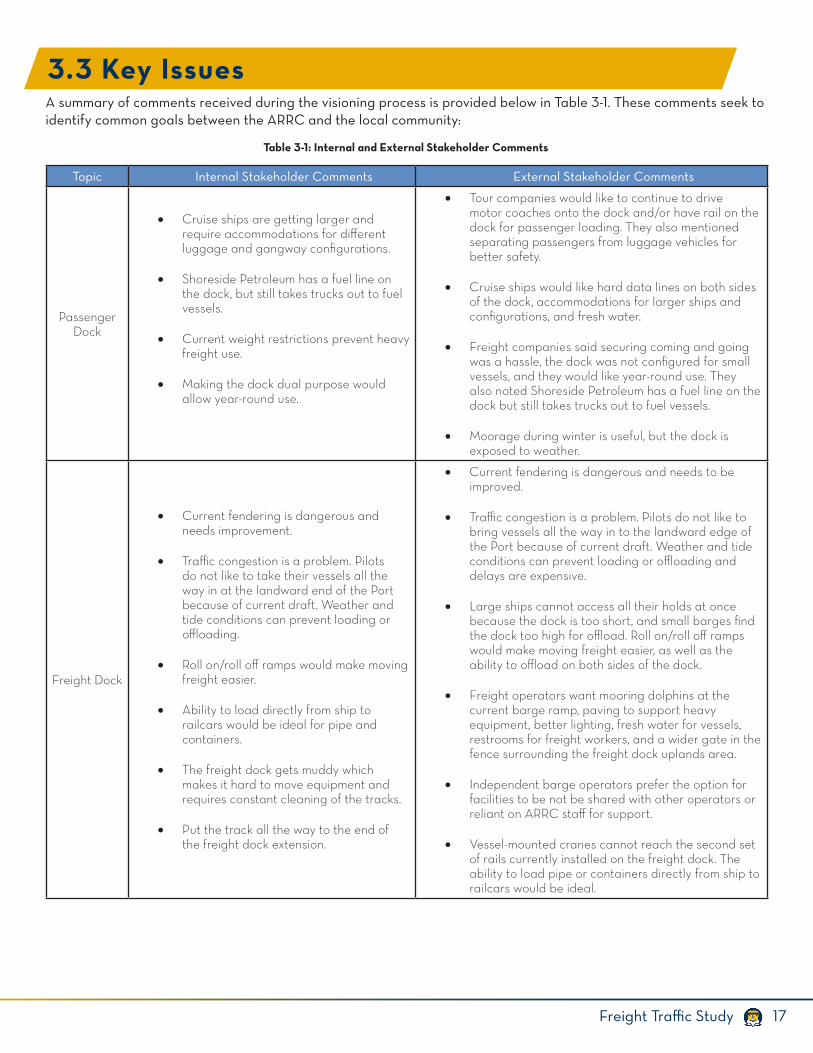
3.3 Key Issues
Topic Internal Stakeholder Comments External Stakeholder Comments
Passenger Dock
• Cruise ships are getting larger and require accommodations for different luggage and gangway configurations.
• Shoreside Petroleum has a fuel line on the dock, but still takes trucks out to fuel vessels.
• Current weight restrictions prevent heavy freight use.
• Making the dock dual purpose would allow year-round use.
• Tour companies would like to continue to drive motor coaches onto the dock and/or have rail on the dock for passenger loading. They also mentioned separating passengers from luggage vehicles for better safety.
• Cruise ships would like hard data lines on both sides of the dock, accommodations for larger ships and configurations, and fresh water.
• Freight companies said securing coming and going was a hassle, the dock was not configured for small vessels, and they would like year-round use. They also noted Shoreside Petroleum has a fuel line on the dock but still takes trucks out to fuel vessels.
• Moorage during winter is useful, but the dock is exposed to weather.
Freight Dock
• Current fendering is dangerous and needs improvement.
• Traffic congestion is a problem. Pilots do not like to take their vessels all the way in at the landward end of the Port because of current draft. Weather and tide conditions can prevent loading or offloading.
• Roll on/roll off ramps would make moving freight easier.
• Ability to load directly from ship to railcars would be ideal for pipe and containers.
• The freight dock gets muddy which makes it hard to move equipment and requires constant cleaning of the tracks.
• Put the track all the way to the end of the freight dock extension.
• Current fendering is dangerous and needs to be improved.
• Traffic congestion is a problem. Pilots do not like to bring vessels all the way in to the landward edge of the Port because of current draft. Weather and tide conditions can prevent loading or offloading and delays are expensive.
• Large ships cannot access all their holds at once because the dock is too short, and small barges find the dock too high for offload. Roll on/roll off ramps would make moving freight easier, as well as the ability to offload on both sides of the dock.
• Freight operators want mooring dolphins at the current barge ramp, paving to support heavy equipment, better lighting, fresh water for vessels, restrooms for freight workers, and a wider gate in the fence surrounding the freight dock uplands area.
• Independent barge operators prefer the option for facilities to be not be shared with other operators or reliant on ARRC staff for support.
• Vessel-mounted cranes cannot reach the second set of rails currently installed on the freight dock. The ability to load pipe or containers directly from ship to railcars would be ideal.
A summary of comments received during the visioning process is provided below in Table 3-1. These comments seek to identify common goals between the ARRC and the local community:
Table 3-1: Internal and External Stakeholder Comments
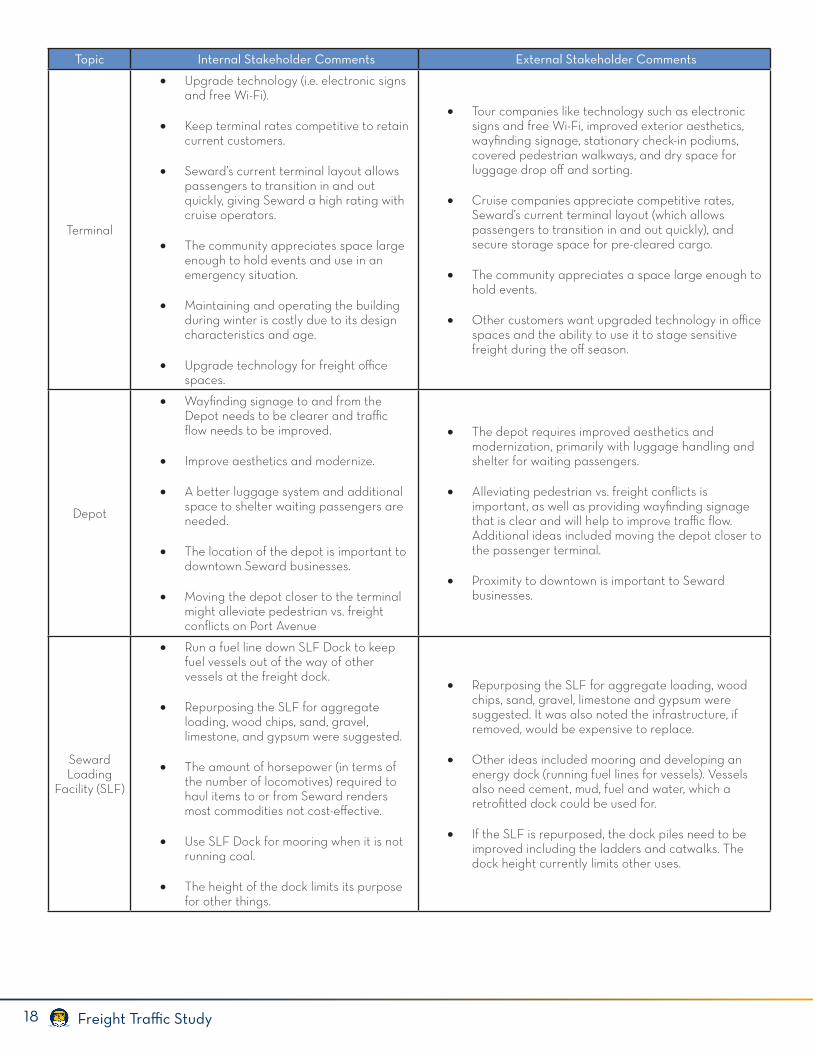
18 Freight Traffic Study
Topic Internal Stakeholder Comments External Stakeholder Comments
Terminal
• Upgrade technology (i.e. electronic signs and free Wi-Fi).
• Keep terminal rates competitive to retain current customers.
• Seward’s current terminal layout allows passengers to transition in and out quickly, giving Seward a high rating with cruise operators.
• The community appreciates space large enough to hold events and use in an emergency situation.
• Maintaining and operating the building during winter is costly due to its design characteristics and age.
• Upgrade technology for freight office spaces.
• Tour companies like technology such as electronic signs and free Wi-Fi, improved exterior aesthetics, wayfinding signage, stationary check-in podiums, covered pedestrian walkways, and dry space for luggage drop off and sorting.
• Cruise companies appreciate competitive rates, Seward’s current terminal layout (which allows passengers to transition in and out quickly), and secure storage space for pre-cleared cargo.
• The community appreciates a space large enough to hold events.
• Other customers want upgraded technology in office spaces and the ability to use it to stage sensitive freight during the off season.
Depot
• Wayfinding signage to and from the Depot needs to be clearer and traffic flow needs to be improved.
• Improve aesthetics and modernize.
• A better luggage system and additional space to shelter waiting passengers are needed.
• The location of the depot is important to downtown Seward businesses.
• Moving the depot closer to the terminal might alleviate pedestrian vs. freight conflicts on Port Avenue
• The depot requires improved aesthetics and modernization, primarily with luggage handling and shelter for waiting passengers.
• Alleviating pedestrian vs. freight conflicts is important, as well as providing wayfinding signage that is clear and will help to improve traffic flow. Additional ideas included moving the depot closer to the passenger terminal.
• Proximity to downtown is important to Seward businesses.
Seward Loading
Facility (SLF)
• Run a fuel line down SLF Dock to keep fuel vessels out of the way of other vessels at the freight dock.
• Repurposing the SLF for aggregate loading, wood chips, sand, gravel, limestone, and gypsum were suggested.
• The amount of horsepower (in terms of the number of locomotives) required to haul items to or from Seward renders most commodities not cost-effective.
• Use SLF Dock for mooring when it is not running coal.
• The height of the dock limits its purpose for other things.
• Repurposing the SLF for aggregate loading, wood chips, sand, gravel, limestone and gypsum were suggested. It was also noted the infrastructure, if removed, would be expensive to replace.
• Other ideas included mooring and developing an energy dock (running fuel lines for vessels). Vessels also need cement, mud, fuel and water, which a retrofitted dock could be used for.
• If the SLF is repurposed, the dock piles need to be improved including the ladders and catwalks. The dock height currently limits other uses.
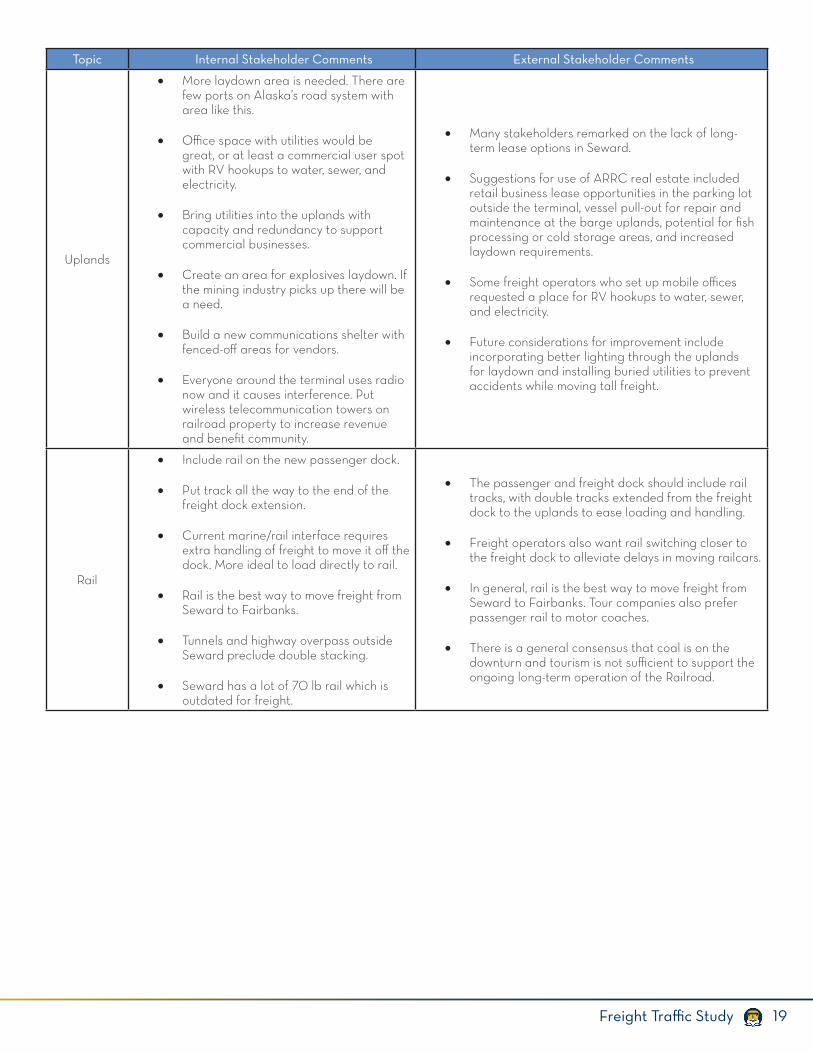
19Freight Traffic Study
Topic Internal Stakeholder Comments External Stakeholder Comments
Uplands
• More laydown area is needed. There are few ports on Alaska’s road system with area like this.
• Office space with utilities would be great, or at least a commercial user spot with RV hookups to water, sewer, and electricity.
• Bring utilities into the uplands with capacity and redundancy to support commercial businesses.
• Create an area for explosives laydown. If the mining industry picks up there will be a need.
• Build a new communications shelter with fenced-off areas for vendors.
• Everyone around the terminal uses radio now and it causes interference. Put wireless telecommunication towers on railroad property to increase revenue and benefit community.
• Many stakeholders remarked on the lack of long-term lease options in Seward.
• Suggestions for use of ARRC real estate included retail business lease opportunities in the parking lot outside the terminal, vessel pull-out for repair and maintenance at the barge uplands, potential for fish processing or cold storage areas, and increased laydown requirements.
• Some freight operators who set up mobile offices requested a place for RV hookups to water, sewer, and electricity.
• Future considerations for improvement include incorporating better lighting through the uplands for laydown and installing buried utilities to prevent accidents while moving tall freight.
Rail
• Include rail on the new passenger dock.
• Put track all the way to the end of the freight dock extension.
• Current marine/rail interface requires extra handling of freight to move it off the dock. More ideal to load directly to rail.
• Rail is the best way to move freight from Seward to Fairbanks.
• Tunnels and highway overpass outside Seward preclude double stacking.
• Seward has a lot of 70 lb rail which is outdated for freight.
• The passenger and freight dock should include rail tracks, with double tracks extended from the freight dock to the uplands to ease loading and handling.
• Freight operators also want rail switching closer to the freight dock to alleviate delays in moving railcars.
• In general, rail is the best way to move freight from Seward to Fairbanks. Tour companies also prefer passenger rail to motor coaches.
• There is a general consensus that coal is on the downturn and tourism is not sufficient to support the ongoing long-term operation of the Railroad.
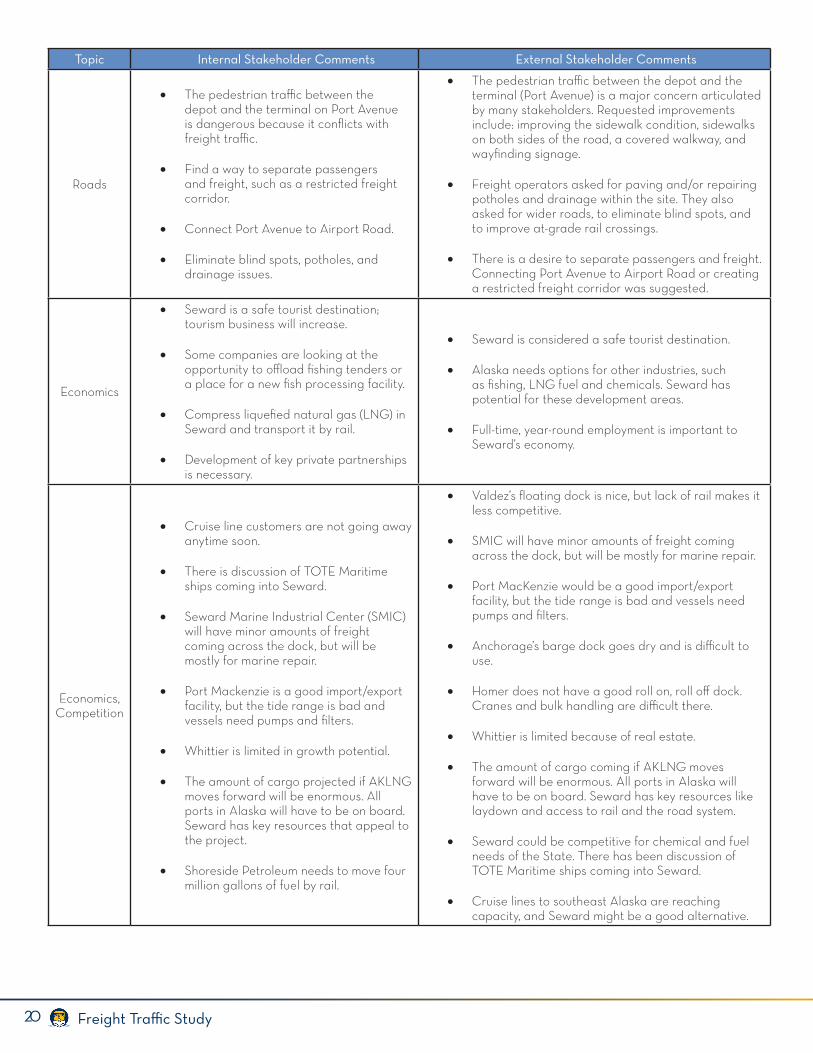
20 Freight Traffic Study
Topic Internal Stakeholder Comments External Stakeholder Comments
Roads
• The pedestrian traffic between the depot and the terminal on Port Avenue is dangerous because it conflicts with freight traffic.
• Find a way to separate passengers and freight, such as a restricted freight corridor.
• Connect Port Avenue to Airport Road.
• Eliminate blind spots, potholes, and drainage issues.
• The pedestrian traffic between the depot and the terminal (Port Avenue) is a major concern articulated by many stakeholders. Requested improvements include: improving the sidewalk condition, sidewalks on both sides of the road, a covered walkway, and wayfinding signage.
• Freight operators asked for paving and/or repairing potholes and drainage within the site. They also asked for wider roads, to eliminate blind spots, and to improve at-grade rail crossings.
• There is a desire to separate passengers and freight. Connecting Port Avenue to Airport Road or creating a restricted freight corridor was suggested.
Economics
• Seward is a safe tourist destination; tourism business will increase.
• Some companies are looking at the opportunity to offload fishing tenders or a place for a new fish processing facility.
• Compress liquefied natural gas (LNG) in Seward and transport it by rail.
• Development of key private partnerships is necessary.
• Seward is considered a safe tourist destination.
• Alaska needs options for other industries, such as fishing, LNG fuel and chemicals. Seward has potential for these development areas.
• Full-time, year-round employment is important to Seward’s economy.
Economics, Competition
• Cruise line customers are not going away anytime soon.
• There is discussion of TOTE Maritime ships coming into Seward.
• Seward Marine Industrial Center (SMIC) will have minor amounts of freight coming across the dock, but will be mostly for marine repair.
• Port Mackenzie is a good import/export facility, but the tide range is bad and vessels need pumps and filters.
• Whittier is limited in growth potential.
• The amount of cargo projected if AKLNG moves forward will be enormous. All ports in Alaska will have to be on board. Seward has key resources that appeal to the project.
• Shoreside Petroleum needs to move four million gallons of fuel by rail.
• Valdez’s floating dock is nice, but lack of rail makes it less competitive.
• SMIC will have minor amounts of freight coming across the dock, but will be mostly for marine repair.
• Port MacKenzie would be a good import/export facility, but the tide range is bad and vessels need pumps and filters.
• Anchorage’s barge dock goes dry and is difficult to use.
• Homer does not have a good roll on, roll off dock. Cranes and bulk handling are difficult there.
• Whittier is limited because of real estate.
• The amount of cargo coming if AKLNG moves forward will be enormous. All ports in Alaska will have to be on board. Seward has key resources like laydown and access to rail and the road system.
• Seward could be competitive for chemical and fuel needs of the State. There has been discussion of TOTE Maritime ships coming into Seward.
• Cruise lines to southeast Alaska are reaching capacity, and Seward might be a good alternative.
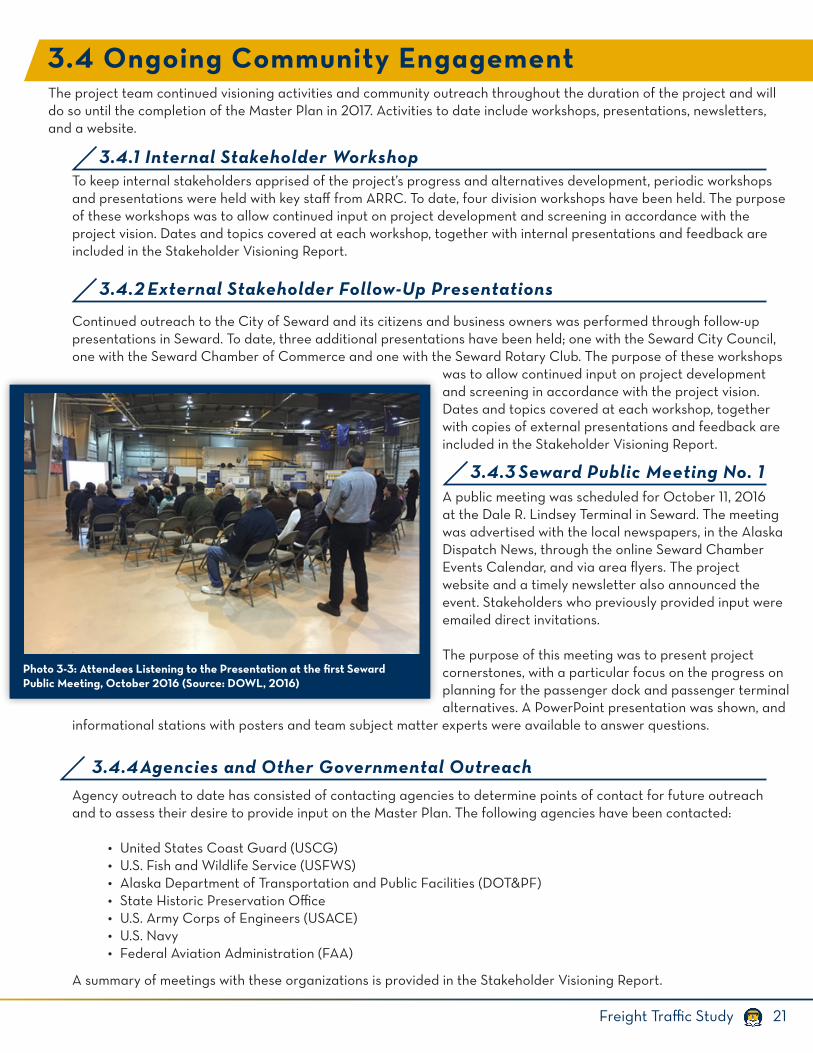
21Freight Traffic Study
3.4 Ongoing Community Engagement
3.4.1 Internal Stakeholder Workshop
The project team continued visioning activities and community outreach throughout the duration of the project and will do so until the completion of the Master Plan in 2017. Activities to date include workshops, presentations, newsletters, and a website.
To keep internal stakeholders apprised of the project’s progress and alternatives development, periodic workshops and presentations were held with key staff from ARRC. To date, four division workshops have been held. The purpose of these workshops was to allow continued input on project development and screening in accordance with the project vision. Dates and topics covered at each workshop, together with internal presentations and feedback are included in the Stakeholder Visioning Report.
Continued outreach to the City of Seward and its citizens and business owners was performed through follow-up presentations in Seward. To date, three additional presentations have been held; one with the Seward City Council, one with the Seward Chamber of Commerce and one with the Seward Rotary Club. The purpose of these workshops
was to allow continued input on project development and screening in accordance with the project vision. Dates and topics covered at each workshop, together with copies of external presentations and feedback are included in the Stakeholder Visioning Report.
A public meeting was scheduled for October 11, 2016 at the Dale R. Lindsey Terminal in Seward. The meeting was advertised with the local newspapers, in the Alaska Dispatch News, through the online Seward Chamber Events Calendar, and via area flyers. The project website and a timely newsletter also announced the event. Stakeholders who previously provided input were emailed direct invitations.
The purpose of this meeting was to present project cornerstones, with a particular focus on the progress on planning for the passenger dock and passenger terminal alternatives. A PowerPoint presentation was shown, and
informational stations with posters and team subject matter experts were available to answer questions.
Agency outreach to date has consisted of contacting agencies to determine points of contact for future outreach and to assess their desire to provide input on the Master Plan. The following agencies have been contacted:
• United States Coast Guard (USCG)• U.S. Fish and Wildlife Service (USFWS)• Alaska Department of Transportation and Public Facilities (DOT&PF)• State Historic Preservation Office• U.S. Army Corps of Engineers (USACE)• U.S. Navy• Federal Aviation Administration (FAA)
A summary of meetings with these organizations is provided in the Stakeholder Visioning Report.
3.4.2 External Stakeholder Follow-Up Presentations
3.4.3 Seward Public Meeting No. 1
Photo 3-3: Attendees Listening to the Presentation at the first Seward Public Meeting, October 2016 (Source: DOWL, 2016)
3.4.4 Agencies and Other Governmental Outreach
22 Freight Traffic Study
The project team has also provided other media for interested parties to hear about the project as well as meetings and workshops.
• A project website, railportseward.com, has been established and is regularly updated to provide information on the project. The website also includes the ability for interested parties to sign up for newsletters and provide comments and feedback on the project.
• Regular project newsletters are prepared and distributed to a mailing list to provide updates on the project.
3.4.5 Additional Outreach
23Freight Traffic Study
4. Market AnalysisThe information contained in this section of the report is primarily drawn from the Economic Analysis Report. Where additional information has been gathered or updates to the information have been made, this has been referenced throughout this section.
The ARRC’s passenger market at Seward is comprised of train operations and passengers arriving and departing on cruise ships.
The Port of Seward is an ice-free port located on the east side of the Kenai Peninsula, approximately 125 highway miles and 114.3 rail miles south of Anchorage. The Port is located on the Alaska highway system as well as the ARRC rail belt. Its location on the Kenai Peninsula allows for freight movement throughout the State by means of connecting rail and highway networks.
The seafood industry is a major economic driver for Seward’s economy. Seward is one of the top commercial fishing ports in Southcentral Alaska and one of the largest ports in the United States (as ranked by landed value). In 2014, Seward processors bought 52.4 million pounds of seafood worth $52.7 million, making it the 21st largest port in the United States by value out of 128 commercial fishery landings.
Alaska Railroad FacilitiesThe Port of Seward consists of three functional docks and a small boat harbor. The Seward passenger dock, Seward freight dock, and the SLF are all owned by ARRC, while the small boat harbor is owned by the City of Seward. The City of Seward also owns the Seward Marine Industrial Center (SMIC), which is located on the eastern shore of Resurrection Bay, approximately six miles from downtown Seward. A description of the passenger dock, freight dock and SLF is provided in Section 2. Historically, coal from the Usibelli Coal Mine (Usibelli) in Healy has been the primary bulk material exported out of the Port of Seward and has dominated Seward freight volumes. However, in 2015 and 2016, this volume dropped significantly; no coal shipments are scheduled for 2017.
Small Boat HarborThe small boat harbor is located on the Southwest border of the Port of Seward and was constructed in 1964 after the Good Friday earthquake. Commercial fishing constitutes a large portion of the harbor’s presence. Long liners, purse-seiners and gill netters are all vessel types that dock or moor at the harbor. In addition, recreational fishing and tourism businesses rely on the harbor, with over 100 charter boat operators located in the harbor and 12 tour boat operators located nearby. The harbor’s depth is -12.5 MLLW and it currently has 666 slips for boats ranging from 17 to 170 feet.
Seward Marine Industrial CenterThe Seward Marine Industrial Center (SMIC) is located on the east side of Resurrection Bay, approximately six miles from downtown Seward by road. This facility is well equipped for ship repairs and maintenance, and includes a 330-ton Marine Travelift, 5,000-ton Syncrolift, and approximately 100 acres of upland area for repairs, support services, supplies, storage, and staging. The SMIC has a water depth of -20 to -25 MLLW at
4.1 Port of Seward
4.1.1 Location and Setting
4.1.2 Infrastructure
24 Freight Traffic Study
its North Dock, and easy access to Resurrection Bay and the Gulf of Alaska. At this time, SMIC is mostly used as a maintenance and repair facility for vessels 50 feet and larger. The City of Seward is currently working to develop the SMIC uplands to attract more business, and the construction of a new breakwater is underway with completion planned for spring 2017. This project will provide additional protection for docked and moored ships at SMIC.
The Port of Seward is located 114.3 rail miles from Anchorage and 470.3 rail miles from Fairbanks. The community’s primary arterial roadway is the Seward Highway, which extends 125 miles north to Anchorage.The Seward Marine Terminal shares its Northeastern border with the Seward Airport. The airport is an unmanned, state-operated facility. Some air service, flightseeing, and air charter services are available. The airport’s two paved runways are 4,240 feet long by 100 feet wide, and 2,279 feet long by 75 feet wide. The DOT&PF is currently considering airport improvements at Seward, including providing for the closure of one runway and the relocation, widening and lengthening of the other10. Flight time between Seward and Anchorage is approximately 45 minutes.
Trains traveling from Seward to Anchorage must climb a three percent grade, which requires a significant number of locomotives per car for a fully loaded train. By comparison, trains traveling from Whittier to Anchorage encounter slight grades and only two locomotives are required for a fully loaded train.
As provided in Table 4-1, most of the inbound freight tonnage in 2013 consisted of forest products (primarily lumber) followed by lime, cement, and glass. In 2013, these categories of freight were approximately 30 percent of Seward’s total inbound freight tonnage. Between the years 2004 and 2013, the total volume of inbound freight has increased by 84.6 percent, but this has fluctuated seasonally
year-on-year and has shown three distinct trends: between 2004 and 2007 volumes remained relatively similar prior to a drop of 50 percent between 2008 and 2010, and then a substantial increase between 2001 and 2013.Coal accounted for almost 99 percent of the outgoing freight tonnage from Seward during 2004-2013 (refer to Table 4-2. However, as discussed in Section 4.4, coal exports from Alaska have reduced significantly and in 2015 export volumes were 165,350 tons (150,000 MT), or approximately 29 percent of the 2013 coal export volume. In 2016 only one shipment of coal was processed through the SLF; no coal shipments are scheduled for 2017.
Between the years 2004 and 2011, the outbound freight exports remained almost the same. In 2013, there was a sudden increase in exports, which was manufactured equipment, machinery and products. Excluding coal exports, Seward’s largest export in 2013 by weight was manufactured equipment, machinery, and products.
Coal from Usibelli has historically accounted for virtually all export tonnage through the Port of Seward. Coal exports have gone to a number of Pacific Rim countries with the bulk of exports going to Chile, South Korea, and Japan.
10Alaska Department of Transportation and Public Facilities (DOT&PF) Request for Scoping Comments, Seward Airport Improvements, January 24, 2017.
4.1.3 Transportation
4.1.4 Freight Operations
4.1.5 Origin and Destination of Freight
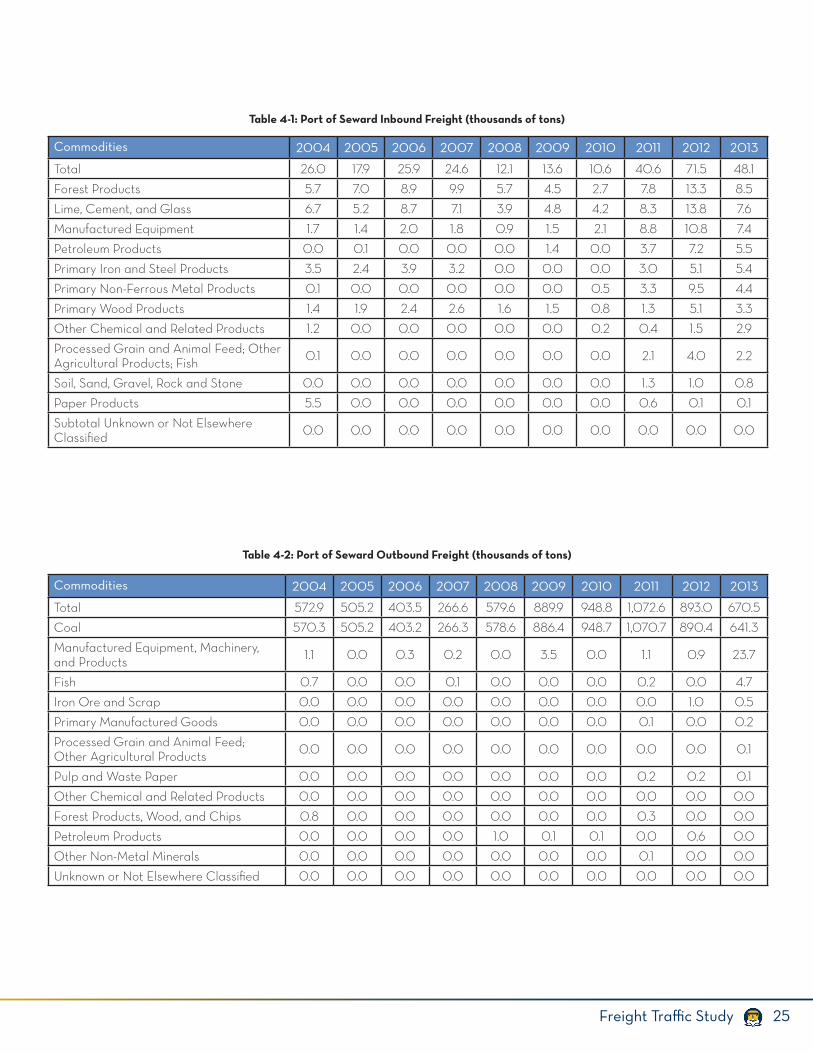
25Freight Traffic Study
Table 4-1: Port of Seward Inbound Freight (thousands of tons)
Commodities 2004 2005 2006 2007 2008 2009 2010 2011 2012 2013
Total 26.0 17.9 25.9 24.6 12.1 13.6 10.6 40.6 71.5 48.1
Forest Products 5.7 7.0 8.9 9.9 5.7 4.5 2.7 7.8 13.3 8.5
Lime, Cement, and Glass 6.7 5.2 8.7 7.1 3.9 4.8 4.2 8.3 13.8 7.6
Manufactured Equipment 1.7 1.4 2.0 1.8 0.9 1.5 2.1 8.8 10.8 7.4
Petroleum Products 0.0 0.1 0.0 0.0 0.0 1.4 0.0 3.7 7.2 5.5
Primary Iron and Steel Products 3.5 2.4 3.9 3.2 0.0 0.0 0.0 3.0 5.1 5.4
Primary Non-Ferrous Metal Products 0.1 0.0 0.0 0.0 0.0 0.0 0.5 3.3 9.5 4.4
Primary Wood Products 1.4 1.9 2.4 2.6 1.6 1.5 0.8 1.3 5.1 3.3
Other Chemical and Related Products 1.2 0.0 0.0 0.0 0.0 0.0 0.2 0.4 1.5 2.9
Processed Grain and Animal Feed; Other Agricultural Products; Fish 0.1 0.0 0.0 0.0 0.0 0.0 0.0 2.1 4.0 2.2
Soil, Sand, Gravel, Rock and Stone 0.0 0.0 0.0 0.0 0.0 0.0 0.0 1.3 1.0 0.8
Paper Products 5.5 0.0 0.0 0.0 0.0 0.0 0.0 0.6 0.1 0.1
Subtotal Unknown or Not Elsewhere Classified 0.0 0.0 0.0 0.0 0.0 0.0 0.0 0.0 0.0 0.0
Commodities 2004 2005 2006 2007 2008 2009 2010 2011 2012 2013
Total 572.9 505.2 403.5 266.6 579.6 889.9 948.8 1,072.6 893.0 670.5
Coal 570.3 505.2 403.2 266.3 578.6 886.4 948.7 1,070.7 890.4 641.3
Manufactured Equipment, Machinery, and Products 1.1 0.0 0.3 0.2 0.0 3.5 0.0 1.1 0.9 23.7
Fish 0.7 0.0 0.0 0.1 0.0 0.0 0.0 0.2 0.0 4.7
Iron Ore and Scrap 0.0 0.0 0.0 0.0 0.0 0.0 0.0 0.0 1.0 0.5
Primary Manufactured Goods 0.0 0.0 0.0 0.0 0.0 0.0 0.0 0.1 0.0 0.2
Processed Grain and Animal Feed; Other Agricultural Products 0.0 0.0 0.0 0.0 0.0 0.0 0.0 0.0 0.0 0.1
Pulp and Waste Paper 0.0 0.0 0.0 0.0 0.0 0.0 0.0 0.2 0.2 0.1
Other Chemical and Related Products 0.0 0.0 0.0 0.0 0.0 0.0 0.0 0.0 0.0 0.0
Forest Products, Wood, and Chips 0.8 0.0 0.0 0.0 0.0 0.0 0.0 0.3 0.0 0.0
Petroleum Products 0.0 0.0 0.0 0.0 1.0 0.1 0.1 0.0 0.6 0.0
Other Non-Metal Minerals 0.0 0.0 0.0 0.0 0.0 0.0 0.0 0.1 0.0 0.0
Unknown or Not Elsewhere Classified 0.0 0.0 0.0 0.0 0.0 0.0 0.0 0.0 0.0 0.0
Table 4-2: Port of Seward Outbound Freight (thousands of tons)
26 Freight Traffic Study
4.1.6 Freight BusinessesFreight Dock CustomersMore than 60 organizations and individuals have been customers to ARRC for the use of the freight dock between 2013 and 2016. Many of the customers have used the dock every year to load, unload or store freight at the dock. Others have landed at the freight dock for marine repair and maintenance operations. The top ten freight customers at the Seward Marine Terminal (by value) are listed below11. These customers combined account for more than 80 percent of the total business at the freight dock between 2013 and 2016.
• Samson Tug and Barge, an intermodal freight carrier, makes the most frequent calls at the freight dock at accounts for approximately 32 percent of the total business at the freight dock.
• Alaska Logistics, LLC, a marine transportation company accounts for approximately 10 percent of the total business at the freight dock.
• Crowley Marine Services, a transportation and logistics company, also accounts for approximately 10 percent of the total business at the freight dock.
• SeaTac Marine Services transports two barges of goods each year to Seward and accounts for approximately 9.5 percent of the total business at the freight dock.
• Northland Services accounts for approximately 4.5 percent of the total business at the freight dock between 2013 to 2016. It is noted however, that Northland Services did not use the dock in 2015 and 2016.
• Shoreside Petroleum Inc., utilizes fuel pipes on the freight dock to transfer fuel to and from its local facility at Seward from Kirby Offshore Marine Barges. Shoreside Petroleum accounts for approximately 4.4 percent of the total business at the freight dock.
• Kirby Offshore Marine operates tank barges for the transportation of petroleum and other oil based products, and accounts for approximately 4.3 percent of the total business at the freight dock.
• Delta Western Inc. distributes and markets petroleum products throughout Southeast Alaska and accounts for approximately 3 percent of the total business at the freight dock. Delta Western Inc. also markets its products under the name North Star Petroleum.
• The USCG utilizes the freight dock for landing goods and also for marine repair and maintenance activities. It accounts for approximately 2.5 percent of the total business at the freight dock.
• Nautical Ventures utilized the freight dock in 2013 and 2015, and accounted for approximately 2.2 percent of the total business at the freight dock between 2013 and 2016.
Permit Holders at Seward Marine TerminalSeward Marine Terminal tenants (permit holders) include the following (although the list is not comprehensive).
• Alaska Logistics, a marine transportation company, operates from the Seward Freight Dock and maintains equipment and freight handling capabilities.
• Carlile Transportation provides services in the Port of Seward and leases the Freight Building.• Colaska/QAP, a manufacturing company that provides various aggregate, emulsion, binders, asphalt,
and concrete mixes for road construction projects, uses its permit area for laydown capacity and has historically received freight at the freight dock.
• Orion Marine Contractors, a marine-related construction company, primarily uses its permit area for equipment laydown space and logistical staging area.
• Pacific Pile and Marine, a civil and marine contractor, leases laydown space.• Samson Tug and Barge, an intermodal freight carrier, transports via barge, rail, and truck; leases land;
and has an office in the Dale R. Lindsey Intermodal Terminal.• Shoreside Petroleum Inc. holds a land permit for their fuel headers at the freight dock.
11ARRC 2017, Seward Freight Invoices 2013 - 2016.
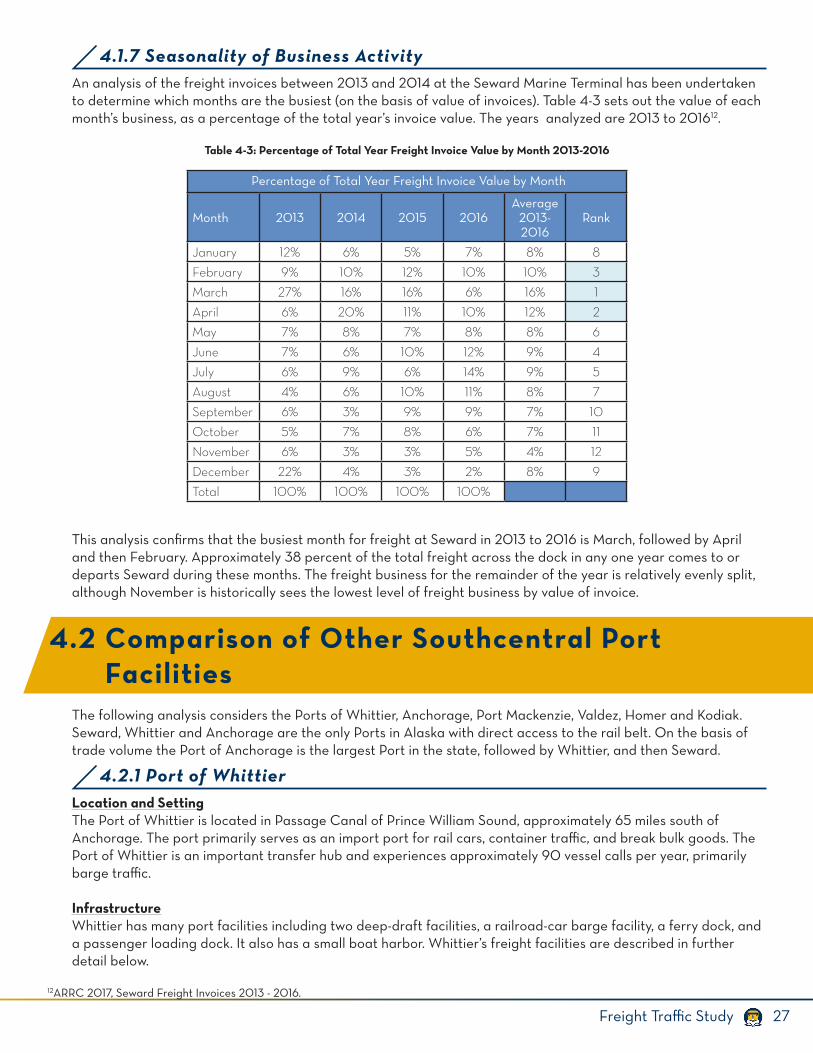
27Freight Traffic Study
4.1.7 Seasonality of Business ActivityAn analysis of the freight invoices between 2013 and 2014 at the Seward Marine Terminal has been undertaken to determine which months are the busiest (on the basis of value of invoices). Table 4-3 sets out the value of each month’s business, as a percentage of the total year’s invoice value. The years analyzed are 2013 to 201612.
This analysis confirms that the busiest month for freight at Seward in 2013 to 2016 is March, followed by April and then February. Approximately 38 percent of the total freight across the dock in any one year comes to or departs Seward during these months. The freight business for the remainder of the year is relatively evenly split, although November is historically sees the lowest level of freight business by value of invoice.
The following analysis considers the Ports of Whittier, Anchorage, Port Mackenzie, Valdez, Homer and Kodiak. Seward, Whittier and Anchorage are the only Ports in Alaska with direct access to the rail belt. On the basis of trade volume the Port of Anchorage is the largest Port in the state, followed by Whittier, and then Seward.
Location and SettingThe Port of Whittier is located in Passage Canal of Prince William Sound, approximately 65 miles south of Anchorage. The port primarily serves as an import port for rail cars, container traffic, and break bulk goods. The Port of Whittier is an important transfer hub and experiences approximately 90 vessel calls per year, primarily barge traffic.
InfrastructureWhittier has many port facilities including two deep-draft facilities, a railroad-car barge facility, a ferry dock, and a passenger loading dock. It also has a small boat harbor. Whittier’s freight facilities are described in further detail below.
Percentage of Total Year Freight Invoice Value by Month
Month 2013 2014 2015 2016Average
2013-2016
Rank
January 12% 6% 5% 7% 8% 8
February 9% 10% 12% 10% 10% 3
March 27% 16% 16% 6% 16% 1
April 6% 20% 11% 10% 12% 2
May 7% 8% 7% 8% 8% 6
June 7% 6% 10% 12% 9% 4
July 6% 9% 6% 14% 9% 5
August 4% 6% 10% 11% 8% 7
September 6% 3% 9% 9% 7% 10
October 5% 7% 8% 6% 7% 11
November 6% 3% 3% 5% 4% 12
December 22% 4% 3% 2% 8% 9
Total 100% 100% 100% 100%
Table 4-3: Percentage of Total Year Freight Invoice Value by Month 2013-2016
4.2 Comparison of Other Southcentral Port Facilities
4.2.1 Port of Whittier
12ARRC 2017, Seward Freight Invoices 2013 - 2016.
28 Freight Traffic Study
• The DeLong Dock is a general service dock owned by ARRC. It is used primarily for fishing vessels, local freight vessels under 100 tons, small cruise ships carrying under 150 passengers, and an occasional cruise ship certified for over 150 passengers. The dock has 675 feet of berthing space, 45 reported alongside and a deck height of 22 feet.
• The Railroad-Car Barge Facility owned by ARRC is primarily used for freight shipments; however, it is also capable of unloading fishing vessels. The dock has a depth of -35 feet MLLW and a length of 350 feet. Alaska Marine Line and Canadian National are the primary companies that use the dock to bring materials up from the continental United States and Prince Rupert, Canada, for distribution throughout Alaska. Great Pacific Seafood is one of the companies that uses the dock for unloading fishing vessels.
• The Whittier Small Boat Harbor was constructed in 1972 and was purchased from the State by the City of Whittier in 1972. Currently, there are approximately 350 slips at the harbor and its depth is -15 feet MLLW. There is enough slip space to moor or dock vessels up to 54 feet in length. The harbor is used for a wide variety of activities including commercial fishing. Facilities include two docks (Ocean Dock and City Dock), two boat launch ramps, two maintenance platforms, and a fuel service depot. The Ocean Dock is 125-feet-long by 30-feet-wide and 15-feet- high and serves cruise vessels. The City Dock is used primarily by commercial fishers and is outfitted with a crane, boom, and net so that fishing vessels can unload.
• The Alaska Marine Highway System owns and operates the Ferry Terminal and Dock, which is serviced by multiple ferries on a nearly daily basis. The dock has a 200-foot face, 18 feet alongside, and a deck height of 22 feet.
TransportationWhittier is connected to the Alaska Highway, the ARRC Rail Belt, and the Alaska Marine Highway System (Alaska State Ferry). Rail and road access to and from Whittier requires traveling a one-lane road for 2.5 miles through the Anton Anderson Memorial Tunnel. Traffic is allowed through the tunnel in each direction approximately once every hour. Other transportation issues in the community include the presence of at-grade rail crossings on main thoroughfares, which creates conflict with vehicles in the community.
Trains traveling from Whittier to Anchorage encounter slight grades and require only two locomotives for a fully loaded train. Alaska Marine Lines and Canada National provide regularly schedule rail barge service to the Port of Whittier. The Alaska Marine Lines barge arrives with 36 to 48 rail cars carrying products such as iron, lime, salt, chemicals, and 100 or more flat cars carrying products such as lumber, pipe, and heavy machinery. The Canadian National Aquatrain operates on a 10-day cycle and usually arrives with 25 to 30 rail cars of oilfield supplies. The Aquatrain is a barge with tracks on its floor, which allow for rail cars to be rolled on and off the barge using rail switches and engines.
The Whittier Airport is owned by the State of Alaska and is located at the head of Passage Canal. There is no scheduled air service between the community and other locations, and the airport primarily functions as a landing strip for small aircraft unable to cross the Chugach Mountains due to poor weather or other complications. Freight OperationsApproximately 280,600 tons of goods were imported through the Port of Whittier in 2013 (Table 4-4). Nearly 45 percent of total imported tonnage was for food and farm products. Manufactured equipment, machinery, and products accounted for the second largest share of imported tonnage with 27 percent of the total. Over the 2004 to 2013 period, there has been a 35 percent increase in the total volume of imports to the Port of Whittier.
Approximately 11,800 tons of goods were exported through the Port of Whittier in 2013 (Table 4-5). Approximately half of the total exported goods, by weight, were manufactured equipment, machinery, and products. Primary non-ferrous metal exports (primarily fabricated metal products) accounted for the second highest volume of exports, 19 percent of total export tonnage. Over the 2004 to 2013 period, there was a 75 percent decline in the total volume of exports from the Port of Whittier. This is primarily attributable to a decrease in exports of manufactured equipment, machinery, and similar cargo products over the timeframe. This level of decline is similar but larger than what has been observed at the Port of Anchorage (47 percent), Valdez (27.3 percent) and Homer (43.6 percent) over the same timeframe. The primary commodities exported from the other ports analyzed are different to the primary commodities exported from Whittier.
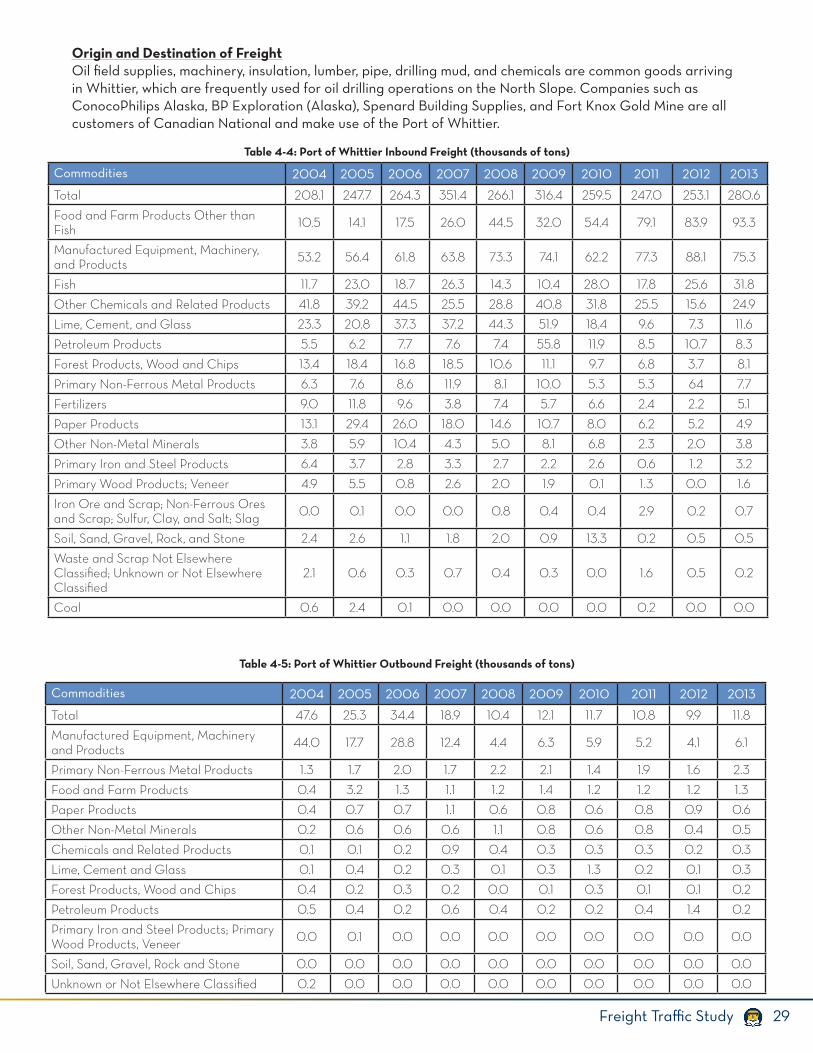
29Freight Traffic Study
Commodities 2004 2005 2006 2007 2008 2009 2010 2011 2012 2013
Total 208.1 247.7 264.3 351.4 266.1 316.4 259.5 247.0 253.1 280.6
Food and Farm Products Other than Fish 10.5 14.1 17.5 26.0 44.5 32.0 54.4 79.1 83.9 93.3
Manufactured Equipment, Machinery, and Products 53.2 56.4 61.8 63.8 73.3 74.1 62.2 77.3 88.1 75.3
Fish 11.7 23.0 18.7 26.3 14.3 10.4 28.0 17.8 25.6 31.8
Other Chemicals and Related Products 41.8 39.2 44.5 25.5 28.8 40.8 31.8 25.5 15.6 24.9
Lime, Cement, and Glass 23.3 20.8 37.3 37.2 44.3 51.9 18.4 9.6 7.3 11.6
Petroleum Products 5.5 6.2 7.7 7.6 7.4 55.8 11.9 8.5 10.7 8.3
Forest Products, Wood and Chips 13.4 18.4 16.8 18.5 10.6 11.1 9.7 6.8 3.7 8.1
Primary Non-Ferrous Metal Products 6.3 7.6 8.6 11.9 8.1 10.0 5.3 5.3 64 7.7
Fertilizers 9.0 11.8 9.6 3.8 7.4 5.7 6.6 2.4 2.2 5.1
Paper Products 13.1 29.4 26.0 18.0 14.6 10.7 8.0 6.2 5.2 4.9
Other Non-Metal Minerals 3.8 5.9 10.4 4.3 5.0 8.1 6.8 2.3 2.0 3.8
Primary Iron and Steel Products 6.4 3.7 2.8 3.3 2.7 2.2 2.6 0.6 1.2 3.2
Primary Wood Products; Veneer 4.9 5.5 0.8 2.6 2.0 1.9 0.1 1.3 0.0 1.6
Iron Ore and Scrap; Non-Ferrous Ores and Scrap; Sulfur, Clay, and Salt; Slag 0.0 0.1 0.0 0.0 0.8 0.4 0.4 2.9 0.2 0.7
Soil, Sand, Gravel, Rock, and Stone 2.4 2.6 1.1 1.8 2.0 0.9 13.3 0.2 0.5 0.5
Waste and Scrap Not Elsewhere Classified; Unknown or Not Elsewhere Classified
2.1 0.6 0.3 0.7 0.4 0.3 0.0 1.6 0.5 0.2
Coal 0.6 2.4 0.1 0.0 0.0 0.0 0.0 0.2 0.0 0.0
Table 4-4: Port of Whittier Inbound Freight (thousands of tons)
Commodities 2004 2005 2006 2007 2008 2009 2010 2011 2012 2013
Total 47.6 25.3 34.4 18.9 10.4 12.1 11.7 10.8 9.9 11.8
Manufactured Equipment, Machinery and Products 44.0 17.7 28.8 12.4 4.4 6.3 5.9 5.2 4.1 6.1
Primary Non-Ferrous Metal Products 1.3 1.7 2.0 1.7 2.2 2.1 1.4 1.9 1.6 2.3
Food and Farm Products 0.4 3.2 1.3 1.1 1.2 1.4 1.2 1.2 1.2 1.3
Paper Products 0.4 0.7 0.7 1.1 0.6 0.8 0.6 0.8 0.9 0.6
Other Non-Metal Minerals 0.2 0.6 0.6 0.6 1.1 0.8 0.6 0.8 0.4 0.5
Chemicals and Related Products 0.1 0.1 0.2 0.9 0.4 0.3 0.3 0.3 0.2 0.3
Lime, Cement and Glass 0.1 0.4 0.2 0.3 0.1 0.3 1.3 0.2 0.1 0.3
Forest Products, Wood and Chips 0.4 0.2 0.3 0.2 0.0 0.1 0.3 0.1 0.1 0.2
Petroleum Products 0.5 0.4 0.2 0.6 0.4 0.2 0.2 0.4 1.4 0.2
Primary Iron and Steel Products; Primary Wood Products, Veneer 0.0 0.1 0.0 0.0 0.0 0.0 0.0 0.0 0.0 0.0
Soil, Sand, Gravel, Rock and Stone 0.0 0.0 0.0 0.0 0.0 0.0 0.0 0.0 0.0 0.0
Unknown or Not Elsewhere Classified 0.2 0.0 0.0 0.0 0.0 0.0 0.0 0.0 0.0 0.0
Table 4-5: Port of Whittier Outbound Freight (thousands of tons)
Origin and Destination of FreightOil field supplies, machinery, insulation, lumber, pipe, drilling mud, and chemicals are common goods arriving in Whittier, which are frequently used for oil drilling operations on the North Slope. Companies such as ConocoPhilips Alaska, BP Exploration (Alaska), Spenard Building Supplies, and Fort Knox Gold Mine are all customers of Canadian National and make use of the Port of Whittier.
30 Freight Traffic Study
Freight BusinessesPort of Whittier tenants (leaseholders) include the following (although the list is not comprehensive).
• Alaska Marine Lines – Lynden (AML) is a marine transportation company providing barge service to and from Alaska and Hawaii. AML offers twice weekly service to central Alaska, seasonal service to western Alaska, and bi-weekly service to Hawaii13. AML leases a substantial area of the ARRC uplands at Whittier for its operations and operates four 420 feet by 100 feet rail/container vessels fitted with rail tracks on the deck and 32 rows of overhead container racks from the Port of Whittier. Each vessel is equipped with six electrically operated ballast tanks14.
• Fee’s Custom Seafoods, a seafood processor and general store, provides custom fish processing and gifts from their location on the outer-east side of the Whittier Small Boat Harbor.
• Shoreside Petroleum, a fuel and lubricant distributor within the Whittier small boat harbor, leases land for a fuel distribution terminal.
Location and SettingThe 220-acre Port of Anchorage (POA) is adjacent to downtown Anchorage and is owned and operated by the Municipality of Anchorage. About 450 vessels call on the POA each year, making this the largest and busiest port in the state. About 90 percent of goods for 85 percent of Alaska’s populated areas arrive through the POA including: gasoline, heating oil, diesel fuel, cement, business supplies, and groceries. Additionally, the port is one of only 19 commercial ports in the U.S designated as a Department of Defense Strategic Seaport. This designation recognizes POA’s role in supporting overseas deployments, fuel for Joint Base Elmendorf Richardson (JBER), vehicle transportation, and goods used in day-to-day business and the commissary15.
InfrastructureThe POA contains three cargo berths, two petroleum berths, and a dry barge landing. The cargo berths have 2,100 feet of dock face for loading and unloading bulk and break-bulk cargo (break-bulk is general non-bulk or intermodal cargo such as bags, bails, boxes, cartons, drums, pallets, and vehicles). The facility is capable of roll-on/roll-off (RO/RO) transfer of cargo; has multiple rail-mounted, electric container cranes capable of moving up to 40 tons; and can handle bulk cement and break-bulk cargo. The two petroleum terminals each have 600 feet of berthing space and four 2,000 barrels per hour (bbl/hr) product pipelines. The POA operating depth is currently dredged to -35 feet MLLW.
Terminals are too small and shallow to accommodate most modern cargo container ships and the POA is currently in the process of modernization. The POA Modernization Project includes replacing two petroleum terminals, replacing two cargo terminals, and improving facility resiliency to survive seismic events and the harsh marine environment. Port modernization will incorporate current technology to enhance operational efficiency. By the end of the project, the POA will be capable of accommodating larger vessels by increasing the harbor depth from -35 feet MLLW and -45 feet MLLW. The port will also have new larger container cranes to load and unload containers from larger vessels and updates will extend the life of the facility for at least 75 years.
The POA serves as a petroleum gathering and storing facility, with a petroleum valve yard and storage tanks where refined and unrefined petroleum product are staged prior to distribution to nearby facilities such as JBER and Ted Stevens Anchorage International Airport. Petroleum arrives at the port through the docks or through a pipeline from the Tesoro Alaska Company’s (Tesoro) Kenai Refinery in Nikiski.
TransportationGoods arriving at the POA have access to the state by ship, rail, highway, airport and pipeline. The close proximity to Ted Stevens Anchorage International Airport, the fifth busiest air cargo hub in the world, allows goods to be quickly transferred from one mode of transportation to another. Furthermore, a network of pipelines allows for the transport of fuel from the Tesoro refinery in Nikiski to the POA, and also for redistribution from the POA to the airport and JBER. In the winter months, ice can build up around the docks and harbor area. In
4.2.2 Port Of Anchorage
13http://www.lynden.com/aml/index.html14http://www.lynden.com/aml/tools/equipment/marine-equipment/whittier.html15http://www.portofanc.com/about-us/faqs/
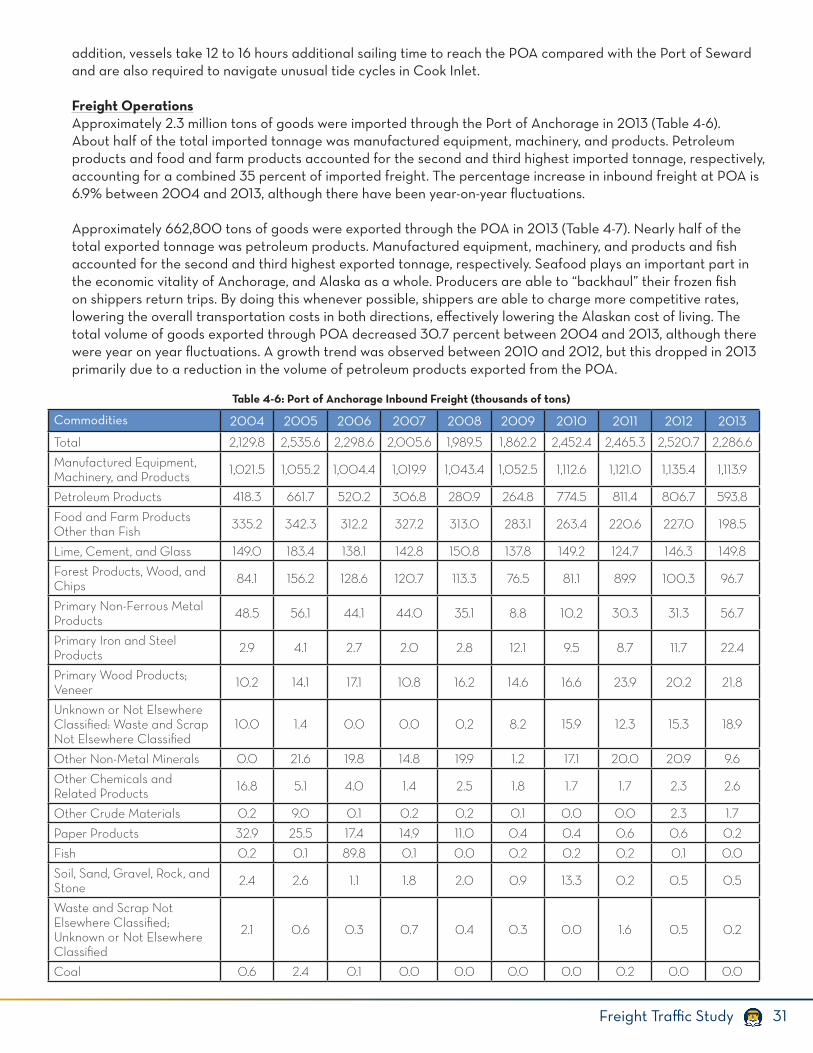
31Freight Traffic Study
addition, vessels take 12 to 16 hours additional sailing time to reach the POA compared with the Port of Seward and are also required to navigate unusual tide cycles in Cook Inlet.
Freight OperationsApproximately 2.3 million tons of goods were imported through the Port of Anchorage in 2013 (Table 4-6). About half of the total imported tonnage was manufactured equipment, machinery, and products. Petroleum products and food and farm products accounted for the second and third highest imported tonnage, respectively, accounting for a combined 35 percent of imported freight. The percentage increase in inbound freight at POA is 6.9% between 2004 and 2013, although there have been year-on-year fluctuations.
Approximately 662,800 tons of goods were exported through the POA in 2013 (Table 4-7). Nearly half of the total exported tonnage was petroleum products. Manufactured equipment, machinery, and products and fish accounted for the second and third highest exported tonnage, respectively. Seafood plays an important part in the economic vitality of Anchorage, and Alaska as a whole. Producers are able to “backhaul” their frozen fish on shippers return trips. By doing this whenever possible, shippers are able to charge more competitive rates, lowering the overall transportation costs in both directions, effectively lowering the Alaskan cost of living. The total volume of goods exported through POA decreased 30.7 percent between 2004 and 2013, although there were year on year fluctuations. A growth trend was observed between 2010 and 2012, but this dropped in 2013 primarily due to a reduction in the volume of petroleum products exported from the POA.
Commodities 2004 2005 2006 2007 2008 2009 2010 2011 2012 2013
Total 2,129.8 2,535.6 2,298.6 2,005.6 1,989.5 1,862.2 2,452.4 2,465.3 2,520.7 2,286.6
Manufactured Equipment, Machinery, and Products 1,021.5 1,055.2 1,004.4 1,019.9 1,043.4 1,052.5 1,112.6 1,121.0 1,135.4 1,113.9
Petroleum Products 418.3 661.7 520.2 306.8 280.9 264.8 774.5 811.4 806.7 593.8
Food and Farm Products Other than Fish 335.2 342.3 312.2 327.2 313.0 283.1 263.4 220.6 227.0 198.5
Lime, Cement, and Glass 149.0 183.4 138.1 142.8 150.8 137.8 149.2 124.7 146.3 149.8
Forest Products, Wood, and Chips 84.1 156.2 128.6 120.7 113.3 76.5 81.1 89.9 100.3 96.7
Primary Non-Ferrous Metal Products 48.5 56.1 44.1 44.0 35.1 8.8 10.2 30.3 31.3 56.7
Primary Iron and Steel Products 2.9 4.1 2.7 2.0 2.8 12.1 9.5 8.7 11.7 22.4
Primary Wood Products; Veneer 10.2 14.1 17.1 10.8 16.2 14.6 16.6 23.9 20.2 21.8
Unknown or Not Elsewhere Classified: Waste and Scrap Not Elsewhere Classified
10.0 1.4 0.0 0.0 0.2 8.2 15.9 12.3 15.3 18.9
Other Non-Metal Minerals 0.0 21.6 19.8 14.8 19.9 1.2 17.1 20.0 20.9 9.6
Other Chemicals and Related Products 16.8 5.1 4.0 1.4 2.5 1.8 1.7 1.7 2.3 2.6
Other Crude Materials 0.2 9.0 0.1 0.2 0.2 0.1 0.0 0.0 2.3 1.7
Paper Products 32.9 25.5 17.4 14.9 11.0 0.4 0.4 0.6 0.6 0.2
Fish 0.2 0.1 89.8 0.1 0.0 0.2 0.2 0.2 0.1 0.0
Soil, Sand, Gravel, Rock, and Stone 2.4 2.6 1.1 1.8 2.0 0.9 13.3 0.2 0.5 0.5
Waste and Scrap Not Elsewhere Classified; Unknown or Not Elsewhere Classified
2.1 0.6 0.3 0.7 0.4 0.3 0.0 1.6 0.5 0.2
Coal 0.6 2.4 0.1 0.0 0.0 0.0 0.0 0.2 0.0 0.0
Table 4-6: Port of Anchorage Inbound Freight (thousands of tons)
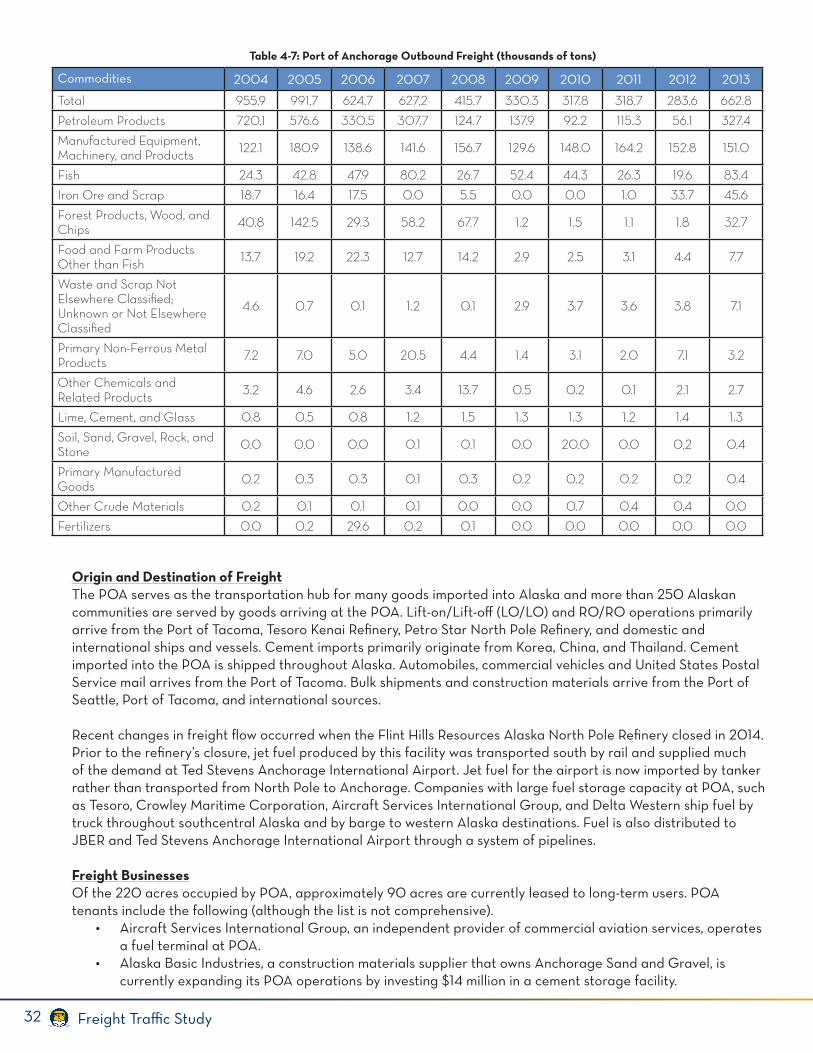
32 Freight Traffic Study
Commodities 2004 2005 2006 2007 2008 2009 2010 2011 2012 2013
Total 955.9 991.7 624.7 627.2 415.7 330.3 317.8 318.7 283.6 662.8
Petroleum Products 720.1 576.6 330.5 307.7 124.7 137.9 92.2 115.3 56.1 327.4
Manufactured Equipment, Machinery, and Products 122.1 180.9 138.6 141.6 156.7 129.6 148.0 164.2 152.8 151.0
Fish 24.3 42.8 47.9 80.2 26.7 52.4 44.3 26.3 19.6 83.4
Iron Ore and Scrap 18.7 16.4 17.5 0.0 5.5 0.0 0.0 1.0 33.7 45.6
Forest Products, Wood, and Chips 40.8 142.5 29.3 58.2 67.7 1.2 1.5 1.1 1.8 32.7
Food and Farm Products Other than Fish 13.7 19.2 22.3 12.7 14.2 2.9 2.5 3.1 4.4 7.7
Waste and Scrap Not Elsewhere Classified; Unknown or Not Elsewhere Classified
4.6 0.7 0.1 1.2 0.1 2.9 3.7 3.6 3.8 7.1
Primary Non-Ferrous Metal Products 7.2 7.0 5.0 20.5 4.4 1.4 3.1 2.0 7.1 3.2
Other Chemicals and Related Products 3.2 4.6 2.6 3.4 13.7 0.5 0.2 0.1 2.1 2.7
Lime, Cement, and Glass 0.8 0.5 0.8 1.2 1.5 1.3 1.3 1.2 1.4 1.3
Soil, Sand, Gravel, Rock, and Stone 0.0 0.0 0.0 0.1 0.1 0.0 20.0 0.0 0.2 0.4
Primary Manufactured Goods 0.2 0.3 0.3 0.1 0.3 0.2 0.2 0.2 0.2 0.4
Other Crude Materials 0.2 0.1 0.1 0.1 0.0 0.0 0.7 0.4 0.4 0.0
Fertilizers 0.0 0.2 29.6 0.2 0.1 0.0 0.0 0.0 0.0 0.0
Table 4-7: Port of Anchorage Outbound Freight (thousands of tons)
Origin and Destination of FreightThe POA serves as the transportation hub for many goods imported into Alaska and more than 250 Alaskan communities are served by goods arriving at the POA. Lift-on/Lift-off (LO/LO) and RO/RO operations primarily arrive from the Port of Tacoma, Tesoro Kenai Refinery, Petro Star North Pole Refinery, and domestic and international ships and vessels. Cement imports primarily originate from Korea, China, and Thailand. Cement imported into the POA is shipped throughout Alaska. Automobiles, commercial vehicles and United States Postal Service mail arrives from the Port of Tacoma. Bulk shipments and construction materials arrive from the Port of Seattle, Port of Tacoma, and international sources.
Recent changes in freight flow occurred when the Flint Hills Resources Alaska North Pole Refinery closed in 2014. Prior to the refinery’s closure, jet fuel produced by this facility was transported south by rail and supplied much of the demand at Ted Stevens Anchorage International Airport. Jet fuel for the airport is now imported by tanker rather than transported from North Pole to Anchorage. Companies with large fuel storage capacity at POA, such as Tesoro, Crowley Maritime Corporation, Aircraft Services International Group, and Delta Western ship fuel by truck throughout southcentral Alaska and by barge to western Alaska destinations. Fuel is also distributed to JBER and Ted Stevens Anchorage International Airport through a system of pipelines.
Freight BusinessesOf the 220 acres occupied by POA, approximately 90 acres are currently leased to long-term users. POA tenants include the following (although the list is not comprehensive).
• Aircraft Services International Group, an independent provider of commercial aviation services, operates a fuel terminal at POA.
• Alaska Basic Industries, a construction materials supplier that owns Anchorage Sand and Gravel, is currently expanding its POA operations by investing $14 million in a cement storage facility.
33Freight Traffic Study
• Crowley Maritime Corporation, a barge delivery and terminal company, operates a fuel terminal at POA.• Delta Western, a petroleum product distributor, is currently expanding its operations by building a
360,000 barrel storage facility at the POA.• Matson, a freight forwarding company that recently acquired Horizon Lines, provides the POA regular
container service from their location at the POA.• Tesoro, a petroleum company that recently acquired the Flint Hills terminal in Anchorage, operates a fuel
terminal at the POA. The terminal has 580,000 barrels of storage capacity, truck racks, and rail-loading facilities.
• TOTE Maritime, a transportation company, operates a fleet of RO/RO cargo ships and relies on the POA because it is the only southcentral port that can meet the requirements of their RO/RO system.
Location and SettingPort MacKenzie is located across the Knik Arm of Cook Inlet from the POA. There are 9,033 acres (14 square miles) of uplands and tidelands currently available for development near Port MacKenzie. Development of Port MacKenzie began in 1999 with construction of the barge dock, and annual vessel calls to the port average less than 10 per year. Port MacKenzie has a ferry dock, a barge dock, and a deep-water dock that can accommodate Panamax and Capesize vessels. In order to comply with Panama Canal size regulations, Panamax vessels cannot be longer than 965 feet or wider than 106 feet, and draught cannot be longer than 39.5 feet. The vessels have an average capacity of 65,000 deadweight tonnage (DWT). Capesize vessels are much larger—too large to pass through the Panama Canal. Capesize vessels have capacities larger than 150,000 DWT and can be as large as 400,000 DWT. The port primarily serves as a bulk commodities port, with shipments consisting of wood chips, saw logs, coal, sand/gravel, cement, and scrap metal.
InfrastructureAt Port MacKenzie, there are two docks, a terminal building, a five-foot-wide conveyer system, and two cranes (230-ton and 100-ton).
• The barge dock has a gravel surface that is 14.7 acres at −20 feet MLLW. The gravel pad has a load capacity of 1,000 pounds per square foot with a 500-foot bulkhead barge dock.
• The deep-draft dock, which is 1,200 feet in length and has a depth of −60 feet MLLW, can accommodate Panamax and Capesize vessels.
• The conveyer system allows for the loading and unloading of 2,000 tons per hour of bulk goods and commodities.
• The terminal building has services and amenities that users of the dock might require. Fuel oil heat, electricity, water, sewer, telephone, and internet are all available in the 7,000-square-foot terminal building. In addition, there are bathrooms with showers, a kitchen, and six offices currently available for lease.
Transportation Port MacKenzie, owned by the Matanuska-Susitna Borough (MSB), is the northernmost deep-draft port in the United States and the closest deep-draft port to Alaska’s interior. However, at this time Port MacKenzie is not connected by rail or air. The Port MacKenzie Rail Extension Project is currently on hold due to state budgetary constraints and incomplete. As of October 2015, $119.5 million dollars were needed to complete the rail construction and design of the project to connect Port MacKenzie to the ARRC main line. Freight Operations
The MSB has positioned Port MacKenzie to specialize in bulk commodities such as gravel, coal, wood chips, and cement, but the port is also capable of handling goods such as modular homes, logs, oilfield modules for the North Slope, and other heavy equipment. Import and export tonnage for Port MacKenzie is not available from the USACE; however, it is estimated that the number of annual vessel calls has been less than 10 per year.
Origin and Destination of FreightMost goods arriving at Port MacKenzie have been bound for the Cook Inlet and North Slope oilfields, while most exported goods including wood chips and coal have been bound for South Korea, Japan, or China.
4.2.3 Port McKenzie
34 Freight Traffic Study
Freight BusinessesPort MacKenzie tenants (leaseholders) include the following:
• Alutiiq Manufacturing Company, a construction company that manufactures building and modular homes for the North Slope oilfields;
• Central Alaska Energy, a subsidiary to Vitus Energy, is developing a seven-million gallon fuel terminal at Port MacKenzie;
• NPI, a natural resource extraction and export company; and • WestPac Logistics, a transportation and logistics company, offers barge service from the Pacific
Northwest to Port MacKenzie.
Location and SettingValdez is located in the northeast corner of Prince William Sound. It is the terminus for the Trans-Alaska Pipeline System (TAPS), which originates in Prudhoe Bay, Alaska. Valdez is the most northerly ice-free port in the United States, allowing year-round access to Southcentral and Interior Alaska. The direct distance between Anchorage and Valdez is about 120 miles, although by highway the distance is about 300 miles.
InfrastructureThe Port of Valdez contains several facilities owned by the City of Valdez.
• The Container Terminal is an offshore floating dock made of concrete that is capable of handling containerized, RO/RO and LO/LO freight. The dock is 700 feet long, with the ability to extend to 1,200 feet, with an operational water depth of −50 feet MLLW. The entire dock is attached by two 200-foot ramps that lead to 21 acres of storage area.
• The Valdez Grain Terminal consists of nine concrete silos that are 112 feet tall and 33 feet in diameter with a total capacity of 522,000 bushels.
• The John Thomas Kelsey Municipal Dock is a 600-foot wooden wharf that features a recently remodeled fendering system. Water depth at the municipal dock is −35 feet MLLW.
• The Valdez Small Boat Harbor has water depths of 10 to 12 feet, and is capable of housing 511 boats, ranging from 20 feet to 65 feet, for long-term or transient berthing. Services at the harbor include water, fuel, electricity, telephone, cable TV, boat-launch ramps, and a mobile vertical boat lift capable of lifting 60 tons.
• The Valdez Pioneer Field Airport Terminal is served daily by a well-established commuter airline.• The privately owned Valdez Marine Terminal is owned and operated by Alyeska Pipeline Service
Company. It stores, loads, and ships crude oil received from the TAPS. The end of the 800-mile TAPS lies on 1,000 acres of land, which is used for loading and storing crude oil. There are 14 functional storage tanks, a power plant, two loading berths, and equipment to measure the inbound oil.
TransportationThe Port of Valdez has access to the Richardson Highway, the Alaska Marine Highway, and the Valdez Pioneer Field Airport. It is not on the ARRC Rail Belt.
Freight OperationsAbout 7,800 tons of goods arrived through the Port of Valdez in 2013. About 67 percent of inbound tonnage was petroleum products and 29 percent was iron and steel products.
Petroleum from the TAPS through the Valdez Marine Terminal accounts for nearly all of the outbound tonnage through the Port of Valdez, totaling 28,147 thousands of tons in 2013. Petroleum shipments declined by nearly 40 percent between 2004 and 2013. Fish exports are the leading non-petroleum outbound freight, with about 9,000 tons outbound in 2012 and 2013.
4.2.4 Port Of Valdez
35Freight Traffic Study
Origin and Destination of FreightThe primary outbound freight through the Port of Valdez is crude oil from the Prudhoe Bay Oilfields transported through the 800-mile-long TAPS. Most of the oil shipped from Valdez is headed to markets in California and Washington, with occasional shipments to Hawaii. A small proportion of the crude oil shipped from Valdez, about three percent between 1996 and 2004 period, was bound for markets in South Korea, Japan, China, and Taiwan.
Freight BusinessesPort of Valdez tenants (leaseholders) include the following seafood processing businesses, North Star Terminal and Stevedoring Co., Samson Tug and Barge, and the USCG.
Location and SettingThe Port of Homer is located on the north side of the entrance to Kachemak Bay within Cook Inlet on the Kenai Peninsula. Homer is connected to the Sterling Highway. The Port of Homer is a year-round ice-free port.
InfrastructurePort of Homer facilities include three docks, a boat launch ramp, two tidal grids for hull inspections, and a range of dock-side amenities such as security, electricity, potable water, sewage pump, fuel, used oil collection, and fish cleaning tables.
• The Deep Water Dock, also called the Cargo Dock, is 345 feet long and has a depth of −40 feet MLLW. It is equipped with one 5-ton crane.
• The Pioneer Dock is primarily used for the Alaska Marine Highway; however, it is available to other appropriately sized ships when unoccupied. It has a length of 469 feet and a depth of −40 feet MLLW.
• The Fish Dock is 382 feet long, with 50 feet side berths, depth of −20 feet MLLW, and a dock height of +31 feet above MLLW. It is equipped with eight cranes, six 2.5-ton cranes and two 5-ton cranes; the associated ice plant and cold storage is closed during winter.
• The Homer Small Boat Harbor has capacity for 920 vessels ranging from 6 to 195 feet.
TransportationHomer is located about 225 miles south of Anchorage on the Sterling Highway. Homer Airport receives regular air carrier service from Anchorage and regular ferry service from the Alaska Marine Highway. Alaskan Coastal Freight regularly provides barge services to Homer, Kachemak Bay, Cook Inlet, Chignik Bay, Perryville, Dillingham, and Kodiak Island. In addition to Alaskan Coastal Freight, Cook Inlet Tug & Barge also provides barge services to Homer.
Freight OperationsAbout 165,400 tons of goods were received in the Port of Homer in 2013. Petroleum products dominate both the inbound and outbound freight through the port in 2013, comprising more than 99.9 percent of total freight traffic.
Origin and Destination of FreightInbound goods are primarily distributed by truck on Alaska highways.
Freight BusinessesPort of Homer tenants (leaseholders) include Alaskan Coastal Freight, a marine transportation company; Cook Inlet Tug & Barge, a marine transportation company; Petro 49 (formerly known as Harbor Enterprises), a petroleum marketing and distribution company; and a number of seafood processing businesses. In addition the Alaska Marine Highway System has a ferry terminal in Homer and the USCG maintains a small facility.
4.2.5 Port Of Homer
36 Freight Traffic Study
Location and SettingThe Port of Kodiak is located on the northwest corner of Kodiak Island, about 200 miles south of Anchorage by sea. The port serves as a hub for Gulf of Alaska container traffic and a distribution center for consumer goods going to communities throughout Southwest Alaska. The USCG maintains a large presence in Kodiak. Between the various USCG operating and support commands, there are approximately 1,400 military (958 active duty) and civilian personnel (government workers) and 1,700 military dependents in Kodiak. Kodiak is one of the top commercial fishing ports in the United States (as ranked by landed value). In 2014, the value of commercial fishery landings in Kodiak was $143.1 million, making it the third largest port in the United States by value. In recent years, the ground fish fishery (primarily pollock and cod) has become increasingly important to Kodiak’s economy.
From 1986 to 2011, the ex-vessel value of this fishery increased from $23.5 million to more than $78 million.
InfrastructureThe Port of Kodiak has three commercial docks, three cranes, two small boat harbors, and a wide variety of facilities for port users. The City of Kodiak owns the port facilities and operates them through the City Harbor Department.
• Pier I, the Ferry Dock, is used for mooring, loading, and unloading of fishing and other types of vessels. It is 204-feet-long by 28-feet-wide with a depth of -26.6 feet MLLW.
• Pier II, the City Dock, is used for loading and unloading commercial freight, cruise ships, government vessels, gear work area, and moorage for fishing vessels. It is 1,050-feet-long and 64-feet-wide, with a depth of −38 feet MLLW.
• Pier III, the Cargo Terminal, is used for containerized and general cargo. It is 490-feet-long and 64-feet-wide, with a depth at −38 feet MLLW.
• The LASH Marine Terminal, operated by Seaport Terminal Services, a subsidiary of LASH Corporation, provides a freight services to port users including the fishing fleet, construction contractors, and freight transporters.
• The two small boat harbors can accommodate 650 vessels up to 150-feet-long Facilities include bulk fuel at Pier I and Pier II, outside storage and a covered warehouse at Pier II, a 30-ton crane at Pier III, and water at all three piers.
TransportationThe City of Kodiak is not connected by road or rail to the rest of Alaska. The community relies on the Alaska Marine Highway System and the port for passenger, vehicle, and cargo service. The Kodiak Airport receives regular service from airline carriers including Alaska Airlines and Ravn Air. Barge companies regularly serving the Port of Kodiak include Matson (formerly Horizon Lines) and Samson Tug and Barge.
Freight OperationsAbout 176,700 tons of goods arrived at the Port of Kodiak in 2013. About 89 percent of the inbound freight was petroleum products. Manufactured equipment, machinery, and products accounted for the remaining 11 percent of inbound freight in 2013.
The leading export from the Port of Kodiak by tonnage was forest products, accounting for 57 percent of total export tonnage in 2013. Manufactured equipment and fish exports also constitute a large proportion of exports from Kodiak, 35 percent and eight percent of total export tonnage, respectively, in 2013.
Origin and Destination of FreightForest products exported through the Port of Kodiak originate from forest harvest on Afognak Island and Chiniak on Kodiak Island from Native Corporation lands. Many of these logs are shipped to Asian markets, such as China, Japan, and South Korea, where the raw materials are produced into wood products. Sitka spruce is one of the
4.2.6 Port of Kodiak
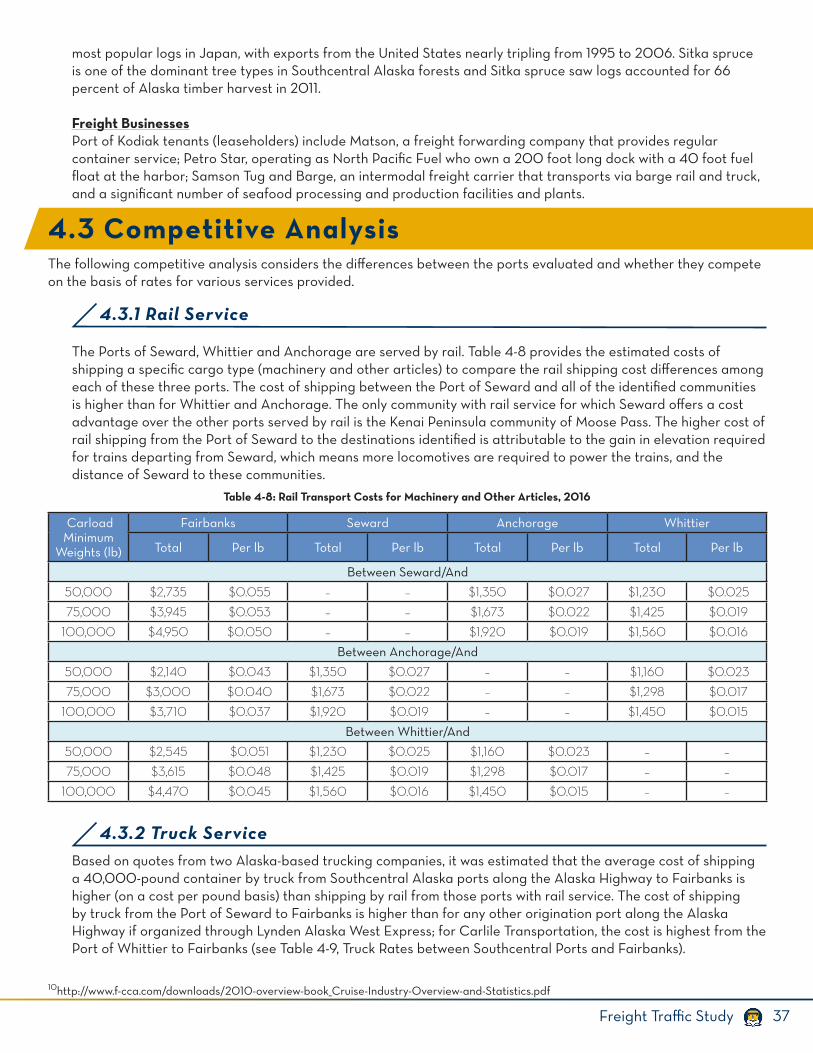
37Freight Traffic Study
most popular logs in Japan, with exports from the United States nearly tripling from 1995 to 2006. Sitka spruce is one of the dominant tree types in Southcentral Alaska forests and Sitka spruce saw logs accounted for 66 percent of Alaska timber harvest in 2011.
Freight BusinessesPort of Kodiak tenants (leaseholders) include Matson, a freight forwarding company that provides regular container service; Petro Star, operating as North Pacific Fuel who own a 200 foot long dock with a 40 foot fuel float at the harbor; Samson Tug and Barge, an intermodal freight carrier that transports via barge rail and truck, and a significant number of seafood processing and production facilities and plants.
The following competitive analysis considers the differences between the ports evaluated and whether they compete on the basis of rates for various services provided.
The Ports of Seward, Whittier and Anchorage are served by rail. Table 4-8 provides the estimated costs of shipping a specific cargo type (machinery and other articles) to compare the rail shipping cost differences among each of these three ports. The cost of shipping between the Port of Seward and all of the identified communities is higher than for Whittier and Anchorage. The only community with rail service for which Seward offers a cost advantage over the other ports served by rail is the Kenai Peninsula community of Moose Pass. The higher cost of rail shipping from the Port of Seward to the destinations identified is attributable to the gain in elevation required for trains departing from Seward, which means more locomotives are required to power the trains, and the distance of Seward to these communities.
Based on quotes from two Alaska-based trucking companies, it was estimated that the average cost of shipping a 40,000-pound container by truck from Southcentral Alaska ports along the Alaska Highway to Fairbanks is higher (on a cost per pound basis) than shipping by rail from those ports with rail service. The cost of shipping by truck from the Port of Seward to Fairbanks is higher than for any other origination port along the Alaska Highway if organized through Lynden Alaska West Express; for Carlile Transportation, the cost is highest from the Port of Whittier to Fairbanks (see Table 4-9, Truck Rates between Southcentral Ports and Fairbanks).
4.3 Competitive Analysis
10http://www.f-cca.com/downloads/2010-overview-book_Cruise-Industry-Overview-and-Statistics.pdf
4.3.1 Rail Service
Table 4-8: Rail Transport Costs for Machinery and Other Articles, 2016
Carload Minimum
Weights (lb)
Fairbanks Seward Anchorage Whittier
Total Per lb Total Per lb Total Per lb Total Per lb
Between Seward/And
50,000 $2,735 $0.055 – – $1,350 $0.027 $1,230 $0.025
75,000 $3,945 $0.053 – – $1,673 $0.022 $1,425 $0.019
100,000 $4,950 $0.050 – – $1,920 $0.019 $1,560 $0.016
Between Anchorage/And
50,000 $2,140 $0.043 $1,350 $0.027 – – $1,160 $0.023
75,000 $3,000 $0.040 $1,673 $0.022 – – $1,298 $0.017
100,000 $3,710 $0.037 $1,920 $0.019 – – $1,450 $0.015
Between Whittier/And
50,000 $2,545 $0.051 $1,230 $0.025 $1,160 $0.023 – –
75,000 $3,615 $0.048 $1,425 $0.019 $1,298 $0.017 – –
100,000 $4,470 $0.045 $1,560 $0.016 $1,450 $0.015 – –
4.3.2 Truck Service
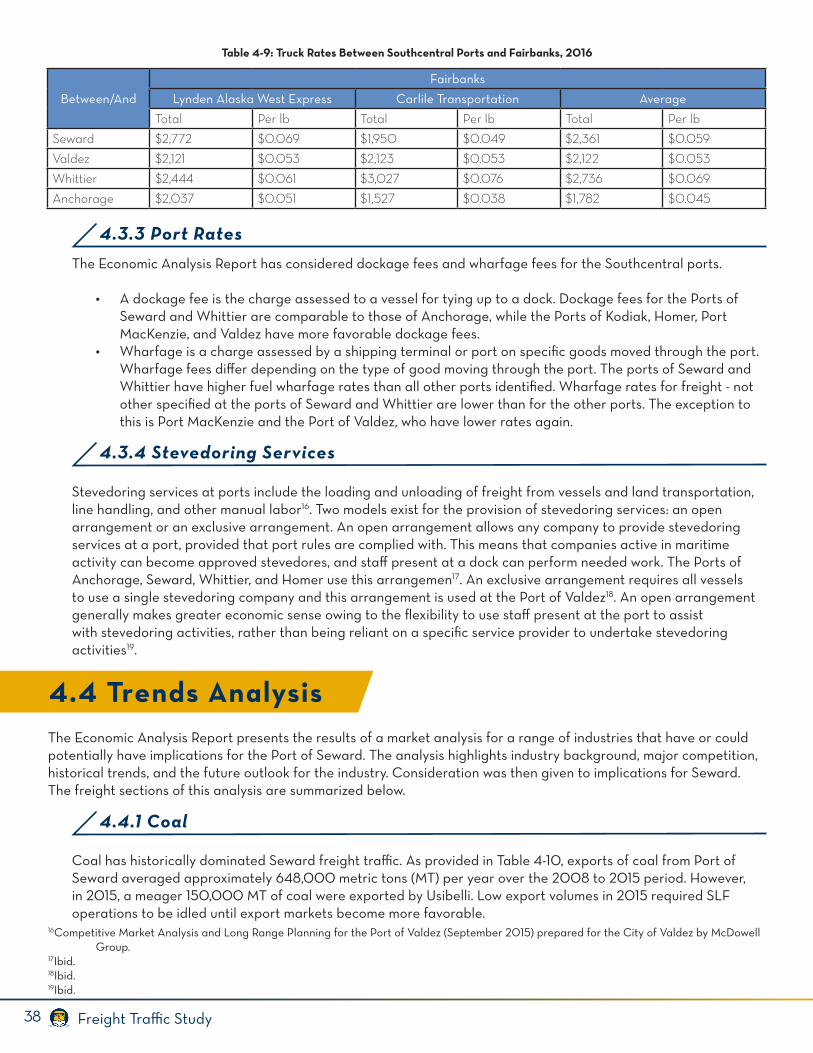
38 Freight Traffic Study
Between/And
Fairbanks
Lynden Alaska West Express Carlile Transportation Average
Total Per lb Total Per lb Total Per lb
Seward $2,772 $0.069 $1,950 $0.049 $2,361 $0.059
Valdez $2,121 $0.053 $2,123 $0.053 $2,122 $0.053
Whittier $2,444 $0.061 $3,027 $0.076 $2,736 $0.069
Anchorage $2,037 $0.051 $1,527 $0.038 $1,782 $0.045
Table 4-9: Truck Rates Between Southcentral Ports and Fairbanks, 2016
4.3.3 Port Rates
The Economic Analysis Report has considered dockage fees and wharfage fees for the Southcentral ports.
• A dockage fee is the charge assessed to a vessel for tying up to a dock. Dockage fees for the Ports of Seward and Whittier are comparable to those of Anchorage, while the Ports of Kodiak, Homer, Port MacKenzie, and Valdez have more favorable dockage fees.
• Wharfage is a charge assessed by a shipping terminal or port on specific goods moved through the port. Wharfage fees differ depending on the type of good moving through the port. The ports of Seward and Whittier have higher fuel wharfage rates than all other ports identified. Wharfage rates for freight - not other specified at the ports of Seward and Whittier are lower than for the other ports. The exception to this is Port MacKenzie and the Port of Valdez, who have lower rates again.
Stevedoring services at ports include the loading and unloading of freight from vessels and land transportation, line handling, and other manual labor16. Two models exist for the provision of stevedoring services: an open arrangement or an exclusive arrangement. An open arrangement allows any company to provide stevedoring services at a port, provided that port rules are complied with. This means that companies active in maritime activity can become approved stevedores, and staff present at a dock can perform needed work. The Ports of Anchorage, Seward, Whittier, and Homer use this arrangemen17. An exclusive arrangement requires all vessels to use a single stevedoring company and this arrangement is used at the Port of Valdez18. An open arrangement generally makes greater economic sense owing to the flexibility to use staff present at the port to assist with stevedoring activities, rather than being reliant on a specific service provider to undertake stevedoring activities19.
The Economic Analysis Report presents the results of a market analysis for a range of industries that have or could potentially have implications for the Port of Seward. The analysis highlights industry background, major competition, historical trends, and the future outlook for the industry. Consideration was then given to implications for Seward. The freight sections of this analysis are summarized below.
Coal has historically dominated Seward freight traffic. As provided in Table 4-10, exports of coal from Port of Seward averaged approximately 648,000 metric tons (MT) per year over the 2008 to 2015 period. However, in 2015, a meager 150,000 MT of coal were exported by Usibelli. Low export volumes in 2015 required SLF operations to be idled until export markets become more favorable.
4.3.4 Stevedoring Services
4.4 Trends Analysis
4.4.1 Coal
16Competitive Market Analysis and Long Range Planning for the Port of Valdez (September 2015) prepared for the City of Valdez by McDowell Group.17Ibid.18Ibid.19Ibid.
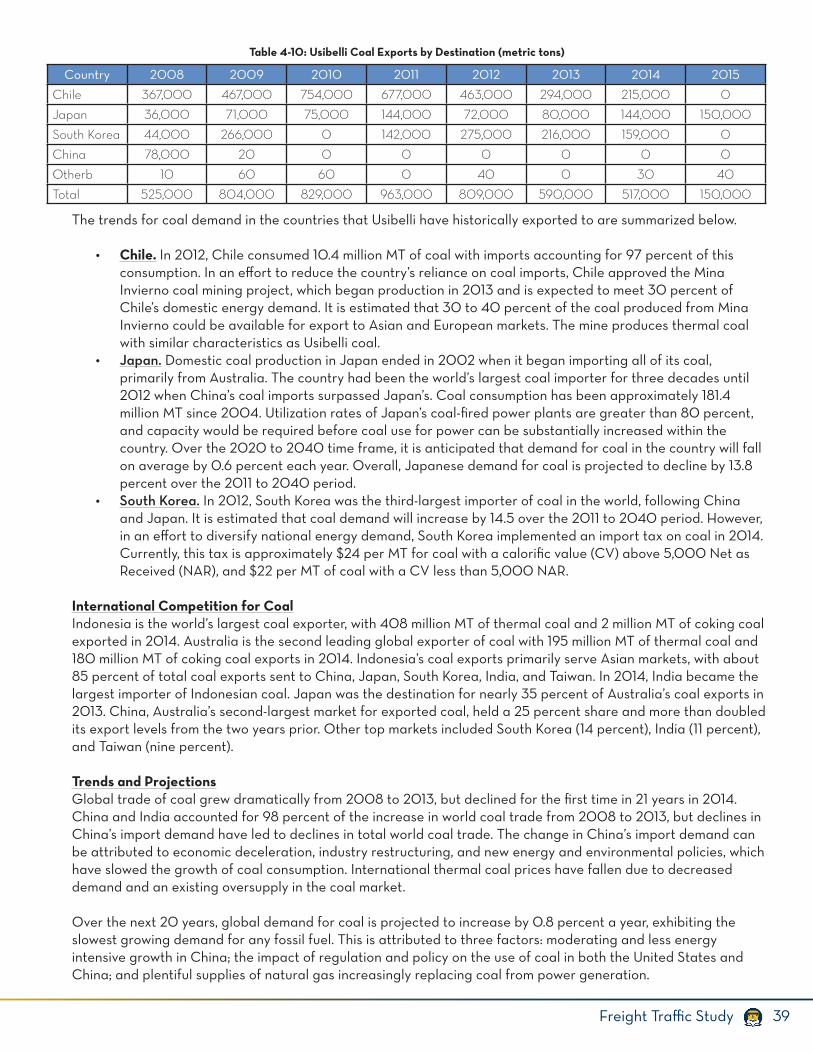
39Freight Traffic Study
Country 2008 2009 2010 2011 2012 2013 2014 2015
Chile 367,000 467,000 754,000 677,000 463,000 294,000 215,000 0
Japan 36,000 71,000 75,000 144,000 72,000 80,000 144,000 150,000
South Korea 44,000 266,000 0 142,000 275,000 216,000 159,000 0
China 78,000 20 0 0 0 0 0 0
Otherb 10 60 60 0 40 0 30 40
Total 525,000 804,000 829,000 963,000 809,000 590,000 517,000 150,000
Table 4-10: Usibelli Coal Exports by Destination (metric tons)
The trends for coal demand in the countries that Usibelli have historically exported to are summarized below.
• Chile. In 2012, Chile consumed 10.4 million MT of coal with imports accounting for 97 percent of this consumption. In an effort to reduce the country’s reliance on coal imports, Chile approved the Mina Invierno coal mining project, which began production in 2013 and is expected to meet 30 percent of Chile’s domestic energy demand. It is estimated that 30 to 40 percent of the coal produced from Mina Invierno could be available for export to Asian and European markets. The mine produces thermal coal with similar characteristics as Usibelli coal.
• Japan. Domestic coal production in Japan ended in 2002 when it began importing all of its coal, primarily from Australia. The country had been the world’s largest coal importer for three decades until 2012 when China’s coal imports surpassed Japan’s. Coal consumption has been approximately 181.4 million MT since 2004. Utilization rates of Japan’s coal-fired power plants are greater than 80 percent, and capacity would be required before coal use for power can be substantially increased within the country. Over the 2020 to 2040 time frame, it is anticipated that demand for coal in the country will fall on average by 0.6 percent each year. Overall, Japanese demand for coal is projected to decline by 13.8 percent over the 2011 to 2040 period.
• South Korea. In 2012, South Korea was the third-largest importer of coal in the world, following China and Japan. It is estimated that coal demand will increase by 14.5 over the 2011 to 2040 period. However, in an effort to diversify national energy demand, South Korea implemented an import tax on coal in 2014. Currently, this tax is approximately $24 per MT for coal with a calorific value (CV) above 5,000 Net as Received (NAR), and $22 per MT of coal with a CV less than 5,000 NAR.
International Competition for CoalIndonesia is the world’s largest coal exporter, with 408 million MT of thermal coal and 2 million MT of coking coal exported in 2014. Australia is the second leading global exporter of coal with 195 million MT of thermal coal and 180 million MT of coking coal exports in 2014. Indonesia’s coal exports primarily serve Asian markets, with about 85 percent of total coal exports sent to China, Japan, South Korea, India, and Taiwan. In 2014, India became the largest importer of Indonesian coal. Japan was the destination for nearly 35 percent of Australia’s coal exports in 2013. China, Australia’s second-largest market for exported coal, held a 25 percent share and more than doubled its export levels from the two years prior. Other top markets included South Korea (14 percent), India (11 percent), and Taiwan (nine percent).
Trends and ProjectionsGlobal trade of coal grew dramatically from 2008 to 2013, but declined for the first time in 21 years in 2014. China and India accounted for 98 percent of the increase in world coal trade from 2008 to 2013, but declines in China’s import demand have led to declines in total world coal trade. The change in China’s import demand can be attributed to economic deceleration, industry restructuring, and new energy and environmental policies, which have slowed the growth of coal consumption. International thermal coal prices have fallen due to decreased demand and an existing oversupply in the coal market.
Over the next 20 years, global demand for coal is projected to increase by 0.8 percent a year, exhibiting the slowest growing demand for any fossil fuel. This is attributed to three factors: moderating and less energy intensive growth in China; the impact of regulation and policy on the use of coal in both the United States and China; and plentiful supplies of natural gas increasingly replacing coal from power generation.
40 Freight Traffic Study
Implications for the Seward Marine TerminalGiven current and projected market conditions, it is expected Alaska coal exports to Japan will likely continue at recent historical volumes. It is anticipated that Chile would substitute Alaska coal exports with their own domestic production over both the near and long term and that export opportunities to the country will remain limited. Furthermore, it is expected that coal export opportunities to South Korea will be restricted given the recent implementation of a coal import tax and the country’s plan for reduced reliance on coal as an energy source. In summary, without expansion into new markets or a shift in current and projected economic conditions in the global market, it is expected that Alaska coal exports through the SLF would be less than 150,000 MT per year for the foreseeable future.
The oil and natural gas industry dominates Alaska’s economy, and it is estimated that 50 percent of jobs in Alaska are related to the oil industry. Alaska has a very small manufacturing sector and virtually all producer and consumer goods must be imported into the state. As such, the oil and gas industry in Alaska has historically accounted for a significant proportion of imports (and exports in the form of crude oil). Oil and gas activity translates into increased imports of goods, which has positive implications on Southcentral Alaska ports.
The proposed Alaska LNG Project would require significant imports of materials during construction. Preliminary studies for the Alaska LNG Project identify eight Alaska ports as being potentially affected by the project’s transportation requirements—Anchorage, Seward, Whittier, Port MacKenzie, Nikiski, Valdez, Dutch Harbor, and Prudhoe Bay. In addition to using ports for transportation of goods, oil and gas companies also use port facilities for operational activities.
However, the price of Alaska North Slope crude oil most recently peaked in June of 2014 at $113 per barrel and has since fallen to $28 per barrel as of January 25, 2015 (2015 dollars). This has had a significant impact on oil and gas development in Alaska, with a number of projects being discontinued and production slowing from existing sites.
International Competition for Oil and GasOrganization of the Petroleum Exporting Countries (OPEC) member countries produce about 40 percent of the world’s crude oil and account for approximately 60 percent of the total petroleum traded internationally. Because of this market share, OPEC’s actions influence international oil prices. In particular, indications of changes in crude oil production from Saudi Arabia frequently affect oil prices. Saudi Arabia, the largest oil producer within OPEC and the world’s largest oil exporter, historically has had the greatest spare capacity. Saudi Arabia has usually kept more than 1.5 to 2 million barrels per day of spare capacity on hand for market management. On January 16, 2016, sanctions on Iran, another OPEC member country, were lifted. The country has expressed their intent to increase their oil production by 1.5 million barrels per day to a total output of 4.2 million barrels per day by the end of 2016.
As it relates to non-OPEC country oil production, United States domestic oil production increased from 6.8 million barrels per day in 2006 to nearly 11.6 million barrels per day by 2014. This surge in production was based in large part on technological advances in horizontal drilling and hydraulic fracturing in shale formations in the central United States. Furthermore, oil production from Canada also increased dramatically, growing from 3.2 million barrels per day in 2006 to 4.3 million barrels per day in 2014, which has been driven by bitumen and upgraded synthetic crude oil produced from the oil sands of Alberta. Canada had roughly 173 billion barrels of proved oil reserves at the beginning of 2015, ranking it third in the world.
Trends and ProjectionsWorld Bank projects oil as being in the $36 to $70 per barrel range over the 2016 to 2025 period. BP’s Energy Outlook projects that the demand for natural gas will grow fastest of the fossil fuels between 2015 and 2035, increasing by 1.9 percent a year, led by demand from Asia. Furthermore, BP anticipates the majority of the increase in traded gas will be met through LNG supplies and that production of LNG will increase by almost eight percent a year through the period to 2020.
4.4.2 Oil and Gas
41Freight Traffic Study
It is estimated the Alaska LNG Project will ship approximately 20 million tons of LNG per year beginning in 2024. Global demand for LNG is expected to increase by approximately 200 million tons between 2015 and 2025, and it is projected there will be a supply gap of approximately 60 million tons at that time.
Implications for the Seward Marine TerminalThe low price of oil will continue to have implications for oil company investment in Alaska. However, Seward’s existing businesses are not as reliant on the oil and gas sectors as other Southcentral ports, such as Anchorage, Whittier, and Valdez. The degree to which individual Seward businesses will be affected will ultimately depend largely on how much that specific business relies on the oil and gas industry. In general, it is anticipated that existing low oil prices will not have a dramatic effect on imports and exports in Seward.
If the Alaska LNG Project were constructed, the oil and gas industry would have a significant effect in Seward due to the planned construction needs of the project. The project is currently in the pre-front-end engineering and design (pre-FEED) process and, ultimately, the likelihood of its development will depend on the project sponsors.
There are currently six major mines operating in Alaska: Red Dog Mine, Fort Knox Mine, Greens Creek Mine, Pogo Mine, Kensington Mine, and the Usibelli Coal Mine. The Usibelli Coal Mine uses the SLF for export operations. In addition to coal, the SLF can be used to load ocean-going vessels with other materials such as rock, sand, gravel, and ore.
In addition to the six major mining operations, there are also over 120 active rock, sand, and gravel mining operations and more than 600 placer mining operations throughout the state. There are also many mining exploration projects underway including the Upper Kobuk Mineral Project (UKMP), Chuitna Coal Project, Wishbone Hill Project, Donlin Gold Project, Pebble Project, Livengood Project, Niblack Project, and a number of others.
International Competition for Mining ProductsAs a low per-unit value commodity, aggregate is typically mined and processed as close to the end user as possible. Generally, aggregate is not shipped more than 35 to 50 miles from the excavation site to end users.
Trends and ProjectionsIt is not anticipated that existing or proposed metal or mineral mines will have a significant effect on Port of Seward exports or imports. There is a potential market for aggregate materials such as rock, sand and gravel but there are a range of alternative sources within the state that are likely to be more cost effective than transporting aggregate materials from Seward.
Implications for the Seward Marine TerminalIt is not anticipated that the Port of Seward will see a significant increase in freight activity from existing mining operations or from the development of proposed metal and mineral mines. Similarly, there is the potential for a very limited market for aggregate, but this is uncertain owing to the range of alternative sources within the state.
The seafood industry is a major economic driver for Seward’s economy. The community is one of the top commercial fishing ports in Southcentral Alaska and one of the largest ports in the United States (as ranked by landed value). In 2014, Seward processors bought 52.4 million pounds of seafood worth $52.7 million, making it the 21st largest port in the United States by value. Based on historical Seward landing data trends, the poundage of fish landings in the community has increased by an average of 4.2 percent each year over the 2000 to 2014 period. It is estimated that the seafood industry supports an estimated 390 full-time equivalent (FTE) jobs in the community and nearly 19 percent of Seward’s working age residents were directly employed in the industry at some point in 2013.
4.4.3 Mining
4.4.4 Seafood
42 Freight Traffic Study
China is the primary export market for Alaska seafood. Most of the seafood products exported to China are re-processed and re-exported to the United States, Europe, Japan, or Brazil. However, the cost of processing in China has been increasing and secondary processing capacity has been expanded by some processors in the United States. It is anticipated that China’s domestic consumption will offer additional growth opportunities for the Alaska seafood industry given historical fish consumption and the recent emergence of a middle class in the country.
Exports to Brazil exhibited the greatest growth over the 2011 to 2014 period. In 2013, the Alaska Seafood Marketing Institute (ASMI) implemented a marketing program for the country. Frozen pink and chum salmon along with pollock fillets are the primary products exported to Brazil; however, many Brazilians use salted cod on a regular basis. Pacific cod is preferred by many consumers in Brazil for its whiter color. Export gains in Europe are mostly driven by pollock fillet exports to central Europe and increasing canned salmon exports to the United Kingdom.
In August of 2014, Russia enacted a ban on seafood imports from the United States, European Union, Canada, Australia, and Norway in response to United States sanctions against the Russian Federation for its involvement in the Ukraine war. Russia and Ukraine were notable markets for Alaskan roe, accounting for $46.6 million and $31.0 million of imports, respectively, in 2013.
International Competition for SeafoodGlobal fish production in 2011 was estimated at 154.0 million tons, of which 59 percent was caught wild and the remaining 41 percent was farmed. Norway and Chile are the leading global producers of farmed salmon. Farmed salmon production in Chile exhibited a noticeable decline between 2008 and 2010 due to an outbreak of infectious salmon anemia, but rebounded in 2011 and 2012.
Trends and ProjectionsSeafood consumption in China, Alaska’s leading export market, is projected to increase by 30.1 percent over the 2010 to 2030 period. Over this same time frame, North America consumption is anticipated to increase by 34.0 percent. Europe and Central Asia consumption is also projected to increase at a rate of 8.1 percent. Consumption of Japan and other East Asia and Pacific countries is projected to decrease at rates of 9.0 percent and 1.1 percent, respectively. Overall, the projection for global seafood consumption is positive at a 27.0 percent increase.
Implications for the Seward Marine TerminalIt is anticipated the seafood industry will continue to offer future growth opportunities for Seward. Global demand for seafood is projected to increase by 27.0 percent over the 2010 to 2030 period. Furthermore, increasing household incomes and the emergence of a middle class in China and Brazil should bolster seafood exports from Seward. Since pink salmon constitutes a large proportion of the fish processed in Seward, landings in Seward will continue to fluctuate dramatically on a year-to-year basis given the return cycle for pink salmon. Assuming historical landing trends are an indication of future landings, it is roughly approximated that Seward could anticipate landings on the order of 105 million pounds in 2035. However, shifts in the Alaska seafood market, such as the market for pollock, would provide year-round fishing opportunities in Seward. Seward is also in competition with other locations for seafood processing, including Kodiak and Valdez. Therefore, there is competition within the state of Alaska market. Any additional opportunities will be most likely created by consolidation of existing business activities rather than new competition.
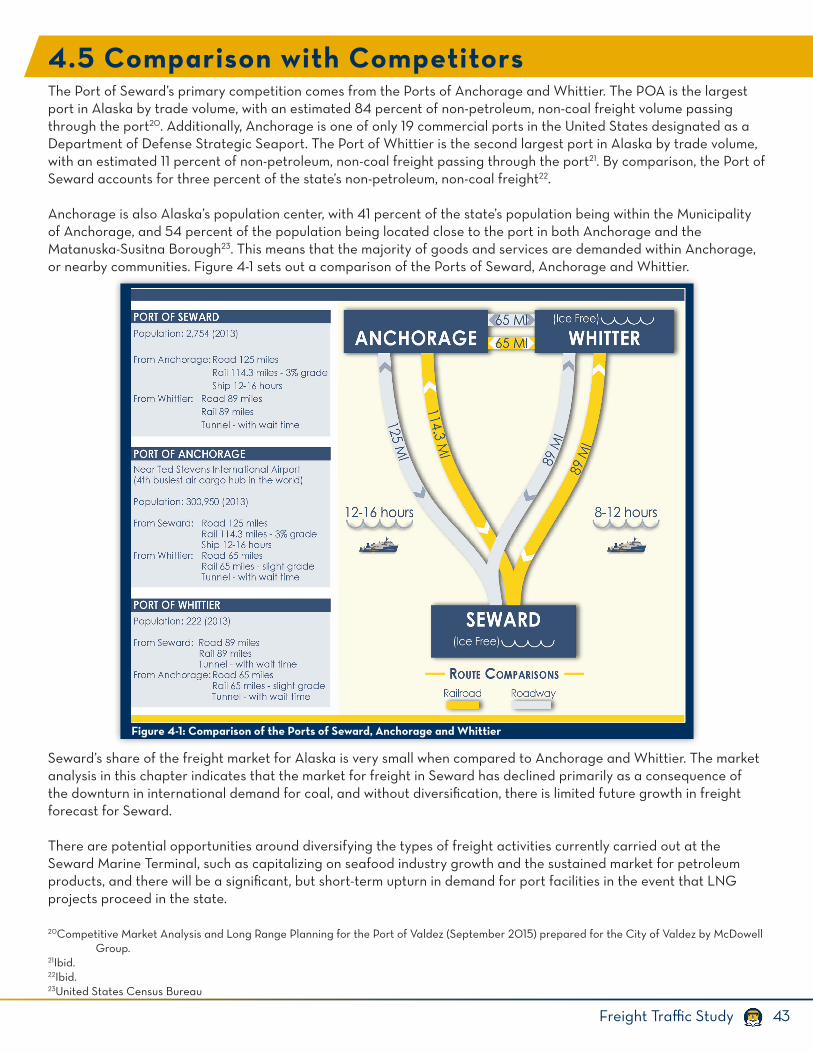
43Freight Traffic Study
The Port of Seward’s primary competition comes from the Ports of Anchorage and Whittier. The POA is the largest port in Alaska by trade volume, with an estimated 84 percent of non-petroleum, non-coal freight volume passing through the port20. Additionally, Anchorage is one of only 19 commercial ports in the United States designated as a Department of Defense Strategic Seaport. The Port of Whittier is the second largest port in Alaska by trade volume, with an estimated 11 percent of non-petroleum, non-coal freight passing through the port21. By comparison, the Port of Seward accounts for three percent of the state’s non-petroleum, non-coal freight22.
Anchorage is also Alaska’s population center, with 41 percent of the state’s population being within the Municipality of Anchorage, and 54 percent of the population being located close to the port in both Anchorage and the Matanuska-Susitna Borough23. This means that the majority of goods and services are demanded within Anchorage, or nearby communities. Figure 4-1 sets out a comparison of the Ports of Seward, Anchorage and Whittier.
Seward’s share of the freight market for Alaska is very small when compared to Anchorage and Whittier. The market analysis in this chapter indicates that the market for freight in Seward has declined primarily as a consequence of the downturn in international demand for coal, and without diversification, there is limited future growth in freight forecast for Seward.
There are potential opportunities around diversifying the types of freight activities currently carried out at the Seward Marine Terminal, such as capitalizing on seafood industry growth and the sustained market for petroleum products, and there will be a significant, but short-term upturn in demand for port facilities in the event that LNG projects proceed in the state.
4.5 Comparison with Competitors
Figure 4-1: Comparison of the Ports of Seward, Anchorage and Whittier
20Competitive Market Analysis and Long Range Planning for the Port of Valdez (September 2015) prepared for the City of Valdez by McDowell Group.21Ibid.22Ibid.23United States Census Bureau
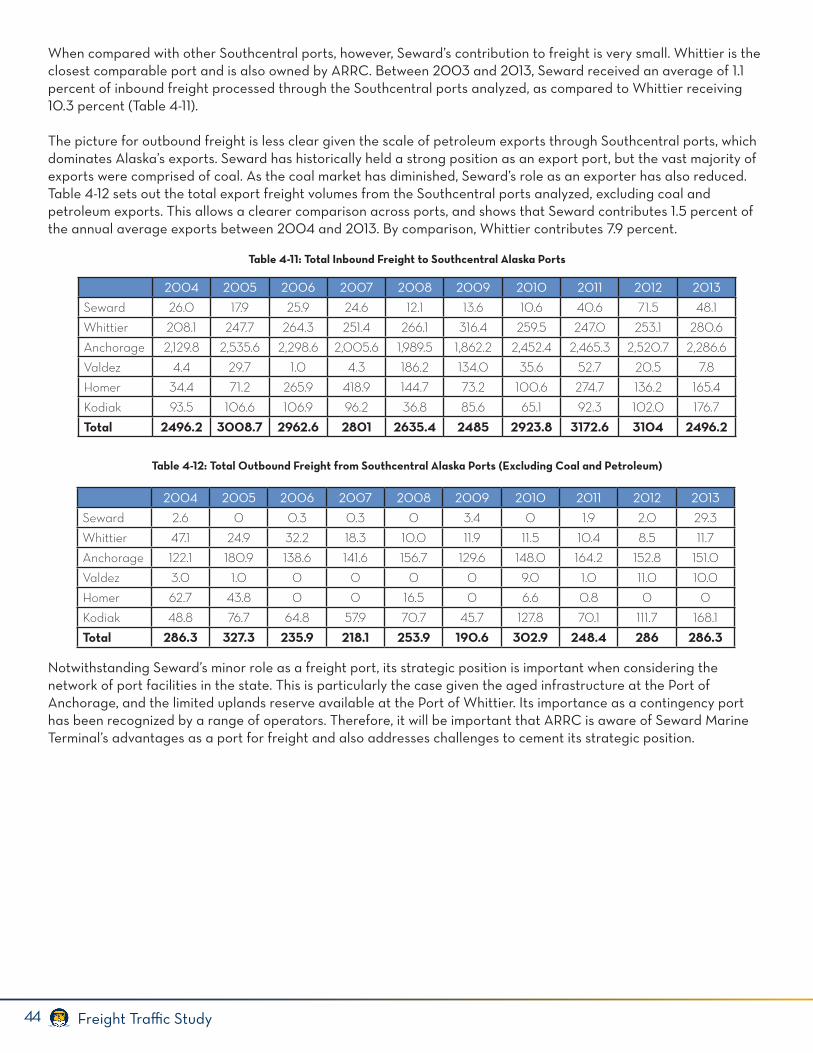
44 Freight Traffic Study
When compared with other Southcentral ports, however, Seward’s contribution to freight is very small. Whittier is the closest comparable port and is also owned by ARRC. Between 2003 and 2013, Seward received an average of 1.1 percent of inbound freight processed through the Southcentral ports analyzed, as compared to Whittier receiving 10.3 percent (Table 4-11).
The picture for outbound freight is less clear given the scale of petroleum exports through Southcentral ports, which dominates Alaska’s exports. Seward has historically held a strong position as an export port, but the vast majority of exports were comprised of coal. As the coal market has diminished, Seward’s role as an exporter has also reduced. Table 4-12 sets out the total export freight volumes from the Southcentral ports analyzed, excluding coal and petroleum exports. This allows a clearer comparison across ports, and shows that Seward contributes 1.5 percent of the annual average exports between 2004 and 2013. By comparison, Whittier contributes 7.9 percent.
Notwithstanding Seward’s minor role as a freight port, its strategic position is important when considering the network of port facilities in the state. This is particularly the case given the aged infrastructure at the Port of Anchorage, and the limited uplands reserve available at the Port of Whittier. Its importance as a contingency port has been recognized by a range of operators. Therefore, it will be important that ARRC is aware of Seward Marine Terminal’s advantages as a port for freight and also addresses challenges to cement its strategic position.
2004 2005 2006 2007 2008 2009 2010 2011 2012 2013
Seward 26.0 17.9 25.9 24.6 12.1 13.6 10.6 40.6 71.5 48.1
Whittier 208.1 247.7 264.3 251.4 266.1 316.4 259.5 247.0 253.1 280.6
Anchorage 2,129.8 2,535.6 2,298.6 2,005.6 1,989.5 1,862.2 2,452.4 2,465.3 2,520.7 2,286.6
Valdez 4.4 29.7 1.0 4.3 186.2 134.0 35.6 52.7 20.5 7.8
Homer 34.4 71.2 265.9 418.9 144.7 73.2 100.6 274.7 136.2 165.4
Kodiak 93.5 106.6 106.9 96.2 36.8 85.6 65.1 92.3 102.0 176.7
Total 2496.2 3008.7 2962.6 2801 2635.4 2485 2923.8 3172.6 3104 2496.2
Table 4-11: Total Inbound Freight to Southcentral Alaska Ports
2004 2005 2006 2007 2008 2009 2010 2011 2012 2013
Seward 2.6 0 0.3 0.3 0 3.4 0 1.9 2.0 29.3
Whittier 47.1 24.9 32.2 18.3 10.0 11.9 11.5 10.4 8.5 11.7
Anchorage 122.1 180.9 138.6 141.6 156.7 129.6 148.0 164.2 152.8 151.0
Valdez 3.0 1.0 0 0 0 0 9.0 1.0 11.0 10.0
Homer 62.7 43.8 0 0 16.5 0 6.6 0.8 0 0
Kodiak 48.8 76.7 64.8 57.9 70.7 45.7 127.8 70.1 111.7 168.1
Total 286.3 327.3 235.9 218.1 253.9 190.6 302.9 248.4 286 286.3
Table 4-12: Total Outbound Freight from Southcentral Alaska Ports (Excluding Coal and Petroleum)

45Freight Traffic Study
• A natural, ice-free year round deep water port.• Provides efficient access directly to rail on the freight dock and out of Seward Marine Terminal to the Alaska
Railbelt.• Provides efficient road access directly to the Seward Highway.• Large laydown areas are available and extensive uplands provide a range of opportunities for freight leases
and permits.• Close proximity to the City of Seward, while still being physically separated from the city’s major attractions.• Marine freight destined for Seward and north can save 12 to 16 hours on the water by landing at Seward as
compared to Anchorage.• Port facilities and freight dock are in generally good condition.• Seward has an established commercial fishing fleet and processors, which provide opportunities to capitalize
on seafood freight.• Although Seward is much smaller than POA, its competitive position is strengthened by the area of
land available at the port, the SMIC being located nearby, and companies like TOTE Maritime formally designating Seward as a contingency port.
• Seward has an open stevedoring arrangement, which can generate cost efficiencies for freight operators utilizing the port.
• Shippers are time and cost sensitive. It is generally less expensive to transport goods directly to the main center of demand at Anchorage, notwithstanding the additional time it takes. This is owing to the costs of transport being lower.
• Seward is located 125 miles by road and 114 miles by rail from Anchorage, the main center of population and distribution.
• The railroad experiences a three percent grade transition between Seward and Anchorage, which requires additional locomotives to successfully transport freight loads.
• The Seward Highway can have high traffic volumes, particularly during the summer months, which can generate delays for freight traffic by truck.
• Some improvements to the facility are needed to enhance its attractiveness; including improving the surface of the freight dock, addressing safety issues with the fendering, and ensuring consistent provision of support infrastructure.
• Dockage and wharfage rates for Seward are about the same as Anchorage and Whittier, and therefore, no cost advantage can be gained by bringing goods to Seward.
• The size of the military operation at JBER, coupled with the special designation of the POA as having strategic importance to the Department of Defense, results in Anchorage serving as the primary port for military shipments.
4.6.2 Seward’s Economic Challenges
4.6 What are Seward’s Economic Advantages and Challenges?
4.6.1 Seward’s Economic Advantages

This page left intentionally blank.
47Freight Traffic Study
5. What are the Issues?
Seward’s freight volume has historically been dominated by coal. With the global downturn in coal demand, Seward’s position as a freight port is relatively weak. The global coal market currently has a net oversupply of resource and this situation is anticipated to remain for the next several years. The SLF is currently shut down, and on the basis of the global coal market, this situation appears unlikely to change in the next several years.
Between the years 2004 and 2013, Seward received an average of 1.1 percent of the total inbound freight volumes received in Southcentral Alaska (volumes comprised of total inbound commodities to Seward, Whittier, Anchorage, Valdez, Homer and Kodiak). As a direct comparison, Whittier received an average of 10.3 percent of the total inbound freight volume for the same time period. With coal removed from the analysis, between the years 2004 and 2013, Seward exported an average of 1.5 percent of the total outbound freight volumes received in Southcentral Alaska. By comparison, Whittier exported an average of 7.9 percent of the total outbound freight volume for the same time period.
The ARRC maintains assets at both the ports of Whittier and Seward. With the exclusion of coal, Whittier has historically handled several orders of magnitude more freight through its port facility than Seward. This study focuses on making recommendations for improvements at Seward, but in order to understand whether these investments are truly necessary or valuable, the contribution that Seward makes to regional freight activities should also consider in the Port of Whittier. This type of analysis should consider all of ARRC’s port assets and conditions, and then make recommendations for improvements at both facilities rather than simply considering Seward in isolation. In this way, ARRC can determine where best to make investments to support its freight business to support business growth and regional demands.
Following the review of existing conditions and facilities, stakeholder outreach and market analysis, issues were identified for all of the Seward Marine Terminal activities, which are discussed below.
The following issues were identified with freight train services to Seward.• There are currently no scheduled freight train services to Seward. Trains are built on an as-booked, as-
needed basis with the construct being as sought by the customer.• Prior to 2015, there were regular coal trains running between the Usibelli Coal Mine and Seward. These
trains provided the opportunity for other freight customers to attach freight cars. With the ceasing of the regular coal freight trains, other freight customers need to either commission their own train from ARRC or transport freight from Seward by truck.
• Lack of availability of freight cars can result in loads sitting in Seward for an extended period of time.• Trains going north from Seward must traverse a three percent grade, which requires one or more
additional locomotives to transport heavy freight loads. By comparison, trains traveling from Whittier to Anchorage encounter slight grades and only two locomotives are required for a fully loaded train.
5.1 Future of Freight for Alaska Railroad Corporation
5.2 Issues at Seward Marine Terminal
5.2.1 Train Services
48 Freight Traffic Study
• The cost of transporting freight by train from Seward to all communities along the rail belt, except Moose Pass, is higher than for the Ports of Whittier and Anchorage. The higher cost of rail shipping from Seward is attributable to the gain in elevation required for trains departing from Seward, which means more locomotives are required to power the trains, and Seward being located a further distance away from the majority of the destinations on the rail belt than Whittier and Anchorage.
The following issues were identified with the freight dock.• The dock is currently too short to accommodate larger barges or multiple barges. The berthing
configuration also limits the ability for multiple vessels to berth at the dock simultaneously.• The dock is currently too narrow to accommodate RO/RO ramps for larger vessels and to allow freight to
be staged from multiple barges before being transported by truck or rail.• Secure cargo storage and staging space is very limited.• The barge basin has been accumulating sediment from the shifting of the Resurrection River. Barge
services cannot currently use the basin, and therefore, need to use the freight dock berth.• The current fender configuration allows only one barge at a time and will need to be reconfigured if the
dock is expanded to facilitate simultaneous use. This is owing to the location of the keys (removable bull rail).
• Fenders are too large for most barge operations. The standoff distance from the dock makes pass-pass operations and direct load to rail difficult. In addition, the location of the freight dock tracks next to the dock face works for unloading pipeline from ships, but cranes or machinery required for handling other types of freight prevents flat cars from being loaded while on these tracks.
• The offset between the existing ladders and vessels is considered to be unsafe by many stakeholders. The ladders are regularly damaged by vessel impact due to their current location. The preferred ladder configuration is in the center of the fender, similar to those present on the passenger dock.
• The current front RO/RO access is difficult to use owing to the pitch/angle of the shoreline with the riprap, which angles the ramps during the tides and makes it not useful during low tide. A notch for a ramp in the dock would allow smaller barges to access the dock for RO/RO operations at all tide levels.
• The gravel working surface on the freight dock has a high fines content which causes track movement due to the freeze-thaw cycle. A cleanout of blocked flangeways with track maintenance equipment is required each time the tracks are to be used.
• Weight restrictions for the tracks on the freight dock creates limitations on the type of freight that can be loaded and unloaded.
The following issues were identified with the SLF.• The market for coal has declined substantially over the last two years, and currently the SLF is in cold
storage owing to a lack of demand for coal in 2017. The economic analysis has concluded that demand for coal will remain low in the foreseeable future.
• Significant maintenance will be required to bring the facility back into service.• There is the potential to decommission the facility due to escalating maintenance costs and diminishing
demand for coal.• The dock currently has limited vehicle access.• Larger ships moored at the dock can interfere with cruise ship access to the passenger dock.• The existing support buildings are in relatively poor condition with leaks and structural degradation.• The ground quality of the uplands area is unknown with the potential for impacts from coal and
petroleum based products.• There has been some concern voiced by the public about fugitive dust, but analysis has been inconclusive.• Site drainage is problematic during heavy rain.
5.2.2 Freight Dock
5.2.3 Seward Loading Facility
49Freight Traffic Study
The following issues were identified with the permit area located inside the freight dock fence.• Distributed utilities are not present currently in this part of the site and stakeholders have noted a
shortage of space for office facilities. Current lighting is insufficient for laydown work during winter months.
• Areas permitted for laydown inside the freight dock fence prevents use of this half of the freight dock tracks for loading and unloading.
The following issues were identified with the permit area located outside the freight dock fence. • Utilities are not distributed throughout this zone with grid power being the only distributed system to the
freight building. Stakeholders have also noted a shortage of space for office facilities. Current lighting is insufficient for laydown work during winter months.
• Security concerns have been raised by a range of stakeholders including people trespassing into the area for bird watching and others starting bonfires and drinking in the area.
• The at-grade crossing at Port Avenue is in poor condition and creates problems for fork lifts and other equipment.
• Signage at the at-grade crossing is considered to be inadequate and confusing by stakeholders. It is noted that further signage was installed during the summer of 2016 to clarify the restrictions on access to the area.
• A number of freight permit holders noted the need for restrooms and other facilities for their use in the permit area.
The following issues were identified with the new laydown area.• This area is not currently available for use as it is under development. The area requires filling and
compaction prior to use.
The following issues were identified with the freight building.• The well house structure is poorly constructed and insulated. Site drainage appears to drain into the building
causing further degradation, freezing and other issues.• One stakeholder expressed a desire for a large, self-funded shop where the freight building is located
currently. A long-term lease on this area would incentivize this plan.
The following issues were identified with the railyard.• The tie condition has deteriorated through much of the railyard and a significant portion of the ties are
nearing the end of their life. There is no capital program for tie replacement currently, and only essential maintenance replacement is being conducted.
• The at-grade crossings south of Port Avenue prevent long strings of cars from being positioned and loaded and unloaded close to the dock, which results in inefficiencies for freight handling and requires frequently repositioning and switching. Waiting for crews to perform frequent switching leads to additional delays.
• The at-grade crossing at Port Avenue is in poor condition and has a high grade differential over a short distance. This creates problems for fork lifts, trucks and other equipment.
• Tracks on the passenger dock are no longer used due to weight limitations on the dock. This limits the length of track available for passenger trains, which can block the Port Avenue crossing. The location of the passenger dock tracks at the end of the railyard, combined with the limited length of available track, occasionally results in freight trains being pushed toward passenger trains, which is not considered ideal but is also not a significant risk.
• Tracks #3, #4 and #5 are jointed 70 lb/yd rail, which restricts their use for heavy freight loads. The remainder of the rail at the Seward Marine Terminal is jointed 115 pound/yard (lb/yd).
5.2.4 Permit Area Inside the Dock Fence
5.2.5 Permit Area Outside the Dock Fence
5.2.6 New Laydown Area
5.2.7 Freight Building
5.2.7 Railyard

This page left intentionally blank.
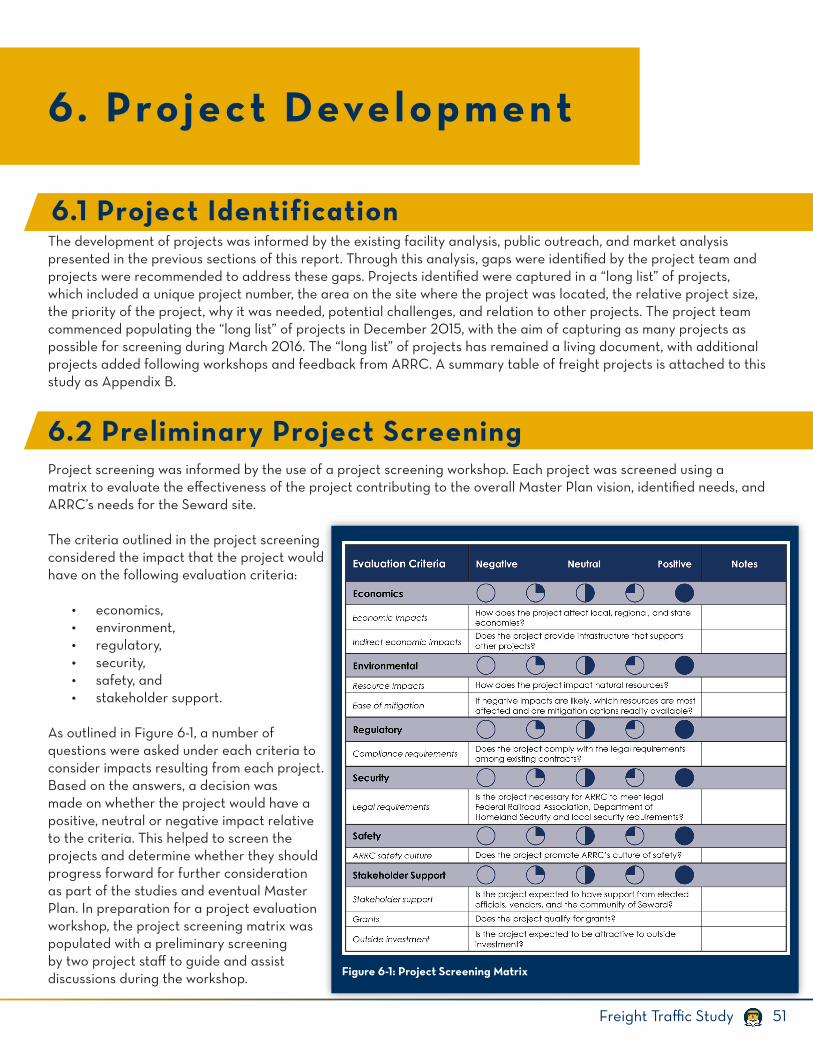
51Freight Traffic Study
6. Project Development
The development of projects was informed by the existing facility analysis, public outreach, and market analysis presented in the previous sections of this report. Through this analysis, gaps were identified by the project team and projects were recommended to address these gaps. Projects identified were captured in a “long list” of projects, which included a unique project number, the area on the site where the project was located, the relative project size, the priority of the project, why it was needed, potential challenges, and relation to other projects. The project team commenced populating the “long list” of projects in December 2015, with the aim of capturing as many projects as possible for screening during March 2016. The “long list” of projects has remained a living document, with additional projects added following workshops and feedback from ARRC. A summary table of freight projects is attached to this study as Appendix B.
Project screening was informed by the use of a project screening workshop. Each project was screened using a matrix to evaluate the effectiveness of the project contributing to the overall Master Plan vision, identified needs, and ARRC’s needs for the Seward site.
The criteria outlined in the project screening considered the impact that the project would have on the following evaluation criteria:
• economics,• environment,• regulatory,• security,• safety, and• stakeholder support.
As outlined in Figure 6-1, a number of questions were asked under each criteria to consider impacts resulting from each project. Based on the answers, a decision was made on whether the project would have a positive, neutral or negative impact relative to the criteria. This helped to screen the projects and determine whether they should progress forward for further consideration as part of the studies and eventual Master Plan. In preparation for a project evaluation workshop, the project screening matrix was populated with a preliminary screening by two project staff to guide and assist discussions during the workshop.
6.2 Preliminary Project Screening
Figure 6-1: Project Screening Matrix
6.1 Project Identification
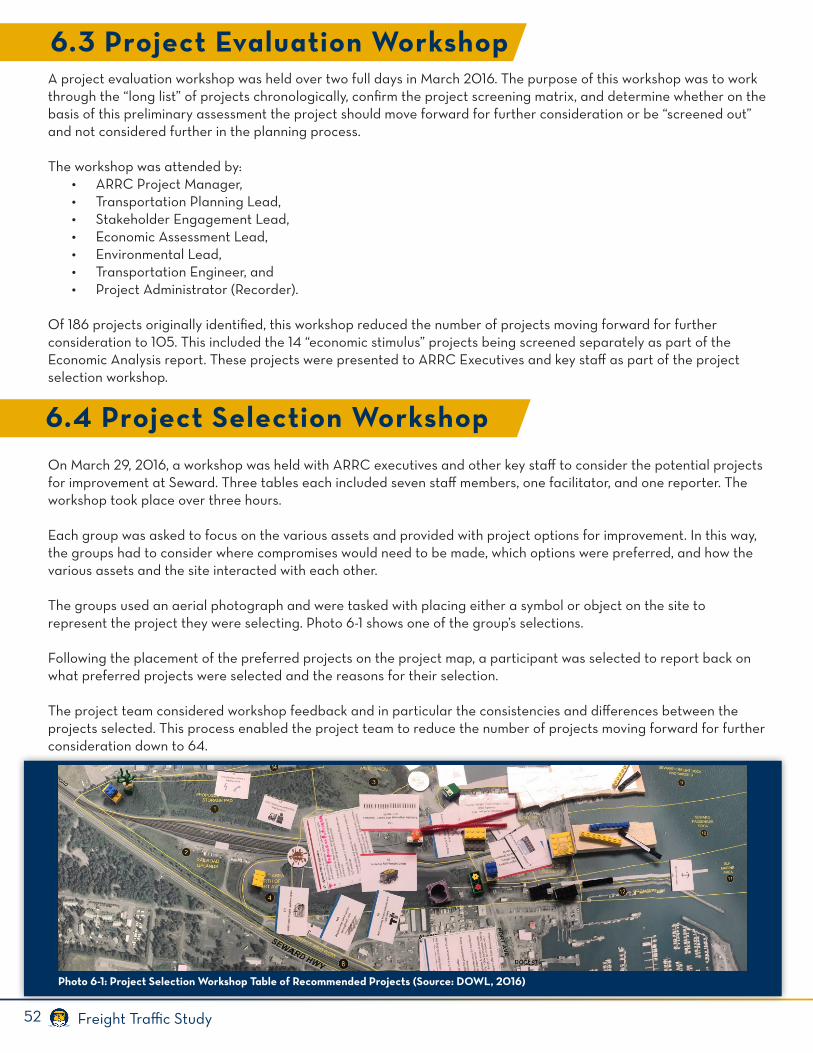
52 Freight Traffic Study
A project evaluation workshop was held over two full days in March 2016. The purpose of this workshop was to work through the “long list” of projects chronologically, confirm the project screening matrix, and determine whether on the basis of this preliminary assessment the project should move forward for further consideration or be “screened out” and not considered further in the planning process.
The workshop was attended by:• ARRC Project Manager,• Transportation Planning Lead,• Stakeholder Engagement Lead,• Economic Assessment Lead,• Environmental Lead,• Transportation Engineer, and• Project Administrator (Recorder).
Of 186 projects originally identified, this workshop reduced the number of projects moving forward for further consideration to 105. This included the 14 “economic stimulus” projects being screened separately as part of the Economic Analysis report. These projects were presented to ARRC Executives and key staff as part of the project selection workshop.
On March 29, 2016, a workshop was held with ARRC executives and other key staff to consider the potential projects for improvement at Seward. Three tables each included seven staff members, one facilitator, and one reporter. The workshop took place over three hours.
Each group was asked to focus on the various assets and provided with project options for improvement. In this way, the groups had to consider where compromises would need to be made, which options were preferred, and how the various assets and the site interacted with each other.
The groups used an aerial photograph and were tasked with placing either a symbol or object on the site to represent the project they were selecting. Photo 6-1 shows one of the group’s selections.
Following the placement of the preferred projects on the project map, a participant was selected to report back on what preferred projects were selected and the reasons for their selection.
The project team considered workshop feedback and in particular the consistencies and differences between the projects selected. This process enabled the project team to reduce the number of projects moving forward for further consideration down to 64.
6.3 Project Evaluation Workshop
6.4 Project Selection Workshop
Photo 6-1: Project Selection Workshop Table of Recommended Projects (Source: DOWL, 2016)
53Freight Traffic Study
Concurrent with the project identification and screening process, the Economic Analysis Report considered 14 projects to increase the use, value, and return of the existing real estate at the Seward Marine Terminal. The projects considered by the Economic Analysis were:
• retail space,• seafood processor,• office space,• dedicated laydown area,• loading facility,• day-trip passenger services,• refined fuel distributor,• offseason moorage,• marine repair and maintenance,• vessel storage,• cannabis grow operation and warehouse,• seafood cold storage and freezer space,• hotel operation, and• housing development.
These projects were considered in detail in the Economic Analysis report. Following project screening, seven projects were recommended for further consideration. Of these projects, four provided services and facilities that aligned with the freight activities on the site, and therefore have been considered as real estate stimulus projects in the Freight Traffic Study. These projects are laydown area, refined fuel distributor, marine repair and maintenance facility, and seafood processing. These projects are addressed in further detail in Section 7 of this report.
Following the project selection workshop and the results of the Economic Analysis, further analysis was undertaken to refine the projects being considered. This included considering what improvements could occur to projects, and also whether some smaller projects could be combined as optional additions to larger projects. An example of this is the addition of water service to both the passenger and freight dock. This further reduced the number of projects down to 38, which were presented at the Cornerstone Review Workshop.
A cornerstone review workshop was held on July 20, 2016, and comprised a presentation of projects to the ARRC Executive Group. Projects were presented as a four-part workshop, comprising of passenger projects, freight projects, real estate projects, and infrastructure projects.
It became immediately apparent during the workshop that the costs of the passenger dock and terminal replacement were the most significant items for consideration. ARRC Executives provided feedback that the costs of the passenger dock replacement in particular were substantially higher than what was expected, and that further work would be required to identify lower cost options. The project team was asked to focus on passenger dock and terminal replacement options, and to hold a further workshop to consider these at the conclusion of option development. One of these options includes accommodating cruise ships on the freight dock.
6.5 Economic Analysis – Real Estate Stimulus Projects
6.6 Project Refinement
6.7 Cornerstone Review Workshop
54 Freight Traffic Study
The revised terminal and passenger dock replacement options were presented to ARRC Executives on October 3, 2016. Feedback was received during this presentation that the costs of the replacement options were still a significant barrier, and the team was again asked to consider whether there were further options available to decrease the costs of these projects.
As part of the presentation a discussion was held on the project approach. It was intended that the cornerstone review workshop and terminal and dock presentation would result in a single preferred option being selected for advancement as part of the Seward Marine Terminal Expansion Master Plan. However, as the costs of the projects were considerably higher than intended and funding to support advancing the projects was not currently available, ARRC requested that a revised approach by taken to the presentation of projects in the Master Plan.
The revised approach involves identifying improvements, and a range of options to enable the improvements. In this way, ARRC can select the preferred option at the time the improvement is required, dependent on identified need, cost, and availability of funding to undertake the improvement project. This is the approach that has been taken in the identification of freight traffic facility project options, as set out in Section 7.
6.8 Terminal and Dock Option Presentation
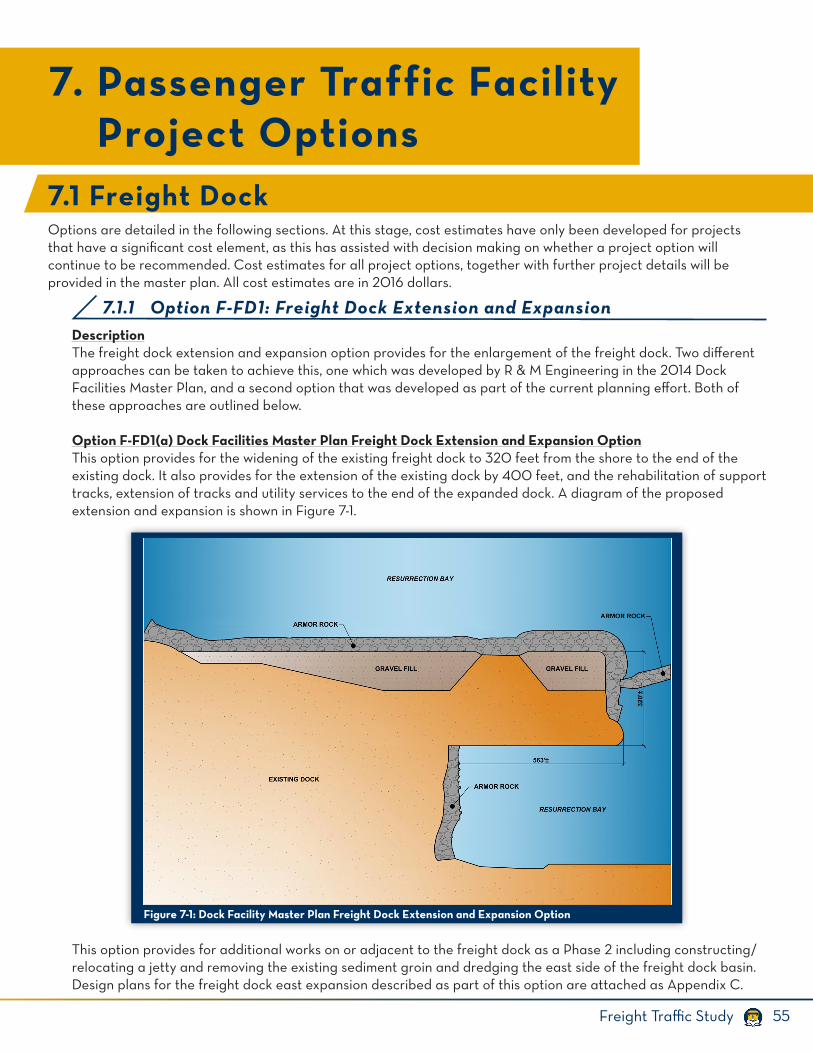
55Freight Traffic Study
Options are detailed in the following sections. At this stage, cost estimates have only been developed for projects that have a significant cost element, as this has assisted with decision making on whether a project option will continue to be recommended. Cost estimates for all project options, together with further project details will be provided in the master plan. All cost estimates are in 2016 dollars.
DescriptionThe freight dock extension and expansion option provides for the enlargement of the freight dock. Two different approaches can be taken to achieve this, one which was developed by R & M Engineering in the 2014 Dock Facilities Master Plan, and a second option that was developed as part of the current planning effort. Both of these approaches are outlined below.
Option F-FD1(a) Dock Facilities Master Plan Freight Dock Extension and Expansion OptionThis option provides for the widening of the existing freight dock to 320 feet from the shore to the end of the existing dock. It also provides for the extension of the existing dock by 400 feet, and the rehabilitation of support tracks, extension of tracks and utility services to the end of the expanded dock. A diagram of the proposed extension and expansion is shown in Figure 7-1.
This option provides for additional works on or adjacent to the freight dock as a Phase 2 including constructing/relocating a jetty and removing the existing sediment groin and dredging the east side of the freight dock basin. Design plans for the freight dock east expansion described as part of this option are attached as Appendix C.
7. Passenger Traffic Facility Project Options
7.1.1 Option F-FD1: Freight Dock Extension and Expansion
Figure 7-1: Dock Facility Master Plan Freight Dock Extension and Expansion Option
7.1 Freight Dock
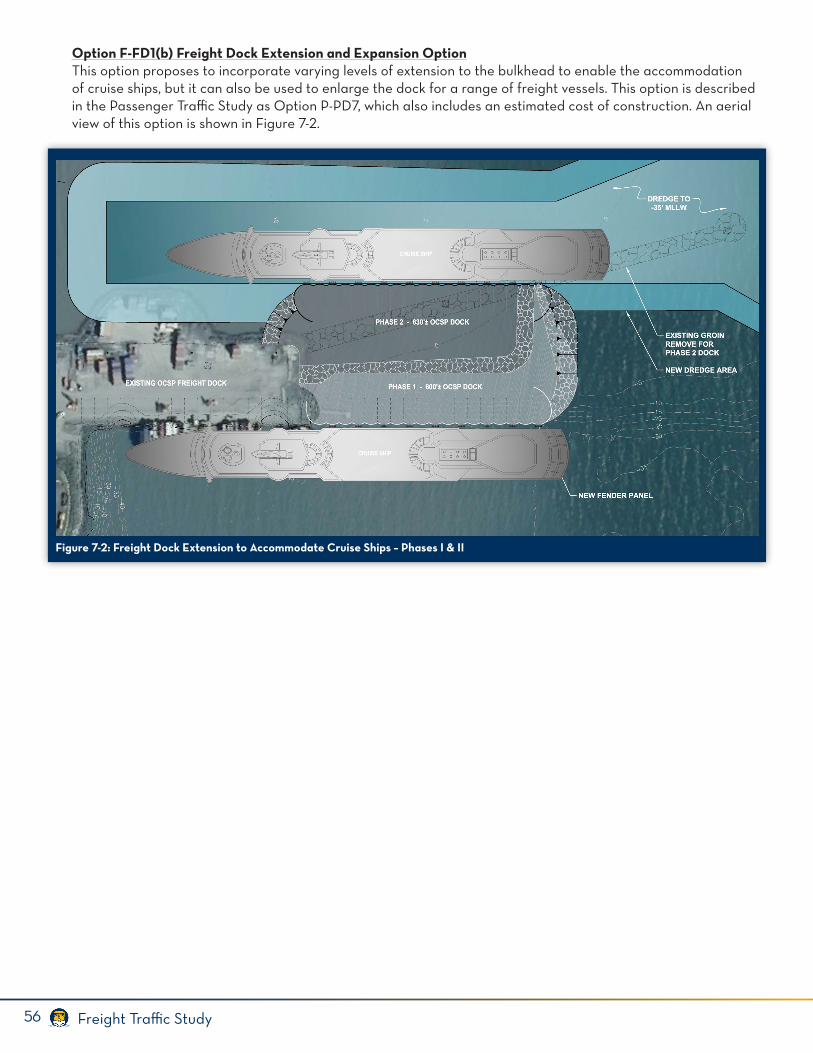
56 Freight Traffic Study
Option F-FD1(b) Freight Dock Extension and Expansion OptionThis option proposes to incorporate varying levels of extension to the bulkhead to enable the accommodation of cruise ships, but it can also be used to enlarge the dock for a range of freight vessels. This option is described in the Passenger Traffic Study as Option P-PD7, which also includes an estimated cost of construction. An aerial view of this option is shown in Figure 7-2.
Figure 7-2: Freight Dock Extension to Accommodate Cruise Ships – Phases I & II
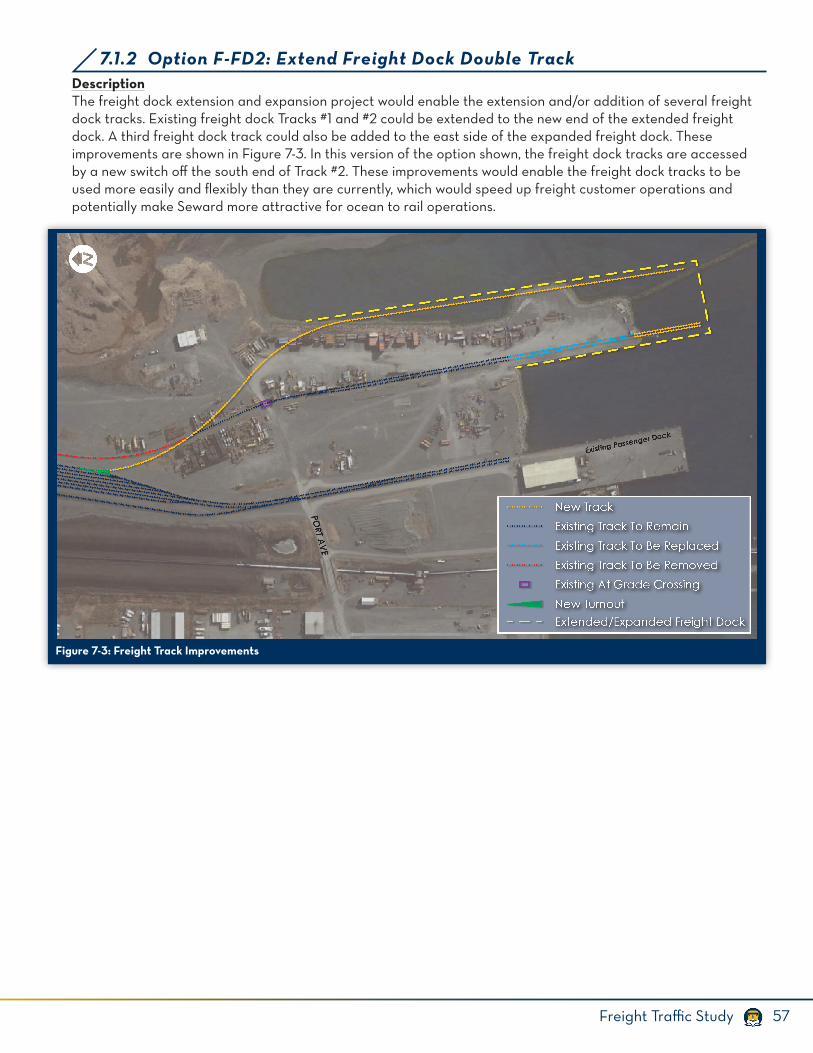
57Freight Traffic Study
DescriptionThe freight dock extension and expansion project would enable the extension and/or addition of several freight dock tracks. Existing freight dock Tracks #1 and #2 could be extended to the new end of the extended freight dock. A third freight dock track could also be added to the east side of the expanded freight dock. These improvements are shown in Figure 7-3. In this version of the option shown, the freight dock tracks are accessed by a new switch off the south end of Track #2. These improvements would enable the freight dock tracks to be used more easily and flexibly than they are currently, which would speed up freight customer operations and potentially make Seward more attractive for ocean to rail operations.
7.1.2 Option F-FD2: Extend Freight Dock Double Track
Figure 7-3: Freight Track Improvements
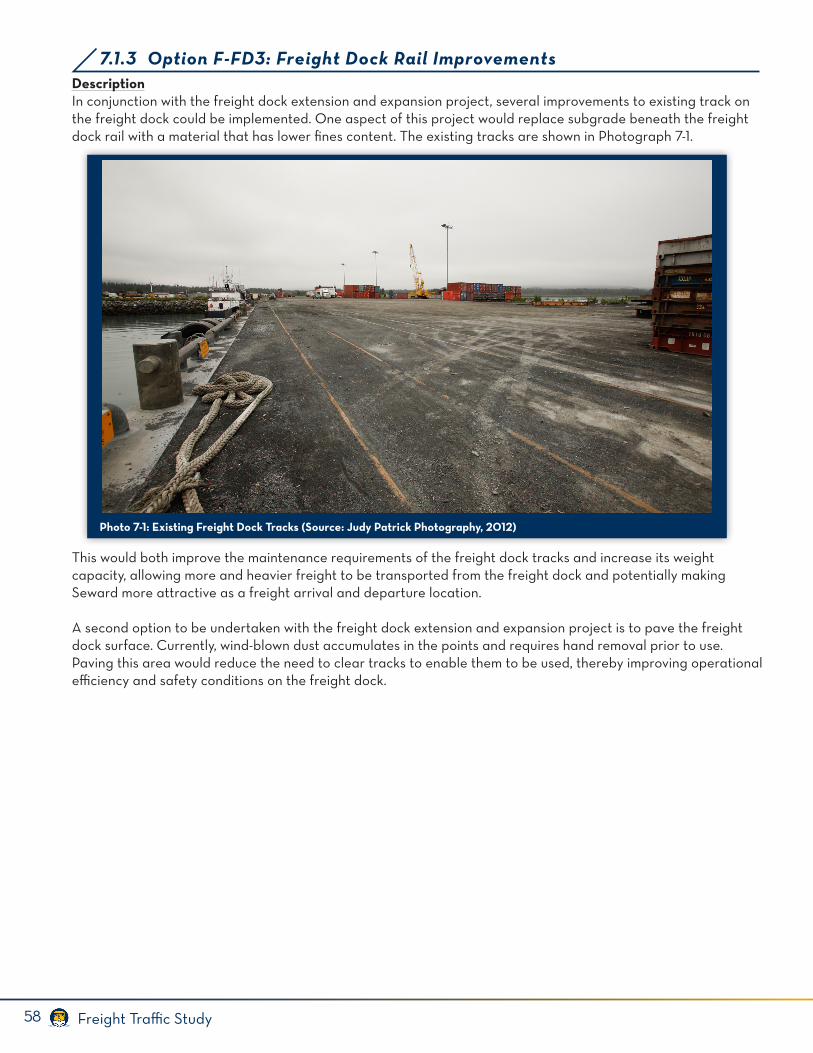
58 Freight Traffic Study
DescriptionIn conjunction with the freight dock extension and expansion project, several improvements to existing track on the freight dock could be implemented. One aspect of this project would replace subgrade beneath the freight dock rail with a material that has lower fines content. The existing tracks are shown in Photograph 7-1.
This would both improve the maintenance requirements of the freight dock tracks and increase its weight capacity, allowing more and heavier freight to be transported from the freight dock and potentially making Seward more attractive as a freight arrival and departure location.
A second option to be undertaken with the freight dock extension and expansion project is to pave the freight dock surface. Currently, wind-blown dust accumulates in the points and requires hand removal prior to use. Paving this area would reduce the need to clear tracks to enable them to be used, thereby improving operational efficiency and safety conditions on the freight dock.
7.1.3 Option F-FD3: Freight Dock Rail Improvements
Photo 7-1: Existing Freight Dock Tracks (Source: Judy Patrick Photography, 2012)
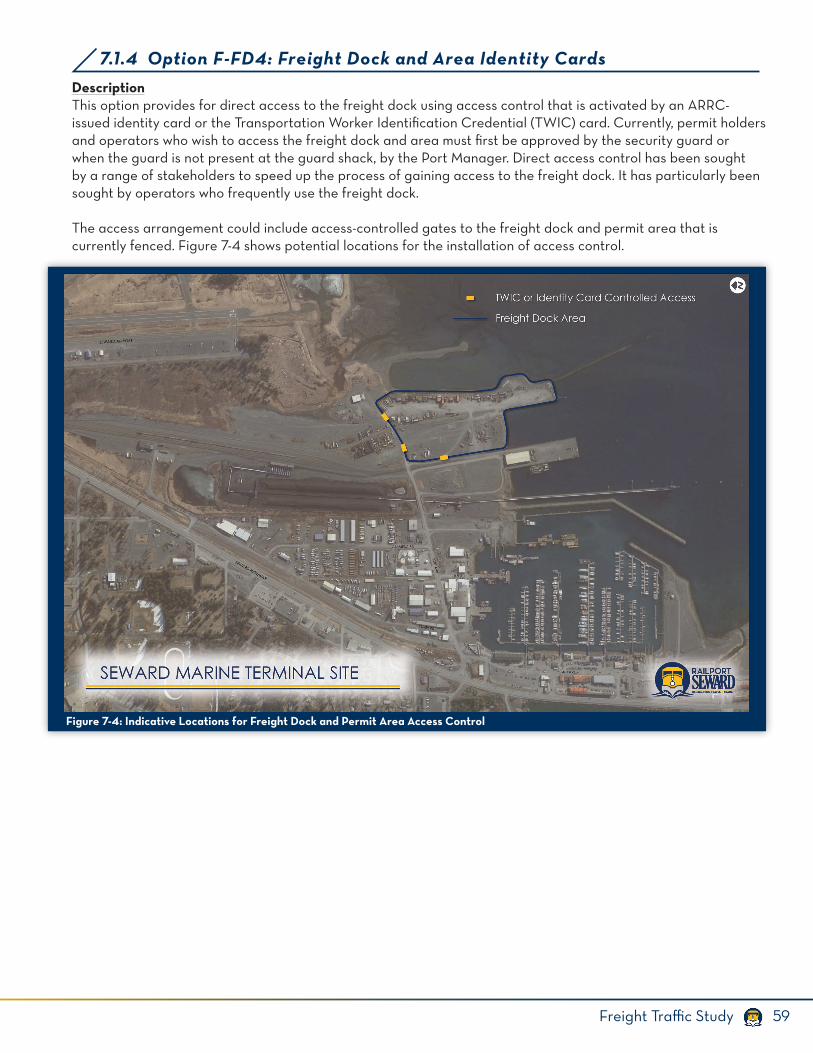
59Freight Traffic Study
DescriptionThis option provides for direct access to the freight dock using access control that is activated by an ARRC-issued identity card or the Transportation Worker Identification Credential (TWIC) card. Currently, permit holders and operators who wish to access the freight dock and area must first be approved by the security guard or when the guard is not present at the guard shack, by the Port Manager. Direct access control has been sought by a range of stakeholders to speed up the process of gaining access to the freight dock. It has particularly been sought by operators who frequently use the freight dock.
The access arrangement could include access-controlled gates to the freight dock and permit area that is currently fenced. Figure 7-4 shows potential locations for the installation of access control.
7.1.4 Option F-FD4: Freight Dock and Area Identity Cards
Figure 7-4: Indicative Locations for Freight Dock and Permit Area Access Control
60 Freight Traffic Study
DescriptionThis option provides for the addition of fuel lines to the SLF dock to convert it into a marine fuel terminal. Potential lines considered include gasoline, Ultra Low Sulfur Diesel (ULSD), JP-8, Jet A and Water. The project assumes storage tanks would be located near the current coal stockpile with pipelines running underneath Port Avenue and the associated pedestrian bridge out to the SLF dock trestle. It was assumed that the pipe size would be six inches to ten inches in diameter and constrained to the SLF dock’s current configuration with the conveyer left in place. The best location for the new pipelines would be below the existing trestle (Figure 7-5). Pipelines would be supported between the DBL HP 24x89 Pile Caps horizontal support members at midspan between pile bents.
Preliminary research of this option has concluded that converting the SLF into a marine fuel terminal is feasible. Few dock modifications would be required for the addition of a pipeline and the current configuration of the dock would provide adequate support and clear space for the fuel pipelines (Figure 7-6). The current facility is designed for larger vessel access (i.e. 600 to 800 feet in length). Smaller, barge size vessels will require some adjustment and modification to the existing fendering system for safe operation.
7.2.1 Option F-SL1: Water Line – Seward Loading Facility Dock
7.2 Seward Loading Facility
DescriptionThis option provides for the addition of water lines to the SLF dock for a range of uses. Preliminary research has been carried out, which has concluded that sufficient space is available for the addition of a water line. This option can be incorporated into any dock conversion option selection if required.
7.2.2 Option F-SL2: Fuel Lines – Seward Loading Facility Dock
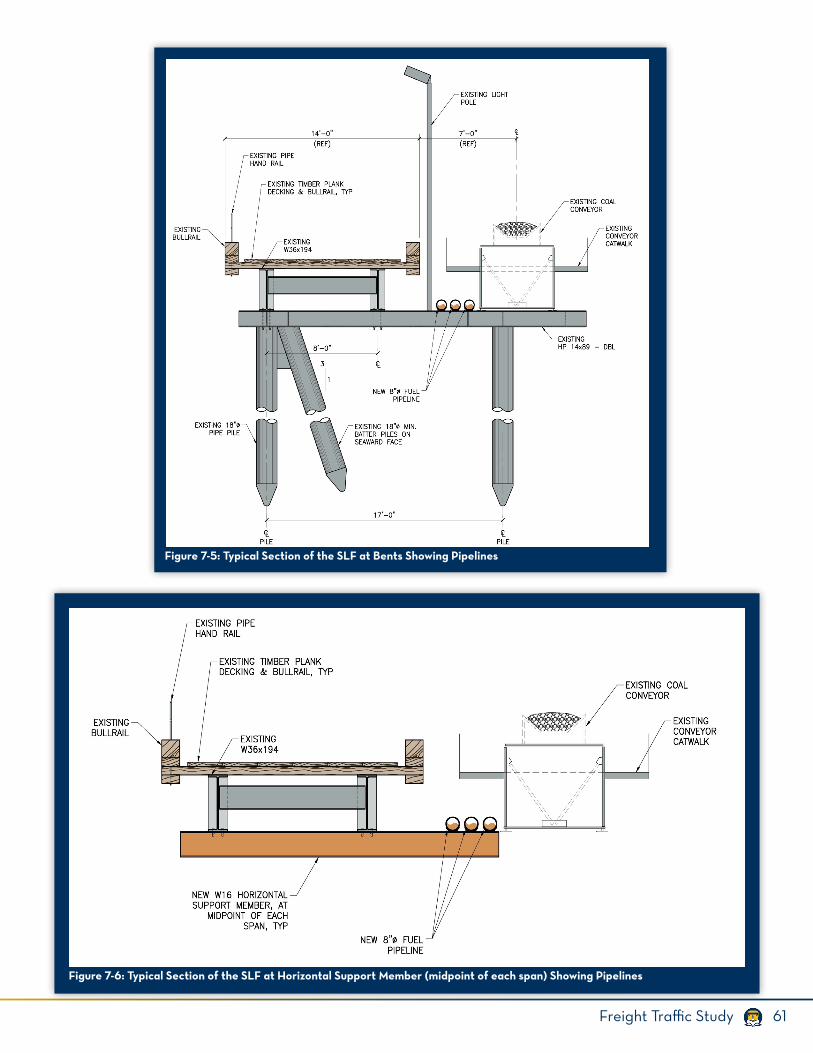
61Freight Traffic Study
Figure 7-5: Typical Section of the SLF at Bents Showing Pipelines
Figure 7-6: Typical Section of the SLF at Horizontal Support Member (midpoint of each span) Showing Pipelines
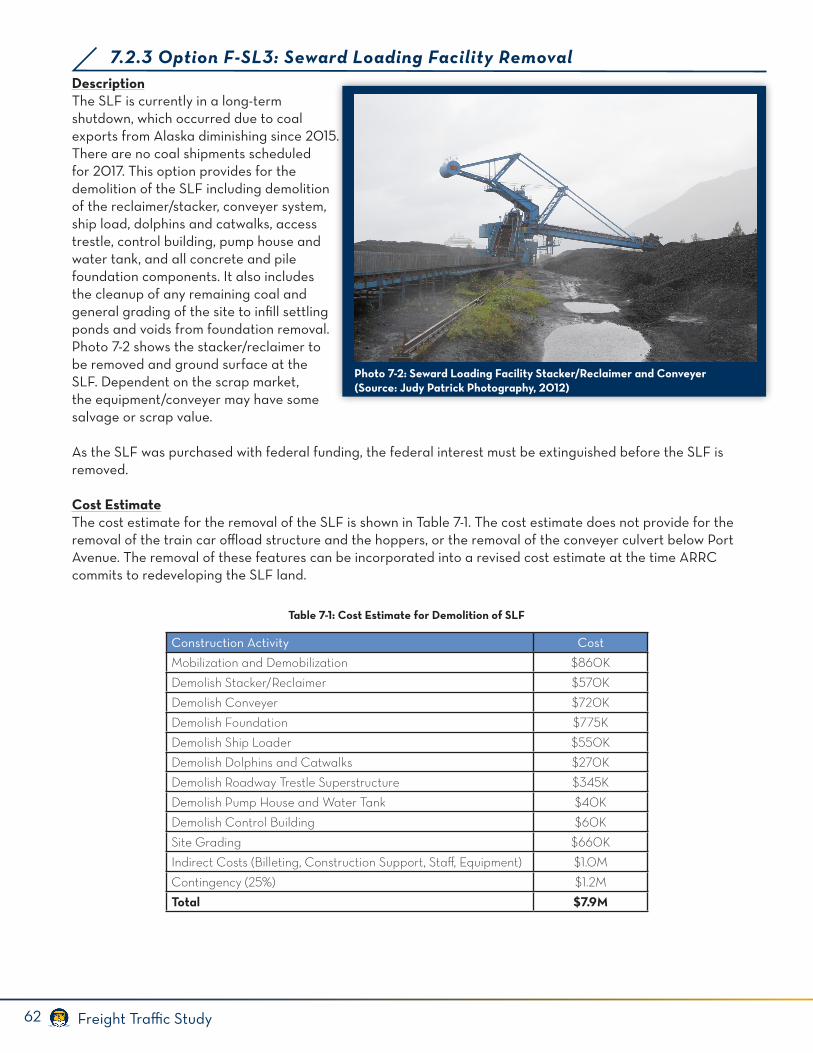
62 Freight Traffic Study
DescriptionThe SLF is currently in a long-term shutdown, which occurred due to coal exports from Alaska diminishing since 2015. There are no coal shipments scheduled for 2017. This option provides for the demolition of the SLF including demolition of the reclaimer/stacker, conveyer system, ship load, dolphins and catwalks, access trestle, control building, pump house and water tank, and all concrete and pile foundation components. It also includes the cleanup of any remaining coal and general grading of the site to infill settling ponds and voids from foundation removal. Photo 7-2 shows the stacker/reclaimer to be removed and ground surface at the SLF. Dependent on the scrap market, the equipment/conveyer may have some salvage or scrap value.
As the SLF was purchased with federal funding, the federal interest must be extinguished before the SLF is removed.
Cost EstimateThe cost estimate for the removal of the SLF is shown in Table 7-1. The cost estimate does not provide for the removal of the train car offload structure and the hoppers, or the removal of the conveyer culvert below Port Avenue. The removal of these features can be incorporated into a revised cost estimate at the time ARRC commits to redeveloping the SLF land.
7.2.3 Option F-SL3: Seward Loading Facility Removal
Construction Activity Cost
Mobilization and Demobilization $860K
Demolish Stacker/Reclaimer $570K
Demolish Conveyer $720K
Demolish Foundation $775K
Demolish Ship Loader $550K
Demolish Dolphins and Catwalks $270K
Demolish Roadway Trestle Superstructure $345K
Demolish Pump House and Water Tank $40K
Demolish Control Building $60K
Site Grading $660K
Indirect Costs (Billeting, Construction Support, Staff, Equipment) $1.0M
Contingency (25%) $1.2M
Total $7.9M
Table 7-1: Cost Estimate for Demolition of SLF
Photo 7-2: Seward Loading Facility Stacker/Reclaimer and Conveyer(Source: Judy Patrick Photography, 2012)
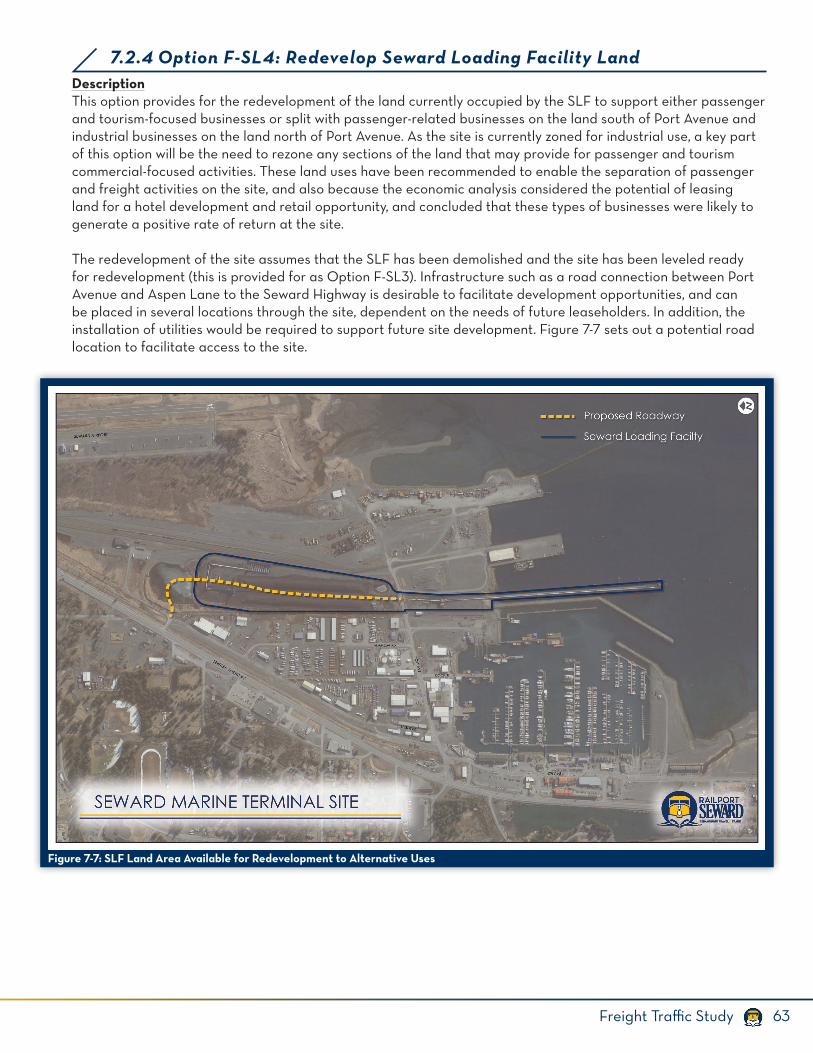
63Freight Traffic Study
DescriptionThis option provides for the redevelopment of the land currently occupied by the SLF to support either passenger and tourism-focused businesses or split with passenger-related businesses on the land south of Port Avenue and industrial businesses on the land north of Port Avenue. As the site is currently zoned for industrial use, a key part of this option will be the need to rezone any sections of the land that may provide for passenger and tourism commercial-focused activities. These land uses have been recommended to enable the separation of passenger and freight activities on the site, and also because the economic analysis considered the potential of leasing land for a hotel development and retail opportunity, and concluded that these types of businesses were likely to generate a positive rate of return at the site.
The redevelopment of the site assumes that the SLF has been demolished and the site has been leveled ready for redevelopment (this is provided for as Option F-SL3). Infrastructure such as a road connection between Port Avenue and Aspen Lane to the Seward Highway is desirable to facilitate development opportunities, and can be placed in several locations through the site, dependent on the needs of future leaseholders. In addition, the installation of utilities would be required to support future site development. Figure 7-7 sets out a potential road location to facilitate access to the site.
7.2.4 Option F-SL4: Redevelop Seward Loading Facility Land
Figure 7-7: SLF Land Area Available for Redevelopment to Alternative Uses
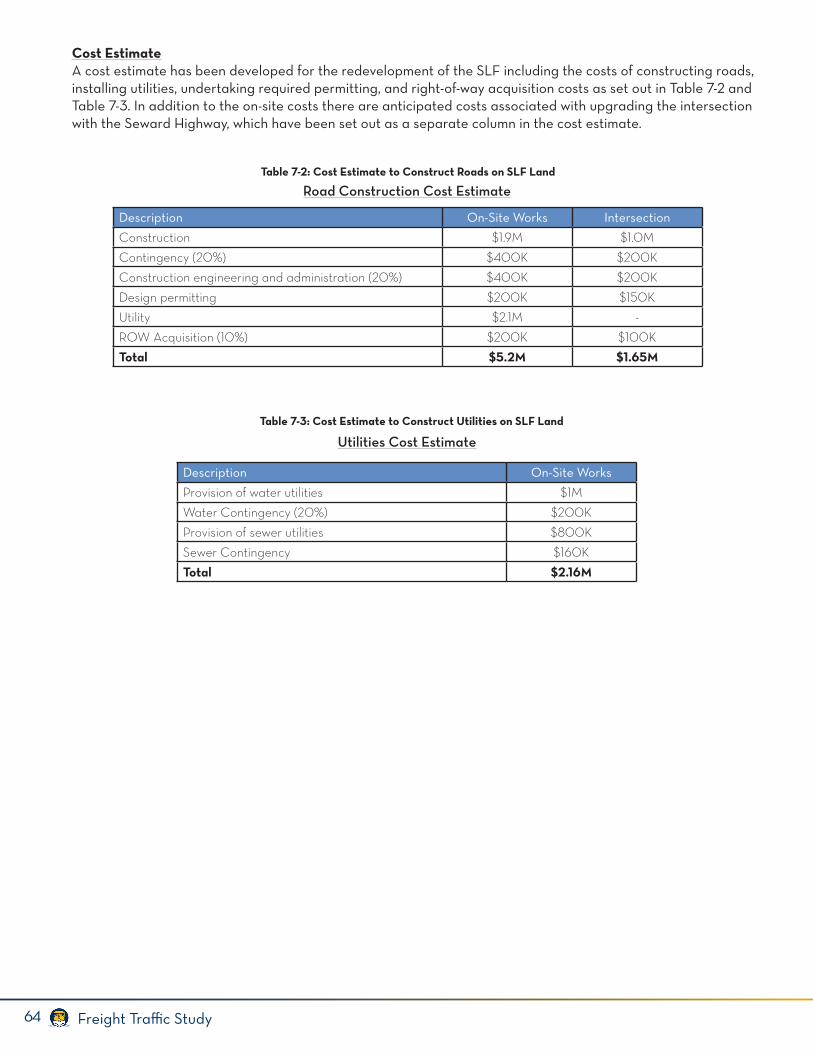
64 Freight Traffic Study
Cost EstimateA cost estimate has been developed for the redevelopment of the SLF including the costs of constructing roads, installing utilities, undertaking required permitting, and right-of-way acquisition costs as set out in Table 7-2 and Table 7-3. In addition to the on-site costs there are anticipated costs associated with upgrading the intersection with the Seward Highway, which have been set out as a separate column in the cost estimate.
Description On-Site Works Intersection
Construction $1.9M $1.0M
Contingency (20%) $400K $200K
Construction engineering and administration (20%) $400K $200K
Design permitting $200K $150K
Utility $2.1M -
ROW Acquisition (10%) $200K $100K
Total $5.2M $1.65M
Table 7-2: Cost Estimate to Construct Roads on SLF Land
Description On-Site Works
Provision of water utilities $1M
Water Contingency (20%) $200K
Provision of sewer utilities $800K
Sewer Contingency $160K
Total $2.16M
Table 7-3: Cost Estimate to Construct Utilities on SLF Land
Road Construction Cost Estimate
Utilities Cost Estimate
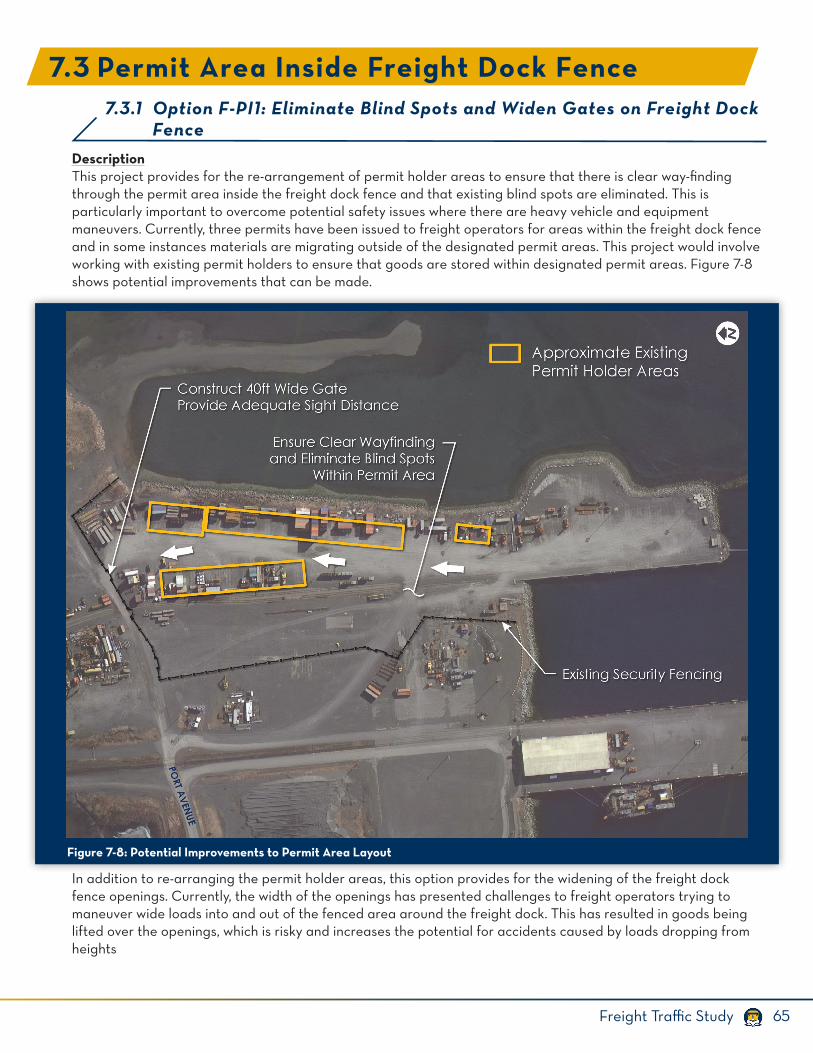
65Freight Traffic Study
DescriptionThis project provides for the re-arrangement of permit holder areas to ensure that there is clear way-finding through the permit area inside the freight dock fence and that existing blind spots are eliminated. This is particularly important to overcome potential safety issues where there are heavy vehicle and equipment maneuvers. Currently, three permits have been issued to freight operators for areas within the freight dock fence and in some instances materials are migrating outside of the designated permit areas. This project would involve working with existing permit holders to ensure that goods are stored within designated permit areas. Figure 7-8 shows potential improvements that can be made.
In addition to re-arranging the permit holder areas, this option provides for the widening of the freight dock fence openings. Currently, the width of the openings has presented challenges to freight operators trying to maneuver wide loads into and out of the fenced area around the freight dock. This has resulted in goods being lifted over the openings, which is risky and increases the potential for accidents caused by loads dropping from heights
7.3.1 Option F-PI1: Eliminate Blind Spots and Widen Gates on Freight Dock Fence
7.3 Permit Area Inside Freight Dock Fence
Figure 7-8: Potential Improvements to Permit Area Layout
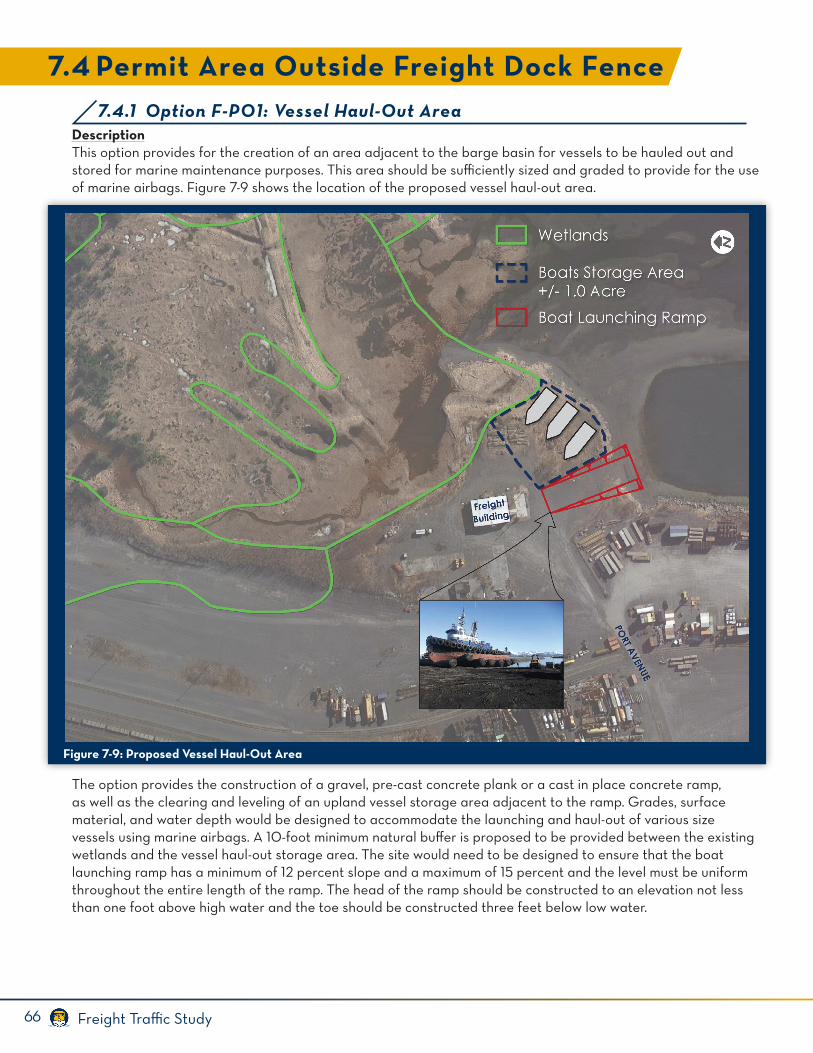
66 Freight Traffic Study
7.4 Permit Area Outside Freight Dock Fence
DescriptionThis option provides for the creation of an area adjacent to the barge basin for vessels to be hauled out and stored for marine maintenance purposes. This area should be sufficiently sized and graded to provide for the use of marine airbags. Figure 7-9 shows the location of the proposed vessel haul-out area.
The option provides the construction of a gravel, pre-cast concrete plank or a cast in place concrete ramp, as well as the clearing and leveling of an upland vessel storage area adjacent to the ramp. Grades, surface material, and water depth would be designed to accommodate the launching and haul-out of various size vessels using marine airbags. A 10-foot minimum natural buffer is proposed to be provided between the existing wetlands and the vessel haul-out storage area. The site would need to be designed to ensure that the boat launching ramp has a minimum of 12 percent slope and a maximum of 15 percent and the level must be uniform throughout the entire length of the ramp. The head of the ramp should be constructed to an elevation not less than one foot above high water and the toe should be constructed three feet below low water.
7.4.1 Option F-PO1: Vessel Haul-Out Area
Figure 7-9: Proposed Vessel Haul-Out Area
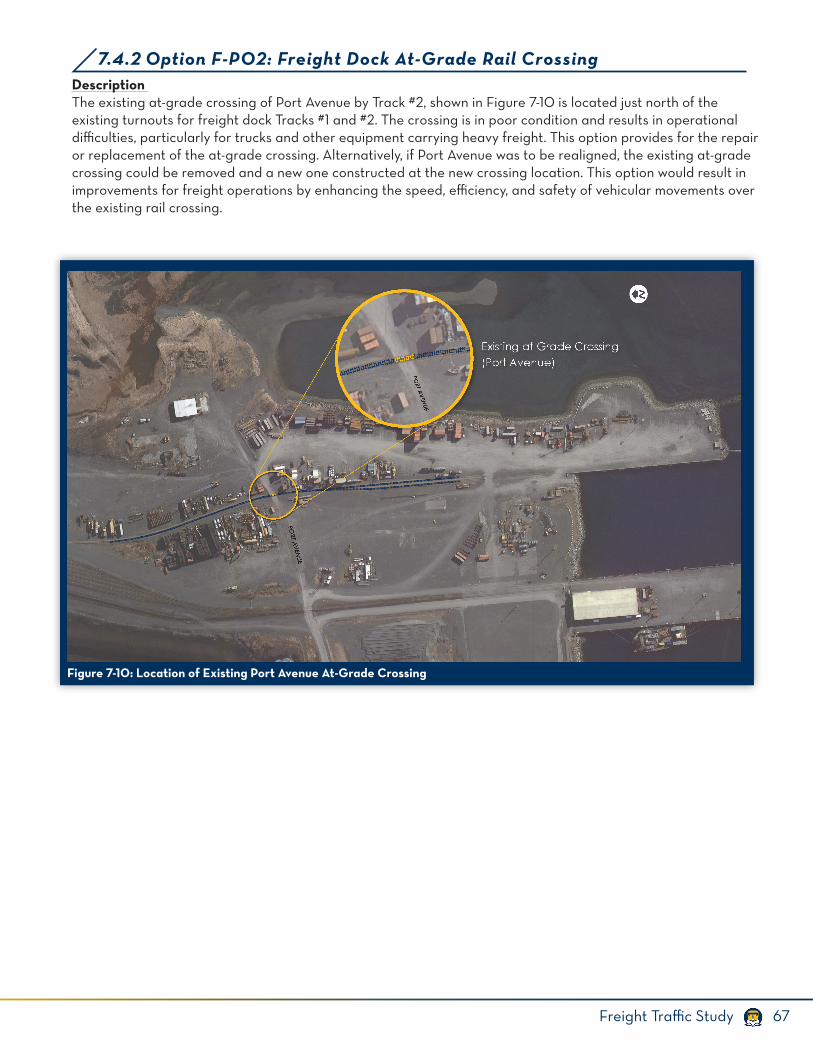
67Freight Traffic Study
7.4.2 Option F-PO2: Freight Dock At-Grade Rail Crossing
Figure 7-10: Location of Existing Port Avenue At-Grade Crossing
Description The existing at-grade crossing of Port Avenue by Track #2, shown in Figure 7-10 is located just north of the existing turnouts for freight dock Tracks #1 and #2. The crossing is in poor condition and results in operational difficulties, particularly for trucks and other equipment carrying heavy freight. This option provides for the repair or replacement of the at-grade crossing. Alternatively, if Port Avenue was to be realigned, the existing at-grade crossing could be removed and a new one constructed at the new crossing location. This option would result in improvements for freight operations by enhancing the speed, efficiency, and safety of vehicular movements over the existing rail crossing.
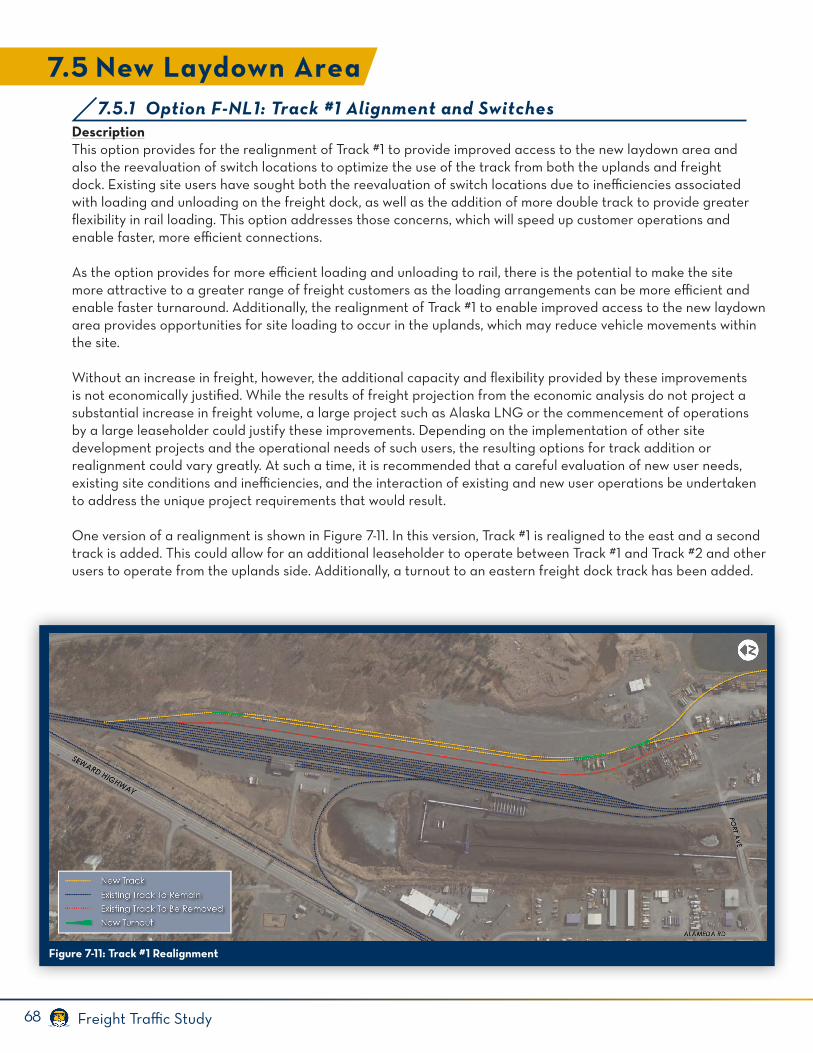
68 Freight Traffic Study
7.5 New Laydown Area7.5.1 Option F-NL1: Track #1 Alignment and Switches
DescriptionThis option provides for the realignment of Track #1 to provide improved access to the new laydown area and also the reevaluation of switch locations to optimize the use of the track from both the uplands and freight dock. Existing site users have sought both the reevaluation of switch locations due to inefficiencies associated with loading and unloading on the freight dock, as well as the addition of more double track to provide greater flexibility in rail loading. This option addresses those concerns, which will speed up customer operations and enable faster, more efficient connections.
As the option provides for more efficient loading and unloading to rail, there is the potential to make the site more attractive to a greater range of freight customers as the loading arrangements can be more efficient and enable faster turnaround. Additionally, the realignment of Track #1 to enable improved access to the new laydown area provides opportunities for site loading to occur in the uplands, which may reduce vehicle movements within the site.
Without an increase in freight, however, the additional capacity and flexibility provided by these improvements is not economically justified. While the results of freight projection from the economic analysis do not project a substantial increase in freight volume, a large project such as Alaska LNG or the commencement of operations by a large leaseholder could justify these improvements. Depending on the implementation of other site development projects and the operational needs of such users, the resulting options for track addition or realignment could vary greatly. At such a time, it is recommended that a careful evaluation of new user needs, existing site conditions and inefficiencies, and the interaction of existing and new user operations be undertaken to address the unique project requirements that would result.
One version of a realignment is shown in Figure 7-11. In this version, Track #1 is realigned to the east and a second track is added. This could allow for an additional leaseholder to operate between Track #1 and Track #2 and other users to operate from the uplands side. Additionally, a turnout to an eastern freight dock track has been added.
Figure 7-11: Track #1 Realignment
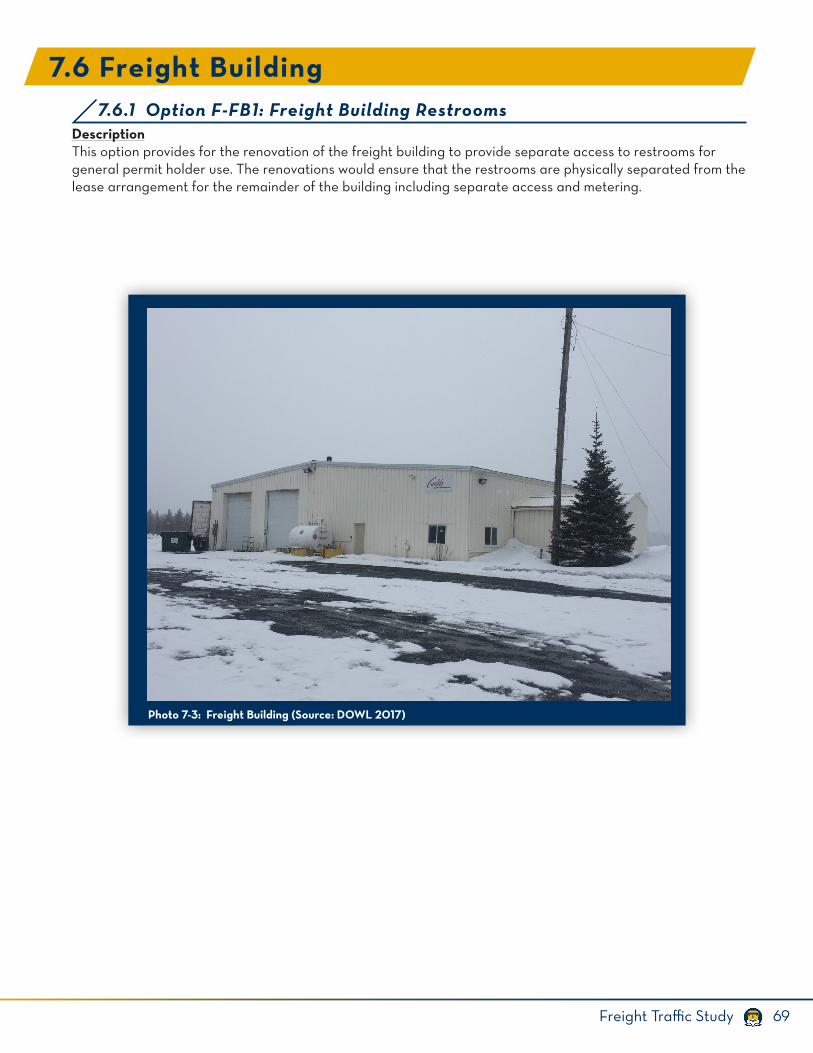
69Freight Traffic Study
DescriptionThis option provides for the renovation of the freight building to provide separate access to restrooms for general permit holder use. The renovations would ensure that the restrooms are physically separated from the lease arrangement for the remainder of the building including separate access and metering.
7.6 Freight Building 7.6.1 Option F-FB1: Freight Building Restrooms
Photo 7-3: Freight Building (Source: DOWL 2017)
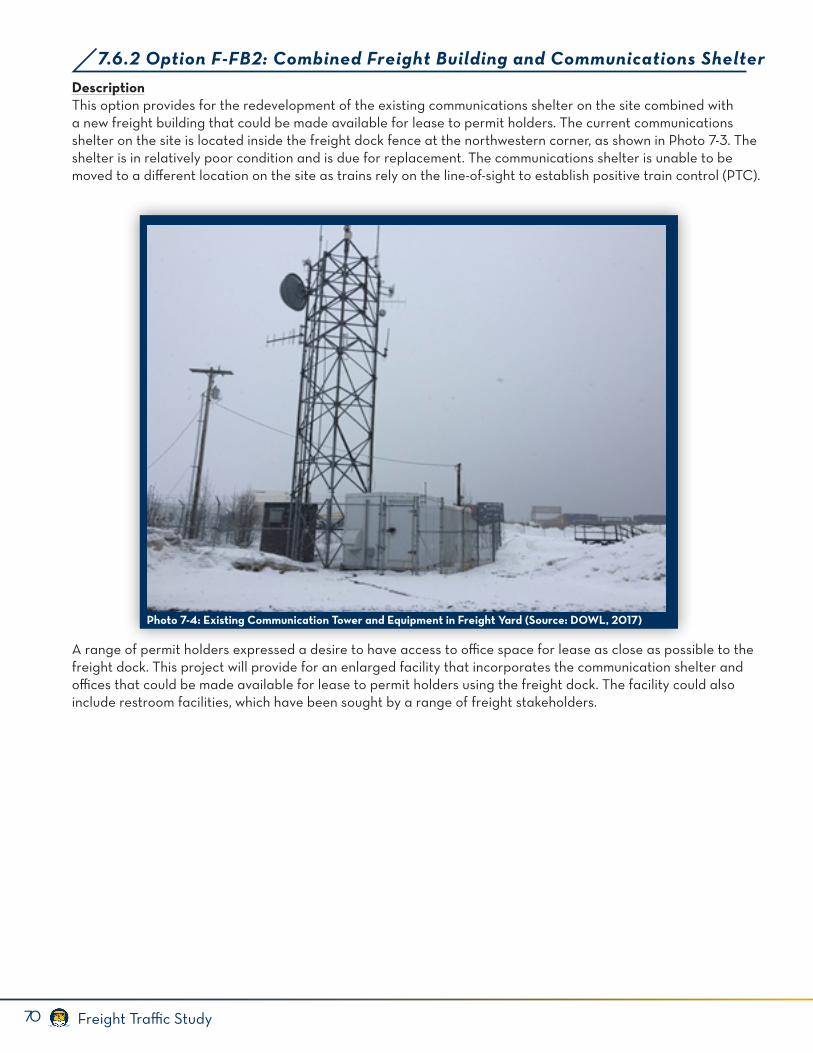
70 Freight Traffic Study
DescriptionThis option provides for the redevelopment of the existing communications shelter on the site combined with a new freight building that could be made available for lease to permit holders. The current communications shelter on the site is located inside the freight dock fence at the northwestern corner, as shown in Photo 7-3. The shelter is in relatively poor condition and is due for replacement. The communications shelter is unable to be moved to a different location on the site as trains rely on the line-of-sight to establish positive train control (PTC).
A range of permit holders expressed a desire to have access to office space for lease as close as possible to the freight dock. This project will provide for an enlarged facility that incorporates the communication shelter and offices that could be made available for lease to permit holders using the freight dock. The facility could also include restroom facilities, which have been sought by a range of freight stakeholders.
7.6.2 Option F-FB2: Combined Freight Building and Communications Shelter
Photo 7-4: Existing Communication Tower and Equipment in Freight Yard (Source: DOWL, 2017)
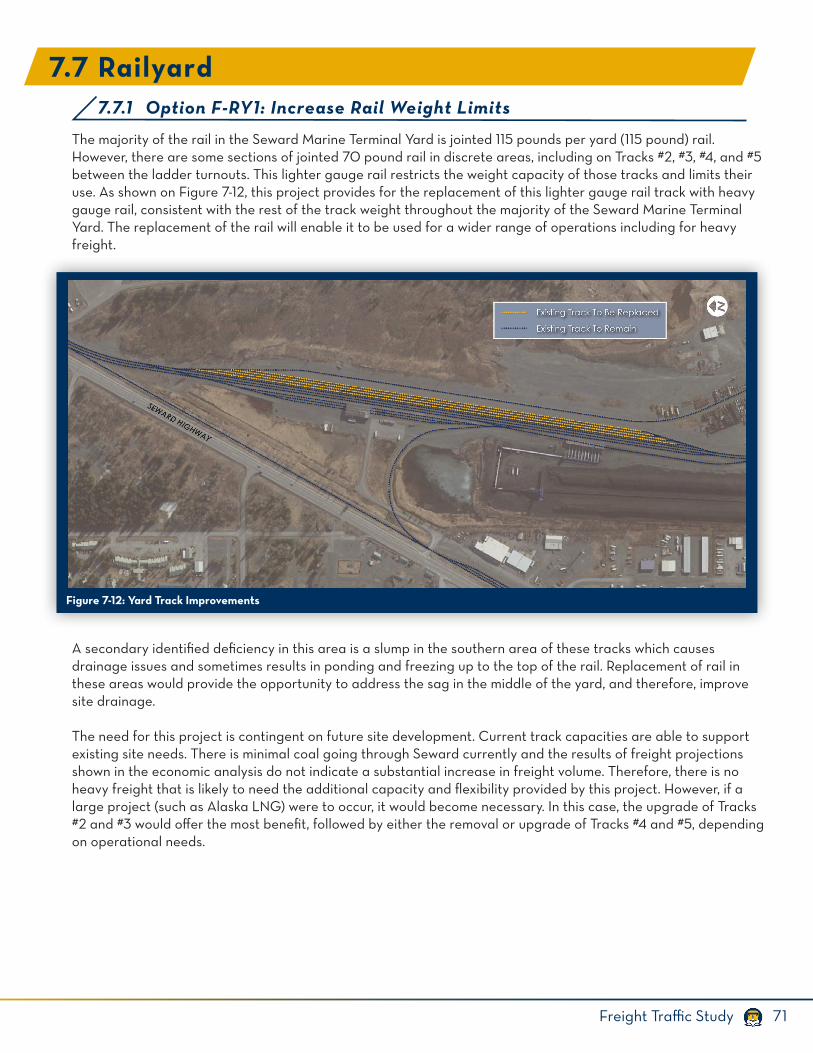
71Freight Traffic Study
7.7 Railyard7.7.1 Option F-RY1: Increase Rail Weight Limits
The majority of the rail in the Seward Marine Terminal Yard is jointed 115 pounds per yard (115 pound) rail. However, there are some sections of jointed 70 pound rail in discrete areas, including on Tracks #2, #3, #4, and #5 between the ladder turnouts. This lighter gauge rail restricts the weight capacity of those tracks and limits their use. As shown on Figure 7-12, this project provides for the replacement of this lighter gauge rail track with heavy gauge rail, consistent with the rest of the track weight throughout the majority of the Seward Marine Terminal Yard. The replacement of the rail will enable it to be used for a wider range of operations including for heavy freight.
A secondary identified deficiency in this area is a slump in the southern area of these tracks which causes drainage issues and sometimes results in ponding and freezing up to the top of the rail. Replacement of rail in these areas would provide the opportunity to address the sag in the middle of the yard, and therefore, improve site drainage.
The need for this project is contingent on future site development. Current track capacities are able to support existing site needs. There is minimal coal going through Seward currently and the results of freight projections shown in the economic analysis do not indicate a substantial increase in freight volume. Therefore, there is no heavy freight that is likely to need the additional capacity and flexibility provided by this project. However, if a large project (such as Alaska LNG) were to occur, it would become necessary. In this case, the upgrade of Tracks #2 and #3 would offer the most benefit, followed by either the removal or upgrade of Tracks #4 and #5, depending on operational needs.
Figure 7-12: Yard Track Improvements
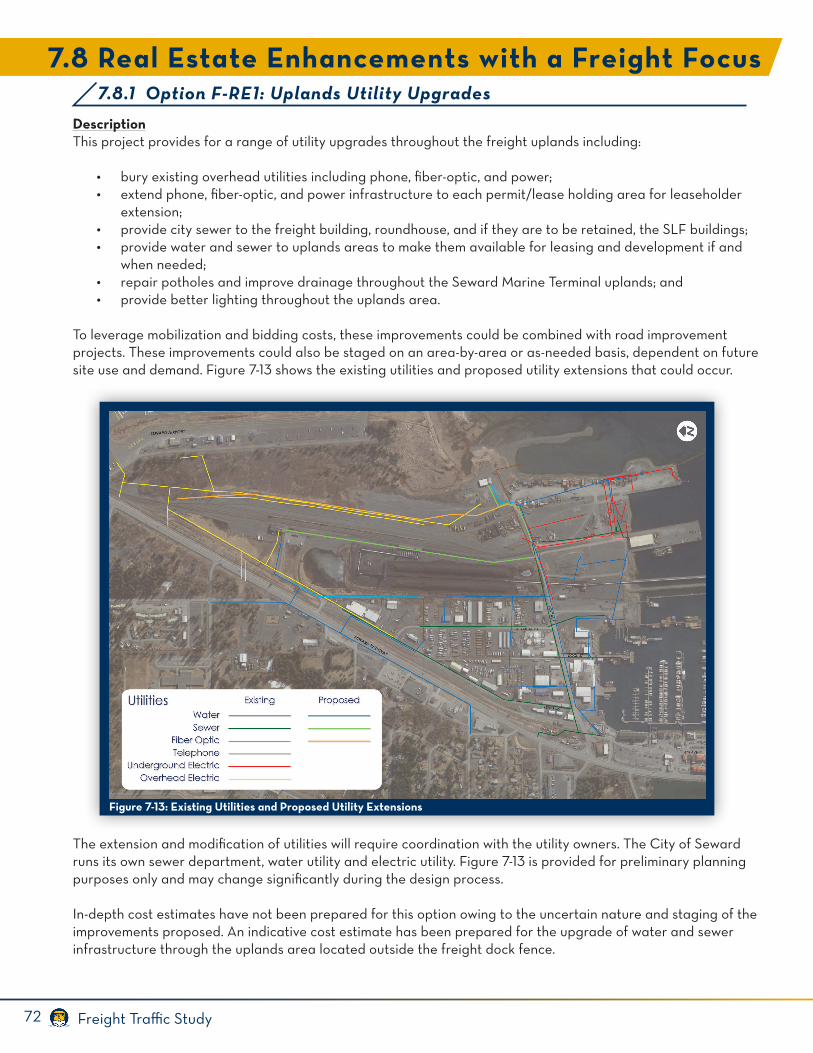
72 Freight Traffic Study
DescriptionThis project provides for a range of utility upgrades throughout the freight uplands including:
• bury existing overhead utilities including phone, fiber-optic, and power;• extend phone, fiber-optic, and power infrastructure to each permit/lease holding area for leaseholder
extension;• provide city sewer to the freight building, roundhouse, and if they are to be retained, the SLF buildings;• provide water and sewer to uplands areas to make them available for leasing and development if and
when needed;• repair potholes and improve drainage throughout the Seward Marine Terminal uplands; and• provide better lighting throughout the uplands area.
To leverage mobilization and bidding costs, these improvements could be combined with road improvement projects. These improvements could also be staged on an area-by-area or as-needed basis, dependent on future site use and demand. Figure 7-13 shows the existing utilities and proposed utility extensions that could occur.
The extension and modification of utilities will require coordination with the utility owners. The City of Seward runs its own sewer department, water utility and electric utility. Figure 7-13 is provided for preliminary planning purposes only and may change significantly during the design process.
In-depth cost estimates have not been prepared for this option owing to the uncertain nature and staging of the improvements proposed. An indicative cost estimate has been prepared for the upgrade of water and sewer infrastructure through the uplands area located outside the freight dock fence.
7.8.1 Option F-RE1: Uplands Utility Upgrades
7.8 Real Estate Enhancements with a Freight Focus
Figure 7-13: Existing Utilities and Proposed Utility Extensions
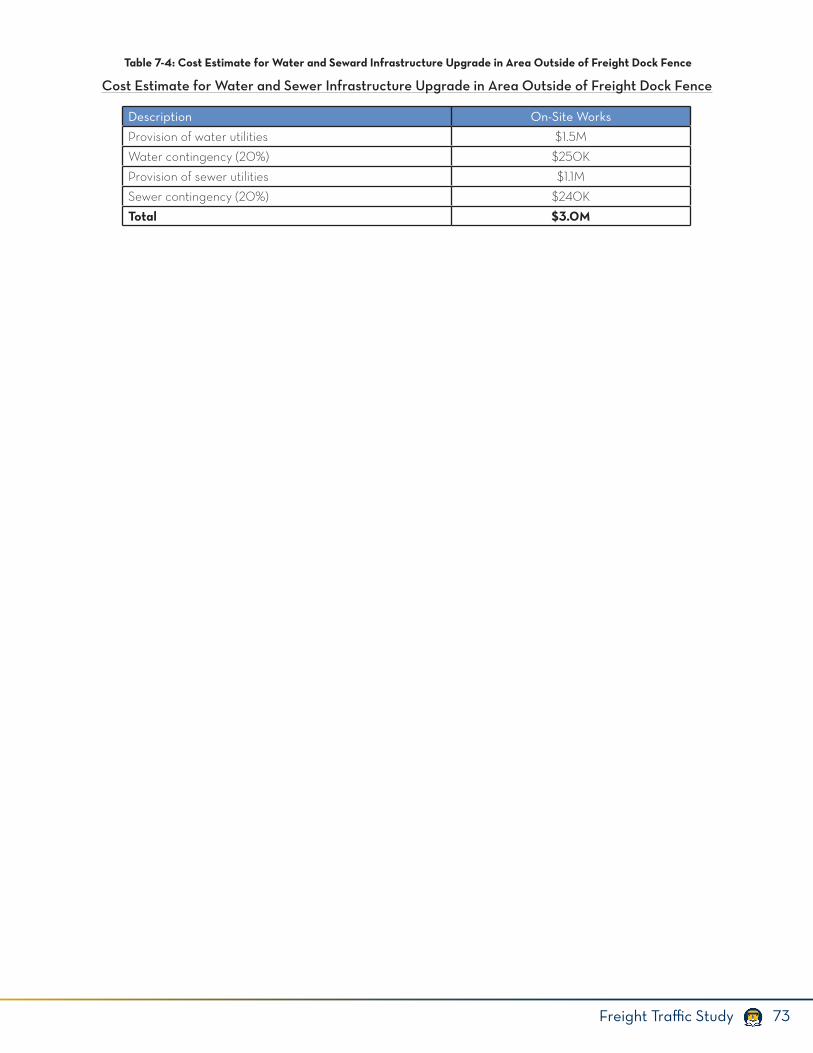
73Freight Traffic Study
Description On-Site Works
Provision of water utilities $1.5M
Water contingency (20%) $250K
Provision of sewer utilities $1.1M
Sewer contingency (20%) $240K
Total $3.0M
Table 7-4: Cost Estimate for Water and Seward Infrastructure Upgrade in Area Outside of Freight Dock Fence
Cost Estimate for Water and Sewer Infrastructure Upgrade in Area Outside of Freight Dock Fence
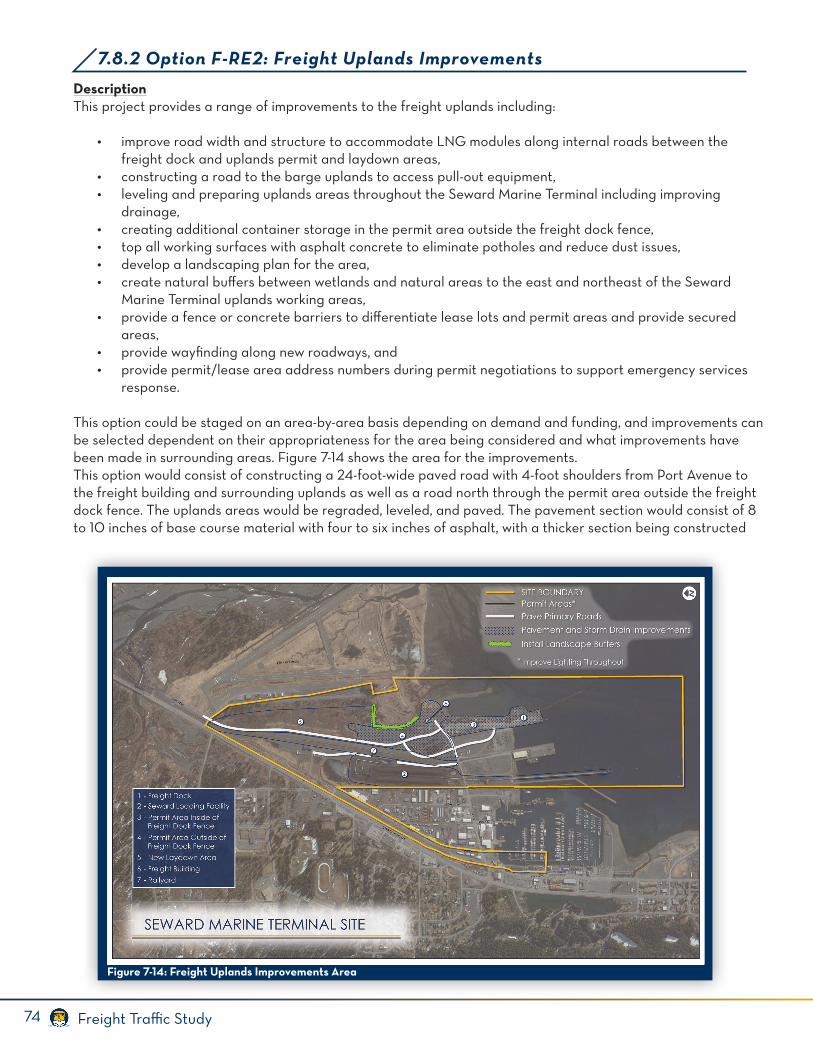
74 Freight Traffic Study
7.8.2 Option F-RE2: Freight Uplands Improvements
DescriptionThis project provides a range of improvements to the freight uplands including:
• improve road width and structure to accommodate LNG modules along internal roads between the freight dock and uplands permit and laydown areas,
• constructing a road to the barge uplands to access pull-out equipment,• leveling and preparing uplands areas throughout the Seward Marine Terminal including improving
drainage,• creating additional container storage in the permit area outside the freight dock fence,• top all working surfaces with asphalt concrete to eliminate potholes and reduce dust issues,• develop a landscaping plan for the area,• create natural buffers between wetlands and natural areas to the east and northeast of the Seward
Marine Terminal uplands working areas,• provide a fence or concrete barriers to differentiate lease lots and permit areas and provide secured
areas,• provide wayfinding along new roadways, and• provide permit/lease area address numbers during permit negotiations to support emergency services
response.
This option could be staged on an area-by-area basis depending on demand and funding, and improvements can be selected dependent on their appropriateness for the area being considered and what improvements have been made in surrounding areas. Figure 7-14 shows the area for the improvements.This option would consist of constructing a 24-foot-wide paved road with 4-foot shoulders from Port Avenue to the freight building and surrounding uplands as well as a road north through the permit area outside the freight dock fence. The uplands areas would be regraded, leveled, and paved. The pavement section would consist of 8 to 10 inches of base course material with four to six inches of asphalt, with a thicker section being constructed
Figure 7-14: Freight Uplands Improvements Area
75Freight Traffic Study
where higher vehicle loading is expected. All paving would be graded to a minimum slope of 2 percent to allow for drainage while still accommodating the potential for various container handling equipment such as straddle carriers or top picks.
A drainage system would be sized to convey the 25 year design storm and would consist of inlets, manholes, culverts and ditches directing water to the existing storm drainage outfall. A natural buffer (10-foot minimum width) would be maintained between the upland area and the existing wetlands at the eastern edge of the site. Moveable barriers such as concrete barriers with chain link fence mounted to the top would be placed around permit holder areas. There is a wide range of options for construction of new wayfinding and secure areas and final configuration is dependent on permit holders and uses, which can be determined at a later time as needed. All signage will be constructed in accordance with the requirements of the DOT&PF and the Manual on Uniform Traffic Control Devices (MUTCD) standards and manuals.
Cost estimates have not been prepared for this option owing to the uncertain nature and staging of the improvements proposed.
76 Freight Traffic Study
DescriptionThe Economic Analysis Report evaluated the use of the 10.7 acre new laydown area to understand its economic return. The analysis assumed that two major LNG projects currently being proposed in the state, the Alaska Stand Alone Pipeline (ASAP) Project and the Alaska LNG Project, proceed and use the Seward Marine Terminal for staging construction pipe. These projects would need to lease land at Seward for between three and five years to receive and stage pipe prior to transporting it to other locations in the state for the construction of facilities.
ARRC revenue estimates for the development of the dedicated laydown area include wharfage, dockage, security, lease, and rail revenue from the hauling of pipe. ARRC costs would include those currently being expended to generate the new laydown area, such as vegetation clearance, placement of granular fill, compaction, leveling, and the construction of the embankment to create a buffer for the wetlands. A number of these construction activities have now been completed. The analysis concluded that the provision of land for lease and associated revenue over the three to five years that these projects would need to use the Seward Marine Terminal would generate a positive rate of return.
7.8.3 Option F-RE3: Laydown Area
DescriptionThe Economic Analysis Report considered the financial feasibility of the development of a refined fuel distribution facility on a 3.5 acre site at the Seward Marine Terminal Site. This scenario would require the installation of a pipe to facilitate the movement of fuel from the site to a dock for loading onto a ship or barge. A potential refined fuel distributor would provide multiple sources of revenue for ARRC. For instance, a vessel delivering fuel to Seward would be charged dockage for tying up at the freight dock and wharfage for any fuel crossing the dock. Revenue would also be generated from security fees when vessels are delivering or receiving fuel in port. Revenue would also be earned from leasing the 3.5 acre site to the refined fuel distributor for operations.
It is anticipated that ARRC would provide for the extension of utilities services to the site. The provision of the fuel pipe would also need to be agreed between ARRC and the leaseholder, but for the purposes of the economic analysis, it was assumed that the cost was split evenly between ARRC and the site tenant. All site development costs were assumed to be the responsibility of the tenant. The analysis concluded that the provision of land for lease and the associated revenue for a refined fuel distributor at the site would generate a positive rate of return.
7.8.4 Option F-RE4: Refined Fuel Distributor
DescriptionThe Economic Analysis Report considered the financial feasibility of providing for a marine repair and maintenance facility at the Seward Marine Terminal site. The marine repair and maintenance operation is assumed to be located on a 1.5 acre site. The analysis assumes that ARRC would complete the necessary site improvements by extending utilities services to the site. The analysis assumes that all on-site development costs would be the responsibility of the site tenant. The ARRC is anticipated to accrue revenues from the lease of the land to the marine repair and maintenance operator and also by transporting materials such as steel and aluminum by rail. The analysis concluded that the provision of land from lease and the associated revenue from providing for transportation of materials by rail would generate a positive rate of return.
7.8.5 Option F-RE5: Marine Repair and Maintenance Facility
77Freight Traffic Study
DescriptionThe Economic Analysis Report considered the financial feasibility of providing for a seafood processing facility at the Seward Marine Terminal site. The analysis evaluated the provision of a land-based seafood processor on a 2.5 acre site. The analysis assumes that all on-site development costs would be the responsibility of the site tenant. ARRC would be responsible for extending utilities to the site including water, sewer and electric service. ARRC is assumed to accrue revenues from leasing the land and also from wharfage, dockage and providing security. The analysis concluded that the provision of a lease and associated services to a seafood processing operator would generate a positive rate of return.
7.8.6 Option F-RE6: Seafood Processing

This page left intentionally blank.
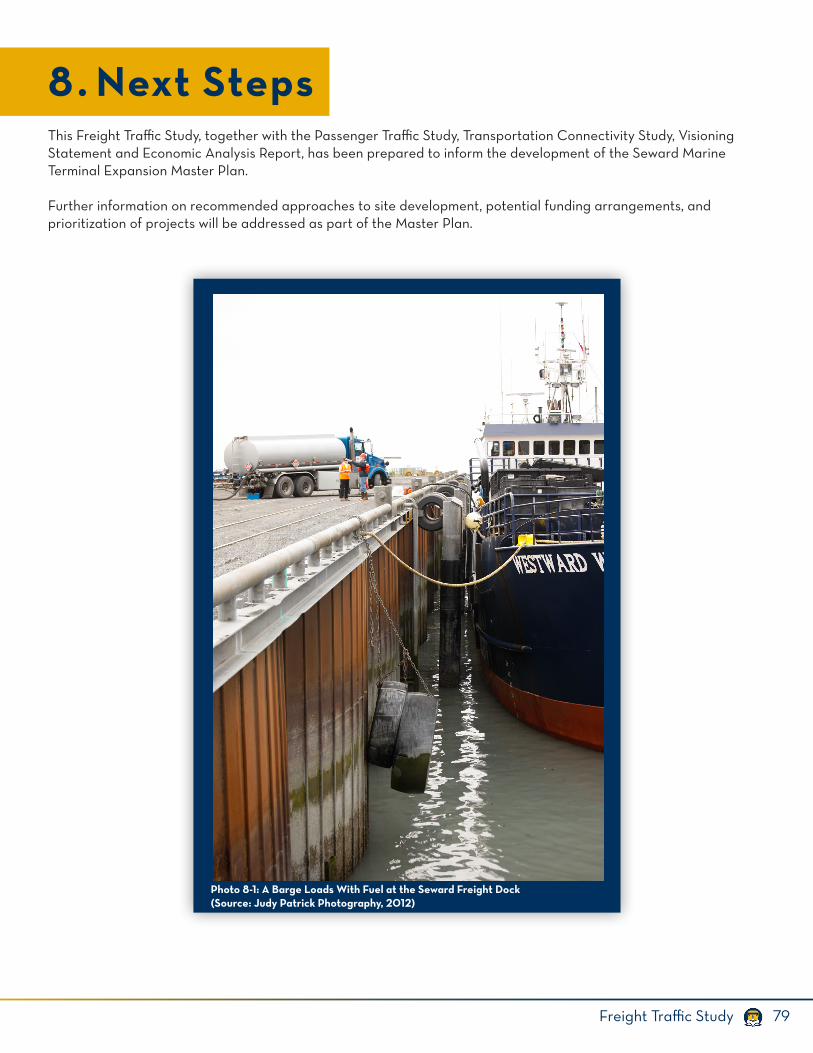
79Freight Traffic Study
8. Next StepsThis Freight Traffic Study, together with the Passenger Traffic Study, Transportation Connectivity Study, Visioning Statement and Economic Analysis Report, has been prepared to inform the development of the Seward Marine Terminal Expansion Master Plan.
Further information on recommended approaches to site development, potential funding arrangements, and prioritization of projects will be addressed as part of the Master Plan.
Photo 8-1: A Barge Loads With Fuel at the Seward Freight Dock(Source: Judy Patrick Photography, 2012)

This page left intentionally blank.

A p p e n d i x A

This page left intentionally blank.
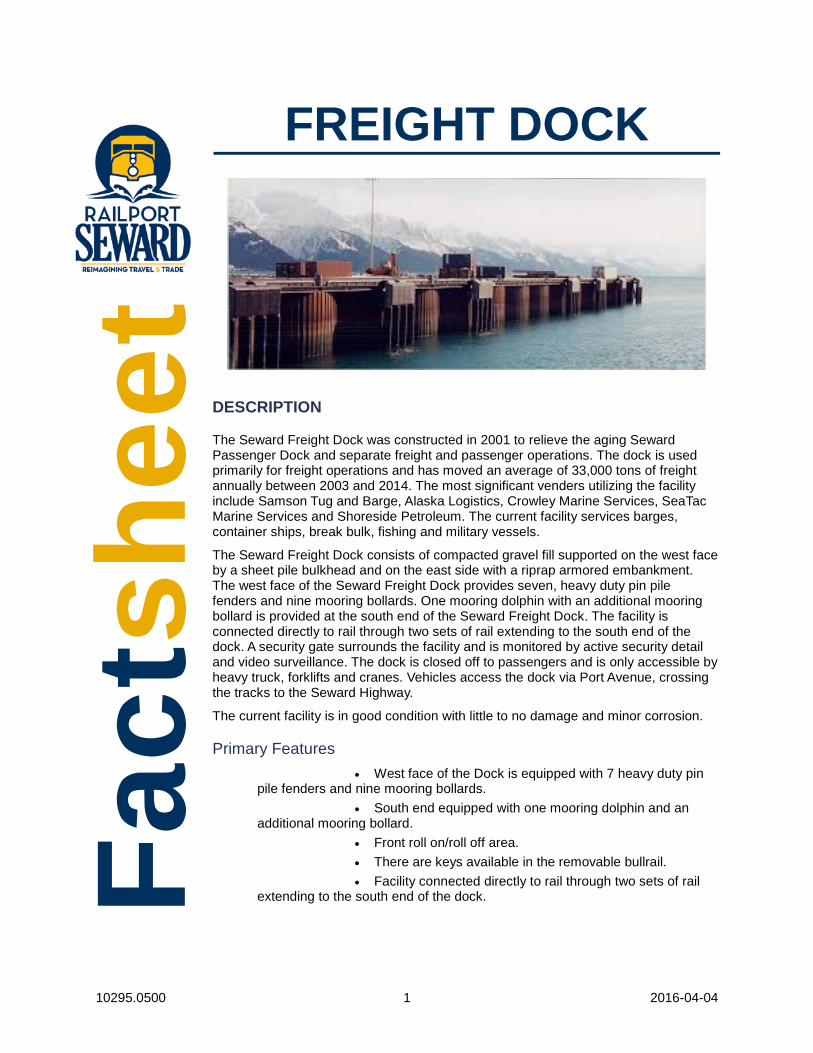
10295.0500 1 2016-04-04
FREIGHT DOCK
DESCRIPTION
The Seward Freight Dock was constructed in 2001 to relieve the aging Seward Passenger Dock and separate freight and passenger operations. The dock is used primarily for freight operations and has moved an average of 33,000 tons of freight annually between 2003 and 2014. The most significant venders utilizing the facility include Samson Tug and Barge, Alaska Logistics, Crowley Marine Services, SeaTac Marine Services and Shoreside Petroleum. The current facility services barges, container ships, break bulk, fishing and military vessels.
The Seward Freight Dock consists of compacted gravel fill supported on the west face by a sheet pile bulkhead and on the east side with a riprap armored embankment. The west face of the Seward Freight Dock provides seven, heavy duty pin pile fenders and nine mooring bollards. One mooring dolphin with an additional mooring bollard is provided at the south end of the Seward Freight Dock. The facility is connected directly to rail through two sets of rail extending to the south end of the dock. A security gate surrounds the facility and is monitored by active security detail and video surveillance. The dock is closed off to passengers and is only accessible by heavy truck, forklifts and cranes. Vehicles access the dock via Port Avenue, crossing the tracks to the Seward Highway.
The current facility is in good condition with little to no damage and minor corrosion.
Primary Features • West face of the Dock is equipped with 7 heavy duty pin
pile fenders and nine mooring bollards. • South end equipped with one mooring dolphin and an
additional mooring bollard. • Front roll on/roll off area. • There are keys available in the removable bullrail. • Facility connected directly to rail through two sets of rail
extending to the south end of the dock. Fact
shee
t
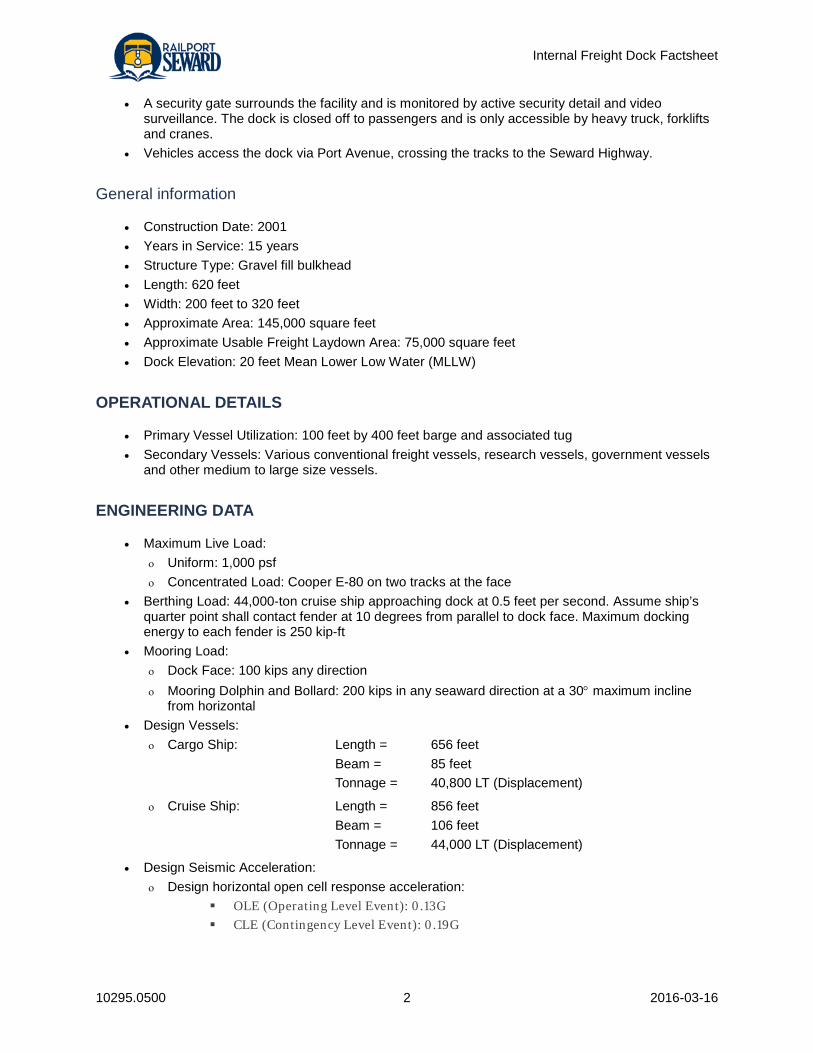
Internal Freight Dock Factsheet
10295.0500 2 2016-03-16
• A security gate surrounds the facility and is monitored by active security detail and video surveillance. The dock is closed off to passengers and is only accessible by heavy truck, forklifts and cranes.
• Vehicles access the dock via Port Avenue, crossing the tracks to the Seward Highway.
General information
• Construction Date: 2001 • Years in Service: 15 years • Structure Type: Gravel fill bulkhead • Length: 620 feet • Width: 200 feet to 320 feet • Approximate Area: 145,000 square feet • Approximate Usable Freight Laydown Area: 75,000 square feet • Dock Elevation: 20 feet Mean Lower Low Water (MLLW)
OPERATIONAL DETAILS
• Primary Vessel Utilization: 100 feet by 400 feet barge and associated tug • Secondary Vessels: Various conventional freight vessels, research vessels, government vessels
and other medium to large size vessels.
ENGINEERING DATA
• Maximum Live Load: ο Uniform: 1,000 psf ο Concentrated Load: Cooper E-80 on two tracks at the face
• Berthing Load: 44,000-ton cruise ship approaching dock at 0.5 feet per second. Assume ship’s quarter point shall contact fender at 10 degrees from parallel to dock face. Maximum docking energy to each fender is 250 kip-ft
• Mooring Load: ο Dock Face: 100 kips any direction ο Mooring Dolphin and Bollard: 200 kips in any seaward direction at a 30° maximum incline
from horizontal • Design Vessels:
ο Cargo Ship: Length = 656 feet Beam = 85 feet Tonnage = 40,800 LT (Displacement)
ο Cruise Ship: Length = 856 feet Beam = 106 feet Tonnage = 44,000 LT (Displacement)
• Design Seismic Acceleration: ο Design horizontal open cell response acceleration:
OLE (Operating Level Event): 0.13G CLE (Contingency Level Event): 0.19G
Internal Freight Dock Factsheet
10295.0500 3 2016-03-16
• Design Significant Wave Height: 6.8 feet (Spectral period: 5.3 second) • Wind Data:
ο 110 mph Exposure “D” (UBC), except for mooring loads ο Mooring Condition:
80 mph in North- South direction October thru April 50 mph in North- South direction May thru September 32 mph in East- West direction year round
• Tidal Data: ο Extreme High Water: 15.7 feet ο Mean Higher High Water: 10.6 feet ο Mean High Water: 9.7 feet ο Mean Tide Level: 5.5 feet ο Mean Low Water: 1.4 feet ο Mean Lower Low Water: 0.0 feet ο Extreme Low Water: -5.0 feet
LIST OF APPLICABLE DRAWINGS
• Alaska Railroad Corporation New Seward Railroad Dock (2000, PND) • North Dredging and Armor Alaska Railroad Dock • Map, Sections, and Seismic Profiles of Seward and Vicinity, Alaska (Seward Seismic Line
Profiles.pdf)
LIST OF APPLICABLE REPORTS AND STUDIES
• Geotechnical Investigations – Methods and Findings (1999, PND) • New Seward ARRC Railroad Dock and Freight Terminal-Liquefaction Susceptibility Evaluation
(2000, Dickinson) • An Investigation of Shoaling and Coastal Processes Occurring at the Alaska Railroad Corporation
Dock, Seward, Alaska (1994, Coastal Processes Report)
RECENT IMPROVEMENTS/IMPROVEMENTS UNDERWAY
• 2005: Video surveillance installed. • 2007: Partially widened to 320 feet through placement of fill to the east of the existing dock. • 2010: Basin dredged to increase maximum vessel draft. • 2011: 8-foot chain link fence installed. Three 30-foot roller entry control gates control dock
access. • 2013: Pan-tilt-zoom (PTZ) cameras installed to monitor the terminal area and moored vessels.
Two of the entry control gates installed.
PLANNED IMPROVEMENTS
• Addition of a 7,000 square foot concrete slab, electrical power and water service on the South end of the dock to accommodate fish unloading operations. Project completion expected in June 2016.
Internal Freight Dock Factsheet
10295.0500 4 2016-03-16
DEFICIENCIES AND AREAS OF CONCERN
Issues Identified by ARRC Staff • Dock is currently too short to accommodate the larger barges and/or multiple barges. The current
berthing configuration limits the ability for multiple barges to access simultaneously. • Dock is currently too narrow to accommodate roll-on/roll-off ramps for larger vessels. • Secure cargo storage and staging space is severely limited. • Barge basin has been accumulating sediment from the shifting of the Resurrection River,
requiring barge services to move to the Freight Dock berth. • The key location in the removable bullrail allows only one barge at a time and will need to be
reconfigured if the dock is expanded to facilitate simultaneous use.
Issues Identified by External Stakeholders • The offset between the existing ladders and vessels is unsafe. The ladders are regularly
damaged by vessel impact due to their current location. The preferred ladder configuration is in the center of the fender, similar to Passenger Dock fenders.
• A longer dock will allow more than one barge to offload simultaneously. • A wider dock will allow freight to be staged from multiple barges before being transported by truck
or rail. • A notch for a ramp in the dock will allow smaller barges to access the dock for roll on-roll off
operations at all tide levels. • Fenders are too large for most barge operations. The standoff distance from the dock makes
pass-pass operations and direct load to rail difficult. • Gravel working surface requires maintenance of the tracks before rail use and becomes
problematic during heavy rain. • The current front roll-on/roll-off access is difficult to use during low tides and vessels are not
easily secured.
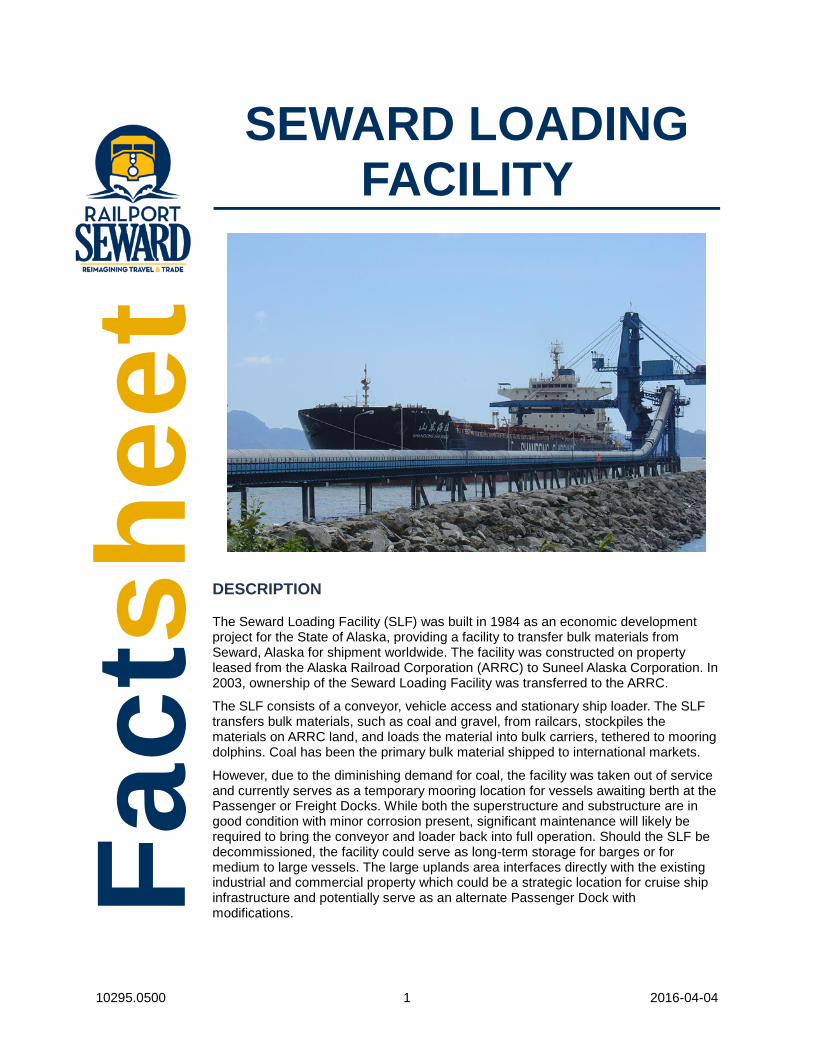
10295.0500 1 2016-04-04
SEWARD LOADING FACILITY
DESCRIPTION
The Seward Loading Facility (SLF) was built in 1984 as an economic development project for the State of Alaska, providing a facility to transfer bulk materials from Seward, Alaska for shipment worldwide. The facility was constructed on property leased from the Alaska Railroad Corporation (ARRC) to Suneel Alaska Corporation. In 2003, ownership of the Seward Loading Facility was transferred to the ARRC.
The SLF consists of a conveyor, vehicle access and stationary ship loader. The SLF transfers bulk materials, such as coal and gravel, from railcars, stockpiles the materials on ARRC land, and loads the material into bulk carriers, tethered to mooring dolphins. Coal has been the primary bulk material shipped to international markets.
However, due to the diminishing demand for coal, the facility was taken out of service and currently serves as a temporary mooring location for vessels awaiting berth at the Passenger or Freight Docks. While both the superstructure and substructure are in good condition with minor corrosion present, significant maintenance will likely be required to bring the conveyor and loader back into full operation. Should the SLF be decommissioned, the facility could serve as long-term storage for barges or for medium to large vessels. The large uplands area interfaces directly with the existing industrial and commercial property which could be a strategic location for cruise ship infrastructure and potentially serve as an alternate Passenger Dock with modifications. Fa
ctsh
eet

Internal Seward Loading Facility Factsheet
10295.0500 2 2016-04-04
General Information • Construction Date: 1984 • Years in Service: 31 years • Structure Type: Pile-supported trestle with conveyor • Length: 1,700 feet • Area: 33.91 acres • Stockpile Capacity: 130,000 tons • Dock Elevation: +24 Mean Lower Low Water (MLLW)
Primary Features • Railcar dump and transfer conveyor facility • Stacker-reclaimer to collect and transfer bulk material from stockpile to trestle with conveyor • Conveyor connected to stationary ship loader for discharging bulk material to bulk ship operated
by control building • Dolphin berth • Facility connects directly to rail by a single track spur extending to the railcar dump • Port Avenue crosses the conveyor by bridge
OPERATIONAL DETAILS
• Annual throughput capacity: 1.65 million tons • Unit train unloading: 2,750 tons per hour • Rail mounted stacker-reclaimer:
ο Stacking capacity: 2,750 to 3,300 tons per hour ο Reclaiming capacity: 770 to 1,100 tons per hour
• Average loading time: 5-6 days to load 77,000 tons
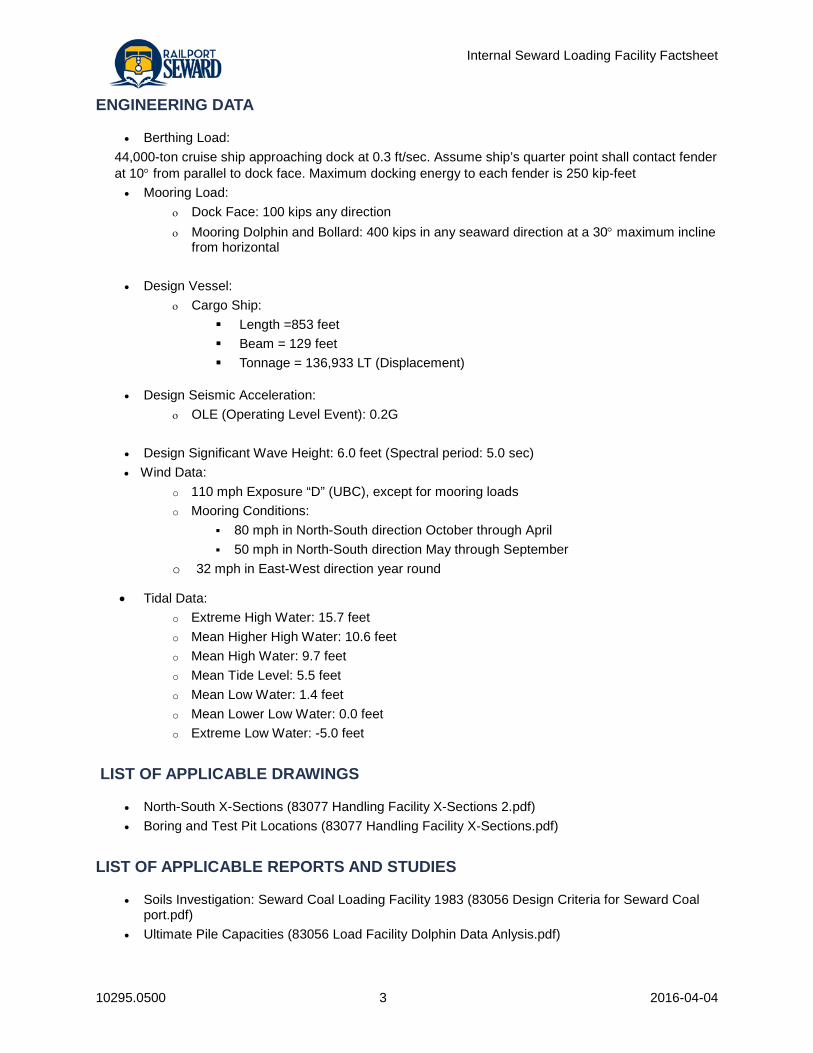
Internal Seward Loading Facility Factsheet
10295.0500 3 2016-04-04
ENGINEERING DATA
• Berthing Load: 44,000-ton cruise ship approaching dock at 0.3 ft/sec. Assume ship’s quarter point shall contact fender at 10° from parallel to dock face. Maximum docking energy to each fender is 250 kip-feet • Mooring Load:
ο Dock Face: 100 kips any direction ο Mooring Dolphin and Bollard: 400 kips in any seaward direction at a 30° maximum incline
from horizontal
• Design Vessel: ο Cargo Ship:
Length =853 feet Beam = 129 feet Tonnage = 136,933 LT (Displacement)
• Design Seismic Acceleration: ο OLE (Operating Level Event): 0.2G
• Design Significant Wave Height: 6.0 feet (Spectral period: 5.0 sec) • Wind Data:
o 110 mph Exposure “D” (UBC), except for mooring loads o Mooring Conditions:
80 mph in North-South direction October through April 50 mph in North-South direction May through September
o 32 mph in East-West direction year round
• Tidal Data: o Extreme High Water: 15.7 feet o Mean Higher High Water: 10.6 feet o Mean High Water: 9.7 feet o Mean Tide Level: 5.5 feet o Mean Low Water: 1.4 feet o Mean Lower Low Water: 0.0 feet o Extreme Low Water: -5.0 feet
LIST OF APPLICABLE DRAWINGS
• North-South X-Sections (83077 Handling Facility X-Sections 2.pdf) • Boring and Test Pit Locations (83077 Handling Facility X-Sections.pdf)
LIST OF APPLICABLE REPORTS AND STUDIES
• Soils Investigation: Seward Coal Loading Facility 1983 (83056 Design Criteria for Seward Coal port.pdf)
• Ultimate Pile Capacities (83056 Load Facility Dolphin Data Anlysis.pdf)
Internal Seward Loading Facility Factsheet
10295.0500 4 2016-04-04
• Wind Rose Chart (83056 Seward Wind Rose 1985.pdf) • 93077 Coal Handling Facility Project Description.pdf • Report of Geotechnical Investigation: Seward Coal Handling Facility (83077 Handling Facility Geo
Report.pdf) • Pile, Log and Driving Record ( 83077 Pile, Log and Driving Record.pdf) • Inspections report following Phase II-B (88088 Coal Port Underwater Inspection Report.pdf) • Evaluation of Seward Coal Terminal Docking and Mooring Structures (95063 Evaluation of Coal
Terminal Docking and Mooring Structures.pdf)
RECENT IMPROVEMENTS
• 2009: ο Installed additional dust control spray bars along conveyor belts and stacker-reclaimer. ο Sealed several openings throughout the dust control system. ο Winterized necessary components of the dust control system to include frost-free valve
and spray bars as well as insulation for the water pump house, water lines, and heating lines.
ο Replaced the ship loader transfer chute to minimize incidental spillage and breakdown time.
ο Added scrapers and wipers to the ship loader belts. ο Installed drip pans beneath the conveyor belt that extends above Resurrection Bay
connecting the ship loader to the stockpile yard.
DEFICIENCIES AND AREAS OF CONCERN
Issues Identified by ARRC Staff • The dock meets existing needs and is believed to be adequate to accommodate any anticipated
growth in demand. • Significant maintenance will be required to bring the loader back into service. • Potential to decommission the facility due to escalating maintenance costs and diminishing
demand for coal. Decision to be made May 2016.
Issues Identified by External Stakeholders • The dock is high and narrow and has limited vehicle access. • Larger ships can interfere with cruise ship access to the Passenger Dock.
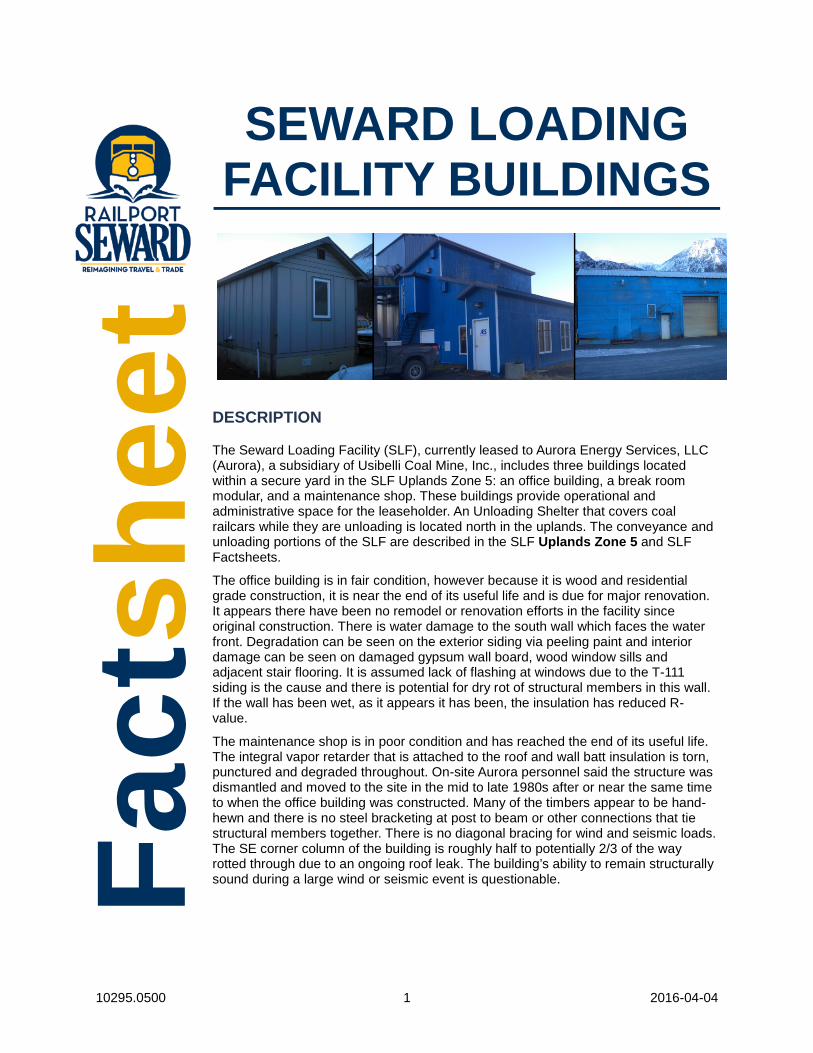
10295.0500 1 2016-04-04
SEWARD LOADING FACILITY BUILDINGS
DESCRIPTION
The Seward Loading Facility (SLF), currently leased to Aurora Energy Services, LLC (Aurora), a subsidiary of Usibelli Coal Mine, Inc., includes three buildings located within a secure yard in the SLF Uplands Zone 5: an office building, a break room modular, and a maintenance shop. These buildings provide operational and administrative space for the leaseholder. An Unloading Shelter that covers coal railcars while they are unloading is located north in the uplands. The conveyance and unloading portions of the SLF are described in the SLF Uplands Zone 5 and SLF Factsheets.
The office building is in fair condition, however because it is wood and residential grade construction, it is near the end of its useful life and is due for major renovation. It appears there have been no remodel or renovation efforts in the facility since original construction. There is water damage to the south wall which faces the water front. Degradation can be seen on the exterior siding via peeling paint and interior damage can be seen on damaged gypsum wall board, wood window sills and adjacent stair flooring. It is assumed lack of flashing at windows due to the T-111 siding is the cause and there is potential for dry rot of structural members in this wall. If the wall has been wet, as it appears it has been, the insulation has reduced R-value.
The maintenance shop is in poor condition and has reached the end of its useful life. The integral vapor retarder that is attached to the roof and wall batt insulation is torn, punctured and degraded throughout. On-site Aurora personnel said the structure was dismantled and moved to the site in the mid to late 1980s after or near the same time to when the office building was constructed. Many of the timbers appear to be hand-hewn and there is no steel bracketing at post to beam or other connections that tie structural members together. There is no diagonal bracing for wind and seismic loads. The SE corner column of the building is roughly half to potentially 2/3 of the way rotted through due to an ongoing roof leak. The building’s ability to remain structurally sound during a large wind or seismic event is questionable.
Fact
shee
t
Internal Seward Loading Facility Buildings Factsheet
10295.0500 2 2016-04-04
The break room modular is in good condition as it is relatively new, having been added to the site within the last 3 to 5 years. Finishes and bathroom areas inside are heavily used with industrial type of workers using the facility. Due to the temporary nature of the structure and finishes combined with the heavy use, it will likely need to be renovated within the next 10 years.
The unloading shelter condition is fair in the occupied areas and good in the open to air portions. The majority of this structure is an open-air shelter with enclosed controls areas on the west or conveyance side of the facility. Enclosed areas were not open for observation, but their condition is reported as fair by ARRC.
General information • Construction Date: Floor Plans are dated December 1983, ground breaking was July 1984, and
assumed completion is 1985. • Years in Service: 31 • Structure Type: • Office building: wood studs with T-111 sheathed shear walls and siding, stem wall foundation with
concrete slab-on-grade, and gabled roof with metal cladding. • Maintenance shop: timber frame with batt insulation and plywood siding, concrete slab-on-grade,
batt insulated metal-clad gabled roof. • Break room modular: wood framed trailer with flat plywood siding and battens. Asphalt shingle
roof. New within last 3 to 5 years. • Unloading shelter: steel framed, with corrugated fiberglass reinforced siding and metal corrugated
roofing.
Primary Features • Buildings within the secured yard are bordered to the east by the conveyance and measuring
tower where the coal is elevated, distributed in the tower back to grade level and then enters a gradually rising portion of the conveyor to the ship loading area. The unloading shelter is to the north of the Uplands and is the starting point of the coal distribution system on the Seward Railroad Reserve.
OPERATIONAL DETAILS
Office Building • The upper room is the control station for the SLF conveyance and loading systems • The lower level is an office area with:
ο four workstations; ο shower/bath facility; ο large electrical room that serves the controls/distribution; and ο typical office level of storage.
• There are two small connexes off the south side of the building with unknown contents. • Most safety features focus on the high voltage electrical service that operates the conveyor. • On-site information was provided by Rocky Elhard with Aurora who has been at location for 9
years. • There are currently three occupants in the SLF permit area which includes both Uplands and
Marine Zones. • Last year, the occupant count was 7 and there was a high of 22 approximately 3 or more years
ago.
Internal Seward Loading Facility Buildings Factsheet
10295.0500 3 2016-04-04
Maintenance Shop • Overhead door and man door • 20-foot connex at south end of structure with roof covering interstitial space and top of connex • A small Bobcat is parked inside • Significant storage space as well as various work benches and welding area
Break Room Modular • Contains a small kitchenette with break room area • Has stacked washer and dryer and two restrooms, one with a shower • Houses handheld radios and base • Stores safety clothing and file cabinets
LIST OF APPLICABLE DRAWINGS
• Floor plans and exterior elevations from 1983 Construction Documents are located in 2nd floor of Office Building. Photos of plans are included at the end of this document.
DEFICIENCIES AND AREAS OF CONCERN
Issues Identified by ARRC Staff
• Concern over high electrical costs despite little operational activity has been noted. This is understandable with all of the buildings using electricity for all or some portion of their heating needs as well as the age and energy inefficiency design of the structures.
Issues Identified by External Stakeholders
• The structural degradation of the corner post of the maintenance shop, which is described above, was pointed out by on-site Aurora staff.
• Aurora on-site staff also noted that during high winds and rains, water leaks through the south wall at window openings. Damage caused by this leakage is noted in more detail above.
ENGINEERING DATA/CODE & CONDITIONS SURVEY
GENERAL INFORMATION Building Name/Location: SLF Office Purpose of Facility: Office space for lease holder/permit Supervising Department: Services Provided: Grid Power, city sewer and water, propane and electrical
heat Date of Construction: 1984 to 1985 Date of Renovation: Appears to not have been renovated General Condition: Fair Land Ownership: ARRC Lot Size:
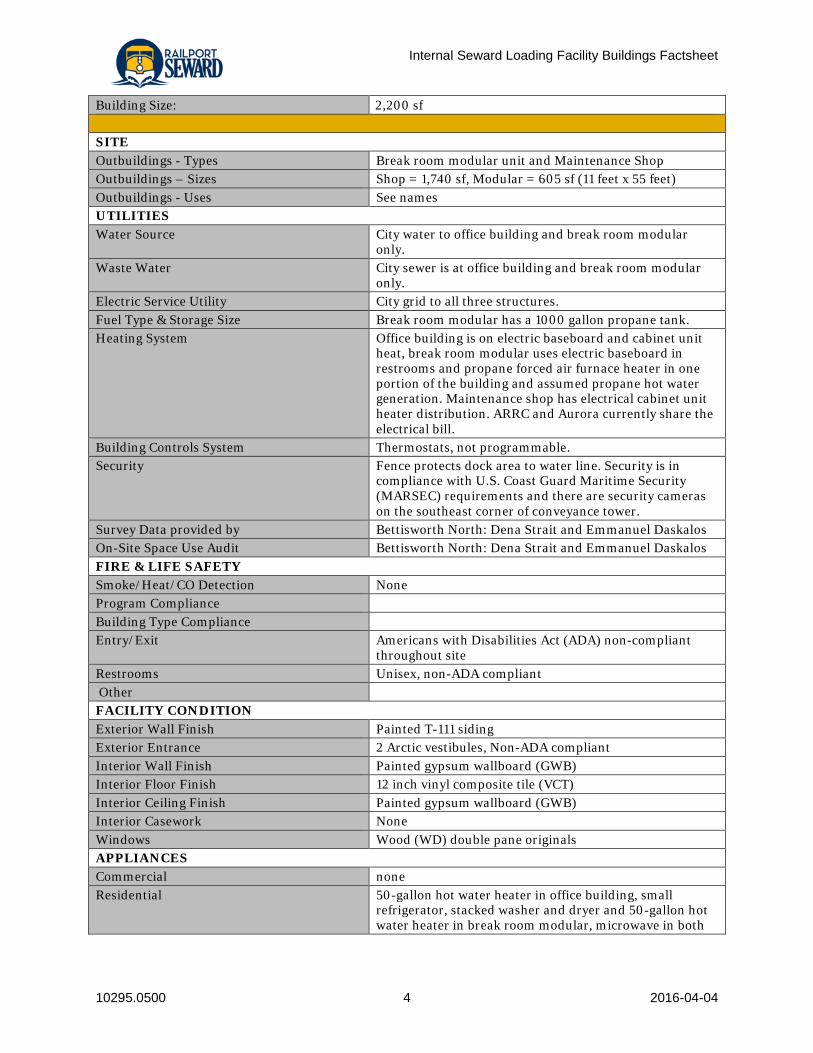
Internal Seward Loading Facility Buildings Factsheet
10295.0500 4 2016-04-04
Building Size: 2,200 sf
SITE Outbuildings - Types Break room modular unit and Maintenance Shop Outbuildings – Sizes Shop = 1,740 sf, Modular = 605 sf (11 feet x 55 feet) Outbuildings - Uses See names UTILITIES Water Source City water to office building and break room modular
only. Waste Water City sewer is at office building and break room modular
only. Electric Service Utility City grid to all three structures. Fuel Type & Storage Size Break room modular has a 1000 gallon propane tank. Heating System Office building is on electric baseboard and cabinet unit
heat, break room modular uses electric baseboard in restrooms and propane forced air furnace heater in one portion of the building and assumed propane hot water generation. Maintenance shop has electrical cabinet unit heater distribution. ARRC and Aurora currently share the electrical bill.
Building Controls System Thermostats, not programmable. Security Fence protects dock area to water line. Security is in
compliance with U.S. Coast Guard Maritime Security (MARSEC) requirements and there are security cameras on the southeast corner of conveyance tower.
Survey Data provided by Bettisworth North: Dena Strait and Emmanuel Daskalos On-Site Space Use Audit Bettisworth North: Dena Strait and Emmanuel Daskalos FIRE & LIFE SAFETY Smoke/Heat/CO Detection None Program Compliance Building Type Compliance Entry/Exit Americans with Disabilities Act (ADA) non-compliant
throughout site Restrooms Unisex, non-ADA compliant Other FACILITY CONDITION Exterior Wall Finish Painted T-111 siding Exterior Entrance 2 Arctic vestibules, Non-ADA compliant Interior Wall Finish Painted gypsum wallboard (GWB) Interior Floor Finish 12 inch vinyl composite tile (VCT) Interior Ceiling Finish Painted gypsum wallboard (GWB) Interior Casework None Windows Wood (WD) double pane originals APPLIANCES Commercial none Residential 50-gallon hot water heater in office building, small
refrigerator, stacked washer and dryer and 50-gallon hot water heater in break room modular, microwave in both
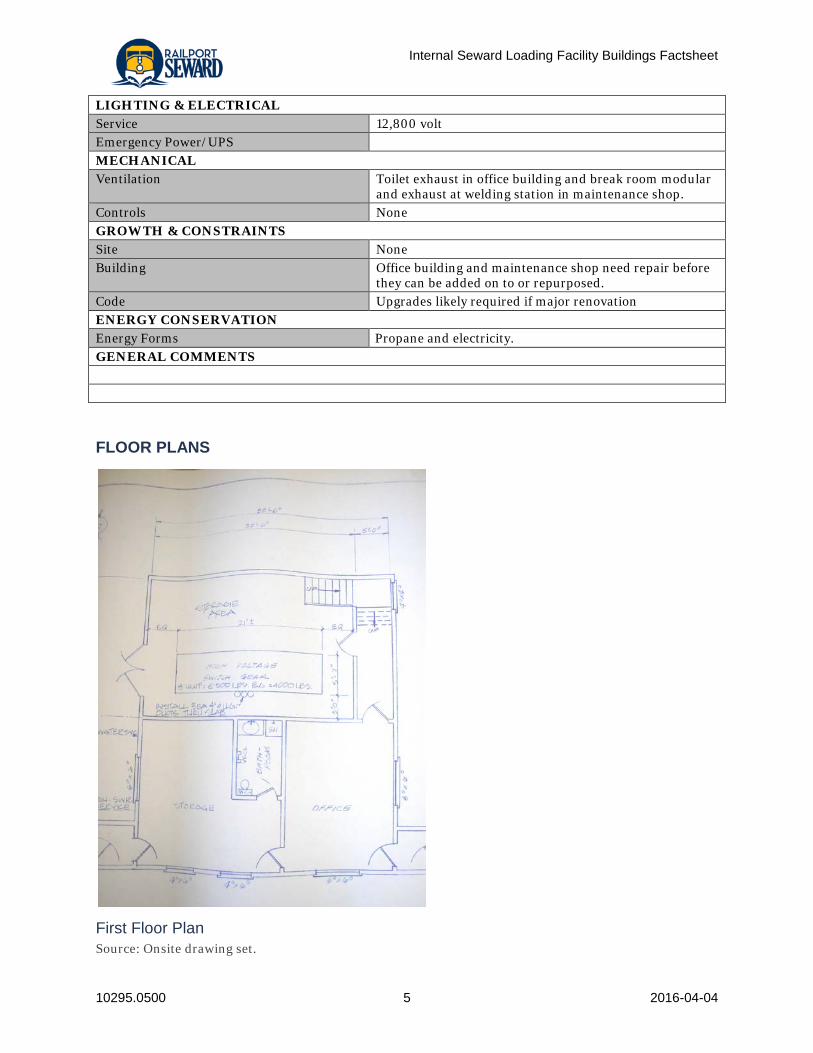
Internal Seward Loading Facility Buildings Factsheet
10295.0500 5 2016-04-04
LIGHTING & ELECTRICAL Service 12,800 volt Emergency Power/UPS MECHANICAL Ventilation Toilet exhaust in office building and break room modular
and exhaust at welding station in maintenance shop. Controls None GROWTH & CONSTRAINTS Site None Building Office building and maintenance shop need repair before
they can be added on to or repurposed. Code Upgrades likely required if major renovation ENERGY CONSERVATION Energy Forms Propane and electricity. GENERAL COMMENTS
FLOOR PLANS
First Floor Plan Source: Onsite drawing set.
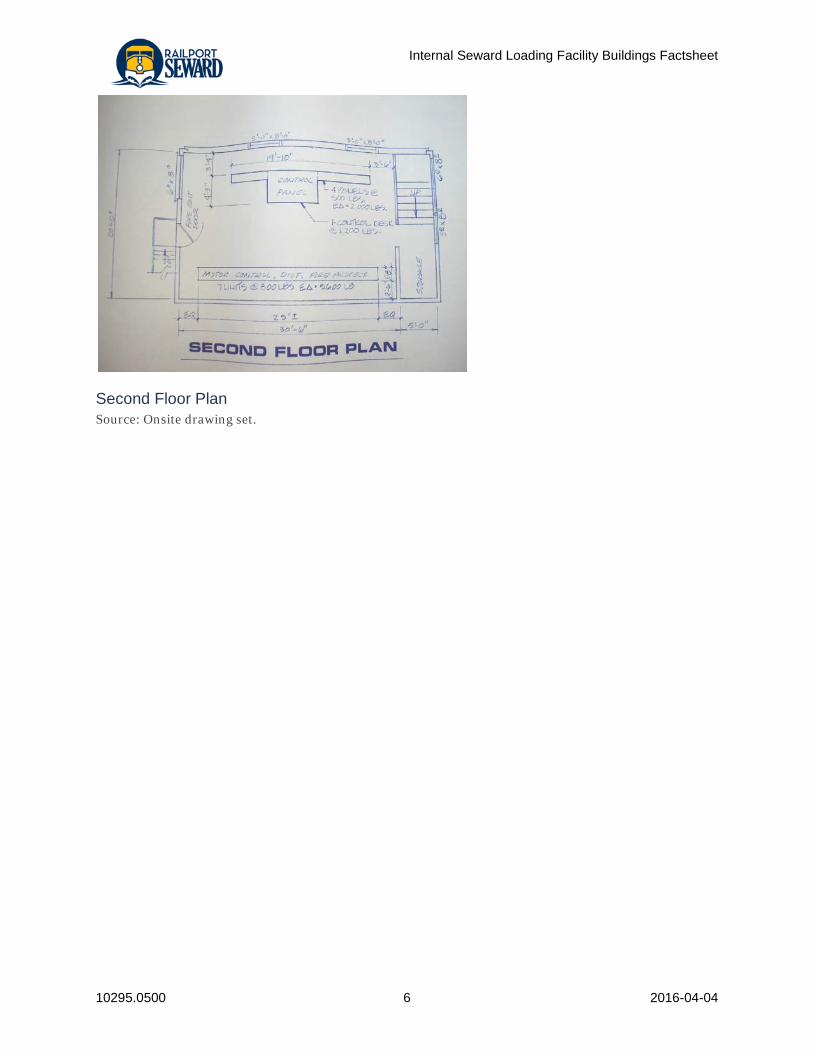
Internal Seward Loading Facility Buildings Factsheet
10295.0500 6 2016-04-04
Second Floor Plan Source: Onsite drawing set.
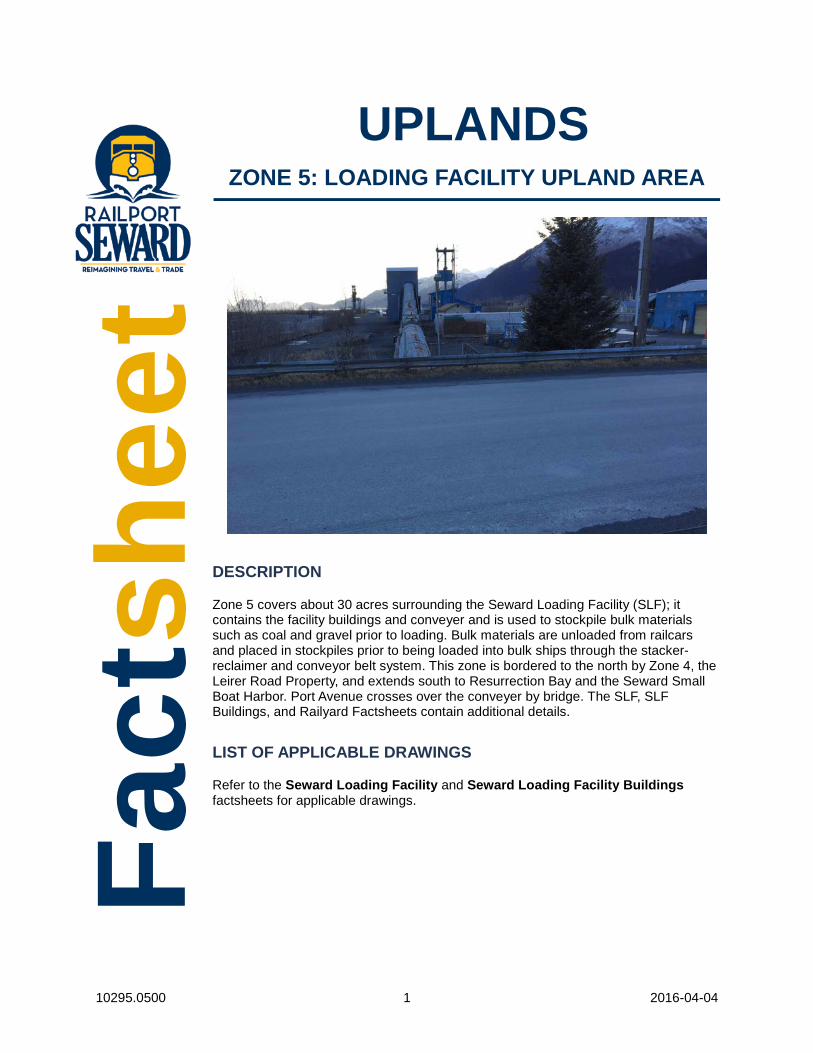
10295.0500 1 2016-04-04
UPLANDS ZONE 5: LOADING FACILITY UPLAND AREA
DESCRIPTION
Zone 5 covers about 30 acres surrounding the Seward Loading Facility (SLF); it contains the facility buildings and conveyer and is used to stockpile bulk materials such as coal and gravel prior to loading. Bulk materials are unloaded from railcars and placed in stockpiles prior to being loaded into bulk ships through the stacker-reclaimer and conveyor belt system. This zone is bordered to the north by Zone 4, the Leirer Road Property, and extends south to Resurrection Bay and the Seward Small Boat Harbor. Port Avenue crosses over the conveyer by bridge. The SLF, SLF Buildings, and Railyard Factsheets contain additional details.
LIST OF APPLICABLE DRAWINGS
Refer to the Seward Loading Facility and Seward Loading Facility Buildings factsheets for applicable drawings.
Fact
shee
t
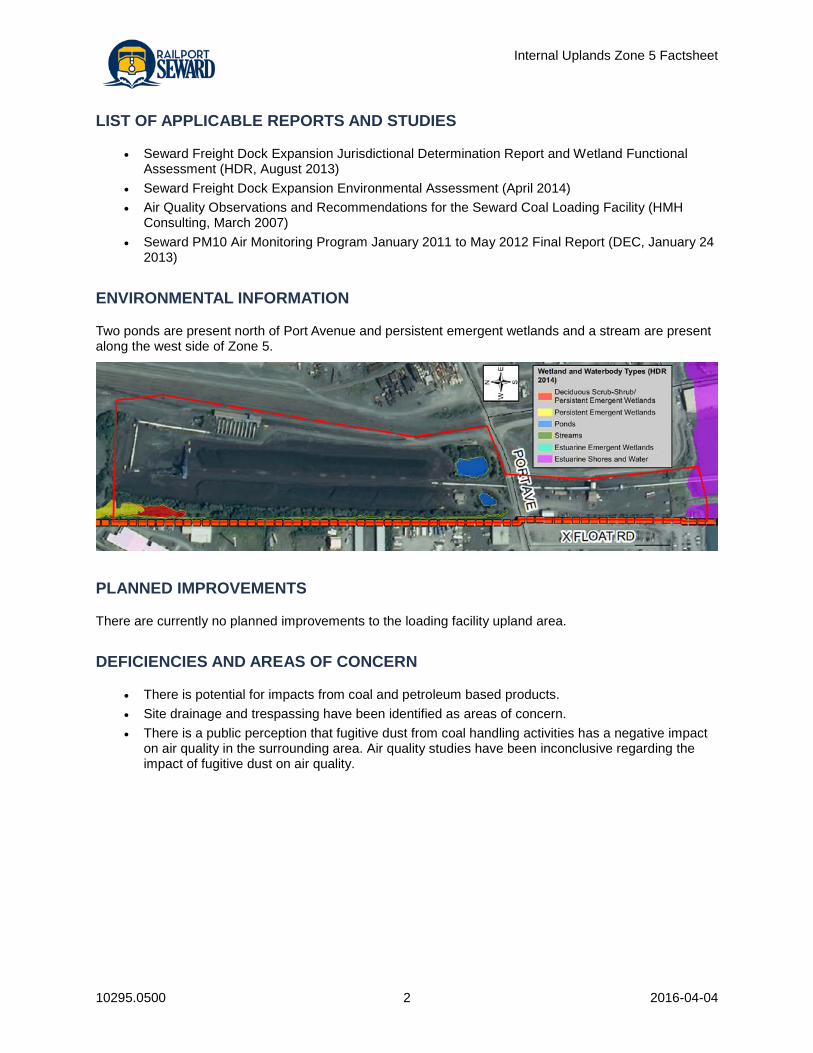
Internal Uplands Zone 5 Factsheet
10295.0500 2 2016-04-04
LIST OF APPLICABLE REPORTS AND STUDIES
• Seward Freight Dock Expansion Jurisdictional Determination Report and Wetland Functional Assessment (HDR, August 2013)
• Seward Freight Dock Expansion Environmental Assessment (April 2014) • Air Quality Observations and Recommendations for the Seward Coal Loading Facility (HMH
Consulting, March 2007) • Seward PM10 Air Monitoring Program January 2011 to May 2012 Final Report (DEC, January 24
2013)
ENVIRONMENTAL INFORMATION
Two ponds are present north of Port Avenue and persistent emergent wetlands and a stream are present along the west side of Zone 5.
PLANNED IMPROVEMENTS
There are currently no planned improvements to the loading facility upland area.
DEFICIENCIES AND AREAS OF CONCERN
• There is potential for impacts from coal and petroleum based products. • Site drainage and trespassing have been identified as areas of concern. • There is a public perception that fugitive dust from coal handling activities has a negative impact
on air quality in the surrounding area. Air quality studies have been inconclusive regarding the impact of fugitive dust on air quality.
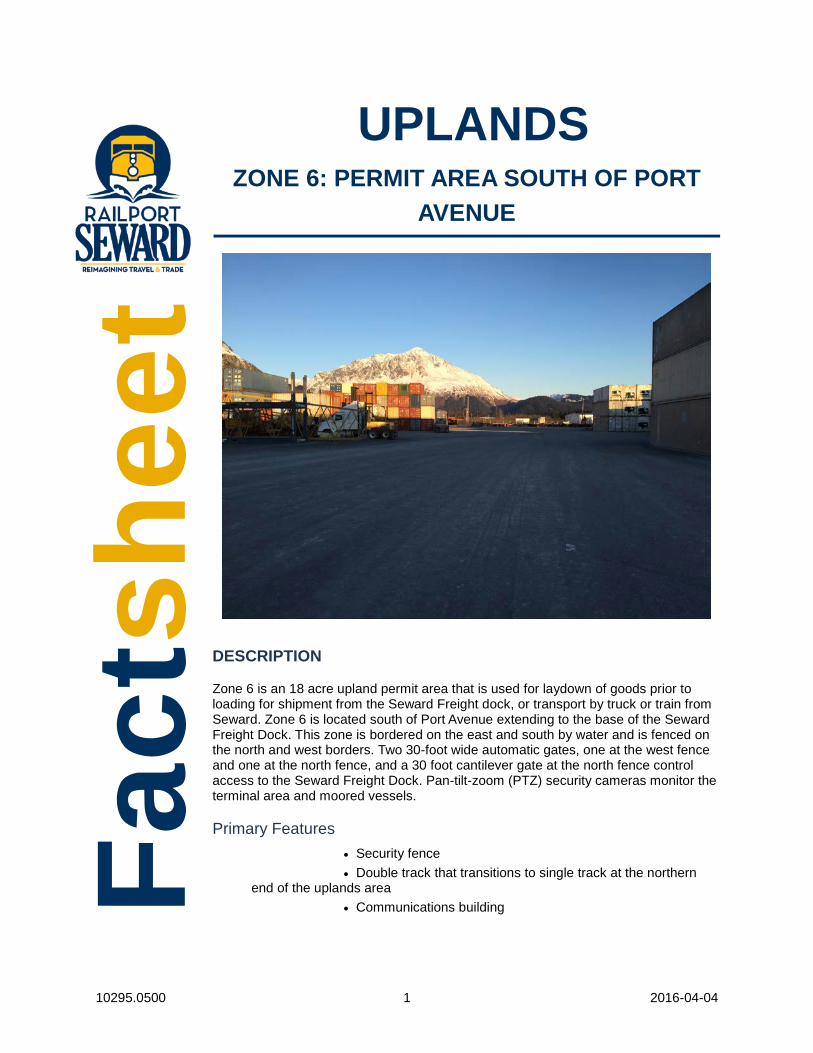
10295.0500 1 2016-04-04
UPLANDS ZONE 6: PERMIT AREA SOUTH OF PORT
AVENUE
DESCRIPTION
Zone 6 is an 18 acre upland permit area that is used for laydown of goods prior to loading for shipment from the Seward Freight dock, or transport by truck or train from Seward. Zone 6 is located south of Port Avenue extending to the base of the Seward Freight Dock. This zone is bordered on the east and south by water and is fenced on the north and west borders. Two 30-foot wide automatic gates, one at the west fence and one at the north fence, and a 30 foot cantilever gate at the north fence control access to the Seward Freight Dock. Pan-tilt-zoom (PTZ) security cameras monitor the terminal area and moored vessels.
Primary Features • Security fence • Double track that transitions to single track at the northern
end of the uplands area • Communications building Fa
ctsh
eet
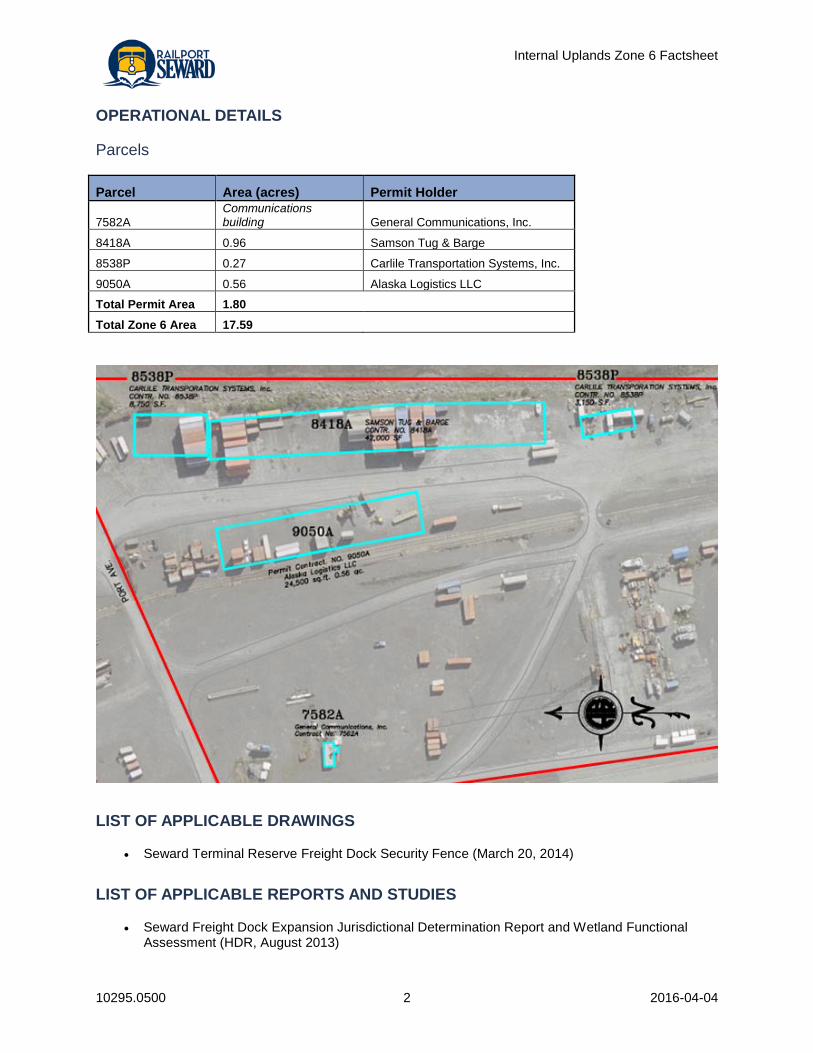
Internal Uplands Zone 6 Factsheet
10295.0500 2 2016-04-04
OPERATIONAL DETAILS
Parcels
Parcel Area (acres) Permit Holder
7582A Communications building General Communications, Inc.
8418A 0.96 Samson Tug & Barge
8538P 0.27 Carlile Transportation Systems, Inc.
9050A 0.56 Alaska Logistics LLC
Total Permit Area 1.80
Total Zone 6 Area 17.59
LIST OF APPLICABLE DRAWINGS
• Seward Terminal Reserve Freight Dock Security Fence (March 20, 2014)
LIST OF APPLICABLE REPORTS AND STUDIES
• Seward Freight Dock Expansion Jurisdictional Determination Report and Wetland Functional Assessment (HDR, August 2013)
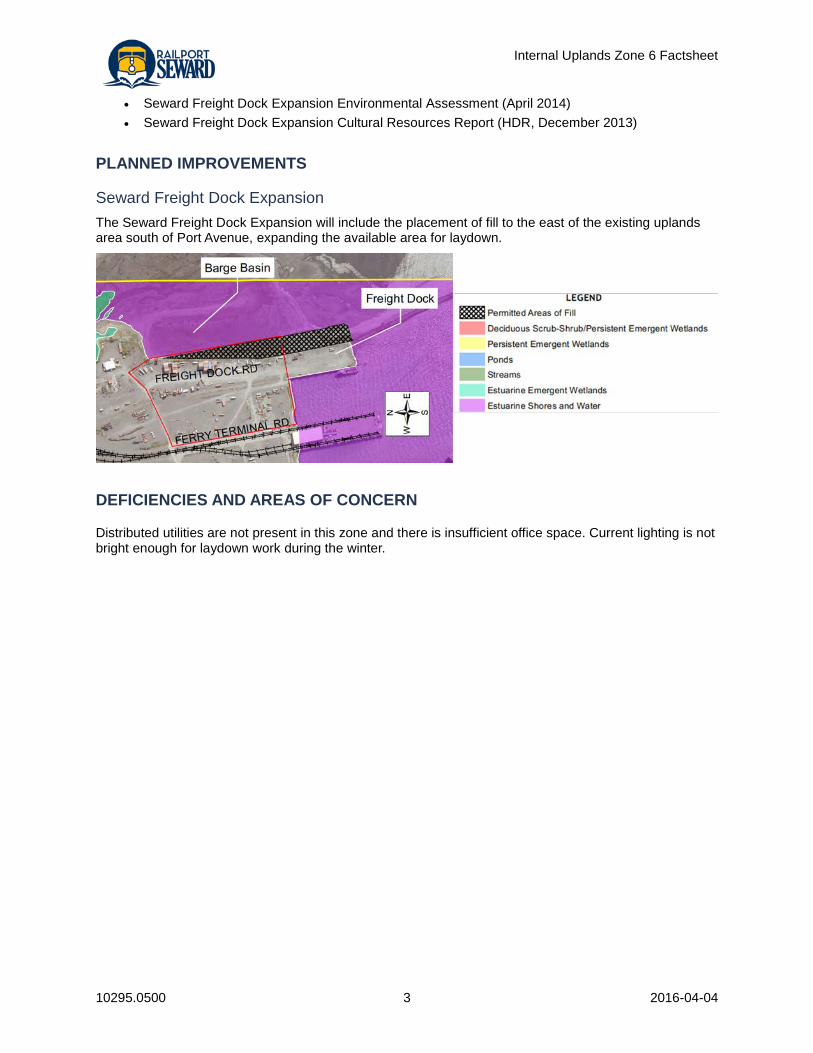
Internal Uplands Zone 6 Factsheet
10295.0500 3 2016-04-04
• Seward Freight Dock Expansion Environmental Assessment (April 2014) • Seward Freight Dock Expansion Cultural Resources Report (HDR, December 2013)
PLANNED IMPROVEMENTS
Seward Freight Dock Expansion The Seward Freight Dock Expansion will include the placement of fill to the east of the existing uplands area south of Port Avenue, expanding the available area for laydown.
DEFICIENCIES AND AREAS OF CONCERN
Distributed utilities are not present in this zone and there is insufficient office space. Current lighting is not bright enough for laydown work during the winter.

This page left intentionally blank.
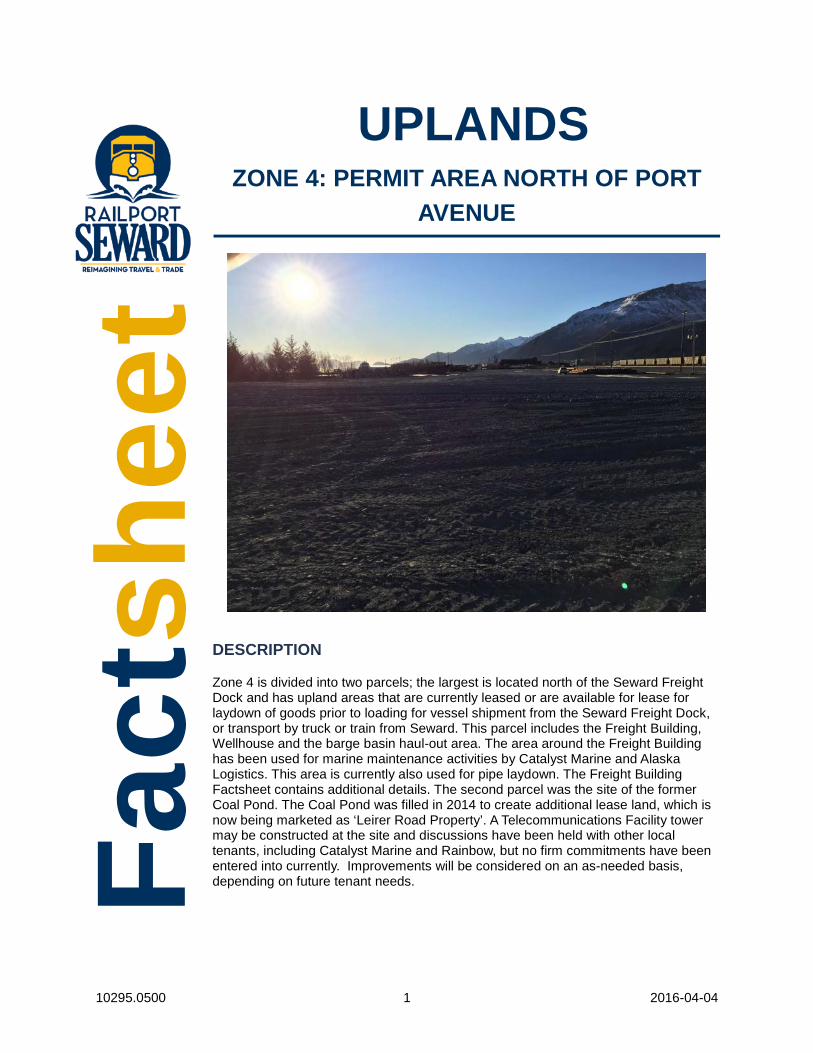
10295.0500 1 2016-04-04
UPLANDS ZONE 4: PERMIT AREA NORTH OF PORT
AVENUE
DESCRIPTION
Zone 4 is divided into two parcels; the largest is located north of the Seward Freight Dock and has upland areas that are currently leased or are available for lease for laydown of goods prior to loading for vessel shipment from the Seward Freight Dock, or transport by truck or train from Seward. This parcel includes the Freight Building, Wellhouse and the barge basin haul-out area. The area around the Freight Building has been used for marine maintenance activities by Catalyst Marine and Alaska Logistics. This area is currently also used for pipe laydown. The Freight Building Factsheet contains additional details. The second parcel was the site of the former Coal Pond. The Coal Pond was filled in 2014 to create additional lease land, which is now being marketed as ‘Leirer Road Property’. A Telecommunications Facility tower may be constructed at the site and discussions have been held with other local tenants, including Catalyst Marine and Rainbow, but no firm commitments have been entered into currently. Improvements will be considered on an as-needed basis, depending on future tenant needs. Fa
ctsh
eet
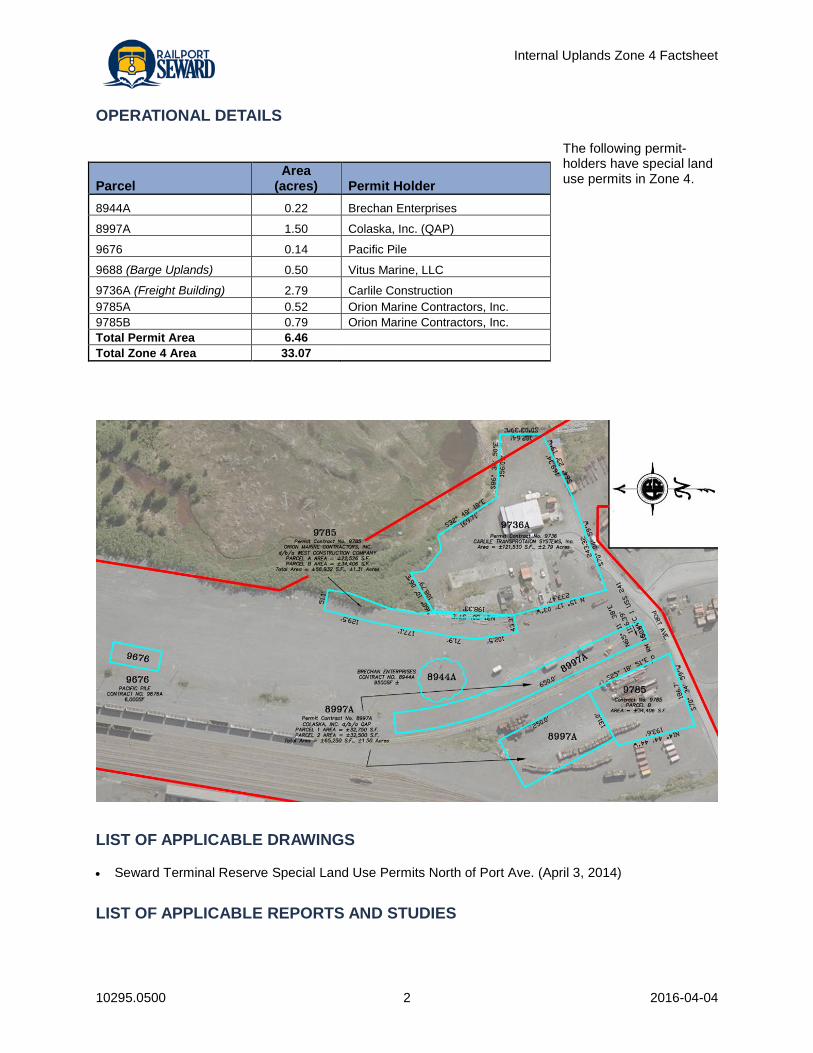
Internal Uplands Zone 4 Factsheet
10295.0500 2 2016-04-04
OPERATIONAL DETAILS
The following permit-holders have special land use permits in Zone 4.
LIST OF APPLICABLE DRAWINGS
• Seward Terminal Reserve Special Land Use Permits North of Port Ave. (April 3, 2014)
LIST OF APPLICABLE REPORTS AND STUDIES
Parcel Area
(acres) Permit Holder 8944A 0.22 Brechan Enterprises
8997A 1.50 Colaska, Inc. (QAP)
9676 0.14 Pacific Pile
9688 (Barge Uplands) 0.50 Vitus Marine, LLC
9736A (Freight Building) 2.79 Carlile Construction 9785A 0.52 Orion Marine Contractors, Inc. 9785B 0.79 Orion Marine Contractors, Inc. Total Permit Area 6.46 Total Zone 4 Area 33.07
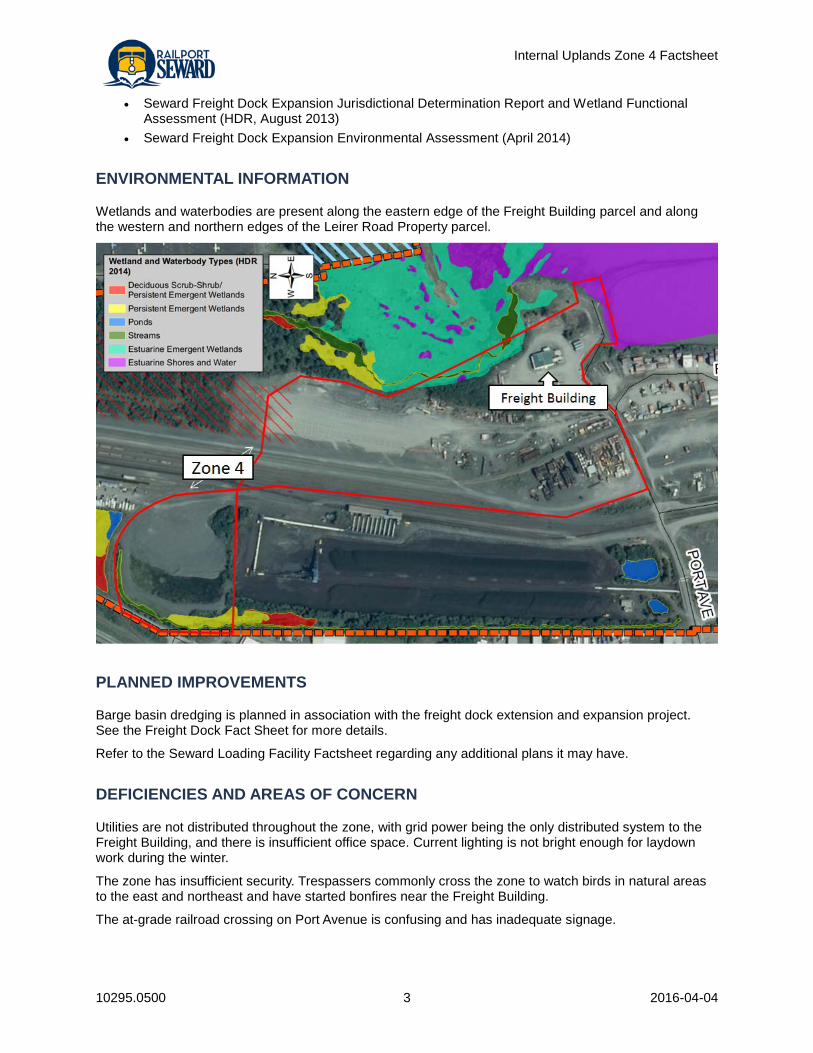
Internal Uplands Zone 4 Factsheet
10295.0500 3 2016-04-04
• Seward Freight Dock Expansion Jurisdictional Determination Report and Wetland Functional Assessment (HDR, August 2013)
• Seward Freight Dock Expansion Environmental Assessment (April 2014)
ENVIRONMENTAL INFORMATION
Wetlands and waterbodies are present along the eastern edge of the Freight Building parcel and along the western and northern edges of the Leirer Road Property parcel.
PLANNED IMPROVEMENTS
Barge basin dredging is planned in association with the freight dock extension and expansion project. See the Freight Dock Fact Sheet for more details.
Refer to the Seward Loading Facility Factsheet regarding any additional plans it may have.
DEFICIENCIES AND AREAS OF CONCERN
Utilities are not distributed throughout the zone, with grid power being the only distributed system to the Freight Building, and there is insufficient office space. Current lighting is not bright enough for laydown work during the winter.
The zone has insufficient security. Trespassers commonly cross the zone to watch birds in natural areas to the east and northeast and have started bonfires near the Freight Building.
The at-grade railroad crossing on Port Avenue is confusing and has inadequate signage.

This page left intentionally blank.
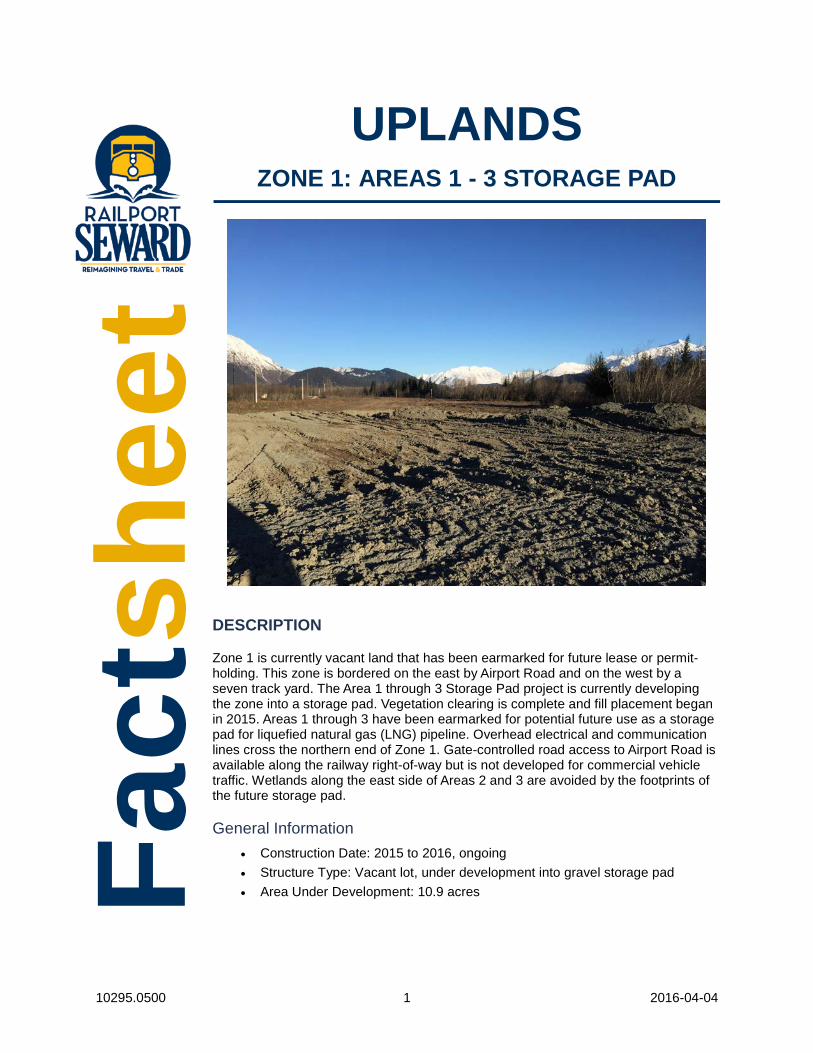
10295.0500 1 2016-04-04
UPLANDS ZONE 1: AREAS 1 - 3 STORAGE PAD
DESCRIPTION
Zone 1 is currently vacant land that has been earmarked for future lease or permit-holding. This zone is bordered on the east by Airport Road and on the west by a seven track yard. The Area 1 through 3 Storage Pad project is currently developing the zone into a storage pad. Vegetation clearing is complete and fill placement began in 2015. Areas 1 through 3 have been earmarked for potential future use as a storage pad for liquefied natural gas (LNG) pipeline. Overhead electrical and communication lines cross the northern end of Zone 1. Gate-controlled road access to Airport Road is available along the railway right-of-way but is not developed for commercial vehicle traffic. Wetlands along the east side of Areas 2 and 3 are avoided by the footprints of the future storage pad.
General Information • Construction Date: 2015 to 2016, ongoing • Structure Type: Vacant lot, under development into gravel storage pad • Area Under Development: 10.9 acres Fact
shee
t
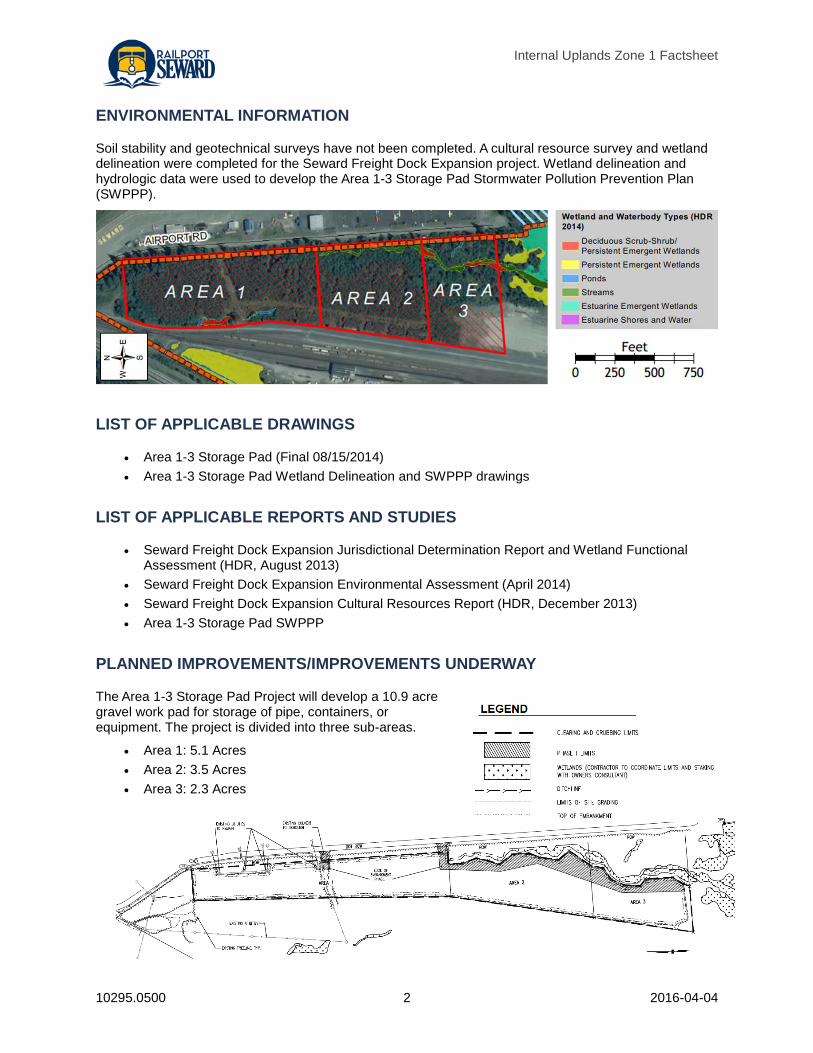
Internal Uplands Zone 1 Factsheet
10295.0500 2 2016-04-04
ENVIRONMENTAL INFORMATION
Soil stability and geotechnical surveys have not been completed. A cultural resource survey and wetland delineation were completed for the Seward Freight Dock Expansion project. Wetland delineation and hydrologic data were used to develop the Area 1-3 Storage Pad Stormwater Pollution Prevention Plan (SWPPP).
LIST OF APPLICABLE DRAWINGS
• Area 1-3 Storage Pad (Final 08/15/2014) • Area 1-3 Storage Pad Wetland Delineation and SWPPP drawings
LIST OF APPLICABLE REPORTS AND STUDIES
• Seward Freight Dock Expansion Jurisdictional Determination Report and Wetland Functional Assessment (HDR, August 2013)
• Seward Freight Dock Expansion Environmental Assessment (April 2014) • Seward Freight Dock Expansion Cultural Resources Report (HDR, December 2013) • Area 1-3 Storage Pad SWPPP
PLANNED IMPROVEMENTS/IMPROVEMENTS UNDERWAY
The Area 1-3 Storage Pad Project will develop a 10.9 acre gravel work pad for storage of pipe, containers, or equipment. The project is divided into three sub-areas.
• Area 1: 5.1 Acres • Area 2: 3.5 Acres • Area 3: 2.3 Acres
Internal Uplands Zone 1 Factsheet
10295.0500 3 2016-04-04
Development of the Area 1 through 3 Storage Pad is divided into two phases. Phase 1 is underway and included 10.9 acres of vegetation clearing. Metco Inc. placed granular fill that had been previously stored next to the passenger terminal parking area and provided 1,800 cubic yards of additional fill in the fall of 2015. The remainder of Phase 1 will include the construction of an embankment along the eastern edge of the fill to create a buffer for the wetlands in Area 2 and Area 3 and construction of two access roads into Area 1 to provide access from Airport Road. Phase 2 will consist of additional fill placement, compaction, and leveling in Areas 1 through 3.
DEFICIENCIES AND AREAS OF CONCERN
The lot is currently undeveloped and requires filling and compaction prior to leasing.

This page left intentionally blank.
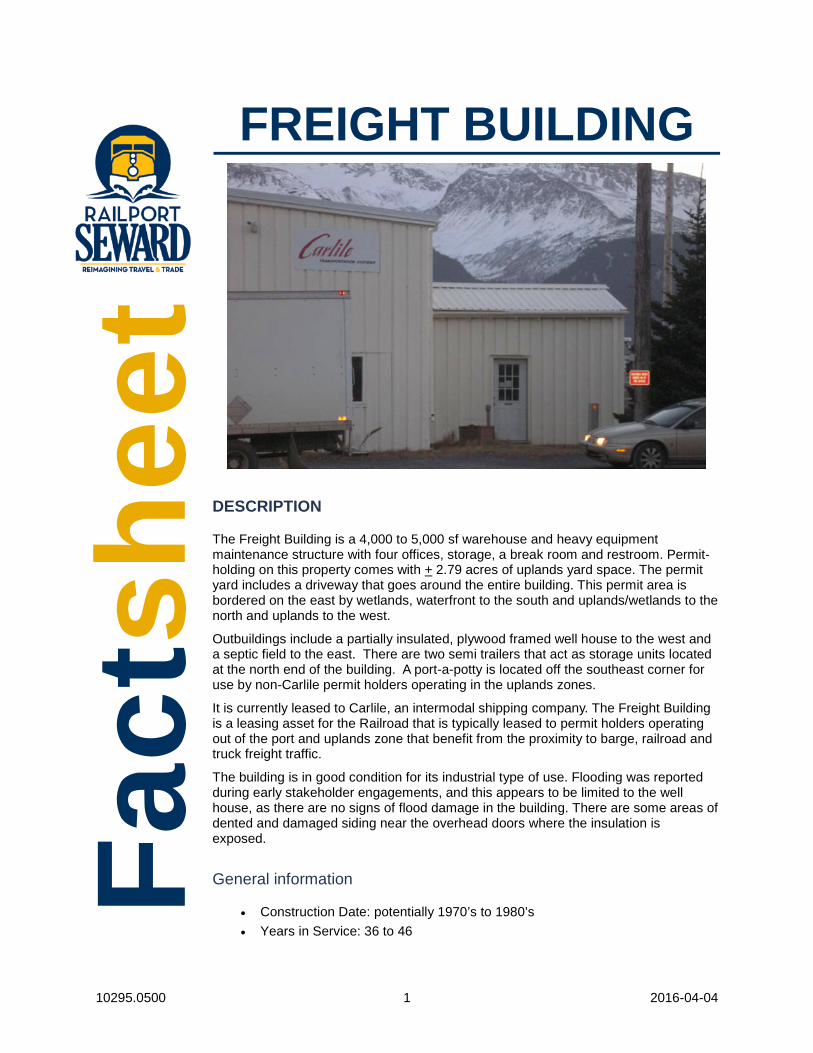
10295.0500 1 2016-04-04
FREIGHT BUILDING
DESCRIPTION
The Freight Building is a 4,000 to 5,000 sf warehouse and heavy equipment maintenance structure with four offices, storage, a break room and restroom. Permit-holding on this property comes with + 2.79 acres of uplands yard space. The permit yard includes a driveway that goes around the entire building. This permit area is bordered on the east by wetlands, waterfront to the south and uplands/wetlands to the north and uplands to the west.
Outbuildings include a partially insulated, plywood framed well house to the west and a septic field to the east. There are two semi trailers that act as storage units located at the north end of the building. A port-a-potty is located off the southeast corner for use by non-Carlile permit holders operating in the uplands zones.
It is currently leased to Carlile, an intermodal shipping company. The Freight Building is a leasing asset for the Railroad that is typically leased to permit holders operating out of the port and uplands zone that benefit from the proximity to barge, railroad and truck freight traffic.
The building is in good condition for its industrial type of use. Flooding was reported during early stakeholder engagements, and this appears to be limited to the well house, as there are no signs of flood damage in the building. There are some areas of dented and damaged siding near the overhead doors where the insulation is exposed.
General information
• Construction Date: potentially 1970’s to 1980’s • Years in Service: 36 to 46
Fact
shee
t
Internal Freight Building Factsheet
10295.0500 2 2016-04-04
• Structure Type: Steel-framed structure with a slab-on-grade floor and the walls and roof are insulated with batt insulation held between the exterior cladding and horizontal purlins. The building is clad in metal siding and roofing.
Primary Features
• Two drive-through, west to east, maintenance bays for heavy equipment, three offices, breakroom, restroom, storage, and arctic entry.
• A recent interior remodel, completed within the last 5 years, refurbished the offices, entry, bathroom, and breakroom spaces.
• Exterior metal siding has also been painted in the last 5 years.
OPERATIONAL DETAILS
• Space is administrative and operations headquarters for Carlile’s Seward operations. • A short semi and snow plow were parked in the building in mid-November 2015. Minimal
maintenance and servicing equipment and supplies were located in the shop portion. • Space is non-traditional office space, with a use schedule that varies by season and barge
schedule. Currently an employee drives to Seward daily from Anchorage to work out of the facility.
• The facility was visited in mid-November 2015 and had very little activity. It appears there are more people in the building and more activity during the summer months.
LIST OF APPLICABLE DRAWINGS
• None
LIST OF APPLICABLE REPORTS AND STUDIES
• RFI 14 Response ID 14 898800 Henderlong PH1 Report All (Hazmat report) located on project SharePoint site.
• RFI 13 Response 20120801 Carlile Lease located on project SharePoint site.
DEFICIENCIES AND AREAS OF CONCERN
Issues Identified by ARRC Staff • ARRC wants the building to remain viable to provide support for marine activities. • There have been freezing problems with the wellhouse which was insulated about two years ago,
current freezing issues were not noted although the insulation is not continuous.
Issues Identified by External Stakeholders • There is a need for restrooms for all leaseholders on the south end of the uplands who operate
near this building. • Catalyst Marine would like to have a large, self funded shop where the Freight Building is located
as it is in a strategic location for them. They noted a long-term or 99 year lease would incentivize them to construct their own shop.
Internal Freight Building Factsheet
10295.0500 3 2016-04-04
• It was suggested by users of the freight dock to have showers, bathrooms etc. available twenty-four/seven for these workers in the general vicinity of the Freight Building, Terminal or secured area of the freight yard. Modifications or a small addition to the Freight Building may be one avenue to fulfill this need.
• The well house, roughly 5 feet by 8 feet, is not well constructed or insulated and has reportedly had issues with freezing up. Site drainage appears to drain into the building from the north causing further degradation, freezing and other issues.
ENGINEERING DATA/CODE & CONDITIONS SURVEY
GENERAL INFORMATION Building Name/Location: Freight/Carlile/Henderlong Building Purpose of Facility: Offices, storage, & maintenance for lease holder/permit holder Supervising Department: Services Provided: Fuel oil heat, lights/electricity, water, well water and site septic Date of Construction: Estimated to be 1970’s to 1980’s, but unconfirmed Date of Renovation: Last 5 years General Condition: Good for industrial type of use Land Ownership: ARRC Lot Size: 2.79 acres Building Size: Approx. 4,100 sf main building plus 270sf arctic vestibule with storage.
SITE Outbuildings - Types Well house, two semi trailers (storage), port-a-potty Outbuildings – Sizes Approx, 5’ x 8’ well house and standard 30’L trailers Outbuildings - Uses See names UTILITIES Water Source Well water Waste Water Septic tank and field Electric Service Utility Fuel Type & Storage Size Fuel oil w/ 5’-4” x 7’ tank, assumed 1,000 gallons Heating System Unit heater in shop space, elect. baseboard in bathroom & offices, unheated
storage area at south end of entry vestibule (6’-10”x8’-9” inside dimensions) Building Controls System None Security 4 cameras (total) focused on office area Survey Data provided by Bettisworth North; Dena Strait On-Site Space Use Audit 2 bay, drive-through maintenance shop with third bay without overhead door
access, 1 rest room that is not Americans with Disability Act (ADA) compliant, 4offices, open storage above finished spaces and near arctic entry.
FIRE & LIFE SAFETY Smoke/Heat/CO Detection None, 4 fire extinguishers in shop Program Compliance Building Type Compliance Entry/Exit Not ADA compliant Restrooms 1 unisex, not ADA compliant Other FACILITY CONDITION Exterior Wall Finish Corrugated metal in fair condition, recently painted, some damage at
OverHead Doors (OHDs) Exterior Entrance Poor, no sidewalk
Internal Freight Building Factsheet
10295.0500 4 2016-04-04
Interior Wall Finish Vapor retarder over batt insulation, painted plywood at shop, Painted gypsum wallboard (GWB) remainder
Interior Floor Finish Painted concrete at shop, painted plywood at loft, carpet in 2 offices, Vinyl Composite Tiles (VCT) in other, painted concrete at entry
Interior Ceiling Finish Shop & loft: exposed insulation and steel beams, office: painted gypsum wallboard (GWB)
Interior Casework Wood with plastic laminate counters Windows 3 (total) double pane sliders APPLIANCES Commercial Residential 1 each refrigerator and microwave LIGHTING & ELECTRICAL Service Emergency Power/UPS MECHANICAL Ventilation Only bathroom vent on switch Controls None GROWTH & CONSTRAINTS Site Minimal expansion opportunity to east due to septic field, Resurrection River
and turning space needed for large equipment. Building None Code ENERGY CONSERVATION Energy Forms Fuel oil, electric baseboard, T-8 lights, incandescents GENERAL COMMENTS
10295.0500 1 2016-04-04
RAILYARD
DESCRIPTION
The Railyard consists of railway tracks between the Jesse Lee Main at the Airport Road grade crossing and Track #1 to the Freight Dock on Resurrection Bay. Features of the Railyard include a Wye connection to the Jesse Lee Main, three Roundhouse tracks, a coal bunker track, and a seven track yard connecting to three upper lead tracks. The Alaska Railroad Corporation (ARRC) uses the Railyard for:
Receiving freight trains from the north
Departing freight trains to the north
Sorting freight cars for delivery to local customers
Storing empty railway cars and equipment until needed
Rail car inspection and repair
Unloading coal
Turning trains via the wye
Accessing the Passenger Dock Tracks
RELATED FACTSHEETS
The Railyard is located within Uplands Zone 2: Roundhouse yard and Uplands Zone 4: Permit Area North of Port Avenue
Portions of the coal bunker track are located within area Uplands Zone 5: Loading Facility Surrounding Area
The coal bunker track is an integral component of the Seward Loading Facility
The Roundhouse is located within the Railyard and is traversed by Roundhouse Tracks #1, #2, and #3
Fa
cts
he
et
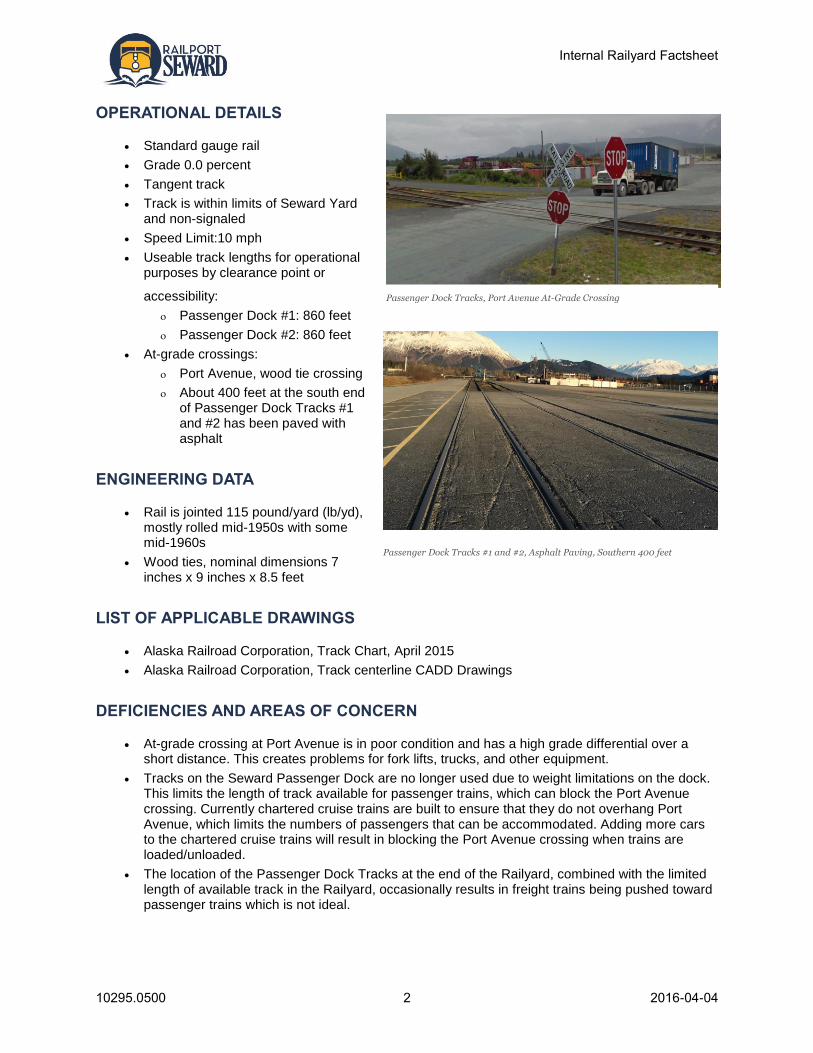
Internal Railyard Factsheet
10295.0500 2 2016-04-04
Passenger Dock Tracks #1 and #2, Asphalt Paving, Southern 400 feet
Passenger Dock Tracks, Port Avenue At-Grade Crossing
OPERATIONAL DETAILS
Standard gauge rail
Grade 0.0 percent
Tangent track
Track is within limits of Seward Yard and non-signaled
Speed Limit:10 mph
Useable track lengths for operational purposes by clearance point or
accessibility:
Passenger Dock #1: 860 feet
Passenger Dock #2: 860 feet
At-grade crossings:
Port Avenue, wood tie crossing
About 400 feet at the south end of Passenger Dock Tracks #1 and #2 has been paved with asphalt
ENGINEERING DATA
Rail is jointed 115 pound/yard (lb/yd), mostly rolled mid-1950s with some mid-1960s
Wood ties, nominal dimensions 7 inches x 9 inches x 8.5 feet
LIST OF APPLICABLE DRAWINGS
Alaska Railroad Corporation, Track Chart, April 2015
Alaska Railroad Corporation, Track centerline CADD Drawings
DEFICIENCIES AND AREAS OF CONCERN
At-grade crossing at Port Avenue is in poor condition and has a high grade differential over a short distance. This creates problems for fork lifts, trucks, and other equipment.
Tracks on the Seward Passenger Dock are no longer used due to weight limitations on the dock. This limits the length of track available for passenger trains, which can block the Port Avenue crossing. Currently chartered cruise trains are built to ensure that they do not overhang Port Avenue, which limits the numbers of passengers that can be accommodated. Adding more cars to the chartered cruise trains will result in blocking the Port Avenue crossing when trains are loaded/unloaded.
The location of the Passenger Dock Tracks at the end of the Railyard, combined with the limited length of available track in the Railyard, occasionally results in freight trains being pushed toward passenger trains which is not ideal.

A p p e n d i x B

This page left intentionally blank.
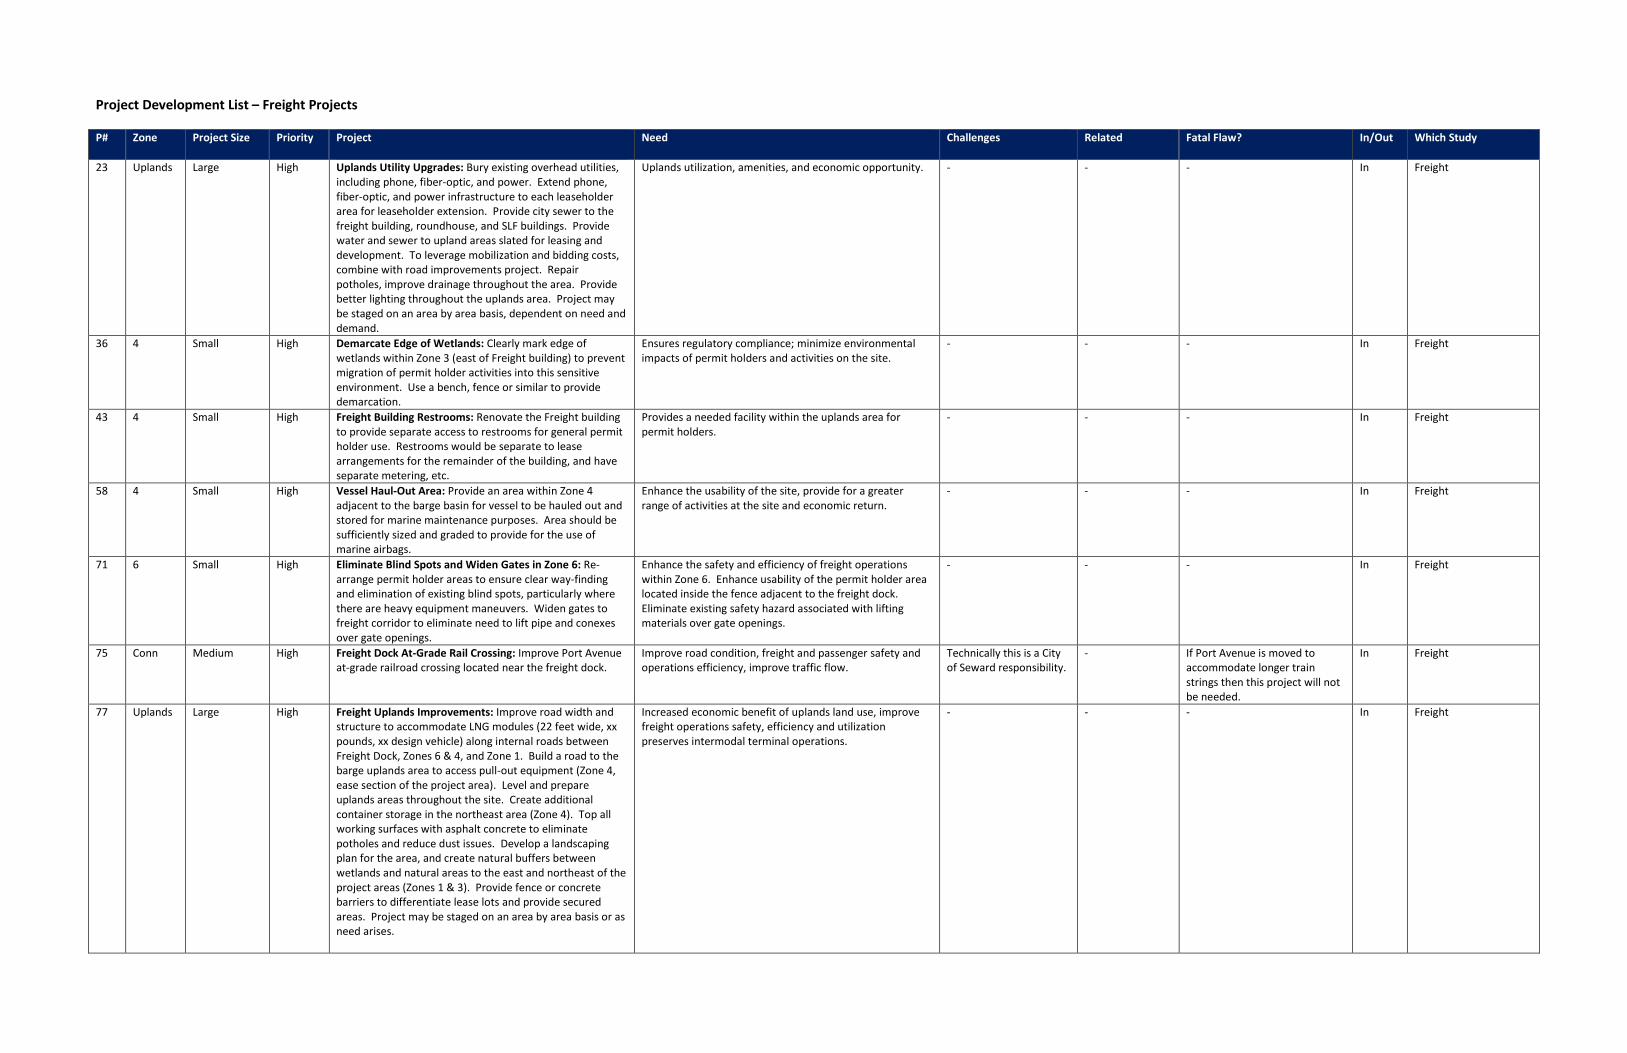
Project Development List – Freight Projects
P# Zone Project Size Priority Project
Need Challenges Related Fatal Flaw? In/Out Which Study
23 Uplands Large High Uplands Utility Upgrades: Bury existing overhead utilities, including phone, fiber-optic, and power. Extend phone, fiber-optic, and power infrastructure to each leaseholder area for leaseholder extension. Provide city sewer to the freight building, roundhouse, and SLF buildings. Provide water and sewer to upland areas slated for leasing and development. To leverage mobilization and bidding costs, combine with road improvements project. Repair potholes, improve drainage throughout the area. Provide better lighting throughout the uplands area. Project may be staged on an area by area basis, dependent on need and demand.
Uplands utilization, amenities, and economic opportunity. - - - In Freight
36 4 Small High Demarcate Edge of Wetlands: Clearly mark edge of wetlands within Zone 3 (east of Freight building) to prevent migration of permit holder activities into this sensitive environment. Use a bench, fence or similar to provide demarcation.
Ensures regulatory compliance; minimize environmental impacts of permit holders and activities on the site.
- - - In Freight
43 4 Small High Freight Building Restrooms: Renovate the Freight building to provide separate access to restrooms for general permit holder use. Restrooms would be separate to lease arrangements for the remainder of the building, and have separate metering, etc.
Provides a needed facility within the uplands area for permit holders.
- - - In Freight
58 4 Small High Vessel Haul-Out Area: Provide an area within Zone 4 adjacent to the barge basin for vessel to be hauled out and stored for marine maintenance purposes. Area should be sufficiently sized and graded to provide for the use of marine airbags.
Enhance the usability of the site, provide for a greater range of activities at the site and economic return.
- - - In Freight
71 6 Small High Eliminate Blind Spots and Widen Gates in Zone 6: Re-arrange permit holder areas to ensure clear way-finding and elimination of existing blind spots, particularly where there are heavy equipment maneuvers. Widen gates to freight corridor to eliminate need to lift pipe and conexes over gate openings.
Enhance the safety and efficiency of freight operations within Zone 6. Enhance usability of the permit holder area located inside the fence adjacent to the freight dock. Eliminate existing safety hazard associated with lifting materials over gate openings.
- - - In Freight
75 Conn Medium High Freight Dock At-Grade Rail Crossing: Improve Port Avenue at-grade railroad crossing located near the freight dock.
Improve road condition, freight and passenger safety and operations efficiency, improve traffic flow.
Technically this is a City of Seward responsibility.
- If Port Avenue is moved to accommodate longer train strings then this project will not be needed.
In Freight
77 Uplands Large High Freight Uplands Improvements: Improve road width and structure to accommodate LNG modules (22 feet wide, xx pounds, xx design vehicle) along internal roads between Freight Dock, Zones 6 & 4, and Zone 1. Build a road to the barge uplands area to access pull-out equipment (Zone 4, ease section of the project area). Level and prepare uplands areas throughout the site. Create additional container storage in the northeast area (Zone 4). Top all working surfaces with asphalt concrete to eliminate potholes and reduce dust issues. Develop a landscaping plan for the area, and create natural buffers between wetlands and natural areas to the east and northeast of the project areas (Zones 1 & 3). Provide fence or concrete barriers to differentiate lease lots and provide secured areas. Project may be staged on an area by area basis or as need arises.
Increased economic benefit of uplands land use, improve freight operations safety, efficiency and utilization preserves intermodal terminal operations.
- - - In Freight
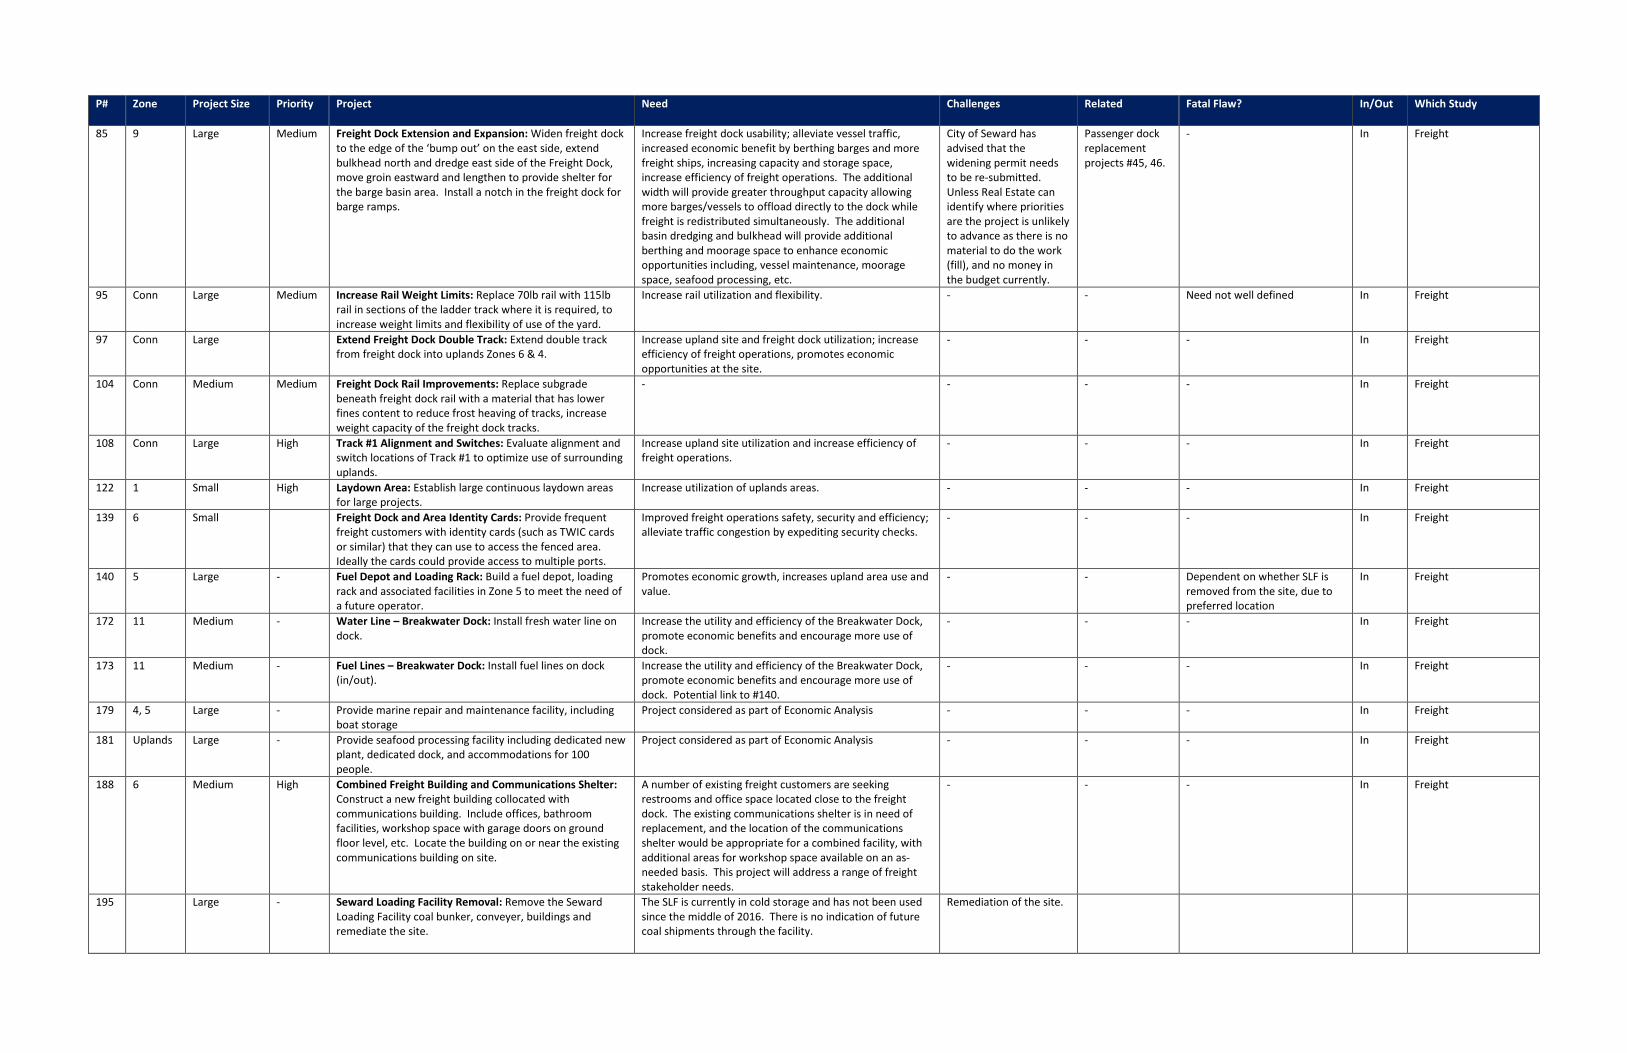
P# Zone Project Size Priority Project
Need Challenges Related Fatal Flaw? In/Out Which Study
85 9 Large Medium Freight Dock Extension and Expansion: Widen freight dock to the edge of the ‘bump out’ on the east side, extend bulkhead north and dredge east side of the Freight Dock, move groin eastward and lengthen to provide shelter for the barge basin area. Install a notch in the freight dock for barge ramps.
Increase freight dock usability; alleviate vessel traffic, increased economic benefit by berthing barges and more freight ships, increasing capacity and storage space, increase efficiency of freight operations. The additional width will provide greater throughput capacity allowing more barges/vessels to offload directly to the dock while freight is redistributed simultaneously. The additional basin dredging and bulkhead will provide additional berthing and moorage space to enhance economic opportunities including, vessel maintenance, moorage space, seafood processing, etc.
City of Seward has advised that the widening permit needs to be re-submitted. Unless Real Estate can identify where priorities are the project is unlikely to advance as there is no material to do the work (fill), and no money in the budget currently.
Passenger dock replacement projects #45, 46.
- In Freight
95 Conn Large Medium Increase Rail Weight Limits: Replace 70lb rail with 115lb rail in sections of the ladder track where it is required, to increase weight limits and flexibility of use of the yard.
Increase rail utilization and flexibility. - - Need not well defined In Freight
97 Conn Large Extend Freight Dock Double Track: Extend double track from freight dock into uplands Zones 6 & 4.
Increase upland site and freight dock utilization; increase efficiency of freight operations, promotes economic opportunities at the site.
- - - In Freight
104 Conn Medium Medium Freight Dock Rail Improvements: Replace subgrade beneath freight dock rail with a material that has lower fines content to reduce frost heaving of tracks, increase weight capacity of the freight dock tracks.
- - - - In Freight
108 Conn Large High Track #1 Alignment and Switches: Evaluate alignment and switch locations of Track #1 to optimize use of surrounding uplands.
Increase upland site utilization and increase efficiency of freight operations.
- - - In Freight
122 1 Small High Laydown Area: Establish large continuous laydown areas for large projects.
Increase utilization of uplands areas. - - - In Freight
139 6 Small Freight Dock and Area Identity Cards: Provide frequent freight customers with identity cards (such as TWIC cards or similar) that they can use to access the fenced area. Ideally the cards could provide access to multiple ports.
Improved freight operations safety, security and efficiency; alleviate traffic congestion by expediting security checks.
- - - In Freight
140 5 Large - Fuel Depot and Loading Rack: Build a fuel depot, loading rack and associated facilities in Zone 5 to meet the need of a future operator.
Promotes economic growth, increases upland area use and value.
- - Dependent on whether SLF is removed from the site, due to preferred location
In Freight
172 11 Medium - Water Line – Breakwater Dock: Install fresh water line on dock.
Increase the utility and efficiency of the Breakwater Dock, promote economic benefits and encourage more use of dock.
- - - In Freight
173 11 Medium - Fuel Lines – Breakwater Dock: Install fuel lines on dock (in/out).
Increase the utility and efficiency of the Breakwater Dock, promote economic benefits and encourage more use of dock. Potential link to #140.
- - - In Freight
179 4, 5 Large - Provide marine repair and maintenance facility, including boat storage
Project considered as part of Economic Analysis - - - In Freight
181 Uplands Large - Provide seafood processing facility including dedicated new plant, dedicated dock, and accommodations for 100 people.
Project considered as part of Economic Analysis - - - In Freight
188 6 Medium High Combined Freight Building and Communications Shelter: Construct a new freight building collocated with communications building. Include offices, bathroom facilities, workshop space with garage doors on ground floor level, etc. Locate the building on or near the existing communications building on site.
A number of existing freight customers are seeking restrooms and office space located close to the freight dock. The existing communications shelter is in need of replacement, and the location of the communications shelter would be appropriate for a combined facility, with additional areas for workshop space available on an as-needed basis. This project will address a range of freight stakeholder needs.
- - - In Freight
195 Large - Seward Loading Facility Removal: Remove the Seward Loading Facility coal bunker, conveyer, buildings and remediate the site.
The SLF is currently in cold storage and has not been used since the middle of 2016. There is no indication of future coal shipments through the facility.
Remediation of the site.
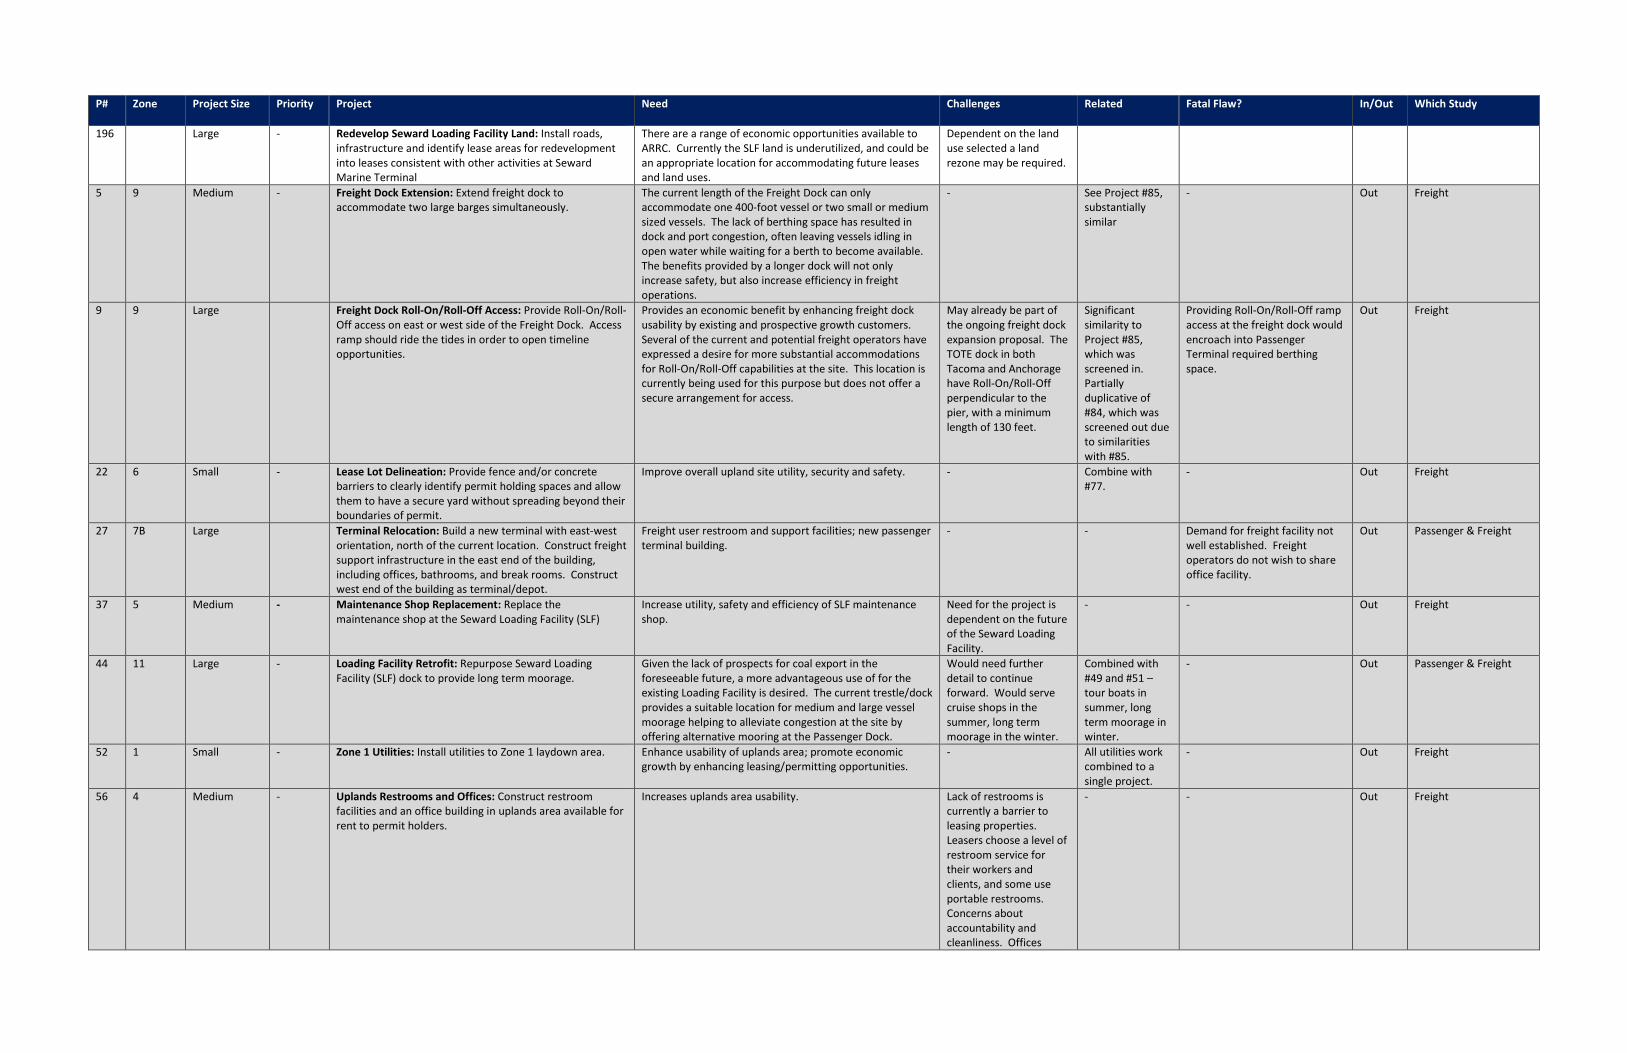
P# Zone Project Size Priority Project
Need Challenges Related Fatal Flaw? In/Out Which Study
196 Large - Redevelop Seward Loading Facility Land: Install roads, infrastructure and identify lease areas for redevelopment into leases consistent with other activities at Seward Marine Terminal
There are a range of economic opportunities available to ARRC. Currently the SLF land is underutilized, and could be an appropriate location for accommodating future leases and land uses.
Dependent on the land use selected a land rezone may be required.
5 9 Medium - Freight Dock Extension: Extend freight dock to accommodate two large barges simultaneously.
The current length of the Freight Dock can only accommodate one 400-foot vessel or two small or medium sized vessels. The lack of berthing space has resulted in dock and port congestion, often leaving vessels idling in open water while waiting for a berth to become available. The benefits provided by a longer dock will not only increase safety, but also increase efficiency in freight operations.
- See Project #85, substantially similar
- Out Freight
9 9 Large Freight Dock Roll-On/Roll-Off Access: Provide Roll-On/Roll-Off access on east or west side of the Freight Dock. Access ramp should ride the tides in order to open timeline opportunities.
Provides an economic benefit by enhancing freight dock usability by existing and prospective growth customers. Several of the current and potential freight operators have expressed a desire for more substantial accommodations for Roll-On/Roll-Off capabilities at the site. This location is currently being used for this purpose but does not offer a secure arrangement for access.
May already be part of the ongoing freight dock expansion proposal. The TOTE dock in both Tacoma and Anchorage have Roll-On/Roll-Off perpendicular to the pier, with a minimum length of 130 feet.
Significant similarity to Project #85, which was screened in. Partially duplicative of #84, which was screened out due to similarities with #85.
Providing Roll-On/Roll-Off ramp access at the freight dock would encroach into Passenger Terminal required berthing space.
Out Freight
22 6 Small - Lease Lot Delineation: Provide fence and/or concrete barriers to clearly identify permit holding spaces and allow them to have a secure yard without spreading beyond their boundaries of permit.
Improve overall upland site utility, security and safety. - Combine with #77.
- Out Freight
27 7B Large Terminal Relocation: Build a new terminal with east-west orientation, north of the current location. Construct freight support infrastructure in the east end of the building, including offices, bathrooms, and break rooms. Construct west end of the building as terminal/depot.
Freight user restroom and support facilities; new passenger terminal building.
- - Demand for freight facility not well established. Freight operators do not wish to share office facility.
Out Passenger & Freight
37 5 Medium - Maintenance Shop Replacement: Replace the maintenance shop at the Seward Loading Facility (SLF)
Increase utility, safety and efficiency of SLF maintenance shop.
Need for the project is dependent on the future of the Seward Loading Facility.
- - Out Freight
44 11 Large - Loading Facility Retrofit: Repurpose Seward Loading Facility (SLF) dock to provide long term moorage.
Given the lack of prospects for coal export in the foreseeable future, a more advantageous use of for the existing Loading Facility is desired. The current trestle/dock provides a suitable location for medium and large vessel moorage helping to alleviate congestion at the site by offering alternative mooring at the Passenger Dock.
Would need further detail to continue forward. Would serve cruise shops in the summer, long term moorage in the winter.
Combined with #49 and #51 – tour boats in summer, long term moorage in winter.
- Out Passenger & Freight
52 1 Small - Zone 1 Utilities: Install utilities to Zone 1 laydown area. Enhance usability of uplands area; promote economic growth by enhancing leasing/permitting opportunities.
- All utilities work combined to a single project.
- Out Freight
56 4 Medium - Uplands Restrooms and Offices: Construct restroom facilities and an office building in uplands area available for rent to permit holders.
Increases uplands area usability. Lack of restrooms is currently a barrier to leasing properties. Leasers choose a level of restroom service for their workers and clients, and some use portable restrooms. Concerns about accountability and cleanliness. Offices
- - Out Freight
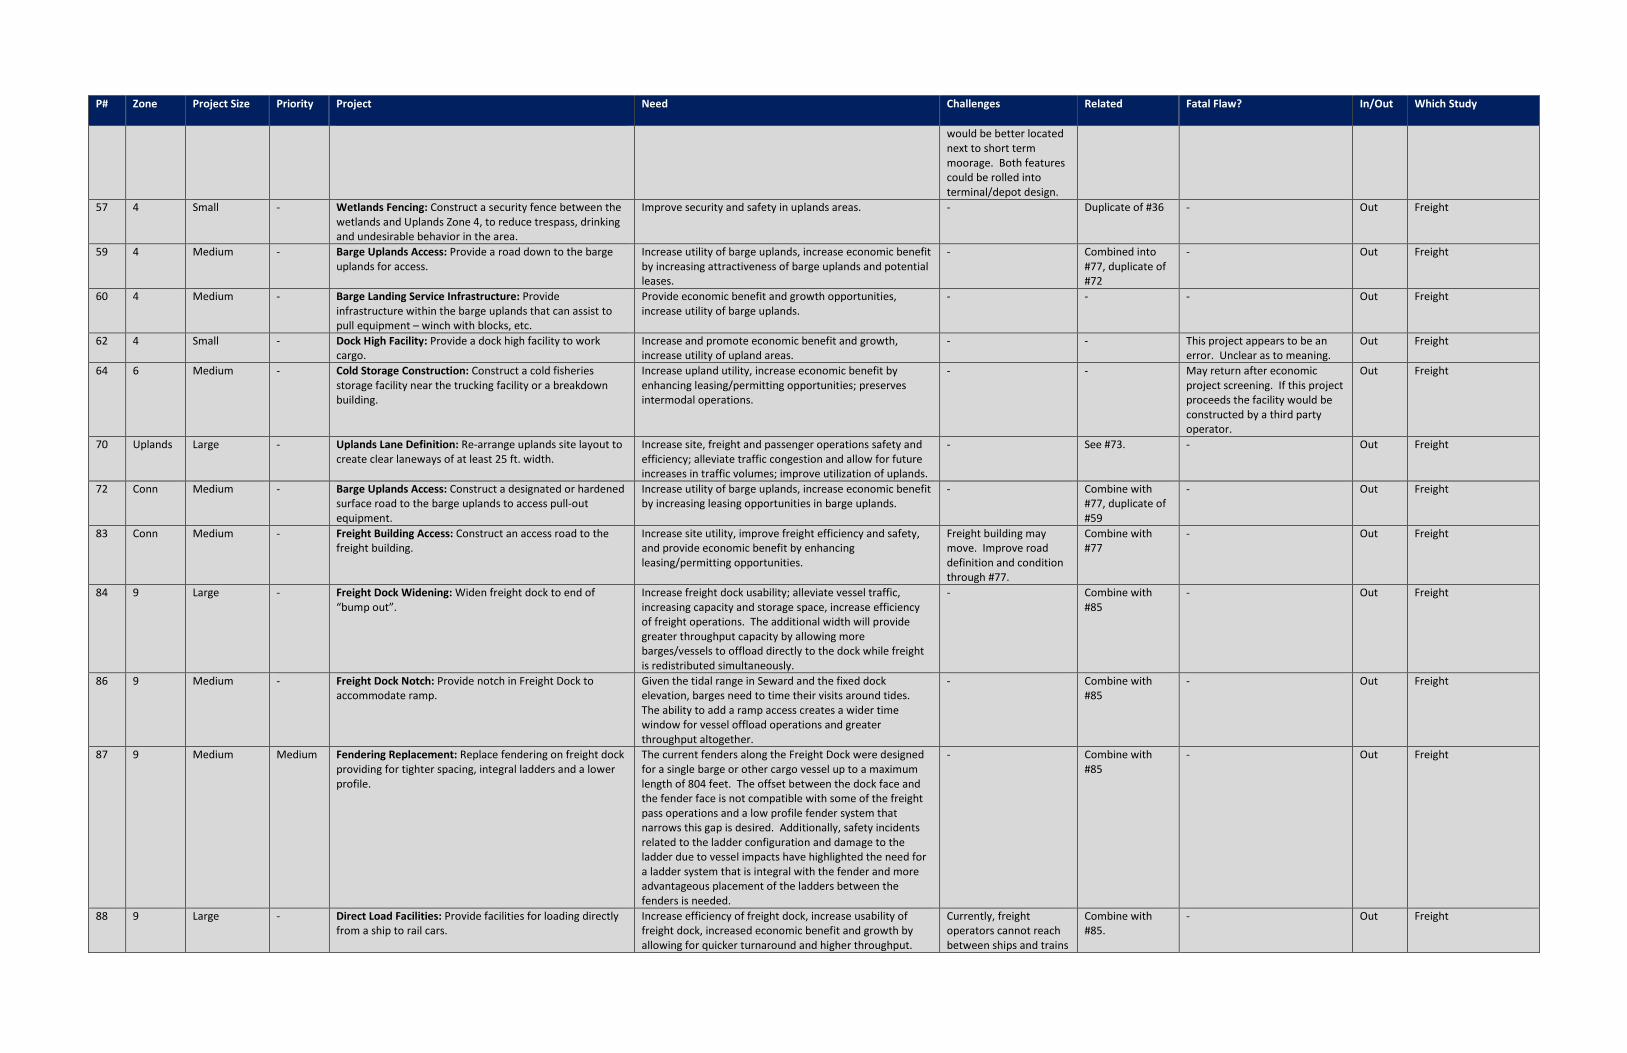
P# Zone Project Size Priority Project
Need Challenges Related Fatal Flaw? In/Out Which Study
would be better located next to short term moorage. Both features could be rolled into terminal/depot design.
57 4 Small - Wetlands Fencing: Construct a security fence between the wetlands and Uplands Zone 4, to reduce trespass, drinking and undesirable behavior in the area.
Improve security and safety in uplands areas. - Duplicate of #36 - Out Freight
59 4 Medium - Barge Uplands Access: Provide a road down to the barge uplands for access.
Increase utility of barge uplands, increase economic benefit by increasing attractiveness of barge uplands and potential leases.
- Combined into #77, duplicate of #72
- Out Freight
60 4 Medium - Barge Landing Service Infrastructure: Provide infrastructure within the barge uplands that can assist to pull equipment – winch with blocks, etc.
Provide economic benefit and growth opportunities, increase utility of barge uplands.
- - - Out Freight
62 4 Small - Dock High Facility: Provide a dock high facility to work cargo.
Increase and promote economic benefit and growth, increase utility of upland areas.
- - This project appears to be an error. Unclear as to meaning.
Out Freight
64 6 Medium - Cold Storage Construction: Construct a cold fisheries storage facility near the trucking facility or a breakdown building.
Increase upland utility, increase economic benefit by enhancing leasing/permitting opportunities; preserves intermodal operations.
- - May return after economic project screening. If this project proceeds the facility would be constructed by a third party operator.
Out Freight
70 Uplands Large - Uplands Lane Definition: Re-arrange uplands site layout to create clear laneways of at least 25 ft. width.
Increase site, freight and passenger operations safety and efficiency; alleviate traffic congestion and allow for future increases in traffic volumes; improve utilization of uplands.
- See #73. - Out Freight
72 Conn Medium - Barge Uplands Access: Construct a designated or hardened surface road to the barge uplands to access pull-out equipment.
Increase utility of barge uplands, increase economic benefit by increasing leasing opportunities in barge uplands.
- Combine with #77, duplicate of #59
- Out Freight
83 Conn Medium - Freight Building Access: Construct an access road to the freight building.
Increase site utility, improve freight efficiency and safety, and provide economic benefit by enhancing leasing/permitting opportunities.
Freight building may move. Improve road definition and condition through #77.
Combine with #77
- Out Freight
84 9 Large - Freight Dock Widening: Widen freight dock to end of “bump out”.
Increase freight dock usability; alleviate vessel traffic, increasing capacity and storage space, increase efficiency of freight operations. The additional width will provide greater throughput capacity by allowing more barges/vessels to offload directly to the dock while freight is redistributed simultaneously.
- Combine with #85
- Out Freight
86 9 Medium - Freight Dock Notch: Provide notch in Freight Dock to accommodate ramp.
Given the tidal range in Seward and the fixed dock elevation, barges need to time their visits around tides. The ability to add a ramp access creates a wider time window for vessel offload operations and greater throughput altogether.
- Combine with #85
- Out Freight
87 9 Medium Medium Fendering Replacement: Replace fendering on freight dock providing for tighter spacing, integral ladders and a lower profile.
The current fenders along the Freight Dock were designed for a single barge or other cargo vessel up to a maximum length of 804 feet. The offset between the dock face and the fender face is not compatible with some of the freight pass operations and a low profile fender system that narrows this gap is desired. Additionally, safety incidents related to the ladder configuration and damage to the ladder due to vessel impacts have highlighted the need for a ladder system that is integral with the fender and more advantageous placement of the ladders between the fenders is needed.
- Combine with #85
- Out Freight
88 9 Large - Direct Load Facilities: Provide facilities for loading directly from a ship to rail cars.
Increase efficiency of freight dock, increase usability of freight dock, increased economic benefit and growth by allowing for quicker turnaround and higher throughput.
Currently, freight operators cannot reach between ships and trains
Combine with #85.
- Out Freight
P# Zone Project Size Priority Project
Need Challenges Related Fatal Flaw? In/Out Which Study
because of the fenders. May be coordinated with the repair of existing track through zones 4 and 6.
92 4 Large - Freight Dock Extension: Increase the length of the working area and the track for loading goods from the freight dock and uplands area directly to train. Also relocate location of switches to reduce the need to move trains back and forth.
Increase upland site utilization, increase efficiency of freight dock.
- Duplicate of #97 - Out Freight
93 93 Large - Freight Dock Double Track: Provide a double track down to the end of the Freight Dock and into the uplands.
Increase upland site and freight dock utilization, increase efficiency of freight operations, promotes economic growth and benefit.
- Duplicate of #97 - Out Freight
94 Conn Large - Freight Track Extension: Install a double track to the end of the freight dock and into the uplands.
Increase upland site and freight dock utilization, increase efficiency of freight operations, promotes economic growth and benefit.
- Duplicate of #97 - Out Freight
96 Conn Large - Freight Track Extension: Extend double track on freight dock.
Increase upland site and freight dock utilization, increase efficiency of freight operations, promotes economic growth and benefit.
- Duplicate of #97 - Out Freight
98 2 Medium - Side Load Accommodations: Remove Tracks #4 and #5 to create side loading areas for Tracks #3 and #6.
Increase freight handling efficiency, increase utility of uplands, and preserve intermodal operations.
- - If economic analysis shows year-round use, will need the tracks. If Economic Analysis does not show increased use, then no need for work. Caters to uplands permit holders, and there is currently no demand.
Out Freight
105 9 Small - Freight Dock Resurfacing: Replace subgrade on freight dock with lower fines content material to reduce frost heaving of tracks.
Improve efficiency and safety of freight operations. - Combine with #104
- Out Freight
106 Medium - At-Grade Crossing Relocations: Relocate at grade crossings adjacent to freight docks to accommodate longer strings of spotted rail cars.
Increase upland site and freight dock utilization, increase efficiency of freight operations, promotes economic growth and benefit.
- Duplicate of #25 - Out Freight
107 9 Large - Freight Dock Extension: Locate track on freight docks to allow for direct loading from both pipe ships and other types of freight.
Increase uplands site and freight dock utilization, increase efficiency of freight operations, promotes economic growth and benefit.
- Duplicate of #97 - Out Freight
109 5 Medium - Coal Bunker Removal: Removal coal bunker track if Seward Loading Facility (SLF) is abandoned.
Increased utility and efficiency of SLF. Project is dependent on whether SLF is abandoned/ decommissioned.
- - Out Operational
110 4 Small - Maintenance Haul-Out: Create a haul-out area for maintenance purposes.
Increase economic growth and site utility. - Duplicate of #58 - Out Freight
111 Uplands Medium - Uplands Pothole Repair: Eliminate potholes and drainage issues throughout uplands area.
Increase uplands usability. - Combine with #77
- Out Freight
112 Uplands Medium - Uplands Levelling: Level and prepare the uplands site area and maintain it.
Increase uplands usability. - Combine with #77
- Out Freight
116 4 Medium - Container Traffic: Increase the space available for container traffic
Freight operations - Combine with #77
- Out Freight
117 9 Small - Fishing Tender Offload: Provide a location to offload fishing tenders.
Promotes economic growth, increases use of Freight Dock. - - This project is to proceed in summer 2016, in advance of the Master Plan. Therefore the project has been screened out from further consideration.
Out Freight
120 1 Small - Secured HAZMAT Area: Create a transient laydown area or offset for material that requires distance, such as explosives.
Increase safety and security of freight operations, increase utilization of uplands areas.
- - - Out Freight
121 1 Large - Natural Gas Plant: Construct natural gas plant for LNG export by large or rail.
Increased economic benefit and promotes economic growth, preserves intermodal operations
No LNG producers interested. Blast radius
- Significant safety risk associated with shipping, piping and
Out Freight
P# Zone Project Size Priority Project
Need Challenges Related Fatal Flaw? In/Out Which Study
would impact airport. receiving LNG, considerable cost of permitting, design and construction of terminal and pipework.
123 1 Small - Area Delineation: Create natural buffers between future uses.
Improve safety and security of uplands areas. - Combine with #77
- Out Freight
124 4 Medium - Lease Lot Optimization: Move Orion and QAP to make room for freight companies such as AK Logistics to have heavy turnover freight.
Increase uplands utilization, improve freight operations efficiency.
Too specific, goes into 25’ setback issues.
- - Out Freight
127 Uplands Medium - Pothole Repairs: Lay asphalt throughout the yard and down by the freight dock to eliminate potholes, reduce dust issues.
Increase uplands usability. - Combine with #77.
- Out Freight
134 10 Medium - Passenger Dock Crane: Put a minimum 100 ton crane on the passenger dock for off-season use by freight shippers.
Increase utility and efficiency of Passenger Dock, promote economic benefits and encourages economic growth.
- - Economic Analysis indicates insufficient demand for facility.
Out Freight
135 6 Small - Freight Access Point Improvements: Widen the 20 foot gates in the security fence enough to move a 40 foot conex through the gate without lifting it over the fence.
Improves freight operations efficiency, increases upland area utility.
- Combine with #71.
- Out Freight
136 9 Small Medium Barge Ramp Mooring Dolphins: Install additional mooring dolphins on the Freight Dock, near the barge ramp located immediately to the west of the Freight Dock.
Improves freight operations safety and efficiency by overcoming a known deficiency with the existing mooring arrangements; promotes economic growth by increasing capacity of Freight Dock and mooring space.
- Combine with #85.
- Out Freight
149 9 Medium Medium Freight Dock Paving: Pave the freight dock to address surface irregularities and improve air quality.
Improves safety and usability of freight dock; preserves intermodal operations; promotes economic growth by providing a safer, more appealing dock to potential customers.
- Combine with #85
- Out Freight
152 1 Medium - Wetlands Fill: Place fill in Zone 1 and provide access to Airport Road (plans and clearing complete).
Promotes economic growth and increases leasing opportunities, increases utility of upland areas, improves efficiency of freight operations, and alleviates traffic congestion.
Economic Study will assist to determine best use. Wetland fill issues a concern. Current fill permits require a buffer.
- - Out Freight
159 - - - East Wye Relocation: Move wye to east side of rail yard. Increase rail and freight operations efficiency and safety. Scope unclear. Project #100 addresses track relocations.
Combine with #11.
- Out Freight
160 1 Medium - New Track: Add industry track to west side of Area 1. Increases utility of uplands, promotes economic growth by increasing leasing/permitting opportunities.
- See #11 and #100.
- Out Freight
161 1 - - New Track: Add industry track to east side of Area 1. Increase freight operations, upland usability. - See #11 and #100.
- Out Freight
166 9 Medium - Freight Dock Crane: Put a minimum 100 ton crane on the freight dock.
Increase the utility and efficiency of the Freight Dock, promote economic benefits and encourage more use of the dock.
- Combine with Project #85
- Out Freight
167 9 Medium Medium “Hotel” Services – Freight Dock: Provide hotel services for vessels at the freight dock (water in particular).
Increase the utility and efficiency of the Freight Dock, promote economic benefits and encourage more use of the dock.
- Combine with Project #85
- Out Freight
168 9 Medium Medium Fuel Lines – Freight Dock: Install fuel lines on the freight dock (In/Out).
Increase the utility and efficiency of the Freight Dock, promote economic benefits and encourage more use of the dock.
- Potential link to P #140 Combine with Project #85
- Out Freight
169 9 Small Medium Lighting – Freight Dock: Improve lighting on the freight dock.
Increase the utility and efficiency of the Freight Dock. Upgrading some lighting this summer due to fishing tender bump-out project.
Combine with Project #85
- Out Freight
178 1, 5 Medium - Create additional freight laydown space Project considered as part of Economic Analysis - - - In Freight 180 11 Small - Provide additional moorage facilities for vessels Project considered as part of Economic Analysis - - - In Freight 182 - Large - Seafood cold storage and freezer space. Project considered as part of Economic Analysis - - Screened out through Economic
Analysis Out Freight
P# Zone Project Size Priority Project
Need Challenges Related Fatal Flaw? In/Out Which Study
183 - Large - Office space Project considered as part of Economic Analysis - - Screened out through Economic Analysis
Out Passenger & Freight
185 - Large - Marijuana grow operation and warehouse Project considered as part of Economic Analysis - - Screened out through Economic Analysis
Out Freight
187 10 Medium High Fuel Lines – Passenger Dock: Install fuel lines on passenger dock (in/out)
Increase the utility and efficiency of the Passenger Dock, promote economic benefits and encourage more use of dock. Potential link to #140.
Higher incremental cost than other ‘extra’ projects for the passenger dock (#170, 171). Could also be installed on existing passenger dock.
Project to be considered as part of a package of works for passenger dock replacement (#45 and 46).
- Out Passenger & Freight


A p p e n d i x C

This page left intentionally blank.
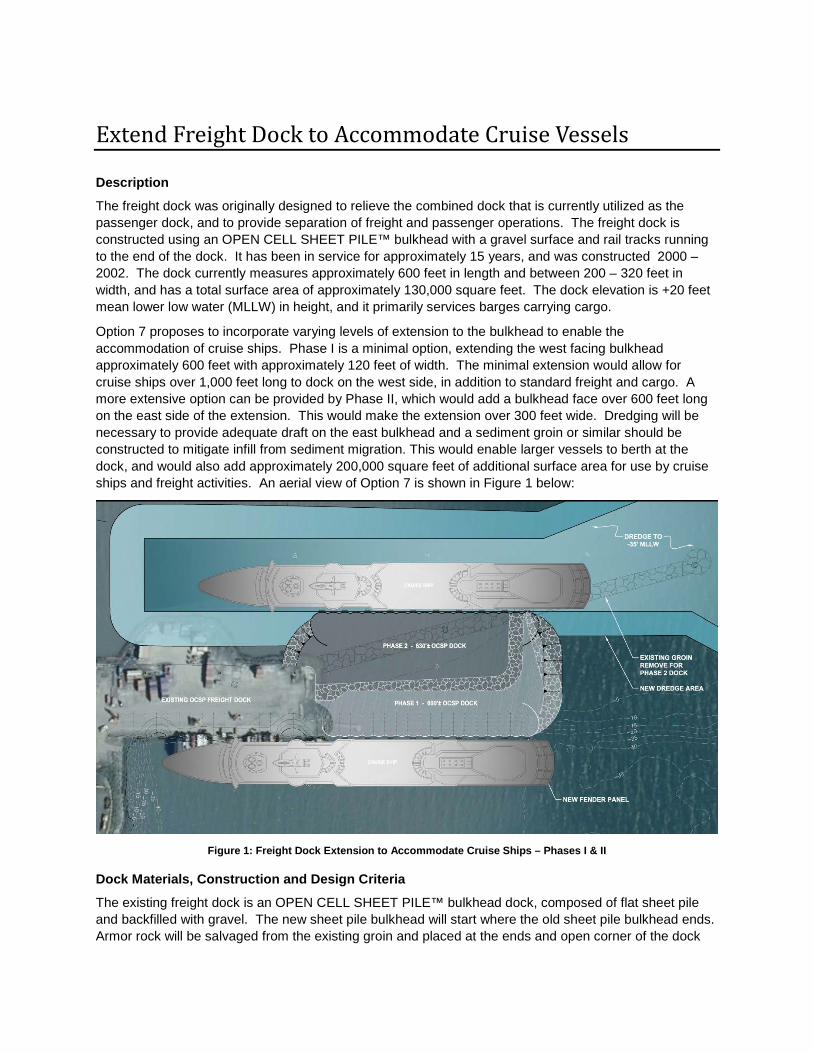
Extend Freight Dock to Accommodate Cruise Vessels
Description
The freight dock was originally designed to relieve the combined dock that is currently utilized as the passenger dock, and to provide separation of freight and passenger operations. The freight dock is constructed using an OPEN CELL SHEET PILE™ bulkhead with a gravel surface and rail tracks running to the end of the dock. It has been in service for approximately 15 years, and was constructed 2000 – 2002. The dock currently measures approximately 600 feet in length and between 200 – 320 feet in width, and has a total surface area of approximately 130,000 square feet. The dock elevation is +20 feet mean lower low water (MLLW) in height, and it primarily services barges carrying cargo.
Option 7 proposes to incorporate varying levels of extension to the bulkhead to enable the accommodation of cruise ships. Phase I is a minimal option, extending the west facing bulkhead approximately 600 feet with approximately 120 feet of width. The minimal extension would allow for cruise ships over 1,000 feet long to dock on the west side, in addition to standard freight and cargo. A more extensive option can be provided by Phase II, which would add a bulkhead face over 600 feet long on the east side of the extension. This would make the extension over 300 feet wide. Dredging will be necessary to provide adequate draft on the east bulkhead and a sediment groin or similar should be constructed to mitigate infill from sediment migration. This would enable larger vessels to berth at the dock, and would also add approximately 200,000 square feet of additional surface area for use by cruise ships and freight activities. An aerial view of Option 7 is shown in Figure 1 below:
Figure 1: Freight Dock Extension to Accommodate Cruise Ships – Phases I & II
Dock Materials, Construction and Design Criteria
The existing freight dock is an OPEN CELL SHEET PILE™ bulkhead dock, composed of flat sheet pile and backfilled with gravel. The new sheet pile bulkhead will start where the old sheet pile bulkhead ends. Armor rock will be salvaged from the existing groin and placed at the ends and open corner of the dock
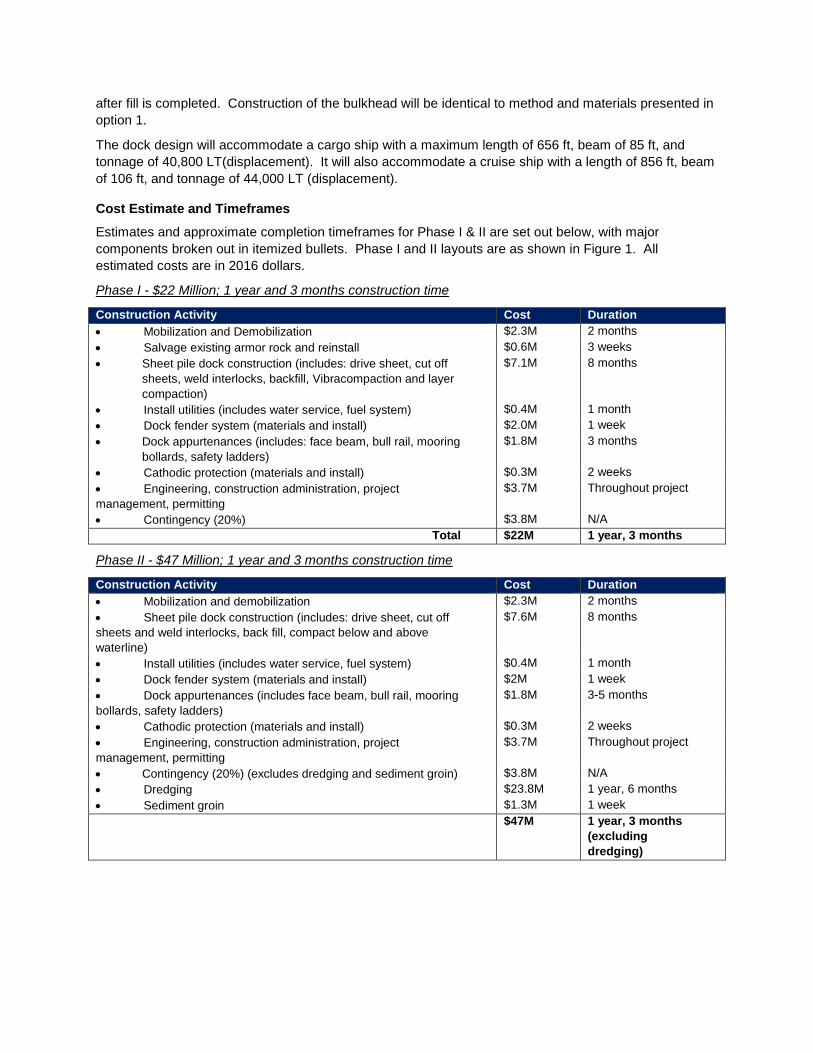
after fill is completed. Construction of the bulkhead will be identical to method and materials presented in option 1.
The dock design will accommodate a cargo ship with a maximum length of 656 ft, beam of 85 ft, and tonnage of 40,800 LT(displacement). It will also accommodate a cruise ship with a length of 856 ft, beam of 106 ft, and tonnage of 44,000 LT (displacement).
Cost Estimate and Timeframes
Estimates and approximate completion timeframes for Phase I & II are set out below, with major components broken out in itemized bullets. Phase I and II layouts are as shown in Figure 1. All estimated costs are in 2016 dollars.
Phase I - $22 Million; 1 year and 3 months construction time
Construction Activity Cost Duration • Mobilization and Demobilization $2.3M 2 months • Salvage existing armor rock and reinstall $0.6M 3 weeks • Sheet pile dock construction (includes: drive sheet, cut off
sheets, weld interlocks, backfill, Vibracompaction and layer compaction)
$7.1M 8 months
• Install utilities (includes water service, fuel system) $0.4M 1 month • Dock fender system (materials and install) $2.0M 1 week • Dock appurtenances (includes: face beam, bull rail, mooring
bollards, safety ladders) $1.8M 3 months
• Cathodic protection (materials and install) $0.3M 2 weeks • Engineering, construction administration, project management, permitting
$3.7M Throughout project
• Contingency (20%) $3.8M N/A Total $22M 1 year, 3 months
Phase II - $47 Million; 1 year and 3 months construction time
Construction Activity Cost Duration • Mobilization and demobilization $2.3M 2 months • Sheet pile dock construction (includes: drive sheet, cut off sheets and weld interlocks, back fill, compact below and above waterline)
$7.6M 8 months
• Install utilities (includes water service, fuel system) $0.4M 1 month • Dock fender system (materials and install) $2M 1 week • Dock appurtenances (includes face beam, bull rail, mooring bollards, safety ladders)
$1.8M 3-5 months
• Cathodic protection (materials and install) $0.3M 2 weeks • Engineering, construction administration, project management, permitting
$3.7M Throughout project
• Contingency (20%) (excludes dredging and sediment groin) $3.8M N/A • Dredging $23.8M 1 year, 6 months • Sediment groin $1.3M 1 week
$47M 1 year, 3 months (excluding dredging)


80 Freight Traffic Study
P A S S E N G E R | F R E I G H T | R E A L E S T A T E