setpoint condition monitoring software - brüel & kjær vibro
TRANSCRIPT
Keep accessible for future reference
Setpoint Condition Monitoring Software CMS 2019 SP2 Release Notes (including release and version history)
Instruction

Trademarks and Copyrights
All trademarks, service marks, and/or registered trademarks used in this document belong to BK Vibro America Inc., except as noted below:
OSIsoft, the OSIsoft logo and logotype, Managed PI, OSIsoft Advanced Services, OSIsoft Cloud Services, OSIsoft Connected Services, PI ACE, PI Advanced Computing Engine, PI AF SDK, PI API, PI Asset Framework, PI Audit Viewer, PI Builder, PI Cloud Connect, PI Connectors, PI Vision, PI Data Archive, PI DataLink, PI DataLink Server, PI Developer's Club, PI Integrator for Business Analytics, PI Interfaces, PI JDBC driver, PI Manual Logger, PI Notifications, PI ODBC, PI OLEDB Enterprise, PI OLEDB Provider, PI OPC HDA Server, PI ProcessBook, PI SDK, PI Server, PI Square, PI System, PI System Access, PI Visualization Suite, PI Web API, PI WebParts, PI Web Services, RLINK and RtReports are all trademarks of OSIsoft, LLC.
Trademarks used herein are the property of their respective owners.
Data and specifications are subject to change without notice.
© Copyright 2019, BK Vibro America Inc. All rights to this technical documentation remain reserved. Any corporeal or incorporeal reproduction or dissemination of this technical documentation or making this document available to the public without prior written approval from BK Vibro America Inc shall be prohibited. This also applies to parts of this technical documentation. BK Vibro America Inc 2243 Park Place Suite A Minden, NV 89423 U.S.A. Phone: 775 552-3110 [email protected] www.setpointvibration.com
Brüel & Kjaer Vibro GmbH Leydhecker Str. 10 64293 Darmstadt Germany Phone: +49 6151 428 0 Fax: +49 6151 428 10 00 [email protected]
Hotline: Phone: +49 6151 428 1400 E-Mail: [email protected]

© Brüel & Kjaer Vibro ● November 2019 ● S108879.002 / V07● █ Page 3 of 36
Technical alterations reserved!
Page 4 of 36 █ © Brüel & Kjaer Vibro ● November 2019 ● S108879.002 / V07 Technical alterations reserved!
EN
Content
1 CMS 2019 SP2 (v6.10.905.0) 6
2 CMS 2019 (v6.10.793.0) 7
2.1 Plot Scales 7 2.2 State Markers and State Displays 8 2.3 Air Gap 9 2.4 Pop Out Plot 10 2.5 Timeline Trend Selection 10 2.6 Channel Name Editing 10 2.7 Time Lock 11 2.8 Defects 12
3 CMS 2018 (v5.0.3045) 13
3.1 Data Availability 13 3.1.1 CMS Database Upload 13 3.1.2 Backfilling CMS-HD Data 13 3.1.3 Exporting a CMS Database 14 3.1.4 Trouble Shooting Network Connections 14
3.2 PI Administrator Enhancements 15 3.3 Plots 16 3.4 Plot Cursors 16 3.5 Plot Headers 17 3.6 Polar Plot 18 3.7 PI Vision 20 3.8 Defects and Enhancements 20
4 CMS 2017 (v4.0.1212) 22
4.1.1 OSISoft PI System 22 4.1.2 CMS Database 22 4.1.3 CMS Files 22 4.1.4 Overlays 23 4.1.5 Cursors 23 4.1.6 High Contrast Theme 23 4.1.7 Full Screen Plots 24 4.1.8 Recip Plot Enhancements 24 4.1.9 Trace Color Palette 25 4.1.10 Toggle Legends 26
© Brüel & Kjaer Vibro ● November 2019 ● █ Page 5 of 36 Technical alterations reserved!
© Brüel & Kjaer Vibro │Instruction Setpoint release CMS 2019 SP2 (v6.10.905.0) EN
4.1.11 Other Enhancements and Bug Fixes 26
5 Version v3.00 28
6 Version v2.52 33
7 Version v2.50 35
Page 6 of 36 █ © Brüel & Kjaer Vibro ● November 2019 ● S108879.002 / V07 Technical alterations reserved!
EN
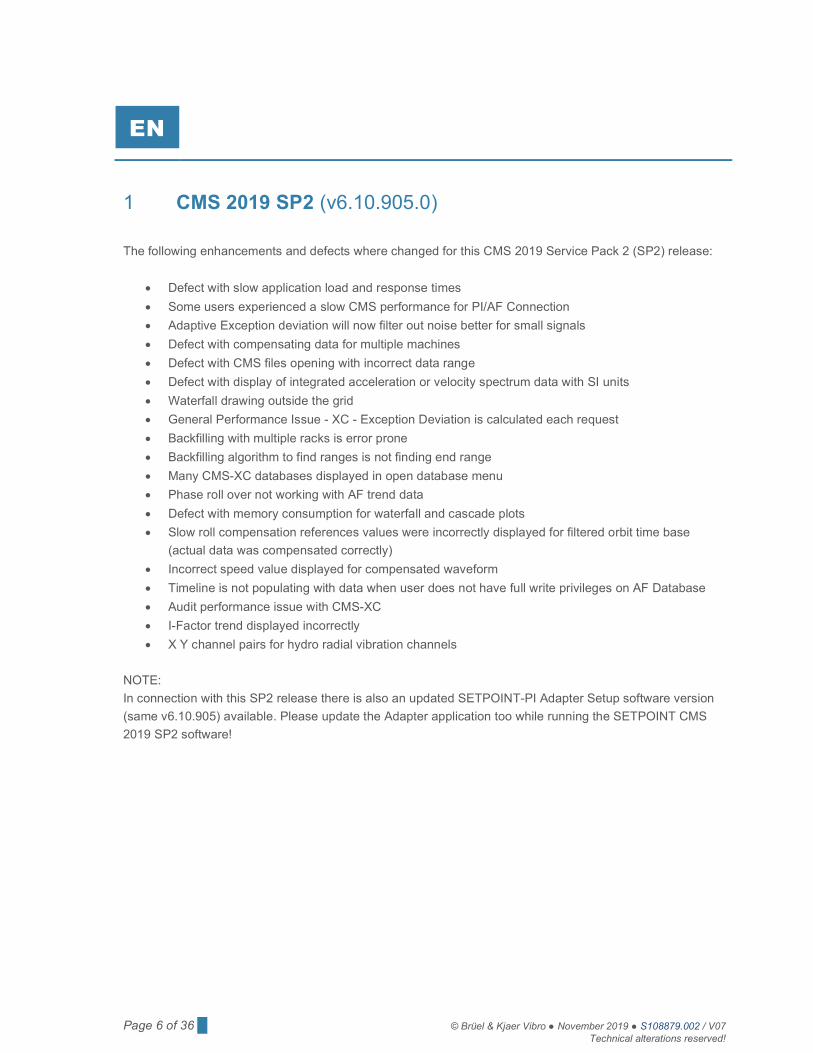
1 CMS 2019 SP2 (v6.10.905.0)
The following enhancements and defects where changed for this CMS 2019 Service Pack 2 (SP2) release:
Defect with slow application load and response times
Some users experienced a slow CMS performance for PI/AF Connection
Adaptive Exception deviation will now filter out noise better for small signals
Defect with compensating data for multiple machines
Defect with CMS files opening with incorrect data range
Defect with display of integrated acceleration or velocity spectrum data with SI units
Waterfall drawing outside the grid
General Performance Issue - XC - Exception Deviation is calculated each request
Backfilling with multiple racks is error prone
Backfilling algorithm to find ranges is not finding end range
Many CMS-XC databases displayed in open database menu
Phase roll over not working with AF trend data
Defect with memory consumption for waterfall and cascade plots
Slow roll compensation references values were incorrectly displayed for filtered orbit time base
(actual data was compensated correctly)
Incorrect speed value displayed for compensated waveform
Timeline is not populating with data when user does not have full write privileges on AF Database
Audit performance issue with CMS-XC
I-Factor trend displayed incorrectly
X Y channel pairs for hydro radial vibration channels
NOTE:
In connection with this SP2 release there is also an updated SETPOINT-PI Adapter Setup software version
(same v6.10.905) available. Please update the Adapter application too while running the SETPOINT CMS
2019 SP2 software!
© Brüel & Kjaer Vibro ● November 2019 ● █ Page 7 of 36 Technical alterations reserved!
© Brüel & Kjaer Vibro │Instruction Setpoint release CMS 2019 (v6.10.793.0) EN
2 CMS 2019 (v6.10.793.0)
2.1 Plot Scales
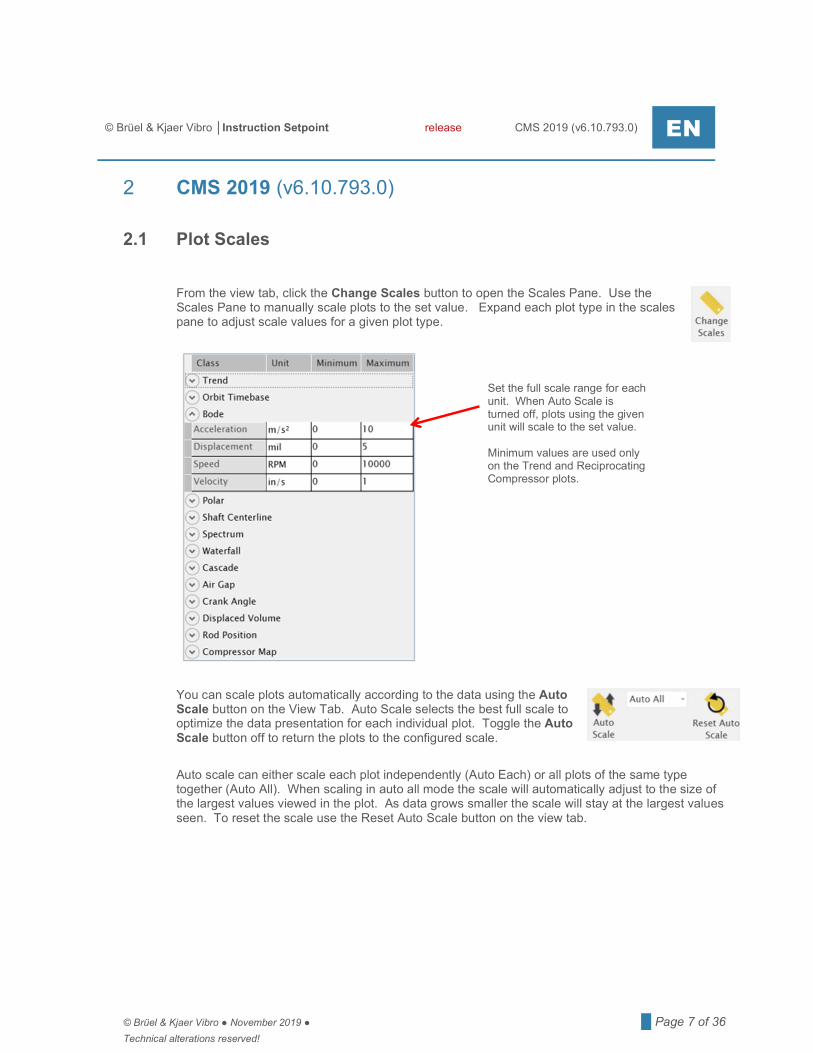
From the view tab, click the Change Scales button to open the Scales Pane. Use the Scales Pane to manually scale plots to the set value. Expand each plot type in the scales pane to adjust scale values for a given plot type.
You can scale plots automatically according to the data using the Auto Scale button on the View Tab. Auto Scale selects the best full scale to optimize the data presentation for each individual plot. Toggle the Auto Scale button off to return the plots to the configured scale.
Auto scale can either scale each plot independently (Auto Each) or all plots of the same type together (Auto All). When scaling in auto all mode the scale will automatically adjust to the size of the largest values viewed in the plot. As data grows smaller the scale will stay at the largest values seen. To reset the scale use the Reset Auto Scale button on the view tab.
Set the full scale range for each unit. When Auto Scale is turned off, plots using the given unit will scale to the set value. Minimum values are used only on the Trend and Reciprocating Compressor plots.
Page 8 of 36 █ © Brüel & Kjaer Vibro ● November 2019 ● S108879.002 / V07 Technical alterations reserved!
EN
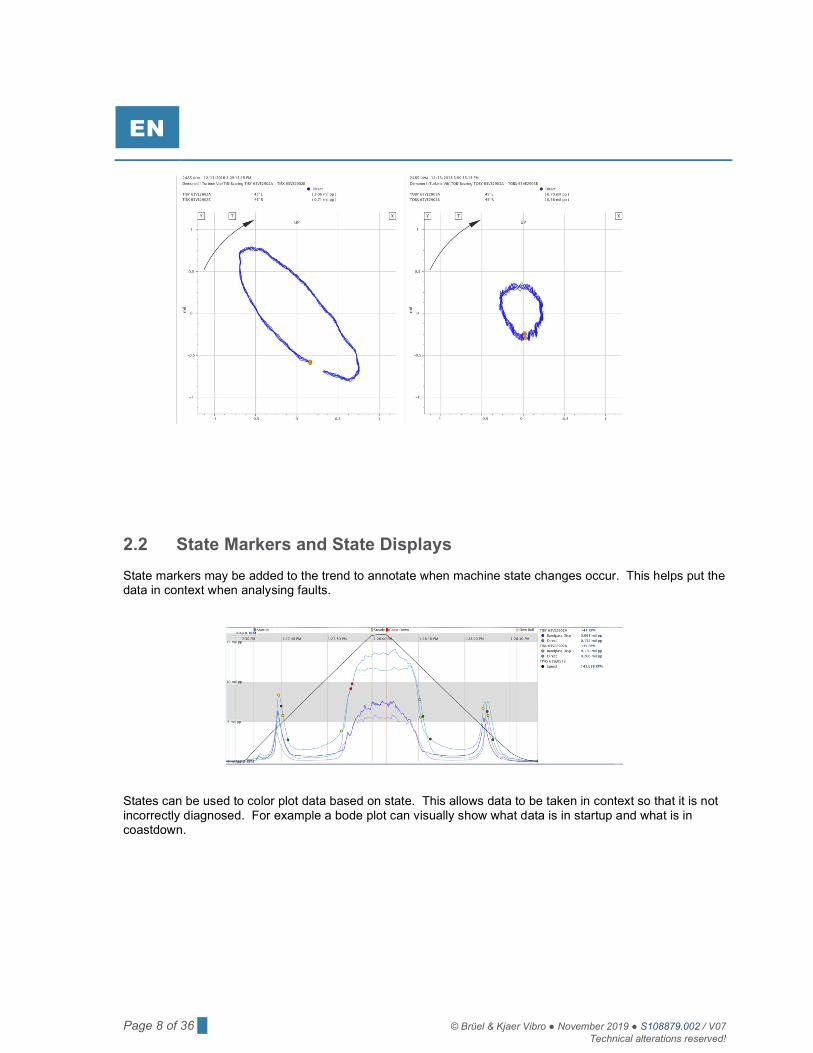
2.2 State Markers and State Displays State markers may be added to the trend to annotate when machine state changes occur. This helps put the data in context when analysing faults.
States can be used to color plot data based on state. This allows data to be taken in context so that it is not incorrectly diagnosed. For example a bode plot can visually show what data is in startup and what is in coastdown.
© Brüel & Kjaer Vibro ● November 2019 ● █ Page 9 of 36 Technical alterations reserved!
© Brüel & Kjaer Vibro │Instruction Setpoint release CMS 2019 (v6.10.793.0) EN
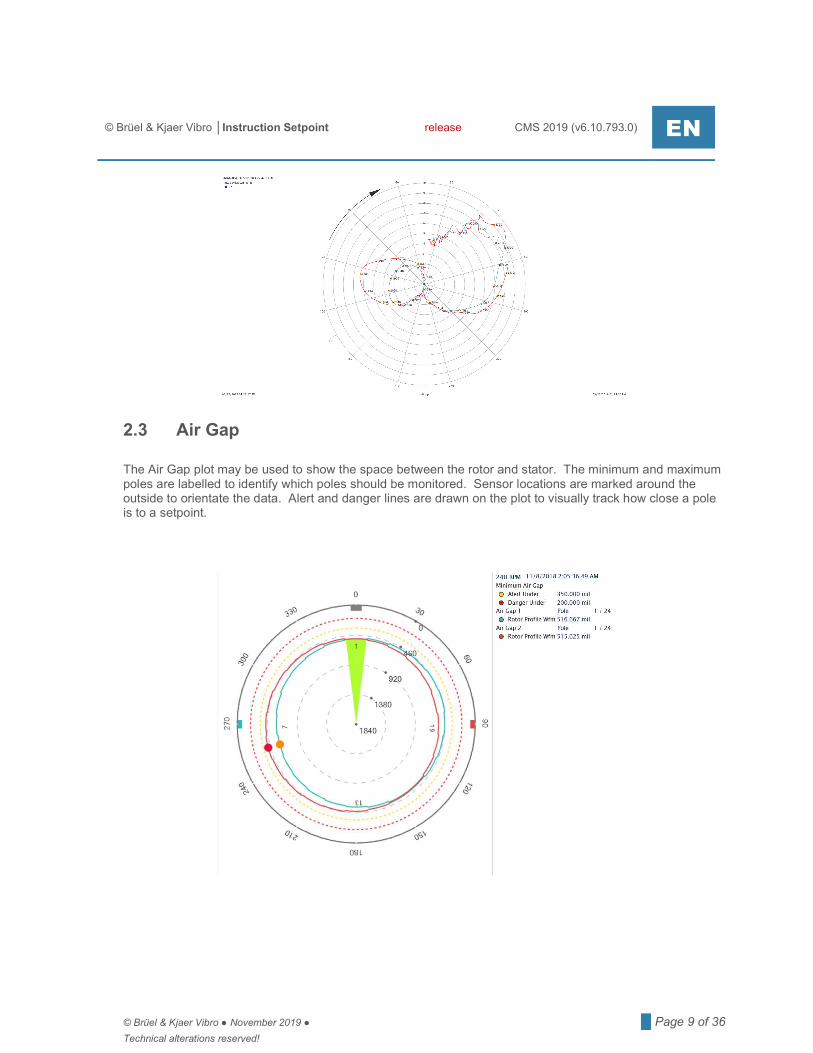
2.3 Air Gap
The Air Gap plot may be used to show the space between the rotor and stator. The minimum and maximum poles are labelled to identify which poles should be monitored. Sensor locations are marked around the outside to orientate the data. Alert and danger lines are drawn on the plot to visually track how close a pole is to a setpoint.
Page 10 of 36 █ © Brüel & Kjaer Vibro ● November 2019 ● S108879.002 / V07 Technical alterations reserved!
EN
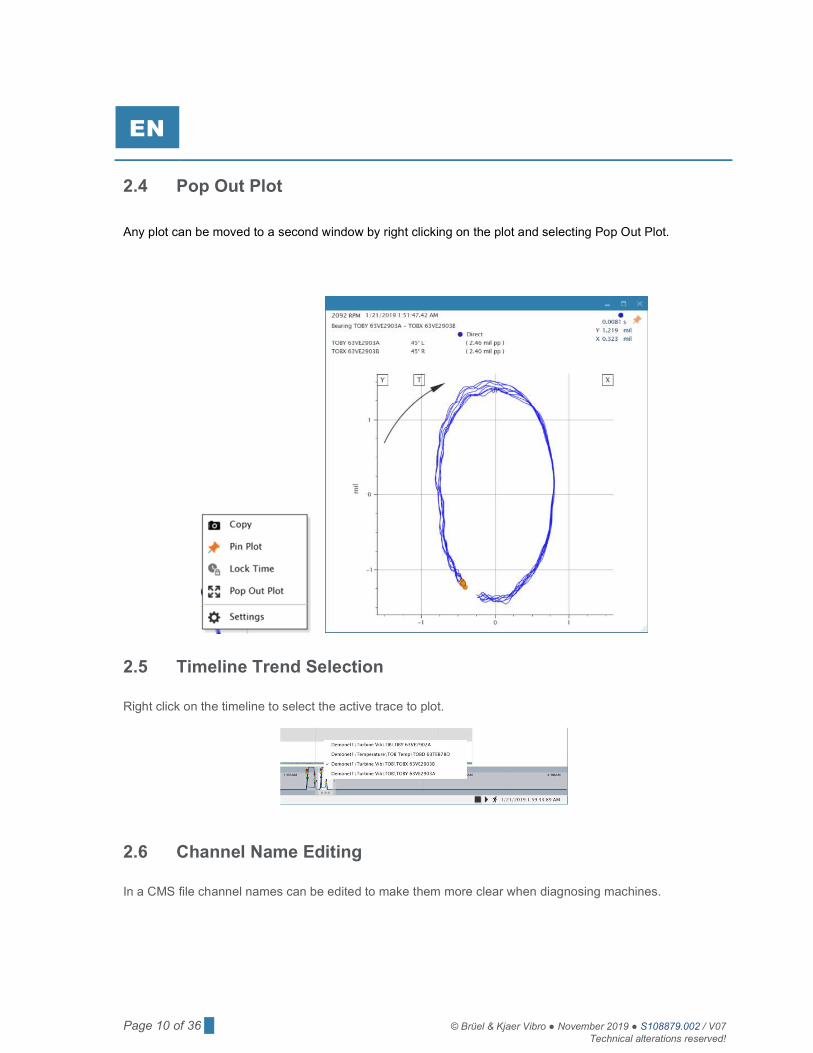
2.4 Pop Out Plot
Any plot can be moved to a second window by right clicking on the plot and selecting Pop Out Plot.
2.5 Timeline Trend Selection
Right click on the timeline to select the active trace to plot.
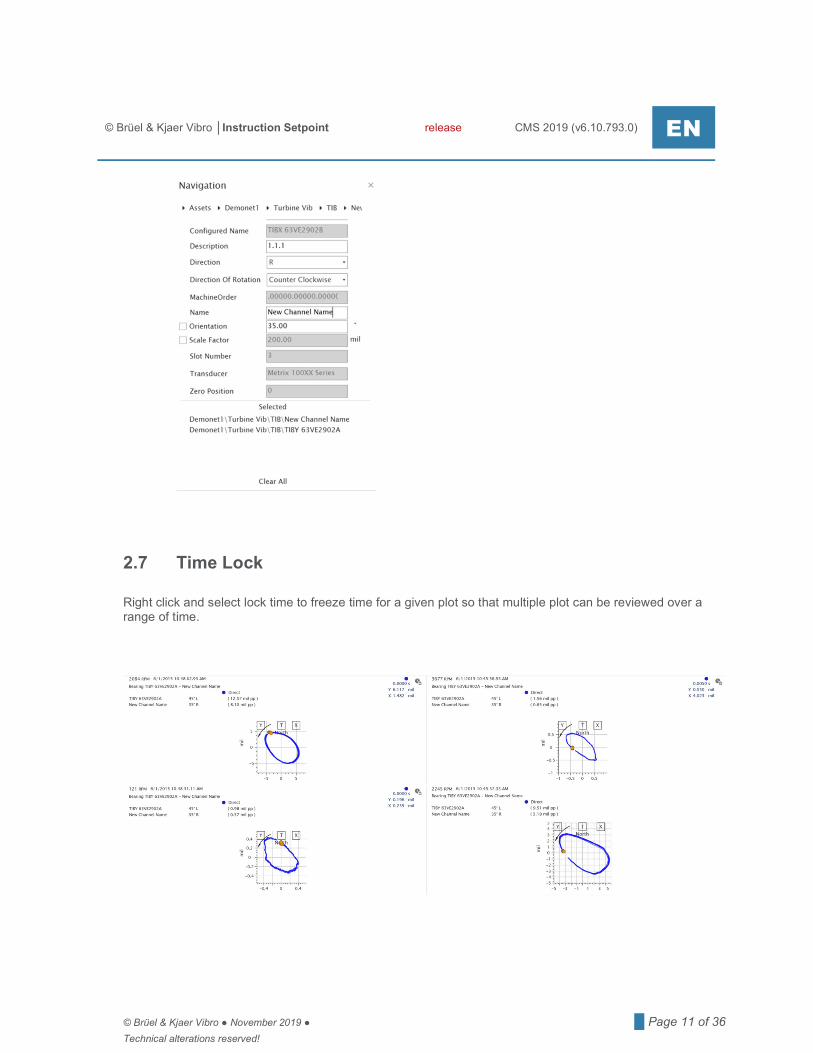
2.6 Channel Name Editing
In a CMS file channel names can be edited to make them more clear when diagnosing machines.
© Brüel & Kjaer Vibro ● November 2019 ● █ Page 11 of 36 Technical alterations reserved!
© Brüel & Kjaer Vibro │Instruction Setpoint release CMS 2019 (v6.10.793.0) EN
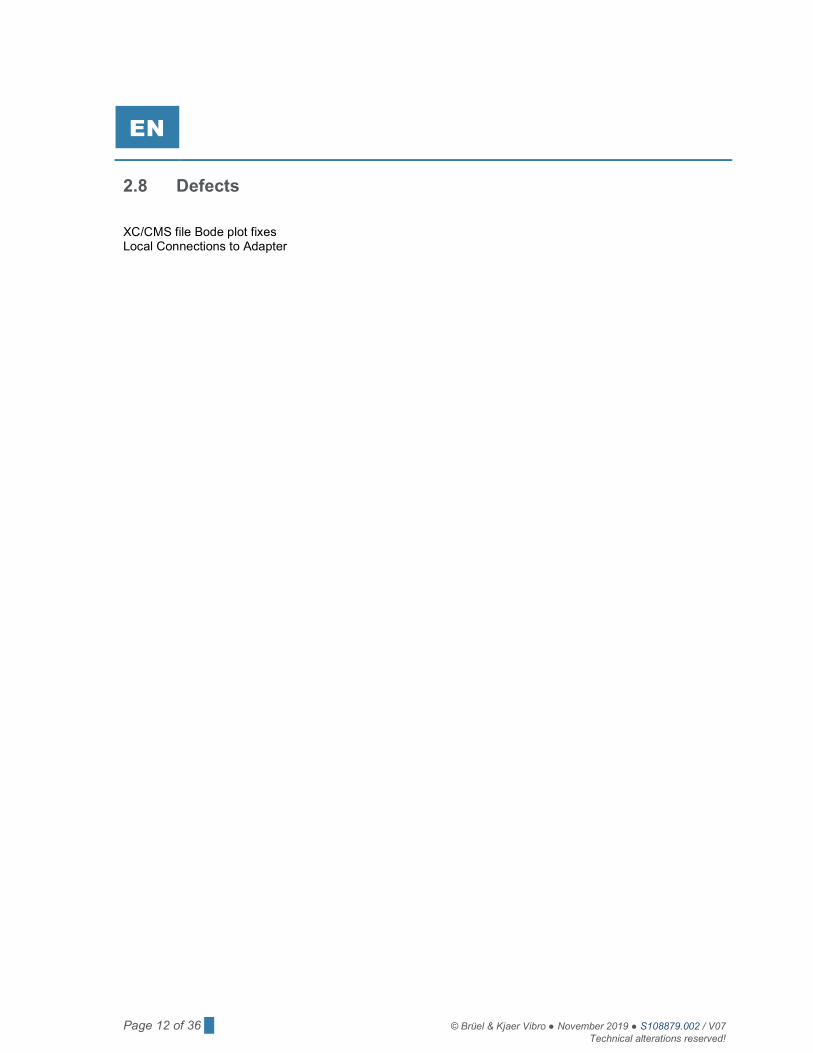
2.7 Time Lock
Right click and select lock time to freeze time for a given plot so that multiple plot can be reviewed over a range of time.
Page 12 of 36 █ © Brüel & Kjaer Vibro ● November 2019 ● S108879.002 / V07 Technical alterations reserved!
EN
2.8 Defects XC/CMS file Bode plot fixes Local Connections to Adapter
© Brüel & Kjaer Vibro ● November 2019 ● █ Page 13 of 36 Technical alterations reserved!
© Brüel & Kjaer Vibro │Instruction Setpoint release CMS 2018 (v5.0.3045) EN
3 CMS 2018 (v5.0.3045)
3.1 Data Availability Data reliability and availability has been increased by providing recovering a mechanism for network failures. The network between the rack and the adapter can be broken and once fixed no data will be lost. This feature is only available for PI data collection. In addition the connection between the adapter and the PI server can be lost and once recovered the data will be backfilled into the PI server. This data recovery will be done using the PI Buffering Subsystem. The subsystem needs to be configured during commissioning of the adapter. This feature is only available for PI data collection. CMS-SD, CMS-XC, and CMS-HD data are now referred to as CMS Databases. The file extension cmsdb is used for them. CMS databases are used to manage large amounts of data and are suitable for archiving portable data, and HD data. The CMS client can now export to the CMS database format when connected to CMS-HD, and CMS-XC databases. Offline data (CMS database format) may be uploaded into a PI System. When a network is not available to the rack and data still needs to be made available on the network the user may upload data using the adapter.
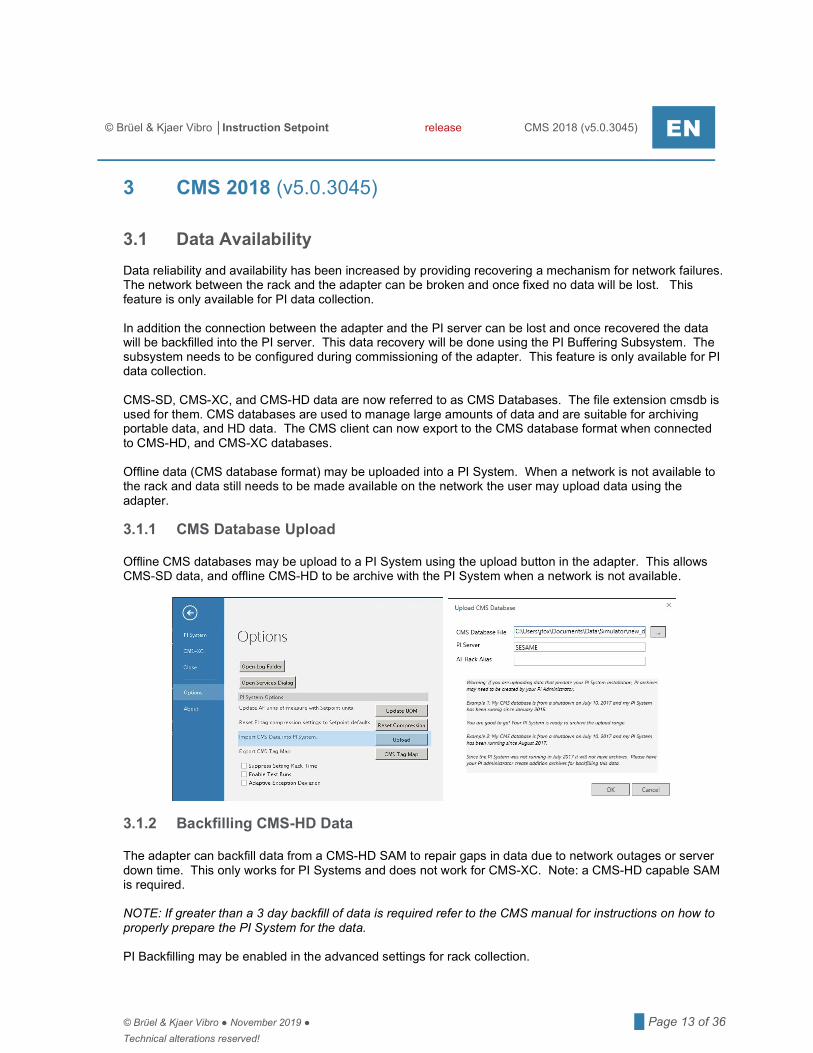
3.1.1 CMS Database Upload Offline CMS databases may be upload to a PI System using the upload button in the adapter. This allows CMS-SD data, and offline CMS-HD to be archive with the PI System when a network is not available.
3.1.2 Backfilling CMS-HD Data The adapter can backfill data from a CMS-HD SAM to repair gaps in data due to network outages or server down time. This only works for PI Systems and does not work for CMS-XC. Note: a CMS-HD capable SAM is required. NOTE: If greater than a 3 day backfill of data is required refer to the CMS manual for instructions on how to properly prepare the PI System for the data. PI Backfilling may be enabled in the advanced settings for rack collection.
Page 14 of 36 █ © Brüel & Kjaer Vibro ● November 2019 ● S108879.002 / V07 Technical alterations reserved!
EN
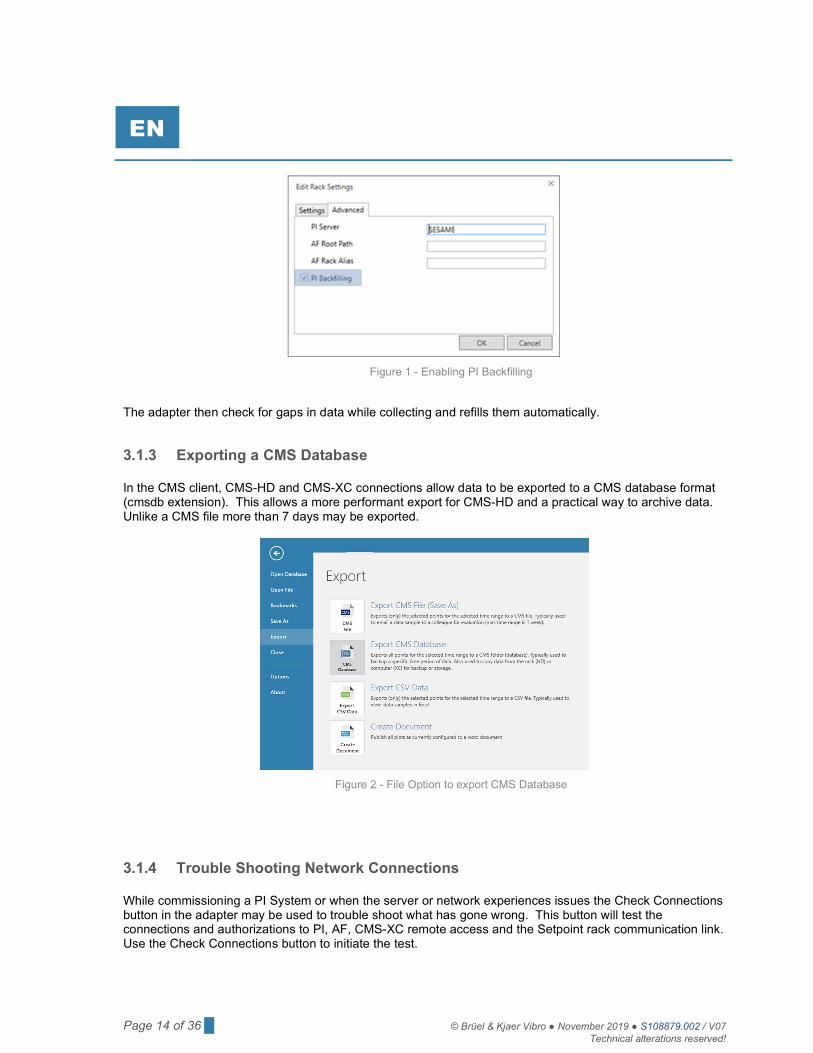
Figure 1 - Enabling PI Backfilling
The adapter then check for gaps in data while collecting and refills them automatically.
3.1.3 Exporting a CMS Database In the CMS client, CMS-HD and CMS-XC connections allow data to be exported to a CMS database format (cmsdb extension). This allows a more performant export for CMS-HD and a practical way to archive data. Unlike a CMS file more than 7 days may be exported.
Figure 2 - File Option to export CMS Database
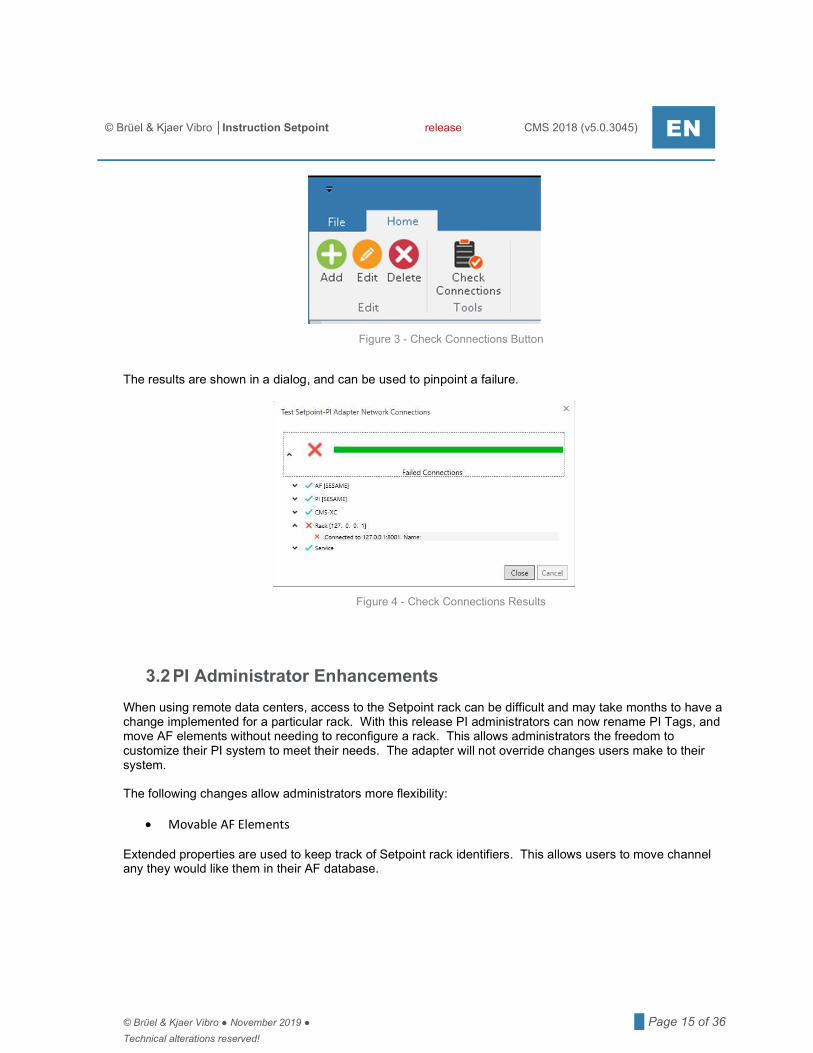
3.1.4 Trouble Shooting Network Connections While commissioning a PI System or when the server or network experiences issues the Check Connections button in the adapter may be used to trouble shoot what has gone wrong. This button will test the connections and authorizations to PI, AF, CMS-XC remote access and the Setpoint rack communication link. Use the Check Connections button to initiate the test.
© Brüel & Kjaer Vibro ● November 2019 ● █ Page 15 of 36 Technical alterations reserved!
© Brüel & Kjaer Vibro │Instruction Setpoint release CMS 2018 (v5.0.3045) EN
Figure 3 - Check Connections Button
The results are shown in a dialog, and can be used to pinpoint a failure.
Figure 4 - Check Connections Results
3.2 PI Administrator Enhancements When using remote data centers, access to the Setpoint rack can be difficult and may take months to have a change implemented for a particular rack. With this release PI administrators can now rename PI Tags, and move AF elements without needing to reconfigure a rack. This allows administrators the freedom to customize their PI system to meet their needs. The adapter will not override changes users make to their system. The following changes allow administrators more flexibility:
Movable AF Elements Extended properties are used to keep track of Setpoint rack identifiers. This allows users to move channel any they would like them in their AF database.
Page 16 of 36 █ © Brüel & Kjaer Vibro ● November 2019 ● S108879.002 / V07 Technical alterations reserved!
EN
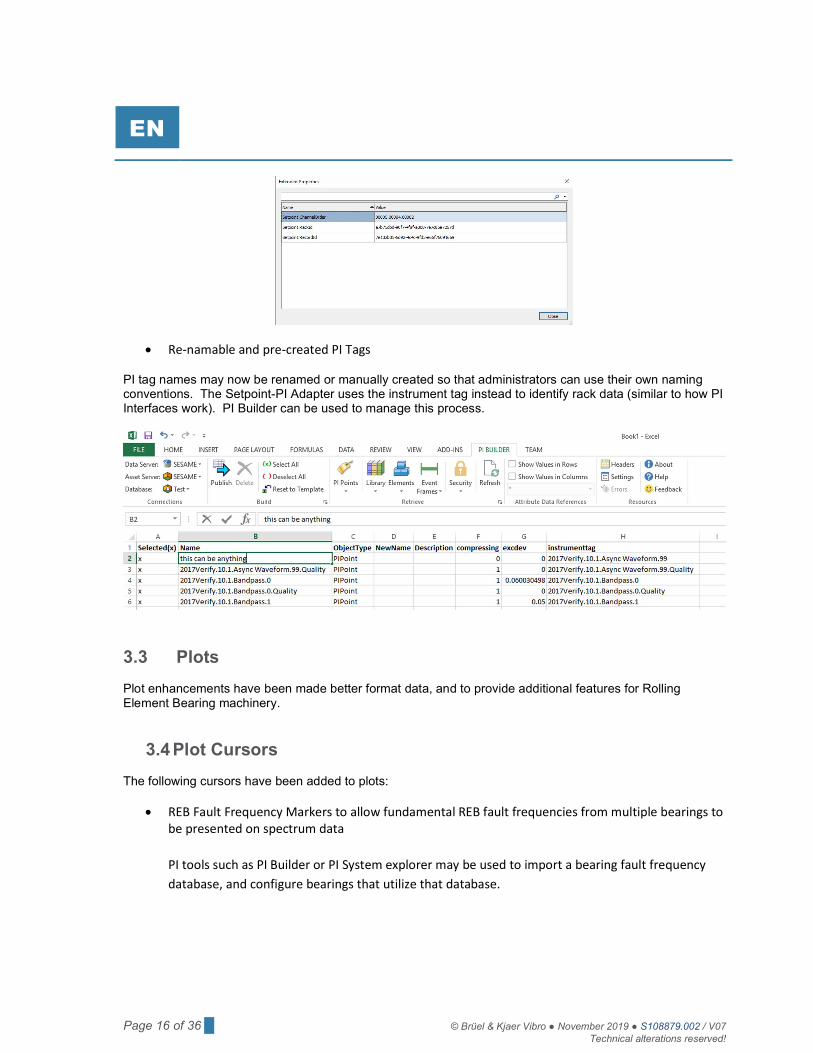
Re-namable and pre-created PI Tags
PI tag names may now be renamed or manually created so that administrators can use their own naming conventions. The Setpoint-PI Adapter uses the instrument tag instead to identify rack data (similar to how PI Interfaces work). PI Builder can be used to manage this process.
3.3 Plots Plot enhancements have been made better format data, and to provide additional features for Rolling Element Bearing machinery.
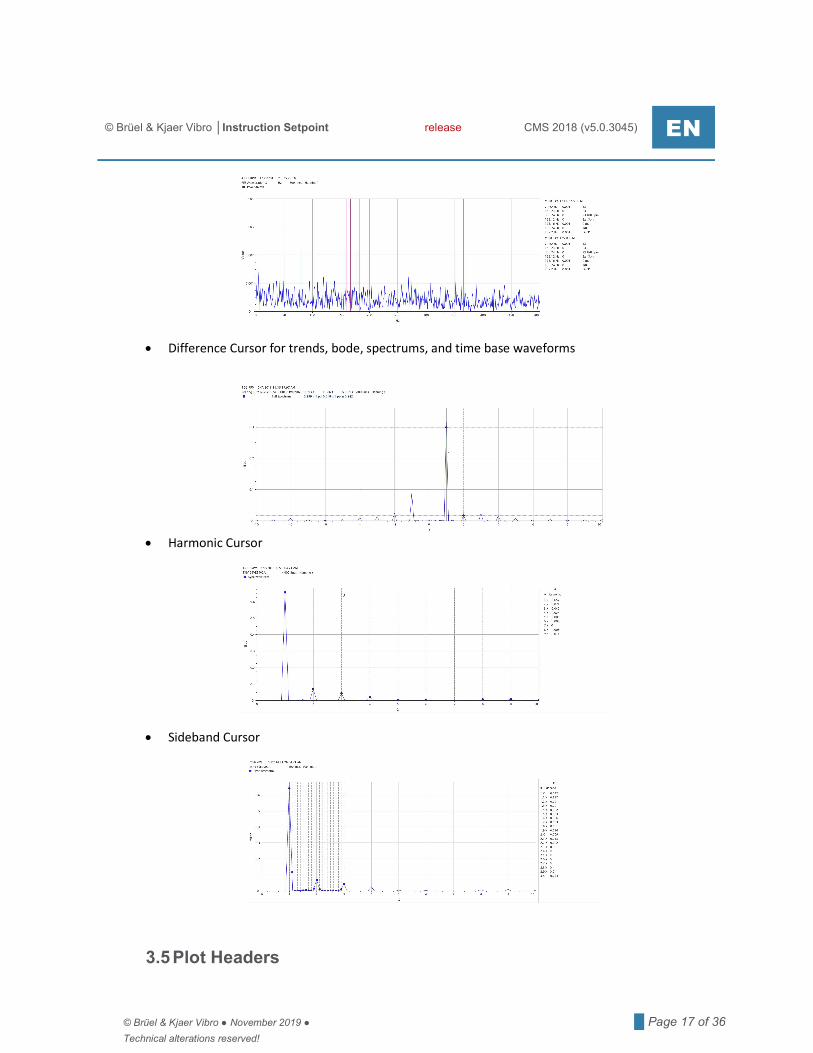
3.4 Plot Cursors The following cursors have been added to plots:
REB Fault Frequency Markers to allow fundamental REB fault frequencies from multiple bearings to be presented on spectrum data PI tools such as PI Builder or PI System explorer may be used to import a bearing fault frequency database, and configure bearings that utilize that database.
© Brüel & Kjaer Vibro ● November 2019 ● █ Page 17 of 36 Technical alterations reserved!
© Brüel & Kjaer Vibro │Instruction Setpoint release CMS 2018 (v5.0.3045) EN
Difference Cursor for trends, bode, spectrums, and time base waveforms
Harmonic Cursor
Sideband Cursor
3.5 Plot Headers
Page 18 of 36 █ © Brüel & Kjaer Vibro ● November 2019 ● S108879.002 / V07 Technical alterations reserved!
EN
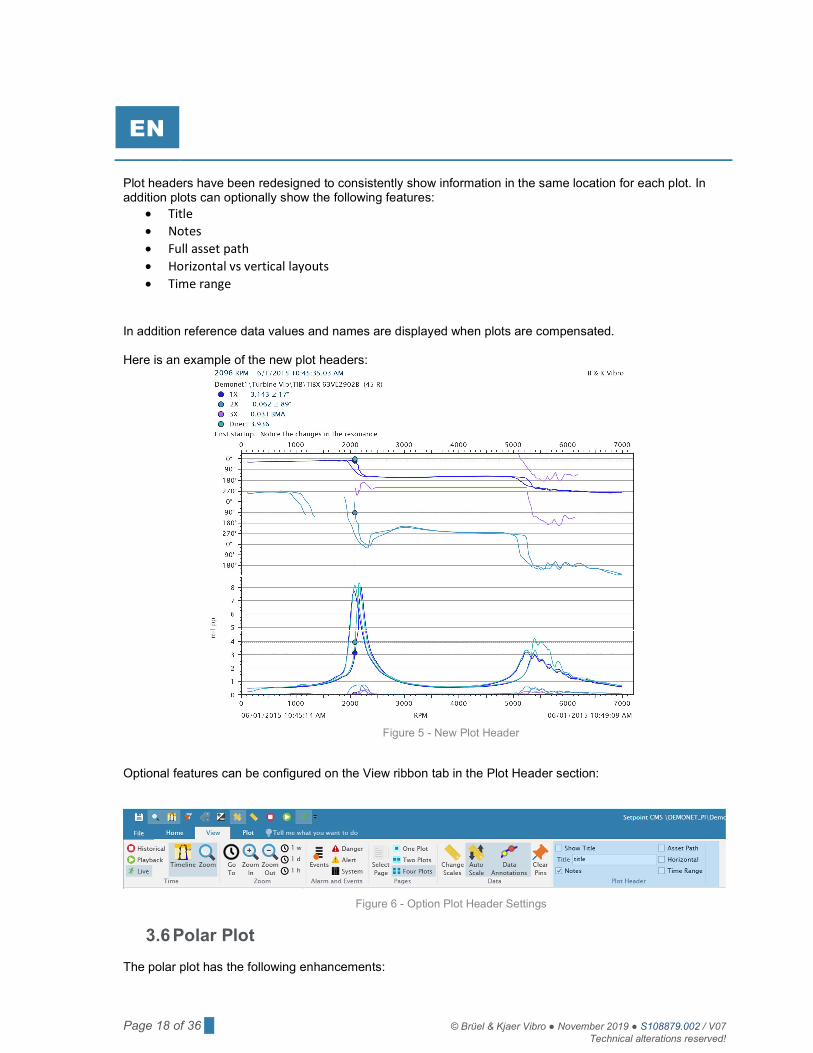
Plot headers have been redesigned to consistently show information in the same location for each plot. In addition plots can optionally show the following features:
Title Notes Full asset path Horizontal vs vertical layouts Time range
In addition reference data values and names are displayed when plots are compensated. Here is an example of the new plot headers:
Figure 5 - New Plot Header
Optional features can be configured on the View ribbon tab in the Plot Header section:
Figure 6 - Option Plot Header Settings
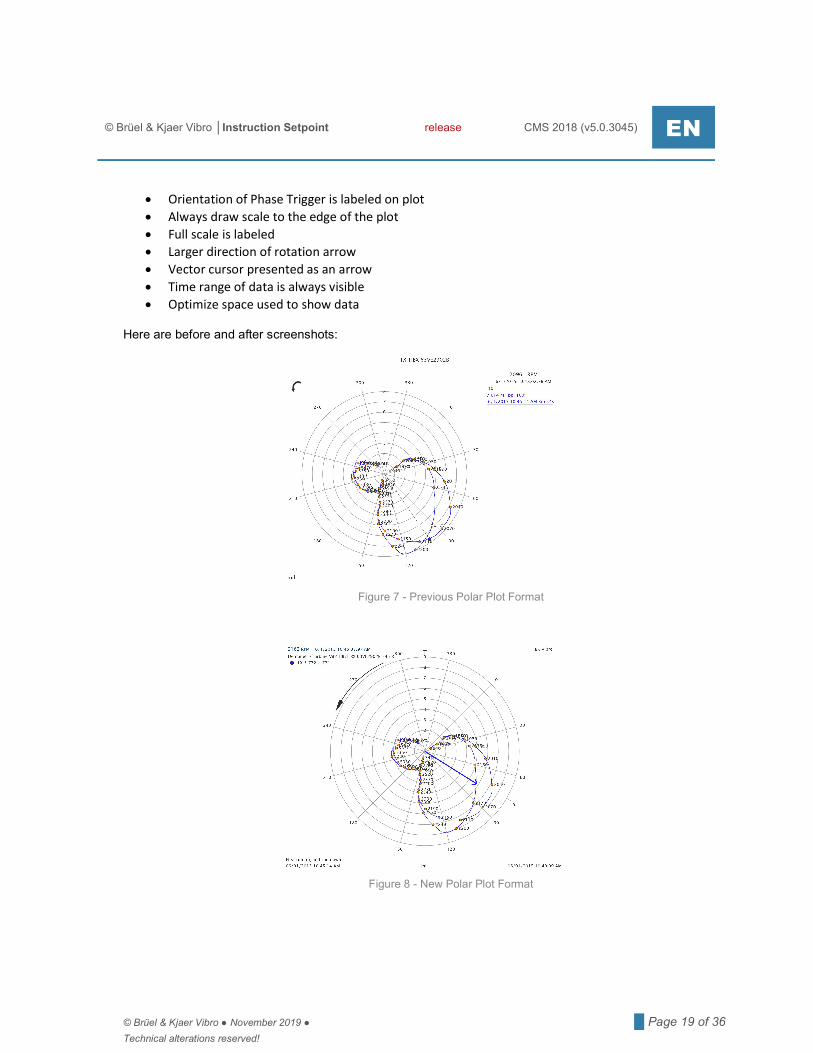
3.6 Polar Plot The polar plot has the following enhancements:
© Brüel & Kjaer Vibro ● November 2019 ● █ Page 19 of 36 Technical alterations reserved!
© Brüel & Kjaer Vibro │Instruction Setpoint release CMS 2018 (v5.0.3045) EN
Orientation of Phase Trigger is labeled on plot Always draw scale to the edge of the plot Full scale is labeled Larger direction of rotation arrow Vector cursor presented as an arrow Time range of data is always visible Optimize space used to show data
Here are before and after screenshots:
Figure 7 - Previous Polar Plot Format
Figure 8 - New Polar Plot Format
Page 20 of 36 █ © Brüel & Kjaer Vibro ● November 2019 ● S108879.002 / V07 Technical alterations reserved!
EN
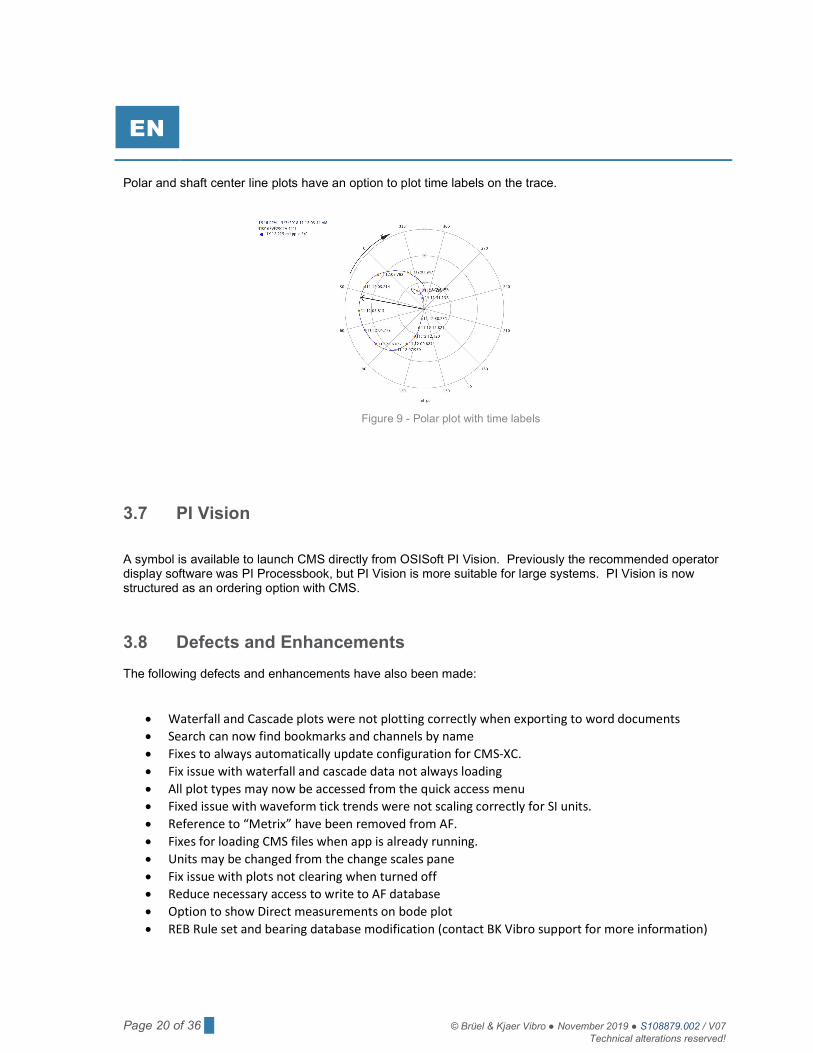
Polar and shaft center line plots have an option to plot time labels on the trace.
Figure 9 - Polar plot with time labels
3.7 PI Vision A symbol is available to launch CMS directly from OSISoft PI Vision. Previously the recommended operator display software was PI Processbook, but PI Vision is more suitable for large systems. PI Vision is now structured as an ordering option with CMS.
3.8 Defects and Enhancements The following defects and enhancements have also been made:
Waterfall and Cascade plots were not plotting correctly when exporting to word documents Search can now find bookmarks and channels by name Fixes to always automatically update configuration for CMS-XC. Fix issue with waterfall and cascade data not always loading All plot types may now be accessed from the quick access menu Fixed issue with waveform tick trends were not scaling correctly for SI units. Reference to “Metrix” have been removed from AF. Fixes for loading CMS files when app is already running. Units may be changed from the change scales pane Fix issue with plots not clearing when turned off Reduce necessary access to write to AF database Option to show Direct measurements on bode plot REB Rule set and bearing database modification (contact BK Vibro support for more information)
© Brüel & Kjaer Vibro ● November 2019 ● █ Page 21 of 36 Technical alterations reserved!
© Brüel & Kjaer Vibro │Instruction Setpoint release CMS 2018 (v5.0.3045) EN
Test stand template reports have been restored. Template based reports allows a reuse of pre-built reports across multiple test runs. This had previously been removed from the product after revision 2.50.
Waterfall and Cascade plots can optionally show amplitude scales (3D Plot Walls) Icon and loading status is now shown for connected database type
Figure 10 - Connected Database Icon
Recently used CMS files can be quickly accessed from the open file menu.
Page 22 of 36 █ © Brüel & Kjaer Vibro ● November 2019 ● S108879.002 / V07 Technical alterations reserved!
EN
4 CMS 2017 (v4.0.1212)
Setpoint CMS 2017 provides a wide range of solutions to store and utilize condition monitoring data, regardless of what network or IT infrastructure are available on site.
4.1.1 OSISoft PI System The primary means of accessing CMS data is via the OSISoft PI System. The PI System provides a performant, highly available solution where important features such the following are available:
Scale to unlimited assets Integration with process data Train diagrams and other operator displays Redundant data base collectives Advanced analytics Notifications Asset modeling Web access Mobile access Cloud access Multi-tier networks IT managed Advanced security
4.1.2 CMS Database When the PI system is not available due to limited or no network access or when additional redundancy is required Setpoint provides alternative means of capturing and accessing CMS data. These options include the following:
CMS - SD stores CMS data on an SD card. This allows CMS data to be recorded with no server or network. Retrieve the SD card to view data within CMS client.
CMS - HD stores CMS data integral to the rack. . This allows CMS data to be recorded with no server or network. This is best suited for sites where network access is limited, or IT support is minimal. It is also good for providing redundant data so nothing is lost if the network goes out for an extended period of time.
CMS – XC allows CMS data to be stored and accessed on a computer. Multiple Setpoint racks may have data aggregated together to view in a CMS client.
When CMS databases are offline they may later be imported into the PI System. All CMS database solutions may be used together with the OSISoft PI System.
4.1.3 CMS Files
© Brüel & Kjaer Vibro ● November 2019 ● █ Page 23 of 36 Technical alterations reserved!
© Brüel & Kjaer Vibro │Instruction Setpoint release CMS 2017 (v4.0.1212) EN
CMS files may be exported and shared to allow easy access to CMS data even when remote network access is not available. A backup plan is recommended for all solutions.
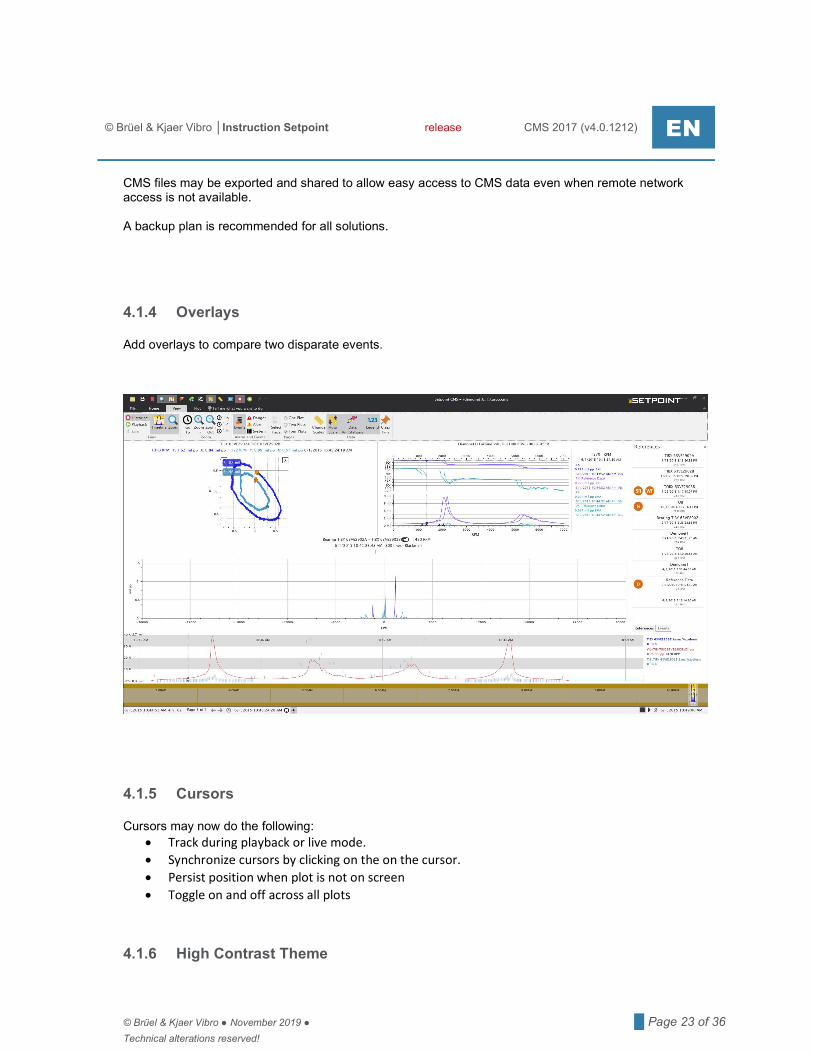
4.1.4 Overlays Add overlays to compare two disparate events.
4.1.5 Cursors Cursors may now do the following:
Track during playback or live mode. Synchronize cursors by clicking on the on the cursor. Persist position when plot is not on screen Toggle on and off across all plots
4.1.6 High Contrast Theme
Page 24 of 36 █ © Brüel & Kjaer Vibro ● November 2019 ● S108879.002 / V07 Technical alterations reserved!
EN
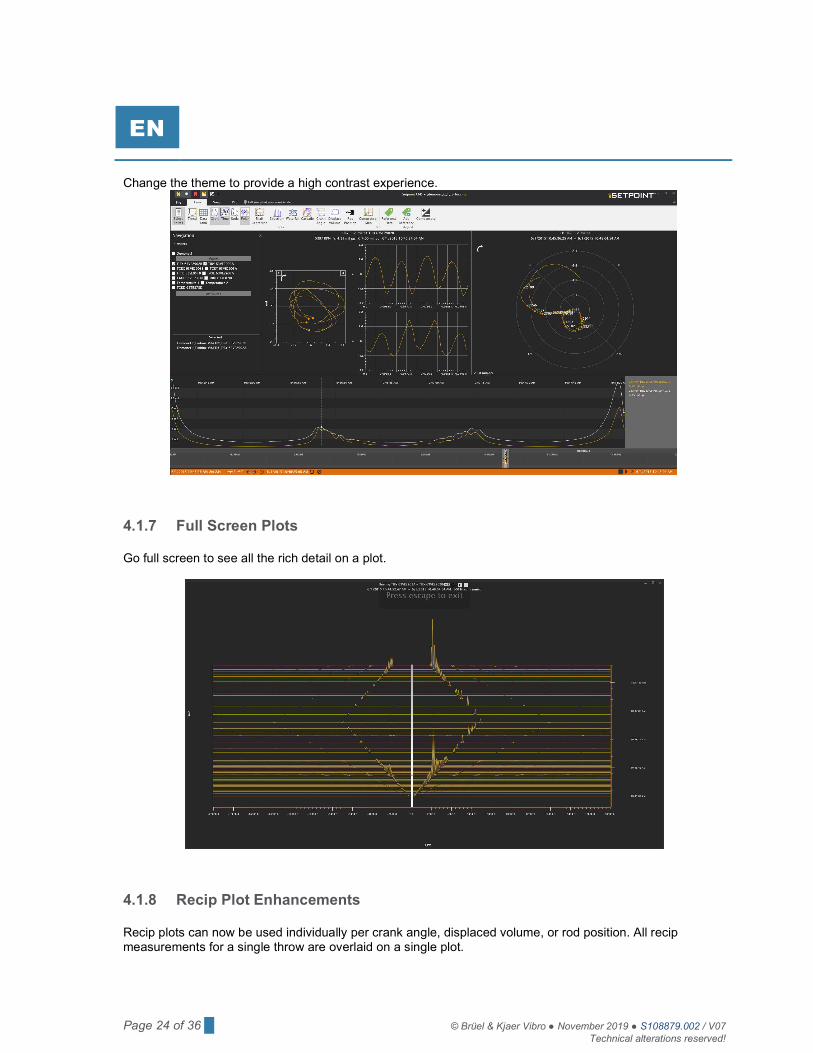
Change the theme to provide a high contrast experience.
4.1.7 Full Screen Plots Go full screen to see all the rich detail on a plot.
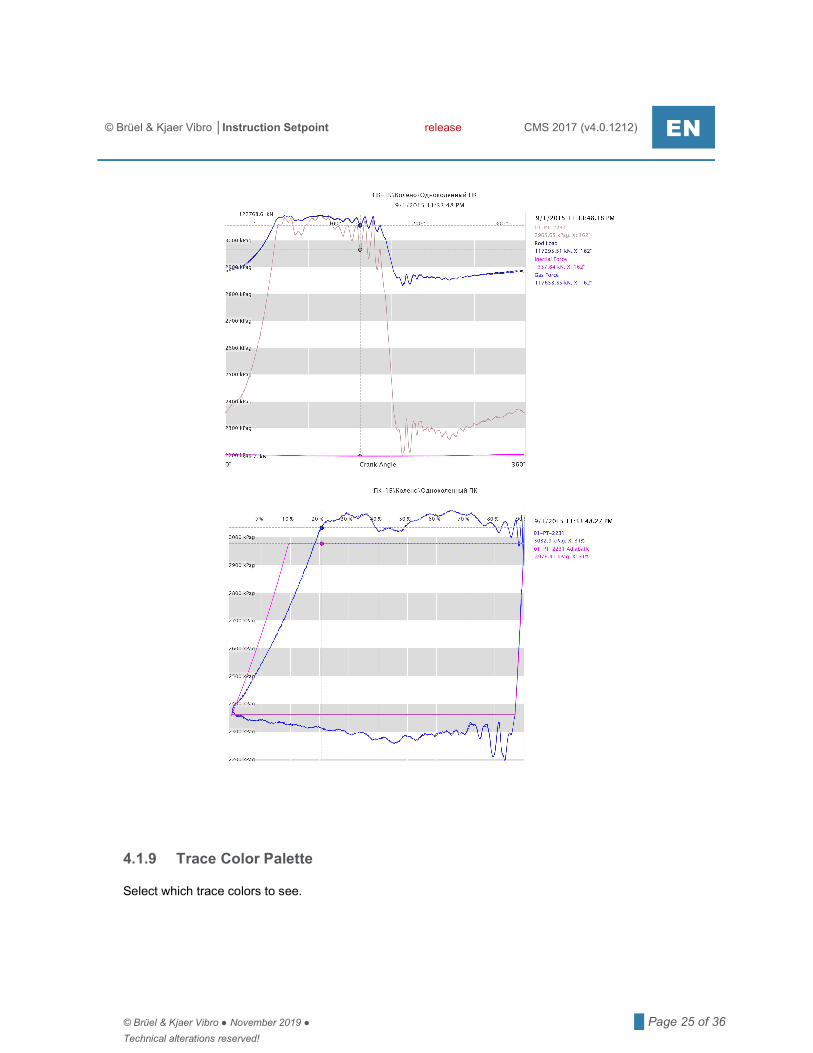
4.1.8 Recip Plot Enhancements Recip plots can now be used individually per crank angle, displaced volume, or rod position. All recip measurements for a single throw are overlaid on a single plot.
© Brüel & Kjaer Vibro ● November 2019 ● █ Page 25 of 36 Technical alterations reserved!
© Brüel & Kjaer Vibro │Instruction Setpoint release CMS 2017 (v4.0.1212) EN
4.1.9 Trace Color Palette Select which trace colors to see.
Page 26 of 36 █ © Brüel & Kjaer Vibro ● November 2019 ● S108879.002 / V07 Technical alterations reserved!
EN
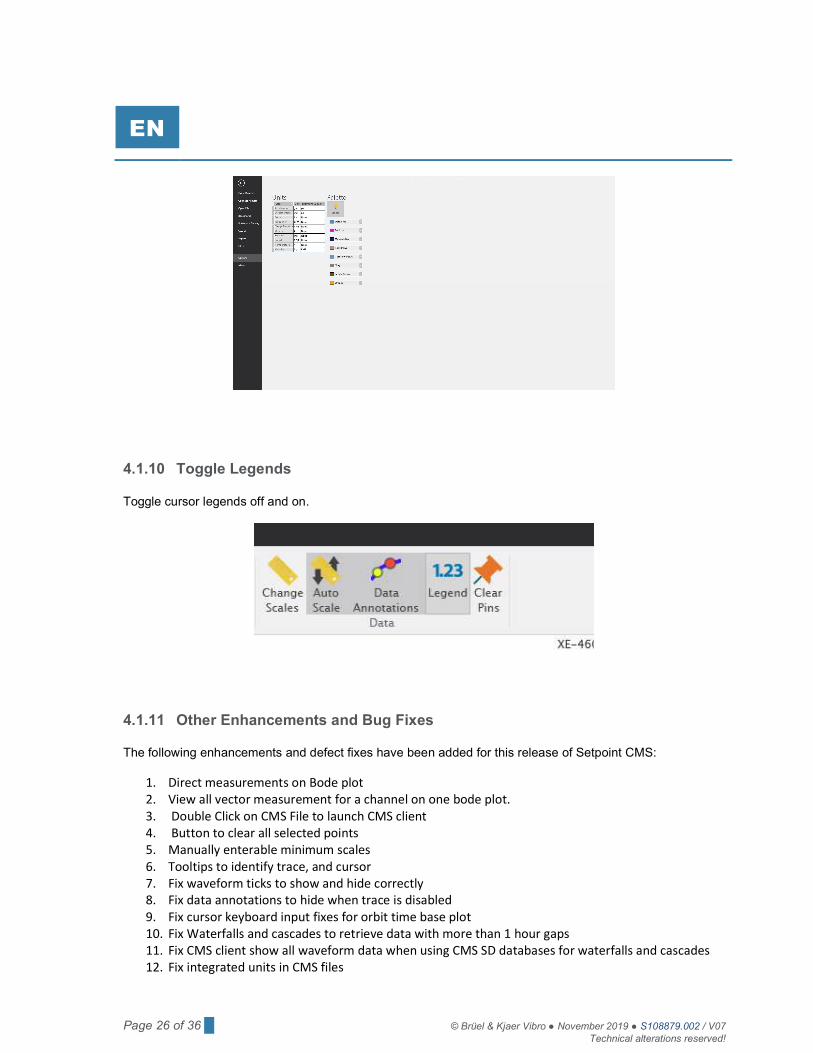
4.1.10 Toggle Legends Toggle cursor legends off and on.
4.1.11 Other Enhancements and Bug Fixes The following enhancements and defect fixes have been added for this release of Setpoint CMS:
1. Direct measurements on Bode plot 2. View all vector measurement for a channel on one bode plot. 3. Double Click on CMS File to launch CMS client 4. Button to clear all selected points 5. Manually enterable minimum scales 6. Tooltips to identify trace, and cursor 7. Fix waveform ticks to show and hide correctly 8. Fix data annotations to hide when trace is disabled 9. Fix cursor keyboard input fixes for orbit time base plot 10. Fix Waterfalls and cascades to retrieve data with more than 1 hour gaps 11. Fix CMS client show all waveform data when using CMS SD databases for waterfalls and cascades 12. Fix integrated units in CMS files

© Brüel & Kjaer Vibro ● November 2019 ● █ Page 27 of 36 Technical alterations reserved!
© Brüel & Kjaer Vibro │Instruction Setpoint release CMS 2017 (v4.0.1212) EN
13. Fix phase labels to a value range of 0 to 360 14. Fix issue with units disappearing on trend plot
Page 28 of 36 █ © Brüel & Kjaer Vibro ● November 2019 ● S108879.002 / V07 Technical alterations reserved!
EN
5 Version v3.00
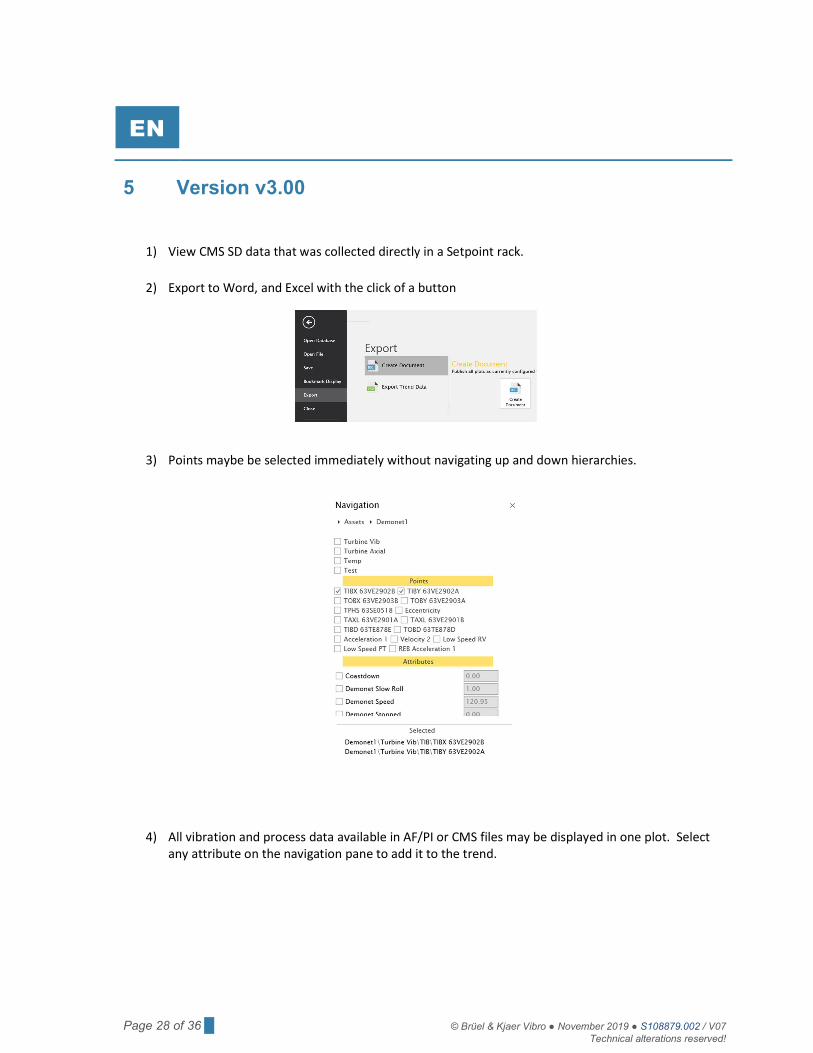
1) View CMS SD data that was collected directly in a Setpoint rack.
2) Export to Word, and Excel with the click of a button
3) Points maybe be selected immediately without navigating up and down hierarchies.
4) All vibration and process data available in AF/PI or CMS files may be displayed in one plot. Select any attribute on the navigation pane to add it to the trend.
© Brüel & Kjaer Vibro ● November 2019 ● █ Page 29 of 36 Technical alterations reserved!
© Brüel & Kjaer Vibro │Instruction Setpoint release Version v3.00 EN
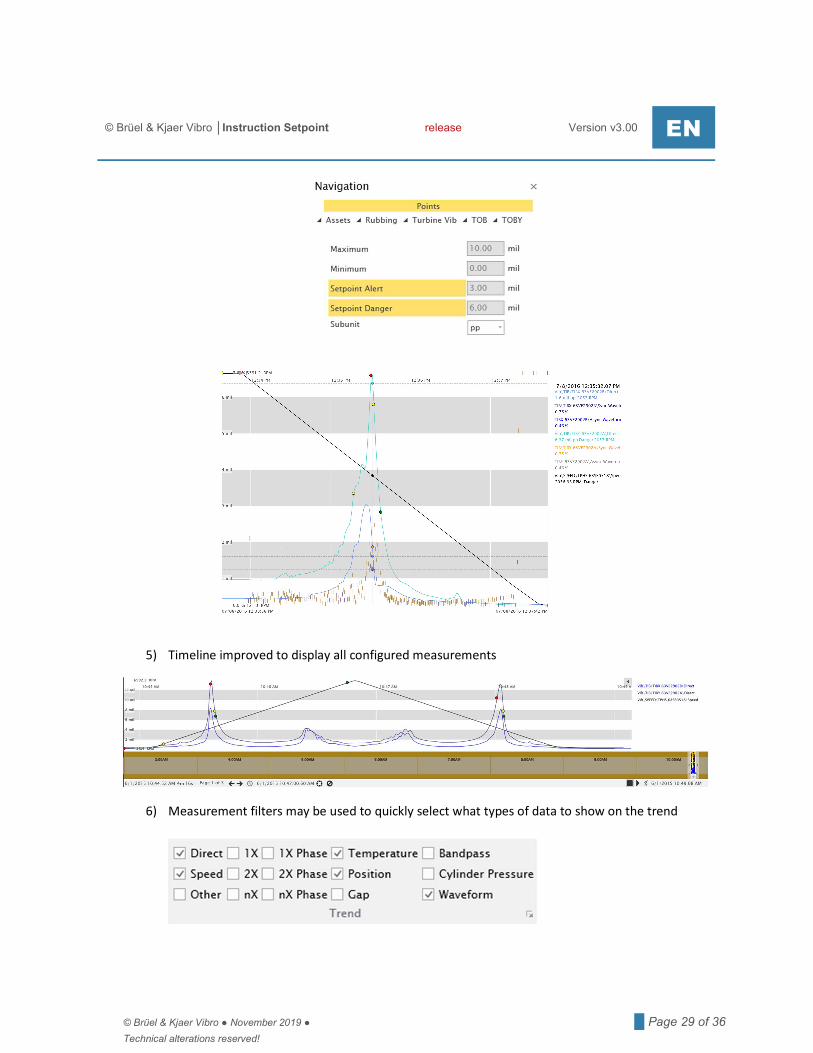
5) Timeline improved to display all configured measurements
6) Measurement filters may be used to quickly select what types of data to show on the trend
Page 30 of 36 █ © Brüel & Kjaer Vibro ● November 2019 ● S108879.002 / V07 Technical alterations reserved!
EN
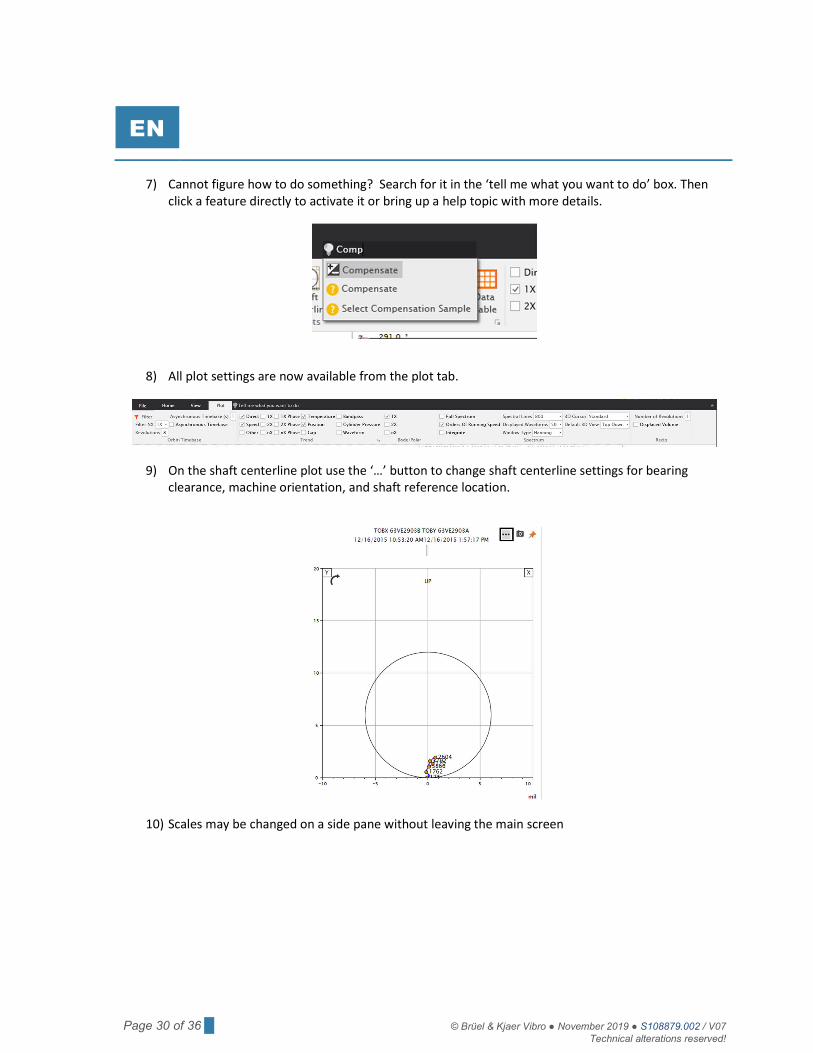
7) Cannot figure how to do something? Search for it in the ‘tell me what you want to do’ box. Then click a feature directly to activate it or bring up a help topic with more details.
8) All plot settings are now available from the plot tab.
9) On the shaft centerline plot use the ‘…’ button to change shaft centerline settings for bearing clearance, machine orientation, and shaft reference location.
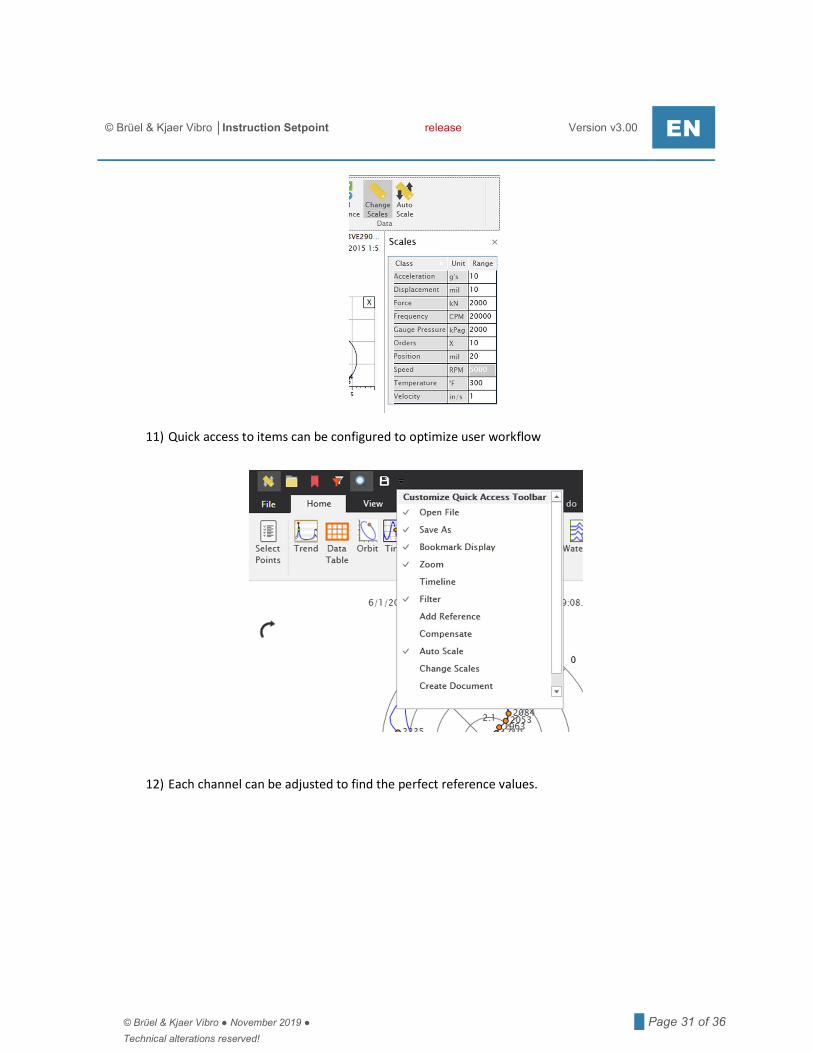
10) Scales may be changed on a side pane without leaving the main screen
© Brüel & Kjaer Vibro ● November 2019 ● █ Page 31 of 36 Technical alterations reserved!
© Brüel & Kjaer Vibro │Instruction Setpoint release Version v3.00 EN
11) Quick access to items can be configured to optimize user workflow
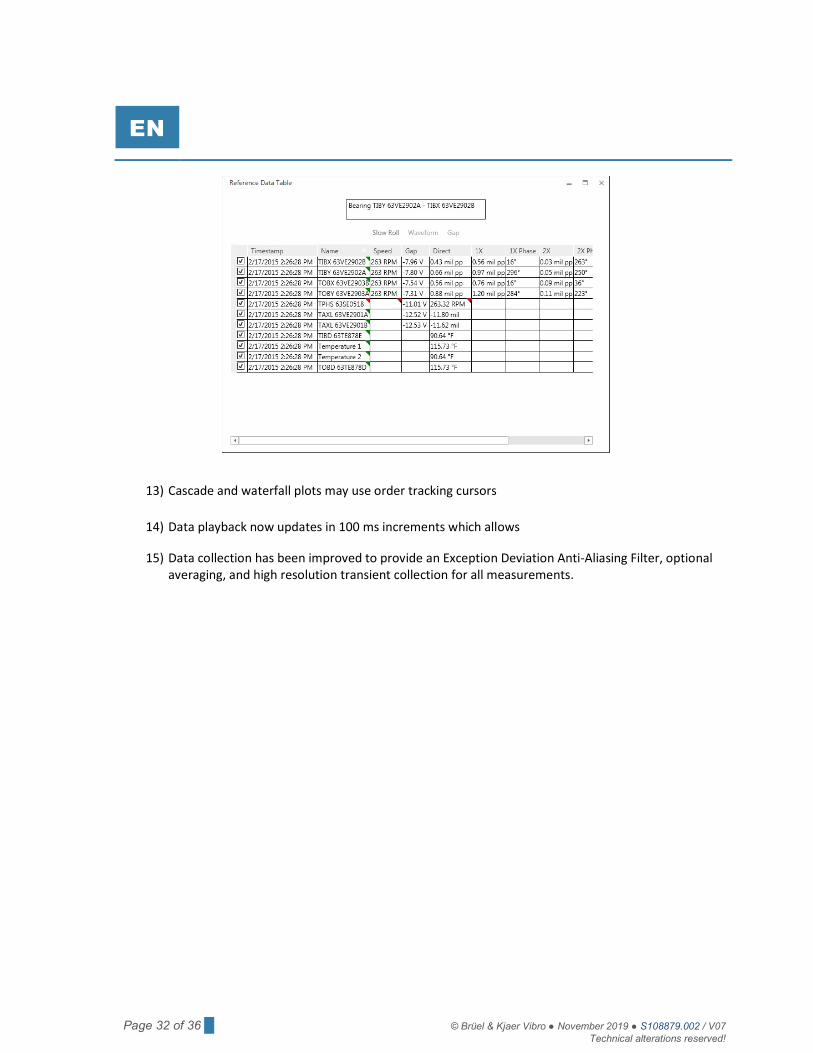
12) Each channel can be adjusted to find the perfect reference values.
Page 32 of 36 █ © Brüel & Kjaer Vibro ● November 2019 ● S108879.002 / V07 Technical alterations reserved!
EN
13) Cascade and waterfall plots may use order tracking cursors
14) Data playback now updates in 100 ms increments which allows
15) Data collection has been improved to provide an Exception Deviation Anti-Aliasing Filter, optional averaging, and high resolution transient collection for all measurements.
© Brüel & Kjaer Vibro ● November 2019 ● █ Page 33 of 36 Technical alterations reserved!
© Brüel & Kjaer Vibro │Instruction Setpoint release Version v2.52 EN
6 Version v2.52
The following changes have been made for SETPOINT CMS Client, and SETPOINT PI Adapter for revision 2.52:
1) Pinned Plots Flagging now pins not only the plot type, but the exact measurement point(s) selected. This will allow plots to display side-by-side Bode plots (and any other plot) from different machine cases.
2) Report Creation Developed primarily for customers (such as Timken and Toshiba) using CMS on test stands, but usable by any customers that need to generate reports. The reports use Microsoft WORD and automatically populate a document with plots, points, etc. as set up by the user in templates (see below). The only thing the user has to set before running a report is the data range selected (begin, end, and cursor position).
3) Report Template Creation Creates Microsoft WORD templates with specific plots in specific locations in the document. Can use any boilerplate verbiage, graphics, etc. of the user’s choice. Automatically grabs screen captures of CMS plots and places them in the designated location.
4) NX Transient Data Now collected with higher resolution to provide more usable plots
5) Measurement/Channel Status Bubbles Alarm “bubbles” superimposed on plots now reflect the specific measurement(s) selected. For example, if a trend of gap voltage is display, the alarm bubbles will only reflect gap voltage alarms – not any alarm for that channel. It thus filters alarms. The time slider at the bottom of the screen continues to reflect all alarms for the channel, thus providing a channel overview of alarms on top of the overall trend.
6) Plot Ordering Allows users to display plots and points in a particular order of their choosing. This is done by using the description field for points in AF. The CMS manual provides details on the conventions to use in AF descriptions to force points and plots to appear in a particular order.
7) New Waterfall, Cascade Perspective 3D plots previously used a vanishing point perspective and could make it difficult to interpret data. These plots now reflect a strictly orthogonal perspective so that spectral lines no longer “lean” inward or outward. The ability to rotate 3D plots is still present.
8) Saving/Opening data using .CMS files Beginning with release 2.50 (see item #9 in list below), CMS software now allows the user to save their selected time range and point(s) to an archive (.cms) file. This file can be shared and opened by anyone with CMS Display installed, and does not require AF client. When installing CMS Display, it will now automatically check the user’s computer for the presence of PI AF Client. If present, CMS Display will install such that the user will be able to connect to a PI Server (which required AF Client) or open a .cms file (archive – does not require PI AF). If not present, CMS Display will still

Page 34 of 36 █ © Brüel & Kjaer Vibro ● November 2019 ● S108879.002 / V07 Technical alterations reserved!
EN
install, but the user will only be able to open .CMS files – the option to connect to a PI Server will be grayed out. This release fixed some issues that prevented users from opening older .CMS files.
9) Global Default Database This enhancement was in response to a request by Eastman Chemical such that a particular PI Server could be designated as a default and would automatically connect with CMS Display is launched, rather than prompting the user to browse to and open the correct server each time.
10) Test Runs on home screen This feature is primarily for users with CMS on their test stands. It allows them to designate and bookmark test runs, for easy retrieval later.
© Brüel & Kjaer Vibro ● November 2019 ● █ Page 35 of 36 Technical alterations reserved!
© Brüel & Kjaer Vibro │Instruction Setpoint release Version v2.50 EN
7 Version v2.50
The following changes have been made for SETPOINT CMS Client, and SETPOINT PI Adapter revision 2.50:
1) Plot Enhancements a) Unobtrusive cursor labels b) Fine grain keyboard cursor control (1 / 700 of screen, or 1 RPM), similar to OSI products c) Native Gap reference data for Shaft Centerline plots d) Probe orientations, and direction of rotation drawn on plot e) Full Spectrum plot (Spectrum, Waterfall, Cascade) f) Full Spectrum cursors g) Integrated Spectrum capability h) Time base and orbit plots showing amplitudes in header i) Filter plots showing amplitude and phase in header j) Units for Data Table Values k) Page dot selections, and previews l) Always show associated speed in timeline m) Preferences for maximum number of traces, and orbit revolutions n) Manually type in desired data range o) Data Table may be sorted p) Rod Load, and Rod Position plots
2) Transient Data Improvements a) Transient detection to show rich startup/shut down data no matter what the time range is
(infinite zoom) b) Transient phase data capture to optimize phase data collection rate during steady state, but
still get very rich data during a transient event c) Bug: Fixed polar plots round corners using polar coordinates and more accurately present
polar data. 3) Sub-second updates during playback of historical data 4) Sub-second updates during live (Running Man) mode and performance improvements make the
application more responsive 5) Preference to turn on trends for all measurements (excluding phase) 6) Persist flagged plots with bookmarks 7) Waterfall and Cascade styling changes to draw lines instead of 3D surfaces 8) Data Collection Enhancements
a) Compression settings optimized based on system noise floor b) Start, and stop collection within Adapter c) Capture test runs in a multi-user environment
9) Data export for remote machinery diagnostics (export and then view up to one week of data remotely without pi installed)
10) PI System auditing to support optimization of pi tag compression settings 11) CMS and Adapter localization enhancements (with Russian language support) 12) Data annotations for waveform tick marks 13) Bug: Polar data is now correctly oriented against direction of rotation
Page 36 of 36 █ © Brüel & Kjaer Vibro ● November 2019 ● S108879.002 / V07 Technical alterations reserved!
EN
14) Bug: Stop interpolating invalid values on data table 15) Bug: Display Bode, and Polar samples, and scales between 0 and 360 16) Bug: Hide RPM in plot header when it does not apply 17) Bug: Fix number of spectral lines (last bucket was not shown) 18) Bug: Fix compression settings for integrated units 19) Bug: Fix phase values to be compressed when below min amplitude 20) RAID 5 tested with CMS 21) OSI AF 2014 R2 support