section 1.2: measurement systems and error
TRANSCRIPT

MAE 3340 INSTRUMENTATION SYSTEMS! 1!
Section 1.2: Measurement Systems and Error Classification (Chapt. 1, Chapt. 5.8-5.10 : Beckwidth)!
• Calibration !• Transduction!• Signal Conditioning!• Sampling/Resolution!• Logging/Recording!

MAE 3340 INSTRUMENTATION SYSTEMS! 2!
Example I: Mechanical Aircraft Airspeed Measurement System!

MAE 3340 INSTRUMENTATION SYSTEMS! 3!
Example II: More General Electro Mechanical System!

MAE 3340 INSTRUMENTATION SYSTEMS! 4!
Example III: Measurement and Control System!
MAE 3340 INSTRUMENTATION SYSTEMS! 5!
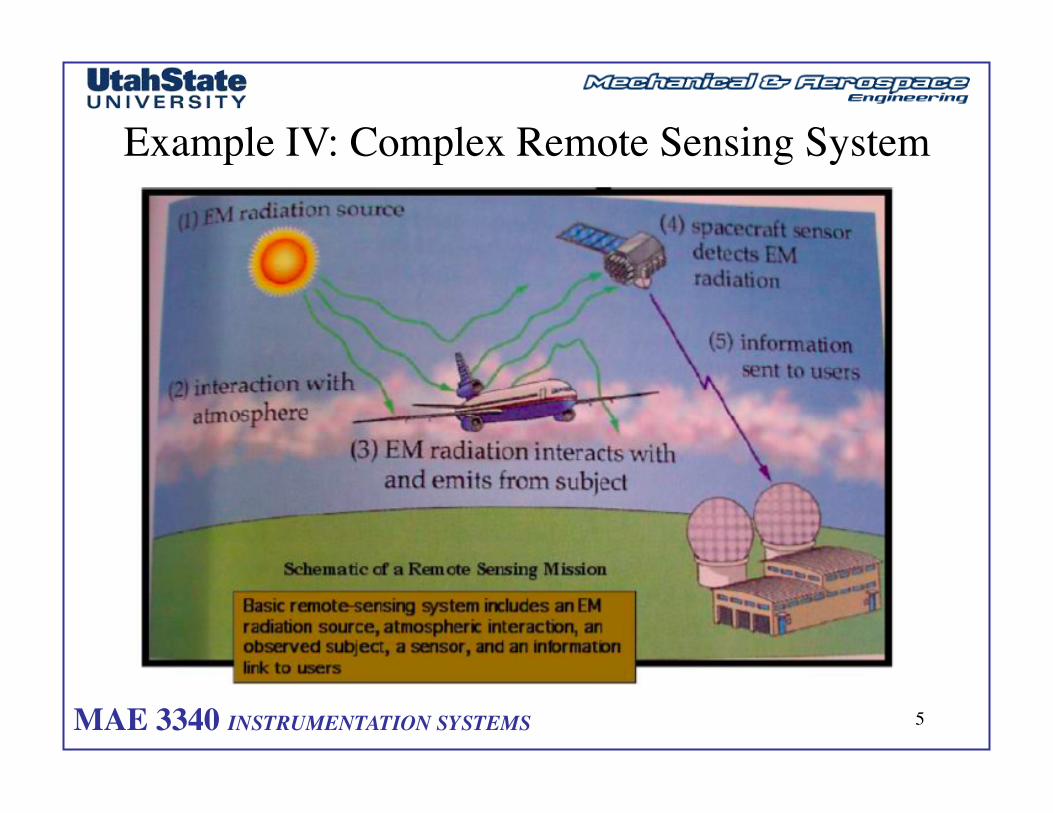
Example IV: Complex Remote Sensing System!

MAE 3340 INSTRUMENTATION SYSTEMS! 6!
Sensors/Transducers (1)!
A sensor is something that is sensitive to some phenomenon that we are interested in. It needs to respond to the phenomenon is some way that we can see or measure. !
Examples: !Mercury thermometer!
! !Wind Sock!
! !Thermocouple!
A transducer is a sensor tied to stuff (very often electronics) that makes the output of the sensor readable. Most transducers output a voltage or a current. … typically this is an element of a sensor!

MAE 3340 INSTRUMENTATION SYSTEMS! 7!
Sensors/Transducers (2)!

MAE 3340 INSTRUMENTATION SYSTEMS! 8!
Transducer Example!• Transducers convert the physical phenomenon being sensed Into an alternative signal (usually electrical or digital) that can be more easily sensed!
Pressure input!Electrical (Analog)!And Digital output!

MAE 3340 INSTRUMENTATION SYSTEMS! 9!
Sensors/Transducers (3)!

MAE 3340 INSTRUMENTATION SYSTEMS! 10!
Measurement Error!All measurements contain error. This may be difficult for you perfectionist types to come to grips with, but you will have error, and it is not a sin. The sin is not knowing how big your error can be. Or as Clint Eastwood says “A man’s got to know his limitations,” or something like that.!
In this chapter, we will learn how to estimate the size of the error in a given measurement. The theory is obtuse, but important, and will be clarified with hands-on examples in the lab.!
This is an extremely important topic (perhaps the most important topic in the course). It is also one that many people, including many experimentalists, do not fully understand.!

MAE 3340 INSTRUMENTATION SYSTEMS! 11!
Classification of Measurement Errors!1) Bias or systematic error!
• Calibration Error!• Recurring Human Errors!• Defective Equipment Errors!• Loading Errors!• Resolution Limitations !
2) Precision or random errors!!a) Human errors!!b) Equipment disturbance errors!!c) Fluctuating condition errors!!d) Insufficient sensitivity errors.!!e) Fundamental accuracy of sensor / Sampling Resolution!
3) Illegitimate errors!!a) Experimental mistakes!!b) Computational errors!
4) Errors that can appear as bias or precision !!a) Backlash, friction, hysteresis!!b) Calibration drift!!c) Errors from variations in procedure among experimenters!

MAE 3340 INSTRUMENTATION SYSTEMS! 12!
Instrument Performance Specs!Accuracy !The difference between the measured value and the ! !
! !actual value, reported as a maximum.!
Precision !The difference between the instrument’s reported ! !! !values during repeated measurements of the same quantity.!
Resolution !The smallest increment of change in the measured value !! !that can be determined from the instruments read out. !! !Usually similar or smaller than precision.!
Sensitivity !The change in the output of an instrument per unit ! !! !change in the input.!
Hysterysis !As a general term, hysteresis means a lag between ! !! !input and output in a system upon a change in ! !! !direction. !

MAE 3340 INSTRUMENTATION SYSTEMS! 13!
Precision versus Accuracy!
• Precision is the smallest number that can be !Repeatedly reproduced by a measurement System!
• Precision and Accuracy are NOT! The same!
Accuracy without Precision! Precision without Accuracy! Accuracy and Precision!small bias, !large random error!
significant bias, !small random error!
small bias and !small random error!

MAE 3340 INSTRUMENTATION SYSTEMS!
Data Acquisition!
14!
• Continuous analog measurand is represented by discretely sampled!“bits” using a Data Acquisition (DAQ) system!
• “Sampling” introduces resolution error!

MAE 3340 INSTRUMENTATION SYSTEMS! 15!
Measurement and Data Sampling!• When perform a measurement … a transducer converts the measurand into !an electrical signal … and this signal is “sampled” using a digital computer!

MAE 3340 INSTRUMENTATION SYSTEMS! 16!
Discrete Signals (1)!More times than not, modern measurements are made using digital data acquisition equipment (DAQ). Most real processes are analog in nature. As such, we need to be able to move freely between these two ways of thinking. !
0
0.5
1
0 1 2 3 4 5 6 7
δ
i
-1
-0.5
0
0.5
1
0 1 2 3 4 5 6 7
y(t)
i-1
-0.5
0
0.5
1
0 1 2 3 4 5 6 7
€
× =!

MAE 3340 INSTRUMENTATION SYSTEMS! 17!
Measurement Resolution (1) !• Resolution determines the ability to see fine details in the measurement.!
• Defined as the smallest incremental value that can be!Discerned by a system !
• Typically a consequence of data sampling!

MAE 3340 INSTRUMENTATION SYSTEMS! 18!
Measurement Resolution (2)!• Sampled Signals are typically represented by! Binary numbers or “digital words”!
Digital encoding!
• Digitized Sine Wave with a Resolution of Three Bits

MAE 3340 INSTRUMENTATION SYSTEMS! 19!
Measurement Resolution (3)!• Least-Significant Bit (LSB) …. !
Minimum change that can be represented in a digitized signal!
LSB!

MAE 3340 INSTRUMENTATION SYSTEMS! 20!
Measurement Resolution (4)!• Example: 8-bit word encoding!
• Full scale range of Sensor: … 0-10 volts!
• Range divided unto 28=256 parts or “counts”!
• Least significant bit = 10volts/256 = 0.039 volts/count!
• --> Analog output from sensor … 2.3575 volts!
• Sampled signal … !
“resolution error”!

MAE 3340 INSTRUMENTATION SYSTEMS! 21!
Measurement Resolution (5)!• Example: 16-bit word encoding!
• Full scale range of Sensor: … 0-10 volts!
• Range divided unto 216=65536 parts or “counts”!
• Least significant bit = 10volts/65536 = 0.000153 volts/count!
• --> Analog output from sensor … 2.3575 volts!
• Sampled signal … !
“resolution error” is!Two orders of magnitude less !

MAE 3340 INSTRUMENTATION SYSTEMS! 22!
Measurement Sensitivity (1)!• Example: unamplified Load cell … 3mv/volt output!
• 500 lbs full DAQ range!
•3mv full scale output per!Excitation voltage input!
• 15Volt excitation …. !

MAE 3340 INSTRUMENTATION SYSTEMS! 23!
Measurement Sensitivity (2)!• Example: amplified Load cell output …gain = 100!
• 500 lbs full scale reading!
•3mv full scale output per!Excitation voltage input!
• 15Volt excitation …. !

MAE 3340 INSTRUMENTATION SYSTEMS! 24!
Hysteresis (1)!Many sensors have the undesirable characteristic of giving a different value when the input is increasing than when it is decreasing. This is called hysteresis.!
As a general term, hysteresis means a lag !between input and output in a system upon a !change in direction. !
Anyone who's ever driven an old automobile !with "loose" steering knows what hysteresis is: !
to change from turning left to turning right (or !visa-versa), you have to rotate the steering wheel !an additional amount to overcome the built-in !"lag" in the mechanical linkage system between !the steering wheel and the front wheels of the car.!

MAE 3340 INSTRUMENTATION SYSTEMS! 25!
Hysteresis (2)!Example: Aviation Magnetometer (Compass) Lag!• In a magnetic system, hysteresis is seen in a ferromagnetic !material that tends to stay magnetized after an applied !field force has been removed.!
Cross lines of !flux clockwise!
Cross lines of !flux counter!clockwise!

MAE 3340 INSTRUMENTATION SYSTEMS! 26!
Hysteresis (3)!
MAE 3340 INSTRUMENTATION SYSTEMS! 27!
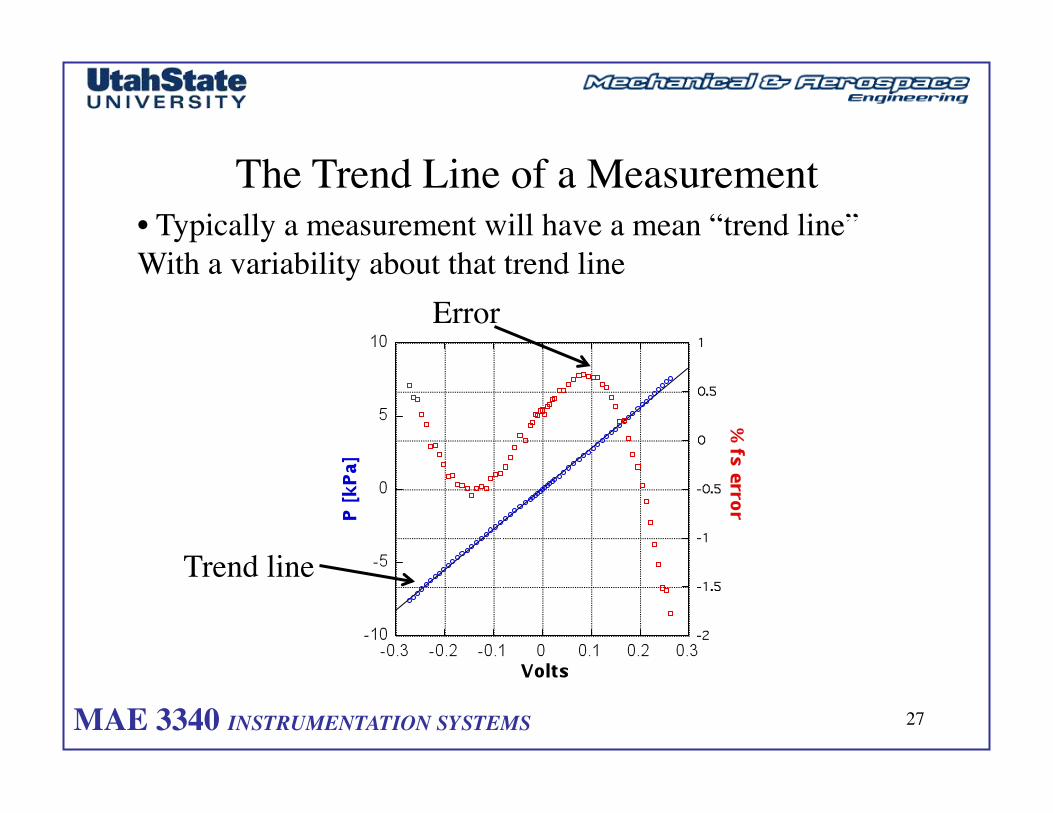
The Trend Line of a Measurement!• Typically a measurement will have a mean “trend line”!With a variability about that trend line!
Trend line!
Error!

MAE 3340 INSTRUMENTATION SYSTEMS! 28!
Linearity!Many types of sensors have linear input/output behavior, along a defined range of inputs. The sensor thus follows an input/output relation like!
yL(x) = a0 + a1x. !
These will often be marketed as linear, and the only calibration data you get is the slope of the input/output relation (a1) and the zero input value (a0). For these types of sensors, the deviation from linear behavior is reported in the specifications. This deviation can be calculated: eL(x) = y(x) - yL(x). The spec is usually the percentage error relative to full scale, or !

MAE 3340 INSTRUMENTATION SYSTEMS! 29!
Non-linear Response Example!
• Many times!The trend is!Not a line but a!“curve” .. And!We describe the!Trend as a !“calibration” curve!

MAE 3340 INSTRUMENTATION SYSTEMS! 30!
Zero-shift and Sensitivity errors!Variations in the trend parameters a0 and a1 are called zero !errors and sensitivity errors, respectively . Zero errors are handled rather easily by measuring the zero input response before measurements are started. These two errors are often sensitive to temperature fluctuations in electronic equipment. !

MAE 3340 INSTRUMENTATION SYSTEMS! 31!
The Measurement Process: Using Calibrated System!
• Using a “Calibrated System”!
Example I: How do you !measure the length of a !“Big” Snake!
-- Naturalists measure length of the animal using in a string following a imaginary middle line of the body from head to tail.
-- then the length of the string is measured by laying it on a ruler
-- allows recording of the actual length of the animal regardless of its position and without having to stretch the snake.
“Hold still … will ya!”!

MAE 3340 INSTRUMENTATION SYSTEMS! 32!
Example II: Pressure Transducer Calibration!• Example … Omega PX143 Series
“Differential Pressure Transducer”
Amplified Output ΔP = P2 - P1
Vout ~ to ΔP Vout

MAE 3340 INSTRUMENTATION SYSTEMS! 33!
Pressure Transducer Calibration (2)!

MAE 3340 INSTRUMENTATION SYSTEMS! 34!
Pressure Transducer Calibration (3)!
• … 1-6 Vdc range … 3.50 Vdc balance
For +1 psid Transducer (PX143-01BD5V)
Linear Calibration!

MAE 3340 INSTRUMENTATION SYSTEMS! 35!
Pressure Transducer Calibration (4)!For +1 psid Transducer (PX143-01BD5V)
• Need to Verify this calibration!

MAE 3340 INSTRUMENTATION SYSTEMS! 36!
Pressure Transducer Calibration (5)!Compare voltage output against reference standard!
Input pressures
Slightly nonlinear fit!

MAE 3340 INSTRUMENTATION SYSTEMS! 37!
Pressure Transducer Calibration (6)!
Residual “error” plot!
Calibration!
Error!

MAE 3340 INSTRUMENTATION SYSTEMS! 38!
Calibration Example III (1)!• Hot-wire anemometer is a device that heats a wire by pumping current through it and keeps its resistance (and thus its temperature) constant.
• When air blows on the wire the current required to keep the wire hot goes up. …. instrument is sensitive to velocity. Requires calibration against a known velocity.
A1, V1, P1!A2, V2, P2!
• A1 is 100 times larger than A2, so V12
is negligible (10-4) compared to V22. !
ª Bernoulli Law … !
Hot wire! P1! P2!
Use Pressure Transducer!Calibrated in previous step!To sense velocity!
MAE 3340 INSTRUMENTATION SYSTEMS! 39!
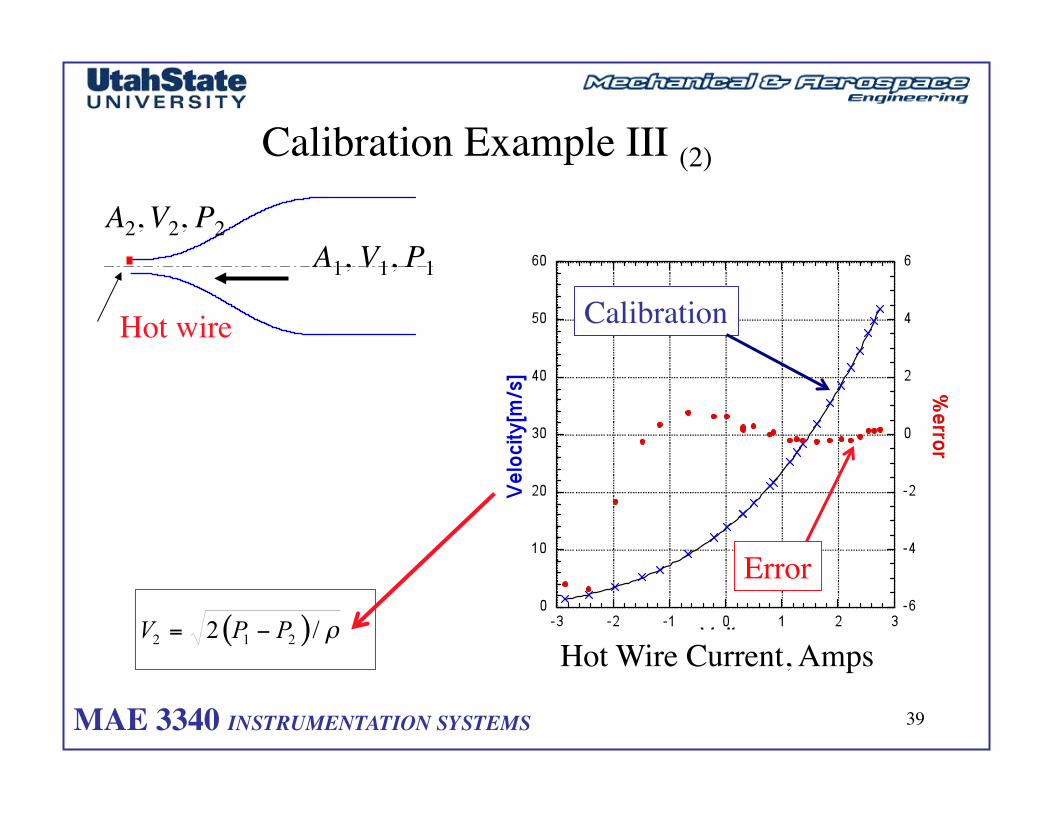
Calibration Example III (2)!
A1, V1, P1!A2, V2, P2!
Hot wire!
Hot Wire Current, Amps!
Calibration!
Error!

MAE 3340 INSTRUMENTATION SYSTEMS! 40!
Example of Measurement Calibration Error (1) !• Rate Gyro calibration!
Spin table!

MAE 3340 INSTRUMENTATION SYSTEMS! 41!
Example of Measurement Calibration Error (2) !• Three different !Sensors !of same make were !tested using!Same spin table !as the reference!
(zero shift)!
Random error!Variability Of each is !Nearly identical!
Offsets are Very different!

MAE 3340 INSTRUMENTATION SYSTEMS! 42!
Quantification of Error!
• Whenever possible, systematic errors are taken out!Of a measurement system using trend lines and calibration!Curves … !
• The remaining errors are unknown and must be quantified!Using statistical means …. !
Our best tools for this quantification are the Mean and!Standard deviation!

MAE 3340 INSTRUMENTATION SYSTEMS! 43!
Mean Value of a Random Sample!• The mean value (µ) of a random population is what is commonly!Referred to as the “average” … it is the most likely value to occur!… more on this in the next section!
… for a sample of n members, selected at random from the !population we can Represent the mean by the “Sample mean”!
µ ≈ x =x1 + x2 + x3 + ...xn
n=
xini=1
n
∑• For error quantification … mean error can be considered as bias!

MAE 3340 INSTRUMENTATION SYSTEMS! 44!
Standard Deviation of a Random Sample!• A random sample will always vary about the mean .. And a!Quantification of this variability is referred to as the “standard !Deviation” … the square of the standard deviation is called the!“variance”!… for a sample of n members, selected at random from the !population we can true variance by the “sample variance”!
σ ≈ Sx =x1 − x
_$%
&'
2
+ x2 − x_$
%&'
2
+ ... xn − x_$
%&'
2
n −1=
xi − x_$
%&'
2
n −1i=1
n
∑
• … standard deviation is used to quantify the random error!In a measurement!

MAE 3340 INSTRUMENTATION SYSTEMS! 45!
Mean and Standard Deviation of a Random Sample!
x(t) !µ"+σ"�σ!

MAE 3340 INSTRUMENTATION SYSTEMS! 46!
Error Propagation (1)!More often then not, the quantity we are interested in measuring is a function of a several other independent sensed variables .. And the end result is calculated from these independent variables .. How do we account for the errors in the independent variable measurements?!
example→ z = f (x, y)....x, y are noisy measurements...what can we say about error in z?
Uz
2 ≅Ux2 ∂ f∂ x#
$%
&
'(2
+Uy2 ∂ f∂ y#
$%
&
'(
2
+Uu2 ∂ f∂u#
$%
&
'(2
+Uv2 ∂ f∂v#
$%
&
'(2
+!
Eqn. 3.35 in B.M.L.!

MAE 3340 INSTRUMENTATION SYSTEMS! 47!
Error Propagation Example (2)!The book cites the example of estimating volume flow rate by measuring the time it takes to fill a bucket of known volume. Q = V/t If you knew the uncertainty of V and the uncertainty of t, how do you find the uncertainty of Q?!
• LOOK AT CHAIN RULE FOR DIFFERENTIATION!
∂Q = ∂ V/t( ) = ∂Q∂V
⋅ ∂V +∂Q∂t
⋅ ∂t→ ∂Q∂V
$%&
'()=
1t
$%&'()→
∂Q∂t
$%&
'()= −
Vt 2$%&
'()
→∂Q∂V
$%&
'()
2
=1t
$%&'()
2
→∂Q∂t
$%&
'()
2
=Vt 2$%&
'()
2

MAE 3340 INSTRUMENTATION SYSTEMS! 48!
Error Propagation Example (3)!Assuming unbiased measurements of V and t, and that errors in these measurements are uncorrelated!
σ t2 = δt( )∑
2
σV2 = δV( )∑
2
$
%
&&
'
(
))→ δtδV( )∑ ≈ 0
• Substitute in for!
→∂Q∂V
#$%
&'(
2
=1t
#$%&'(
2
→∂Q∂t
#$%
&'(
2
=Vt 2#$%
&'(
2
σQ2 =
∂Q∂V
#$%
&'(
2
σV2 +
∂Q∂t
#$%
&'(
2
σ t2 =
1t
#$%&'(
2
⋅σV2 +
Vt 2#$%
&'(
2
⋅σ t2

MAE 3340 INSTRUMENTATION SYSTEMS! 49!
Overall Measurement Uncertainty!
• The overall uncertainty of a measurement will be a combination of the bias uncertainty and the precision uncertainty !
• If we can account for the bias we take it out … otherwise bias is modeled as an uncertainly!
• The overall uncertainty is the Root-sum-square (RSS) of the Bias and random uncertainty + other classifiable errors like hysterysis, calibration, etc.!
! ! Ux = (Bx2 + Rx
2+… )1/2!

MAE 3340 INSTRUMENTATION SYSTEMS! 50!
Uncertainty Analysis Procedure (1)!1) Find the functional form of what you will measure (e.g. Re = Ud/v)!
2) Identify all variables to be measured (U, d, v)!
3) For each of these quantities, determine the bias error based on instrument specs and calibration information!
E.G., the velocity probe has an accuracy of 2% of reading (0.02U) or perhaps 1% of full scale. The diameter is known to the resolution of the measuring caliper, which is 0.001”.!
4) For each of the quantities, if repeated measurements produce different results, sample the quantity until the desired precision uncertainty is obtained. ENSURE ALL SAMPLES ARE INDEPENDENT. If not, your precision error is larger than you have estimated. A desirable precision uncertainty is similar to the bias uncertainty.!

MAE 3340 INSTRUMENTATION SYSTEMS! 51!
Uncertainty Analysis Procedure (2)!5) Root sum square the bias and precision uncertainty for each
quantity.!
6) Propagate the uncertainty. If component uncertainties are provided as percentages (relative uncertainties, as opposed to absolute uncertainties), and if the functional form is multiplications, divisions and powers, it may be convenient to write the propagation equation in terms of relative uncertainties by dividing through by the function.!
€
uRe2 = uU
2 ∂Re∂U
#
$ %
&
' ( 2
+ ud2 ∂Re∂d
#
$ %
&
' ( 2
+ uv2 ∂Re∂v
#
$ %
&
' ( 2
uRe2 = uU
2 dv#
$ % &
' ( 2
+ ud2 Uv
#
$ %
&
' ( 2
+ uv2 −
dUv 2
#
$ %
&
' ( 2
uRe2
Re2=
uUU#
$ %
&
' (
2
+udd
#
$ %
&
' (
2
+uvv#
$ %
&
' (
2
• Compute total error!
Ux = (Bx2 + Rx
2)1/2!
• Carefully go Through Example!3.15 (pp 78-81) in B.M.L!

MAE 3340 INSTRUMENTATION SYSTEMS! 52!
Experimental Design Tips!1) Avoid approaches that require two large numbers to be measured in order to
determine the small difference between them. For example, large uncertainty is likely when measuring δ = (x1 - x2) if δ << x1.!
2) Design experiments that amplify the signal strength to improve sensitivity.!
3) Build “null designs” in which the output is measured as a change from zero rather than a change in a non-zero value. This reduces both bias and precision errors. Such designs often make the output proportional to the difference of two sensors.!
4) Avoid experiments where large correction factors are applied!
5) Attempt to minimize loading errors!
6) Calibrate the entire system rather than the individual components.!

MAE 3340 INSTRUMENTATION SYSTEMS! 53!
Graphical Presentation of Data (1)!A graph should be used when it will convey information and portray
significant features more efficiently than words or tabulations.!
Graphs should:!
1) Require minimal effort from the reader in understanding and interpreting the information it conveys!
2) The axes should have clear labels that name the quantity plotted, its units, and its symbol!
3) Axes should be clearly numbered and should have tick marks for significant numerical divisions. Typically, ticks should appear in increments of 1, 2, or 5 units. Not every tick need be numbered. Too many will clutter the axis.!
4) Use scientific notation to avoid placing too many digits on the graph. !

MAE 3340 INSTRUMENTATION SYSTEMS! 54!
Graphical Presentation of Data (2)!5) When plotting on logarithm axes, place ticks at powers of 10 and minor
ticks at 10, 20, 50, 100, 200, etc.!
6) Axes should usually include 0.!
7) The choice in scales and proportions should be commensurate with the relative importance of the variations shown in the results.!
8) Use symbols, Not dots, for data points. Open symbols should be used before closed. When allowed USE COLOR!!
9) Either place error bars on the plot that indicate uncertainty or use symbols that are the size of the uncertainty.!
10) When several curves appear on the same plot, use different line styles to distinguish them. Avoid using colors. !

MAE 3340 INSTRUMENTATION SYSTEMS! 55!
Graphical Presentation of Data (3)!11) Minimize lettering on graphs!
12) Labels on the axes and curves should be oriented to be read from the bottom or from the right. Avoid forcing the reader to rotate the figure to read it.!
13) The graph should have a descriptive but concise title. !
14) When plotting points collected from multiple trials use “error bars” to show the accuracy range for each sample.!
Bottom Line- You want to communicate information to your reader. The burden to get your point across falls to you. The chances of successfully communicating your point are improved considerably when you make it easy on the reader. Never think of your plot as pretty graphics. If that is all it is, you should remove it. !

MAE 3340 INSTRUMENTATION SYSTEMS! 56!
Graphical Presentation of Data (4)!

MAE 3340 INSTRUMENTATION SYSTEMS! 57!
Graphical Presentation of Data (5)!
Error in Independent Variable!
Error in Dependent Variable!

MAE 3340 INSTRUMENTATION SYSTEMS! 58!
Graphical Presentation of Data (6)!
+Error (Utotal) in !Dependent !Variable!

MAE 3340 INSTRUMENTATION SYSTEMS! 59!
Graphical Presentation of Data (7)!
Can Also use !Continuous Uncertainty!Bounds!