seasonality intensification and long-term winter cooling as a part of the late pliocene climate...
TRANSCRIPT
www.elsevier.com/locate/epsl
Earth and Planetary Science L
Seasonality intensification and long-term winter cooling as a part of
the Late Pliocene climate development
Stefan Klotz a,b,*, Severine Fauquette c, Nathalie Combourieu-Nebout d, Dieter Uhl a,e,
Jean-Pierre Suc b, Volker Mosbrugger a
a Institut fur Geowissenschaften, Universitat Tubingen, Sigwartstr. 10, 72070 Tubingen, Germanyb Laboratoire PaleoEnvironnements et PaleobioSphere (UMR 5125 CNRS), Universite Claude, Bernard- Lyon 1,
27-43 boulevard du 11 Novembre, 69622 Villeurbanne Cedex, Francec Institut des Sciences de l’Evolution (UMR 5554 CNRS), Universite Montpellier II, Place Eugene Bataillon, 34095 Montpellier Cedex 05, France
d Laboratoire des Sciences du Climat et de l’Environnement (UMR 1572), L’Orme des Merisiers, Centre de Saclay,
91191 Gif-sur-Yvette Cedex, Francee Laboratory of Palaeobotany and Palynology, Department of Palaeoecology, University of Utrecht, Budapestlaan 4,
3584 CD Utrecht, The Netherlands
Received 16 March 2005; received in revised form 15 September 2005; accepted 5 October 2005
Available online 21 November 2005
Editor: H. Elderfield
Abstract
A mutual climatic range method is applied to the Mediterranean marine pollen record of Semaforo (Vrica section, Calabria,
Italy) covering the period from ~2.46 Ma to ~2.11 Ma. The method yields detailed information on summer, annual and winter
temperatures and on precipitation during the nine obliquity and precession-controlled dglacialT periods (marine isotope stages 96 to
80) and eight dinterglacialT periods (marine isotope stages 95 to 81) characterising this time interval. The reconstruction reveals
higher temperatures of at least 2.8 8C in mean annual and 2.2 8C in winter temperatures, and 500 mm in precipitation during the
dinterglacialsT as compared to the present-day climate in the study area. During the dglacialsT, temperatures are generally lower as
compared to the present-day climate in the region, but precipitation is equivalent. Along the consecutive dinterglacialsT, a trend
toward a reduction in annual and winter temperatures by more than 2.3 8C, and toward a higher seasonality is observed. Along the
consecutive dglacialsT, a trend toward a strong reduction in all temperature parameters of at least 1.6 8C is reconstructed. Climatic
amplitudes of dinterglacial–glacialT transitions increase from the older to the younger cycles for summer and annual temperatures.
The cross-spectral analyses suggest obliquity related warm/humid–cold/dry dinterglacial–glacialT cycles which are superimposed by
precession related warm/dry– cold/humid cycles. A time displacement in the development of temperatures and precipitation is
indicated for the obliquity band by temperatures generally leading precipitation change at ~4 kyr, and on the precession band of
~9.6 kyr in maximum.
D 2005 Elsevier B.V. All rights reserved.
Keywords: Late Pliocene; obliquity; precession; palaeoclimate; pollen
0012-821X/$ - see front matter D 2005 Elsevier B.V. All rights reserved.
doi:10.1016/j.epsl.2005.10.005
* Corresponding author. Institut fur Geowissenschaften, Universitat
Tubingen, Sigwartstr. 10, 72070 Tubingen Germany. Tel.: +49 7071
2973081; fax: +49 7071 295217.
E-mail address: [email protected] (S. Klotz).
1. Introduction
Research into the Late Pliocene climate is of espe-
cial interest as it contributes to the understanding of
etters 241 (2006) 174–187
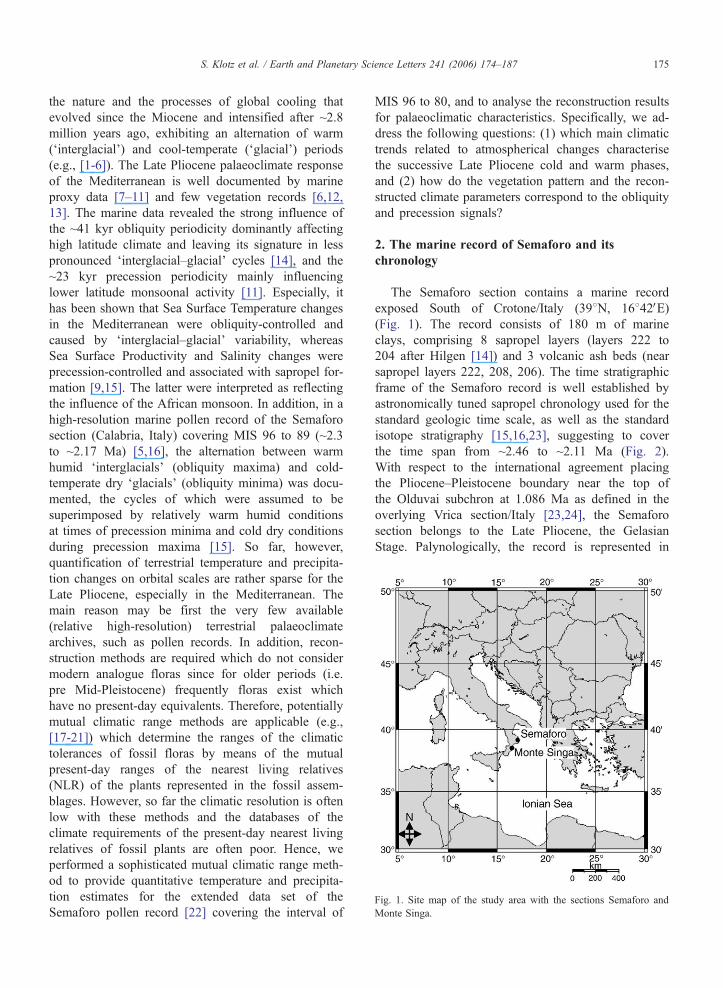
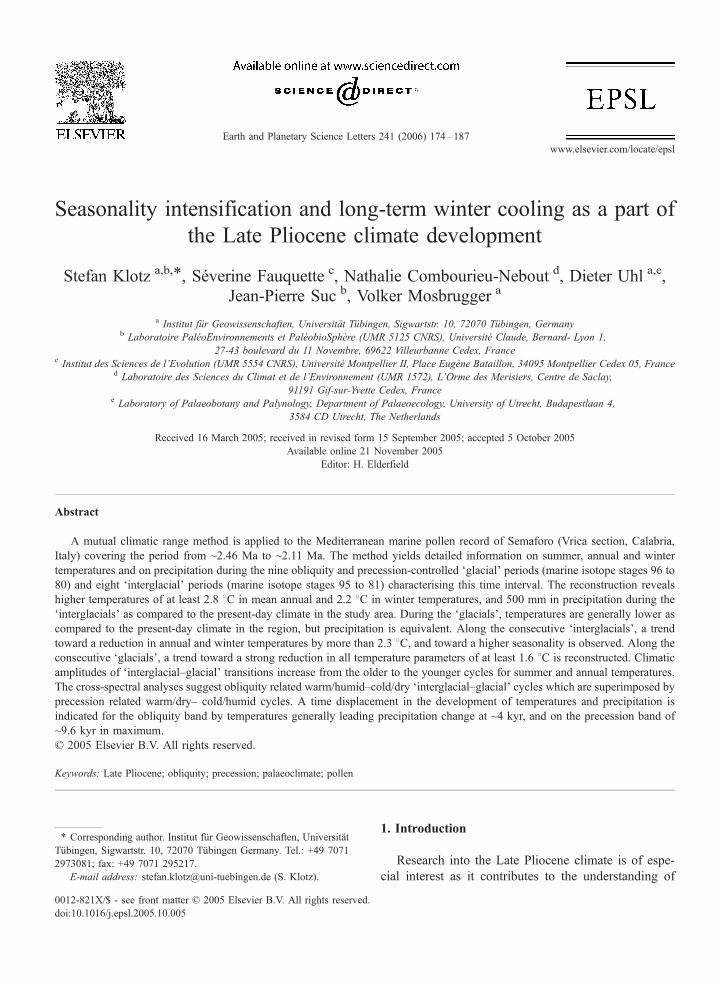
Fig. 1. Site map of the study area with the sections Semaforo and
Monte Singa.
S. Klotz et al. / Earth and Planetary Science Letters 241 (2006) 174–187 175
the nature and the processes of global cooling that
evolved since the Miocene and intensified after ~2.8
million years ago, exhibiting an alternation of warm
(dinterglacialT) and cool-temperate (dglacialT) periods
(e.g., [1-6]). The Late Pliocene palaeoclimate response
of the Mediterranean is well documented by marine
proxy data [7–11] and few vegetation records [6,12,
13]. The marine data revealed the strong influence of
the ~41 kyr obliquity periodicity dominantly affecting
high latitude climate and leaving its signature in less
pronounced dinterglacial–glacialT cycles [14], and the
~23 kyr precession periodicity mainly influencing
lower latitude monsoonal activity [11]. Especially, it
has been shown that Sea Surface Temperature changes
in the Mediterranean were obliquity-controlled and
caused by dinterglacial–glacialT variability, whereas
Sea Surface Productivity and Salinity changes were
precession-controlled and associated with sapropel for-
mation [9,15]. The latter were interpreted as reflecting
the influence of the African monsoon. In addition, in a
high-resolution marine pollen record of the Semaforo
section (Calabria, Italy) covering MIS 96 to 89 (~2.3
to ~2.17 Ma) [5,16], the alternation between warm
humid dinterglacialsT (obliquity maxima) and cold-
temperate dry dglacialsT (obliquity minima) was docu-
mented, the cycles of which were assumed to be
superimposed by relatively warm humid conditions
at times of precession minima and cold dry conditions
during precession maxima [15]. So far, however,
quantification of terrestrial temperature and precipita-
tion changes on orbital scales are rather sparse for the
Late Pliocene, especially in the Mediterranean. The
main reason may be first the very few available
(relative high-resolution) terrestrial palaeoclimate
archives, such as pollen records. In addition, recon-
struction methods are required which do not consider
modern analogue floras since for older periods (i.e.
pre Mid-Pleistocene) frequently floras exist which
have no present-day equivalents. Therefore, potentially
mutual climatic range methods are applicable (e.g.,
[17-21]) which determine the ranges of the climatic
tolerances of fossil floras by means of the mutual
present-day ranges of the nearest living relatives
(NLR) of the plants represented in the fossil assem-
blages. However, so far the climatic resolution is often
low with these methods and the databases of the
climate requirements of the present-day nearest living
relatives of fossil plants are often poor. Hence, we
performed a sophisticated mutual climatic range meth-
od to provide quantitative temperature and precipita-
tion estimates for the extended data set of the
Semaforo pollen record [22] covering the interval of
MIS 96 to 80, and to analyse the reconstruction results
for palaeoclimatic characteristics. Specifically, we ad-
dress the following questions: (1) which main climatic
trends related to atmospherical changes characterise
the successive Late Pliocene cold and warm phases,
and (2) how do the vegetation pattern and the recon-
structed climate parameters correspond to the obliquity
and precession signals?
2. The marine record of Semaforo and its
chronology
The Semaforo section contains a marine record
exposed South of Crotone/Italy (398N, 16842VE)(Fig. 1). The record consists of 180 m of marine
clays, comprising 8 sapropel layers (layers 222 to
204 after Hilgen [14]) and 3 volcanic ash beds (near
sapropel layers 222, 208, 206). The time stratigraphic
frame of the Semaforo record is well established by
astronomically tuned sapropel chronology used for the
standard geologic time scale, as well as the standard
isotope stratigraphy [15,16,23], suggesting to cover
the time span from ~2.46 to ~2.11 Ma (Fig. 2).
With respect to the international agreement placing
the Pliocene–Pleistocene boundary near the top of
the Olduvai subchron at 1.086 Ma as defined in the
overlying Vrica section/Italy [23,24], the Semaforo
section belongs to the Late Pliocene, the Gelasian
Stage. Palynologically, the record is represented in
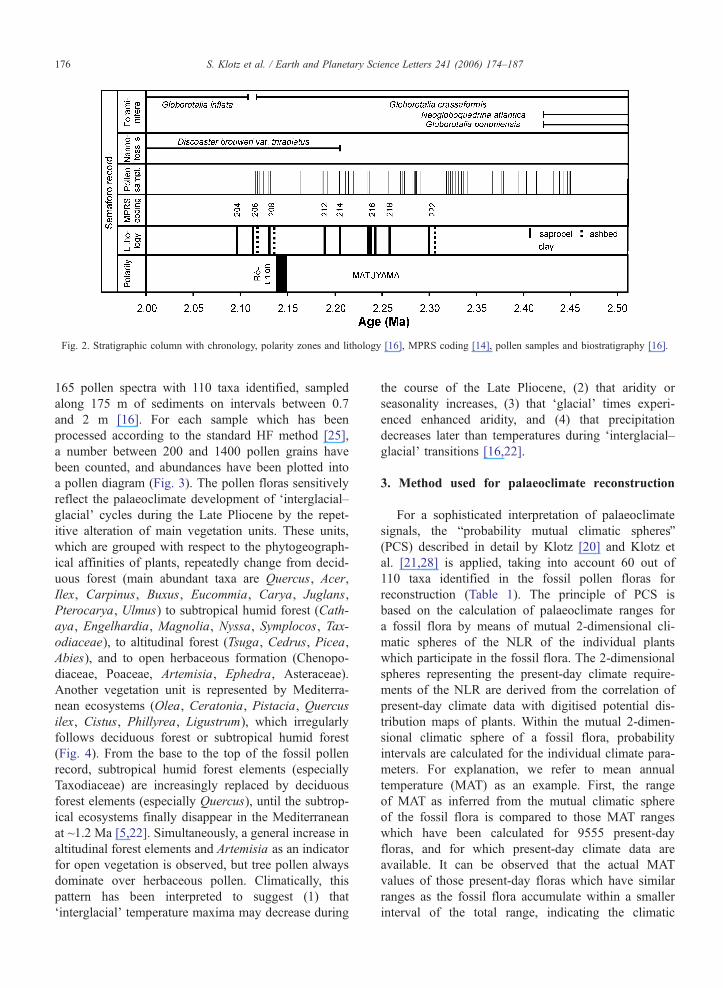
Fig. 2. Stratigraphic column with chronology, polarity zones and lithology [16], MPRS coding [14], pollen samples and biostratigraphy [16].
S. Klotz et al. / Earth and Planetary Science Letters 241 (2006) 174–187176
165 pollen spectra with 110 taxa identified, sampled
along 175 m of sediments on intervals between 0.7
and 2 m [16]. For each sample which has been
processed according to the standard HF method [25],
a number between 200 and 1400 pollen grains have
been counted, and abundances have been plotted into
a pollen diagram (Fig. 3). The pollen floras sensitively
reflect the palaeoclimate development of dinterglacial–glacialT cycles during the Late Pliocene by the repet-
itive alteration of main vegetation units. These units,
which are grouped with respect to the phytogeograph-
ical affinities of plants, repeatedly change from decid-
uous forest (main abundant taxa are Quercus, Acer,
Ilex, Carpinus, Buxus, Eucommia, Carya, Juglans,
Pterocarya, Ulmus) to subtropical humid forest (Cath-
aya, Engelhardia, Magnolia, Nyssa, Symplocos, Tax-
odiaceae), to altitudinal forest (Tsuga, Cedrus, Picea,
Abies), and to open herbaceous formation (Chenopo-
diaceae, Poaceae, Artemisia, Ephedra, Asteraceae).
Another vegetation unit is represented by Mediterra-
nean ecosystems (Olea, Ceratonia, Pistacia, Quercus
ilex, Cistus, Phillyrea, Ligustrum), which irregularly
follows deciduous forest or subtropical humid forest
(Fig. 4). From the base to the top of the fossil pollen
record, subtropical humid forest elements (especially
Taxodiaceae) are increasingly replaced by deciduous
forest elements (especially Quercus), until the subtrop-
ical ecosystems finally disappear in the Mediterranean
at ~1.2 Ma [5,22]. Simultaneously, a general increase in
altitudinal forest elements and Artemisia as an indicator
for open vegetation is observed, but tree pollen always
dominate over herbaceous pollen. Climatically, this
pattern has been interpreted to suggest (1) that
dinterglacialT temperature maxima may decrease during
the course of the Late Pliocene, (2) that aridity or
seasonality increases, (3) that dglacialT times experi-
enced enhanced aridity, and (4) that precipitation
decreases later than temperatures during dinterglacial–glacialT transitions [16,22].
3. Method used for palaeoclimate reconstruction
For a sophisticated interpretation of palaeoclimate
signals, the bprobability mutual climatic spheresQ(PCS) described in detail by Klotz [20] and Klotz et
al. [21,28] is applied, taking into account 60 out of
110 taxa identified in the fossil pollen floras for
reconstruction (Table 1). The principle of PCS is
based on the calculation of palaeoclimate ranges for
a fossil flora by means of mutual 2-dimensional cli-
matic spheres of the NLR of the individual plants
which participate in the fossil flora. The 2-dimensional
spheres representing the present-day climate require-
ments of the NLR are derived from the correlation of
present-day climate data with digitised potential dis-
tribution maps of plants. Within the mutual 2-dimen-
sional climatic sphere of a fossil flora, probability
intervals are calculated for the individual climate para-
meters. For explanation, we refer to mean annual
temperature (MAT) as an example. First, the range
of MAT as inferred from the mutual climatic sphere
of the fossil flora is compared to those MAT ranges
which have been calculated for 9555 present-day
floras, and for which present-day climate data are
available. It can be observed that the actual MAT
values of those present-day floras which have similar
ranges as the fossil flora accumulate within a smaller
interval of the total range, indicating the climatic
Fig. 3. Pollen diagram of the Semaforo record according to Combourieu-Nebout [22] with thickness, lithology [16] (same caption as in Fig. 2) and
MPRS coding [14]. Percentages of Pinus are calculated on the total pollen and spores sum, percentages of other taxa and AP, NAP are based on the
total sum excluding Pinus.
S. Klotz et al. / Earth and Planetary Science Letters 241 (2006) 174–187 177
preference of the floras. The interval of preference is
then interpreted as the probability interval of MAT.
For representation of the reconstructions, we use the
centres of the probability intervals. The quality of PCS
has been tested on the base of a multitude of present-
day floras [20,21], yielding information on the large
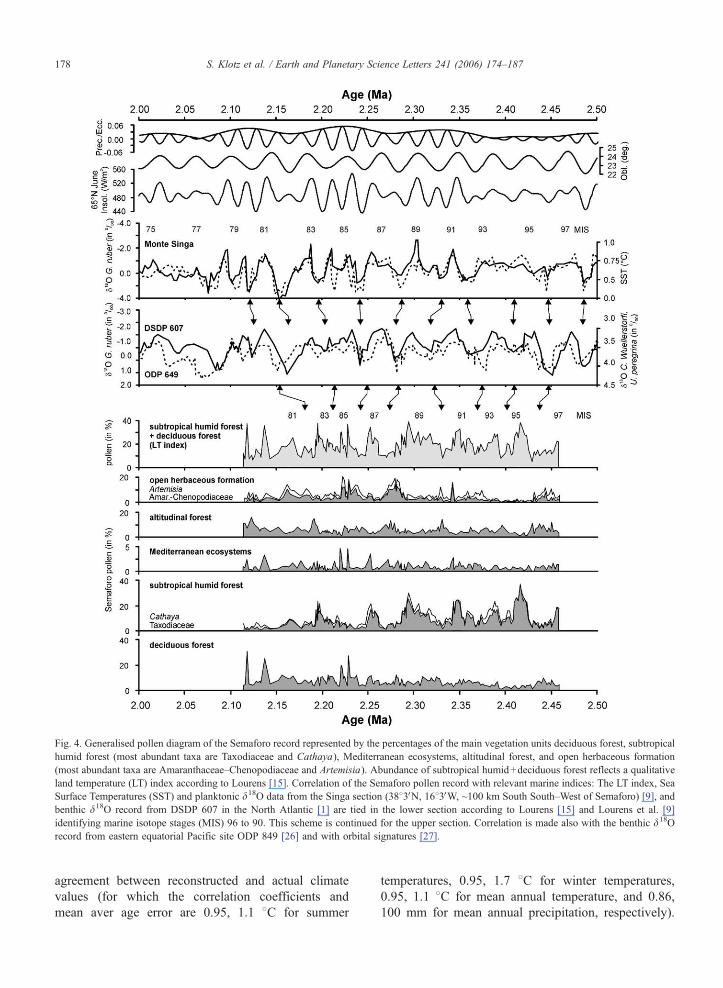
Fig. 4. Generalised pollen diagram of the Semaforo record represented by the percentages of the main vegetation units deciduous forest, subtropical
humid forest (most abundant taxa are Taxodiaceae and Cathaya), Mediterranean ecosystems, altitudinal forest, and open herbaceous formation
(most abundant taxa are Amaranthaceae–Chenopodiaceae and Artemisia). Abundance of subtropical humid+deciduous forest reflects a qualitative
land temperature (LT) index according to Lourens [15]. Correlation of the Semaforo pollen record with relevant marine indices: The LT index, Sea
Surface Temperatures (SST) and planktonic d18O data from the Singa section (3883VN, 1683VW, ~100 km South South–West of Semaforo) [9], and
benthic d18O record from DSDP 607 in the North Atlantic [1] are tied in the lower section according to Lourens [15] and Lourens et al. [9]
identifying marine isotope stages (MIS) 96 to 90. This scheme is continued for the upper section. Correlation is made also with the benthic d18O
record from eastern equatorial Pacific site ODP 849 [26] and with orbital signatures [27].
S. Klotz et al. / Earth and Planetary Science Letters 241 (2006) 174–187178
agreement between reconstructed and actual climate
values (for which the correlation coefficients and
mean aver age error are 0.95, 1.1 8C for summer
temperatures, 0.95, 1.7 8C for winter temperatures,
0.95, 1.1 8C for mean annual temperature, and 0.86,
100 mm for mean annual precipitation, respectively).
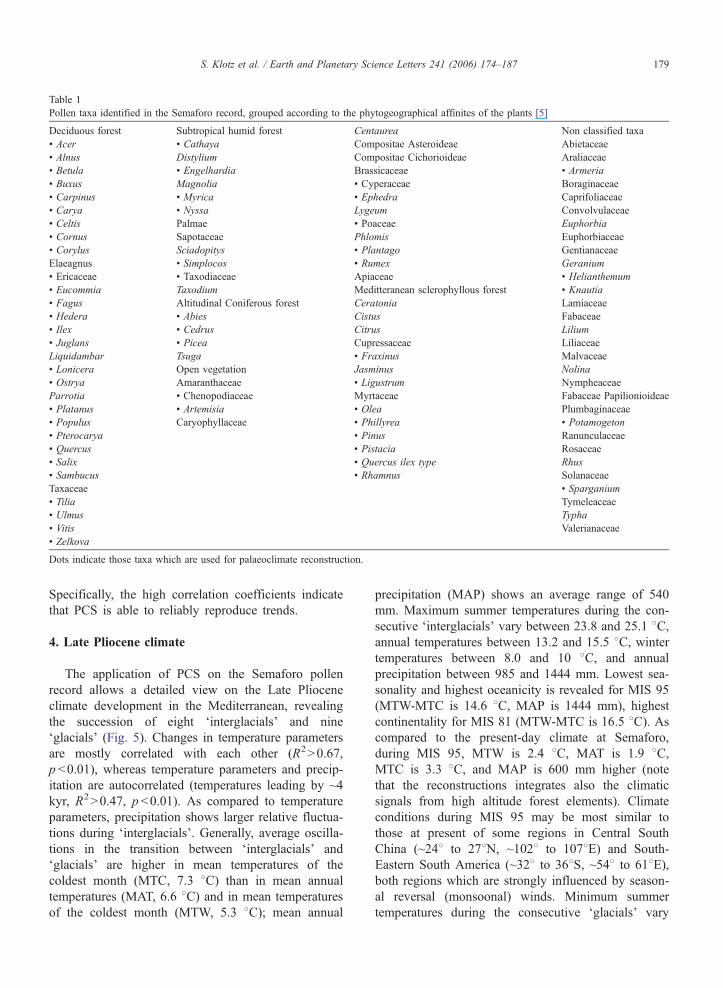
Table 1
Pollen taxa identified in the Semaforo record, grouped according to the phytogeographical affinites of the plants [5]
Deciduous forest Subtropical humid forest Centaurea Non classified taxa
! Acer ! Cathaya Compositae Asteroideae Abietaceae
! Alnus Distylium Compositae Cichorioideae Araliaceae
! Betula ! Engelhardia Brassicaceae ! Armeria! Buxus Magnolia ! Cyperaceae Boraginaceae
! Carpinus ! Myrica ! Ephedra Caprifoliaceae
! Carya ! Nyssa Lygeum Convolvulaceae
! Celtis Palmae ! Poaceae Euphorbia
! Cornus Sapotaceae Phlomis Euphorbiaceae
! Corylus Sciadopitys ! Plantago Gentianaceae
Elaeagnus ! Simplocos ! Rumex Geranium
! Ericaceae ! Taxodiaceae Apiaceae ! Helianthemum! Eucommia Taxodium Meditteranean sclerophyllous forest ! Knautia! Fagus Altitudinal Coniferous forest Ceratonia Lamiaceae
! Hedera ! Abies Cistus Fabaceae
! Ilex ! Cedrus Citrus Lilium
! Juglans ! Picea Cupressaceae Liliaceae
Liquidambar Tsuga ! Fraxinus Malvaceae
! Lonicera Open vegetation Jasminus Nolina
! Ostrya Amaranthaceae ! Ligustrum Nympheaceae
Parrotia ! Chenopodiaceae Myrtaceae Fabaceae Papilionioideae
! Platanus ! Artemisia ! Olea Plumbaginaceae
! Populus Caryophyllaceae ! Phillyrea ! Potamogeton! Pterocarya ! Pinus Ranunculaceae
! Quercus ! Pistacia Rosaceae
! Salix ! Quercus ilex type Rhus
! Sambucus ! Rhamnus Solanaceae
Taxaceae ! Sparganium! Tilia Tymeleaceae
! Ulmus Typha
! Vitis Valerianaceae
! Zelkova
Dots indicate those taxa which are used for palaeoclimate reconstruction.
S. Klotz et al. / Earth and Planetary Science Letters 241 (2006) 174–187 179
Specifically, the high correlation coefficients indicate
that PCS is able to reliably reproduce trends.
4. Late Pliocene climate
The application of PCS on the Semaforo pollen
record allows a detailed view on the Late Pliocene
climate development in the Mediterranean, revealing
the succession of eight dinterglacialsT and nine
dglacialsT (Fig. 5). Changes in temperature parameters
are mostly correlated with each other (R2N0.67,
p b0.01), whereas temperature parameters and precip-
itation are autocorrelated (temperatures leading by ~4
kyr, R2N0.47, p b0.01). As compared to temperature
parameters, precipitation shows larger relative fluctua-
tions during dinterglacialsT. Generally, average oscilla-
tions in the transition between dinterglacialsT and
dglacialsT are higher in mean temperatures of the
coldest month (MTC, 7.3 8C) than in mean annual
temperatures (MAT, 6.6 8C) and in mean temperatures
of the coldest month (MTW, 5.3 8C); mean annual
precipitation (MAP) shows an average range of 540
mm. Maximum summer temperatures during the con-
secutive dinterglacialsT vary between 23.8 and 25.1 8C,annual temperatures between 13.2 and 15.5 8C, wintertemperatures between 8.0 and 10 8C, and annual
precipitation between 985 and 1444 mm. Lowest sea-
sonality and highest oceanicity is revealed for MIS 95
(MTW-MTC is 14.6 8C, MAP is 1444 mm), highest
continentality for MIS 81 (MTW-MTC is 16.5 8C). Ascompared to the present-day climate at Semaforo,
during MIS 95, MTW is 2.4 8C, MAT is 1.9 8C,MTC is 3.3 8C, and MAP is 600 mm higher (note
that the reconstructions integrates also the climatic
signals from high altitude forest elements). Climate
conditions during MIS 95 may be most similar to
those at present of some regions in Central South
China (~248 to 278N, ~1028 to 1078E) and South-
Eastern South America (~328 to 368S, ~548 to 618E),both regions which are strongly influenced by season-
al reversal (monsoonal) winds. Minimum summer
temperatures during the consecutive dglacialsT vary
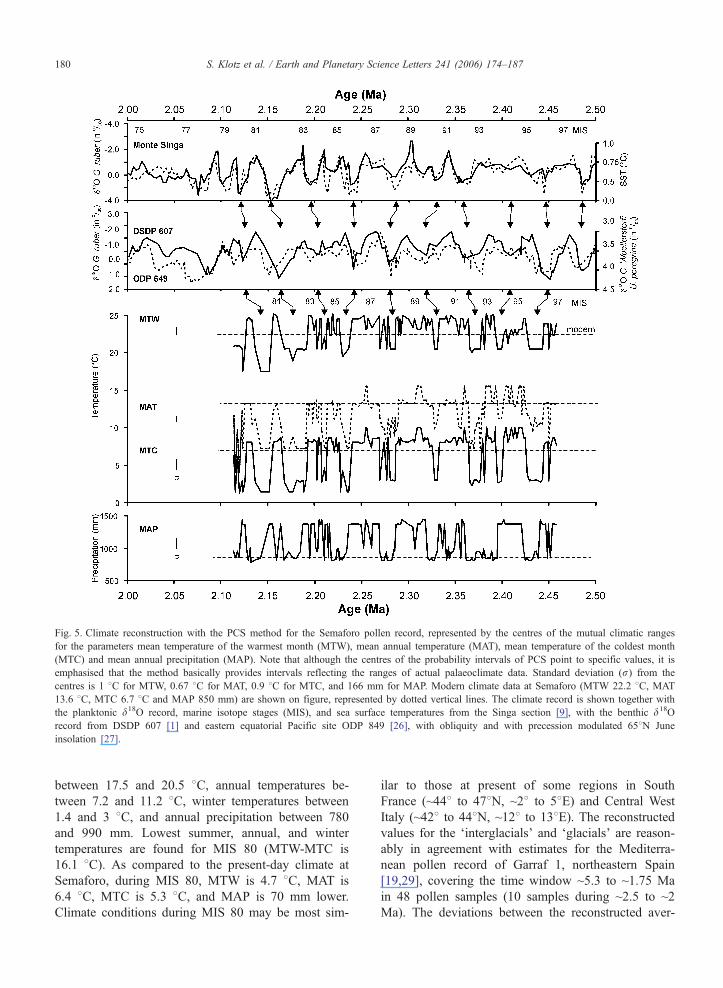
Fig. 5. Climate reconstruction with the PCS method for the Semaforo pollen record, represented by the centres of the mutual climatic ranges
for the parameters mean temperature of the warmest month (MTW), mean annual temperature (MAT), mean temperature of the coldest month
(MTC) and mean annual precipitation (MAP). Note that although the centres of the probability intervals of PCS point to specific values, it is
emphasised that the method basically provides intervals reflecting the ranges of actual palaeoclimate data. Standard deviation (r) from the
centres is 1 8C for MTW, 0.67 8C for MAT, 0.9 8C for MTC, and 166 mm for MAP. Modern climate data at Semaforo (MTW 22.2 8C, MAT
13.6 8C, MTC 6.7 8C and MAP 850 mm) are shown on figure, represented by dotted vertical lines. The climate record is shown together with
the planktonic d18O record, marine isotope stages (MIS), and sea surface temperatures from the Singa section [9], with the benthic d18O
record from DSDP 607 [1] and eastern equatorial Pacific site ODP 849 [26], with obliquity and with precession modulated 658N June
insolation [27].
S. Klotz et al. / Earth and Planetary Science Letters 241 (2006) 174–187180
between 17.5 and 20.5 8C, annual temperatures be-
tween 7.2 and 11.2 8C, winter temperatures between
1.4 and 3 8C, and annual precipitation between 780
and 990 mm. Lowest summer, annual, and winter
temperatures are found for MIS 80 (MTW-MTC is
16.1 8C). As compared to the present-day climate at
Semaforo, during MIS 80, MTW is 4.7 8C, MAT is
6.4 8C, MTC is 5.3 8C, and MAP is 70 mm lower.
Climate conditions during MIS 80 may be most sim-
ilar to those at present of some regions in South
France (~448 to 478N, ~28 to 58E) and Central West
Italy (~428 to 448N, ~128 to 138E). The reconstructed
values for the dinterglacialsT and dglacialsT are reason-
ably in agreement with estimates for the Mediterra-
nean pollen record of Garraf 1, northeastern Spain
[19,29], covering the time window ~5.3 to ~1.75 Ma
in 48 pollen samples (10 samples during ~2.5 to ~2
Ma). The deviations between the reconstructed aver-
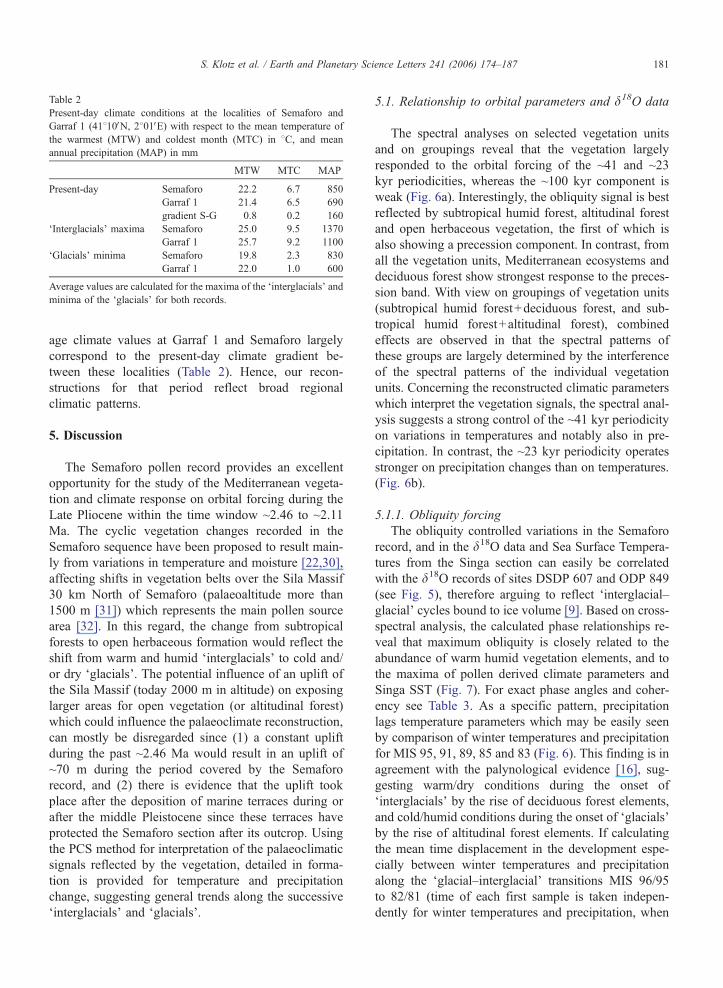
Table 2
Present-day climate conditions at the localities of Semaforo and
Garraf 1 (41810VN, 2801VE) with respect to the mean temperature of
the warmest (MTW) and coldest month (MTC) in 8C, and mean
annual precipitation (MAP) in mm
MTW MTC MAP
Present-day Semaforo 22.2 6.7 850
Garraf 1 21.4 6.5 690
gradient S-G �0.8 �0.2 �160
dInterglacialsT maxima Semaforo 25.0 9.5 1370
Garraf 1 25.7 9.2 1100
dGlacialsT minima Semaforo 19.8 2.3 830
Garraf 1 22.0 1.0 600
Average values are calculated for the maxima of the dinterglacialsT andminima of the dglacialsT for both records.
S. Klotz et al. / Earth and Planetary Science Letters 241 (2006) 174–187 181
age climate values at Garraf 1 and Semaforo largely
correspond to the present-day climate gradient be-
tween these localities (Table 2). Hence, our recon-
structions for that period reflect broad regional
climatic patterns.
5. Discussion
The Semaforo pollen record provides an excellent
opportunity for the study of the Mediterranean vegeta-
tion and climate response on orbital forcing during the
Late Pliocene within the time window ~2.46 to ~2.11
Ma. The cyclic vegetation changes recorded in the
Semaforo sequence have been proposed to result main-
ly from variations in temperature and moisture [22,30],
affecting shifts in vegetation belts over the Sila Massif
30 km North of Semaforo (palaeoaltitude more than
1500 m [31]) which represents the main pollen source
area [32]. In this regard, the change from subtropical
forests to open herbaceous formation would reflect the
shift from warm and humid dinterglacialsT to cold and/
or dry dglacialsT. The potential influence of an uplift of
the Sila Massif (today 2000 m in altitude) on exposing
larger areas for open vegetation (or altitudinal forest)
which could influence the palaeoclimate reconstruction,
can mostly be disregarded since (1) a constant uplift
during the past ~2.46 Ma would result in an uplift of
~70 m during the period covered by the Semaforo
record, and (2) there is evidence that the uplift took
place after the deposition of marine terraces during or
after the middle Pleistocene since these terraces have
protected the Semaforo section after its outcrop. Using
the PCS method for interpretation of the palaeoclimatic
signals reflected by the vegetation, detailed in forma-
tion is provided for temperature and precipitation
change, suggesting general trends along the successive
dinterglacialsT and dglacialsT.
5.1. Relationship to orbital parameters and d18O data
The spectral analyses on selected vegetation units
and on groupings reveal that the vegetation largely
responded to the orbital forcing of the ~41 and ~23
kyr periodicities, whereas the ~100 kyr component is
weak (Fig. 6a). Interestingly, the obliquity signal is best
reflected by subtropical humid forest, altitudinal forest
and open herbaceous vegetation, the first of which is
also showing a precession component. In contrast, from
all the vegetation units, Mediterranean ecosystems and
deciduous forest show strongest response to the preces-
sion band. With view on groupings of vegetation units
(subtropical humid forest+deciduous forest, and sub-
tropical humid forest+altitudinal forest), combined
effects are observed in that the spectral patterns of
these groups are largely determined by the interference
of the spectral patterns of the individual vegetation
units. Concerning the reconstructed climatic parameters
which interpret the vegetation signals, the spectral anal-
ysis suggests a strong control of the ~41 kyr periodicity
on variations in temperatures and notably also in pre-
cipitation. In contrast, the ~23 kyr periodicity operates
stronger on precipitation changes than on temperatures.
(Fig. 6b).
5.1.1. Obliquity forcing
The obliquity controlled variations in the Semaforo
record, and in the d18O data and Sea Surface Tempera-
tures from the Singa section can easily be correlated
with the d18O records of sites DSDP 607 and ODP 849
(see Fig. 5), therefore arguing to reflect dinterglacial–glacialT cycles bound to ice volume [9]. Based on cross-
spectral analysis, the calculated phase relationships re-
veal that maximum obliquity is closely related to the
abundance of warm humid vegetation elements, and to
the maxima of pollen derived climate parameters and
Singa SST (Fig. 7). For exact phase angles and coher-
ency see Table 3. As a specific pattern, precipitation
lags temperature parameters which may be easily seen
by comparison of winter temperatures and precipitation
for MIS 95, 91, 89, 85 and 83 (Fig. 6). This finding is in
agreement with the palynological evidence [16], sug-
gesting warm/dry conditions during the onset of
dinterglacialsT by the rise of deciduous forest elements,
and cold/humid conditions during the onset of dglacialsTby the rise of altitudinal forest elements. If calculating
the mean time displacement in the development espe-
cially between winter temperatures and precipitation
along the dglacial–interglacialT transitions MIS 96/95
to 82/81 (time of each first sample is taken indepen-
dently for winter temperatures and precipitation, when
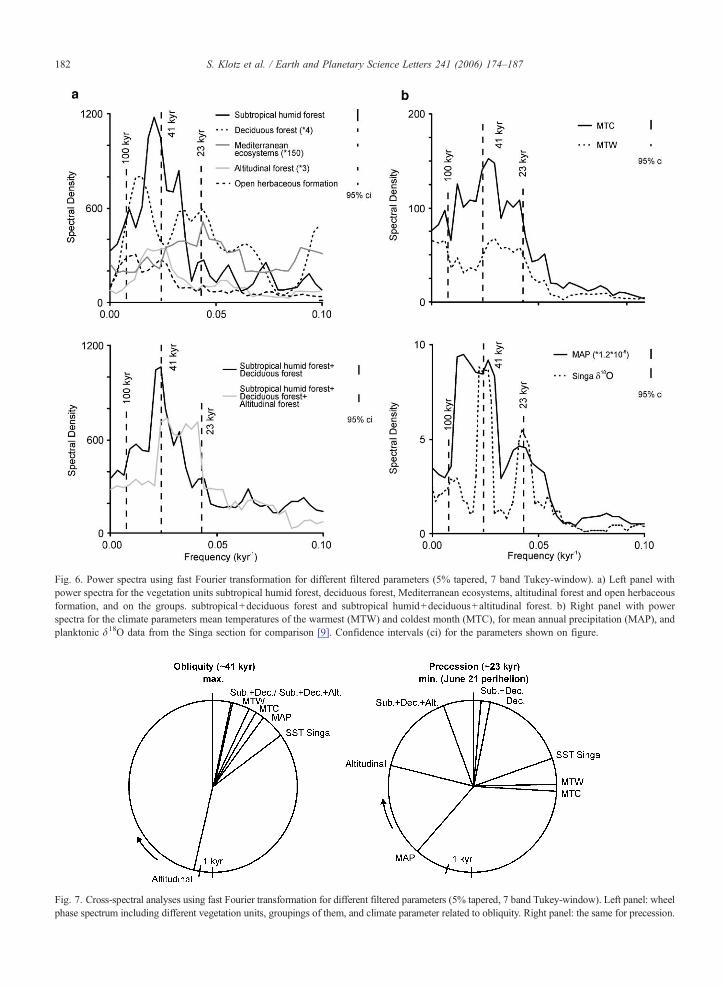
Fig. 6. Power spectra using fast Fourier transformation for different filtered parameters (5% tapered, 7 band Tukey-window). a) Left panel with
power spectra for the vegetation units subtropical humid forest, deciduous forest, Mediterranean ecosystems, altitudinal forest and open herbaceous
formation, and on the groups. subtropical+deciduous forest and subtropical humid+deciduous+altitudinal forest. b) Right panel with power
spectra for the climate parameters mean temperatures of the warmest (MTW) and coldest month (MTC), for mean annual precipitation (MAP), and
planktonic d18O data from the Singa section for comparison [9]. Confidence intervals (ci) for the parameters shown on figure.
Fig. 7. Cross-spectral analyses using fast Fourier transformation for different filtered parameters (5% tapered, 7 band Tukey-window). Left panel: wheel
phase spectrum including different vegetation units, groupings of them, and climate parameter related to obliquity. Right panel: the same for precession.
S. Klotz et al. / Earth and Planetary Science Letters 241 (2006) 174–187182
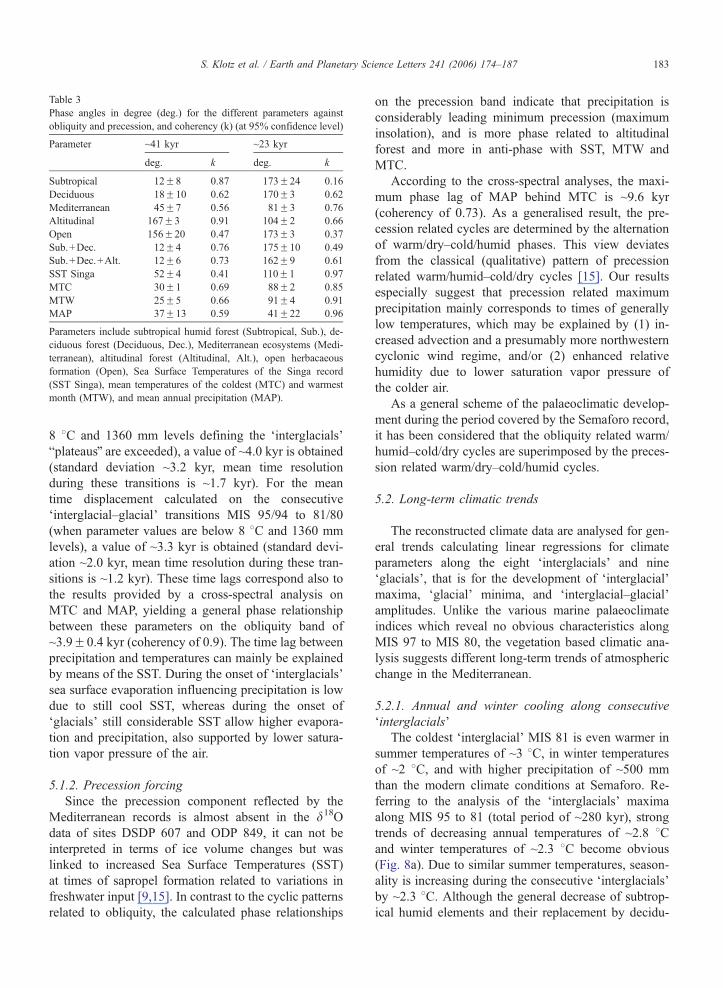
Table 3
Phase angles in degree (deg.) for the different parameters against
obliquity and precession, and coherency (k) (at 95% confidence level)
Parameter ~41 kyr ~23 kyr
deg. k deg. k
Subtropical �12F8 0.87 173F24 0.16
Deciduous �18F10 0.62 170F3 0.62
Mediterranean �45F7 0.56 81F3 0.76
Altitudinal 167F3 0.91 �104F2 0.66
Open 156F20 0.47 �173F3 0.37
Sub.+Dec. �12F4 0.76 175F10 0.49
Sub.+Dec.+Alt. �12F6 0.73 �162F9 0.61
SST Singa �52F4 0.41 110F1 0.97
MTC �30F1 0.69 88F2 0.85
MTW �25F5 0.66 91F4 0.91
MAP �37F13 0.59 �41F22 0.96
Parameters include subtropical humid forest (Subtropical, Sub.), de-
ciduous forest (Deciduous, Dec.), Mediterranean ecosystems (Medi-
terranean), altitudinal forest (Altitudinal, Alt.), open herbacaeous
formation (Open), Sea Surface Temperatures of the Singa record
(SST Singa), mean temperatures of the coldest (MTC) and warmest
month (MTW), and mean annual precipitation (MAP).
S. Klotz et al. / Earth and Planetary Science Letters 241 (2006) 174–187 183
8 8C and 1360 mm levels defining the dinterglacialsTbplateausQ are exceeded), a value of ~4.0 kyr is obtained(standard deviation ~3.2 kyr, mean time resolution
during these transitions is ~1.7 kyr). For the mean
time displacement calculated on the consecutive
dinterglacial–glacialT transitions MIS 95/94 to 81/80
(when parameter values are below 8 8C and 1360 mm
levels), a value of ~3.3 kyr is obtained (standard devi-
ation ~2.0 kyr, mean time resolution during these tran-
sitions is ~1.2 kyr). These time lags correspond also to
the results provided by a cross-spectral analysis on
MTC and MAP, yielding a general phase relationship
between these parameters on the obliquity band of
~3.9F0.4 kyr (coherency of 0.9). The time lag between
precipitation and temperatures can mainly be explained
by means of the SST. During the onset of dinterglacialsTsea surface evaporation influencing precipitation is low
due to still cool SST, whereas during the onset of
dglacialsT still considerable SST allow higher evapora-
tion and precipitation, also supported by lower satura-
tion vapor pressure of the air.
5.1.2. Precession forcing
Since the precession component reflected by the
Mediterranean records is almost absent in the d18Odata of sites DSDP 607 and ODP 849, it can not be
interpreted in terms of ice volume changes but was
linked to increased Sea Surface Temperatures (SST)
at times of sapropel formation related to variations in
freshwater input [9,15]. In contrast to the cyclic patterns
related to obliquity, the calculated phase relationships
on the precession band indicate that precipitation is
considerably leading minimum precession (maximum
insolation), and is more phase related to altitudinal
forest and more in anti-phase with SST, MTW and
MTC.
According to the cross-spectral analyses, the maxi-
mum phase lag of MAP behind MTC is ~9.6 kyr
(coherency of 0.73). As a generalised result, the pre-
cession related cycles are determined by the alternation
of warm/dry–cold/humid phases. This view deviates
from the classical (qualitative) pattern of precession
related warm/humid–cold/dry cycles [15]. Our results
especially suggest that precession related maximum
precipitation mainly corresponds to times of generally
low temperatures, which may be explained by (1) in-
creased advection and a presumably more northwestern
cyclonic wind regime, and/or (2) enhanced relative
humidity due to lower saturation vapor pressure of
the colder air.
As a general scheme of the palaeoclimatic develop-
ment during the period covered by the Semaforo record,
it has been considered that the obliquity related warm/
humid–cold/dry cycles are superimposed by the preces-
sion related warm/dry–cold/humid cycles.
5.2. Long-term climatic trends
The reconstructed climate data are analysed for gen-
eral trends calculating linear regressions for climate
parameters along the eight dinterglacialsT and nine
dglacialsT, that is for the development of dinterglacialTmaxima, dglacialT minima, and dinterglacial–glacialTamplitudes. Unlike the various marine palaeoclimate
indices which reveal no obvious characteristics along
MIS 97 to MIS 80, the vegetation based climatic ana-
lysis suggests different long-term trends of atmospheric
change in the Mediterranean.
5.2.1. Annual and winter cooling along consecutive
dinterglacialsTThe coldest dinterglacialT MIS 81 is even warmer in
summer temperatures of ~3 8C, in winter temperatures
of ~2 8C, and with higher precipitation of ~500 mm
than the modern climate conditions at Semaforo. Re-
ferring to the analysis of the dinterglacialsT maxima
along MIS 95 to 81 (total period of ~280 kyr), strong
trends of decreasing annual temperatures of ~2.8 8Cand winter temperatures of ~2.3 8C become obvious
(Fig. 8a). Due to similar summer temperatures, season-
ality is increasing during the consecutive dinterglacialsTby ~2.3 8C. Although the general decrease of subtrop-
ical humid elements and their replacement by decidu-
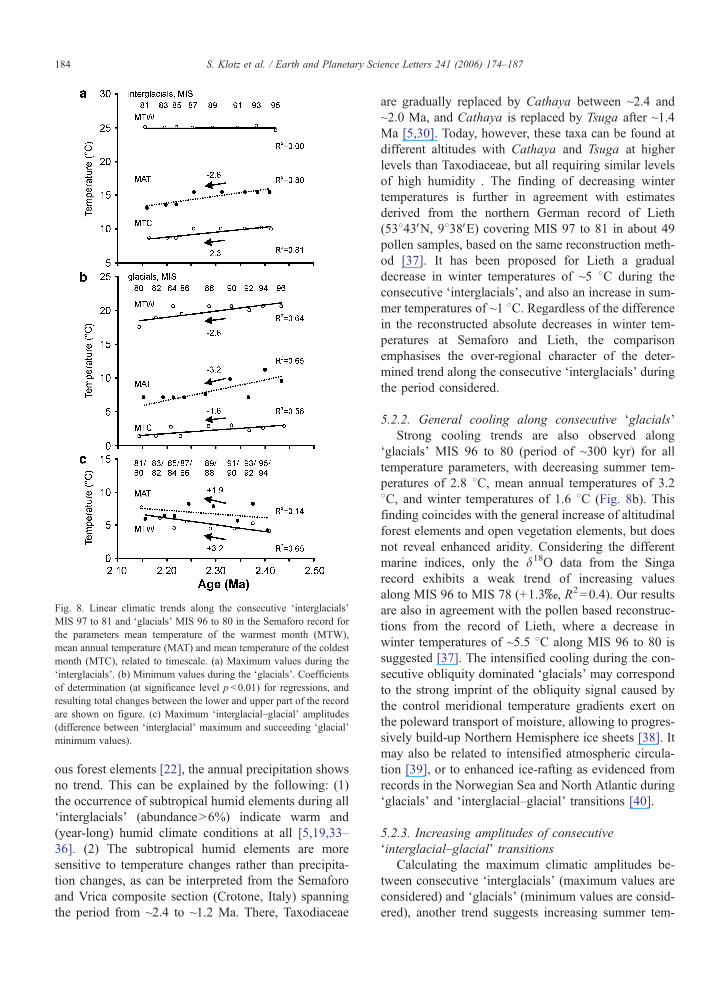
Fig. 8. Linear climatic trends along the consecutive dinterglacialsTMIS 97 to 81 and dglacialsT MIS 96 to 80 in the Semaforo record for
the parameters mean temperature of the warmest month (MTW),
mean annual temperature (MAT) and mean temperature of the coldest
month (MTC), related to timescale. (a) Maximum values during the
dinterglacialsT. (b) Minimum values during the dglacialsT. Coefficientsof determination (at significance level p b0.01) for regressions, and
resulting total changes between the lower and upper part of the record
are shown on figure. (c) Maximum dinterglacial–glacialT amplitudes
(difference between dinterglacialT maximum and succeeding dglacialTminimum values).
S. Klotz et al. / Earth and Planetary Science Letters 241 (2006) 174–187184
ous forest elements [22], the annual precipitation shows
no trend. This can be explained by the following: (1)
the occurrence of subtropical humid elements during all
dinterglacialsT (abundanceN6%) indicate warm and
(year-long) humid climate conditions at all [5,19,33–
36]. (2) The subtropical humid elements are more
sensitive to temperature changes rather than precipita-
tion changes, as can be interpreted from the Semaforo
and Vrica composite section (Crotone, Italy) spanning
the period from ~2.4 to ~1.2 Ma. There, Taxodiaceae
are gradually replaced by Cathaya between ~2.4 and
~2.0 Ma, and Cathaya is replaced by Tsuga after ~1.4
Ma [5,30]. Today, however, these taxa can be found at
different altitudes with Cathaya and Tsuga at higher
levels than Taxodiaceae, but all requiring similar levels
of high humidity . The finding of decreasing winter
temperatures is further in agreement with estimates
derived from the northern German record of Lieth
(53843VN, 9838VE) covering MIS 97 to 81 in about 49
pollen samples, based on the same reconstruction meth-
od [37]. It has been proposed for Lieth a gradual
decrease in winter temperatures of ~5 8C during the
consecutive dinterglacialsT, and also an increase in sum-
mer temperatures of ~1 8C. Regardless of the differencein the reconstructed absolute decreases in winter tem-
peratures at Semaforo and Lieth, the comparison
emphasises the over-regional character of the deter-
mined trend along the consecutive dinterglacialsT duringthe period considered.
5.2.2. General cooling along consecutive dglacialsTStrong cooling trends are also observed along
dglacialsT MIS 96 to 80 (period of ~300 kyr) for all
temperature parameters, with decreasing summer tem-
peratures of 2.8 8C, mean annual temperatures of 3.2
8C, and winter temperatures of 1.6 8C (Fig. 8b). This
finding coincides with the general increase of altitudinal
forest elements and open vegetation elements, but does
not reveal enhanced aridity. Considering the different
marine indices, only the d18O data from the Singa
record exhibits a weak trend of increasing values
along MIS 96 to MIS 78 (+1.3x, R2=0.4). Our results
are also in agreement with the pollen based reconstruc-
tions from the record of Lieth, where a decrease in
winter temperatures of ~5.5 8C along MIS 96 to 80 is
suggested [37]. The intensified cooling during the con-
secutive obliquity dominated dglacialsT may correspond
to the strong imprint of the obliquity signal caused by
the control meridional temperature gradients exert on
the poleward transport of moisture, allowing to progres-
sively build-up Northern Hemisphere ice sheets [38]. It
may also be related to intensified atmospheric circula-
tion [39], or to enhanced ice-rafting as evidenced from
records in the Norwegian Sea and North Atlantic during
dglacialsT and dinterglacial–glacialT transitions [40].
5.2.3. Increasing amplitudes of consecutive
dinterglacial–glacialT transitionsCalculating the maximum climatic amplitudes be-
tween consecutive dinterglacialsT (maximum values are
considered) and dglacialsT (minimum values are consid-
ered), another trend suggests increasing summer tem-
S. Klotz et al. / Earth and Planetary Science Letters 241 (2006) 174–187 185
perature amplitudes of ~3.2 8C and mean annual tem-
peratures of ~1.9 8C along MIS 96/95 to 81/80 (Fig.
8c). For comparison, the analysis on the d18O data from
the Singa record reveals a trend suggesting higher
amplitudes along MIS 97/96 to MIS 79/78 (+2.4x,
R2=0.6), which is not obvious from the d18O record at
DSDP 607 in the North Atlantic. It is especially sug-
gested that changes in global ice volume associated
with reductions in the Mediterranean surface-water sa-
linity (resulting from changes in the rates of evapora-
tion/precipitation and from fluvial runoff), led to higher
dinterglacial–glacialT amplitudes in the region [41,42].
As compared to the amplitude of winter temperature
change of more than 18 8C during the last dinterglacial–glacialT transition (Eemian–Weichselian) as recon-
structed from the pollen record of Lago Grande di
Monticchio/Southern Italy [43], the Late Pliocene tran-
sitions show less than half in amplitude.
6. Conclusions
The quantitative climate analysis of the Mediterra-
nean pollen record of Semaforo/Southern Italy provides
new and detailed information on the climate develop-
ment along eight Late Pliocene dinterglacialsT and nine
dglacialsT during the time window 2.46–2.11Ma. Mainly
forced by the obliquity and the precession signal modu-
lating 658N June insolation, the analysis of climate
development reveals specific characteristics of change.
(1) Summer, mean annual and winter temperatures,
as well as precipitation are considerably higher
during the Late Pliocene subtropical humid
dinterglacialsT as compared to present-day climate
conditions in the study area. Temperatures during
dglacialT periods are lower, but precipitation is
similar than at present.
(2) Relying on the timescale of the Semaforo record,
the spectral analyses on vegetation units and on
reconstructed climate parameters reveals the con-
siderable imprint of the ~41 kyr obliquity and ~23
kyr precession periodicity. Generalised, it is
evidenced the alternation of warm/humid–cold/
dry dinterglacial–glacialT cycles on the obliquity
band, which are superimposed by warm/dry–cold/
humid cycles on the precession band. Whereas the
obliquity bound climatic cycles in the Mediterra-
nean largely follows the global change in ice vol-
ume, the precession related cycles may be best
explained by the influence of warm/dry southern
anticyclonic wind circulation alternating with a
cold/humid northwestern cyclonic wind regime.
(3) A time lag of ~4 kyr is observed in the development
of temperatures and precipitation during the obliq-
uity controlled dglacial–interglacialT cycles, and of~9.6 kyr inmaximum during the precession related
cycles, with precipitation lagging temperature
parameters. Transitional phases are thus charac-
terised by warm/dry or cold/humid conditions.
(4) Along the consecutive dinterglacialsT no precipi-
tation trend change is yielded according to the
abundance of taxa requiring a high amount of
year-long humidity.
(5) A strong trend in the climate development of over-
regional scale along the consecutive Late Pliocene
dinterglacialsT is indicated by the reduction in min-
imum mean annual and winter temperatures, and
by the intensification of seasonality.
(6) A further trend in the climate development
along the consecutive dglacialsT is indicated by
reduced minimum summer, mean annual, and
winter temperatures.
(7) Considering maximum temperature shifts along
the consecutive dinterglacial–glacialT transitions,
the amplitudes are increasing for summer and
mean annual temperatures. As compared to the
amplitude of winter temperature change during
the last dinterglacial–glacialT (Eemian–Weichse-
lian) transition in South Italy, the Late Pliocene
shifts are less than half in size.
Acknowledgements
S. Klotz and D. Uhl gratefully acknowledge the
financial support by the Alexander von Humboldt-
Foundation, and N. Combourieu-Nebout by CNRS for
processing palynological samples (this is LSCE contri-
bution No. 1804). S. Klotz gratefully acknowledges
also the financial support by the Laboratoire PaleoEn-
vironnements and PaleobioSphere, and the European
Science Foundation. The authors thank Dr. L. Lourens,
Prof. C. Tzedakis and an anonymous reviewer for their
valuable comments on an earlier manuscript which
helped to improve the manuscript.
References
[1] M.E. Raymo, W.F. Ruddiman, J. Backman, B.M. Clement, D.G.
Martinson, Late Pliocene variation in Northern Hemisphere ice
sheets and North Atlantic deep circulation, Palaeoceanography 4
(1989) 413–446.
[2] N.J. Shackleton, New data on the evolution of Pliocene climatic
variability, in: E.S. Vrba, G.H. Denton, T.C. Partridge (Eds.),
Paleoclimate and Evolution, with Emphasis on Human Origins,
Yale Univ. Press, New Haven, 1995, pp. 24–45.

S. Klotz et al. / Earth and Planetary Science Letters 241 (2006) 174–187186
[3] J. Zachos, M. Pagani, L. Sloan, E. Thomas, K. Billups, Trends,
rhythms, and aberrations in global climate 65 Ma to present,
Science 292 (2001) 686–693.
[4] W.H. Zagwijn, Subtropical relicts in the Pliocene flora of Bruns-
sum (The Netherlands), Geol. Mijnb. 69 (1990) 219–225.
[5] N. Combourieu-Nebout, C. Vergnaud Grazzini, Late Pliocene
northern hemisphere glaciation: the continental and marine
responses in the central Mediterranean, Quat. Sci. Rev. 10
(1991) 319–334.
[6] J.P. Suc, Origin and evolution of the Mediterranean vegetation
and climate in Europe, Nature 307 (1984) 429–432.
[7] C. Vergnaud Grazzini, J.F. Sallege, M.J. Urrutiaguer, A. Iannace,
Oxygen and Carbon isotope stratigraphy of ODP hole 653A and
site 654: the Pliocene–Pleistocene glacial history recorded in the
Tyrrhenian Basin (West Mediterranean), Proc. Ocean Drill.
Prog., Sci. Results 107 (1990) 361–385.
[8] R.C. Thunell, D.F. Williams, E. Tappa, D. Rio, I. Raffi, Pliocene–
Pleistocene stable isotope record for ocean drilling program site
653, Tyrrhenian Basin, implications for the paleoenvironmental
history of the Mediterranean Sea, Proc. Ocean Drill. Prog., Sci.
Results 107 (1990) 387–399.
[9] L.J. Lourens, F.J. Hilgen, L. Gudjonsson, W.J. Zachariasse, Late
Pliocene to early Pleistocene astronomically forced sea surface
productivity and temperature variations in the Mediterranean,
Mar. Micropaleontol. 19 (1992) 49–78.
[10] L.J. Lourens, A. Antonarakou, F.J. Hilgen, A.A.M. Van Hoof, C.
Vergnaud-Grazzini, W.J. Zachariasse, Evaluation of the Plio-
Pleistocene astronomical timescale, Paleoceanography 11
(1996) 391–413.
[11] D. Kroon, I. Alexander, M. Little, L.J. Lourens, A. Matthewson,
A.H.F. Robertson, T. Sakamoto, Oxygen isotope and sapropel
stratigraphy in the Eastern Mediterranean during the last 3.2
million years, Proc. Ocean Drill. Prog., Sci. Results 160
(1998) 181–189.
[12] W.H. Zagwijn, Aspects of the Pliocene and early Pleistocene
vegetation in the Netherlands, Meded. - Rijks Geol. Dienst C 3
(1960) 1–78.
[13] J.-P. Suc, A. Bertini, N. Combourieu Nebout, F. Diniz, S. Leroy,
E. Russo-Ermolli, Z. Zheng, E. Bessais, J. Ferrier, Structure of
West Mediterranean vegetation and climate since 5.3 Ma, Acta
Zool. Cracov. 38 (1995) 3–16.
[14] F.J. Hilgen, Astronomical calibration of Gauss to Matuyama
sapropels in the Mediterranean and implications for the geomag-
netic polarity time scale, Earth Planet. Sci. Lett. 104 (1991)
226–244.
[15] L.J. Lourens, Astronomical Forcing of Mediterranean Climate
during the Last 5.3 Million Years, Proefschrift, Universiteit
Utrecht, Utrecht, 1993, 247 pp.
[16] N. Combourieu-Nebout, Vegetation response to upper Pliocene
glacial/interglacial cyclicity in the central Mediterranean, Quat.
Res. 40 (1993) 228–236.
[17] J. Iversen, Viscum, Hedera and Ilex as climate indicators, Geol.
Foren. Stockh. Forh. 66 (1944) 463–483.
[18] K.J. Sinka, T.C. Atkinson, A mutual climatic range method for
reconstructing palaeoclimate from plant remains, J. Geol. Soc.
156 (1999) 381–396.
[19] S. Fauquette, J. Guiot, J.P. Suc, A method for climatic recon-
struction of the Mediterranean Pliocene using pollen data,
Palaeogeogr. Palaeoclimatol. Palaeoecol. 144 (1998) 183–201.
[20] S. Klotz, Neue Methoden der Klimarekonstruktion-angewendet
auf quartare Pollensequenzen der franzosischen Alpen, Tub.
Mikropalaontol. Mitt. 21 (1999) (169 pp.).
[21] S. Klotz, U. Muller, V. Mosbrugger, J.L. de Beaulieu, M. Reille,
Eemian to early Wurmian climate dynamics: history and pattern
of changes in Central Europe, Palaeogeogr. Palaeoclimatol.
Palaeoecol. 211 (2004) 107–126.
[22] N. Combourieu-Nebout, Reponse de la vegetation de l’Italie
meridionale au seuil climatique de la f in du Pliocene d’apres
l’analyse pollinique haute resolution de la section Semaforo
(2,46 a 2,1 Ma), C.R. Acad. Sci. Paris 321 (1995) 659–665.
[23] L.J. Lourens, F.J. Hilgen, N.J. Shackleton, J. Laskar, D. Wilson,
The Neogene period, in: F.M. Gradstein, J.G. Ogg, A.G. Smith
(Eds.), A Geologic Time Scale 2004, Cambridge University
Press, 2004, pp. 409–440.
[24] G. Pasini, M.L. Colalongo, The Pleistocene boundary stratotype
at Vrica, Italy, in: J.A. Van Couvering (Ed.), The Pleistocene
Boundary and the Beginning of the Quaternary, Cambridge
University Press, Cambridge, 1997, pp. 15–45.
[25] K. Faegri, J. Iversen, Textbook of Pollen Analysis, Hafner Press,
New York, 1997, 295 pp..
[26] A.C. Mix, N.G. Pisias, W. Rugh, J. Wilson, A. Morey, T.K.
Hagelberg, Benthic foraminifer stable isotope record from Site
849 (0–5 Ma): local and global climate changes, Proc. Ocean
Drill. Program Sci. Results 138 (1995) 371–412.
[27] J. Laskar, P. Robutel, F. Joutel, M. Gastineau, A. Correia,
B. Levrand, A long-term numerical solution for the insola-
tion quantities of the Earth, Astron. Astrophys. 428 (2004)
261–285.
[28] S. Klotz, J. Guiot, V. Mosbrugger, Continental European Eemian
and early Wurmian climate evolution: comparing signals using
different quantitative reconstruction approaches based on pollen,
Glob. Planet. Change 36 (2003) 277–294.
[29] J.-P. Suc, J. Cravatte, Etude palynologique du Pliocene de
Catalogne (nord-est de l’Espagne), Paleobiol. Cont. 13 (1982)
1–31.
[30] N. Combourieu-Nebout, S. Fauquette, P. Quezel, What was the
late Pliocene Mediterranean climate like: a preliminary quanti-
fication from vegetation, Bull. Soc. Geol. France 171 (2000)
271–277.
[31] W. Landini, E. Menesini, L’ittiofauna plio-pleistocenica della
sezione delle Vrica (Crotone-Calabria), Bull. Soc. Palaeontol.
Ital. 17 (1978) 143–175.
[32] V.F. Rogl, F.F. Steininger, Vom Zerfall der Tethys zu Mediterran
und Paratethys. Die Neogene Palaogeographie und Palinspastik
des zirkummediterranean Raumes, Ann. Naturhist. Mus. Wien
85 (1983) 135–163.
[33] C.W. Wang, The Forests of China with a Survey of Grassland
and Desert Vegetation, Maria Moors Cabot Foundation, Cam-
bridge, Mass., 1961.
[34] L.E. Heusser, W.L. Balsam, Pollen distribution in the northwest
Pacific Ocean, Quat. Res. 7 (1977) 45–62.
[35] J.L. Vankat, The Natural Vegetation of North America: An
Introduction, Wiley, New York, 1979.
[36] S. Fauquette, J.-P. Suc, J. Guiot, F. Diniz, N. Feddi, Z. Zheng, E.
Bessais, A. Drivaliari, Climate and biomes in the West Medi-
terranean area during the Pliocene, Palaeogeogr. Palaeoclimatol.
Palaeoecol. 152 (1999) 15–36.
[37] J. Pross, S. Klotz, Palaeotemperature calculations from the
Praetiglian/Tiglian (Plio-Pleistocene) pollen record of Lieth,
northern Germany: implications for the climatic evolution of
NW Europe, Glob. Planet. Change 34 (2002) 253–267.
[38] M.E. Raymo, K.H. Nisancioglu, The 41 kyr world: Milanko-
vitch’s other unsolved mystery, Paleoceanography 18 (2003),
doi:10.1029/2002PA000791.

S. Klotz et al. / Earth and Planetary Science Letters 241 (2006) 174–187 187
[39] S. Leroy, L. Dupont, Development of vegetation and continental
aridity in northwestern Africa during the Late Pliocene: the
pollen record of ODP Site 658, Palaeogeogr. Palaeoclimatol.
Palaeoecol. 109 (1994) 295–316.
[40] K. McIntyre, M.L. Delaney, A.C. Ravelo, Millenial-scale cli-
mate change and oceanic process in the late Pliocene and early
Pleistocene, Paleoceanography 16 (2001) 535–543.
[41] M.W. Howell, R.C. Thunell, E. Di Stefano, R. Sprovieri, E.J.
Tappa, T. Sakamoto, Stable isotope chronology and paleo-
ceanographic history of Sites 963 and 964, Eastern Mediter-
ranean Sea, Proc. Ocean Drill. Prog., Sci. Results 160 (1998)
167–180.
[42] F.J. Hilgen, L.J. Lourens, A. Berger, M.F. Loutre, Evaluation of
the astronomically calibrated time scale for the late Pliocene and
earliest Pleistocene, Paleoceanography 8 (1993) 549–565.
[43] J.R.M. Allen, W.A. Watts, B. Huntley, Weichselian palynostra-
tigraphy, palaeovegetation and palaeoenvironment, the record
from Lago Grande di Monticchio, Southern Italy, Quat. Int.
73/74 (2000) 91–110.