tropical-cyclone intensification and predictability in three dimensions
TRANSCRIPT

QUARTERLY JOURNAL OF THE ROYAL METEOROLOGICAL SOCIETYQ. J. R. Meteorol. Soc. 134: 1661–1671 (2008)Published online in Wiley InterScience(www.interscience.wiley.com) DOI: 10.1002/qj.327
Tropical-cyclone intensification and predictabilityin a minimal three-dimensional model
Seoleun Shin and Roger K. Smith*Meteorological Institute, University of Munich, Munich, Germany
ABSTRACT: We investigate the amplification and predictability of tropical cyclones in the context of a minimal, three-dimensional numerical model. In the prototype problem for intensification, starting with a tropical storm strength vortex ina quiescent environment on an f -plane, the emergent flow in the inner region of the vortex becomes highly asymmetric anddominated by deep convective vortex structures, even though the problem as posed is essentially axisymmetric. The detailsof the intensification process, including the asymmetric structures that develop, are highly sensitive to small perturbationsin the low-level moisture field at the initial time. This sensitivity is manifest in a significant spread in the intensity ofvortices from an ensemble of calculations in which random moisture perturbations are added in the lowest model level.Similar experiments are carried out on a β-plane and in the case where there is an anticyclonic shear flow at upper levels.The former set shows no significant difference from the f -plane calculations in the evolution of intensity, but the latter setshows a significantly weaker vortex, contrary to a broadly held hypothesis that upper-level outflow channels are favourableto intensification. Copyright c© 2008 Royal Meteorological Society
KEY WORDS hurricane; tropical cyclone; typhoon; predictability; minimal model
Received 4 January 2008; Revised 2 September 2008; Accepted 3 September 2008
1. Introduction
In this paper we revisit the prototype problem for tropical-cyclone intensification, which considers the evolution of aprescribed, initially cloud-free, axisymmetric, baroclinicvortex over a warm ocean on an f -plane. This problemhas been the subject of many numerical studies over theyears and these can be classified into the following types:
• hydrostatic axisymmetric models with cumulusparametrization (e.g. Ooyama, 1969; Emanuel,1989, 1995; Nguyen et al., 2002);
• hydrostatic three-dimensional models with cumulusparametrization (e.g. Kurihara and Tuleya, 1974;Zhu et al., 2001, hereafter ZSU; Zhu and Smith,2002, 2003, hereafter ZS03; Zhu et al., 2004);
• hydrostatic three-dimensional models with explicitmicrophysics (e.g. Wang 2001, 2002a, 2002b);
• non-hydrostatic axisymmetric cloud models (e.g.Willoughby et al., 1984; Rotunno and Emanuel,1987; Persing and Montgomery, 2003);
• non-hydrostatic three-dimensional cloud models(Montgomery et al., 2006);
• non-hydrostatic three-dimensional mesoscale mod-els (Nguyen et al., 2008, hereafter NSM08).
A significant feature of all the three-dimensional cal-culations is the emergence of flow asymmetries, despite
*Correspondence to: Roger K. Smith, Meteorological Institute, Univer-sity of Munich, Theresienstr. 37, 80333 Munich, Germany.E-mail: [email protected]
the symmetry in the formulation, except, of course, inthe representation of a circular flow on a square grid orpossibly the implementation of boundary conditions on adistant square boundary.
The related problem on a β-plane is the prototypeproblem for tropical-cyclone motion and has been a topicof much study also (e.g. Flatau et al., 1994; Wang andHolland, 1996; Dengler and Reeder, 1997; Ritchie andFrank, 2007; NSM08). (There have been many morestudies of this problem in a barotropic context, but ourinterest here is focused on baroclinic models with atleast three vertical levels to represent the effects of deepconvection.) However, in this case, flow asymmetries areexpected to evolve from the lack of symmetry implied byβ. Indeed, it is the wavenumber-one component of theseasymmetries that leads to the well-known north-westwardmotion of the vortex.
The occurrence of asymmetries in f -plane calculationswas the focus of a study by ZS03 in the context of a min-imal three-layer model. At that time, we considered theasymmetries to be spurious and showed that their ampli-tude could be reduced by reformulating finite differencesin the vertical on a Charney–Phillips (CP) grid insteadof on a Lorenz grid as used by ZSU, Zhu and Smith(2002), and many others. The results suggested that theearly development of asymmetries was exacerbated bya computational mode in temperature that is generatedwith the onset of convection. This computational modedoes not occur with the CP grid. However, even withthis grid, ZS03 found a weak wavenumber-four asymme-try in the temperature and velocity fields in the lower to
Copyright c© 2008 Royal Meteorological Society

1662 S. SHIN AND R. K. SMITH
middle troposphere. It turns out that these asymmetriesare associated with a significant asymmetry in the rela-tive vorticity in this layer and we believe now that theyare in some sense quasi-realistic features associated withan attempt of the model to resolve deep convection. Thisbelief stems from the results of NSM2008, who used ahigher-resolution multilayer model.
NSM08 showed that the flow asymmetries that developare highly sensitive to the surface moisture distribution.When a random moisture perturbation is added in theboundary layer at the initial time, even with a magnitudethat is below the accuracy with which moisture isnormally measured, the pattern of evolution of the flowasymmetries is dramatically changed and no two suchcalculations are alike in detail. The same is true alsoof calculations on a β-plane, at least in the inner-coreregion of the vortex, within 100–200 km from the centre.Nevertheless, the large-scale β-gyre asymmetries remaincoherent and are similar in each realization, so thatthey survive when one calculates the ensemble mean.The implication is that the inner-core asymmetries onthe f - and β-planes result from the onset of modelconvection and that, like convection in the atmosphere,they have a degree of randomness, being highly sensitiveto small-scale inhomogeneities in the low-level moisturedistribution, which is a well-known characteristic of thereal atmosphere (e.g. Weckwerth, 2000).
The recognition that the inner-core asymmetries areassociated with convective processes motivated us torevisit the prototype intensification problem using theminimal three-dimensional hurricane model described byZS03. The re-examination is important because the modelis potentially useful for developing a basic understandingof tropical-cyclone dynamics and has been used to studythe inner-core asymmetries when the model is coupledto a simple ocean model (Zhu et al., 2004). The presentversion of the model has a higher horizontal resolutionthan that of ZS03 (10 km instead of 20 km) andhas a simple explicit representation of moist processes,but no convective parametrization scheme. In particular,we investigate the structure and evolution of the flowasymmetries and the range of variability of the vortexintensity and structure when the boundary-layer moistureis slightly perturbed. This study complements that ofNSM08.
The random nature of the inner-core asymmetries callsfor a new methodology to assess differences betweentwo particular flow configurations, because the results ofa single deterministic calculation in each configurationmay be unrepresentative of a model ensemble in thatconfiguration. This means that one needs to compare theensemble means of suitably perturbed ensembles of thetwo configurations. We illustrate this methodology in twoexamples of idealized flows.
The paper is structured as follows. In section 2 we givea brief description of the model. Then, in sections 3 and4 we compare ensemble calculations of vortex evolutionon an f -plane and on a β-plane, where the ensembles aregenerated by adding small moisture perturbations at lowlevels. In section 5 we apply the foregoing methodology
to explore the effects of adding an anticyclonic shearflow to the upper model level. This problem is ofinterest because it has often been supposed that thepresence of outflow channels in the upper troposphere isconducive to tropical-cyclone intensification (e.g. Sadler,1976, 1978; Merrill, 1988). In the calculations shownhere, the presence of the shear flow is found to bedetrimental to intensification. The conclusions are givenin section 6.
2. The model
The minimal hurricane model is that described in ZS03.It is fully three-dimensional and based on the hydrostaticprimitive equations formulated in σ -coordinates (x, y, σ),where σ = (p − ptop)/(ps − ptop). Here, p is the pres-sure, ps is the surface pressure and ptop is the pressure atthe top of the domain. The vertical differencing is carriedout on a CP grid shown in Figure 1. The model equationsand the advantages of the CP grid are discussed by ZS03.The model is divided vertically into four layers of unequaldepth in σ : the lowest layer has depth 0.1 and the threelayers above have depths 0.3. Some of the calculations arecarried out on an f -plane and some on a β-plane. New-tonian cooling is used to represent the effect of radiativecooling. Simply, the moist static energy is relaxed to itsenvironmental value on a prescribed time-scale, τ . Theturbulent flux of momentum to the sea surface and thefluxes of sensible heat and water vapour from the surfaceare represented by bulk aerodynamic formulae. The sur-face drag coefficient, CD, is calculated from the formulaused by Shapiro (1992):
CD = (1.024 + 0.05366RF |ub|) × 10−3 . (1)
Here, RF = 0.8 is used to reduce the boundary layer wind,ub, to the 10-m level. The surface exchange coefficientsfor moisture and heat are assumed to be equal to eachother and to CD.
Moist processes are represented in this version ofthe model by the simplest explicit scheme in whichcondensation occurs when the air becomes supersaturatedat a grid point. At such points, the excess water isassumed to precipitate out and the latent heat of the
Figure 1. The CP vertical grid used in the model.
Copyright c© 2008 Royal Meteorological Society Q. J. R. Meteorol. Soc. 134: 1661–1671 (2008)DOI: 10.1002/qj
TROPICAL-CYCLONE INTENSIFICATION AND PREDICTABILITY 1663
Table I. The numerical experiments.
Number Name DescriptionA0 Control Control experiment on an f -plane, quiescent environmentA1–A10 f -plane ensemble Ten ensemble members (see text for details)B1–B10 f -plane ensemble Same as A0–A10, except with a smaller (×1/4) moisture perturbationC0–C10 β-plane ensemble Same as A0–A10, except on a β planeD0–D10 f -plane ensemble Same as A0–A10, except with an anticyclonic upper-level shear flow
condensed water goes to increase the air temperature. Thescheme, which is described in detail by ZSU, involves aniterative procedure. There is no parametrization of deepconvection as in the original model.
The initial vortex is axisymmetric and baroclinic. Thetangential wind profile is that used by Smith et al. (1990),but with different parameters: the maximum tangentialwind speed is 15 m s−1 at level 4 at a radius of 120 kmand its magnitude reduces to zero at level 1. The initialmass and geopotential fields are obtained by solving theinverse balance equation in the same way as Kurihara andBender (1980). The far-field temperature, geopotentialheight and humidity structure are based on the meanWest Indies sounding (Jordan, 1957). The horizontal gridspacing of the model is 10 km and the integration timestep is 3 s. The ocean surface temperature is 26.3◦C. Theexperiments are performed on an f -plane at 20◦N. As inZS03, the value of τ is taken to be ten days followingthe suggestion of Mapes and Zuidema (1996). The vortexcentre is obtained by calculating a centre of weightedrelative vorticity evaluated over the area 400 × 400 km2
centred on the location of maximum relative vorticity.Four main sets of calculations are carried out as
summarized in Table I. The first set, the control set,consists of a standard calculation (A0) and ten additionalones (A1–A10) in which the moisture fields throughoutthe innermost domain are randomly perturbed at thesurface (i.e. at level 4 1/2 and level 3 1/2). In the latter,the magnitude of the mixing ratio perturbation lies in therange of (−0.5 g kg−1, 0.5 g kg−1). The integration timeis 120 h.
3. Experiments on an f -plane
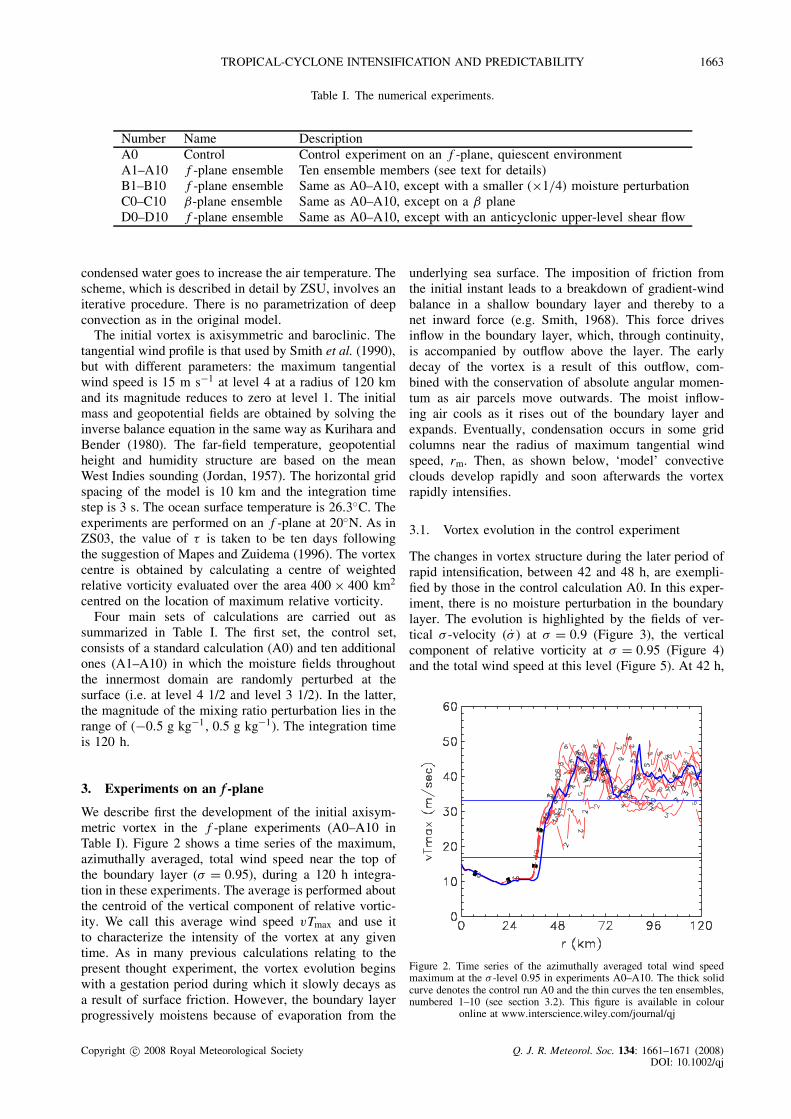
We describe first the development of the initial axisym-metric vortex in the f -plane experiments (A0–A10 inTable I). Figure 2 shows a time series of the maximum,azimuthally averaged, total wind speed near the top ofthe boundary layer (σ = 0.95), during a 120 h integra-tion in these experiments. The average is performed aboutthe centroid of the vertical component of relative vortic-ity. We call this average wind speed vTmax and use itto characterize the intensity of the vortex at any giventime. As in many previous calculations relating to thepresent thought experiment, the vortex evolution beginswith a gestation period during which it slowly decays asa result of surface friction. However, the boundary layerprogressively moistens because of evaporation from the
underlying sea surface. The imposition of friction fromthe initial instant leads to a breakdown of gradient-windbalance in a shallow boundary layer and thereby to anet inward force (e.g. Smith, 1968). This force drivesinflow in the boundary layer, which, through continuity,is accompanied by outflow above the layer. The earlydecay of the vortex is a result of this outflow, com-bined with the conservation of absolute angular momen-tum as air parcels move outwards. The moist inflow-ing air cools as it rises out of the boundary layer andexpands. Eventually, condensation occurs in some gridcolumns near the radius of maximum tangential windspeed, rm. Then, as shown below, ‘model’ convectiveclouds develop rapidly and soon afterwards the vortexrapidly intensifies.
3.1. Vortex evolution in the control experiment
The changes in vortex structure during the later period ofrapid intensification, between 42 and 48 h, are exempli-fied by those in the control calculation A0. In this exper-iment, there is no moisture perturbation in the boundarylayer. The evolution is highlighted by the fields of ver-tical σ -velocity (σ̇ ) at σ = 0.9 (Figure 3), the verticalcomponent of relative vorticity at σ = 0.95 (Figure 4)and the total wind speed at this level (Figure 5). At 42 h,
Figure 2. Time series of the azimuthally averaged total wind speedmaximum at the σ -level 0.95 in experiments A0–A10. The thick solidcurve denotes the control run A0 and the thin curves the ten ensembles,numbered 1–10 (see section 3.2). This figure is available in colour
online at www.interscience.wiley.com/journal/qj
Copyright c© 2008 Royal Meteorological Society Q. J. R. Meteorol. Soc. 134: 1661–1671 (2008)DOI: 10.1002/qj
1664 S. SHIN AND R. K. SMITH
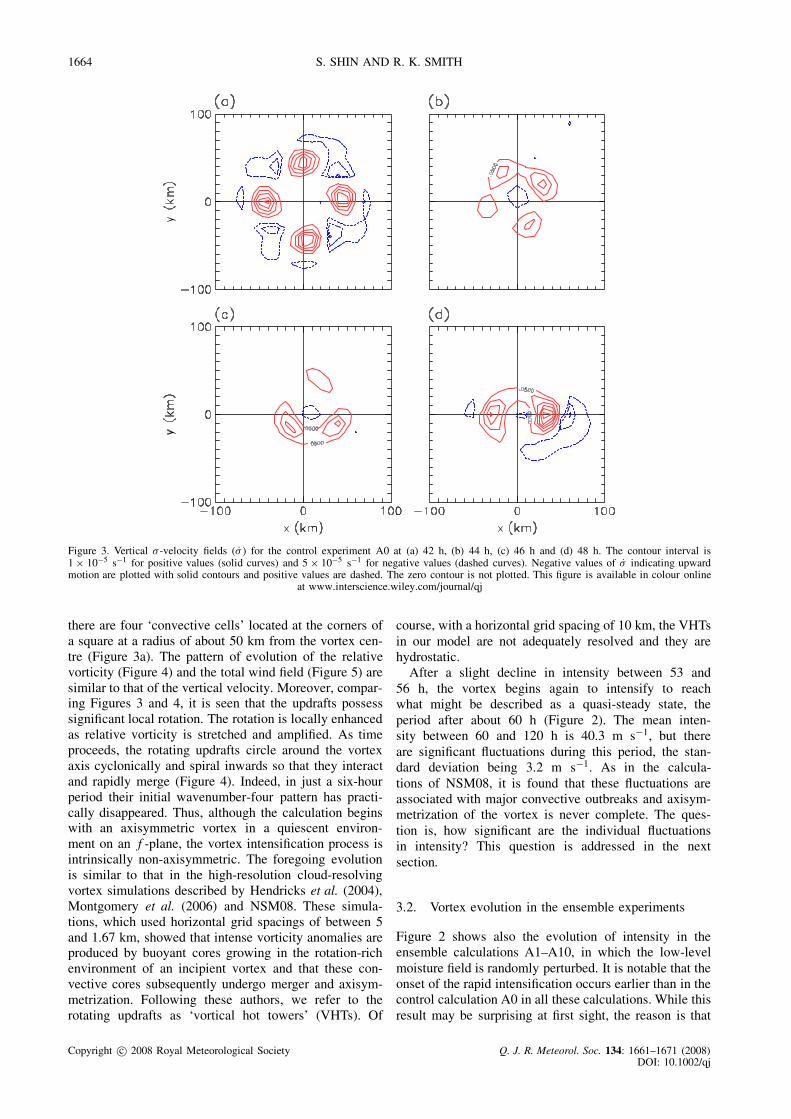
Figure 3. Vertical σ -velocity fields (σ̇ ) for the control experiment A0 at (a) 42 h, (b) 44 h, (c) 46 h and (d) 48 h. The contour interval is1 × 10−5 s−1 for positive values (solid curves) and 5 × 10⁻⁵ s−1 for negative values (dashed curves). Negative values of σ̇ indicating upwardmotion are plotted with solid contours and positive values are dashed. The zero contour is not plotted. This figure is available in colour online
at www.interscience.wiley.com/journal/qj
there are four ‘convective cells’ located at the corners ofa square at a radius of about 50 km from the vortex cen-tre (Figure 3a). The pattern of evolution of the relativevorticity (Figure 4) and the total wind field (Figure 5) aresimilar to that of the vertical velocity. Moreover, compar-ing Figures 3 and 4, it is seen that the updrafts possesssignificant local rotation. The rotation is locally enhancedas relative vorticity is stretched and amplified. As timeproceeds, the rotating updrafts circle around the vortexaxis cyclonically and spiral inwards so that they interactand rapidly merge (Figure 4). Indeed, in just a six-hourperiod their initial wavenumber-four pattern has practi-cally disappeared. Thus, although the calculation beginswith an axisymmetric vortex in a quiescent environ-ment on an f -plane, the vortex intensification process isintrinsically non-axisymmetric. The foregoing evolutionis similar to that in the high-resolution cloud-resolvingvortex simulations described by Hendricks et al. (2004),Montgomery et al. (2006) and NSM08. These simula-tions, which used horizontal grid spacings of between 5and 1.67 km, showed that intense vorticity anomalies areproduced by buoyant cores growing in the rotation-richenvironment of an incipient vortex and that these con-vective cores subsequently undergo merger and axisym-metrization. Following these authors, we refer to therotating updrafts as ‘vortical hot towers’ (VHTs). Of
course, with a horizontal grid spacing of 10 km, the VHTsin our model are not adequately resolved and they arehydrostatic.
After a slight decline in intensity between 53 and56 h, the vortex begins again to intensify to reachwhat might be described as a quasi-steady state, theperiod after about 60 h (Figure 2). The mean inten-sity between 60 and 120 h is 40.3 m s−1, but thereare significant fluctuations during this period, the stan-dard deviation being 3.2 m s−1. As in the calcula-tions of NSM08, it is found that these fluctuations areassociated with major convective outbreaks and axisym-metrization of the vortex is never complete. The ques-tion is, how significant are the individual fluctuationsin intensity? This question is addressed in the nextsection.
3.2. Vortex evolution in the ensemble experiments
Figure 2 shows also the evolution of intensity in theensemble calculations A1–A10, in which the low-levelmoisture field is randomly perturbed. It is notable that theonset of the rapid intensification occurs earlier than in thecontrol calculation A0 in all these calculations. While thisresult may be surprising at first sight, the reason is that
Copyright c© 2008 Royal Meteorological Society Q. J. R. Meteorol. Soc. 134: 1661–1671 (2008)DOI: 10.1002/qj

TROPICAL-CYCLONE INTENSIFICATION AND PREDICTABILITY 1665
Figure 4. The vertical component of the relative vorticity fields of the control experiment A0 at (a) 42 h, (b) 44 h, (c) 46 h and (d) 48 h. Thecontour interval is 5 × 10⁻⁴ s−1 for positive values (solid curves) and 5 × 10⁻⁵ s−1 for negative values (dashed curves). The zero contour is
not plotted. This figure is available in colour online at www.interscience.wiley.com/journal/qj
although the moisture perturbation in a particular ensem-ble member is spatially random, there are always somepositive perturbations that initiate deep convection ear-lier. In fact, grid-scale saturation at σ = 0.9 occurs atabout 18 h in all the ensembles, which is about 2 hearlier than in the control run and this leads to a cor-respondingly earlier development of the VHTs. We seethis in the pattern of relative vorticity in the ensemblemembers A1–A3 at 38 h (Figure 6), fields which aresimilar to that in the control experiment at 40 h. Whilethe differences between ensemble members at this timeare slight, the solutions rapidly diverge, as shown in thecorresponding vorticity fields at 45 h in A0 and 43 hin A1–A3 shown in Figure 7. These differences providean explanation for the differences in intensity betweenthe control experiment and the ensembles evident in Fig-ure 2 and provide an answer to the question raised insection 3.1. It is manifestly clear that the differencesin intensity are not significant, rather they are randomfeatures associated with small random perturbations oflow-level moisture.
As one measure of the variability in the ensemblecalculations, we calculated the maximum total wind speedattained over the 120 h integration period and the time atwhich this maximum was reached. The average maximum(with the control calculation included) was 48.9 m s−1,with a standard deviation of 2.3 m s−1. The time at which
this maximum occurs shows considerable variability also,the average time being at 76 h and the standard deviation15 h. We carried out a second set of ensemble calculations(B1–B10) with the amplitude of the moisture perturbationreduced by a factor of 4 to enable the calculations to bebetter compared with those of NSM08, who used gridcells of one-quarter the area of those here. In this case, theaverage maximum wind speed increased slightly to 52.5m s−1 with a standard deviation of 4.2 m s−1. The time atwhich the maxima occur showed a similar variability, theaverage being again at 76 h, but the standard deviation17 h is marginally larger.
Figure 8 compares the time series of the ensemblemean of the azimuthally averaged total wind speedmaximum in the boundary layer (i.e. at σ = 0.95) inthe two sets of ensemble calculations A0–A10 andB1–B10. Perhaps surprisingly, the variability betweenensemble members in B1–B10 is larger than in A0–A10,as indicated by the standard deviation time series, shownalso in Figure 8. We are not yet able to explain thisresult, but infer therefrom that it is not the horizontalresolution that leads to the greater variability in theseminimal model calculations compared with NSM08.Another possibility is that it is the coarser verticalresolution that is responsible, a possibility that we planto investigate in due course.
Copyright c© 2008 Royal Meteorological Society Q. J. R. Meteorol. Soc. 134: 1661–1671 (2008)DOI: 10.1002/qj

1666 S. SHIN AND R. K. SMITH
Figure 5. Total wind fields at σ -level 0.95 in the control experiment A0 at (a) 42 h, (b) 44 h, (c) 46 h and (d) 48 h. The contour interval is 5 ms−1. This figure is available in colour online at www.interscience.wiley.com/journal/qj
4. Experiments on a β-plane
At this stage, it is of interest to examine how the evolutionof the flow asymmetries is affected by the presence ofa β-effect, the relevant question being, to what extentdoes the azimuthal wavenumber-one asymmetry imposedby β impose a stamp on the asymmetries that develop?For this reason, we repeated the ensemble f -planeexperiments described in section 3.1 for the β-plane.These experiments are designated C0–C10 in Table I. Atime series of the ensemble average of the azimuthallyaveraged total wind speed maxima in the boundary layerfor experiments A0–A10 is compared with that for theexperiments C0–C10 in Figure 9. There is virtually nodifference between the two curves until about 40 h andthere is no significant difference after about 63 h, whenthe two curves lie largely within one standard deviation ofthe variability in each ensemble (indicated by the verticallines in Figure 9). In the intervening period, which marksthe second part of the period of rapid intensification,the intensity in the ensemble mean intensity on the f -plane is a little larger, by up to 5 m s−1, comparedwith the mean intensity on the β-plane. Even then, thedeviation hardly exceeds one standard deviation of thevariability in each ensemble, except in the last 12 h ofthe calculations. We conclude that there is no significantdifference between the intensity in the f - and β-planecalculations. Note, however, that it is necessary to carry
out ensemble calculations to demonstrate this lack of asignificant difference; had we chosen to compare twoensemble members, one from each set of calculations,we may have arrived at a different conclusion. Thispossibility is indicated by the substantial variation inintensity between individual members in the case of thef -plane calculations shown in Figure 2, a result that istrue also of those on the β-plane.
The inner-core asymmetries in the β-plane calculationsare again dominated by random ‘model’ convective burstsas in the f -plane experiments and do not show upas a coherent asymmetry in the ensemble mean. Thisfeature is exemplified by the azimuthal wavenumber-onecomponent of relative vorticity for the f -plane shownin Figures 6 and 7. Nevertheless, a coherent large-scale asymmetry is apparent in the ensemble averagefields (Figure 10) and corresponds with the associatedβ-gyres familiar in barotropic calculations (e.g. Fiorinoand Elsberry, 1989; Smith and Ulrich, 1990, 1993; Smithet al., 1990). Note that the strength of these asymmetriesincreases with time during the 12 h period from 48 to 60h and their scale increases, as would be expected frombarotropic theory (Smith and Ulrich, 1993). A similarresult was obtained in the high-resolution calculations ofNSM08.
Our conclusions here differ significantly from thoseof a very recent paper by Ritchie and Frank (2007).
Copyright c© 2008 Royal Meteorological Society Q. J. R. Meteorol. Soc. 134: 1661–1671 (2008)DOI: 10.1002/qj

TROPICAL-CYCLONE INTENSIFICATION AND PREDICTABILITY 1667
Figure 6. Vertical component of the relative vorticity in (a) the control experiment A0 at 40 h, and in three of the ensemble experiments (b) A1,(c) A2 and (d) A3 at 38 h. The contour interval is 5 × 10⁻⁴ s−1 for positive values (solid curves) and 1 × 10⁻⁴ s−1 for negative values (dashed
curves). The zero contour is not plotted. This figure is available in colour online at www.interscience.wiley.com/journal/qj
They compared two deterministic experiments of a simi-lar type to ours using a version of the Pennsylvania StateUniversity–National Center for Atmospheric Researchfifth-generation Mesoscale Model (MM5) with 5 km hor-izontal resolution. They found that the vortex on theβ-plane ‘quickly develops a persistent wavenumber-oneasymmetry in its inner core’. Based on our ensembleexperiments and those of NSM08, we question the valid-ity of this conclusion. Unfortunately, it is not possibleto compare the details of vortex evolution in our con-trol experiments with theirs, as they show only coarse-grain, horizontal fields of potential vorticity and only atthe mature stage of vortex development. Nevertheless,we note that they found little difference in the inten-sity between their f - and β-plane experiments, consistentwith our results.
5. Experiments with an upper-level anticyclonicshear flow on an f -plane
It is commonly believed that a favourable condition fortropical-cyclone intensification is the existence of so-called outflow channels in the upper troposphere thatprovide a means of assisting the removal of air thatrises in the eyewall. As far as we are aware, this idea
was first put forward by Sadler (1976) and it seems tohave gained much credence amongst forecasters, some ofwhom see it as a mechanism for ‘sucking’ air upwards inthe storm and thereby enhancing the secondary circulationas well as the low-level convergence. Merrill (1988)suggested that the outflow is enhanced by the approachof a jet stream associated with an upper-level trough,thereby enhancing the secondary circulation of the jet. Ifthe upward branch of the secondary circulation is closeenough to the cyclone, it might invigorate the inner-coreconvection.
Shi et al., (1990) carried out a series of idealizednumerical experiments with a view to testing these ideas.The idea was to examine the response of the modelcyclone to an acceleration of the outflow brought aboutby artificially nudging parts of the outflow to a specifiedwind distribution. When the nudging was performedwithin 5◦ latitude of the vortex, the storm did strengthen.However, when it was performed outside this radius,convection was initiated far from the storm axis and thestorm weakened.
An alternative perspective on these issues is to rec-ognize that deep convection is a response to conditionalinstability and that the outflow channels are generated bythe inner-core convection, itself. This idea is supportedby the scale analysis of tropical motions by Charney
Copyright c© 2008 Royal Meteorological Society Q. J. R. Meteorol. Soc. 134: 1661–1671 (2008)DOI: 10.1002/qj

1668 S. SHIN AND R. K. SMITH
Figure 7. Vertical component of the relative vorticity in (a) the control experiment A0 at 45 h, and in three of the ensemble experiments at 43 h:(b) A1, (c) A2 and (d) A3. The contour interval is 5 × 10⁻⁴ s−1 for positive values (solid curves) and 5 × 10⁻⁵ s−1 for negative values (dashed
curves). The zero contour is not plotted. This figure is available in colour online at www.interscience.wiley.com/journal/qj
Figure 8. Comparison of time series of the ensemble mean of theazimuthally averaged total wind speed maximum at the σ -level 0.95 inthe ensemble calculations A0–A10 (solid line) and B0–B10 (dashedline), referred to in section 3.2. The thin vertical lines indicatethe standard deviation (solid lines for A0–A10 and dashed linesfor A0 and B1–B10). This figure is available in colour online at
www.interscience.wiley.com/journal/qj
Figure 9. Comparison of time series of the ensemble mean ofthe azimuthally averaged total wind speed maximum at the σ -level 0.95 in the ensemble calculations A0–A10 (solid lines) andthose on the β-plane, C0–C10 (dashed lines). The thin verticallines indicate the standard deviation (solid lines for A0–A10 anddashed lines for C0–C10). This figure is available in colour online
at www.interscience.wiley.com/journal/qj
Copyright c© 2008 Royal Meteorological Society Q. J. R. Meteorol. Soc. 134: 1661–1671 (2008)DOI: 10.1002/qj
TROPICAL-CYCLONE INTENSIFICATION AND PREDICTABILITY 1669
(a)
(b)
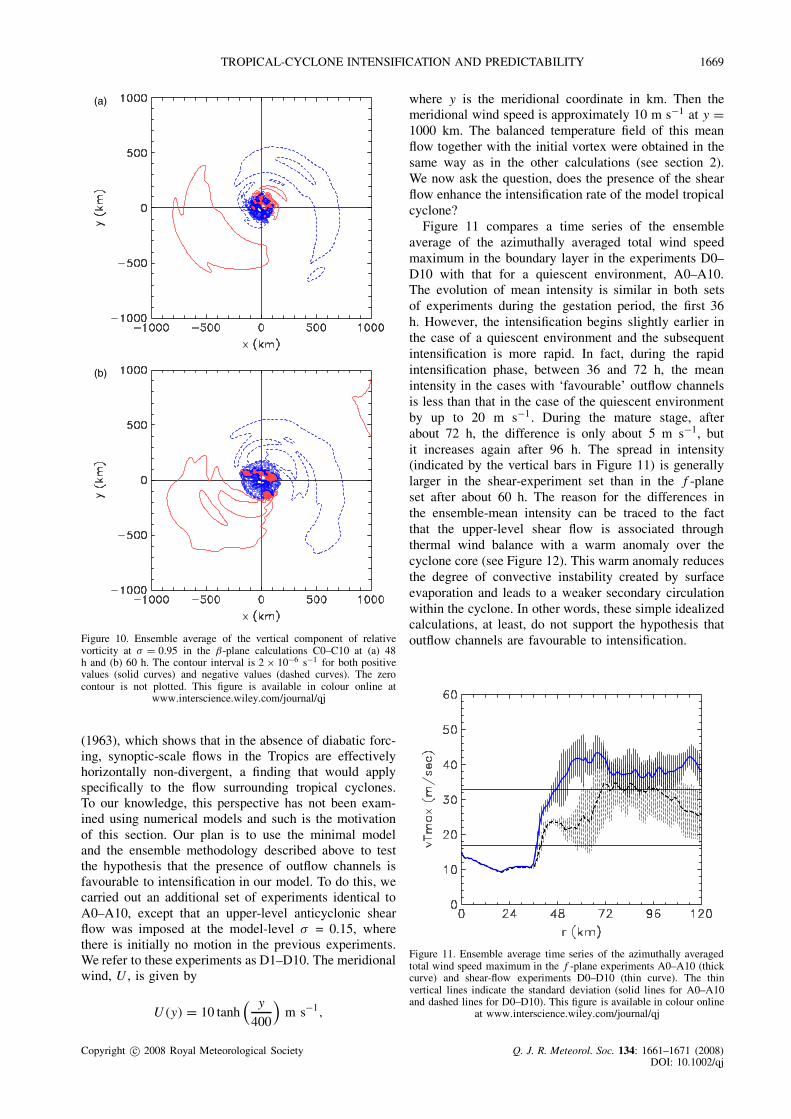
Figure 10. Ensemble average of the vertical component of relativevorticity at σ = 0.95 in the β-plane calculations C0–C10 at (a) 48h and (b) 60 h. The contour interval is 2 × 10⁻⁶ s−1 for both positivevalues (solid curves) and negative values (dashed curves). The zerocontour is not plotted. This figure is available in colour online at
www.interscience.wiley.com/journal/qj
(1963), which shows that in the absence of diabatic forc-ing, synoptic-scale flows in the Tropics are effectivelyhorizontally non-divergent, a finding that would applyspecifically to the flow surrounding tropical cyclones.To our knowledge, this perspective has not been exam-ined using numerical models and such is the motivationof this section. Our plan is to use the minimal modeland the ensemble methodology described above to testthe hypothesis that the presence of outflow channels isfavourable to intensification in our model. To do this, wecarried out an additional set of experiments identical toA0–A10, except that an upper-level anticyclonic shearflow was imposed at the model-level σ = 0.15, wherethere is initially no motion in the previous experiments.We refer to these experiments as D1–D10. The meridionalwind, U , is given by
U(y) = 10 tanh( y
400
)m s−1,
where y is the meridional coordinate in km. Then themeridional wind speed is approximately 10 m s−1 at y =1000 km. The balanced temperature field of this meanflow together with the initial vortex were obtained in thesame way as in the other calculations (see section 2).We now ask the question, does the presence of the shearflow enhance the intensification rate of the model tropicalcyclone?
Figure 11 compares a time series of the ensembleaverage of the azimuthally averaged total wind speedmaximum in the boundary layer in the experiments D0–D10 with that for a quiescent environment, A0–A10.The evolution of mean intensity is similar in both setsof experiments during the gestation period, the first 36h. However, the intensification begins slightly earlier inthe case of a quiescent environment and the subsequentintensification is more rapid. In fact, during the rapidintensification phase, between 36 and 72 h, the meanintensity in the cases with ‘favourable’ outflow channelsis less than that in the case of the quiescent environmentby up to 20 m s−1. During the mature stage, afterabout 72 h, the difference is only about 5 m s−1, butit increases again after 96 h. The spread in intensity(indicated by the vertical bars in Figure 11) is generallylarger in the shear-experiment set than in the f -planeset after about 60 h. The reason for the differences inthe ensemble-mean intensity can be traced to the factthat the upper-level shear flow is associated throughthermal wind balance with a warm anomaly over thecyclone core (see Figure 12). This warm anomaly reducesthe degree of convective instability created by surfaceevaporation and leads to a weaker secondary circulationwithin the cyclone. In other words, these simple idealizedcalculations, at least, do not support the hypothesis thatoutflow channels are favourable to intensification.
Figure 11. Ensemble average time series of the azimuthally averagedtotal wind speed maximum in the f -plane experiments A0–A10 (thickcurve) and shear-flow experiments D0–D10 (thin curve). The thinvertical lines indicate the standard deviation (solid lines for A0–A10and dashed lines for D0–D10). This figure is available in colour online
at www.interscience.wiley.com/journal/qj
Copyright c© 2008 Royal Meteorological Society Q. J. R. Meteorol. Soc. 134: 1661–1671 (2008)DOI: 10.1002/qj

1670 S. SHIN AND R. K. SMITH
Figure 12. Upper-level (level 1) temperature anomaly relative to thefar-field temperature at the same level and at the initial time in theshear-flow experiments. The contour interval is 0.5 K. This figure is
available in colour online at www.interscience.wiley.com/journal/qj
6. Conclusions
We have shown that the predictability of hurricaneintensity using the minimal hurricane model is limitedby the sensitivity of the solutions to small, but ran-dom perturbations to the low-level moisture field. Theresults are in line with those of NSM08, who used amore complex, although also considerably idealized non-hydrostatic model.
The sensitivity to random moisture perturbations islarger with the 10 km grid size used here comparedwith the 5 km resolution grid size used by NSM08. Thissensitivity is quantified in terms of the standard deviationof the intensity of a set of ensemble calculations. We ruledout that this increased sensitivity is because the impliedhorizontal scale of moisture fluctuations is larger than inNSM2008. The likelihood is that it is associated with themuch coarser vertical resolution in the minimal model.
Together with that of NSM08, our study represents anew approach to understanding hurricane dynamics usingmodels. It adopts the view that a single deterministic cal-culation may have features that are not significant whenone takes into account the variability associated with theuncertainty in the low-level moisture distribution. In thisview, only features that survive in an ensemble mean canbe regarded as robust.
We have shown two examples of this approach: one ina comparison of vortex evolution on an f -plane withthat on a β-plane and the other examining the roleof apparently favourable outflow channels. In the lattercase, the presence of outflow channels was found to bedetrimental to intensification because the warm upper-level thermal anomaly between them has a stabilizingeffect on deep convection in the intensifying vortex.
Acknowledgements
We are most grateful to Hongyan Zhu for kindly makingher model available for this study, and to MichaelMontgomery and two anonymous reviewers for theirhelpful comments on an earlier version of the manuscript.The first author is indebted to the Deutsche AkademischerAustauschdienst (DAAD) for providing a stipendium tosupport this study.
References
Charney JG. 1963. A note on the large-scale motions in the tropics. J.Atmos. Sci. 20: 607–609.
Dengler K, Reeder MJ. 1997. The effects of convection andbaroclinicity on the motion of tropical-cyclone-like vortices. Q. J.R. Meteorol. Soc. 123: 699–727.
Emanuel KA. 1989. The finite amplitude nature of tropicalcyclogenesis. J. Atmos. Sci. 46: 3431–3456.
Emanuel KA. 1995. Sensitivity of tropical cyclones to surface exchangecoefficients and a revised steady-state model incorporating eyedynamics. J. Atmos. Sci. 52: 3969–3976.
Fiorino M, Elsberry R. 1989. Some aspects of vortex structure relatedto tropical cyclone motion. J. Atmos. Sci. 46: 975–990.
Flatau M, Schubert WH, Stevens DE. 1994. The role of baroclinicprocesses in tropical cyclone motion. Part I: The influence of verticaltilt. J. Atmos. Sci. 51: 2589–2601.
Frank WM, Ritchie EA. 1999. Effects of environmental flow upontropical cyclone structure. Mon. Weather Rev. 127: 2044–2061.
Hendricks EA, Montgomery MT, Davis CA. 2004. On the role of‘vortical’ hot towers in formation of tropical cyclone Diana (1984).J. Atmos. Sci. 61: 1209–1232.
Jordan CL. 1957. Mean soundings for the West Indies area. J. Meteorol.15: 91–97.
Kurihara Y, Bender MA. 1980. Use of a movable nested-mesh modelfor tracking a small vortex. Mon. Weather Rev. 108: 1792–1809.
Kurihara Y, Tuleya RE. 1974. Structure of a tropical cyclone developedin a three-dimensional numerical simulation model. J. Atmos. Sci.31: 893–919.
Mapes BE, Zuidema P. 1996. Radiative-dynamical consequences ofdry tongues in the tropical troposphere. J. Atmos. Sci. 53: 620–638.
Merrill RT. 1988. Environmental influences on hurricane intensifica-tion. J. Atmos. Sci. 45: 1678–1687.
Montgomery MT, Nicholls ME, Cram TA, Saunders AB. 2006. Avortical hot tower route to tropical cyclogenesis. J. Atmos. Sci. 63:355–386.
Nguyen CM, Smith RK, Zhu H, Ulrich W. 2002. A minimalaxisymmetric hurricane model. Q. J. R. Meteorol. Soc. 128:2641–2661.
Nguyen SV, Smith RK, Montgomery MT. 2008. Tropical-cycloneintensification and predictability in three dimensions. Q. J. R.Meteorol. Soc. 134: 563–582 (NSM08).
Ooyama KV. 1969. Numerical simulation of the life cycle of tropicalcyclones. J. Atmos. Sci. 26: 3–40.
Peng MS, Jeng BF, Williams RT. 1999 A numerical study on tropicalcyclone intensification. Part I: Beta effect and mean flow effect. J.Atmos. Sci. 56: 1404–1423.
Persing J, Montgomery MT. 2003. Hurricane superintensity. J. Atmos.Sci. 60: 2349–2371.
Ritchie EA, Frank WM. 2007. Interactions between simulated tropicalcyclones and an environment with a variable Coriolis parameter.Mon. Weather Rev. 135: 1889–1905.
Rotunno R, Emanuel KA. 1987. An air–sea interaction theory fortropical cyclones. Part II: Evolutionary study using a non-hydrostaticaxisymmetric numerical model. J. Atmos. Sci. 44: 542–561.
Sadler JC. 1976. A role of the tropical upper tropospheric troughin early season typhoon development. Mon. Weather Rev. 104:1266–1278.
Sadler JC. 1978. Mid-season typhoon development and intensitychanges and the tropical upper tropospheric trough. Mon. WeatherRev. 106: 1137–1152.
Shapiro LJ. 1992. Hurricane vortex motion and evolution in a three-layer model. J. Atmos. Sci. 49: 140–153.
Shi JJ, Chang SW, Raman S. 1990. A numerical study of the outflowof tropical cyclones. Mon. Weather Rev. 118: 2042–2055.
Copyright c© 2008 Royal Meteorological Society Q. J. R. Meteorol. Soc. 134: 1661–1671 (2008)DOI: 10.1002/qj

TROPICAL-CYCLONE INTENSIFICATION AND PREDICTABILITY 1671
Smith RK. 1968. The surface boundary layer of a hurricane. Tellus 20:473–483.
Smith RK, Ulrich W. 1990. An analytical theory of tropical cyclonemotion using a barotropic model. J. Atmos. Sci. 47: 1973–1986.
Smith RK, Ulrich W. 1993. Vortex motion in relation to the absolutevorticity gradient of the vortex environment. Q. J. R. Meteorol. Soc.119: 207–215.
Smith RK, Ulrich W, Dietachmayer G. 1990. A numerical study oftropical cyclone motion using a barotropic model. Part I: The roleof vortex asymmetries. Q. J. R. Meteorol. Soc. 116: 337–362.
Wang Y. 2001. An explicit simulation of tropical cyclones with atriply nested movable mesh primitive equation model: TCM3. Part I:Model description and control experiment. Mon. Weather Rev. 129:1370–1394.
Wang Y. 2002a. Vortex Rossby waves in a numerical simulated tropicalcyclone. Part I: Overall structure, potential vorticity, and kineticenergy budgets. J. Atmos. Sci. 59: 1213–1238.
Wang Y. 2002b.. Vortex Rossby waves in a numerical simulatedtropical cyclone. Part II: The role in tropical cyclone structure andintensity changes. J. Atmos. Sci. 59: 1239–1262.
Wang Y, Holland GJ. 1996. The beta drift of baroclinic vortices. PartII: Diabatic vortices. J. Atmos. Sci. 53: 3737–3756.
Weckwerth TM. 2000. The effect of small-scale moisture variabilityon thunderstorm initiation. Mon. Weather Rev. 128: 4017–4030.
Willoughby HE, Jin HL, Lord SJ, Piotrowicz JM. 1984. Hurricanestructure and evolution as simulated by an axisymmetric, non-hydrostatic numerical model. J. Atmos. Sci. 41: 1169–1186.
Zhu H, Smith RK. 2002. The importance of three physical processesin a three-dimensional tropical cyclone model. J. Atmos. Sci. 59:1825–1840.
Zhu H, Smith RK. 2003. Effects of vertical differencing in a minimalhurricane model. Q. J. R. Meteorol. Soc. 129: 1051–1069 (ZS03).
Zhu H, Smith RK, Ulrich W. 2001. A minimal three-dimensionaltropical cyclone model. J. Atmos. Sci. 58: 1924–1944 (ZSU).
Zhu H, Smith RK, Ulrich W. 2004. Ocean effects on tropical cycloneintensification and inner-core asymmetries. J. Atmos. Sci. 61:1245–1258.
Copyright c© 2008 Royal Meteorological Society Q. J. R. Meteorol. Soc. 134: 1661–1671 (2008)DOI: 10.1002/qj