role of quercetin in modulating rat cardiomyocyte gene expression profile
TRANSCRIPT

1
Role of quercetin in modulating rat cardiomyocyte gene
expression profile
C. Angeloni 1, E.Leoncini 1, M. Malaguti 1, S. Angelini 2, P. Hrelia 2, S. Hrelia 1
1 Department of Biochemistry “G.Moruzzi” University of Bologna, Via Irnerio 48, 40126
Bologna (Italy)
2 Department of Pharmacology, University of Bologna, Via Irnerio 48, 40126 Bologna,
(Italy)
Running head: Quercetin modulates rat cardiomyocyte gene expression
Corresponding Author:
Prof. Silvana Hrelia
Dipartimento di Biochimica “G.Moruzzi”
Alma Mater-Università di Bologna
Via Irnerio, 48
40126 BOLOGNA (Italy)
Tel: +39 051 2091233
Fax: +39 051 2091235
e-mail: [email protected]
Page 1 of 46
Copyright Information
Articles in PresS. Am J Physiol Heart Circ Physiol (January 4, 2008). doi:10.1152/ajpheart.01091.2007
Copyright © 2008 by the American Physiological Society.

2
ABSTRACT
Despite extensive studies, the fundamental mechanisms responsible for the development
and progression of cardiovascular diseases have not yet been fully elucidated. Recent
experimental and clinical studies have suggested that reactive oxygen species (ROS) play a
major pathological role. Oxidative stress reduction induced by flavonoids has been
regarded by many as the most likely mechanism in the protective effects of these
compounds; however, there is an emerging view that flavonoids may also exert modulatory
actions on protein kinase and lipid kinase signaling pathways. Quercetin, a major flavonoid
present in the human diet, has been widely studied and its biological properties are
consistent with its protective role in the cardiovascular system. However, it remains
unknown whether the cardioprotective effects of quercetin may also occur through the
modulation of genes involved in cell survival. The main goal of this study was to examine
the gene expression profiling of cultured rat primary cardiomyocytes treated with quercetin
using DNA-microarrays and to relate these data to functional effects. Results showed
distinct temporal changes in gene expression induced by quercetin and a strong up-
regulation of phase 2 enzymes, highlighting quercetin ability to act also with an indirect
antioxidant mechanism.
Keywords: flavonoids; phase 2 enzymes; oxidative stress.
Page 2 of 46
Copyright Information

3
INTRODUCTION
Heart diseases are the leading cause of morbidity and mortality in industrialized countries
(55). Despite extensive studies, the fundamental mechanisms responsible for their
development and progression are still under debate. Recent experimental and clinical
studies have suggested that reactive oxygen species (ROS) play a major pathological role
(4, 13). The cellular sources of ROS generation within the heart include cardiac
myocytes, endothelial cells, and neutrophils. Potential rources of ROS in cardiac
myocytes include mitochondrial electron transport, NADPH oxidase, and xantine
dehydrogenase/xantine oxidase (50). One of the strongest lines of evidence for the
involvement of ROS in cardiovascular diseases is the ability of a number of structurally
unrelated compounds with antioxidant properties to protect against cardiovascular
pathophysiology, including myocardial ischemia-reperfusion injury, cardiomyopathy, and
arterial atherogenesis (14, 23, 26, 29).
Recently, much of the attention has been focused on flavonoids, naturally occurring
polyphenolic compounds, as food factors that may be beneficial for cardiovascular
disease prevention. Various epidemiological studies have shown an inverse correlation
between the consumption of flavonoid-rich foods and cardiovascular disease risk (6, 28,
37). Oxidative stress reduction by flavonoids has been regarded as the most likely
mechanism in the protective effects of these compounds; however, there is an emerging
view that flavonoids may also exert modulatory effects acting through protein kinase and
lipid kinase signaling pathways (5, 59). Quercetin (Q), a major flavonoid present in the
human diet, has been widely studied and its biological properties are consistent with its
Page 3 of 46
Copyright Information

4
protective role in the cardiovascular system (30). In a previous paper, we have
demonstrated that Q is able to protect cardiac cells from oxidative stress acting both as an
antioxidant and a modulator of the signal transduction pathway related to apoptosis (5).
However, it remains unknown whether the cardioprotective effects of Q may also occur
through the modulation of genes involved in cell survival. Nutrigenomics is the scientific
study by which some of these questions can be answered. The concept of nutrigenomics
has rosen thanks to the development of new techniques, like global gene expression by
microarray technology, successfully applied to study the transcriptional changes
occurring in heart, vessels, and blood cells in different cardiovascular disorders. DNA
microarray technology could promote an increased understanding of how Q influences
gene expressions and regulates those genes responsible for cardioprotection. To our
knowledge, the cardiomyocyte expression profile of genes associated with response to Q
has not yet been reported. The present study was therefore designed to examine the gene
expression profiling of cultured rat primary cardiomyocytes treated with Q using DNA-
microarrays and to relate these data to functional effects. The results showed distinct
temporal changes in gene expression induced by Q and a strong up-regulation of phase 2
enzymes. In addition, to demonstrate the physiological relevance of the gene expression
analysis, cell viability and ROS production were measured in cardiomyocytes treated
with Q for selected time periods in the presence of oxidative stress.
Page 4 of 46
Copyright Information

5
MATERIALS AND METHODS
Chemicals
CelLytic™ M, 3-(4,5-dimethylthiazol-2-yl)-2,5-diphenyl-tetrazolium bromide (MTT),
2’,7’-dichlorodihydrofluorescein diacetate (DCFH-DA), ferrozine, Q, H2O2, digitonin,
glucose-6-phosphate, glucose-6-phosphate dehydrogenase, bovine serum albumin,
NADP, FAD, DMSO, FeCl3, menadione, monochlorobimane (MCB), 1-chloro-2,4-
dinitrobenzene (CDNB), 5,5'-dithiobis(2-nitrobenzoic) acid (DTNB), glutathione (GSH),
and all other chemicals of the highest analytical grade were purchased from Sigma
Chemical Co. (St. Louis, MO, USA), unless otherwise stated. Q was dissolved in DMSO
at a concentration of 30 mM and kept at −20 °C until use.
Cell culture and treatments
Ventricular cardiomyocytes were derived from the heart of 2–4 days old Wistar rats, as
previously reported (7). Cells were seeded at a density of 1.2x10⁶cells/mL and were
grown in DMEM F12 culture medium treated with 10 % fetal calf serum, 10 % horse
serum (complete medium), and 1% sodium pyruvate. Cells were routinely grown in a
humidified incubator (95 % humidity) with 5 % CO2 at 37 °C until complete confluence.
In some dishes, 30 µM Q was added to the culture medium for 6, 12 and 24 h. The low
micromolar concentration of Q employed in this study is similar to that used by other
investigators (30, 32, 53).
RNA extraction
Page 5 of 46
Copyright Information

6
Total RNA was extracted using Total RNA Isolation Mini Kit (Agilent Technologies,
Palo Alto, CA), following the manufacturer’s protocol. The yield and purity of the RNA
were measured using NanoDrop ND-1000 Spectrophotometer (NanoDrop Technologies,
Inc., Rockland, DE, USA). The 28s and 18s ribosomal bands were checked using Agilent
2100 bioanalyzer with an RNA 6000 Nano LabChip Kit.
mRNA amplification and labeling
For each sample, mRNA was amplified starting from 1.5 µg of totRNA by Amino Allyl
MessageAmp I aRNA Kit (Ambion, Woodward Austin, TX, USA) to obtain amino allyl
antisense RNA following the method developed by Eberwine et al. (54). Only one round
of amplification was performed, according to the manufacturer’s protocol, with minor
modification. Briefly, mRNA was reverse transcribed into cDNA single strand; after the
second strand synthesis, cDNA was in vitro transcribed in aaRNA including an amino
allyl modified nucleotide (aaUTP). Both dsDNA and aaRNA underwent a purification
step using columns provided with the kit. Labeling was performed using NHS ester Cy3
or Cy5 dies (Amersham Biosciences, Piscataway, NJ, USA) able to react with the
modified RNA. At least 5 µg of mRNA, for each sample, were labeled and purified with
columns. mRNA quality, concentration and labeling were checked by RNA 6000 Nano
LabChip assays (Agilent Technologies) and Agilent 2100 Bioanalyzer. Concentrations
were also checked by NanoDrop ND-1000 Spectrophotometer.
Microarray hybridization and scanning
Page 6 of 46
Copyright Information

7
One hybridization with dye-swap duplication was performed to compare samples versus
reference. Reverse labeling was performed to reduce dye-specific biases in signal
intensity. The same quantity of differentially labeled sample and reference (0.75 µg) was
put together, fragmented and hybridized to high-density rat arrays containing 22,575 (60
mer) oligo-nucleotide probes representing over 20,000 well characterized rat genes,
ESTs, and EST cluster. All steps were performed using the In Situ Hybridization kit-plus
(Agilent Technologies) and following the 60-mer oligo microarray processing protocol
(Agilent Technologies). Then, slides were washed with the SSC wash procedure (Agilent
Technologies) and scanned with the dual-laser microarray scanner Agilent B (Agilent
Technologies) at 5 µm resolution. Feature extraction and data normalization were
performed with the Agilent Feature Extraction software.
Data analysis
Raw result files were then loaded into the Resolver SE System (Rosetta Biosoftware,
Seattle, WA, USA) for data processing and normalization using the Agilent platform-
specific error model. Replicated expression profiles were combined to form ratio
experiments where each gene is associated to an expression fold-change and a p-value
that assesses the statistical significance of its modulation in the treated sample compared
to the control reference. Sequences with absolute fold-change ≥ 2 and p-value ≤ 0.001
were considered as differentially expressed.
For all selected genes, information were obtained from the NCBI websites UniGene,
OMIM and PubMed (www.ncbi.nlm.nih.gov). All the details about the microarrays and
data on gene expressions have been deposited in NCBIs Gene Expression Omnibus, and
Page 7 of 46
Copyright Information

8
are accessible through GEO Series accession number GSE7222
(www.ncbi.nlm.nih.gov/geo/).
Reverse Transcription-Polymerase Chain reaction (RT-PCR) analysis of mRNA
expression
NAD(P)H:quinone oxidoreductase (NQO1), Heme Oxygenase 1 (HO-1), Thioredoxin
reductase 1 (TR), and glutathione-S-transferase (GST) genes were validated using the
End-Point RT-PCR Assay, designed for conventional gel-based detection (Superarray,
Frederick, MD, USA). Total RNA was extracted as previously reported. cDNA was
synthesized from 1 µg of total RNA using the ReactionReady™ First Strand cDNA
Synthesis Kit, according to manufacturer’s direction (Superarray). cDNA was reverse
transcribed at 37°C for 60 min, finally the reaction was stopped by heating at 95° for 5
min. To ensure optimal results, two different dilutions (1:5 e 1:10) of cDNA were
prepared from each samples. PCR reaction was carried out in 25 µl volume containing
ReactionReady™ HotStart Sweet PCR master mix (10 mM Tris-HCl: 50 mM KCl, 1.5
mM MgCl2, 0.2 mM dNTPs and Taq DNA polymerase), 0.4 µM of each primer
(Superarray) and 1 µl diluted cDNA. The cDNA amplification was started by
denaturating the samples for 10 min at 95°C, followed by 35 cycles of 15 s at 95°C, 30 s
at 55°C and 30 s at 72°C. Finally, samples were held at 72°C for 7 min to ensure the
complete extension of the PCR products. Fragments size were predicted on the basis of
the mRNA sequence as reported in Table 1.
Page 8 of 46
Copyright Information

9
6 µL of the amplified products were separated by electrophoresis on 10% polyacrylamide
gel in TBE buffer (pre-cast gel, Bio-Rad). The bands were stained with ethidium bromide
and visualized under UV light using a Versa-Doc 4000 Imaging system (Bio-Rad).
NAD(P)H:quinone oxidoreductase enzymatic activity assay
NQO1 enzymatic activity was measured as described previously (40). Briefly,
cardiomyocytes were plated in 96-well plates (2.5x10³ cells/well) and grown under
normal condition until confluence. The plates were treated with Q for 6, 12 and 24 h, then
lysated with a solution containing 0.8% digitonin. 200 µL of reaction mix (0.025 mM
Tris-HCl, 0.67 mg/mL bovine serum albumin, 0.01% Tween-20, 5µM FAD, 1 mM
glucose 6-phosphate, 30 µM NADP, 2 U/mL yeast glucose-6-phosphate dehydrogenase,
0.3 mg/mL MTT, 50 µM menadione) were added to each well and the reaction was
arrested after 5 min by the addition of a solution containing 0.3 mM dicoumarol, 0.5%
DMSO and 5 mM potassium phosphate buffer. The plates were then scanned at 610 nm
with a microplate spectrophotometer VICTOR3 V™ Multilabel Counter (Perkin Elmer).
NOQ1 activity was expressed as nmol x min-1 x mg protein-1.
Total glutathione S-Transferase enzymatic activity assay
Total GST activity was assayed using CDNB according to the procedure of Habig et al.
(15). This assay measures the total GST activity because all the different GST isoforms
catalyze the conjugation of GSH with CDNB (16). After Q treatment, cells were lysated
with CelLytic M, and centrifuged (10,000 x g for 10 min). 10 µL of supernatant were
added to 990 µL of reaction mix (100 mM phosphate buffer pH 6.5 with 1 mM EDTA, 2
Page 9 of 46
Copyright Information

10
mM GSH, 2 mM CDNB) and absorbance was read at 340 nm at 30 sec intervals over 5
minutes. GST activity was expressed as nmol x min-1 x mg protein-1.
Thioredoxin Reductase enzymatic activity assay
TR activity was assayed by an in vitro reduction of DTNB to 5’-thionitrobenzoic acid
(TNB) using a procedure adapted from Holmgren and Bjornstedt (19). Briefly, after Q
treatment, cells were lysated with CelLytic M, centrifuged at 10,000 x g for 10 min and
10 µL of supernatant was added to 990 µl of reaction mix (0.25 mM DTNB, 0.24 mM
NADPH, 10 mM EDTA, 100 mM phosphate buffer pH 7.5). The conversion of DTNB to
TNB was measured spectrophotometrically at 412 nm at 10 sec intervals over 1 min.
GST activity was expressed as mU/mg protein. 1 unit of thioredoxin reductase will cause
an increase in A412 of 1.0 per minute per mL (when measured in a non-coupled assay
containing DTNB alone) at pH 7.0 at 25 °C.
Heme Oxygenase activity assay
HO-1 activity was determined as reported in (3) with slightly modification. Briefly, cells
were lysated with CelLytic M, centrifuged (10,000 x g for 10 min) and 30 µL of
supernatant were added to 70 µL of iron-detection reagent (6.5 mM ferrozine, 6.5 mM
neocuproine, 2.5 M ammonium acetate, and 1 M ascorbic acid). The incubation was
carried out for 30 min at 37 °C and the absorbance was measured at 540 nm on a
microplate reader. The iron content of the sample was calculated comparing its
absorbance to that of a standard curve obtained with FeCl3, and normalized against the
protein concentration.
Page 10 of 46
Copyright Information

11
Protein concentration
The protein concentration of the cell lysates was determined by the Bio-Rad Bradford
protein assay (Bio-Rad Laboratories, Hercules, CA, USA).
Reduced glutathione levels
Reduced glutathione levels were determined with a fluorometric assay. GSH is
specifically conjugated with MCB to form a fluorescent bimane–GSH adduct, in a
reaction catalyzed by glutathione S-transferase (45). The concentration of the bimane–
GSH adducts increases during the initial 10- to 12-min period of this reaction with first-
order kinetic, before leveling off (66). After Q treatment, culture medium was removed
and cells were washed twice with 0.2 mL PBS and incubated for 30 min at 37°C in 0.1
mL fresh PBS containing 50 µM MCB. After incubation, fluorescence was measured at
355 nm (excitation) and 460 nm (emission) with a microplate spectrofluorometer.
Reduced glutathione levels were expressed as percentage of control cells (control
cells=100%).
Detection of intracellular reactive oxygen species
The formation of intracellular ROS was evaluated using a fluorescent probe, DCFH-DA,
as described by Wang et al. (57). Briefly, cardiomyocytes were treated for 6, 12, and 24 h
with 30 µM Q. The cells were washed with PBS and then incubated with 5 µM DCFH-
DA in PBS for 30 min. After DCFH-DA removal and further washing, the cells were
incubated with 100 µM H2O2 for 30 min. At the end of incubation, cell fluorescence from
Page 11 of 46
Copyright Information

12
each well was measured using a microplate spectrofluorometer VICTOR3 V™
Multilabel Counter (Perkin Elmer, Wellesley, MA, USA) (λexcitation=485 nm and
λemission=535 nm). Intracellular antioxidant activity was expressed as the percentage of
inhibition of intracellular ROS produced by H2O2 exposure.
Cell viability measurement
Cardiomyocyte viability in the presence of Q was measured using the MTT assay. After
the treatment for 6, 12 and 24 h with 30 µM Q, cells were washed twice with PBS and
exposed to 100 µM H2O2 for 30 min. Controls received equivalent volumes of DMSO
(vehicle). Cellular damage elicited by H2O2 treatment was evaluated by measuring MTT
reduction. MTT was added to the medium (final concentration 0.5 mg/mL) and incubated
for 1 h at 37°C. After incubation, MTT solutions were removed, DMSO was added and
the absorbance was measured at 595 nm using a microplate spectrophotometer VICTOR3
V™ Multilabel Counter (Perkin Elmer). Data were expressed as percent of viable cells
with respect to controls.
Statistics
Each experiment was performed at least four times, and all values are represented as
means ± SD. Student’s t-test was used to analyze a statistical significance of the results
(Prism 4, GraphPad Software Inc., San Diego, CA, U.S.A.). Values of p<0.05 were
considered as statistically significant.
Page 12 of 46
Copyright Information

13
RESULTS
Modulation of gene expression by Q
Q treatment did not alter the expression of most of the ~22.000 studied genes. A total of
91 genes (Fig. 1) were up- or down regulated with most of the genes significantly
changed after 6 h treatment. The number of the up-regulated genes was greater than that
of the down regulated. A total of 8 genes were up-regulated at any time exposure, but
only 2 genes were up-regulated following both 6 and 12 h treatment and 1 gene following
12 and 24 h treatment (Fig. 1 A). The overlapping region of the Venn diagram of Fig. 1 B
shows that there were no down-regulated genes shared by 6, 12 and 24 h Q treatment.
Eleven genes were modulated in both the 12 and 24 h treatment. Fig. 2 shows the
hierarchical clustering display of data for treated cardiomyocytes based on the 91 filtered
genes. Each gene is represented by a single row of colored bars. The genes were grouped
into 4 main clusters. Cluster number 1 shows a gene up-regulation only after 6 h Q
treatment, while the expression level profile was not significantly different from control
cells at 12 and 24 h Q treatment. Cluster 2 evidences an induced gene expression at each
treatment time. Cluster 3 shows a gene down-regulation at 12 and 24 h while cluster 4
shows a down regulation only at the shortest treatment time.
Table 2 shows the list of the significant up- or down-regulated genes in cardiomyocytes
treated with 30 µM Q for 6, 12 and 24 h, related to their function. We focused our
attention on genes codifying for antioxidant/detoxification enzymes. Interestingly most of
these genes belong to cluster 2, underlying a common functional regulation. In particular
we have chosen 6 genes critically involved in antioxidant/detoxification mechanisms
related to cell survival: NQO1, HO-1, TR, GSTa3, Mgst1, GSTp2.
Page 13 of 46
Copyright Information

14
To verify the accuracy and validity of the array data obtained for the 6 selected genes, we
performed RT-PCR in independent samples. Gene expression levels, reported in Fig. 3,
are in agreement with the changes of gene expression observed in the microarray data.
Effects of Q on NQO1, HO-1, TR, total GST activities and cellular GSH content
NQO1, HO1, TR, total GST activities in cardiomyocytes treated with Q are shown in Fig.
4. The activities of all the 4 enzymes significantly increased at any exposure time
compared to control cells. The increase in activities, although different in magnitude, is in
agreement with the up-regulation of the corresponding genes at any treatment time.
Fig. 5 represents GSH levels in cultured cardiomyocytes treated with Q. GSH levels
significantly increased after 12 and 24 h Q treatments, with the highest increase at the
longest time exposure. After 6 h treatment no differences in GSH levels were observed in
respect to control cells. This increase is in agreement with the increased expression of the
gene codifying for the glutamate-cysteine ligase catalytic subunit as obtained by
microarray data analysis.
Q reduces ROS accumulation induced by H2O2
To verify whether antioxidant genes up regulated by Q can influence cell ability to
counteract oxidative stress, we verified the effect of Q treatment on ROS production
induced by H2O2. A significantly increased formation of ROS, as detected by DCFH-DA
assay, was observed in cells exposed to H2O2 (Fig. 6). ROS levels were markedly
reduced in Q treated cells at any exposure time, with the highest inhibition after 24h
treatment.
Page 14 of 46
Copyright Information

15
Q protects against H2O2-induced damage
To verify whether the up-regulation of antioxidant genes after Q treatment could lead to
cell protection against oxidative damage, we determined cell viability after exposure to
H2O2. Incubation of cardiomyocytes with H2O2 led to a significant decrease in cell
viability, as detected by MTT reduction assay (Fig. 7). Q is responsible for a marked
protection at all the treatment time, as cell viability levels of Q treated cardiomyocytes
were comparable to controls.
Page 15 of 46
Copyright Information

16
DISCUSSION
Many evidences underline a critical role for oxidative stress in the development of
various forms of cardiovascular disorders, including myocardial ischemia-reperfusion
injury, congestive heart failure, coronary arterial atherosclerosis, and chemical induced
cardiotoxicity (21, 29, 47, 52, 58). In this context, administration of some exogenous
antioxidants, such as flavonoids, has been shown to exert protective effects against
oxidative stress in different “in vitro” and “in vivo” models (1, 5, 11, 23, 26, 29, 59). The
ability of flavonoids to protect cardiac cells has been classically ascribed to their
antioxidant activity as ROS scavengers. Recently it has been demonstrated that
flavonoids are also able to modulate important signaling pathways activated by ROS in
cardiac myocytes, namely the mitogen-activated protein kinase cascades and the
phosphoinositide 3-kinase/protein kinase B (Akt) pathway (5, 55, 59). One of the major
representatives of flavonoids is Q, found in many edible plants. In Western populations
the intake has been estimated as 18 mg/day (41). The potential protective effects of Q
have been documented in various studies (5, 36). However, the exact mechanisms
underlying Q protective effects in cardiac cells remain to be elucidated. To better clarify
these aspects, we have evaluated the ability of Q to modulate the cardiomyocyte global
gene expression. Microarray technology was used to determine the expression levels of
22,000 genes after Q treatment. Since dietary components can also modify the translation
of RNA to proteins and the post-translational events, which can affect protein activity, we
have also evaluated the activity of the enzymes coded by the selected genes. Moreover,
Page 16 of 46
Copyright Information

17
we have evaluated the existence of a time dependent relationship between induced
enzyme activities and ability of Q to protect cells from H2O2 elicited damage.
The results of this study demonstrated for the first time the predominant induction of
antioxidant/detoxifying genes in cardiomyocytes after treatment. In particular, a group of
cellular antioxidant/phase 2 enzymes was significantly up-regulated, including GSTa3,
GSTp2, Mgst1, NQO1, TR, HO-1, glutamate-cysteine ligase. Interestingly, the
hierarchical cluster analysis obtained with the microarray data revealed that all these
genes were classified in the same cluster, evidencing a similar time dependent regulation
pattern of expression and highlighting a possible common functional regulation. NQO1,
HO, TR, and GST activities and GSH content are critically involved in the regulation of
cellular reduction/oxidation status, and have been suggested to play important roles in
protecting against oxidative cardiovascular pathophysiology (16, 23, 46, 60).
Surprisingly, Q treatment significantly down-regulated metallothionein 1a (Mt1a) and
metallothionein 2 (MT-2) gene expressions after 12 and 24 h. Other Authors
demonstrated that Mt1a and MT-2 mRNA levels were enhanced by Q treatment in
different cell systems. These discrepancies are due to the use of DMSO as vehicle for Q.
DMSO is a potent inducer of Mt1a and MT-2 mRNA transcription, as reported by
Conklin et al. (10), who also demonstrated that MT levels in DMSO plus Q treated cells
were indistinguishable from levels in their respective controls. As we performed
competitive microarrays in which control and treated cells are hybridized on the same
microarray, the observed down-regulation of Mt1a and MT-2 was only apparent. From
the data reported in this paper it is not possible to speculate about the ability of Q to
Page 17 of 46
Copyright Information

18
modulate MT gene expression in the heart. Further studies, specifically targeted to
flavonoid modulation of MT expression levels are necessary to clarify this aspect.
Although it has been previously demonstrated that Q is capable of inducing several genes
encoding for endogenous antioxidants and phase 2 enzymes in transformed cells (31, 32),
the inducibility of these important antioxidant-related genes has not yet been reported in
normal cells.
Regulation of the cellular reduction/oxidation (redox) balance is critically determined by
several antioxidant systems and its impairment alters multiple cell pathways. The
ubiquitously expressed thiol-reducing systems include the thioredoxin (TRX),
glutaredoxin, and glutathione systems (35, 39). TRX is a small and ubiquitously
expressed thiol-disulfide oxidoreductase, and functions as an important redox regulator in
cells from Escherichia coli to mammals (18, 34). The reduction of the catalytic center in
TRX is catalyzed by TR, using NADPH as cofactor. TRX functions as scavenger for
ROS at the cellular level (2). In addition, TRX interacts with various proteins in a redox
dependent manner, and modulates intracellular signaling pathways and transcription
factor activity (44, 62). Turoczi et al. (51) showed that TRX-over-expressing mouse
hearts had improved post-ischemic ventricular recovery and reduced myocardial infarct
size compared to normal hearts. It has been demonstrated that TRX overexpression in
adult rat cardiomyocytes prevents α-adrenergic receptor-stimulated hypertrophy (22),
suggesting a protective role of endogenous TRX in failing heart. Our results evidenced a
marked up-regulation of TR after Q treatment contributing to explain the ability of this
flavonoids to protect cardiomyocytes from oxidative stress.
Page 18 of 46
Copyright Information

19
Glutathione is the major non enzymatic regulator of intracellular redox homeostasis,
ubiquitously present in all cell types at millimolar concentration (27). It is synthesized
enzymatically by glutamate-cysteine ligase and glutathione synthetase, with the former
being the rate-limiting enzyme (24). Glutathione exists in cell both in reduced (GSH) and
oxidized (GSSG) forms. Under normal cellular redox conditions, the major portion is in
reduced form. Our data showed both a significant up-regulation of glutamate-cysteine
ligase expression level and a marked increase of GSH content after Q treatment,
indicating a clear role of Q in increasing thiol-related compound levels. Thus, our results
strongly suggest that the elevation of GSH by Q is probably due to an induction of
glutamate-cysteine ligase and not of glutathione reductase, the enzyme responsible for the
production of GSH from GSSG. In fact, we have not evidenced any significant up-
regulation of glutathione reductase after Q treatment. Accordingly, Myhrstad et al. (33)
have shown that Q is able to increase the intracellular concentration of GSH by
approximately 50% in COS-1 cells. They also demonstrated that Q increased the
expression of both the regulatory and the catalytical subunit of glutamate-cysteine ligase.
In a recent study, Q and other flavonoids were found to efficiently protect neuronal cells
from oxidative glutamate toxicity and other forms of oxidative injury (20). Interestingly,
the increased production of GSH was one of three mechanisms suggested by the Authors
for the protective effects of Q (20).
GSH is also a cofactor for GST, an abundant cellular enzyme in mammalian tissues. GST
is generally viewed as a phase 2 enzyme, primarily involved in the detoxification of
electrophilic xenobiotics through the formation of GSH–electrophile conjugates (17, 48).
Recently, several studies have also reported that GST plays an important role in
Page 19 of 46
Copyright Information

20
protecting cells against ROS-mediated injury catalyzing the decomposition of lipid
hydroperoxides generated from oxidative damage of cellular lipids (61, 63).
In this study we have demonstrated the induction of GST by Q in cardiomyocytes, which
may contribute to the increased cell resistance to H2O2-elicited toxicity.
The observed strong induction of NQO1 by Q may also be involved in the cytoprotective
effects on H2O2-induced cytotoxicity. In this context, NQO1 may act as an antioxidant
enzyme via its ability to maintain the cellular levels of ubiquinol and vitamin E, two
important non-protein antioxidants (42).
HO catalyzes the rate limiting step in the heme degradation yielding to biliverdin, carbon
monoxide (CO) and free iron. Biliverdin is subsequently reduced to bilirubin by
biliverdin reductase. Three isoforms of HO have been characterized: the inducible HO-1,
the constitutive HO-2, and the recently cloned HO-3, which is only marginally active in
heme degradation (43). In this study we demonstrated the ability of Q to induce HO-1
gene expression and to increase HO activity. HO-1 is also one of the heat shock proteins
(HSP32) and is highly up-regulated by various factors causing oxidative stress such as
heat shock, cytokines, hypoxia, and ischemia/reperfusion (25, 49, 56). The induction of
HO-1 is considered beneficial, as it may protect against apoptotic cell death in fibroblasts
and endothelial cells (8, 12, 38). Moreover, HO-1 deficient mice developed larger
myocardial infarcts in response to hypoxia, whereas cardiac-specific HO-1
overexpression has been shown to protect against ischaemia-reperfusion injury (64, 65).
Clark et al. (9) demonstrated that HO-1 upregulation before ischemia ameliorates
myocardial function and reduces infarct size on reperfusion of isolated rat hearts.
Page 20 of 46
Copyright Information

21
Previous studies have demonstrated that Q is able to protect H9c2 cardiomioblasts against
oxidative stress, not only by a direct antioxidant mechanism, but also through the
modulation of pro-survival protein kinases, such as Akt/PKB and ERK1/2 (5). The data
here presented complete these findings showing also the enhancement of
antioxidant/detoxifying enzyme activities by Q.
Considering the ability of Q to increase GST, NQO1, TR, HO activities and GSH
content, important cellular defenses against oxidative stress, we investigated whether
their induction after Q treatment leads to protection against ROS-mediate cytotoxicity.
The results clearly showed that treatment of cardiomyocytes with Q resulted in a
complete protection against H2O2 mediated cytotoxicity and intracellular accumulation of
ROS already at the shortest treatment time.
The protective role of Q against H2O2 toxicity at short exposure times could be ascribed
to its well known antioxidant activity. The ability to decrease ROS levels and maintain
cell viability also at longer times could be due to both modulation of intracellular
signaling pathways, as previously demonstrated (5), and regulation of some important
phase 2 enzymes, evidencing its indirect antioxidant activity. These results suggest that
cardiac cells exposed to Q through diet may be protected against oxidative stress, having
higher levels of phase 2 detoxifying enzymes. In conclusion, cardiomyocytes could be
better prepared to subsequent toxic insults after Q nutritional intake. In particular Q
intake may have a role in the counteraction and prevention of cardiac stress related to
diseases.
Page 21 of 46
Copyright Information

22
GRANTS
Supported by MIUR (Italy) and Fondazione del Monte di Bologna e Ravenna (Italy).
Page 22 of 46
Copyright Information

23
REFERENCES
1. Agnetti G, Bordoni A, Angeloni C, Leoncini E, Guarnieri C, Caldarera CM,
Biagi PL, Hrelia S. Green tea modulation of inducible nitric oxide synthase in
hypoxic/reoxygenated cardiomyocytes. Biochimie 87: 457-460, 2005.
2. Ago T, Yeh I, Yamamoto M, Schinke-Braun M, Brown JA, Tian B,
Sadoshima J. Thioredoxin1 upregulates mitochondrial proteins related to oxidative
phosphorylation and TCA cycle in the heart. Antioxid Redox Signal 8: 1635-1650, 2006.
3. Akins R, Jr., McLaughlin T, Boyce R, Gilmour L, Gratton K. Exogenous
metalloporphyrins alter the organization and function of cultured neonatal rat heart cells
via modulation of heme oxygenase activity. J Cell Physiol 201: 26-34, 2004.
4. Alameddine FM, Zafari AM. Genetic polymorphisms and oxidative stress in
heart failure. Congest Heart Fail 8: 157-164, 172, 2002.
5. Angeloni C, Spencer JP, Leoncini E, Biagi PL, Hrelia S. Role of quercetin and
its in vivo metabolites in protecting H9c2 cells against oxidative stress. Biochimie 89: 73-
82, 2007.
6. Arts IC, Hollman PC. Polyphenols and disease risk in epidemiologic studies. Am
J Clin Nutr 81: 317S-325S, 2005.
7. Bordoni A, Biagi PL, Rossi CA, Hrelia S. Alpha-1-stimulated phosphoinositide
breakdown in cultured cardiomyocytes: diacylglycerol production and composition in
docosahexaenoic acid supplemented cells. Biochem Biophys Res Commun 174: 869-877,
1991.
Page 23 of 46
Copyright Information

24
8. Brouard S, Otterbein LE, Anrather J, Tobiasch E, Bach FH, Choi AM,
Soares MP. Carbon monoxide generated by heme oxygenase 1 suppresses endothelial
cell apoptosis. J Exp Med 192: 1015-1026, 2000.
9. Clark JE, Foresti R, Sarathchandra P, Kaur H, Green CJ, Motterlini R.
Heme oxygenase-1-derived bilirubin ameliorates postischemic myocardial dysfunction.
Am J Physiol Heart Circ Physiol 278: H643-651, 2000.
10. Conklin DR, Tan KH, Aschner M. Dimethyl sulfoxide, but not acidosis-induced
metallothionein mRNA expression in neonatal rat primary astrocyte cultures is inhibited
by the bioflavonoid, quercetin. Brain Res 794: 304-308, 1998.
11. Cuzzocrea S, Riley DP, Caputi AP, Salvemini D. Antioxidant therapy: a new
pharmacological approach in shock, inflammation, and ischemia/reperfusion injury.
Pharmacol Rev 53: 135-159, 2001.
12. Ferris CD, Jaffrey SR, Sawa A, Takahashi M, Brady SD, Barrow RK, Tysoe
SA, Wolosker H, Baranano DE, Dore S, Poss KD, Snyder SH. Haem oxygenase-1
prevents cell death by regulating cellular iron. Nat Cell Biol 1: 152-157, 1999.
13. Givertz MM, Colucci WS. New targets for heart-failure therapy: endothelin,
inflammatory cytokines, and oxidative stress. Lancet 352 Suppl 1: SI34-38, 1998.
14. Griendling KK, FitzGerald GA. Oxidative stress and cardiovascular injury: Part
II: animal and human studies. Circulation 108: 2034-2040, 2003.
15. Habig WH, Pabst MJ, Jakoby WB. Glutathione S-transferases. The first
enzymatic step in mercapturic acid formation. J Biol Chem 249: 7130-7139, 1974.
16. Hayes JD, Flanagan JU, Jowsey IR. Glutathione transferases. Annu Rev
Pharmacol Toxicol 45: 51-88, 2005.
Page 24 of 46
Copyright Information

25
17. Hayes JD, Pulford DJ. The glutathione S-transferase supergene family:
regulation of GST and the contribution of the isoenzymes to cancer chemoprotection and
drug resistance. Crit Rev Biochem Mol Biol 30: 445-600, 1995.
18. Holmgren A. Thioredoxin and glutaredoxin systems. J Biol Chem 264: 13963-
13966, 1989.
19. Holmgren A, Bjornstedt M. Thioredoxin and thioredoxin reductase. Methods
Enzymol 252: 199-208, 1995.
20. Ishige K, Schubert D, Sagara Y. Flavonoids protect neuronal cells from
oxidative stress by three distinct mechanisms. Free Radic Biol Med 30: 433-446, 2001.
21. Kang YJ. New understanding in cardiotoxicity. Curr Opin Drug Discov Devel 6:
110-116, 2003.
22. Kuster GM, Pimentel DR, Adachi T, Ido Y, Brenner DA, Cohen RA, Liao R,
Siwik DA, Colucci WS. Alpha-adrenergic receptor-stimulated hypertrophy in adult rat
ventricular myocytes is mediated via thioredoxin-1-sensitive oxidative modification of
thiols on Ras. Circulation 111: 1192-1198, 2005.
23. Lefer DJ, Granger DN. Oxidative stress and cardiac disease. Am J Med 109:
315-323, 2000.
24. Lu SC. Regulation of hepatic glutathione synthesis. Semin Liver Dis 18: 331-343,
1998.
25. Maines MD. The heme oxygenase system: a regulator of second messenger
gases. Annu Rev Pharmacol Toxicol 37: 517-554, 1997.
26. Marchioli R. Antioxidant vitamins and prevention of cardiovascular disease:
laboratory, epidemiological and clinical trial data. Pharmacol Res 40: 227-238, 1999.
Page 25 of 46
Copyright Information

26
27. Meister A, Anderson ME. Glutathione. Annu Rev Biochem 52: 711-760, 1983.
28. Mennen LI, Sapinho D, de Bree A, Arnault N, Bertrais S, Galan P, Hercberg
S. Consumption of foods rich in flavonoids is related to a decreased cardiovascular risk in
apparently healthy French women. J Nutr 134: 923-926, 2004.
29. Molavi B, Mehta JL. Oxidative stress in cardiovascular disease: molecular basis
of its deleterious effects, its detection, and therapeutic considerations. Curr Opin Cardiol
19: 488-493, 2004.
30. Moon SK, Cho GO, Jung SY, Gal SW, Kwon TK, Lee YC, Madamanchi NR,
Kim CH. Quercetin exerts multiple inhibitory effects on vascular smooth muscle cells:
role of ERK1/2, cell-cycle regulation, and matrix metalloproteinase-9. Biochem Biophys
Res Commun 301: 1069-1078, 2003.
31. Moon YJ, Wang X, Morris ME. Dietary flavonoids: effects on xenobiotic and
carcinogen metabolism. Toxicol In Vitro 20: 187-210, 2006.
32. Murtaza I, Marra G, Schlapbach R, Patrignani A, Kunzli M, Wagner U,
Sabates J, Dutt A. A preliminary investigation demonstrating the effect of quercetin on
the expression of genes related to cell-cycle arrest, apoptosis and xenobiotic metabolism
in human CO115 colon-adenocarcinoma cells using DNA microarray. Biotechnol Appl
Biochem 45: 29-36, 2006.
33. Myhrstad MC, Carlsen H, Nordstrom O, Blomhoff R, Moskaug JO.
Flavonoids increase the intracellular glutathione level by transactivation of the gamma-
glutamylcysteine synthetase catalytical subunit promoter. Free Radic Biol Med 32: 386-
393, 2002.
Page 26 of 46
Copyright Information

27
34. Nakamura H, Nakamura K, Yodoi J. Redox regulation of cellular activation.
Annu Rev Immunol 15: 351-369, 1997.
35. Nordberg J, Arner ES. Reactive oxygen species, antioxidants, and the
mammalian thioredoxin system. Free Radic Biol Med 31: 1287-1312, 2001.
36. Perez-Vizcaino F, Duarte J, Andriantsitohaina R. Endothelial function and
cardiovascular disease: effects of quercetin and wine polyphenols. Free Radic Res 40:
1054-1065, 2006.
37. Peters U, Poole C, Arab L. Does tea affect cardiovascular disease? A meta-
analysis. Am J Epidemiol 154: 495-503, 2001.
38. Petrache I, Otterbein LE, Alam J, Wiegand GW, Choi AM. Heme oxygenase-
1 inhibits TNF-alpha-induced apoptosis in cultured fibroblasts. Am J Physiol Lung Cell
Mol Physiol 278: L312-319, 2000.
39. Powis G, Briehl M, Oblong J. Redox signalling and the control of cell growth
and death. Pharmacol Ther 68: 149-173, 1995.
40. Prochaska HJ, Santamaria AB. Direct measurement of NAD(P)H:quinone
reductase from cells cultured in microtiter wells: a screening assay for anticarcinogenic
enzyme inducers. Anal Biochem 169: 328-336, 1988.
41. Radtke J, Linseisen J, Wolfram G. Fasting plasma concentrations of selected
flavonoids as markers of their ordinary dietary intake. Eur J Nutr 41: 203-209, 2002.
42. Ross D, Kepa JK, Winski SL, Beall HD, Anwar A, Siegel D.
NAD(P)H:quinone oxidoreductase 1 (NQO1): chemoprotection, bioactivation, gene
regulation and genetic polymorphisms. Chem Biol Interact 129: 77-97, 2000.
Page 27 of 46
Copyright Information

28
43. Scapagnini G, D'Agata V, Calabrese V, Pascale A, Colombrita C, Alkon D,
Cavallaro S. Gene expression profiles of heme oxygenase isoforms in the rat brain.
Brain Res 954: 51-59, 2002.
44. Shioji K, Nakamura H, Masutani H, Yodoi J. Redox regulation by thioredoxin
in cardiovascular diseases. Antioxid Redox Signal 5: 795-802, 2003.
45. Shrieve DC, Bump EA, Rice GC. Heterogeneity of cellular glutathione among
cells derived from a murine fibrosarcoma or a human renal cell carcinoma detected by
flow cytometric analysis. J Biol Chem 263: 14107-14114, 1988.
46. Siegel D, Gustafson DL, Dehn DL, Han JY, Boonchoong P, Berliner LJ, Ross
D. NAD(P)H:quinone oxidoreductase 1: role as a superoxide scavenger. Mol Pharmacol
65: 1238-1247, 2004.
47. Stocker R, Keaney JF, Jr. Role of oxidative modifications in atherosclerosis.
Physiol Rev 84: 1381-1478, 2004.
48. Strange RC, Spiteri MA, Ramachandran S, Fryer AA. Glutathione-S-
transferase family of enzymes. Mutat Res 482: 21-26, 2001.
49. Terry CM, Clikeman JA, Hoidal JR, Callahan KS. Effect of tumor necrosis
factor-alpha and interleukin-1 alpha on heme oxygenase-1 expression in human
endothelial cells. Am J Physiol 274: H883-891, 1998.
50. Tsutsui H, Ide T, Kinugawa S. Mitochondrial oxidative stress, DNA damage,
and heart failure. Antioxid Redox Signal 8: 1737-1744, 2006.
51. Turoczi T, Chang VW, Engelman RM, Maulik N, Ho YS, Das DK.
Thioredoxin redox signaling in the ischemic heart: an insight with transgenic mice
overexpressing Trx1. J Mol Cell Cardiol 35: 695-704, 2003.
Page 28 of 46
Copyright Information

29
52. Uchida K. Role of reactive aldehyde in cardiovascular diseases. Free Radic Biol
Med 28: 1685-1696, 2000.
53. van Erk MJ, Roepman P, van der Lende TR, Stierum RH, Aarts JM, van
Bladeren PJ, van Ommen B. Integrated assessment by multiple gene expression
analysis of quercetin bioactivity on anticancer-related mechanisms in colon cancer cells
in vitro. Eur J Nutr 44: 143-156, 2005.
54. Van Gelder RN, von Zastrow ME, Yool A, Dement WC, Barchas JD,
Eberwine JH. Amplified RNA synthesized from limited quantities of heterogeneous
cDNA. Proc Natl Acad Sci U S A 87: 1663-1667, 1990.
55. Vlahos CJ, McDowell SA, Clerk A. Kinases as therapeutic targets for heart
failure. Nat Rev Drug Discov 2: 99-113, 2003.
56. Wagner CT, Durante W, Christodoulides N, Hellums JD, Schafer AI.
Hemodynamic forces induce the expression of heme oxygenase in cultured vascular
smooth muscle cells. J Clin Invest 100: 589-596, 1997.
57. Wang H, Joseph JA. Quantifying cellular oxidative stress by dichlorofluorescein
assay using microplate reader. Free Radic Biol Med 27: 612-616, 1999.
58. Wattanapitayakul SK, Bauer JA. Oxidative pathways in cardiovascular disease:
roles, mechanisms, and therapeutic implications. Pharmacol Ther 89: 187-206, 2001.
59. Williams RJ, Spencer JP, Rice-Evans C. Flavonoids: antioxidants or signalling
molecules? Free Radic Biol Med 36: 838-849, 2004.
60. World CJ, Yamawaki H, Berk BC. Thioredoxin in the cardiovascular system. J
Mol Med 84: 997-1003, 2006.
Page 29 of 46
Copyright Information

30
61. Xie C, Lovell MA, Xiong S, Kindy MS, Guo J, Xie J, Amaranth V, Montine
TJ, Markesbery WR. Expression of glutathione-S-transferase isozyme in the SY5Y
neuroblastoma cell line increases resistance to oxidative stress. Free Radic Biol Med 31:
73-81, 2001.
62. Yamawaki H, Haendeler J, Berk BC. Thioredoxin: a key regulator of
cardiovascular homeostasis. Circ Res 93: 1029-1033, 2003.
63. Yang Y, Cheng JZ, Singhal SS, Saini M, Pandya U, Awasthi S, Awasthi YC.
Role of glutathione S-transferases in protection against lipid peroxidation.
Overexpression of hGSTA2-2 in K562 cells protects against hydrogen peroxide-induced
apoptosis and inhibits JNK and caspase 3 activation. J Biol Chem 276: 19220-19230,
2001.
64. Yet SF, Perrella MA, Layne MD, Hsieh CM, Maemura K, Kobzik L, Wiesel
P, Christou H, Kourembanas S, Lee ME. Hypoxia induces severe right ventricular
dilatation and infarction in heme oxygenase-1 null mice. J Clin Invest 103: R23-29, 1999.
65. Yet SF, Tian R, Layne MD, Wang ZY, Maemura K, Solovyeva M, Ith B,
Melo LG, Zhang L, Ingwall JS, Dzau VJ, Lee ME, Perrella MA. Cardiac-specific
expression of heme oxygenase-1 protects against ischemia and reperfusion injury in
transgenic mice. Circ Res 89: 168-173, 2001.
66. Young PR, ConnorsWhite AL, Dzido GA. Kinetic analysis of the intracellular
conjugation of monochlorobimane by IC-21 murine macrophage glutathione-S-
transferase. Biochim Biophys Acta 1201: 461-465, 1994.
Page 30 of 46
Copyright Information

31
FIGURE LEGENDS
Figure 1. (A) Number of up-regulated genes (FoldChange ≥ 2) in cardiomyocytes treated
with 30 µM Q for 6, 12 and 24 h compared to the controls. (B) Number of down-
regulated genes (FoldChange ≤ -2) in cardiomyocytes treated with 30 µM Q for 6, 12 and
24 h compared to the controls. The overlapping regions denote the number of common
genes up- or down-regulated. The nonoverlapping regions denote the number of unique
genes up- or down-regulated.
Figure 2. Hierarchical clustering display of data in cardiomyocytes treated with 30 µM Q
for 6, 12 and 24 h based on the significant 91 genes. The clustering display was
performed using Rosetta Resolver SE software as reported in Methods. Each gene is
represented by a single row of colored bars. The red color indicates up-regulation of the
gene expression and the green color denotes the down-regulation of the gene expression
compared to the controls.
Figure 3. Gene expression levels of NQO1 (A), HO-1 (B), TR (C), GSTa3 (D), Mgst1
(E), and GSTp2 (F) in cardiomyocytes. Cardiomyocytes were treated with 30 µM Q for
6, 12 and 24 h and gene expression was obtained by RT-PCR, as reported in Methods,
and reported as fold change relative to the control (not-treated) cells after normalization
using the GADP gene expression level. Data are means ± S.D. of four different cell
cultures. Statistical analysis was performed by the Student’s t test comparing
cardiomyocytes treated with Q with control cardiomyocytes: * at least p < 0.05.
Page 31 of 46
Copyright Information

32
Figure 4. Effect of Q treatment on NQO1 (A), HO (B), TR (C) and GST (D) activities in
cardiomyocytes. Cardiomyocytes were treated with 30 µM Q for 6, 12 and 24 h and
enzyme activities were evaluated as reported in Methods. Data are means ± S.D. of four
different cell cultures. Statistical analysis was performed by the Student’s t test
comparing cardiomyocytes treated with Q with control cardiomyocytes: * at least p <
0.05.
Figure 5. Effects of Q treatment on GSH levels. Cardiomyocytes were treated with 30
µM Q for 6, 12 and 24 h and GSH level was determined using the fluorescent probe
MCB as reported in Methods. Data are expressed as % GSH level in comparison to
controls. Data are means ± S.D. of four different cell cultures. Statistical analysis was
performed by the Student’s t test comparing cardiomyocytes treated with Q with control
cardiomyocytes: * at least p < 0.05.
Figure 6. Effect of Q treatment on intracellular ROS production. Cardiomyocytes were
treated with 30 µM Q for 6, 12 and 24 h before the addition of H2O2 (100 µM, 30 min)
and then the level of intracellular ROS was determined using the peroxide-sensitive
fluorescent probe DCFH-DA as reported in Methods. Data are expressed as % inhibition
of ROS produced compared to H2O2 exposure. Data are means ± S.D. of four different
cell cultures. Statistical analysis was performed by the Student’s t test: * at least p<0.05
in comparison to H2O2 exposed cells.
Page 32 of 46
Copyright Information

33
Figure 7. Protection against peroxide-induced cell damage by Q. Cardiomyocytes were
treated with 30 µM Q for 6, 12 and 24 h before the addition of H2O2 (100 µM, 30 min)
and cellular damage was assessed by the MTT assay and reported as % cell viability in
comparison to controls. Data are means ± S.D. of four different cell cultures. Statistical
analysis was performed by the Student’s t test: * at least p<0.05 in comparison to H2O2
exposed cells.
Page 33 of 46
Copyright Information

34
TABLE LEGENDS
Table 1. Primers used in RT-PCR.
Table 2. Up-regulated (≥2.0 fold) and down-regulated (≤-2.0 fold) genes in
cardiomyocytes treated with Q for 6, 12 and 24 h.
Page 34 of 46
Copyright Information

Gene RefSeq Accession # 2 Amplicon (bp)
GSTa3 NM_031509 124
Mgst1 NM_134349 96
GSTp2 NM_138974 61
NQO1 NM_017000 137
TR NM_031614 87
HO-1 NM_012580 95
GADP J04038 390
1 Internal normalizer.
2 NCBI Nucleotide Sequence Database accession number.
Page 35 of 46
Copyright Information

GenBank Fold Change Gene Name Cluster
6 h 12 h 24 h
Signal transduction
NM_017327 2.3 1.2 -1.4 Guanine nucleotide binding protein 1
BU671109 2.1 -1.1 -1 Similar to Mouse zinedin (Zin) (EST) 1
BF400606 1.2 1.5 2.3 Sequestosome 1 (Sqstm1) 4
Cell cycle
CA511295 2.3 1.4 1.1 Similar to Retinoblastoma-binding protein 2 (RBBP-2) 1
BQ207155 2.2 1.5 1 Similar to Retinoblastoma-binding protein 2 1
AW529579 1.7 2.3 1.5 similar to putative tumor suppressor 101F6 (LOC362017) 2
NM_138504 3.9 4.1 3.4 pregnancy-induced growth inhibitor (Okl38) 2
NM_133306 2.3 -2.6 -2.2 oxidised low density lipoprotein (lectin-like) receptor 1 3
NM_012987 1.5 -1.4 -2.5 Nestin (Nes) 3
NM_133306 2.3 -2.6 -2.2 oxidised low density lipoprotein (lectin-like) receptor 1 3
CB545890 1.1 1.1 2.1similar to dJ862K6.2.2 (splicing factor, arginine/serine-
rich 6 (SRP55-2)(isoform 2))4
AI175779 -1.1 -1.1 3 Polymerase (DNA directed), alpha 2 (Pola2) 4
NM_017105 -2.1 -1.2 1.1 bone morphogenetic protein 3 4
NM_012578 -2.8 1 1.2 Rattus norvegicus Histone H1-0 (H1f0) 4
Antioxidant /detoxification
NM_013215 1.6 2.3 1.3 aflatoxin B1 aldehyde reductase 2
S82820.1 2.6 4.6 4.1 GSTA5=glutathione S-transferase Yc2 2
NM_138974 3.1 5 2.5 glutathione S-transferase, pi 2 2
BQ202809 2.1 1.8 1.4 glutamate-cysteine ligase catalytic subunit 2
NM_017000 7.2 7.7 4.8 Diaphorase (NADH/NADPH) (Dia4), mRNA. 2
Page 36 of 46
Copyright Information

AA892527 1.4 1.9 2.2 similar to Glutathione S-transferase, theta 3 2
D00688.1 2.1 1.7 1.5 Rattus sp. mRNA for monoamine oxidase, partial cds. 2
NM_012940 2.0 1.5 1.4 Cytochrome P450 1b1 (Cyp1b1) 2
AA874884 3.7 1.6 1.7 heme oxygenase 2
NM_031509 3.1 5.6 5.5 glutathione S-transferase, alpha 1 2
NM_031614 2.1 1.2 1.2 thioredoxin reductase 1 2
NM_012580 2.6 1.2 1.6 heme oxygenase 1 2
NM_138826 1.76 -2.11 -3.38 metallothionein 1a (Mt1a) 3
BF556648 1.9 -2.6 -3.7 metallothionein-2 3
NM_134349 1.1 2.3 3 microsomal glutathione S-transferase 1 (Mgst1) 4
NM_138547 -2.8 -1.4 1.3 Rattus norvegicus 3-alpha-hydroxysteroid dehydrogenase 4
Receptor
NM_017333 4.5 1.4 1.1 endothelin receptor type B (Ednrb) 1
NM_031628 2.1 -1.3 -1.2 nuclear receptor subfamily 4, group A, member 3 1
M58040.1 2 1.4 -1.3 transferrin receptor, 3 end. 1
NM_013037 1.3 -2.6 -2.5 interleukin 1 receptor-like 1 3
Miscellaneous
NM_080399 2.3 3.1 2.7 Smhs1 protein (Smhs1) 2
BM386003 3.2 1.3 1 apelin, AGTRL1 ligand (EST) 1
CB606442 2 1.4 1.1 ubiquitin-conjugating enzyme E2D 1
NM_012953 3.2 -1.1 1.1 Fos-like antigen 1 (Fosl1) 1
AA818267 2 1.5 -1.1 similar to SI:dZ142B24.4) 1
NM_053420 2.3 1.4 -1.1 BCL2/adenovirus E1B 19 kDa-interacting protein 3 1
NM_030834 2.2 1.4 -1.1 monocarboxylate transporter 1
BQ210515 2.6 -1.3 -1.4 Hypoxia induced gene 1 (Hig1) (EST) 1
AA891949 2.6 -1.2 -1.5 Adenylate kinase 3-like 1 (Ak3l1) (EST) 1
AI406759 2.2 -1.1 -1.7 Similar to Human carbonate dehydratase 1
Page 37 of 46
Copyright Information

NM_013126 2.4 -3.2 -2.9 Diacylglycerol kinase 3 (gamma) (Dgkg) 1
AI044063 2.8 2.4 -1.6 similar to Mouse mRNA for IZP6 (EST) 1
CB544664 1.4 2.2 1.5 similar to phospholipase A2 2
NM_138863 3.2 5.1 3.1 dithiolethione-inducible gene-1 (Dig1) 2
NM_080399 2.3 3.1 2.7 Smhs1 protein (Smhs1) 2
BF420687 2.4 1.6 1.3 similari to protein ref:NP_000421.1 (H.sapiens 2
NM_013083 1.5 -1.3 -2 heat shock 70kD protein 5 (Hspa5) 3
BQ191772 1 -2.7 -3 similar to mouse annexin A8 3
BE126741 1.3 -2 -2.9 tenascin C 3
BM387134 1.3 -1.8 -2.8 tenascin C 3
AW531866 1.3 -1.9 -2.2 similar to mouse RIKEN cDNA 1810020G14 gene 3
AI044054 1.8 -3.3 -2 tissue factor pathway inhibitor 2 3
AJ132352.1 -1 -2.3 -1.1 Rattus norvegicus mRNA for 45 kDa secretory protein 3
BE116861 -1.1 1.3 2.2 Heterogeneous nuclear ribonucleoprotein A1 (Hnrpa1) 4
NM_080892 -2.1 1.4 1.4 Rattus norvegicus selenium binding protein 2 (Selenbp2) 4
NM_031545 -2.9 1 1.6 natriuretic peptide precursor type B 4
NM_019280 -2.4 -1.1 1.3 gap junction membrane channel protein alpha 5 4
BQ202499 -2.3 1.2 1.5 Aldo-keto reductase family 1, member E1 (predicted) 4
NM_053536 -2.5 1.1 1.6 Kruppel-like factor 15 (Klf15) 4
NM_012889 -2.4 -1.1 1.1 Vascular cell adhesion molecule 1 (Vcam1) 4
Unknown
BF523428 2.3 1.2 -1.4 similar to Mouse DNA sequence from clone RP23-40G2 1
AM:ARGI1-
037175-CYA2.1 1 -1 similar to Translation of nuc:U14172_1 Mus musculus 1
BE102806 2.2 1 -1.1 similar to Mouse DNA sequence from clone RP23-344D2 1
CA338760 2.5 1.6 1.1 similar to Mouse, ribosome binding protein 1 1
AA818967 2.3 -1 -1.4 unknown function 1
BU671646 2.8 2.1 1.3 similar to protein ref:NP_005830.1 (H.sapiens 2
BM385792 5 3.1 2.6 similar to Sulfiredoxin 1 homolog (S. cerevisiae) 2
Page 38 of 46
Copyright Information

AA875256 1.6 -1.9 -2.6 transcribed sequence 3
AI043706 1.2 -1.9 -2.2 unknown function 3
CB548350 1.1 -2.3 -2.3 Transcribed sequence 3
BF522774 -1 -2.3 -1.1 Transcribed sequence 3
AA926036 -1 -2.2 -1.1 unknown function 3
CB544646 -1 -2.1 -1 similar to NP_082393.2 dermatan-4-sulfotransferase-1 3
BM392090 -1.1 -2.7 -2.9 similar to G protein-coupled receptor family C 3
CA340365 1.1 1.2 2.2 NISC_lz02g05.y1 NCI_CGAP_Pr33 Rattus norvegicus 4
AW918961 -2 1.1 1.4 Rattus norvegicus transcribed sequences 4
AB072252.1 -1.6 1.2 2.1 Rattus norvegicus cDNA, clone:bA7, 4
BE110944 -1.7 1.8 3 Similar to NP_001809.2 aldo-keto reductase family 1 4
BQ194588 -1.1 2 1.8 similar to Blvrb protein 4
BE102241 -2 1.1 1.2 similar to Zinc finger CCCH type 4
BF557949 -2.3 1.4 1.4 similar to Protein:NP_077170 4
CA506727 -2.9 1.1 1.1 Rat clone RP31-202M22 strain Brown Norway 4
BF284739 -2.3 1.2 1.2 transcribed sequences 4
AI712694 -2.1 1.6 -1 shypothetical protein FLJ10156 4
BF283760 -2.2 -1.3 -1.1 similar to NP_034828.2 LIM domain binding 2 4
AI009713 -2.1 1.1 -1.1 unknown function 4
12847730 -2.2 -1.2 -1.2 unknown function 4
Page 39 of 46
Copyright Information

Figure 1. (A) Number of up-regulated genes (FoldChange 2) in cardiomyocytes treated with 30 µM Q for 6, 12 and 24 h compared to the controls. (B) Number of down-regulated
genes (FoldChange -2) in cardiomyocytes treated with 30 µM Q for 6, 12 and 24 h compared to the controls. The overlapping regions denote the number of common genes up- or down-regulated. The nonoverlapping regions denote the number of unique genes
up- or down-regulated. 80x53mm (600 x 600 DPI)
Page 40 of 46
Copyright Information
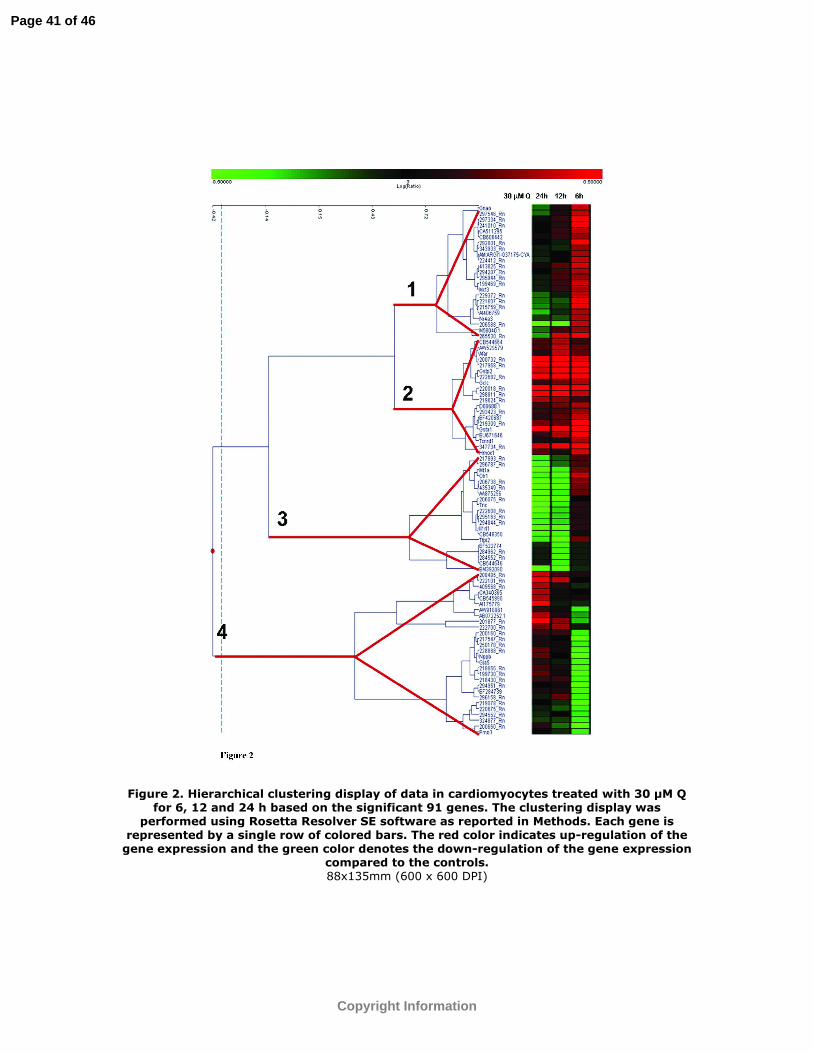
Figure 2. Hierarchical clustering display of data in cardiomyocytes treated with 30 µM Q for 6, 12 and 24 h based on the significant 91 genes. The clustering display was
performed using Rosetta Resolver SE software as reported in Methods. Each gene is represented by a single row of colored bars. The red color indicates up-regulation of the
gene expression and the green color denotes the down-regulation of the gene expression compared to the controls. 88x135mm (600 x 600 DPI)
Page 41 of 46
Copyright Information

Figure 3. Gene expression levels of NQO1 (A), HO-1 (B), TR (C), GSTa3 (D), Mgst1 (E), and GSTp2 (F) in cardiomyocytes. Cardiomyocytes were treated with 30 µM Q for 6, 12
and 24 h and gene expression was obtained by RT-PCR, as reported in Methods, and reported as fold change relative to the control (not-treated) cells after normalization
using the GADP gene expression level. Data are means ± S.D. of four different cell cultures. Statistical analysis was performed by the Student's t test comparing
cardiomyocytes treated with Q with control cardiomyocytes: * at least p < 0.05. 159x207mm (600 x 600 DPI)
Page 42 of 46
Copyright Information

Figure 4. Effect of Q treatment on NQO1 (A), HO (B), TR (C) and GST (D) activities in cardiomyocytes. Cardiomyocytes were treated with 30 µM Q for 6, 12 and 24 h and
enzyme activities were evaluated as reported in Methods. Data are means S.D. of four different cell cultures. Statistical analysis was performed by the Student's t test
comparing cardiomyocytes treated with Q with control cardiomyocytes: * at least p < 0.05.
120x120mm (600 x 600 DPI)
Page 43 of 46
Copyright Information

Figure 5. Effects of Q treatment on GSH levels. Cardiomyocytes were treated with 30 µM Q for 6, 12 and 24 h and GSH level was determined using the fluorescent probe MCB as
reported in Methods. Data are expressed as % GSH level in comparison to controls. Data are means S.D. of four different cell cultures. Statistical analysis was performed by the Student's t test comparing cardiomyocytes treated with Q with control cardiomyocytes: *
at least p < 0.05. 70x66mm (600 x 600 DPI)
Page 44 of 46
Copyright Information

Figure 6. Effect of Q treatment on intracellular ROS production. Cardiomyocytes were treated with 30 M Q for 6, 12 and 24 h before the addition of H2O2 (100 M, 30 min)
and then the level of intracellular ROS was determined using the peroxide-sensitive fluorescent probe DCFH-DA as reported in Methods. Data are expressed as % inhibition of
ROS produced compared to H2O2 exposure. Data are means S.D. of four different cell cultures. Statistical analysis was performed by the Student's t test: * at least p<0.05 in
comparison to H2O2 exposed cells. 70x59mm (600 x 600 DPI)
Page 45 of 46
Copyright Information

Figure 7. Protection against peroxide-induced cell damage by Q. Cardiomyocytes were treated with 30 M Q for 6, 12 and 24 h before the addition of H2O2 (100 M, 30 min) and cellular damage was assessed by the MTT assay and reported as % cell viability in comparison to controls. Data are means S.D. of four different cell cultures. Statistical analysis was performed by the Student's t test: * at least p<0.05 in comparison to H2O2
exposed cells. 70x75mm (600 x 600 DPI)
Page 46 of 46
Copyright Information