revisiting torsional stiffness of flexible disc couplings
TRANSCRIPT
A l t r a I n d u s t r i a l M o t i o n
Ameridrives
Bauer Gear Motor
Bibby Turboflex
Boston Gear
Delroyd Worm Gear
Formsprag Clutch
Guardian Couplings
Huco
Industrial Clutch
Inertia Dynamics
Kilian
Lamiflex Couplings
Marland Clutch
Matrix
Nuttall Gear
Stieber Clutch
Stromag
Svendborg Brakes
TB Wood’s
Twiflex Limited
Warner Electric
Warner Linear
Wichita Clutch
Revisiting Torsional Stiffness of Flexible Disc Couplings

Abstract System torsional analysis is performed by packagers and OEMs to ensure the reliable operation of assembled systems such as engine-compressor packages. This is especially critical when the prime mover or the load are reciprocating machines, with associated high levels of oscillating torque. Unexpectedly high shaft stresses are likely to occur if the frequency of the oscillating torque or multiples of it coincide with a torsional critical speed. Failure to rigorously and accurately model this behavior can result in fatigue of torque transmitting components, with disastrous results (figure 1). Flexible coupling characteristics are among the parameters used in system torsional analysis. Coupling manufacturers routinely supply weight, inertia, center of gravity, and torsional stiffness data for use by the system analyst. During the development of a new disc coupling product line, discrepancies were noted between historically and widely used coupling torsional stiffness data vs. the stiffness measured in laboratory tests. Subsequently, in-depth investigation was undertaken using FEA (Finite Element Analysis) and multiple lab tests on the proposed new coupling line, as well as on competitor couplings, in an attempt to more accurately model coupling torsional stiffness characteristics. Based on this research, new equations were derived which provide significant improvement in the accuracy of flexible disc coupling torsional stiffness calculations.
Revisiting Torsional Stiffness of Flexible Disc Couplings
FIG. 1- THE CONSEQUENCES OF A TORSIONALVIBRATION PROBLEM

NomenclatureUnits used in this paper are in the lb-inch-second system.
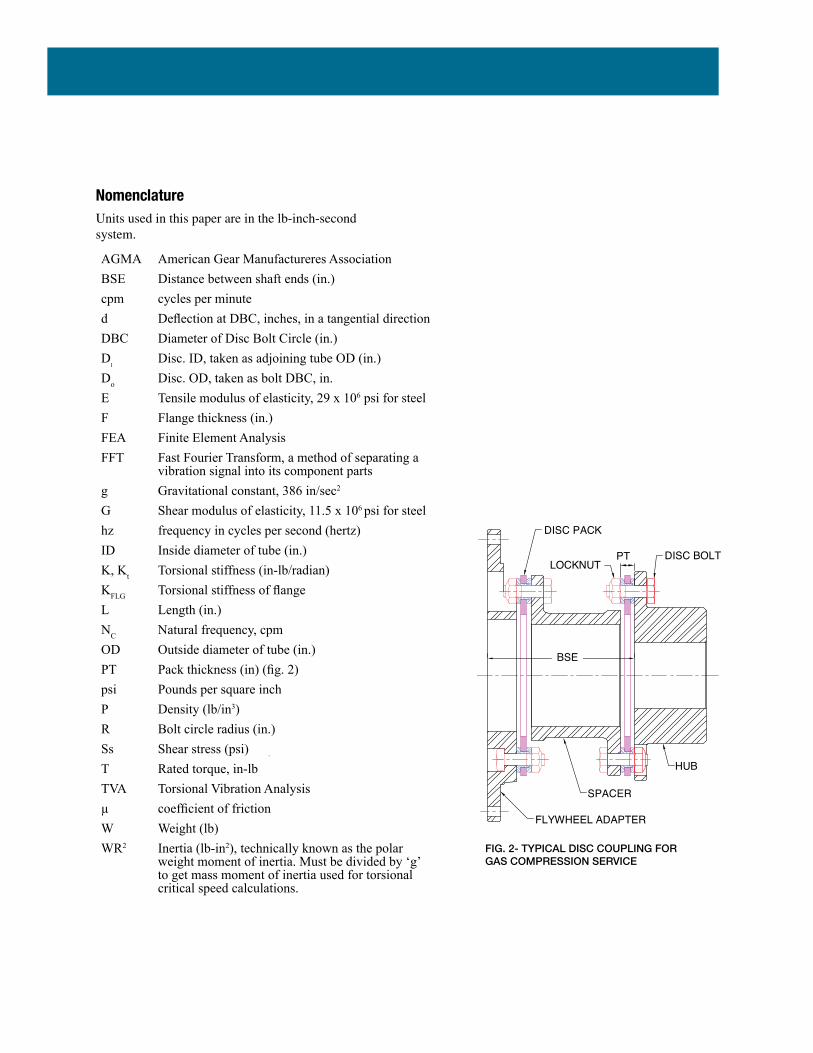
FIG. 2- TYPICAL DISC COUPLING FORGAS COMPRESSION SERVICE
AGMA American Gear Manufactureres AssociationBSE Distance between shaft ends (in.)cpm cycles per minuted Deflection at DBC, inches, in a tangential directionDBC Diameter of Disc Bolt Circle (in.)D
iDisc. ID, taken as adjoining tube OD (in.)
Do Disc. OD, taken as bolt DBC, in.E Tensile modulus of elasticity, 29 x 106 psi for steelF Flange thickness (in.)FEA Finite Element AnalysisFFT Fast Fourier Transform, a method of separating a
vibration signal into its component partsg Gravitational constant, 386 in/sec2
G Shear modulus of elasticity, 11.5 x 10⁶ psi for steelhz frequency in cycles per second (hertz)ID Inside diameter of tube (in.)K, Kt Torsional stiffness (in-lb/radian)KFLG Torsional stiffness of flangeL Length (in.)NC Natural frequency, cpmOD Outside diameter of tube (in.)PT Pack thickness (in) (fig. 2)psi Pounds per square inchP Density (lb/in3)R Bolt circle radius (in.)Ss Shear stress (psi)T Rated torque, in-lbTVA Torsional Vibration Analysisµ coefficient of frictionW Weight (lb)WR2 Inertia (lb-in2), technically known as the polar
weight moment of inertia. Must be divided by ‘g’ to get mass moment of inertia used for torsional critical speed calculations.
FLYWHEEL ADAPTER
DISC PACK
SPACER
DISC BOLT LOCKNUT
HUB
BSE
PT

FIG. 3- BREAKDOWN OF SHORT DISC COUPLINGTORSIONAL STIFFNESS BY COMPONENT(8.45” BSE, 15” OD, 6” BORE)
Introduction Coupling manufacturers have historically calculated mass-elastic data for their products by breaking the coupling components down into simple tube and disk sections, then using conventional equations to calculate the properties of the sections. For weight and inertia, the sections are summed to provide the data for the component or coupling, and, for torsional stiffness, the reciprocals of the sections are summed to obtain the reciprocal of the total stiffness. In equation form:
W = W1 + W
2 + W
3 + …. (1)
WR2 = WR21+ WR2
2 + WR2
3 + … (2)
1/K= 1/K1 + 1/K
2 + 1/K
3 + … (3)
where subscripts 1, 2, 3, … refer to the individual section numbers. Two concepts to note from the stiffness equation:
a) the total stiffness of a coupling is always less than the stiffness of the softest section or component in it
b) every section you add causes the total stiffness to decrease
A full description of the relevant calculations is provided in AGMA 9004, Flexible Couplings- Mass Elastic Properties and Other Characteristics [1].
Most, if not all, coupling manufacturers generally perform their calculations in accordance with AGMA 9004. However, AGMA 9004 pointedly avoids attempting to dictate calculation methods for torsional stiffness of flex elements and bolting, leaving these two areas to the discretion of the manufacturer. All other parts of a coupling are straightforward to analyze, providing they are cylindrical, so consistent results can be expected from various manufacturers for all parts other than flex elements, bolting, and noncylindrical parts. For relatively long couplings (say 18” or longer BSE), variations in the calculation of stiffness of flex elements and bolting have a minimal influence on the bottom line. But for the short couplings commonly used in the gas compression industry, most of the components of the coupling do have a significant effect on the total- see figure 3. Note that hub stiffness includes the use of the 1/3 shaft penetration factor which causes the shaft diameter to have a major impact on hub stiffness. Furthermore the number 1/3 must be considered a nominal value as the actual value depends on the tightness of the hub shrink and the accuracy of the key fit.
Consequently, when dealing with short couplings, variations in both manufacturing tolerances and the manufacturers’ approach to flex element and bolt stiffness calculations are likely to cause significant variations in the accuracy of the data furnished. Papers by Murray et al [2] and by Varty et al [3] point out the consequences of inaccurate mass-elastic data: the accuracy of the analysis is limited to the accuracy of its inputs. Murray and Feese [9] suggest the use of ±20% on coupling stiffness. Users should consider the confidence they have in the supplier’s modeling approach. This study focused specifically on short 8-bolt heavy-duty disc couplings as used in the gas compression industry. Other disc designs may have different characteristics.
Disc Coupling Features to Note Flexible disc couplings (figure 2) are of simple construction and have been in common use for years, but analysis of their torsional characteristics is more complex than expected. Disc couplings accommodate misalignment by flexing of the disc material between two sets of bolts on a common bolt circle, one set being attached to the driving member, say a hub, and the other to the driven member, such as a spacer piece. In the case of an 8-bolt design commonly used in heavy duty applications, four bolts attach rigidly to the hub and four to the spacer (figure 6)
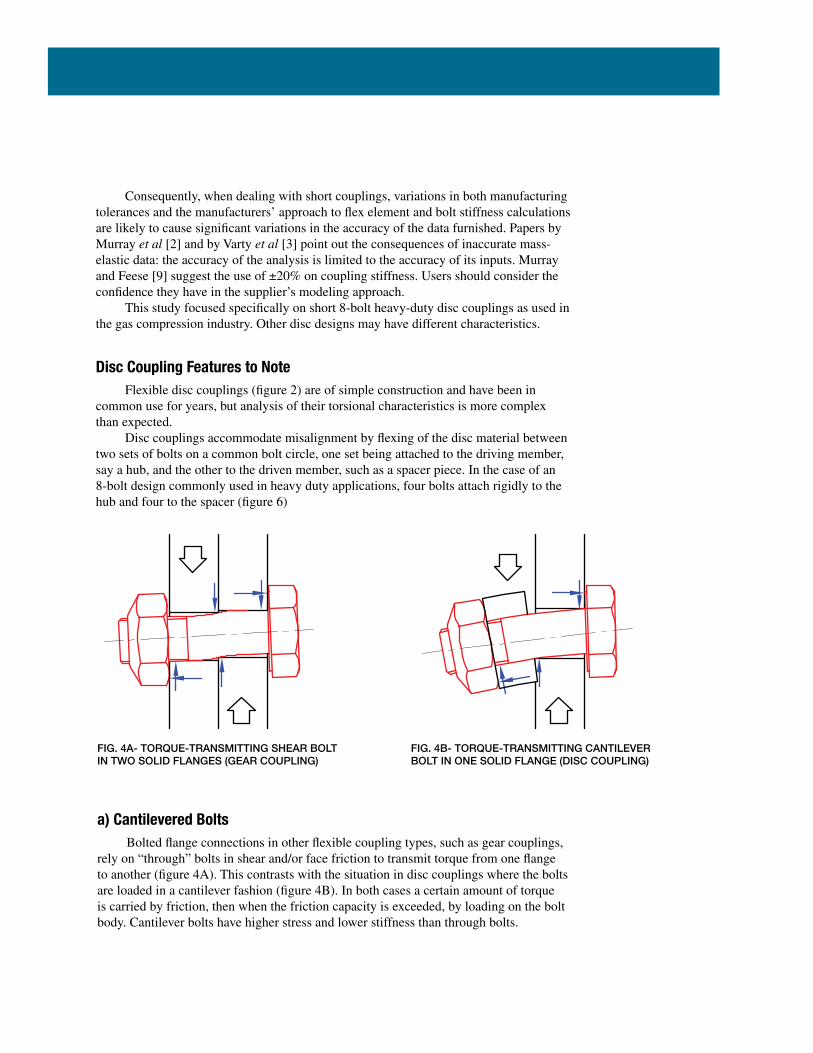
FIG. 4A- TORQUE-TRANSMITTING SHEAR BOLTIN TWO SOLID FLANGES (GEAR COUPLING)
FIG. 4B- TORQUE-TRANSMITTING CANTILEVERBOLT IN ONE SOLID FLANGE (DISC COUPLING)
a) Cantilevered Bolts Bolted flange connections in other flexible coupling types, such as gear couplings, rely on “through” bolts in shear and/or face friction to transmit torque from one flange to another (figure 4A). This contrasts with the situation in disc couplings where the bolts are loaded in a cantilever fashion (figure 4B). In both cases a certain amount of torque is carried by friction, then when the friction capacity is exceeded, by loading on the bolt body. Cantilever bolts have higher stress and lower stiffness than through bolts.
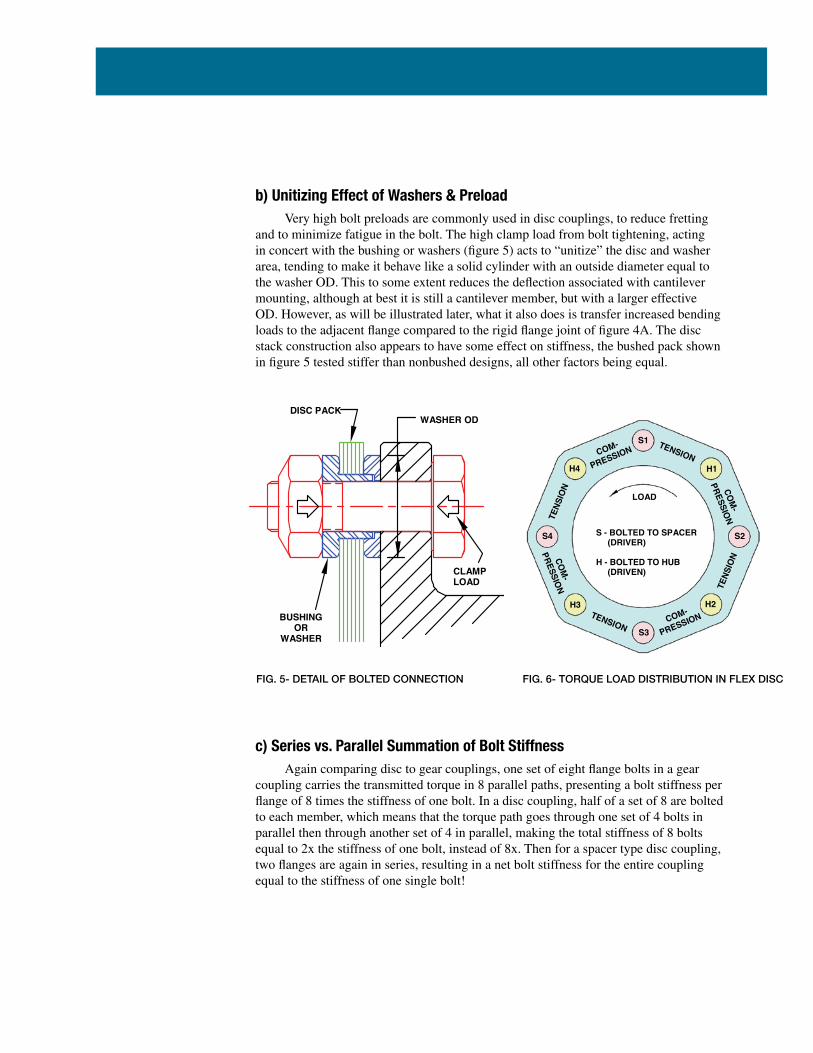
FIG. 5- DETAIL OF BOLTED CONNECTION FIG. 6- TORQUE LOAD DISTRIBUTION IN FLEX DISC
b) Unitizing Effect of Washers & Preload Very high bolt preloads are commonly used in disc couplings, to reduce fretting and to minimize fatigue in the bolt. The high clamp load from bolt tightening, acting in concert with the bushing or washers (figure 5) acts to “unitize” the disc and washer area, tending to make it behave like a solid cylinder with an outside diameter equal to the washer OD. This to some extent reduces the deflection associated with cantilever mounting, although at best it is still a cantilever member, but with a larger effective OD. However, as will be illustrated later, what it also does is transfer increased bending loads to the adjacent flange compared to the rigid flange joint of figure 4A. The disc stack construction also appears to have some effect on stiffness, the bushed pack shown in figure 5 tested stiffer than nonbushed designs, all other factors being equal.
c) Series vs. Parallel Summation of Bolt Stiffness Again comparing disc to gear couplings, one set of eight flange bolts in a gear coupling carries the transmitted torque in 8 parallel paths, presenting a bolt stiffness per flange of 8 times the stiffness of one bolt. In a disc coupling, half of a set of 8 are bolted to each member, which means that the torque path goes through one set of 4 bolts in parallel then through another set of 4 in parallel, making the total stiffness of 8 bolts equal to 2x the stiffness of one bolt, instead of 8x. Then for a spacer type disc coupling, two flanges are again in series, resulting in a net bolt stiffness for the entire coupling equal to the stiffness of one single bolt!
DISC PACK WASHER OD
BUSHING OR
WASHER
CLAMP LOAD
S1
H1
S2
H2
S3
H3
S4
H4
TENSION
TENSION
COM-
PRESSION
COM-
PRESSION
COM-
PRESSION
COM-
PRESSION
TENS
ION
TENS
ION
S - BOLTED TO SPACER (DRIVER)
H - BOLTED TO HUB
(DRIVEN)
LOAD
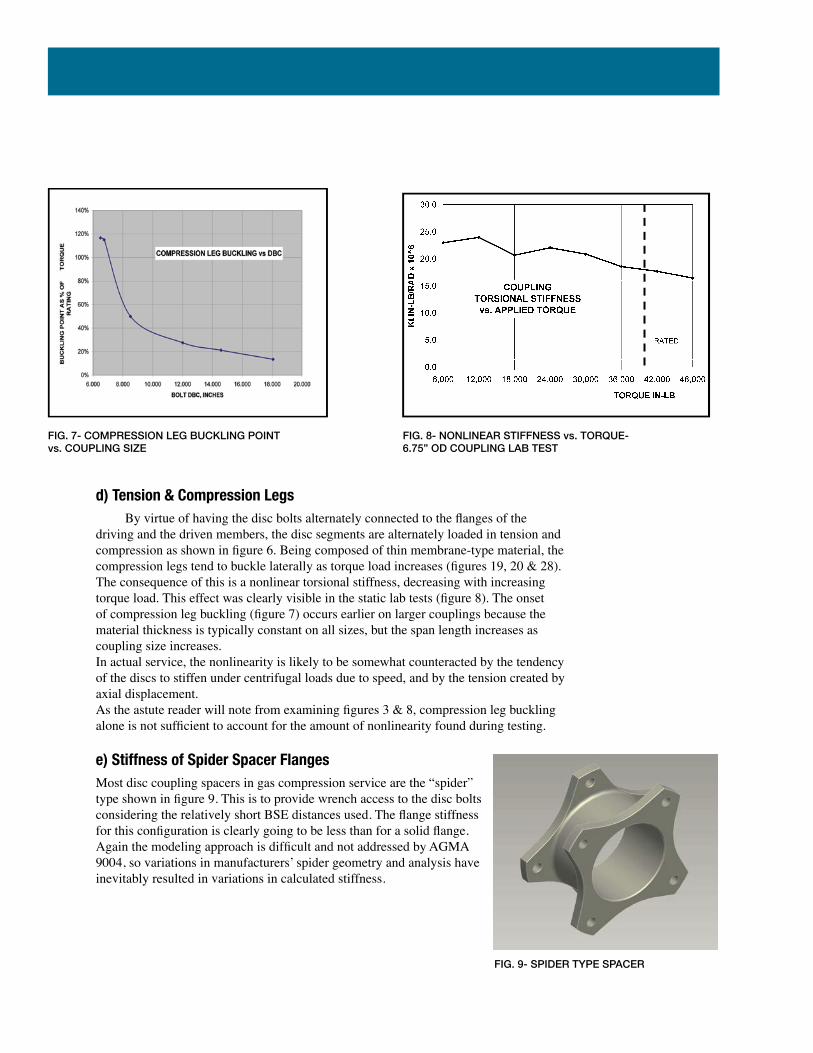
FIG. 7- COMPRESSION LEG BUCKLING POINTvs. COUPLING SIZE
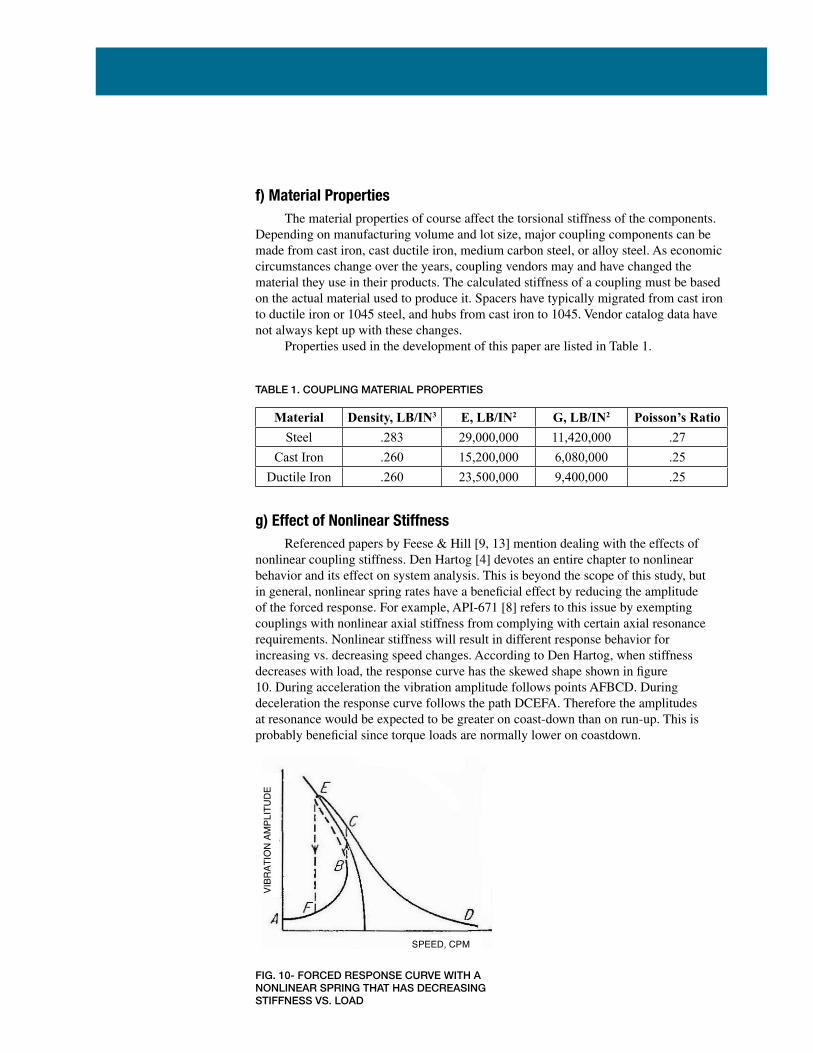
FIG. 8- NONLINEAR STIFFNESS vs. TORQUE-6.75” OD COUPLING LAB TEST
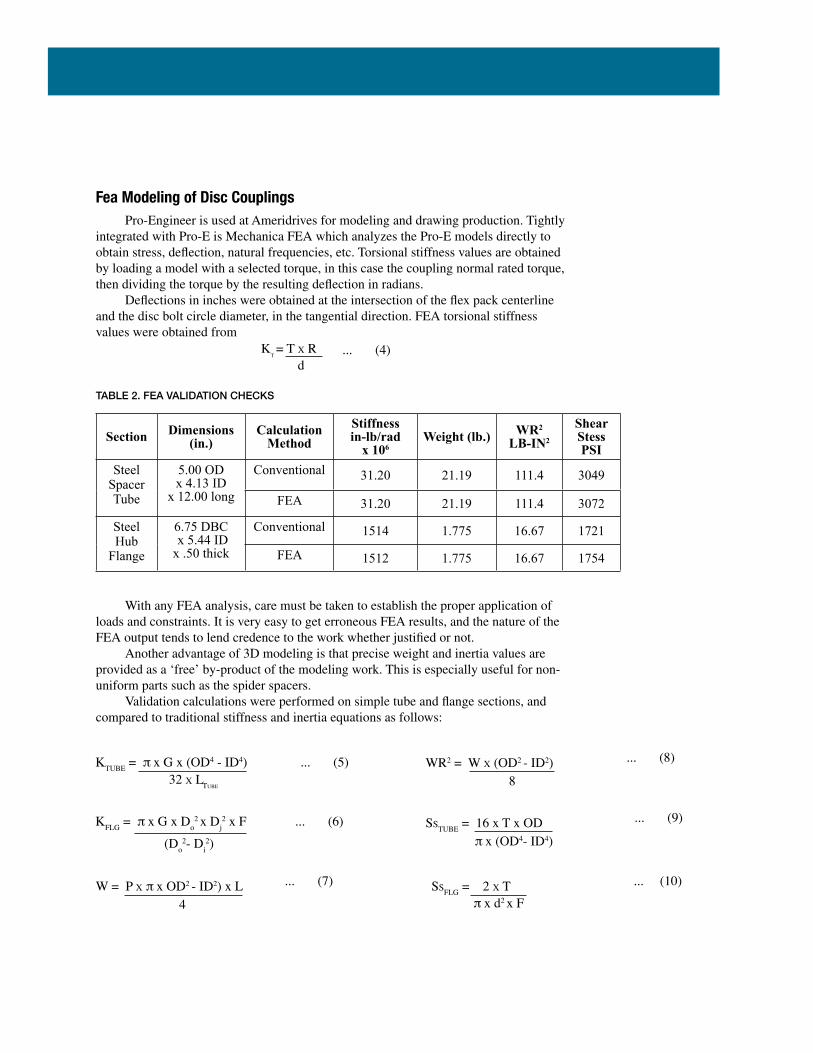
FIG. 9- SPIDER TYPE SPACER
d) Tension & Compression Legs By virtue of having the disc bolts alternately connected to the flanges of the driving and the driven members, the disc segments are alternately loaded in tension and compression as shown in figure 6. Being composed of thin membrane-type material, the compression legs tend to buckle laterally as torque load increases (figures 19, 20 & 28). The consequence of this is a nonlinear torsional stiffness, decreasing with increasing torque load. This effect was clearly visible in the static lab tests (figure 8). The onset of compression leg buckling (figure 7) occurs earlier on larger couplings because the material thickness is typically constant on all sizes, but the span length increases as coupling size increases.In actual service, the nonlinearity is likely to be somewhat counteracted by the tendency of the discs to stiffen under centrifugal loads due to speed, and by the tension created by axial displacement.As the astute reader will note from examining figures 3 & 8, compression leg buckling alone is not sufficient to account for the amount of nonlinearity found during testing.
e) Stiffness of Spider Spacer FlangesMost disc coupling spacers in gas compression service are the “spider” type shown in figure 9. This is to provide wrench access to the disc bolts considering the relatively short BSE distances used. The flange stiffness for this configuration is clearly going to be less than for a solid flange. Again the modeling approach is difficult and not addressed by AGMA 9004, so variations in manufacturers’ spider geometry and analysis have inevitably resulted in variations in calculated stiffness.
Material Density, LB/IN3 E, LB/IN2 G, LB/IN2 Poisson’s RatioSteel .283 29,000,000 11,420,000 .27
Cast Iron .260 15,200,000 6,080,000 .25Ductile Iron .260 23,500,000 9,400,000 .25
f) Material Properties The material properties of course affect the torsional stiffness of the components. Depending on manufacturing volume and lot size, major coupling components can be made from cast iron, cast ductile iron, medium carbon steel, or alloy steel. As economic circumstances change over the years, coupling vendors may and have changed the material they use in their products. The calculated stiffness of a coupling must be based on the actual material used to produce it. Spacers have typically migrated from cast iron to ductile iron or 1045 steel, and hubs from cast iron to 1045. Vendor catalog data have not always kept up with these changes. Properties used in the development of this paper are listed in Table 1.
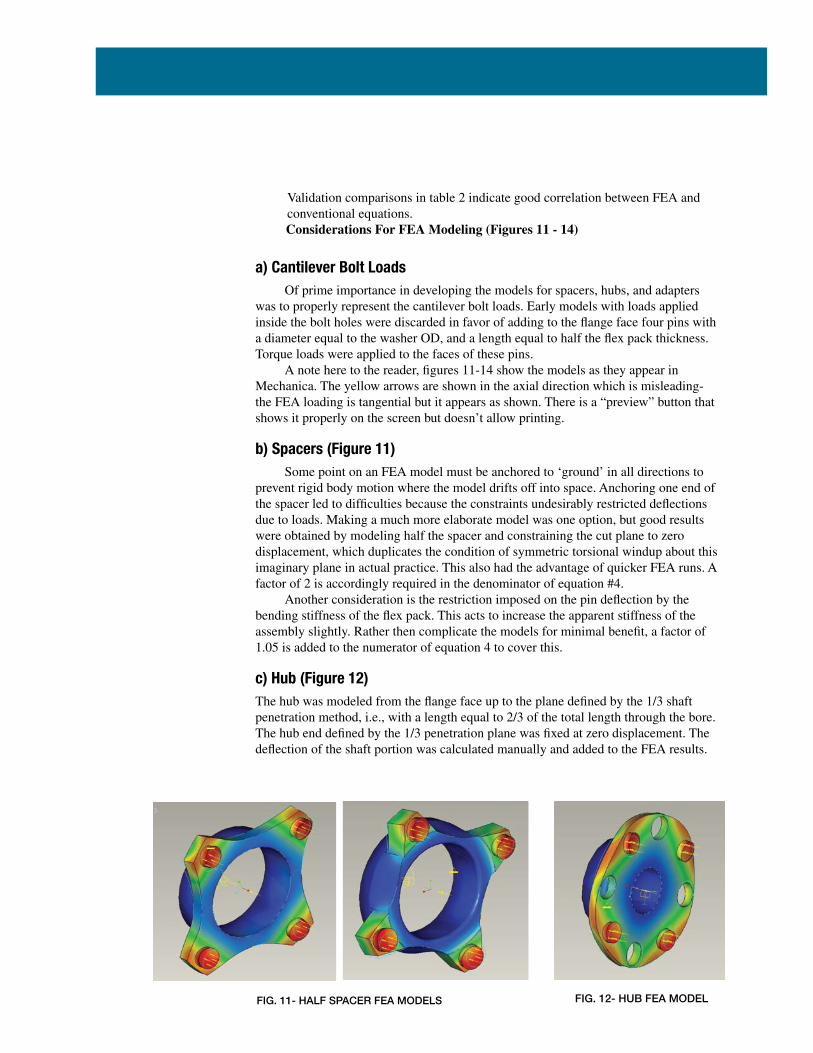
g) Effect of Nonlinear Stiffness Referenced papers by Feese & Hill [9, 13] mention dealing with the effects of nonlinear coupling stiffness. Den Hartog [4] devotes an entire chapter to nonlinear behavior and its effect on system analysis. This is beyond the scope of this study, but in general, nonlinear spring rates have a beneficial effect by reducing the amplitude of the forced response. For example, API-671 [8] refers to this issue by exempting couplings with nonlinear axial stiffness from complying with certain axial resonance requirements. Nonlinear stiffness will result in different response behavior for increasing vs. decreasing speed changes. According to Den Hartog, when stiffness decreases with load, the response curve has the skewed shape shown in figure 10. During acceleration the vibration amplitude follows points AFBCD. During deceleration the response curve follows the path DCEFA. Therefore the amplitudes at resonance would be expected to be greater on coast-down than on run-up. This is probably beneficial since torque loads are normally lower on coastdown.
TABLE 1. COUPLING MATERIAL PROPERTIES
SPEED, CPM
VIBR
ATIO
N A
MPL
ITU
DE
FIG. 10- FORCED RESPONSE CURVE WITH ANONLINEAR SPRING THAT HAS DECREASINGSTIFFNESS VS. LOAD
Section Dimensions (in.)
Calculation Method
Stiffness in-lb/rad
x 106Weight (lb.) WR2
LB-IN2
Shear Stess PSI
Steel Spacer Tube
5.00 OD x 4.13 ID
x 12.00 long
Conventional 31.20 21.19 111.4 3049
FEA 31.20 21.19 111.4 3072
Steel Hub
Flange
6.75 DBC x 5.44 ID x .50 thick
Conventional 1514 1.775 16.67 1721
FEA 1512 1.775 16.67 1754
... (5)KTUBE = π x G x (OD4 - ID4)32 x LTUBE
... (6)KFLG = π x G x Do2 x Dj
2 x F
(Do2- Di
2)
... (8)WR2 = W x (OD2 - ID2) 8
... (7)W = P x π x OD2 - ID2) x L4
... (9)SSTUBE = 16 x T x ODπ x (OD4- ID4)
... (10)SSFLG = 2 x Tπ x d2 x F
TABLE 2. FEA VALIDATION CHECKS
Fea Modeling of Disc Couplings Pro-Engineer is used at Ameridrives for modeling and drawing production. Tightly integrated with Pro-E is Mechanica FEA which analyzes the Pro-E models directly to obtain stress, deflection, natural frequencies, etc. Torsional stiffness values are obtained by loading a model with a selected torque, in this case the coupling normal rated torque, then dividing the torque by the resulting deflection in radians. Deflections in inches were obtained at the intersection of the flex pack centerline and the disc bolt circle diameter, in the tangential direction. FEA torsional stiffness values were obtained from
With any FEA analysis, care must be taken to establish the proper application of loads and constraints. It is very easy to get erroneous FEA results, and the nature of the FEA output tends to lend credence to the work whether justified or not. Another advantage of 3D modeling is that precise weight and inertia values are provided as a ‘free’ by-product of the modeling work. This is especially useful for non-uniform parts such as the spider spacers. Validation calculations were performed on simple tube and flange sections, and compared to traditional stiffness and inertia equations as follows:
... (4)KT = T x R
d
a) Cantilever Bolt Loads Of prime importance in developing the models for spacers, hubs, and adapters was to properly represent the cantilever bolt loads. Early models with loads applied inside the bolt holes were discarded in favor of adding to the flange face four pins with a diameter equal to the washer OD, and a length equal to half the flex pack thickness. Torque loads were applied to the faces of these pins. A note here to the reader, figures 11-14 show the models as they appear in Mechanica. The yellow arrows are shown in the axial direction which is misleading- the FEA loading is tangential but it appears as shown. There is a “preview” button that shows it properly on the screen but doesn’t allow printing.
b) Spacers (Figure 11) Some point on an FEA model must be anchored to ‘ground’ in all directions to prevent rigid body motion where the model drifts off into space. Anchoring one end of the spacer led to difficulties because the constraints undesirably restricted deflections due to loads. Making a much more elaborate model was one option, but good results were obtained by modeling half the spacer and constraining the cut plane to zero displacement, which duplicates the condition of symmetric torsional windup about this imaginary plane in actual practice. This also had the advantage of quicker FEA runs. A factor of 2 is accordingly required in the denominator of equation #4. Another consideration is the restriction imposed on the pin deflection by the bending stiffness of the flex pack. This acts to increase the apparent stiffness of the assembly slightly. Rather then complicate the models for minimal benefit, a factor of 1.05 is added to the numerator of equation 4 to cover this.
c) Hub (Figure 12)The hub was modeled from the flange face up to the plane defined by the 1/3 shaft penetration method, i.e., with a length equal to 2/3 of the total length through the bore. The hub end defined by the 1/3 penetration plane was fixed at zero displacement. The deflection of the shaft portion was calculated manually and added to the FEA results.
FIG. 11- HALF SPACER FEA MODELS FIG. 12- HUB FEA MODEL
Validation comparisons in table 2 indicate good correlation between FEA and conventional equations.
Considerations For FEA Modeling (Figures 11 - 14)

d) Adapters (Figure 13) The interface bolt holes where the adapter bolts to the flywheel were constrained to zero displacement axially in the bolt head spotface, and rotationally about the part axis. Torque loads were applied through four pins like the spacers. Where the adapter bolts up against the flywheel, bending deflection of the flange perpendicular to the flywheel is limited to moving away from the flange only.
e) Individual Discs (Figure 14) A pin with a total length equal to the disk pack thickness was modeled projecting out from each side of the disc equally. On one side of the disc half the pin ends were fixed; on the other side of the disc the ends of half the pin ends were loaded with the rated torque per disc. The ends of the loaded pins were constrained to stay in their original plane, to prevent adding cantilever deflection that was already considered in the connected pieces.
g) Disc Pack Assembly (not shown) In most cases, assembled packs became too complex to run successfully, even with symmetry simplifications, but one successful pack model was developed. Modeling arrangement was the same as for the individual disc.
FIG. 13- ADAPTER FEA MODEL FIG. 14- DISC FEA MODELS
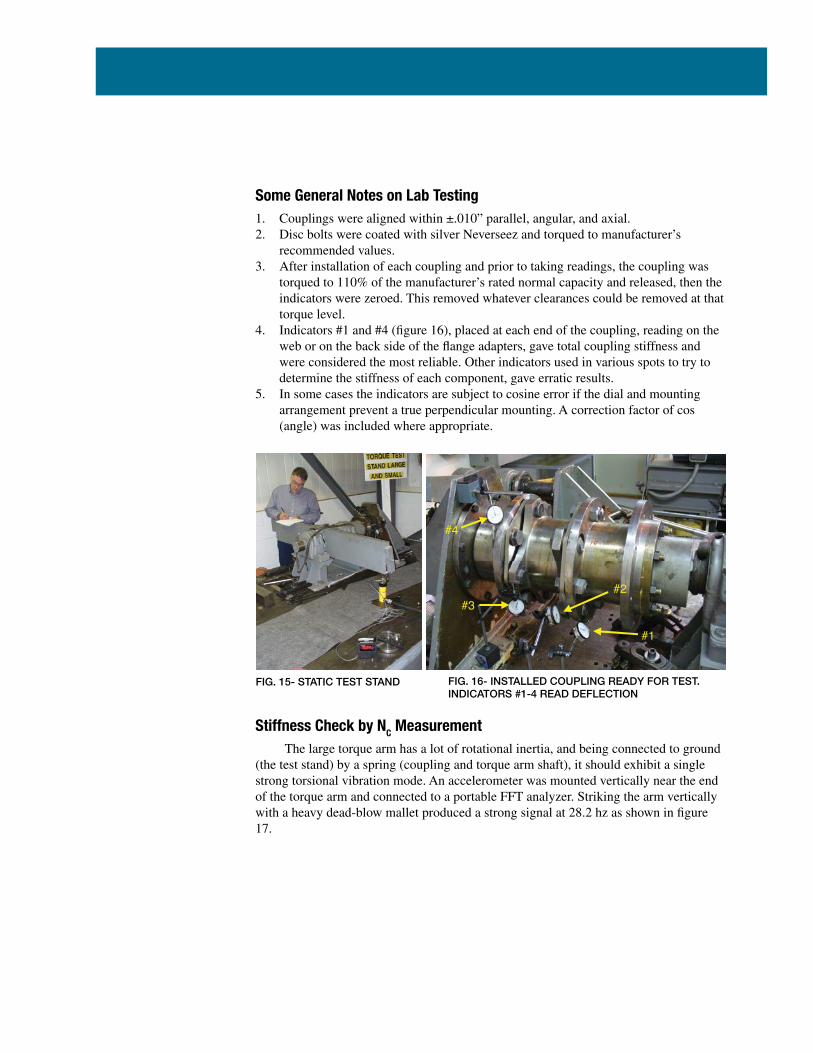
Lab Testing Several coupling configurations were tested on Ameridrives’ large static test stand with a capacity of 600,000 in-lb (figure 15). This consists of a large torque arm and shaft carried by four heavy roller bearings. When unloaded the arm and shaft can be rotated with one finger indicating low friction losses. Friction loss using =.05 was included in the stiffness calculations. Force is applied by a hydraulic cylinder and read by a calibrated load cell and digital panel meter. Deflections are read manually from dial indicators placed tangentially on the coupling with their bases on or connected to the fixed stand.
Some General Notes on Lab Testing1. Couplings were aligned within ±.010” parallel, angular, and axial.2. Disc bolts were coated with silver Neverseez and torqued to manufacturer’s
recommended values.3. After installation of each coupling and prior to taking readings, the coupling was
torqued to 110% of the manufacturer’s rated normal capacity and released, then the indicators were zeroed. This removed whatever clearances could be removed at that torque level.
4. Indicators #1 and #4 (figure 16), placed at each end of the coupling, reading on the web or on the back side of the flange adapters, gave total coupling stiffness and were considered the most reliable. Other indicators used in various spots to try to determine the stiffness of each component, gave erratic results.
5. In some cases the indicators are subject to cosine error if the dial and mounting arrangement prevent a true perpendicular mounting. A correction factor of cos (angle) was included where appropriate.
Stiffness Check by NC Measurement The large torque arm has a lot of rotational inertia, and being connected to ground (the test stand) by a spring (coupling and torque arm shaft), it should exhibit a single strong torsional vibration mode. An accelerometer was mounted vertically near the end of the torque arm and connected to a portable FFT analyzer. Striking the arm vertically with a heavy dead-blow mallet produced a strong signal at 28.2 hz as shown in figure 17.
#4
#3 #2
#1
FIG. 15- STATIC TEST STAND FIG. 16- INSTALLED COUPLING READY FOR TEST.INDICATORS #1-4 READ DEFLECTION
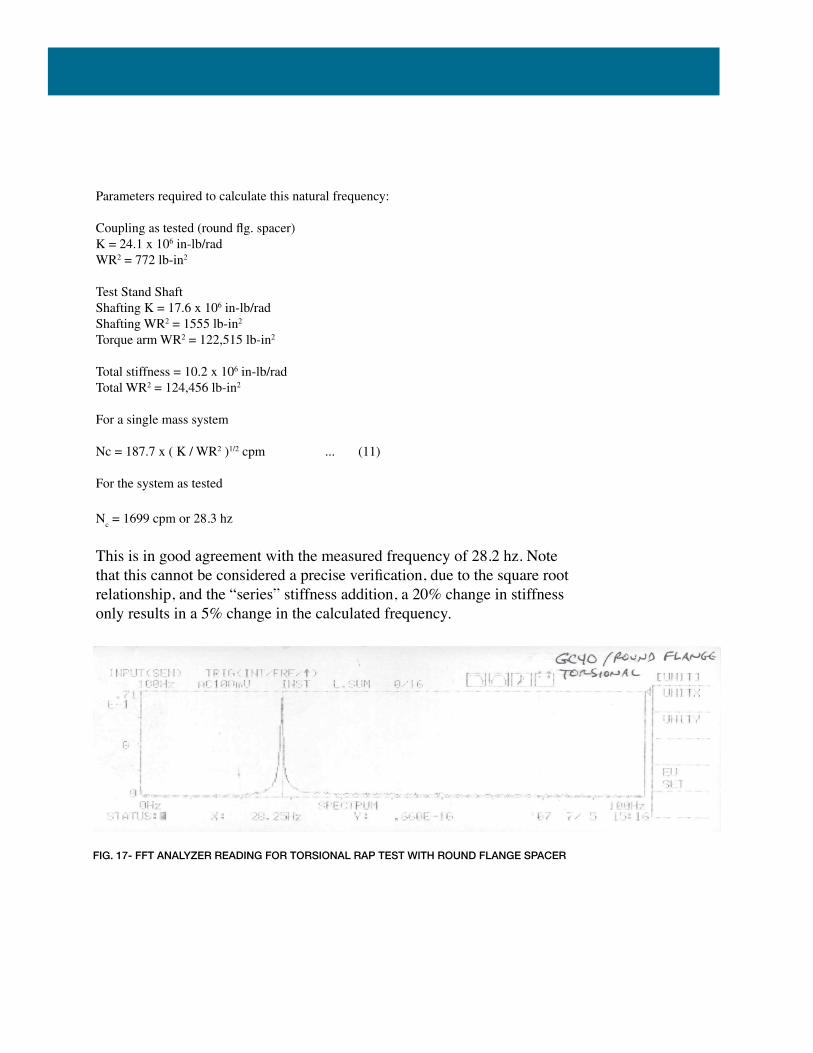
FIG. 17- FFT ANALYZER READING FOR TORSIONAL RAP TEST WITH ROUND FLANGE SPACER
Parameters required to calculate this natural frequency:
Coupling as tested (round flg. spacer)K = 24.1 x 10⁶ in-lb/radWR2 = 772 lb-in2
Test Stand ShaftShafting K = 17.6 x 10⁶ in-lb/radShafting WR2 = 1555 lb-in2
Torque arm WR2 = 122,515 lb-in2
Total stiffness = 10.2 x 10⁶ in-lb/radTotal WR2 = 124,456 lb-in2
For a single mass system
Nc = 187.7 x ( K / WR2 )1/2 cpm ... (11)
For the system as tested
Nc = 1699 cpm or 28.3 hz
This is in good agreement with the measured frequency of 28.2 hz. Note that this cannot be considered a precise verification, due to the square root relationship, and the “series” stiffness addition, a 20% change in stiffness only results in a 5% change in the calculated frequency.
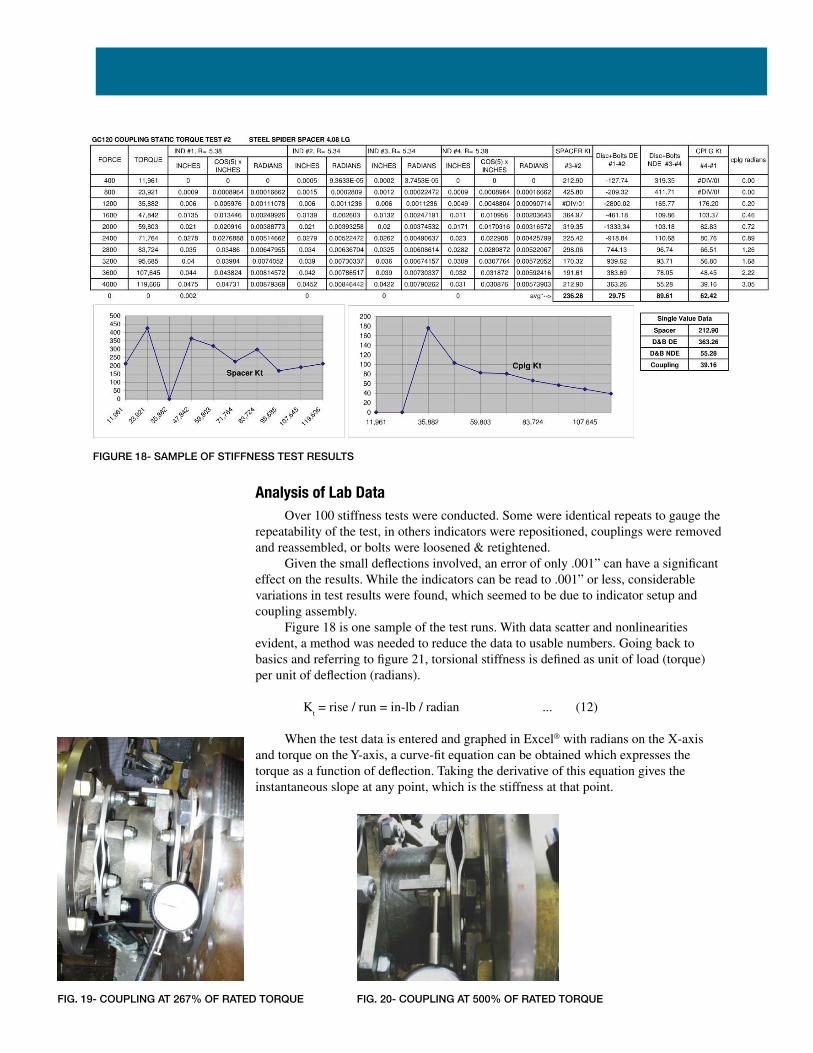
FIGURE 18- SAMPLE OF STIFFNESS TEST RESULTS
Analysis of Lab Data Over 100 stiffness tests were conducted. Some were identical repeats to gauge the repeatability of the test, in others indicators were repositioned, couplings were removed and reassembled, or bolts were loosened & retightened. Given the small deflections involved, an error of only .001” can have a significant effect on the results. While the indicators can be read to .001” or less, considerable variations in test results were found, which seemed to be due to indicator setup and coupling assembly. Figure 18 is one sample of the test runs. With data scatter and nonlinearities evident, a method was needed to reduce the data to usable numbers. Going back to basics and referring to figure 21, torsional stiffness is defined as unit of load (torque) per unit of deflection (radians).
Kt = rise / run = in-lb / radian ... (12)
When the test data is entered and graphed in Excel® with radians on the X-axis and torque on the Y-axis, a curve-fit equation can be obtained which expresses the torque as a function of deflection. Taking the derivative of this equation gives the instantaneous slope at any point, which is the stiffness at that point.
FIG. 19- COUPLING AT 267% OF RATED TORQUE FIG. 20- COUPLING AT 500% OF RATED TORQUE
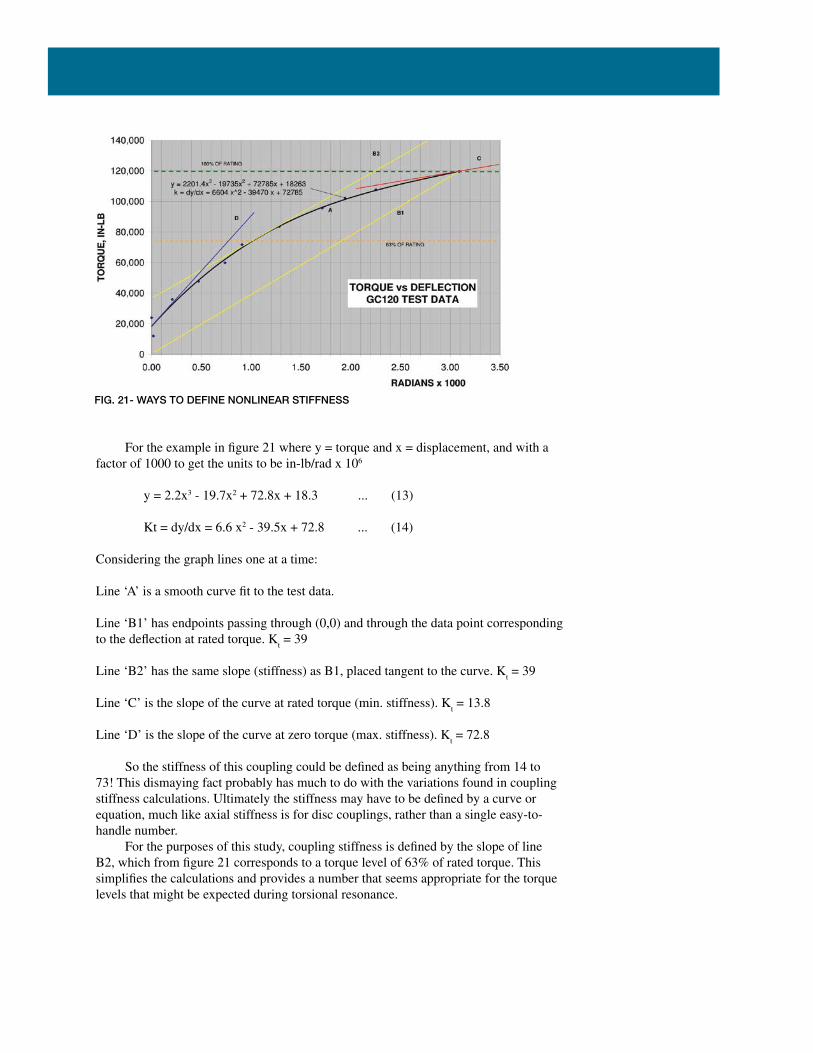
FIG. 21- WAYS TO DEFINE NONLINEAR STIFFNESS
For the example in figure 21 where y = torque and x = displacement, and with a factor of 1000 to get the units to be in-lb/rad x 106
y = 2.2x3 - 19.7x2 + 72.8x + 18.3 ... (13)
Kt = dy/dx = 6.6 x2 - 39.5x + 72.8 ... (14)
Considering the graph lines one at a time:
Line ‘A’ is a smooth curve fit to the test data.
Line ‘B1’ has endpoints passing through (0,0) and through the data point corresponding to the deflection at rated torque. K
t = 39
Line ‘B2’ has the same slope (stiffness) as B1, placed tangent to the curve. Kt = 39
Line ‘C’ is the slope of the curve at rated torque (min. stiffness). Kt = 13.8
Line ‘D’ is the slope of the curve at zero torque (max. stiffness). Kt = 72.8
So the stiffness of this coupling could be defined as being anything from 14 to 73! This dismaying fact probably has much to do with the variations found in coupling stiffness calculations. Ultimately the stiffness may have to be defined by a curve or equation, much like axial stiffness is for disc couplings, rather than a single easy-to-handle number. For the purposes of this study, coupling stiffness is defined by the slope of line B2, which from figure 21 corresponds to a torque level of 63% of rated torque. This simplifies the calculations and provides a number that seems appropriate for the torque levels that might be expected during torsional resonance.
Further Notes on Lab Tests:1. The first few readings are always erratic especially on larger coupling sizes.
Stiffness results under about 20% of rated torque can only be inferred from an averaged trend line. When the compression leg buckling point falls in this area, the data become even more erratic.
2. At torque levels exceeding 100% of rating, minor slippage of disc material under the bolt heads can occur, made evident by residual gaps between discs that were not present initially. Therefore most of the testing was limited to 100% of rated torque.
3. Attempts to read individual spacer and flex pack stiffnesses were not consistent due to flange bending and twisting deflections, so they were not included in the results.
Test No. Coupling Brand Spacer Design Spacer
Material
Measured Stiffness
Based On Deflection At 100% Torque
Average Measured Stiffness
IN-LB/RAD x 106
Calculated Stiffness
IN-LB/RAD x 106
31-1 A Spider Cast Iron 9.02
9.19 10.331-2 A Spider Cast Iron 8.3631-3 A Spider Cast Iron 9.5331-4 A Spider Cast Iron 9.84
312-1 B Spider Cast Iron 9.54
8.15 8.90312-2 B Spider Cast Iron 7.97312-3 B Spider Cast Iron 8.12312-4 B Spider Cast Iron 8.29312-5 B Spider Cast Iron 6.8440-1 C Round Flange Steel 24.8
23.2 24.9
40-2 C Round Flange Steel 25.340-3 C Round Flange Steel 26.1
40-14 C Round Flange Steel 21.840-15 C Round Flange Steel 22.240-16 C Round Flange Steel 22.240-17 C Round Flange Steel 21.640-18 C Round Flange Steel 21.840-4 C Spider 3.01 LG Steel 22.0
22.4 22.340-5 C Spider 3.01 LG Steel 22.240-6 C Spider 3.01 LG Steel 22.840-7 C Scalloped Steel 22.8
23.1 24.340-8 C Scalloped Steel 22.940-9 C Scalloped Steel 23.7
40-10 C Spider 3.58 LG Ductile Iron 21.8
20.9 18.740-11 C Spider 3.58 LG Ductile Iron 21.640-12 C Spider 3.58 LG Ductile Iron 22.240-13 C Spider 3.58 LG Ductile Iron 18.140-19 C Spider 3.01 LG Ductile Iron 20.8
19.9 20.840-20 C Spider 3.01 LG Ductile Iron 19.0
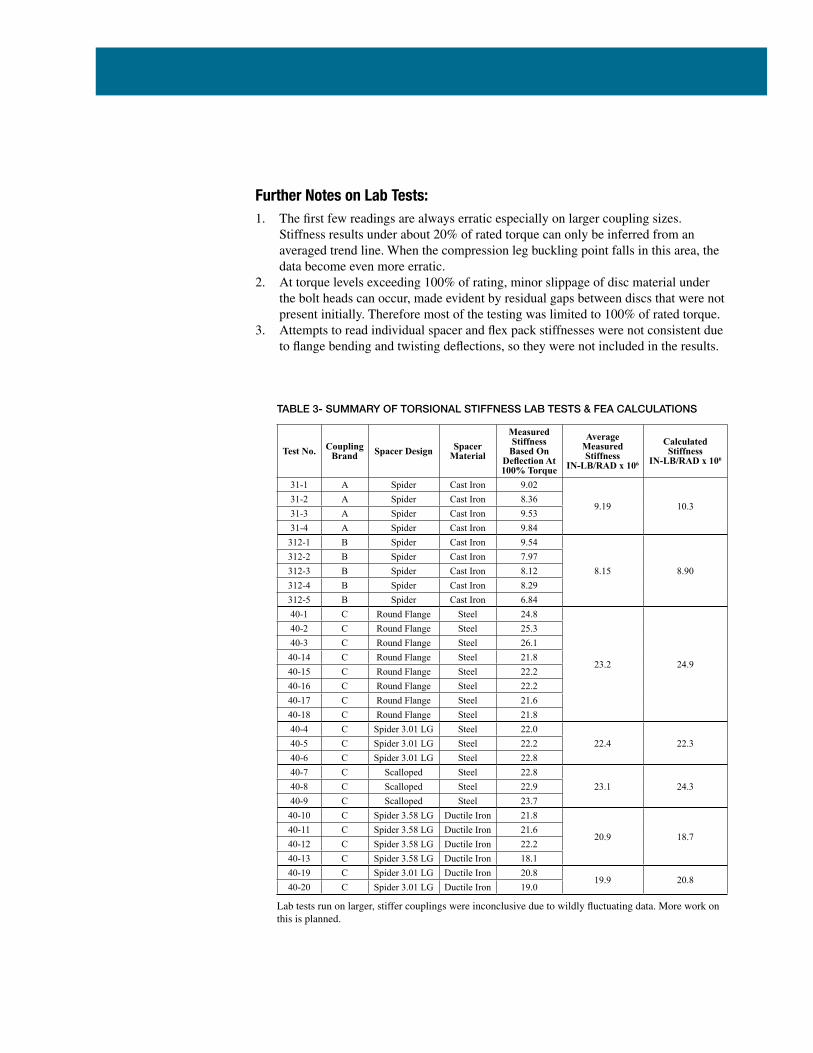
TABLE 3- SUMMARY OF TORSIONAL STIFFNESS LAB TESTS & FEA CALCULATIONS
Lab tests run on larger, stiffer couplings were inconclusive due to wildly fluctuating data. More work on this is planned.
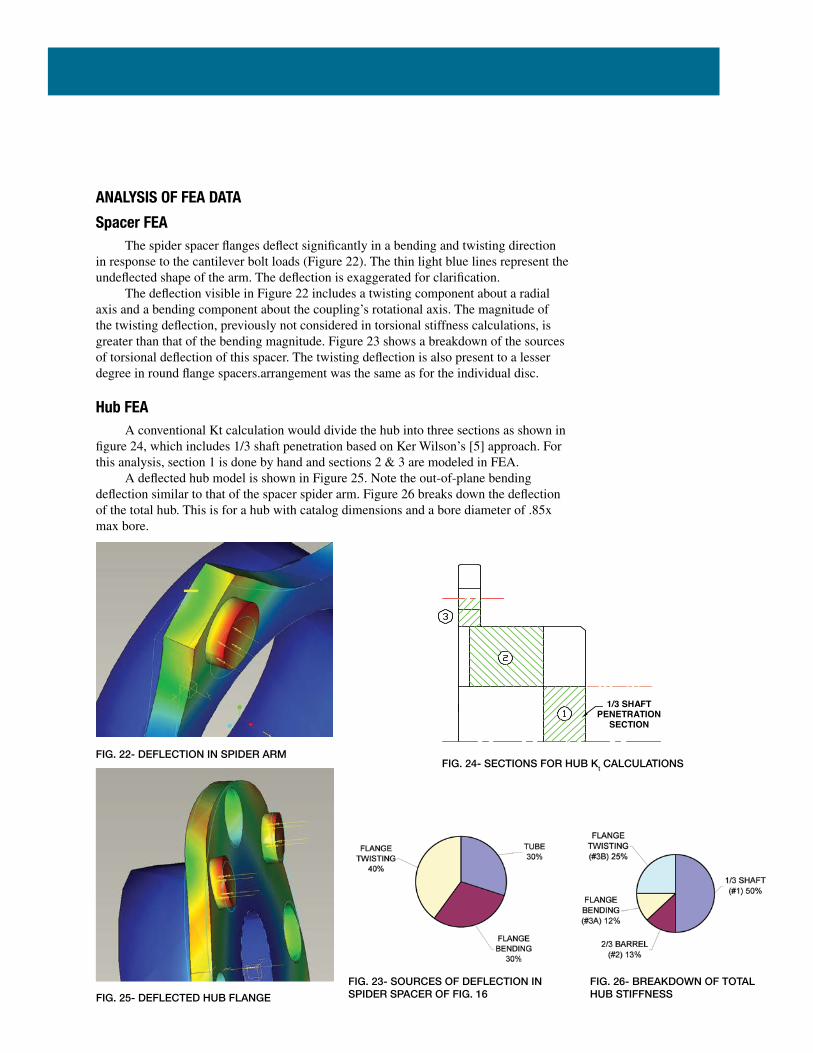
TABLE 3- SUMMARY OF TORSIONAL STIFFNESS LAB TESTS & FEA CALCULATIONS
FIG. 22- DEFLECTION IN SPIDER ARMFIG. 24- SECTIONS FOR HUB Kt CALCULATIONS
FIG. 23- SOURCES OF DEFLECTION INSPIDER SPACER OF FIG. 16
FIG. 26- BREAKDOWN OF TOTALHUB STIFFNESSFIG. 25- DEFLECTED HUB FLANGE
ANALYSIS OF FEA DATA
Spacer FEA The spider spacer flanges deflect significantly in a bending and twisting direction in response to the cantilever bolt loads (Figure 22). The thin light blue lines represent the undeflected shape of the arm. The deflection is exaggerated for clarification. The deflection visible in Figure 22 includes a twisting component about a radial axis and a bending component about the coupling’s rotational axis. The magnitude of the twisting deflection, previously not considered in torsional stiffness calculations, is greater than that of the bending magnitude. Figure 23 shows a breakdown of the sources of torsional deflection of this spacer. The twisting deflection is also present to a lesser degree in round flange spacers.arrangement was the same as for the individual disc.
Hub FEA A conventional Kt calculation would divide the hub into three sections as shown in figure 24, which includes 1/3 shaft penetration based on Ker Wilson’s [5] approach. For this analysis, section 1 is done by hand and sections 2 & 3 are modeled in FEA. A deflected hub model is shown in Figure 25. Note the out-of-plane bending deflection similar to that of the spacer spider arm. Figure 26 breaks down the deflection of the total hub. This is for a hub with catalog dimensions and a bore diameter of .85x max bore.
1/3 SHAFT PENETRATION
SECTION
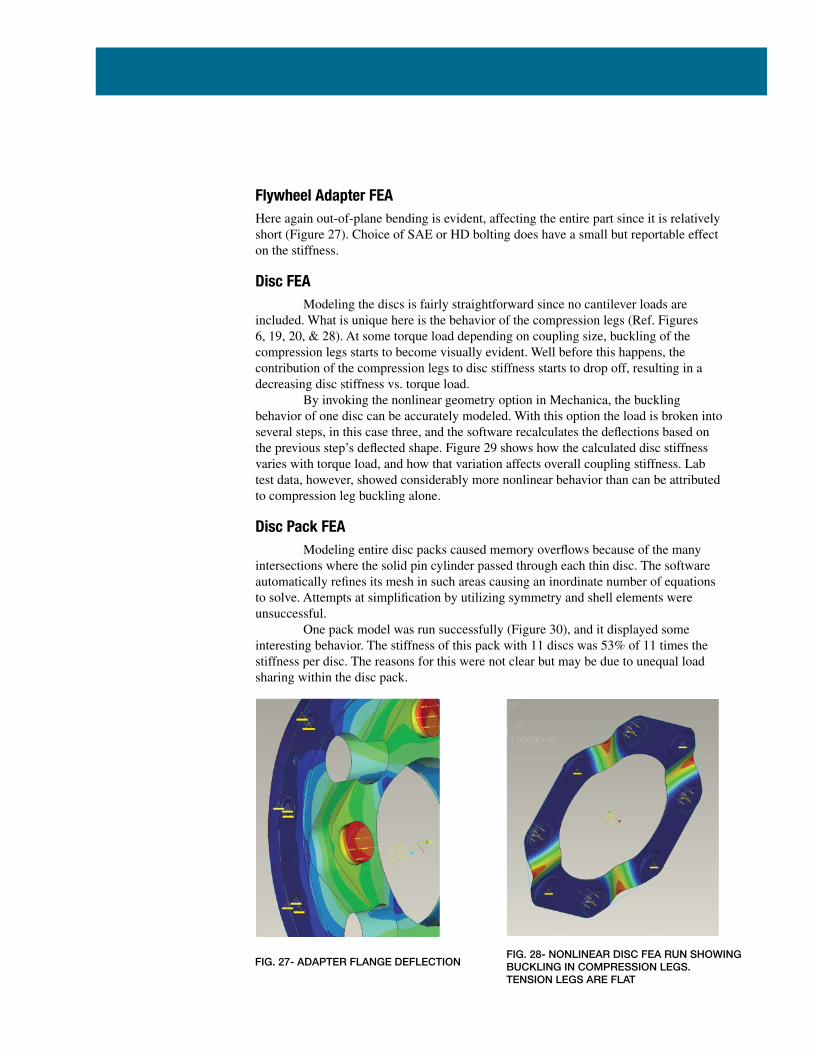
Flywheel Adapter FEAHere again out-of-plane bending is evident, affecting the entire part since it is relatively short (Figure 27). Choice of SAE or HD bolting does have a small but reportable effect on the stiffness.
Disc FEA Modeling the discs is fairly straightforward since no cantilever loads are included. What is unique here is the behavior of the compression legs (Ref. Figures 6, 19, 20, & 28). At some torque load depending on coupling size, buckling of the compression legs starts to become visually evident. Well before this happens, the contribution of the compression legs to disc stiffness starts to drop off, resulting in a decreasing disc stiffness vs. torque load. By invoking the nonlinear geometry option in Mechanica, the buckling behavior of one disc can be accurately modeled. With this option the load is broken into several steps, in this case three, and the software recalculates the deflections based on the previous step’s deflected shape. Figure 29 shows how the calculated disc stiffness varies with torque load, and how that variation affects overall coupling stiffness. Lab test data, however, showed considerably more nonlinear behavior than can be attributed to compression leg buckling alone.
Disc Pack FEA Modeling entire disc packs caused memory overflows because of the many intersections where the solid pin cylinder passed through each thin disc. The software automatically refines its mesh in such areas causing an inordinate number of equations to solve. Attempts at simplification by utilizing symmetry and shell elements were unsuccessful. One pack model was run successfully (Figure 30), and it displayed some interesting behavior. The stiffness of this pack with 11 discs was 53% of 11 times the stiffness per disc. The reasons for this were not clear but may be due to unequal load sharing within the disc pack.
FIG. 28- NONLINEAR DISC FEA RUN SHOWINGBUCKLING IN COMPRESSION LEGS.TENSION LEGS ARE FLAT
FIG. 27- ADAPTER FLANGE DEFLECTION
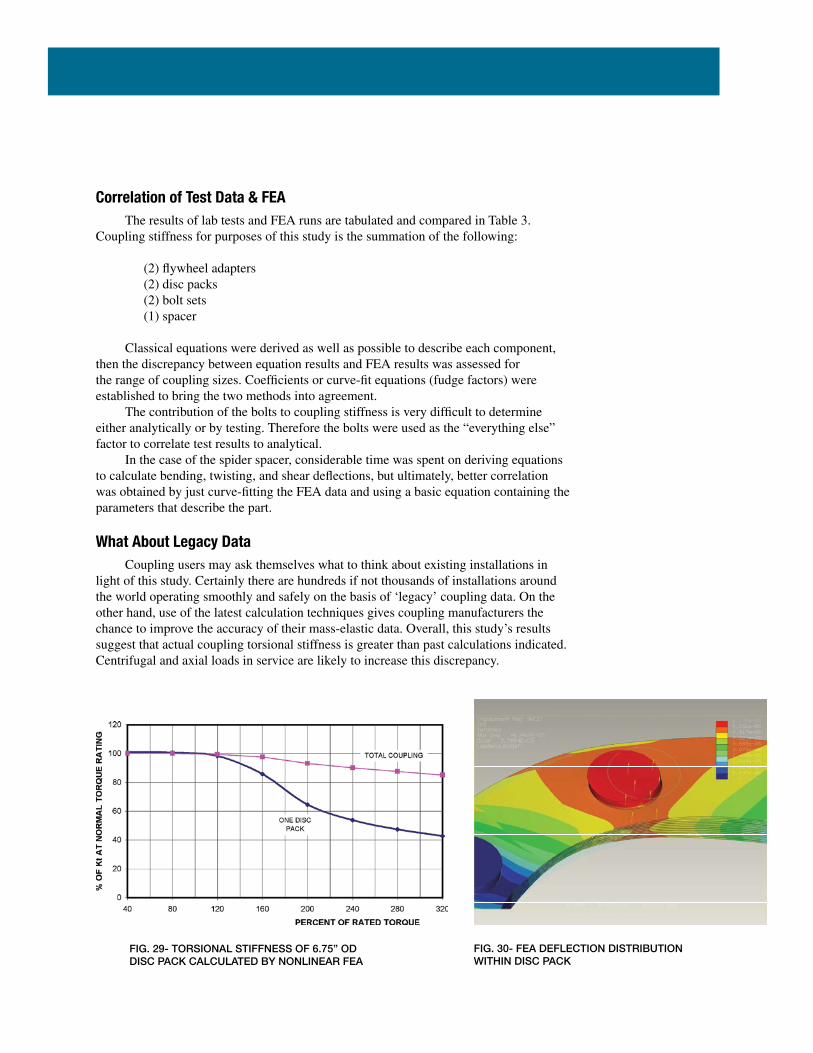
FIG. 29- TORSIONAL STIFFNESS OF 6.75” ODDISC PACK CALCULATED BY NONLINEAR FEA
FIG. 30- FEA DEFLECTION DISTRIBUTIONWITHIN DISC PACK
Correlation of Test Data & FEA The results of lab tests and FEA runs are tabulated and compared in Table 3. Coupling stiffness for purposes of this study is the summation of the following:
(2) flywheel adapters (2) disc packs (2) bolt sets (1) spacer
Classical equations were derived as well as possible to describe each component, then the discrepancy between equation results and FEA results was assessed for the range of coupling sizes. Coefficients or curve-fit equations (fudge factors) were established to bring the two methods into agreement. The contribution of the bolts to coupling stiffness is very difficult to determine either analytically or by testing. Therefore the bolts were used as the “everything else” factor to correlate test results to analytical. In the case of the spider spacer, considerable time was spent on deriving equations to calculate bending, twisting, and shear deflections, but ultimately, better correlation was obtained by just curve-fitting the FEA data and using a basic equation containing the parameters that describe the part.
What About Legacy Data Coupling users may ask themselves what to think about existing installations in light of this study. Certainly there are hundreds if not thousands of installations around the world operating smoothly and safely on the basis of ‘legacy’ coupling data. On the other hand, use of the latest calculation techniques gives coupling manufacturers the chance to improve the accuracy of their mass-elastic data. Overall, this study’s results suggest that actual coupling torsional stiffness is greater than past calculations indicated. Centrifugal and axial loads in service are likely to increase this discrepancy.
Coupling Torsional Stiffness
Torsional Natural Frequency (CPM)Mode 1 Mode 2 Mode 3
1x 4,710 12,030 13,0302x 4,710 12,100 15,5003x 4,720 12,110 16,6604x 4,720 12,110 17,3205x 4,720 12,110 17,7506x 4,720 12,110 18,0407x 4,720 12,110 18,2608x 4,720 12,110 18,420
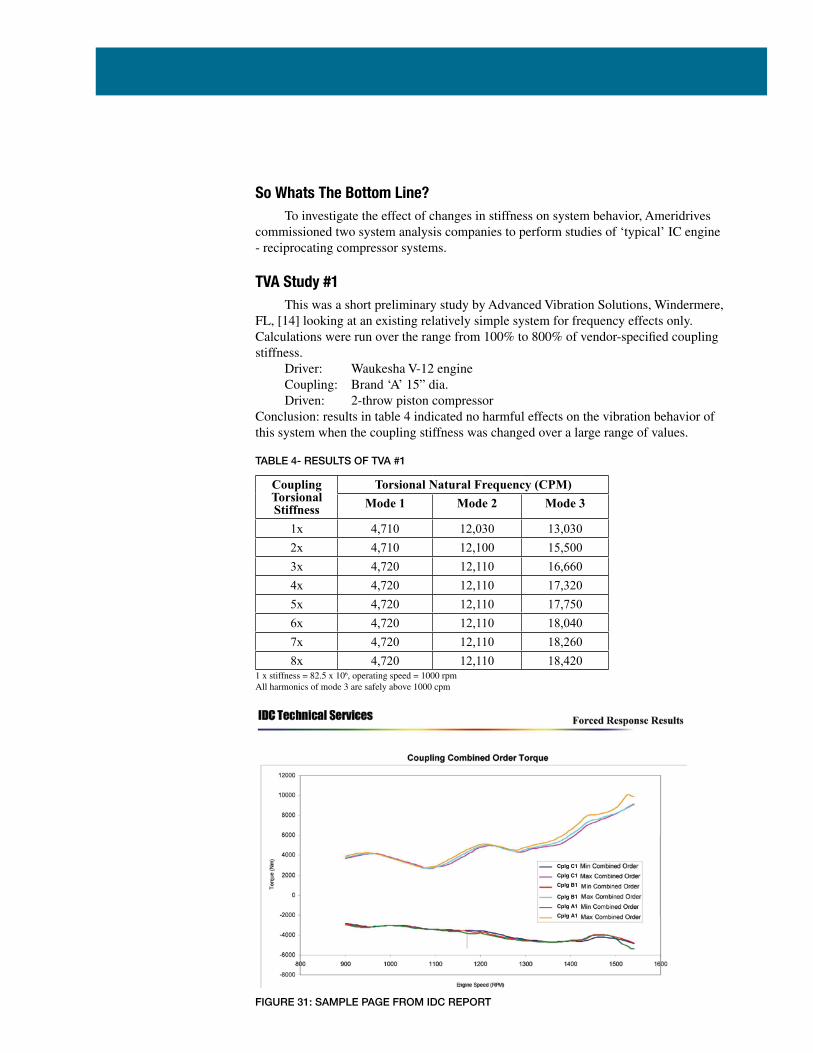
So Whats The Bottom Line? To investigate the effect of changes in stiffness on system behavior, Ameridrives commissioned two system analysis companies to perform studies of ‘typical’ IC engine - reciprocating compressor systems.
TVA Study #1 This was a short preliminary study by Advanced Vibration Solutions, Windermere, FL, [14] looking at an existing relatively simple system for frequency effects only. Calculations were run over the range from 100% to 800% of vendor-specified coupling stiffness. Driver: Waukesha V-12 engine Coupling: Brand ‘A’ 15” dia. Driven: 2-throw piston compressorConclusion: results in table 4 indicated no harmful effects on the vibration behavior of this system when the coupling stiffness was changed over a large range of values.
Cplg C1 Cplg C1 Cplg B1
Cplg B1 Cplg A1 Cplg A1
TABLE 4- RESULTS OF TVA #1
FIGURE 31: SAMPLE PAGE FROM IDC REPORT
1 x stiffness = 82.5 x 10⁶, operating speed = 1000 rpmAll harmonics of mode 3 are safely above 1000 cpm
TVA Study #2 This was a full forced response study by IDC Technical, Metamora, IL, involving a variety of couplings and connected equipment [15].
Driver: Caterpillar G3516 V16 engine
Couplings: Brand ‘A1’ 19” OD Kt = 104 Brand ‘B1’ 19” OD Kt = 108 Brand ‘C1’ 18” OD Kt = 120 Brand ‘A2’ 16.75” OD Kt = 73 Brand ‘B2’ 16.75” OD Kt = 83 Brand ‘C2’ 15” OD Kt = 82Driven: Ariel JGE/4 compressor & Ariel JGT/4 compressor
Opr Cond: 1000 kW @ 1400 rpm
The report is too lengthy to include here, but Figure 31 is one sample page. Conclusion: all stresses and amplitudes for all combinations of couplings and compressors remained within allowable limits regardless of coupling type.
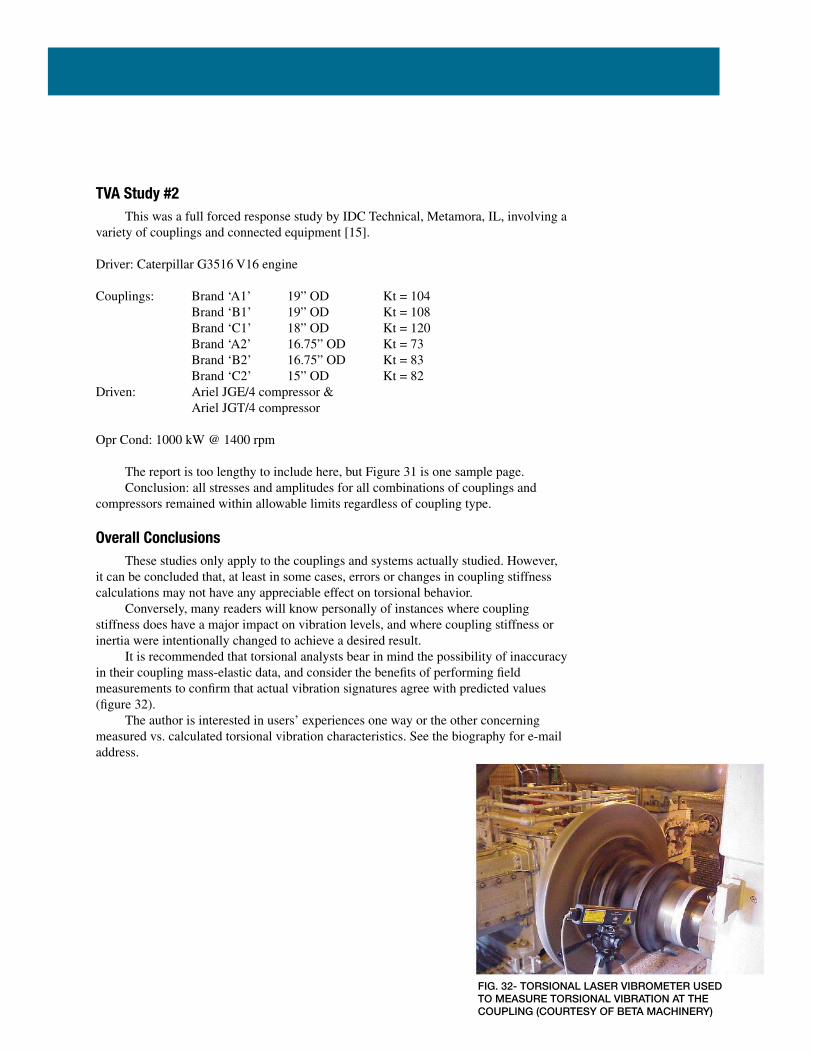
Overall Conclusions These studies only apply to the couplings and systems actually studied. However, it can be concluded that, at least in some cases, errors or changes in coupling stiffness calculations may not have any appreciable effect on torsional behavior. Conversely, many readers will know personally of instances where coupling stiffness does have a major impact on vibration levels, and where coupling stiffness or inertia were intentionally changed to achieve a desired result. It is recommended that torsional analysts bear in mind the possibility of inaccuracy in their coupling mass-elastic data, and consider the benefits of performing field measurements to confirm that actual vibration signatures agree with predicted values (figure 32). The author is interested in users’ experiences one way or the other concerning measured vs. calculated torsional vibration characteristics. See the biography for e-mail address.
FIG. 32- TORSIONAL LASER VIBROMETER USEDTO MEASURE TORSIONAL VIBRATION AT THECOUPLING (COURTESY OF BETA MACHINERY)
... (17)KFLG = π x G x DBC2 x B2 x F(DBC2 - B2) x 8.89
... (16)KFLG = π x G x DBC2 x OD2 x F x .753.8 x (DBC2 - OD2) x (F + .3).29
... (15)KFLG = E x ADF3 x DBC1.91x F2
1.1 x (DBC - OD)
... (18)KPaCK = F2 x DBC1.1 x ((ODDISC x F1) - IDDISC) ) x t x Nd x E x 1.1 x F3
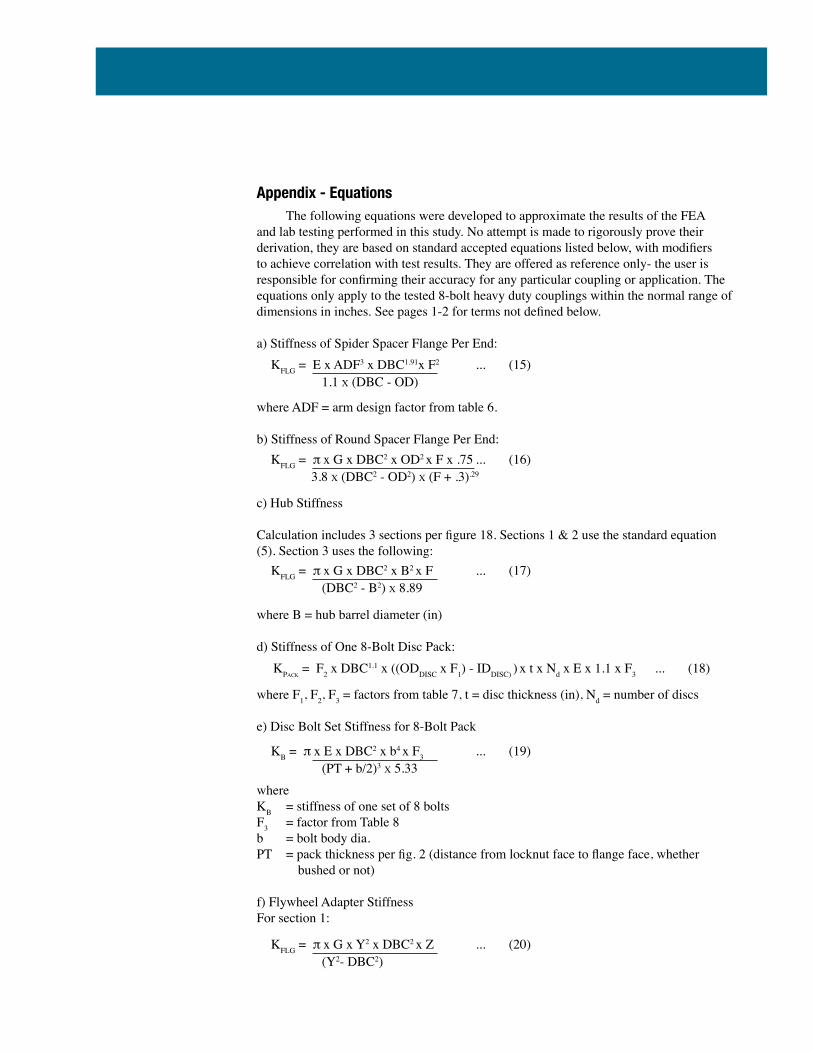
Appendix - Equations The following equations were developed to approximate the results of the FEA and lab testing performed in this study. No attempt is made to rigorously prove their derivation, they are based on standard accepted equations listed below, with modifiers to achieve correlation with test results. They are offered as reference only- the user is responsible for confirming their accuracy for any particular coupling or application. The equations only apply to the tested 8-bolt heavy duty couplings within the normal range of dimensions in inches. See pages 1-2 for terms not defined below.
a) Stiffness of Spider Spacer Flange Per End:
where ADF = arm design factor from table 6.
b) Stiffness of Round Spacer Flange Per End:
c) Hub Stiffness
Calculation includes 3 sections per figure 18. Sections 1 & 2 use the standard equation (5). Section 3 uses the following:
where B = hub barrel diameter (in)
d) Stiffness of One 8-Bolt Disc Pack:
where F1, F2, F3 = factors from table 7, t = disc thickness (in), Nd = number of discs
e) Disc Bolt Set Stiffness for 8-Bolt Pack
whereKB = stiffness of one set of 8 boltsF3 = factor from Table 8b = bolt body dia.PT = pack thickness per fig. 2 (distance from locknut face to flange face, whether
bushed or not)
f) Flywheel Adapter StiffnessFor section 1:
... (19)KB = π x E x DBC2 x b4 x F3
(PT + b/2)3 x 5.33
... (20)KFLG = π x G x Y2 x DBC2 x Z(Y2- DBC2)
... (21)KTUBE = π x G x (DBC4 - Q4) x .6532 x (V - Z/2)
... (22)K = .3 / (1/KFLG + 1/KTUBE)
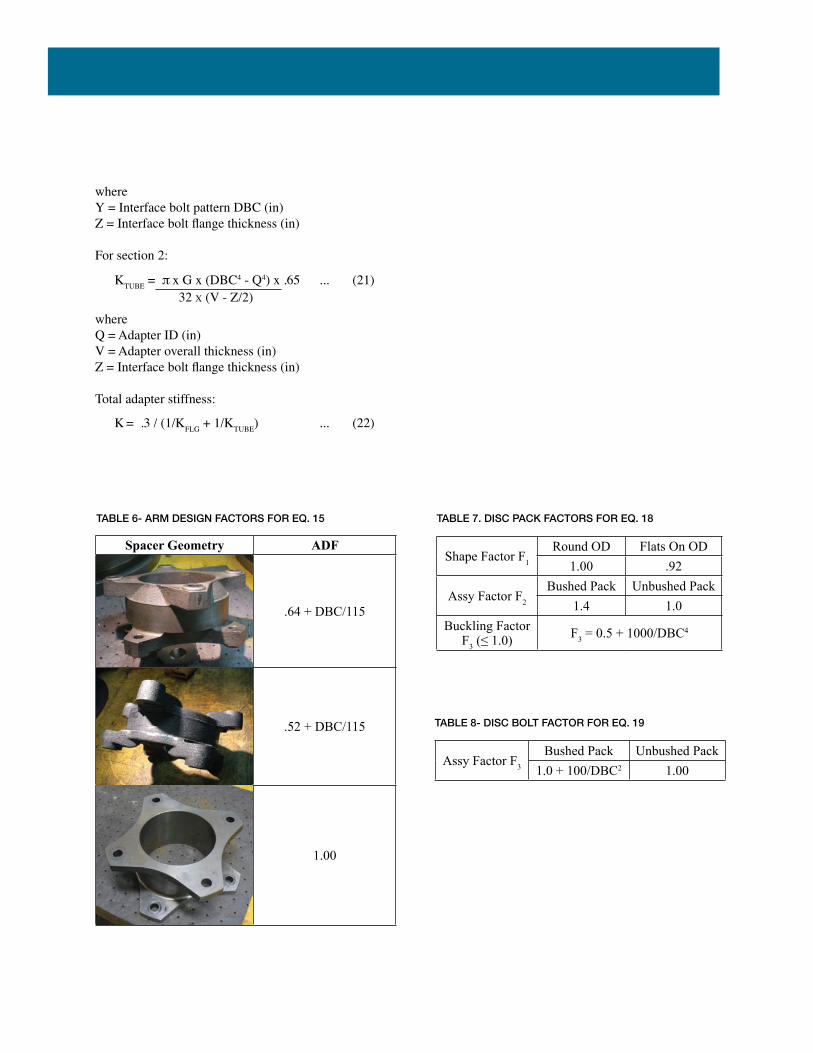
whereY = Interface bolt pattern DBC (in)Z = Interface bolt flange thickness (in)
For section 2:
whereQ = Adapter ID (in)V = Adapter overall thickness (in)Z = Interface bolt flange thickness (in)
Total adapter stiffness:
Spacer Geometry ADF
.64 + DBC/115
.52 + DBC/115
1.00
Rexnord CMR
Ameridrives GC
TABLE 6- ARM DESIGN FACTORS FOR EQ. 15
Shape Factor F1
Round OD Flats On OD1.00 .92
Assy Factor F2
Bushed Pack Unbushed Pack1.4 1.0
Buckling Factor F3 (≤ 1.0) F3 = 0.5 + 1000/DBC4
Assy Factor F3
Bushed Pack Unbushed Pack1.0 + 100/DBC2 1.00
TABLE 7. DISC PACK FACTORS FOR EQ. 18
TABLE 8- DISC BOLT FACTOR FOR EQ. 19
Biography For Sam Steiner Graduated from Penn State University with a Bachelor of Science degree in Mechanical Engineering. Employed with Zurn Industries - Mechanical Drives Division (MDD) in Erie PA from 1977-1989, involved with all phases of design, testing, manufacture, and sales of rotating flexible couplings. Active member of the AGMA Flexible Couplings Committee during this period. Worked as a design engineer and as department manager in the design and manufacture of large rubber mixers from 1989-2006, then returned to Zurn MDD in 2006, now known as Ameridrives Couplings.
E-mail: [email protected] or [email protected].
This paper was first presented at the Gas Machinery Research Council Conference, Oct. 3, 2007, Dallas TX.
References1. AGMA 9004-A99, Flexible Couplings-Mass
Elastic Properties and Other Characteristics, American Gear Manufacturers Association, Alexandria, VA, 1999.
2. Murray, Howes, Zacharias, & Chui of Beta Machinery Analysis, Sensitivity of Torsional Analyses to Uncertainty in Mass-Elastic Properties, presented at the ASME International Pipe Line Conference, Calgary, 1996.
3. Varty, R.V., and Harvey, J.D. of Beta Machinery Analysis, Torsional Vibration Modeling and Analysis Continued, GMRC Gas Machinery Conference, 2003
4. Den Hartog, J.P., Mechanical Vibrations, McGraw-Hill Book Company, New York, New York, 1956.
5. Wilson, W. Ker, Practical Solution of Torsional Vibration Problems Volume 1, Wiley & Sons, New York, New York, 1956.
6. Neale, M.J., Proceedings of the International Conference on Flexible Couplings for High Powers and Speeds, Neale & Associates Ltd., Surrey, England, 1977.
7. Mancuso, J.R., Couplings and Joints: Design, Selection, and Application, Marcel Dekker Inc., New York, New York, 1986.
8. API-671, Special-Purpose Couplings for Petroleum, Chemical, and Gas Industry Services, American Petroleum Institute, Washington D.C., 1998
9. Feese, T.D., and Hill, C.H. of Engineering Dynamics Inc., Guidelines for Improving Reliability of Reciprocating Machinery by Avoiding Torsional Vibration Problems, GMRC Gas Machinery Conference, 2001.
10. Murray, Howes, & Zacharias of Beta Machinery Analysis, A Systems Approach to Torsional Analysis, GMRC Gas Machinery Conference, 1995.
11. Varty, R.V., and Harvey, J.D. of Beta Machinery Analysis, Torsional Vibration: The Value of Field Verification, GMRC Gas Machinery Conference, 2004.
12. Stephens, T. of Ariel Corp., Torsional Case Studies on High Speed Separable Reciprocating Compressors, GMRC Gas Machinery Conference, 2004
13. Feese, T.D., and Hill, C.H. of Engineering Dynamics Inc., Guidelines for Preventing Torsional Vibration Problems in Reciprocating Machinery , GMRC Gas Machinery Conference, 2002
14. Zubritsky, P.D. of Advanced Vibration Solutions, memo of 8/28/06 to Ameridrives concerning torsional analysis.
15. Chundi, R.K. of IDC Technical Services, Torsional Study for Ameridrives International, report no’s 07-003-01 thru -03, 2007.
P-8456-AC 10/17
US (Application Assistance)+1-814-480-5095 www.ameridrives.com
Asia PacificFor a list of our AP sales offices: www.AltraMotion.com/ContactUs
About Altra Industrial Motion
Altra is a leading global designer and manufacturer of quality power transmission and motion control products utilized on a wide variety of industrial drivetrain applications. Altra clutches and brakes, couplings, gearing and PT component product lines are marketed under the industries most well known manufacturing brands. Each brand is committed to the guiding principles of operational excellence, continuous improvement and customer satisfaction. Highly-engineered Altra solutions are sold in over 70 countries and utilized in a variety of major industrial markets, including food processing, material handling, packaging machinery, mining, energy, automotive, primary metals, turf and garden and many others.
Altra’s leading brands include Ameridrives, Bauer Gear Motor, Bibby Turboflex, Boston Gear, Delroyd Worm Gear, Formsprag Clutch, Guardian Couplings, Huco, Industrial Clutch, Inertia Dynamics, Kilian, Lamiflex Couplings, Marland Clutch, Matrix, Nuttall Gear, Stieber Clutch, Stromag, Svendborg Brakes, TB Wood’s, Twiflex, Warner Electric, Warner Linear and Wichita Clutch.