review of highway cost allocation methodologies
TRANSCRIPT
Research Report KTC-92-6
REVIEW OF HIGHWAY COST ALLOCATION METHODOLOGIES
by
John A. Deacon Professor
Jerry G. Pigman Research Engineer
and
Nikiforos Stamatiadis Assistant Professor
Kentucky Transportation Center College of Engineering University of Kentucky
Lexington, Kentucky
in cooperation with
Kentucky Transportation Cabinet Commonwealth of Kentucky
and
Federal Highway Administration U.S. Department of Transportation
The contents of this report reflect the views of the authors who are responsible for the facts and accuracy of the data presented herein. The contents do not necessarily reflect the official views or
policies of the University of Kentucky, the Kentucky Transportation Cabinet, or the Federal Highway Administration. This report does not constitute a standard, specification, or regulation. The inclusion of manufacturer names and trade names is for identification purposes and is not to be considered an
endorsement.
June 1992
Technical Report Documentation Page
1. Report No. 2. Government Accession No. 3. Recipient's Catalog No.
KTC-92-6
4. Title and"'SUbtitle a:-ReffOffDife ·
June 1992 Review of Highway Cost Allocation Methodologies
6. Performing Organization Code
7. Author(s) 8. Pelforming Organization Report No.
J. A Deacon, J. G. Pigman, N. Stamatiadis KTC-92-6
9. Performing Organization Name and Address 10. Work Unit No. {TRAIS)
Kentucky Transportation Center College of Engineering 11. Contract or Grant No.
University of Kentucky KYHPR-91-134
Lexington, KY 40506-0043 13. Type of Report and Period Covered
Final 12. Sponsoring Agency Name and Address
Kentucky Transportation Cabinet State Office Building 14. Sponsoring Agency Code
Frankfort, KY 40622
15. Supplementary Notes Study Title: Review of Highway Cost Allocation Methodologies
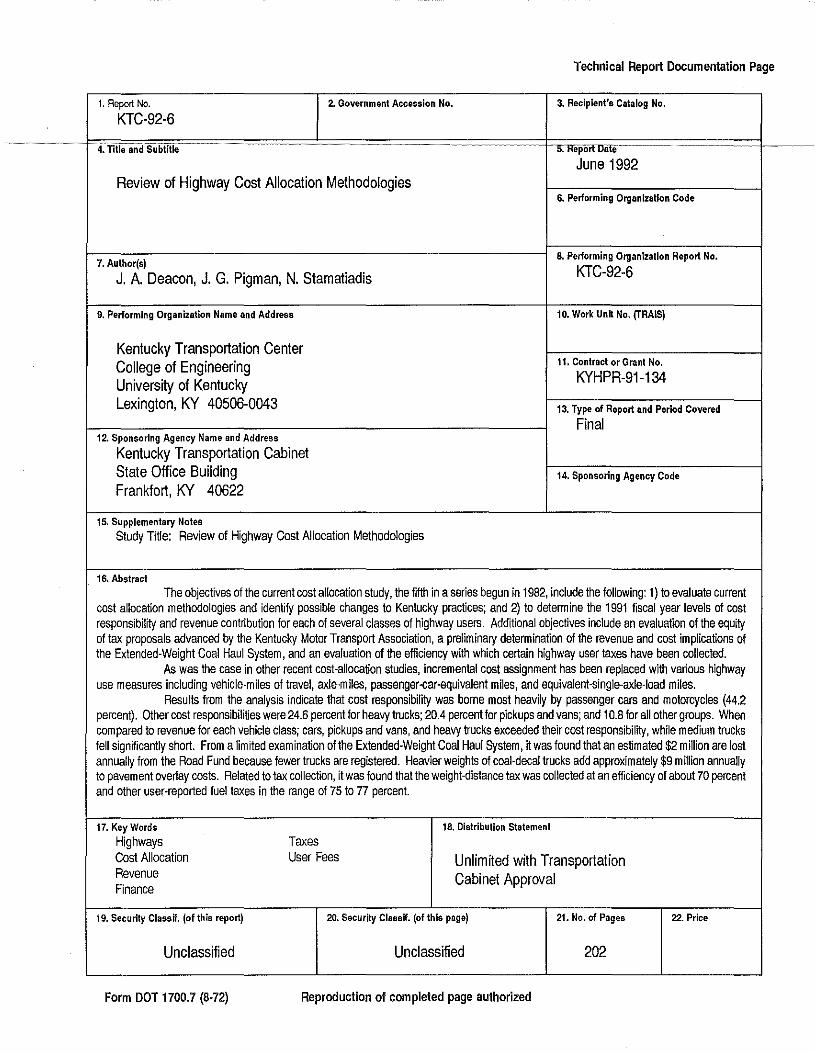
16. Abstract The objectives of the current cost allocation study, the fifth in a series begun in 1982, include the following: 1) to evaluate current
cost allocation methodologies and identify possible changes to Kentucky practices; and 2) to determine the 1991 fiscal year levels of cost responsibility and revenue contnbution for each of several classes of highway users. Additional objectives include an evaluation of the equity of tax proposals advanced by the Kentucky Motor Transport Association, a preliminary determination of the revenue and cost implications of the Extended-Weight Coal Haul System, and an evaluation of the efficiency with which certain highway user taxes have been collected.
As was the case in other recent cost-allocation studies, incremental cost assignment has been replaced with vanous highway use measures including vehicle-miles of travel, axle-miles, passenger-car-equivalent miles, and equivalent-single-axle-load miles.
Results from the analysis indicate that cost responsibility was borne most heavily by passenger cars and motorcycles (44.2 percent). Other cost responsibilities were 24.6 percent for heavy trucks; 20.4 percentfor pickups and vans; and 10.8 for all other groups. When compared to revenue for each vehicle class; cars, pickups and vans, and heavy trucks exceeded their cost responsibility, while medium trucks fell significantly short. From a limited examination of the Extended-Weight Coal Haul System, it was found that an estimated $2 million are lost annually from the Road Fund because fewer trucks are registered. Heavier weights of coal-decal trucks add approximately $9 million annually to pavement overlay costs. Related to tax collection, it was found that the weight-distance tax was collected at an efficiency of about 70 percent and other user-reported fuel taxes in the range of 75 to 77 percent.
17. Key Words 18. Distribution Statement
Highways Taxes Cost Allocation User Fees Unlimited with Transportation Revenue Cabinet Approval Finance
19. Security Class if. (of this report) 20. Security Class if. (of this page) 21. No. of Pages 22. Price
Unclassified Unclassified 202
Form DOT 1700.7 (8-72) Reproduction of completed page authorized
CONTENTS
Technical Report Documentation Page
Executive Summary . . . . . . . . . . . . . . . . . . . . . . . . . . . . . . . . . . . . . . . . . . . . . iii
Acknowledgements ............................................ viii
Introduction . . . . . . . . . . . . . . . . . . . . . . . . . . . . . . . . . . . . . . . . . . . . . . . . . . 1
Background and Overview . . . . . . . . . . . . . . . . . . . . . . . . . . . . . . . . . . . . . . . . 3
Survey of State Practices . . . . . . . . . . . . . . . . . . . . . . . . . . . . . . . . . . . . . . . . . 5
Introduction . . . . . . . . . . . . . . . . . . . . . . . . . . . . . . . . . . . . . . . . . . . . . . 5 Strategies . . . . . . . . . . . . . . . . . . . . . . . . . . . . . . . . . . . . . . . . . . . . . . . . 5 Highway Cost Allocation Studies . . . . . . . . . . . . . . . . . . . . . . . . . . . . . . . 7 Cost Allocation Methodologies . . . . . . . . . . . . . . . . . . . . . . . . . . . . . . . . . 9 Travel Trends .. ; . . . . . . . . . . . . . . . . . . . . . . . . . . . . . . . . . . . . . . . . . 11 Results . . . . . . . . . . . . . . . . . . . . . . . . . . . . . . . . . . . . . . . . . . . . . . . . . 12 Reliability of Highway Cost Allocation Studies . . . . . . . . . . . . . . . . . . . . . 13 Summary and Conclusions . . . . . . . . . . . . . . . . . . . . . . . . . . . . . . . . . . . 14
Special Investigation of Bridge Construction Costs . . . . . . . . . . . . . . . . . . . . . . 17
Modifications to 1990 Procedures . . . . . . . . . . . . . . . . . . . . . . . . . . . . . . . . . . 21
Distribution of Registered Truck Weights . . . . . . . . . . . . . . . . . . . . . . . . . . . . . 23
Analysis and Results . . . . . . . . . . . . . . . . . . . . . . . . . . . . . . . . . . . . . . . . . . . 25
Allocation of Highway Costs and Revenues . . . . . . . . . . . . . . . . . . . . . . . 25 Unit Cost and Revenue Estimates . . . . . . . . . . . . . . . . . . . . . . . . . . . . . . 26 Motor Carrier Industry Legislative Proposals . . . . . . . . . . . . . . . . . . . . . . 27 Extended-Weight System . . . . . . . . . . . . . . . . . . . . . . . . . . . . . . . . . . . . 29 Efficiency of Tax Collection . . . . . . . . . . . . . . . . . . . . . . . . . . . . . . . . . . 37
Summary and Findings . . . . . . . . . . . . . . . . . . . . . . . . . . . . . . . . . . . . . . . . . . 39
References . . . . . . . . . . . . . . . . . . . . . . . . . . . . . . . . . . . . . . . . . . . . . . . . . . 41
Tables . . . . . . . . . . . . . . . . . . . . . . . . . . . . . . . . . . . . . . . . . . . . . . . . . . 43
Figures . . . . . . . . . . . . . . . . . . . . . . . . . . . . . . . . . . . . . . . . . . . . . . . . . . 79
A Technical Documentation . . . . . . . . . . . . . . . . . . . . . . . . . . . . . . . . 87
B Identification of Cost and Revenue Elements . . . . . . . . . . . . . . . . . 107
C FY 1991 Cost Allocation Tables . . . . . . . . . . . . . . . . . . . . . . . . . . 115
D FY 1991 Revenue Allocation Tables ..... , . . . . . . . . . . . . . . . . . 139
E Interstate Travel . . . . . . . . . . . . . . . . . . . . . . . . . . . . . . . . . . . . . 151
F Extended-Weight System . . . . . . . . . . . . . . . . . . . . . . . . . . . . . . . 165
ii
EXECUTIVE SUMMARY
-~~~ ~ -~~n+~Geny~ar.s,costs-aLhigh1'lliY ... facilliies ha'L~neral~eeiL CQIIBQerec!J.Q_beJile~~~~~~ responsibility of highway users. Although the private sector has recently been called upon to assume more cost responsibility, highways are primarily financed from tax revenues and user tolls. A continuing task related to assessment of highway user fees is determination of the appropriate level of taxation for each class of highway user. Cost allocation in various forms has traditionally been a tool to achieve an equitable assignment of user responsibility. This highway cost allocation study is the fifth in a recent series begun in the early 1980s by the Transportation Cabinet and the Kentucky Transportation Center (formerly the Kentucky Transportation Research Program). Its primary objective is to determine the level of revenue contribution and cost responsibility for each class of highway user.
The current study parallels much of the work performed in Kentucky's previous studies; however, the process continues to be streamlined and automated to permit analyses to be performed and evaluated within relatively short periods of time. As was the case in the two most recent studies, various highway use and wear measures including vehicle-miles of travel, axle-miles, passenger-car-equivalent-miles, and equivalent-single-axle-load-miles have been used as the basis for cost allocations. The base year for the study is fiscal year (FY) 1991, which is the most recent time period for which revenue and cost data are available. Highway use or travel activity is generally reported on a calendar-year basis, and 1990 has been used because it is the most recent year for which complete data are available.
Highway user classes, with which revenue and cost responsibility were associated, totaled 17 and included motorcycles, cars, buses, and 14 registered or declared weight classes of trucks. Primary sources of revenue allocated to the various classes of highway users include fuel taxes, registration or license fees, usage taxes, road tolls, other motor carrier taxes, other Federal taxes, and miscellaneous taxes and fees. Primary expenditure categories include construction, maintenance and operation, administration, and enforcement. Construction expenditures were further subdivided into preliminary design and engineering, rights of way, utilities, grading and drainage, pavements and shoulders, and bridges.
One of the objectives of this study was to review and evaluate recent highway cost allocation literature. This was achieved by comparing the current practices of five states to the method used by Kentucky. The review indicated that there is a wide variety of approaches taken by the several states. Most studies have adopted the general principles of the 1982 federal study, but a few have made adjustments to the methods used for cost allocation. The difference in the roadway types, the "basic" vehicle, the determination of expenditures and revenues, and the amount of travel by each vehicle class were reasons for different revenue-to-cost ratios among the states. The reliability and sensitivity of such studies were also examined, and it was determined that continuous evaluation and update are desirable.
iii
Another issue examined in this study was the construction costs for bridges and their allocation among the highway users. The literature review indicated that the incremental
----metOOd~s~i!.lel~sediorMlncating bridge J;_Ons!mc:!io~c:osJ~~-Ho~\\'~eyt!fLthis aJlQJ:oacJlj:;not ideal for bridge cost allocation because the cost of long-span bridges is relatively insensitive to traffic loads, bridge design procedures do not allow for accurate modeling of incremental costs, and incremental cost procedures are time consuming and costly. A more reasonable approach is allocation of costs by PCE-miles or by a combination of PCE-miles to allocate basic costs and ton-miles to allocate residual (truck) costs.
A basic premise of this study was that only the state-maintained system of highways should be of interest to those attempting to recoup costs (by assigning them to the appropriate highway user) expended to construct and maintain the system. In 1990, the state-maintained highway system comprised approximately 28,000 miles of the 70,000 miles of roads and streets in Kentucky while accommodating approximately 90 percent of all travel in the state. Expenditures on Kentucky's roads and streets by the Transportation Cabinet totaled approximately $1,007 million, of which $845 million or 84 percent was spent on improving, maintaining, and operating the state-maintained system. Road Fund receipts totaled $1,007 million, of which $853 million was categorized as revenues attributed to state-maintained highways.
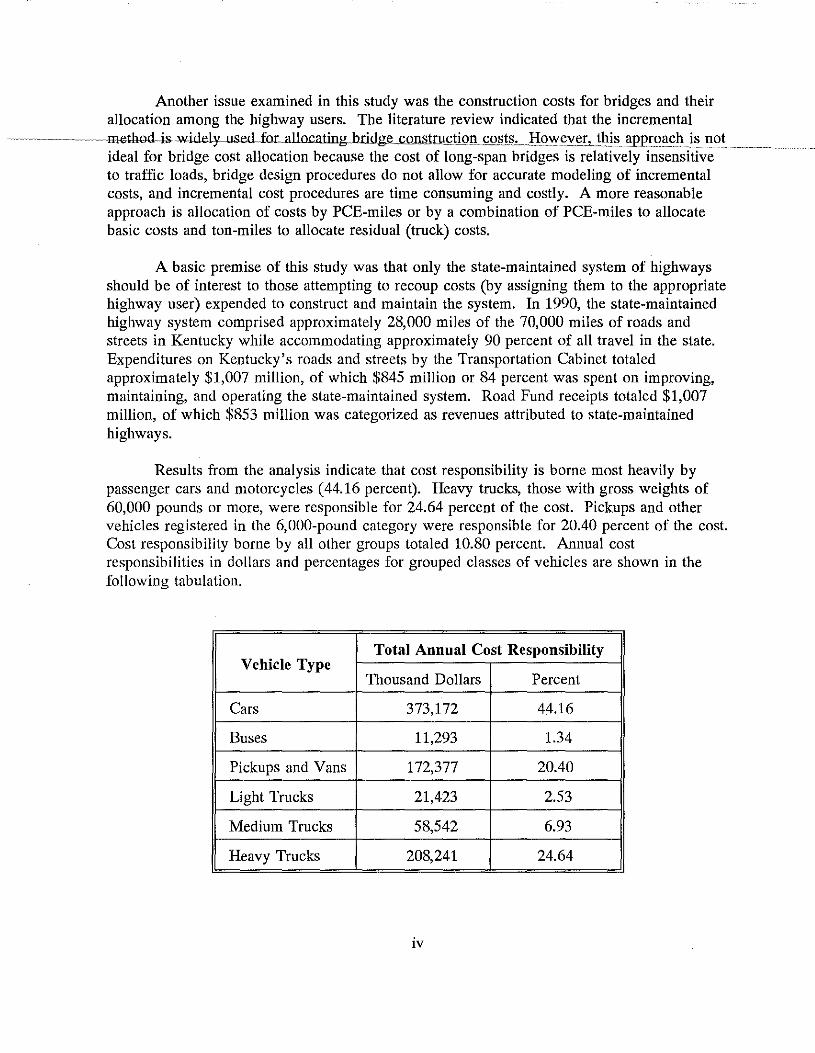
Results from the analysis indicate that cost responsibility is borne most heavily by passenger cars and motorcycles (44.16 percent). Heavy trucks, those with gross weights of 60,000 pounds or more, were responsible for 24.64 percent of the cost. Pickups and other vehicles registered in the 6,000-pound category were responsible for 20.40 percent of the cost. Cost responsibility borne by all other groups totaled 10.80 percent. Annual cost responsibilities in dollars and percentages for grouped classes of vehicles are shown in the following tabulation.
Total Annual Cost Responsibility Vehicle Type
Thousand Dollars Percent
Cars 373,172 44.16
Buses 11,293 1.34
Pickups and Vans 172,377 20.40
Light Trucks 21,423 2.53
Medium Trucks 58,542 6.93
Heavy Trucks 208,241 24.64
iv
-----
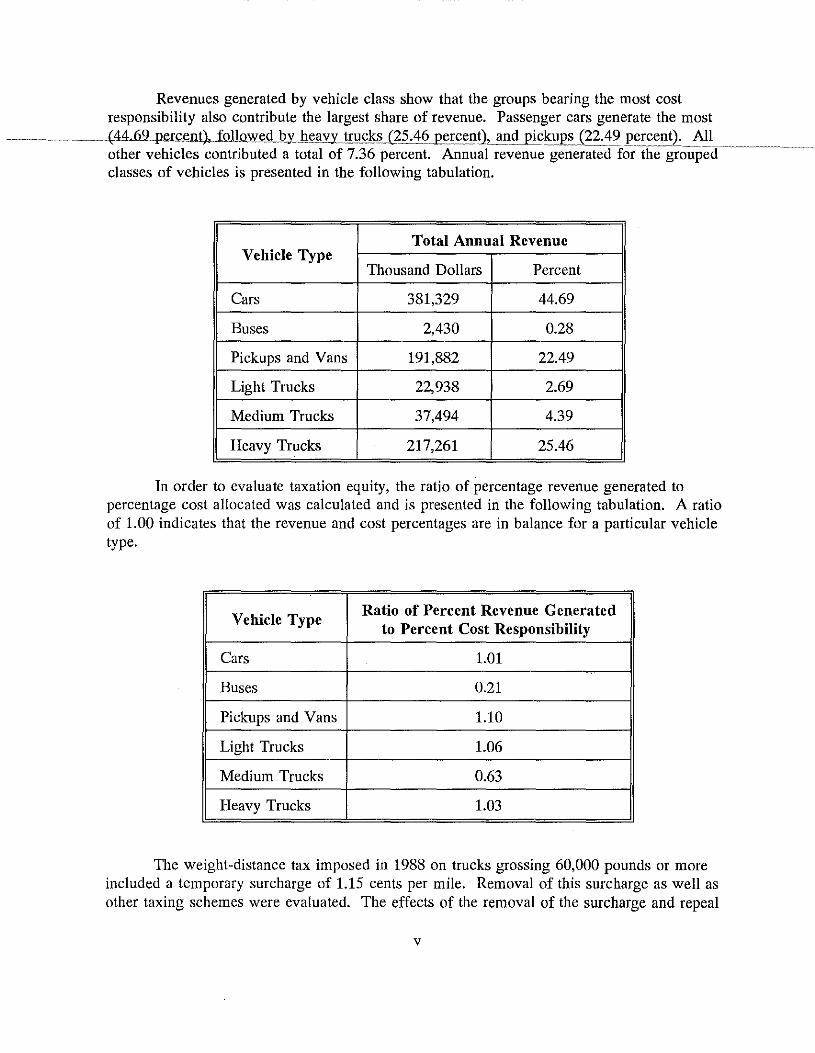
Revenues generated by vehicle class show that the groups bearing the most cost responsibility also contribute the largest share of revenue. Passenger cars generate the most
~~-~--{44.69 p=nl)._fo)loJ,Ye<,Ll2y_J!~gyy_truc]<:§ __ (~~~4fi_p~r<;ent)Llll1_d_pic:kup_s_(22.49 percent). All other vehicles contributed a total of 7.36 percent. Annual revenue generatei.Cfor-i.he-groupe"d classes of vehicles is presented in the following tabulation.
Total Annual Revenue Vehicle Type
Thousand Dollars Percent
Cars 381,329 44.69
Buses 2,430 0.28
Pickups and Vans 191,882 22.49
Light Trucks 22,938 2.69
Medium Trucks 37,494 4.39
Heavy Trucks 217,261 25.46
In order to evaluate taxation equity, the ratio of percentage revenue generated to percentage cost allocated was calculated and is presented in the following tabulation. A ratio of 1.00 indicates that the revenue and cost percentages are in balance for a particular vehicle type.
Vehicle Type Ratio of Percent Revenue Generated
to Percent Cost Responsibility
Cars 1.01
Buses 0.21
Pickups and Vans 1.10
Light Trucks 1.06
Medium Trucks 0.63
Heavy Trucks 1.03
The weight-distance tax imposed in 1988 on trucks grossing 60,000 pounds or more included a temporary surcharge of 1.15 cents per mile. Removal of this surcharge as well as other taxing schemes were evaluated. The effects of the removal of the surcharge and repeal
v
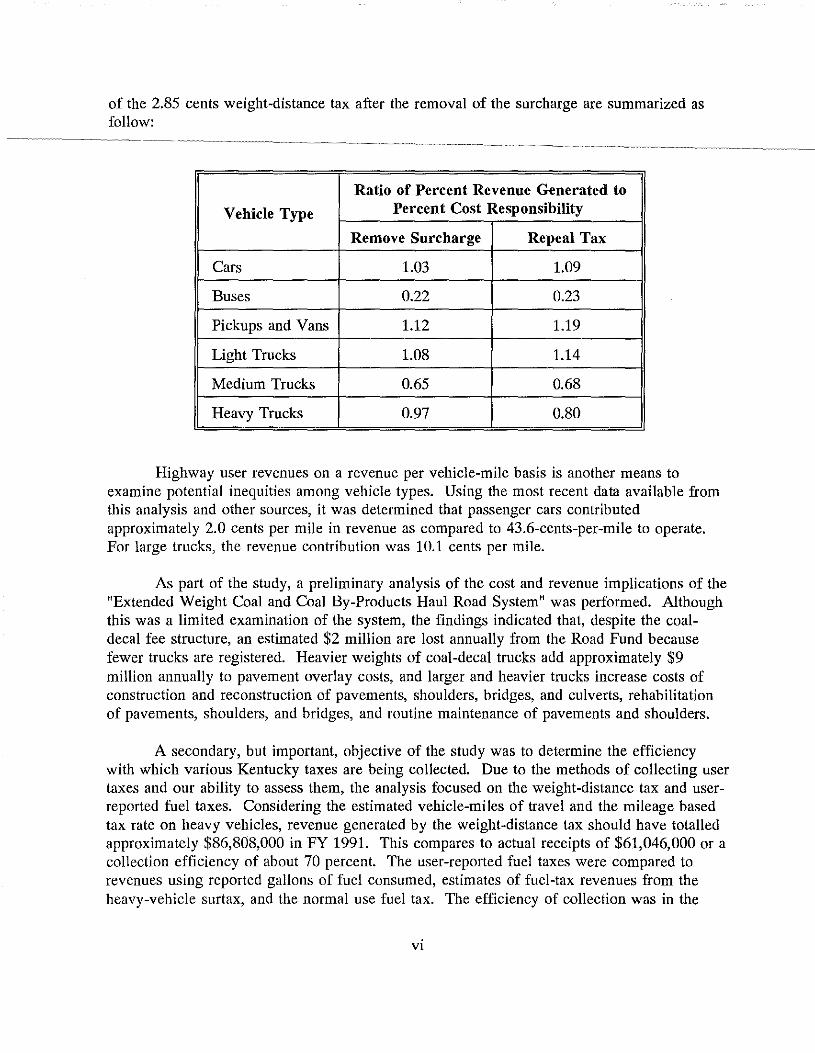
of the 2.85 cents weight-distance tax after the removal of the surcharge are summarized as follow:
Ratio of Percent Revenue Generated to
Vehicle Type Percent Cost Responsibility
Remove Surcharge Repeal Tax
Cars 1.03 1.09
Buses 0.22 0.23
Pickups and Vans 1.12 1.19
Light Trucks 1.08 1.14
Medium Trucks 0.65 0.68
Heavy Trucks 0.97 0.80
Highway user revenues on a revenue per vehicle-mile basis is another means to examine potential inequities among vehicle types. Using the most recent data available from this analysis and other sources, it was determined that passenger cars contributed approximately 2.0 cents per mile in revenue as compared to 43.6-cents-per-mile to operate. For large trucks, the revenue contribution was 10.1 cents per mile.
As part of the study, a preliminary analysis of the cost and revenue implications of the "Extended Weight Coal and Coal By-Products Haul Road System" was performed. Although this was a limited examination of the system, the findings indicated that, despite the coaldecal fee structure, an estimated $2 million are lost annually from the Road Fund because fewer trucks are registered. Heavier weights of coal-decal trucks add approximately $9 million annually to pavement overlay costs, and larger and heavier trucks increase costs of construction and reconstruction of pavements, shoulders, bridges, and culverts, rehabilitation of pavements, shoulders, and bridges, and routine maintenance of pavements and shoulders.
A secondary, but important, objective of the study was to determine the efficiency with which various Kentucky taxes are being collected. Due to the methods of collecting user taxes and our ability to assess them, the analysis focused on the weight-distance tax and userreported fuel taxes. Considering the estimated vehicle-miles of travel and the mileage based tax rate on heavy vehicles, revenue generated by the weight-distance tax should have totalled approximately $86,808,000 in FY 1991. This compares to actual receipts of $61,046,000 or a collection efficiency of about 70 percent. The user-reported fuel taxes were compared to revenues using reported gallons of fuel consumed, estimates of fuel-tax revenues from the heavy-vehicle surtax, and the normal use fuel tax. The efficiency of collection was in the
Vl
range of 75 to 77 percent. These rates indicate a moderate improvement in the efficiency of tax collection since FY 1989.
vii
ACKNOWLEDGEMENTS
------~This tepm t was p1 epared-i11 e8flSt!Hatien-4th~d-HIHisr-~idance ~f the4'o!lowing members of the St11dy Advisory Committee:
David E. Smith, Chairman, Department of Highways, Assistant State Highway Engineer for Planning
George AsbHry, Department of Highways, Division of Maintenance Mike Hancock, Department of Highways, Programming Staff Glenn Jilek, Federal Highway Administration, KentHcky Division Glenn Mitchell, Transportation Cabinet, Office of Policy and B11dget Sandra G. Pullen, Transportation Cabinet, Secretary's Office Bruce Siria, Department of Highways, Division of Specialized Programs
Others whose contributions to this study are also gratefully acknowledged include the following:
Charles Briggs, Department of Highways, Division of Maintenance Jim Burchett, Department of Highways, Division of Specialized Programs Mildred Carter, Department of Vehicle Regulation, Division of Motor Vehicle
Licensing Jon D. Clark, Department of Administrative Services, Division of Automated Services Elwood Conway, Department of Information Systems, Division of Systems
Engineering John Dade, Department of Highways, Division of Specialized Programs Carl Dixon, Department of Highways, Division of Planning Lewis Dotson, Department of Vehicle Regulation, Division of Motor Carriers Jim Roberts, Transportation Cabinet, Secretary's Office Steve Taylor, Department of Rural and Municipal Aid
Finally, an expression of appreciation is also extended to the following employees of the Kentucky Transportation Center for their contributions toward completion of this research report: Jo Ann Browning, David Cain, Scott Cochran, Carla Crossfield, and Kurt Godshall.
viii
INTRODUCTION
--~~~-~---m:meunifea~aTes;~govemnrellrblmrS primmy respunsibilityW.prtWitling~iJ:rul---~~~-~-~ -~~~-~~ maintaining public roads and streets. Although the private sector has recently been called upon to shoulder more of the load, highways are largely financed from tax revenues and user tolls. Primary goals of those responsible for drafting highway tax legislation include an equitable assignment of responsibility to various groups of taxpayers and an efficient system for tax administration. Highway cost allocation studies seek to assure that the goals of equity and efficiency are met.
To pay for roads, both general taxes and those scaled specifically to road use are collected. In Kentucky, almost all of the revenue for financing the state highway system is generated from either user taxes or from tolls. Since the issue of user vs. non-user responsibility is thus largely preempted, the focus of state highway cost allocation studies in Kentucky is narrowed to one of assigning cost responsibility to the several groups of road users. Estimates are also required of the contributions of each group to revenue collections.
The primary objectives of the highway cost allocation study reported herein--the fifth of a recent series begun in 1982--include the following:
• to evaluate current cost allocation methodologies and to identify and implement desired changes to Kentucky practices;
• to determine an equitable assignment of cost responsibility to the various classes of highway users in Kentucky;
• to estimate current revenue contributions from these classes based on current taxation policy; and
• to determine the extent to which each user class is meeting its cost responsibility.
Additional objectives include an evaluation of the equity of tax proposals being advanced by the Kentucky Motor Transport Association, a preliminary determination of the revenue and cost implications of the extend~!d-weight coal haul system, and an evaluation of the efficiency with which certain of Kentucky's taxes are being collected.
This report begins by presenting an overview of highway cost allocation studies completed previously. Next, a survey of state practices is presented where several methodological issues are analyzed. Then, an overview of the bridge construction costs is given. Next, methodological modifications incorporated following the 1990 study are identified. At this point, the distribution of the registered truck weights is presented. The next section presents the analysis and results of the study followed by its summary and
1
findings. A set of Appendices is also included presenting all the technical documentation and supporting data.
2
·-·.·'
BACKGROUND AND OVERVIEW
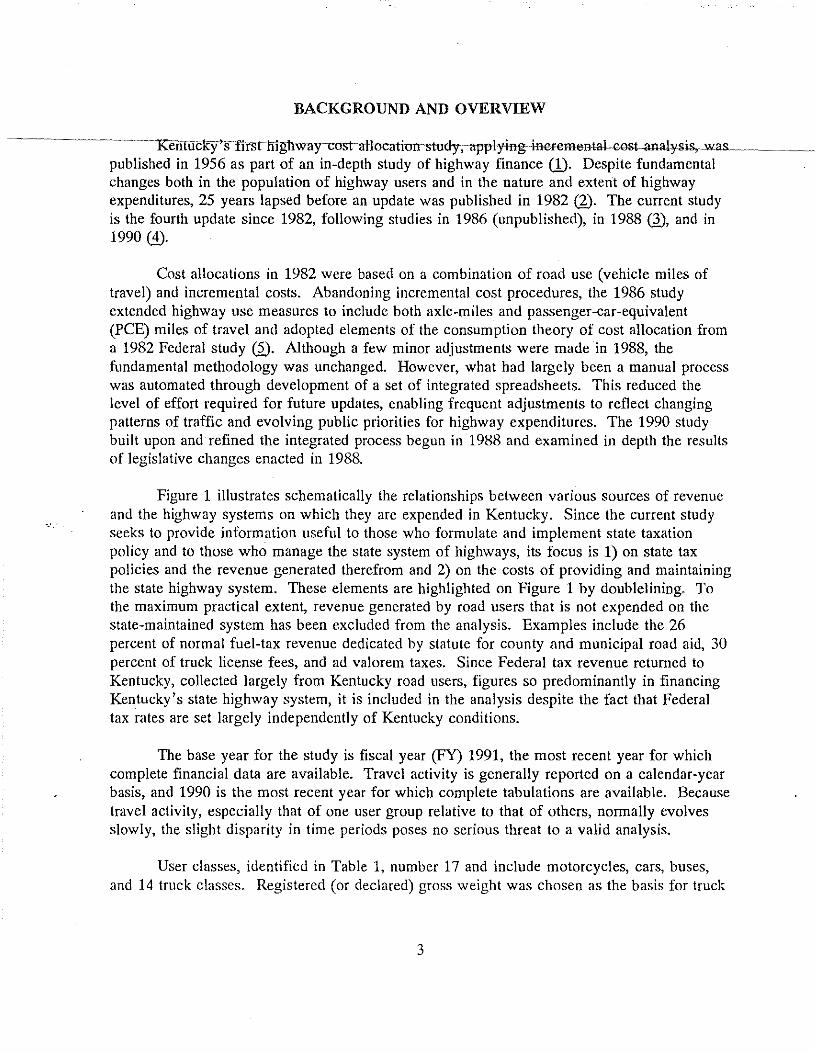
--------Kentiic1ey'lnrrsrhtghway<:ost-aHucatiurrstudy;wJ'ing-irHOFenHmtal-~t-anal:ysis,._was__ .. _~-published in 1956 as part of an in-depth study of highway finance (1). Despite fundamental changes both in the population of highway users and in the nature and extent of highway expenditures, 25 years lapsed before an update was published in 1982 G). The current study is the fourth update since 1982, following studies in 1986 (unpublished), in 1988 Q), and in 1990 (±).
Cost allocations in 1982 were based on a combination of road use (vehicle miles of travel) and incremental costs. Abandoning incremental cost procedures, the 1986 study extended highway use measures to include both axle-miles and passenger-car-equivalent (PCE) miles of travel and adopted elements of the consumption theory of cost allocation from a 1982 Federal study G). Although a few minor adjustments were made in 1988, the fundamental methodology was unchanged. However, what had largely been a manual process was automated through development of a set of integrated spreadsheets. This reduced the level of effort required for future updates, enabling frequent adjustments to reflect changing patterns of traffic and evolving public priorities for highway expenditures. The 1990 study built upon and refined the integrated process begun in 1988 and examined in depth the results of legislative changes enacted in 1988.
Figure 1 illustrates schematically the relationships between various sources of revenue and the highway systems on which they are expended in Kentucky. Since the current study seeks to provide information useful to those who formulate and implement state taxation policy and to those who manage the state system of highways, its focus is 1) on state tax policies and the revenue generated therefrom and 2) on the costs of providing and maintaining the state highway system. These elements are highlighted on Figure 1 by doublelining. To the maximum practical extent, revenue generated by road users that is not expended on the state-maintained system has been excluded from the analysis. Examples include the 26 percent of normal fuel-tax revenue dedicated by statute for county and municipal road aid, 30 percent of truck license fees, and ad valorem taxes. Since Federal tax revenue returned to Kentucky, collected largely from Kentucky road users, figures so predominantly in financing Kentucky's state highway system, it is included in the analysis despite the fact that Federal tax rates are set largely independently of Kentucky conditions.
The base year for the study is fiscal year (FY) 1991, the most recent year for which complete financial data are available. Travel activity is generally reported on a calendar-year basis, and 1990 is the most recent year for which complete tabulations are available. Because travel activity, especially that of one user group relative to that of others, normally evolves slowly, the slight disparity in time periods poses no serious threat to a valid analysis.
User classes, identified in Table 1, number 17 and include motorcycles, cars, buses, and 14 truck classes. Registered (or declared) gross weight was chosen as the basis for truck
3
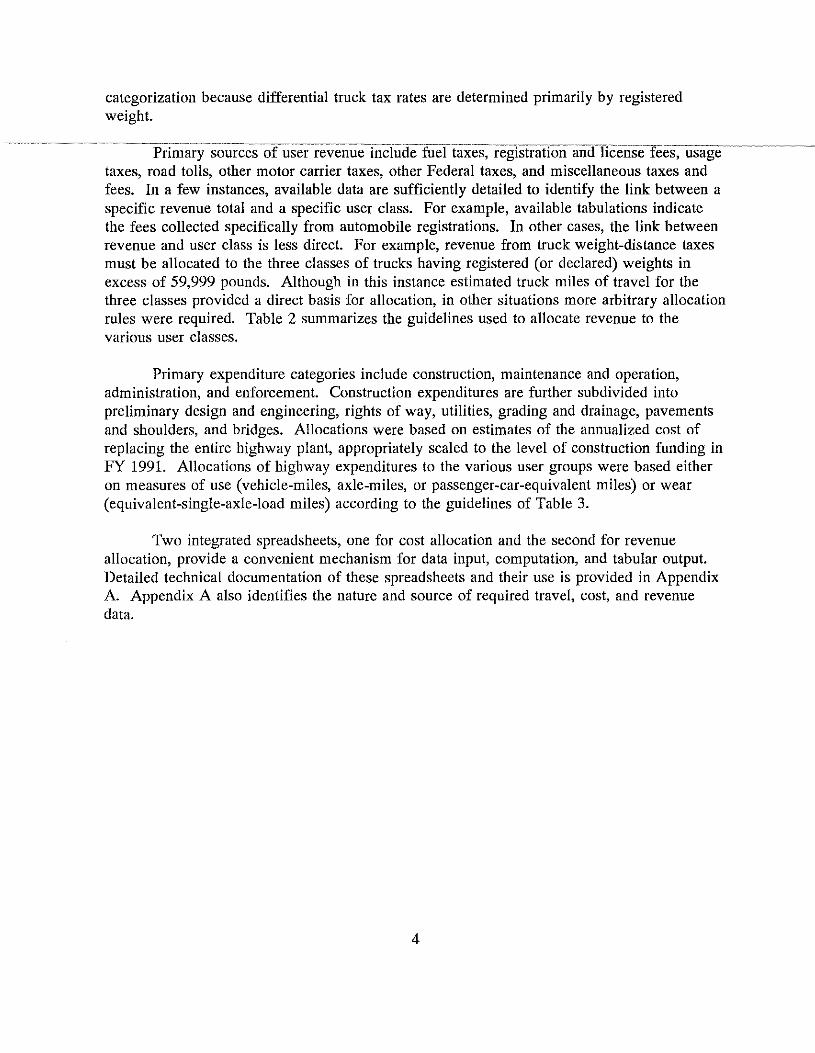
categorization because differential truck tax rates are determined primarily by registered weight.
Primary salircesorliserreveillie-iii:CTi.icfe--fiieltaxeS,-regfstratfoii~anlflicense-Iees~-usage taxes, road tolls, other motor carrier taxes, other Federal taxes, and miscellaneous taxes and fees. In a few instances, available data are sufficiently detailed to identify the link between a specific revenue total and a specific user class. For example, available tabulations indicate the fees collected specifically from automobile registrations. In other cases, the link between revenue and user class is less direct. For example, revenue from truck weight-distance taxes must be allocated to the three classes of trucks having registered (or declared) weights in excess of 59,999 pounds. Although in this instance estimated truck miles of travel for the three classes provided a direct basis for allocation, in other situations more arbitrary allocation rules were required. Table 2 summarizes the guidelines used to allocate revenue to the various user classes.
Primary expenditure categories include construction, maintenance and operation, administration, and enforcement. Construction expenditures are further subdivided into preliminary design and engineering, rights of way, utilities, grading and drainage, pavements and shoulders, and bridges. Allocations were based on estimates of the annualized cost of replacing the entire highway plant, appropriately scaled to the level of construction funding in FY 1991. Allocations of highway expenditures to the various user groups were based either on measures of use (vehicle-miles, axle-miles, or passenger-car-equivalent miles) or wear (equivalent-single-axle-load miles) according to the guidelines of Table 3.
Two integrated spreadsheets, one for cost allocation and the second for revenue allocation, provide a convenient mechanism for data input, computation, and tabular output. Detailed technical documentation of these spreadsheets and their use is provided in Appendix A. Appendix A also identifies the nature and source of required travel, cost, and revenue data.
4
SURVEY OF STATE PRACTICES
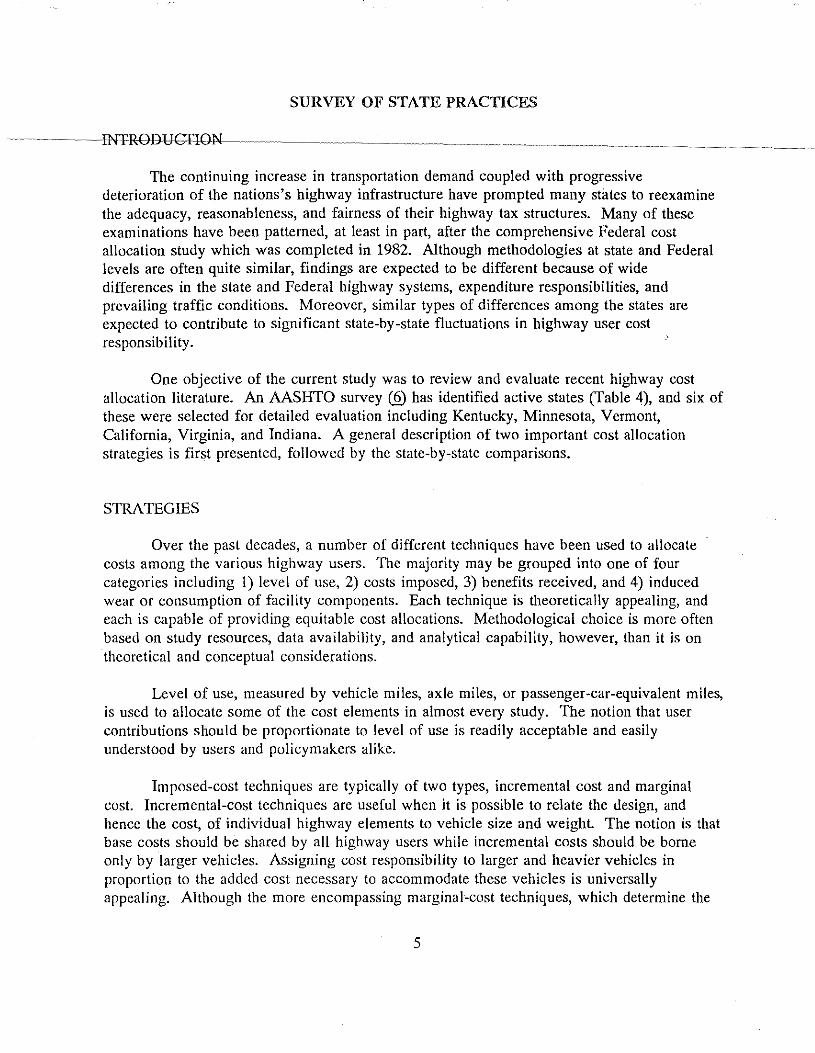
The continuing increase in transportation demand coupled with progressive deterioration of the nations's highway infrastructure have prompted many states to reexamine the adequacy, reasonableness, and fairness of their highway tax structures. Many of these examinations have been patterned, at least in part, after the comprehensive Federal cost allocation study which was completed in 1982. Although methodologies at state and Federal levels are often quite similar, findings are expected to be different because of wide differences in the state and Federal highway systems, expenditure responsibilities, and prevailing traffic conditions. Moreover, similar types of differences among the states are expected to contribute to significant state-by-state fluctuations in highway user cost responsibility.
One objective of the current study was to review and evaluate recent highway cost allocation literature. An AASHTO survey (§) has identified active states (Table 4), and six of these were selected for detailed evaluation including Kentucky, Minnesota, Vermont, California, Virginia, and Indiana. A general description of two important cost allocation strategies is first presented, followed by the state-by-state comparisons.
STRATEGIES
Over the past decades, a number of different techniques have been used to allocate costs among the various highway users. The majority may be grouped into one of four categories including 1) level of use, 2) costs imposed, 3) benefits received, and 4) induced wear or consumption of facility components. Each technique is theoretically appealing, and each is capable of providing equitable cost allocations. Methodological choice is more often based on study resources, data availability, and analytical capability, however, than it is on theoretical and conceptual considerations.
Level of use, measured by vehicle miles, axle miles, or passenger-car-equivalent miles, is used to allocate some of the cost elements in almost every study. The notion that user contributions should be proportionate to level of use is readily acceptable and easily understood by users and policymakers alike.
Imposed-cost techniques are typically of two types, incremental cost and marginal cost. Incremental-cost techniques are useful when it is possible to relate the design, and hence the cost, of individual highway elements to vehicle size and weight. The notion is that base costs should be shared by all highway users while incremental costs should be borne only by larger vehicles. Assigning cost responsibility to larger and heavier vehicles in proportion to the added cost necessary to accommodate these vehicles is universally appealing. Although the more encompassing marginal~cost techniques, which determine the
5
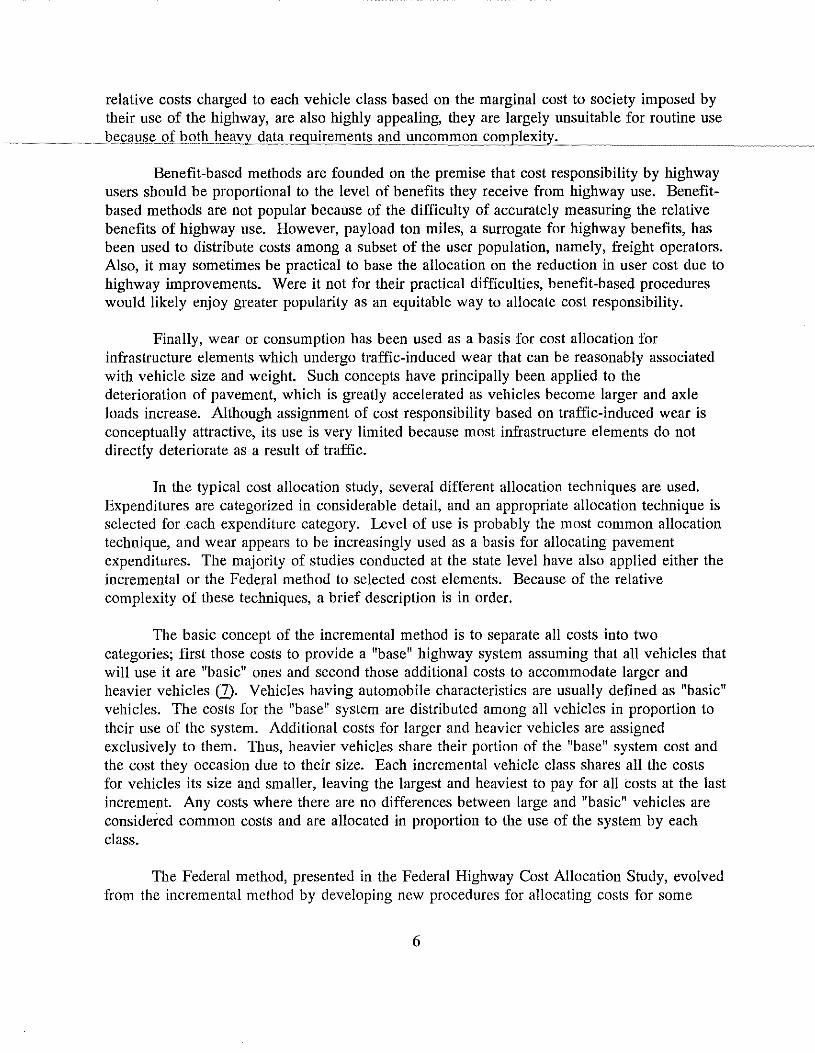
relative costs charged to each vehicle class based on the marginal cost to society imposed by their use of the highway, are also highly appealing, they are largely unsuitable for routine use
-----~beceiHI_~~-gLQgJL]}~(lyy_data requirements and uncommon complexity,
Benefit-based methods are founded on the premise that cost responsibility by highway users should be proportional to the level of benefits they receive from highway use. Benefitbased methods are not popular because of the difficulty of accurately measuring the relative benefits of highway use. However, payload ton miles, a surrogate for highway benefits, has been used to distribute costs among a subset of the user population, namely, freight operators. Also, it may sometimes be practical to base the allocation on the reduction in user cost due to highway improvements. Were it not for their practical difficulties, benefit-based procedures would likely enjoy greater popularity as an equitable way to allocate cost responsibility.
Finally, wear or consumption has been used as a basis for cost allocation for infrastructure elements which undergo traffic-induced wear that can be reasonably associated with vehicle size and weight. Such concepts have principally been applied to the deterioration of pavement, which is greatly accelerated as vehicles become larger and axle loads increase. Although assignment of cost responsibility based on traffic-induced wear is conceptually attractive, its use is very limited because most infrastructure elements do not directly deteriorate as a result of traffic.
In the typical cost allocation study, several different allocation techniques are used. Expenditures are categorized in considerable detail, and an appropriate allocation technique is selected for each expenditure category. Level of use is probably the most common allocation technique, and wear appears to be increasingly used as a basis for allocating pavement expenditures. The majority of studies conducted at the state level have also applied either the incremental or the Federal method to selected cost elements. Because of the relative complexity of these techniques, a brief description is in order.
The basic concept of the incremental method is to separate all costs into two categories; first those costs to provide a "base" highway system assuming that all vehicles that will use it are "basic" ones and second those additional costs to accommodate larger and heavier vehicles (]). Vehicles having automobile characteristics are usually defined as "basic" vehicles. The costs for the "base" system are distributed among all vehicles in proportion to their use of the system. Additional costs for larger and heavier vehicles are assigned exclusively to them. Thus, heavier vehicles share their portion of the "base" system cost and the cost they occasion due to their size. Each incremental vehicle class shares all the costs for vehicles its size and smaller, leaving the largest and heaviest to pay for all costs at the last increment. Any costs where there are no differences between large and "basic" vehicles are considered common costs and are allocated in proportion to the use of the system by each class.
The Federal method, presented in the Federal Highway Cost Allocation Study, evolved from the incremental method by developing new procedures for allocating costs for some
6
expenditures and adapting the procedures of the incremental method for others (2). The basic difference between the traditional incremental method and the Federal method is the way they
-~·--~----treat pav ement-eost~--T-be-Federal-m.<lthod-uses-a-m.inimum thickness_ method ior.ru:~lL __ _ pavement costs, where the costs are based upon the estimated strength required for a minimum pavement thickness without regard to any basic design vehicle. This method reduces the pavement thickness by removing equivalent single axle loads (ESALs) until reaching a point where any further removal will make construction of the pavement impractical. Pavement costs are distributed among vehicle classes in proportion to ESALs.
Pavement rehabilitation costs are also allocated differently between the two methodologies. The incremental method uses the same methodology as for new pavements, while the Federal method uses a consumption approach. This approach simulates consumption or wear of pavements using distress models. Another difference between the two methods is for replacement and repair costs for bridges. The incremental method uses the same incremental approach as for other expenditures. The Federal method allocates bridge replacement costs based upon a function which considers the reasons for replacement and treats the costs for bridge repairs as common costs.
Advocates of the Federal method argue that the incremental method provides all the economies of scale to heavier vehicles since the cost for adding pavement thickness is reduced drastically with every inch added. On the other hand, advocates of the incremental method argue that the "base" highway system would be constructed regardless of whether larger and heavier vehicles were allowed to use it. The Federal method of handling pavement rehabilitation and bridge replacement allocates more equitably the costs for these expenditures among vehicle classes. Previous highway cost allocation studies (HCASs) have shown that both methods produce similar results for all items other than pavements and bridges. If expenditures for pavements and bridges are large, then the two methods will produce different results. Some believe that, because of the importance of pavement expenditures, both methods should be applied and the results should be compared.
Because the Federal method has been endorsed by AASHTO, several studies completed at the state level present their results based on this method. However, some states are using both methods to present their findings but draw their recommendations from the Federal method.
HIGHWAY COST ALLOCATION STUDIES
The selected HCASs include those performed at the state level for Kentucky (±) and Virginia @), Minnesota (2), Vermont (!Q), California (!.!), and Indiana (11). The study performed for Virginia was completed in 1991, while the HCASs for Minnesota and Vermont were completed in 1990. The study for Kentucky was updated in 1990. Finally, the study for California was completed in 1987 and for Indiana, in 1984. These particular studies were selected for review herein because of their currency and the availability of suitable
7
documentation. First, the general characteristics of the studies will be presented, followed by a description of revenue sources, items of expenditures, and cost allocation methodologies
---Mlowed~by-~Gh-State.-~Finall)Lrthe-ratiouleterm i ning__theJ:q!lliy_blsue_'YiJll>~Jlre§~f!l!!ed~~a!l_d, __ _ discussed.
General Characteristics
The number of vehicle classes used by each state varied from a maximum of 14 in Kentucky and Indiana to a minimum of 9 in Vermont and Virginia. Minnesota and California included 10 vehicle classes. Kentucky truck study findings were also presented using 14 registered weight classes.
All states used functional classification as a basis for stratifying the highway system for analysis except Kentucky, where federal aid classification was used, and Virginia, where an administrative classification was used.
For the Minnesota study, the roadway system covered by state expenditures included the state trunk system, which serves interstate travel, and state aid highways which include the county state aid highway system and municipal state aid street system. The latter roadways are the responsibility of the local governments but projects are eligible to receive state aid. The study for Vermont indicated that state responsibility is limited to interstate, freeway, and principal arterial roadways. The study for California was primarily focused on the state highway system, but it was expanded to include expenditures for all local streets and roads. The study performed for Indiana included the entire highway system of the state excluding toll roads. Kentucky included all state maintained highways. Finally, the study for Virginia included all state maintained roads as determined by administrative classification.
Revenues
Minnesota revenues included fuel taxes, registration fees, license fees, and excise taxes. Vermont revenues included fuel taxes, registration fees, purchase and use taxes, and other fees that support the state's transportation fund. Virginia revenues were obtained from fuel taxes, road use taxes, motor vehicle sales and use tax, registration and license fees, excise taxes, and weight fees. California revenues included fuel taxes, weight fees, registration and license fees. Purchase (sales) taxes were excluded from California revenue sources. Indiana revenues included fuel taxes, registration fees, weight and use fees, and purchase taxes. License fees were excluded from Indiana revenues. Kentucky revenues included fuel taxes, registration and license fees, excise taxes, weight fees, purchase and use taxes, and toll road payments. For all states, non-user fees were excluded from the revenue sources.
Expenditures
Minnesota and Vermont expenditure classes included capital improvements, maintenance, commercial vehicle programs, and other programs. Expenditures related to
8
administration and enforcement were excluded. The HCASs for the remaining four states indicated that expenditures included capital outlay, maintenance, administrative, enforcement,
~~-~--~~~-anootller-pragrnrnsUJSts:~firaddition-ttr+hese-eolllffiOH~{}xpwditures,Caiifornia~jncl,,ded
expenditures for its Department of Motor Vehicles.
For all studies, capital improvement and capital outlay costs were the same. These costs were further divided into several subcategories which generally included new pavements, pavement rehabilitation, new bridges, bridge replacement, grading and drainage, preliminary design and construction engineering, and rights of way.
A comparison chart for the general characteristics, the revenue sources, and expenditure items is presented in Table 5.
COST ALLOCATION METHODOLOGIES
HCASs for Minnesota, Vermont, and California determined the responsibility for expenditures using both the incremental and Federal methods. Because these studies used the Federal method for their major findings, only these methodologies will be examined. The other three studies varied in the degree to which they followed the Federal method. The method applied by each HCAS is detailed for each expenditure category in the following sections.
New Pavement
Minnesota, Vermont, and California used the minimum pavement thickness method as adopted in the Federal procedure. Virginia allocated costs for new pavement using vehiclemiles of travel (VMT) for the basic pavement and ESALs for additional strength and width requirements. The basic pavement was defined as one with 6.5 or 7.5 inches of thickness, depending upon traffic volume, and 10 feet wide. Indiana modified the incremental method by determining pavement thickness increments instead of traffic increments and distributing the costs according to ESALs. The minimum pavement thickness was taken as 4.5 inches. The Kentucky study allocated pavement expenditures in proportion to ESAL-miles on each class of the state maintained system.
Pavement Rehabilitation
Minnesota and Vermont used the consumption method as developed in the Federal study. California applied the same method but the percentages between the load and non-load results are included indicating that 70 percent of the costs are distributed based on ESALs and 30 percent based on VMT. Virginia allocated pavement rehabilitation costs the same way as new pavement costs. Indiana used a similar methodology for load related portions as the one used for new pavements. For non-load portions, the costs were distributed according to VMT. The proportions between load and non-load related costs varied depending on the
9
location of the highway. Kentucky allocated these expenditures in proportion to axle-miles allocating 80 percent of the expenditures to all vehicles and the remaining 20 percent to
New Bridges
Minnesota, Vermont, California, and Indiana studies used an incremental analysis of bridge strength for the allocation of expenditures for new bridges. Virginia used the incremental analysis of structural construction cost developed by Sinclair and Associates (!.;1). Kentucky allocated the costs for new bridges in proportion to passenger car equivalent (PCE) miles.
Bridge Replacement
Minnesota, Vermont, and California used the Federal method which applies an incremental analysis of bridge strength and a special bridge replacement function. This function takes into consideration replacement costs incurred because of load bearing deficiencies and assigns these costs to vehicles operating at weights over the load bearing capacities of replaced bridges. Virginia indicated that load deficiencies are very small and determined that this analysis would be impractical. Indiana allocated these costs in proportion to ESALs, and Kentucky allocated the costs for bridge replacement similar to the way used for new bridges, that is, in proportion to PCE-miles.
Grading
Minnesota, Vermont, California, and Virginia used an incremental analysis of earthwork requirements as incorporated in the Federal method. The costs were allocated to vehicle classes (weight-to-power ratios) based on incremental savings in grading costs proportional to their VMT. Indiana used a similar method where the costs for the minimum road width (as defined by AASHTO standards) were allocated in proportion to VMT among all vehicle classes, and the remainder was allocated in proportion to PCE-miles. Kentucky allocated grading costs in proportion to PCE-miles.
Drainage
In the Minnesota, Vermont, and California studies, drainage expenditures were included in the grading component. Virginia used an incremental method for box culverts if the heights of fill above the structure were less than 10 feet and a proportional allocation by VMT if they were more than 10 feet. Indiana and Kentucky allocated these expenditures similar to the method for allocating grading costs.
10
Preliminary Design and Construction Engineering
~---Minnesota and_Y'ermilllLallm:ate~~tb~e~~c~ostlUiliing_lLPIQrate!Lhlll>i~QILQtll~t;rs;;!pjJl!l -----~ outlays for construction. Other studies allocated these expenditures in proportion to VMT. The only exception was Indiana, which excluded costs of preliminary design and construction engineering.
Right of Way
With one exception, all studies allocated these expenditures in proportion to VMT. Indiana was the only exception, where cost for the required basic right of way (as defined by AASHTO standards) was allocated in proportion to VMT, and costs for additional right of way were allocated in proportion to PCE-miles.
Enforcement
For all studies enforcement costs were allocated in proportion to VMT. This item of expenditures was not included in the Minnesota and Vermont studies.
Miscellaneous
Minnesota, Vermont, California, and Virginia allocated miscellaneous costs in proportion to VMT. Kentucky allocated them in proportion to axle miles. Miscellaneous expenditures were not included in the Indiana study.
A comparative chart summarizing the methodological issues adopted by each state is presented in Table 6.
TRAVEL TRENDS
Because each state used a different number of vehicle classes, the comparisons herein dictated the use of a "least-common-denominator" set of eight classes including automobiles, motorcycles, pickups and vans, buses, single-unit or straight trucks having two axles, singleunit trucks having three or more axles, combination trucks having four or fewer axles, and combination trucks having five or more axles. Table 7 presents the comparative travel trends for each state in a percentage form. The last line in this table identifies the total VMT for the highway system investigated by each state. Significant differences in the amount and composition of travel are readily apparent. For example, travel in the state of California far exceeds the travel in all other states. Moreover, there are surprisingly large differences among the states in the amount of combination truck travel with Kentucky and Indiana experiencing the heaviest concentrations.
11
RESULTS
~~~-~~ ---.~:-:
One uTtimate~purpose~on:osnrltocatiunotudieris~to-examinHht7~equity4}f~cost responsibilities and revenues generated by each vehicle class using the highway system. To determine this revenue-to-cost responsibility, ratios of revenue to cost for the various vehicle classes are often compared. A ratio of one indicates a balance between revenue generated by user taxes and the assigned or allocated cost responsibility. Revenue-cost ratios for each of the six states are presented in Table 8. This table indicates rather remarkable differences among the states. In Indiana, passenger vehicles bear much greater financial responsibility than their fair share of costs would indicate. On the other hand, truckers in California are shouldering the heavier tax burden. In the other four states, passenger vehicles seem to be more equitably treated by existing tax laws.
Disparity in the tax burden is even more evident between truck classes. Only in Vermont and, to a lesser extent, Virginia are operators of single unit or straight trucks and operators of combination trucks on equal footing. In California, Indiana, and Minnesota, straight trucks appear to bear a disproportionally large portion of the revenue responsibility. In Kentucky, on the other hand, combination trucks bear a larger tab than their straight-truck counterparts.
The rather large differences in revenue-cost ratios among the six states may be attributed to many factors including travel patterns, tax exemptions, topography and geography, current highway needs and expenditure patterns, and, of course, financial policy and tax law. Significant differences in travel patterns, for example, are evident among the six states. Even though the proportion of travel among the vehicle classes was somewhat similar, the fact is that actual VMT (or measures of travel other than percentages) influences the cost responsibility of the vehicle classes. Another reason for such differences is the inclusion/exclusion of tax exempt vehicles. It is possible that some states may have included tax-exempt vehicles in their travel projections and, because these vehicles did not pay their fair share of revenues, reliability of the revenue-cost ratios would be adversely affected.
Another factor affecting these ratios is the way that each state has defined the vehicle classes. As mentioned, several different schemes were used, and an attempt was made herein to bring all groups to a common basis. Different topographic conditions and geographic location for each state also play an important role in the determination of revenue-cost ratios. Each geographic region poses its own unique characteristics for travel, roadway design, and climatic conditions. These factors affect the allocation of revenues and expenditures among the various vehicle classes.
Differences in the revenue-cost ratios may also be attributed to the different highway system needs of each state. For example, states that place a high priority on the construction of new pavements will, thus, increase the cost responsibility of heavy trucks. On the other hand, if there is a need for more maintenance activities and pavement rehabilitation, then different cost responsibilities will be allocated. A detailed comparison of the proportions of
12
the expenditures by each type of activity was not feasible herein because of inconsistent reporting of expenditure data. Such differences may not only be noted among states but also col.ifcfprol5liolyl5e-Ol'Jservect-tlrrring-llfferent-time~eriods-f'DHhe-same~tate.~-------
The different ratios among the states for the various vehicle classes may also be attributed to different shares of cost responsibilities and revenues by each vehicle class. Tables 9 and 10 present the proportions of expenditures and revenues by vehicle class for each state. These figures indicate a wide variety of shares among the vehicle classes which may be attributed to factors such as identified above. For a number of states, the cost responsibility of combination trucks was high due to the high proportion of expenditures for new pavements and pavement rehabilitation.
Other useful comparisons include revenue and expenditure for each vehicle class expressed on a per vehicle-mile basis. These figures are presented in Tables 11 and 12. These methods facilitate comparisons among the various vehicle classes to determine the costs and revenues they generate based on their amounts of travel. Even though these methods are relatively inaccurate--because many expenditures and revenues are not based on VMT --they may be used for comparisons among the vehicle classes to determine the relative cost responsibility and revenue contribution. Again, a wide variety among the values in these tables is noted. Except for California, the cost responsibility of single unit trucks was more than double of that for passenger vehicles. Moreover, a greater variation existed between single unit and combination trucks than for passenger vehicles and trucks. On a per mile of travel basis, the cost responsibility for single unit trucks slightly exceeded that of combination trucks in Kentucky but was only about one fourth that of combinations in California. Similarly diverse patterns were noted for revenues per vehicle mile.
RELIABILITY OF HIGHWAY COST ALLOCATION STUDIES
Because the most important reason for conducting a HCAS is to determine if there is equity between costs generated by highway users and revenues attributed to them, it is apparent that their reliability and sensitivity are of central importance. In all studies, data limitations were mentioned as a problem. Traffic mix, relations between mileage and registered weights for trucks, and tax -exempt vehicles are some of the data items reported as being inadequate. A few studies mentioned the need to update data collection techniques to produce more accurate data. Kentucky completed a sensitivity analysis to test the impact of uncertainty of data on the final revenue-to-cost ratios. Results indicated that the impact of some variables was very high while, for others, the impact was likely to be minimal. Altogether, this preliminary analysis suggested that, pending the development of more refined estimates, the revenue-cost ratio developed using Kentucky data and procedures may be considered to be a normally distributed random variable having a coefficient of variation in the range of 5 to 11 percent.
13
Moreover, items that are included in the revenues and expenditures are not uniform among the states. For example, California, Minnesota, and Vermont included, as
~~~-~~~-~~~-~~~- expenditures,.__ai1Lprovided to Jocal au(horjties while the other states did not. The presence or absence of expenditure and revenue items i~-;~--imp;~(;;;iis~s~;;-;he_n_HCASsare~conctucie(C~~-~···~~~~-~-· At the present time, there are no universally accepted guidelines indicating which items should be included or excluded at the state level. A sensitivity analysis included in the California study indicated that the inclusion of a comprehensive set of programs related to highways (inclusion of expenditures for Department of Motor Vehicles, enforcement, and other mass transit programs) resulted in lower equity ratios for light trucks and higher ratios for heavy vehicles.
Also, all studies noted the need to continuously update the data base and to perform periodic evaluation of the cost responsibilities and revenue generation of the various classes of highway users. The completion of a HCAS should not be considered as a one-time event but rather should be viewed as part of a continuous process with periodic updates. Inflation, changes in travel patterns, new taxation schemes, new trends in vehicle registrations, and changes in highway needs are factors that influence the revenues and expenditures and therefore may change the status of certain users relative to taxation equity. It is reasonable to assume that the states will go through a dynamic process where changes will occur over time. For example, highway system needs are shifting from construction of new pavements to maintenance and rehabilitation. Such a change will affect the proportion of expenditures between new pavements and rehabilitation, and, as a result, will affect the cost responsibilities of all vehicle classes.
Another important issue which may reduce the reliability of these studies is the definition of the "base" highway system and "basic" vehicle. For those expenditures allocated among vehicle classes based on an incremental method, such definition is essential and may vary among the states. For example, Virginia used two different "basic" pavement thicknesses depending on traffic volume while Indiana used one for all roads. Similarly, Virginia assumed a 10-foot wide pavement as the base width and Indiana, a 9-foot wide pavement. Other studies suggest that 12-foot pavements should be the minimum width, both for safety reasons and due to the fact that this width is used currently for designing and constructing most new highways.
SUMMARY AND CONCLUSIONS
This review of six recent state HCASs indicated that a variety of approaches is taken by the several states. Most studies adopted general principles of the 1982 Federal study, but a few have made adjustments to the methods used for cost allocation. Most of these studies were initiated because of the desire to reevaluate the fairness of the taxation policies among the various vehicle classes at the state level.
14
By applying the methodology used by the Federal Highway Administration in the Federal HCAS (FHCAS), certain problems arise. First, the FHCAS focused on highways to
~wliicllFecierarnnms areapplted0Jllmely; primary-faeHities-"lleFVing-pHldGm-inantly-lnter&tate. .. ~.-- -----~ travel. However, at the state level, a variety of roadways must be considered, and each carries a different mixture of traffic. Second, revenues and expenditures are determined in a more uniform fashion for the FHCAS while greater variation exists among the states. Third, different characteristics exist among states based upon their geographic location, types of urban centers, and urbanization level. A number of states have a greater portion covered by urbanized areas, and each has unique highway needs based on its location.
The revenue-to-cost ratios for vehicle classes are considered as an important final outcome of HCASs. When these ratios were compared among the studies examined, no consistent trends were noted for specific vehicle classes. For example, for passenger vehicles, three states (Minnesota, Virginia, and Vermont) indicated a very small overpayment, California showed a large underpayment, Indiana a large overpayment, and Kentucky an equity between revenues and expenditures. Results were even more diverse when these overall ratios were broken down to other subclasses within this group. The differences in these relationships may be attributed to several factors including different travel patterns among the states for the same vehicle class, different highway needs among the states, different expenditure proportions among the various items considered by each state, different geographic location, and different taxation policy.
Although very few states have directly addressed the reliability and sensitivity of their HCASs, these are obviously of critical importance. Hypothetical scenarios regarding inclusion or exclusion of revenues or expenditures are the primary sensitivity analyses performed by existing studies. The most reasonable way to determine the reliability of HCASs may be to compare the results of the preselected methodology with other alternatives. Level-of-use, incremental, Federal, and ton-mile methods are well developed, and it is expected that in the future two additional methodologies (marginal cost and benefits), which are not used widely at the present, may become easier to perform and the required data for their completion may become available. Because no set guidelines exist for a nationwide methodology for HCAS at the state level, the choice of methodology is clearly an arbitrary one.
The items included as revenues and expenditures varied among the states. For all states, non-user revenues were rightfully excluded. Some states included all other revenues paid by highway users regardless of whether or not they are dedicated to highway purposes while others considered only those revenues dedicated to highway use. Similar problems exist for the determination of the expenditures to be included or excluded. Four of the HCASs included expenditures related to enforcement of highway rules while the other two did not consider them as part of the cost responsibility of the highway users. For several other revenue and expenditure categories, the agencies conducting these studies face the question of whether it is appropriate is to include or exclude them from the corresponding category.
15
Continuous evaluation and update of results from HCASs are necessities. Traffic trends change, highway system needs alter, vehicle characteristics evolve, and financial and
-----eeoo=~value~rvaey"-lim~"-Inflati<}n~~ates-zn!l markeLfluetuatio~l!Le_ veryjmportaJ!t ______ . elements that ought to be seriously considered. If current taxation rates are retained, then revenues attributed to each vehicle class will be reduced in the future if no special care is given. Among all revenue sources, only purchase taxes are structured to follow inflation. One may argue that revenues will be increased if the travel trends increase. On the other hand, the future is uncertain regarding which of the two, travel or inflation, will increase at a faster pace. Only a periodic update will enable legislation to adjust taxation schemes to achieve equity among vehicle classes as well as between revenues and expenditures.
16
SPECIAL INVESTIGATION OF BRIDGE CONSTRUCTION COSTS
-~------~~-~~~~--~~-----T-he-su=y-cl~state_practices_reYealed that the increm_ent!l costmethod is widely used, particularly for allocating the costs of pavement and bridge construction. Because seveiai-----~~~ ~-~---~ years have passed since Kentucky has applied incremental cost techniques, a special study was launched to reexamine the applicability of these techniques to Kentucky investigations (1±). The specific focus was on newly constructed and reconstructed bridges spanning the state's highways and waterways. The primary objectives of the study were to calibrate the incremental cost model for Kentucky bridges and to examine competitive alternatives including level-of-use and benefits-based techniques.
Incremental cost analyses for bridge construction require detailed design of specific bridges for a range of hypothetical traffic loadings. The analysis is made tractable only by selecting a limited set of the most common structures being constructed in the state. Based on a review of construction records for all bridges constructed on the state-maintained system from 1979 through 1989, four of the most common bridge types were selected for analysis; 1) a 46-foot prestressed box bridge, 2) an SO-foot prestressed girder bridge, 3) a 230-foot prestressed continuous bridge, and 4) a 356-foot continuous steel girder bridge. Actual construction quantities were determined from a detailed analysis of two bridges representative of each of these four bridge types, and costs were projected to the base year of 1990.
Fortunately, bridges similar both in type and in length to these typical Kentucky bridges had been analyzed by Sinclair (11) for the Federal HCAS (1). These bridges had been designed for a wide span of design traffic loadings, and detailed models were available relating construction quantities to design loadings. Theoretically, it was a trivial matter to apply Kentucky average unit bid prices to Sinclair's construction quantities to determine total bridge construction cost and, then, its relationship to design traffic. Actually, the process was more difficult and less exact because several pay items in Kentucky differed significantly from those evaluated by Sinclair.
Unfortunately, bridges are designed on the basis of somewhat arbitrary loading conditions rather than on the basis of traffic that will actually cross them. Conceptually, design loads envelop critical truck loading conditions, and load repetitions seldom directly influence design details. To make use of the recalibrated Sinclair models, it was necessary to develop relationships between actual traffic loads and the design loads that drive construction cost estimates. For the sake of simplicity, traffic loads and design loads were deemed to be equivalent when they produced identical bending moments in each of the typical Kentucky bridges.
Once the cost model had been calibrated and extrapolated to the population of on-theroad vehicles, application of the incremental cost analysis was primarily an accounting matter. The highway system was stratified by Federal aid classification, and totals of the number and square footage of bridges of each type which had been constructed on each Federal aid system were developed based on information contained in the bridge construction database.
17
Traffic estimates were obtained directly from the 1990 Kentucky HCAS (±). The base vehicle was a four-tired vehicle, such as a pickup truck, loaded to 5,000 pounds. System-
~~~LcleJl!!il<;J?Ii!lgeS:Ql1~tr]£tion_c_Q~t§~~~~re~aJ12<;ate~<l~ecll!aJly~t<J_a.Jl~\'ell_ic;!e~~cj[j~S!'~t!S~!)!IS~~ .o_n~-----Ievel of use. Cost increments attributed to heavier vehicles were allocated, again according to level of use, only to these more demanding vehicles. Level-of-use measures for the basic cost allocation included vehicle-miles, axle-miles, and passenger-car-equivalent (PCE) miles. For the residual cost analysis, costs due to heavier vehicles, only vehicle-miles was used as an allocator.
In addition to the incremental cost analysis, two other allocation techniques were examined. First, the total costs of bridge construction were allocated directly based on level of use. Once again, the three common level-of-use measures were used, vehicle-miles, axlemiles, and PCE-miles. Second, payload ton-miles, a surrogate for benefits, was used to allocate residual (non-basic) costs among the truck population. PCE-miles was used in this analysis as the means for splitting total costs into basic and residual components.
Final results of the analysis are shown in Table 13. With all allocators, the incremental method assigns greater cost responsibility to trucks than does the total cost method. Among allocators, the greatest responsibility is assigned to trucks by PCE-miles, followed in order by axle-miles and vehicle-miles. Ton-mile allocations assign relatively greater cost responsibility to combination trucks, those that carry the greatest payload, than to straight trucks.
Based on this extended experience in calibrating the incremental cost model for Kentucky conditions, it is not recommended for routine use for the following reasons:
1. Because of continuous changes in both the truck population and in the allocation ofbridge construction and reconstruction dollars to the various highway systems, cost allocation models must be periodically recalibrated when accuracy is to be maintained. Periodic updates are extremely difficult with the incremental method because of its complexity and expense.
2. Because the Sinclair design models differ significantly from Kentucky practice, new models would have to be developed to replace them. Other new models would have to be constructed and calibrated as a result of any future changes in bridge design and construction practice in Kentucky.
3. Because bridge design, and hence construction cost, is affected only indirectly by the nature and volume of anticipated traffic loading, information needed to calibrate the incremental cost model requires assumptions that may compromise its accuracy and integrity. Among the difficulties in calibrating the incremental model are the following:
18
•
•
•
•
•
•
Bridge design practice does not provide the capability to link bridge costs to loading frequency and to occasional overloads.
Bridges must be designed to withstand their own weight (dead load) and a variety of live loads including traffic, wind, earthquakes, and thermal forces. The design of longer spans is driven primarily by dead load and natural forces, not traffic loads. Under such conditions, incremental cost procedures assign negligible cost increments to progressively larger and heavier vehicles.
Although bridge design, and hence construction costs, is driven by a maximum loading envelop, cost allocations are traditionally based on the distribution of operating weights of the various vehicle types.
Real trucks are usually equated to design loads by the bending moments they impose on typical spans ignoring effects of impact, load distribution, truck trains, etc.
When military vehicles, garbage trucks, fire engines, or other noncommercial vehicles drive bridge design, incremental cost practices that assign costs to less critical vehicles are conceptually unappealing.
Because vehicle width does not directly influence bridge width in conventional design practice, incremental cost allocation procedures must either ignore possible cost increments associated with vehicle width or must utilize arbitrary rules for allocating costs of bridge width increments to the various vehicle types.
In conclusion, incremental cost procedures are of questionable suitability for bridge cost allocations because 1) the way bridges are designed is unsuitable for accurately developing the cost models necessary to support incremental analysis, 2) the cost of many spans, particularly longer ones, is relatively insensitive to traffic loading, and 3) incremental cost procedures are time consuming and costly. Allocating total bridge costs by PCE-miles seems to be a reasonable substitute although it allocates smaller costs to trucks than the incremental method and smaller costs to combination trucks than the ton-mile method. A combined procedure which allocates basic costs by PCE-miles and residual (truck) costs by ton-miles may be preferred.
19
20
MODIFICATIONS TO 1990 PROCEDURES
------ --·-The1Qniuc1Cysmrty-<:-ompieted-in--1990l:1)-incorporated-~-1!ttmber-ilf.-~ignif4eant
methodological changes. Although the review of state practices and the special investigation of bridge construction costs offered potential for further change during the current study, no changes of great consequence were judged as being necessary.
Only three changes were suggested by the review of HCASs conducted by other states including 1) use of functional classification as the basis for stratifying Kentucky's highway system for analysis, 2) incorporation of a predictive methodology to enable future ex post facto analyses designed to document data and methodological reliability, and 3) development of new tables to identify cost responsibilities and revenue contributions based on truck axle configuration in addition to other tables based on registered or declared weights.
Because functional classification is the primary basis for collecting, storing, and processing both traffic and roadway data, stratifying the highway system by functional classification instead of Federal-aid classification is certainly desirable. Unfortunately, construction cost estimates, performed originally by the Division of Planning in 1980, had not been converted to functional classification and resources were not available to permit their conversion and updating for use in the current study. Given both the inherent desirability of changing to a functional classification basis as well as redefinition of the Federal-aid program as a result of recent Congressional action, conversion to functional classification should be considered to be a necessary component of any future Kentucky investigations.
Adding a predictive component to the cost allocation methodology was the second major change that was considered. The notion was that predictions made for future periods could be tested during future ex post facto evaluations. One definitive measure of the reliability of Kentucky cost allocation techniques would be the extent to which actual realizations matched past projections. Although such an extension would doubtlessly be useful, its potential benefits were not judged to be sufficiently great to warrant the rather considerable costs associated with its development and implementation. Hesitancy was also expressed about developing a new set of independently generated revenue forecasts.
It thus turns out that the only methodological change initiated as a consequence of the literature review was the development of new tables summarizing cost and revenue allocations on the basis of axle configuration in addition to registered weight.
Four other changes, described as follows, were made during the current study:
• Until recently, manual traffic classifications had distinguished between school buses and other buses. Because automatic classifiers, on which increasing reliance is being placed, do not make such distinctions, it was necessary to combine these two bus categories into one. Because the revenue implications of school bus operations are different than those of other buses, this change was made with some loss of accuracy.
21
Fortunately, the small extent of bus activity in the state should ameliorate the adverse consequence.
• Pavement costs continue to be allocated using ESAL-miles. ESAL-miles are computed from the product of VMT and average ESALs per vehicle. Statewide averages, which have been used in the past, were replaced with averages which distinguish between Interstate and non-Interstate travel as well as between urban and rural conditions. Enabling this change, which will increase the accuracy of ESALmile estimates, was the adoption by the Division of Planning in 1989 of an enhanced truck weighing program using weigh-in-motion scales. Statewide average unit ESALs are now available by functional classification and on a much more representative basis than permitted by the limited sampling program of the past.
• Usage tax payments by vehicle type were obtained for the first time directly from the A VIS file rather than from a rather complex and inexact estimation routine that had been necessary in prior years.
• Finally, the method for allocating total Federal proceeds to the four Table Dl categories (Federal fuel tax revenue, Federal usage taxes on trucks and trailers, Federal motor carrier use taxes, and other Federal taxes) has been changed. The allocation is now based strictly on the proportions reported in Table FE-9, "Federal Highway Trust Fund Receipts Attributable to Highway Users in Each State," of the current version of Highway Statistics. Federal fuel revenues of Table DS have been adjusted accordingly.
The special investigation of bridge construction costs confirmed the efficacy of using PCE-miles as the basis for allocating the costs of newly constructed and reconstructed bridges while raising a significant question about the ability to accurately apply incremental cost techniques to bridge construction costs. No methodological changes were initiated as a result of this investigation.
22
DISTRIBUTION OF REGISTERED TRUCK WEIGHTS
- ~---~-~-~-----Perhfrps-the~great"*'t-c!Hlng~-in--th?-1-99(LKentuclqcBCAS~®-RlllUhe Jlev~lQ!l!!!~nLQL _____ ~---new distributions representing the frequencies with which trucks of given axle configuration are registered at given levels of gross weight. The need for such distributions arises from the fact that on-the-road traffic monitoring typically identifies trucks by axle configuration while tax rates and operating fees are based, in part, on registered or declared gross weight. The key link enabling on-the-road activity to be expressed in terms of registered weights is the frequency distribution of registered weights (for example, the percentage of five-axle tractor-semitrailer combinations operating at each of the gross weight categories ranging from 6,000 to 80,000 pounds).
Unfortunately, data necessary for determining the frequency distribution of registered weights are not routinely collected. In 1990, the new frequency distributions (Table 14) were developed on the basis of a sample of trucks involved in Kentucky accidents. For straight trucks, analysis focused on Kentucky-registered trucks involved in accidents in 1988. The A VIS file was used to match axle configuration from the accident record with registered weight. For combination trucks, analysis focused on apportioned-registered Kentucky trucks involved in accidents during 1987 and 1988. Kentucky's cab card file, containing information on all apportioned trucks operating in Kentucky including those having out-of-state plates, provided a basis for validating the frequency distributions developed from the accident samples.
Concern lingered, however, about possible bias due to the accident-based sampling procedure. As a result, a special field survey was undertaken in the summer of 1991 to provide additional data with which to further examine registered weight distributions. All observations were taken at truck inspection stations on Interstate highways. During the first part of the survey, visual inspection was made of axle configuration, and papers were examined to match axle configuration with registered weight. It soon became apparent that this rather time-consuming procedure would not yield a sample of sufficient size to permit meaningful analyses. Thereafter, the field observer recorded both axle configuration as well as KYU and unit numbers. Subsequently, this information was entered into a computer file and matched with registered weights through the centralized file maintained in Frankfort. Although only about half of the observations were successfully matched, data for slightly more than 2,100 trucks were collected. In addition to the Interstate field study, additional data were collected for apportioned-registered Kentucky trucks involved in accidents during 1989-90. Procedures similar to those used in 1990 were repeated.
Thus, three different frequency distributions were available for comparison, one used in 1990 and based on 1987-88 accident sampling, one based on 1989-90 accident sampling, and one based on Interstate observations in 1991. Graphical comparisons of the three frequency distributions indicated that they differed significantly (Figures 2-10). No "matches" were found in the distributions of straight truck weights (Figures 2-5). For single trailers, frequency distributions based on the two sets of accident data (1987 -88 and 1989-90)
23
appeared to match quite well but, on the whole, Interstate trucks appear to have slightly greater registered weights (Figures 6-9). The data for multiple trailer trucks were too sparse
Chi squared testing was used to identify any statistical similarity in the registered weight distributions between the 1991 and 1987-88 data sets (Table 15~ the 1991 and 1989-90 data sets (Table 16), and the 1987-88 and 1989-90 data sets (Table 17). With but very minor exception, this analysis revealed statistically significant differences among the three registered weight distributions.
Although statistical tests were not performed, average gross weights were also compared (Table 18). Once again, considerable differences were noted for straight trucks. For single trailer trucks, on the other hand, the matches were quite good especially between the 1987-88 data and the 1989-90 data.
Unfortunately, the true frequency distributions of registered weight remain elusive quantities. Based largely on the analyses reported herein and in 1990 (:!), the most reasonable distribution for straight trucks appears to be that developed in 1990. On Interstate highways, combination trucks appear to be registered at slightly larger weights than on more typical highways. The similarity between distributions based on 1987-88 and 1989-90 accident samples suggests that combination trucks should be represented by distributions based on the combined 1987-88 and 1989-90 samples. The resulting distributions are summarized in Table 19.
24
ANALYSIS AND RESULTS
-~----~~~-~-~-~-~-------In-~199-1,tM-8tate-maintained-highway-S¥stenu:ompri sec.Lapproxim at ely 28,000 m i I es of the 70,000 miles of roads and streets in Kentucky while accommodating approximately 90 percent of all travel in the state. Before Federal reimbursements totaling almost $182 million, Road Fund expenditures by the Transportation Cabinet on Kentucky's roads and streets were approximately $1,007 million, of which an estimated $845 million or 84 percent was spent on improving, maintaining, and operating the state-maintained highway system. The distribution of state-system expenditures is summarized in Table C1 of Appendix C: the bulk, approximately 64 percent, was for activities related to construction or reconstruction.
Road Fund and Federal Fund receipts in FY 1991 totaled approximately $1,007 million. The largest contributor to the Road Fund, bringing in approximately $350 million, was the state fuel tax. Usage taxes contributed the second largest amount, approximately $212 million. Road Fund receipts also included $38 million from bond sales. Highway user revenue attributed to state-maintained highways, excluding local aid and revenue from the sale of bonds but including Federal assistance, totaled approximately $853 million. The distribution of this total among the several sources of revenue is detailed in Table D1 of Appendix D.
ALLOCATION OF illGHWAY COSTS AND REVENUES
As indicated in Table 3, four different measures were used in allocating highway cost elements to the various user groups. These measures included vehicle miles, axle miles, passenger-car-equivalent (PCE) miles, and equivalent-single-axle-load (ESAL) miles. Among these measures, vehicle miles allocates the greatest proportion of costs to cars, followed in order by axle miles, PCE-miles, and ESAL-miles (Table 20). The pattern is reversed for larger and heavier vehicles. The five-axle tractor-semitrailer, for example, contributes a relatively small 5.96 percent of the vehicle miles of travel when compared with 13.41 percent of the axle miles, 17.32 percent of the PCE-miles, and 50.68 percent of the ESAL-miles. ESAL-miles are used only to allocate the costs of constructing pavements and shoulders, estimated to represent approximately 18.8 percent of the annual sum expended on the state-maintained system.
A summary of the annual capital costs and the annual maintenance/administrative costs attributable to each major vehicle class is presented in Table 21 (details are provided in Appendix C). Total cost responsibility is borne most heavily by passenger cars and motorcycles ( 44.16 percent) followed in order by heavy trucks grossing 60,000 pounds or more (24.64 percent) and vehicles registered at 6,000 pounds such as pickup trucks and vans (20.40 percent). Cost responsibility borne by all other groups totals 10.80 percent.
Table 22 compares these findings with results of three prior studies. Changes recorded from 1982 to 1988 are probably influenced more significantly by methodological
25
enhancements in the 1988 study than by changes in travel patterns and/or in the nature of the highway budget. Between 1988 and 1990, the decrease in cost responsibility of cars parallels
-~~------------almost--exactly-tbeir41ecr.ease-ln-r.elative_Jrav-eLThe=mfUsl!:ue.lill:_pickups_._Despite.=ortL ___ . _____ .~--·---travel by the heaviest trucks, their percentage share of highway costs also diminished somewhat between 1988 and 1990, as a result of increased maintenance and administration expenditures in 1990 and allocating pavement costs to the heaviest trucks based on a corrected gross weight of 80,000 pounds instead of the 82,000 pounds used previously. Trucks of intermediate size shouldered a greater percentage of the responsibility. For all vehicle classes, very small changes were noted between the 1990 and 1992 studies. The travel trends and ratio of cost to travel were very similar and only a very small decrease in the cost responsibility of cars was noted followed by a corresponding increase, similar in magnitude, by heavy trucks.
Table 23 summarizes the effect of selected factors on changes noted in cost responsibility between the 1990 and 1992 studies. The effect on cost responsibility due to changes in either travel or expenditure levels between the two periods is captured by the columns titled costs, highway miles and volume, vehicle types, and weight-distance table. Changes affected by procedural modifications are presented under the heading of one bus type, while column ESALs indicates changes due to a combination of new data and procedural changes. Heavy trucks showed a 6.34 percent increase on cost responsibility which is mainly due to new data for ESALs and vehicle types. For the same reasons, light trucks showed the largest reduction in cost responsibility (16. 78 percent).
Table 24 summarizes the FY 1991 revenue generated by each major vehicle class. Vehicle classes contributing most to the revenue total are generally the same as those bearing the largest cost responsibility. Passenger cars and motorcycles generate the most ( 44.69 percent), followed by heavy trucks (25.46 percent), and pickups and vans (22.49 percent). All other vehicles contribute a total of 7.36 percent.
The ratio between the percentage of revenue contributed by each vehicle class and its percentage of cost responsibility provides a convenient means for assessing the equity of current taxation policy (Table 25). A ratio of one indicates perfect balance. All primary contributors to highway user revenue over contribute at various rates. The over contribution for passenger automobiles is about 1 percent, for pickups/vans is about 10 percent, and for heavy trucks is about 3 percent. Light trucks (ratio of 1.06) and medium trucks (ratio of 0.63) are generally smaller contributors both to the revenue pool and to the total cost responsibility.
UNIT COST AND REVENUE ESTIMATES
Highway-user costs and revenues are often easier to comprehend when expressed on a unit basis rather than as aggregated totals. Cost and revenue per vehicle mile are effective and convenient expressions. Combining the cost and revenue totals of Tables 21 and 24 with
26
travel estimates of Table 26, unit estimates--representing user taxes collected by Federal and _________________ state governments in FY 1991 which were used to provide and maintain Kentucky's state
highway system --are present~dTn-TabTe-i7~------------------------------------------------------- ---------------
In FY 1991, approximately 2.0 cents per mile were collected from passenger cars for the purpose of upgrading and maintaining Kentucky's state highways. This represents approximately 4.6 percent of the 43.6-cents-per-mile cost to operate an intermediate-size car in the 1991 model year Q§). On a per mile basis, the largest trucks paid approximately five times more than cars, 10.1 cents per mile.
Expressed another way, the intermediate-size car, traveling 15,000 miles annually on Kentucky highways, contributes approximately $300 to state highways. The large truck, when traveling 100,000 miles in Kentucky, contributes approximately $10,100.
MOTOR CARRIER INDUSTRY LEGISLATIVE PROPOSALS
Prior to the 1992 Legislative session, the Kentucky Motor Transport Association, Inc. (KMTA) proposed a variety of changes in Kentucky's highway taxation structure (11). The KMTA has taken a firm stand in opposition to Kentucky's weight-distance tax, and repeal of the weight-distance tax is the centerpiece of its legislative agenda. It has also argued that, to avoid paying Kentucky's usage tax, many motor carriers have domiciled their vehicles in other states to the economic detriment of Kentucky and its motor carrier industry. As a result, the KMT A has also proposed that the usage tax be applied only to trucks grossing 26,000 pounds or less.
To compensate for the revenue lost by eliminating the weight-distance and heaviervehicle usage taxes, the KMTA has proposed increases in some of the existing highway user tax rates. Among the taxes considered for possible rate increases are the heavy vehicle fuel surtax, the special fuel tax, the gasoline tax, truck registration and license fees, and automobile registration fees.
The equity of the various KMTA proposals is of potential interest to state legislators and others who are concerned with Kentucky highway finance. Accordingly, the effects of several possible tax alternatives, which have been developed from the KMTA's proposals, are evaluated herein. In keeping with the basic philosophy of this study, attention has been restricted to highway user tax revenue which is deposited in the Road Fund and used to maintain and improve Kentucky's state-maintained highway system. Accordingly, omitted from consideration herein are KMTA's proposals regarding other taxes, such as the sales tax on parts and accessories, occupational taxes, property taxes, and local vehicle insurance taxes. Revenue from these taxes is not expended on the state-maintained highway system and, hence, should be excluded from state cost allocation studies.
27
This study is limited to examining the equity of various tax proposals by allocating the costs of providing a modern highway plant to the various classes of highway users. It does
--~--- -----not-etmSider-ether-issues-{}f--highway---finnnce-such-a&_thdmpacLilLvariol!s_ tax __ pi9JIQ:,;~ls __ Q1L_~~~-------the state's economic prosperity or on its motor carrier industry. The KMTA addresses a number of these important issues in its analysis (11).
The following eight tax alternatives are evaluated herein:
1. Remove the 1.15¢ weight-distance surcharge;
2. Repeal the 2.85¢ weight-distance tax and remove the surcharge;
3. Repeal the weight-distance tax and eliminate usage tax for trucks grossing 32,000 pounds or more;
4. Repeal the weight-distance tax, eliminate usage tax for trucks grossing 32,000 pounds or more, and increase the heavy vehicle fuel surtax by 12¢ per gallon;
5. Repeal the weight-distance tax, eliminate usage tax for trucks grossing 32,000 pounds or more, increase the heavy vehicle fuel surtax by 7. 7¢ per gallon, and increase the special fuel tax by 3¢ per gallon (dedicating all revenue from this increase to the Road Fund);
6. Repeal the weight-distance tax, eliminate usage tax for trucks grossing 32,000 pounds or more, increase the gasoline tax by 1¢ per gallon, and increase the special fuel tax by 5¢ per gallon;
7. Repeal the weight-distance tax, eliminate usage tax for trucks grossing 32,000 pounds or more, and increase truck registration, permit, and license fees by 89 percent; and
8. Repeal the weight-distance tax, eliminate usage tax for trucks grossing 32,000 pounds or more, and increase the automobile registration fee by $21.50.
In identifying these tax alternatives, the intent was to include the kinds of changes envisioned by the Kentucky Motor Transport Association: no claim is made that these eight alternatives are exhaustive nor that they precisely duplicate the KMTA proposals. It has been generally assumed that the Road Fund portion of revenue increments will remain unchanged from current practice. The fifth alternative from the above list is an exception because it proposes that all revenue from the special fuels tax increase be deposited into the Road Fund. The annual change in the Road Fund balance due to each of these proposals has been estimated independently of the KMTA's figures. The estimates developed herein are compatible with data used elsewhere in this investigation but may not match KMTA's estimates. It has been assumed that the changes in tax rates are not of sufficiently large
28
magnitude to affect the amount of travel in the State, the number of vehicles registered, etc. Finally, the KMTA estimate of a $5 million reduction in administrative costs due to repeal of
___________________ _th~:w~ighblistance_tax_has __ noLQ!!f._J!jm:tudt<Lil1_tll_e_c:()l1JJll!!!t!i<l~,__
Each of the eight proposals would increase the relative tax burden on automobiles and reduce the relative tax burden on heavy trucks (those of 60,000-pound gross weight or more), and each would reduce the annual revenue deposited into the Road Fund (Table 28). The revenue shortfall would range from a minimum of about $17 million (removal of the weightdistance surcharge) to a maximum of about $70 million (repeal of the weight-distance tax and elimination of usage tax on heavier vehicles). The KMTA's proposed tax rate increases were designed to produce a net revenue increment of about $42 million. Independent estimates made herein project net revenue increments ranging from a minimum of $28.5 million (1¢ increase per gallon of gasoline and 5¢ increase per gallon of special fuel) to a maximum of $43 million ($21.50 increase in automobile registration fees). Although most of the specific proposals fail to meet the KMTA target of $42 million, this target is certainly attainable if the number and magnitude of tax rate increases are sufficiently large.
Tax equity among the various classes of highway users is achieved when the income generated by each class matches its cost responsibility, yielding a revenue-to-cost ratio of one. The KMTA proposals would unbalance the near equity that has been achieved under current tax policy for both automobiles and heavy trucks (Table 29). Beneficiaries of the KMTA proposals would generally be the heavy trucks. The revenue surplus collected from cars, pickups and vans, and light trucks would escalate.
In summary, the KMTA proposals, as interpreted herein, would create a substantial Road Fund revenue shortfall and would threaten the equity that is currently achieved between the revenue contributions and the cost responsibilities of the various classes of highway users. Possible impacts of the KMTA proposals on Kentucky's economy and on its motor carrier industry have not been assessed herein but are of great potential significance.
EXTENDED-WEIGHT SYSTEM
Introduction
Because of the importance of efficient coal transportation to the state's economy, Kentucky has established a special coal-haul system on which coal trucks may operate at weights considerably in excess of normal legal maximums. Designated annually by the Secretary of Transportation, this "Extended Weight Coal and Coal By-Products Haul Road System" generally includes road segments carrying 50,000 or more tons of coal and coal byproducts annually but excludes both Interstate highways and those segments posing a safety threat. The annual purchase of a special decal allows coal trucks to operate on the extendedweight system at the following gross weight limits:
29
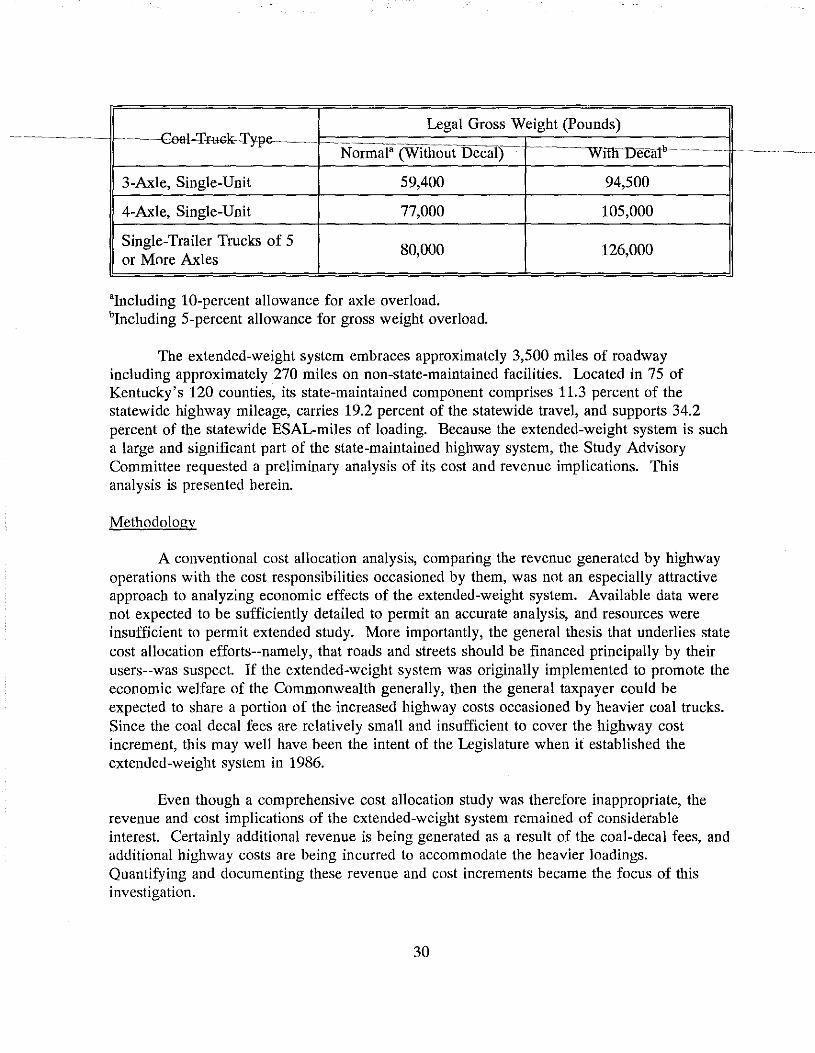
-Geal-:f-£uc~1'-¥pe Legal Gross Weight (Pounds)
-NormaF (WitlloliTITecaJ'j~--
3-Axle, Single-Unit 59,400
4-Axle, Single-Unit 77,000
Single-Trailer Trucks of 5 80,000
or More Axles
'Including 10-percent allowance for axle overload. blncluding 5-percent allowance for gross weight overload.
----------with-uecalb-
94,500
105,000
126,000
The extended-weight system embraces approximately 3,500 miles of roadway including approximately 270 miles on non-state-maintained facilities. Located in 75 of Kentucky's 120 counties, its state-maintained component comprises 11.3 percent of the statewide highway mileage, carries 19.2 percent of the statewide travel, and supports 34.2 percent of the statewide ESAL-miles of loading. Because the extended-weight system is such a large and significant part of the state-maintained highway system, the Study Advisory Committee requested a preliminary analysis of its cost and revenue implications. This analysis is presented herein.
Methodology
A conventional cost allocation analysis, comparing the revenue generated by highway operations with the cost responsibilities occasioned by them, was not an especially attractive approach to analyzing economic effects of the extended-weight system. Available data were not expected to be sufficiently detailed to permit an accurate analysis, and resources were insufficient to permit extended study. More importantly, the general thesis that underlies state cost allocation efforts--namely, that roads and streets should be financed principally by their users--was suspect. If the extended-weight system was originally implemented to promote the economic welfare of the Commonwealth generally, then the general taxpayer could be expected to share a portion of the increased highway costs occasioned by heavier coal trucks. Since the coal decal fees are relatively small and insufficient to cover the highway cost increment, this may well have been the intent of the Legislature when it established the extended-weight system in 1986.
Even though a comprehensive cost allocation study was therefore inappropriate, the revenue and cost implications of the extended-weight system remained of considerable interest. Certainly additional revenue is being generated as a result of the coal-decal fees, and additional highway costs are being incurred to accommodate the heavier loadings. Quantifying and documenting these revenue and cost increments became the focus of this investigation.
30
Revenue implications of the extended-weight system are both direct and indirect. The coal decal fee is a direct implication, adequately documented and easy to comprehend. The
-~ ~ ~~-----~1i1iilfe~cf impl!cailons~iire-mo~re-suotre.--r:argerpaytmrcts-mean-fewertruck:s7antHewertr-uek~~~~-~.---·
mean reduced registration fees and perhaps reduced fuel taxes. Because the effect of truck weight on fuel efficiency and, hence, on fuel taxes is not well documented, only two revenue sources, coal decal fees and truck registration fees, are evaluated herein.
It is well recognized that the costs of providing the highway infrastructure are influenced by the sizes and weights of the trucks that use them. Almost all cost elements are affected: larger vehicles generally require flatter slopes, wider cross sections, thicker pavements, stronger bridges, more frequent and extensive maintenance, etc. Generally, however, most investigators of large-truck impacts focus on the costs of constructing, maintaining, and replacing bridges, pavements, and shoulders @-lQ). Other cost effects of heavy trucks are more difficult to quantify.
The analysis reported herein focused on pavement overlay or restoration costs. Pavement overlay costs are substantial in Kentucky, and excellent data are available to quantify implications of the extended-weight system. Detailed examination of other pavement cost elements (construction, reconstruction, rehabilitation, and recurring maintenance) as well as bridge and shoulder cost elements is left to future investigations.
Geographically, the study was limited to the 75 extended-weight-system counties: 38 are classified as coal-producing counties and 37, as coal-impact counties. Only statemaintained highways, classified as either on the extended-weight system or on a base system, were considered. The base system included all highways of comparable functional classification as those included within the extended-weight system. It provided a frame of reference to which the extended-weight system could be compared. Analyses were disaggregated to the level of functional highway classification. System mileages for extended-weight and base systems are summarized in Table 30.
The base year for this analysis was 1990. However, to reduce the effects of minor year-by-year fluctuations and thus increase accuracy, 1989-1991 vehicle classification and weight data were used. In addition, average resurfacing frequency was based on experience during the period, 1988-1990, and average resurfacing costs, 1988-1991.
Data Requirements
The analysis required development of detailed information describing:
• System mileage,
1Larger trucks would also generally mean fewer drivers, an unfortunate economic consequence in a depressed economy.
31
• Average traffic volumes, -~-~--~--~--~ • Typical composition of the traffic stream,
~~-~--~-~~~--~--~. --~----AVerage pavement-rlanmge--fact~&Ab&)--~hicle-typer--~-~~-~~~~-~~~--~----~~~--~~--~-~--~--~ • Average annual resurfacing mileage, • Average unit costs of resurfacing, and • Average rideability indices.
Basic data sources included files of the Divisions of Maintenance and Planning and the Pavement Management Branch. The detailed analysis is documented in Appendix F.
Extent and Cost of Resurfacing Program
Approximately 1,470 miles of roadway on the extended-weight and base systems are resurfaced annually (fable 31) at a total cost of approximately $45.2 million (fable 32). The unit cost of the l-inch resurfacing layer, including cost of surface preparation such as leveling and milling, averages approximately $31,000 per mile.
When comparing the extended-weight system with the base system, a considerably larger percentage of the extended-weight system is resurfaced each year (14.4 percent vs. 6.0 percent) at a substantially greater unit cost ($42,100 per mile vs. $25,700 per mile) (Tables 33 and 34, respectively). To better comprehend the net result of these differences, approximately $13.6 million would be saved annually if resurfacing of the extended-weight system had been programmed to the same norms (annual percentage of mileage resurfaced and average unit resurfacing costs) as the base system (Table 35).
Importantly, the $13.6 million increment can not be attributed solely to the heavier weights of the coal-decal trucks. Coal haulage would be concentrated on the extended-weight system even if increased truck weights were not permitted, and any such concentration of heavy trucks would intensify the rate of pavement wear and, hence, the costs of pavement restoration. Moreover, extended-weight highways carry almost twice the traffic volume of base highways (fable 36), and their pavements are maintained to a slightly superior condition on average (fable 37). To accurately assess the incremental effect of the extended-weight system requires substantially more detailed analysis.
Incremental Resurfacing Costs
As summarized above, pavement resurfacing costs for both the extended-weight system and the base system are known with reasonable accuracy. In order to determine the incremental resurfacing costs due solely to the extended-weight/coal-decal system, estimates are also required of "normal" resurfacing costs, costs that would have been incurred if coaltruck weight limits had been held to pre-extended-weight system levels. The difference, then, is the impact directly attributable to extended-weight limits.
32
The approach taken herein required two key assumptions. The first is that resurfacing ~--------- costs are directly related to traffic wear as measured by equivalent-single-axle-loads (ESALs).
----Thlsassum ptJo!is-eems-reasonab1e-a1tlrough-m-have-arguetH-)-that-envir-OBJnentaUact:ors_ _________ ··-·-------, also contribute to pavement wear and affect the frequency and cost of resurfacing and 2) that ESALs, originally developed as a measure of traffic damage for designing new pavements, may not accurately reflect traffic effects on pavement resurfacing frequency and cost.
The second key assumption is that 1) the volume of coal transported by highway and 2) the routes used for coal transport are unaffected by the extended-weight/coal-decal system. To the extent that effective competition exists between truck and train, the increase in trucking productivity resulting from increased payloads would ultimately increase both the volume of coal moving by highway as well as the cost of maintaining pavement surface condition to acceptable levels. To assume that coal tonnages on the highway system remain constant effectively understates the impact of the extended-weight system. Nevertheless, accurate techniques for estimating coal tonnages that may have been diverted from the railroads were unavailable. Because of the way the extended-weight system is designated, that is, by coal haulage exceeding 50,000 tons per year, any initial effect of the extendedweight designation on the routes used for coal transport is likely to have been small. Because the extended-weight system is redesignated annually, it is not likely to affect the shipper's choice of route unless the extended-weight system eventually evolves into a "super" system of roadways designated and provided specifically for efficient coal transport.
costs: The following summarizes the procedure used to determine incremental resurfacing
0
0
0
0
•
•
•
Determine the annual resurfacing cost for the extended-weight and base systems in the 75 extended-weight counties (Table F26);
Determine the respective annual ESAL-miles for all traffic loads (Tables F21 and F22);
Determine the resurfacing cost per ESAL-mile (Table F28);
Determine the annual ESAL-miles due solely to coal-decal trucks (Table F29);
Determine the percentage reduction in ESAL-miles by substituting trucks of conventional loading for coal-decal trucks (Table F30);
Determine the hypothetical annual ESAL-miles due solely to lighter trucks that would substitute for coal-decal trucks (Table F31); and
Determine the hypothetical resurfacing cost increment associated with the extended-weight/coal-decal system (Table F32).
33
As outlined above, the overall process for determining the resurfacing cost increment ~ ~ ~~~ is generally straightforward given the detailed information that was accumulated for the
-~- ~-- -siateWillelilgliwa ycoStatrocatillTI-stul:lf.~-'fhe fush:JHwtr-except-iorur-involves--determini ng the ~~~~~~~~-~travel patterns of coal-decal trucks. Manually collected vehicle classification data record the total number of coal trucks (based on body style) and permit summary tabulations such as those of Tables F5 and F6 which show the percentage of coal trucks within the truck population as a function of roadway classification, extended-weight or base system, and coal-producing or coal-impact counties. Although these percentages would represent reasonable upper bounds, it is unfortunate that no traffic database identifies the particular subset of coal trucks displaying the special coal decals associated with the extended-weight system.
As a result, it was necessary to rely primarily on a smaller data set, that containing weight data, to identify coal-decal trucks. Any truck was considered to be a coal-decal truck if its weight exceeded normal legal maximums (59,400 pounds for three-axle straight trucks, 77,000 pounds for four-axle straight trucks, and 80,000 pounds for five- and six-axle singletrailer trucks). This assumption resulted in two kinds of unavoidable error: conventional trucks carrying overloads were considered to have been decaled, and decaled trucks traveling empty or with partial loads were considered to be conventional trucks. The resulting percentages of decaled trucks (Tables F7 and F8) very likely understate their presence in the typical traffic stream. Because the size of the data base prevented reliable estimates for each of the functional classes, the only possible class distinction was between rural and urban facilities.
In addition to the difficulty of identifying coal-decal trucks, information was required on typical payloads both of coal-decal trucks and conventional coal trucks. Typical payloads were assumed to be the difference between legal maximum loading and empty (tare) weights. To determine empty weights of coal-decal trucks, a rather involved procedure was followed. Focussing on the routes most likely to be heavily populated by coal-decal trucks, extendedweight-system routes in coal-producing counties, typical axle spacings were determined for the more heavily laden trucks. Still concentrating on extended-weight-system routes in coalproducing counties, gross weight distributions were then obtained for the entire population of trucks within these axle-spacing ranges (Figures 11-14). Gross weight distributions for fiveand six-axle trucks were bimodally shaped with the smaller mode representing typical empty weight and the larger mode representing typical loaded weight (Figures 13-14). Using an average empty weight of 40,000 pounds, the estimated payload for these trucks is 86,000 pounds.
Weight data for four-axle straight trucks were limited in extent. The gross weight distribution showed a peak at around 70,000 pounds, much lower than expected, with no observable peak in the range of "empty" weights. When empty, these trucks are apparently operated with the lift axle raised, making them appear to be three-axle trucks. The grossweight distribution for three-axle trucks showed a broad peak in the "empty" weight range with local maxima at 29,000 and 35,000 pounds. It was assumed that the smaller maximum, 29,000 pounds, represented the average empty weight for the three-axle truck and that the
34
larger maximum, 35,000 pounds, was representative of the empty, four-axle truck. For ~-- conventional coal trucks, empty weights were assumed to be 4,000 to 5,000 pounds lighter
-~-~-----than-forcoar:a:ecaltiuclfs.-ihrassumw-mrck-weightdor-empty-and-loaded-t~uc~_anct_ ..... ~-~-~~without the coal-decal are presented in Table 38.
Results of the payload analysis are summarized in Table F30. Coal-decal trucks can carry much heavier payloads than conventional trucks, up to 41,000 pounds more for combination vehicles. ESAL computations, assuming fully loaded trucks, show that the increased payload is gained at the expense of greater pavement wear (fable F30). A fullyloaded combination truck with decal results in about 6.5 times more wear than a comparable fully-loaded conventional truck (Table F30). This effect is somewhat offset by the fact that a considerably larger number of conventional truck operations is necessary to move a given volume of coal than the number of decaled truck operations. The net reduction in ESALmiles expected by replacing coal-decal trucks with conventional coal trucks ranges from about 42 to about 71 percent (fable F30).
Based on these considerations, the extended-weight/coal-decal system adds approximately $9.08 million annually to the cost of resurfacing pavements in the 75 extendedweight counties (Table 39). Interestingly, a full one-third of the added expense is for accommodating overweight trucks, whether decaled or not, on the base system.
Incremental Revenue
Of the total of 3,877 decaled coal trucks, approximately two-thirds were five- and sixaxle combinations. Most of the remainder of the decals were issued to three-axle straight trucks (fable 40). Assuming the empty miles traveled by each truck equal the loaded miles, it is projected that average annual mileage are 26,000 miles, 60,000 miles, and 87,000 miles for three-axle, four-axle, and five- or six-axle coal trucks, respectively, assuming all operations are within the 75-county area.
Revenue from decal fees totaled approximately $1.1 million. Because 40 percent of these fees is distributed to local government, only about $680,000 is available for upkeep of the state-maintained highway system. Coal-decal trucks must also be registered at a gross weight of 80,000 pounds. Approximately $897,000 in added revenue was generated by this requirement, overwhelmingly from three-axle trucks.
Offuetting these sums are fees lost due to fewer truck registrations. To transport a given volume of coal requires a smaller fleet of heavier trucks than that of lighter trucks. Without the increased payload of decaled trucks, approximately 3,400 more coal trucks would theoretically be needed (fable F33). Because these trucks are not required under provisions of the extended-weight system, approximately $3.5 million in registration fees are lost annually. The net revenue effect of the extended-weight/coal-decal system is estimated to be a loss of almost $2 million in decal and registration fees (Table 40) that would otherwise be available for state-maintained highways.
35
-~~--~
Pavement Maintenance and Rehabilitation Costs
~---------lll- Ke-ntiicK.y;-pavemenfTesur:fiicifigandrenaotlttlftion--arr-the-extemlettweight-system--i~--------------------
addressed by two state-funded programs. The pavement resurfacing program (211 Account) is administered by the Division of Maintenance and essentially involves a thin overlay repair strategy. Usually, the thickness of this overlay varies from l to 1.5 inches, depending on the type of bituminous surface mix used. For pavements having more severe distress and for situations where estimates of ESALs indicate inadequate pavement structure, thick overlays are required, to extend the fatigue life of the pavement structure. Those projects involving thick overlays are administered through the Primary and Parkway rehabilitation program (212 Account). In addition to thick overlays, these projects also address other conditions for the roadway such as guardrail, drainage structures, etc. In summary, the resurfacing program typically addresses only the repair of the pavement where the parkway and primary rehabilitation program not only rehabilitates the pavement but also addresses the overall roadway section.
These two divergent approaches result in a considerable variation in cost per mile. The thin overlay costs are approximately $100,000 per mile for a four-lane roadway while the cost for the thicker overlay is approximately five times larger (ranging from approximately $350,000 to $730,000 per mile, with an average of $500,000 per mile). The cost per mile for the thin overlay rehabilitation concept probably is representative of average or perhaps below average rehabilitation costs whereas the expanded scope of the primary and parkway rehabilitation program results in much higher costs. Although a significant portion of the primary and parkway rehabilitation program costs has been spent on extended-weight system highways, determinations have not been made of the amount attributed specifically to the extended-weight/coal decal system.
In addition to resurfacing and rehabilitation, pavements require annual maintenance, such as crack and joint filling, patching, chip sealing, and pothole repair. Preliminary indications suggest that pavement surface maintenance expenditures are greater in coalproducing regions than in other parts of the state. For example, maintenance costs in the four highway Districts producing most of Kentucky's coal (Districts 2, 10, 11, and 12) average almost $300 per mile more each year than in non-coal-producing regions (Table 41). However, whether more annual maintenance is required on extended-weight highways than on base-system highways has not yet been documented. Presumably, though, if maintenance programs are sensitive to the added pavement wear caused by heavier trucks, extended-weight pavements might prove more costly to maintain. On the other hand, their more frequent resurfacing might moderate maintenance demands.
Summary
The purpose of this special study was to examine the cost and revenue implications of Kentucky's extended-weight/coal-decal system. Although the examination could be only
36
partially completed within the framework of the available resources and time constraints, the
•
0
•
•
interim findings are significant:
The extended-weight system, an extensive conduit for Kentucky coal, includes over 11 percent of the state-maintained mileage and carries over 19 percent of the vehicle miles of travel.
Because heavier payloads mean fewer truck registrations, the coal-decal fee structure results in a net loss of revenue to the Road Fund, estimated at almost $2 million annually.
The heavier weights of coal-decal trucks add approximate $9 million annually to pavement overlay costs.
Larger and heavier trucks increase, to an undetermined extent, other highway costs including:
Construction and reconstruction of pavements, shoulders, bridges, and culverts; Rehabilitation of pavements, shoulders, and bridges; Routine maintenance of pavements and shoulders; and Others.
EFFICIENCY OF TAX COLLECTION
Another secondary objective of this study was to determine the efficiency with which certain Kentucky user taxes are being collected, namely the weight-distance tax and userreported fuel taxes.
Motor carriers operating large trucks--those having more than two axles and having declared gross weights above 26,000 pounds--are assessed both weight-distance and fuel taxes based on information they supply quarterly to the Division of Motor Carriers on a "Kentucky Highway Quarterly Tax Return." The weight-distance tax rate, $0.0285 per truck mile with a surcharge of $0.0115 per mile, applies to the operation of trucks having a combined gross or licensed weight of 60,000 pounds or more. Two types of fuel tax, the heavy vehicle surtax of $0.02 per gallon applying also to trucks grossing 60,000 pounds or more and the normal use tax currently at $0.052 per gallon for large trucks grossing more than 26,000 pounds, are also assessed based on the quarterly tax return. Although the third fuel tax, $0.15 per gallon of gasoline and $0.12 per gallon of special fue~ is collected from the motor carrier by the dealer, the quarterly tax return may be used to support a claim for overpayment providing the fuel was used for out-of-state travel. Claims for overpayment can be validated only by detailed audit of individual carriers.
37
Turning first to the weight-distance tax, travel in Kentucky by trucks grossing more than 59,999 pounds has been estimated herein to total approximately 2,170,217,000 truck
-~~~~~~-~-~~~~~~~~miles-in-Galooda~J:-1-WD.-~Neglecting._hoth_Jhe_negligible contributioJLoLfarm_JIJ!Cks _ _and -~--~---~---~the slight increase in travel expected from calendar year 1990 to fiscal year 1991, the weight-distance tax should have generated approximately $86,808,000 in revenue during fiscal year 1991. Actual receipts, totaling approximately $61,046,000, were 70.3 percent of the expected amount. Table 42 presents the estimated and reported revenues for the weight-distance tax for both the 1990 and 1992 studies. The tax collection efficiency for the 1990 period was 67.4 percent indicating an increase in the efficiency of collecting the weight-distance tax between 1990 and 1992. Although the potential for error in the estimation of heavy truck mileage is acknowledged, the travel data supporting this finding are considered to be quite good, and no bias that would result in a significant overestimate has been identified. The FY 1991 $26 million shortfall in weight-distance tax collections is expected to continue to diminish in future years as both carriers and state agencies become more adept at administering this tax, implemented in April of 1988, and as improved truck monitoring strategies are implemented.
Estimates of revenue expected from fuel taxes are somewhat more difficult to develop not only because of the several different types of fuel that are used and differential tax rates (depending both on type of fuel and the vehicle that consumes it) but also because average rates of fuel consumption are not known with great certainty. Fortunately, opportunity exists in a cost allocation study to adjust estimated gallonages to agree with those on which fuel taxes were actually collected. For the 1992 study period, estimates of the fuel used for highway travel total 1, 701,792,000 gallons of gasoline and gasohol and 528,113,000 gallons of special fuel (Table 43). Compared with the gallonages on which fuel taxes were collected in FY 1991, these estimates are 7.2 percent low and 8.2 percent high, respectively. Altogether, this study estimated about 4 percent less fuel than was "consumed" statewide.
Using gallonages reported by the Revenue Cabinet, estimated Road Fund revenue from fuel taxes compared with reported collections is shown in Table 44 along with the 1990 data. On the basis of these comparisons, the efficiency of collecting user-reported fuel taxes, the heavy vehicle surtax, and the normal use tax, is about 77 or 76 percent. Both figures indicated an increased efficiency when compared to the 1990 data. However, in both periods the dealer collection of fuel taxes, as is the practice with normal fuel taxes, is much more efficient.
38
SUMMARY AND FINDINGS
----~-~-------~~------~-~-----The-ciirieiiTii1gliw-ay -cosnrmr revemre-altm:atimrmudy-is--the-{ifih-Bf--&-roooot-~--~--------------~Kentucky series begun in 1982. Experience gained with each study has resulted in subsequent refinements that have enlarged the data base, enhanced the accuracy, and simplified the study process. One of the long-term aims is to develop an easy-to-use process for continuously monitoring effects of changes in traffic patterns, in finance and tax policy, and in highway expenditures.
Passenger automobiles remain the largest single revenue source, contributing about 45 percent of the total user revenue, and they slightly exceed their equitable cost assignment by about 1 percent. Pickups and light trucks continue to contribute more in revenue than their cost responsibility, by 10 percent and 6 percent, respectively. Heavy trucks also exceed their cost assignment by 3 percent, while medium trucks and buses fail to meet their responsibility.
Despite any methodological and/or data imprecision that may have influenced the above estimates, operators of heavy trucks are indisputedly playing a much more central role in financing the state highway system now than in the past. Even if their tax rates are unchanged, continued increases in revenue are expected as trucking garners an even greater share of the nation's freight business. This study examined the impact of several taxing alternatives proposed by the trucking industry and determined that these proposals would unbalance the near equity that has been achieved under current tax policy for both automobiles and heavy trucks. The application of these tax alternatives would benefit heavy trucks and it would create a substantial Road Fund revenue shortfall.
In FY 1991, approximately 2.0 cents per mile of operation were collected from passenger cars for the purpose of upgrading and maintaining Kentucky's state highways. Collections generally increase for progressively larger vehicles: 80,000-pound trucks contribute approximately 10.1 cents per mile. Although available data on operating expenses are limited, these road user taxes appear to comprise a relatively small portion of operating expenses. At such levels of taxation, the largest trucks traveling about 100,000 miles in Kentucky each year would make annual contributions of $10,100. At 15,000 miles a year, a car would contribute $300.
A review and evaluation of recent highway cost allocation literature was conducted as part of this study. The review, which compared Kentucky's approach to that of five other states, indicated that there is a wide variety of approaches taken by the several states but most studies have adopted the general principles of the 1982 Federal study. Different revenue-tocost ratios by vehicle class among the states were attributed to differences in roadway types, "basic" vehicle, determination of expenditures and revenues, and amount of travel by each vehicle class. The reliability and sensitivity of such studies was also examined, and it was determined that continuous evaluation and update are desirable.
39
The allocation of bridge construction costs among the highway users was another issue ~~~-- . . examined in this study. The literature review indicated that the incremental method is widely
--------------~~~dfor allocatinforRlge consftuction~costs;-~nowever;--this-awma&h-may-I~~abkloL~-~~~~-~-bridge cost allocation due to bridge design procedures and difficulties and low accuracy of modeling incremental costs. A more reasonable approach is allocation of costs by PCE-mi!es or by a combination of PCE-miles and residual (truck) costs by ton-miles.
An examination of the cost and revenue ramifications of the extended-weight system was conducted within this study, which was partially completed within the framework of the available resources and time constraints. This analysis indicated that the current coal-decal fee structure may produce a loss of approximately $2 million annually to the Road Fund, the heavier truck weights increase the pavement overlay costs as well as the construction, reconstruction, and rehabilitation of pavements, shoulders, and bridges.
In regard to tax collection efficiency, this study also sought to determine how completely current taxes are being collected. Although this is a difficult task, there appears to be little opportunity for highway users to avoid full payment of those taxes that contribute most to the revenue totals, in particular, normal fuel taxes and vehicle usage taxes. Taxes assessed on the basis of user-reported information, namely, the heavy vehicle fuel surtax, the normal use surtax, and the weight-distance tax, appear to have been collected with about a 70 to 75 percent efficiency. Efficiency of collecting these taxes should continue to increase as experience accumulates and more effective monitoring and auditing procedures are implemented.
This cost and revenue allocation study has not dealt with a number of issues central to highway finance. It has not sought to determine whether the level of revenue currently being collected is sufficient to meet the needs for an efficient and effective highway system. Neither has it sought to address the balance between user and non-user responsibilities for the highway infrastructure nor the varying responsibilities for local roads and streets in contrast with the state highway system. It has not addressed the possibility that post-1991 Federal surface transportation legislation may well alter the nature and level of Federal participation in highway finance and, henceforth, the state responsibility as well. Finally, it should be emphasized that cost allocation studies do not determine tax policy. While they provide indispensable information to the policy maker regarding the equity of alternative tax policies, they do not consider a host of other critical factors including competitive balance among modes, economic development and prosperity, funding levels necessary to maintain and enhance efficient commerce, energy conservation, etc.
40
REFERENCES
~----~~~~1~. ~--GeHege-ef~Conuneroo,--Bu±<laUc-~f---BtlSiness-Researj;h,--''Einancing_Xen!JJcky' lt Roads ___ ~~-~--~--~~-~~~--and Streets," University of Kentucky, 1956.
2. Black, James E. and Pigman, Jerry G., "Allocation of Transportation Costs to Users," Research Report UKTRP-81-22, Kentucky Transportation Research Program, University of Kentucky, Lexington, May 1982.
3. Pigman, Jerry G. and Deacon, John A., "Allocation of Highway Costs and Revenues," Research Report UKTRP-88-8, Kentucky Transportation Research Program, University of Kentucky, Lexington, March 1988.
4. Pigman, J.G. and Deacon, J.A., "Allocation for Highway Costs and Revenues," Research Report KTC-90-1, Kentucky Transportation Center, University of Kentucky, Lexington, January 1990.
5. U.S. Department of Transportation, Office of the Secretary, "Final Report on the Federal Highway Cost Allocation Study," Report of the Secretary of Transportation to the United States Congress, U.S. Government Printing Office, Washington, D.C., May 1982.
6. Highway Subcommittee on Highway Transport, "Highway Cost Allocation Study Activity Report," First Edition, American Association of State Highway and Transportation Officials, Washington, D.C., February 1989.
7. The Urban Institute and SYDEC, Inc., "Rationalization of Procedures for Highway Cost Allocation, Final Report," 1990.
8. Virginia Department of Transportation, "Vehicle Cost Responsibility Study (SIR 121 ), " 1991.
9. Cambridge Systematics, Inc., SYDEC, Inc., The Urban Institute, and Jack Faucett Associates, "Results of the Minnesota Highway User Cost Allocation Study," 1990.
10. SYDEC, Inc. and The Urban Institute, "Highway Cost Allocation Study, Final Report," prepared for the Vermont Legislature, 1990.
11. SYDEC, Inc., "Highway Cost Allocation Study, Final Report," prepared for the California Department of Transportation, 1987.
12. Sinha, K.C., Fwa, T.F., Sharaf, E.A., Tee, A.B., and Michael, H.L., "Indiana Highway Cost Allocation Study: Final Report," FHWAJIN/JHRP-84/20, Indiana Department of Highways and School of Engineering, Purdue University, 1984.
41
13. Sinclair, B., "Incremental Analysis of Structural Construction Costs," Sinclair and Associates, April 1981.
14. Saad, Charles G., "Allocation of Bridge Construction Costs in Kentucky," A Dissertation Submitted in Partial Fulfillment of the Requirements for the Doctor of Philosophy Degree, University of Kentucky, Lexington, December 1991.
15. Commonwealth of Kentucky, Transportation Cabinet, "Financial Report to Management for the Period of July 1, 1990 to June 30, 1991," Frankfort, Kentucky.
16. Motor Vehicle Manufacturers' Association, "Motor Vehicle Facts & Figures '91."
17. Kentucky Motor Transport Association, Inc., "Motor Carrier Industry Legislative Proposals," Unpublished, November 8, 1991.
18. Secretary of Transportation, "Heavy Vehicle Cost Responsibility Study," U.S. Department of Transportation, Washington, D.C, November 1988.
19. Transportation Research Board, "New Trucks for Greater Productivity and Less Road Wear - An Evaluation of the Turner Proposal," Special Report 227, Transportation Research Board, Washington, D.C., 1990.
20. Transportation Research Board, "Truck Weight Limits - Issues and Opinions," Special Report 225, Transportation Research Board, Washington, D.C, 1990.
42
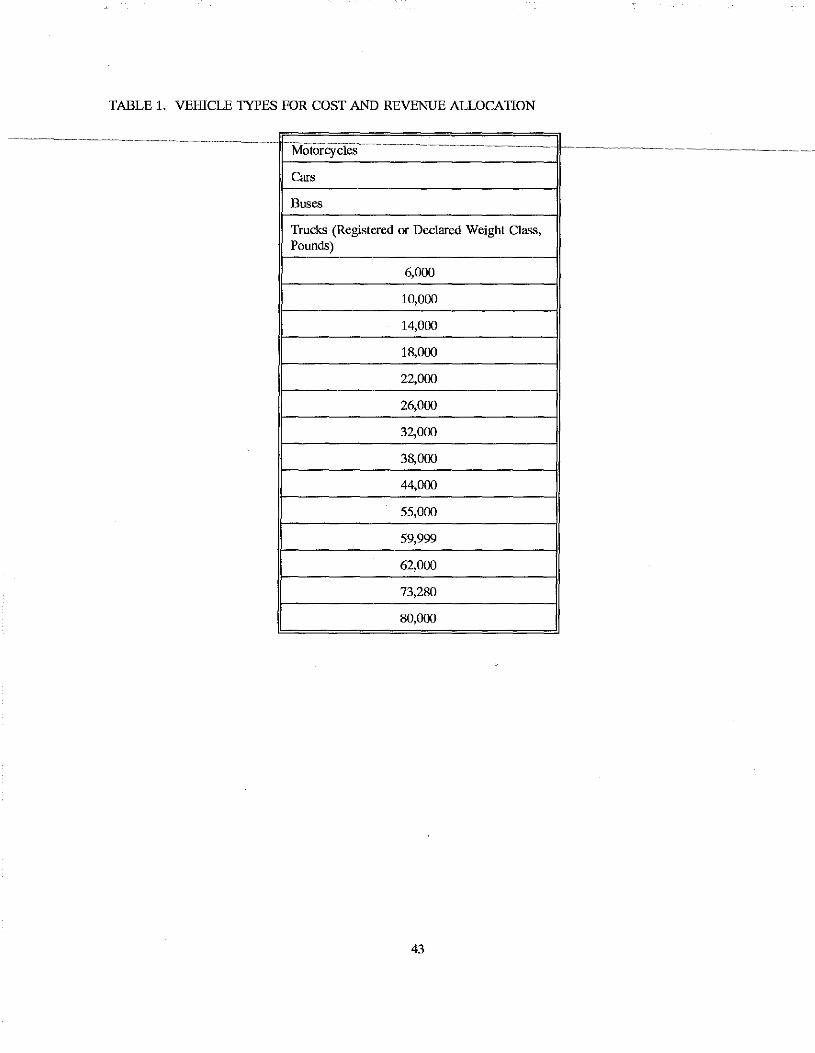
TABLE 1. VEITICLE TYPES FOR COST AND REVENUE ALLOCATION
·~.-o
Cars
Buses
Trucks (Registered or Declared Weight Class, Pounds)
6,000
10,000
14,000
18,000
22,000
26,000
32,000
38,000
44,000
55,000
59,999
62,000
73,280
80,000
43
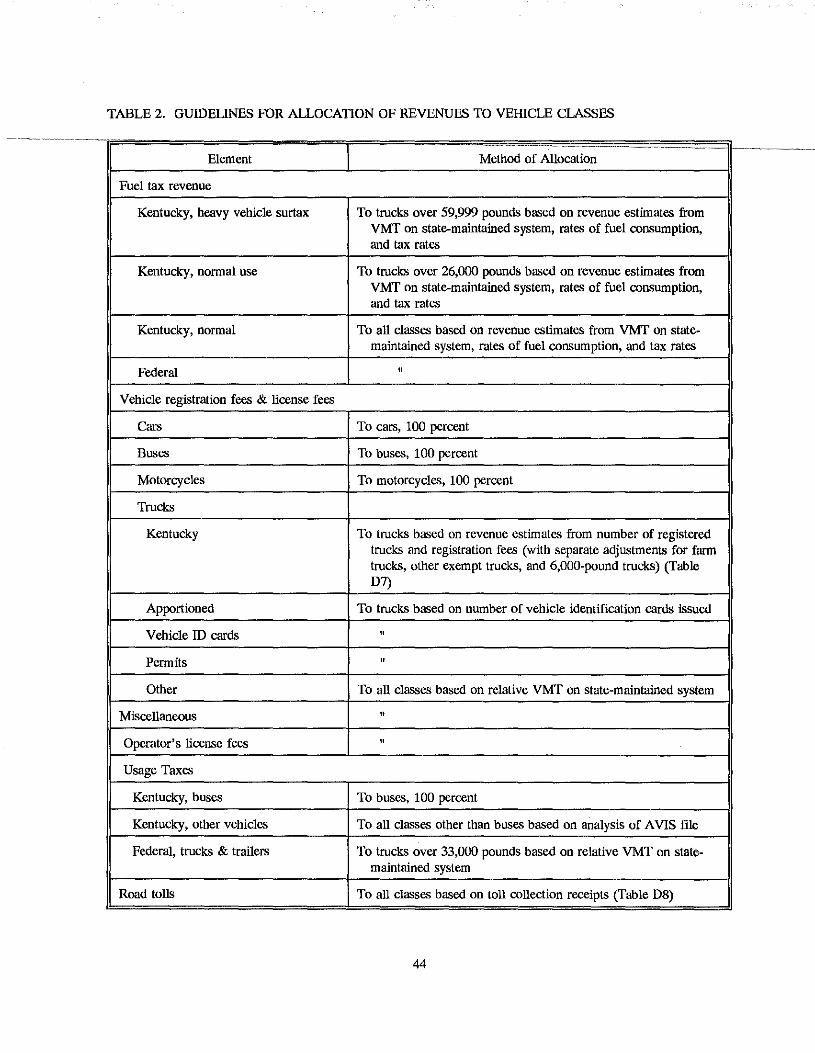
TABLE 2. GUIDEUNES FOR ALLOCATION OF REVENUES TO VEIDCLE CLASSES
- --Element Method of Allocation
Fuel tax revenue
Kentucky, heavy vehicle surtax To trucks over 59,999 pounds based on revenue estimates from VMT on state-maintained system, rates of fuel consumption, and tax rates
Kentucky, normal use To trucks over 26,000 pounds based on revenue estimates from VMT on state-maintained system, rates of fuel consumption, and tax rates
Kentucky, normal To all classes based on revenue estimates from VMT on state-maintained system, rates of fuel consumption, and tax rates
Federal "
Vehicle registration fees & license fees
Cars To cars, 100 percent
Buses To buses, 100 percent
Motorcycles To motorcycles, 100 percent
Trucks
Kentucky To trucks based on revenue estimates from number of registered trucks and registration fees (with separate adjustments for farm trucks, other exempt trucks, and 6,000-pound trucks) (Table D7)
Apportioned To trucks based on number of vehicle identification cards issued
Vehicle ID cards "
Permits "
Other To all classes based on relative VMT on state-maintained system
Miscellaneous "
Operator's license fees "
Usage Taxes
Kentucky, buses To buses, 100 percent
Kentucky, other vehicles To all classes other than buses based on analysis of A VIS file
Federal, trucks & trailers To trucks over 33,000 pounds based on relative VMT on state-maintained system
Road tolls To all classes based on toll collection receipts (Table D8)
44
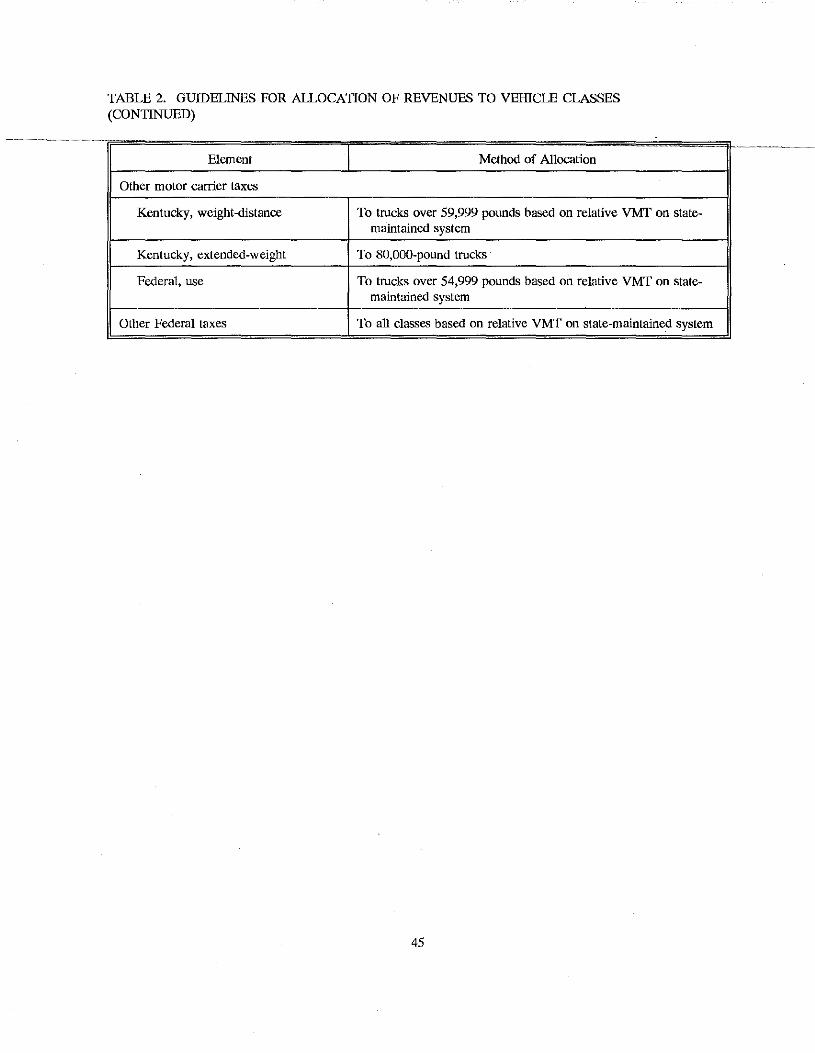
TABLE 2. GUIDELINES FOR ALLOCATION OF REVENUES TO VEIDCLE CLASSES (CONTINUED)
Element Method of Allocation
Other motor carrier taxes
Kentucky, weight-distance To trucks over 59,999 pounds based on relative VMT on state-maintained system
Kentucky, extended-weight To 80,000-pound trucks
Federal, use To trucks over 54,999 pounds based on relative VMT on state-maintained system
Other Federal taxes To all classes based on relative VMT on state-maintained system
45
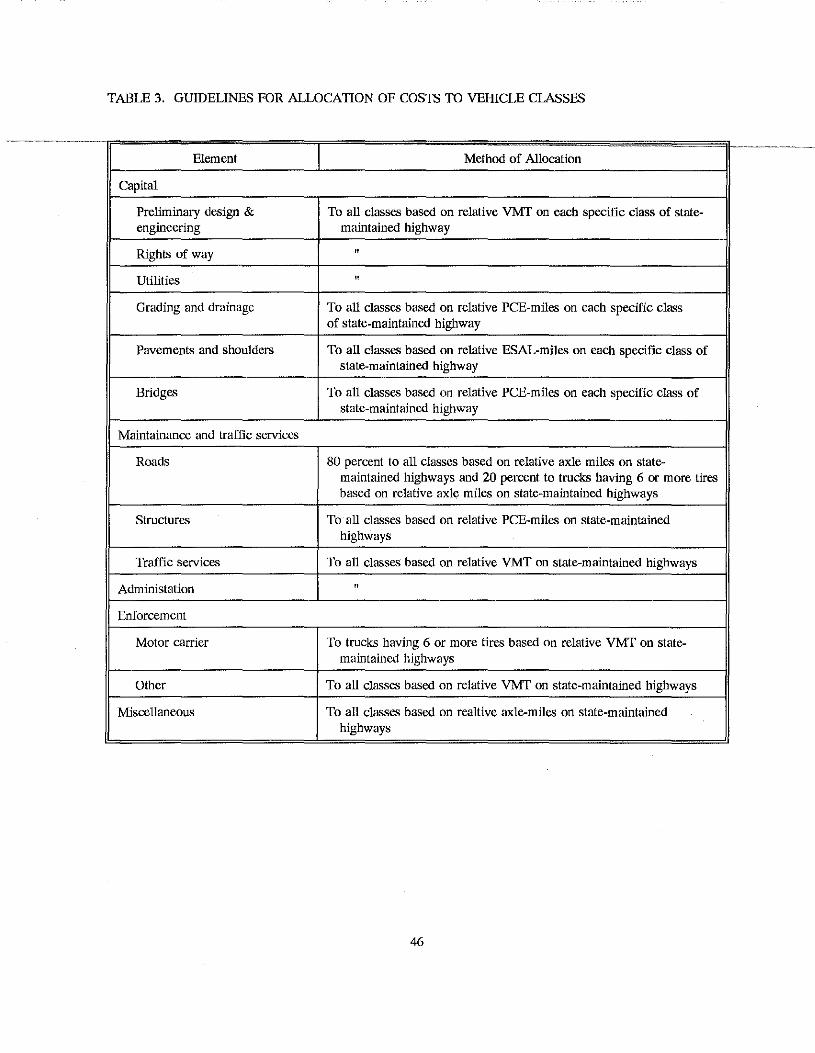
TABLE 3. GUIDELINES FOR ALLOCATION OF COSTS TO VEHICLE CLASSES
-Element Method of Allocation
Capital
Preliminary design & To all classes based on relative VMT on each specific class of state-engineering maintained highway
Rights of way "
Utilities "
Grading and drainage To all classes based on relative PCE-miles on each specific class of state-maintained highway
Pavements and shoulders To all classes based on relative ESAL-miles on each specific class of state-maintained highway
Bridges To all classes based on relative PCE-miles on each specific class of state-maintained highway
Maintainance and traffic services
Roads 80 percent to all classes based on relative axle miles on state-maintained highways and 20 percent to trucks having 6 or more tires based on relative axle miles on state-maintained highways
Structures To all classes based on relative PCE-miles on state-maintained highways
Traffic services To all classes based on relative VMT on state-maintained highways
Administation "
Enforcement
Motor carrier To trucks having 6 or more tires based on relative VMT on state-maintained highways
Other To all classes based on relative VMT on state-maintained highways
Miscellaneous To all classes based on realtive axle-miles on state-maintained highways
46
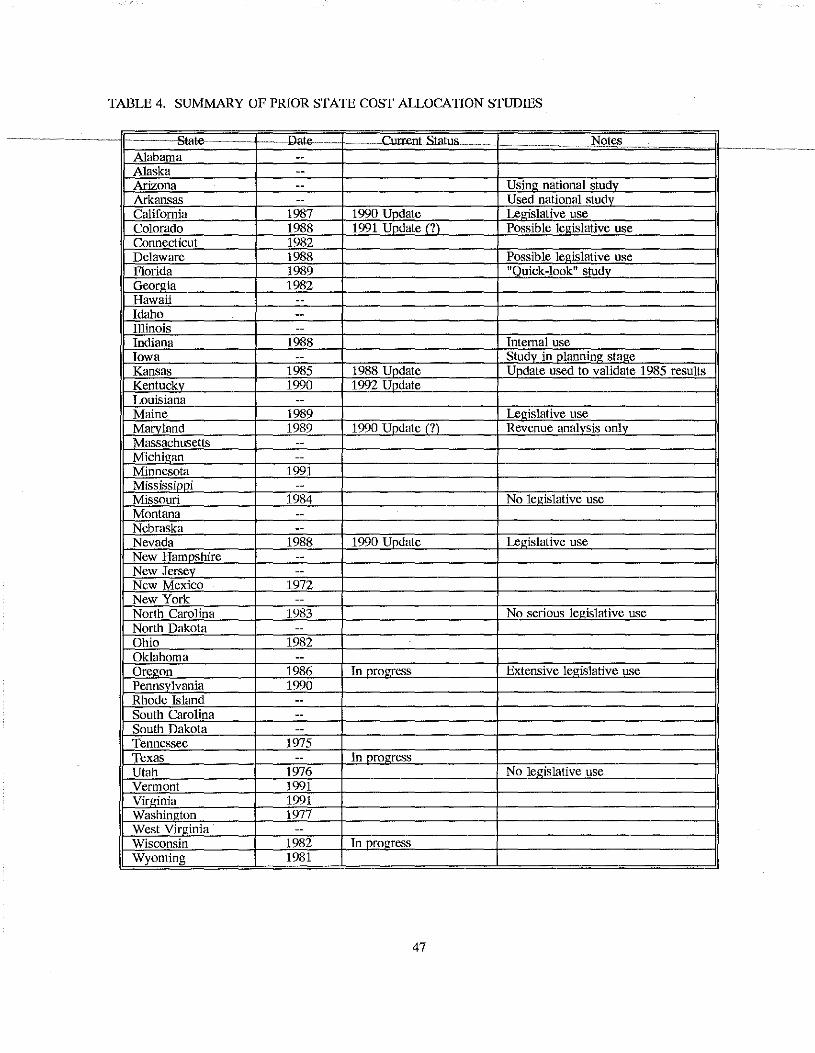
TABLE 4. SUMMARY OF PRIOR STATE COST ALLOCATION STUDIES
... -stale- . .. . .. Dat~ .. . . ...CUrrenLStatus.. . .. Notes . . . ..
Alabama --Alaska --Arizona -- Using national study Arkansas -- Used national studv California 1987 1990 Update Legislative use Colorado 1988 1991 Up_date Gl Possible leg_islative use Connecticut 1982 Delaware 1988 Possible legislative use Florida 1989 "Quick-look" study Georgia 1982 Hawaii --Idaho --Illinois --Indiana 1988 Internal use Iowa -- Studv in olanning stage Kansas 1985 1988 Update Update used to validate 1985 results Kentuckv 1990 1992 Uodate Louisiana --Maine 1989 Legislative use Maryland 1989 1990 Update (?) Revenue analysis only Massachusetts --Michigan --Minnesota 1991 Mississippi --Missouri 1984 No legislative use Montana --Nebraska --Nevada 1988 1990 Uodate Legislative use New Hampshire --New Jersev --New Mexico 1972 New York --North Carolina 1983 No serious legislative use North Dakota --Ohio 1982 Oklahoma --Oregon 1986 In m:ogress Extensive legislative use Pennsylvania 1990 Rhode Island --South Carolina --South Dakota --Tennessee 1975 Texas -- In progress Utah 1976 No legislative use Vermont 1991 Vintinia 1991 Washington 1977 West Virginia --Wisconsin 1982 In orogress Wyoming 1981
47
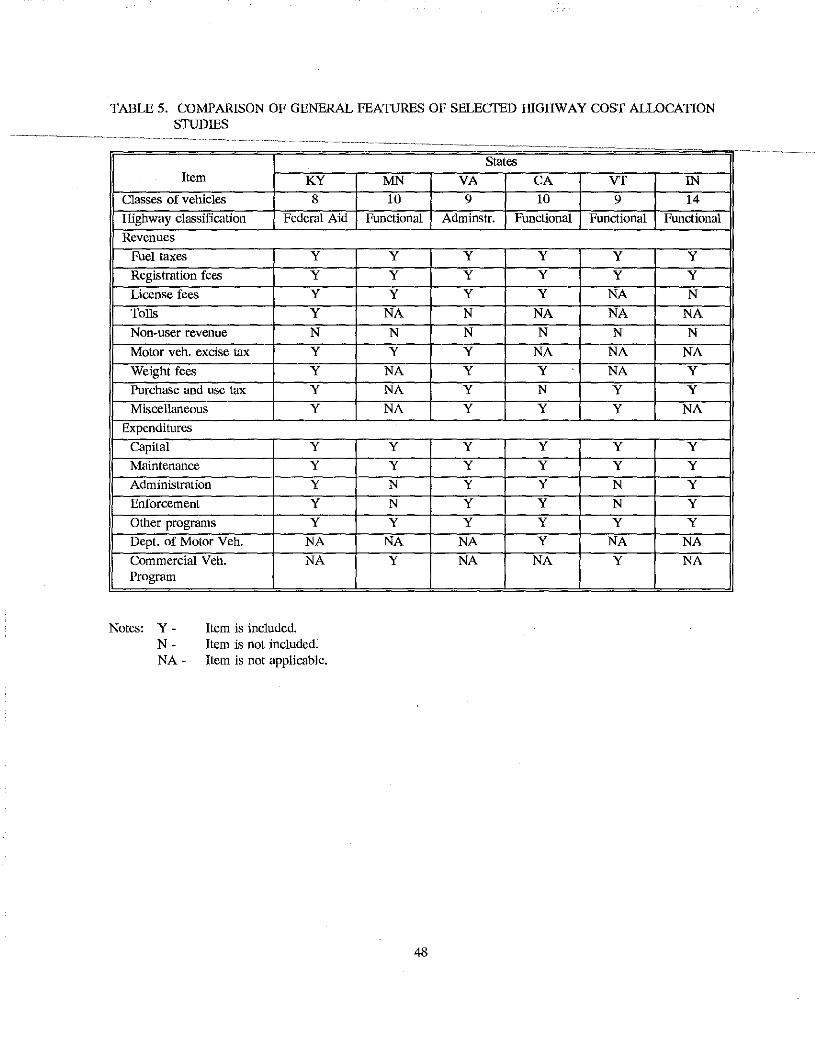
TABLE 5. COMPARISON OF GENERAL FEATURES OF SELECTED IUGHWAY COST ALLOCATION STUDIES
States Item KY MN VA CA VT IN
Classes of vehicles 8 10 9 10 9 14
Highway classification Federal Aid Functional Adminstr. Functional Functional Functional
Revenues
Fuel taxes y y y y y y
Registration fees y y y y y y
License fees y y y y NA N
Tolls y NA N NA NA NA
Non-user revenue N N N N N N
Motor veh. excise tax y y y NA NA NA
Weight fees y NA y y NA y
Purchase and use tax y NA y N y y
Miscellaneous y NA y y y NA
Expenditures
Capital y y y y y y
Maintenance y y y y y y
Administration y N y y N y
Enforcement y N y y N y
Other programs y y y y y y
Dept. of Motor Veh. NA NA NA y NA NA
Commercial Veh. NA y NA NA y NA Program
Notes: Y - Item is included. N - Item is not included. NA - Item is not applicable.
48
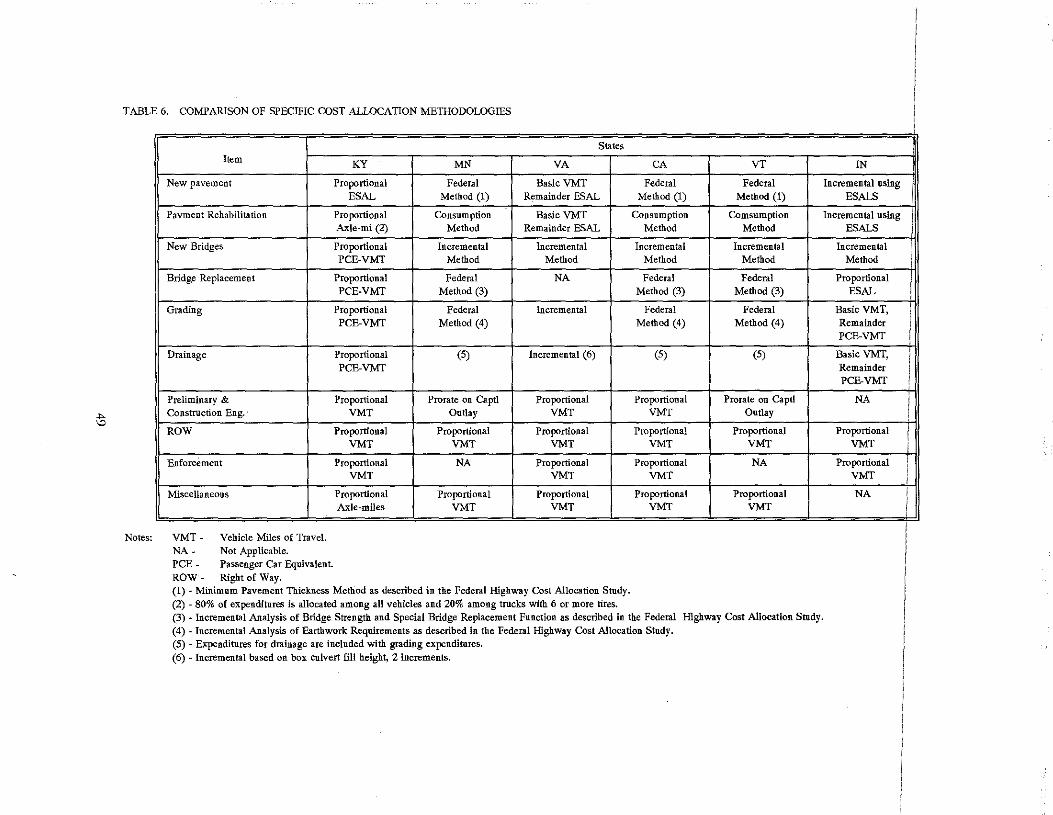
_,. 'D
TABLE
Notes
6. COMPARISON OF sPECIFIC COST ALLOCATION METHODOIDGIES
States Item KY MN VA CA VT IN
New pavement Proportional Federal Basic VMT Federal Federal Incremental using ESAL Method (1) Remainder ESAL Method (1) Method (1) ESALS
Pavment Rehabilitation Proportional Consumption Basic VMT Consumption Comsumption Incremental using Ax.le·mi (2) Method Remainder ESAL Method Method ESALS
New Bridges Proportional Incremental Incremental Incremental Incremental Incremental PCE-VMT Method Method Method Method Method
Bridge Replacement Proportional Federal NA Federal Federal Proportional PCE-VMT Method (3) Method (3) Method (3) ESAL
Grading Proportional Federal Incremental Federal Federal Basic VMT, PCE-VMT Metnod (4) Method (4) Method (4) Remainder
PCE-VMT
Drainage Proportional (5) Incremental (6) (5) (5) Basic VMT, PCE-VMT Remainder
PCE-VMT
Preliminary & Proportional Prorate on Captl Proportional Proportional Prorate on Captl NA Construction Eng. VMT Outlay VMT VMT Outlay
ROW Proportional Proportional Proportional Proportional Proportional Proportional VMT VMT VMT VMT VMT VMT
Enforcement Proportional NA Proportional Proportional NA Proportional VMT VMT VMT VMT
Miscellaneous Proportional Proportional Proportional Proportional Proportional NA Axle·miles VMT VMT VMT VMT
VMT- Vehicle Miles of Travel. NA- Not Applicable. PCE- Passenger Car Equivalent. ROW- Right of Way. (1)- Minimum Pavement Thickness Method as described in the Federal Highway Cost Allocation Study. (2) · 80% of expenditures is allocated among all vehicles and 20% among trucks with 6 or more tires. (3)- Incremental Analysis of Bridge Strength and Special Bridge Replacement Function as described in the Federal Highway Cost Allocation Study. (4)- Incremental Analysis of Earthwork Requirements as described in the Federal Highway Cost Allocation Study. (5) · Expenditures for drainage are included with grading expenditures. (6) -Incremental based on box culvert fill height, 2 increments.
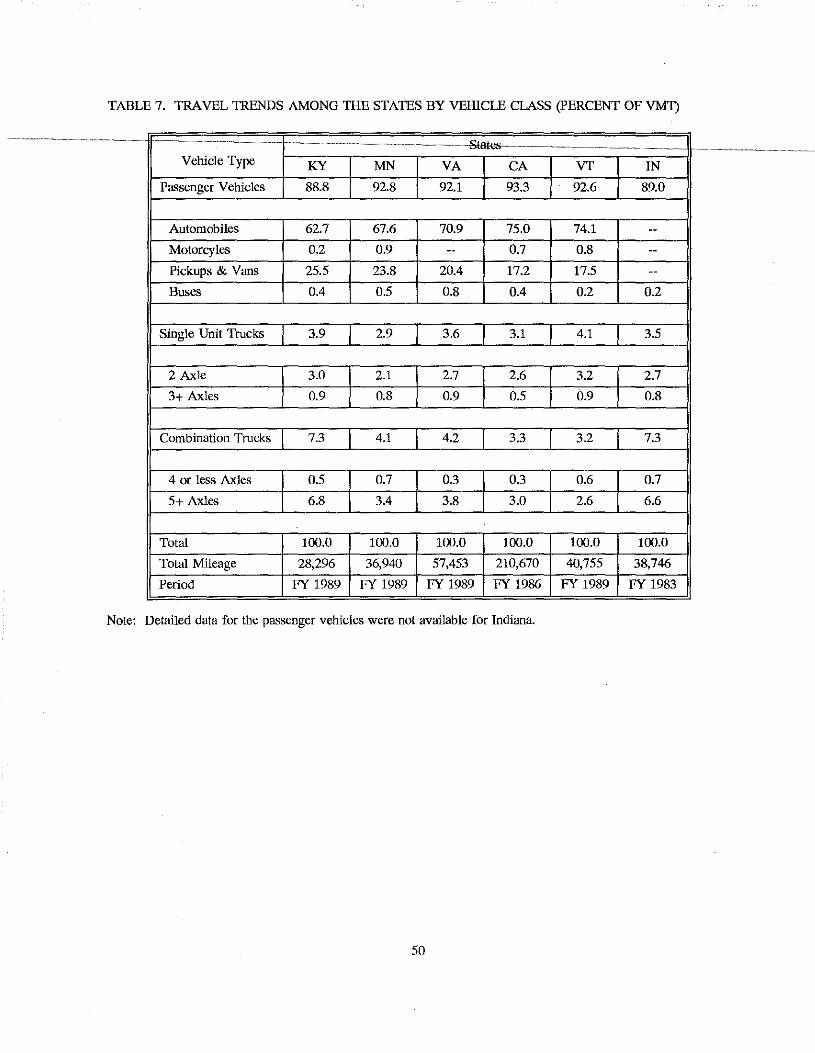
TABLE 7. TRAVEL TRENDS AMONG THE STATES BY VEIDCLE CLASS (PERCENT OF VMI)
- -- -- -- --.<>tat<!£- ----- - -----Vehicle Type KY MN VA CA VT IN
Passenger Vehicles 88.8 92.8 92.1 93.3 92.6 89.0
Automobiles 62.7 67.6 70.9 75.0 74.1 --Motorey1es 0.2 0.9 -- 0.7 0.8 --Pickups & Vans 25.5 23.8 20.4 17.2 17.5 --Buses 0.4 0.5 0.8 0.4 0.2 0.2
Single Unit Trucks 3.9 2.9 3.6 3.1 4.1 3.5
2 Axle 3.0 2.1 2.7 2.6 3.2 2.7
3+ Axles 0.9 0.8 0.9 0.5 0.9 0.8
Combination Trucks 7.3 4.1 4.2 3.3 3.2 7.3
4 or less Axles 0.5 0.7 0.3 0.3 0.6 0.7
5+ Axles 6.8 3.4 3.8 3.0 2.6 6.6
Total 100.0 100.0 100.0 100.0 100.0 100.0
Total Mileage 28,296 36,940 57,453 210,670 40,755 38,746
Period FY 1989 FY 1989 FY 1989 FY 1986 FY 1989 FY 1983
Note: Detailed data for the passenger vehicles were not available for Indiana.
50
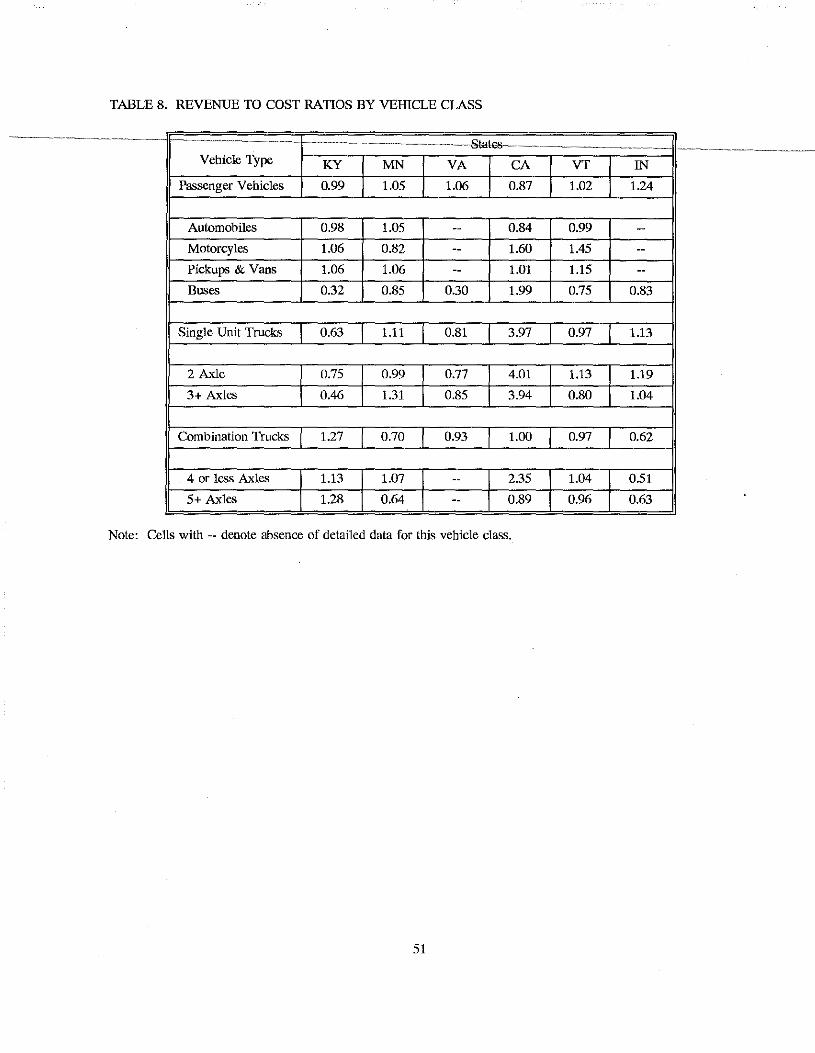
TABLE 8. REVENUE TO COST RATIOS BY VEIDCLE CLASS
--------- - -- ----- - - Slales -- - - ------ ------·
------Vehicle Type KY MN VA CA VT IN
Passenger Vehicles 0.99 1.05 1.06 0.87 1.02 1.24
Automobiles 0.98 1.05 -- 0.84 0.99 --Motorcyles 1.06 0.82 -- 1.60 1.45 --Pickups & Vans 1.06 1.06 -- 1.01 1.15 --Buses 0.32 0.85 0.30 1.99 0.75 0.83
Single Unit Trucks 0.63 1.11 0.81 3.97 0.97 1.13
2 Axle 0.75 0.99 0.77 4.01 1.13 1.19
3+ Axles 0.46 1.31 0.85 3.94 0.80 1.04
Combination Trucks 1.27 0.70 0.93 1.00 0.97 0.62
4 or less Axles 1.13 1.07 -- 2.35 1.04 0.51
5+ Axles 1.28 0.64 -- 0.89 0.96 0.63
Note: Cells with -- denote absence of detailed data for this vehicle class.
51
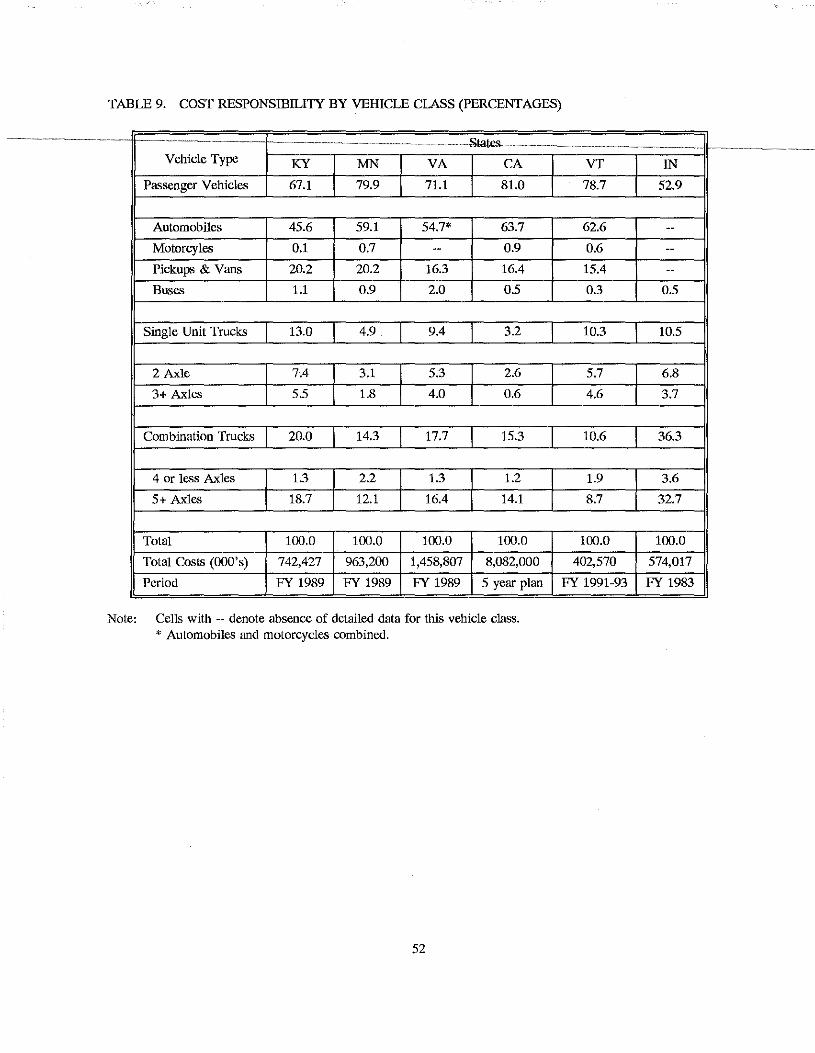
TABLE 9. COST RESPONSIBILIIT BY VEHICLE CLASS (PERCENTAGES)
- --- --- - - ---- -Stat~- ---Vehicle Type KY MN VA CA
Passenger Vehicles 67.1 79.9 71.1 81.0
Automobiles 45.6 59.1 54.7* 63.7
Motorcyles 0.1 0.7 -- 0.9
Pickups & Vans 20.2 20.2 16.3 16.4
Buses 1.1 0.9 2.0 0.5
Single Unit Trucks 13.0 4.9 9.4 3.2
2 Axle 7.4 3.1 5.3 2.6
3+ Axles 5.5 1.8 4.0 0.6
Combination Trucks 20.0 14.3 17.7 15.3
4 or less Axles 1.3 2.2 1.3 1.2
5+ Axles 18.7 12.1 16.4 14.1
Total 100.0 100.0 100.0 100.0
Total Costs (OOO's) 742,427 963,200 1,458,807 8,082,000
Period FY 1989 FY 1989 FY 1989 5 year plan
Note: Cells with -- denote absence of detailed data for this vehicle class. * Automobiles and motorcycles combined.
52
---- -- --
VT
78.7
62.6
0.6
15.4
0.3
10.3
5.7
4.6
10.6
1.9
8.7
100.0
402,570
FY 1991-93
_____ ,,,_ ..... _ .......
IN
52.9
------
0.5
10.5
6.8
3.7
36.3
3.6
32.7
100.0
574,017
FY 1983
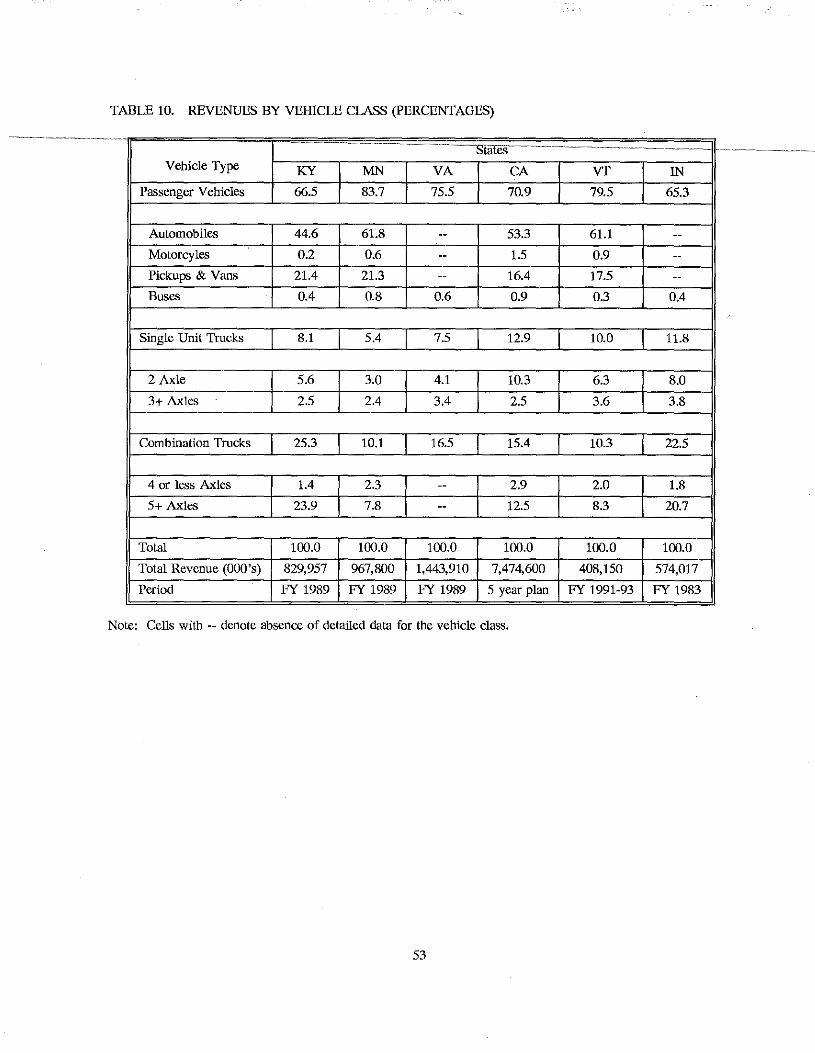
TABLE 10. REVENUES BY VEHICLE CLASS (PERCENTAGES)
;:,rares Vehicle Type KY MN VA CA VT IN
Passenger Vehicles 66.5 83.7 75.5 70.9 79.5 65.3
Automobiles 44.6 61.8 -- 53.3 61.1 --Motorcyles 0.2 0.6 -- 1.5 0.9 --Pickups & Vans 21.4 21.3 -- 16.4 17.5 --Buses 0.4 0.8 0.6 0.9 0.3 0.4
Single Unit Trucks 8.1 5.4 7.5 12.9 10.0 11.8
2 Axle 5.6 3.0 4.1 10.3 6.3 8.0
3+ Axles 2.5 2.4 3.4 2.5 3.6 3.8
Combination Trucks 25.3 10.1 16.5 15.4 10.3 22.5
4 or less Axles 1.4 2.3 -- 2.9 2.0 1.8
5+ Axles 23.9 7.8 -- 12.5 8.3 20.7
Total 100.0 100.0 100.0 100.0 100.0 100.0
Total Revenue (OOO's) 829,957 967,800 1,443,910 7,474,600 408,150 574,017
Period FY 1989 FY 1989 FY 1989 5 year plan FY 1991-93 FY 1983
Note: Cells with -- denote absence of detailed data for the vehicle class.
53
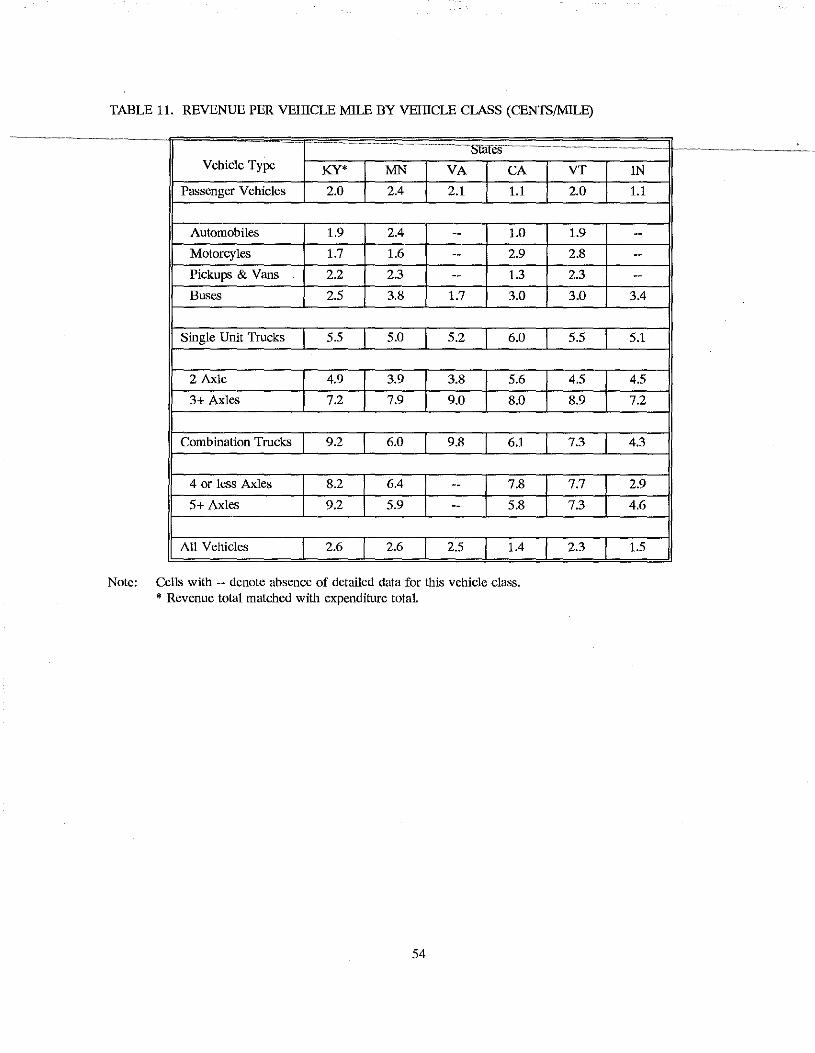
TABLE 11. REVENUE PER VEIDCLE MILE BY VEHICLE CLASS (CENTS/MILE)
"'"'"" Vehicle Type KY* MN VA CA
Passenger Vehicles 2.0 2.4 2.1 1.1
Automobiles 1.9 2.4 -- 1.0
Motorcyles 1.7 1.6 -- 2.9
Pickups & Vans . 2.2 2.3 -- 1.3
Buses 2.5 3.8 1.7 3.0
Single Unit Trucks 5.5 5.0 5.2 6.0
2 Axle 4.9 3.9 3.8 5.6
3+ Axles 7.2 7.9 9.0 8.0
Combination Trucks 9.2 6.0 9.8 6.1
4 or less Axles 8.2 6.4 -- 7.8
5+ Axles 9.2 5.9 -- 5.8
All Vehicles 2.6 2.6 2.5 1.4
Note: Cells with -- denote absence of detailed data for this vehicle class. * Revenue total matched with expenditure totaL
54
VT
2.0
1.9
2.8
2.3
3.0
5.5
4.5
8.9
7.3
7.7
7.3
2.3
IN
1.1
------
3.4
5.1
4.5
7.2
4.3
2.9
4.6
1.5
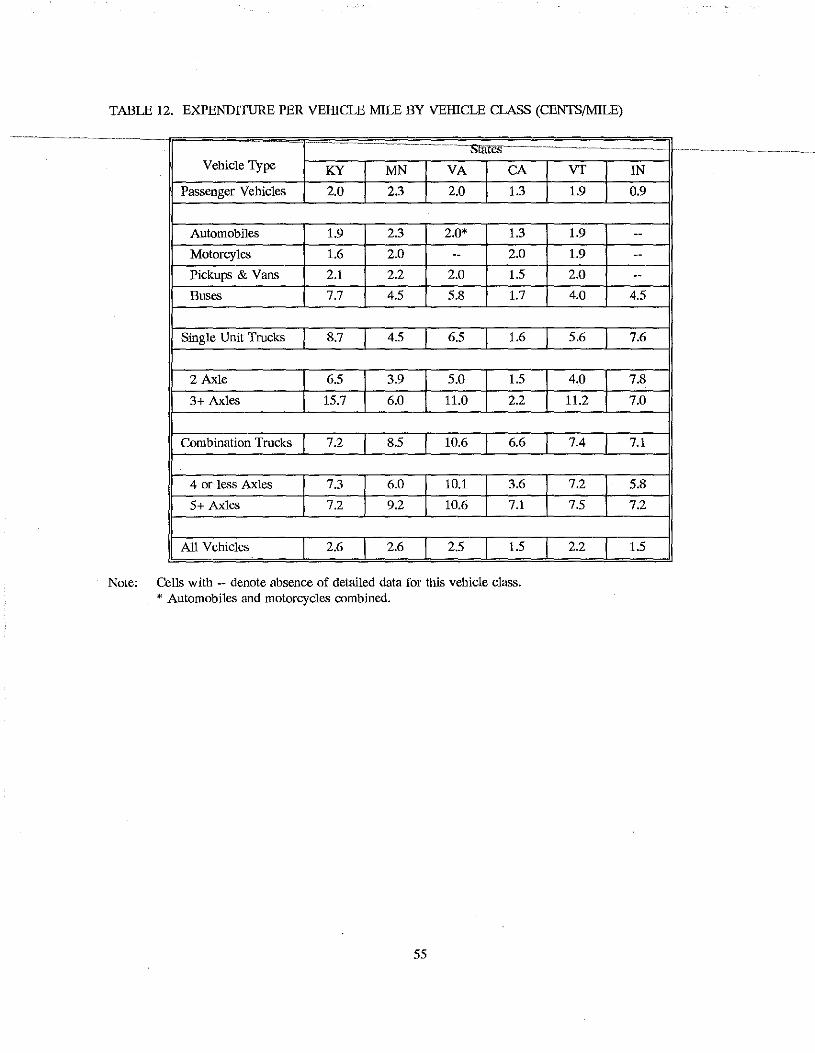
TABLE 12. EXPENDITURE PER VEHICLE MILE BY VEHICLE CLASS (CENTS/MILE)
""""'' Vehicle Type KY MN VA CA
Passenger Vehicles 2.0 2.3 2.0 1.3
Automobiles 1.9 2.3 2.0* 1.3
Motorcyles 1.6 2.0 -- 2.0
Pickups & Vans 2.1 2.2 2.0 1.5
Buses 7.7 4.5 5.8 1.7
Single Unit Trucks 8.7 4.5 6.5 1.6
2 Axle 6.5 3.9 5.0 1.5
3+ Axles 15.7 6.0 11.0 2.2
Combination Trucks 7.2 8.5 10.6 6.6
4 or less Axles 7.3 6.0 10.1 3.6
5+ Axles 7.2 9.2 10.6 7.1
All Vehicles 2.6 2.6 2.5 1.5
Note: Cells with -- denote absence of detailed data for this vehicle class. * Automobiles and motorcycles combined.
55
VT
1.9
1.9
1.9
2.0
4.0
5.6
4.0
11.2
7.4
7.2
7.5
2.2
IN
0.9
------
4.5
7.6
7.8
7.0
7.1
5.8
7.2
1.5
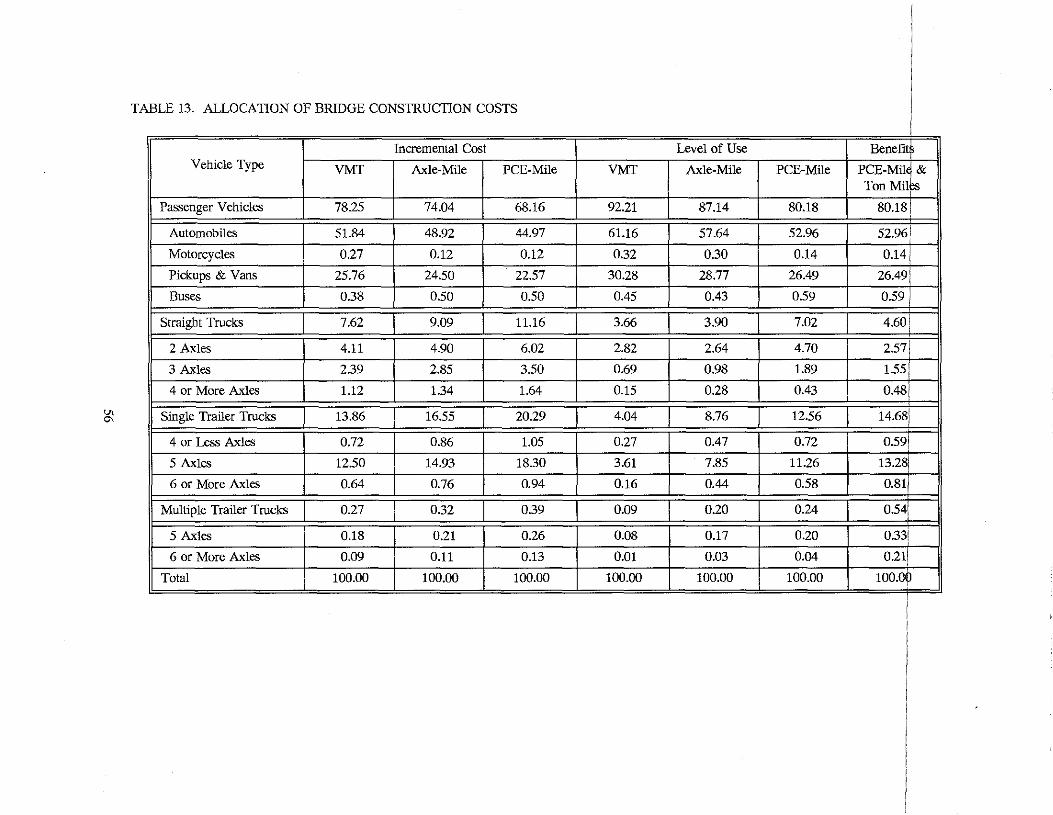
TAB LE 13. ALLOCATION OF BRIDGE CONSTRUCTION COSTS
Incremental Cost Level of Use Benefit I
Vehicle Type VMT Axle-Mile PCE-Mile VMT Axle-Mile PCE-Mile PCE-Mil & ' Ton Miles 1
Passenger Vehicles 78.25 74.Q4 68.16 92.21 87.14 80.18 80.181 '
I Automobiles 51.84 48.92 44.97 61.16 57.64 52.96 52.961
Motorcycles 0.27 0.12 0.12 0.32 0.30 0.14 0.14
Pickups & Vans 25.76 24.50 22.57 30.28 28.77 26.49 26.491
Buses 0.38 0.50 0.50 0.45 0.43 0.59 0.59.
Straight Trucks 7.62 9.09 11.16 3.66 3.90 7.02 4.60[
2 Axles 4.11 4.90 6.02 2.82 2.64 4.70 2.57[
3 Axles 2.39 2.85 3.50 0.69 0.98 1.89 1.55[
4 or More Axles 1.12 1.34 1.64 0.15 0.28 0.43 0.48
~ Single Trailer Trucks 13.86 16.55 20.29 4.04 8.76 12.56 14.681
4 or Less Axles 0.72 0.86 1.05 0.27 0.47 0.72 0.591 '
5 Axles 12.50 14.93 18.30 3.61 7.85 11.26 13.281
6 or More Axles 0.64 0.76 0.94 0.16 0.44 0.58 0.811
Multiple Trailer Trucks 0.27 0.32 0.39 0.09 0.20 0.24 0.54[
5 Axles 0.18 0.21 0.26 0.08 0.17 0.20 0.331
6 or More Axles 0.09 0.11 0.13 0.01 O.D3 0.04 0.211
Total 100.00 100.00 100.00 100.00 100.00 100.00 100.~
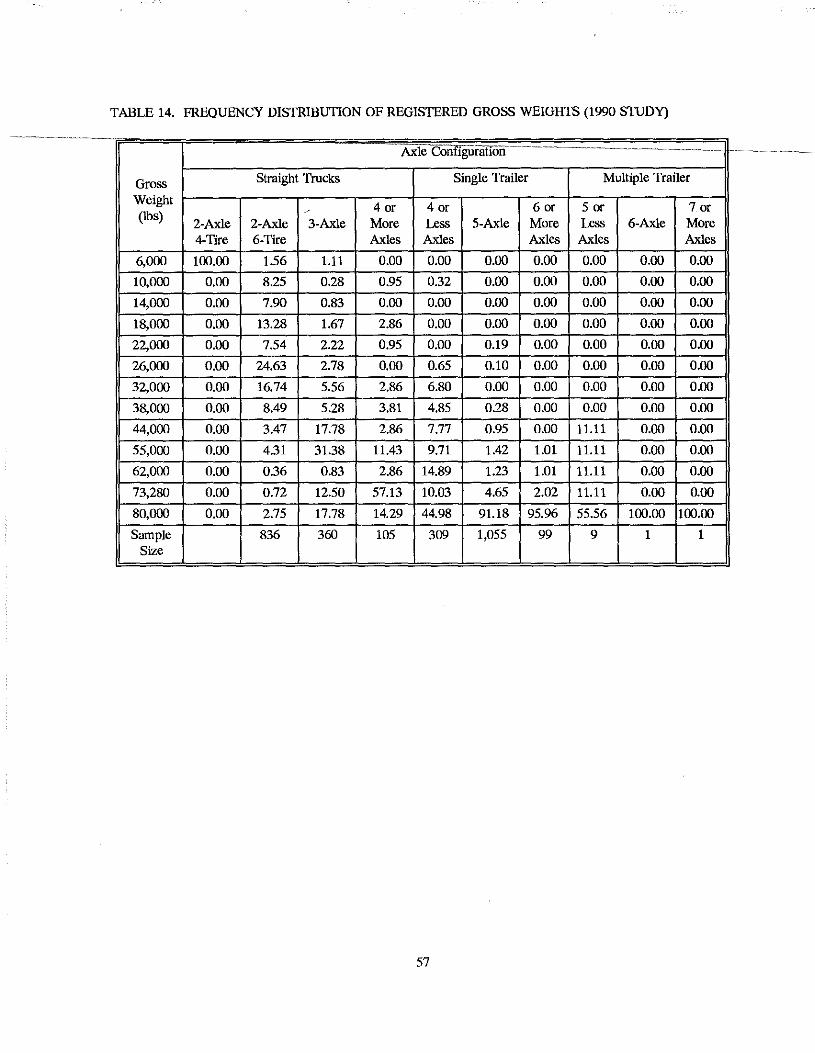
TABLE 14. FREQUENCY DISTRIBUTION OF REGISTERED GROSS WEIGHTS (1990 STUDY)
Axle-con11gtirauon --------- """ " " """ -----"--- --
Gross Straight Trucks Single Trailer Multiple Trailer
Weight 4 or 4 or 6 or 5 or 7 or (lbs) /
2-Axle 2-Axle 3-Axle More Less 5-Axle More Less 6-Axle More 4-Tire 6-Tire Axles Axles Axles Axles Axles
6,000 100.00 1.56 1.11 0.00 0.00 0.00 0.00 0.00 0.00 0.00
10,000 0.00 8.25 0.28 0.95 0.32 0.00 0.00 0.00 0.00 0.00
14,000 0.00 7.90 0.83 0.00 0.00 0.00 0.00 0.00 0.00 0.00
18,000 0.00 13.28 1.67 2.86 0.00 0.00 0.00 0.00 0.00 0.00
22,000 0.00 7.54 2.22 0.95 0.00 0.19 0.00 0.00 0.00 0.00
26,000 0.00 24.63 2.78 0.00 0.65 0.10 0.00 0.00 0.00 0.00
32,000 0.00 16.74 5.56 2.86 6.80 0.00 0.00 0.00 0.00 0.00
38,000 0.00 8.49 5.28 3.81 4.85 0.28 0.00 0.00 0.00 0.00
44,000 0.00 3.47 17.78 2.86 7.77 0.95 0.00 11.11 0.00 0.00
55,000 0.00 4.31 31.38 11.43 9.71 1.42 1.01 11.11 0.00 0.00
62,000 0.00 0.36 0.83 2.86 14.89 1.23 1.01 11.11 0.00 0.00
73,280 0.00 0.72 12.50 57.13 10.03 4.65 2.02 11.11 0.00 0.00
80,000 0.00 2.75 17.78 14.29 44.98 91.18 95.96 55.56 100.00 100.00
Sample 836 360 105 309 1,055 99 9 1 1 Size
57
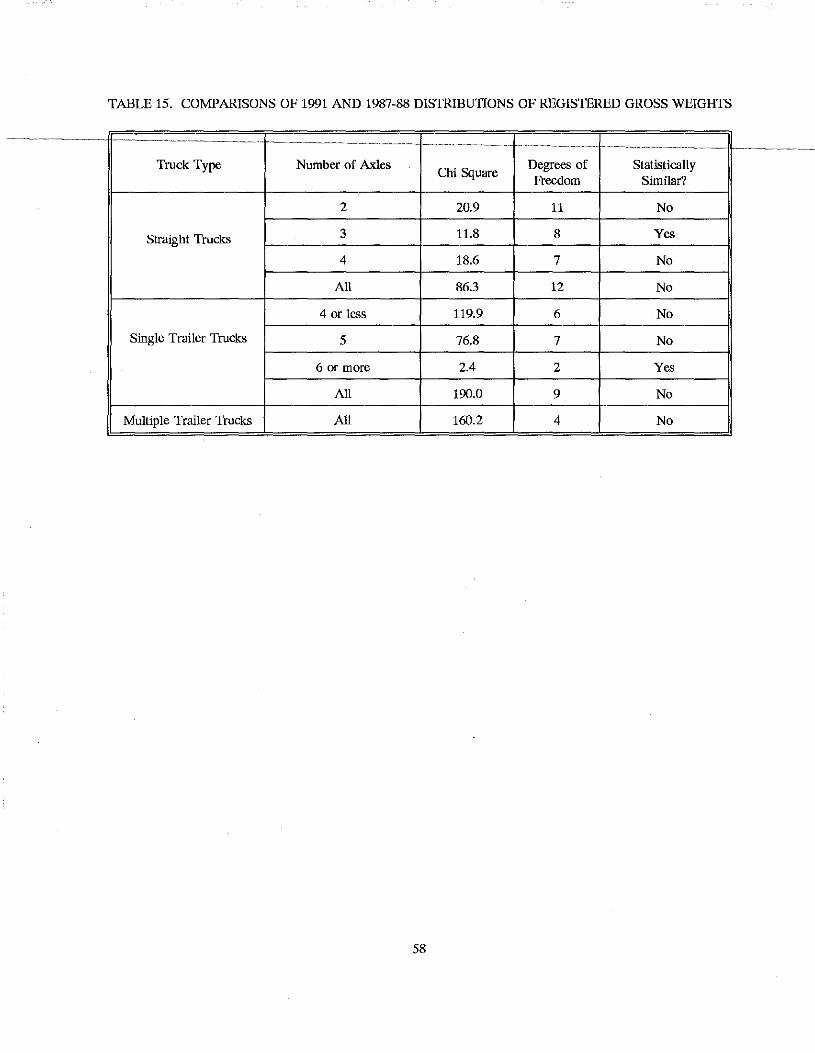
TABLE 15. COMPARISONS OF 1991 AND 1987-88 DISTRIBUTIONS OF REGISTERED GROSS WEIGHTS
Truck Type Number of Axles Chi Square
Degrees of Statistically Freedom Similar?
2 20.9 11 No
Straight Trucks 3 11.8 8 Yes
4 18.6 7 No
All 86.3 12 No
4 or less 119.9 6 No
Single Trailer Trucks 5 76.8 7 No
6 or more 2.4 2 Yes
All 190.0 9 No
Multiple Trailer Trucks All 160.2 4 No
58
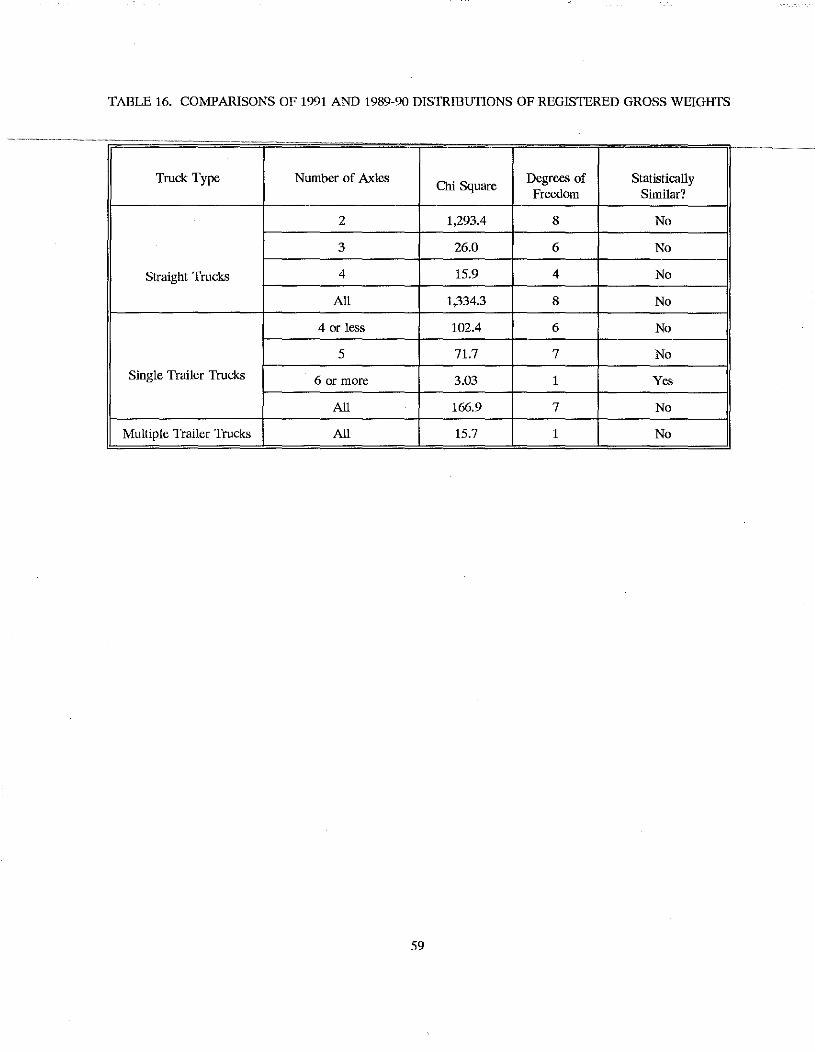
TABLE 16. COMPARISONS OF 1991 AND 1989-90 DISTRIBUTIONS OF REGISTERED GROSS WEIGHTS
Truck Type Number of Axles Chi Square
Degrees of Statistically Freedom Similar?
2 1,293.4 8 No
3 26.0 6 No
Straight Trucks 4 15.9 4 No
All 1,334.3 8 No
4 or less 102.4 6 No
5 71.7 7 No
Single Trailer Trucks 6 or more 3.03 1 Yes
All 166.9 7 No
Multiple Trailer Trucks All 15.7 1 No
59
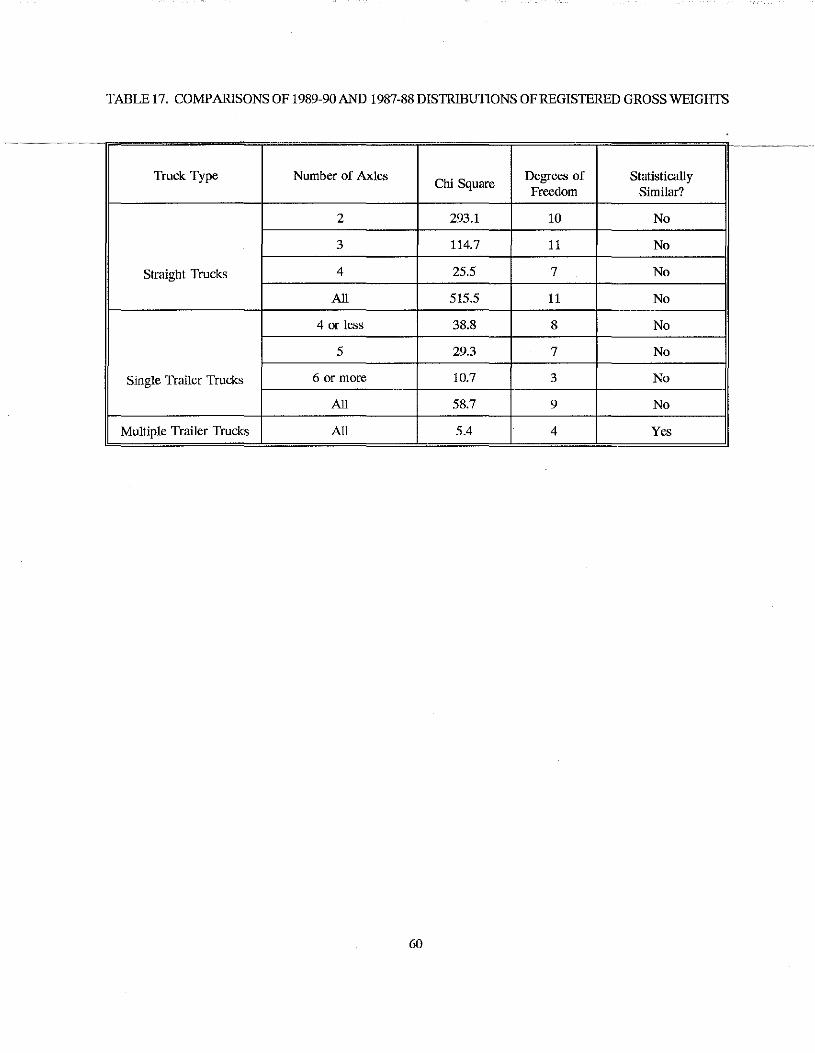
TABLE 17. COMPARISONS OF 1989-90AND 1987-88 DISTRIBUTIONS OF REGISTERED GROSS WEIGHTS
Truck Type Number of Axles Chi Square
Degrees of Statistically Freedom Similar?
2 293.1 10 No
3 114.7 11 No
Straight Trucks 4 25.5 7 No
All 515.5 11 No
4 or less 38.8 8 No
5 29.3 7 No
Single Trailer Trucks 6 or more 10.7 3 No
All 58.7 9 No
Multiple Trailer Trucks All 5.4 4 Yes
60
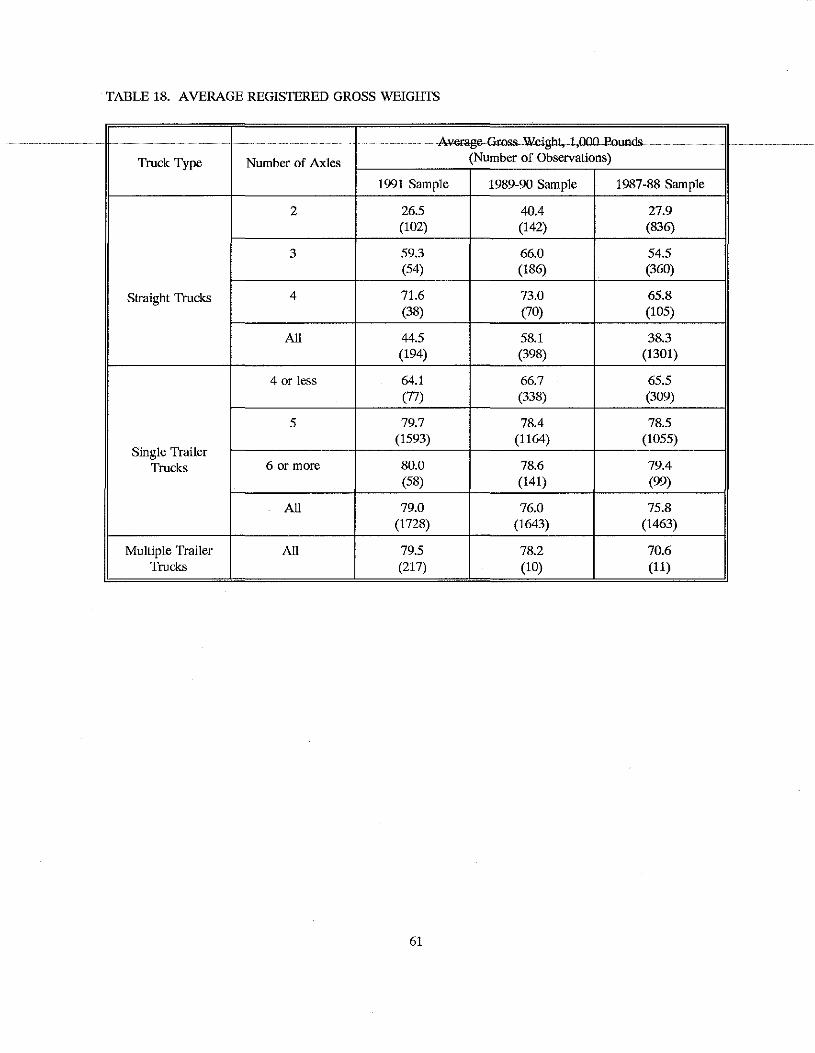
TABLE 18. AVERAGE REGISTERED GROSS WEIGHTS
-------~-------------------·---- ~-----------------A-.age--Gr"'OS-Wcigbt,--1-,000-l'"'uml&--------
Truck Type Number of Axles (Number of Observations)
1991 Sample 1989-90 Sample 1987-88 Sample
2 26.5 40.4 27.9 (102) (142) (836)
3 59.3 66.0 54.5 (54) (186) (360)
Straight Trucks 4 71.6 73.0 65.8 (38) (70) (105)
All 44.5 58.1 38.3 (194) (398) (1301)
4 or less 64.1 66.7 65.5 (77) (338) (309)
5 79.7 78.4 78.5 (1593) (1164) (1055)
Single Trailer Trucks 6 or more 80.0 78.6 79.4
(58) (141) (99)
All 79.0 76.0 75.8 (1728) (1643) (1463)
Multiple Trailer All 79.5 78.2 70.6 Trucks (217) (10) (11)
61
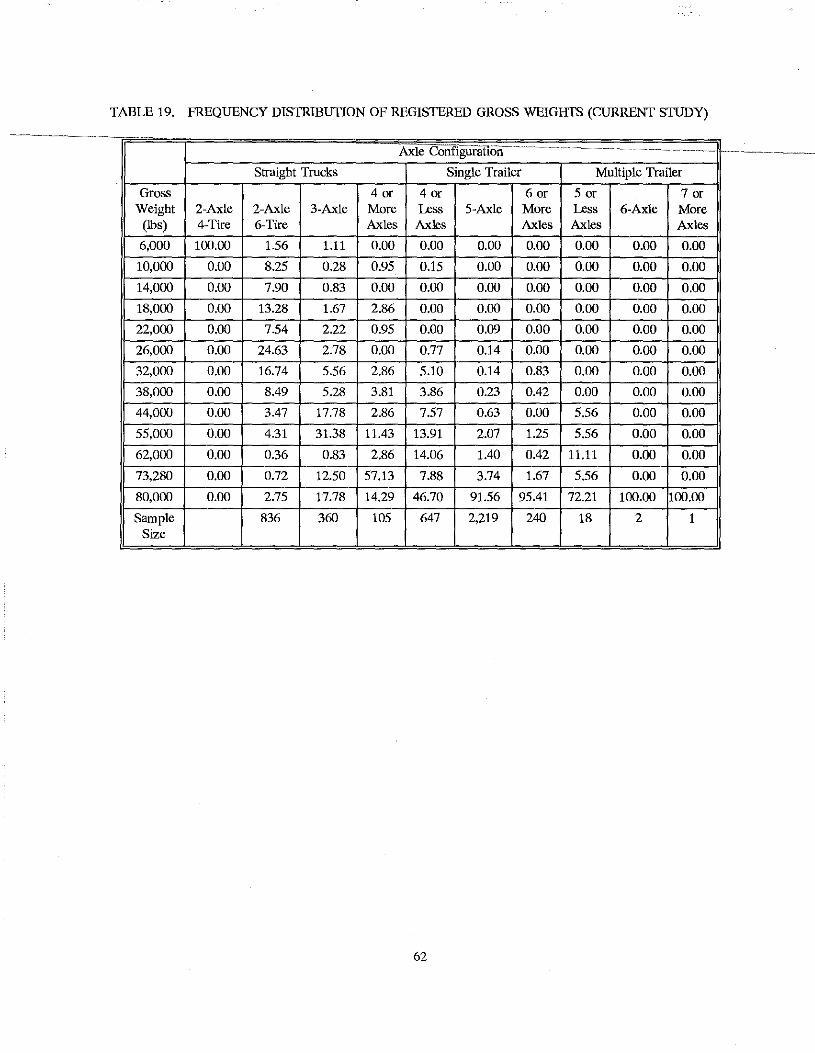
TABLE 19. FREQUENCY DISTRIBUTION OF REGISTERED GROSS WEIGIITS (CURRENT STUDY)
.
Axle
Straight Trucks Single Trailer Multiple Trailer
Gross 4 or 4 or 6 or 5 or 7 or Weight 2-Axle 2-Axle 3-Axle More Less 5-Axle More Less 6-Axle More
(lbs) 4-Tire 6-Tire Axles Axles Axles Axles Axles
6,000 100.00 1.56 1.11 0.00 0.00 0.00 0.00 0.00 0.00 0.00
10,000 0.00 8.25 0.28 0.95 0.15 0.00 0.00 0.00 0.00 0.00
14,000 0.00 7.90 0.83 0.00 0.00 0.00 0.00 0.00 0.00 0.00
18,000 0.00 13.28 1.67 2.86 0.00 0.00 0.00 0.00 0.00 0.00
22,000 0.00 7.54 2.22 0.95 0.00 0.09 0.00 0.00 0.00 0.00
26,000 0.00 24.63 2.78 0.00 0.77 0.14 0.00 0.00 0.00 0.00
32,000 0.00 16.74 5.56 2.86 5.10 0.14 0.83 0.00 0.00 0.00
38,000 0.00 8.49 5.28 3.81 3.86 0.23 0.42 0.00 0.00 0.00
44,000 0.00 3.47 17.78 2.86 7.57 0.63 0.00 5.56 0.00 0.00
55,000 0.00 4.31 31.38 11.43 13.91 2.07 1.25 5.56 0.00 0.00
62,000 0.00 0.36 0.83 2.86 14.06 1.40 0.42 11.11 0.00 0.00
73,280 0.00 0.72 12.50 57.13 7.88 3.74 1.67 5.56 0.00 0.00
80,000 0.00 2.75 17.78 14.29 46.70 91.56 95.41 72.21 100.00 100.00
Sample 836 360 105 647 2,219 240 18 2 1 Size
62
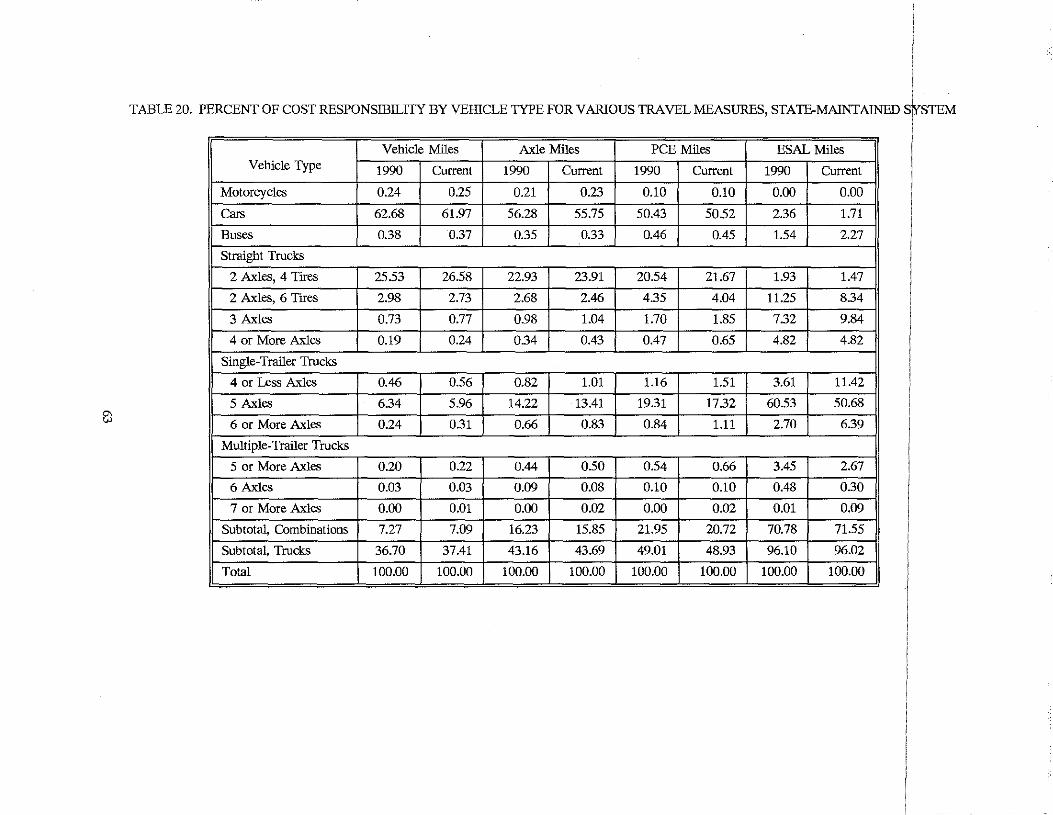
TABLE 20. PERCENT OF COST RESPONSIBILITY BY VEIDCLE TYPE FOR VARIOUS TRAVEL MEASURES, STATE-MAINTAINED siv.<:TFM
Vehicle Miles Axle Miles PCE Miles ESAL Miles Vehicle Type 1990 Current 1990 Current 1990 Current 1990 Current
Motorcycles 0.24 0.25 0.21 0.23 0.10 0.10 0.00 0.00
Cars 62.68 61.97 56.28 55.75 50.43 50.52 2.36 1.71
Buses 0.38 0.37 0.35 0.33 0.46 0.45 1.54 2.27
Straight Trucks
2 Axles, 4 Tires 25.53 26.58 22.93 23.91 20.54 21.67 1.93 1.47
2 Axles, 6 Tires 2.98 2.73 2.68 2.46 4.35 4.04 11.25 8.34
3 Axles 0.73 0.77 0.98 1.04 1.70 1.85 7.32 9.84
4 or More Axles 0.19 0.24 0.34 0.43 0.47 0.65 4.82 4.82
Single-Trailer Trucks
4 or Less Axles 0.46 0.56 0.82 1.01 1.16 1.51 3.61 11.42
5 Axles 6.34 5.96 14.22 13.41 19.31 17.32 60.53 50.68 8l
I 6 or More Axles 0.24 0.31 0.66 0.83 0.84 1.11 2.70 6.39
Multiple-Trailer Trucks
I
5 or More Axles 0.20 0.22 0.44 0.50 0.54 0.66 3.45 2.67
6 Axles o.m O.D3 0.09 0.08 0.10 0.10 0.48 0.30
7 or More Axles 0.00 0.01 0.00 0.02 0.00 0.02 0.01 0.09
Subtotal, Combinations 7.27 7.09 16.23 15.85 21.95 20.72 70.78 71.55
Subtotal, Trucks 36.70 37.41 43.16 43.69 49.01 48.93 96.10 96.02
Total 100.00 100.00 100.00 100.00 100.00 100.00 100.00 100.00
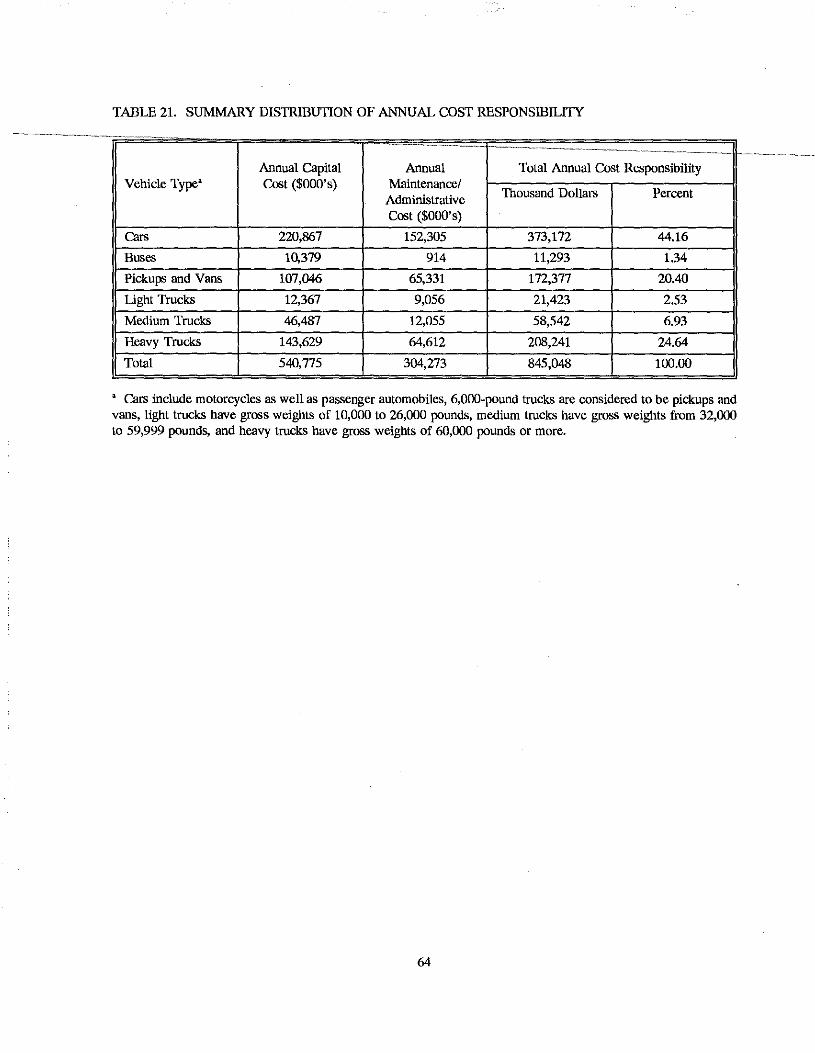
TABLE 21. SUMMARY DISTRIBUTION OF ANNUAL COST RESPONSIBILITY
Annual Capital Annual Total Annual Cost Responsibility Vehicle Type' Cost ($DOD's) Maintenance/
Thousand Dollars Percent Administrative Cost ($000's)
Cars 220,867 152,305 373,172 44.16
Buses 10,379 914 11,293 1.34
Pickups and Vans 107,046 65,331 172,377 20.40
Light Trucks 12,367 9,056 21,423 2.53
Medium Trucks 46,487 12,055 58,542 6.93
Heavy Trucks 143,629 64,612 208,241 24.64
Total 540,775 304,273 845,048 100.00
' Cars include motorcycles as well as passenger automobiles, 6,000-pound trucks are considered to be pickups and vans, light trucks have gross weights of 10,000 to 26,000 pounds, medium trucks have gross weights from 32,000 to 59,999 pounds, and heavy trucks have gross weights of 60,000 pounds or more.
64
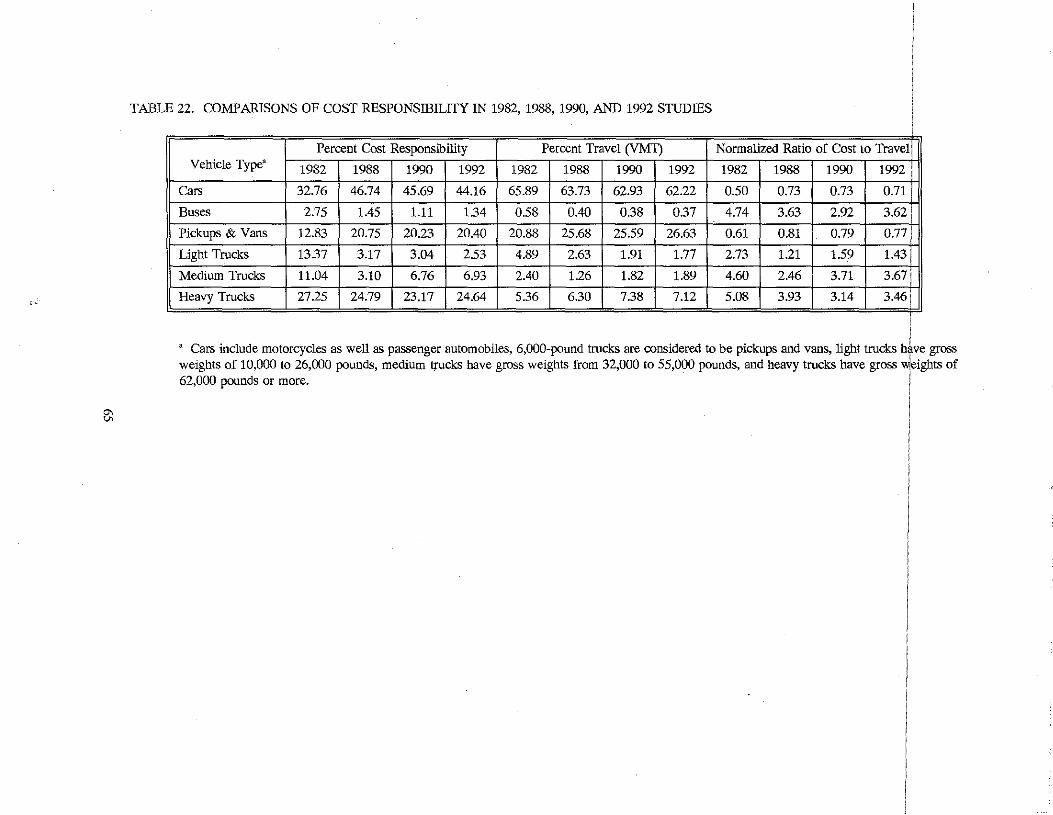
TABL
e::
:l22. COMPARISONS OF COST RESPONSIBILITY IN 1982, 1988, 1990, AND 1992 STUDIES
,
Percent Cost Responsibility Percent Travel (VMI) Normalized Ratio of Cost to Travel I Vehicle Type' 1982 1988 1990 1992 1982 1988 1990 1992 1982 1988 1990 1992 i
Cars 32.76 46.74 45.69 44.16 65.89 63.73 62.93 62.22 0.50 0.73 0.73 0.711
Buses 2.75 1.45 1.11 1.34 0.58 0.40 0.38 0.37 4.74 3.63 2.92 3.621
Pickups & Vans 12.83 20.75 20.23 20.40 20.88 25.68 25.59 26.63 0.61 0.81 0.79 0.77 i , Light Trucks 13.37 3.17 3.04 2.53 4.89 2.63 1.91 1.77 2.73 1.21 1.59 1.431 , Medium Trucks 11.04 3.10 6.76 6.93 2.40 1.26 1.82 1.89 4.60 2.46 3.71 3.671
Heavy Trucks 27.25 24.79 23.17 24.64 5.36 6.30 7.38 7.12 5.08 3.93 3.14 3.461 , J
' Cars include motorcycles as well as passenger automobiles, 6,000-pound trucks are considered to be pickups and vans, light trucks have gr "OSS
of weights of 10,000 to 26,000 pounds, medium trucks have gross weights from 32,000 to 55,000 pounds, and heavy trucks have gross Jeights . , 62,000 pounds or more.
,
I I
I I I , I I , I I , I I , I I
J , I
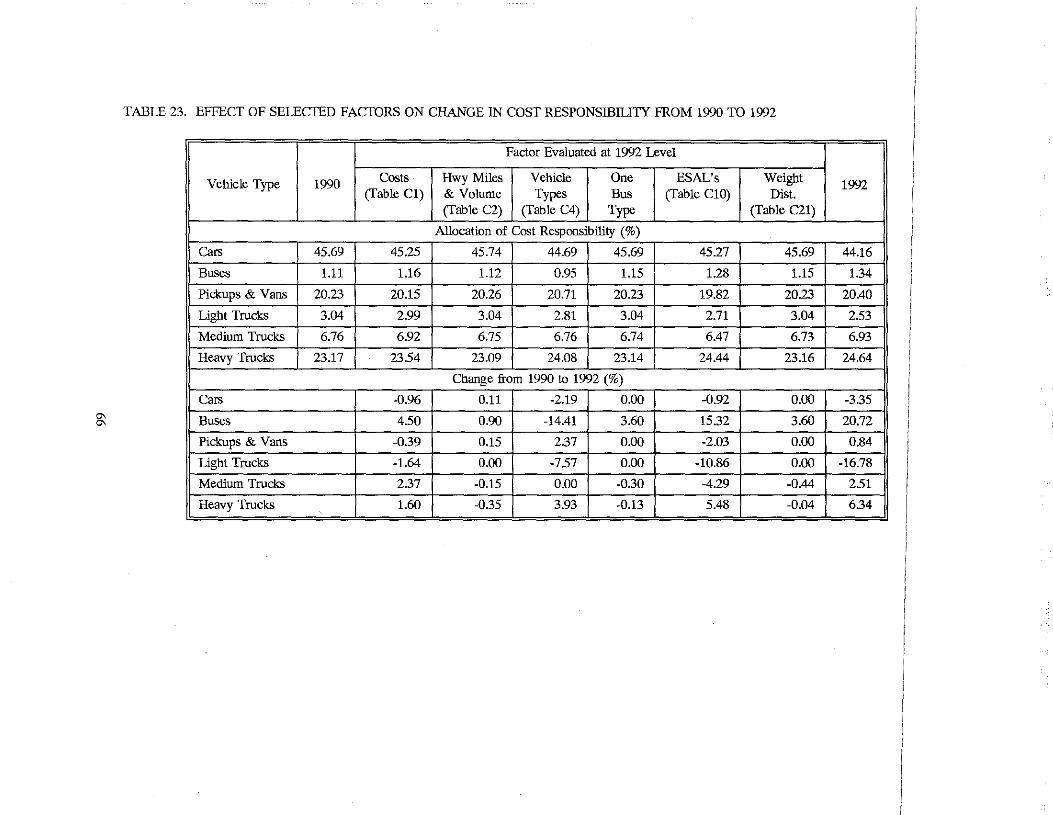
TABLE 23. EFFECT OF SELECTED FACTORS ON CHANGE IN COST RESPONSIBJUTY FROM 1990 TO 1992
Factor Evaluated at 1992 Level
Vehicle Type 1990 Costs Hwy Miles Vehicle One ESAL's Weight 1992 (fable C1) & Volume Types Bus (Table C10) Dist.
(fable C2) (Table C4) Type (Table C21)
Allocation of Cost Responsibility (%)
Cars 45.69 45.25 45.74 44.69 45.69 45.27 45.69 44.16
Buses 1.11 1.16 1.12 0.95 1.15 1.28 1.15 1.34
Pickups & Vans 20.23 20.15 20.26 20.71 20.23 19.82 20.23 20.40
Light Trucks 3.04 2.99 3.04 2.81 3.04 2.71 3.04 2.53
Medium Trucks 6.76 6.92 6.75 6.76 6.74 6.47 6.73 6.93
Heavy Trucks 23.17 23.54 23.09 24.08 23.14 24.44 23.16 24.64
Change from 1990 to 1992 (%)
Cars -0.96 0.11 -2.19 0.00 -0.92 0.00 -3.35
g; Buses 4.50 0.90 -14.41 3.60 15.32 3.60 20.72
Pickups & Vans -0.39 0.15 2.37 0.00 -2.03 0.00 0.84
Light Trucks -1.64 0.00 -7.57 0.00 -10.86 0.00 -16.78 I
Medium Trucks 2.37 -0.15 0.00 -0.30 -4.29 -0.44 2.51 I
Heavy Trucks 1.60 -0.35 3.93 -0.13 5.48 -0.04 6.34 I - --- - - - - - - - .. - - - - - -- - - ·-
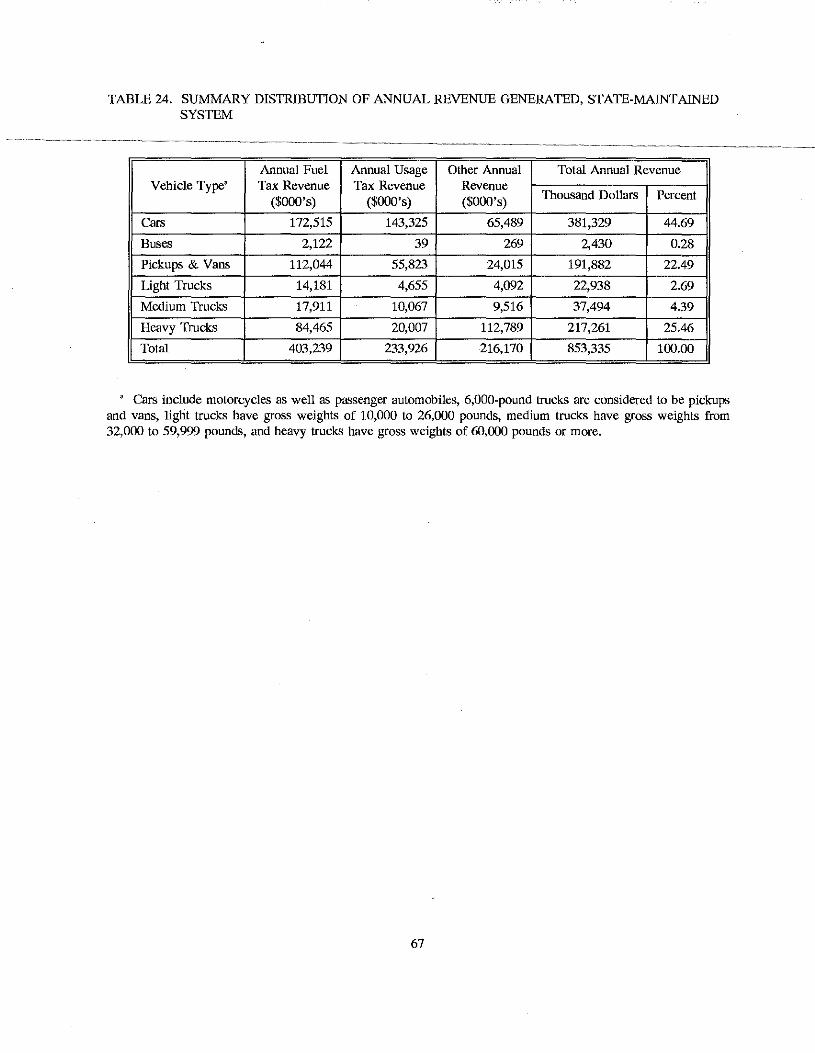
TABLE 24. SUMMARY DISTRIBUTION OF ANNUAL REVENUE GENERATED, STATE-MAINTAINED SYSTEM
Annual Fuel Annual Usage Other Annual Total Annual Revenue Vehicle Type' Tax Revenue Tax Revenue Revenue
($000's) ($000's) ($000's) Thousand Dollars Percent
Cars 172,515 143,325 65,489 381,329 44.69
Buses 2,122 39 269 2,430 0.28
Pickups & Vans 112,044 55,823 24,015 191,882 22.49
Light Trucks 14,181 4,655 4,092 22,938 2.69
Medium Trucks 17,911 10,067 9,516 37,494 4.39
Heavy Trucks 84,465 20,007 112,789 217,261 25.46
Total 403,239 233,926 216,170 853,335 100.00 .
' Cars include motorcycles as well as passenger automobiles, 6,000-pound trucks are considered to be pickups and vans, light trucks have gross weights of 10,000 to 26,000 pounds, medium trucks have gross weights from 32,000 to 59,999 pounds, and heavy trucks have gross weights of 60,000 pounds or more.
67
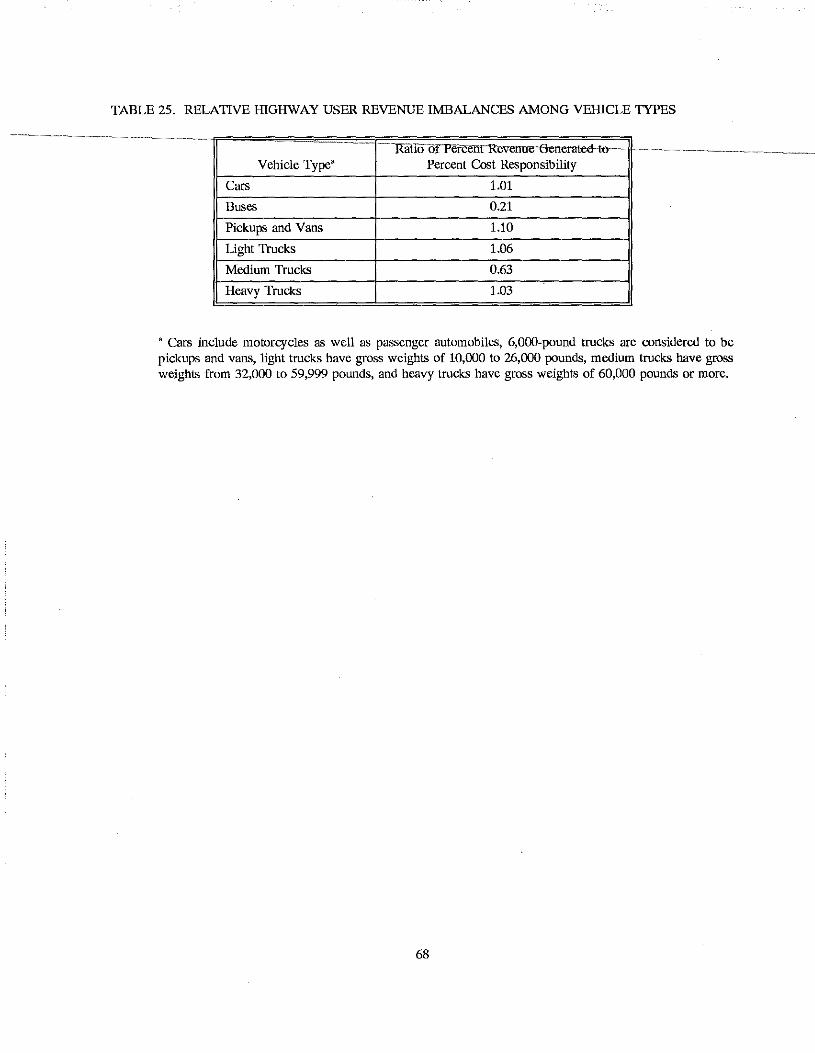
TABLE 25. RELATIVE IDGHWAY USER REVENUE IMBALANCES AMONG VEIDCLE TYPES
··Rallo oTPercent Revenue·GeneratetHo· · Vehicle Type' Percent Cost Responsibility
Cars 1.01
Buses 0.21
Pickups and Vans 1.10
Light Trucks 1.06
Medium Trucks 0.63
Heavy Trucks 1.03
• Cars include motorcycles as well as passenger automobiles, 6,000-pound trucks are considered to be pickups and vans, light trucks have gross weights of 10,000 to 26,000 pounds, medium trucks have gross weights from 32,000 to 59,999 pounds, and heavy trucks have gross weights of 60,000 pounds or more.
68
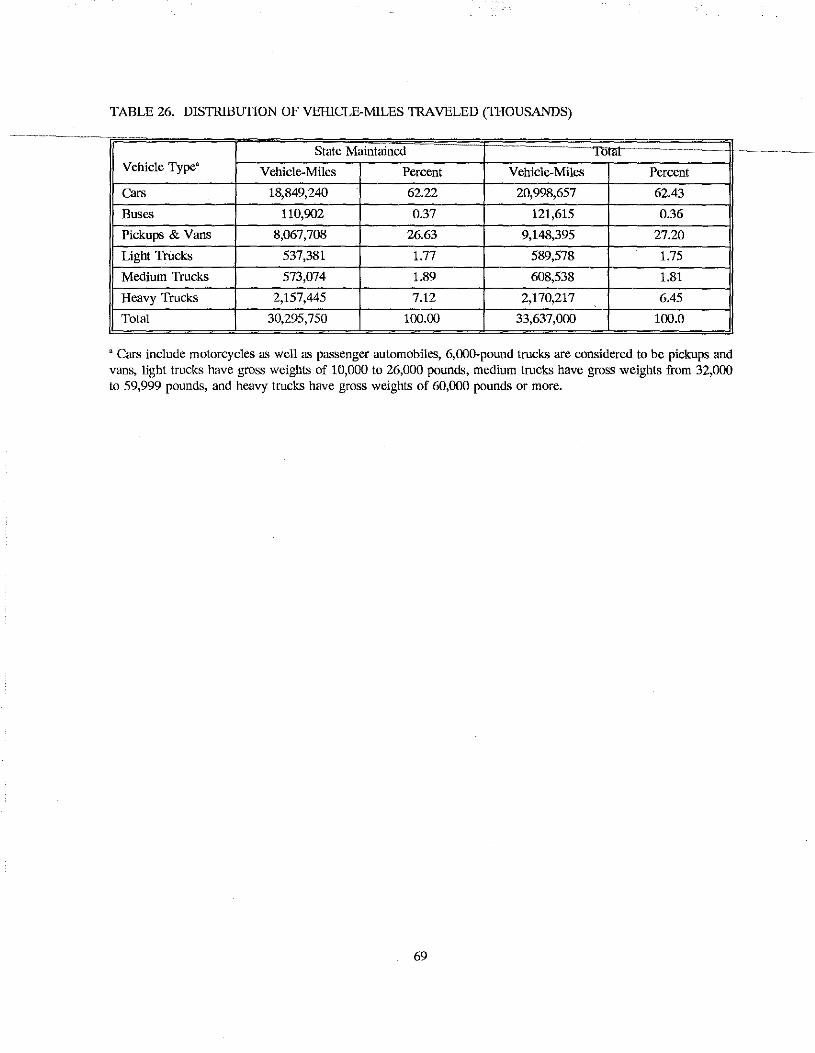
TABLE 26. DISTRIBUTION OF VEHICLE-MILES TRAVELED (THOUSANDS)
State Maintained ·- Total ...
Vehicle Type' Vehicle-Miles Percent Vehicle-Miles Percent
Cars 18,849,240 62.22 20,998,657 62.43
Buses 110,902 0.37 121,615 0.36
Pickups & Vans 8,067,708 26.63 9,148,395 27.20
Light Trucks 537,381 1.77 589,578 1.75
Medium Trucks 573,074 1.89 608,538 1.81
Heavy Trucks 2,157,445 7.12 2,170,217 6.45
Total 30,295,750 100.00 33,637,000 100.0
' Cars include motorcycles as well as passenger automobiles, 6,000-pound trucks are considered to be pickups and vans, light trucks have gross weights of 10,000 to 26,000 pounds, medium trucks have gross weights from 32,000 to 59,999 pounds, and heavy trucks have gross weights of 60,000 pounds or more.
69
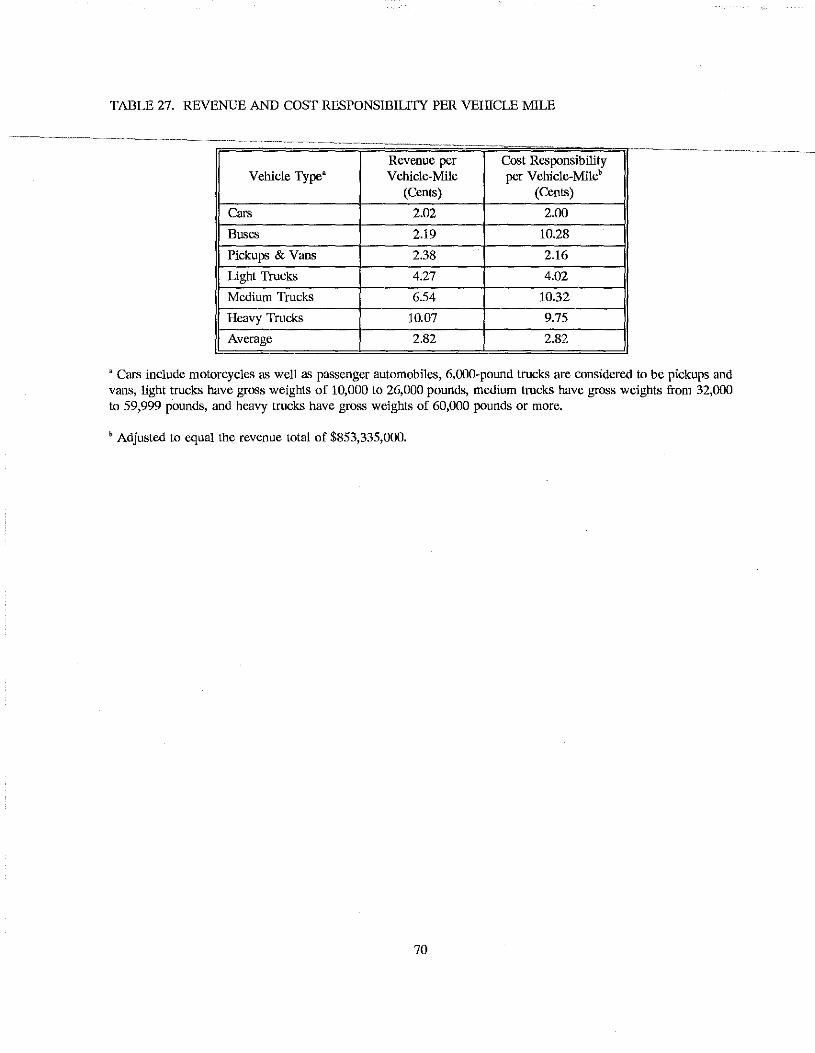
TABLE 27. REVENUE AND COST RESPONSIBILITY PER VEIDCLE MILE
Revenue per Cost Responsibility Vehicle Type' Vehicle-Mile per Vehicle-Mile•
(Cents) (Cents)
Cars 2.02 2.00
Buses 2.19 10.28
Pickups & Vans 2.38 2.16
Light Trucks 4.27 4.02
Medium Trucks 6.54 10.32
Heavy Trucks 10.D7 9.75
Average 2.82 2.82
' Cars include motorcycles as well as passenger automobiles, 6,000-pound trucks are considered to be pickups and vans, light trucks have gross weights of 10,000 to 26,000 pounds, medium trucks have gross weights from 32,000 to 59,999 pounds, and heavy trucks have gross weights of 60,000 pounds or more.
" Adjusted to equal the revenue total of $853,335,000.
70
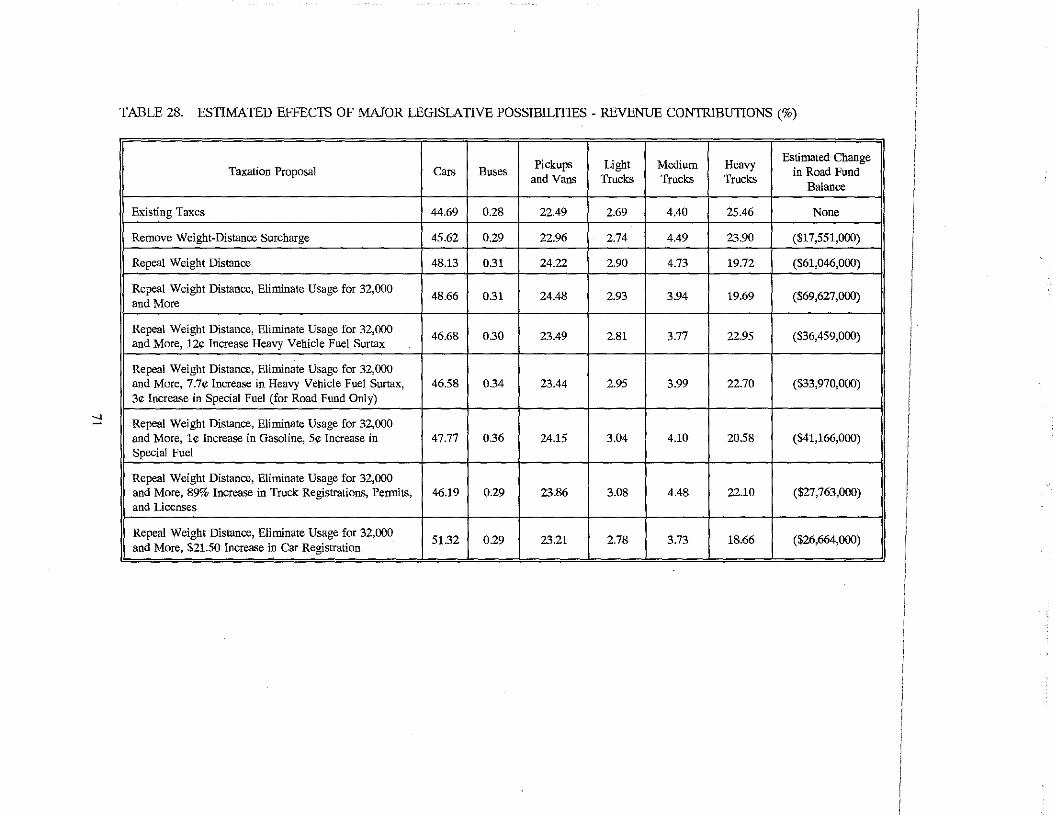
TABLE 28. ESTIMATED EFFECTS OF MAJOR LEGISLATIVE POSSIBILITIES - REVENUE CONIRIBUTIONS (%)
Pickups Light Medium Heavy Estimated Change ! Taxation Proposal Cars Buses in Road Fund ] and Vans Trucks Trucks Trucks
Balance
Existing Taxes 44.69 0.28 22.49 2.69 4.40 25.46 None
:1 Remove Weight-Distance Surcharge 45.62 0.29 22.96 2.74 4.49 23.90 ($17,551,000) I
;1 Repeal Weight Distance 48.13 0.31 24.22 2.90 4.73 19.72 ($61,046,000) I
11 Repeal Weight Distance, Eliminate Usage for 32,000 I
48.66 0.31 24.48 2.93 3.94 19.69 ($69,627,000) I and More
Repeal Weight Distance, Eliminate Usage for 32,000 46.68 0.30 23.49 2.81 3.77 22.95 ($36,459,000)
and More, 124: Increase Heavy Vehicle Fuel Surtax
Repeal Weight Distance, Eliminate Usage for 32,000 and More, 7.7¢ Increase in Heavy Vehicle Fuel Surtax, 46.58 0.34 23.44 2.95 3.99 22.70 ($33,970,000) 3e Increase in Special Fuel (for Road Fund Only)
-.! - Repeal Weight Distance, Eliminate Usage for 32,000 and More, le Increase in Gasoline, 5¢ Increase in 47.77 0.36 24.15 3.04 4.10 20.58 ($41,166,000) Special Fuel
Repeal Weight Distance, Eliminate Usage for 32,000 and More, 89% Increase in Truck Registrations, Pennits, 46.19 0.29 23.86 3.08 4.48 22.10 ($27,763,000) and Licenses
Repeal Weight Distance, Eliminate Usage for 32,000 51.32 0.29 23.21 2.78 3.73 18.66 ($26,664,000)
and More, $21.50 Increase in Car Registration
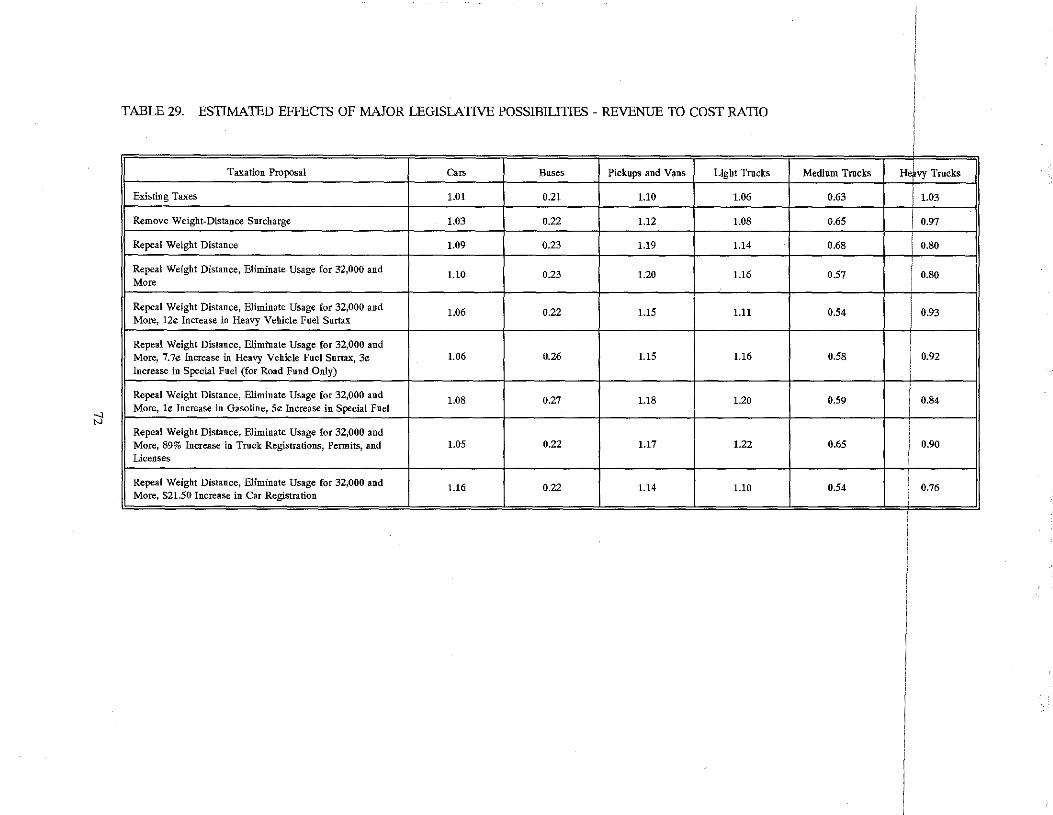
TABLE 29. ESTIMATED EFFECTS OF MAJOR LEGISLATIVE POSSIBILITIES - REVENUE TO COST RATIO
Taxation Proposal Cars Buses Pickups and Vans Light Trucks Medium Trucks He vy Trucks
Existing Taxes 1.01 0.21 1.10 1.06 0.63 i 1 1.o3
Remove Weight-Distance Surcharge i
1.03 0.22 1.12 1.08 0.65 1 o.97
Repeal Weight Distance 1.09 0.23 1.19 1.14 0.68 0.80
Repeal Weight Distance, Eliminate Usage for 32,000 and i
1.10 0.23 1.20 1.16 0.57 1 o.8o More i
Repeal Weight Distance, Eliminate Usage for 32,000 and More, 12¢ Increase in Heavy Vehicle Fuel Surtax
1.06 0.22 1.15 1.11 0.54 0.93
Repeal Weight Distance, Elimi'nate Usage for 32,000 and
I More, 7.7¢ Increase in Heavy Vehicle Fuel Surtax, :3¢ 1.06 0.26 1.15 1.16 0.58 0.92
Increase in Special Fuel (for Road Fund Only) I
;j
Repeal Weight Distance, Eliminate Usage for 32,000 and ! 1.08 0.27 1.18 1.20 0.59 i 0.84
More, l¢ Increase in Gasoline, 5¢ Increase in Special Fuel ' ' Repeal Weight Distance, Eliminate Usage for 32,000 and More, 89% Increase in Truck Registrations, Permits, and 1.05 0.22 1.17 1.22 0.65 0.90
Licenses
Repeal Weight Distance, Eliminate Usage for 32,000 and More, $21.50 Increase in Car Registration
1.16 0.22 1.14 1.10 0.54
I 0.76
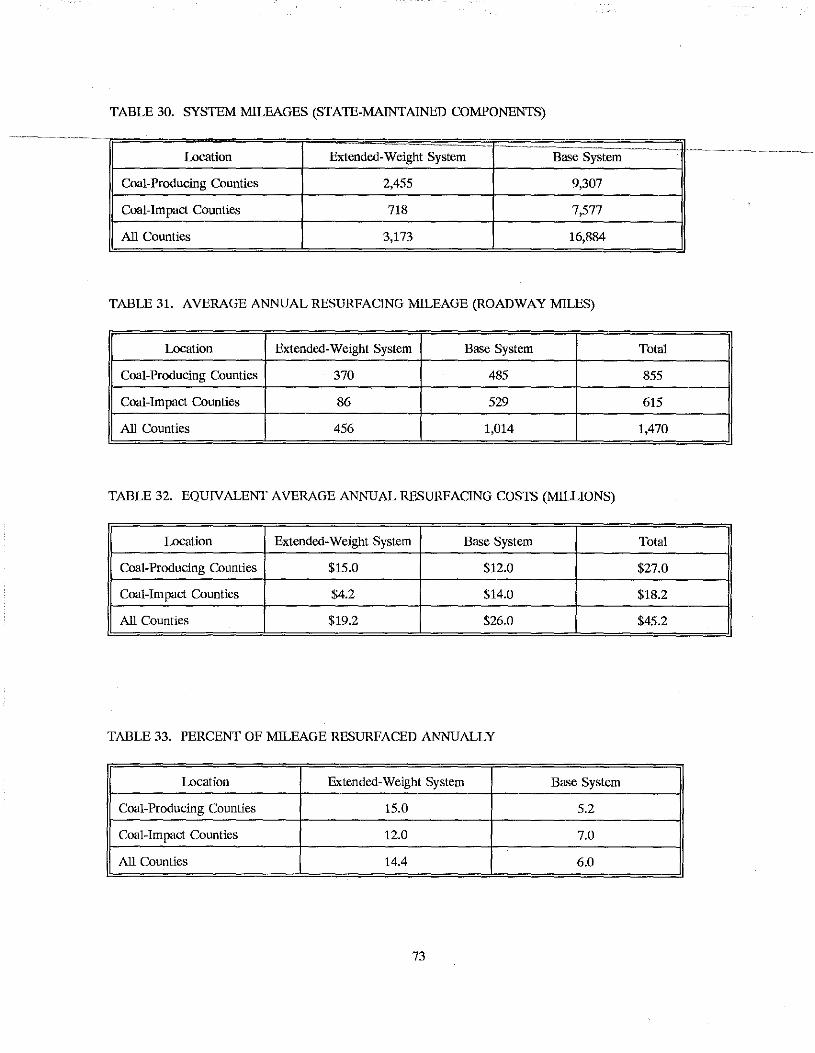
TABLE 30. SYSTEM MILEAGES (STATE-MAINTAINED COMPONENTS)
Location Extended-Weight System Base System
Coal-Producing Counties 2,455 9,307
Coal-Impact Counties 718 7,577
All Counties 3,173 16,884
TABLE 31. AVERAGE ANNUAL RESURFACING MILEAGE (ROADWAY MILES)
Location Extended-Weight System Base System Total
Coal-Producing Counties 370 485 855
Coal-Impact Counties 86 529 615
All Counties 456 1,014 1,470
TABLE 32. EQUIVALENT AVERAGE ANNUAL RESURFACING COSTS (MILLIONS)
Location Extended-Weight System Base System Total
Coal-Producing Counties $15.0 $12.0 $27.0
Coal-Impact Counties $4.2 $14.0 $18.2
All Counties $19.2 $26.0 $45.2
TABLE 33. PERCENT OF MILEAGE RESURFACED ANNUALLY
Location Extended-Weight System Base System
Coal-Producing Counties 15.0 5.2
Coal-Impact Counties 12.0 7.0
AU Counties 14.4 6.0
73
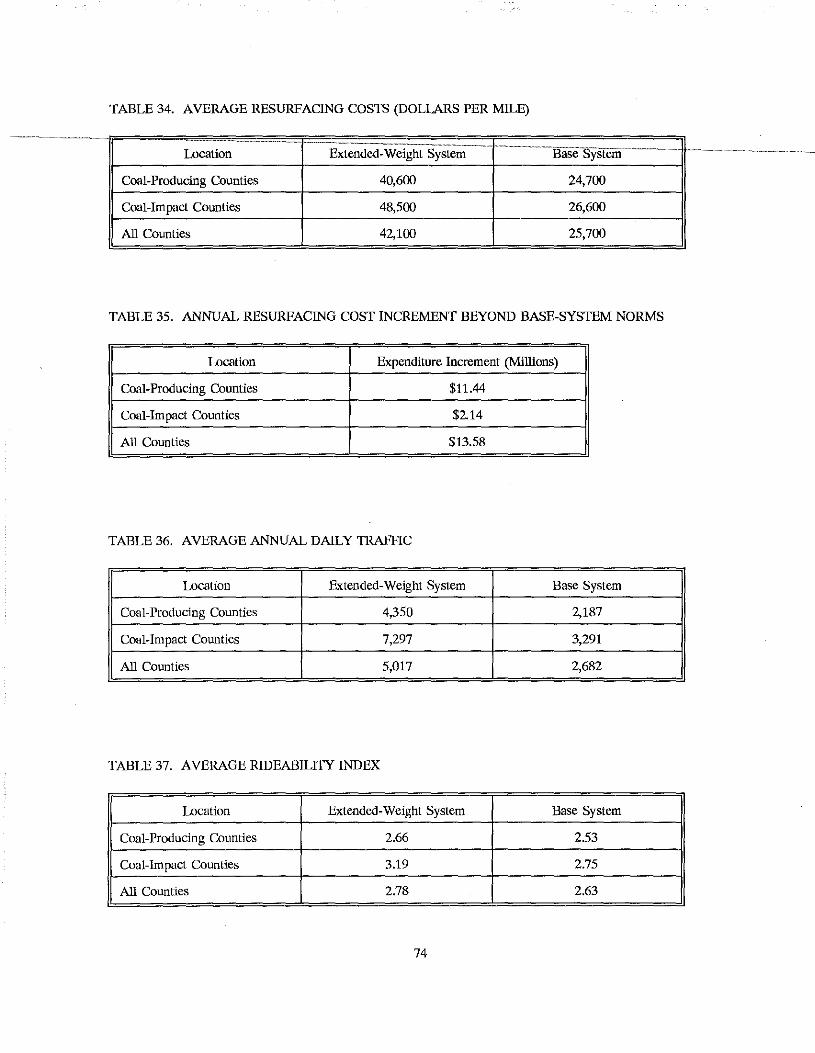
TABLE 34. AVERAGE RESURFACING COSTS (DOLLARS PER MILE)
Location Extended-Weight System Base
Coal-Producing Counties 40,600 24,700
Coal-Impact Counties 48,500 26,600
All Counties 42,100 25,700
TABLE 35. ANNUAL RESURFACING COST INCREMENT BEYOND BASE-SYSTEM NORMS
Location Expenditure Increment (Millions)
Coal-Producing Counties $11.44
Coal-Impact Counties $2.14
All Counties $13.58
TABLE 36. AVERAGE ANNUAL DAILY TRAFFIC
Location Extended-Weight System Base System
Coal-Producing Counties 4,350 2,187
Coal-Impact Counties 7,297 3,291
All Counties 5,017 2,682
TABLE 37. AVERAGE RIDEABILITY INDEX
Location Extended-Weight System Base System
Coal-Producing Counties 2.66 2.53
Coal-Impact Counties 3.19 2.75
All Counties 2.78 2.63
74
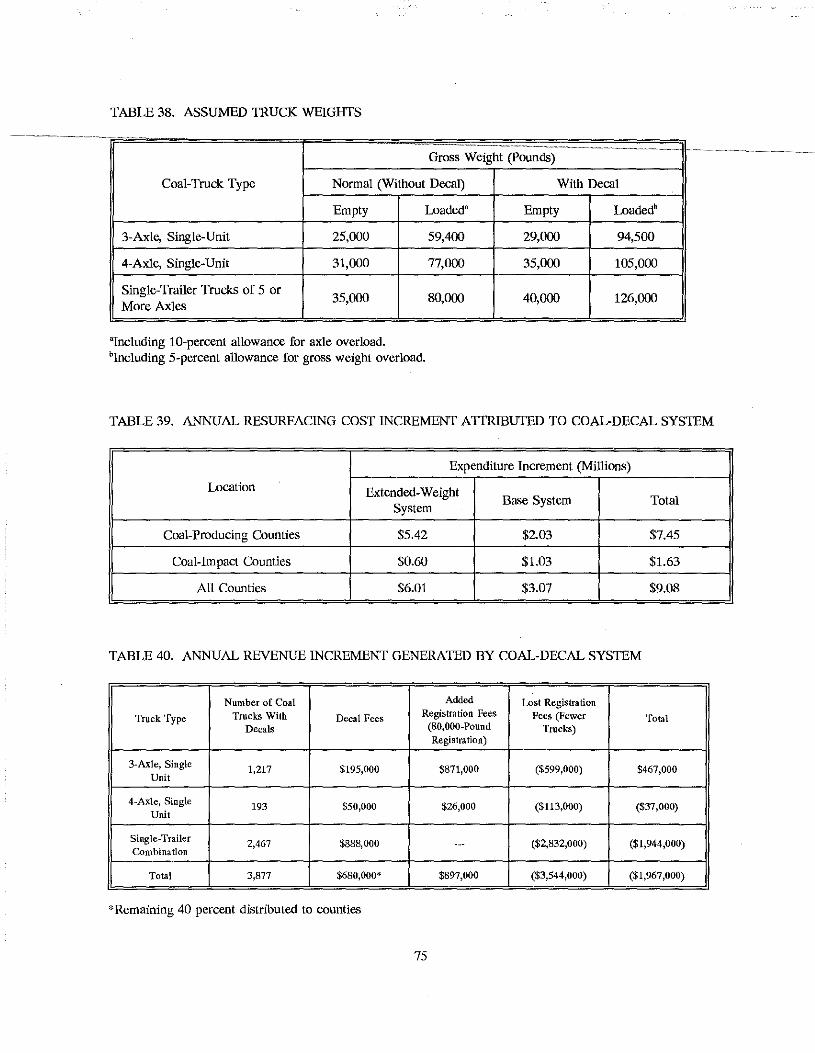
TABLE 38. ASSUMED TRUCK WEIGHfS
Gross Weight (Pounds)
Coal-Truck Type Normal (Without Decal)
Empty Loaded'
3-Axle, Single-Unit 25,000 59,400
4-Axle, Single-Unit 31,000 77,000
Single-Trailer Trucks of 5 or 35,000 80,000
More Axles
"Including 1 0-percent allowance for axle overload. 'Including 5-percent allowance for gross weight overload.
With Decal
Empty Loaded'
29,000 94,500
35,000 105,000
40,000 126,000
TABLE 39. ANNUAL RESURFACING COST INCREMENT ATTRIBUTED TO COAL-DECAL SYSTEM
Expenditure Increment (Millions)
Location Extended-Weight System
Base System Total
Coal-Producing Counties $5.42 $203 $7.45
Coal-Impact Counties $0.60 $1.03 $1.63
All Counties $6.01 $3.07 $9.08
TABLE 40. ANNUAL REVENUE INCREMENT GENERATED BY COAL-DECAL SYSTEM
Number of Coal Added Lost Registration
Truck Type Trucks With Decal Fees Registration Fees Fees (Fewer Total Decals (80,000-Pound Trucks)
Registration)
3-A:xle, Single 1,217 $195,000 $871,000 ($599,000) $467,000 Unit
4-Axle, Single 193 $50,000 $26,000 ($113,000) ($37,000) Unit
Single-Trailer 2,467 $888,000 ... ($2,832,000) ($1,944,000) Combination
Total 3,877 $680,000* $897,000 ($3,544,000) ($1,967,000)
*Remaining 40 percent distributed to counties
75
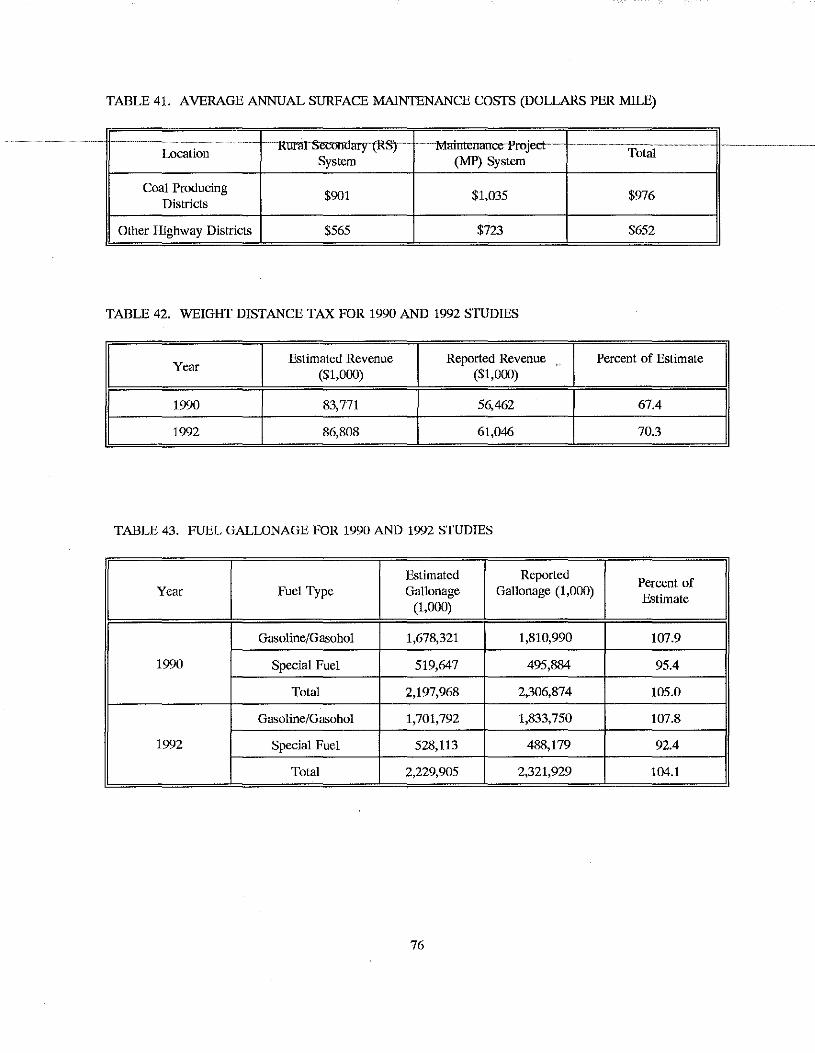
TABLE 41. AVERAGE ANNUAL SURFACE MAINTENANCE COSTS (DOllARS PER MILE)
i-RUI1llSerornlaiT(RS)"---- 1vfaiutenance-Project·--Location Total
System (MP) System
Cool Producing $901 $1,035 $976
Districts
Olher Highway Districts $565 $723 $652
TABLE 42. WEIGHf DISTANCE TAX FOR 1990 AND 1992 STUDIES
Year Estimated Revenue Reported Revenue Percent of Estimate
($1,000) ($1,000)
1990 83,771 56,462 67.4
1992 86,808 61,046 70.3
TABLE 43. FUEL GALLONAGE FOR 1990 AND 1992 STUDIES
Estimated Reported Percent of
Year Fuel Type Gallonage Gallonage (1,000) Estimate
(1,000)
Gasoline/Gasohol 1,678,321 1,810,990 107.9
1990 Special Fuel 519,647 495,884 95.4
Total 2,197,968 2,306,874 105.0
Gasoline/Gasohol 1,701,792 1,833,750 107.8
1992 Special Fuel 528,113 488,179 92.4
Total 2,229,905 2,321,929 104.1
76
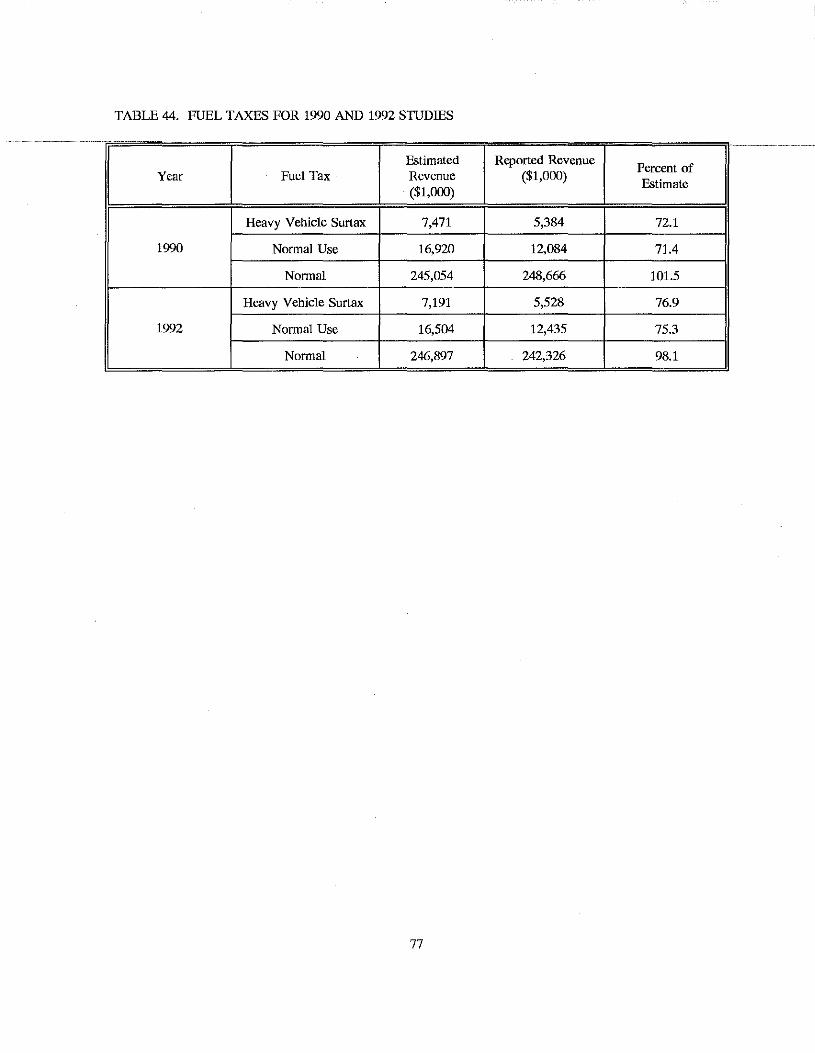
TABLE 44. FUEL TAXES FOR 1990 AND 1992 STUDIES
Estimated Reported Revenue Percent of
Year Fuel Tax Revenue ($1,000) Estimate
($1,000)
Heavy Vehicle Surtax 7,471 5,384 72.1
1990 Normal Use 16,920 12,084 71.4
Normal 245,054 248,666 101.5
Heavy Vehicle Surtax 7,191 5,528 76.9
1992 Normal Use 16,504 12,435 75.3
Normal 246,897 242,326 98.1
77
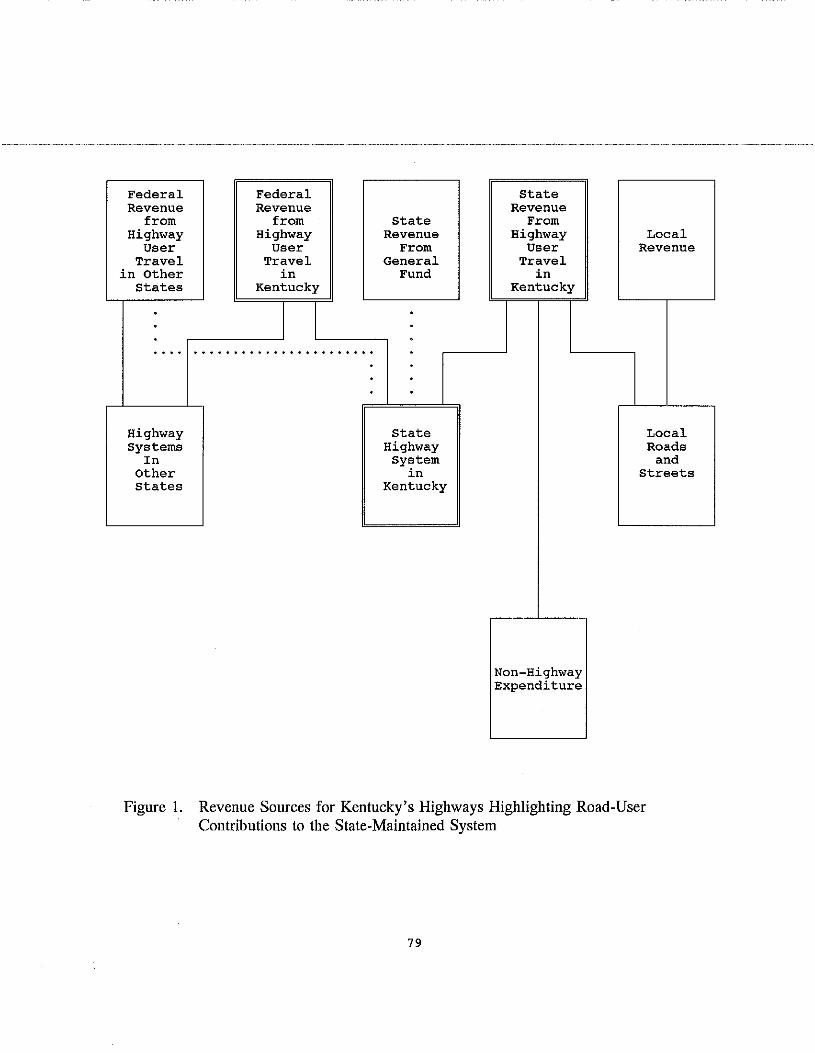
Federal Federal Revenue Revenue
from from Highway Highway
User User Travel Travel
in Other in States Kentucky
.
Highway Systems
In Other States
State Revenue
From General
Fund
state Highway
System in
Kentucky
state Revenue
From Highway
User Travel
in Kentucky
Non-Highway Expenditure
Local Revenue
Local Roads
and Streets
Figure 1. Revenue Sources for Kentucky's Highways Highlighting Road-User Contributions to the State-Maintained System
79
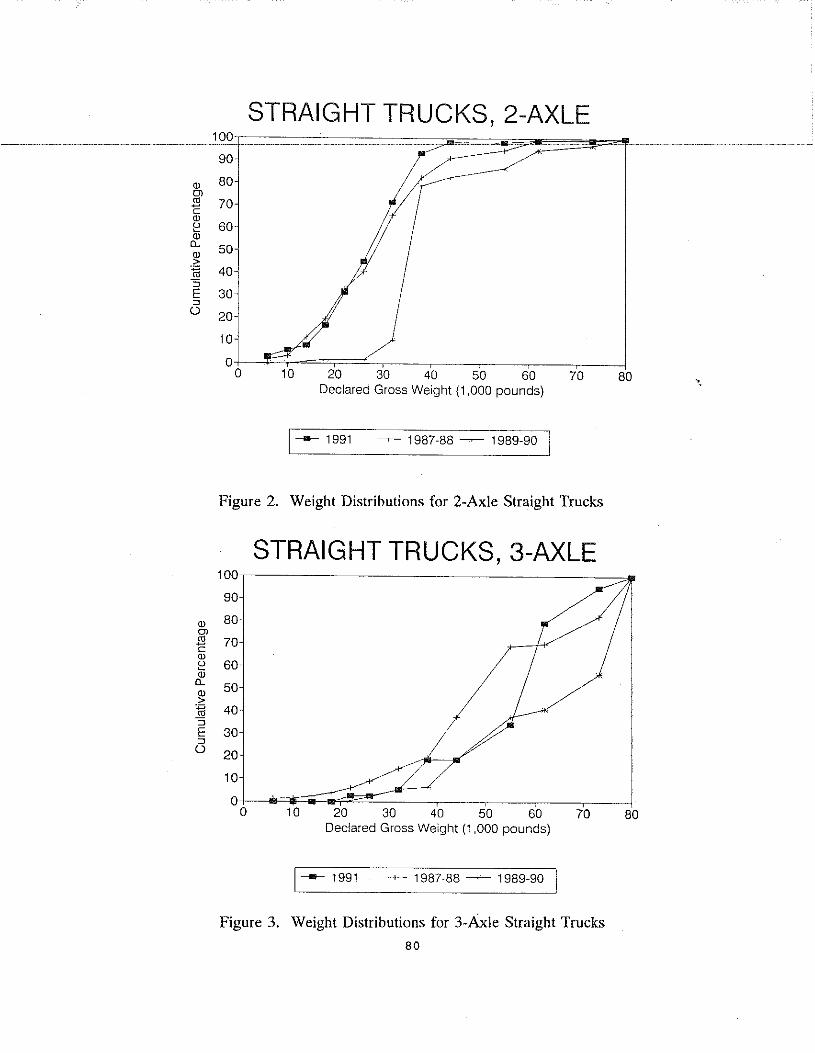
<lJ Ol !'l c <lJ 2 <lJ
D... <lJ > ~ "5 E ::l 0
<lJ Ol
"' -c <lJ 2 <lJ
D... <lJ > .E
"5 E :J 0
STRAIGHT TRUCKS, 2-AXLE 100
90
80
70
60
50
40
30
20
10
0 0 10 20 30 40 50 60 70
Declared Gross Weight (1 ,000 pounds)
1---1991 --+- 1987-88 --- 1989-90 1
Figure 2. Weight Distributions for 2-Axle Straight Trucks
STRAIGHT TRUCKS, 3-AXLE 100
90
80
70
60
50
40
30
20
10
0 0 10 20 30 40 50 60 70
Declared Gross Weight (1 ,000 pounds)
1---- 1991 --+- 1987-88 -- 1989-90 1
Figure 3. Weight Distributions for 3-Axle Straight Trucks
80
80
80
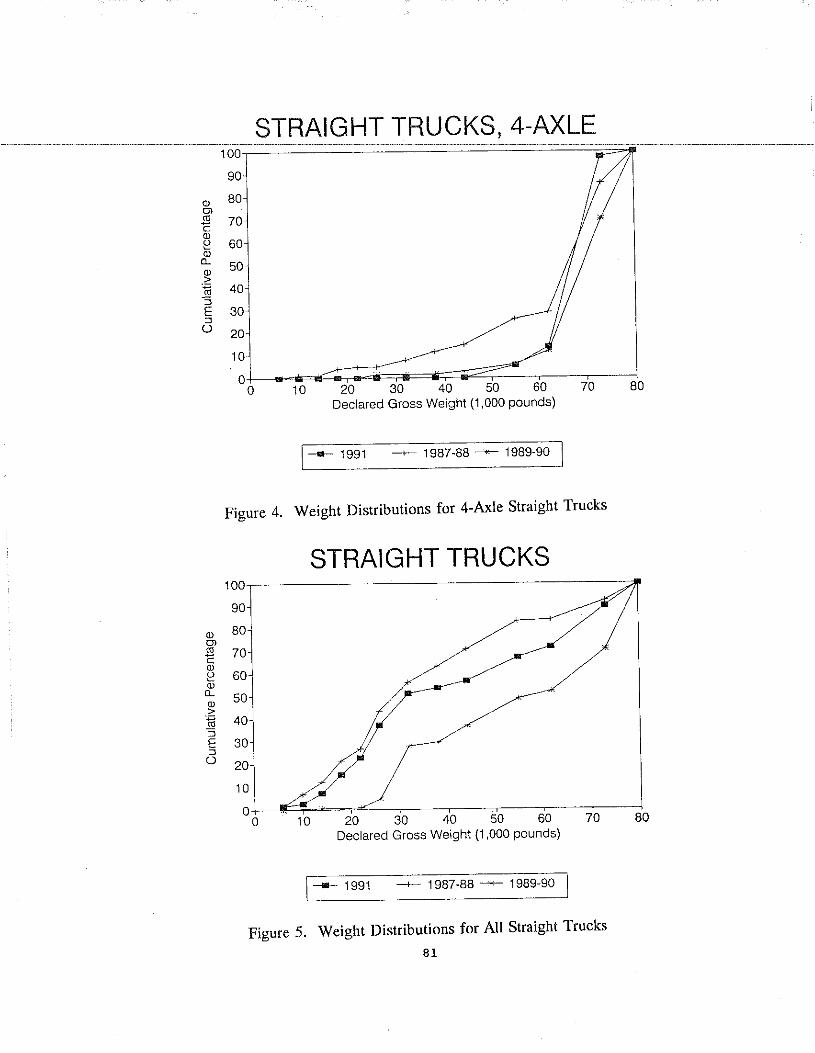
OJ Ol l'l c OJ 2 OJ a. OJ > ·~
-s E :J
(.)
OJ Ol
"' c OJ 2 OJ a. OJ > ~ :J E :J
(.)
STRAIGHT TRUCKS, 4-AXLE 100
90
80
70
60
50
40
30
20
10
0 0 10 20 30 40 50 60 70
Declared Gross Weight (1 ,000 pounds)
1--- 1991 ~ 1987-88 --'*""" 1989-90 1
Figure 4. Weight Distributions for 4-Axle Straight Trucks
STRAIGHT TRUCKS 100
90
80
70
60
50
40
30
20
10
0 0 10 20 30 40 50 60 70
Declared Gross Weight (1 ,000 pounds)
1-~~- 1991 ~ 1987-88 _,.__ 1989-90 1
Figure 5. Weight Distributions for All Straight Trucks
81
80
80
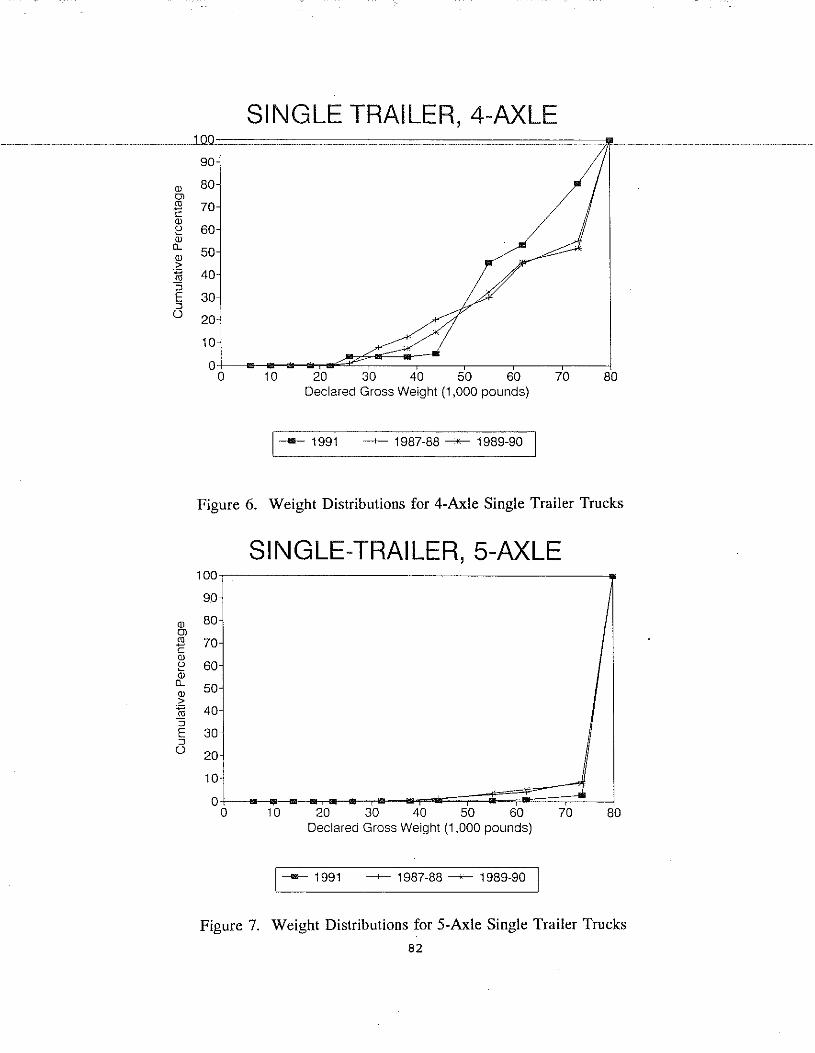
Cl Ol ro c Cl 2 Cl
0.. Cl > ~ :s E :::J u
Ql Ol J'l c Ql ()
Q; 0.. Cl > ~ :s E :::J u
SINGLE TRAILER, 4-AXLE 100
90
80
70
60
50
40
30
20
10
0 0 10 ~ 3D 40 ~ ro m oo
Declared Gross Weight (1 ,000 pounds)
1--- 1991 -~-- 1987-88---+--- 1989-90 1
Figure 6. Weight Distributions for 4-Axle Single Trailer Trucks
SINGLE-TRAILER, 5-AXLE 100
90
80
70
60
50
40
30
20
10
0 0 10 20 30 40 50 60 70 80
Declared Gross Weight (1 ,000 pounds)
1----- 1991 -~-- 1987-88 ~ 1989-90 1
Figure 7. Weight Distributions for 5-Axle Single Trailer Trucks
82
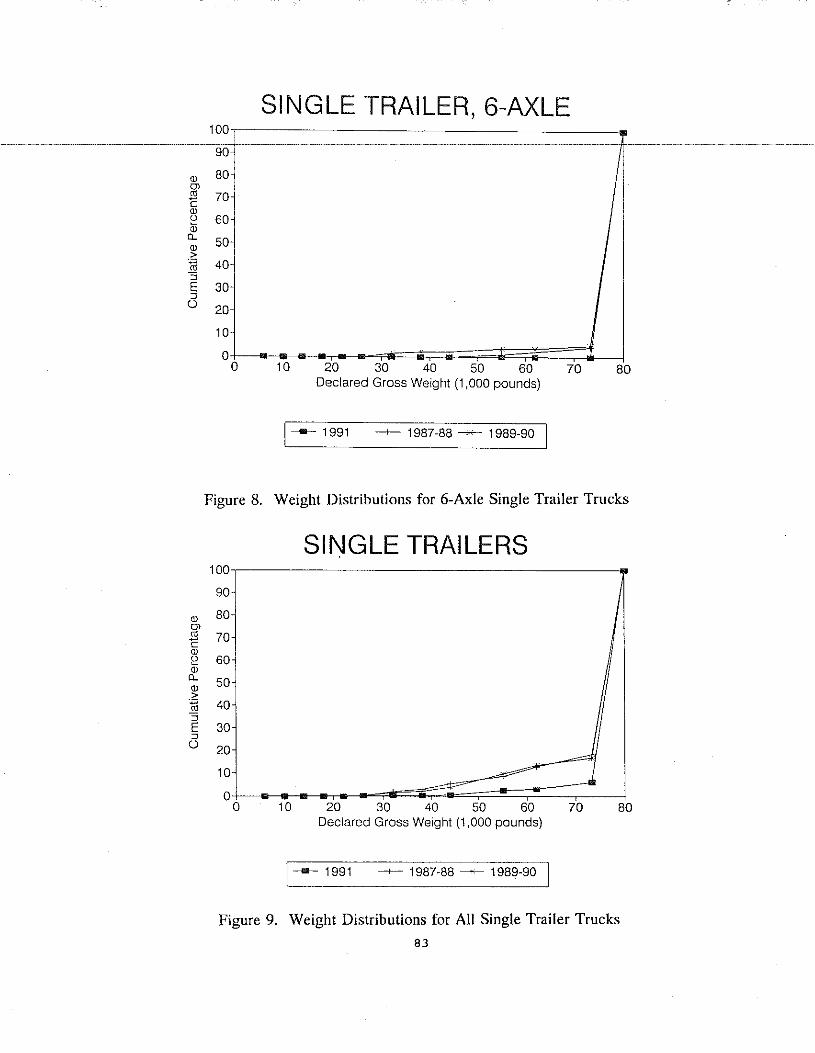
(J) OJ ~ c (J) u Qj
Q_
(J) > '"§ :; E :J
0
QJ
OJ ~ c (J)
2 (J)
Q_
(J) > ·~
:; E :J 0
100
90
80
70
60
50
40
30
20
10
0 0
SINGLE TRAILER, 6-AXLE
10 ~ ~ ~ ~ ® ro oo Declared Gross Weight (1 ,000 pounds)
1---- 1991 -~- 1987-88 ~ 1989-90 1
Figure 8. Weight Distributions for 6-Axle Single Trailer Trucks
SINGLE TRAILERS 100
90
80
70
60
50
40
30
20
10
0 0 10 20 ~ ~ ~ ® 70 00
Declared Gross Weight (1 ,000 pounds)
1---1991 -~- 1987-88 __..,__ 1989-90 1
Figure 9. Weight Distributions for All Single Trailer Trucks
83
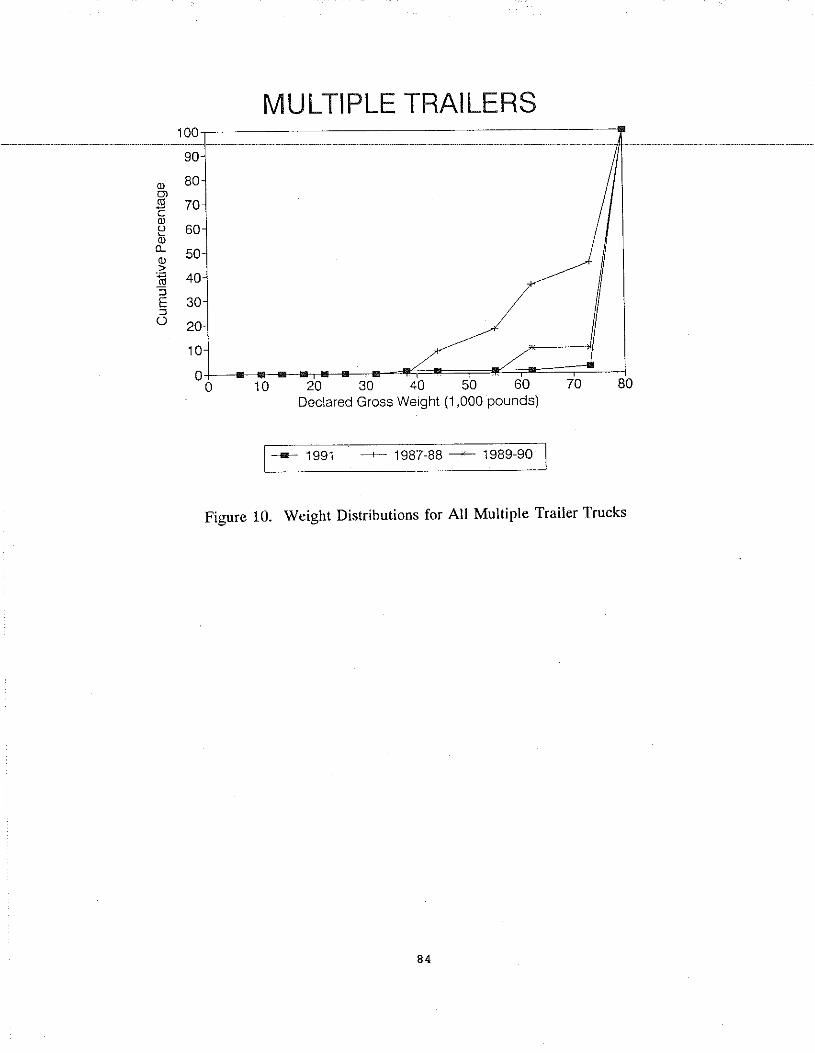
MULTIPLE TRAILERS 100
90
Q) 80 Ol 2 70 c Q)
[:! 60 Q) 0.. 50 Q) > ~ 40 :s E 30 :::l ()
20
10 / 0
0 10 20 30 40 50 60 70 80 Declared Gross Weight (1 ,000 pounds)
1--- 1991 ~ 1987-88 ~ 1989-90 1
Figure 10. Weight Distributions for All Multiple Trailer Trucks
84
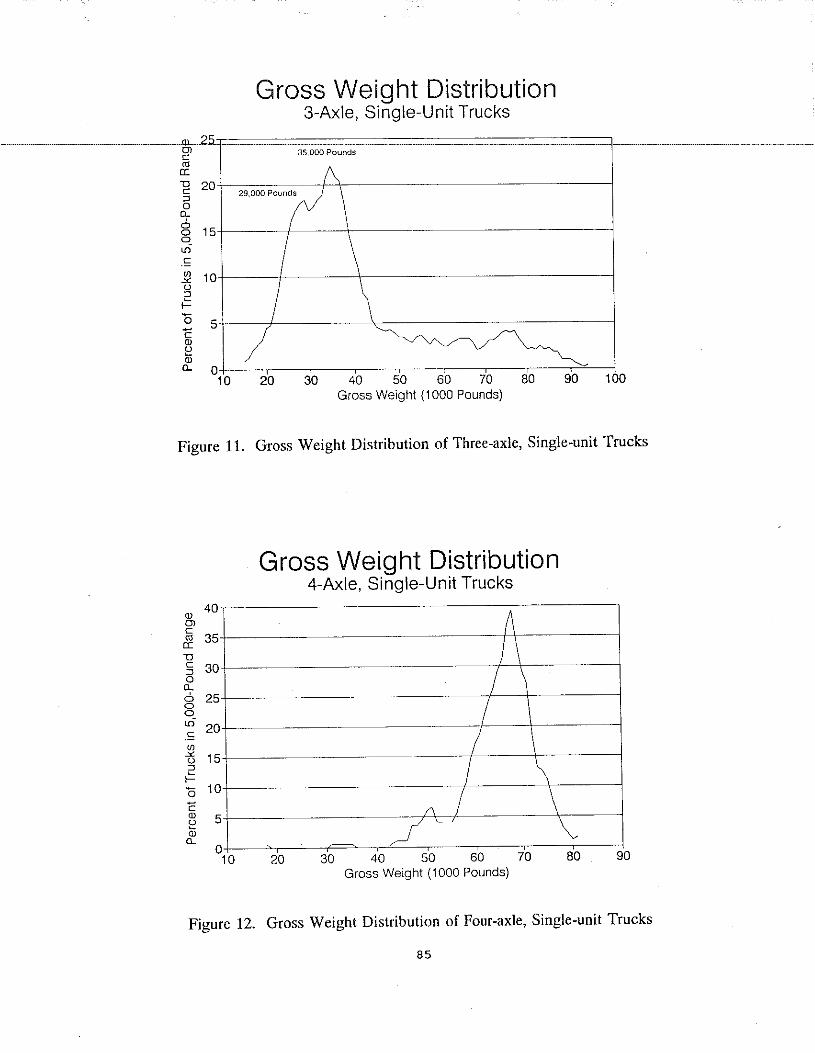
u 20 c ;;:J 0
0.. 6
15 0 0
"' .<::: Ul 10 -"' (.J ;;:J
,:: 0 5 c Q)
t:! Q)
0.. 0 10
Gross Weight Distribution 3-Axle, Single-Unit Trucks
35,000 Pounds
29,000 Pounds
20 30 40 50 60 70 80 Gross Weight (1000 Pounds)
90 100
Figure 11. Gross Weight Distribution of Three-axle, Single-unit Trucks
Q)
Ol c
"' a: u c ;;:J 0
0.. 6 0 0 tD s Ul -"' (.J ;;:J
,:: 0 c Q)
t:! Q)
0..
40
35
30
25
20
15
10
5
0 10
Gross Weight Distribution 4-Axle, Single-Unit Trucks
A J I I I ··-···-7 \
/\ I \ ;Jc_J \_ 20 30 40 50 60 70 80
Gross Weight (1000 Pounds) 90
Figure 12. Gross Weight Distribution of Four-axle, Single-unit Trucks
85
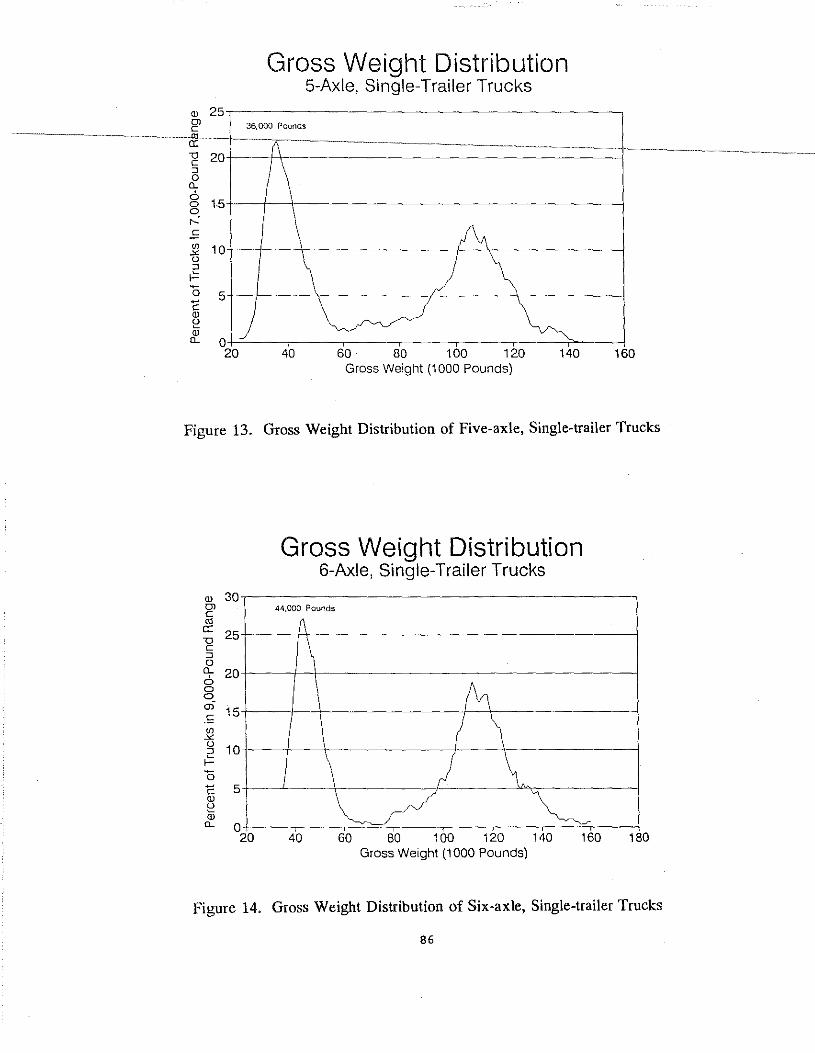
"2 20 ::J 0 a..
Gross Weight Distribution 5-Axle, Single-Trailer Trucks
36,000 Pounds
6 0 1.5+--1-----+-------------------1 0 ,..:-.5
60 80 100 120 140 160 Gross Weight (1000 Pounds)
Figure 13. Gross Weight Distribution of Five-axle, Single-trailer Trucks
<D 30 Ol c
"' a: 25 '0 c ::J 0
~ 20 0 0
cri 15 .S Ul
"" ~ 10 != 0 c <ll u Q; a..
5
0 20
Gross Weight Distribution 6-Axle, Single-Trailer Trucks
44.000 Pounds
1\
\ ~ ! \
_\ ; \ \ / ~
40 60 80 100 120 140 160 Gross Weight (1000 Pounds)
180
Figure 14. Gross Weight Distribution of Six-axle, Single-trailer Trucks
86
APPENDIX A
TECHNICAL DOCUMENTATION

1. GENERAL CONCEPTS
-~~~~~~~~~~~~-~~~~--~---~~~~~~-~-~~~--~--~~-~The--ttnftiysi~-i~-limit<ld--t-O--those-.rost&_ftlldJ:eY.enue£.I!~_SQ_eillt~_!L~lth the state-maintained system of highways. ----~~----~~--~---~-~~-~~~~~~~~~~--~~~-
• Allocation guidelines are identified in Tables Al-A3 .
• The annualized cost of constructing the entire state-maintained system is scaled to the level of the annual budget for capital improvements.
2. PROCEDURE
Two primary SuperCalc4 spreadsheets are used in updating the cost and revenue allocations. HCAXX-l.CAL is used for cost allocations and HCAXX-2.CAL is used for revenue allocations. The update requires that new information be supplied to both HCAXX-l.CAL and HCAXX-2.CAL. Additionally, information from HCAXX-l.CAL must be transferred to HCAXX-2.CAL during the updating process.
Begin the process by copying and renaming the two files to reflect the new date. Update HCAXX-l.CAL as required and execute a recalculation. Unprotect and blank Al.AC73 in HCAXX-2.CAL. Transfer the VALUES of AF136.A W182 of HCAXXl.CAL to Al of HCAXX-2.CAL and from DB734.DL759 to S48. (NOTE: The process of unprotecting, blanking, and partial loading is more easily accomplished by executing the HCAXX-2.CAL macro, LOAD, by pressing <ALT-F5> and entering LOAD.) Update HCAXX-2.CAL as required and execute a recalculation.
A wide carriage printer, set to condensed print, or a suitable alternative must be used to obtain the printouts. Any table can be output manually or all tables can be output using macros, labeled PRINT, within HCAXX-l.CAL and HCAXX-2.CAL. (NOTE: To use the print macro, turn off the borders, press <ALT-F5>, and enter PRINT.)
3. FILE IDENTIFICATION
HCAXX-l.CAL
HCAXX-2.CAL
HCAIXX-l.CAL
HCAIXX-2.CAL
The SuperCalc4 spreadsheet used for allocating highway costs to various vehicle types and weight categories
The SuperCalc4 spreadsheet used for allocating highway revenues to various vehicle types and weight categories
A SuperCalc4 spreadsheet into which Interstate classification data is entered on a segment by segment basis. Data from the spreadsheet is manually input to HCAIXX-2.CAL.
A SuperCalc4 spreadsheet used to calculate travel (VMT) on
89
Kentucky Interstates and the average composition of the traffic stream (percentages by vehicle type) on Interstate highways as a
~-----------------------------------------------------------funetion--of-1ocation-(~ur.al/urban_)_mllLn111llbJ;LQfJane_§,_ ____ ~--------------------------
HCAXX.BAS A QuickBasic4 program to compute vehicle-type percentages for input to Table C3
C*.DAT Vehicle classification data for input to HCAXX.BAS, one record for each station with federal aid, rural/urban, and number-of-lanes codes added. Produced by combining classification data with information extracted from the Roadway Characteristics Inventory file.
HCAFUELS.CAL A SuperCalc4 spreadsheet which computes the average percentage of diesel fuel usage for input to Table D4
HCAFUNDS.CAL A SuperCalc4 spreadsheet which categorizes and sums highway revenue and expenditure data extracted from "The Financial Report to Management for the Period of July 1, 1990 to June 30, 1991"
HCATOLLS.CAL A SuperCalc4 spreadsheet which sums toll road revenue for input into Table DS
4. INPUT
TABLE C1 Annual expenditures for construction, maintenance and traffic services, administration, enforcement, and miscellaneous needs for statemaintained system Source: Financial Report to Management for the Period of July 1, 1990 to June 30, 1991 (see Appendix B), 1990 State Highway Expenditures (Form FHWA 532), and 1990 Highway Statistics.
TABLE C2 Highway miles, vehicle-miles traveled, and AADT by highway classification Source: 1991 Roadway Characteristics Inventory (RCI) file, Division of Planning, KYDOH and 1990 Highway Statistics (Total VMT)
TABLE C3 Terrain/land use percentages by highway classification Source: Division of Planning, KYDOH
TABLE C4 Vehicle-type percentages by Federal-Aid highway classification, rural/urban designation, and number of lanes Source: 1987-1990 Vehicle Classification Files and 1991 RCI file,
90
- ~-~---- - -----
Division of Planning, KYDOH
----~---- --------TABI:E--c7---Basi:c-pll5Sengercarequ-i:vltlents-----~~----- ---~---~--~~----~~--~--~-----------
TABLE C10
Unnumbered table
TABLE Cll
Unnumbered table
TABLE C21
Source: Highway Capacity Manual (TRB Special Report 209) and 1982 Federal Cost Allocation Study
Unit pavement damage factors (ESALs(vehicle) by vehicle type and highway type Source: 1989 and 1990 Loadometer (WIM) Files, Division of Planning, KYDOH
1980 highway construction cost per mile by construction element, highway classification, and terrain/land use Source: 1980 construction costs per mile, Division of Planning, KYDOH
Construction cost conversion factor (to convert costs to current year values) (BI477) Source: Construction Cost Indices, Estimating Staff, KYDOH
Service lives of highway elements (BM479.BV479) Source: Report UKTRP-81-22
Percentage of vehicles by axle type in various registered weight categories Source: Sample comprised of Kentucky-licensed trucks involved in reported accidents for the period 1987 through 1990. Type of truck, number of axles, license number, and VIN obtained from accident file (Department of State Police). Registered weight obtained from apportionment file (Division of Motor Vehicle Licensing) of Kentucky trucks by matching license number. Registered weight obtained from AVIS file (Division of Motor Vehicle Licensing) by matching with VIN and license number. Data from the cab card file is used to proportion 62,000-pound trucks between 59,999- and 62,000-pound declared weight categories.
TABLE D1 Statewide revenue totals Source: Highway Statistics (1990), FHWA; Kentucky Highway Income (Form FHWA-531 and Notes on FHWA-531), Division of Planning, KYDOH; Financial Report to Management for the Period July 1, 1990 to June 30, 1991, KYTC, Division of Accounts
TABLE D3 Percentage of trucks that are diesel powered as a function of gross weight
91
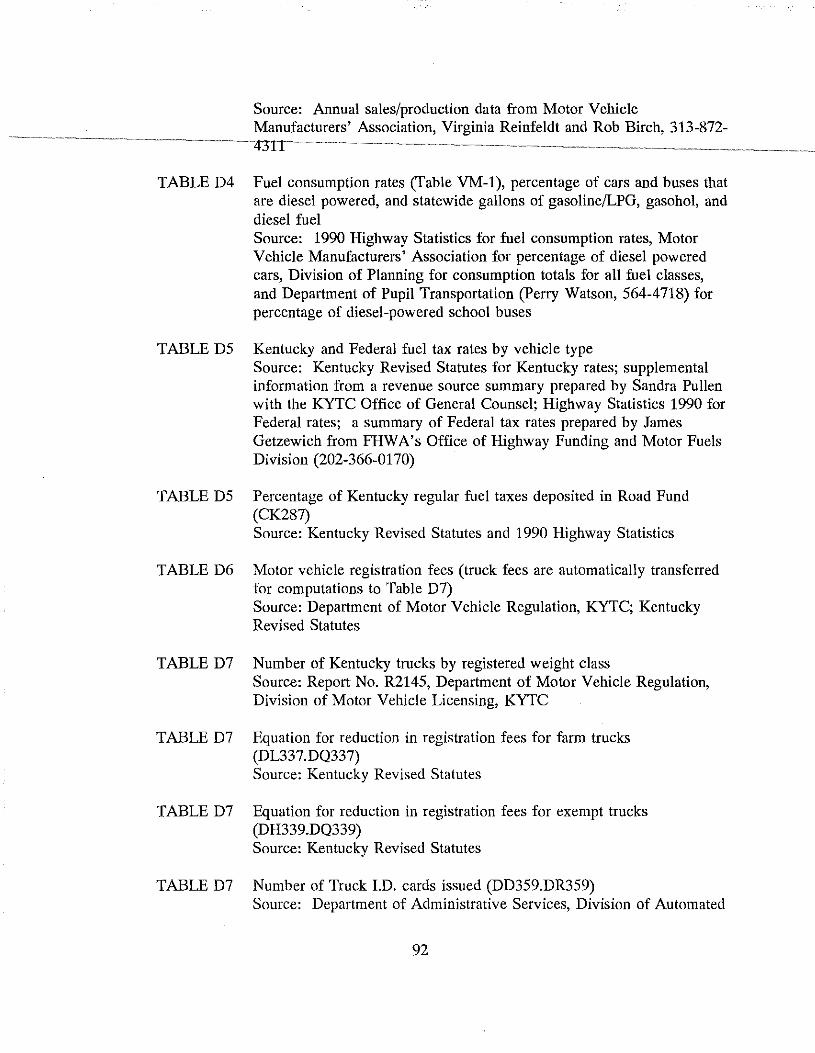
Source: Annual sales/production data from Motor Vehicle Manufacturers' Association, Virginia Reinfeldt and Rob Birch, 313-872-
TABLE D4 Fuel consumption rates (fable VM-1), percentage of cars and buses that are diesel powered, and statewide gallons of gasoline/LPG, gasohol, and diesel fuel Source: 1990 Highway Statistics for fuel consumption rates, Motor Vehicle Manufacturers' Association for percentage of diesel powered cars, Division of Planning for consumption totals for all fuel classes, and Department of Pupil Transportation (Perry Watson, 564-4718) for percentage of diesel-powered school buses
TABLE D5 Kentucky and Federal fuel tax rates by vehicle type Source: Kentucky Revised Statutes for Kentucky rates; supplemental information from a revenue source summary prepared by Sandra Pullen with the KYTC Office of General Counsel; Highway Statistics 1990 for Federal rates; a summary of Federal tax rates prepared by James Getzewich from FHWA's Office of Highway Funding and Motor Fuels Division (202-366-0170)
TABLE D5 Percentage of Kentucky regular fuel taxes deposited in Road Fund (CK287) Source: Kentucky Revised Statutes and 1990 Highway Statistics
TABLE D6 Motor vehicle registration fees (truck fees are automatically transferred for computations to Table D7) Source: Department of Motor Vehicle Regulation, KYTC; Kentucky Revised Statutes
TABLE D7 Number of Kentucky trucks by registered weight class Source: Report No. R2145, Department of Motor Vehicle Regulation, Division of Motor Vehicle Licensing, KYTC
TABLE D7 Equation for reduction in registration fees for farm trucks (DL337.DQ337) Source: Kentucky Revised Statutes
TABLE D7 Equation for reduction in registration fees for exempt trucks (DH339.DQ339) Source: Kentucky Revised Statutes
TABLE D7 Number of Truck I.D. cards issued (DD359.DR359) Source: Department of Administrative Services, Division of Automated
92
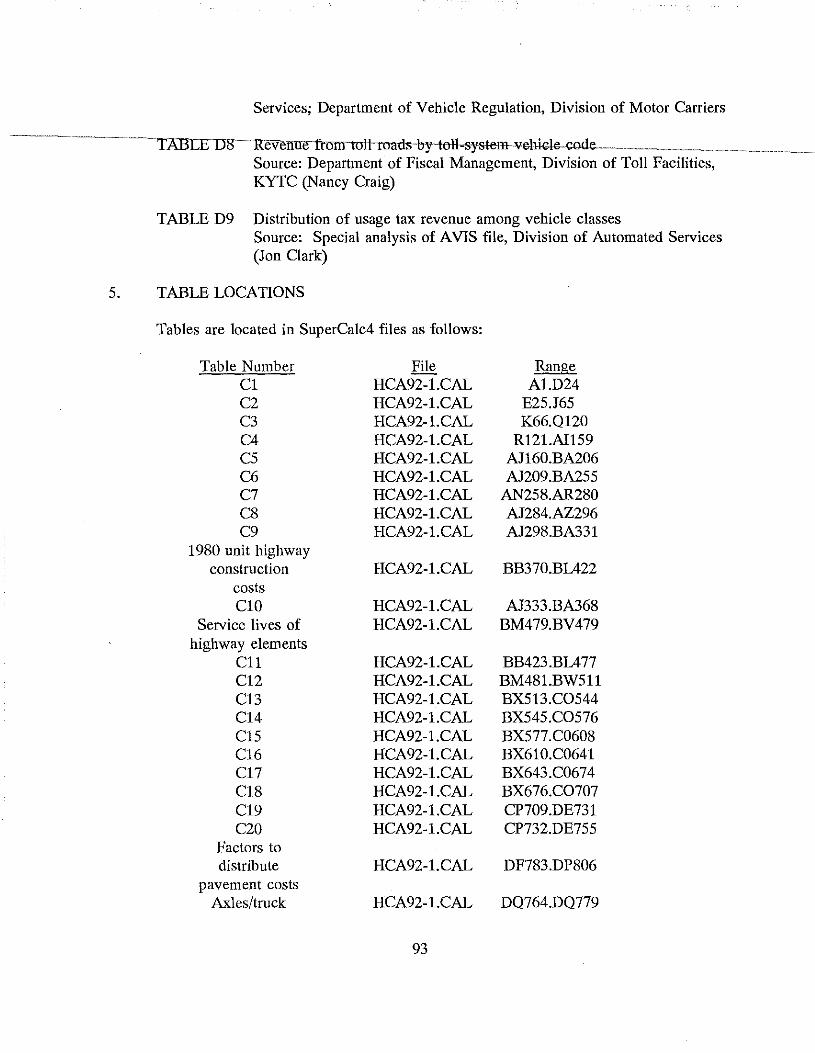
Services; Department of Vehicle Regulation, Division of Motor Carriers
-------------------~-TABIEDs--ltevenue--rnmrtuthoatls--bytcll-system-vehicl~-rode------------------------------------------------------------Source: Department of Fiscal Management, Division of Toll Facilities,
5.
KYTC (Nancy Craig)
TABLE D9 Distribution of usage tax revenue among vehicle classes Source: Special analysis of A VIS file, Division of Automated Services (Jon Clark)
TABLE LOCATIONS
Tables are located in SuperCalc4 files as follows:
Table Number File Range Cl HCA92-l.CAL Al.D24 C2 HCA92-l.CAL E25.J65 C3 HCA92-l.CAL K66.Ql20 C4 HCA92-l.CAL R12l.AI159 C5 HCA92-l.CAL AJ160.BA206 C6 HCA92-l.CAL AJ209.BA255 C7 HCA92-l.CAL AN258.AR280 C8 HCA92-l.CAL AJ284.AZ296 C9 HCA92-l.CAL AJ298.BA331
1980 unit highway construction HCA92-l.CAL BB370.BL422
costs ClO HCA92-l.CAL AJ333.BA368
Service lives of HCA92-l.CAL BM479.BV479 highway elements
Cll HCA92-l.CAL BB423.BL477 C12 HCA92-l.CAL BM481.BW511 C13 HCA92-l.CAL BX513.C0544 C14 HCA92-l.CAL BX545.C0576 C15 HCA92-l.CAL BX577.C0608 C16 HCA92-l.CAL BX610.C0641 C17 HCA92-l.CAL BX643.C0674 C18 HCA92-l.CAL BX676.C0707 Cl9 HCA92-l.CAL CP709.DE731 C20 HCA92-l.CAL CP732.DE755
Factors to distribute HCA92-l.CAL DF783.DP806
pavement costs Axles/truck HCA92-l.CAL DQ764.DQ779
93
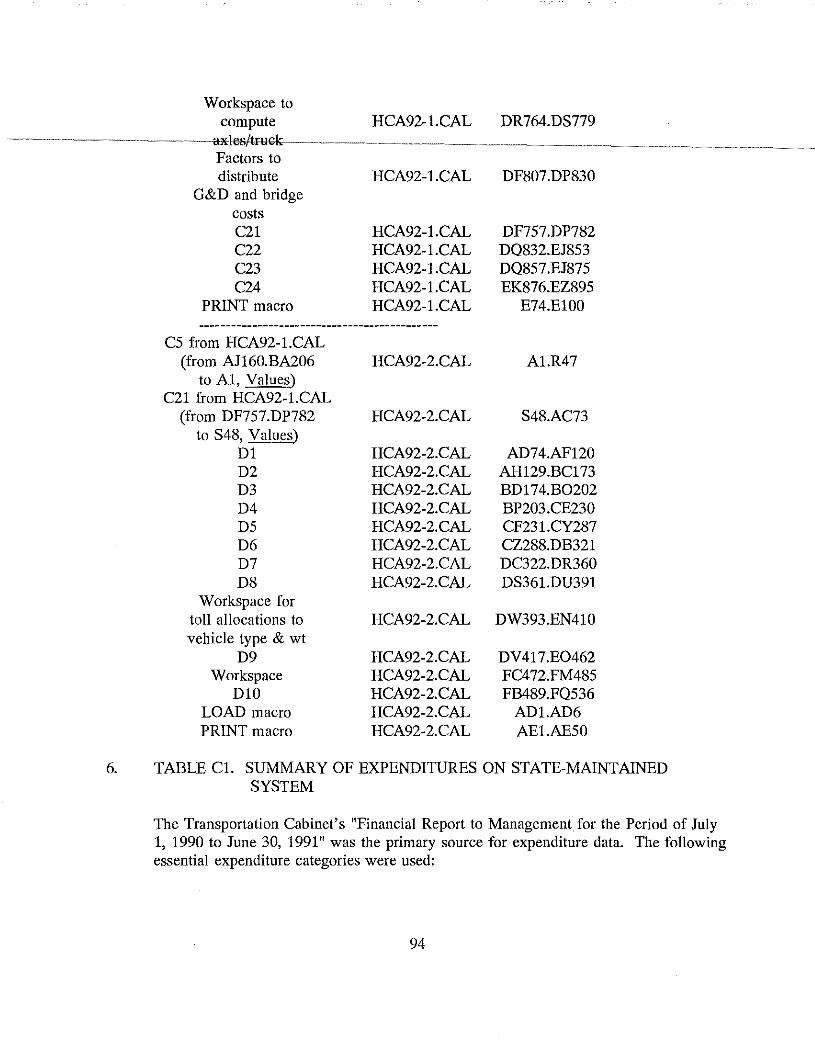
6.
Workspace to compute HCA92-l.CAL DR764.DS779
Factors to distribute HCA92-l.CAL DF807.DP830
G&D and bridge costs C21 HCA92-l.CAL DF757.DP782 C22 HCA92-l.CAL DQ832.EJ853 C23 HCA92-l.CAL DQ857.EJ875 C24 HCA92-l.CAL EK876.EZ895
PRINT macro HCA92-l.CAL E74.El00 ---------------------------------------------
CS from HCA92-l.CAL (from AJ160.BA206 HCA92-2.CAL Al.R47
to A1, Values) C21 from HCA92-l.CAL
(from DF757.DP782 HCA92-2.CAL S48.AC73 to S48, Values)
D1 HCA92-2.CAL AD74.AF120 D2 HCA92-2.CAL AH129.BC173 D3 HCA92-2.CAL BD174.B0202 D4 HCA92-2.CAL BP203.CE230 DS HCA92-2.CAL CF23l.CY287 D6 HCA92-2.CAL CZ288.DB321 D7 HCA92-2.CAL DC322.DR360 DS HCA92-2.CAL DS361.DU391
Workspace for toll allocations to HCA92-2.CAL DW393.EN410 vehicle type & wt
D9 HCA92-2.CAL DV417.E0462 Workspace HCA92-2.CAL FC472.FM485
D10 HCA92-2.CAL FB489.FQ536 LOAD macro HCA92-2.CAL AD1.AD6 PRINT macro HCA92-2.CAL AEl.AESO
TABLE Cl. SUMMARY OF EXPENDITURES ON STATE-MAINTAINED SYSTEM
The Transportation Cabinet's "Financial Report to Management for the Period of July 1, 1990 to June 30, 1991" was the primary source for expenditure data. The following essential expenditure categories were used:
94
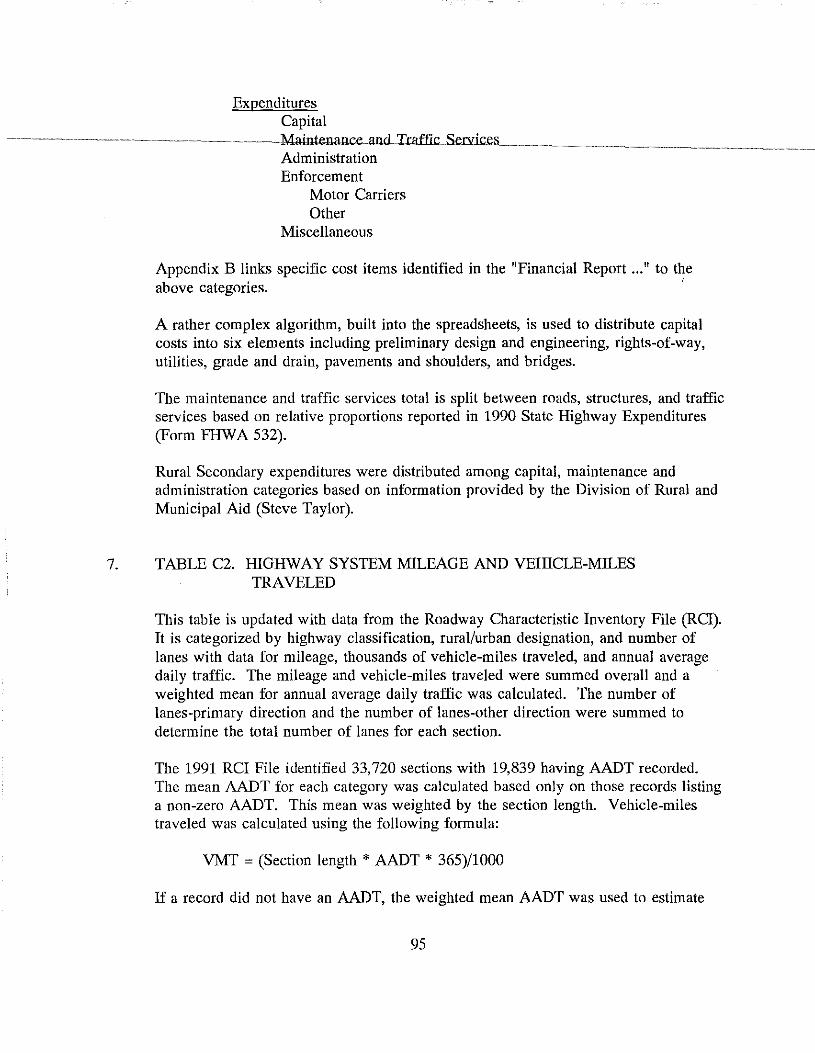
Expenditures Capital
--~-----------------------------------------------------~-Maintenance and _Traffic ServiceL ______________________________________________________________ _ Administration Enforcement
Motor Carriers Other
Miscellaneous
Appendix B links specific cost items identified in the "Financial Report ... " to the above categories. '
A rather complex algorithm, built into the spreadsheets, is used to distribute capital costs into six elements including preliminary design and engineering, rights-of-way, utilities, grade and drain, pavements and shoulders, and bridges.
The maintenance and traffic services total is split between roads, structures, and traffic services based on relative proportions reported in 1990 State Highway Expenditures (Form FHW A 532).
Rural Secondary expenditures were distributed among capital, maintenance and administration categories based on information provided by the Division of Rural and Municipal Aid (Steve Taylor).
7. TABLE C2. HIGHWAY SYSTEM MILEAGE AND VEHICLE-MILES TRAVELED
This table is updated with data from the Roadway Characteristic Inventory File (RCI). It is categorized by highway classification, rural/urban designation, and number of lanes with data for mileage, thousands of vehicle-miles traveled, and annual average daily traffic. The mileage and vehicle-miles traveled were summed overall and a weighted mean for annual average daily traffic was calculated. The number of lanes-primary direction and the number of lanes-other direction were summed to determine the total number of lanes for each section.
The 1991 RCI File identified 33,720 sections with 19,839 having AADT recorded. The mean AADT for each category was calculated based only on those records listing a non-zero AADT. This mean was weighted by the section length. Vehicle-miles traveled was calculated using the following formula:
VMT = (Section length * AADT * 365)/1000
If a record did not have an AADT, the weighted mean AADT was used to estimate
95
the vehicle-miles of traveL
------~-----------------------------~-1:\xamfnatimrohdrequene-y-distr-ibutioo-oLAAITLprmll.IC.m_J;;Q!lcJ<DL~\l_()l!_l__r~~~!tec!_
occurrences of certain AADT values and some unusually high values. Manual ------------------------------
adjustment was made to this questionable data so that the total vehicle-miles of travel conformed to reasonable expectations.
A SAS program read the data and applied a set of criteria for record inclusion: the primary check was the Federal-aid system status which indicates if the section is open to traffic. A highway classification variable was created based on the Federal-aid system code and the governmental level of controL
There are eight highway classification categories--Interstate, Federal-Aid Primary, Federal-Aid Urban, Federal-Aid Secondary, Non-Federal-Aid State Maintained, Non-Federal-Aid County Maintained, Non-Federal-Aid City Maintained, and Non-Federal-Aid Other. The first four categories are determined solely by the Federal-aid code whereas the governmental level of control is used to help identify the four remaining categories.
This data set is sorted by highway classification, rural/urban designation and number of lanes. A mean AADT weighted by section length is computed. This weighted AADT is then used together with the aforementioned formula to make the necessary estimates in cases where AADTs have not been recorded.
Sums are calculated for number of sections, mileage, vehicle-miles traveled, number of sections with AADT, and mileage with AADT. The SAS procedure MEANS is used exclusively to obtain the desired statistics.
8. TABLE C4. PERCENTAGE OF TRAFFIC STREAM BY VEHICLE TYPE
A. Because of the significance of travel on the Interstate system, Interstate travel was treated in greater detail than travel on other types of highways.
1990 AADTs were extracted from the historical volume (TVS) file for each of the Interstate segments. Data for all classification counts that had been conducted on Interstate highways in the period, 1986-90, were manually extracted from hard copy reports and entered into a SuperCalc4 spreadsheet, HCAI92-l.CAL. These two sets of data were combined in another spreadsheet, HCAI92-2.CAL. Rural/urban designation and number of lanes, obtained from the printout of the statewide mileage tape, were also added to HCAI92-2.CAL. The computation of vehicle miles traveled by each vehicle type on each segment of Interstate was straightforward. A sort was then made on rural/urban designation and lanes of travel and cumulative vehicle miles of travel were obtained for each vehicle type on each category of Interstate
96
highway. Percentage-composition of the traffic stream was determined from these vehicle mile estimates.
B. The necessary information for other types of highways was a by-product of the classification summary program, CLASSUM, which is executed annually to update the ESAL model used for pavement design. The CLASSUM program is maintained by the Kentucky Transportation Center. This classification summary program produces two permanent output files along with a paper-copy printout. One of the files, CLASSUM.YR19XX, contains daily volumes of each vehicle type for the four seasons as well as annual average daily volumes for each vehicle type. This file was accessed from magnetic tape and the records with a "1" in column 1 were read to determine county, station, route, milepoint and Federal-aid system codes. The records with "3" in column I' were read to determine the annual average daily volume of each vehicle type.
C. Four files so produced--one for each of the four most recent years of data--were downloaded to floppy disks and printouts of these files were obtained.
D. The above files were supplemented with information from other parts of the classification tape (the header records) and the RCI file. This information included rural/urban designation and number of lanes from the RCI file. In cases where this information were not available from computer with the RCI file, then the latest statewide mileage tape was used. Federal-Aid category was obtained from the classification file annually processed by KTC for the Division of Planning.
Extract for each of the above stations:
(1) Federal-Aid type of highway coded as follows:
1 Interstates 2 Federal-Aid Primary 3 Federal-Aid Urban 4 Federal-Aid Secondary 5 Non-Federal-Aid, State Maintained 6 Non-Federal-Aid, County Maintained 7 Non-Federal-Aid, City Maintained 8 Non-Federal-Aid, Maintained by Other Agencies
For codes 5-8, individual records were scanned and data supplied manually.
97
(2) Rural/urban designation coded as follows:
2 Urban and suburban
(3) Number of lanes coded as follows:
1 1, 2, or 3 lanes (considered 2 lanes) 2 4 or more lanes (considered 4 lanes)
E. HCA92.BAS was run to produce the information needed in Table C4 for the non-Interstate highways.
9. TABLE ClO. DISTRIBUTION OF EQUIVALENT-SINGLE-AXLE-LOAD-MILES TRAVELED
With exception of the damage factors, ESAL'S per vehicle, Table C9 is computed based on previously supplied information. Damage factors are usually developed using the three most recent years of weight data. The mainframe program, EALCON, provides the necessary averages for Interstate and non-Interstate highways located in both rural and urban areas.
10. TABLE Dl. SUMMARY OF REVENUE ATTRIBUTED TO STATE-MAINTAINED SYSTEM
The Transportation Cabinet's "Financial Report to Management for the Period of July 1, 1990 to June 30, 1991" was used to determine the revenue deposited in the state road and Federal funds and, hence, attributed to the state-maintained system. The following essential categories were used:
98
Revenue Fuel Tax
Normal Use Normal
Registration and License Fees Cars Buses Motorcycles Trucks
Kentucky Apportioned Vehicle Identification Cards Permits
Other Miscellaneous Operator's License Fees Usage Taxes
Buses Other Vehicles
Road Tolls Other Motor Carrier Taxes
Weight-Distance Extended-Weight Permits
Federal Aid
Appendix B links specific revenue items identified in the "Financial Report ... " to the above categories.
In addition, Federal-aid revenue was distributed to fuel, usage (trucks and trailers), use, and other categories based on the proportion of Federal aid shown in the Financial Report and the Federal Aid Highway Trust Fund receipts from Kentucky as shown in Table FE-9 of "Highway Statistics".
11. TABLE D9. TOTAL REVENUE GENERATED
The distribution of usage tax among the vehicle classes is determined by a special analysis of the A VIS file. Results are entered manually into Table D9.
99
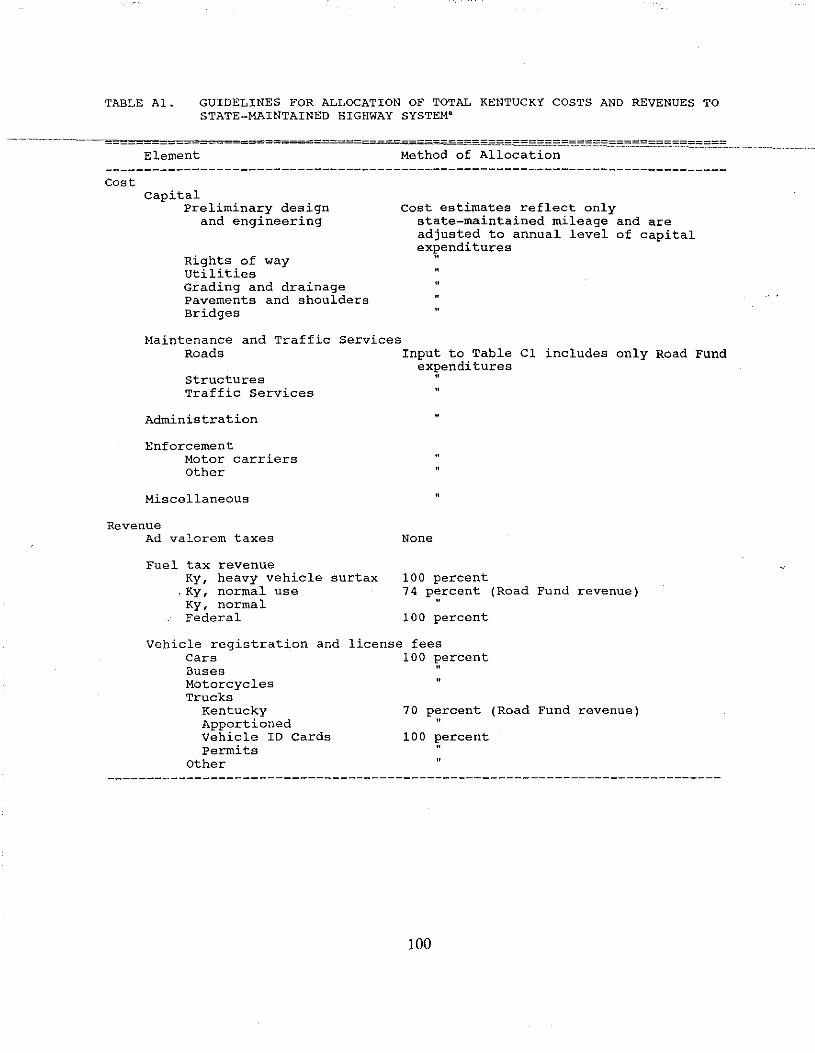
TABLE Al. GUIDELINES FOR ALLOCATION OF TOTAL KENTUCKY COSTS AND REVENUES TO STATE-MAINTAINED HIGHWAY SYSTEM•
Cost
=======-~-·~==============~· Element
Capital Preliminary design
and engineering
Rights of way utilities Grading and drainage Pavements and shoulders Bridges
Maintenance and Traffic Roads
structures Traffic Services
Administration
Enforcement Motor carriers other
Miscellaneous
Services
Method of Allocation
Cost estimates reflect only state-maintained mileage and are adjusted to annual level of capital exP,enditures
Input to Table Cl includes only Road Fund ex~enditures
Revenue Ad valorem taxes
Fuel tax revenue Ky, heavy vehicle surtax
. Ky, normal use Ky, normal Federal
None
100 percent 74 p~rcent (Road Fund revenue)
100 percent
Vehicle registration and license fees Cars 100 percent Buses Motorcycles Trucks
Kentucky Apportioned Vehicle ID Cards Permits
Other
"
70 percent (Road Fund revenue) "
100 percent "
100
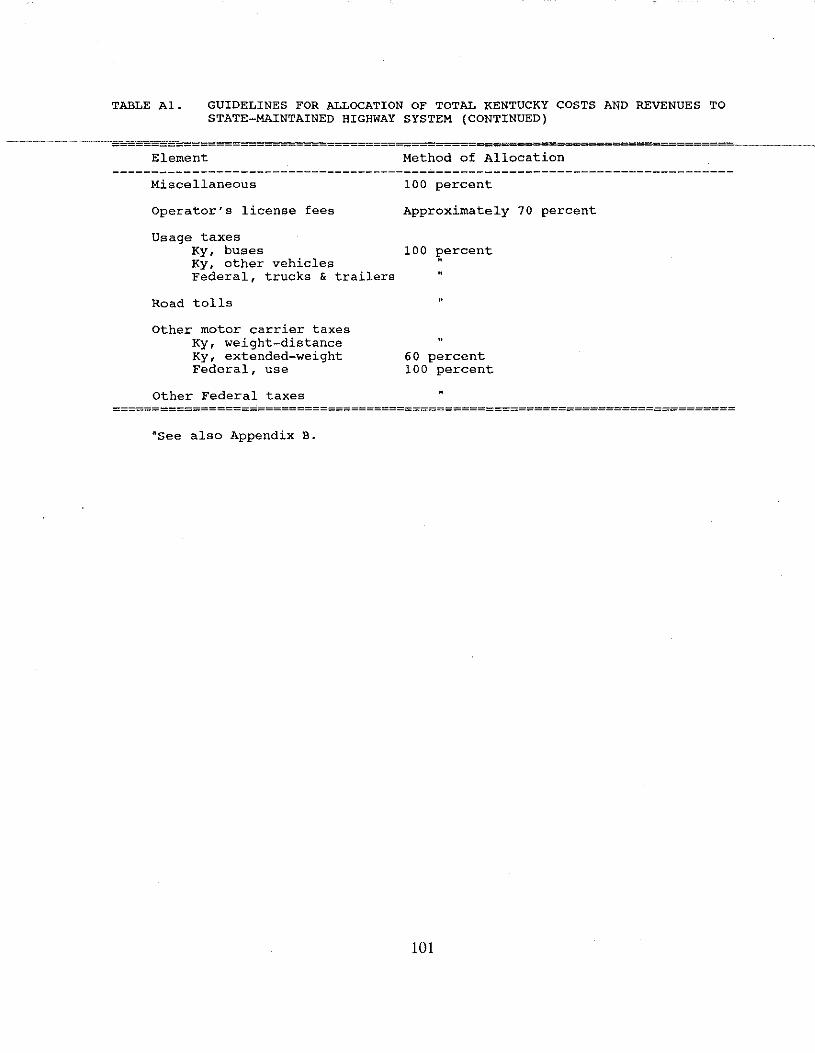
TABLE A1. GUIDELINES FOR ALLOCATION OF TOTAL KENTUCKY COSTS AND REVENUES TO STATE-MAINTAINED HIGHWAY SYSTEM (CONTINUED)
Element
Miscellaneous
Operator's license fees
Usage taxes Ky, buses Ky, other vehicles Federal, trucks & trailers
Road tolls
Other motor carrier taxes Ky, weight-distance Ky, extended-weight Federal, use
Other Federal taxes
Method of Allocation
100 percent
Approximately 70 percent
100 12ercent
..
60 percent 100 percent
==============================================================================
•see also Appendix B.
101
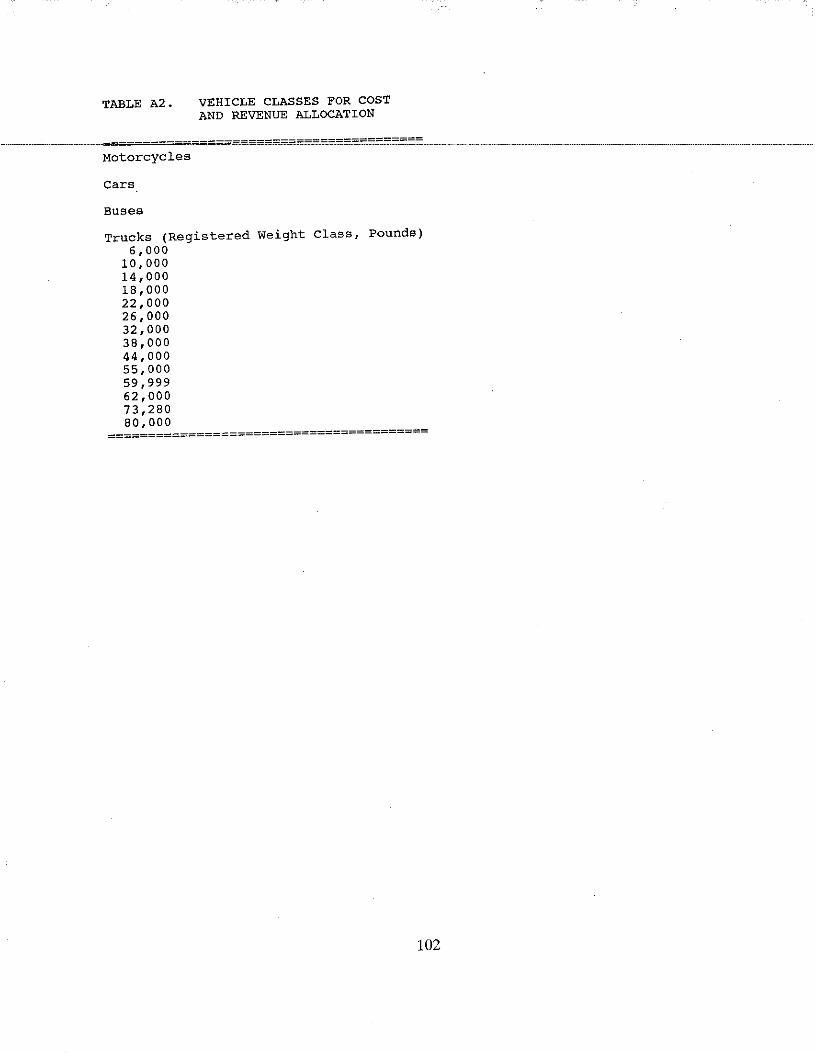
TABLE A2.
Motorcycles
Cars
Buses
VEHICLE CLASSES FOR COST AND REVENUE ALLOCATION
Trucks (Registered Weight Class, Pounds) 6,000
10,000 14,000 18,000 22,000 26,000 32,000 38,000 44,000 55,000 59,999 62,000 73,280 80,000
========================================
102
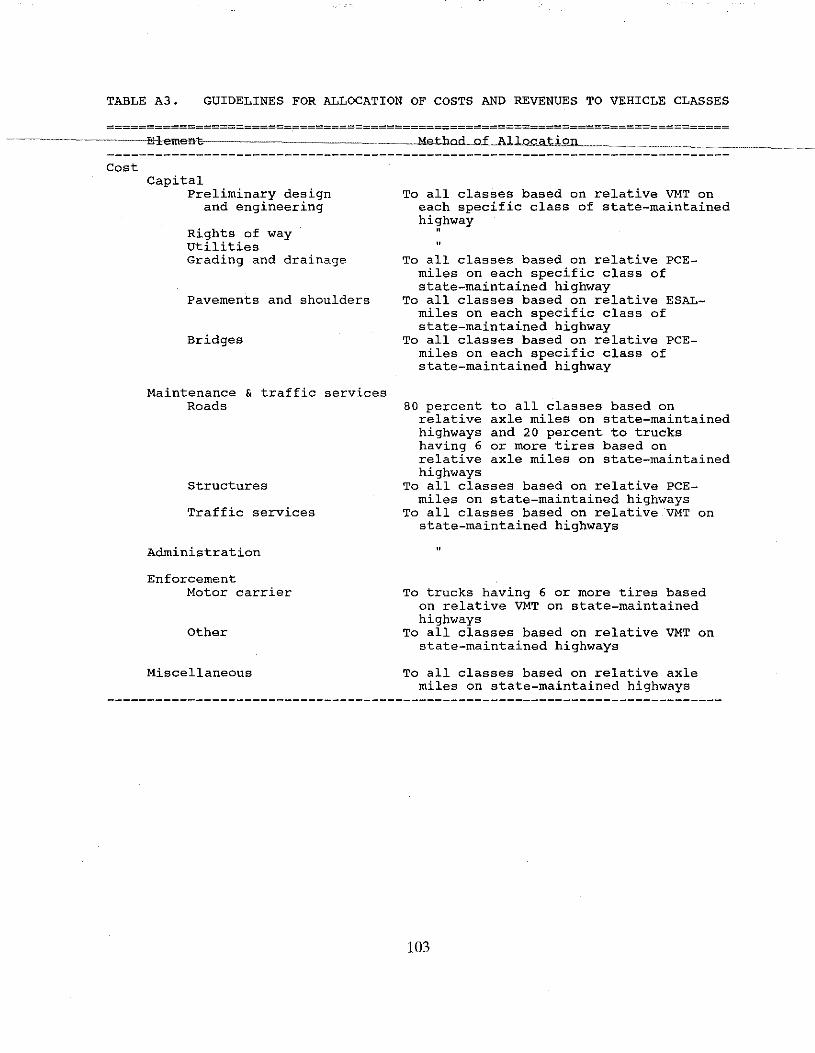
TABLE A3. GUIDELINES FOR ALLOCATION OF COSTS AND REVENUES TO VEHICLE CLASSES
==============================================================================
Cost Capital
Preliminary design and engineering
Rights of way Utilities Grading and drainage
Pavements and shoulders
Bridges
Maintenance & traffic services Roads
Structures
Traffic services
Administration
Enforcement Motor carrier
Other
Miscellaneous
To all classes based on relative VMT on each specific class of state-maintained hi~hway
To all classes based on relative PCEmiles on each specific class of state-maintained highway
To all classes based on relative ESALmiles on each specific class of state-maintained highway
To all classes based on relative PCErniles on each specific class of state-maintained highway
80 percent to all classes based on relative axle miles on state-maintained highways and 20 percent to trucks having 6 or more tires based on relative axle miles on state-maintained highways
To all classes based on relative PCEmiles on state-maintained highways
To all classes based on relative VMT on state-maintained highways
To trucks having 6 or more tires based on relative VMT on state-maintained highways
To all classes based on relative VMT on state-maintained highways
To all classes based on relative axle miles on state-maintained highways
103
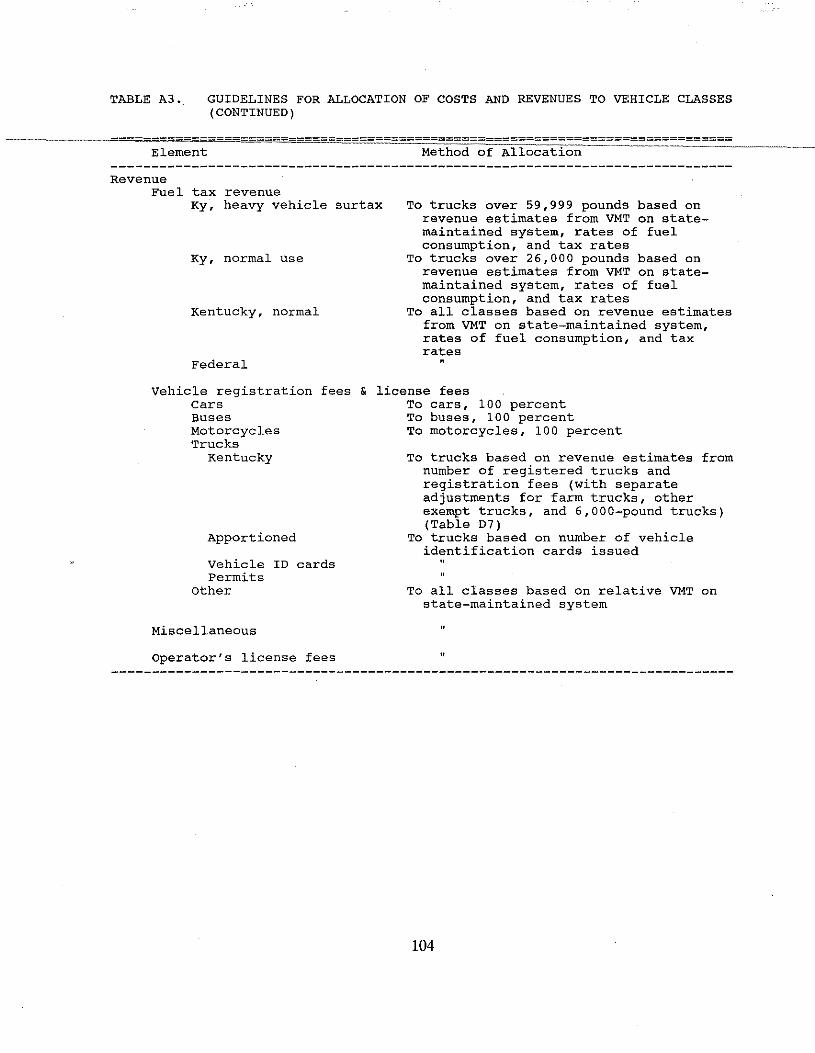
TABLE A3. GUIDELINES FOR ALLOCATION OF COSTS AND REVENUES TO VEHICLE CLASSES (CONTINUED)
Element Method of Allocation--
Revenue Fuel tax revenue
Ky, heavy vehicle surtax
Ky, normal use
Kentucky, normal
Federal
To trucks over 59,999 pounds based on revenue estimates from VMT on statemaintained system, rates of fuel consumption, and tax rates
To trucks over 26,000 pounds based on revenue estimates from VMT on statemaintained system, rates of fuel consumption, and tax rates
To all classes based on revenue estimates from VMT on state-maintained system, rates of fuel consumption, and tax rates
Vehicle registration fees & license fees cars To cars, 100 percent Buses To buses, 100 percent Motorcycles To motorcycles, 100 percent Trucks
Kentucky
Apportioned
Vehicle ID cards Permits
Other
Miscellaneous
Operator's license fees
To trucks based on revenue estimates from number of registered trucks and registration fees (with separate adjustments for farm trucks, other exempt trucks, and 6,000-pound trucks) (Table D7)
To trucks based on number of vehicle identification cards issued
To all classes based on relative VMT on state-maintained system
..
104
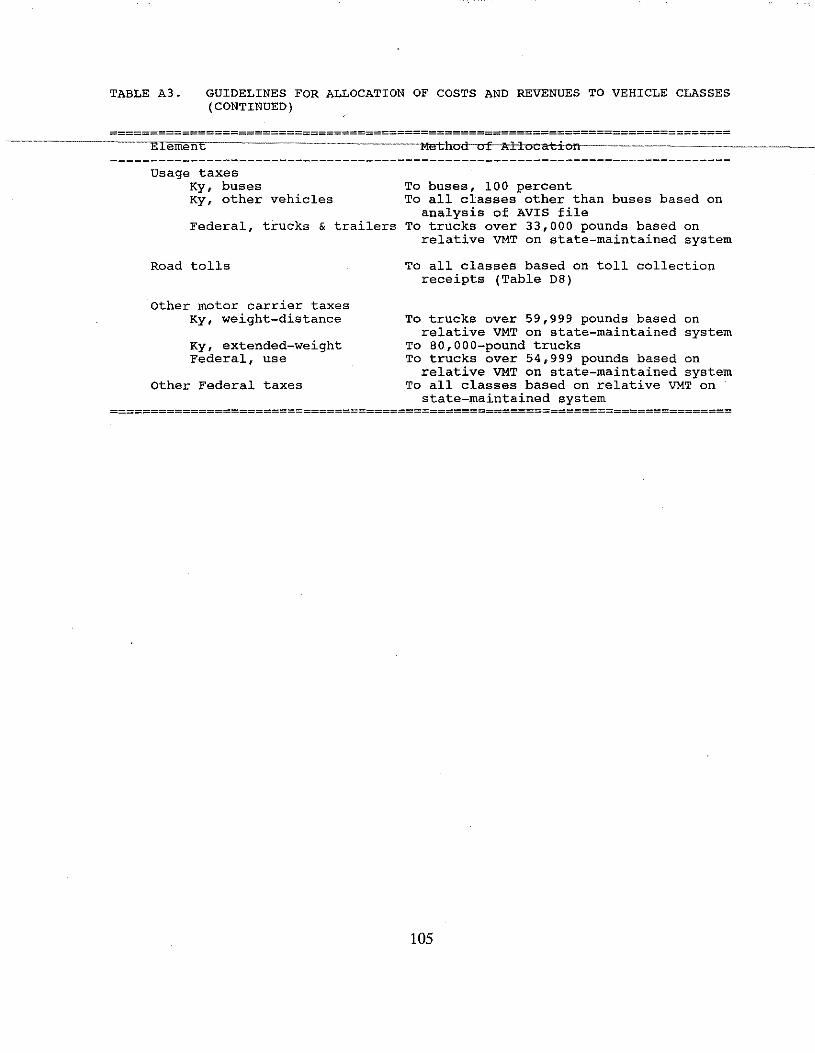
TABLE A3. GUIDELINES FOR ALLOCATION OF COSTS AND REVENUES TO VEHICLE CLASSES (CONTINUED)
==============================================================================
Usage taxes Ky, buses Ky, other vehicles
Federal, trucks & trailers
Road tolls
Other motor carrier taxes Ky, weight-distance
Ky, extended-weight Federal, use
Other Federal taxes
To buses, 100 percent To all classes other than buses based on
analysis of AVIS file To trucks over 33,000 pounds based on
relative VMT on state-maintained system
To all classes based on toll collection receipts (Table DB)
To trucks over 59,999 pounds based on relative VMT on state-maintained system
To 80,000-pound trucks To trucks over 54,999 pounds based on
relative VMT on state-maintained system To all classes based on relative VMT on
state-maintained system ==============================================================================
105

106
APPENDIX B
IDENTIFICATION OF COST AND REVENUE ELEMENTS
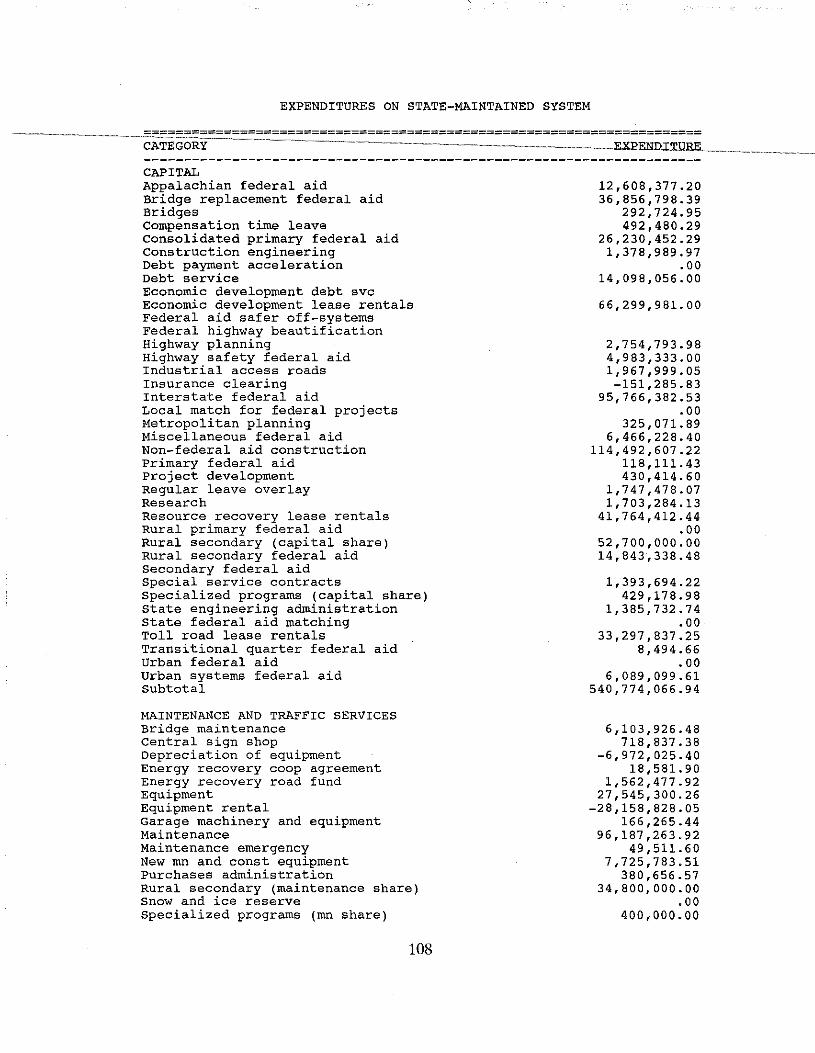
EXPENDITURES ON STATE-MAINTAINED SYSTEM
CAPITAL Appalachian federal aid Bridge replacement federal aid Bridges Compensation time leave Consolidated primary federal aid Construction engineering Debt payment acceleration Debt service Economic development debt svc Economic development lease rentals Federal aid safer off-systems Federal highway beautification Highway planning Highway safety federal aid Industrial access roads Insurance clearing Interstate federal aid Local match for federal projects Metropolitan planning Miscellaneous federal aid Non-federal aid construction Primary federal aid Project development Regular leave overlay Research Resource recovery lease rentals Rural primary federal aid Rural secondary (capital share) Rural secondary federal aid Secondary federal aid Special service contracts Specialized programs (capital share) state engineering administration State federal aid matching Toll road lease rentals Transitional quarter federal aid Urban federal aid Urban systems federal aid Subtotal
MAINTENANCE AND TRAFFIC SERVICES Bridge maintenance central sign shop Depreciation of equipment Energy recovery coop agreement Energy recovery road fund Equipment Equipment rental Garage machinery and equipment Maintenance Maintenance emergency New ron and const equipment Purchases administration Rural secondary (maintenance share) Snow and ice reserve Specialized programs (mn share)
108
12,608,377.20 36,856,798.39
292,724.95 492,480.29
26,230,452.29 1,378,989.97
.00 14,098,056.00
66,299,981.00
2,754,793.98 4,983,333.00 1,967,999.05 -151,285.83
95,766,382.53 .oo
325' 071.89 6,466,228.40
114,492,607.22 118,111.43 430,414.60
1,747,478.07 1,703,284.13
41,764,412.44 .00
52,700,000.00 14,843,338.48
1,393,694.22 429,178.98
1,385,732.74 .oo
33,297,837.25 8,494.66
.oo 6,089,099.61
540 '774' 066.94
6,103,926.48 718,837.38
-6,972,025.40 18' 581.90
1,562,477.92 27,545,300.26
-28,158,828.05 166,265.44
96,187,263.92 49,511.60
7,725,783.51 380,656.57
34,800,000.00 .00
400,000.00
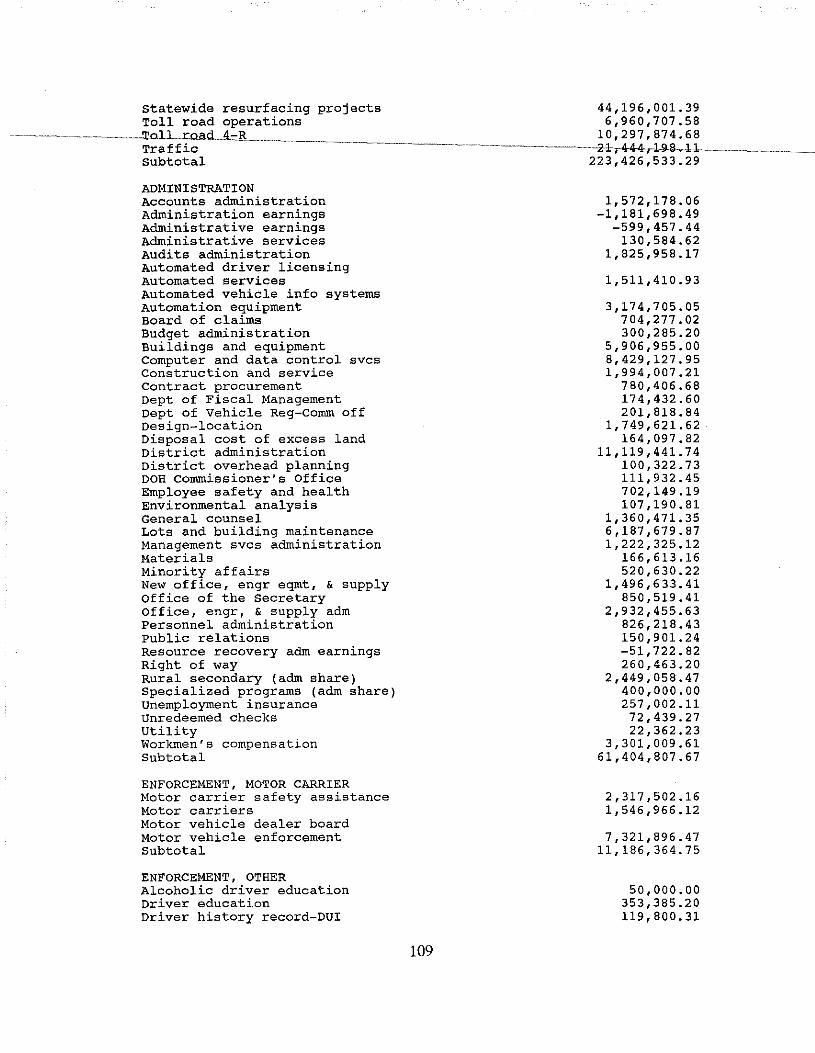
Statewide resurfacing projects 44,196,001.39 Toll road operations 6,960,707.58
------------------------ ---------Tal.Lroad_ __ 4=::R_____ 1 0 , 2 9 7 , 8 7 4 • 6 8 Traffic ------~------~----~--------------------------------------------2-l-,-444-,-1~8~-ll-----------------------
Subtotal 223,426,533.29
ADMINISTRATION Accounts administration Administration earnings Administrative earnings Administrative services Audits administration Automated driver licensing Automated services Automated vehicle info systems Automation equipment Board of claims Budget administration Buildings and equipment Computer and data control aves Construction and service Contract procurement Dept of Fiscal Management Dept of Vehicle Reg-Comm off Design-location Disposal cost of excess land District administration District overhead planning DOH Commissioner's Office Employee safety and health Environmental analysis General counsel Lots and building maintenance Management svcs administration Materials Minority affairs New office, engr eqmt, & supply Office of the Secretary Office, engr, & supply adm Personnel administration Public relations Resource recovery adm earnings Right of way Rural secondary (adm share) Specialized programs (adm share) unemployment insurance Unredeemed checks Utility Workmen's compensation Subtotal
ENFORCEMENT, MOTOR CARRIER Motor carrier safety assistance Motor carriers Motor vehicle dealer board Motor vehicle enforcement subtotal
ENFORCEMENT, OTHER Alcoholic driver education Driver education Driver history record-DUI
109
1,572,178.06 -1,181,698.49
-599,457.44 130,584.62
1,825,958.17
1,511,410.93
3,174,705.05 704,277.02 300,285.20
5,906,955.00 8,429,127.95 1,994,007.21
780,406.68 174,432.60 201,818.84
1, 749,621.62 164,097.82
11,119,441.74 100,322.73 111,932.45 702,149.19 107,190.81
1,360,471.35 6,187,679.87 1,222,325.12
166,613.16 520,630.22
1,496,633.41 850,519.41
2,932,455.63 826,218.43 150,901.24 -51,722.82 260,463.20
2,449,058.47 400,000.00 257 '002 .11 72,439.27 22,362.23
3,301,009.61 61,404,807.67
2,317,502.16 1,546,966.12
7,321,896.47 11,186,364.75
50,000.00 353,385.20 119,800.31
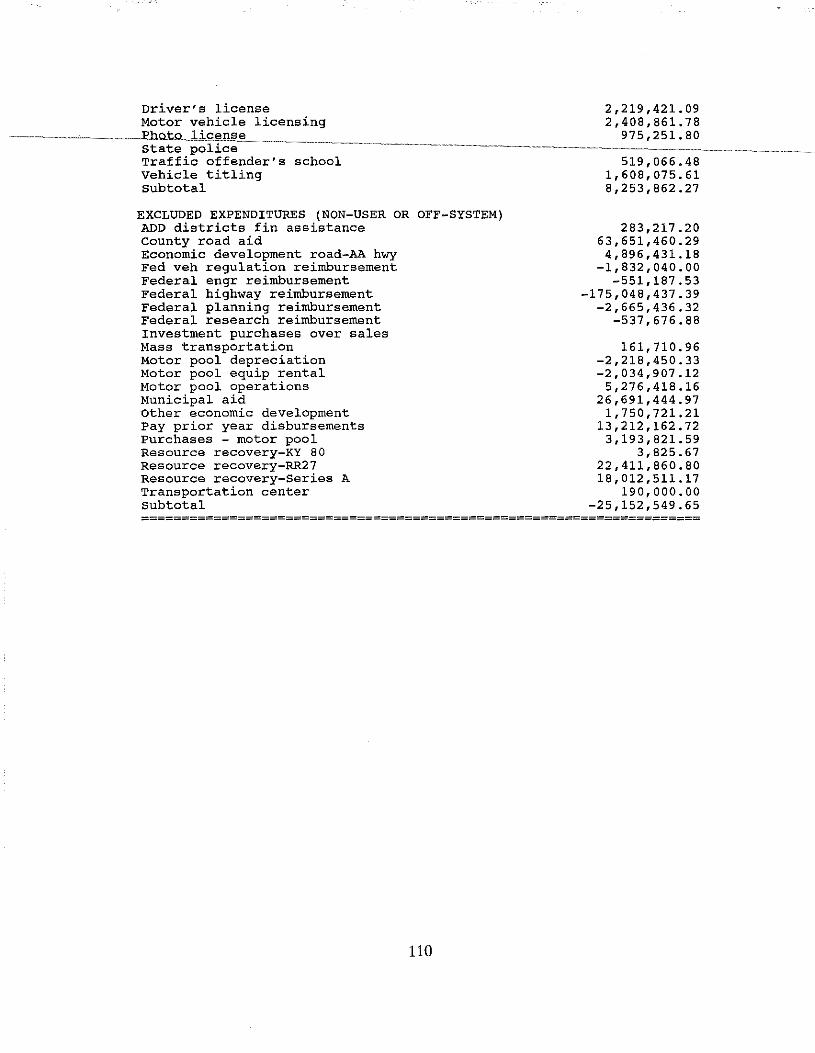
Driver's license Motor vehicle licensing
state Traffic offender's school Vehicle titling subtotal
EXCLUDED EXPENDITURES (NON-USER OR OFF-SYSTEM) ADD districts fin assistance county road aid Economic development road-AA hwy Fed veh regulation reimbursement Federal engr reimbursement Federal highway reimbursement Federal planning reimbursement Federal research reimbursement Investment purchases over sales Mass transportation Motor pool depreciation Motor pool equip rental Motor pool operations Municipal aid Other economic development Pay prior year disbursements Purchases - motor pool Resource recovery-KY 80 Resource recovery-RR27 Resource recovery-Series A Transportation center subtotal
2,219,421.09 2,408,861. 78
97 5' 251.80
519,066.48 1,608,075.61 8,253,862.27
283,217.20 63,651,460.29 4' 896' 431.18
-1,832,040.00 -551,187.53
-175,048,437.39 -2,665,436.32
-537,676.88
161,710.96 -2,218,450.33 -2,034,907.12
5,276,418.16 26,691,444.97
1,750,721.21 13,212,162.72
3,193,821.59 3,825.67
22,411,860.80 18' 012' 511.17
190,000.00 -25,152,549.65
======================================================================
110
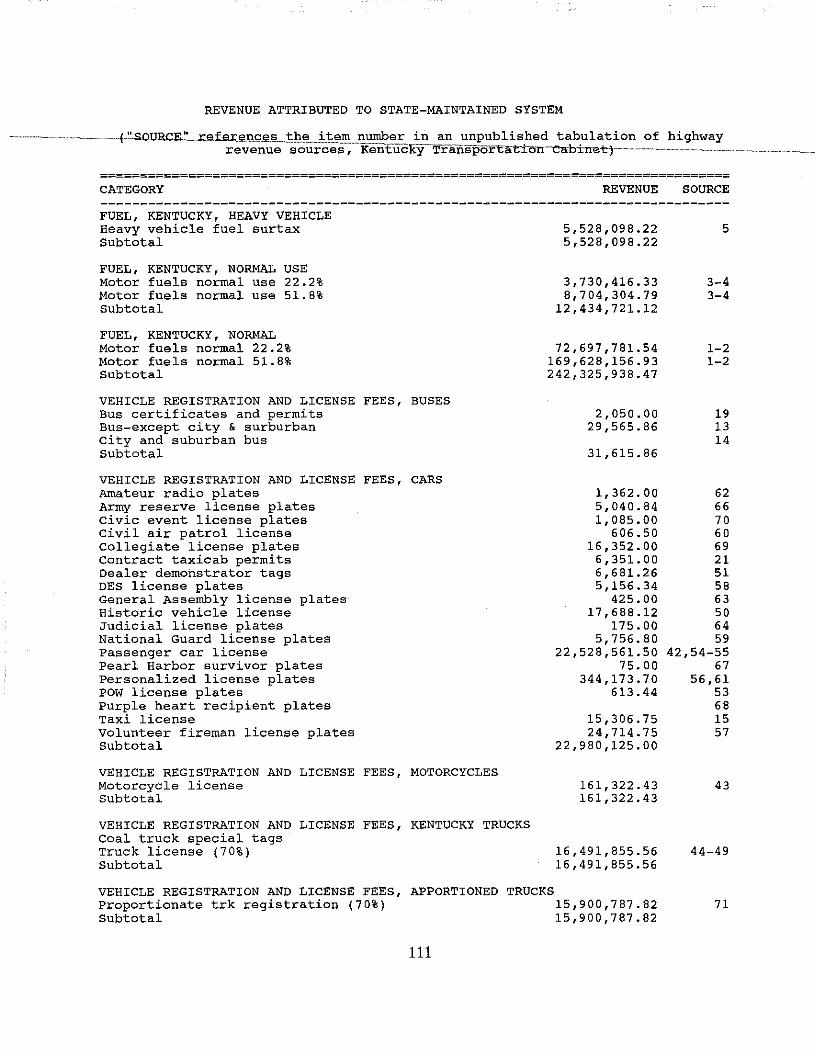
REVENUE ATTRIBUTED TO STATE-MAINTAINED SYSTEM
~--------~-----~.0~~-.rei.e.rences the _iteE'\_p.urnber in an unpublished tabulation of highway revenue sources , K9:ritUCK.y-TrEliis port:artcm:·-cab±:rret-)··------------------------
=============================================================================== CATEGORY
FUEL, KENTUCKY, HEAVY VEHICLE Heavy vehicle fuel surtax Subtotal
FUEL, KENTUCKY, NORMAL USE Motor fuels normal use 22.2% Motor fuels normal use 51.8% Subtotal
FUEL, KENTUCKY, NORMAL Motor fuels normal 22.2% Motor fuels normal 51.8% Subtotal
VEHICLE REGISTRATION AND LICENSE FEES, BUSES Bus certificates and permits Bus-except city & surburban city and suburban bus subtotal
VEHICLE REGISTRATION AND LICENSE FEES, CARS Amateur radio plates Army reserve license plates civic event license plates civil air patrol license Collegiate license plates Contract taxicab permits Dealer demonstrator tags DES license plates General Assembly license plates Historic vehicle license Judicial license plates National Guard license plates Passenger car license Pearl Harbor survivor plates Personalized license plates POW license plates Purple heart recipient plates Taxi license Volunteer fireman license plates Subtotal
VEHICLE REGISTRATION AND LICENSE FEES, MOTORCYCLES Motorcycle license Subtotal
REVENUE
5,528,098.22 5,528,098.22
3,730,416.33 8,704,304.79
12,434,721.12
72,697' 781.54 169,628,156.93 242,325,938.47
2,050.00 29,565.86
31,615.86
1,362.00 5,040.84 1,085.00
606.50 16,352.00
6,351.00 6,681.26 5,156.34
425.00 17,688.12
175.00 5,756.80
22,528,561.50 75.00
344,173.70 613.44
15,306.75 24,714.75
22,980,125.00
161,322.43 161,322.43
VEHICLE REGISTRATION AND LICENSE FEES, KENTUCKY TRUCKS Coal truck special tags Truck license (70%) Subtotal
VEHICLE REGISTRATION AND LICENSE FEES, APPORTIONED Proportionate trk registration (70%) Subtotal
111
16,491,855.56 16,491,855.56
TRUCKS 15,900,787.82 15,900,787.82
SOURCE
5
3-4 3-4
1-2 1-2
19 13 14
62 66 70 60 69 21 51 58 63 50 64 59
42,54-55 67
56,61 53 68 15 57
43
44-49
71
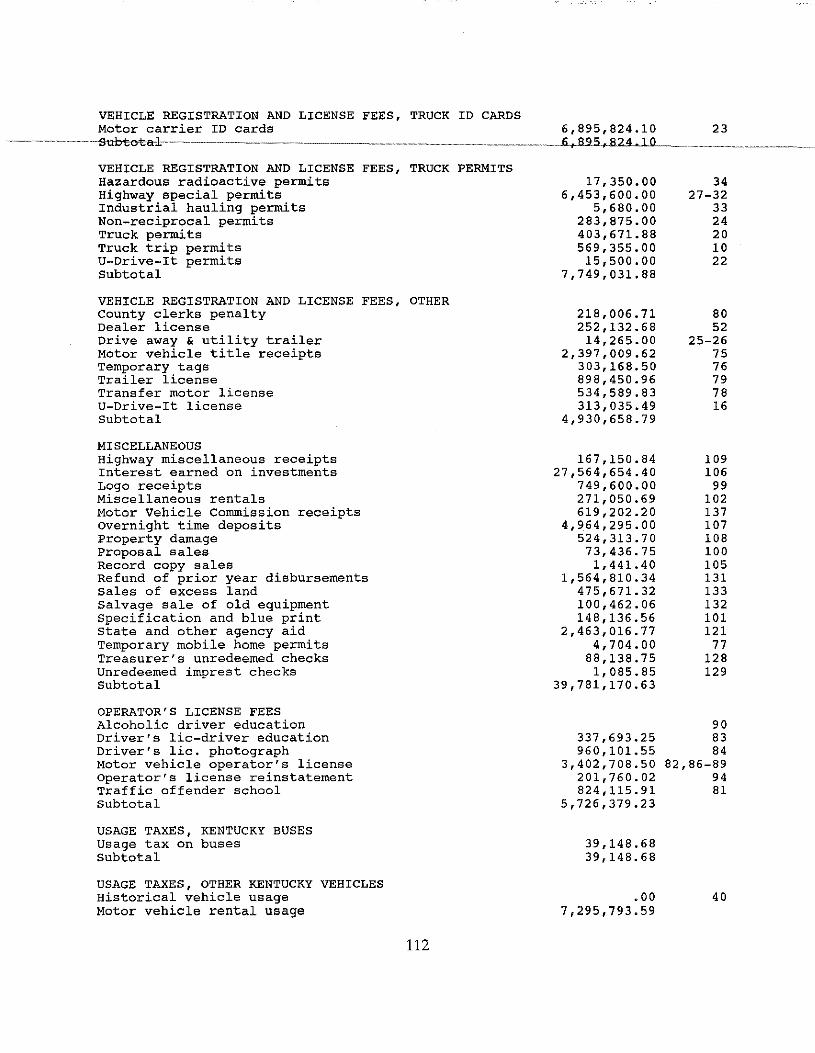
VEHICLE REGISTRATION AND LICENSE FEES, TRUCK ID CARDS Motor carrier ID cards
VEHICLE REGISTRATION AND LICENSE FEES, TRUCK PERMITS Hazardous radioactive permits Highway special permits Industrial hauling permits Non-reciprocal permits Truck permits Truck trip permits U-Drive-It permits Subtotal
VEHICLE REGISTRATION AND LICENSE FEES, OTHER County clerks penalty Dealer license Drive away & utility trailer Motor vehicle title receipts Temporary tags Trailer license Transfer motor license U-Drive-It license subtotal
MISCELLANEOUS Highway miscellaneous receipts Interest earned on investments Logo receipts Miscellaneous rentals Motbr Vehicle Commission receipts overnight time deposits Property damage Proposal sales Record copy sales Refund of prior year disbursements sales of excess land Salvage sale of old equipment Specification and blue print state and other agency aid Temporary mobile home permits Treasurer's unredeemed checks Unredeemed imprest checks Subtotal
OPERATOR'S LICENSE FEES Alcoholic driver education Driver's lie-driver education Driver's lie. photograph Motor vehicle operator's license Operator's license reinstatement Traffic offender school subtotal
USAGE TAXES, KENTUCKY BUSES Usage tax on buses Subtotal
USAGE TAXES, OTHER KENTUCKY VEHICLES Historical vehicle usage Motor vehicle rental usage
112
6,895,824.10
17,350.00 6,453,600.00
5,680.00 283,875.00 403,671.88 569,355.00
15,500.00 7,749,031.88
218,006.71 252,132.68
14,265.00 2,397,009.62
303,168.50 898,450.96 534,589.83 313,035.49
4,930,658.79
167,150.84 27,564,654.40
749,600.00 271,050.69 619,202.20
4,964,295.00 524,313.70 73,436.75 1,441.40
1,564,810.34 475,671.32 100,462.06 148' 136.56
2,463,016.77 4,704.00
88,138.75 1,085.85
39,781,170.63
337,693.25 960' 101.55
3,402,708.50 201,760.02 824,115.91
5,726,379.23
39,148.68 39,148.68
.00 7,295,793.59
23
34 27-32
33 24 20 10 22
80 52
25-26 75 76 79 78 16
109 106
99 102 137 107 108 100 105 131 133 132 101 121
77 128 129
90 83 84
82,86-89 94 81
40
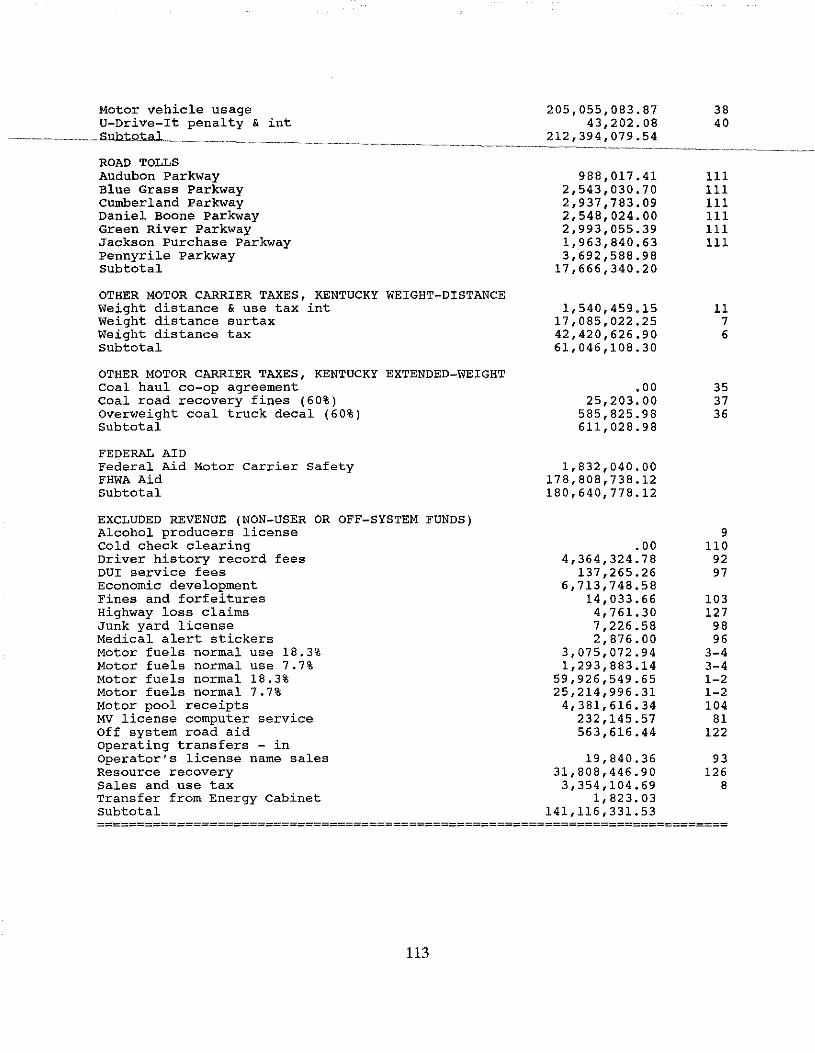
Motor vehicle usage U-Drive-It penalty & int
ROAD TOLLS Audubon Parkway Blue Grass Parkway Cumberland Parkway Daniel Boone Parkway Green River Parkway Jackson Purchase Parkway Pennyrile Parkway Subtotal
OTHER MOTOR CARRIER TAXES, KENTUCKY WEIGHT-DISTANCE Weight distance & use tax int Weight distance surtax Weight distance tax Subtotal
OTHER MOTOR CARRIER TAXES, KENTUCKY EXTENDED-WEIGHT Coal haul co-op agreement coal road recovery fines (60%) Overweight coal truck decal (60%) subtotal
FEDERAL AID Federal Aid Motor Carrier Safety FHWA Aid Subtotal
EXCLUDED REVENUE (NON-USER OR OFF-SYSTEM FUNDS) Alcohol producers license Cold check clearing Driver history record fees DUI service fees Economic development Fines and forfeitures Highway loss claims Junk yard license Medical alert stickers Motor fuels normal use 18.3% Motor fuels normal use 7.7% Motor fuels normal 18.3% Motor fuels normal 7.7% Motor pool receipts MV license computer service Off system road aid Operating transfers - in Operator's license name sales Resource recovery Sales and use tax Transfer from Energy Cabinet Subtotal
205,055,083.87 43,202.08
212,394,079.54
988' 017.41 2,543,030.70 2,937,783.09 2,548,024.00 2,993,055.39 1,963,840.63 3,692,588.98
17,666,340.20
1,540,459.15 17,085,022.25 42,420,626.90 61,046,108.30
.oo 25,203.00
585,825.98 611,028.98
1,832,040.00 178,808,738.12 180,640,778.12
.00 4,364,324.78
137,265.26 6,713,748.58
14,033.66 4,761.30 7,226.58 2,876.00
3,075,072.94 1,293,883.14
59,926,549.65 25,214,996.31
4,381,616.34 232,145.57 563,616.44
19,840.36 31,808,446.90
3,354,104.69 1,823.03
141,116,331.53
38 40
111 111 111 111 111 111
11 7 6
35 37 36
9 110
92 97
103 127
98 96
3-4 3-4 1-2 1-2 104
81 122
93 126
8
===============================================================================
113
114
APPENDIX C
FY 1991 COST ALLOCATION TABLES

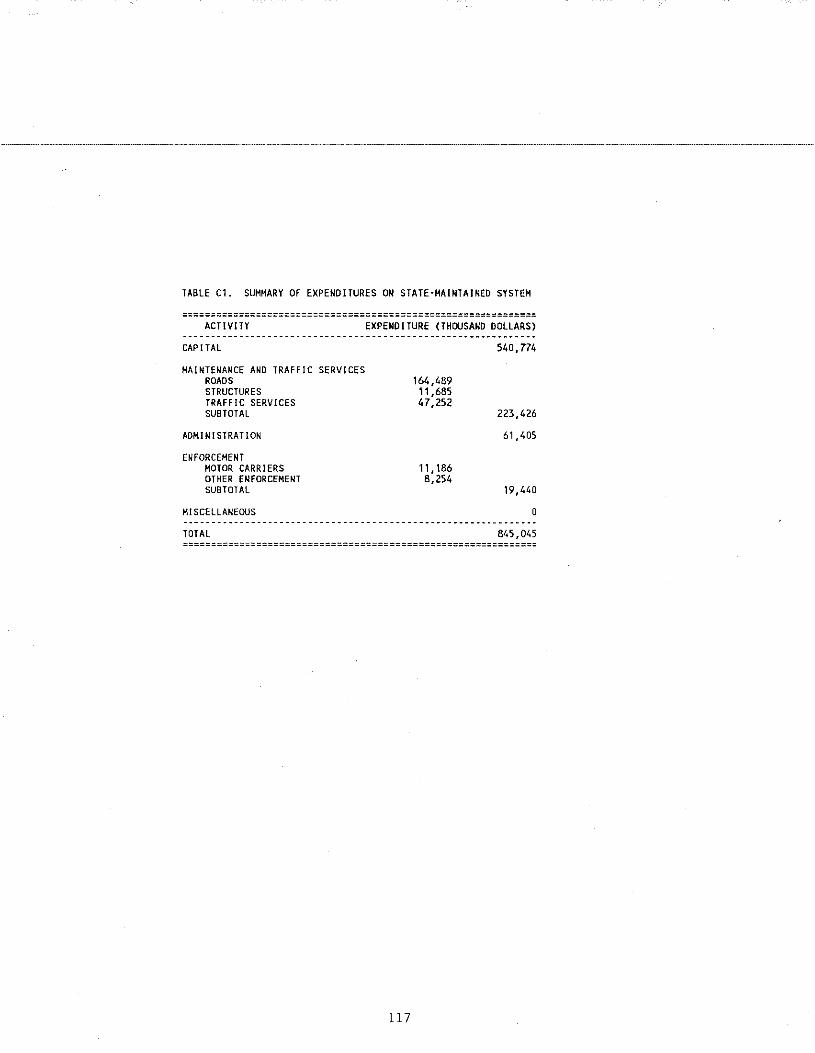
TABLE C1. SUMMARY Of EXPENDITURES ON STATE-MAINTAINED SYSTEM
============================================================== ACTIVITY EXPENDITURE (THOUSAND DOLLARS)
CAPlTAL 540,774
MAl NTENANCE AND TRAFFIC SERVICES ROADS 164,489 STRUCTURES 11,685 TRAFFIC SERVICES 47,252 SUBTOTAL 223,426
ADMINISTRATION 61,405
ENFORCEMENT MOTOR CARRIERS 11,186 OTHER ENFORCEMENT 8,254 SUBTOTAL 19,440
MISCELLANEOUS 0
TOTAL 845,045 ==============================================================
117
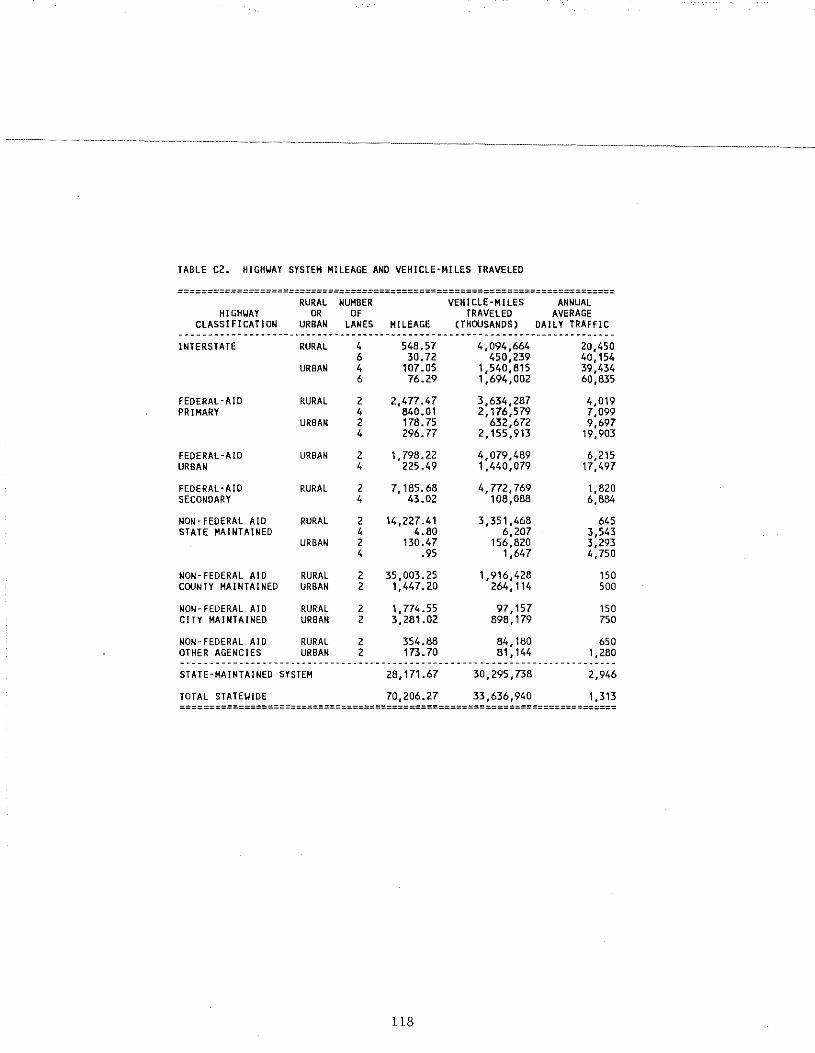
TABLE C2. HIGHUAY SYSTEM MILEAGE AND VEHICLE·HILES TRAVELED
============================================================================ RURAL NUMBER VEHICLE·MILES ANNUAL
HIGHUAY OR OF TRAVELED AVERAGE CLASSIFICATION URBAN LANES HI LEAGE (THOUSANDS) DAILY TRAFFIC
----------------------------------------------------------------------------INTERSTATE RURAL 4 548.57 4,094,664 20,450
6 30.72 450,239 40,154 URBAN 4 107 .OS 1,540,815 39,434
6 76.29 1,694,002 60,835
FEDERAL-AID RURAL 2 2,477.47 3,634,287 4,019 PRIMARY 4 840.01 2,176,579 7,099
URBAN 2 178.75 632,672 9,697 4 296.77 2,155,913 19,903
FEDERAL-A lD URBAN 2 1,798.22 4,079,489 6,215 URBAN 4 225.49 1,440,079 17,497
FEDERAL-AID RURAL 2 7,185.68 4, 772,769 1,820 SECONDARY 4 43.02 108,088 6,884
NON-FEDERAL AID RURAL 2 14,227.41 3,351,468 645 STATE MAINTAINED 4 4.80 6,207 3,543
URBAN 2 130.47 156,820 3,293 4 .95 1,647 4,750
NON-FEDERAL AID RURAL 2 35,003.25 1,916,428 150 COUNTY MAINTAINED URBAN 2 1,447.20 264,114 500
NON-FEDERAL AID RURAL 2 1,774.55 97,157 150 CITY MAINTAINED URBAN 2 3,281.02 898,179 750
NON- FEDERAL AID RURAL 2 354.88 84,180 650 OTHER AGENCIES URBAN 2 173.70 81.144 1,280 ----------------------------------------------------------------------------STATE-MAINTAINED SYSTEM 28,171.67 30,295,738 2,946
TOTAL STATEUIDE 70,206.27 33,636,940 1,313 ============================================================================
118
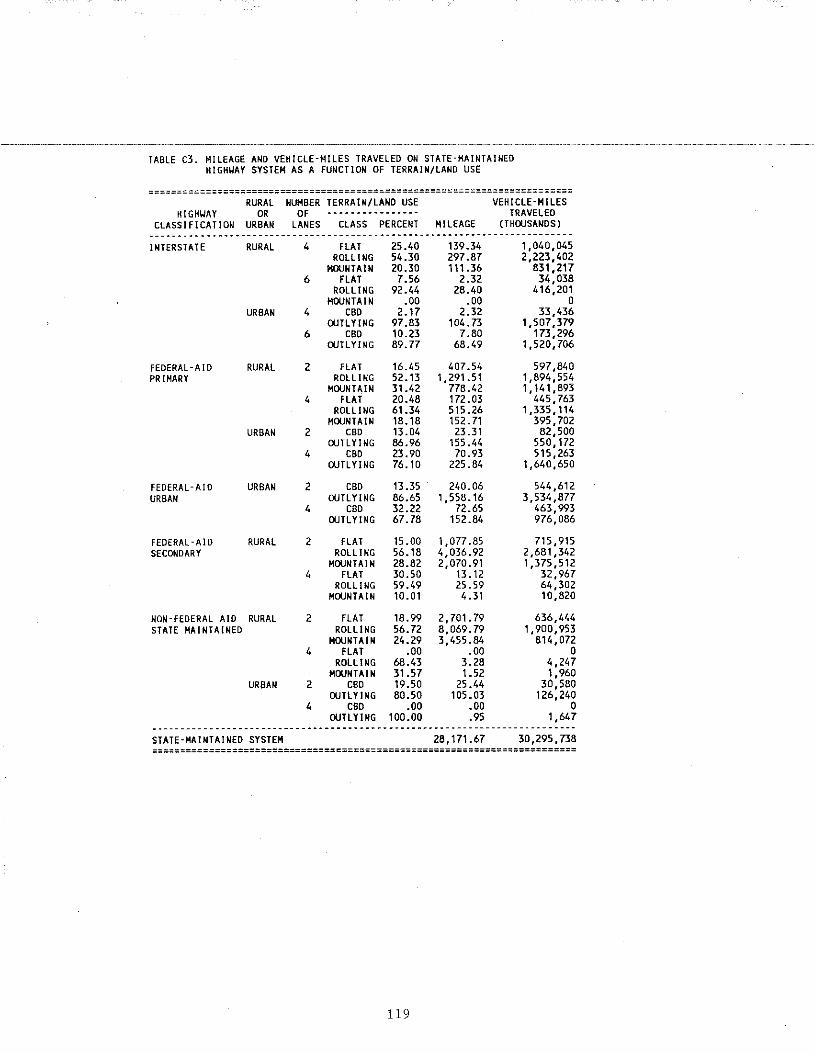
TABLE C3. MILEAGE AND VEHICLE-MILES TRAVELED ON STATE·MAINTAINED HlGH~AY SYSTEM AS A FUNCTION OF TERRAIN/LAND USE
========================================================================== RURAL NUMBER TERRAIN/LAND USE
HIGH~AY OR OF ·----··-·--··-·-CLASSIFICATION URBAN LANES CLASS PERCENT MILEAGE
INTERSTATE
FEDERAL-AID PRIMARY
FEDERAL-AID URBAN
FEDERAL-AID SECONDARY
RURAL
URBAN
RURAL
URBAN
URBAN
RURAL
NON-FEDERAL AID RURAL STAlE MAINTAINED
URBAN
STATE-MAINTAINED SYSTEM
4 FLAT ROLLING
MOUNTAIN 6 FLAT
ROLL I NG MOUNTAIN
4 CBD OUTLYING
6 CBD OJTL YING
2 FLAT ROLLING
MOUNTAIN 4 FLAT
ROLLING MOUNTAIN
2 CBD OUTLYING
4 CBD OJTLYING
2 CBD OUTLYING
4 CBD OUTLYING
2 FLAT ROLLING
MOUNTAIN 4 FLAT
2
4
2
4
ROlliNG MOUNTAIN
FLAT ROLLING
MOUNTAIN FLAT
ROLLING MOUNTAIN
CBD OUTLYING
CBD OUTLYING
25.4D 54.30 20.30 7.56
92.44 .00
2.17 97.83 10.23 89.77
16.45 52.13 31.42 20.48 61.34 18.18 13.D4 86.96 23.90 76.10
13.35 86.65 32.22 67.78
15.00 56.18 28.82 30.50 59.49 10.01
18.99 56.72 24.29
.00 68.43 31.57 19.50 80.50
.00 100.00
139.34 297.87 111.36
2.32 28.40
.DO 2.32
104.73 7.80
68.49
407.54 1,291.51
778.42 172.03 515.26 152. 71
23.31 155.44 70.93
225.84
240.06 1,558.16
72.65 152.84
1,077.85 4,036.92 2,070.91
13.12 25.59 4.31
2,701. 79 8,069.79 3,455.84
.00 3.28 1.52
25.44 105.03
.oo
.95
28,171.67
VEHICLE·HILES TRAVELED
(THOUSANDS)
1,040,045 2,223,402
831,217 34,038
416,201 0
33,436 1,507,379
173,296 1,520,706
597,840 1,894,554 1,141,893
445,763 1,335,114
395,702 82,500
550,172 515,263
1,640,650
544,612 3,534,877
463,993 976,086
715,915 2,681,342 1,375,512
32,967 64,302 10,820
636,444 1,900,953
814,072 0
4,247 1,960
30,580 126,240
0 1,647
30,295,738 ==========================================================================
119
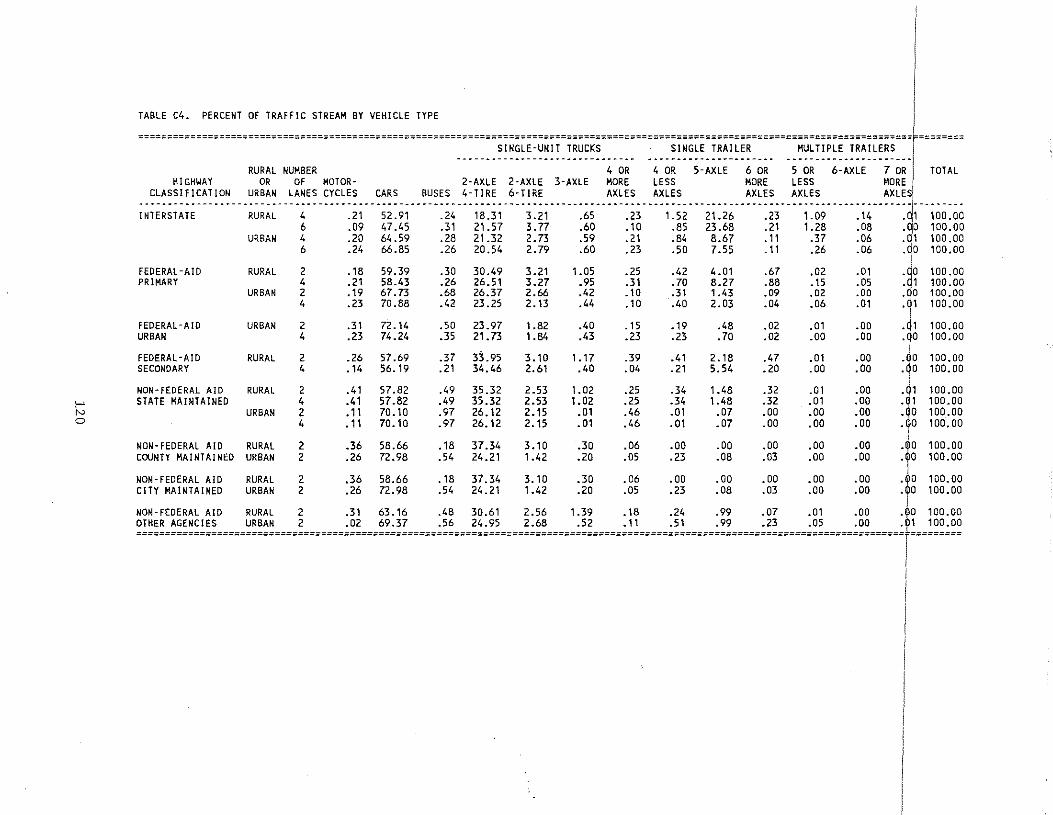
>-' N 0
TABLE C4. PERCENT OF TRAFFIC STREAM BY VEHICLE TYPE
======================================================================================================================================~======== SINGLE-UNIT TRUCKS SINGLE TRAILER MULTIPLE TRAILERS
-----···-·--------------------- --------------------·- -·--·-----------------RURAL NUMBER 4 OR 4 OR 5-AXLE 6 OR 5 OR 6-AXLE 7 OR TOTAL
HIGHWAY OR OF MOTOR- 2-AXLE 2-AXLE 3-AXLE MORE LESS MORE lESS MORE ClASSIFICATION URBAN lANES CYCLES CARS BUSES 4-TIRE 6-TIRE AXLES AXLES AXLES AXLES AXLE
INTERSTATE
FEDERAL-AID PRIMARY
FEDERAL-AID URBAN
FEDERAL-AID SECONDARY
NON-FEDERAL AID STATE MAINTAINED
RURAL
URBAN
RURAL
URBAN
URBAN
RURAL
RURAL
URBAN
4 6 4 6
2 4 2 4
2 4
.21 52.91
.09 47.45
.20 64.59
.24 66.85
.18
.21
.19
.23
.31
.23
59.39 58.43 67.73 70.88
72.14 74.24
.24 18.31
.31 21.57
.28 21.32
.26 20.54
.30
.26
.68
.42
.50
.35
30.49 26.51 26.37 23.25
23.97 21.73
3.21 3.77 2. 73 2.79
3.21 3.27 2.66 2.13
1.82 1.84
.65
.60
.59
.60
1.05 .95 .42 .44
.40
.43
.23
. 10
. 21
.23
.25
.31
. 10
.10
.15
.23
1.52 21.26 .85 23.68 .84 8.67 .so 7.55
.42
. 70
.31
.40
.19
.23
4.01 8.27 1.43 2.03
.48
.70
.23
.21
. 11
. 11
.67
.88
.09
.04
.02
.02
1.09 1.28
.37
.26
.02
.15
.D2
.06
.01
.00
. 14
.08
.06
.D6
.01
.05
.00
.01
.00
.OD
1 100.00 ;o 1oo.oo 1 100.00 0 100.00
0 100.00 1 100.00 0 100.00
.u1 100.00
_J, 100.00 .QO 100.00
I
2 .26 57.69 .37 33.95 3.10 1.17 .39 .41 2.18 .47 .01 .00 .QO 100.00 4 .14 56.19 .21 34.46 2.61 .40 .o4 .21 5.54 .20 .oo .oo .qo 10o.oo
2 .41 57.82 .49 35.32 2.53 1.02 .25 .34 1.48 .32 .01 .00 -~1 100.00 4 .41 57.82 .49 35.32 2.53 1.02 .25 .34 1.48 .32 .01 .00 .01 100.00 2 .11 70.10 .97 26.12 2.15 .01 .46 .01 .07 .00 .00 .00 -~0 100.00 4 .11 1o.1o .97 26.12 2.15 .01 .46 .01 .07 .oo .oo .oo • io 1oo.oo
NON-FEDERAl AID RURAL 2 .36 58.66 .18 37.34 3.10 .30 .06 .00 .DO .00 .00 .00 .~0 100.DO COUNTY MAINTAINED URBAN 2 .26 72.98 .54 24.21 1.42 .20 .05 .23 .08 .03 .00 .00 .~0 100.00
NON-FEDERAl AID RURAL 2 .36 58.66 .18 37.34 3.10 .30 .06 .00 .00 .00 .00 .00 -~D 1DO.OO CITY MAINTAINED URBAN 2 .26 72.98 .54 24.21 1.42 .20 .D5 .23 .08 .03 .00 .OD • D 100.0D
NON-FEDERAL AID RURAL 2 .31 63.16 .48 30.61 2.56 1.39 .18 .24 .99 .07 .D1 .00 . 0 100.00 OTHER AGENCIES URBAN 2 .02 69.37 .56 24.95 2.68 .52 .11 .51 .99 .23 .DS .00 . 1 100.00 =====================================================================================================================================r=========
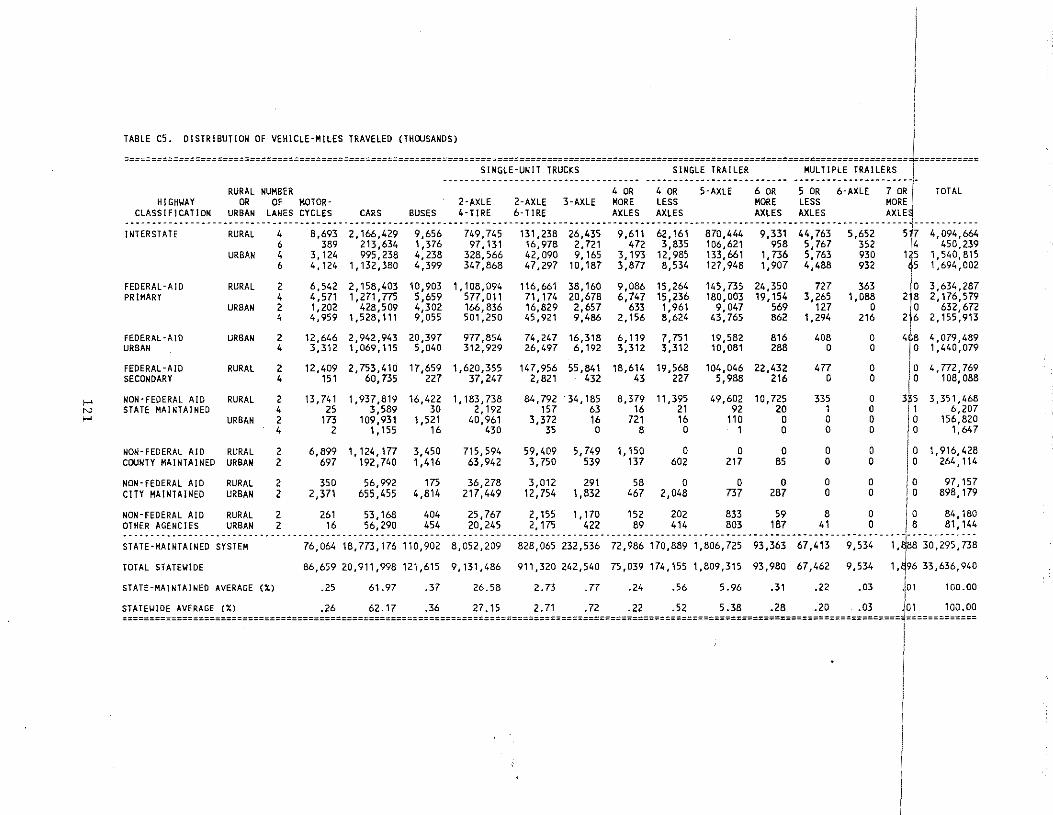
I TABLE c5. OlSTRIBUTIOH OF VEHlCLE·HILES TRAVELED {THOUSANDS) t ===============================================================================================================================================--===========
SINGLE·UNIT TRUCKS SINGLE TRAILER MULTIPLE TRAILERS ------------------------------------ -------------------------- -----------------------
RURAL NUMBER 4 OR 4 OR 5-AXLE 6 OR 5 OR 6-AXLE 7 OR~ TOTAL HIGH'oo'AY OR OF MOTOR- . 2-AXLE 2-AXLE 3-AXLE MORE LESS MORE LESS MORE
CLASSIFICATION URBAN LANES CYCLES CARS BUSES 4-TIRE 6-TIRE AXLES AXLES AXLES AXLES AXLE ----------------------------------------------------------------------------------------------------------------------------------------------- ------------INTERSTATE RURAL 4 8,693 2,166,429 9,656 749,745 131,238 26,435 9,611 62,161 87a,444 9,331 44,763 5,652 57 4,a94,664
6 389 213,634 1,376 97,131 16,978 2,721 472 3,835 106,621 958 5,767 352 14 45a,239 URBAN 4 3,124 995,238 4,238 328,566 42,a9a 9,165 3,193 12,985 133,661 1,736 5,763 93a 125 1,54a,815
6 4,124 1, 132,3Ba 4,399 347,868 47,297 1a, 187 3,877 8,534 127,948 1,9a7 4,488 932 45 1,694,aa2
FEDERAL ·A I D RURAL 2 6,542 2,158,403 1a,9a3 1, 1aa,a94 116,661 38, 16a 9,086 15,264 145,735 24,35a 727 363 a 3,634,287 PRIMARY 4 4,571 1,211,m 5,659 577,a11 71.174 2a,678 6,747 15,236 18a,aa3 19,154 3,265 1,088 2 8 2,176,579
URBAN 2 1,202 428,5a9 4,302 166,836 16,829 2,657 633 1,961 9,a47 569 127 0 a 632,672 4 4,959 1,528,111 9,a55 501,250 45,921 9,486 2,156 8,624 43,765 862 1,294 216 2 6 2,155,913
FEDERAL-AID 2 12,646 2,942,943 20,397 977,854 16,318 I
URBAN 74,247 6,119 7,751 19,582 816 408 0 408 4,079,489 URBAN 4 3,312 1,069,115 5,a40 312,929 26,497 6,192 3,312 3,312 10,081 288 0 a Ia 1,44a,o79
I FEDERAL-A 10 RURAL 2 12,4a9 2,753,41a 17,659 1,620,355 147,956 55.841 18,614 19,568 1a4,046 22,432 477 0 Ia 4, 772,769 SECONDARY 4 151 6a,735 227 37,247 2,821 432 43 227 5,988 216 a a
3~: 1a8,a8B
f-' NON-FEDERAL AID RURAL 2 13,741 1,937,819 16,422 1,183,738 84,792 34,185 8,379 11,395 49,6a2 10,725 335 a 3,351,468 N STATE MAINTAINED 4 25 3,589 3a 2,192 157 63 16 21 92 2a 1 a I 1 6,207 f-' URBAN 2 173 1a9,931 1 1521 4a,961 3,372 16 721 16 1 1 a a a a Ia 156,a2a
4 2 1, 155 16 430 35 a 8 a 1 a a 0 Ia 1,647 I
NON-FEDERAL AID RURAL 2 6,899 1, 124,177 3,45a 715,594 59,4a9 5,749 1, 15a a a a a a I~ 1, 916,428 COUNTY MAINTAINED URBAN 2 697 192,74a 1,416 63,942 3, 75a 539 137 6a2 217 85 a a 264,114
I I
NON-FEDERAL AID RURAL 2 350 56,992 175 36,278 3,012 291 58 a a a a a Ia 97,157 CITY MAINTAINED URBAN 2 2,371 655,455 4,814 217,449 12,754 1,832 467 2,048 737 287 0 a
Ja 898,179
NON-FEDERAL AID RURAL 2 261 53,168 4a4 25' 767 2,155 1' 170 152 2a2 833 59 8 D Ia 84,180 OTHER AGENCIES URBAN 2 16 56, 29a 454 2a,245 2, 175 422 89 414 803 187 41 0 )8 81, 144 . ---.--.-.- .. ----.---. ----.------.---------.----- ... -- .. --- .. ---------.--.------.-----------------------.-----.-- .. --------.-------.------.----:---------.--. STATE·HAINTAINEO SYSTEM 76,064 18,773,176 11a,902 8,052,209 82B,a65 232,536 72,986 170,889 1,8a6,725 93,363 67,413 9,534 1,jaa 3a,295,738
TOTAL STATEWIDE 86,659 20,911,998 121,615 9,131,486 911,32a 242,54a 75,a39 174,155 1,Ba9,315 93,980 67,462 9,534 1, 96 33,636,940 I
STATE-MAiNTAINED AVERAGE (%) .25 61.97 .37 26.58 2.73 .77 .24 .56 5.96 .31 .22 .03 .~01 100.00
STATEWIDE AVERAGE(%) .26 62.17 .36 27.15 2.71 .72 .22 .52 5.38 .28 .20 .03 _101 100.00 ==============================================================================================================================================~=============
I
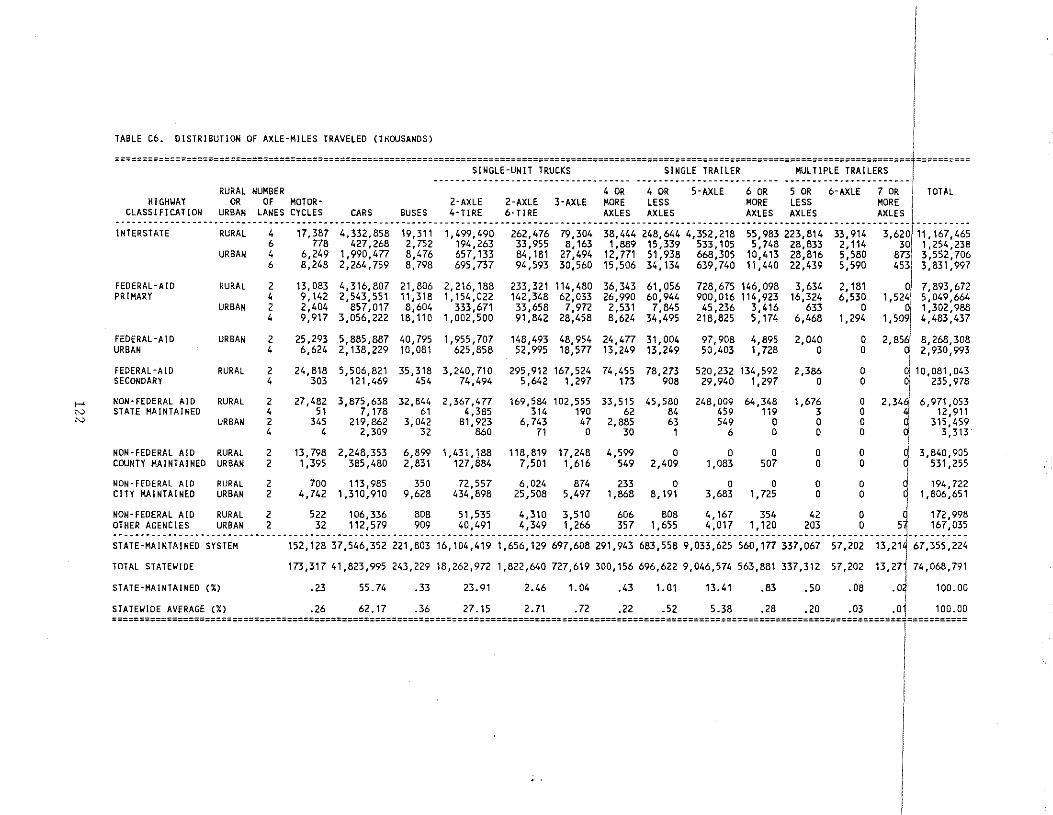
TABLE C6. DISTRIBUTION OF AXLE-MILES TRAVELED (THOUSANDS)
=================================================================================================================================================•========== SINGLE-UNIT TRUCKS SINGLE TRAILER MULTIPLE TRAILERS
------------------------------------ -------------------------- -----------------------RURAL NUMBER 4 OR 4 OR 5-AXLE 6 OR 5 OR 6-AXLE 7 OR I TOTAL
HIGHWAY OR OF MOTOR· 2-AXLE 2-AXLE 3-AXLE MORE LESS MORE LESS MORE CLASSIFICATION URBAN- LANES CYCLES CARS BUSES 4-TIRE 6-TIRE AXLES AXLES AXLES AXLES AXLES
------------------------------------------------------------------------------------------------------------------------------------------------- ----------INTERSTATE RURAL 4 17,3B7 4,332,B5B 19' 31 1 1,499,490 262,476 79,304 38,444 248,644 4,352,218 55,983 223,814 33' 914 3,620 11' 167,465
6 778 427,268 2,752 194,263 33,955 8,163 1,889 15,339 533,105 5,748 28,833 2, 114 30 1,254,238 URBAN 4 6,249 1,990,477 8,476 657,133 84,181 27,494 12,771 51,938 668,305 10,413 28,816 5,580 873 3,552,706
6 8,248 2,264, 759 B,798 695 '737 94,593 30,560 15,506 34,134 639,740 11,440 22,439 5,590 453 3,831,997
FEDERAL· AID RURAL 2 13,083 4,316,807 21,806 2,216,188 233,321 114,480 36,343 61,056 728,675 146,098 3,634 2,181 0 7,893,672 PRIMARY 4 9,142 2,543,551 11,318 1,154,022 142,348 62,033 26,990 60,944 900,016 114,923 16,324 6,530 1,524 5,049,664
URBAN 2 2,404 857,017 8,604 333,671 33,658 7,972 2,531 7,845 45,236 3,416 633 0 0 1 ,302, 988 4 9,917 3,056,222 18,110 1,002,500 91,842 28,458 8,624 34,495 218,825 5,174 6,468 1,294 1,5091 4,483,437
FEDERAL-AID URBAN 2 25,293 5,885,887 40,795 1 ,955, 707 148,493 48,954 24,477 31,004 97,908 4,895 2,040 0 2,85~ 8,268,308 URBAN 4 6,624 2, 138,229 10,081 625,858 52,995 18,577 13,249 13,249 50,403 1,728 0 0 0 2,930,993
I FEDERAL-AID RURAL 2 24,818 5,506,821 35,318 3,240,710 295,912 167,524 74,455 78,273 520' 232 134' 592 2,386 0 ~ 10,081,043 SECONDARY 4 303 121,469 454 74,494 5,642 1,297 173 908 29,940 1,297 0 0 ~ 235,978
1-' NON-FEDERAL AID RURAL 2 27,482 3,875,638 32,844 2,367,477 169,584 102,555 33,515 45,580 248,009 64,348 1,676 0 2,34~ 6,971,053 N STATE MAINTAINED 4 51 7,178 61 4,385 314 190 62 84 459 119 3 0 4 12,911 N URBAN 2 345 219,862 3,042 81,923 6,743 47 2,885 63 549 0 0 0 q 315,459
4 4 2,309 32 860 71 0 30 1 6 0 0 0 ~ 3,313
NON-FEDERAL AID RURAL 2 13,798 2,248,353 6,899 1,431' 188 118,819 17,248 4,599 0 0 0 0 0 q 3,840,905 COUNTY MAINTAINED URBAN 2 1,395 3B5,4BO 2,B31 127,B84 7,501 1,616 549 2,409 1,0B3 507 0 0 9 531,255
NON-FEDERAL AID RURAL 2 700 113,985 350 72,557 6,024 B74 233 0 0 0 0 0 ~ 194,722 CITY MAINTAINED URBAN 2 4,742 1,310,910 9,628 434 ,89B 25,508 5,497 1,868 8,191 3,683 1, 725 0 0 1,806,651
NON-FEDERAL AID RURAL 2 522 106,336 BOB 51,535 4,310 3,510 606 BOB 4,167 354 42 0 J 172,99B OTHER AGENCIES URBAN 2 32 112,579 909 40,491 4,349 1,266 357 1,655 4,017 1,120 203 0 57 167,035 ------------------------------------------------------------------------------------------------------------------------------------------------<-----------STATE-MAINTAINED SYSTEM 152, 12B 37,546,352 221,B03 16,104,419 1,656,129 697,608 291,943 6B3,55B 9,033,625 560,177 337,067 57,202 13,211 67,355,224
TOTAL STATEWIDE 173,317 41,B23,995 243,229 1B,262,972 1,B22,640 727,619 300,156 696,622 9,046,574 563,BB1 337,312 57,202 13,27 74,068,791
STATE-MAINTAINED (%) .23 55.74 .33 23.91 2.46 1.04 .43 ,_ 01 13.41 .83 .50 .08 .oJ 100.00 I
STATEWIDE AVERAGE (%) .26 62.17 .36 27.15 2.71 .72 .22 .52 5.38 .2B .20 .03 .o; 100.00 ================================================================================================================================================1===========
I I
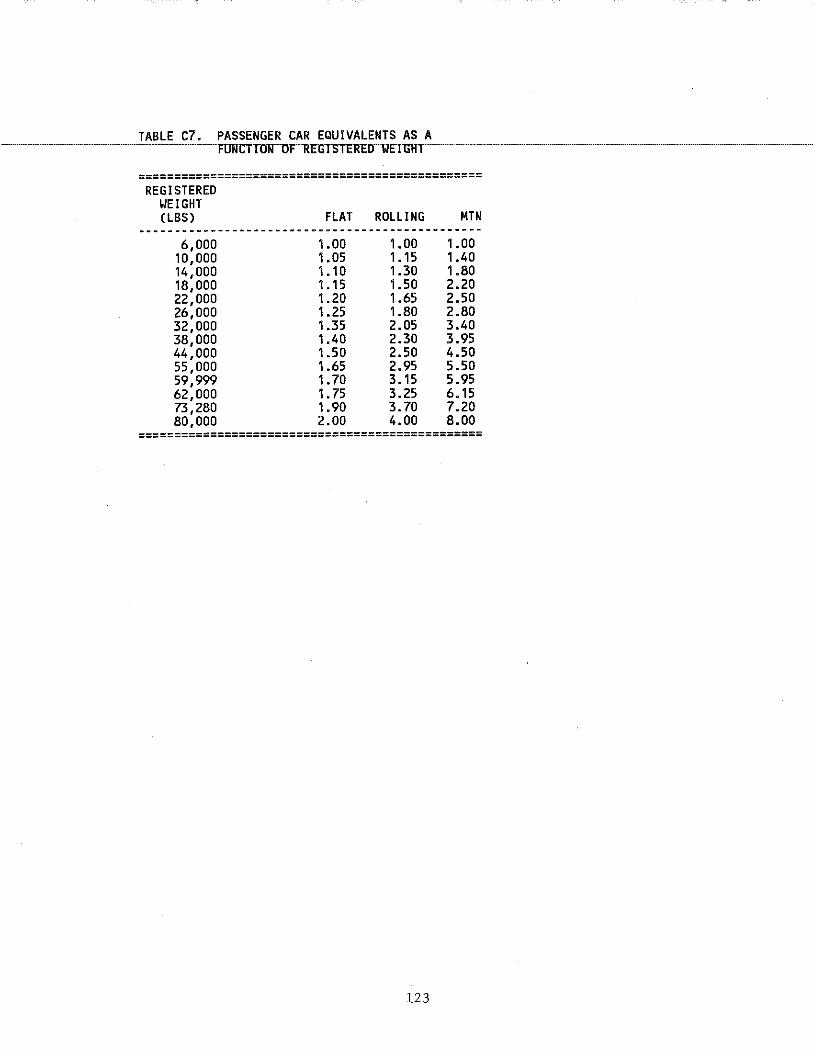
TABLE C7. PASSENGER CAR EQUIVALENTS AS~A~~ NC110N OF REGTSTEREIJWETGH I
================================================ REGISTERED
WEIGHT (LBS)
6,000 10,000 14,000 18,000 22,000 26,000 32,000 38,000 44,000 55,000 59,999 62,000 73,280 80,000
FLAT ROLLING
1.00 1.05 1.10 1.15 1.20 1.25 1.35 1.40 1.50 1.65 1.70 1.75 1.90 2.00
1.00 1.15 1.30 1.50 1.65 1.80 2.05 2.30 2.50 2.95 3.15 3.25 3.70 4.00
MTN
1.00 1.40 1.80 2.20 2.50 2.80 3.40 3.95 4.50 5.50 5.95 6.15 7.20 8.00
================================================
123
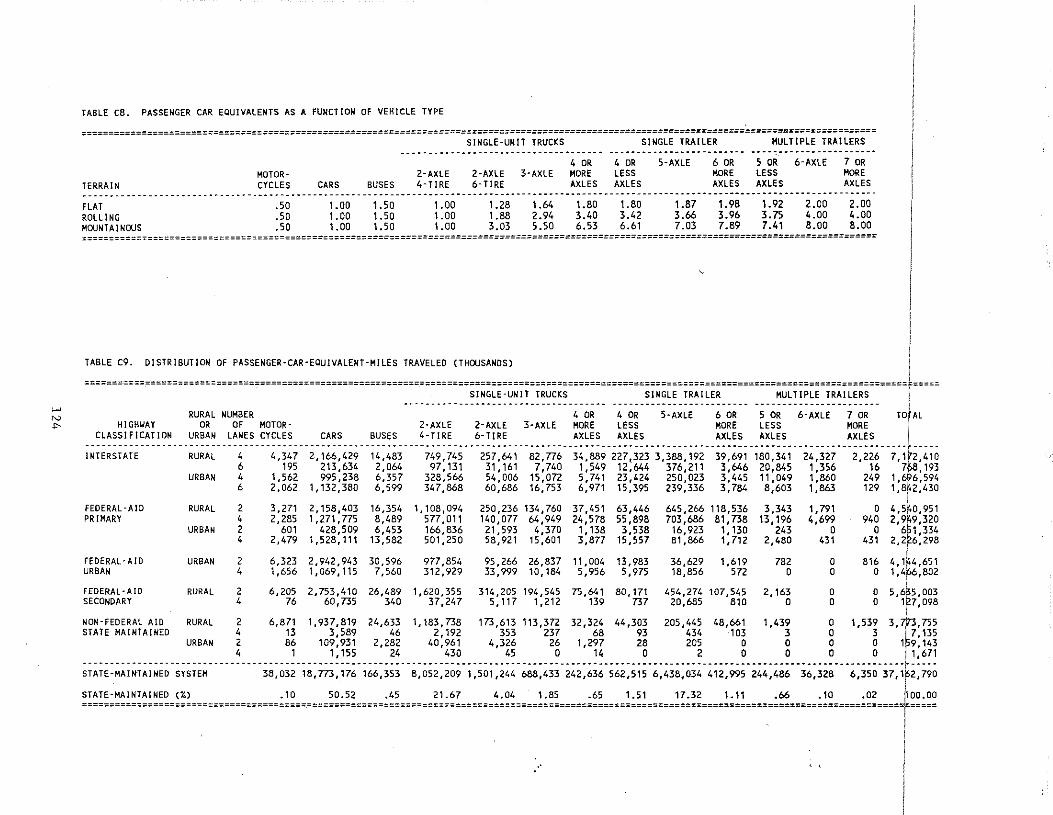
TABLE C8. PASSENGER CAR EQUIVALENTS AS A FUNCTION OF VEHICLE TYPE
=================================================================================================================================================
TERRAIN MOTORCYCLES CARS BUSES
2-AXLE 4-TIRE
SINGLE-UNIT TRUCKS SINGLE TRAILER MULTIPLE TRAILERS
4 OR 2-AXLE 3-AXLE MORE 6- TIRE AXLES
4 DR LESS AXLES
5-AXLE 6 DR MORE AXLES
5 OR 6-AXLE LESS AXLES
7 DR MORE AXLES
-------------------------------------------------------------------------------------------------------------------------------------------------FLAT ROLLING MOUNTAINOUS
.so
.50
.50
1.00 1.00 1.00
1.50 1.50 1.50
1.00 1.00 1.00
1.28 1.88 3.03
1.64 2.94 5.50
1.80 3.40 6.53
1.80 3.42 6.61
1.87 3.66 7.03
1.98 3.96 7.89
1.92 3. 75 7.41
2.00 4.00 8.00
2.00 4.00 8.00
=================================================================================================================================================
TABLE C9. DISTRIBUTION OF PASSENGER-CAR-EOUIVALENT-MILES TRAVELED (THOUSANDS) I i
======================================================================================================================================================~===== ------------~~~~==~~~~:_:~~~~~------- ------~~~~::_:~~~==~----- ----~~::~~::_:~~~==~=-- I
;:::; RURAL NUMBER 4 OR 4 OR 5-AXLE 6 OR 5 OR 6-AXLE 1 OR TOtAL -1>- HIGHWAY OR OF MOTOR- 2-AXLE 2-AXLE 3-AXLE MORE LESS MORE LESS MORE
CLASSIFICATION URBAN lANES CYCLES CARS BUSES 4-TIRE 6-T!RE AXLES AXLES AXLES AXLES AXLES
;;;;~~;;;;----·-·--~~~;~-·--4-----4;347--;:;~;4;;--;4:483 ____ 749;745 ___ 257;&;;·-82:776--34;889-227;;;;-;;;88;;;;-·;;;6;;-;8a:34i--24;327---;:;;6--?:;~;:4;a 6 195 213,634 2,064 97,131 31,161 7,740 1,549 12,644 376,211 3,646 20,845 1,356 16 71>8,193
URBAN 4 1,562 995,238 6,357 328,566 54,006 15,072 5,741 23,424 250,023 3,445 11,049 1,860 249 1,6?6,594 6 2,062 1,132,3BO 6,599 347,868 60,686 16,753 6,971 15,395 239,336 3,784 8,603 1,863 129 1,8~2,430
i FEDERAL-AID RURAL 2 3,271 2,158,403 16,354 1,108,094 250' 236 134' 760 37,451 63,446 645,266 118,536 3,343 1, 791 0 4,5~0,951 PRIMARY 4 2,285 1,271 '775 8,489 577,011 140,077 64,949 24,578 55,898 703,686 81 '738 13,196 4,699 940 2,9 9,320
URBAN 2 601 428,509 6,453 166,836 21,593 4,370 1,138 3,538 16,923 1.130 243 0 0 6p1 ,334 4 2,479 1,528,111 13,582 501,250 58,921 15,601 3,877 15,557 81,866 1 1712 2,480 431 431 2,2~6,298
FEDERAL-AID URBAN 2 6,323 2,942,943 30.596 977,854 95,266 26,837 11,004 13,983 36,629 1,619 782 0 816 4,1 4,651 URBAN 4 1,656 1,069,115 7,560 312,929 33,999 10,184 5,956 5,975 18,856 572 0 0 0 1,4 6,802
' FEDERAL·AID RURAL 2 6,205 2,753,410 26,489 1,620,355 314,205 194,545 75,641 80,171 454,274 107,545 2,163 0 0 5,6~5,003 SECONDARY 4 76 60,735 340 37,247 5,117 1,212 139 737 20,685 810 0 0 0 1[27,098
i NDN·fEOERAL AID RURAL 2 6,871 1,937,819 24,633 1,183,738 173,613 113,372 32,324 44,303 205,445 48,661 1,439 0 1,539 3,7173,755 STATE MAINTAINED 4 13 3,589 46 2,192 353 237 68 93 434 103 3 0 3 i 7,135
URBAN 2 86 109,931 2,282 40,961 4,326 26 1,297 28 205 0 0 0 0 1p9,143 4 1 1.155 24 430 45 0 14 0 2 0 0 0 0 i 1, 671
--------·------·---------------------------·-------------··-·---------------·-----------------------------------·------------------···-----·-----·----1·-----STATE·MAIN-TAINED SYSTEM 38,03218,713,176166,353 8,052,2091,501,244 688,433 242,636 562,515 6,438i034 412,995 244,486 36,328 6,350 37,1i2,790
STATE-MAINTAINED(%) .10 50.52 .45 21.67 4.04 1.85 .65 1.51 17.32 1.11 .66 .10 .02 ~00.00
==========~=============~=============================================================================================================================r=====
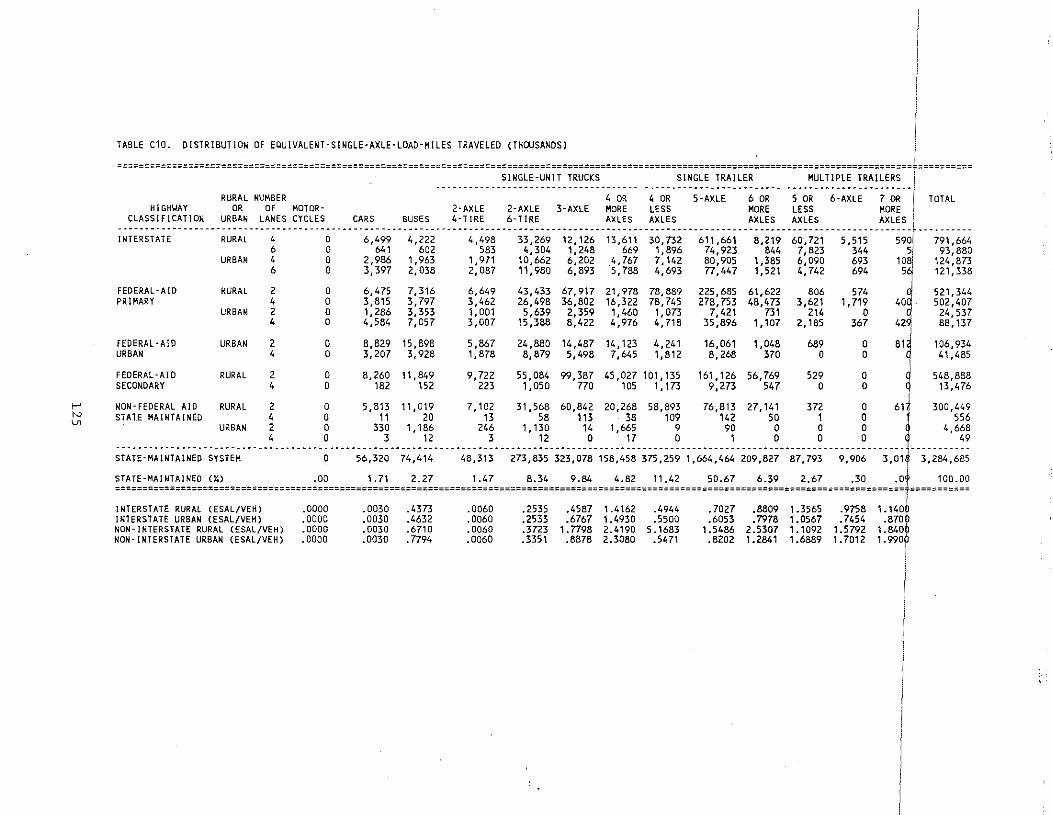
f-' N l.n
TABLE C10. DISTRIBUTION Of EOUIVALENT·SINGLE·AXLE·lOAD·MilES TRAVELED (THOUSANDS) 1 --------------------------------------------------------------------------------------------------------------------~---------------------------- -----------------------------------------------------------------------------------------------------------------------------------------------------------~----------
SINGLE-UNIT TRUCKS SINGLE TRAILER MULTIPLE TRAILERS
RURAL NUMBER 4 OR 4 OR 5-AXLE 6 OR 5 OR 6-AXLE 7 OR TOTAL HIGHWAY OR OF MOTOR- 2-AXLE 2-AXLE 3-AXLE MORE LESS MORE LESS MORE
CLASSIFICATION URBAN LANES CYCLES CARS BUSES 4-TIRE 6-TIRE AXLES AXLES AXLES AXLES AXLES . ········-----------------·----------························-··············--------·-------·····················-·························--··-·->--········ INTERSTATE RURAL 4 0 6,499 4,222 4,498 33,269 12,126 13,611 30,732 611,661 8,219 60.721 5,515 59! 791,664
6 0 641 602 583 4,304 1,248 669 1,896 74,923 844 7,823 344 5 93,880 URBAN 4 0 2,986 1,963 1,971 10,662 6,202 .4,767 7,142 80,9D5 1,385 6,D9D 693 10 124,B73
6 0 3,397 2,038 2,087 11,980 6,893 5,788 4,693 77,447 1,521 4,742 694 5 121,338
FEDERAL·AID RURAL 2 0 6,475 7,316 6,649 43,433 67,917 21,978 78,889 225,685 61,622 806 574 521,344 PRIMARY 4 0 3,815 3,797 3,462 26,498 36,802 16,322 78,745 278,753 48,473 3,621 1, 719 40Q 502,407
FEDERAL·AIO URBAN
FEDERAL-AID SECONDARY
URBAN 2 0 1,286 3,353 1,001 5,639 2,359 1,460 1,073 7,421 731 214 0 q 24,537 4 0 4,5B4 7,D57 3,007 15,388 B,422 4,976 4,718 35,896 1,107 2,185 367 42j 88,137
URBAN 2 0 8,829 15,898 5,867 24,880 14,487 14,123 4,241 16,061 1,048 689 0 81 106,934 4 0 3,207 3,928 1,878 8,879 5,49B 7,645 1,812 8,268 370 0 0 41,485
RURAL 2 D 8,260 11,849 9,722 55,084 99,387 45,027101,135 161,126 56,769 529 0 548,8B8 4 0 182 152 223 1,050 770 105 1,173 9,273 547 0 0 13,476
I NON·FEDERAl AID RURAL 2 0 5,813 11,019 7,102 31,568 6D,842 20,268 5B,893 76,813 27,141 372 0 61~ 30D,449 STATE MAINTAINED 4 D 11 20 13 58 113 38 109 142 50 1 0 l 556
URBAN 2 0 330 1,186 246 1,130 14 1,665 9 90 0 0 0 4,668 4 0 3 12 3 12 0 17 0 1 0 D 0 49
······················----------------------------·-------------------------·---------------·---·--···-------------·--·-------·-------·--------- -----------STATE·MAJNTAJNED SYSTEM 0 56,320 74,414 48,313 273,835 323,078 158,458 375,259 1,664,464 209,827 87,793 9,906 3,01 3,284,685
STATE-MAINTAINED(") .00 1.71 2.27 1.47 8.34 9.84 4.82 11.42 50.67 6.39 2.67 .30 .0 100.00 ;;;;;;;;;;;;;;;;;;;;;;;;;;;;;;;;;;;;;;;;;;;;;;;;;;;;;;;;;;;;;;;;;;;;;;;;;;;;;;;;;;;;;;;;;;;;;;;;;;;;;;;;;;;;;;;;;;;;;;;;;;;;;;;;;;;;;;;;;;;;;;;;f;;;;;;;;;;;
INTERSTATE RURAL (ESAL/VEH) .0000 .0030 .4373 .0060 .2535 .4587 1.4162 .4944 .7027 .8809 1.3565 .9758 1.140~ INTERSTATE URBAN (ESAl/VEH) .ODOO .OD30 .4632 .0060 .2533 .6767 1.4930 .5500 .6053 .7978 1.0567 .7454 .870ID NON-INTERSTATE RURAL (ESAL/VEH) .0000 .0030 .6710 .0060 .3723 1.7798 2.4190 5.1683 1.5486 2.5307 1.1092 1.5792 1.840f NON-INTERSTATE URBAN (ESAL/VEH) .0000 .003D .7794 .0060 .3351 .887B 2.30BO .5471 .8202 1.2841 1.6889 1.7012 1.990
1
I
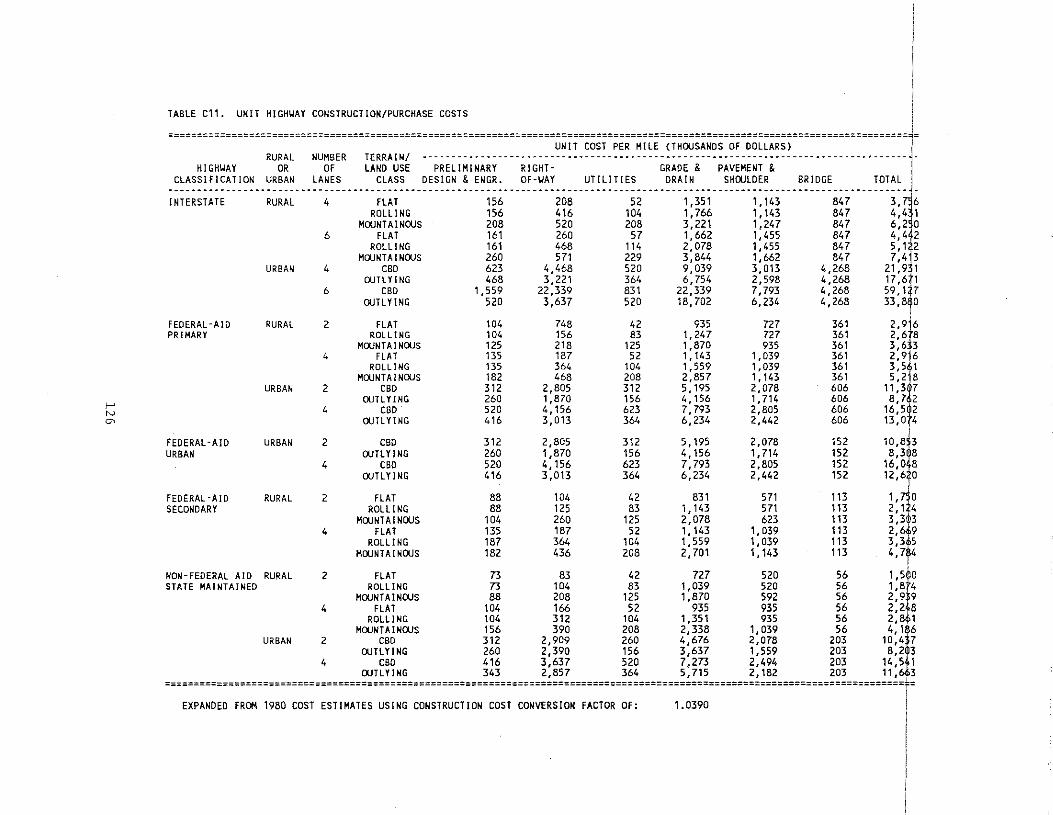
1-' N
"'
TABLE C11. UNIT HIGHWAY CONSTRUCTION/PURCHASE COSTS
================================================================================================================================i= UNIT COST PER MILE (THOUSANDS Of DOLLARS)
RURAL NUMBER TERRAIN/ ----------------------------------------------·-------------------------------------H!GHUAY OR Of LAND USE PRELIMINARY RIGHT- GRADE & PAVEMENT &
CLASSlflCAT!OH URBAN LANES CLASS DESIGN & ENGR. OF-~AY UTILITIES DRAIN SHOULDER BRIDGE TOTAL
INTERSTATE
FEDERAL-AID PRIMARY
fEOERAL-AJO URBAN
fEDERAL -A 1 D SECONDARY
RURAL
URBAN
RURAL
URBAN
URBAN
RURAL
NON-FEDERAL AID RURAL STATE MAINTAINED
URBAN
4
6
4
6
2
4
2
4
2
4
2
4
2
4
2
fLAT ROLLING
MOUNTAINOUS FLAT
ROLLING MOUNTAINOUS
CBO OUTLYING
CBO OUTLYING
FLAT ROLLING
MOUNTAINOUS FLAT
ROLLING MOUNTAINOUS
CBD OUTLYING
CBD OUTLYING
CBD OUTLYING
CBD OUTL Yl NG
FLAT ROLLING
MOUNTAINOUS FLAT
ROLLING MOUNTAINOUS
FLAT ROLLING
MOUNTAINOUS fLAT
ROLLING MOUNTAINOUS
156 156 208 161 161 260 623 468
1,559 520
104 104 125 135 135 182 312 260 520 416
312 260 520 416
88 88
104 135 187 182
73 73 88
104 104 156
208 416 520 260 468 571
4,468 3,221
22,339 3,637
748 156 218 187 364 468
2,805 1,a7o 4,156 3, 013
2,805 1,870 4,156 3,013
104 125 260 187 364 436
83 104 208 166 312 390
52 104 208 57
114 229 520 364 831 520
42 83
125 52
104 208 312 156 623 364
312 156 623 364
42 83
125 52
104 208
42 83
125 52
104 208
1,351 1,766 3,221 1, 662 2,078 3,844 9,039 6,754
22,339 18,702
935 1, 247 1,870 1,143 1,559 2,857 5,195 4.156 7,793 6,234
5.195 4.156 7,793 6,234
831 1,143 2,078 1, 143 1, 559 2,701
727 1,039 1,870
935 1,351 2.338
1,143 1,143 1,247 1,455 1,455 1,662 3,013 2,598 7,793 6,234
727 727 935
1,039 1,039 1,143 2,078 1,714 2,805 2,442
2,078 1, 714 2,805 2,442
571 571 623
1,039 1, 039 1,143
520 520 592 935 935
1,039
847 847 847 847 847 847
4,268 4,268 4,268 4,268
361 361 361 361 361 361 606 606 606 606
152 152 152 152
113 113 113 113 113 113
56 56 56 56 56 56
3,ij6 4,4 1 6,2 0 4,4 2 5.1 2 7,4j3
21,931 17 ,6?1 59,1F 33,88D
2,9}1
6 2,6 a
~:*i~ 3,5 1 5,2 a
11,3 7 8,7 2 16,5~2 13, D"f4
I
10,8l3 8,3~8
16,048 12,6~0
1, .,.10 2,124 3,313 2,6-9 3,3,5 4,7~4
i 1,5$0 1,8f4 2,il9 2,2 8 2, 1
CBD 312 2,9D9 260 4,676 2,078 203 1D,4 7 OUTLYING 260 2,390 156 3,637 1,559 203 8,2 3
4,~6 4 CBO 416 3,637 520 7,273 2,494 203 14,5 1
OUTLYING 343 2,857 364 5,715 2,182 203 11, 3 ================================================================================================================================t=
EXPANDED FROM 1980 COST ESTIMATES USING CONSTRUCTION COST CONVERSION FACTOR Of: 1.0390 ~
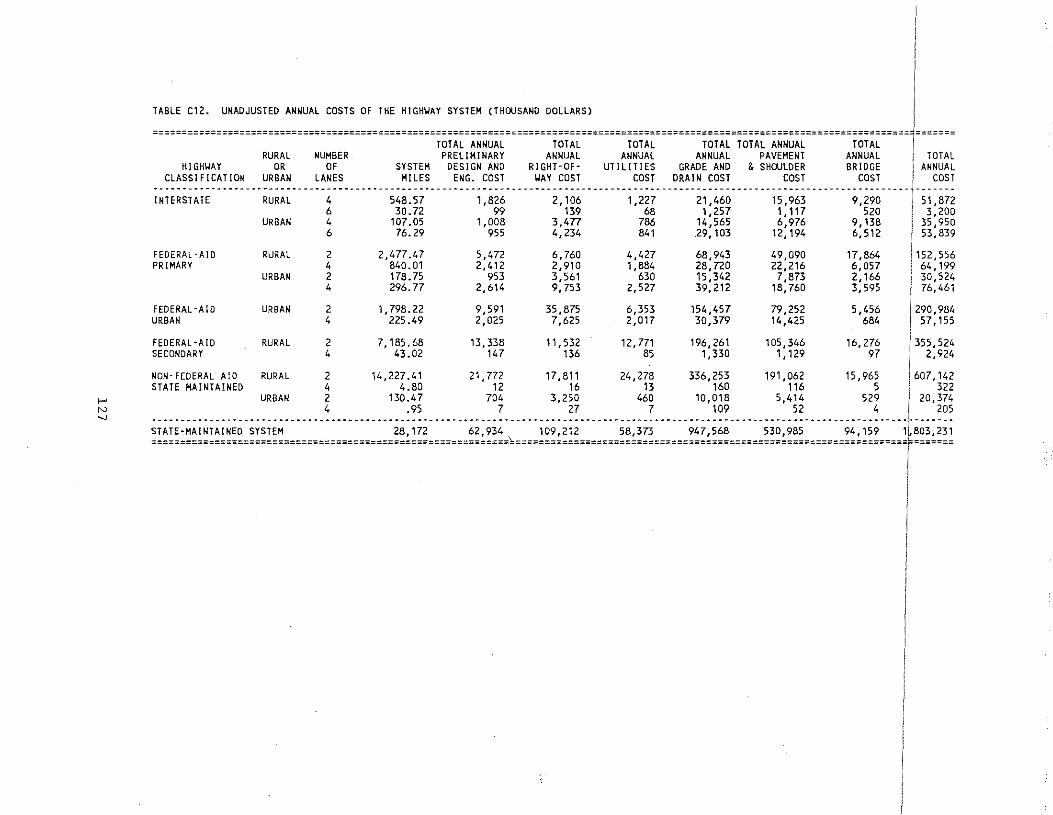
,_. N ...,
TABLE C12. UNADJUSTED ANNUAL COSTS OF THE HIGHWAY SYSTEM (THOUSAND DOLLARS)
===================================================================================================================================,'======= TOTAL ANNUAL TOTAL TOTAL TOTAL TOTAL ANNUAL TOTAL
RURAL NUMBER PRELIMINARY ANNUAL ANNUAL ANNUAL PAVEMENT ANNUAL i TOTAL HIGH~AY OR OF SYSTEM DESIGN AND RIGHT~OF- UTILITIES GRADE AND & SHOULDER BRIDGE ! ANNUAL
CLASSIFICATION URBAN LANES MILES ENG. COST ~AY COST COST ORAl N COST COST COST / COST ···-··········-·-·---·····--·--·-········-----··--·········--····--··-···········-·········-······-·········-·----·················j······· INTERSTATE RURAL 4 548.57 1,826 2,106 1,227 21,460 15,963 9,290 I' 51,872
FEDERAL-AID PRIMARY
FEDERAL·AIO URBAN
FEDERAL·AIO SECONDARY
NON- FEDERAL AID STATE MAINTAINED
6 30.72 99 139 68 1,257 1,117 520 3,200 URBAN 4 107.05 1,008 3,477 786 14,565 6,976 9,13B I 35,950
6 76.29 955 4,234 841 29,103 12,194 6,512 ' 53,839
2 2,477.47 5,472 6,760 4,427 68,943 49,090 17,864 1152,556 RURAL 4 84o.o1 2,412 2,910 1,884 28,720 22,216 6,os7 1 64,199 2 178.75 953 3,561 630 15,342 7,873 2,166 i 30,524 4 296.77 2,614 9,753 2.527 39,212 18,760 3,595 I 76,461
2 1,798.22 9,591 35,875 6,353 154,457 79,252 s,4s6 I 290,984 4 225.49 2,025 7,625 2,017 30,379 14,425 684 57,155
URBAN
URBAN
2 7,185.68 13,338 11,532 12,771 196,261 105,346 16,276 1355,524 4 43.02 147 136 85 1,330 1,129 97 I 2,924
2 14,227.41 21,772 17,811 24,278 336,253 191,062 15,965 1607,142 4 4.80 12 16 13 160 116 5 322 2 130.47 704 3,250 460 10,018 5,414 529 20,374 4 .95 7 27 7 109 52 4 1 205
RURAL
RURAL
URBAN
··--·-···············-····-···-----········-···-····-············-·······························--·············--·-···············r······· STATE·MAINTAINED SYSTEM 28,172 62,934 109,212 58,373 947,568 530,985 94,159 11,803,231 =============================================================='====================================================================r=======
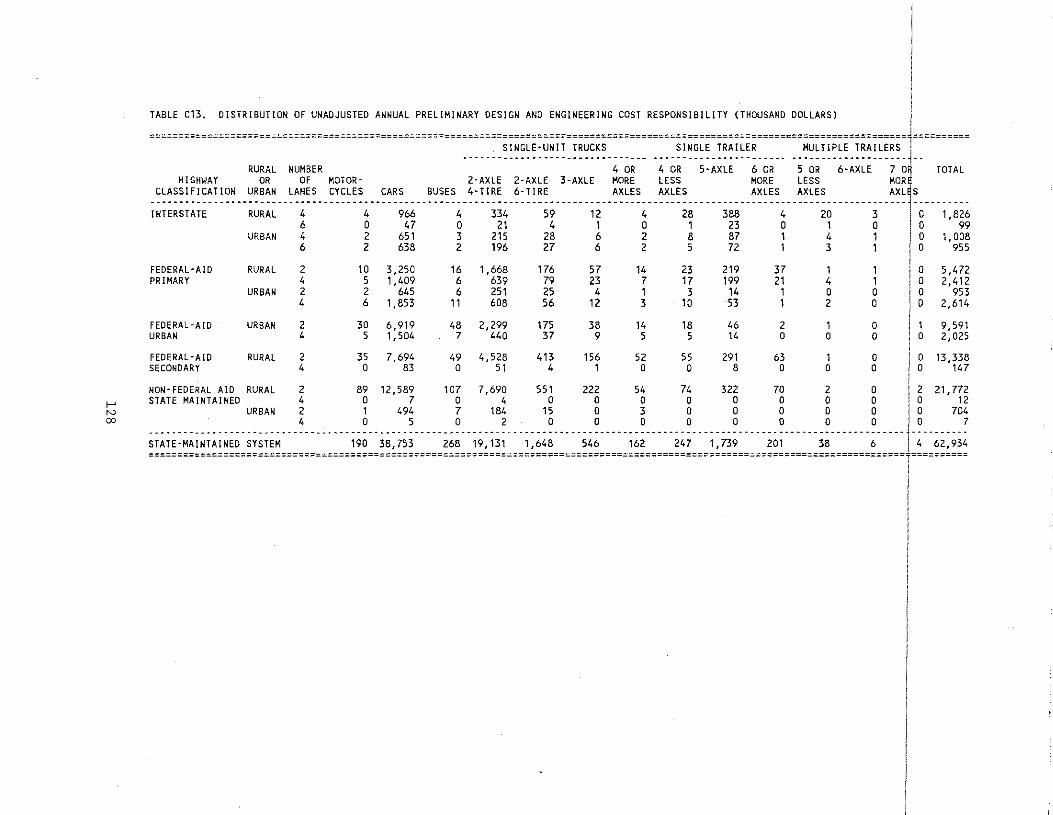
>--' N 00
TABLE C13. 0 I STR I BUTtON OF UNADJUSTED ANNUAL PRELl M I NARY DESIGN AND ENGINEERING COST RESPONS I B I L1 TY (THOUSAND DOLLARS) !
===================================================================================================================================lj========== , SINGLE-UNIT TRUCKS SINGLE TRAILER MULTIPLE TRAILERS
H!GH"AY RU~~L NU~~ER MOTOR- -~:~:~~--~:~:~:·-~:~:~:---~~~~-- -~:~~---;:~~~~---~~~~-- -~~~~---~:~~~~---t~~~-- TOTAL
CLASSIFICATION URBAN LANES CYCLES CARS BUSES 4~TIRE 6-TIRE AXLES AXLES AXLES AXLES AXL1S --~-------------------------------------------------------------------------------------------------------------------------------- ----------INTERSTATE RURAL 4 4 966 4 334 59 12 4 28 388 4 20 3 0 1,826
6 0 47 0 21 4 1 0 1 23 0 1 0 0 99 URBAN 4 2 651 3 215 28 6 2 8 87 1 4 1 1 0 1, 008
6 2 638 2 196 27 6 2 5 72 1 3 1 I o 955
FEDERAL-AID RURAL 2 10 3,250 16 1,668 176 57 14 23 219 37 1 1 I 0 5,472 PRIMARY 4 5 1,409 6 639 79 23 7 17 199 21 4 1 I 0 2,412
FEDERAL-AID URBAN
FEDERAL-AID SECONDARY
URBAN 2 2 645 6 251 25 4 1 3 14 1 0 0 'I 0 953 4 6 1,853 11 608 56 12 3 10 53 1 2 0 0 2,614
URBAN
RURAL
2 4
2 4
30 6,919 5 1 ,5D4
35 7,694 0 83
48 2,299 7 440
49 4,528 0 51
175 37
413 4
38 9
156 1
14 5
52 0
18 5
55 0
46 14
291 8
2 0
63 0
I 0
1 0
0 0
0 0
1 9' 591 0 2' 025
0 13,338 0 147
NON-FEDERAL AID RURAL 2 89 12,589 107 7,690 551 222 54 74 322 70 2 0 I 2 21,772 STATE MAINTAINED 4 0 7 0 4 0 0 0 0 0 0 0 0 I 0 12
URBAN 2 1 494 7 184 15 0 3 0 0 0 0 0 II 0 704 4 0 5 0 2 0 0 0 0 0 0 0 0 ' 0 7
;;~;~:~~~~;~~~~~-;~;;~~------------;90--38:753 _____ 2~8--;9:;;;·--;:~48 _____ 54~-----;~2-----247---;:739 _____ 201 ______ 38-------~-----j-4·-~2:934 ===================================================================================================================================f==========
'
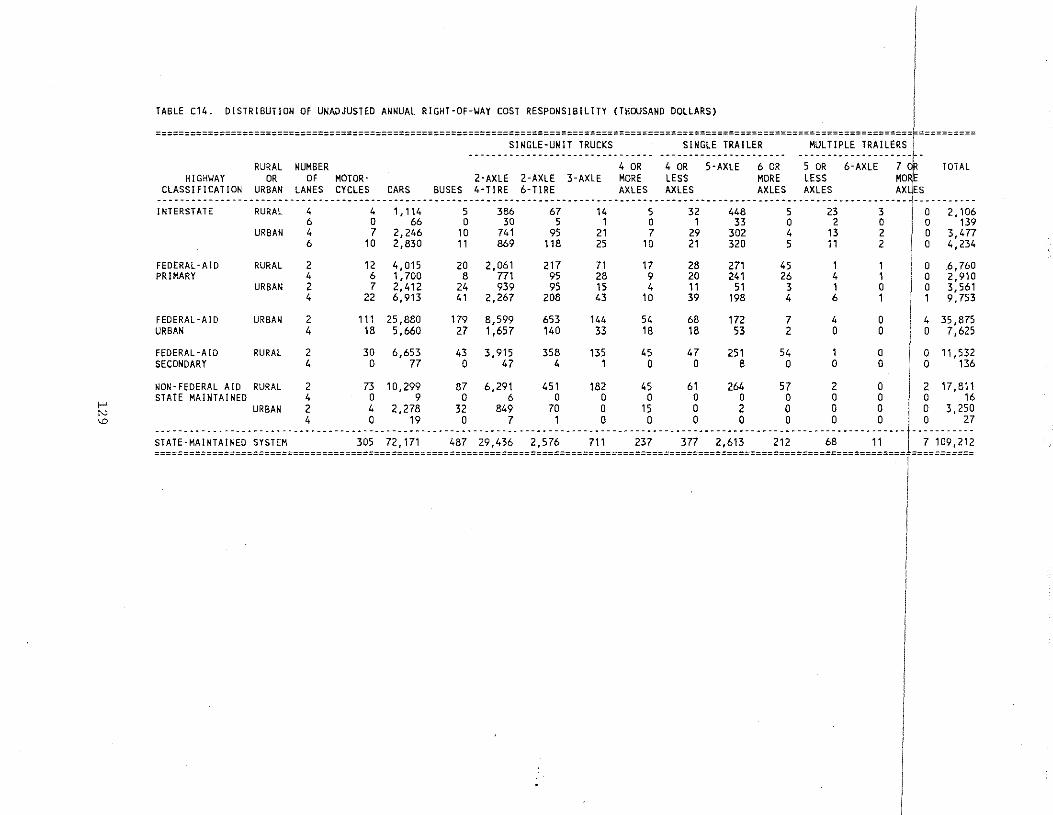
1-' N
"'
I :::~:=:::~==:~:::~:~:~::=::=~:::~~::::=:::~:~=:~:::~::~~::=::::=:::::::~:~~~::=:::~::::=::~~:::~=================================1-l ==========
SINGLE-UNIT TRUCKS SINGLE TRAILER MULTIPLE TRAILERS ~------------------------------- ---------------------- ----------------------
RURAL NUMBER 4 OR 4 OR 5-AXLE 6 OR 5 OR 6-AXLE 7 TOTAL HIGHWAY OR OF MOTOR- 2-AXLE 2-AXLE 3-AXLE MORE LESS MORE LESS MOlE
CLASSIFICATION URBAN LANES CYCLES CARS BUSES 4-TIRE 6-TIRE AXLES AXLES AXLES AXLES AX ES ----------------------------------------------------------------------------------------------------------------------------------------------INTERSTATE RURAL 4 4 1,114 5 386 67 14 5 32 448 5 23 3 0 2,106
6 0 66 0 30 5 1 0 1 33 0 2 0 0 139 URBAN 4 7 2,246 10 741 95 21 7 29 302 4 13 2 0 3,477
6 10 2,830 11 869 118 25 1D 21 320 5 11 2 0 4,234
FEDERAL*AID PRIMARY
FEDERAL-AID URBAN
FEDERAL*AID SECONDARY
RURAL
URBAN
URBAN
RURAL
2 12 4,015 20 2,061 217 71 17 28 271 45 1 1 'II D 6,760 4 6 1,700 8 771 95 28 9 20 241 26 4 1 0 2,910 2 7 2,412 24 939 95 15 4 11 51 3 1 0 1 0 3,561 4 22 6,913 41 2,267 2D8 43 10 39 198 4 6 1 1 , 9,753
2 4
111 25,880 179 8,599 653 144 54 68 172 7 4 D 1 4 35,875 18 5,66D 27 1,657 14D 33 18 18 53 2 D D ' D 7,625
2 30 6,653 43 3,915 358 135 45 47 251 54 1 o 1 o 11,532 4 D 77 0 47 4 1 0 D 8 0 D 0 1 0 136
I NON-FEDERAL AID RURAL 2 73 1D,299 87 6,291 451 182 45 61 264 57 2 D I 2 17,811 STATE MAINTAINED 4 D 9 D 6 D D 0 0 D 0 0 D j D 16
URBAN 2 4 2,278 32 849 7D D 15 D 2 0 0 0 D 3,250 4 0 19 0 7 1 0 0 0 0 0 0 D D 27
---------------------------------------------------------------------------------------------------------------------------------- ----- * * * * * *
STATE-MAINTAINED SYSTEM 3D5 72,171 487 29,436 2,576 711 237 377 2,613 212 68 11 [ 7 109,212
~~~~,~~----~--~~~-,-~~---~~~--~~~, ... , .. ~----~~---~--~~~---~---~~--oc·--~~---~~,-~~-~--~---~~-----------~--------~---~~---~-----~--~~-------
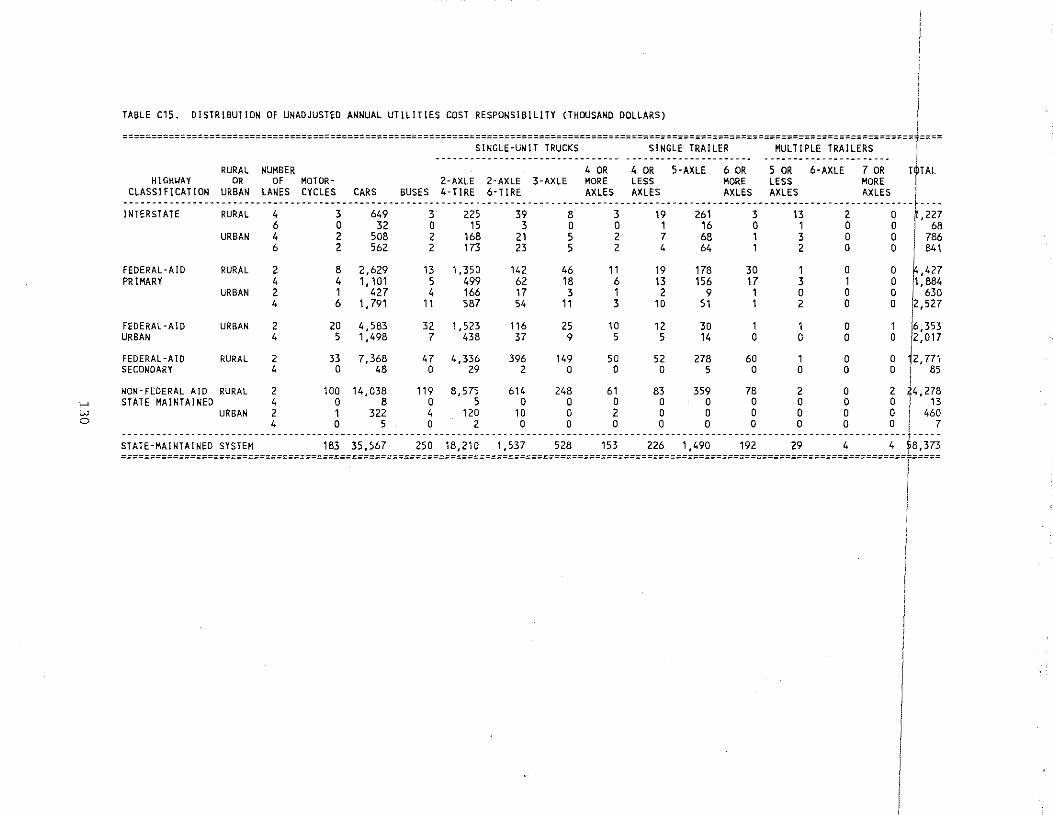
>--' w 0
I TABLE C15. DISTRIBUTION OF UNADJUSTED ANNUAL UTILITIES COST RESPONSIBILITY (THOUSAND DOLLARS) I
=========================================================================================================================================rl==== SINGLE-UNIT TRUCKS SINGLE TRAILER MULTIPLE TRAILERS
-------------------------------- ---------------------- ----------------------RURAL NUMBER 4 OR 4 OR 5-AXLE 6 OR 5 OR 6-AXLE 7 OR T TAL
HIGHWAY OR OF MOTOR- 2-AXLE 2-AXLE 3-AXLE MORE LESS MORE LESS MORE CLASSIFICATION URBAN LANES CYCLES CARS BUSES 4-TIRE 6-TIRE AXLES AXLES AXLES AXLES AXLES
INTERSTATE
FEDERAL-AID PRIMARY
FEDERAL-AID URBAN
FEDERAL-AID SECONDARY
RURAL
URBAN
RURAL
URBAN
URBAN
RURAL
4 6 4 6
2 4 2 4
2 4
2 4
3 649 0 32 2 508 2 562
8 2,629 4 1' 101 1 427 6 1,791
20 4,583 5 1,498
33 7,368 0 48
3 225 39 8 0 15 3 0 2 168 21 5 2 173 23 5
13 1,350 142 46 5 499 62 18 4 166 17 3
11 587 54 11
32 1 '523 116 25 7 438 37 9
47 4,336 396 149 0 29 2 0
3 19 261 3 13 2 0 0 1 16 0 1 0 0 2 7 68 1 3 0 0 2 4 64 1 2 0 0 ,, 19 178 30 1 0 0 6 13 156 17 3 1 0 1 2 9 1 0 0 0 3 10 51 1 2 0 0
10 12 30 1 1 0 1 5 5 14 0 0 0 0
50 52 278 60 1 0 0 0 0 5 0 0 0 0
,227 68
786 841
,427 1, 884
630 2,527
t53 2,017
2, 771 I as
NON-FEDERAL AID RURAL 2 100 14,038 119 8,575 614 248 61 83 359 78 2 0 2 ~4,278 STATE MAINTAINED 4 0 8 0 5 0 0 0 0 0 0 0 0 0 I 13
URBAN 2 1 322 4 120 10 0 2 0 0 0 0 0 0 I 460 4 0 5 . 0 2 0 0 0 0 0 0 0 0 0 J 7
=~~~~:~~~~~~~~~~-=~=~~~------------~~~--~~:~~~-----:~~--~~::~~---~::~~-----~:~-----~~~-----::~---~::~~-----~~: ______ :~ _______ : _______ : __ 1~:~~
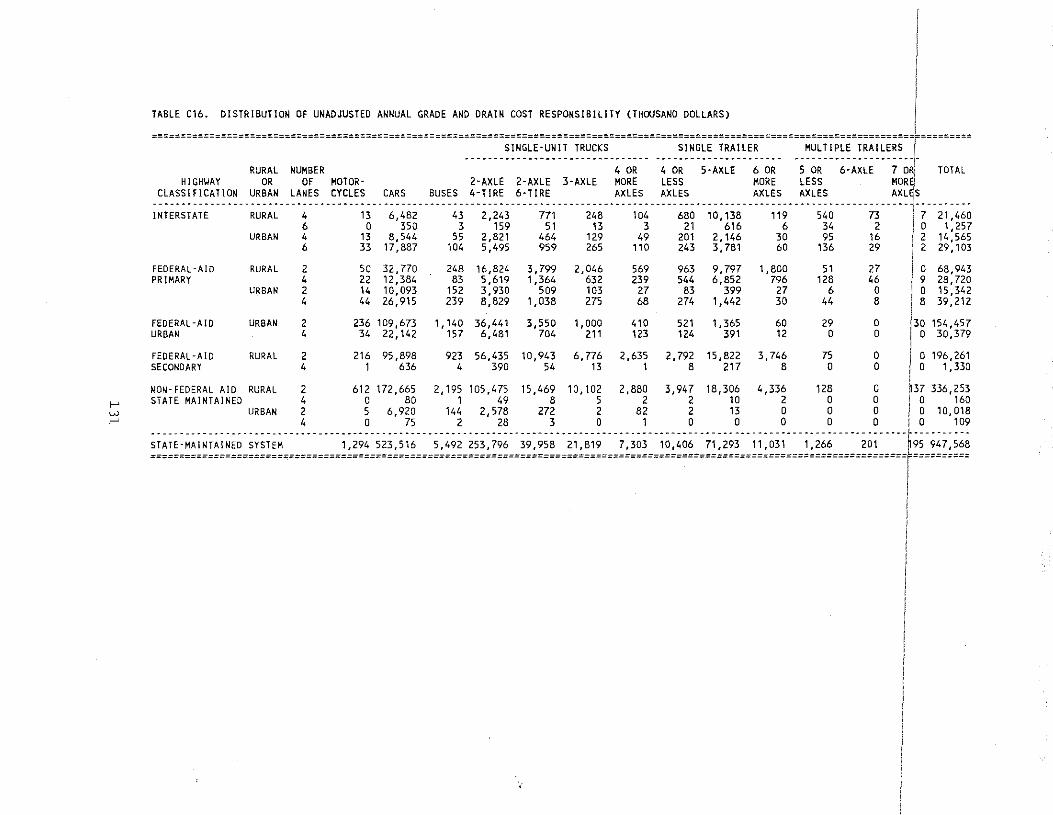
~--' w ~--'
TABLE C16. DISTRIBUTION OF UNADJUSTED ANNUAL GRADE AND DRAIN COST RESPONSIBILITY (THOUSAND DOLLARS)
=================================[ SINGLE·UNIT TRUCKS SINGLE TRAILER MULTIPLE TRAILERS I
-----------~·------------------- ---------------------- ----------------------RURAL NUMBER 4 OR 4 OR S·AXLE 6 OR 5 OR 6·AXLE 7 0~ TOTAL
HIGH~AY OR OF MOTOR· 2·AXLE 2·AXLE 3·AXLE MORE LESS MORE LESS MORe CLASSIFICATION URBAN LANES CYCLES CARS BUSES 4·T!RE 6·T!RE AXLES AXLES AXLES AXLES AXLBS
;~;~~;;~;~·······~~~~~····4·········;;···6;4~2······4;···2;243·····~~;·····24~·····;~4·····68~··;~;;;~·····;;~·····;4~····--Ti·--··j·?-·2;;46~ 6 0 350 3 159 51 13 3 21 616 6 34 2 1 0 1,257
FEDERAL-AID PRIMARY
FEDERAL -A I D URBAN
FEDERAL-AID SECONDARY
NON-FEDERAL AID STATE MAINTAINED
URBAN 4 13 8,544 55 2,B21 464 129 49 201 2,146 30 95 16 i 2 14,565 6 33 17,B87 104 5,495 959 265 110 243 3, 781 60 136 29 i 2 29,103
2 so 32,770 248 16,B24 3,799 2,046 569 963 9,797 1,800 51 27 ,- 0 68,943 4 22 12,384 83 5,619 1,364 632 239 544 6,852 796 128 46 9 28,720 2 14 10,093 152 3,930 509 103 27 83 399 27 6 0 i 0 15,342 4 44 26,915 239 8,829 1,038 275 68 274 1,442 30 44 8 ' 8 39,212
2 236 109,673 1,140 36,441 3,550 1,000 410 521 1,365 60 29 0 130 154,457
RURAL
URBAN
URBAN 4 34 22,142 157 6,481 704 211 123 124 391 12 a a I a 30,379
2 216 95,898 923 56,435 10,943 6,776 2,635 2,792 15,822 3,746 75 0 i 0 196,261 4 1 636 4 39o s4 13 1 8 211 8 o o 1 o 1,33o
RURAL
I 2 612 172,665 2.19s 105,475 15,469 10,102 2,880 3,947 18,306 4,336 128 a n37 336,253 4 0 80 1 49 8 5 2 2 10 2 0 0 i 0 160
RURAL
URBAN 2 5 6,920 144 2,578 272 2 82 2 13 0 0 0 i 0 10,018 4 0 75 2 28 3 0 1 0 0 0 0 0 i 0 109
-----------------------------------------------------------------------------------------------------------------------------------I-----------STATE-MAINTAINEO SYSTEM 1,294 523,516 5,492 253,796 39,958 21,819 7,303 10,406 71,293 11,031 1,266 201 ~95 947,568 ===================================================================================================================================r==========
i
'
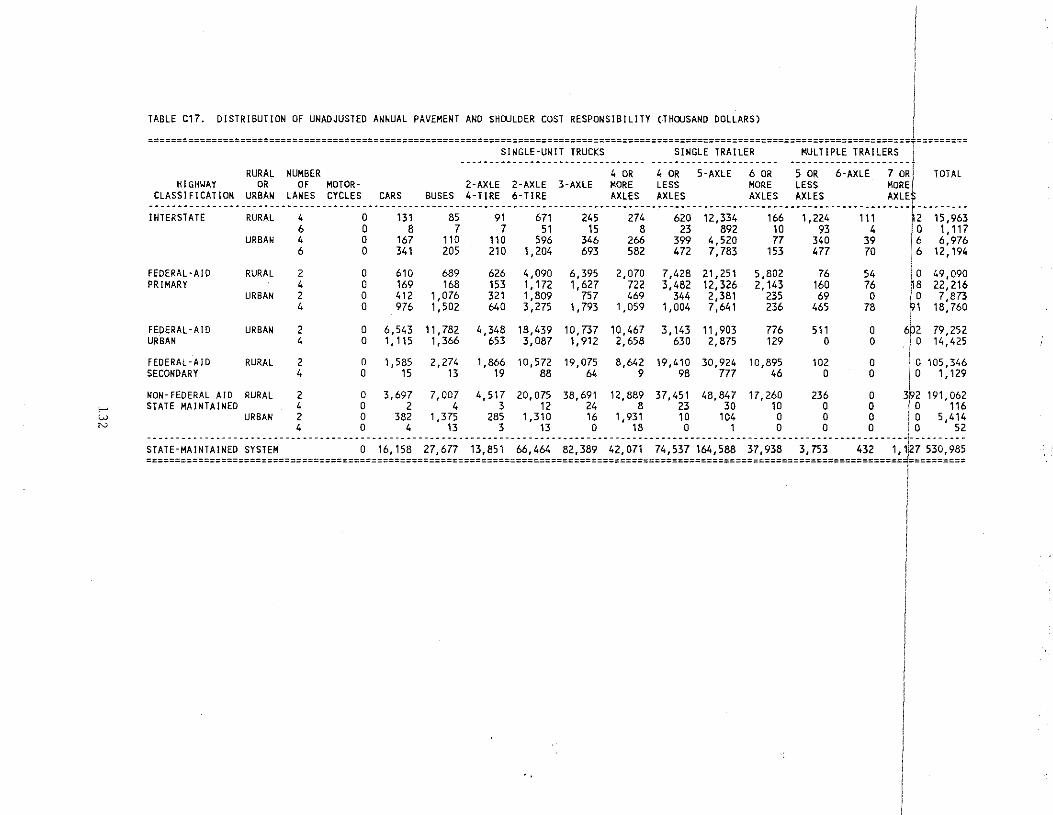
f-0 w N
I
I
I
TABLE C17. DISTRIBUTION OF UNADJUSTED ANNUAL PAVEMENT AND SHOULDER COST RESPONSIBILITY (THOUSAND DOLLARS) 1 ====================================================================================================================================I=========
SlNGLE·UNlT TRUCKS SINGLE TRAILER MULTIPLE TRAILERS
RURAL NUMBER ····----------------------4-~~-- -4-~~---5:~;~~---6-~~- ·5-~~---6:~;~~---l-~~~ TOTAL HlGHUAY OR OF MOTOR- 2-AXLE 2-AXLE 3-AXLE MORE LESS MORE LESS MOREl
CLASSIFICATION URBAN LANES CYCLES CARS BUSES 4-TIRE 6-TIRE AXLES AXLES AXLES AXLES AXLES ------------·--·----------------------··--------------------------------------------------------------------------------------------f---------INTERSTATE RURAL 4 0 131 85 91 671 245 274 620 12,334 166 1,224 111 hz 15,963
6 o 8 7 7 s1 1s s z3 892 10 93 4 1 o 1,117
FEDERAL -A 10 PRIMARY
FEDERAL-A!O URBAN
FEDERAL-AID SECONDARY
URBAtl
RURAL
URBAN
URBAN
RURAL
NON-FEDERAL AID RURAL STATE MAINTAINED
URBAN
4 0 167 110 110 596 346 266 399 4,520 77 340 39 16 6,976 6 0 341 205 210 1,204 693 582 472 7,783 153 477 70 6 12,194
2 4 2 4
2 4
D 0 0 0
0 0
610 169 412 976
689 168
1,076 1,502
6,543 11,782 1,115 1,366
626 153 321 640
4,090 1' 172 1,809 3,275
6,395 1,627
757 1,793
2,D70 722 469
1,059
4,348 18,439 10,737 10,467 653 3,087 1,912 2,658
7,428 3,482
344 1 ,OD4
21,251 12,326 2,381 7,641
3,143 11,903 63D 2, 875
5,8D2 2,143
235 236
776 129
76 160 69
465
511 D
54 76
0 78
0 0
! !O 49,090 r8 22,216
to 7,873 1 18,760
6 2 79,252 ! 0 14,425 ' 2 o 1,585 2,274 1,866 10,572 19,075 8,642 19,410 30,924 10,895 102 o I' o 105,346
4 0 15 13 19 88 64 9 98 777 46 0 0 0 1,129
2 0 3,697 7,007 4,517 20,075 38,691 12,889 37,451 48,847 17,260 236 0 3~2 191,062 4 0 2 4 3 12 24 8 23 30 10 0 0 ! 0 116 2 o 382 1,375 285 1,310 16 1,931 10 104 o o o 1 o 5,414 4 0 4 13 3 13 0 18 0 1 0 0 0 i 0 52
--------·····-··------·------------------·-·----------·-----------------------------------------------------------------------------1----------STATE-MA!NTA!NED SYSTEM 0 16,158 27,677 13,851 66,464 82,389 42,D71 74,537 164,588 37,938 3,753 432 1,1j27 530,985 ===================================================================================================================================1==========
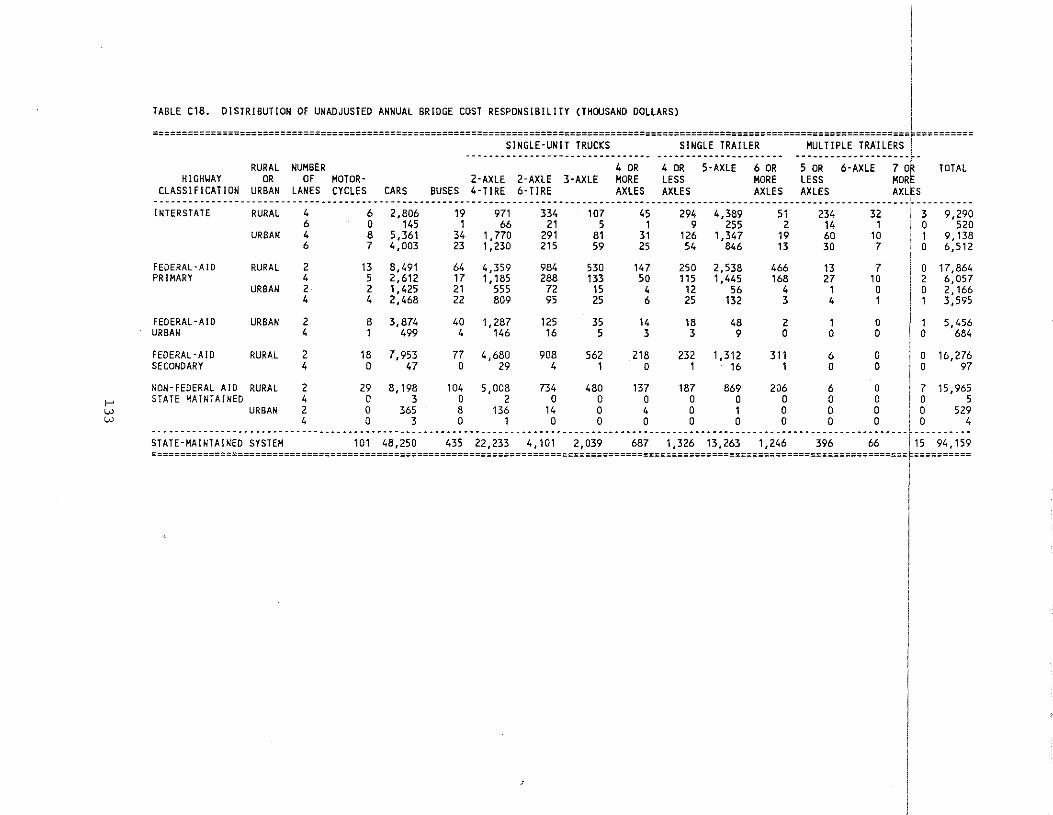
>-" w w
TABLE C18- DISTRIBUTION Of UNADJUSTED ANNUAL BRIDGE COST RESPONSIBILITY (THOUSAND DOLLARS)
============================================================================================================================================== SINGLE-UNIT TRUCKS SINGLE TRAILER MULTIPLE TRAILERS
RURAL NUMBER 4 OR 4 OR 5-AXLE 6 OR 5 OR 6-AXLE 7 OR TOTAL HIGH~AY OR Of MOTOR- 2-AXLE 2-AXLE 3-AXLE MORE LESS MORE LESS MOR
-~=~::~~~~~:~~~--~~~~~--=~~:: __ :~~=:: ___ ~~~:----~~::: __ ~::~~: __ ~::~~:-----------~~=:: ___ ~~=:: ___________ ~~=:: ___ ~~::: ___________ ~~=~: ________ _ INTERSTATE RURAL 4 6 2,806 19 971 334 107 45 294 4,389 51 234 32 I 3 9,290
FEDERAL· AID PRIMARY
FEDERAL -AID URBAN
fEOERAL-AIO SECONDARY
URBAN
RURAL
URBAN
URBAN
RURAL
6 . o 145 , 66 21 5 , 9 255 2 14 , I o 520 4 8 5,361 34 1,770 291 81 31 126 1,347 19 60 10 1 9,138 6 7 4,003 23 1,230 215 59 25 54 846 13 30 7 0 6,512
2 13 8,491 64 4,359 984 530 147 250 2,538 466 13 7 I o 17,864 4 5 2,612 17 1,185 288 133 50 115 1,445 168 27 10 1 2 6,057 2 2 1,425 21 555 72 15 4 12 56 4 1 0 I 0 2,166 4 4 2,468 22 8a9 95 25 6 25 n2 3 4 , 1 , 3,595
2 8 3,874 40 1,287 125 35 14 18 48 2 , a I , 5,456 4 , 499 4 146 16 5 3 3 9 o o o 1 o 684
I
2 18 7,953 77 4,680 908 562 218 232 , ,312 311 6 o I o 16,276 4 0 47 0 29 4 1 0 1 16 1 0 0 0 97
NON-FEDERAL AID RURAL 2 29 8,198 104 5,008 734 480 137 187 869 206 6 0 I 7 15,965 STATE MAINTAINED 4 0 3 0 2 0 0 0 0 0 0 0 0 I 0 5
URBAN 2 0 365 8 136 14 0 4 0 1 0 0 0 0 529 4 0 3 0 1 0 0 0 0 0 0 0 0 IO 4
--------····---------------·-······------------------------------------------------------------------------------------------------r----------STATE-MAINTAINEO SYSTEM 101 48,250 435 22,233 4,101 2,039 687 1,326 13,263 1,246 396 66 j 15 94,159 ===================================================================================================================================r==========
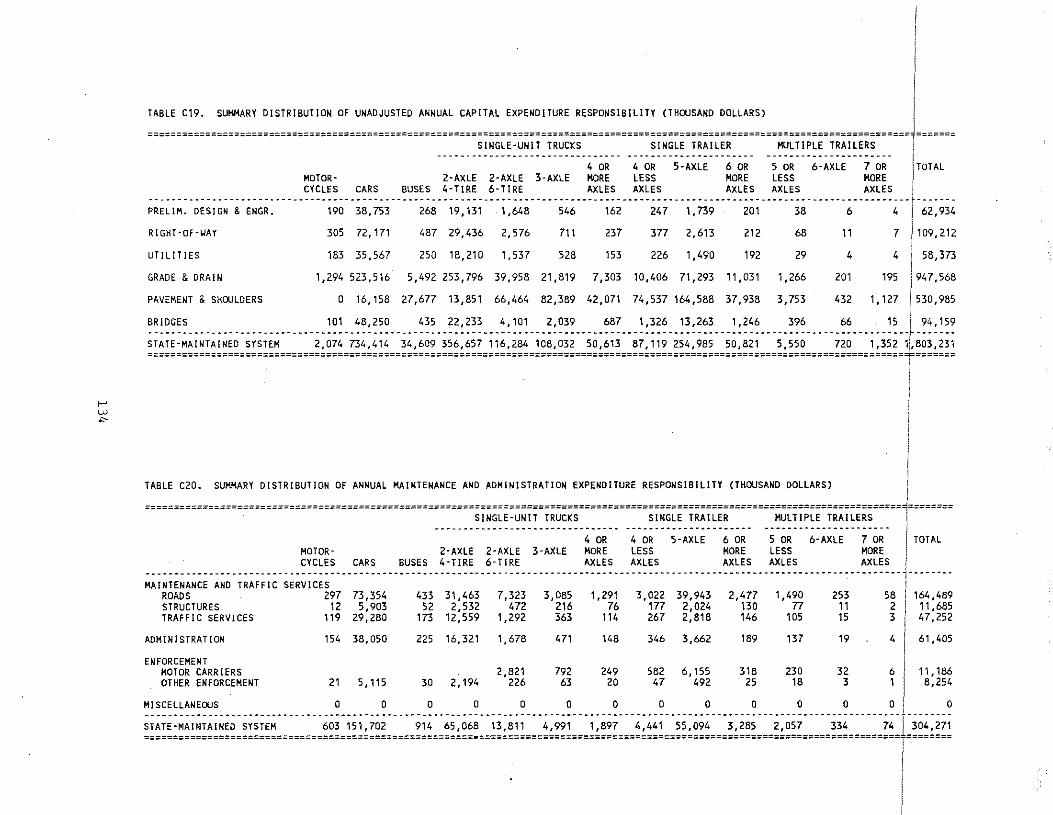
1-' w .,.
TABLE C19. SUMMARY DISTRIBUTION OF UNADJUSTED ANNUAL CAPITAL EXPENDITURE RESPONSIBILITY (THOUSAND DOLLARS)
PRELIM. DESIGN & ENGR.
RIGHT·OF-I,JAY
UTILITIES
GRADE & DRAIN
PAVEMENT & SHOULDERS
MOTOR· CYCLES CARS
190 38,753
305 72,171
183 35,567
SINGLE·UNIT TRUCKS SINGLE TRAILER -------------------------------- ----------------------
2·AXLE 2·AXLE BUSES 4·TIRE 6·TIRE
268 19,131 1,648
487 29,436 2,576
250 18,210 1,537
3·AXLE
546
711
528
4 OR MORE AXLES
162
237
153
4 OR 5-AXLE LESS AXLES
247 1,739
377 2,613
226 1,490
6 OR MORE AXLES
201
212
192
MULTIPLE TRAILERS ----------------------5 OR LESS AXLES
38
68
29
6·AXLE
6
11
4
7 OR MORE AXLES
I TOTAL
4 62,934
7 109,212
4 58,373
1,294 523,516 5,492 253,796 39,958 21,819 7,303 10,406 71,293 11,031 1,266
0 16,158 27,677 13,851 66,464 82,389 42,071 74,537 164,588 37,938 3,753
201 195 1947,568
432 1, 121 1 53o, 985
BRIDGES 101 48,250 435 22,233 4,101 2,039 687 1,326 13,263 1,246 396 66 15 194,159 --------------------------------------------------------------------------------------------------------------------------------------------STATE·MAINTAINEO SYSTEM 2,074 734,414 34,609 356,657 116,284 108,032 50,613 87,119 254,985 50,821 5,550 720 1,352 11,803,231 ====================================================================================================================================r=======
I
TABLE C20. SUMMARY DISTRIBUTION OF ANNUAL MAINTENANCE AND ADMINISTRATION EXPENDITURE RESPONSIBILITY (THOUSAND DOLLARS) I ===================================================================================================================================1========
SINGLE-UNIT TRUCKS SINGLE TRAILER MULTIPLE TRAILERS I
-------------------------------- -----·---------------- ---------------~~-~~~~ I 4 OR 4 OR S·AXLE 6 OR 5 OR 6·AXLE 7 OR I TOTAL
MOTOR· 2·AXLE 2·AXLE 3·AXLE MORE LESS MORE LESS MORE CYCLES CARS BUSES 4-TIRE 6~TIRE AXLES AXLES AXLES AXLES AXLES /
~~~~~~-~~~~---~~--~---------------------~-------------~--·-~-----------------------------------------------------------~------------;--------MAINTENANCE AND TRAFFIC
ROADS STRUCTURES TRAFFIC SERVICES
ADMINISTRATION
ENFORCEMENT MOTOR CARRIERS OTHER ENFORCEMENT
SERVICES 297
12 119
73,354 5,903
29,280
154 38,050
21 5,115
433 52
173
31,463 2,532
12,559
225 16,321
30 2,194
7,323 472
1,292
1,678
2,821 226
3,085 216 363
471
792 63
1 '291 76
114
148
249 20
3,022 177 267
346
582 47
39,943 2,024 2,818
3,662
6,155 492
z,4n 130 146
189
318 25
1,490 77
105
137
230 18
253 11 15
19
32 3
58 2 3
164,489 11,685 47,252
4 1 61 ,405
611 11,186 1 8, 254
MISCELLANEOUS 0 0 0 0 0 0 0 0 0 0 0 0 0 I 0 -----------------------------------------------------------------------------------------------------------------------------------l. ______ _ STATE·MAINTAINEO SYSTEM 603 151,702 914 65,068 13,811 4,991 1,897 4,441 55,094 3,285 2,057 334 74 1 304,271 ~~~~~-~~~-~~~--~~···~~~-~~~~~~~--~~~--~~-·~·~··~···~~···~~-~~··~~~··~~~-~~~.~~-~~~~-~~··~~··~~~-~~~·~·~~~~~·~~·~·~·····~·~~~--~~-·~~
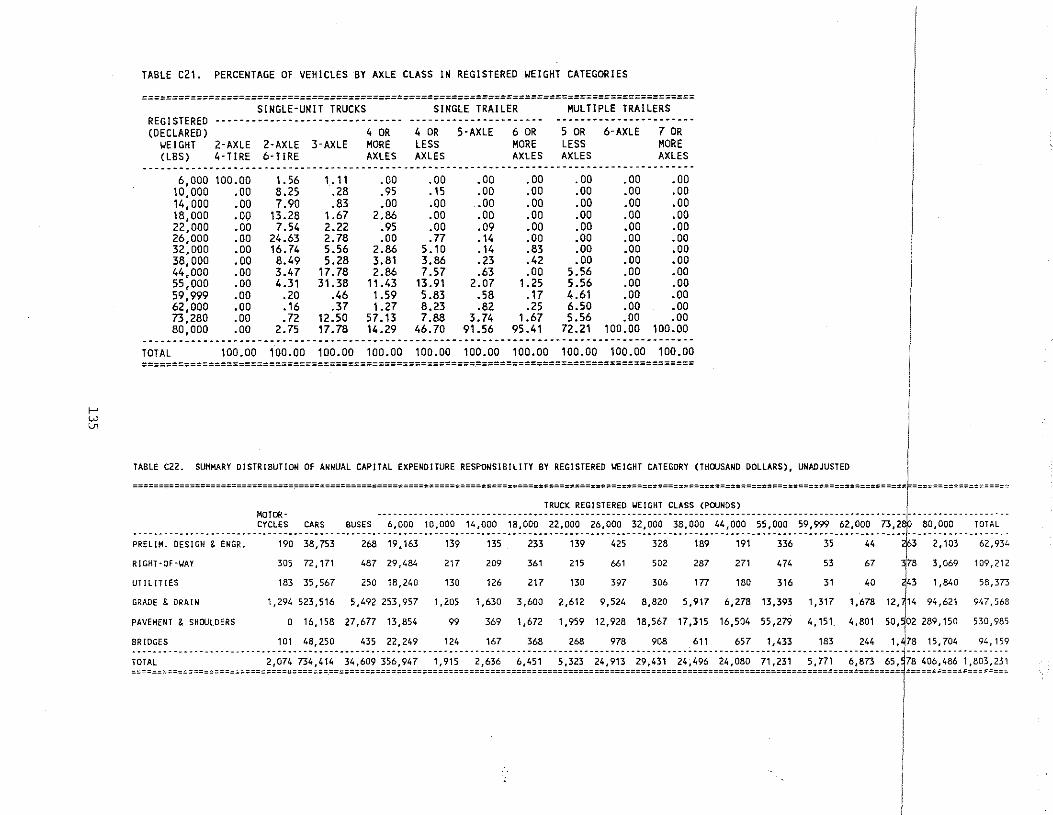
>-' w l.n
TABLE C21. PERCENTAGE Of VEHICLES BY AXLE CLASS IN REGISTERED ~EIGHT CATEGORIES
=========================================================================================== SINGLE-UNIT TRUCKS SINGLE TRAILER MULTIPLE TRAILERS
REGISTERED ------------------------------- ---------------------- -----------------------(DECLARED) 4 OR 4 OR 5-AXLE 6 OR 5 OR 6-AXLE 7 OR ~EIGHT 2-AXLE 2-AXLE 3-AXLE MORE LESS MORE LESS MORE (LBS) 4-TIRE 6-TIRE AXLES AXLES AXLES AXLES AXLES
6,000 100.00 1. 56 1 . 11 .00 .00 -DO .00 .00 .00 .00 10,000 .00 8.25 .28 .95 . 15 .00 .00 .00 .00 .00 14,000 .00 7.90 .83 .00 .00 .00 .00 .00 .00 .00 18,000 .00 13.28 1.67 2.86 .oo .00 .00 .00 .00 .00 22,000 .00 7.54 2.22 .95 .00 .09 .00 .00 .00 .oo 26,000 .oo 24.63 2.78 .00 .77 .14 .00 .00 .DO .00 32,000 .00 16.74 5.56 2.86 5.10 .14 .83 .00 .00 .00 38,000 .00 8.49 5.28 3.81 3.86 .23 .42 .00 .oo .00 44,000 .00 3.47 17.78 2.86 7.57 .63 .00 5.56 .00 .00 55,000 .00 4.31 31.38 11.43 13.91 2.07 1.25 5.56 .00 .00 59,999 .00 .20 .46 1.59 5.83 .58 .17 4.61 .00 .00 62,000 .00 .16 .37 1.27 8.23 .82 .25 6.50 .00 .00 73,280 .00 .72 12.50 57.13 7.88 3. 74 1.67 5.56 .DO .00 80,000 .00 2. 75 17.78 14.29 46.70 91.56 95.41 72.21 100_00 100.00
-------------------------------------------------------------------------------------------TOTAL 100.00 100.00 100.00 100.00 100.00 100.00 100.00 100.00 100.00 100.00 ===========================================================================================
TABLE C22. SUMMARY DISTRIBUTIOM Of ANNUAL CAPITAL EXPENDITURE RESPONSIBILITY BY REGISTERED YEIGHT CATEGORY (THOUSAND DOLLARS), UNADJUSTED l ====================================================================================================================================================~- ===================
TRUCK REGISTERED ~EIGHT CLASS (POUNDS) MOTOR. ------.---.-------- •• ----------------.-------.--.------- ••• --- M. --- ••••••••••• ---.- •••• -- •• -- •• - •••••• ---.----.-- •••••••• -
CYCLES CARS BUSES 6,000 10,000 14,000 18,000 22,000 26,000 32,000 38,000 44,000 55,000 59,999 62,000 73,2 80,000 TOTAL . ---.------------------- .. -----.---.-------.---- ----- ----- ------ .... -----. ---------- .. ---. --.------- ----- ----- --------------------- ----------------.-----. -
PRELIM. DESIGN & ENGR. 190 38,753 268 19,163 139 135 233 139 425 328 189 191 336 35 44 3 2,103 62,934
RIGHT·OF-YAY 305 72,171 487 29,484 217 209 361 215 661 502 287 271 474 53 67 i 8 3,069 109,212
UTILITIES 183 35,567 250 18,240 130 126 217 130 397 306 tn 180 316 31 40 443 1,840 58,373
GRADE & DRAIN 1,294 523,516 5,492 253,957 1,205 1,630 3,600 2,612 9,524 8,820 5,917 6,278 13,393 1,317 1,678 12,~14 94,621 947,568
PAVEMENT & SHOULDERS 0 16,158 27,677 13,854 99 369 1,672 1,959 12,928 18,567 17,315 16,504 55,279 4,151 4,801 50,~02 289,150 530,985
BRIDGES 101 48,250 435 22,249 124 167 368 268 978 908 611 657 1,433 183 244 1,~78 15,704 94,159 0 0 0 o 0 0 0 • • o 0 0 o o o 0 0 o o o o 0 • o 0 0 0 o 0 0 0 0 o 0 0 0 0 o o 0--- o 0 0 0 o o o 0 0 0 0 0 + 0 • • 0 0 0 0 o 0 0 0 • o o 0 • 0 o o 0 0 0 o o 0 0 o • 0 0 0 + • o o 0 0 o 0 o 0 0 • o 0 0 0 0 o o 0 0 0 o o 0 0 0 • o 0 0 0 • oM 0 0 M 0 0 0 0 0 0 0 0 0 "• o 0 0 • 0--0 • • 0 0 -1· 0 0 0 • 0 0 0 0 • 0 0 0 • • • • 0 • •
TOTAL 2,074 734,414 34,609 356,947 1,915 2,636 6,451 5,323 24,913 29,431 24,496 24,080 71,231 S,n1 6,873 65,r8 406,486 1,803,231 ""===="==="===="===="========"===="=========="===""==="===="===="===="======="""========""===""====""==="="==="==="===="===="======"==:""==::::=="== /::===::===::==""====
I
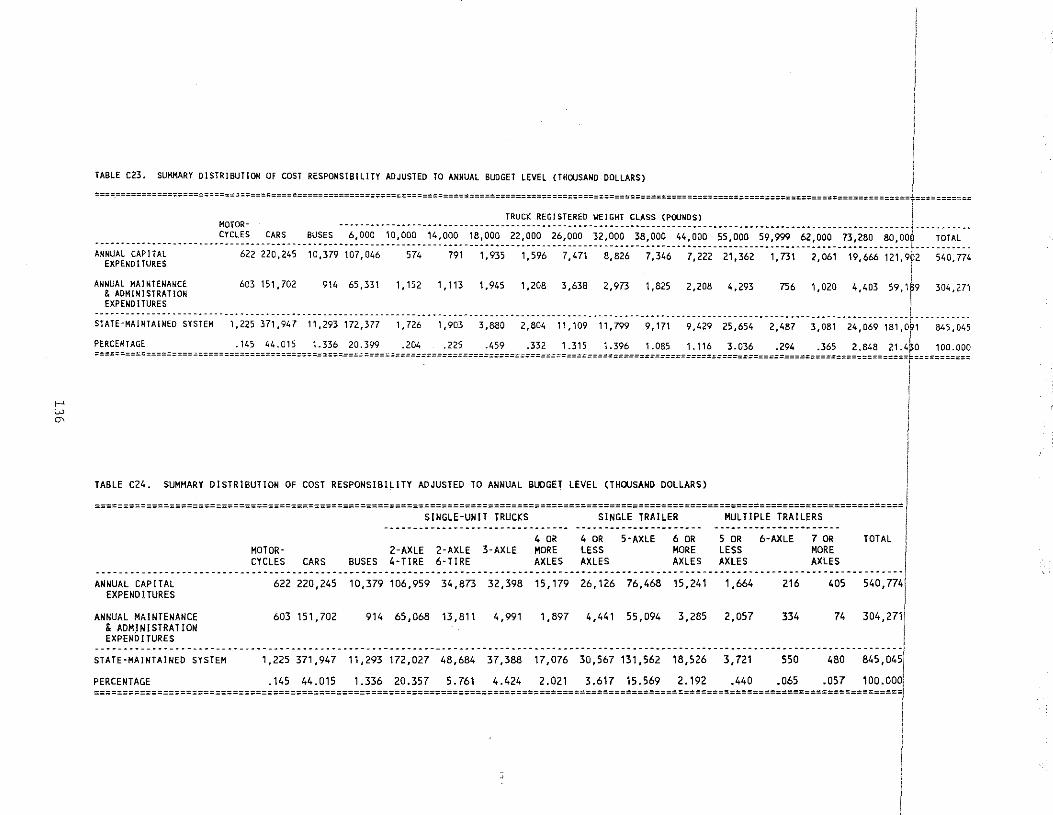
r' w
"'
TABLE C23. SUMMARY DISTRIBUTION OF COST RESPONSIBILITY ADJUSTED TO ANNUAL BUDGET LEVEL (THOUSAND DOLLARS)
===~========================================================================================================================================================= =========== TRUCK REGISTERED ~EIGHT CLASS (POUNDS) I MOTOR
CYCLES CARS BUSES 6,000 10,000 14,000 18,000 "················+·""""" ....
22,000 26,000 32,000 38,000 44,000 55,000 59,999 62,000 n,280 80,00«! TOTAL
ANNUAL CAPITAl EXPENDITURES
ANNUAL MAINTENANCE & ADMINISTRATION EXPENDITURES
622 220' 245
603 151,702
10,379 107,046 574
914 65,331 1' 152
791 1, 935 1,596 7,471 8,826 7,346 1,222 21,362 1,731 2,061 19,6&;·;;;;9~;···;;a:774
1 '113 1,945 1.208 3,638 2.973 1.825 2.208 4.293 756 1,020 4,403 59. 1r9 304.271
STATE-MAIN~~~~~~-~;~;~~---,~zzs·;r;:;4r··;;:;;;·;?;:;rr···;:?z6·-·;:;~;-··;:;;~-·-z:eo4·-;;:;o;··;;:?g;··-9:t7t--·;:4z;··zs:6s4··-z:~~r···;:oe;--z~:o69-;~;:o~;---~s:o4s PERCENTAGE .145 t.4.015 1.336 20.399 .204 .225 .459 .332 1.315 1.396 1.085 1.116 3.036 .294 .365 2,848 21.4~0 100.000 =============================================================================================================================================================r===========
TABLE C24. SUMMARY DISTRIBUTION OF COST RESPONSIBILITY ADJUSTED TO ANNUAL BUDGET LEVEL (THOUSAND DOLLARS) I ============================================================================================================================================/
SINGLE-UNIT TRUCKS SINGLE TRAILER MULTIPLE TRAILERS I -·------------------------------ ----···············-·· ·······-···········-·· I
4 OR 4 OR 5-AXLE 6 OR 5 OR 6-AXLE 7 OR TOTAL I MOTOR· 2-AXLE 2·AXLE 3-AXLE MORE LESS MORE LESS MORE • CYCLES CARS BUSES 4-TIRE 6-TIRE AXLES AXLES AXLES AXLES AXLES I
--------------------------------------------------------------------------------------------------------------------------------------------1 ANNUAL CAPITAL 622 22D,245 1D,379 1D6,959 34,873 32,398 15,179 26,126 76,468 15,241 1,664 216 4D5 54D,774'1
EXPENDITURES
ANNUAL MAINTENANCE 6D3 151,7D2 914 65,D68 13,811 4,991 1,897 4,441 55,D94 3,285 2,D57 334 74 3D4,2711 & ADMINISTRATION EXPENDITURES 1
--------------------------------------------------------------------------------------------------------------------------------------------1 STATE-MAINTAINED SYSTEM 1,225 371,947 11,293 172,D27 48,684 37,388 17,D76 3D,567 131,562 18,526 3,721 55D 48D 845,D45,.
PERCENTAGE .145 44.D15 1.336 2D.357 5.761 4.424 2.021 3.617 15.569 2.192 .44D .D65 .057 1DD.DDD1 ============================================================================================================================================!
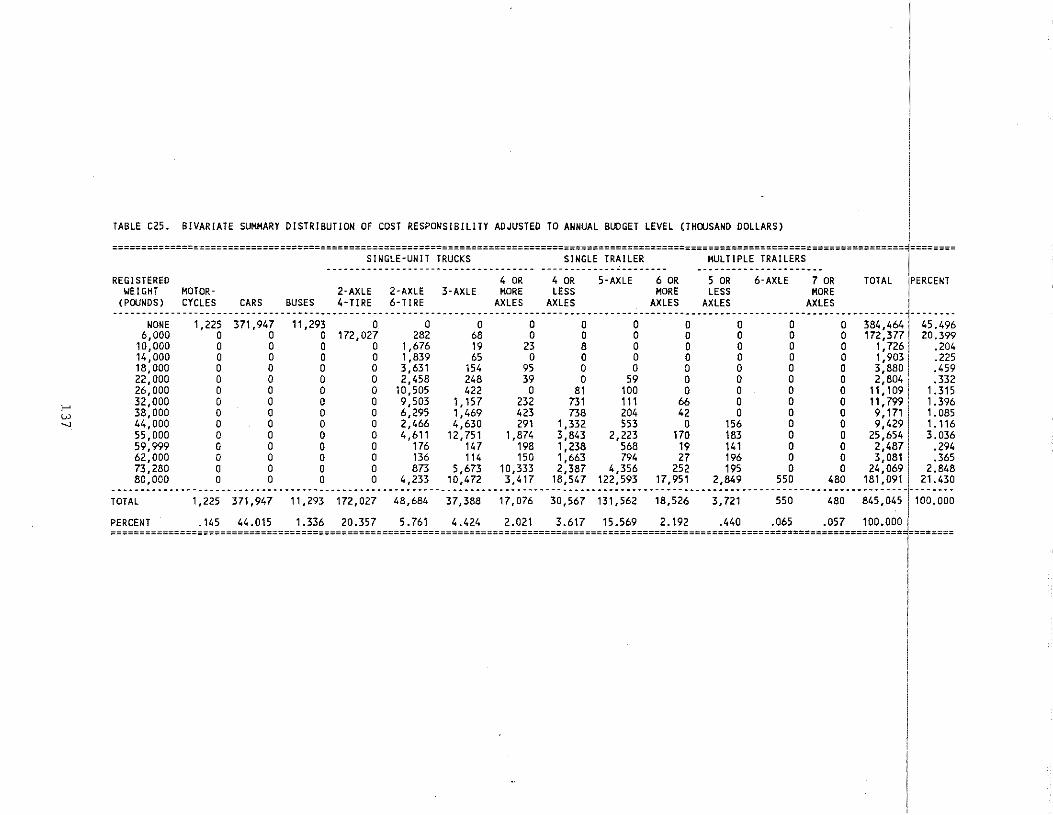
,... w "
TABLE C25. BIVARIATE SUMMARY DISTRIBUTION Of COST RESPONSIBILITY ADJUSTED TO ANNUAL BUDGET LEVEL (THOUSAND DOLLARS) I
=========================================================================================================================================,======== SINGLE-UNIT TRUCKS SINGLE TRAILER MULTIPLE TRAILERS I
····----············-··············· ---··········'·------- ················----·· I REGISTERED 4 OR 4 OR S·AXLE 6 OR 5 OR 6·AXLE 7 OR TOTAL !PERCENT
WEIGHT MOTOR· 2·AXLE 2·AXLE 3·AXLE MORE LESS MORE LESS MORE 1 (POUNDS) CYCLES CARS BUSES 4-TIRE 6-TIRE AXLES AXLES AXLES AXLES AXLES I
··----············---·········--··----···-···························--·-----·············-············---·-···········-----·-------·····j········ NONE 1,225 371,947 11,293 D D 0 0 0 0 0 0 0 D 384,4641 45.496
6,000 0 D 0 172,027 282 68 0 0 0 0 0 0 0 172,37711 20.399 10,000 0 0 0 0 1,676 19 23 8 0 0 0 0 0 1,726 .204 14,000 0 0 0 0 1,839 65 0 0 0 0 0 0 0 1,9031 .225 18,000 0 0 0 0 3,631 154 95 0 0 0 0 0 0 3,880 .459 22,000 0 0 D 0 2,458 248 39 0 59 0 0 0 0 2,804 I .332 26,000 0 0 0 0 10,505 422 0 81 100 0 0 0 0 11,1091 1.315 32,000 o o o o 9,503 1,157 232 731 111 66 o o o 11,799 I 1.396 38,000 0 0 0 0 6,295 1,469 423 738 204 42 0 0 0 9,1711 1.085 44,000 0 0 0 0 2,466 4,630 291 1,332 553 0 156 0 0 9,429 1.116 55,000 0 0 0 0 4,611 12,751 1,874 3,843 2,223 170 183 0 0 25,654 3.036 59,999 0 0 0 0 176 147 198 1,238 568 19 141 0 0 2,487 .294 62,000 0 0 0 0 136 114 150 1,663 794 27 196 0 0 3,081 .365 73,280 0 0 0 0 873 5,673 10,333 2,387 4,356 252 195 0 0 24,069 2.848 80,000 0 0 0 0 4,233 10,472 3,417 18,547 122,593 17,951 2,849 550 480 181,091 21.430
TOTAL 1,225 371,947 11,293 172,027 48,684 37,388 17,076 30,567 131,562 18,526 3,721 550 480 845,045 I 10o.ooo
PERCENT .145 44.015 1.336 20.357 5.761 4.424 2.021 3.617 15.569 2.192 .440 .065 .057 100.0001 =========================================================================================================================================,========
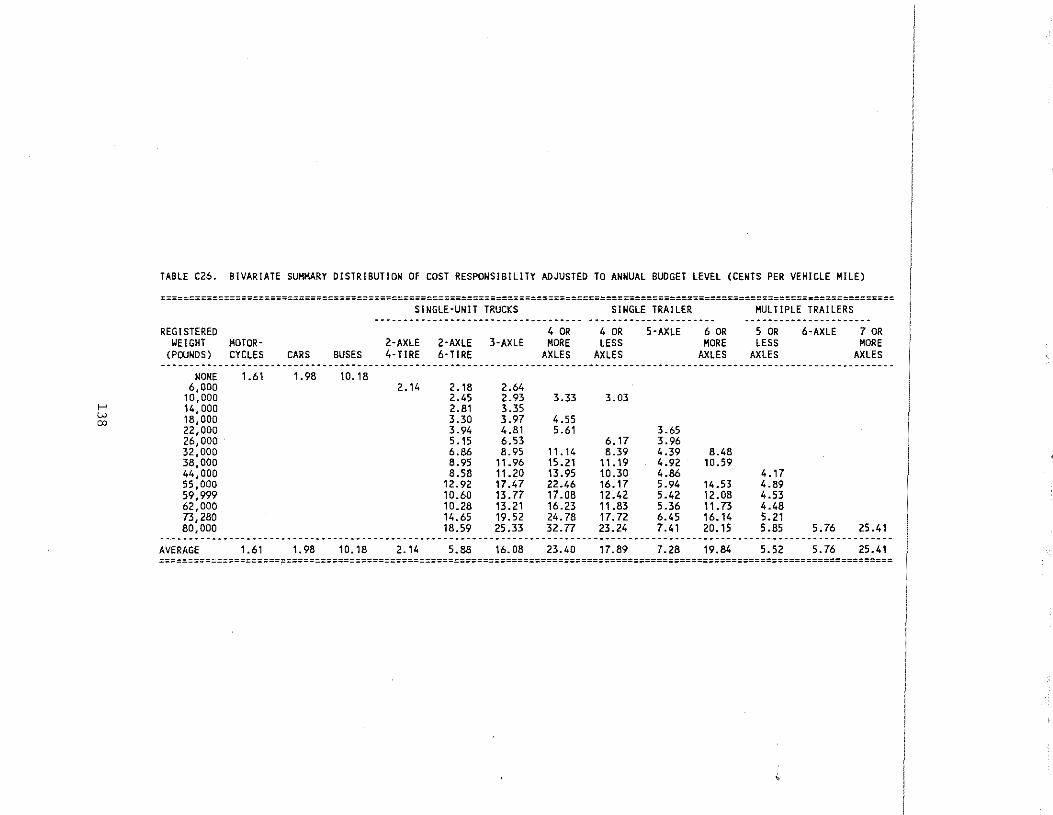
>-" w 00
TABLE C26. BIVARIATE SUMMARY DISTRIBUTION OF COST RESPONSIBILITY ADJUSTED TO ANNUAL BUDGET LEVEL (CENTS PER VEHICLE MILE)
===============================================================================================================================
REGISTERED WEIGHT MOTOR
(POUNOS) CYCLES
NONE 1.61 6,000
10,000 14,000 18,000 22,000 26,000 32,000 38,000 44,000 55,000 59,999 62,000 73,280 80,000
CARS BUSES
1.98 10.18
SINGLE-UNIT TRUCKS SINGLE TRAILER
4 OR 2-AXLE 2-AXLE 3-AXLE MORE 4-TIRE 6-TIRE AXLES
2.14 2.18 2.64 2.45 2.93 3.33 2.81 3.35 3.30 3.97 4.55 3.94 4.81 5.61 5.15 6.53 6.86 8.95 11.14 8.95 11.96 15.21 8.58 11.20 13.95
12.92 17.47 22.46 10.60 13.77 17.08 10.28 13.21 16.23 14.65 19.52 24.78 18.59 25.33 32.77
4 OR LESS
AXLES
3.03
6.17 8.39
11. 19 10.30 16.17 12.42 11.83 17.72 23.24
5-AXLE 6 OR MORE
AXLES
3.65 3.96 4.39 8.48 4.92 10.59 4.86 5.94 14.53 5.42 12.08 5.36 11.73 6.45 16.14 7.41 20.15
MULTIPLE TRAILERS
5 OR LESS
AXLES
4.17 4.89 4.53 4.48 5.21 5.85
6-AXLE 7 OR
5. 76
MORE AXLES
25.41 ~------------------------------------------------------------------------------------------------------------------------------AVERAGE 1.61 1.98 10.18 2.14 5.88 16.08 23.40 17.89 7.28 19.84 5.52 5.76 25.41 ===============================================================================================================================
'··
APPENDIX D
FY 1991 REVENUE ALLOCATION TABLES

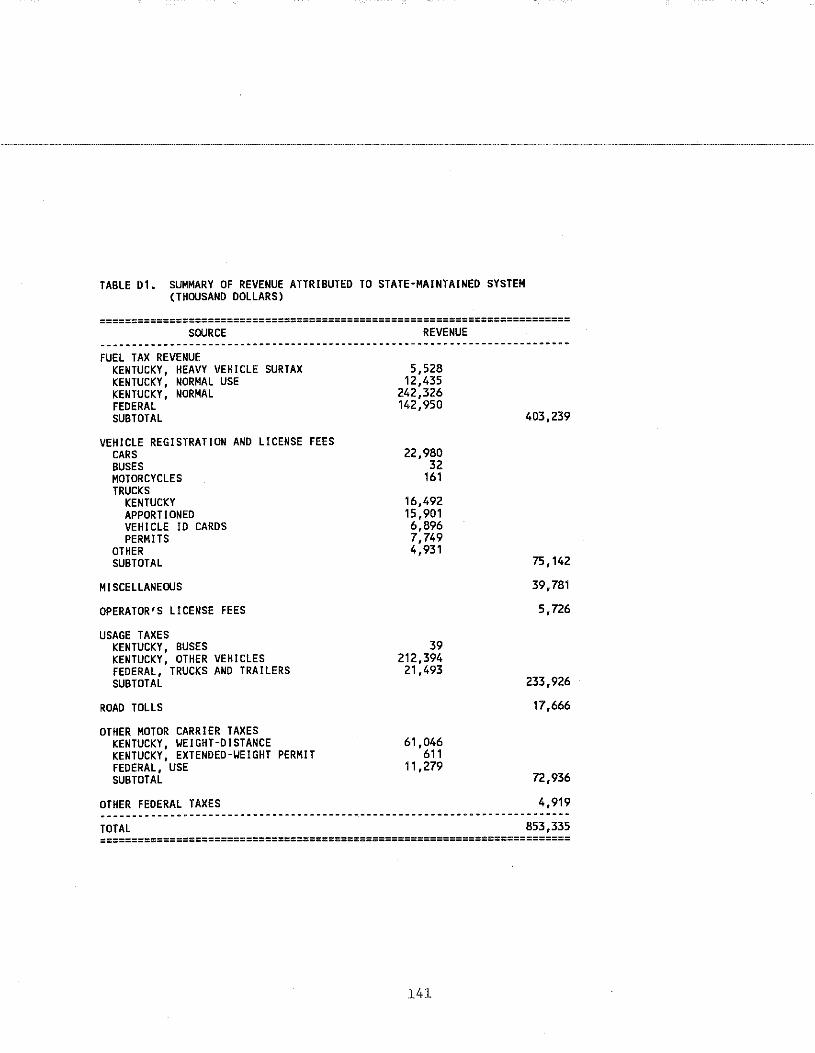
TABLE 01. SUMMARY OF REVENUE ATTRIBUTED TO STATE-MAINTAINED SYSTEM (THOUSAND DOLLARS)
========================================================================== SOURCE REVENUE
FUEL TAX REVENUE KENTUCKY, HEAVY VEHICLE SURTAX 5,528 KENTUCKY, NORMAL USE 12,435 KENTUCKY, NORMAL 242,326 FEDERAL 142,950 SUBTOTAL 403,239
VEHICLE REGISTRATION AND LICENSE FEES CARS 22,980 BUSES 32 MOTORCYCLES 161 TRUCKS
KENTUCKY 16,492 APPORTIONED 15,901 VEHICLE ID CARDS 6,896 PERMITS 7, 749
OTHER 4,931 SUBTOTAL 75.142
MISCELLANEOUS 39,781
OPERATOR'S LICENSE FEES 5,726
USAGE TAXES KENTUCKY, BUSES 39 KENTUCKY, OTHER VEHICLES 212,394 FEDERAL, TRUCKS AND TRAILERS 21,493 SUBTOTAL 233,926
ROAD TOLLS 17,666
OTHER MOTOR CARRIER TAXES KENTUCKY, ~EIGHT-DISTANCE 61,046 KENTUCKY, EXTENDED-~EIGHT PERMIT 611 FEDERAL, USE 11,279 SUBTOTAL 72,936
OTHER FEDERAL TAXES 4,919 ~----~--------------------------------------------------------------------TOTAL 853,335 ==========================================================================
141
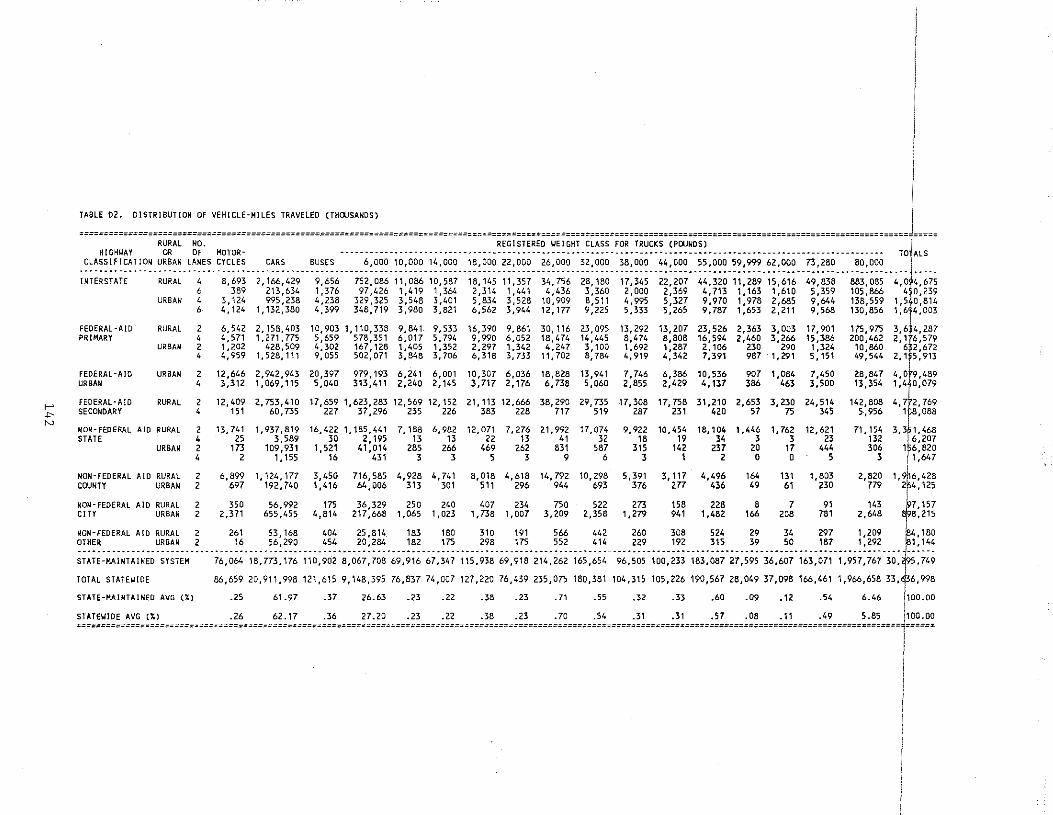
I TABLE 02. DISTRIBUTION DF VEHICLE-HILES TRAVELED (THOUSANDS) I ====~====================================================================================================================================================================-=====
RURAL NO. REGISTERED UEIGHT CLASS FOR TRUCKS (POUNDS) I HIGHWAY OR OF MOTOR- ·-- -- ·--- • ··- • ·----- • ·--- • • ·- • • ·-- -· • ·-- • • • ·-- • ----- • ---- • • ·-- • ---------- • • --- • --- ·- • • --- • ---- •• ·-- -- • ---- ·-- • • TO ALS
CLASSIFICATION URBAN LANES CYCLES CARS BUSES 6,000 10,000 14,000 18,000 22,000 26,000 32,000 38,000 44,000 55,000 59,999 62,000 73,280 80,000 --.----------------------------------------------------------------------------------------------- ...... --------. ·---- ------------------- ... --- .. ----.------------------- -----INTERSTATE RURAL 4 8,693 2,166,429 9,656 752,086 11,086 10,587 18,145 11,357 34,756 28,180 17,345 22,207 44,320 11,289 15,616 49,838 883,085 410,4 1675
6 389 2131634 1,376 971426 11419 11364 21314 11441 4,436 31360 2,000 2,369 41713 1,163 1,610 51359 105,866 4$0,239 URBAN 4 3,124 995,238 4,238 329,325 3,548 31401 5,834 3,528 10,909 8,511 4,995 5,327 9,970 1,978 2,685 9,644 138,559 1,540,814
6 4,124 1,132,380 4,399 348,719 3,980 3,821 6,562 3,944 12,177 9,225 51333 5,265 9,787 1,653 2,211 9,568 130,856 1,6,4,003
FEDERAL-AID RURAL 2 6,542 2,158,403 10,903 1,110,338 91841 9,533 16,390 9,861 30,116 23,095 13,292 13,207 23,526 2,363 3,003 171901 175,975 316 4,287 PRIMARY 4 4,571 1,271,775 5,659 578 1351 6,017 5,794 9,990 6,052 18,474 14,445 8,474 8,808 16,594 21460 3,266 15,386 200,462 2,1 6,579
URBAN 2 1,202 428,509 4,302 167,128 1,405 1,352 2,297 1,342 4,247 3,100 1,692 1,287 2,106 230 290 1,324 10,860 6~2,672 4 4,959 1,528,111 9,055 502,071 3,848 31706 6,318 31733 11,702 8,784 4,919 4,342 7,391 987 1,291 5,151 49,544 2, 1~5,913
FEDERAL-AID URBAN 2 12,646 2,9421943 201397 979,193 6,241 6,001 10,307 6,036 18,828 13,941 7, 746 6,386 10,536 907 1,084 7,450 28,847 ·r·· URBAN 4 3,312 1 ,069,115 5,040 313,411 2,240 2,145 3,717 2,176 6,738 5,060 2,855 2,429 4,137 386 463 3,500 13,354 1,4 0,079
>-' FEDERAL-AID RURAL 2 12,409 2,753,410 17,659 1,623,283 12,569 12,152 21,113 121666 38,290 29 I 735 17,308 17,758 31,210 2,653 3,230 24,514 142,808 4, 7 2,769
-!> SECONDARY 4 151 601735 227 37,296 235 226 383 228 717 519 287 231 420 57 75 345 5·,956 1 8,088 N
NON-FEDERAL AID RURAL 2 13,741 1,937,819 16,422 11185,441 71188 6,982 121071 7, 276 21,992 17,074 9, 922 10,454 18,104 1,446 1, 762 12,621 71' 154 3,3 1,468 STATE 4 25 3,589 30 2,195 13 13 22 13 41 32 18 19 34 3 3 23 132 ~6,207
URBAN 2 173 109,931 1,521 41,014 285 266 469 262 831 587 315 142 237 20 17 444 306 1 6,820 4 2 , 1 155 16 431 3 3 5 3 9 6 3 1 2 0 0 5 3 i 1,647
NON-FEDERAL AID RURAL 2 6,899 1,124,177 3,450 716,585 4,928 4, 741 81018 4,618 14,792 10,298 5,391 3,117 4,496 164 131 1,803 2,820 1,9 6,428 COUNTY URBAN 2 697 192,740 1,416 64,006 313 301 511 296 944 693 376 277 436 49 61 230 779 2 4,125
NON-FEDERAL AID RURAL 2 350 56,992 175 36,329 250 240 407 234 750 522 273 158 228 8 7 91 143 7,157 CITY URBAN 2 21371 655,455 4,814 217,668 1,065 1,023 11738 1,007 3,209 2,358 1,279 941 1,482 166 208 781 2,648 8,215
NON-FEDERAL AID RURAL 2 261 53,168 404 25,814 183 180 310 191 566 442 260 308 524 29 34 297 1,209 4,180 OTHER URBAN 2 16 56,290 454 20,284 182 175 298 175 552 414 229 192 315 39 50 187 1,292 1,144 "----"-.-"---" ------.---.-------------.---.- .. ---- .. --.-----.--.----.----.--------.----------.----.--------------."- ------.----------------------------------.".-. ----.- -···--STATE-MAINTAINED SYSTEM 76,064 1817731176 110,902 8,067,708 69,916 67,347 115,938 69,918 214,262 165,654 96,505 100,233 183,087 27,595 36,607 163,071 1,957,767 30, 5 '749
TOTAL STATEWIDE 86,659 20,911,998 121,615 9,148,395 76,837 74,007 127,220 761439 235,075 180,381 104,315 105,226 190,567 28,049 37,098 166,461 1,966,658 33, 6,998
STATE-MAINTAINED AVG {%) .25 61.97 .37 26.63 .23 .22 .38 .23 .71 .55 .32 .33 .60 .09 .12 .54 6.46 1100.00
STATE'oiiDE AVG (%) .26 62.17 .36 27.20 .23 .22 .38 .23 .70 .54 .31 .31 .57 .08 .11 .49 5.85 f00.00 ================================================================================================================================================================:==:==:= ,=====:
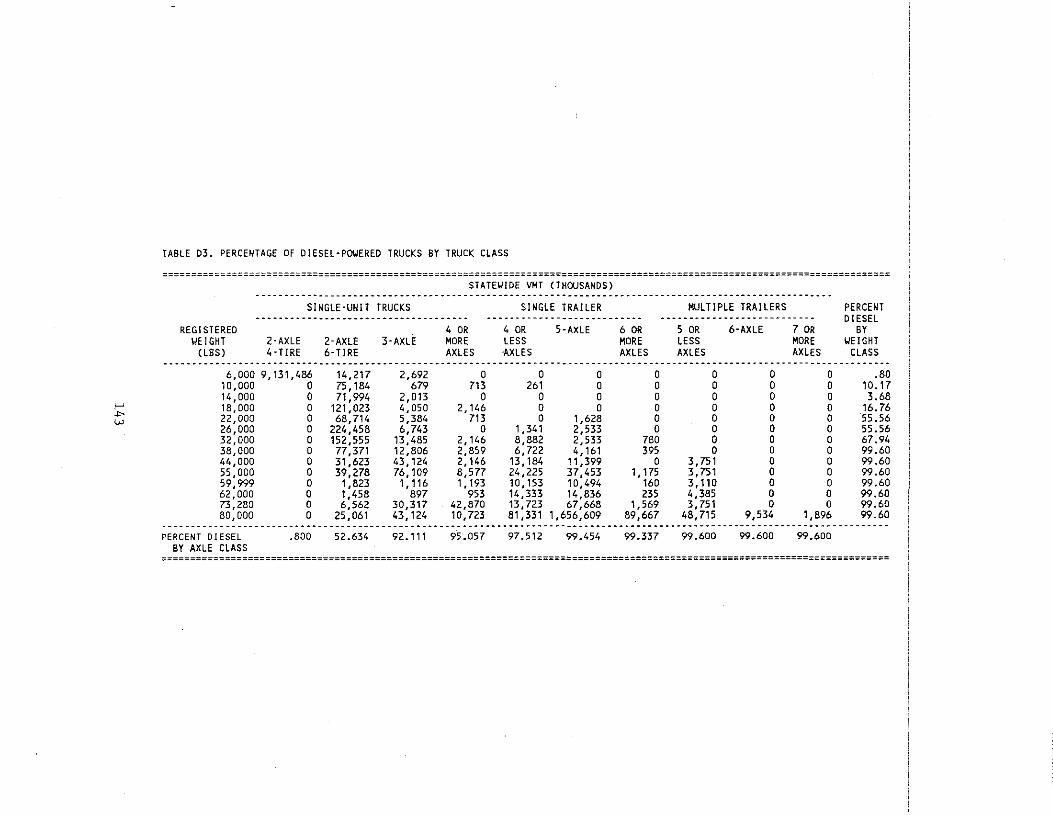
TABLE 03. PERCENTAGE OF DIESEL-POWERED TRUCKS BY TRUCK CLASS
============================================================================================================================== STATEUIOE VMT (THOUSANDS)
SINGLE-UNIT TRUCKS SINGLE TRAILER MULTIPLE TRAILERS PERCENT --------------------------···--·-···· -------------------·--····· --------------------------- DIESEL
REGISTERED 4 OR 4 OR 5-AXLE 6 OR 5 OR 6-AXLE 7 OR BY YEIGHT 2-AXLE 2-AXLE 3-AXLE MORE LESS MORE LESS MORE ~EIGHT
(LBS) 4-TIRE 6-TIRE AXLES -AXLES AXLES AXLES AXLES CLASS
6,000 9,131,486 14,217 2,692 0 0 0 0 0 0 0 .80 10,000 0 75,184 679 713 261 0 0 0 0 0 10.17 14,000 0 71,994 2,013 0 0 0 0 0 0 0 3.68
>--' 18,000 0 121,023 4,050 2,146 0 0 0 0 0 0 16.76 _,_ 22,000 0 68,714 5,384 713 0 1,628 0 0 0 0 55.56 w 26,000 0 224,458 6,743 0 1,341 2,533 0 0 0 0 55.56 32,000 0 152,555 13,485 2,146 8,882 2,533 780 0 0 0 67.94 38,000 0 77,371 12,806 2,859 6,722 4,161 395 0 0 0 99.60 44,000 0 31,623 43,124 2,146 13,184 11,399 0 3,751 0 0 99.60 55,000 0 39.278 76,109 8,577 24,225 37,453 1,175 3, 751 0 0 99.60 59.999 0 1,823 1, 116 1,193 10,153 10,494 160 3,110 0 0 99.60 62,000 0 1,458 897 953 14,333 14,836 235 4,385 0 0 99.60 73,280 0 6,562 30,317 42,870 13,723 67,668 1,569 3, 751 0 0 99.60 80,000 0 25,061 43,124 10,723 81,331 1,656,609 89,667 48,715 9,534 1,896 99.60
------------------------------------------------------------------------------------------------------------------------------PERCENT DIESEL .800 52.634 92.111 95.057 97.512 99.454 99.337 99.600 99.600 99.600
BY AXLE CLASS ==============================================================================================================================
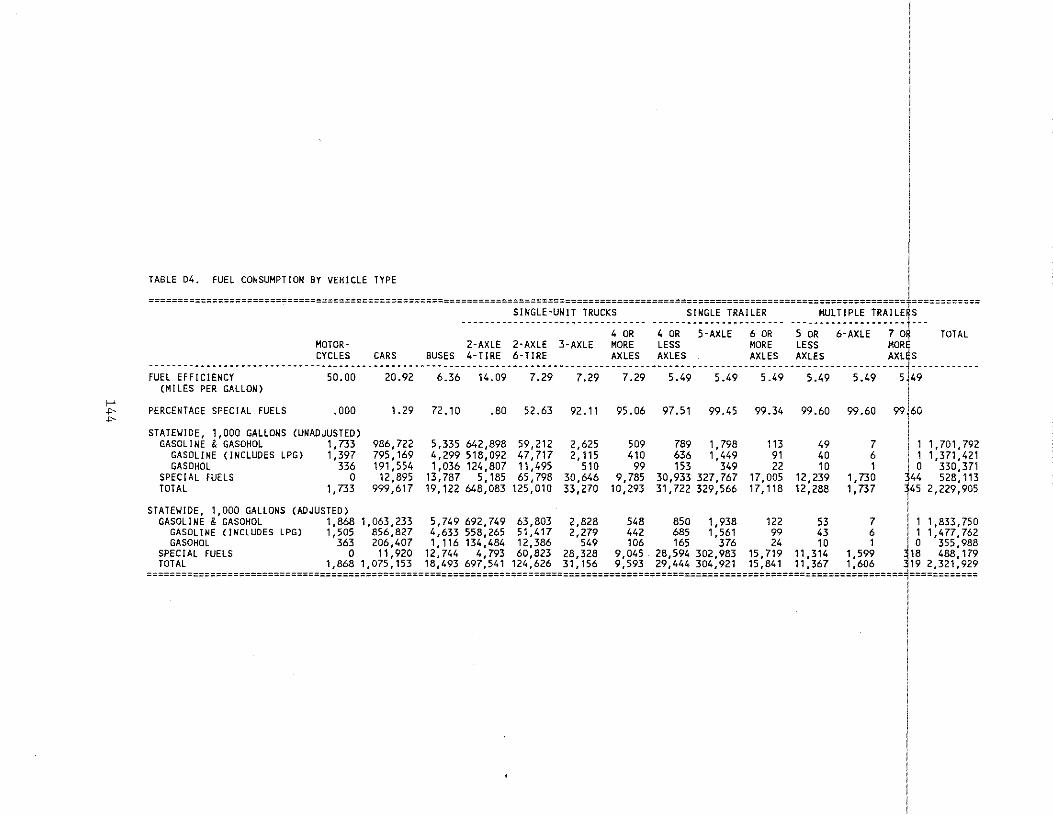
TABLE 04. FUEL CONSUMPTION BY VEHICLE TYPE
===================================================================================================================================+============ SINGLE-UNIT TRUCKS SINGLE TRAILER MULTIPLE TRAILERS
--------------------------4-~~-- -4-~~---S=~~~~---~-~~-- -S-~~---~=~~~~---7-~iJ___ TOTAL MOTOR- 2-AXLE 2-AXLE 3-AXLE MORE LESS MORE LESS MOR CYCLES CARS BUSES 4-TIRE 6-TIRE AXLES AXLES AXLES AXLES AXL S
-----------------------------------------------------------------------------------------------------------------------------------i------------FUEL EffiCIENCY 50.00 20.92 6.36 14.09 7.29 7.29 7.29 5.49 5.49 5.49 5.49 5.49 5~49
(MILES PER GALLON) I f-' I """'
PERCENTAGE SPECIAL FUELS .000 1.29 72.10 .80 52.63 92.11 95.06 97.51 99.45 99.34 99.60 99.60 99r0 """'
STATE~IDE, 1,000 GALLONS (UNADJUSTED) GASOLINE & GASOHOL 1, 733 986,722 5,335 642,898 59,212 2,625 509 789 1, 798 113 49 7 1 1 1,701,792
GASOLINE (INCLUDES LPG) 1,397 795,169 4,299 518,092 47,717 2, 115 410 636 1,449 91 40 6 1 1 1,371,421 GASOHOL 336 191,554 1,036 124,807 11,495 510 99 153 349 22 10 1 1 o 330,371
SPECIAL FUELS 0 12,895 13,787 5.185 65,798 30,646 9,785 30,933 327,767 17,005 12,239 1, 730 ~44 528,113 TOTAL 1. 733 999,617 19,122 648,083 125,010 33,270 10,293 31 ,722 329.566 17,118 12,288 11737 ~45 2,229,905
STATE~IDE, 1,000 GALLONS (ADJUSTED) GASOLINE & GASOHOL 1,868 1,063,233 5,749 692,749 63,803 2,828 548 850 1,938 122 53 7 I 1 1,833,750
GASOLINE (INCLUDES LPG) 1,505 856,827 4,633 558,265 51,417 2,279 442 685 1,561 99 43 6 I 1 1,477,762 GASOHOL 363 206,407 1,116 134,484 12,386 549 106 165 376 24 10 1 I 0 355,988
SPECIAL FUELS 0 11,920 12,744 4,793 60,823 28,328 9,045 28,594 302,983 15,719 11,314 1,599 318 488,179 TOTAL 1,868 1,075,153 18,493 697,541 124,626 31,156 9,593 29,444 304,921 15,841 11,367 1,606 319 2,321,929
===================================================================================================================================9============
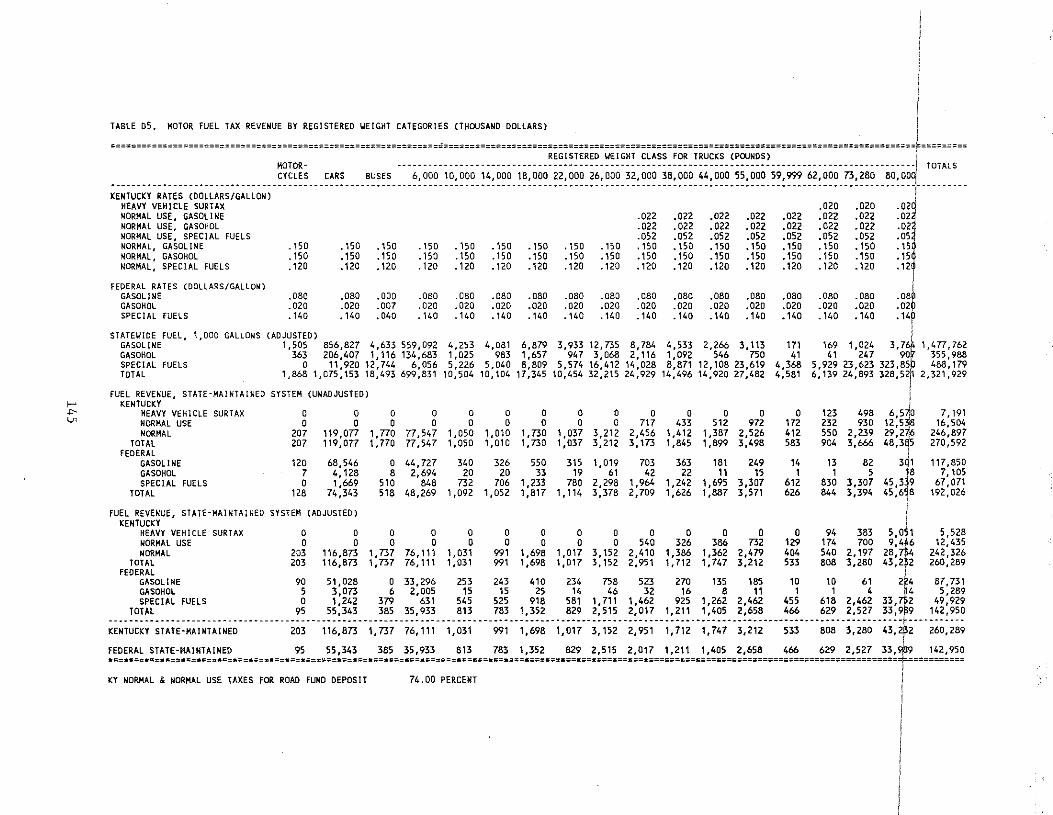
1-' ..,.. Ln
I ' I I
TABLE 05. MOTOR FUEL TAX REVENUE BY REGISTERED ~EIGHT CATEGORIES (THOUSAND DOLLARS) ' I ooooooooooooooooooooooooooooooooooooooooooooooooooooooooooooooo=ooooooooooooooooooooooooooooooooooooooooooooooooooo<oo:::::::::::::o::o::o::o::o::oo::o::o•r•==<o:ooo
REGISTERED ~EIGHT CLASS FOR TRUCKS (POUNDS) MOTOR- ----------------------------------------------------------------------·----------------------------~ TOTALS CYCLES CARS BUSES 6,000 10,000 14,000 18,000 22,000 26,000 32,000 38,000 44,000 55,000 59,999 62,000 73,280 80,00
----------------------------- ----------------------------------------------------------------------------------------------------------------------- -------1----------KENTUCKY RATES (DOLLARS/GALLON) I
HEAVY VEHICLE SURTAX .020 .020 .02~ NORMAL USE, GASOLINE .022 .022 .022 .022 .022 .ozz .022 .02 NORMAL USE, GASOHOL .022 .022 .022 .022 .022 .022 .022 .024 NORMAL USE, SPECIAL FUELS .052 .052 .052 .052 .052 .052 .052
.05! NORMAL, GASOLINE .150 .150 .150 . 150 . 150 . 150 . 150 .150 . 150 . 150 .150 .150 .150 .150 .150 . 150 . 15 NORMAL, GASOHOL .150 .150 . 150 .150 .150 . 150 • 150 .150 .150 .150 .150 .150 .150 • 150 .150 .150 .15 NORMAL, SPECIAL FUELS . 120 .120 . 120 .120 .120 . 120 . 120 .120 . 120 .120 .120 '120 . 120 .120 .120 . 120 .12
I FEDERAL RATES (DOLLARS/GALLON) .o8P GASOLINE ,080 .080 .000 .080 .080 .080 .080 .080 .080 .080 .080 .080 .080 .080 .080 .080
GASOHOL .020 .020 .007 .020 .020 .020 .020 .020 .020 .020 .020 .020 .020 .020 .020 .020 .o2o SPECIAL FUELS .140 .140 . 040 .140 .140 .140 .140 .140 .140 .140 . 140 .140 .140 .140 . 140 .140 .14p
STATE~IDE FUEL, 1,000 GALLONS (ADJUSTED) J
GASOLINE 1,505 856,827 4 I 633 5591092 4,253 4,081 6,879 3,933 12,735 8, 784 4,533 2,266 3.113 171 169 1 1024 3,7~ 1,477,762 GASOHOL 363 206,407 1,116 134,683 1,025 983 1,657 947 3,068 2,116 1,092 546 750 41 41 247 90 355,9S8 SPECIAL FUELS 0 11,920 12,744 6,056 5,226 5,040 8,809 5,574 16,412 14,028 8,871 12,108 23,619 4,368 5,929 23,623 323,85P 488,179
6,139 24,893 328,52h 2,321,929 TOTAL 1,868 1,075,153 18,493 699,831 10,504 10,104 17,345 10,454 32,215 24,929 14,496 14,920 27,482 4,581
I FUEL REVENUE, STATE-MAINTAINED SYSTEM (UNADJUSTED) KENTUCKY
HEAVY VEHICLE SURTAX NORMAL USE NORMAL
TOTAL FEDERAL
GASOLINE GASOHOL SPECIAl FUELS
TOTAL
FUEl REVENUE, STATE-MAINTAINED KENTUCKY
HEAVY VEHICLE SURTAX NORMAL USE NORMAL
TOTAL FEDERAL
GASOLINE GASOHOL SPECIAL FUELS
TOTAL
0 0 0 0
207 119,077 207 119,on
120 68,546 7 4,128 0 1,669
128 74,343
SYSTEM (ADJUSTED)
0 0
203 203
90 5 0
95
0 0
116,873 116,873
5'1 ,028 3,073 1,242
55,343
0 0 0 0 0 0 0 0 0 0 0 0 123 498 6,5$
7,191 0 0 0 0 0 0 0 717 433 512 972 172 232 930 12,5 16,504
1,770 77,547 1,050 1 '010 1,730 1,037 3,212 2,456 1,412 1,387 2,526 412 550 2,239 29,2 6 246,897 1,770 n,547 1,050 1,010 1, 730 1,037 3,212 3,173 1,845 1,899 3,498 583 904 3,666 48,3 5 270,592
I 0 44,727 340 326 550 315 1,019 703 363 181 249 14 13 82 T 117,850 8 2,694 20 20 33 19 61 42 22 11 15 1 1 5
45,3 ~ 7, 105 510 848 732 706 1,233 780 2,298 1,964 1,242 1,695 3,307 612 830 3,307 67,071 518 48,269 1,092 1,052 1,817 1,114 3,378 2,709 1,626 1,887 3,571 626 844 3,394 45,618 192,026
I 0 0 0 0 0 0 0 0 0 0 0 0 94 383 5,011 5,528 0 0 0 0 0 0 0 540 326 386 732 129 174 700 9,4+6 12,435
1,737 76,111 1,031 991 1,698 1,017 3,152 2,410 1,386 1,362 2,479 404 540 2,197 28,'714 242,326 1.737 76,111 1,031 991 1,698 1,017 3,152 2,951 1,712 1,747 3,212 533 808 3,280 43,2f2 260,289
0 33,296 253 243 410 234 758 523 270 135 185 10 10 61 224 87,731 6 2.oos 1s 1s zs 14 46 32 16 a ,, , 1 4 n4 5,289
385 35,933 813 783 1,352 829 2,515 2,017 1,211 1,405 2,658 466 629 2,527 33,9 9 142,950 379 631 545 525 918 581 1,711 1,462 925 1,262 2,462 455 618 2,462 33,~2 49,929
203 116,873 ;:;;? .. 76:;;;··;:a;;····99;··;:698··;:a;7··;:;;;··;:;;;··;:?;2·-;:?47··;:;;;··--;;;····8~··;:28a .. 43:2~2···;6a:289 KENTUCKY STATE-MAINTAINED I
FEDERAL STATE-MAINTAINED 95 55,343 385 35,933 813 783 1,352 829 2,515 2,017 1,211 1,405 2,658 466 629 2,527 33,st9 142,950 =========================================================================================================================================================F===========
i KY NORMAL & NORMAL USE TAXES FOR ROAD FUND DEPOSIT 74.00 PERCENT
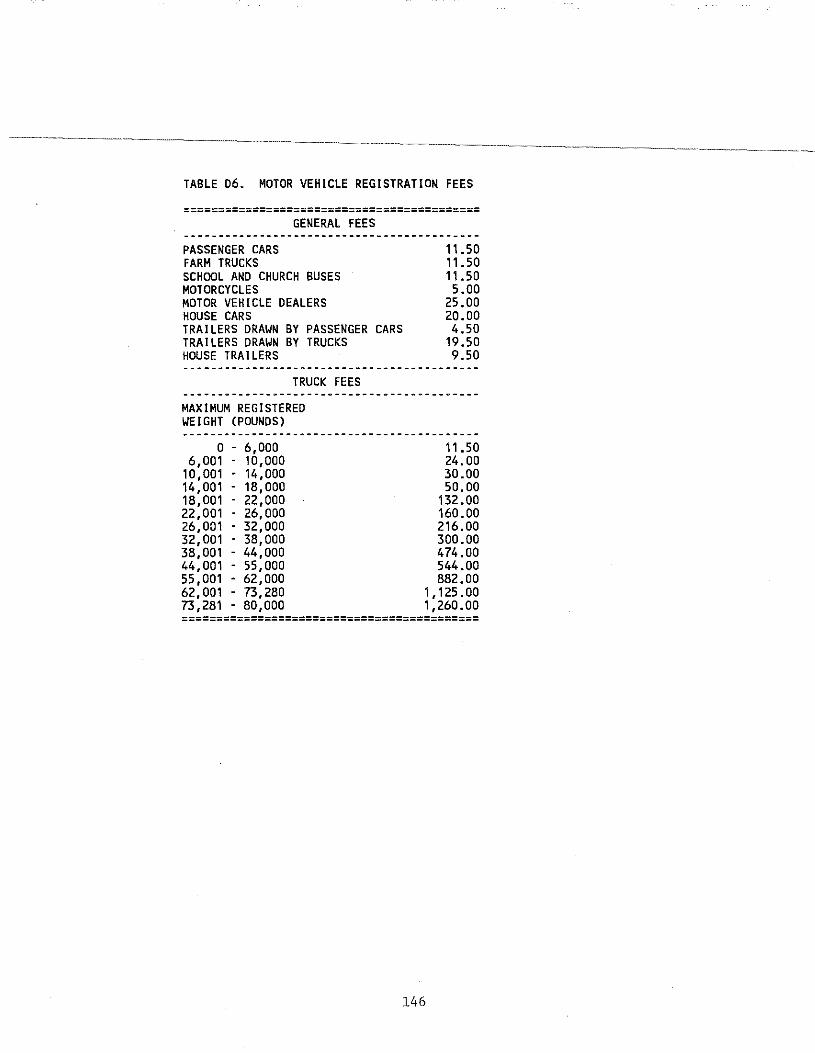
TABLE D6. MOTOR VEHICLE REGISTRATION FEES
===========================================
PASSENGER CARS FARM TRUCKS
GENERAL FEES
SCHOOL AND CHURCH BUSES MOTORCYCLES MOTOR VEHICLE DEALERS HOUSE CARS TRAILERS DRAWN BY PASSENGER CARS TRAILERS DRAWN BY TRUCKS HOUSE TRAILERS
TRUCK FEES
MAXIMUM REGISTERED WEIGHT (POUNDS)
0 6,001
10,001 14,001 18,001 22,001 26,001 32,001 38,001 44,001 55,001 62,001 73,281
6,000 10,000 14,000 18,000 22,000 26,000 32,0DO 38,00D 44,DDO 55,000 62,000 73,280 80,000
11.50 11.50 11.50 5.00
25.00 20.00 4.50
19.50 9.50
11 .50 24.0D 30.00 50.00
132.00 160.00 216.0D 300.00 474.00 544.00 882.00
1,125.00 1,260.00
===========================================
146
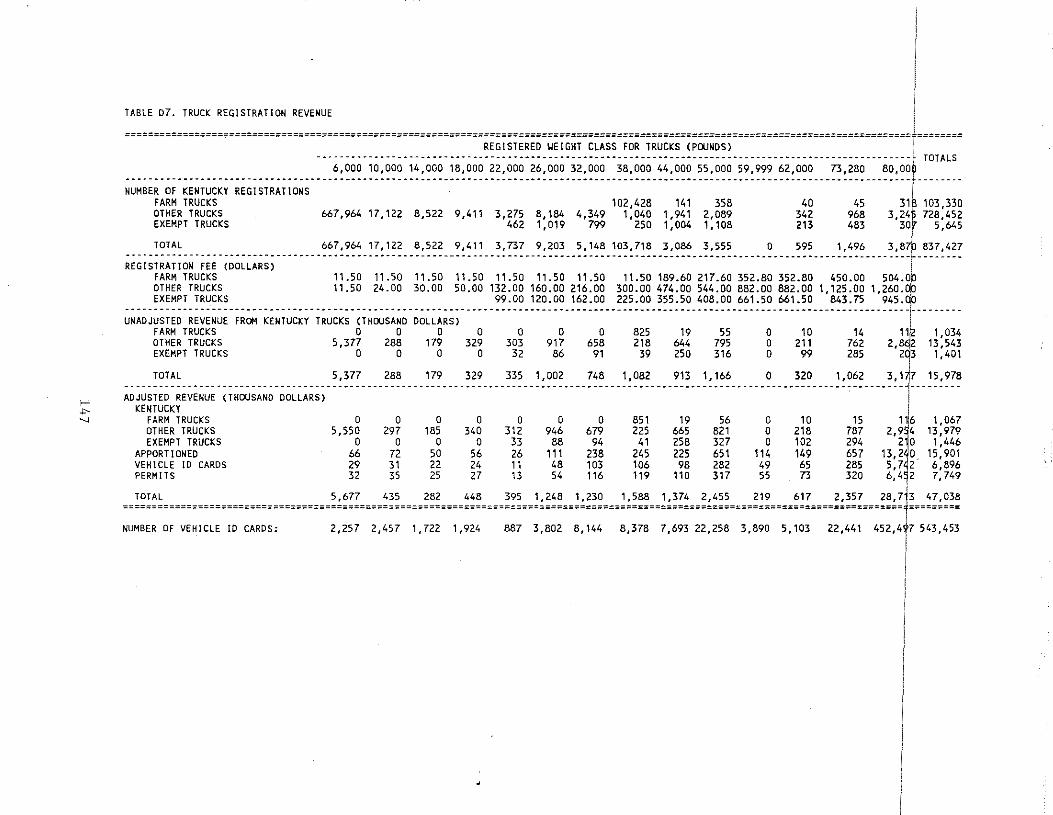
>-' -""" ""
TABLE 07. TRUCK REGISTRATION REVENUE
REGISTERED YEIGHT CLASS FOR TRUCKS (POUNDS) I --------------------------------------·----------------------------------------------------------------~ TOTALS
6,000 10,000 14,000 18,000 22,000 26,000 32,000 38,000 44,000 55,000 59,999 62,000 73,280 80,00 ---------------------------------------------------------------------------------------------------------------------------------------- --------NUMBER OF KENTUCKY REGISTRATIONS ~
FARM TRUCKS 102,428 141 358 40 45 31 103,330 OTHER TRUCKS 667,964 17,122 8,522 9,411 3,275 8,184 4,349 1,040 1,941 2,089 342 968 3,24 728,452 EXEMPT TRUCKS 462 1,019 799 250 1,004 1,108 213 483 30r 5,645
TOTAL 667,964 17,122 8,522 9,411 3,737 9,203 5,148 103,718 3,086 3,555 0 595 1,496 3,87p 837,427 ----------------------------------------------------------------------------------------------------------------------------------------r--------REGISTRATION FEE (DOLLARS) i
FARM TRUCKS 11.50 11.50 11.50 11.50 11.50 11.50 11.50 11.50 189.60 217.60 352.80 352.80 450.00 504.0 OTHER TRUCKS 11.50 24.00 30.00 50.00 132.00 160.00 216.00 300.00 474.00 544.00 882.00 882.00 1,125.00 1,260.0 EXEMPT TRUCKS 99.00 120.00 162.00 225.00 355.50 408.00 661.50 661.50 843.75 945.
··-···---·····'------···-····-·············-···-·-·----·········-·····-----···--------··--···-·······-·····--·--···-·--------···--······1········· UNADJUSTED REVENUE FROM KENTUCKY TRUCKS (THOUSAND DOLLARS} I_
FARM TRUCKS 0 0 0 0 0 0 0 825 19 55 0 10 14 11~ 1,034 OTHER TRUCKS 5,377 288 179 329 303 917 658 218 644 795 0 211 762 2,~2 13,543 EXEMPT TRUCKS 0 0 0 0 32 86 91 39 250 316 0 99 285 293 1,401
TOTAL 5,377 288 179 329 335 1,002 748 1,082 913 1,166 0 320 1,062 3,1~ 15,978 -····-········-···-·-·····-····-········--··-········-··-···········--········-----·······-·-----···-···---·······----········---·--··-·1-··-····· ADJUSTED REVENUE (THOUSAND DOLLARS) I
KENTUCKY I FARM TRUCKS 0 0 0 0 0 0 0 851 19 56 0 10 15 1]6 1,067 OTHER TRUCKS 5,550 297 185 340 312 946 679 225 665 821 0 218 787 2,9 4 13,979 EXEMPT TRUCKS 0 0 0 0 33 88 94 41 258 327 0 102 294 2 0 1,446
APPORTIONED 66 72 50 56 26 111 238 245 225 651 114 149 657 13,2 0_ 15,901 VEHICLE 10 CARDS 29 31 22 24 11 48 103 106 98 282 49 65 285 5,742 6,896 PERMITS 32 35 25 27 13 54 116 119 110 317 55 73 32D 6,4j2 7,749
TOTAL 5,677 435 282 448 395 1,248 1,230 1,588 1,374 2,455 219 617 2,357 28,7J13 47,038
::::::=::=:::~:::=~:=::::::=========:~::~==:~::~==~~~::==~~:::====::~==:~:::==:~~::===:~:~:==~~:::=::~:::==:~:::==:~~::===::~::~==:::~:+;=:::~:::
I
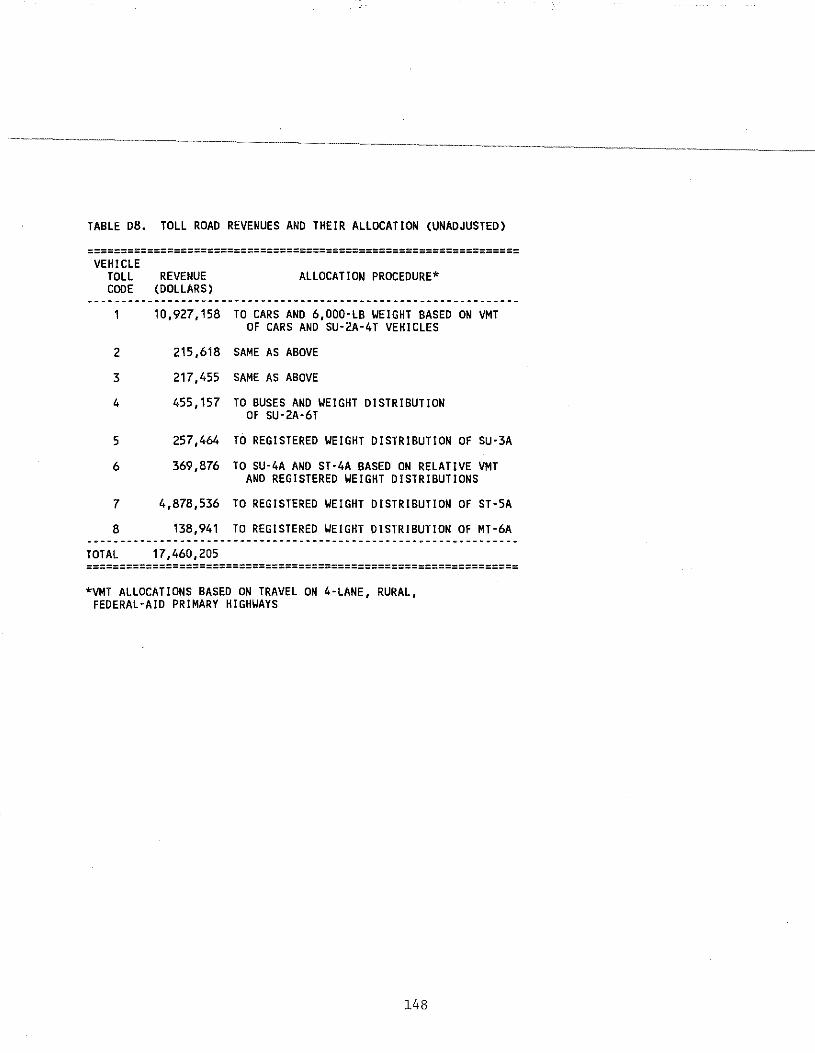
TABLE D8. TOLL ROAD REVENUES AND THEIR ALLOCATION (UNADJUSTED)
:================================================================ VEHICLE
TOLL REVENUE ALLOCATION PROCEDURE* CODE (DOLLARS)
10,927,158 TO CARS AND 6,000-LB WEIGHT BASED ON VMT OF CARS AND SU-2A-4T VEHICLES
2 215,618 SAME AS ABOVE
3 217,455 SAME AS ABOVE
4 455.157 TO BUSES AND WEIGHT DISTRIBUTION OF SU-2A-6T
5 257,464 TO REGISTERED WEIGHT DISTRIBUTION OF SU·3A
6 369,876 TO SU-4A AND ST·4A BASED ON RELATIVE VMT AND REGISTERED WEIGHT DISTRIBUTIONS
7 4,878,536 TO REGISTERED WEIGHT DISTRIBUTION OF ST·5A
8 138,941 TO REGISTERED WEIGHT DISTRIBUTION OF MT-6A •O•••••••••••••••••••••••••••••••••••••••••••••••••••••••••••••••
TOTAL 17,460,205 ================================================================= *VMT ALLOCATIONS BASED ON TRAVEL ON 4-LANE, RURAL,
FEDERAL-AID PRIMARY HIGHWAYS
148
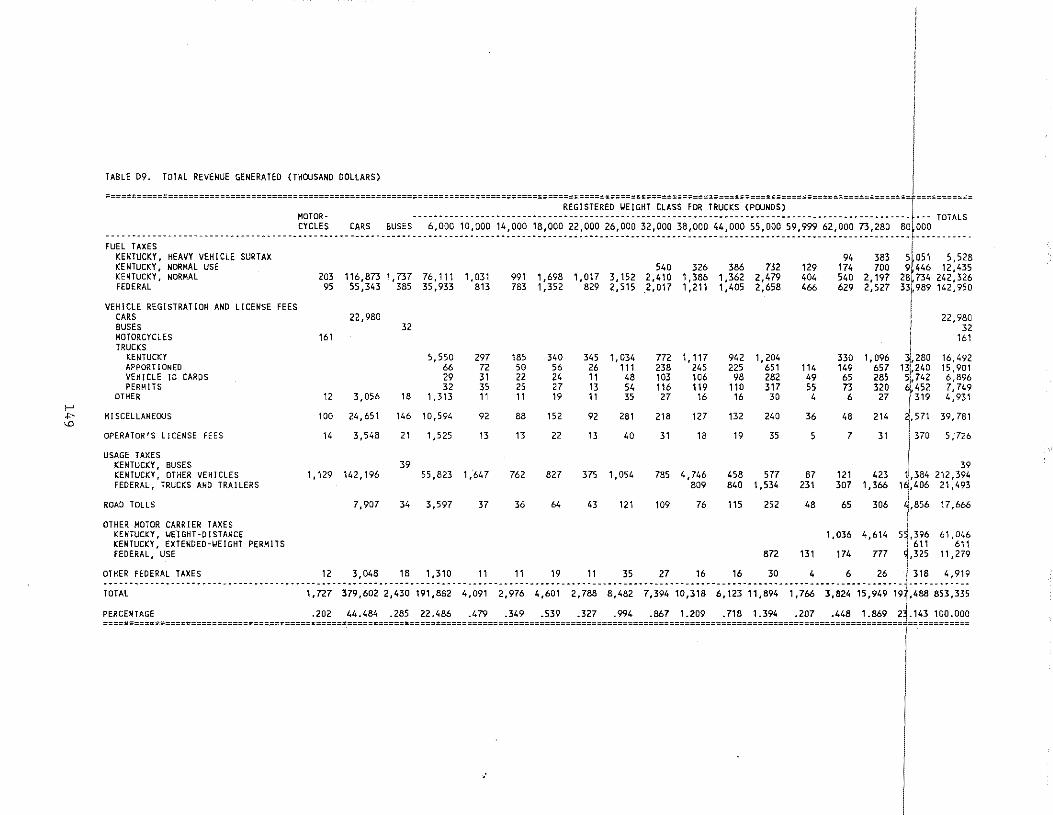
~
TABLE D9. TOTAL REVENUE GENERATED (THOUSAND DOLLARS)
===========================================================================================================================================================r"=========== REGISTERED WEIGHT CLASS FOR TRUCKS (POUNDS)
MOTOR- ----··········--·-···················-····-············--·--·-···-··--------·-··············----[··- TOTALS CYCLES CARS BUSES 6,000 10,000 14,000 18,000 22,000 26,000 32,000 38,000 44,000 55,000 59,999 62,000 73,280 80 000
--------------------------------------------------------------···------------------------------------------------------------------------------------------ -----------KENTUCKY, HEAVY VEHICLE SURTAX 94 383 5 051 5,528
FUEL TAXES t KENTUCKY, NORMAL USE 540 326 386 732 129 174 700 9 446 12,435 KENTUCKY, NORMAL 203 116,8731,737 76,111 1,031 991 1,698 1,017 3,152 2,410 1,386 1,362 2,479 404 540 2,197 28 734 242,326 FEDERAL 95 55,343 385 35,933 813 783 1,352 829 2,515 .2,017 1,211 1,405 2,658 466 629 2,527 331,989 142,950
VEHICLE REGISTRATION AND CARS BUSES MOTORCYCLES TRUCKS
KENTUCKY APPORTIONED VEHICLE 10 CARDS PERMITS
OTHER
LICENSE FEES
161
12
22,980 32
5,550 66 29 32
3,056 18 1,313
297 185 340 345 1, 034 72 50 56 26 111 31 22 24 11 48 35 25 27 13 54 11 11 19 11 35
772 1,117 942 1, 204 238 245 225 651 114 103 106 98 282 49 116 119 110 317 55 27 16 16 30 4
330 1,096 149 657 65 285 73 320 6 27
I
' ~,280 1~,240 5, 742
,452
22,980 32
161
16,492 15 '901 6,896 7, 749 4,931
+' MISCELLANEOUS ~
100 24,651 146 10,594 92 88 152 92 281 218 127 132 240 36 48 214 ,.:~: 39,781
OPERATOR'S LICENSE FEES 14 3,548 21 1 1525 13 13 22 13 40 31 18 19 35 5 7 31 370 5 I 726
USAGE TAXES KENTUCKY I BUSES 39 I 39 KENTUCKY, OTHER VEHICLES 1,129 142,196 55,823 1 1 647 762 827 375 1,054 785 4,746 458 577 87 121 423 1,384 212,394 FEDERAL, TRUCKS AND TRAILERS 809 840 11 534 231 307 1,366 14,406 21,493
ROAD TOLLS 7,907 34 3 1 597 37 36 6L. 43 121 109 76 115 252 48 65 306 ~,856 17,666
OTHER MOTOR CARRIER TAXES I KENTUCKY, W'E.lGHT-OISTANCE 1,036 4,614 51,396 61,046 KENTUCKY, EXTEN:DED-\JEIGHT PERMITS 611 611 FEDERAL I usE 872 131 174 m 1 325 11,279
OTHER FEDERAL TAXES 12 3 1 048 18 1,310 11 11 19 11 35 27 16 16 30 4 6 26 , 318 4,919 -----. ~---.----- ~-------.---------------- .. -- ------------------- .• -----.-----------------.------.----------.------------. -~------------------------------- J------------TOTAL 1 1 727 379 1 602 2,430 191,882 4,091 2 1 976 4 1 601 2 1 788 8,482 7,394 10,318 6,123 11,894 1,766 3,824 15,949 19t,488 853,335
PERCENTAGE .202 44.484 .285 22.486 .479 .349 .539 .327 .994 .867 1.209 .718 1.394 .207 .448 1.869 2~.143 100.000 ==========================================================================================================================================================,============
.'
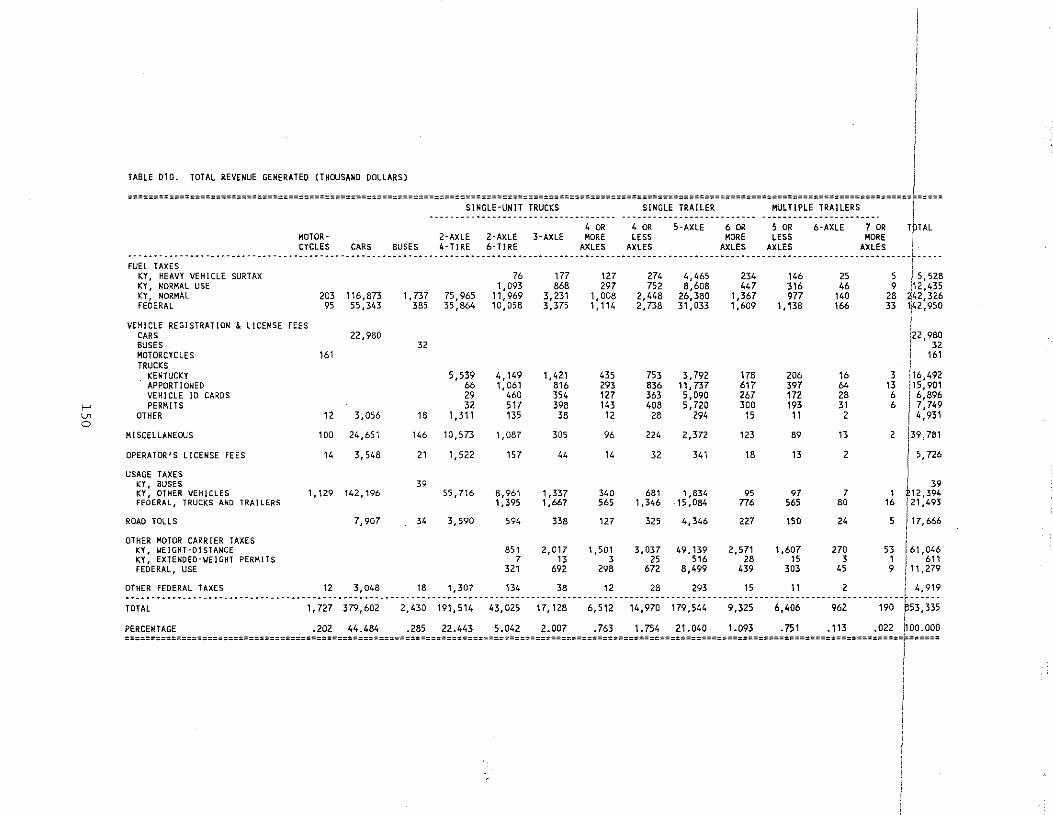
r Ln 0
TABLE D10. TOTAL REVENUE GENERATED (THOUSAWD DOLLARS)
=======================================================================================================================================================~[===== SlNGLE·UNIT TRUCKS SINGLE TRAILER MULTIPLE TRAILERS
.... --.-- ........................... ···-···-···· ............. - . ···-··---------------· 4 OR 4 OR 5-AXLE 6 OR 5 OR 6-AXLE 7 OR T TAL
FUEL TAXES KY, HEAVY VEHICLE SURTAX KY, NORMAL USE KY, NORMAL FEDERAL
VEHICLE REGISTRATION & LICENSE CARS BUSES MOTORCYCLES TRUCKS
KENTUCKY APPORTIONED VEHICLE 1D CARDS PERMITS
OTHER
MISCELLANEOUS
OPERATOR'S LICENSE FEES
USAGE TAXES KY, BUSES KY, OTHER VEHICLES FEDERAL, TRUCKS AND TRAILERS
ROAD TOLLS
OTHER MOTOR CARRIER TAXES KY, WEIGHT-DISTANCE KY, EXTENDED-WEIGHT PERMITS FEDERAL, USE
OTHER FEDERAL TAXES
TOTAL
MOTORCYCLES CARS
203 1'16,873 95 55,343
FEES
161
12
100
22,980
3,016
24,651
14 3, 548
1' 129 142,196
7,907
12 3,048
1,727 379. 602
BUSES 2·AXLE 2·AXLE 3-AXLE MORE LESS MORE LESS MORE I 4·TIRE 6·TIRE AXLES AXLES AXLES AXLES AXLES :
, '737 385
32
18
146
75,965 35,864
1,539 66 29 32
1,311
10,573
21 1, 522
39 55,716
34 3,590
18 1,307
76 1,093
11,969 10,058
4,149 1, 061
460 517 135
1,087
157
8,961 1, 395
594
851 7
321
134
177 868
3, 231 3,375
1,421 816 354 398 38
305
44
1,337 1,667
338
2,017 13
692
38
2,430 191,514 43,025 17,128
127 297
1,008 1' 114
435 293 127 143 12
96
14
340 565
127
1 '501 3
298
12
274 752
2,448 2,738
753 836 363 408
28
224
4,465 8,608
26,380 31,033
3,792 11,737 5,090 5,720
294
2,372
32 341
681 1,834 1,346 .15,084
325 4, 346
3,037 25
672
28
49,139 516
8,499
293
6,512 14,970 179,544
234 447
1,367 1,609
178 617 267 300
11
123
18
95 776
227
2,571 28
439
15
9,321
146 316 977
1,138
206 397 172 193
11
89
13
97 565
150
1,607 15
303
25 46
140 166
16 64 28 31 2
13
2
7 80
24
270 3
45
--+--- --I
115,528
9 12,435 28 ~42,326 33 1[42,950
I 122,980 I 32 : 161
3 116,492 13 111,901 6 I 6,896 6 7 I 749
4. 931
2 139,781
I'· 726
I 39 1 ~12,394
16 121,493
5 )17,666
I 53 161,046 1 I 611 9 !11,279
11 2 ! 4,919
6,4~;------;;;------;;~--~;i:iii I
PERCENTAGE -202 44_484 .285 22.443 5.042 2.007 .763 1.754 21.040 1.093 .751 .113 .022 1100.000 ======================================================================================================================================================r======
APPENDIXE
INTERSTATE TRAVEL

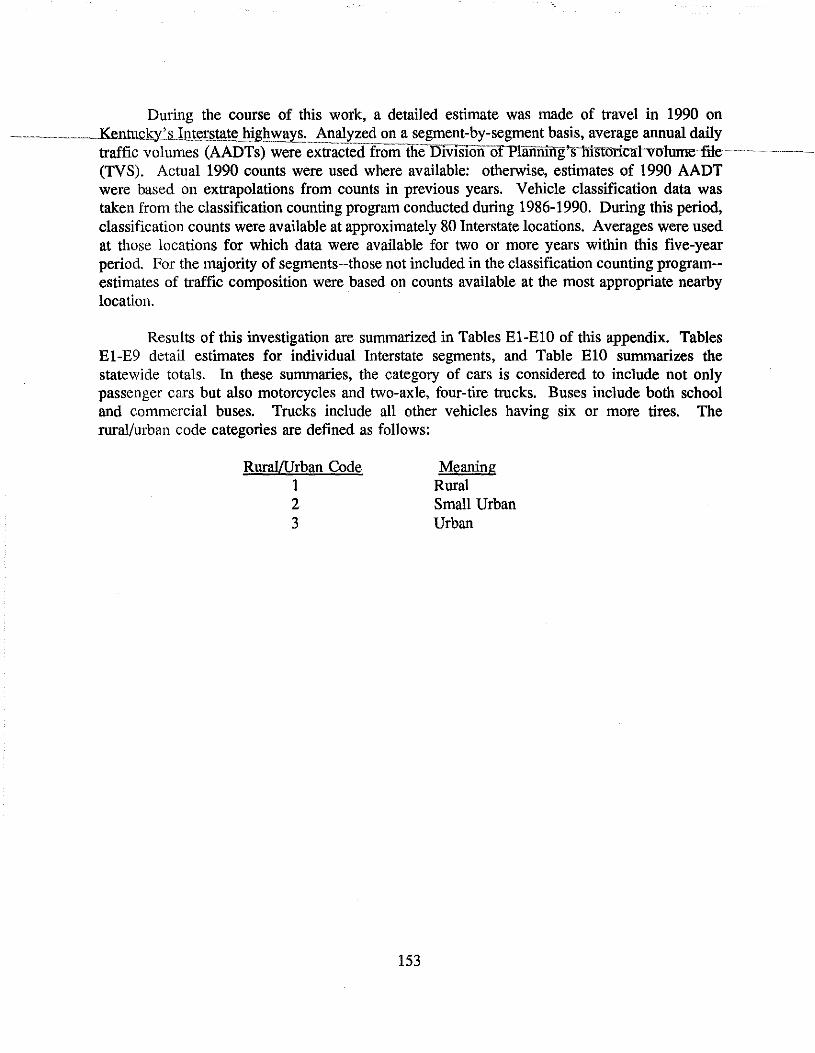
During the course of this work, a detailed estimate was made of travel in 1990 on __________ _K~terstate highways. Analyzed on a segment-by-segment basis, average annual daily
traffic volumes (AADTs) were extractedfrom-flleDlVlsion-oft'lanmng'snistori:catvolumeiile---------------(TVS). Actual 1990 counts were used where available: otherwise, estimates of 1990 AADT were based on extrapolations from counts in previous years. Vehicle classification data was taken from the classification counting program conducted during 1986-1990. During this period, classification counts were available at approximately 80 Interstate locations. Averages were used at those locations for which data were available for two or more years within this five-year period. For the majority of segments--those not included in the classification counting program--estimates of traffic composition were based on counts available at the most appropriate nearby location.
Results of this investigation are summarized in Tables El-ElO of this appendix. Tables E1-E9 detail estimates for individual Interstate segments, and Table E10 summarizes the statewide totals. In these summaries, the category of cars is considered to include not only passenger cars but also motorcycles and two-axle, four-tire trucks. Buses include both school and commercial buses. Trucks include all other vehicles having six or more tires. The rural/urban code categories are defined as follows:
Rural/Urban Code 1 2 3
153
Meaning Rural Small Urban Urban
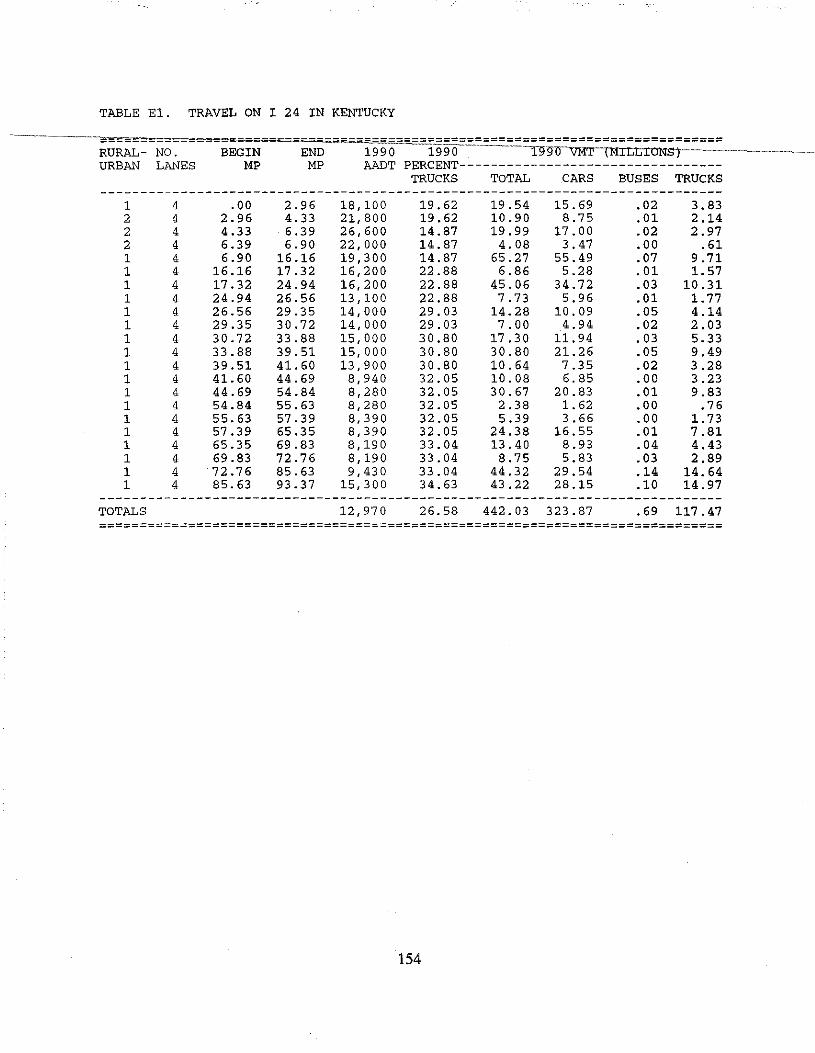
TABLE El. TRAVEL ON I 24 IN KENTUCKY
-----_!!!!! __
- ; =-==-=-=====.:::_::_::_:::=_::.::_==;;;:====::;;==;;;:=:;;;============ -RURAL- NO. BEGIN END 1990 1990 ·-T~l"gQ\'M'F .. (MILL IONS y--·········-··~·-··-· -----------------URBAN LANES MP MP AADT PERCENT---------------------------------
TRUCKS TOTAL CARS BUSES TRUCKS ------------------------------------------------------------------------------
1 4 .00 2.96 18,100 19.62 19.54 15.69 .02 3. 83 2 4 2.96 4.33 21,800 19.62 10.90 8.75 .01 2.14 2 4 4.33 6.39 26,600 14.87 19.99 17.00 .02 2.97 2 4 6.39 6.90 22,000 14.87 4.08 3.47 .00 .61 1 4 6.90 16.16 19,300 14.87 65.27 55.49 .07 9. 71 1 4 16.16 17.32 16,200 22.88 6.86 5.28 .01 1. 57 1 4 17.32 24.94 16,200 22.88 45.06 34.72 .03 10.31 1 4 24.94 26.56 13,100 22.88 7.73 5.96 . 01 1. 77 1 4 26.56 29.35 14,000 29.03 14.28 10.09 .05 4.14 1 4 29.35 30.72 14,000 29.03 7.00 4.94 .02 2.03 1 4 30.72 33.88 15,000 30.80 17.30 11.94 .03 5.33 1 4 33.88 39.51 15,000 30.80 30.80 21.26 .05 9.49 1 4 39.51 41.60 13,900 30.80 10.64 7.35 .02 3.28 1 4 41.60 44.69 8,940 32.05 10.08 6.85 .00 3.23 1 4 44.69 54.84 8,280 32.05 30.67 20.83 .01 9.83 1 4 54.84 55.63 8,280 32.05 2.38 1.62 .00 .76 1 4 55.63 57.39 8,390 32.05 5.39 3.66 .00 1.73 1 4 57.39 65.35 8,390 32.05 24.38 16.55 .01 7.81 1 4 65.35 69.83 8,190 33.04 13.40 8.93 .04 4.43 1 4 69.83 72.76 8,190 33.04 8.75 5.83 .03 2.89 1 4 72.76 85.63 9,430 33.04 44.32 29.54 .14 14.64 1 4 85.63 93.37 15,300 34.63 43.22 28.15 .10 14.97
------------------------------------------------------------------------------TOTALS 12' 97 0 26.58 442. 03 323.87 .69 117.47 ==============================================================================
154
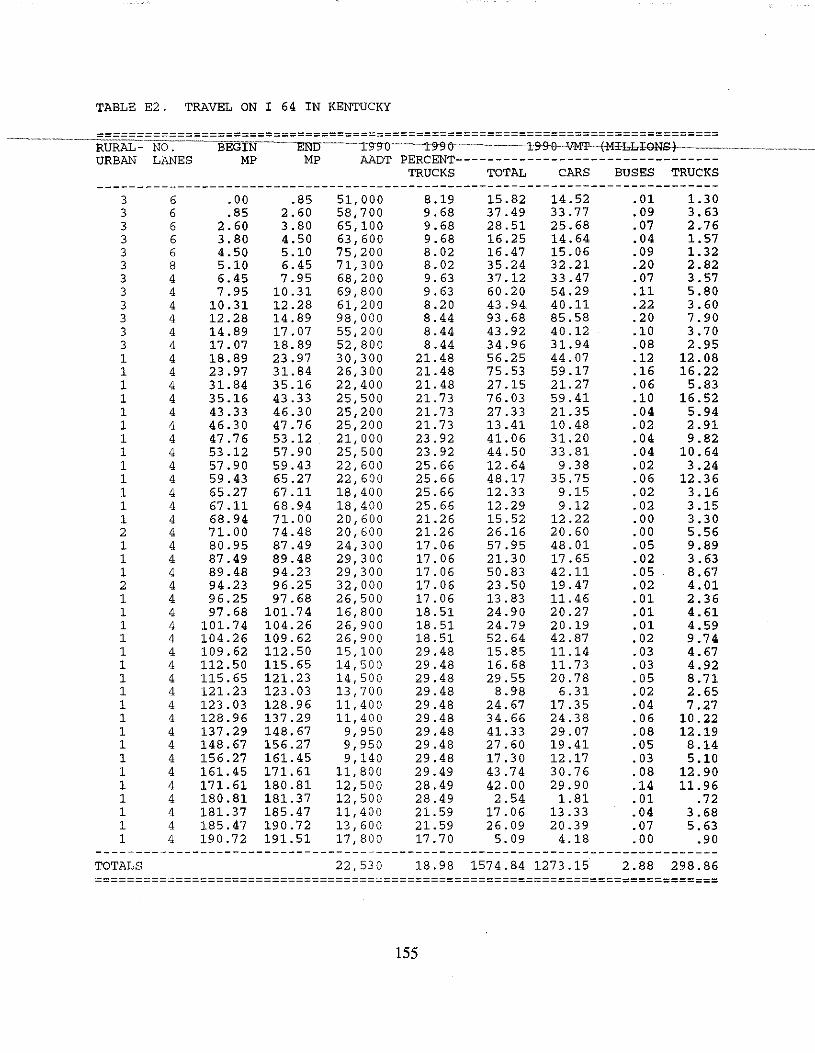
TABLE E2. TRAVEL ON I 64 IN KENTUCKY
---==--======================================================================= ----------------RURAL NO. BEG 1N-·-----~NIJ-·-······-1.-g:r1J-···---j:9'9·1J·-···-··-················l-9·9·8·-·VM'I'-··fM±LkiONS-)-···················-··-········· URBAN LANES MP MP AADT PERCENT---------------------------------
TRUCKS TOTAL CARS BUSES TRUCKS ------------------------------------------------------------------------------
3 6 .00 .85 51,000 8.19 15.82 14.52 .01 1.30 3 6 .85 2.60 58,700 9.68 37.49 33.77 .09 3. 63 3 6 2.60 3.80 65,100 9.68 28.51 25.68 .07 2.76 3 6 3.80 4.50 63,600 9.68 16.25 14.64 .04 1.57 3 6 4.50 5.10 75,200 8.02 16.47 15.06 .09 1.32 3 8 5.10 6.45 71,300 8.02 35.24 32.21 .20 2.82 3 4 6.45 7.95 68,200 9.63 37.12 33.47 .07 3. 57 3 4 7.95 10.31 69,800 9. 63 60.20 54.29 .11 5.80 3 4 10.31 12.28 61,200 8.20 43 . 9-t 40.11 .22 3.60 3 4 12.28 14.89 98,000 8.44 93.68 85.58 .20 7.90 3 4 14.89 17.07 55,200 8.44 43.92 40.12 .10 3.70 3 4 17.07 18.89 52,800 8.44 34.96 31.94 .08 2.95 1 4 18.89 23.97 30,300 21.48 56.25 44.07 .12 12.08 1 4 23.97 31.84 26,300 21.48 75.53 59.17 .16 16.22 1 4 31.84 35.16 22,400 21.48 27.15 21.27 .06 5.83 1 4 35.16 43.33 25,500 21.73 76.03 59.41 .10 16.52 1 4 43.33 46.30 25,200 21.73 27.33 21.35 .04 5.94 1 4 46.30 47.76 25,200 21.73 13.41 10.48 .02 2.91 1 4 47.76 53.12 21,000 23.92 41.06 31.20 .04 9.82 1 4 53.12 57.90 25,500 23.92 44.50 33.81 .04 10.64 1 4 57.90 59.43 22,600 25.66 12.64 9.38 .02 3.24 1 4 59.43 65.27 22,600 25.66 48.17 35.75 .06 12.36 1 4 65.27 67.11 18,400 25.66 12.33 9.15 • 02 3.16 1 4 67.11 68.94 18,400 25.66 12.29 9.12 .02 3.15 1 4 68.94 71.00 20,600 21.26 15.52 12.22 .00 3.30 2 4 71.00 74.48 20,600 21.26 26.16 20.60 .00 5.56 1 4 80.95 87.49 24,300 17.06 57.95 48.01 .05 9.89 1 4 87.49 89.48 29,300 17.06 21.30 17.65 .02 3.63 1 4 89.48 94.23 29,300 17.06 50.83 42.11 .05 8.67 2 4 94.23 96.25 32,000 17.06 23.50 19.47 .02 4.01 1 4 96.25 97.68 26,500 17.06 13.83 11.46 .01 2.36 1 4 97.68 101.74 16,800 18.51 24.90 20.27 .01 4.61 1 4 101.74 104.26 26, 900 18.51 24.79 20.19 .01 4.59 1 4 104.26 109.62 26,900 18.51 52.64 42.87 .02 9.74 1 4 109.62 112.50 15,100 29.48 15.85 11.14 .03 4.67 1 4 112.50 115.65 14,500 29.48 16.68 11.73 .03 4.92 1 4 115.65 121.23 14,500 29.48 29.55 20.78 .05 8.71 1 4 121.23 123.03 13,700 29.48 8.98 6.31 .02 2.65 1 4 123.03 128.96 11,400 29.48 24.67 17.35 .04 7.27 1 4 128.96 137.29 11,400 29.48 34.66 24.38 .06 10.22 1 4 137.29 148.67 9,950 29.48 41.33 29.07 .08 12.19 1 4 148.67 156.27 9,950 29.48 27.60 19.41 .05 8.14 1 4 156.27 161.45 9,140 29.48 17.30 12.17 .03 5.10 1 4 161.45 171.61 11,800 29.49 43.74 30.76 .08 12.90 1 4 171.61 180.81 12,500 28.49 42.00 29.90 .14 11.96 1 4 180.81 181.37 12,500 28.49 2.54 1.81 .01 . 72 1 4 181.37 185.47 11,400 21.59 17.06 13.33 .04 3.68 1 4 185.47 190.72 13,600 21.59 26.09 20.39 .07 5.63 1 4 190.72 191.51 17,800 17.70 5.09 4.18 .00 .90
------------------------------------------------------------------------------TOTALS 22,530 18.98 1574.84 1273.15 2.88 298.86 ==============================================================================
155
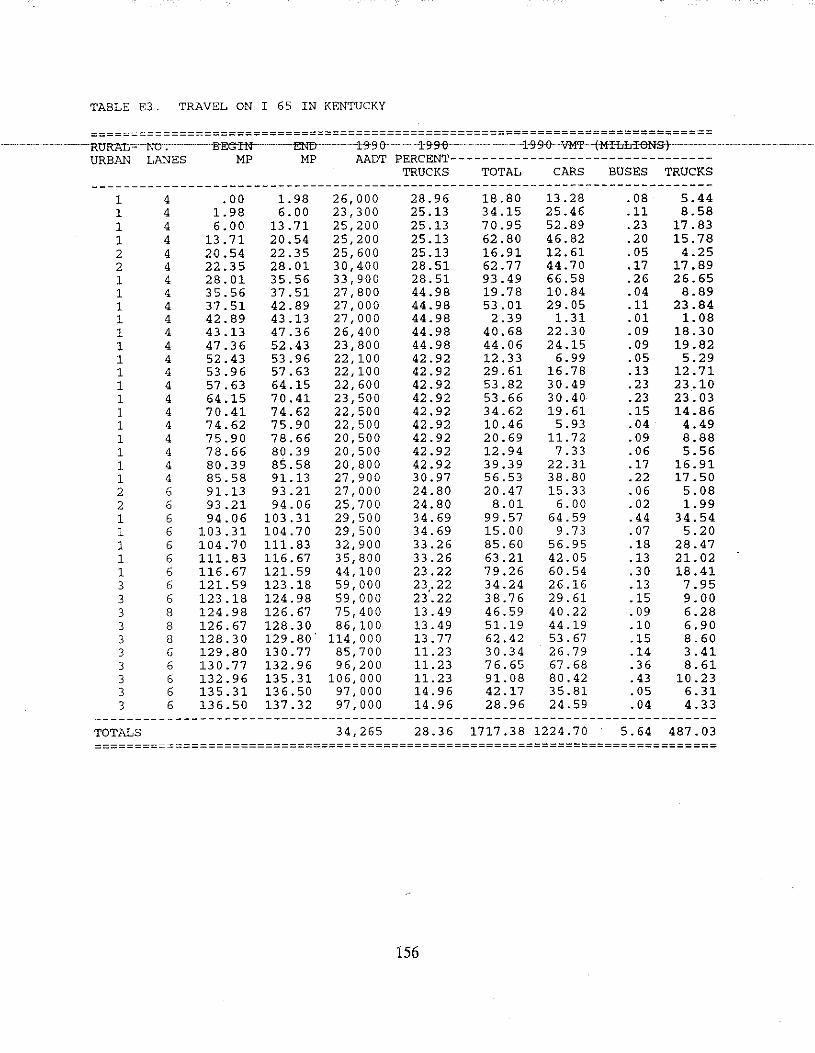
TABLE E3. TRAVEL ON I 65 IN KENTUCKY
============================================================================== ------~--- ··--~"""""Rt1R1'<t=~NO . fl"E~J'N-" END ·-··-1-'J-9·()-·-·---]:9-9·()-·---·····---·--··-·-1-9-9·9--vM'F-···(M-HobWN&)---·---············· ------------------------
URBAN LANES MP MP AADT PERCENT---------------------------------TRUCKS TOTAL CARS BUSES TRUCKS
------------------------------------------------------------------------------1 4 .00 1.98 26,000 28.96 18.80 13.28 .08 5.44 1 4 1.98 6.00 23,300 25.13 34.15 25.46 .11 8.58 1 4 6.00 13.71 25,200 25.13 70.95 52.89 .23 17.83 1 4 13.71 20.54 25,200 25.13 62.80 46.82 .20 15.78 2 4 20.54 22.35 25,600 25.13 16.91 12.61 .05 4.25 2 4 22.35 28.01 30,400 28.51 62.77 44.70 .17 17.89 1 4 28.01 35.56 33,900 28.51 93.49 66.58 .26 26.65 1 4 35.56 37.51 27,800 44.98 19.78 10.84 .04 8.89 1 4 37.51 42.89 27,000 44.98 53.01 29.05 .11 23.84 1 4 42.89 43.13 27,000 44.98 2.39 1. 31 .01 1.08 1 4 43.13 47.36 26,400 44.98 40.68 22.30 .09 18.30 1 4 47.36 52.43 23,800 44.98 44.06 24.15 .09 19.82 1 4 52.43 53.96 22,100 42.92 12.33 6.99 .05 5.29 1 4 53.9 6 57.63 22,100 42.92 29.61 16.78 .13 12.71 1 4 57.63 64.15 22,600 42.92 53.82 30.49 .23 23.10 1 4 64.15 70.41 23,500 42.92 53.66 30.40 .23 23.03 1 4 70.41 74.62 22,500 42.92 34.62 19.61 .15 14.86 1 4 74.62 75.90 22,500 42.92 10.46 5.93 .04 4.49 1 4 75.90 78.66 20,500 42.92 20.69 11.72 .09 8.88 1 4 78.66 80.39 20,500 42.92 12.94 7.33 .06 5.56 1 4 80.39 85.58 20,800 42.92 39.39 22.31 .17 16.91 1 4 85.58 91.13 27,900 30.97 56.53 38.80 .22 17.50 2 6 91.13 93.21 27,000 24.80 20.47 15.33 .06 5.08 2 6 93.21 94.06 25,700 24.80 8.01 6.00 .02 1.99 1 6 94.06 103.31 29,500 34.69 99.57 64.59 .44 34.54 1 6 103.31 104.70 29,500 34.69 15.00 9.73 . 07 5.20 1 6 104.70 111.83 32,900 33.26 85.60 56.95 .18 28.47 1 6 111.83 116.67 35,800 33.26 63.21 42.05 .13 21.02 1 6 116.67 121.59 44,100 23.22 79.26 60.54 . 30 18.41 3 6 121.59 123.18 59,000 23,.22 34.24 26.16 .13 7.95 3 6 123.18 124.98 59,000 23.22 38.76 29.61 .15 9.00 3 8 124.98 126.67 75,400 13.49 46.59 40.22 .09 6.28 3 8 126.67 128.30 86,100 13.49 51.19 44.19 .10 6.90 3 8 128.30 129.80" 114,000 13.77 62.42 53.67 .15 8.60 3 6 129.80 130.77 85,700 11.23 30.34 26.79 .14 3.41 3 6 130.77 132.96 96,200 11.23 76.65 67.68 . 36 8.61 3 6 132.96 135.31 106,000 11.23 91.08 80.42 .43 10.23 3 6 135.31 136.50 97,000 14.96 42.17 35.81 .05 6.31 3 6 136.50 137.32 97,000 14.96 28.96 24.59 .04 4.33
------------------------------------------------------------------------------TOTALS 34,265 28.36 1717.38 1224.70 5.64 487.03 ==============================================================================
156
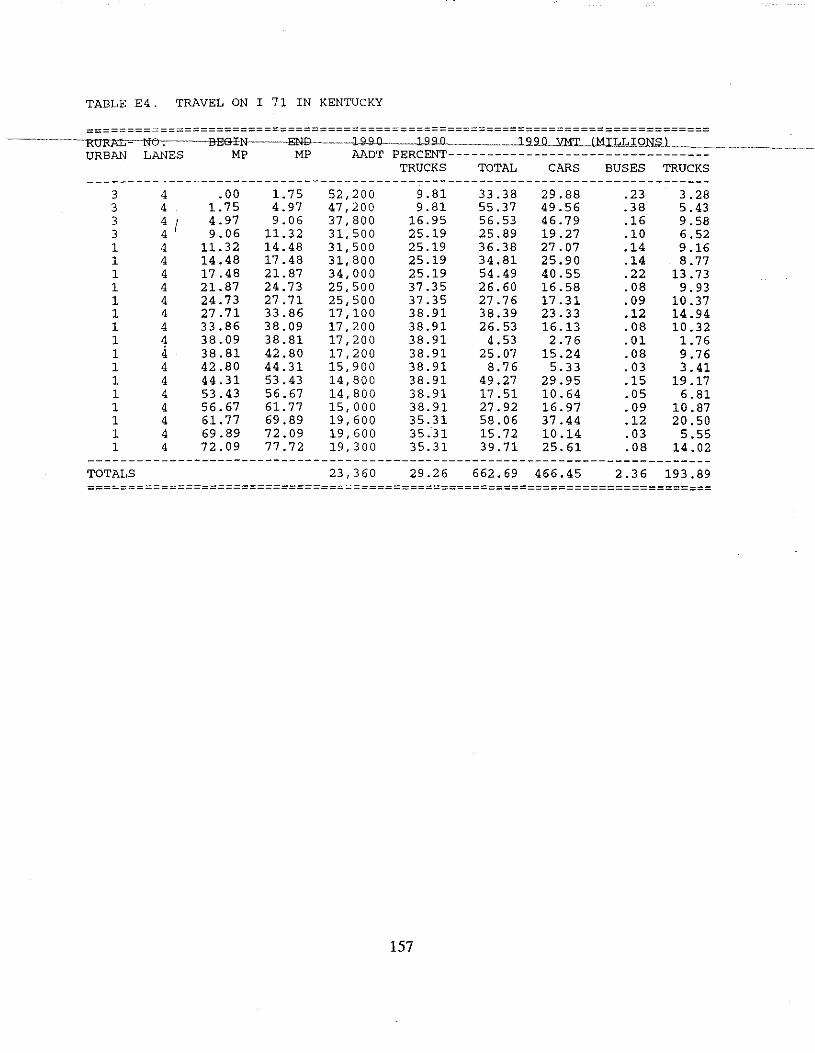
TABLE E4. TRAVEL ON I 71 IN KENTUCKY
============================================================================== ------------- ··-RUR~NO. --BEEHN·---ENt>---········=····-.l.S9JL. _________ ~9.9Jl .. 'lMT ... JMIJ,LIONSl ....... _______ -----------------
URBAN LANES MP MP AADT PERCENT····-----------------------------TRUCKS TOTAL CARS BUSES TRUCKS
------------------------------------------------------------------------------3 4 .00 1. 75 52,200 9.81 33.38 29.88 .23 3.28 3 4 1. 75 4.97 47,200 9.81 55.37 49.56 .38 5.43 3 4 I 4.97 9.06 37,800 16.95 56.53 46.79 .16 9.58 3 4 9.06 11.32 31,500 25.19 25.89 19.27 .10 6.52 1 4 11.32 14.48 31,500 25.19 36.38 27.07 .14 9.16 1 4 14.48 17.48 31,800 25.19 34.81 25.90 .14 8. 77 1 4 17.48 21.87 34,000 25.19 54.49 40.55 .22 13.73 1 4 21.87 24.73 25,500 37.35 26.60 16.58 .08 9.93 1 4 24.73 27.71 25,500 37.35 27.76 17.31 .09 10.37 1 4 27.71 33.86 17,100 38.91 38.39 23.33 .12 14.94 1 4 33.86 38.09 17,200 38.91 26.53 16.13 .08 10.32 1 4 38.09 38.81 17,200 38.91 4.53 2. 76 .01 1. 76 1 4 38.81 42.80 17' 200 38.91 25.07 15.24 .08 9.76 1 4 42.80 44.31 15,900 38.91 8.76 5.33 .03 3.41 1 4 44.31 53.43 14,800 38.91 49.27 29.95 .15 19.17 1 4 53.43 56.67 14,800 38.91 17.51 10.64 .05 6.81 1 4 56.67 61.77 15,000 38.91 27.92 16.97 .09 10.87 1 4 61.77 69.89 19,600 35.31 58.06 37.44 .12 20.50 1 4 69.89 72.09 19,600 35.31 15.72 10.14 .03 5.55 1 4 72.09 77.72 19,300 35.31 39.71 25.61 .08 14.02
------------------------------------------------------------------------------TOTALS 23,360 29.26 662.69 466.45 2 .3 6 193.89 ==============================================================================
157
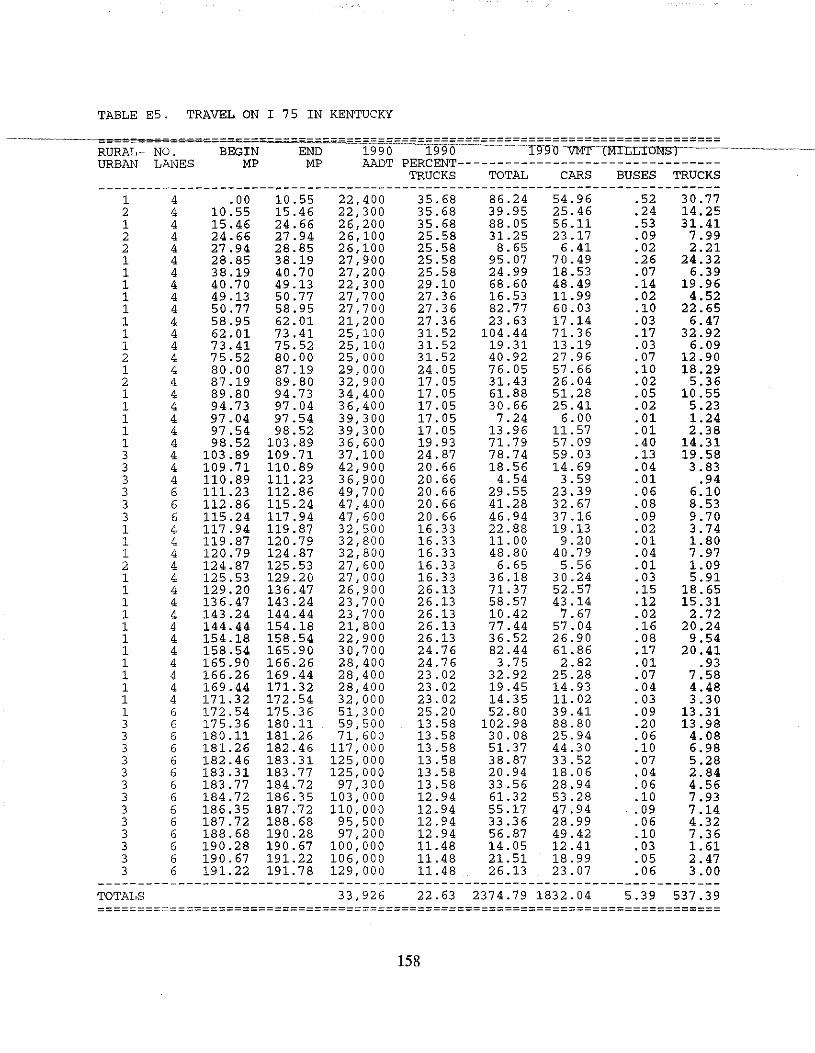
TABLE E5. TRAVEL ON I 75 IN KENTUCKY
~----~------·------------ = = = - = - -RURAL- NO. BEGIN END 1990 1990 ~()-VJi!T···(MILLIONS}······ ----------------------URBAN LANES MP MP AADT PERCENT---------------------------------
TRUCKS TOTAL CARS BUSES TRUCKS ------------------------------------------------------------------------------
1 4 .00 10.55 22,400 35.68 86.24 54.96 .52 30.77 2 4 10.55 15.46 22,300 35.68 39.95 25.46 .24 14.25 1 4 15.46 24.66 26,200 35.68 88.05 56.11 .53 31.41 2 4 24.66 27.94 26,100 25.58 31.25 23.17 .09 7.99 2 4 27.94 28.85 26,100 25.58 8.65 6.41 .02 2.21 1 4 28.85 38.19 27,900 25.58 95.07 70.49 .26 24.32 1 4 38.19 40.70 27,200 25.58 24.99 18.53 .07 6.39 1 4 40.70 49.13 22,300 29.10 68.60 48.49 .14 19.96 1 4 49.13 50.77 27,700 27.36 16.53 11.99 .02 4.52 1 4 50.77 58.95 27,700 27.36 82.77 60.03 .10 22.65 1 4 58.95 62.01 21,200 27.36 23.63 17.14 .03 6.47 1 4 62.01 73.41 25,100 31.52 104.44 71.36 .17 32.92 1 4 73.41 75.52 25,100 31.52 19.31 13.19 .03 6.09 2 4 75.52 80.00 25,000 31.52 40.92 27.96 .07 12.90 1 4 80.00 87.19 29,000 24.05 76.05 57.66 .10 18.29 2 4 87.19 89.80 32,900 17.05 31.43 26.04 .02 5.36 1 4 89.80 94.73 34,400 17.05 61.88 51.28 .05 10.55 1 4 94.73 97.04 36,400 17.05 30.66 25.41 .02 5.23 1 4 97.04 97.54 39,300 17.05 7.24 6.00 .01 1.24 1 4 97.54 98.52 39,300 17.05 13.96 11.57 . 01 2.38 1 4 98.52 103.89 36,600 19.93 71.79 57.09 .40 14.31 3 4 103.89 109.71 37,100 24.87 78.74 59.03 .13 19.58 3 4 109.71 110.89 42,900 20.66 18.56 14.69 .04 3. 83 3 4 110.89 111.23 36,900 20.66 4.54 3.59 .01 .94 3 6 111.23 112.86 49,700 20.66 29.55 23.39 .06 6.10 3 6 112.86 115.24 47,400 20.66 41.28 32.67 . 08 8.53 3 6 115.24 117.94 47,600 20.66 46.94 37.16 .09 9.70 1 4 117.94 119.87 32,500 16.33 22.88 19.13 .02 3.74 1 4 119.87 120.79 32,800 16.33 11.00 9.20 .01 1.80 1 4 120.79 124.87 32,800 16.33 48.80 40.79 .04 7.97 2 4 124.87 125.53 27,600 16.33 6.65 5.56 . 01 1.09 1 4 125.53 129.20 27,000 16.33 36.18 30.24 .03 5.91 1 4 129.20 136.47 26,900 26.13 71.37 52.57 .15 18.65 1 4 136.47 143.24 23,700 26.13 58.57 43.14 .12 15.31 1 4 143.24 144.44 23,700 26.13 10.42 7.67 .02 2.72 1 4 144.44 154.18 21, 800 26.13 77.44 57.04 .16 20.24 1 4 154.18 158.54 22,900 26.13 36.52 26.90 .08 9.54 1 4 158.54 165.90 30,700 24.76 82.44 61.86 .17 20.41 1 4 165.90 166.26 28,400 24.76 3.75 2.82 . 01 .93 1 4 166.26 169.44 28,400 23.02 32.92 25.28 .07 7.58 1 4 169.44 171.32 28,400 23.02 19.45 14.93 .04 4.48 1 4 171.32 172.54 32,000 23.02 14.35 11.02 . 03 3.30 1 6 172.54 175.36 51,300 25.20 52.80 39.41 .09 13.31 3 6 175.36 180.11 59,500 13.58 102.98 88.80 .20 13.98 3 6 180.11 181.26 71, 60 0 13.58 30.08 25.94 .06 4.08 3 6 181.26 182.46 117,000 13.58 51.37 44.30 .10 6.98 3 6 182.46 183.31 125,000 13.58 38.87 33.52 .07 5.28 3 6 183.31 183.77 125,000 13.58 20.94 18.06 .04 2.84 3 6 183.77 184.72 97,300 13.58 33.56 28.94 .06 4.56 3 6 184.72 186.35 103,000 12.94 61.32 53.28 .10 7.93 3 6 186.35 187.72 110,000 12.94 55.17 47.94 .09 7.14 3 6 187.72 188.68 95,500 12.94 33.36 28.99 .06 4.32 3 6 188.68 190.28 97,200 12.94 56.87 49.42 .10 7.36 3 6 190.28 190.67 100,000 11.48 14.05 12.41 .03 1.61 3 6 190.67 191.22 106,000 11.48 21.51 18.99 .05 2. 47 3 6 191.22 191.7 8 129,000 11.48 26.13 23.07 . 06 3.00
------------------------------------------------------------------------------TOTALS 33,926 22.63 2374.79 1832.04 5.39 537.39 ==============================================================================
158
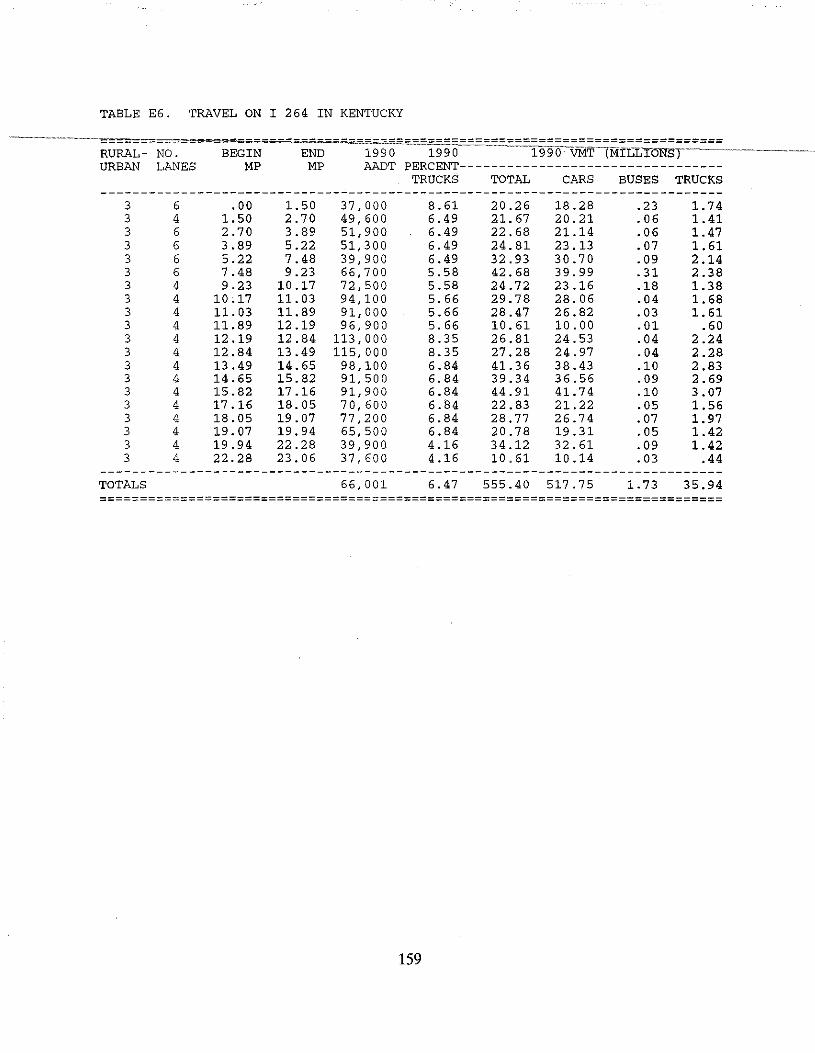
TABLE E6. TRAVEL ON I 264 IN KENTUCKY
RURAL- NO. URBAN LANES
3 3 3 3 3 3 3 3 3 3 3 3 3 3 3 3 3 3 3 3
TOTALS
6 4 6 6 6 6 4 4 4 4 4 4 4 4 4 4 4 4 4 4
~~~;;~;-=;;~~~,-=~;~;===-"~~~~=====-===-"'1§§li"~~=1il!t:i!~"'"'"'-"-"'~--- ----------------MP MP AADT PERCENT---------------------------------
.00 1.50 2.70 3.89 5.22 7.48 9.23
10.17 11.03 11.89 12.19 12.84 13.49 14.65 15.82 17.16 18.05 19.07 19.94 22.28
1.50 2.70 3.89 5.22 7.48 9.23
10.17 11.03 11.89 12.19 12.84 13.49 14.65 15.82 17.16 18.05 19.07 19.94 22.28 23.06
37,000 49,600 51,900 51,300 39,900 66,700 72,500 94,100 91,000 96,900
113,000 115,000 98,100 91,500 91,900 70,600 77,200 65,500 39,900 37,600
66,001
TRUCKS TOTAL CARS BUSES TRUCKS
159
8.61 6.49 6.49 6.49 6.49 5.58 5.58 5.66 5.66 5.66 8.35 8.35 6.84 6.84 6.84 6.84 6.84 6.84 4.16 4.16
6.47
20.26 21.67 22.68 24.81 32.93 42.68 24.72 29.78 28.47 10.61 26.81 27.28 41.36 39.34 44.91 22.83 28.77 20.78 34.12 10.61
18.28 20.21 21.14 23.13 30.70 39.99 23.16 28.06 26.82 10.00 24.53 24.97 38.43 36.56 41.74 21.22 26.74 19.31 32.61 10.14
555.40 517.75
.23
.06
.06
.07
.09
.31
.18
. 04
.03
.01
. 04
.04
.10
.09
.10
.05
.07
. 05
.09
.03
1. 73
1. 74 1.41 1.47 1.61 2.14 2.38 1.38 1.68 1.61
.60 2.24 2.28 2.83 2.69 3. 07 1.56 1.97 1.42 1.42
.44
35.94
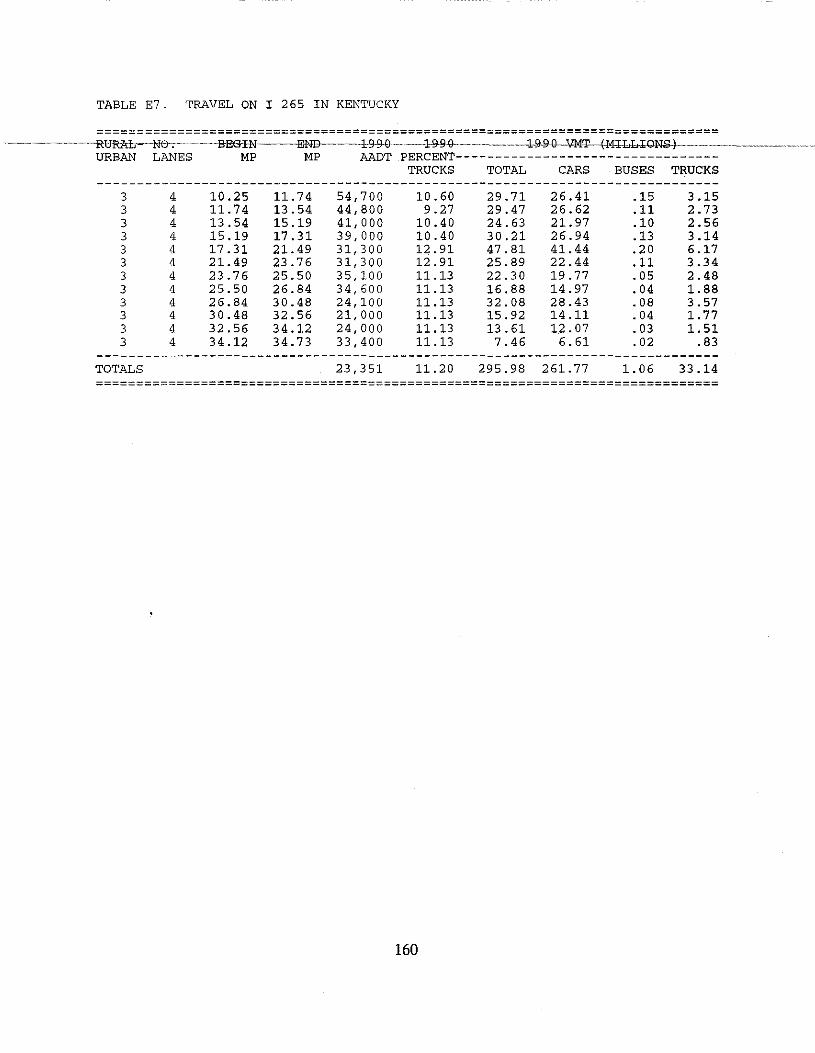
TABLE E7. TRAVEL ON I 265 IN KENTUCKY
-~---~-~------~--~~--RURM:r-··N&.------~-------~B-E<'rl'N------ffiND~--~-~---±fl-9{1-~---~-;k9.9-0-----···············-~------1~'I'--(Mll.1,-IONS-}--------~---······· -------~---············ URBAN LANES MP MP AADT PERCENT---------------------------------
TRUCKS TOTAL CARS BUSES TRUCKS ------------------------------------------------------------------------------
3 4 10.25 11.74 54,700 10.60 29.71 26.41 .15 3.15 3 4 11.74 13.54 44,800 9.27 29.47 26.62 .11 2.73 3 4 13.54 15.19 41,000 10.40 24.63 21.97 .10 2.56 3 4 15.19 17.31 39,000 10.40 30.21 26.94 .13 3.14 3 4 17.31 21.49 31,300 12.91 47.81 41.44 .20 6.17 3 4 21.49 23.76 31,300 12.91 25.89 22.44 .11 3.34 3 4 23.76 25.50 35,100 11.13 22.30 19.77 .05 2.48 3 4 25.50 26.84 34,600 11.13 16.88 14.97 .04 1.88 3 4 26.84 30.48 24,100 11.13 32.08 28.43 .08 3.57 3 4 30.48 32.56 21,000 11.13 15.92 14.11 .04 1. 77 3 4 32.56 34.12 24,000 11.13 13.61 12.07 .03 1.51 3 4 34.12 34.73 33,400 11.13 7.46 6.61 .02 .83
TOTALS 23,351 11.20 295.98 261.77 1.06 33.14
160
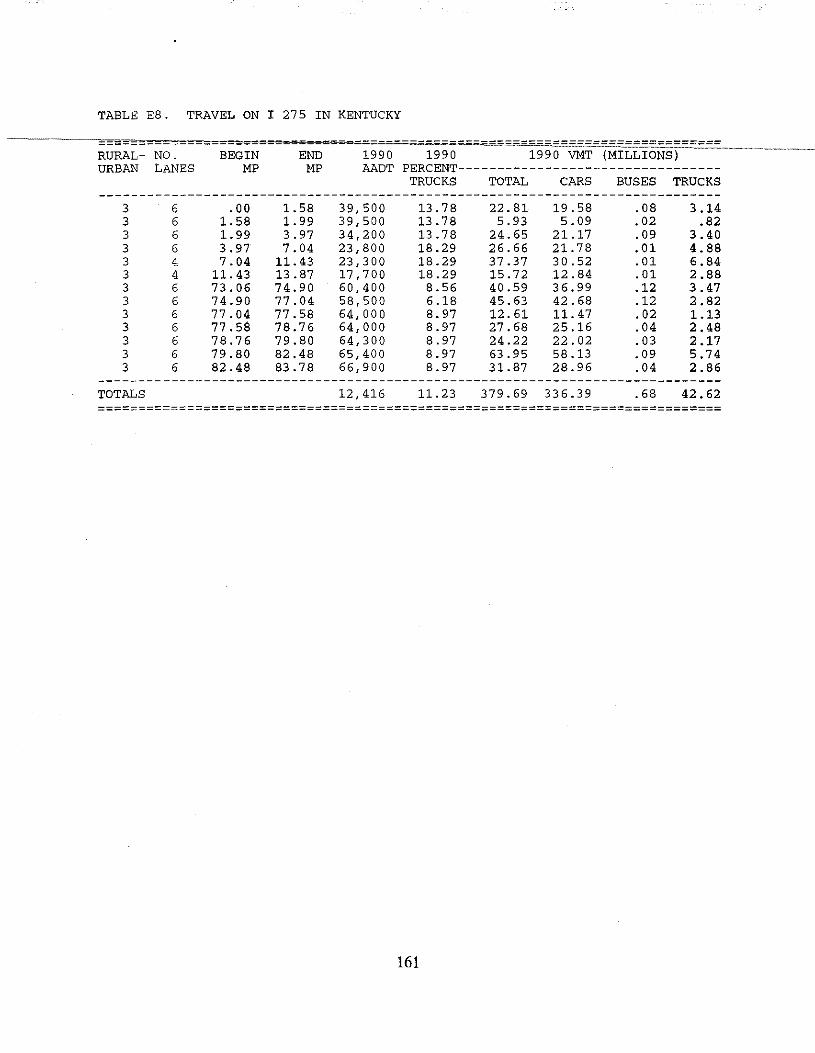
TABLE E8. TRAVEL ON I 275 IN KENTUCKY
!!!I& -----;--------------------------RURAL- NO. BEGIN END 1990 1990 1990 VMT (MILLIONS)
-----------------------------------
URBAN LANES MP MP AADT PERCENT---------------------------------TRUCKS TOTAL CARS BUSES TRUCKS
------------------------------------------------------------------------------3 6 .oo 1.58 39,500 13.78 22.81 19.58 .08 3.14 3 6 1.58 1.99 39,500 13.78 5.93 5.09 .02 .82 3 6 1.99 3. 97 34,200 13.78 24.65 21.17 .09 3.40 3 6 3. 97 7.04 23,800 18.29 26.66 21.78 .01 4.88 3 4 7.04 11.43 23,300 18.29 37.37 30.52 . 01 6.84 3 4 11.43 13.87 17,700 18.29 15.72 12.84 .01 2.88 3 6 73.06 74.90 60,400 8.56 40.59 36.99 .12 3.47 3 6 74.90 77.04 58,500 6.18 45.63 42.68 .12 2.82 3 6 77.04 77.58 64,000 8.97 12.61 11.47 .02 1.13 3 6 77.58 78.76 64,000 8.97 27.68 25.16 .04 2.48 3 6 78.76 79.80 64,300 8.97 24.22 22.02 .03 2 .17 3 6 79.80 82.48 65,400 8.97 63.95 58.13 .09 5.74 3 6 82.48 83.78 66,900 8.97 31.87 28.96 .04 2.86
------------------------------------------------------------------------------TOTALS 12,416 11.23 379.69 336.39 .68 42.62
161
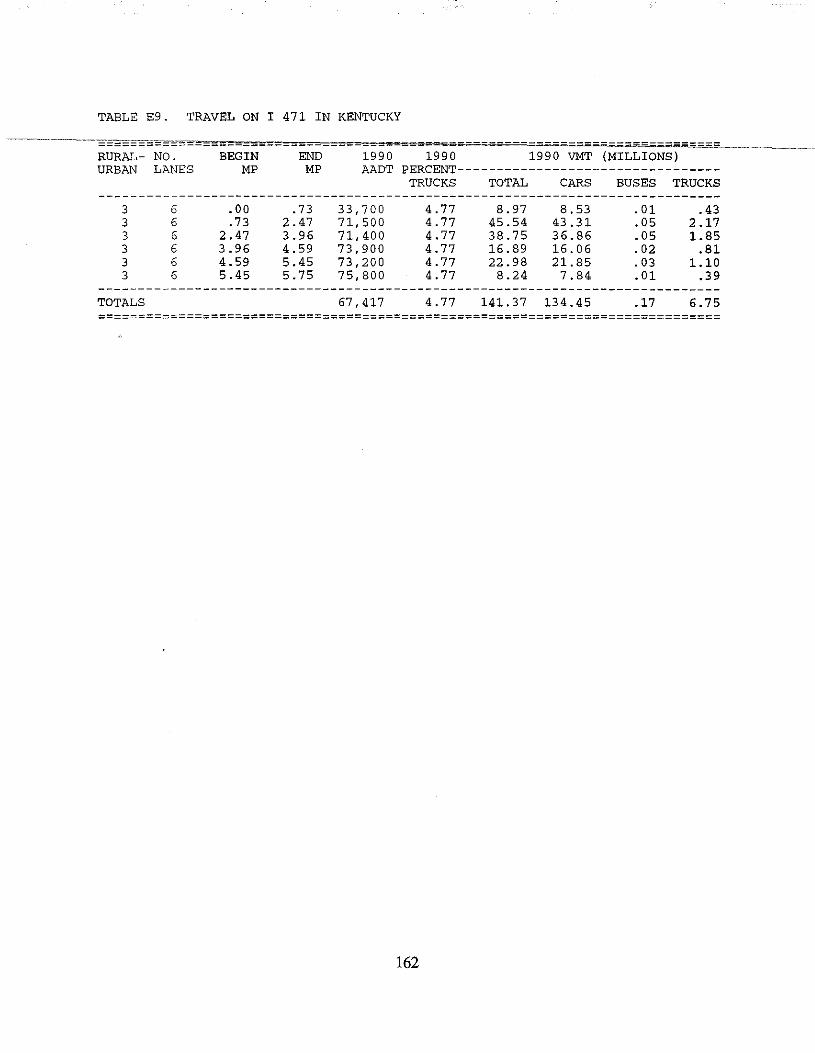
TABLE E9. TRAVEL ON I 471 IN KENTUCKY
RURAL- NO. URBAN LANES
BEGIN MP
END MP
1990 1990 1990 VMT (MILLIONS) AADT PERCENT---------------------------------
TRUCKS TOTAL CARS BUSES TRUCKS ------------------------------------------------------------------------------
3 6 .00 . 73 33,700 4.77 8.97 8.53 .01 .43 3 6 .73 2.47 71,500 4.77 45.54 43.31 . 05 2.17 3 6 2.47 3.96 71,400 4.77 38.75 36.86 . 05 1.85 3 6 3.96 4.59 73,900 4.77 16.89 16.06 .02 .81 3 6 4.59 5.45 73' 200 4.77 22.98 21.85 .03 1.10 3 6 5.45 5.75 75,800 4.77 8.24 7.84 . 01 .39
TOTALS 67' 417 4.77 141.37 134.45 .17 6.75
162
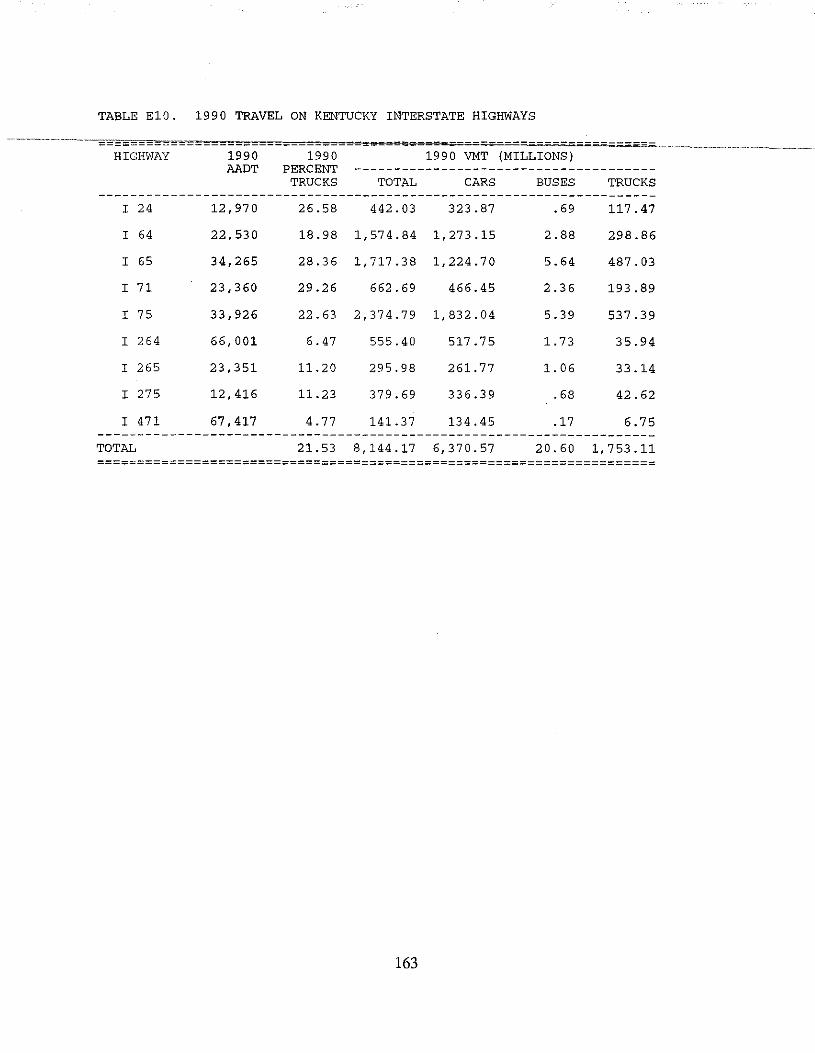
TABLE E10. 1990 TRAVEL ON KENTUCKY INTERSTATE HIGHWAYS
----------------------- = s ~ ---------------.. --~~------
HIGHWAY 1990 1990 1990 VMT (MILLIONS) AADT PERCENT --------------------------------------
TRUCKS TOTAL CARS BUSES TRUCKS ----------------------------------------------------------------------
I 24 12' 97 0 26.58 442.03 323.87 .69 117.47
I 64 22,530 18.98 1,574.84 1,273.15 2.88 298.86
I 65 34,265 28.36 1,717.38 1,224.70 5.64 487.03
I 71 23,360 29.26 662.69 466.45 2.36 193.89
I 75 33,926 22.63 2,374.79 1,832.04 5.39 537.39
I 264 66,001 6.47 555.40 517.7 5 1. 73 35.94
I 265 23,351 11.20 295.98 261.77 1. 06 33.14
I 275 12,416 11.23 379.69 336.39 .68 42.62
I 471 67,417 4.77 141.37 134.45 .17 6.75
TOTAL 21.53 8,144.17 6,370.57 20.60 1,753.11
163

APPENDIXF
EXTENDED-WEIGHT SYSTEM

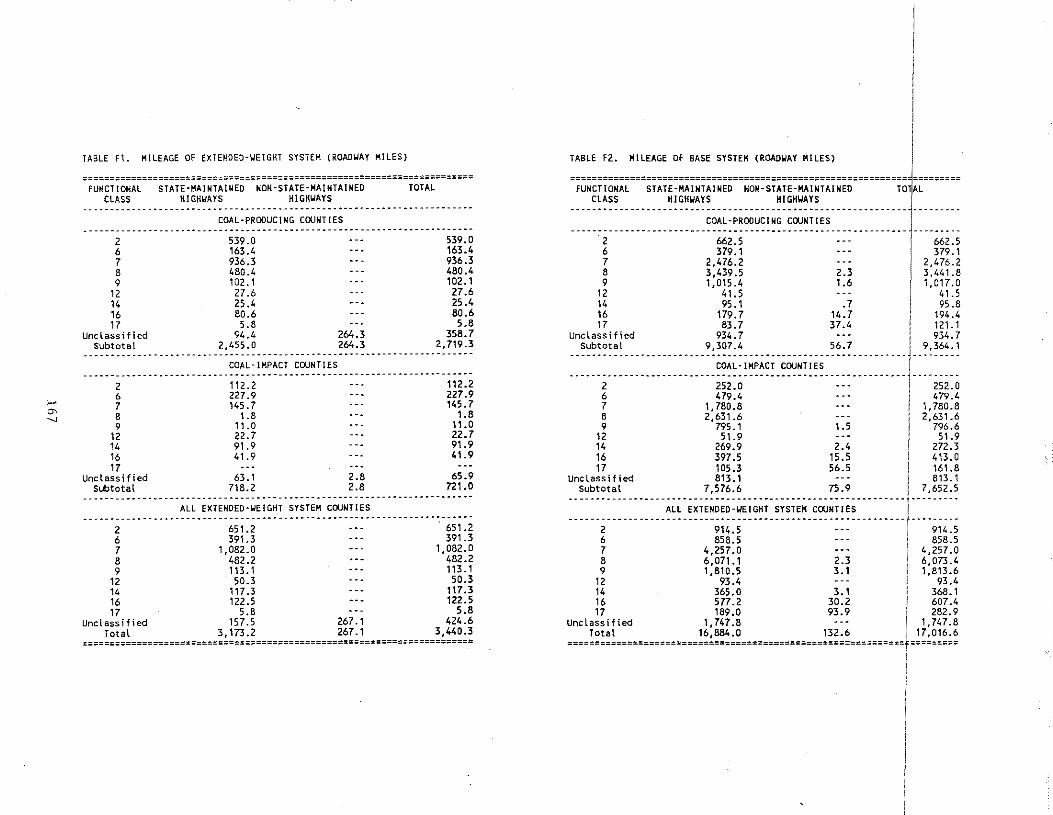
TABLE F1. MILEAGE OF EXTENDED-WEIGHT SYSTEM (ROADWAY MILES} TABLE F2. MILEAGE Of BASE SYSTEM (ROADWAY MILES)
======================================================================== ==============================================================~========= FUNCTIONAL STATE-MAINTAINED NON-STATE-MAINTAINED TOTAL FUNCTIONAL STATE-MAINTAINED NON-STATE-MAINTAINED T011AL
CLASS HIGHWAYS HIGHUAYS CLASS HIGHWAYS HIGHWAYS
COAL-PRODUCING COUNTIES COAL-PRODUCING COUNTIES 0
2 662.5 -·- 1 662.5 6 379.1 ••• I 379.1 7 2,476.2 ... 2,476.2 8 3,439.5 2.3 3,441.8 9 1,015.4 1.6 I 1,017.0
12 41.5 .•. 41.5 14 95.1 .7 1 95.8 16 179.7 14.7 i 194.4
2 539.0 --- 539.0 6 163.4 --- 163.4 7 936.3 --- 936.3 8 480.4 --- 480.4 9 102.1 --- 102.1
12 27.6 --- 27.6 14 25.4 --- 25.4 16 80.6 --- 80.6
11 83.7 37.4 I 121.1 Unclassified 934.7 --- i 934.7
17 5.8 --. 5.8 Unclassified 94.4 264.3 358.7
Subtotal 2,455.0 264.3 2, 719.3 Subtotal 9,307.4 56.7 1 9,364.1 ---------------------------·-----------------------··-······-·1····-----
COAL-IMPACT COUNTIES COAL·IMPACT COUNTIES I ----------------------------------------------------------·-··j····-----
2 252.0 --- ' 252.0 6 479.4 --- I 479.4 1 1,780.8 --- 1 1,780.8 8 2,631.6 --- ' 2,631.6 9 795.1 1.5 I 796.6
12 51.9 --- i 51.9 14 269.9 2.4 i 272.3
------------------------------------------------------------------------2 112.2 --- 112.2 6 227.9 --- 227.9 ,... 7 145.7 --- 145.7
"' ..._, 8 1.8 --- 1.8 9 11.0 --. 11.0
12 22.7 --- 22.7 14 91.9 --- 91.9 16 41.9 --- 41.9 16 397.5 15.5 I 413.o
17 105.3 56.5 i 161.8 Unclassified 813.1 --- I 813.1
Subtotal 7,576.6 75.9 I 7,652.5 ---------------------------------------------------------·--·-t····-----
17 ... ·-- ---Unclassified 63.1 2.8 65.9
Subtotal 718.2 2.8 721.0 -------------------------------·----------------------------------------
ALL EXTENDEO·IJEJGHT SYSTEM COUNTIES ALL EXTENDED-WEIGHT SYSTEM COUNTIES I ------2·-------------------9;~:;·---------------·:::·---------r--·-9;;:;
6 858.5 --- 1 858.5 7 4,257.0 --- i 4,257.0 8 6,071.1 2.3 i 6,073.4 9 1,810.5 3.1 I 1,813.6
12 93.4 --- I 93.4
-- . -- --- .. -. -- ..... - . -. -. -- " ... -- . --- .. ---- .. ------ -- " ... --- -- .. --.--- ---2 651.2 --- 651.2 6 391.3 --- 391.3 7 1,082.0 --- 1,082.0 8 482.2 --- 482.2 9 113.1 --- 113.1
12 50.3 --- 50.3 14 365.0 3.1 368.1 16 577.2 30.2 ' 607.4 17 189.0 93.9 ' 282.9
Unclassified 1,747.8 --- l 1,747.8 Total 16,884.0 132.6 17,016.6
==============================================================r=========
14 117.3 --- 117.3 16 122.5 --- 122.5 17 5.8 --- 5.8
Unclassified 157.5 267.1 424.6 Total 3,173.2 267.1 3,440.3
========================================================================
I
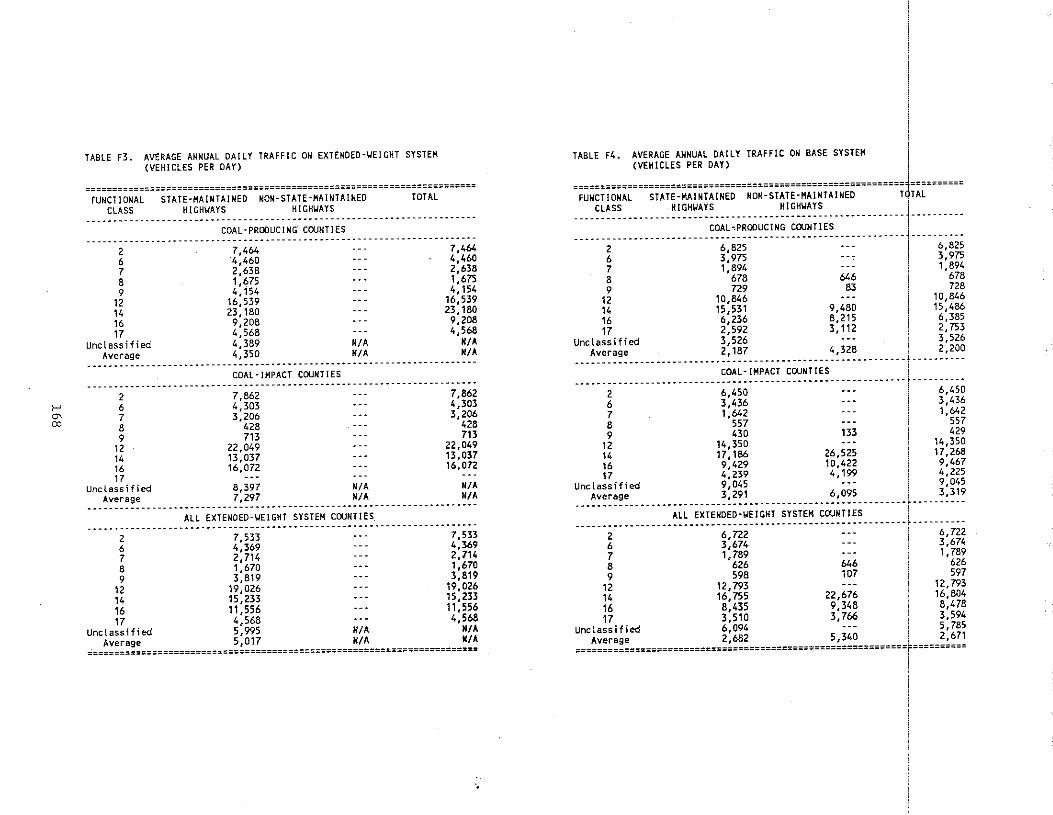
>-' a--CXl
TABLE F3. AVERAGE ANNUAL DAILY TRAFFIC ON EXTENDED-WEIGHT SYSTEM (VEHICLES PER DAY)
======================================================================== FUNCTIONAL STATE-MAINTAINED NON-STATE-MAINTAINED TOTAL
CLASS HIGHWAYS HIGHUAYS ------------------------------------------------------------------------
COAL-PRODUCING. COO!HIES ------------------------------------------------------------------------
2 7,464 --- 7,464 6 4,460 --- 4,460 7 2,636 --- 2,638 8 1,675 --- 1,675 9 4,154 --- 4,154
12 16,539 --- 16,539 14 23,180 --- 23,180 16 9,206 --- 9,208 17 4,568 --- 4,568
Unclassified 4,389 N/A N/A
Average 4,350 N/A N/A ------------------------------------------------------------------------
COAL-IMPACT COUNTIES ------------------------------------------------------------------------
2 7,662 6 4,303 7 3,206 8 428 9 713
12 22,049 14 13,037 16 16,072 17 ---
Unclassified 6,397 N/A Average 7,297 N/A
------------------------------------------.---ALL EXTENDED-WEIGHT SYSTEM COONTIES
7,862 4,303 3,206
428 713
22,049 13,037 16,072
N/A N/A
------------------------------------------------------------------------2 7,533 --- 7,533 6 4,369 --- 4,369 7 2,714 --- 2,714 8 1,670 --- 1,670 9 3,819 --- 3,819
12 19,026 --- 19,026 14 15,233 --- 15,233 16 11,556 --- 11,556 17 4 568 --- 4 568
Unclassified 5:995 N/A 'tUA Average 5.017 N/A N/A
========================================================================
'•
I TABLE F4. AVERAGE ANNUAL DAILY TRAFFIC ON BASE SYSTEM j
(VEHICLES PER DAY)
~~~~~~~~~~~~~~~~~~~~~~~~~~~~~~~~~~~~~~~~~~~~~~~~~~~~~~~~~~~~~1~~~~~~~~~~
FUNCTIONAL STATE-MAINTAINED NON-STATE-MAINTAINED TQTAL CLASS HIGHWAYS HIGHWAYS
-------------------------------------------------------------
2 6 7 8 9
12 14 16 17
Unclassified Average
COAL~PROOUCING COUNTIES
6,825 3,975 1,894
678 729
10,846 15,531 6,236 2,592 3,526 2,187
6,825 3,975 1,894
646 678 83 728
--- 10 846 9,46D 15:466 8,215 6,385 3,112 2, 753
--- 3 526 4,328 2:200
------------------------------------.--- ------------ ----------COAL-IMPACT COUNTIES
-------------------------------------------2 6,450 --- I 6,450 6 3,436 --- 3,436 1 1,642 --- I 1,642 8 557 --- ' 557 9 430 133 i 429
12 14,350 --- ' 14,350 14 17,186 26,525
1
· 17,268 16 9,429 10,422 9,467 17 4,239 4,199 •
1
4,225 Unclassified 9, 045 - • • 9, 045
Average 3,291 6,095 3,319 -------------------------------------------------------------~----------
ALL EXTENDED-WEIGHT SYSTEM COUNTIES l -------------------------------------------------------------, ----------
2 6,722 --- 1 6,nz 6 3,674 --- 1 3,674 7 1789 --- '1789 8 • 626 646 •
1
· • 626 9 598 107 597
12 12,793 --- ; 12,793 14 16,755 22,676 ! 16,804 16 8,435 9,348 1 a,478 17 3,510 3,766 ; 3,594
Unclassified 6,094 --- ! 5,785 Average 2,682 5,340 1 2,671
~~~~~~~~~~~~~~~~~~~~~~~~~~~~~~~~~~~~~~~~~~~~~~~~~~~~~~~~~~~~~~~~~~~~~~~~
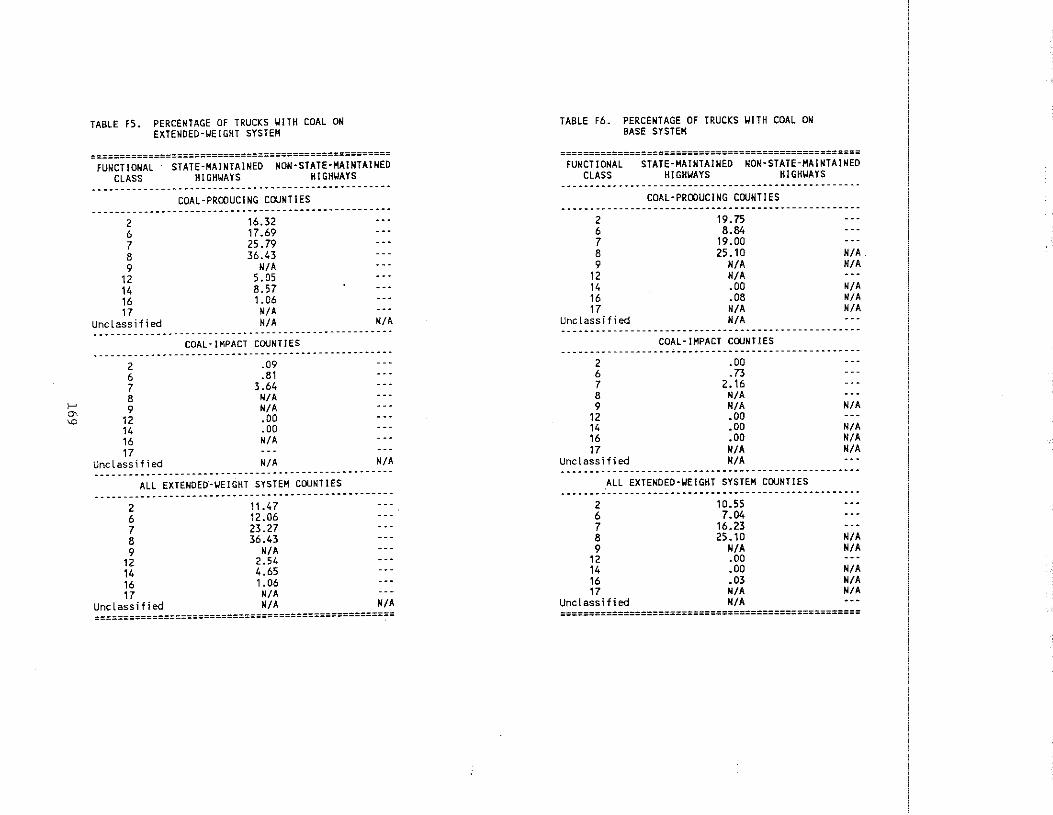
,... "' "'
TABLE FS. PERCENTAGE OF TRUCKS ~ITH COAL ON EXTENDED-WEIGHT SYSTEM
==================================================== FUNCTIONAL STATE-MAINTAINED NON·STATE·MAINTAINED
CLASS HIGHWAYS HIGHWAYS ----------------------------------------------------
COAL-PRODUCING COUNTIES ----------------------------------------------------
2 6 7 8 9
12 14 16 17
Unclassified
16.32 17.69 25.79 36.43
N/A 5.05 8.57 1.06
N/A N/A N/A
----------------------------------------------------COAL-IMPACT COUNTIES
----------------------------------------------------2 .09 6 .81 7 3.64 8 N/A 9 N/A
12 .00 14 .00 16 N/A 17 ---
Unclassified N/A N/A ----------------------------------------------------
ALL EXTENDED-WEIGHT SYSTEM COUNTIES ----------------------------------------------------
2 6 7 8 9
12 14 16 17
Unclassified
11.47 12.06 23.27 36.43
N/A 2.54 4.65 1.06
N/A N/A N/A
====================================================
TABLE F6. PERCENTAGE Of TRUCKS WITH COAL ON BASE SYSTEM
==================================================== FUNCTIONAL STATE-MAINTAINED NON-STATE-MAINTAINED
CLASS HIGHWAYS HIGHWAYS
COAL-PRODUCING COUNTIES
2 19.75 6 8.84 7 19.00 8 25-10 N/A 9 N/A N/A
12 N/A ---14 .DO N/A 16 .08 N/A 17 N/A N/A
Unclassified N/A
COAL-IMPACT COUNTIES
2 .00 6 .73 7 2.16 8 N/A 9 N/A N/A
12 .00 ---14 .00 N/A 16 .oo N/A 17 N/A N/A
Unclassified N/A
ALL EXTENDED-WEIGHT SYSTEM COUNTIES ----------------------------------------------------
2 10.55 6 7.04 7 16.23 8 25.10 N/A 9 N/A N/A
12 .00 ---14 .00 N/A 16 .03 N/A 17 N/A N/A
Unclassified N/A ====================================================
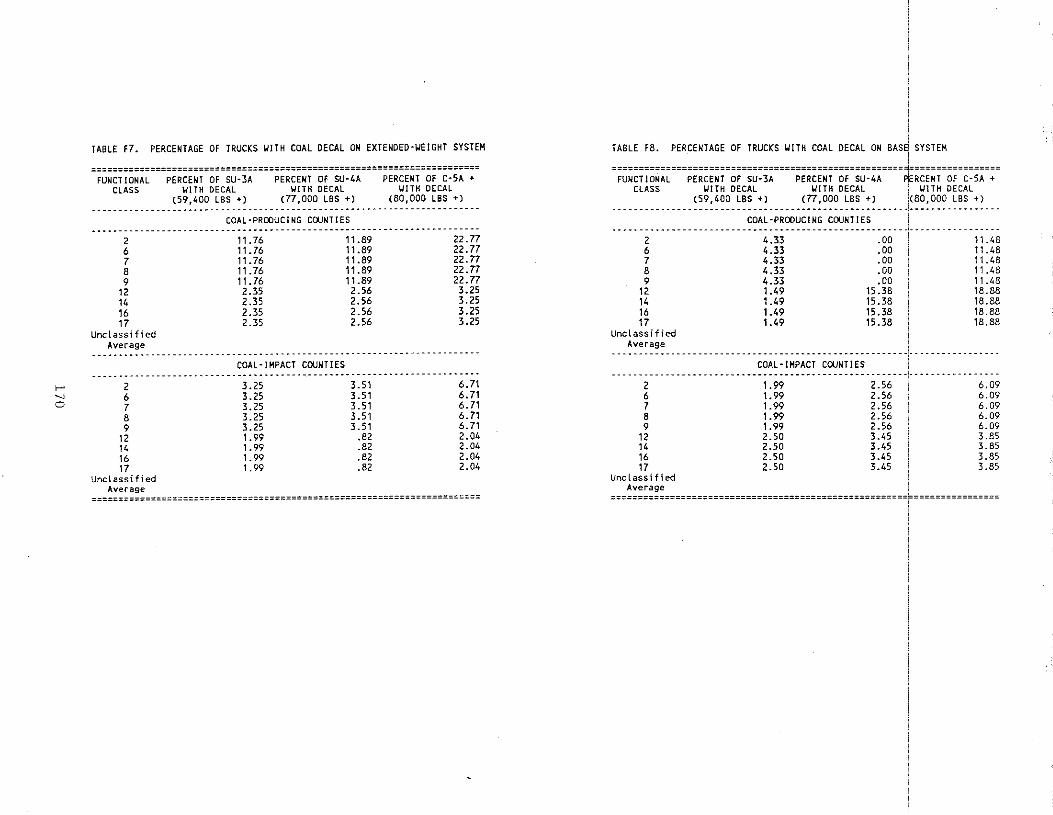
>-' .._, 0
TABLE F7. PERCENTAGE OF TRUCKS WITH COAL DECAL ON EXTENDED-WEIGHT SYSTEM
======================================================================== FUNCTIONAL PERCENT OF SU·3A
CLASS WITH DECAL (59,400 LBS +)
PERCENT Of SU·4A WITH DECAL
(77,000 LBS +)
COAL-PRODUCING COUNTIES
PERCENT OF C·SA + WITH DECAL
(80,000 LBS +)
-------------" ---.------------------------------------------------------2 6 7 8 9
12 14 16 17
Unclassified Average
11.76 11.76 11.76 11.76 11.76 2.35 2.35 2.35 2.35
11.89 22.77 11.89 22.77 11.89 22.77 11.89 22.77 11.89 22.77 2.56 3.25 2.56 3.25 2.56 3.25 2.56 3.25
--------------------.---------------------------------------------------COAL-IMPACT COUNTIES
-----.----------.-----------------------------------.-------------------2 3.25 3.51 6.71 6 3.25 3.51 6.71 7 3.25 3.51 6.71 8 3.25 3.51 6.71 9 3.25 3.51 6.71
12 1.99 .82 2.04 14 1.99 .82 2.04 16 1.99 .82 2.04 17 1.99 .82 2.04
Unclassified Average
========================================================================
I TABLE F8. PERCENTAGE OF TRUCKS WITH COAL DECAL ON BAS9 SYSTEM
"""""""""""""""""""""""""""::::::"::::::::::":::"":::"~:":""""::"""::::: FUNCTIONAL PERCENT OF SU-3A PERCENT OF SU·4A 1ERCEHT OF C·5A +
CLASS WITH DECAL WITH DECAL WITH DECAL (59,400 LBS +) (77,000 LBS -+-) 1<80,000 LBS +}
-.----------.------------------------------------------- .. --------------COAL-PROOUCING COJIHIES I
---------.-------------------.-------------------- .. -- -1-----.-----------2 4.33 .oo 1 11.48 6 4.33 .00 1 11.48 7 4.33 .oo 1 11.48 a 4.33 .oo I 11.48 9 4.33 .oo 1 11.48
12 1.49 15.38 1 18.88 14 1.49 15.38 1 18.88 16 1.49 15.38 I 18.88 17 1.49 15.38 I 18.88
Unclassified i
-·- I --------------------------- ~~~~:j~;~~; -~~~~;~;- -------!----------.--.------------------------------ ···- -------------.-------.--1-.---------------
2 1.99 2.56 6.09 6 1.99 2.56 6.09 7 1.99 2.56 6.09 8 1.99 2.56 6.09 9 1.99 2.56 6.09
12 2.50 3.45 3.85 14 2.50 3.45 3.85 16 2.50 3.45 3.85 17 2.50 3.45 3.85
Unclassified Average I
=======================================================F================
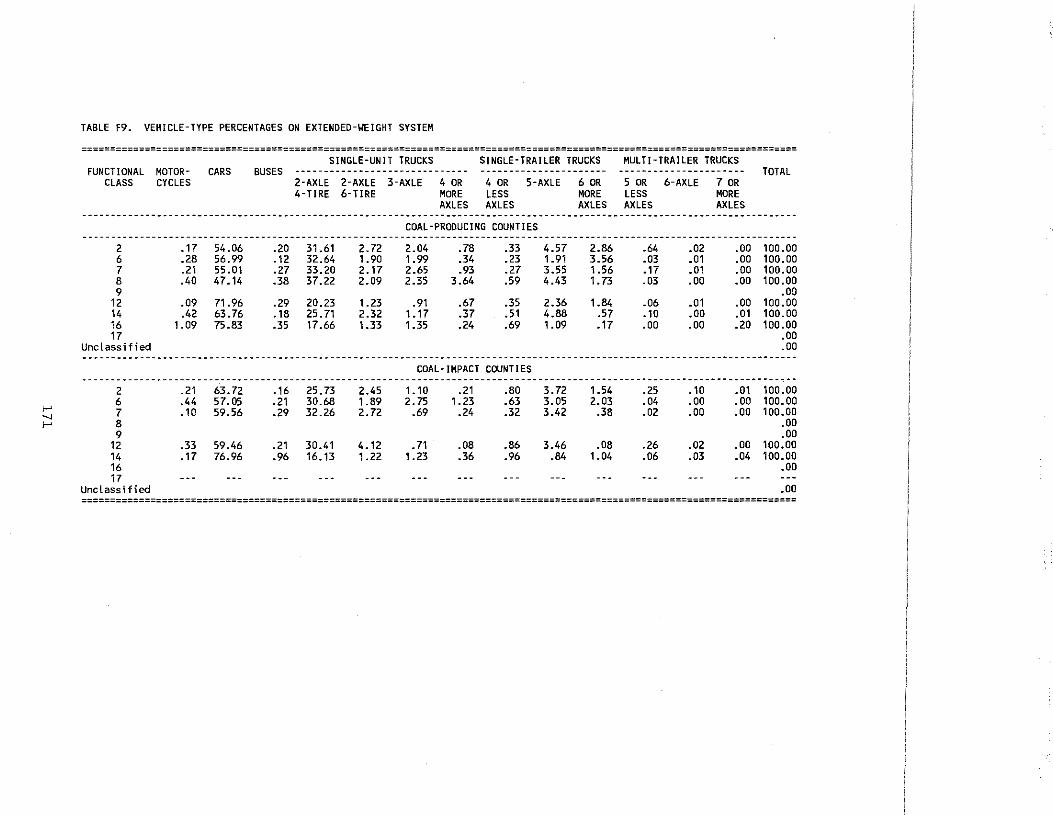
TABLE F9. VEHICLE-TYPE PERCENTAGES ON EXTENDED-WEIGHT SYSTEM
============================================================================================================================ SINGLE-UNIT TRUCKS SINGLE-TRAILER TRUCKS MULTI-TRAILER TRUCKS
FUNCTIONAL MOTOR- CARS BUSES ------------------------------ ---------------------- ---------------------- TOTAL CLASS CYCLES 2-AXLE 2-AXLE 3-AXLE 4 OR 4 OR 5-AXLE 6 OR 5 OR 6-AXLE 7 OR
4-TIRE 6-TIRE MORE LESS MORE LESS MORE AXLES AXLES AXLES AXLES AXLES
COAL-PRODUCING COUNTIES ----------------------------------------------------------------------------------------------------------------------------
2 .17 54.06 .20 31.61 2.72 2.04 . 78 .33 4.57 2.86 .64 .02 .00 100.00 6 .28 56.99 .12 32.64 1.90 1.99 .34 .23 1.91 3.56 .03 .01 .00 100.00 7 .21 55.01 .27 33.20 2.17 2.65 .93 .27 3.55 1.56 .17 .01 .00 100.00 8 .40 47.14 .38 37.22 2.09 2.35 3.64 .59 4.43 1.73 .03 .00 .00 100.00 9 .00
12 .09 71.96 .29 20.23 1.23 . 91 .67 .35 2.36 1.84 .06 .01 .00 100.00 14 .42 63.76 .18 25.71 2.32 1.17 .37 .51 4.88 .57 .10 .00 .01 100.00 16 1.09 75.83 .35 17.66 1.33 1.35 .24 .69 1.09 .17 .00 .oo .20 100.00 17 .00
Unclassified .00
COAL-IMPACT COUNTIES ·············--------··------------------··-----··----···----------------------------------------------------- --------------
2 .21 63.72 .16 25.73 2.45 1.10 .21 .80 3.72 1.54 .25 .10 .01 100.00 .04 .00 .oo 100.00 .02 .00 .00 100.00
.00
6 .44 57.05 .21 30.68 1.89 2. 75 1.23 .63 3.05 2.03 1-' 7 .10 59.56 .29 32.26 2.72 .69 .24 .32 3.42 .38 -._J
1-' 8 9 .00
12 .33 59.46 .21 30.41 4.12 • 71 .08 .86 3.46 .08 .26 .02 .00 100.00 14 .17 76.96 .96 16.13 1.22 1.23 .36 .96 .84 1.04 .06 .03 .04 100.00 16 .00 17 ---
Unclassified .00 ============================================================================================================================
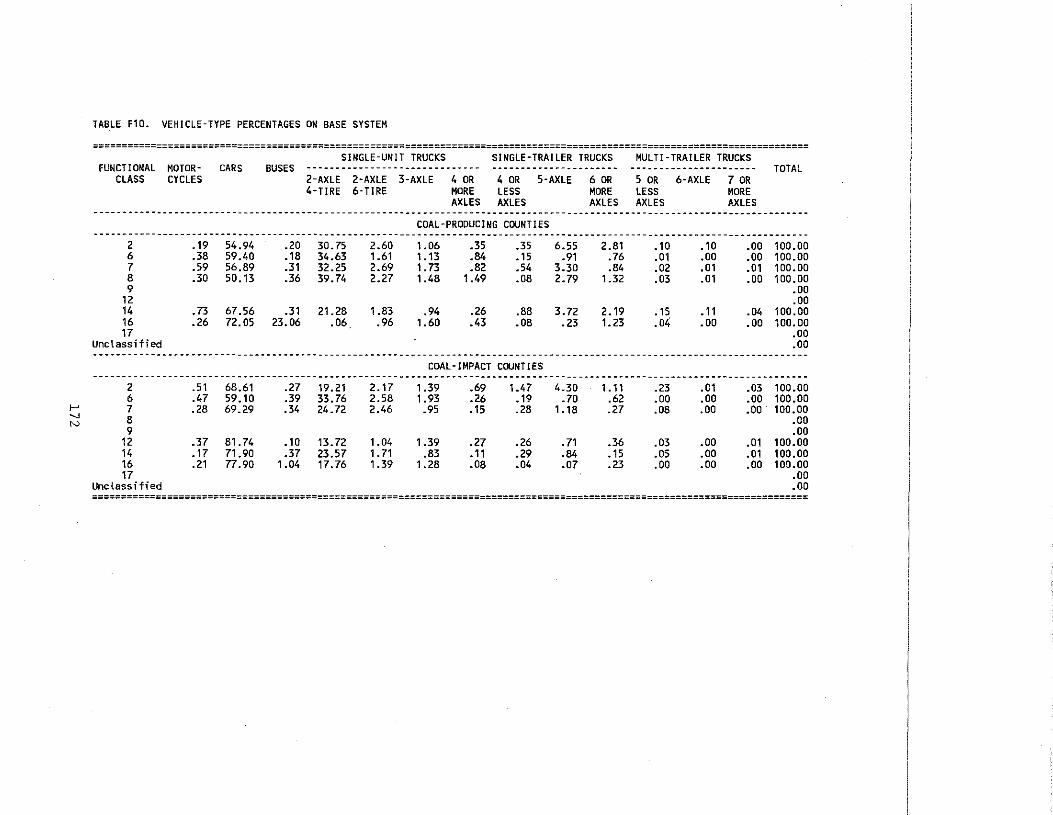
TABLE F10. VEHICLE-TYPE PERCENTAGES ON BASE SYSTEM
============================================================================================================================ SINGLE-UNIT TRUCKS SINGLE-TRAILER TRUCKS MULTI-TRAILER TRUCKS
FUNCTIONAL MOTOR- CARS BUSES ------------------------------ ---------------------- ---------------------- TOTAL CLASS CYCLES 2-AXLE 2-AXLE 3-AXLE 4 OR 4 OR 5-AXLE 6 OR 5 OR 6-AXLE 7 OR
4-TIRE 6-TIRE MORE LESS MORE LESS MORE AXLES AXLES AXLES AXLES AXLES
COAL-PRODUCING COUNTIES ---------------------------------------------------------------------------------------------------------------------
2 -19 54.94 .20 30.75 2.60 1-06 .35 .35 6.55 2.B1 .10 .10 .00 100.00 6 .38 59.40 .18 34.63 1-61 1-13 .84 -15 .91 .76 .01 .oo .00 100.00 7 .59 56.89 .31 32.25 2.69 1-73 .82 .54 3.30 .84 .02 .01 .01 100.00 8 .30 50.13 .36 39.74 2.27 1-48 1-49 .08 2.79 1-32 .03 .01 .00 100.00 9 .00
12 .00 14 .73 67.56 .31 21-28 1-83 .94 .26 .88 3.72 2.19 -15 -11 .04 100.00 16 .26 72.05 23.06 .06 .96 1-60 .43 .08 -23 1-23 .04 .00 .00 100.00 17 .00
Unclassified .00
COAL-IMPACT COUNTIES ----------------------------------------------------------------------------------------------------------------------------
2 -51 68.61 .27 19.21 2.17 1.39 .69 1.47 4.30 ,_ 11 .23 .01 .03 100.00 6 .47 59.10 .39 33.76 2.58 1-93 .26 .19 .70 .62 .00 .00 .00 100.00
1--' 7 .28 69.29 .34 24.72 2.46 .95 -15 .28 ,_ 18 .27 .08 .oo .00 100.00 " 8 .00 N
9 .00 12 .37 81-74 -10 13.72 1-04 1-39 .27 .26 .71 .36 .03 .00 .01 100.00 14 .17 71.90 .37 23.57 ,_ 71 .83 -11 .29 -84 -15 .OS .00 .01 100.00 16 .21 77.90 1.04 17.76 1.39 1-28 .08 .04 .07 .23 .00 .00 .00 100.00 17 .00
Unclassified .00 ============================================================================================================================
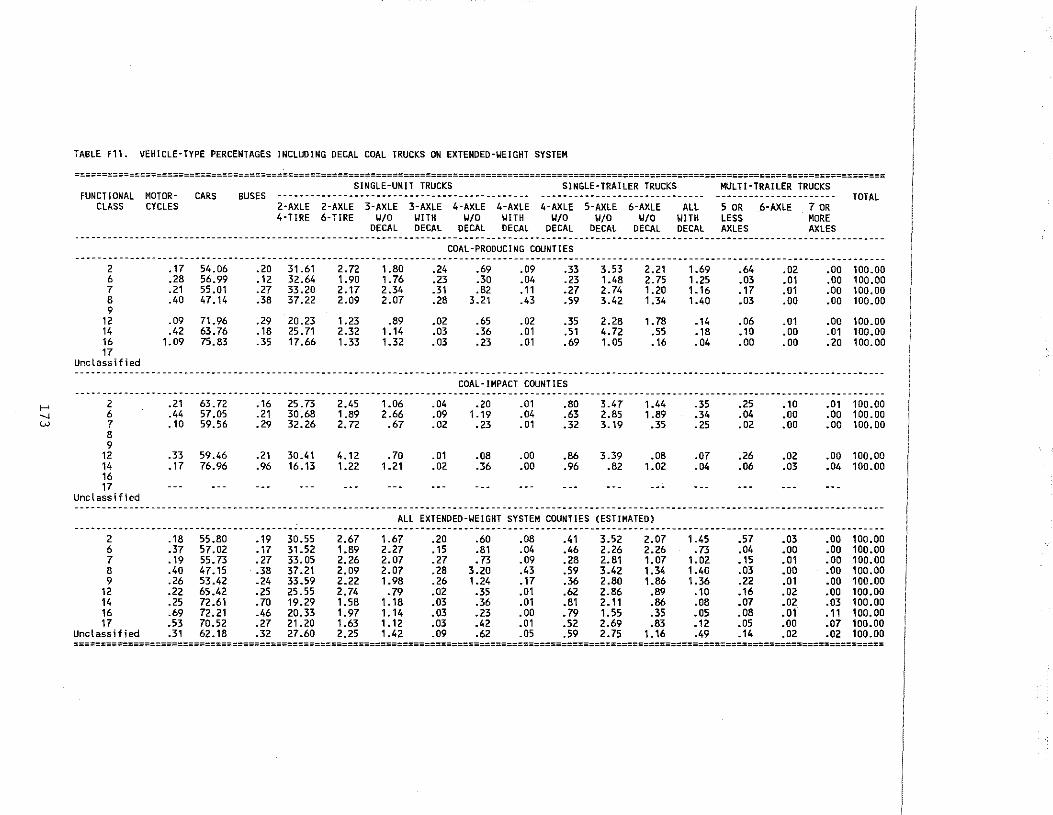
TABLE F11. VEHICLE·TYPE PERCENTAGES INCLUDING DECAL COAL TRUCKS ON EXTENDED·YEIGHT SYSTEM
==================================================================================================================================================== SINGLE-UNIT TRUCKS SINGLE·TRAILER TRUCKS MULTI·TRAILER TRUCKS
FUNCTIONAL MOTOR· CARS BUSES -···-··--·-·-···-··-··-·-·-··-·-·-··----··---· --···---··-·-··-·--·-··-···--- -·-------------------- TOTAL CLASS CYCLES 2-AXLE 2-AXLE 3-AXLE 3-AXLE 4-AXLE 4-AXLE 4-AXLE 5-AXLE 6-AXLE All 5 OR 6-AXLE 7 OR
4-TIRE 6-TIRE W/0 \JITH W/0 \JITH W/0 W/0 W/0 WITH LESS MORE DECAL DECAL DECAL DECAL DECAL DECAL DECAL DECAL AXLES AXLES
-------------------·----------------------------------------------------------------------------·---------------------------------------------------COAL-PRODUCING COUNTIES
---------------------------------·-----------·-----------------------------------------------·-------------------------2 .17 54.06 .20 31.61 2.72 1.80 .24 .69 .09 .33 3.53 2.21 1.69 .64 .02 .00 100.00 6 .28 56.99 . 12 32.64 1.90 1.76 .23 .30 .04 .23 1.48 2.75 1.25 .03 .01 .00 100.00 7 . 21 55.01 .27 33.20 2.17 2.34 .31 .82 . 11 .27 2.74 1.20 1.16 .17 .01 .00 100.00 8 .40 47.14 .38 37.22 2.09 2.07 .28 3.21 .43 .59 3.42 1.34 1.40 .03 .00 .00 100.00 9
12 .09 71.96 .29 20.23 1.23 .89 .02 .65 .02 .35 2.28 1. 78 .14 .06 .01 .00 100.00 14 .42 63.76 -18 25.71 2.32 1.14 .03 .36 .01 . 51 4.72 .55 .18 • 10 .00 .01 100.00 16 1.09 75.83 .35 17.66 1.33 1.32 .03 .23 .01 .69 1.05 .16 .04 .00 .00 .20 100.00 17
Unclassified ---------·----·----------------------------------------------------·----·------------------------------------·------------
COAL-IMPACT COUNTIES --------------------------------------------------------------------------------------------------·-------------------------------------------------
>-' 2 .21 63.72 . 16 25.73 2.45 1.06 .04 .20 .01 .80 3.47 1.44 .35 .25 .10 .01 100.00 _, 6 .44 57.05 .21 30.68 1.89 2.66 .09 1.19 .04 .63 2.85 1.89 .34 .04 .00 .00 100.00 w 7 . 10 59.56 .29 32.26 2.72 .67 .02 .23 . 01 .32 3.19 .35 .25 .02 .00 .00 100.00
8 9
12 .33 59.46 .21 30.41 4.12 . 70 .01 .08 .00 .86 3.39 .08 .07 .26 .02 .00 100.00 14 .17 76.96 .96 16.13 1.22 1.21 .02 .36 .00 .96 .82 1.02 .04 .06 .03 .04 100.00 16 17
Unclassified -------------------------------------------------------·------------------------------------
ALL EXTENDEO-\JEIGHT SYSTEM COUNTIES (ESTIMATED) --------------------------------------------------------------------------------------------·----·--------------------------------------------------
2 .18 55.80 .19 30.55 2.67 1.67 .20 .60 .08 .41 3.52 2.07 1.45 .57 .03 .00 100.00 6 .37 57.02 .17 31.52 1.89 2.27 .15 .81 .04 .46 2.26 2.26 .73 .04 .00 .00 100.00 7 .19 55.73 .27 33.05 2.26 2.07 .27 .73 .09 .28 2.81 1.07 1.02 .15 .01 .00 100.00 8 .40 47.15 .38 37.21 2.09 2.07 .28 3.20 .43 .59 3.42 1.34 1.40 .03 .00 .00 100.00 9 .26 53.42 .24 33.59 2.22 1.98 .26 1.24 .17 .36 2.80 1.86 1.36 .22 .01 .oo 100.00
12 .22 65.42 .25 25.55 2.74 .79 .02 .35 .01 .62 2.86 .89 .10 .16 .02 .00 100.00 14 .25 72.61 .70 19.29 1.58 1.18 .03 .36 .01 .81 2.11 .86 .08 .07 .02 .03 100.00 16 .69 72.21 .46 20.33 1.97 1.14 .03 .23 .00 .79 1. 55 .35 .05 .08 .01 .11 100.00 17 .53 70.52 .27 21.20 1.63 1.12 .03 .42 .01 .52 2.69 .83 .12 .05 .00 .07 100.00
Unclassified .31 62.18 .32 27.60 2.25 1.42 .09 .62 .05 .59 2.75 1.16 .49 .14 .02 .02 100.00 ===::===============================================================================================================================================
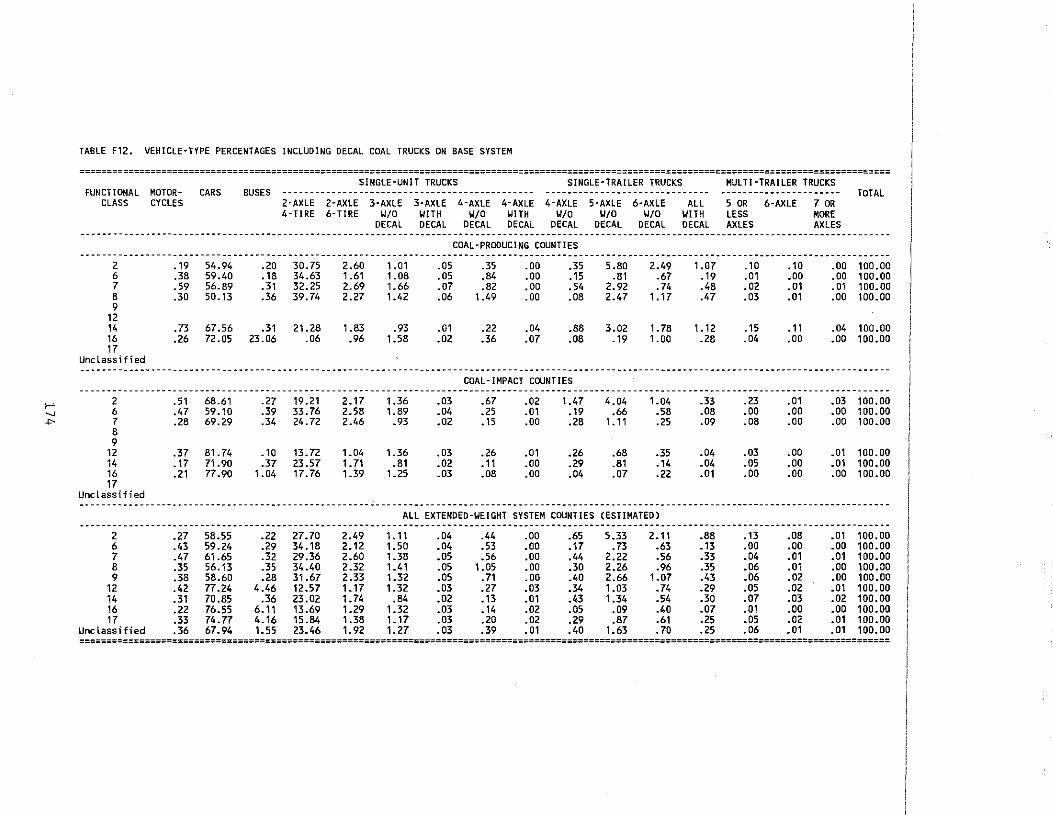
TABLE F12. VEHICLE-TYPE PERCENTAGES INCLUDING DECAL COAL TRUCKS ON BASE SYSTEM
==================================================================================================================================================== SINGLE-UNIT TRUCKS SINGLE-TRAILER TRUCKS MULTI-TRAILER TRUCKS
FUNCTIONAL MOTOR- CARS BUSES ---------------------------------------------- ------------------------------ ---------------------- TOTAL CLASS CYCLES 2-AXLE 2-AXLE 3-AXLE 3-AXLE 4-AXLE 4-AXLE 4-AXLE 5-AXLE 6-AXLE ALL 5 OR 6-AXLE 7 OR
4-TIRE 6-TIRE W/0 WITH W/0 WITH W/0 W/0 W/0 WITH LESS MORE DECAL DECAL DECAL DECAL DECAL DECAL DECAL DECAL AXLES AXLES
----------------------------------------------------------------------------------------------------------------------------------COAL-PRODUCING COUNTIES
---------------------------------------------------------------------------------------------------------2 .19 54.94 .20 30.75 2.60 1.01 .05 .35 .00 .35 5.80 2.49 1.07 .10 .10 .00 100.00 6 .38 59.40 .18 34.63 1 .61 1.08 .05 .84 .00 .15 .81 .67 • 19 .01 .00 .00 100.00 7 .59 56.89 .31 32.25 2.69 1.66 .07 .82 .00 . 54 2.92 . 74 .48 .02 .01 . 01 100.00 8 .30 50.13 .36 39.74 2.27 1.42 .06 1.49 .00 .08 2.47 1.17 .47 .03 .01 .00 100.00 9
12 14 .73 67.56 .31 21.28 1.83 .93 .01 .22 .04 .88 3.02 1.78 1.12 .15 • 11 .04 100.00 16 .26 72.05 23.06 .06 .96 1.58 .02 .36 .07 .08 .19 1.00 .28 .04 .00 .00 100.00 17
Unclassified ----------------------------------------------------------------------------------------------------------------------------------------------------
COAL-IMPACT COUNTIES ----------------------------------------------------------------------------------------------------------------------------------------------------
>-' 2 .51 68.61 .27 19.21 2.17 1.36 .03 .67 .02 1.47 4.04 1.04 .33 .23 .01 .03 100.00 ..., 6 .47 59.10 .39 33.76 2.58 1.89 .04 .25 .01 .19 .66 .58 .08 .00 .00 .00 100.00 .p. 7 .28 69.29 .34 24.72 2.46 .93 .02 .15 .00 .28 1. 11 .25 .09 .08 .00 .00 100.00
8 9
12 .37 81.74 -10 13.72 1.04 1.36 .03 .26 .01 .26 .68 .35 .04 .03 .00 .01 100.00 14 .17 71.90 .37 23.57 1. 71 .81 .02 • 11 .00 .29 .81 .14 .04 .05 .00 .01 100.00 16 . 21 77.90 1.04 17.76 1.39 1.25 .03 .08 .00 .04 .07 .22 .01 .00 .00 .00 100.00 17
Unclassified --------------------------------------------------------------------------------------------------------------
ALL EXTENDED-WEIGHT SYSTEM COUNTIES (ESTIMATED) ----------------------------------------------------------------------------------------------
2 .27 58.55 .22 27.70 2.49 1. 11 .04 .44 .00 .65 5.33 2.11 .88 .13 .08 .01 100.00 6 .43 59.24 .29 34.18 2.12 1.50 .04 .53 .00 • 17 .73 .63 .13 .00 .00 .00 100.00 7 .47 61.65 .32 29.36 2.60 1.38 .05 .56 .00 .44 2.22 .56 .33 .04 .01 .01 100.00 8 .35 56.13 .35 34.40 2.32 1.41 .05 1.05 .00 .30 2.26 .96 .35 .06 .01 .00 100.00 9 .38 58.60 .28 31.67 2.33 1.32 .05 . 71 .00 .40 2.66 1.07 .43 .06 .02 .00 100.00
12 .42 77.24 4.46 12.57 1.17 1.32 .03 .27 .03 .34 1.03 .74 .29 .05 .02 .01 100.00 14 .31 70.85 .36 23.02 1.74 .84 .02 .13 .01 .43 1.34 .54 .30 .07 .03 .02 100.00 16 .22 76.55 6. 11 13.69 1.29 1.32 .03 .14 .02 .05 .09 .40 .07 .01 .00 .00 100.00 17 .33 74.77 4.16 15.84 1.38 ,_ 17 .03 .20 .02 .29 .87 .61 .25 .05 .02 .01 100.00
Unclassified .36 67.94 1.55 23.46 1.92 1.27 .03 .39 . 01 .40 1.63 . 70 .25 .06 .01 .01 100.00 ====================================================================================================================================================
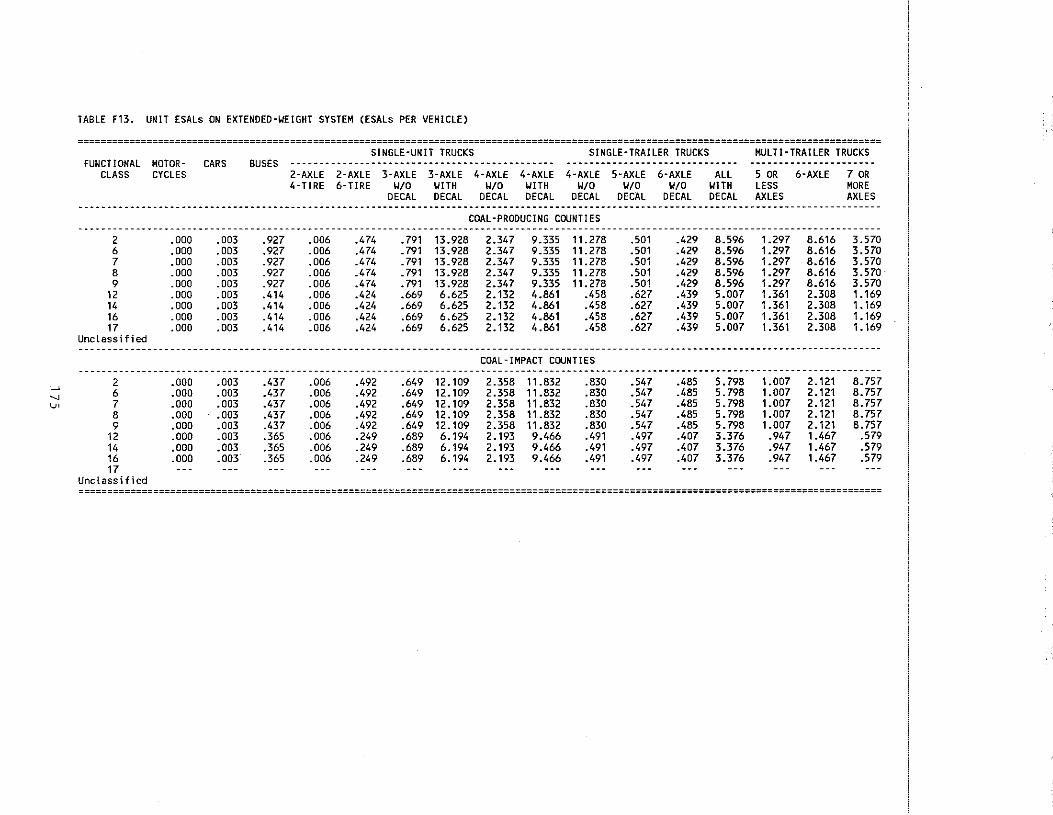
TABLE F13. UNIT ESALs ON EXTENDED·UE!GHT SYSTEM (ESALs PER VEHICLE)
============================================================================================================================================ SINGLE-UNIT TRUCKS SINGLE-TRAILER TRUCKS MULTI-TRAILER TRUCKS
FUNCTIONAL MOTOR· CARS BUSES CLASS CYCLES 2-AXLE 2-AXLE 3-AXLE 3-AXLE 4-AXLE 4-AXLE 4-AXLE 5-AXLE 6-AXLE ALL 5 OR 6·AXLE 7 OR
4·T!RE 6·T!RE U/0 U!TH U/0 U!TH Y/0 U/0 Y/0 Y!TH LESS MORE DECAL DECAL DECAL DECAL DECAL DECAL DECAL DECAL AXLES AXLES
COAL-PRODUCING COUNTIES --------------------------------------------------------------------------------------------------------------------------------------------
2 .000 .003 .927 .006 .474 .791 13.928 2.347 9.335 11.278 .501 .429 8.596 1.297 8.616 3.570 6 .000 .OD3 .927 .006 .474 . 791 13.928 2.347 9.335 11.278 .501 .429 8.596 1.297 8.616 3.570 7 .000 .OD3 .927 .006 .474 .791 13.928 2.347 9.335 11.278 .501 .429 8.596 1.297 8.616 3.570 8 .000 .003 .927 .006 .474 . 791 13.928 2.347 9.335 11.278 .501 .429 8.596 1.297 8.616 3.570 9 .000 .003 .927 .006 .474 • 791 13.928 2.347 9.335 11. 278 .501 .429 8.596 1.297 8.616 3.570
12 .000 .003 .414 .006 .424 .669 6.625 2.132 4.861 .458 .627 .439 5.007 1.361 2.308 1.169 14 .000 .003 .414 .006 .424 .669 6.625 2.132 4.861 .458 .627 .439 5.007 1.361 2.308 1.169 16 .000 .003 .414 .006 .424 .669 6.625 2.132 4.861 .458 .627 .439 5.007 1.361 2.308 1.169 17 .000 .003 .414 .006 .424 .669 6.625 2.132 4.861 .458 .627 .439 5.007 1.361 2.308 1.169
Unclassified -------------------------------------------------------------------------------------------------------------------------------
COAL-IMPACT COUNTIES --------------------------------------------------------------------------------------------------------------------------------
2 .000 .003 .437 .006 .492 .649 12.109 2.358 11.832 .830 .547 .485 5.798 1.007 2.121 8.757 f-' 6 .000 .003 .437 .006 .492 .649 12.109 2.358 11.832 .830 .547 .485 5.798 1.007 2.121 8. 757 " '-" 7 .000 .003 .437 .006 .492 .649 12.109 2.358 11.832 .830 .547 .485 5.798 1.007 2.121 8.757
8 .000 .003 .437 .006 .492 .649 12.109 2.358 11.832 .830 .547 .485 5.798 1.007 2.121 8. 757 9 .000 .003 .437 .006 .492 .649 12.109 2.358 11.832 .830 .547 .485 5.798 1.007 2. 121 8.757
12 .000 .003 .365 .006 .249 .689 6.194 2.193 9.466 .491 .497 .407 3.376 .947 1.467 .579 14 .000 .003 .365 .006 .249 .689 6.194 2.193 9.466 .491 .497 .407 3.376 .947 1.467 .579 16 .000 .003 .365 .006 .249 .689 6.194 2.193 9.466 .491 .497 .407 3.376 .947 1.467 .579 17 --- --- --- --- --- --- --- --- --- --- --- --- --- --- --- ---
Unclassified ============================================================================================================================================
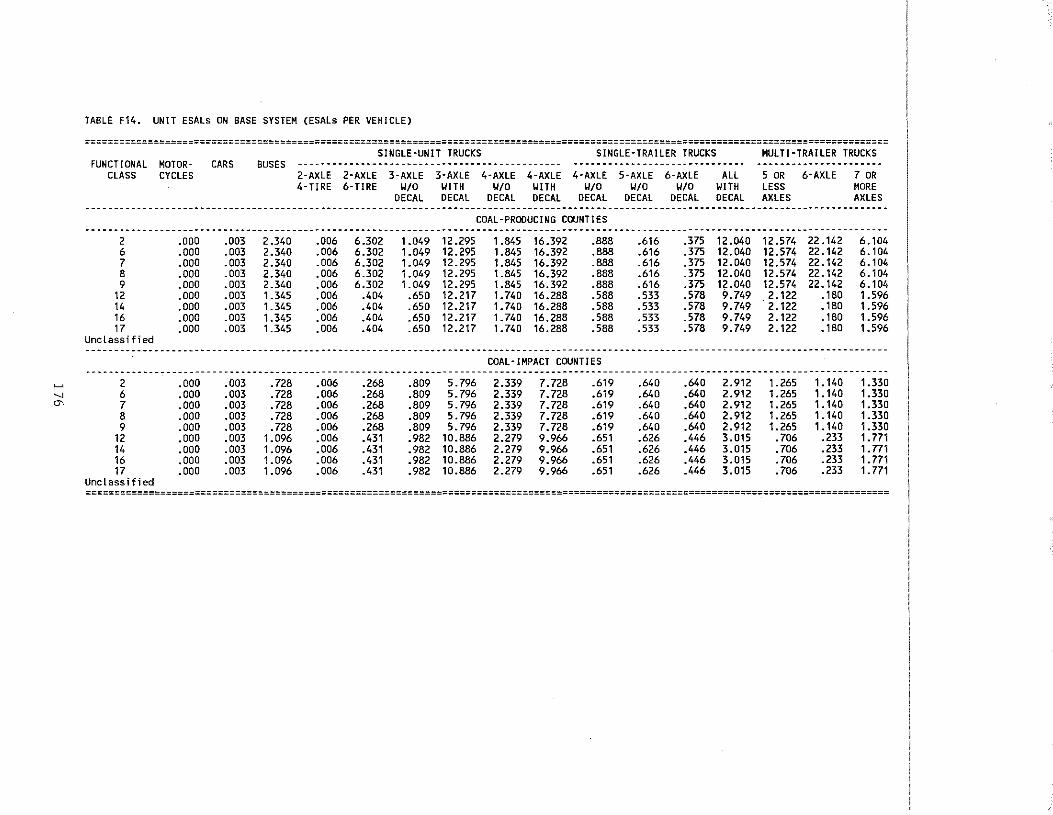
TABLE F14. UNIT ESALs ON BASE SYSTEM (ESALs PER VEHICLE)
============================================================================================================================================ SINGLE-UNIT TRUCKS SINGLE-TRAILER TRUCKS MULTI-TRAILER TRUCKS
FUNCTIONAL MOTOR- CARS BUSES ---------------------------------------------- ------------------------------ ----------------------CLASS CYCLES 2-AXLE 2-AXLE 3-AXLE 3-AXLE 4-AXLE 4-AXLE 4-AXLE 5-AXLE 6-AXLE ALL 5 OR 6-AXLE 7 OR
4-TIRE 6-TIRE W/0 WITH W/0 WITH W/0 W/0 W/0 WITH LESS MORE DECAL DECAL DECAL DECAL DECAL DECAL DECAL DECAL AXLES AXLES
--------------------------------------------------------------------------------------------------------------------------------------------COAL-PRODUCING COUNTIES
---------------------------------------------------------------------------------------------------------------------------------··········· 2 .DOD .003 2.340 .006 6.302 1.D49 12.295 1.845 16.392 .888 .616 .375 12.040 12.574 22.142 6.104 6 .DOD .D03 2.340 .OD6 6.3D2 1.049 12.295 1.845 16.392 .888 .616 .375 12.D40 12.574 22.142 6.104 7 .000 .D03 2.340 .006 6.3D2 1.049 12.295 1.845 16.392 .888 .616 .375 12.040 12.574 22.142 6.1D4 8 .000 .003 2.340 .006 6.302 1.049 12.295 1.845 16.392 .888 .616 .375 12.D4D 12.574 22.142 6.1D4 9 .DOD .003 2.340 .006 6.302 1.049 12.295 1.845 16.392 .888 .616 .375 12.040 12.574 22.142 6.1D4
12 .DOD .D03 1.345 .OD6 .404 .650 12.217 1. 740 16.288 .588 .533 .578 9.749 2.122 .180 1.596 14 .000 .003 1.345 .006 .404 .650 12.217 1. 740 16.288 .588 .533 .578 9.749 2.122 • 180 1.596 16 .DOD .003 1.345 .006 .404 .650 12.217 1. 740 16.288 .588 .533 .578 9.749 2.122 .180 1.596 17 .ODO .003 1.345 .DD6 .404 .650 12.217 1. 740 16.288 .588 .533 .578 9.749 2.122 .18D 1.596
Unclassified
COAL-IMPACT COUNTIES ·····----·------------------------·---------------------------------------------------------------------------------------------,... 2 .DDD .003 .728 .OD6 .268 .809 5. 796 2.339 7.728 .619 .64D .64D 2.912 1.265 1. 14D 1.330
___, 6 .000 .D03 .728 .OD6 .268 .809 5. 796 2.339 7.728 .619 .640 .64D 2.912 1.265 1. 14D 1.33D
"' 7 .ODD .DD3 .728 .OD6 .268 .809 5.796 2.339 7.728 .619 .640 .64D 2.912 1.265 1.140 1.33D 8 .DOD .D03 .728 .006 .268 .809 5. 796 2.339 7.728 .619 .640 .640 2.912 1.265 1.140 1.33D 9 .ODD .003 • 728 .006 .268 .809 5. 796 2.339 7.728 .619 .64D .640 2.912 1.265 1. 14D 1.33D
12 .DOD .D03 1.096 .OD6 .431 .982 1D.886 2.279 9.966 .651 .626 .446 3.D15 .7D6 .233 1.771 14 .ODD .003 1.096 .006 .431 .982 1D.886 2.279 9.966 .651 .626 .446 3.D15 .706 .233 1.771 16 .DOD .003 1.096 .DD6 .431 .982 10.886 2.279 9.966 .651 .626 .446 3.015 .7D6 .233 1.771 17 .ODD .003 1.096 .006 .431 .982 10.886 2.279 9.966 .651 .626 .446 3.D15 .706 .233 1.771
Unclassified ============================================================================================================================================
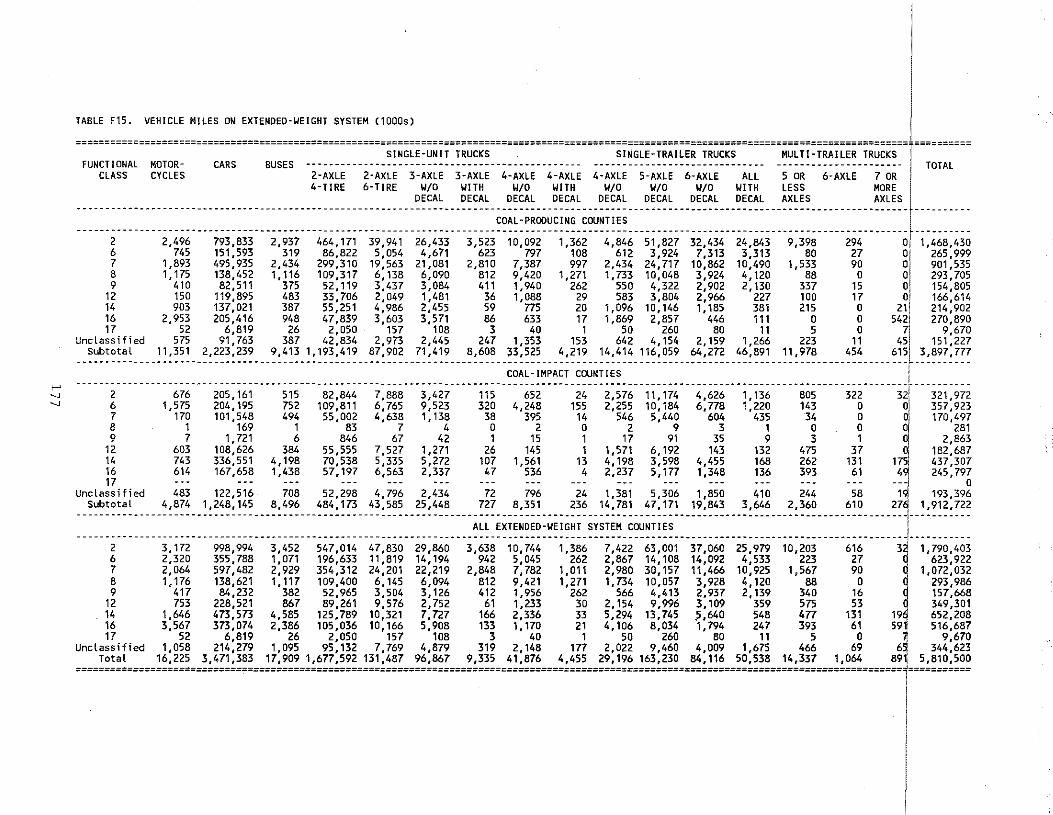
r -...J -...J
TABLE F15. VEHICLE MILES ON EXTENDED-~EIGHT SYSTEM (1000s) 1·
=================================================================================================================================================r========== SINGLE-UNIT TRUCKS SINGLE-TRAILER TRUCKS MULTI-TRAILER TRUCKS
FUNCTIONAL MOTOR- CARS BUSES ------------------------------------------------ ------------------------------ ---------------------- . TOTAL CLASS CYCLES 2-AXLE 2-AXLE 3-AXLE 3-AXLE 4-AXLE 4-AXLE 4-AXLE 5-AXLE 6-AXLE ALL 5 OR 6-AXLE 7 OR
2 2,496 6 745 7 1,893 8 1 '175 9 410
12 150 14 903 16 2,953 17 52
Unclassified 575 Subtotal 11,351
2 6 7 8 9
12 14 16 17
676 1,575
170 1 7
603 743 614
4-TIRE 6-TIRE ~/0 ~ITH Y/0 WITH W/0 ~/0 W/0 YITH LESS MORE DECAL DECAL OECAL DECAL OECAL DECAL OECAL OECAL AXLES AXLES
COAL-PRODUCING COUNTIES ------------------------------------------------------------------
793,833 2,937 464,171 39,941 26,433 3,523 10,092 1,362 4,846 51,827 32,434 24,843 9,398 294 Oj 1,468,430 151,593 319 86,822 5,054 4,671 623 797 108 612 3,924 7,313 3,313 80 27 01 265,999 495,935 2,434 299,310 19,563 21,081 2,810 7,387 997 2,434 24,717 10,862 10,490 1,533 90 0 901,535 138,452 1,116 109,317 6,138 6,090 812 9,420 1,271 1,733 10,048 3,924 4,120 88 0 0 293,705 82,511 375 52,119 3,437 3,084 411 1,940 262 550 4,322 2,902 2,130 337 15 o, 154,805
119,895 483 33,706 2,049 1,481 36 1,088 29 583 3,804 2,966 227 100 17 Oi 166,614 137,021 387 55,251 4,986 2,455 59 775 20 1,096 10,146 1,185 381 215 0 21j 214,902 205,416 948 47,839 3,603 3,571 86 633 17 1,869 2,857 446 111 0 0 5421 270,890
6,819 26 2,050 157 108 3 40 1 50 260 80 11 5 0 71 9,670 91,763 387 42,834 2,973 2,445 247 1,353 153 642 4,154 2,159 1,266 223 11 451 151,227
2,223,239 9,413 1,193,419 87,902 71,419 8,608 33,525 4,219 14,414 116,059 64,272 46,891 11,978 454 615 3,897,777 -------------------------------------------------------------------------------------------------------------------------~----------
205' 161 204,195 101,548
169 1,721
108,626 336,551 167,658
515 752 494
1 6
384 4,198 1,438
82,844 109,811 55,002
83 846
55,555 70,538 57,197
7,888 6,765 4,638
7 67
7,527 5,335 6,563
3,427 9,523 1,138
4 42
1,271 5,272 2,337
115 320
38 0 1
26 107 47
COAL-IMPACT COUNTIES
652 4,248
395 2
15 145
1,561 536
24 155
14 0 1 1
13 4
2,576 2,255
546 2
17 1,571 4,198 2,237
11,174 10,184 5,440
9 91
6,192 3,598 5,177
4,626 6,778
604 3
35 143
4,455 1,348
1,136 1,220
435 1 9
132 168 136
805 143 34
0 3
475 262 393
----------~----------322 321 321 '972
0 ! 357,923 0 0 170,497 0 0 281 1 2,863
37 182,687 131 1751 437,307
61 4~ 245,797 ---, 0
Unclassified 483 122,516 708 52,298 4,796 2,434 484,173 43,585 25,448
72 796 727 8,351
24 1,381 5,306 1,850 236 14,781 47,171 19,843
410 244 58 610
11i 193,396 27~ 1,912,722 Subtotal 4,874 1,248,145 8,496 3,646 2,360
-------------------------------------------------------------------------------------------------------------------------------------------------!-----------All EXTENDEO-~EIGHT SYSTEM COUNTIES 1
----------------------~-----------2 3,172 998,994 3,452 547,014 47,830 29,860 3,638 10,744 1,386 7,422 63,001 37,060 25,979 10,203 616 3~ 1,790,403 6 2,320 355,788 1,071 196,633 11,819 14,194 942 5,045 262 2,867 14,108 14,092 4,533 223 27 623,922 7 2,064 597,482 2,929 354,312 24,201 22,219 2,848 7,782 1,011 2,980 30,157 11,466 10,925 1,567 90 1,072,032 8 1,176 138,621 1,117 109,400 6,145 6,094 812 9,421 1,271 1,734 10,057 3,928 4,120 88 0 q 293,986 9 417 84,232 382 52,965 3,504 3,126 412 1,956 262 566 4,413 2,937 2,139 340 16 Q 157,668
12 753 228,521 867 89,261 9,576 2,752 61 1,233 30 2,154 9,996 3,109 359 575 53 q 349,301 14 1,646 473,573 4,585 125,789 10,321 7,727 166 2,336 33 5,294 13,745 ?,640 548 477 131 19~ 652,208 16 3,567 373,074 2,386 105,036 10,166 5,908 133 1,170 21 4,106 8,034 1,794 247 393 61 591 516,687 17 52 6,819 26 2,050 157 108 3 40 1 50 260 80 11 5 0 t 9,670
Unclassified 1,058 214,279 1,095 95,132 7,769 4,879 319 2,148 177 2,022 9,460 4,009 1,675 466 69 65 344,623 Total 16,225 3,471,383 17,909 1,677,592 131,487 96,867 9,335 41,876 4,455 29,196 163,230 84,116 50,538 14,337 1,064 89j 5,810,500
================================================================================================================================================~===========
I
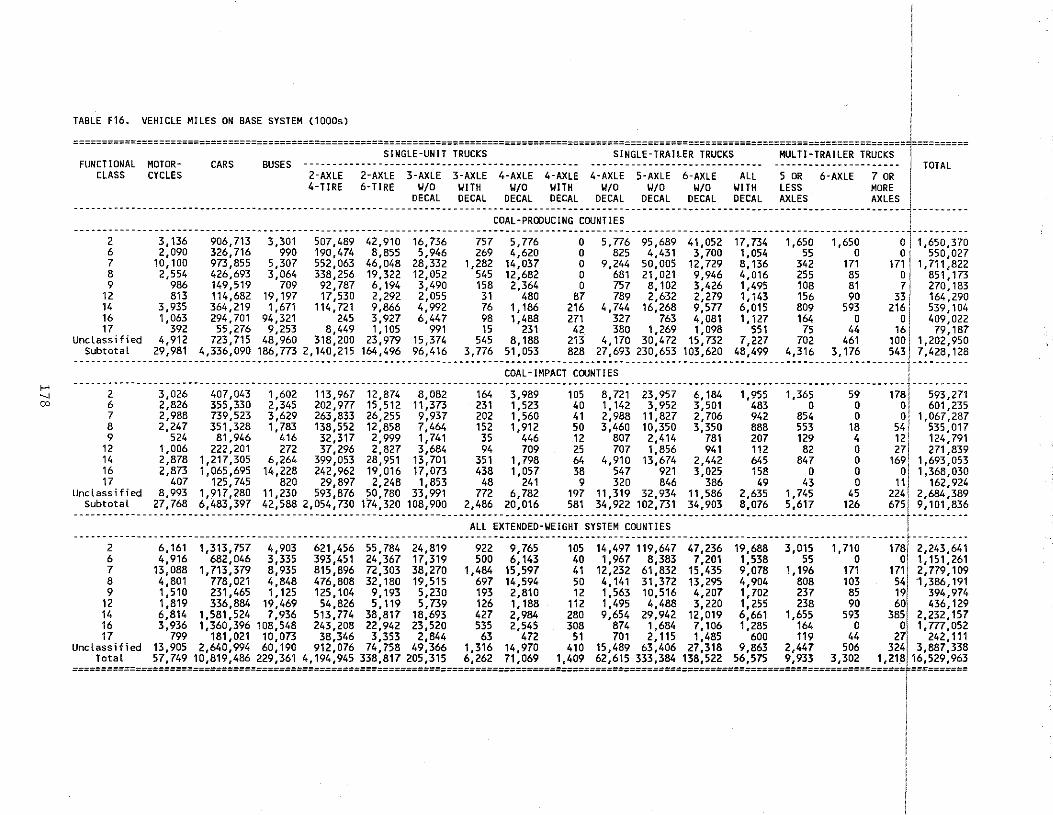
1-' '-J
""
TABLE F16. VEHICLE MILES ON BASE SYSTEM (1000s) i
=================================================================================================================================================~==========
FUNCTIONAL MOTOR- CARS BUSES --------------~~~~===~~~:_:~~~~~---------------- ----~~~~===:~~~==~-:~~~~~----- -~~=:~::~~~==~-:~~~~~- I TOTAL CLASS CYCLES 2-AXLE 2-AXLE 3-AXLE 3-AXLE 4-AXLE 4-AXLE 4-AXLE 5-AXLE 6-AXLE ALL 5 OR 6-AXLE 7 OR I
4-TIRE 6-TIRE ~/0 ~ITH ~/0 ~ITH ~/0 ~10 W/0 WITH LESS MORE , DECAL DECAL DECAL DECAL DECAL DECAL DECAL DECAL AXLES AXLES I
-------------------------------------------------------------------------------------------------------------------------------------------------j----------COAL-PROOUCING COUNTIES ,
-------------------------------------------------------------------------------------------------------------------------------------------------l'----------2 3,136 906,713 3,301 507,489 42,910 16,736 757 5,776 0 5,776 95,689 41,052 17,734 1,650 1,650 0 1,650,370 6 2,090 326,716 990 190,474 8,855 5,946 269 4,620 0 825 4,431 3,700 1,054 55 0 01 550,027 7 10,100 973,855 5,307 552,063 46,048 28,332 1,282 14,037 0 9,244 50,005 12,729 8,136 342 171 171 I 1,711,822 8 2,554 426,693 3,064 338,256 19,322 12,052 545 12,682 o 681 21,021 9,946 4,016 255 85 ol
1 851,173
9 986 149,519 709 92,787 6,194 3,490 158 2,364 0 757 8,102 3,426 1,495 108 81 7, 270,183 12 813 114,682 19,197 17,530 2,292 2,055 31 480 87 789 2,632 2,279 1,143 156 90 33' 164,290 14 3,935 364,219 1,671 114,721 9,866 4,992 76 1,186 216 4,744 16,268 9,577 6,015 809 593 21611 539,104 16 1,063 294,701 94,321 245 3,927 6,447 98 1,488 271 327 763 4,081 1,127 164 0 0 409,022 17 392 55,276 9,253 8,449 1,105 991 15 231 42 380 1,269 1,098 551 75 44 161 79,187
Unclassified 4,912 723,715 48,960 318,200 23,979 15,374 545 8,188 213 4,170 30,472 15,732 7,227 702 461 1001 1,202,950 Subtotal 29,981 4,336,090 186,773 2,140,215 164,496 96,416 3,776 51,053 828 27,693 230,653 103,620 48,499 4,316 3,176 5431 7,428,128
:::::::::::::::::::::::::::::::::::::::::::::::::::::::::::::::::::::::::::~~~~=~~~~~~:~~~~~~~::::::::::::::::::::::::::::::::::::::::::::::::::1:::::::::: 2 3,026 407,043 1,602 113,967 12,874 8,082 164 3,989 105 8,721 23,957 6,184 1,955 1,365 59 1781 593,271 6 2,826 355,330 2,345 202,977 15,512 11,373 231 1,523 40 1,142 3,952 3,501 483 o o ol 601,235 7 2,988 739,523 3,629 263,833 26,255 9,937 202 1,560 41 2,988 11,827 2,706 942 854 0 Ol 1,067,287 8 2,247 351,328 1,783 138,552 12,858 7,464 152 1,912 50 3,460 10,350 3,350 888 553 18 541 535,017 9 524 81,946 416 32,317 2,999 1,741 35 446 12 807 2,414 781 207 129 4 121 124,791
12 1,006 222,201 272 37,296 2,827 3,684 94 709 25 707 1,856 941 112 82 0 271 271,839 14 2,878 1,217,305 6,264 399,053 28,951 13,701 351 1,798 64 4,910 13,674 2,442 645 847 0 1691 1,693,053 16 2,873 1,065,695 14,228 242,962 19,016 17,073 438 1,057 38 547 921 3,025 158 0 0 Ol 1,368,030 17 407 125,745 820 29,897 2,248 1,853 48 241 9 320 846 386 49 43 0 111 162,924
Unclassified 8,993 1,917,280 11,230 593,876 50,780 33,991 772 6,782 197 11,319 32,934 11,586 2,635 1,745 45 2241 2,684,389 Subtotal 27,768 6,483,397 42,588 2,054,730 174,320 108,900 2,486 20,016 581 34,922 102,731 34,903 8,076 5,617 126 675[ 9,101,836 -------------------------------------------------------------------~~~-~~;~~~~~=~~;~~;-~;~;~~-~~~;;~~-----------------------------------------1 ----------
______ 2 ________ 6;;6;-·;:;;;;?57 ___ 4:9o3 ___ 62i;456--55;784--24;8i9 _____ 922 ___ 9;765-----;o5--i4;497-ii9:647--47;236--i9;688 ___ 3:oi5---;:?;o·----;78/-2:243;64i 6 4,916 682,046 3,335 393,451 24,367 17,319 500 6,143 40 1,967 8,383 7,201 1,538 55 0 0' 1,151,261 7 13,088 1,713,379 8,935 815,896 72,303 38,270 1,484 15,597 41 12,232 61,832 15,435 9,078 1,196 171 171'1 2,779,109 8 4,801 778,021 4,848 476,808 32,180 19,515 697 14,594 50 4,141 31,372 13,295 4,904 808 103 54 ·1,386,191 9 1,510 231,465 1,125 125,104 9,193 5,230 193 2,810 12 1,563 10,516 4,207 1,702 237 85 19' 394,974
12 1,819 336,884 19,469 54,826 5,119 5,739 126 1,188 112 1,495 4,488 3,220 1,255 238 90 60 436,129 14 6,814 1,581,524 7,936 513,774 38,817 18,693 427 2,984 280 9,654 29,942 12,019 6,661 1,655 593 385 2,232,157 16 3,936 1,360,396 108,548 243,208 22,942 23,520 535 2,545 308 874 1,684 7,106 1,285 164 0 0 1,777,052 17 799 181,021 10,073 38,346 3,353 2,844 63 472 51 701 2,115 1,485 600 119 44 27 242,111
Unclassified 13,905 2,640,994 60,190 912,076 74,758 49,366 1,316 14,970 410 15,489 63,406 27,318 9,863 2,447 506 324l 3,887,338 Total 57,749 10,819,486 229,361 4,194,945 338,817 205,315 6,262 71,069 1,409 62,615 333,384 138,522 56,575 9,933 3,302 1,218 16,529,963
=================================================================================================================================================r==========
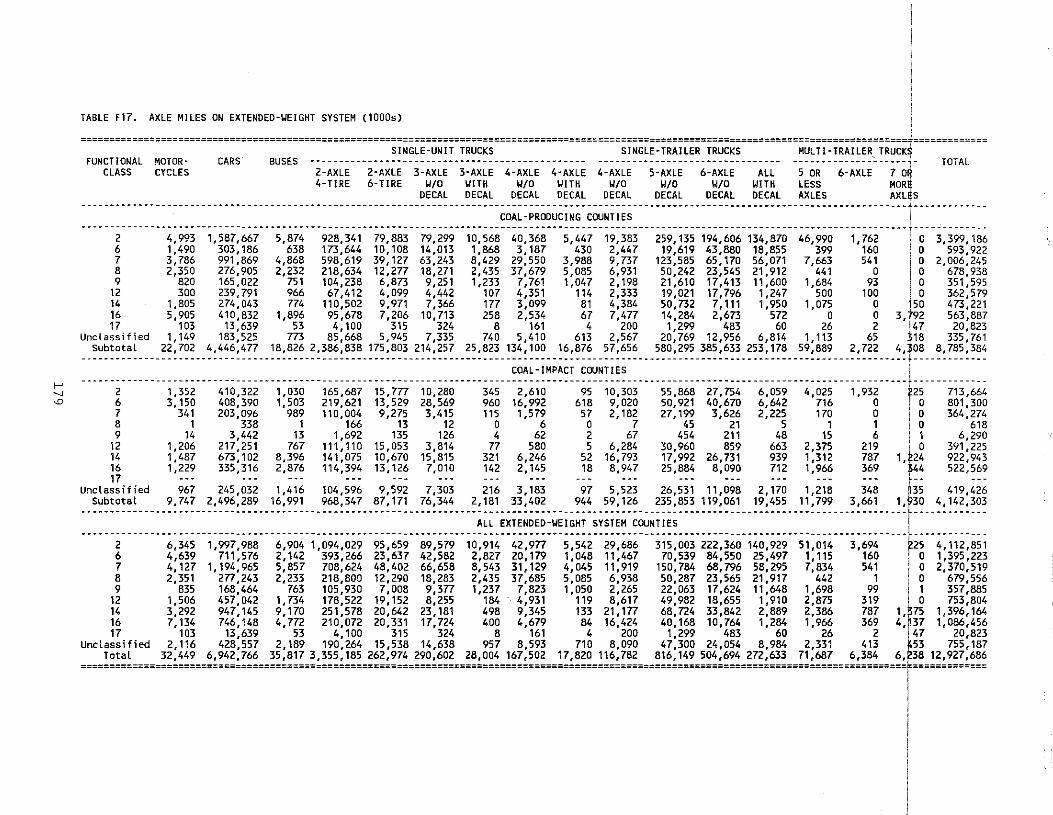
'-' " '"'
:::~:=:::~==::~:=::~::=::=:::::::::~:::::=::::::=::::::~========================================================================================~1============= SINGLE-UNIT TRUCKS SINGLE-TRAILER TRUCKS MULTI-TRAILER TRUCK FUNCTIONAL MOTOR- CARS BUSES ------------------------------------------------ -------------------------------- --------------~----- - TOTAL
CLASS CYCLES 2-AXLE 2-AXLE 3-AXLE 3-AXLE 4-AXLE 4-AXLE 4-AXLE 5-AXLE 6-AXLE ALL 5 OR 6-AXLE 7 0 4-TJRE 6-TIRE Y/0 WITH W/0 WITH W/0 W/0 W/0 WITH LESS MORE
DECAL DECAL DECAL DECAl DECAL DECAL DECAL DECAL AXLES AXLes -------------------------------------------------------------------------------------------------------------------------- 1 ____________ _
COAL-PRODUCING COUNTIES l ______ 2 ________ 4;99;--;;587;667---;;874 ___ 928;34i--79;883--79;299--io;568--4o;368---;;447--;;;;8;---259;;;;-;;4:6o6-i34;87o--46;99o---;;?62 _____ ~-o--;;;99;i86
6 1,490 303,186 638 173,644 10,108 14,013 1,868 3,187 430 2,447 19,619 43,880 18,855 399 160 I o 593,922 7 3,786 991,869 4,868 598,619 39,127 63,243 8,429 29,550 3,988 9,737 123,585 65,170 56,071 7,663 541 0 2,006,245 8 2,350 276,905 2,232 218,634 12,277 18,271 2,435 37,679 5,085 6,931 50,242 23,545 21,912 441 0 0 678,938 9 820 165,022 751 104,238 6,873 9,251 1,233 7,761 1,047 2,198 21,610 17,413 11,600 1,684 93 0 351,595
12 300 239,791 966 67,412 4,099 4,442 107 4,351 114 2,333 19,021 17,796 1,247 500 100 0 362,579 14 1,805 274,043 774 110,502 9,971 7,366 177 3,099 81 4,384 50,732 7,111 1,950 1,075 0 so 473,221 16 5,905 410,832 1,896 95,678 7,206 10,713 258 2,534 67 7,477 14,284 2,673 572 0 0 3,792 563,887 17 103 13,639 53 4,100 315 324 8 161 4 200 1,299 483 60 26 2 147 20,823
Unclassified 1,149 183,525 773 85,668 5,945 7,335 740 5,410 613 2,567 20,769 12,956 6,814 1,113 65 ~18 335,761 Subtotal 22,702 4,446,477 18,826 2,386,838 175,803 214,257 25,823 134,100 16,876 57,656 580,295 385,633 253,178 59,889 2,722 4,308 8,785,384
----------------------------------------------------------------------------------------------------------------------~--~~---------------------~-----------~-COAL- IMPACT COUNTIES I
------------------------------------------------------------------------------------------------------------------------------------------------t-------------2 1,352 410,322 1,030 165,687 15,777 10,280 345 2,610 95 10,303 55,868 27,754 6,059 4,025 1,932 ?25 713,664 6 3,150 408,390 1,503 219,621 13,529 28,569 960 16,992 618 9,020 50,921 40,670 6,642 716 0 ! 0 801,300 7 341 zo3,o96 989 11o,oo4 9,275 3,415 11s 1,579 s7 2,182 27,199 3,626 2,22s 110 o 1 o 364,274 8 1 338 1 166 13 12 o 6 o 1 45 21 5 1 1 1 o 618 9 14 3,442 13 1,692 135 126 4 62 2 67 454 211 48 15 6 I 1 6,290
12 1,206 217,251 767 111,110 15,053 3,814 77 580 5 6,284 30,960 859 663 2,375 219 ! 0 391,225 14 1,487 673,102 8,396 141,075 10,670 15,815 321 6,246 52 16,793 17,992 26,731 939 1,312 787 1,?24 922,943 16 1,229 335,316 2,876 114,394 13,126 7,010 142 2,145 18 8,947 25,884 8,090 712 1,966 369 344 522,569 17 --- --- --- --- --- --- --- --- --- --- --- --- --- --- --- ~-- ---
Unclassified 967 245,032 1,416 104,596 9,592 7,303 216 3,183 97 5,523 26,531 11,098 2,170 1,218 348 ,35 419,426 Subtotal 9,747 2,496,289 16,991 968,347 87,171 76,344 2,181 33,402 944 59,126 235,853 119,061 19,455 11,799 3,661 1,f30 4,142,303
------------------------------------------------------------------------------------------------------------------------------------------------~-------------ALL EXTENDED-WEIGHT SYSTEM COUNTIES I
------------------------------------------------------------------------------------------------------------------------------------------------r-------------2 6,345 1,997,988 6,904 1,094,029 95,659 89,579 10,914 42,977 5,542 29,686 315,003 222,360 140,929 51,014 3,694 ~25 4,112,851 6 4,639 711,576 2,142 393,266 23,637 42,582 2,827 20,179 1,048 11,467 70,539 84,550 25,497 1,115 160 ! 0 1,395,223 7 4,127 1,194,965 5,857 708,624 48,402 66,658 8,543 31,129 4,045 11,919 150,784 68,796 58,295 7,834 541 ! 0 2,370,519 8 2,351 277,243 2,233 218,800 12,290 18,283 2,435 37,685 5,085 6,938 50,287 23,565 21,917 442 1 1 o 679,556 9 835 168,464 763 105,930 7,008 9,377 1,237 7,823 1,050 2,265 22,063 17,624 11,648 1,698 99 I 1 357,885
12 1,506 457,042 1,734 178,522 19,152 8,255 184 4,931 119 8,617 49,982 18,655 1,910 2,875 319 ! 0 753,804 14 3,292 947,145 9,170 251,578 20,642 23,181 498 9,345 133 21,177 68,724 33,842 2,889 2,386 787 1,~75 1,396,164 16 7,134 746,148 4,772 210,072 20,331 17,724 400 4,679 84 16,424 40,168 10,764 1,284 1,966 369 4,~37 1,086,456 17 103 13,639 53 4,100 315 324 8 161 4 200 1,299 483 60 26 2 147 20,823
Unclassified 2,116 428,557 2,189 190,264 15,538 14,638 957 8,593 710 8,090 47,300 24,054 8,984 2,331 413 ~53 755,187 Total 32,449 6,942,766 35,817 3,355,185 262,974 290,602 28,004 167,502 17,820 116,782 816,149 504,694 272,633 71,687 6,384 6,238 12,927,686
================================================================================================================================================r=============
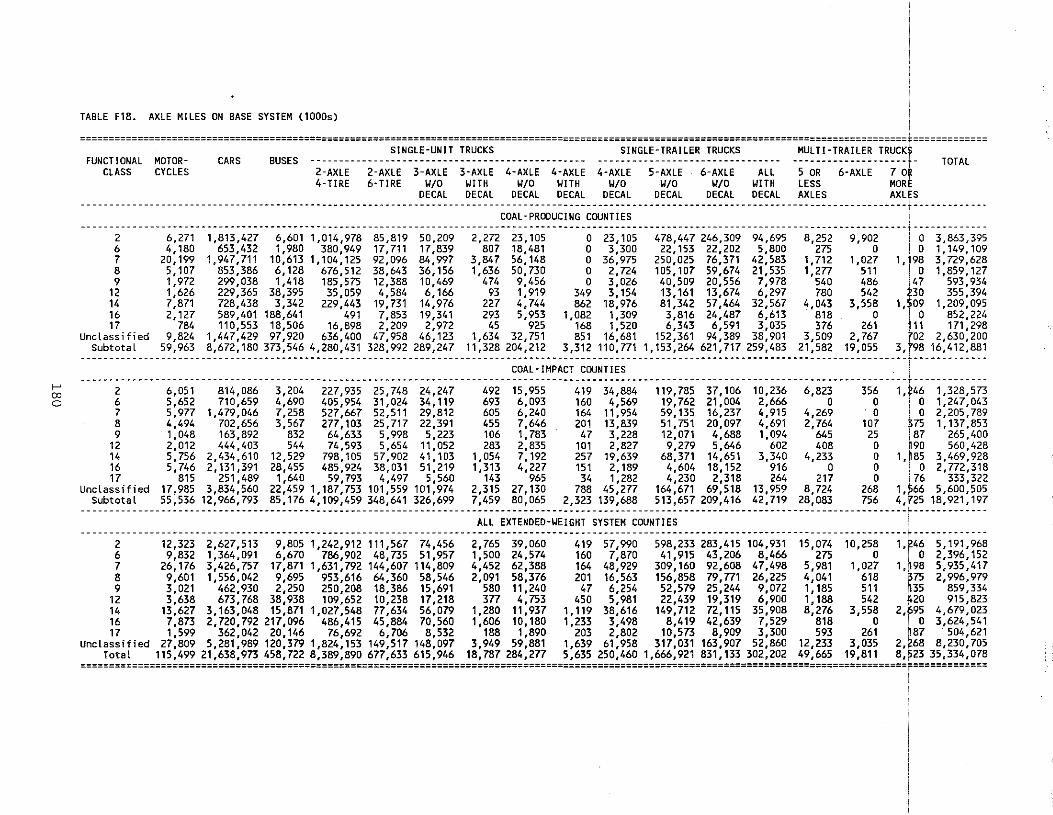
I TABLE F18. AXLE MILES ON BASE SYSTEM (1000s) I ================================================================================================================================================+=============
FUNCTIONAl MOTORClASS CYCLES
CARS SINGLE-UNIT TRUCKS SINGLE-TRAILER TRUCKS MULTI-TRAILER TRUCKf
BUSES ·2:~~~~--·2:~~~~·-;:~~~~--;:~~~~--4:~~~~--4:~~~~ 4:~~~~---5:;~~~--·6:;~~~----;~~- -5-~~---6:;~~~---l-~~- TOTAl
DECAl DECAl DECAl DECAl DECAl DECAL DECAl DECAl AXLES AXl S 4-TIRE 6·TIRE Y/0 YITH Y/0 YITH Y/0 Y/0 Y/0 YITH lESS MOR'
------------------------------------------------------------------------------------------------------------------------------------------------ -------------COAl-PRODUCING COUNTIES I
---------·---·-··········------------------------------------------------···--·-····--··----------------------------------------·-·········--·-·t··-----· 2 6,271 1,813,427 6,6D1 1,014,978 85,819 50,209 2,272 23,105 0 23,105 478,447 246,309 94,695 8,252 9,902 0 3,863,395 6 4,180 653,432 1,980 380,949 17,711 17,839 807 18,481 0 3,300 22,153 22,202 5,800 275 0 0 1,149,109 7 20,199 1,947,711 10,613 1,104,125 92,096 84,997 3,847 56,148 0 36,975 250,025 76,371 42,583 1,712 1,027 1, 98 3,729,628 8 5,107 853,386 6,128 676,512 38,643 36,156 1,636 50,730 0 2,724 105,107 59,674 21,535 1,277 511 0 1,859,127 9 1,972 299,038 1,418 185,575 12,388 10,469 474 9,456 0 3,026 40,509 20,556 7,978 540 486 47 593,934
12 1,626 229,365 38,395 35,059 4,584 6,166 93 1,919 349 3,154 13,161 13,674 6,297 780 542 ?30 355,394 14 7,871 728,438 3,342 229,443 19,731 14,976 227 4,744 862 18,976 81,342 57,464 32,567 4,043 3,558 1,$09 1,209,095 16 2,127 589,401 188,641 491 7,853 19,341 293 5,953 1,082 1,309 3,816 24,487 6,613 818 0 II 0 852,224 17 784 110,553 18,506 16,898 2,209 2,972 45 925 168 1,520 6,343 6,591 3,035 376 261 11 171,298
Unclassified 9,824 1,447,429 97,920 636,400 47,958 46,123 1,634 32,751 851 16,681 152,361 94,389 38,901 3,509 2,767 f02 2,630,200 Subtotal 59,963 8,672,180 373,546 4,280,431 328,992 289,247 11,328 204,212 3,312 110,771 1,153,264 621,717 259,483 21,582 19,055 3, 98 16,412,881
------------------------------------------------------------------------------------------------------------------------------------------------~-------------COAl-IMPACT COUNTIES I
--·---------------------------------------------------------------------------------------------------------------------------------------------f·------------6; 2 6,051 814,086 3,204 227,935 25,748 24,247 492 15,955 419 34,884 119,785 37,106 10,236 6,823 356 1, 46 1,328,573 C) 6 5,652 710,659 4,690 405,954 31,024 34,119 693 6,093 160 4,569 19,762 21,004 2,666 0 0 1 0 1,247,043
7 5,977 1,479,046 7,258 527,667 52,511 29,812 605 6,240 164 11,954 59,135 16,237 4,915 4,269 · o I o 2,205,789 8 4,494 702,656 3,567 277,103 25,717 22,391 455 7,646 201 13,839 51,751 20,097 4,691 2,764 107 375 1,137,853 9 1,048 163,892 832 64,633 5,998 5,223 106 1,783 47 3,228 12,071 4,688 1,094 645 25 187 265,400
12 2,012 444,403 544 74,593 5,654 11,052 283 2,835 101 2,827 9,279 5,646 602 408 0 ~90 560,428 14 5,756 2,434,610 12,529 798,105 57,902 41,103 1,054 7,192 257 19,639 68,371 14,651 3,34o 4,233 o 1,r85 3,469,928 16 5,746 2,131,391 28,455 485,924 38,031 51,219 1,313 4,227 151 2,189 4,604 18,152 916 0 0 ' 0 2,772,318 17 815 251,489 1,640 59,793 4,497 5,560 143 965 34 1,282 4,230 2,318 264 217 0 176 333,322
Unclassified 17,985 3,834,560 22,459 1,187,753 101,559 101,974 2,315 27,130 788 45,277 164,671 69,518 13,959 8,724 268 1,~66 5,600,505 Subtotal 55,536 12,966,793 85,176 4,109,459 348,641 326,699 7,459 80,065 2,323 139,688 513,657 209,416 42,719 28,083 756 4,f25 18,921,197
------------------------------------------------------------------------------------------------------------------------------------------------~-------------All EXTENDED·YEIGHT SYSTEM COUNTIES 1
------------------------------------------------------------------------------------------------------------------------------------------------r-------------2 12,323 2,627,513 9,805 1,242,912 111,567 74,456 2,765 39,060 419 57,990 598,233 283,415 104,931 15,074 10,258 1,t46 5,191,968 6 9,832 1,364,091 6,670 786,902 48,735 51,957 1,500 24,574 160 7,870 41,915 43,206 8,466 275 0 0 2,396,152 7 26,176 3,426,757 17,871 1,631,792 144,607 114,809 4,452 62,388 164 48,929 309,160 92,608 47,498 5,981 1,027 1, 98 5,935,417 8 9,601 1,556,042 9,695 953,616 64,360 58,546 2,091 58,376 201 16,563 156,858 79,771 26,225 4,041 618 ~75 2,996,979 9 3,021 462,930 2,250 250,208 18,386 15,691 580 11,240 47 6,254 52,579 25,244 9,072 1,185 511 f35 859,334
12 3,638 673,768 38,938 109,652 10,238 17,218 377 4,753 450 5,981 22,439 19,319 6,900 1,188 542 20 915,823 14 13,627 3,163,048 15,871 1,027,548 77,634 56,079 1,280 11,937 1,119 38,616 149,712 72,115 35,908 8,276 3,558 2, 95 4,679,023 16 7,873 2,720,792 217,096 486,415 45,884 70,560 1,606 10,180 1,233 3,498 8,419 42,639 7,529 818 0 0 3,624,541 17 1,599 362,042 20,146 76,692 6,706 8,532 188 1,890 203 2,802 10,573 8,909 3,300 593 261 t87 504,621
Unclassified 27,809 5,281,989 120,379 1,824,153 149,517 148,097 3,949 59,881 1,639 61,958 317,031 163,907 52,860 12,233 3,035 2, 68 8,230,705 Total 115,499 21,638,973 458,722 8,389,890 677,633 615,946 18,787 284,277 5,635 250,460 1,666,921 831,133 302,202 49,665 19,811 8, 23 35,334,078
;:;:::::::;;;:;::;:;:========================;=======;=========================;=====================================================;=======;==?=============
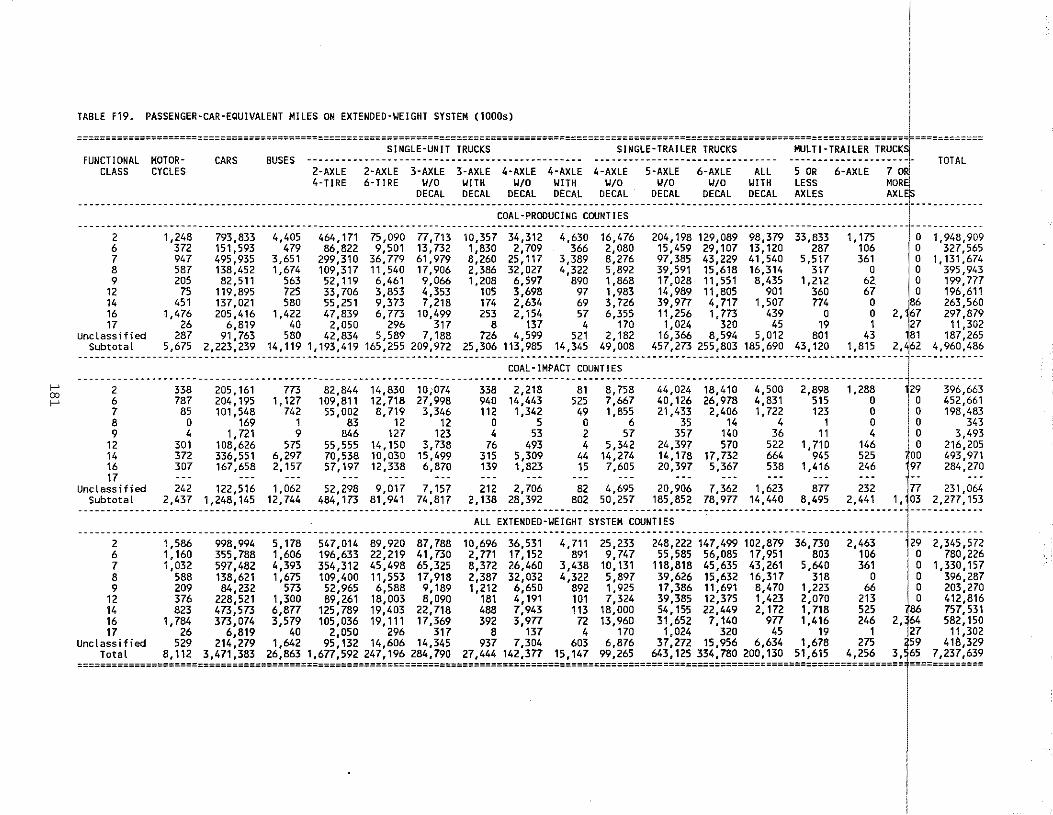
r
"" r
TABLE F19. PASSENGER-CAR-EQUIVALENT MILES ON EXTENOEO-~EIGHT SYSTEM (1000s)
================================================================================================================================================~============ SINGLE-UNIT TRUCKS SINGLE-TRAILER TRUCKS MULTI-TRAILER TRUCK
FUNCTIONAL MOTOR· CARS BUSES ------------------------------------------------ -------------------------------- ---------------------~ TOTAL CLASS CYCLES 2-AXLE 2-AXLE 3-AXLE 3-AXLE 4-AXLE 4-AXLE 4-AXLE 5-AXLE 6-AXLE All 5 OR 6-AXLE 7 0!
4-TIRE 6-TIRE ~/0 ~ITH ~/0 WITH W/0 W/0 W/0 WITH LESS MOR DECAL DECAL DECAL DECAL DECAL DECAL DECAL DECAL AXLES AXL~S
--------------------------------------------------------------------------------------------------------------------------------------------------------------COAL-PRODUCING COUNTIES
------------------------------------------------------------------------------------------------------------------------------------------------- -------------2 1,248 793,833 4,405 464,171 75,090 77,713 10,357 34,312 4,630 16,476 204,198 129,089 98,379 33,833 1' 175 0 1,948,909 6 372 151,593 479 86,822 9,501 13,732 1,830 2,709 366 2,080 15,459 29,107 13,120 287 106 0 327,565 7 947 495,935 3,651 299,310 36,779 61 '979 8,260 25,117 3,389 8,276 97,385 43,229 41,540 5,517 361 0 1' 131,674 8 587 138,452 1,674 109,317 11,540 17,9D6 2,386 32,027 4,322 5,892 39,591 15,618 16,314 317 0 0 395 '943 9 205 82,511 563 52,119 6,461 9,066 1,208 6,597 890 1,868 17,028 11,551 8,435 1,212 62 0 199,777
12 75 119,895 725 33,706 3,853 4,353 105 3,698 97 1,983 14,989 11,805 901 360 67 0 196,611 14 451 137,021 580 55,251 9,373 7,218 174 2,634 69 3,726 39,977 4,717 1,507 774 0 86 263,560 16 1,476 205,416 1,422 47,839 6,773 10,499 253 2,154 57 6,355 11,256 1,m 439 0 0 2,1 67 297,879 17 26 6,819 40 2,050 296 317 8 137 4 170 1,024 320 45 19 1 27 11,302
Uncl ass 1f i ed 287 91,763 580 42,834 5,589 7,188 726 4,599 521 2,182 16,366 8,594 5,012 801 43 181 187,265 Subtotal 5,675 2,223,239 14,119 1,193,419 165,255 209,972 25,306 113,985 14,345 49,008 457,273 255,803 185,690 43,120 1,815 2, 62 4,960,486
------------------------------------------------------------------------------------------------------------------------------------------------ -------------COAL-IMPACT COUNTIES
------------------------------------------------------------------------------------------------------------------------------------------------~-------------2 338 205,161 773 82,844 14,830 10,074 338 2,218 81 8,758 44,024 18,410 4,500 2,898 1,288 129 396,663 6 787 204,195 1,127 109,811 12,718 27,998 940 14,443 525 7,667 40,126 26,978 4,831 515 o 1 0 452,661 7 85 101,548 742 55,oo2 8,719 3,346 112 1,342 49 1,855 21,433 2,406 1,722 123 o •
1
o 198,483 8 0 169 1 83 12 12 0 5 0 6 35 14 4 1 0 0 343 9 4 1,721 9 846 127 123 4 53 2 57 357 14o 36 11 4 I o 3,493
12 301 108,626 575 55,555 14,150 3,738 76 493 4 5,342 24,397 570 522 1,110 146 1 o 216,2D5 14 372 336,551 6,297 70,538 10,03D 15,499 315 5,309 44 14,274 14,178 17,732 664 945 525 ljOO 493,971 16 3D7 167,658 2,157 57,197 12,338 6,870 139 1,823 15 7,605 20,397 5,367 538 1,416 246 97 284,270 17 --- ... --- ... --- --- ... --- ... ... --- --- ... --- ... -- ...
Unclassified 242 122,516 1,062 52,298 9,017 7,157 212 2,706 82 4,695 20,906 7,362 1,623 877 232 j77 231,064 Subtotal 2,437 1,248,145 12,744 484,173 81,941 74,817 2,138 28,392 802 50,257 185,852 78,977 14,440 8,495 2,441 1, 03 2,277,153
---------------------------------------------------------------------~~~-~;;~~~~~=~~;~;;-~;~;~~-~~~;;~~-----,------------------------··········1·············
------------------------------------------------------------------------------------------------------------------------------------------------ -------------2 1,586 998,994 5,178 547,014 89,920 87,788 10,696 36,531 4,711 25,233 248,222 147,499 102,879 36,730 2,463 29 2,345,572 6 1,160 355,788 1,606 196,633 22,219 41,730 2,771 17,152 891 9,747 55,585 56,085 17,951 803 106 0 780,226 7 1,032 597,482 4,393 354,312 45,498 65,325 8,372 26,460 3,438 10,131 118,818 45,635 43,261 5,640 361 1 o 1,330,157 8 588 138,621 1,675 109,400 11.553 17.918 2,387 32.032 4,322 5,897 39,626 15,632 16,317 318 0 I 0 396,287 9 209 84,232 573 52,965 6,588 9,189 1,212 6,650 892 1,925 17,386 11,691 8,470 1,223 66 0 203,270
12 376 228,521 1,300 89,261 18,003 8,090 181 4,191 101 7,324 39,385 12,375 1,423 2,070 213 0 412,816 14 823 473,573 6,877 125,789 19,403 22,718 488 7,943 113 18,000 54,155 22,449 2,172 1,718 525 86 757,531 16 1,784 373,074 3,579 105,036 19,111 17,369 392 3,977 72 13,960 31,652 7,140 977 1,416 246 2, 64 582,150 17 26 6,819 40 2,050 296 317 8 137 4 170 1,024 320 45 19 1 27 11,3D2
Unclassified 529 214,279 1,642 95,132 14,606 14,345 937 7,304 603 6,876 37,272 15,956 6,634 1,678 275 259 418,329 Total 8,112 3,471,383 26,863 1,677,592 247,196 284,790 27,444 142,377 15,147 99,265 643,125 334,780 200,130 51,615 4,256 3,l65 7,237,639
================================================================================================================================================~=============
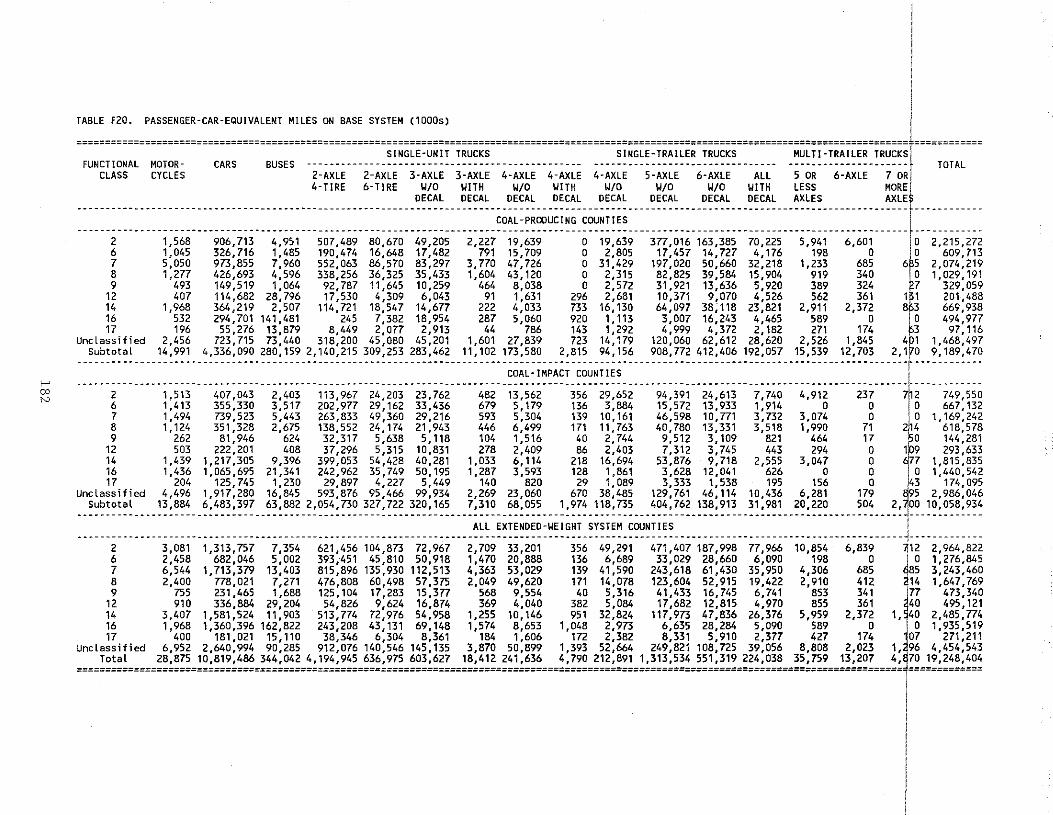
1-' 00 N
I TABLE F20. PASSENGER·CAR·EOUIVALENT MILES ON BASE SYSTEM (1000s) /
=================================================================================================================================================t============ SINGLE-UNIT TRUCKS SINGLE-TRAILER TRUCKS MULTI-TRAILER TRUCKS
FUN~~l~~AL ~$~~~~ CARS BUSES ·z:;;~~--·z:;;~~--3:;;~~-·3:;;~~-·4:;;~~-·4:;;~E 4:;;~~--·;:;;~~---6:;;~~-···;~~- ·;·~~--·6:;;~E·--7-~~~ TOTAL 4·TIRE 6·TIRE Y/0 WITH W/0 WITH W/0 W/0 W/0 WITH LESS MOREl
·-·----·-··············--·---------------------------------~~~~~---~~~~~---~~~~~---~~~~~---~~~~~----~~~~~----~~~~~---~~~~~---~~~~~-----------~~~~sf,------------coAL-PRoouciNG COUNTIES
------------------------------------------------------------------------------------------------------------------------------------------------- ------------2 1,568 906,713 4,951 507,489 80,670 49,205 2,227 19,639 0 19,639 377,016 163,385 70,225 5,941 6,601 0 2,215,272 6 1,045 326,716 1,485 190,474 16,648 17,482 791 15,709 0 2,805 17,457 14,727 4,176 198 0 0 609,713 7 5,050 973,855 7,960 552,063 86,570 83,297 3,770 47,726 0 31,429 197,020 50,660 32,218 1,233 685 6t5 2,074,219 8 1,277 426,693 4,596 338,256 36,325 35,433 1,604 43,120 0 2,315 82,825 39,584 15,904 919 340 0 1,029,191 9 493 149,519 1,064 92,787 11,645 10,259 464 8,038 0 2,572 31,921 13,636 5,920 389 324 7 329,059
12 407 114,682 28,796 17,530 4,309 6,043 91 1,631 296 2,681 10,371 9,070 4,526 562 361 1~1 201,488 14 1,968 364,219 2,507 114,721 18,547 14,677 222 4,033 733 16,130 64,097 38,118 23,821 2,911 2,372 8p3 669,938 16 532 294,701 141,481 245 7,382 18,954 287 5,060 920 1,113 3,007 16,243 4,465 589 0 I 0 494,977 17 196 55,276 13,879 8,449 2,077 2,913 44 786 143 1,292 4,999 4,372 2,182 271 174 b3 97,116
Unclassified 2,456 723,715 73,440 318,200 45,080 45,201 1,601 27,839 723 14,179 120,060 62,612 28,620 2,526 1,845 4P1 1,468,497 Subtotal 14,991 4,336,090 280,159 2,140,215 309,253 283,462 11,102 173,580 2,815 94,156 908,772 412,406 192,057 15,539 12,703 2,1~0 9,189,470
-------------------------------------------------------------------------------------------------------------------------------------------------f------------COAL-IMPACT COUNTIES I
-------------------------------------------------------------------------------------------------------------------------------------------------f------------2 1,513 407,043 2,403 113,967 24,203 23,762 482 13,562 356 29,652 94,391 24,613 7,740 4,912 237 In2 749,550 6 1,413 355,330 3,517 202,977 29,162 33,436 679 5,179 136 3,884 15,572 13,933 1,914 o o 1 o 667,132 7 1,494 739,523 5,443 263,833 49,360 29,216 593 5,304 139 10,161 46,598 10,771 3,732 3,074 o 1 o 1,169,242 8 1,124 351,328 2,675 138,552 24,174 21,943 446 6,499 171 11,763 40,780 13,331 3,518 1,990 71 2M4 618,578 9 262 81,946 624 32,317 5,638 5,118 104 1,516 40 2,744 9,512 3,109 821 464 17 lo 144,281
12 503 222,201 408 37,296 5,315 10,831 278 2,409 86 2,403 7,312 3,745 443 294 0 1 9 293,633 14 1,439 1,217,305 9,396 399,053 54,428 40,281 1,033 6,114 218 16,694 53,876 9,718 2,555 3,047 0 7 1,815,835 16 1,436 1,065,695 21,341 242,962 35,749 50,195 1,287 3,593 128 1,861 3,628 12,041 626 0 0 0 1,440,542 17 204 125,745 1,230 29,897 4,227 5,449 140 820 29 1,089 3,333 1,538 195 156 0 43 174,095
Unclassified 4,496 1,917,280 16,845 593,876 95,466 99,934 2,269 23,060 670 38,485 129,761 46,114 10,436 6,281 179 95 2,986,046 Subtotal 13,884 6,483,397 63,882 2,054,730 327,722 320,165 7,310 68,055 1,974 118,735 404,762 138,913 31,981 20,220 504 2,~00 10,058,934
------------------------------------------------------------------------------------------------------------------------------------------------~-------------ALL EXTENDED-~EIGHT SYSTEM COUNTIES i
------------------------------------------------------------------------------------------------------------------------------------------------1-------------2 3,081 1,313,757 7,354 621,456 104,873 72,967 2,709 33,201 356 49,291 471,407 187,998 77,966 10,854 6,839 ~12 2,964,822 6 2,458 682,046 5,002 393,451 45,810 50,918 1,470 20,888 136 6,689 33,029 28,660 6,090 198 0 ~ 0 1,276,845 7 6,544 1,713,379 13,403 815,896 135,930 112,513 4,363 53,029 139 41,590 243,618 61,430 35,950 4,306 685 85 3,243,460 8 2,400 778,021 7,271 476,808 60,498 57,375 2,049 49,620 171 14,078 123,604 52,915 19,422 2,910 412 14 1,647,769 9 755 231,465 1,688 125,104 17,283 15,377 568 9,554 40 5,316 41,433 16,745 6,741 853 341 ~77 473,340
12 910 336,884 29,204 54,826 9,624 16,874 369 4,040 382 5,084 17,682 12,815 4,970 855 361 40 495,121 14 3,407 1,581,524 11,903 513,774 72,976 54,958 1,255 10,146 951 32,824 117,973 47,836 26,376 5,959 2,372 1, 40 2,485,774 16 1,968 1,360,396 162,822 243,208 43,131 69,148 1,574 8,653 1,048 2,973 6,635 28,284 5,090 589 0 i 0 1,935,519 17 400 181,021 15,110 38,346 6,304 8,361 184 1,606 172 2,382 8,331 5,910 2,377 427 174 07 271,211
Unclassified 6,952 2,640,994 90,285 912,076 140,546 145,135 3,870 50,899 1,393 52,664 249,821 108,725 39,056 8,808 2,023 1, 96 4,454,543
::::!~!~!:::::~~~~~~:!~~~!~~~~~=~~~~~~~=~~!~~~~~~=~~~~~~~=~~~~~~~::!~~~!~:~~!~~~~===~~~~~:~!~~~~!:!~~!~~~~~=~~!~~!~:~~~~~~~==~~~~~~::!~~~~~===~~1~~:!~~~~~~~~~
I
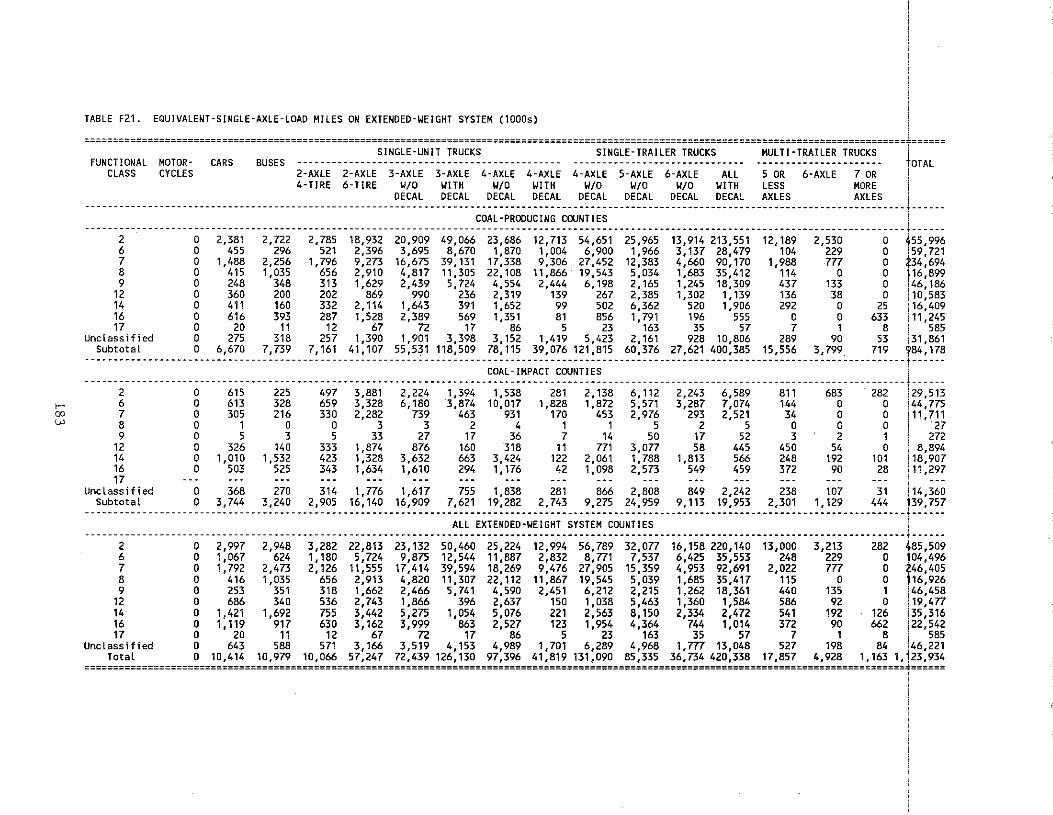
f-' 00 '-'
I TABLE F21. EQUIVALENT·SINGLE·AXLE·LOAO MILES ON EXTENOEO-~EIGHT SYSTEM (1000s) I ::::::::::::::::::::::::::::::::::::::::::::::::::::::::::====:=====:====:::=====::=::==:=============::=========::=:=========:===::==:::::::::1::::::
FUNCTIONAL MOTOR· CARS BUSES ············--=~~~===~~~:.:~~:~:.............. ----=~~~===:~~~==~-:~~:~:..... -~~=:~::~~~==~-:~~:~=- tOTAL CLASS CYCLES 2-AXLE 2-AXLE 3·AXLE 3·AXLE 4·AXLE 4·AXLE 4-AXLE 5-AXLE 6-AXLE ALL 5 OR 6·AXLE 7 OR
4-TIRE 6-TIRE W/0 ~ITH W/0 ~ITH W/0 ~/0 W/0 WITH LESS MORE I
·····················································-~=:~=---~=:~=---~=:~=---~=:~=---~=:~=---~=:~=---~=:~=---~=:~=---~~===---·······-~~=:: .... fl ..... . COAL-PRODUCING COUNTIES ----------------------------------------------------------------------------------------------------------------------------------------------- ------
2 0 2,381 2,722 2,785 18,932 20,909 49,066 23,686 12,713 54,651 25,965 13,914 213,551 12,189 2,530 0 55,996 6 0 455 296 521 2,396 3,695 8,670 1,870 1,004 6,900 1,966 3,137 28,479 104 229 0 59,721 7 0 1,488 2,256 1,796 9,273 16,675 39,131 17,338 9,306 27,452 12,383 4,660 90,170 1,988 777 0 ?34,694 8 0 415 1,035 656 2,910 4,817 11,305 22,108 11,866 19,543 5,034 1,683 35,412 114 0 0 )16,899 9 0 248 348 313 1,629 2,439 5,724 4,554 2,444 6,198 2,165 1,245 18,309 437 133 0 146,186
12 0 360 zoo 202 869 990 236 2,319 139 267 2,385 1,302 1,139 136 38 0 10,583 14 0 411 160 332 2,114 1,643 391 1,652 99 502 6,362 520 1,906 292 0 25 •
1
16,409 16 0 616 393 287 1,528 2,389 569 1,351 81 856 1,791 196 555 0 0 633 11,245 17 o zo 11 12 67 7z 17 s6 5 z3 163 35 57 7 1 s 1 585
Unclassified 0 275 318 257 1,390 1,901 3,398 3,152 1,419 5,423 2,161 928 10,806 289 90 53 131,861 Subtotal 0 6,670 7,739 7,161 41,107 55,531 118,509 78,115 39,076 121,815 60,376 27,621 400,385 15,556 3,799 719 184,178
----------------------------------------------------------------------------------------------------------------------------------------------- ------COAL-IMPACT COUNTIES
----------------------------------------------------------------------------------------------------------------------------------------------- ------2 0 615 225 497 3,881 2,224 1,394 1,538 281 2,138 6,112 2,243 6,589 811 683 282 29,513 6 0 613 328 659 3,328 6,180 3,874 10,017 1,828 1,872 5,571 3,287 7,074 144 0 0 44,775 7 0 305 216 330 2,282 739 463 931 170 453 2,976 293 2,521 34 0 0 111,711 s o 1 o o 3 3 z 4 1 1 5 z 5 o o o 1 z7 9 0 5 3 5 33 27 17 36 7 14 50 17 52 3 2 1 ' 272
12 o 326 14o 333 1,874 s76 16o 318 11 111 3,o77 5s 445 45o 54 o I s,s94 14 0 1,010 1,532 423 1,328 3,632 663 3,424 122 2,061 1,788 1,813 566 248 192 101 118,907 16 0 503 525 343 1,634 1,610 294 1,176 42 1,098 2,573 549 459 372 90 28 111,297 17 ... ... ... ... ... ... ... ... ... ... ... .•. •.. ... ... ... . ..
Unclassified 0 368 270 314 1,776 1,617 755 1,838 281 866 2,808 849 2,242 238 107 31 i14,360 Subtotal 0 3,744 3,240 2,905 16,140 16,909 7,621 19,282 2,743 9,275 24,959 9,113 19,953 2,301 1,129 444 !39,757 ---------------------------------------------------------------------------------------------------------------------------------------------~------
----------------------------------------------------------------~~~-:~::~~:~=~:~~~:-~~~::~.:~~:~:~--------------------------------------------1 _____ _ 2 0 2,997 2,948 3,282 22,813 23,132 50,460 25,224 12,994 56,789 32,077 16,158 220,140 13,000 3,213 282 ~85,509 6 0 1,067 624 1,180 5,724 9,875 12,544 11,887 2,832 8,771 7,537 6,425 35,553 248 229 0 104,496 7 0 1,792 2,473 2,126 11,555 17,414 39,594 18,269 9,476 27,905 15,359 4,953 92,691 2,022 777 0 146,405 8 0 416 1,035 656 2,913 4,820 11,307 22,112 11,867 19,545 5,039 1,685 35,417 115 0 0 16,926 9 0 253 351 318 1,662 2,466 5,741 4,590 2,451 6,212 2,215 1,262 18,361 440 135 1 46,458
12 0 686 340 536 2,743 1,866 396 2,637 150 1,038 5,463 1,360 1,584 586 92 0 119,477 14 0 1,421 1,692 755 3,442 5,275 1,054 5,076 221 2,563 8,150 2,334 2,472 541 192 126 135,316 16 0 1,119 917 630 3,162 3,999 863 2,527 123 1,954 4,364 744 1,014 372 90 662 22,542 17 0 20 11 12 67 72 17 86 5 23 163 35 57 7 1 8 I 585
Unclassified 0 643 588 571 3,166 3,519 4,153 4,989 1,701 6,289 4,968 1,m 13,048 527 198 84 146,221 Total 0 10,414 10,979 10,066 57,247 72,439 126,130 97,396 41,819 131,090 85,335 36,734 420,338 17,857 4,928 1,163 1,123,934
===============================================================================================================================================*======
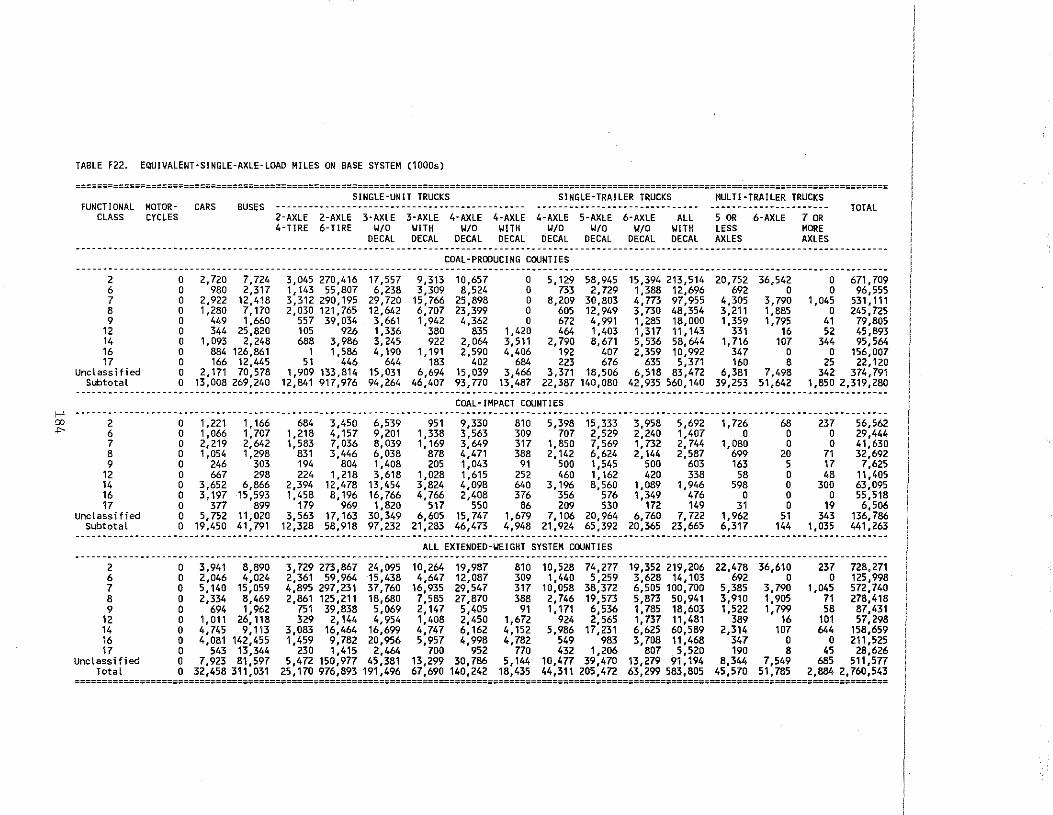
TABLE F22. EQUIVALENT·SINGLE·AXLE·LOAD MILES ON BASE SYSTEM (1000s)
====================================================================================================================================================== SINGLE-UNIT TRUCKS SINGLE-TRAILER TRUCKS MULTI-TRAILER TRUCKS
FUNCTIONAL MOTOR- CARS BUSES ---------------------------------------------- ------------------------------ ---------------------- TOTAL CLASS CYCLES 2-AXLE 2-AXLE 3-AXLE 3-AXLE 4-AXLE 4-AXLE 4-AXLE 5-AXLE 6-AXLE ALL 5 OR 6-AXLE 7 OR
4-TIRE 6-TIRE WID WITH ~/0 WITH ~/0 ~/0 W/0 WITH LESS MORE DECAL DECAL DECAL DECAL DECAL DECAL DECAL DECAL AXLES AXLES
------------------------------------------------------------------------------------------------------------------------------------------------------COAL-PRODUCING COUNTIES
---------------------------------------------------------------------------------------------------------------------------2 0 2, 720 7,724 3,045 270,416 17' 557 9,313 10,657 0 5,129 58,945 15,394 213,514 20,752 36,542 0 671,709 6 0 980 2,317 1,143 55,807 6,238 3,309 8,524 0 733 2,729 1,388 12,696 692 0 0 96,555 7 0 2,922 12,418 3,312 290,195 29,720 15,766 25,898 0 8,209 30,803 4,773 97,955 4,305 3, 790 1,045 531,111 8 0 1,260 7,170 2,030 121,765 12,642 6,707 23,399 0 605 12,949 3, 730 48,354 3,211 1,665 0 245,725 9 0 449 1,660 557 39,034 3,661 1,942 4,362 0 672 4,991 1,265 18,000 1,359 11795 41 79,805
12 0 344 25,820 105 926 1,336 380 835 1,420 464 1,403 1,317 11,143 331 16 52 45,693 14 0 1,093 2,248 688 3,966 3,245 922 2,064 3, 511 2,790 8,671 5,536 58,644 1, 716 107 344 95,564 16 0 884 126,861 1 1,566 4,190 1' 191 2,590 4,406 192 407 2,359 10,992 347 0 0 156,007 17 0 166 12,445 51 446 644 183 402 684 223 676 635 5,371 160 8 25 22,120
Unclassified 0 2,171 70,578 1,909 133,814 15,031 6,694 15,039 3,466 3,371 18,506 6,518 83,472 6,361 7,498 342 374,791 Subtotal 0 13,008 269,240 12,841 917,976 94,264 46,407 93,770 13,487 22,387 140,080 42,935 560,140 39,253 51,642 1,850 2,319,280
------------------------------------------------------------------------------------------------------------------------------------------------------COAL-IMPACT COUNTIES
>--' --------------------------------------------------------------------------------------------------------CJ) 2 0 1,221 1' 166 684 3,450 6,539 951 9,330 810 5,398 15,333 3,958 5,692 1,726 68 237 56,562 "' 6 0 1,066 1, 707 1,218 4,157 9,201 1,338 3,563 309 707 2,529 2,240 1,407 0 0 0 29,444
7 0 2,219 2,642 1, 583 7,036 8,039 1,169 3,649 317 1,850 7,569 1, 732 2,744 1,080 0 0 41' 630 8 0 1,054 1,298 831 3,446 6,038 878 4,471 388 2,142 6,624 2,144 2,587 699 20 71 32,692 9 0 246 303 194 804 1,408 205 1,043 91 500 1,545 500 603 163 5 17 7,625
12 0 667 298 224 1,218 3,618 1,028 1,615 252 460 1,162 420 338 58 0 48 11,405 14 0 3,652 6,866 2,394 12,478 13,454 3,824 4,098 640 3,196 8,560 1,089 1,946 598 0 300 63,095 16 0 3,197 15,593 1,458 8,196 16,766 4,766 2,408 376 356 576 1,349 476 0 0 0 55,518 17 0 377 899 179 969 1,820 517 550 86 209 530 172 149 31 0 19 6,506
Unclassified 0 5, 752 11,020 3,563 17,163 30,349 6,605 15,747 1,679 7,106 20,964 6,760 7,722 1,962 51 343 136,786 Subtotal 0 19,450 41,791 12,328 58,918 97,232 21,283 46,473 4,948 21,924 65,392 20,365 23,665 6,317 144 1,035 441,263
------------------------------------------------------------------------------------------------------------------------------------------------------ALL EXTENDED-WEIGHT SYSTEM COUNTIES
------------------------------------------------------------------------------------------------------------------------------------------------------2 0 3,941 8,890 3, 729 273,867 24,095 10,264 19,987 810 10,528 74,277 19,352 219,206 22,478 36,610 237 728,271 6 0 2,046 4,024 2,361 59,964 15,438 4,647 12,087 309 1,440 5,259 3,628 14,103 692 0 0 125,998 7 0 5,140 15,059 4,895 297,231 37,760 16,935 29,547 317 10,058 38,372 6,505 100,700 5,385 3,790 1,045 572,740 8 0 2,334 8,469 2,861 125,211 18,680 7,585 27,870 388 2,746 19,573 5,873 50,941 3,910 1,905 71 278,418 9 0 694 1,962 751 39,838 5,069 2,147 5,405 91 1' 171 6,536 1,785 18,603 1,522 1,799 58 87,431
12 0 1' 011 26,118 329 2,144 4,954 1,408 2,450 1,672 924 2,565 1, 737 1 1' 481 389 16 101 57,298 14 0 4,745 9,113 3,083 16,464 16,699 4,747 6,162 4,152 5,986 17,231 6,625 60,589 2,314 107 644 158,659 16 0 4,081 142,455 1,459 9,782 20,956 5,957 4,998 4,782 549 983 3,708 11,468 347 0 0 211,525 17 0 543 13,344 230 1,415 2,464 700 952 770 432 1,206 807 5,520 190 8 45 28,626
Unclassified 0 7,923 81,597 5,472 150,977 45,381 13,299 30,786 5,144 10,477 39,470 13,279 91,194 8,344 7,549 685 511,577 Total 0 32,458 311,031 25,170 976,893 191,496 67,690 140,242 18,435 44,311 205,472 63,299 583,805 45,570 51,785 2,884 2,760,543
======================================================================================================================================================
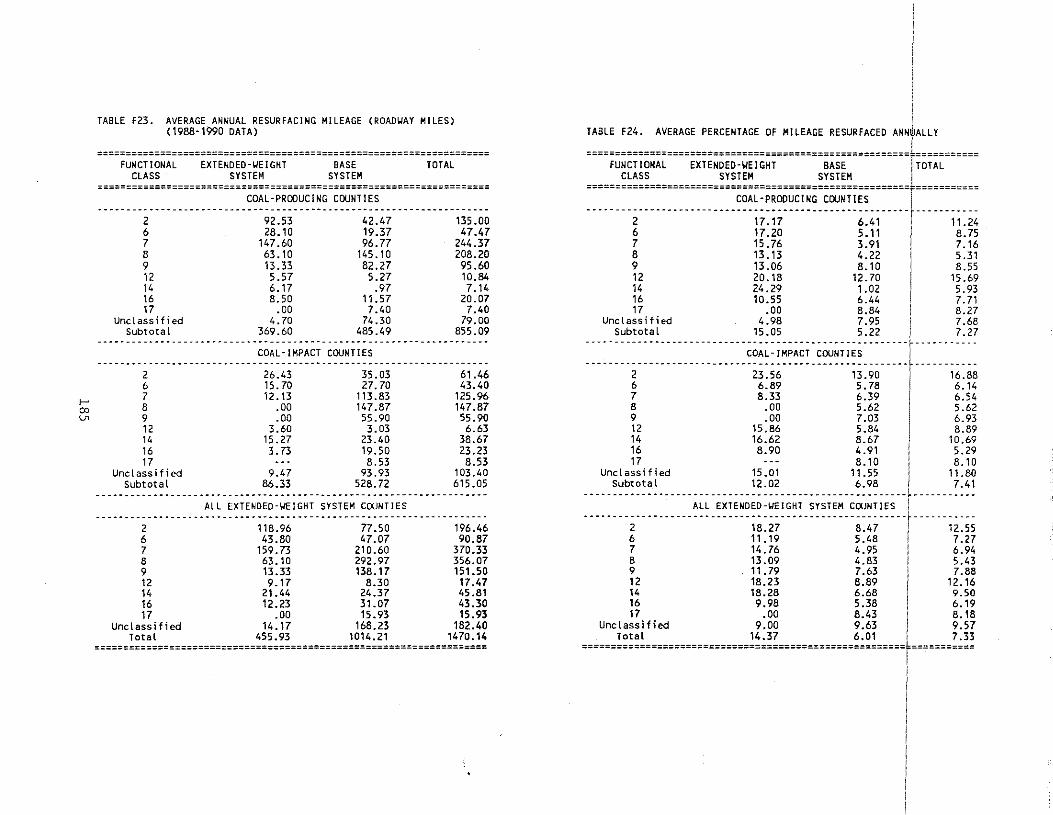
I-'
"' en
TABLE F23. AVERAGE ANNUAL RESURFACING MILEAGE (ROADYAY MILES) (1988·1990 DATA)
==================================================================== FUNCTIONAL
ClASS EXTENDED-~EIGHT
SYSTEM BASE
SYSTEM TOTAl
====================================================================
2 6 7 8 9 12 1' 16 17
Unclassified Subtotal
2 6 7 8 9 12 14 16 17
Unclassified Subtotal
2 6 7 B 9 12 14 16 17
Unclassified Total
COAl-PRODUCING COUNTIES
92.53 28.10
,.7.60 63.10 13.33 5.57 6.17 8.50
.00 •. 70
369.60
42.47 19.37 96.77
,.5,10 82.27 5.27
.97 11.57 7 .• 0
7 •. 30 485 .• 9
COAl-IMPACT COUNTIES
26.43 15.70 12.13
.00
.00 3.60
15.27 3. 73
9.47 86.33
35.03 27.70
113.83 1'7.87 55.90 3.03
23 .• 0 19.50 8.53
93.93 528.72
ALL EXTENDED-~EIGHT SYSTEM COUNTIES
118.96 77.50 43.80 .7.07
159.73 210.60 63.10 292.97 13.33 138.17 9.17 8.30
21." 24.37 12.23 31.07
.00 15.93 14.17 168.23
455.93 1014.21
135.00 47.47
244.37 208.20 95.60 10.84 7.14
20.07 7.40
79.00 855.09
61.46 43.40
125.96 147.87 55.90 6.63
38.67 23.23 8.53
103.40 615.05
196 .• 6 90.87
370.33 356.07 151.50 17.47 45.81 43.30 15.93
182.40 1470.14
====================================================================
TABlE F2.. AVERAGE PERCENTAGE OF MilEAGE RESURFACED ANNiliAllY i
========================================================•=========== FUNCTIONAl EXTENDEO-~EIGHT BASE !TOTAl
ClASS SYSTEM SYSTEM i ========================================================r-===========
COAl-PRODUCING COUNTIES -------·;··------------------;~:;~----------·-·;:;;··---~ ----··;;:;~
6 11.20 5.11 1 8.75 7 15.76 3.91 ' 7.16 8 13.13 4.22 .
1
5.31 9 13.06 8.10 8.55 12 20.18 12.70 15.69 ,. 2•.29 1.02 I 5.93 16 10.55 6... ' 7.71 17 .00 B.S. I 8.27
Unclassified 4.98 7.95 1 7.68
----- ~~~:~:~ ~---------------- ~:: ~:-------------:: ::----- ~-------:: :7 COAL-IMPACT COUNTIES I
--------------------------------------------------------~-----------2 23.56 13.90 I 16.88 6 6.89 5.78 6.14 7 8.33 6.39 I 6.54 B .00 5.62 'I 5.62 9 .00 7.03 6.93 12 15.86 5.8. 8.89 14 16.62 8.67 ' 10.69 16 8.90 4.91 I 5.29 17 --- 8.10 i 8.10
Unclassified 15.D1 11.55 1 11.80 Subtotal 12.02 6.98 f 7.41
--------------------------------~-----------------------~-----------All EXTENDED-WEIGHT SYSTEM COUNTIES
------------------------------------------------------- -----------2 18.27 8 .• 7 12.55 6 11.19 5.48 7.27 7 14.76 4.95 6.94 B 13.09 4.83 5.43 9 11.79 7.63 7.88 12 18.23 8.89 12.16 14 18.28 6.68 9.50 16 9.98 5.38 6.19 17 .00 8.43 8.18
Unclassified 9.00 9.63 9.57 Total 14.37 6.01 7.33
~~~~~~~~··~~~~~~~··~~~~""·~~~~~~~ .. ·~~~~~····~~~~~~~---~~~~~-·
I
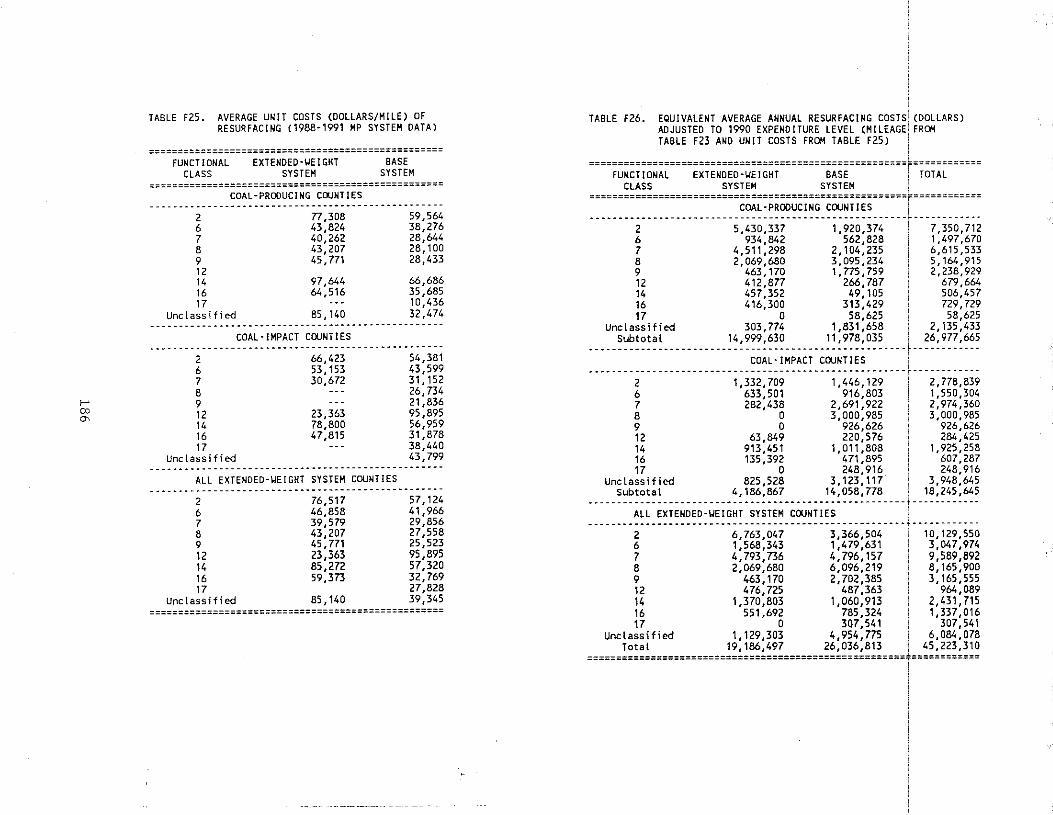
>--" co
"'
TABLE F25. AVERAGE UNIT COSTS (DOLLARS/MILE) OF RESURFACING (1988·1991 MP SYSTEM DATAl
=================================================== FUNCTIONAL
CLASS EXTENDED -~EIGHT
SYSTEM BASE
SYSTEM ===================================================
COAL-PRODUCING COUNTIES
2 77,308 59,564 6 43,824 38,276 7 40,262 28,644 8 43,207 28,100 9 45,771 28,433 12 14 97,644 66,686 16 64,516 35,685 17 ... 10,436
Unclassified 85. 140 32,474 ------------------------------------------.---------
COAL· IMPACT COUNTIES -------------------------.-------------------------
2 66,423 54,381 6 53. 153 43,599 7 30,672 31, 152 8 ... 26,734 9 ... 21,836 12 23,363 95,895 14 78,800 56,959 16 47,815 31,878 17 --- 38,440
Unclassified 43,799
ALL EXTENOED-~EIGHT SYSTEM COUNTIES
2 76,517 57,124 6 46,858 41,966 7 39,579 29,856 8 43,207 27,558 9 45.771 25,523 12 23,363 95,895 14 85,272 57,320 16 59,373 32,769 17 27,828
Unclassified 85.140 39,345 ===================================================
TABLE F26. EQUIVALENT AVERAGE ANNUAL RESURFACING COSTS! (DOLLARS) ADJUSTED TO 1990 EXPENDITURE LEVEL (MILEAGE• FROM TABLE F23 AND UNIT COSTS FROM TABLE F25) I
=======================================================l============ FUNCTIONAL EXTENDED -~EIGHT BASE I TOTAL
CLASS SYSTEM SYSTEM i =======================================================~============
COAL·PROCUCING COUNTIES I ····················------····················---------~---··--····-
2 5,430,337 1,920,374 I 7,350,712 6 934,842 562,828 1,497,670 7 4,511,298 2,104,235 1 6,615,533 8 2,069,680 3,095,234 I 5,164,915 9 463,170 1,775,759 1 2,238,929 12 412,877 266,787 i 679,664 14 457,352 49,105 1 506,457 16 416,300 313,429 I 729,729 17 0 58,625 i 58,625
Unclassified 303,774 1,831,658 1 2,135,433 Subtotal 14,999,630 11,978,035 I 26,977,665
-------------------------------------------------------r------------coAL·IMPAcT COUNTIES I
-------------------------------------------------------~------------2 1,332,709 1,446,129 2,778,839 6 633,501 916,803 1,550,304 7 282,438 2,691,922 2,974,360 8 0 3,000,985 3,000,985 9 0 926,626 926,626 12 63,849 220,576 284,425 14 913,451 1,011,808 1,925,258 16 135,392 471,895 607,287 17 0 248,916 248,916
Unclassified 825,528 3,123,117 3,948,645 Subtotal 4,186,867 14,058,778 18,245,645
--------;~~-~;~~~~~~:~~~~~~-;;~~~~-~~~~~~~------------i·---------------···································--------········f·····-------
2 6,763,047 3,366,504 ! 10,129,550 6 1,568,343 1,479,631 ' 3,047,974 7 4,793,736 4,796,157 1 9,589,892 8 2,069,680 6,096,219 i 8,165,900 9 463,170 2,702,385 I 3,165,555 12 476,725 487,363 I 964,089 14 1,370,803 1,060,913 i 2,431,715 16 551,692 785,324 i 1,337,016 17 0 307,541 I 307,541
Unclassified 1,129,303 4,954,775 I 6,084,078 Total 19,186,497 26,036,813 1 45,223,310
-~~···················,···················~,.·····i············
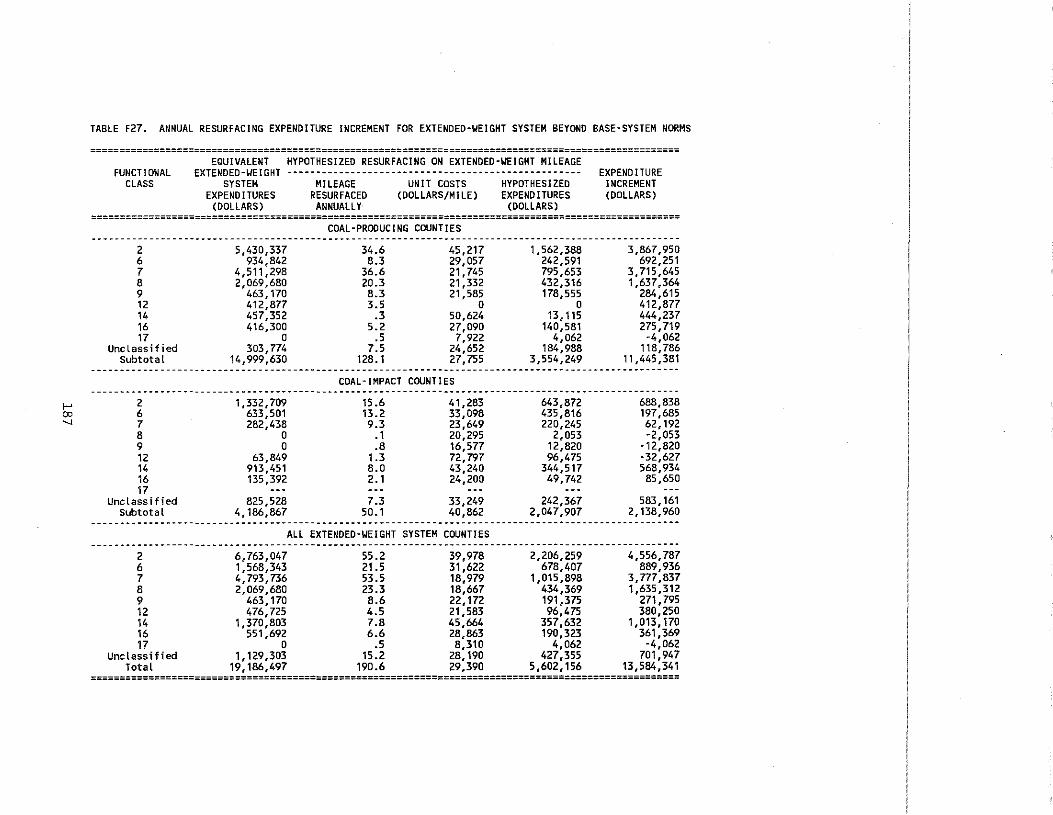
f-'
"' .._,
TABLE F27. ANNUAL RESURFACING EXPENDITURE INCREMENT FOR EXTENDED-WEIGHT SYSTEM BEYOND BASE-SYSTEM NORMS
====================================================================================================== FUNCTIONAL
CLASS
EQUIVALENT EXTENDED-WEIGHT
SYSTEM EXPENDITURES
(DOLLARS)
HYPOTHESIZED RESURFACING ON EXTENDED-WEIGHT MILEAGE
MILEAGE RESURFACED
ANNUALLY
UNIT COSTS (DOLLARS/MILE)
HYPOTHESIZED EXPENDITURES
(DOLLARS)
EXPENDITURE INCREMENT (DOLLARS)
====================================================================================================== COAL-PRODUCING COUNTIES
------------------------------------------------------------------------------------------------------2 6 7 8 9 12 14 16 17
Unclassified Subtotal
5,430,337 934,842
4,511,298 2,069,680
463,170 412,877 457,352 416,300
0 303,774
14,999,630
34.6 8.3
36.6 20.3 8.3 3.5
.3 5.2
.5 7.5
128.1
45,217 29,057 21,745 21,332 21,585
0 50,624 27,090
7,922 24,652 27,755
COAL-IMPACT COUNTIES
1,562,388 242,591 795,653 432,316 178,555
0 13,115
140,581 4,062
184,988 3,554,249
3,867,950 692,251
3, 715,645 1,637,364
284,615 412,877 444,237 275,719
-4,D62 118,786
11,445,381
------------------------------------------------------------------------------------------------------2 1,332,709 15.6 41,283 643,872 688,838 6 633,501 13.2 33,098 435,816 197,685 7 282,438 9.3 23,649 220,245 62,192 8 0 • 1 20,295 2,053 -2,053 9 0 .8 16,577 12,820 -12,820 12 63,849 1.3 72,797 96,475 -32,627 14 913,451 8.0 43,240 344,517 568,934 16 135,392 2.1 24,200 49,742 85,650 17 --- --- --- --- ---
Unclassified 825,528 7.3 33,249 242,367 583,161 Subtotal 4,186,867 50.1 40,862 2,047,907 2,138,960
------------------------------------------------------------------------------------------------------ALL EXTENDED-WEIGHT SYSTEM COUNTIES
------------------------------------------------------------------------------------------------------2 6 7 8 9 12 14 16 17
Unclassified Total
6,763,047 1,568,343 4, 793,736 2,069,680
463,170 476,725
1,370,803 551,692
0 1,129,303
19,186,497
55.2 21.5 53.5 23.3 8.6 4.5 7.8 6.6
.5 15.2
190.6
39,978 31,622 18,979 18,667 22,172 21,583 45,664 28,863 8,310
28,190 29,390
2,206,259 678,407
1,015,898 434,369 191,375 96,475
357,632 190,323
4,062 427,355
5,602,156
4,556,787 889,936
3, 777,837 1,635,312
271,795 380,250
1,013,170 361,369
-4,062 701,947
13,584,341 ======================================================================================================
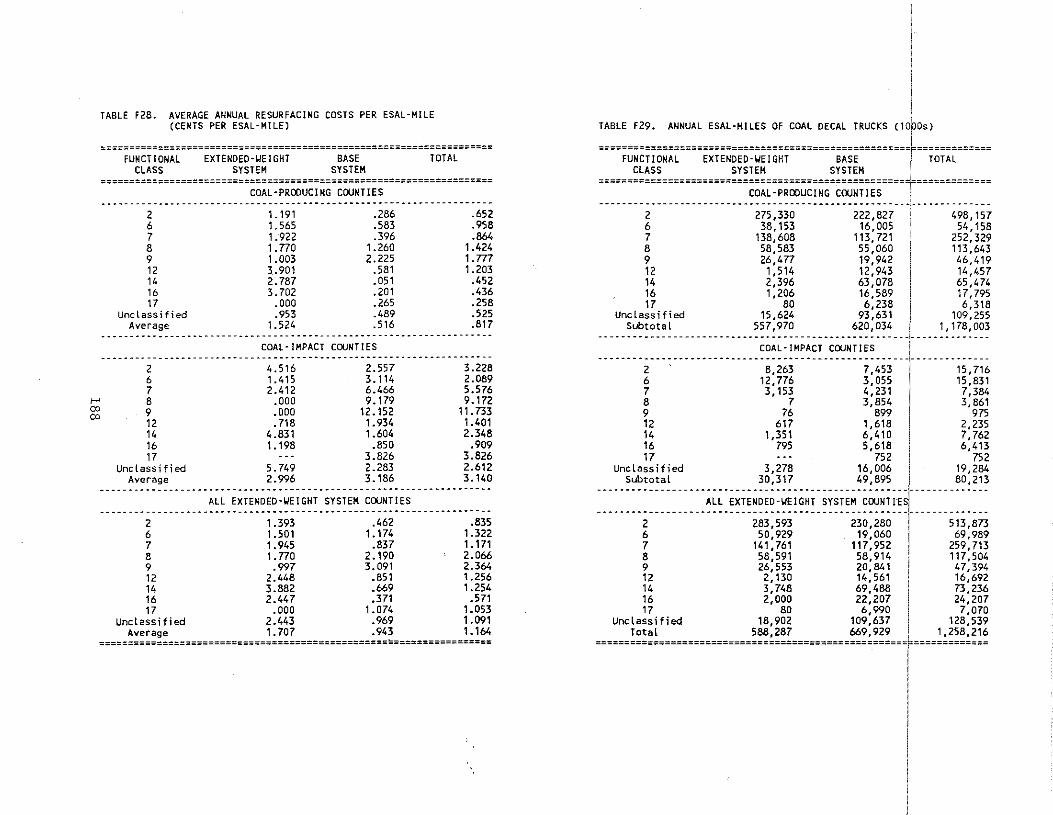
,..., 00 00
TABLE F28. AVERAGE ANNUAL RESURFACING COSTS PER ESAL·HILE (CENTS PER ESAL·HILE)
==================================================================== FUNCTIONAL
CLASS EXTENDED-~EIGHT
SYSTEM BASE
SYSTEM TOTAL
==================================================================== COAL-PRODUCING COUNTIES
2 L 191 .286 .652 6 L565 .583 .958 7 L922 .396 .864 8 1. 770 1.260 1.424 9 1.003 2.225 t.m 12 3.901 .581 1.203 14 2.787 .051 .452 16 3. 702 .201 .436 17 .000 .265 .258
Unclassified .953 .489 .525 Average 1. 524 .516 .817
··········----------------·--------------·····--·-·-··--------------
2 6 7 8 9 12 14 16 17
Unclassified Average
COAL·IHPACT COUNTIES
4.516 1.415 2.412
.000
.000
. 718 4.831 1.198
5. 749 2.996
2.557 3.114 6.466 9.179
12.152 1.934 1.604
.850 3.826 2.283 3.186
ALL EXTENDED-~EIGHT SYSTEM COUNTIES
3.228 2.089 5.576 9.172
11.733 1.401 2.348
.909 3.826 2.612 3.140
2 1.393 .462 .835 6 1.501 1.174 1.322 7 1.945 .837 1.171 8 1.770 2.190 2.066 9 .997 3.091 2.364 12 2.448 .851 1.256 14 3.882 .669 1.254 16 2.447 .371 .571 17 .000 1.074 1.053
Unclassified 2.443 .969 1.091 Average 1.707 .943 1.164
====================================================================
TABLE F29. ANNUAL ESAL·MILES OF COAL DECAL TRUCKS (10P0s)
======================================================~============= FUNCTIONAL
CLASS EXTENDED-~EIGHT
SYSTEM BASE
SYSTEM TOTAL
======================================================~============= COAL-PRODUCING COUNTIES
2 275,330 222,827 498,157 6 38,153 16,005 54. 158 7 138,608 113,721 252,329 8 58,583 55,060 113,643 9 26,477 19.942 46,419 12 1,514 12,943 14,457 14 2,396 63,078 65,474 16 1,206 16,589 17,795 17 80 6,238 6,318
Unclassified 15,624 93,631 I 109,255 Subtotal 557,970 620,034 1 1,178,003
-----------------------·------------------------------:-------------------------------------·----~~~=:~~~~~~-~~~:~:~-----1-------------
2 6 7 8 9 12 14 16 17
Unclassified
8,263 12,776 3,153
7 76
617 1,351
795
3.278
7,453 3,055 4,231 3,854
899 1,618 6,410 5,618
15,716 15,831 7,384 3,861
975 2,235 7, 762 6,413
752 19,284
752 16,oo6 .
1 ----- :~~~~~~:- - - -------- --- -:~:: ~:- ------ ----~~: ~~:- --~- ---- - - -~~: ~ ~: ALL EXTENDED-~EIGHT SYSTEM COUNTIES
------·------------··-------------·---------------------------------2 283,593 230,280 I 513,873 6 50,929 19,o6o ·
1 69,989
7 141,761 117,952 I 259,713 8 58,591 58,914 I 117,504 9 26,553 20,841 i 47,394 12 2, Bo 14,561 I 16,692 14 3,748 69,488 I 73,236 16 2,ooo 22,201 1 24,207 17 80 6,990 1 7,070
Unclassified 18,902 109,637 1 128,539 Total 588,287 669,929 1 1,258,216
======================================================f============= I
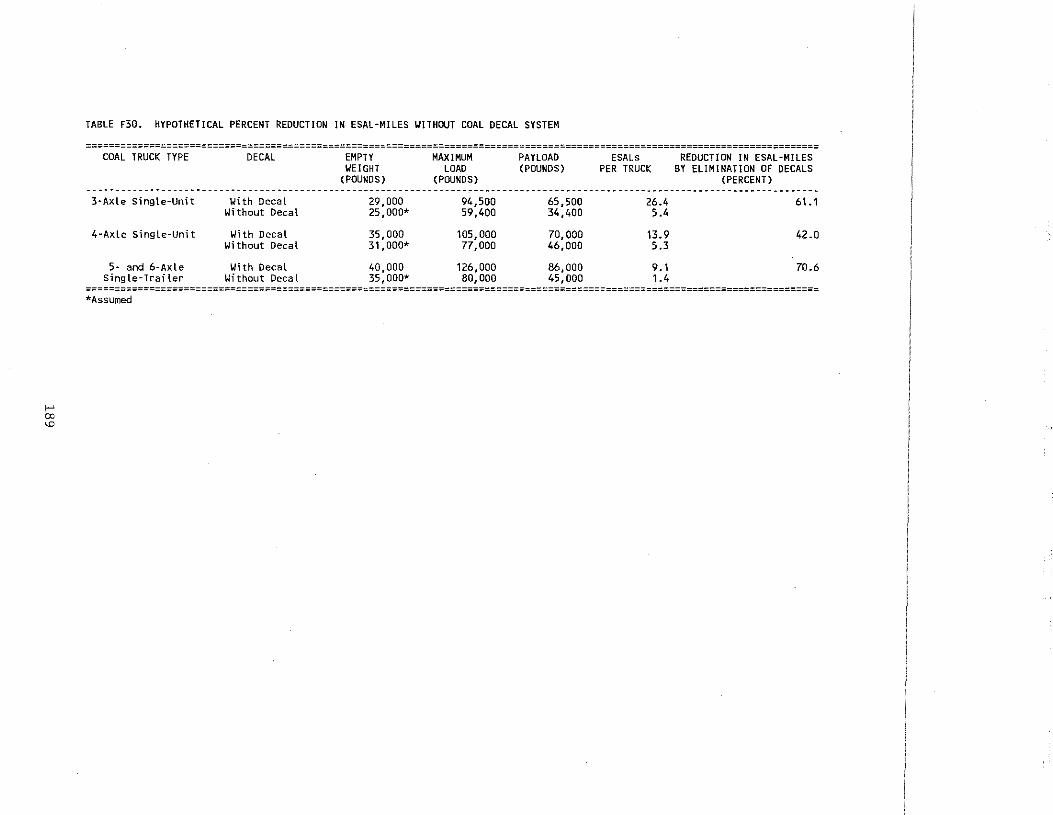
>-' 00
"'
TABLE F30. HYPOTHETICAL PERCENT REDUCTION IN ESAL-MILES ~ITHOUT COAL DECAL SYSTEM
=============================================================================================================================== COAL TRUCK TYPE DECAL EMPTY MAXIMUM PAYLOAD ESALs REDUCTION IN ESAL-MILES
~EIGHT LOAD (POUNDS) PER TRUCK BY ELIMINATION Of DECALS (POUNDS) (POUNDS) (PERCENT)
-------------------------------------------------------------------------------------------------------------------------------3-Axle Single-Unit With Decal 29,DDD 94,5DO 65,500 26.4 61.1
Without Decal 25,000* 59,400 34,400 5.4
4-Axle Single-Unit Yith Decal 35,000 105,000 70,000 13.9 42.0 Without Decal 31,000* 77,000 46,000 5.3
5- and 6-Axle With Decal 40,000 126,000 86,000 9.1 70.6 Single-Trailer \.li thout Decal 35,000* 80,000 45,000 1.4
=============================================================================================================================== *Assumed
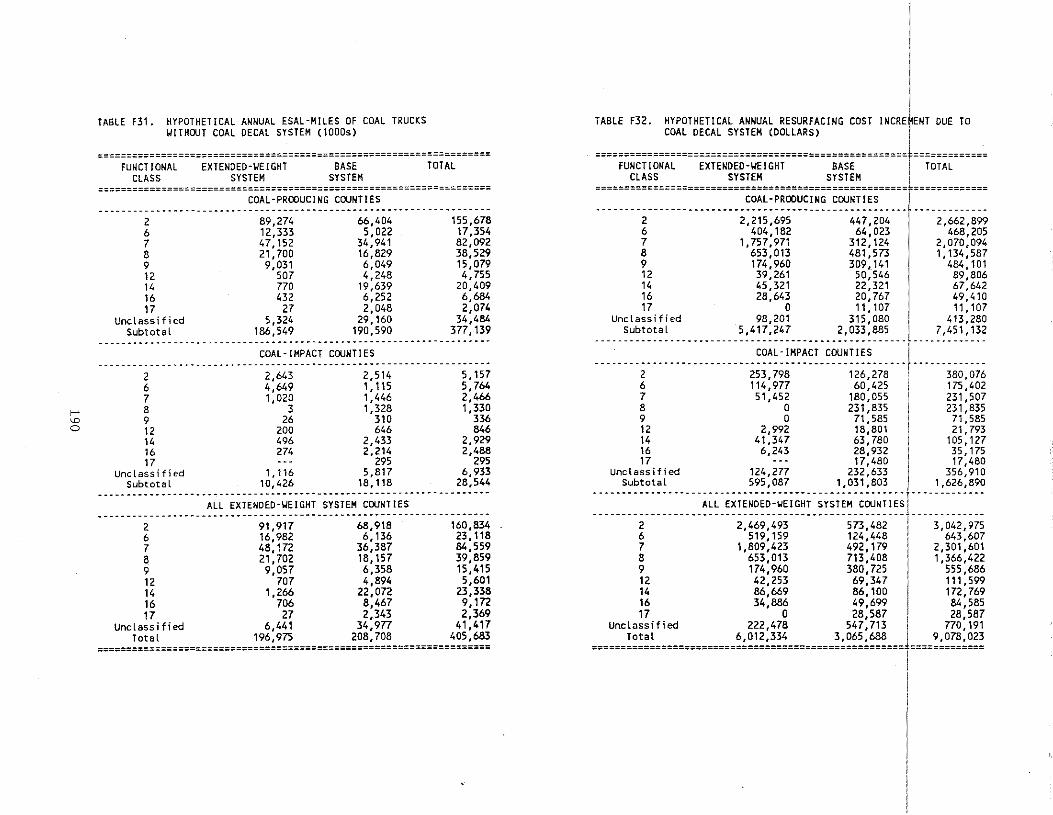
f-'
"' 0
TABLE F31. HYPOTHETICAL ANNUAL ESAL-M!LES OF COAL TRUCKS WITHOUT COAL DECAL SYSTEM (10D0s)
==================================================================== FUNCT tONAL
CLASS EXTENOEO·YE!GHT
SYSTEM BASE
SYSTEM TOTAL
====================================================================
2 6 7 8 9 12 14 16 17
Unclassified Subtotal
COAL·PROCUC!NG COUNTIES
89,274 12,333 47,152 21,700 9,031
507 770 432
27 5,324
186,549
66,404 5,022
34,941 16,829 6,049 4,248
19,639 6,252 2,048
29,160 190,590
155,678 17,354 82,092 38,529 15,079 4,755
20,409 6,684 2,074
34,484 377,139
--------------------------------------------------------------------COAL· IMPACT COUNTIES
--------------------------------------------------------------------2 6 7 8 9 12 14 16 17
Unclassified Subtotal
2,643 4,649 1,020
3 26
200 496 274
1, 116 10,426
2,514 1,115 1,446 1,328
310 646
2,433 2,214
295 5,817
18,118
5' 157 5,764 2,466 1,330
336 846
2,929 2,488
295 6,933
28,544 --------------------------------------------------------------------
ALL EXTENDED-WEIGHT SYSTEM COUNTIES --------------------------------------------------------------------
2 91,917 68,918 160,834 6 16,982 6,136 23,118 7 48,172 36,387 84,559 8 21,702 18,157 39,859 9 9,057 6,358 15,415 12 707 4,894 5,601 14 1,266 22,072 23,338 16 706 8,467 9,172 17 27 2,.343 2,369
Unclassified 6,441 34,977 41,417 Total 196,975 208,708 405,683
====================================================================
I
TABLE F32. HYPOTHETICAL ANNUAL RESURFACING COST !NCRE~ENT DUE TO COAL DECAL SYSTEM (DOLLARS) 1
======================================================rl============= FUNCTIONAL EXTENOEO·YE!GHT BASE TOTAL
CLASS SYSTEM SYSTEM I ======================================================F=============
2 6 7 8 9 12 14 16 17
Unclassified Subtotal
COAL·PROCUC!NG COUNTIES I
2,215,695 404, 1B2
1,757,971 653,013 174,960 39,261 45,321 28,643
0 98,201
5,417,247
447,204 64,023
312,124 481,573 309,141
50,546 22,321 20,767 11' 107
315,080 2,033,885
2,662,899 468,205
2,070,094 1,134,587
484,101 89,806 67,642 49,410 1 1 '1 07
413,280 7,451,132
------------------------------------------------------ -------------COAL·!MPACT COUNTIES
------------------------------------------------------ -------------2 253,798 126,278 380,076 6 114,977 60,425 175,402 7 51,452 180,055 231,507 8 0 231,B35 231,835 9 0 71,585 71,585 12 2,992 18,801 21,793 14 41,347 63,780 105,127 16 6,243 28,932 35,175 17 ... 17,480 17,480
Unclassified 124,277 232,633 356,910 Subtotal 595,087 1,031,B03 1,626,890
------------------------------------------------------+-------------
-------------------~:~-=~:=~~=~=~=~~~:_:~:::~.:~~:~::f-------------2 2,469,493 573,482 i 3,042,975 6 519,159 124,448 i 643,607 1 1,809,423 492,179 1 2,301,601 8 653,013 713,408 1 1,366,422 9 174,96o 380,725 1 555,686 12 42,253 69,347 .
1
111,599 14 86,669 86,100 172,769 16 34,886 49,699 84,585 17 0 28,587 I 28,587
Unclassified 222,478 547,713 i 770,191 Total 6,012,334 3,065,688 I 9,078,023
======================================================*=============
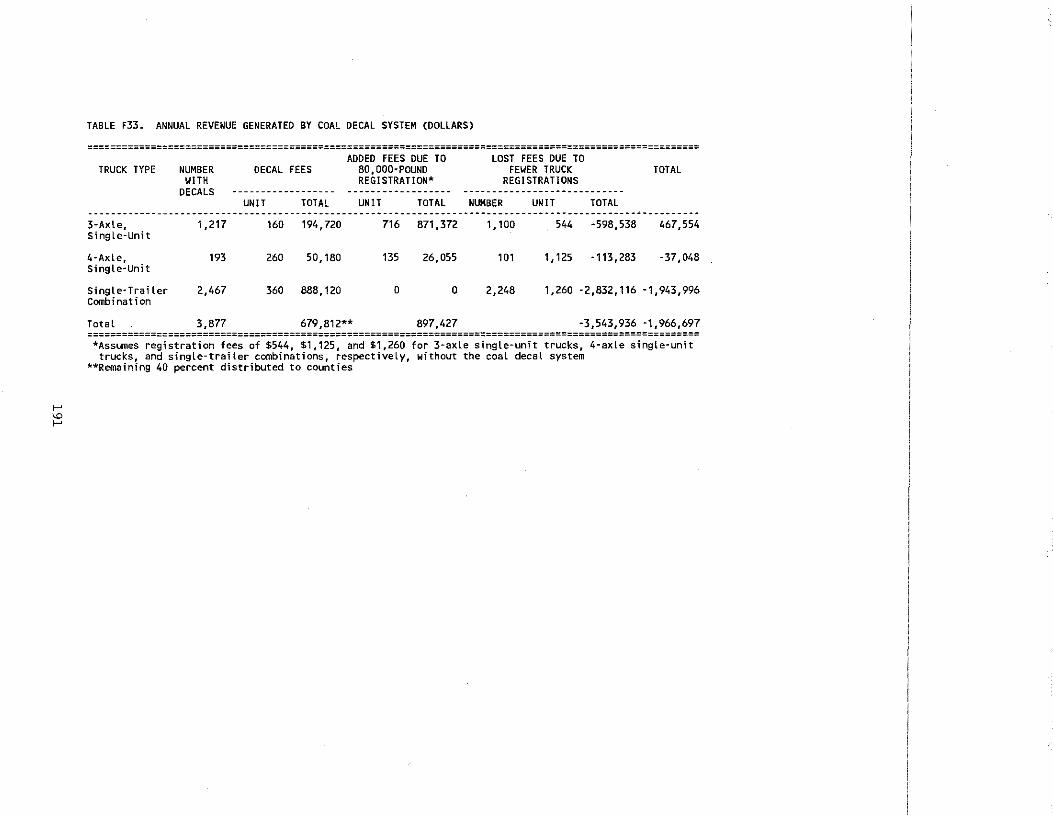
>--'
'"' >--'
TABLE F33. ANNUAL REVENUE GENERATED BY COAL DECAL SYSTEM (DOLLARS)
========================================================================================================== ADDED FEES DUE TO LOST FEES DUE TO
TRUCK TYPE NUMBER DECAL FEES 80,000-POUND FEWER TRUCK TOTAL WITH REGISTRATION* REGISTRATIONS
DECALS ------------------ ------------------ ----------------------------UNIT TOTAL UNIT TOTAL NUMBER UNIT TOTAL
3-Axte, 1,217 160 194,72D 716 871,372 1,10D 544 -598,538 467,554 Single-Unit
4-Axle, 193 26D 50,180 135 26,055 1D1 1 '125 ·113,283 ·37,D48 Single-Unit
Single-Trailer 2,467 360 888, 12D 0 0 2,248 1,260 ·2,832,116 -1,943,996 Combination
Total 3,877 679,812** 897,427 -3,543,936 ·1,966,697 ========================================================================================================== *Assumes registration fees of $544, $1,125, and $1,260 for 3-axle single-unit trucks, 4-axle single-unit
trucks, and single-trailer combinations, respectively, without the coal decal system **Remaining 40 percent distributed to counties
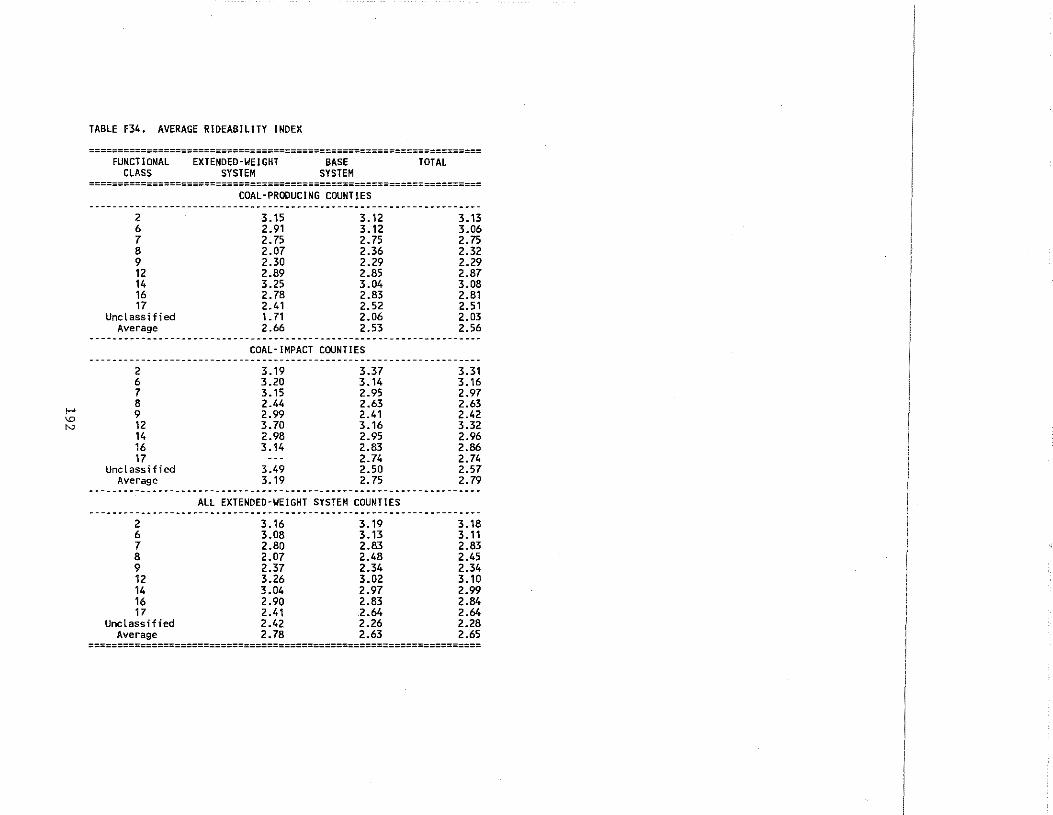
1-'
"' N
TABLE F34. AVERAGE R!DEABIL!TY INDEX
==================================================================== FUNCTIONAL
CLASS EXTENDED-WEIGHT
SYSTEM BASE
SYSTEM TOTAL
==================================================================== COAL-PRODUCING COUNTIES
-------------------------------------------------------------2 6 7 8 9 12 14 16 17
Unclassified Average
3.15 2.91 2. 75 2.07 2.30 2.89 3.25 2.78 2.41 1. 71 2.66
3.12 3.12 2. 75 2.36 2.29 2.85 3.04 2.83 2.52 2.06 2.53
COAL-IMPACT COUNTIES
3.13 3.06 2. 75 2.32 2.29 2.87 3.08 2.81 2. 51 2.03 2.56
--------------------------------------------------------------------2 6 7 8 9 12 14 16 17
Unclassified Average
2 6 7 8 9 12 14 16 17
Uncl ass 1f i ed Average
3.19 3.20 3.15 2.44 2.99 3.70 2.98 3.14
3.49 3.19
3.37 3.14 2.95 2.63 2.41 3.16 2.95 2.83 2.74 2.50 2.75
ALL EXTENDED-WEIGHT SYSTEM COUNTIES
3.16 3.19 3.08 3.13 2.80 2.83 2.07 2.48 2.37 2.34 3.26 3.02 3.04 2.97 2.90 2.83 2.41 2.64 2.42 2.26 2. 78 2.63
3.31 3.16 2.97 2.63 2.42 3.32 2.96 2.86 2.74 2.57 2.79
3.18 3. 11 2.83 2.45 2.34 3.10 2.99 2.84 2.64 2.28 2.65
====================================================================