camden county highway plan
TRANSCRIPT

MARCH 2015
Prepared by:
Prepared for:
CAMDEN COUNTYHIGHWAY PLAN

The Delaware Valley Regional Planning Commission is dedicated to uniting the region’s elected officials,
planning professionals, and the public with a common vision of making a great region even greater.
Shaping the way we live, work, and play, DVRPC builds consensus on improving transportation
promoting smart growth, protecting the environment, and enhancing the economy. We serve a diverse
region of nine counties: Bucks, Chester, Delaware, Montgomery, and Philadelphia in Pennsylvania;
and Burlington, Camden, Gloucester, and Mercer in New Jersey. DVRPC is the federally designated
Metropolitan Planning Organization for the Greater Philadelphia Region — leading the way to a better future.
The symbol in our logo is adapted from the official DVRPC seal and is designed as a stylized image of the Delaware Valley.
The outer ring symbolizes the region as a whole while the diagonal bar signifies the Delaware River.
The two adjoining crescents represent the Commonwealth of Pennsylvania and the State of New Jersey.
DVRPC is funded by a variety of funding sources including federal grants from the U.S. Department of Transportation’s Federal Highway Administration
(FHWA) and Federal Transit Administration (FTA), the Pennsylvania and New Jersey departments of transportation, as well as by DVRPC’s state and
local member governments. The authors, however, are solely responsible for the findings and conclusions herein, which may not represent the official
views or policies of the funding agencies.
The Delaware Valley Regional Planning Commission (DVRPC) fully complies with Title VI of the Civil Rights Act of 1964, the Civil Rights Restoration Act
of 1987, Executive Order 12898 on Environmental Justice, and related nondiscrimination statutes and regulations in all programs and activities.
DVRPC’s website, www.dvrpc.org, may be translated into multiple languages. Publications and other public documents can be made available in
alternative languages and formats, if requested. DVRPC public meetings are always held in ADA-accessible facilities and in transit-accessible locations
when possible. Auxiliary services can be provided to individuals who submit a request at least seven days prior to a meeting. Requests made within
seven days will be accommodated to the greatest extent possible. Any person who believes they have been aggrieved by an unlawful discriminatory
practice by DVRPC under Title VI has a right to file a formal complaint. Any such complaint may be in writing and filed with DVRPC’s Title VI Compliance
Manager and/or the appropriate state or federal agency within 180 days of the alleged discriminatory occurrence. For more information on DVRPC’s
Title VI program, or to obtain a Title VI Complaint Form, please call (215) 238-2871 or email [email protected].


Camden County Highway Plan
Table of Contents
EXECUTIVE SUMMARY .................................................................................................... 1
CHAPTER 1: INTRODUCTION ...................................................................................... 3
Work Program .............................................................................................................................................................. 4
The Report ................................................................................................................................................................... 4
CHAPTER 2: THE SETTING .......................................................................................... 5
Perspectives on Growth, Development, and Travel ................................................................................................. 5
CHAPTER 3: EXISTING TRANSPORTATION SYSTEMS ....................................... 9
County Routes ............................................................................................................................................................. 9
Current Traffic Demand ............................................................................................................................................ 15
Current Improvement Proposals .............................................................................................................................. 15
CHAPTER 4: GROWTH AND DEVELOPMENT ....................................................... 19
Forecasting Growth .................................................................................................................................................. 19
Managing Development ............................................................................................................................................ 19
Centers ..................................................................................................................................................................................... 20
CHAPTER 5: TRAVEL DEMAND FORECAST MODELING .................................. 21
Travel Simulation ...................................................................................................................................................... 21
2011 Base-Year Model Preparation .......................................................................................................................... 22
2011 Base-Year Model Performance ........................................................................................................................ 22
2040 Model Preparation ............................................................................................................................................ 23
2040 Long-Range Plan Scenario .............................................................................................................................. 23
2040 Master Plan Scenario ....................................................................................................................................... 23
Findings and Conclusions........................................................................................................................................ 23
CHAPTER 6: ASSESSMENT OF TRAFFIC CONDITIONS ................................... 25
The Congestion Management Process .................................................................................................................... 25
Analyses ..................................................................................................................................................................... 29
Technical Analysis Results .................................................................................................................................................... 34
Congestion Management Process Corridors ........................................................................................................................ 34
Incident Management Highway Network ............................................................................................................................... 34
Community Planning Considerations .................................................................................................................................... 34
CHAPTER 7: RECOMMENDED IMPROVEMENT PROGRAM ............................. 41
Congestion Management Process Strategy Compliance ...................................................................................... 46
Recommendations .................................................................................................................................................... 46
Final Travel Testing ................................................................................................................................................... 53
Implementation .......................................................................................................................................................... 53
CHAPTER 8: CONCLUSION ........................................................................................ 55
Page i

Camden County Highway Plan
List of Figures Figure 1: County Setting .............................................................................................................................................3 Figure 2: 2010 Land Use ............................................................................................................................................6 Figure 3: Land Use Change 1970 – 2010 ...................................................................................................................5 Figure 4: Commuting Patterns ................................................................................................................................... 8 Figure 5: Means of Transportation to Work ............................................................................................................... 8 Figure 6: Regional Transportation Facilities ............................................................................................................ 10 Figure 7: The County Route Network ...................................................................................................................... 11 Figure 8: Mass Transit Services .............................................................................................................................. 12 Figure 9: Intelligent Transportation Systems Infrastructure Vision ........................................................................... 13 Figure 10: Incident Management Highway Network (IMHN) .................................................................................... 14 Figure 11: Current Annual Average Daily Traffic Volumes (AADT) ......................................................................... 16 Figure 12: Highway Safety Improvement Program (HSIP) ...................................................................................... 17 Figure 13: Regional Transportation Improvement Projects on TIP and LRP ........................................................... 18 Figure 14: Schematic Diagram of Travel Demand Forecasting ............................................................................... 21 Figure 15: 2011 Model Calibration Results .............................................................................................................. 22 Figure 16: Congestion Management Process (CMP) Corridors ............................................................................... 26 Figure 16a: Subcorridor Areas for CMP Corridors 2, 3, 5, 6 .................................................................................... 27 Figure 16b: Subcorridor Areas for CMP Corridors 10, 11, 12, 13 ............................................................................ 28 Figure 17: Current Traffic Congestion and Traffic Safety – Segments of Concern .................................................. 35 Figure 18: Year 2040 Traffic Congestion – Segments of Concern .......................................................................... 36 Figure 19: Top Congestion Management Process Composite Score Segments ..................................................... 37 Figure 20: Candidate County Route Turnbacks ....................................................................................................... 38 Figure 21: Bike Facilities on County Routes (Existing, Proposed, and Planned) ..................................................... 39 Figure 22: Recommended Traffic Safety Program .................................................................................................. 47 Figure 23: Regional Mobility Improvement Program ................................................................................................ 48 Figure 24: County Route Mobility Improvement Recommendations ........................................................................ 49 Figure 25: Concept of the New Road/Medical Center Drive Extension (County Route 673 Relief Route)............... 51 Figure 26: Interconnected Traffic Signal System Priority Network ........................................................................... 52
List of Tables Table 1: Population and Employment (2010 and 2040) ............................................................................................. 7 Table 2: County-wide Growth Perspective ............................................................................................................... 19 Table 3: Preliminary Modeled Network Performance ............................................................................................... 23 Table 4: Summary of Camden County Route Transportation Analyses ................................................................... 30 Table 5: Camden County Route Mobility Recommendations................................................................................... 42 Table 6: Final Modeled Network Performance ......................................................................................................... 53
Appendices
APPENDIX A: CAMDEN COUNTY HIGHWAY INVENTORY ........................... A-1
Table A-1: Inventory of Camden County’s Highways ........................................................................................... A-2 Table A-2: Federal Highway Administration (FHWA) Highway Functional Classification and Federal-Aid Funding Eligibility.................................................................................................................................................... A-1
APPENDIX B: CAMDEN COUNTY BRIDGE INVENTORY .............................. B-1
Figure B-1: Location of Camden County’s Bridges .............................................................................................. B-2
Table B-1: Inventory of Camden County’s Bridges .............................................................................................. B-3
APPENDIX C: OTHER TRAFFIC AND TRANSPORTATION STUDIES, AND RECOMMENDATIONS FOR THE CAMDEN COUNTY MASTER PLAN ....... C-1
Table C-1: Traffic and Transportation Studies in Camden County (2004 to 2015)............................................. C-2
APPENDIX D: ENVIRONMENTAL SCREENING OF PHYSICAL IMPROVEMENTS ....................................................................................................... D-1
Figure D-1: Natural Features Near the Atco Station Access Improvement ........................................................ D-2
Figure D-2: Human Environments Near the Atco Station Access Improvement ............................................... D-3
Figure D-3: Natural Features Near the Atlantic City Expressway Interchange Improvement ........................... D-4
Figure D-4: Human Environments Near the Atlantic City Expressway Interchange Improvement .................. D-5
Figure D-5: Natural Features Along the Medical Center Drive/New Road Extension Improvement ................. D-6
Figure D-6: Human Environments Along the Medical Center Drive/New Road Extension Improvement ........ D-7
Figure D-7: Natural Features Along the Cross Keys Road Widening Project .................................................... D-8
Figure D-8: Human Environments along the Cross Keys Road Widening Project ............................................ D-9
Page ii

Camden County Highway Plan
Executive Summary The Camden County Highway Plan serves as an element to the update of the overall Camden County Master Plan. The project was developed by the Delaware Valley Regional Planning Commission (DVRPC) for, and with the direct participation of, the Camden County Division of Planning. The Highway Plan sets the direction for highway infrastructure—and particularly the county route network—to keep pace with changes expected by 2040. The work was conducted alongside the development of the county’s Land Use Plan update, and integrated findings from the Camden County Bicycling & Multi-Use Trails Plan and the Camden County Farmland Preservation Plan elements.
Principles guiding the project included:
Support the county’s economic activity and vitality,
Improve mobility and accessibility for the county’s residents and products,
Support the goals of the county’s Land Use Plan and the region’s Long-Range Plan,
Improve safety conditions for all travelers using the county route network,
Preserve and modernize key elements of the county route network,
Mitigate congestion by employing sustainable strategies and solutions that reduce (first), manage (second), or accommodate (last) single-occupant vehicular travel, and
Identify equitable partners (stakeholders and cosponsors) to help implement the highway element of the Master Plan.
Travel demand modeling was performed to estimate vehicle demands for the 401-mile long county route network for current and 2040 conditions, and ultimately the county’s recommended land use plan. Travel, traffic volumes, and congestion will increase in marginal amounts by 2040—generally in line with the growth in population and employment forecasted for the county. Assessment of the demands and transportation conditions was conducted using the model outputs, traffic safety data, and other highway and community planning criteria as inputs to the holistic evaluation methodology of the DVRPC Congestion Management Process. The Congestion Management Process and its outputs support Smart Growth tenets and systematically identify areas needing transportation attention.
Subsequently, recommendations were developed through need and opportunity. Recommendations incorporate projects included on the region’s adopted Transportation Improvement Program and Long-Range Plan, and match traffic safety deficiencies in the county with the active Highway Safety Improvement Program. The county is submitting candidate projects to DVRPC for consideration in the Highway Safety Improvement Program.
All but one of the mobility improvement projects for Camden County on the current Transportation Improvement Program and Long-Range Plan are devoted to regionally important transportation facilities. DVRPC staff conducted literature research and independent analysis of the current county route network—using Congestion Management Process indicators and opportunities identified through existing plans and programs—to determine the set of mobility improvement projects for the Master Plan. In addition to recommendations contained in prior transportation studies, the Highway Plan identifies seven major physical/operational mobility improvement projects to support the Land Use Plan, favor multimodal travel, and foster partnerships. Where necessary, the new mobility recommendations have been screened for possible environmental consequences.
Traffic backs up on Laurel Road (County Route 673), through Stratford Borough, during the rush hours. A relief route is proposed to distribute traffic and improve accessibility to the Lindenwold Station. (Photo: DVRPC)
Page 1

Camden County Highway Plan
Physical improvement recommendations developed through the Highway Plan’s analyses are:
Create “Bus Streets” along County Route 537 (Federal Street and Market Street) and County Route 551 (Broadway) in the City of Camden – Bus Streets serve more than three scheduled bus routes. Physical and operational improvements are proposed (including corner bus-stop bulb-outs, shelters, benches, pedestrian-scale street lighting, high-visibility crosswalks, and synchronized traffic signals) to promote transit use and operations ($12 million);
Rebuild County Route 536 Spur (Williamstown-New Freedom Road) and its interchange with the Atlantic City Expressway to add capacity and expand vehicular access to the Avandale Park-and-Ride Lot, in Winslow Township – Rectifies existing congestion problems and accommodates the proposed South Jersey Bus Rapid Transit project ($10 million);
Provide direct vehicular and pedestrian access to the Atlantic City Rail Line’s Atco Station from County Route 534 (Jackson Road), in Waterford Township – Addresses nearby congestion, and improves connections to NJTransit’s regional rail and bus services ($2 million for roadway and parking improvements);
Extend New Road and Medical Center Drive, two local roadways, in association with the “Eds and Meds” Revitalization Area—involving Rowan University, Kennedy Hospital, and the former Bradlees Shopping Center properties—with two vehicular lanes, in Stratford Borough – Supplies an alternate route to County Route 673 (Laurel Road) through the US 30 (White Horse Pike) and County Route 702 (Berlin Road) intersection, and increases accessibility to NJTransit’s and PATCO’s Lindenwold stations ($4 million for roadway improvements); and
Widen County Route 689 (Berlin-Cross Keys Road) to five vehicular lanes through Gloucester and Winslow townships – Reduces existing congestion and serves cross-county mobility for the long term ($20 million).
By now the county is largely developed, future growth is forecasted at marginal rates, and the proposed Land Use Plan shows a preference for recentralization to accommodate the growth. As such, the Camden County Highway Plan also includes a far-reaching, county-wide, Smart Growth operational recommendation: to implement an interconnected traffic signal system and Traffic Operations Center to monitor and actively manage traffic throughout the county route network. This improvement will have the farthest-reaching transportation benefit—serving more than one million vehicle trips per day—with the least impact on the adjacent environment. The priority network for implementing the recommendation includes the county’s principal highways and county route segments that are included in the region’s Incident Management Highway Network ($30 million for approximately 200 signalized intersections). Institutional agreements need to be formalized before the plan proceeds. The Camden County Shared Services Department will manage, monitor, and maintain the system comprised of traffic signals owned by the municipalities.
Camden County owns and maintains an extensive and hardworking highway system that serves local needs and national interests. The recommendations identified through the Highway Plan’s analyses, coupled with recommendations from detailed studies performed over the past decade, will attend to the foreseen needs of its transportation system. Vigilance on the part of the county planning staff, and support from its planning partners and the wider community, will be required to implement the long-term vision. Daily practices performed by county staff during the land development application, review, and approval process can help preserve and optimize the county route network on an incremental basis. These include requiring properly designed access points to the network and providing interconnected roadways through adjacent subdivisions (via the county’s Subdivision and Site Plan Procedures and Land Development Regulations), and integrating all modes of travel into the design of its streets and highways (through the provisions of the county’s Complete Streets Policy).
Page 2

Camden County Highway Plan
Chapter 1: INTRODUCTION
Camden County is situated in southern New Jersey, within the Greater Philadelphia metropolitan area (Figure 1). The county contains a diverse development pattern and a full range of transportation options to serve the movement of its residents and products. Marginal growth in population and employment is foreseen in the county.
Presently, the county is taking steps to update its comprehensive Master Plan.1 The Master Plan will contain the vision and provide the authority for managing the change that will come. The county commissioned DVRPC to prepare the Highway Plan element of its overall Master Plan. The Highway Plan sets the direction for highway infrastructure—particularly the county route network—to keep pace with the change.
Importantly, DVRPC staff assessed traffic safety and performed travel demand modeling for the 401-mile-long county route network concurrently with the development of the county’s Land Use Plan. Consequently, the long-term effect of planned growth was assessed. Transportation improvements were subsequently identified to accommodate the growth in a safe, efficient, and sustainable manner. The highway planning work also considered findings contained in the Bicycling & Multi-Use Trails Plan, and the Farmland Preservation Plan elements of the overall Master Plan.
The Highway Plan project also produced a linked GIS-Transportation Asset Management Database for county staff‘s use. The tool can be used to centralize and streamline maintenance and project development activities for the county route system and the inventory of county bridges (155). Physical attributes of the county route network and county-owned bridges were loaded into the database, as were relevant outputs from this study.
1 The Camden County Master Plan Update is being prepared by the Camden County Division of Planning with the assistance of Group Melvin Design. The update is being coordinated with the public at large, the business community, and other stakeholder groups, and with elected officials throughout the county.
Figure 1: County Setting
DVRPC, 2015
Page 3

Camden County Highway Plan
WORK PROGRAM The following tasks were performed for the Camden County Highway Plan project.
1. Work with county planning staff, and their representatives, to fulfill the project requirements.
2. Establish a linked GIS-database management framework to inventory and track transportation assets (roads, bridges, and traffic signals) along the county route network. Load the database with attributes and performance data available from the county, the New Jersey Department of Transportation, and DVRPC.
3. Prepare DVRPC’s regional travel demand forecasting model for the 2011 Base Yearexisting transportation conditions in the county.
4. Prepare and conduct the Year 2040 Long-Range Plan scenario travel demand forecasting model reflecting the land use assumptions and transportation recommendations of CONNECTIONS 2040, DVRPC’s endorsed Long-Range Plan for Greater Philadelphia.
5. Prepare and conduct the Year 2040 Master Plan scenario travel demand forecasting model reflecting the land use assumptions of the Camden County Land Use Plan.
6. Evaluate 2011 Base Year, Year 2040 Long-Range Plan, and Year 2040 Master Plan modeled traffic volumes in accordance with the methodology of the region’s mandated Congestion Management Process.
7. Identify transportation projects and land use and community planning strategies to address deficiencies.
8. Develop an endorsed set of recommendations for the county route network that is consistent with existing plans and programs in the region, previous studies performed in the county, and with the other elements of the updated Master Plan.
9. Provide a county route improvement program, including a high-level environmental assessment, cost estimates, and implementation guide for recommended physical infrastructure improvements.
10. Incorporate applicable study data and report recommendations into the linked GIS-asset management database for the county route network and bridge inventory.
11. Provide a report summarizing the project.
THE REPORT This report summarizes the undertakings and findings of the work program. An overview of the remaining chapters of the report follows.
Chapter 2 – The Setting Chapter 3 – Existing Transportation Systems Chapter 4 – Growth and Development Chapter 5 – Travel Demand Forecast Modeling Chapter 6 – Assessment of Traffic Conditions Chapter 7 – Recommended Improvement Program Chapter 8 – Conclusion
Appendices – A. Camden County Highway Inventory B. Camden County Bridge Inventory C. Other Traffic and Transportation Studies, and Recommendations for the Camden County Master
Plan D. Environmental Screening of Physical Improvements
Page 4

Camden County Highway Plan
Chapter 2: THE SETTING
Camden County’s northern boundary is situated along the Delaware River, across from the City of Philadelphia, Pennsylvania. Surrounding New Jersey counties are Burlington County (east), Atlantic County (south), and Gloucester County (west). A robust transportation system exists to serve interactions across these boundaries.
The county covers approximately 227 square miles and includes 37 municipalities. Figure 2 (page 6) illustrates the county’s land use cover in 2010. Generalized patterns of development include:
The Riverfront – Extending outward from the Delaware River to US 130. Includes the City of Camden and older urban mixed-industrial and residential neighborhoods.
First Generation Suburbs – Extending from US 130 to the I-295/NJ Turnpike corridor. Includes mature suburban residential communities.
Post-World War II Suburbs – Extending to the county’s southern and eastern boundaries from the I-295/NJ Turnpike corridor. Modern subdivisions, built on former agricultural lands, are typical here.
The Pinelands National Reserve – At the southern edge of the county and spreading into Burlington, Atlantic, and Gloucester counties. Here, regulations of the New Jersey State Pinelands Commission deflect modern development pressures to preserve unique natural and cultural resources.
PERSPECTIVES ON GROWTH, DEVELOPMENT, AND TRAVEL Over the past 40 years, 15 percent of the county’s land area has been transformed from agricultural use or undeveloped area to more active uses (Figure 3). Total population has risen by 13 percent, while total vehicle ownership has risen by 72 percent.
Figure 3: Land Use Change 1970 – 2010
DVRPC, 2015
Dispersed land development patterns and rises in service-sector employment have changed travel patterns and demands. A greater reliance on private automobiles for transportation and an increased use of county routes have been consequences.
In 2010 there were almost 513,700 residents (Table 1, page 7).2 In the same year, slightly more than 263,400 jobs were offered within the county (Table 1, page 7). 3 The City of Camden and Cherry Hill and Gloucester townships were the county’s most populous municipalities. Employment was highest in Cherry Hill Township and in the City of Camden.
2 Source: 2010 US Census 3 Source: Delaware Valley Regional Planning Commission, September 2012. Base employment data from the National Establishments Time Series (NETS) database, 2010.
Page 5

Camden County Highway Plan
Figure 2: 2010 Land Use
DVRPC, 2015
Page 6

Camden County Highway Plan
Table 1: Population and Employment (2010 and 2040)
Sources: 2010 Population – 2010 US Census; 2010 Employment – DVRPC, September 2012, base employment data from the National Establishments Time Series (NETS) database, 2010; 2040 Population and Employment – CONNECTIONS2040, DVRPC, September 2013.
DVRPC, 2015
Page 7

Camden County Highway Plan
According to the 2010 US Census,4 53 percent of the county’s 231,800 employed residents worked within the county. The rest of its employed residents commuted to:
Burlington County, NJ – 15% Philadelphia County, PA – 13% Gloucester County, NJ – 8% Atlantic County, NJ – 2% Elsewhere – 8%
Figure 4: Commuting Patterns
DVRPC, 2015
4 Source: 2010 US Census’ Census Transportation Planning Package (CTPP)
Commuting in Camden County was overwhelmingly performed by private motorized vehicles (75 percent drove alone or used motorcycles, and 11 percent carpooled in private cars, trucks, and vans). Public transportation services carried just eight percent of the county’s residents to work.
Figure 5: Means of Transportation to Work
DVRPC, 2015
In contrast to the overall situation, 30 percent of Philadelphia County-bound work trips were primarily accomplished via public transportation modes, and 59 percent of the commuters drove alone.
38% to adjacent counties
Page 8
75%
11%
8%
3% 2%
1% Drive Alone andMotorcycle
Carpool
Public Transportation
Work at Home
Walk and Bike
Taxi and Other

Camden County Highway Plan
Chapter 3: EXISTING TRANSPORTATION SYSTEMS
The county benefits from Delaware River waterfront access. Land-side mobility is supported via a regional transportation system (Figure 6, page 10) that includes freight railroads, interstate and authority (toll) expressways, and intercity and regional-rail passenger services. Four bridges link the county with the City of Philadelphia. The county also has the advantage of one public-use, general aviation airport.
Port Facilities – six along the Delaware River.
Rail Freight Systems – owned and operated by Conrail.
Interstate and Authority (toll) Expressways – I-76, I-295, and I-676 (owned and operated by the New Jersey Department of Transportation); the New Jersey Turnpike (owned and operated by the New Jersey Turnpike Authority); and the Atlantic City Expressway (owned and operated by the South Jersey Transportation Authority).
Principal Arterial Highways – US 30, US 130, NJ 38, NJ 41, NJ 42, NJ 70, NJ 73, NJ 154, and NJ 168 (owned and maintained by the New Jersey Department of Transportation); and County Routes 534, 544, 561, 605, 644, and 689 (owned and operated by Camden County).
Passenger Rail Systems – NJTransit’s Atlantic City Rail Line and RiverLINE; and the PATCO Hi-Speed Line, owned and operated by the Delaware River Port Authority.
Passenger and Freight Intermodal Facilities – a variety of hubs where multiple transportation modes meet and significant volumes of people and goods transfer between them.
Bridges – the Walt Whitman (I-76), the Ben Franklin (I-676), and the Betsy Ross (NJ 90) bridges (owned and operated by the Delaware River Port Authority), and the Delair Bridge (owned and operated by Conrail).
Airport – the Camden County Airport, in Winslow Township (owned and operated by Albion Airport, Inc.).
COUNTY ROUTES Camden County owns and maintains 179 county routes and 155 bridges. The 401-mile long highway network, complemented by highways maintained by the New Jersey Department of Transportation and local municipal streets and roads, provides land-side access. The county route network (Figure 7, page 11) is aligned in a hierarchical manner; 500-series routes are the highest order highways, followed by 600- and 700-series routes. The 500-series highways are the longest, traverse multiple counties, and typically serve the highest volume of traffic. Selected attributes of the county’s highways and bridges are contained in Appendix A and Appendix B, respectively.
Some county routes, along with state and toll highways, are components of the National Highway System.5 These include:
– County Route 534 – Blackwood-Clementon Road,
– County Route 544 – Evesham Road,
– County Route 561 – Haddonfield-Berlin Road,
– County Route 605 – Ephraim Avenue,
– County Route 644 – Grove Street/Haddonfield Road, and
– County Route 689 – Berlin-Cross Keys Road.
Mass transit services are also part of the county’s fabric (Figure 8, page 12). Three passenger rail lines, 20 train stations, and 33 NJTransit bus routes serve the county’s population and support its activity centers. The county route network supplies direct access to many of the transit stations and carries many of the bus routes.
The Ferry Avenue PATCO Station, a regionally significant public transit station, is served by Camden County Routes 561, 603, and 606. (Photo: DVRPC)
5 The National Highway System is comprised of highways and intermodal facilities. The interconnected network serves the nation’s security and defense, and aims to enhance personal mobility and increase the nation’s competitiveness. The network is approved by the Federal Highway Administration.
Page 9

Camden County Highway Plan
Figure 6: Regional Transportation Facilities
DVRPC, 2015
Page 10

Camden County Highway Plan
Figure 7: The County Route Network
DVRPC, 2015
Page 11

Camden County Highway Plan
Figure 8: Mass Transit Services
DVRPC, 2015
Page 12

Camden County Highway Plan
The described transportation facilities and services are available and relied upon on a daily basis. According to the Federal Highway Administration, on any given day, approximately 60 percent of the traffic congestion in major urban areas, like the Philadelphia metropolitan area, is due to temporary or nonrecurring conditions, such as disabled vehicles, crashes, maintenance and construction activity, or adverse weather. In these situations, conventional transportation improvement strategies, such as increasing highway capacity or providing alternative transportation options, are not justified. Instead, transportation operations strategies are more appropriate, targeted to a system of interstate and arterial highways in the region, as is shown on Figure 9 and was developed for the regional Transportation Operations Master Plan.
Figure 9: Intelligent Transportation Systems Infrastructure Vision
DVRPC, 2009
Some county route segments serve as official detour routes for the region’s major highway network (shown). As such, they are also components of the DVRPC vision for Intelligent Transportation Systems (ITS) infrastructure deployment.
Combinations of strategies are utilized to address nonrecurring congestion. Traffic operations strategies include technology, planning, preparedness, and interagency and multijurisdictional coordination.6 Of these, technology is the backbone. Computers, surveillance and communications equipment, and electronic control systems are employed to detect, and flexibly respond to and mitigate the problem. Portions of the county route network are recognized as official detour and evacuation routes to support the regional highway system during emergencies (Figure 10, page 14). They should be properly integrated and equipped to do so.
A robust transportation system serves the county. It is the highway network, and particularly county highways, that is the focus of this project, and the subject of most of this report’s content.
6 Source: Transportation Operations Master Plan, DVRPC July 2009, Publication No. 09049
Page 13

Camden County Highway Plan
Figure 10: Incident Management Highway Network (IMHN)
DVRPC, 2015
Page 14

Camden County Highway Plan
CURRENT TRAFFIC DEMAND Current annual average daily traffic (AADT) volumes were determined from historical traffic counts contained in the DVRPC traffic counts database (2008 through 2012) and from counts conducted for this study in early 2013. The average date of all the traffic count data is 2011—defining the study’s baseline year for current conditions. Figure 11 (on page 16) indicates ranges of AADTs on the highway network in the county.
Traffic count data is useful for general information, and for modeling and analyses.7 A review of current count data indicates:
– 500-series county routes carry an average of approximately 11,000 vehicles per day,
– 600-series county routes carry an average of approximately 9,000 vehicles per day, and
– 700-series county routes carry an average of approximately 6,000 vehicles per day.
CURRENT IMPROVEMENT PROPOSALS Studies, plans, and improvement programs have already been advanced to maintain the transportation infrastructure, remedy existing deficiencies, and manage growth.
Highway Safety Improvement Program (Figure 12, page 17) – A competitive, federally funded, annual initiative8 to build quick-fix safety improvements that will
reduce the frequency or severity of crashes at pre-identified (eligible) locations.
New Jersey Transportation Improvement Program for FY 2014 to FY 2017 (Figure 13, page 18) – New Roadway Capacity – I-295/NJ 42, Add missing moves at interchange; I-295/NJ 42/I-76,
Construct Direct Connection; Camden Waterfront Roads, Extend Riverside Drive and Cooper Street.
– Intersection/Interchange Improvements – I-295/NJ 168, Improve interchange.
– Traffic Calming/Streetscape Improvements – County Route 543 (River Road) from State Street in the City of Camden to Sherman Avenue in Pennsauken Township.
– Transit – Construct and serve the Pennsauken Transit Center, Pennsauken Township.9
DVRPC’s YEAR 2040 Long-Range Plan (Figure 13, page 18) – Highway – Widen the Atlantic City Expressway; NJ 70, Implement operational and safety
improvements.
– Transit – Construct the Gloucester-Camden Line (GCL) passenger rail line (operation anticipated after 2040); Construct and operate the South Jersey Bus Rapid Transit (BRT) service along the Atlantic City Expressway/NJ 55, NJ 42, I-76, and I-676; Rehabilitate the Atlantic City Rail Line’s Cherry Hill, Lindenwold, and Atco stations.
7 Current-year traffic volumes were added as a field in the Camden County Transportation Asset Management database. 8 Funds provided through the current federal surface transportation funding bill, Moving Ahead for Progress in the 21st Century (MAP-21). 9 The Pennsauken Transit Center was opened for service on October 14, 2013.
Opened in 2010, the College Drive (County Route 673) interchange with the North-South Freeway (NJ 42) is also planned to serve a park-and-ride lot when the South Jersey BRT project is operational. (Aerial imagery: NJDOT 2012)
The Highway Safety Improvement Program provides a funding opportunity for a broad selection of safety-deficient county route locations. Camden County is submitting projects for participation. Just one capital project for the county route network is included in the Transportation Improvement Program and the Long-Range Plan—a traffic calming improvement along County Route 543 (River Road) through the City of Camden’s Cramer Hill neighborhood.
Page 15

Camden County Highway Plan
Figure 11: Current Annual Average Daily Traffic Volumes (AADT)
DVRPC, 2015
Page 16

Camden County Highway Plan
Figure 12: Highway Safety Improvement Program (HSIP)
DVRPC, 2015
Page 17

Camden County Highway Plan
Figure 13: Regional Transportation Improvement Projects on TIP and LRP
DVRPC, 2015
Page 18
Camden County Highway Plan
Chapter 4: GROWTH AND DEVELOPMENT
The Master Plan will provide the authority for directing and managing change in the county. Procedures, tools, and principles supporting DVRPC’s long-range planning process have been employed—in coordination with the development of the county’s Land Use Plan—to forecast the future and assess and chart the course for the Highway Plan.
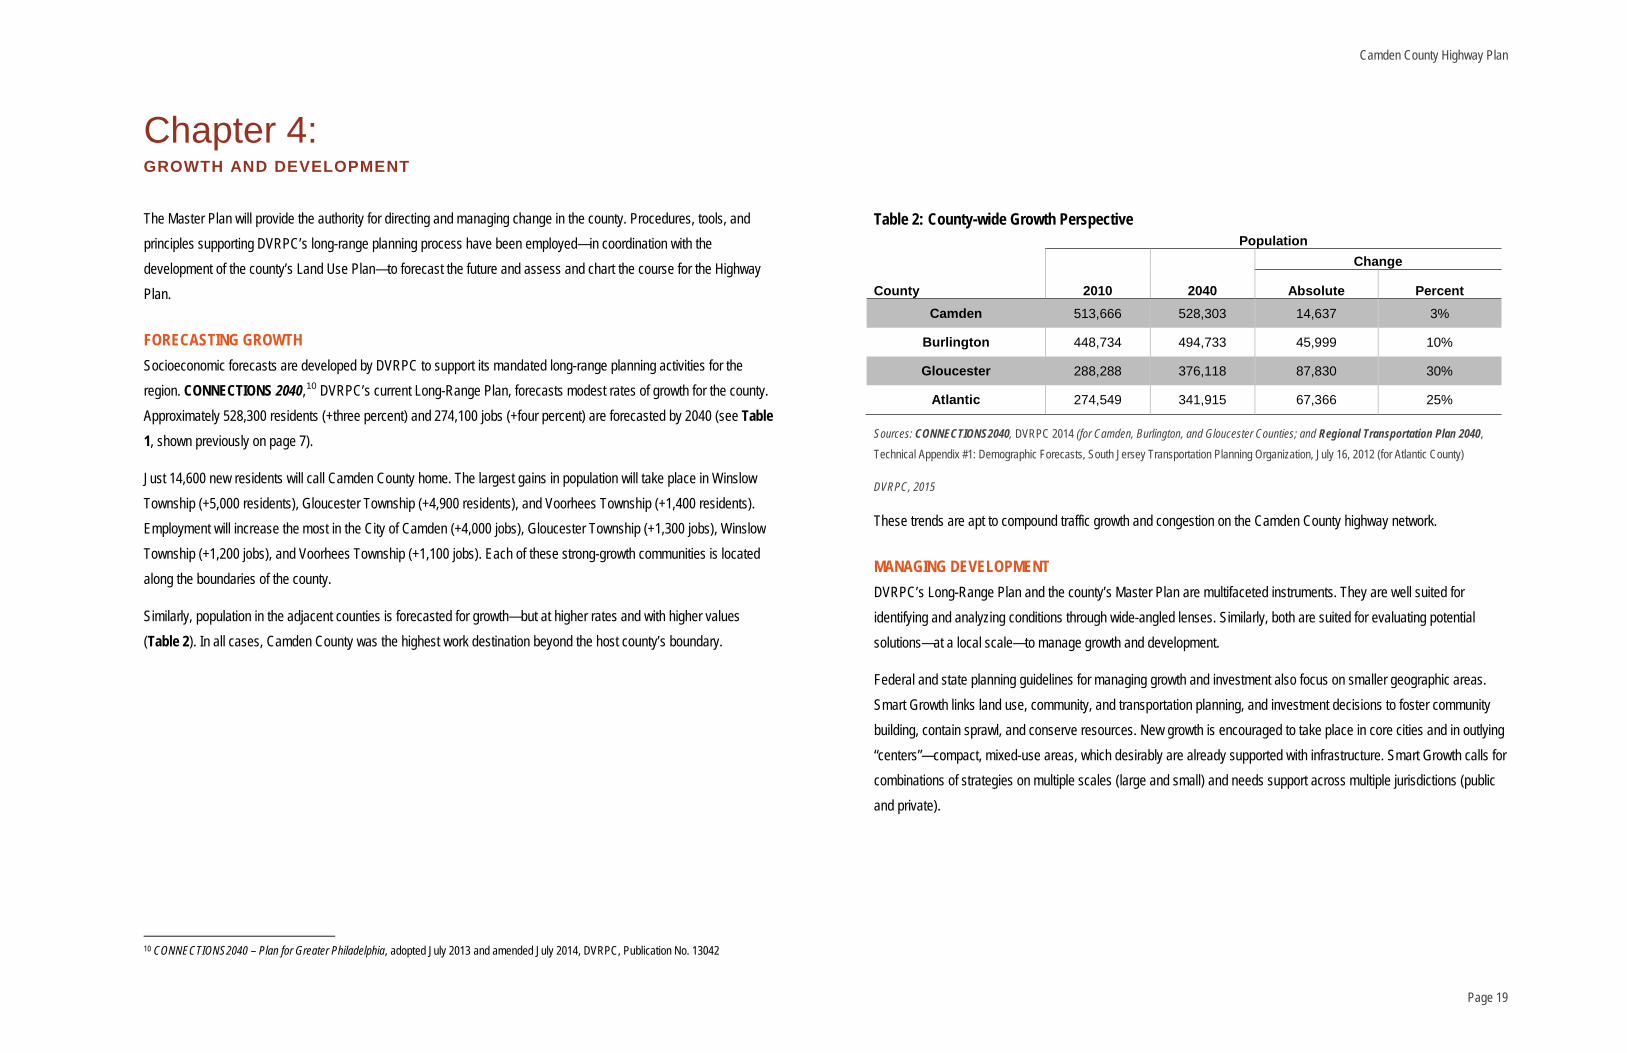
FORECASTING GROWTH Socioeconomic forecasts are developed by DVRPC to support its mandated long-range planning activities for the region. CONNECTIONS 2040,10 DVRPC’s current Long-Range Plan, forecasts modest rates of growth for the county. Approximately 528,300 residents (+three percent) and 274,100 jobs (+four percent) are forecasted by 2040 (see Table 1, shown previously on page 7).
Just 14,600 new residents will call Camden County home. The largest gains in population will take place in Winslow Township (+5,000 residents), Gloucester Township (+4,900 residents), and Voorhees Township (+1,400 residents). Employment will increase the most in the City of Camden (+4,000 jobs), Gloucester Township (+1,300 jobs), Winslow Township (+1,200 jobs), and Voorhees Township (+1,100 jobs). Each of these strong-growth communities is located along the boundaries of the county.
Similarly, population in the adjacent counties is forecasted for growth—but at higher rates and with higher values (Table 2). In all cases, Camden County was the highest work destination beyond the host county’s boundary.
10 CONNECTIONS2040 – Plan for Greater Philadelphia, adopted July 2013 and amended July 2014, DVRPC, Publication No. 13042
Table 2: County-wide Growth Perspective
Population
2010 2040
Change
County Absolute Percent Camden 513,666 528,303 14,637 3%
Burlington 448,734 494,733 45,999 10%
Gloucester 288,288 376,118 87,830 30%
Atlantic 274,549 341,915 67,366 25%
Sources: CONNECTIONS2040, DVRPC 2014 (for Camden, Burlington, and Gloucester Counties; and Regional Transportation Plan 2040, Technical Appendix #1: Demographic Forecasts, South Jersey Transportation Planning Organization, July 16, 2012 (for Atlantic County)
DVRPC, 2015
These trends are apt to compound traffic growth and congestion on the Camden County highway network.
MANAGING DEVELOPMENT DVRPC’s Long-Range Plan and the county’s Master Plan are multifaceted instruments. They are well suited for identifying and analyzing conditions through wide-angled lenses. Similarly, both are suited for evaluating potential solutions—at a local scale—to manage growth and development.
Federal and state planning guidelines for managing growth and investment also focus on smaller geographic areas. Smart Growth links land use, community, and transportation planning, and investment decisions to foster community building, contain sprawl, and conserve resources. New growth is encouraged to take place in core cities and in outlying “centers”—compact, mixed-use areas, which desirably are already supported with infrastructure. Smart Growth calls for combinations of strategies on multiple scales (large and small) and needs support across multiple jurisdictions (public and private).
Page 19
Camden County Highway Plan
Centers The City of Philadelphia is the region’s core; the county’s is the City of Camden. Eleven other centers, in or adjacent to the county, are identified in the DVRPC Long-Range Plan as focal points for regional Smart Growth planning:
Metropolitan Subcenters – Cherry Hill/Mount Laurel/Marlton (shared with Burlington County), encompassing the lands surrounding NJ 70, NJ 73, I-295, and the New Jersey Turnpike.
Suburban Centers – Deptford (Gloucester County), encompassing the area surrounding the NJ 42 and NJ 55 interchange.
Town Centers – Collingswood, Gloucester City, Haddonfield, Haddon Heights, Merchantville, and Westmont; traditional business districts along community arterial highways, integrated with the surrounding community, and surrounding PATCO Hi-Speed Line stations.
Planned Town Centers – Voorhees/Lindenwold, The Town Center at Haddon in Haddon Township, Haddon Avenue Transit Village in the City of Camden, and Town Place at Garden State Park in Cherry Hill Township; new, neotraditional developments.
Neighborhood Centers – Fairview and Parkside; embedded neighborhoods, both within the City of Camden.
In developing its updated Land Use Plan, Camden County performed visioning exercises and conducted public opinion surveys to determine what the county should look like in 2040. Survey results indicated preferences for development in distressed areas in need of reinvestment, the City of Camden, and in locations where infrastructure is present to accommodate growth. Following the survey, the county and its consultants analyzed aerial photography to draw and estimate their land use vision.
Subsequently, locally important areas or community hubs were identified as targets for revitalization and reinvestment planning, including:
Lanning Square and Cooper Plaza neighborhoods adjacent to Downtown Camden,
The lands surrounding the Pennsauken Transit Center in Pennsauken Township,
The lands surrounding the US 130, NJ 73, NJ 90, and County Route 644 interchange in Pennsauken Township, and
Residential areas and commercial districts near the Ferry Avenue, Collingswood, Westmont, Haddonfield, Woodcrest, Ashland, and Lindenwold stations on the PATCO Hi-Speed Line.
The complete set of regionally significant and locally important Land Use Centers, guiding Smart Growth in Camden County, was central to the work conducted in this project. They are identified in many of the figures throughout this plan.
The county’s visioning work was accomplished within the general structure of the DVRPC regional plan. In spirit, the centered-development concepts of the county and the region are the same. So are many of the targeted growth areas. Thus, the authority vested in the new Master Plan will direct future investments where they are needed most, be aligned with local objectives, and be consistent with the region’s Long-Range Plan.
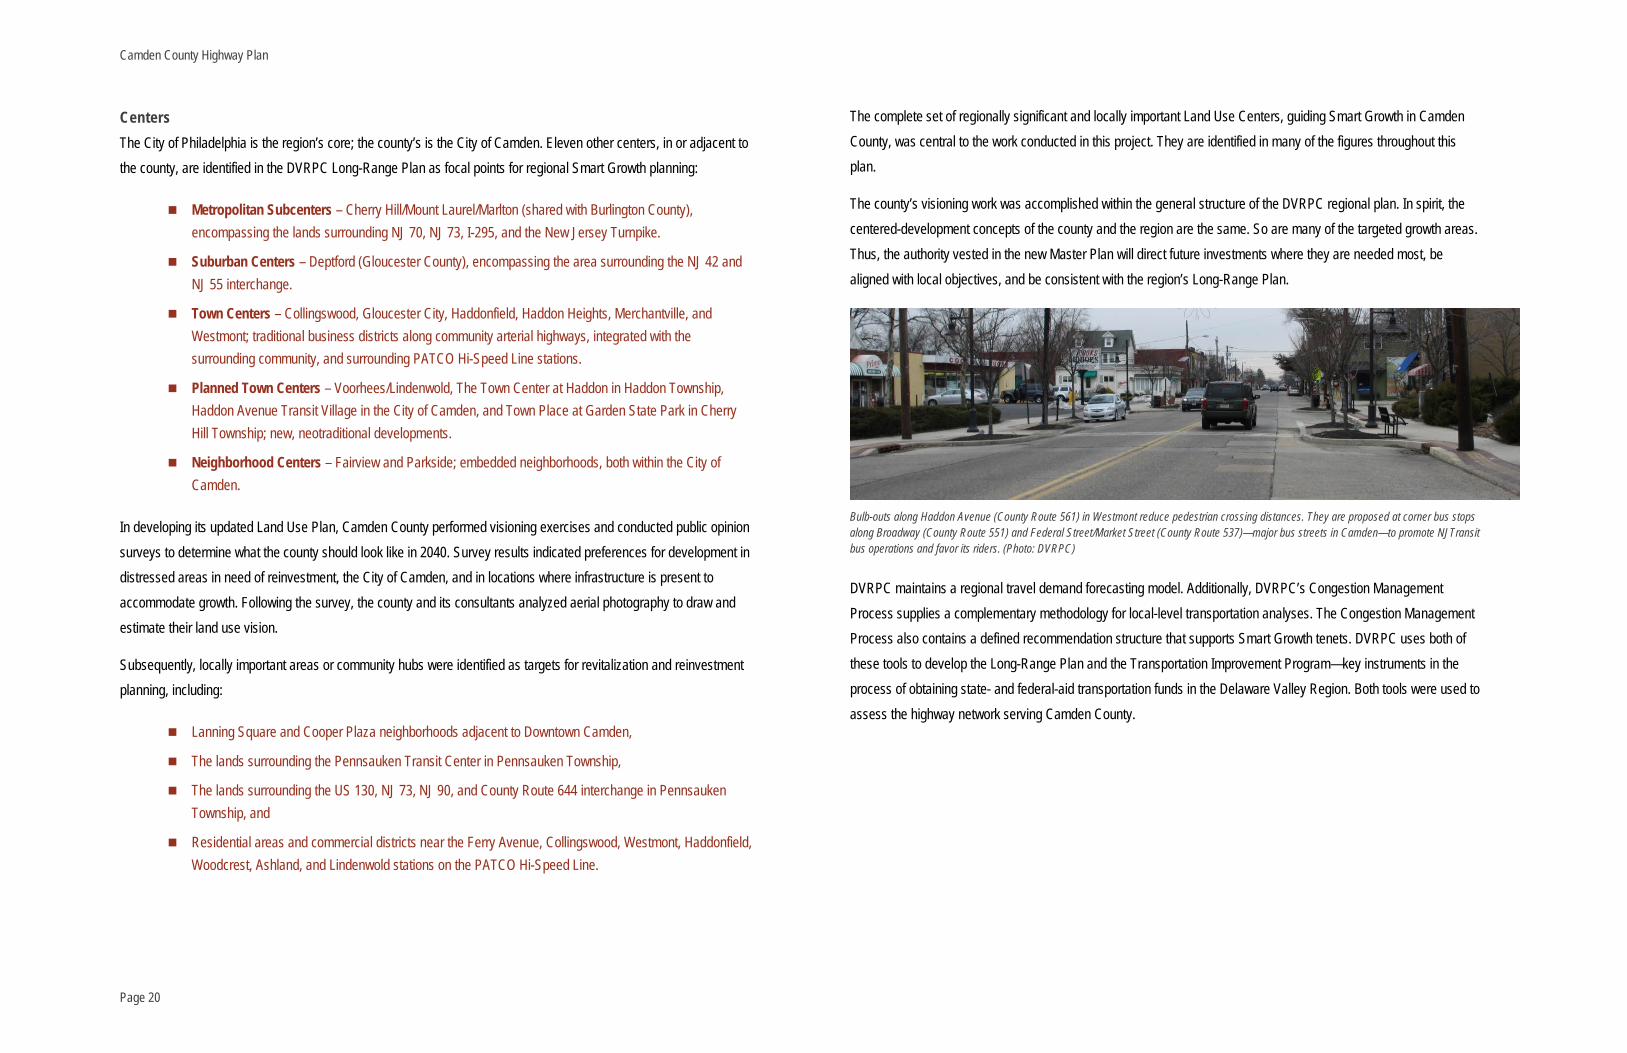
Bulb-outs along Haddon Avenue (County Route 561) in Westmont reduce pedestrian crossing distances. They are proposed at corner bus stops along Broadway (County Route 551) and Federal Street/Market Street (County Route 537)—major bus streets in Camden—to promote NJTransit bus operations and favor its riders. (Photo: DVRPC)
DVRPC maintains a regional travel demand forecasting model. Additionally, DVRPC’s Congestion Management Process supplies a complementary methodology for local-level transportation analyses. The Congestion Management Process also contains a defined recommendation structure that supports Smart Growth tenets. DVRPC uses both of these tools to develop the Long-Range Plan and the Transportation Improvement Program—key instruments in the process of obtaining state- and federal-aid transportation funds in the Delaware Valley Region. Both tools were used to assess the highway network serving Camden County.
Page 20

Camden County Highway Plan
Chapter 5: TRAVEL DEMAND FORECAST MODELING
Travel demand forecasting was performed expressly for this project. The work supplied direct outputs for measuring the effectiveness of the highway system serving the county. The modeling work also supplied inputs to DVRPC’s holistic evaluation procedure supporting the Congestion Management Process.
TRAVEL SIMULATION DVRPC maintains a computer-based highway and public transportation travel simulation model that replicates highways and public transit services throughout the region. It can be used to understand or estimate travel behavior and travel data for differing transportation networks, demographic conditions, and time periods. In turn, the model can be used to locate problem areas, identify future trends and travel conditions, and consider alternative improvement strategies to address existing and emerging problems.
For this project, the regional model was employed to determine and assess traffic mobility conditions on the county’s highway network and along state- and authority-owned highways. The following highway systems are included in the modeled network:
– National Highway System highways and connectors,
– Other arterial and collector highways – state ownership, and
– County route network – generally: county routes greater than one mile in length; or where shorter: county routes that have interchanges with higher-order highways, provide access to county parklands, or have been identified as County Route “Turnback” candidates (i.e., candidates for transfer of ownership—from the county to the municipality).
Ultimately, 99 unique county highway facilities satisfying minimum thresholds for length and connectivity, comprising 90 percent of the county route system’s overall mileage, were included in the calibrated model. The four bridges to Philadelphia, and selected points on the expressway and state-owned principal arterial highway systems were included for calibration and use as monitoring points alongside the assessment of the county route network.
Multiple simulations were conducted and analyzed. Three are reported in depth: the 2011 Base Year scenario, to establish baseline conditions; a 2040 Long-Range Plan scenario, which is based on forecasted demographic changes and infrastructure investment as stated in the region’s Long-Range Plan; and, finally, a 2040 Master Plan scenario, which included the land use vision of the county planners and their consultants. Each scenario is described on the following pages.
DVRPC utilizes PTV AG’s VISUM software package for travel demand modeling. The model is a four-step model. Figure 14 provides a schematic representation of the four-step process. The model network (highways, rails, transit routes, etc.) is defined as the Travel Improvement Model (version 2.0), which was constructed using Open Street Map and Google’s General Transit Feed Specification.
Figure 14: Schematic Diagram of Travel Demand Forecasting
DVRPC, 2015
Page 21

Camden County Highway Plan
After the model generates trips and distributes them across the network, the model splits the trips to either highway or transit based on numerous factors that are built into the model. This is referred to as mode or modal split. For this project, the transit networks were used only for their utility in the mode split process—to ensure that the proper proportion of trips were assigned to the highway assignment model. Only the results from the highway assignment model were assessed in this project.
Volume-to-capacity (V/C) ratios were used as a key planning indicator. Volume (V) corresponds with number of vehicles during the peak hour, and capacity (C) is defined as the theoretical maximum number of vehicles that can travel along a link in one hour. The maximum volume-to-capacity ratio equals 1.00. Beyond 1.00, breakdown and unstable and unpredictable traffic operations are to be expected. Therefore, a volume-to-capacity ratio threshold equaling or exceeding 0.85, consistent with the Congestion Management Process, was used as a planning indicator of a roadway segment’s approach to capacity and degree of congestion.
2011 BASE-YEAR MODEL PREPARATION Traffic forecasting required a focused network for Camden County. By “focusing” DVRPC’s regional travel demand model, enhancements are accomplished within a detailed study area, while a regional level of detail is maintained elsewhere. Focusing supplies a finer analytical grain in the detailed study area’s transportation analysis zone structure and a denser highway network to support it, and yields greater accuracy in the highway assignment in the focused study area.
Focusing the model for this project required:
– Adding county routes not represented in the regional model;
– Identifying locally owned roads that impact the county’s highway system, and adding them to the model where important;
– Ensuring that lane configurations and turn restrictions were accurate; and
– Reassigning where trips enter and exit the highway network to better reflect demographic realities.
Following preparation, the model was executed. Traffic assignments for nearly 600 monitoring points on county roads and significant non-county roads were compared with actual ground counts for reasonableness and accuracy. Where necessary, adjustments to the modeled network were performed and the model re-run to calibrate the detailed study area highway network to a “current” average daily traffic volume condition in 2011.
2011 BASE-YEAR MODEL PERFORMANCE Figure 15 illustrates results from the final calibration of the 2011 modeled network for Camden County.
Figure 15: 2011 Model Calibration Results
DVRPC, 2015
Consistent with similar applications of the travel demand forecasting model, the overall calibration goal was to realize model results within 15 percent of counted volumes. This goal was achieved.
Page 22
Camden County Highway Plan
2040 MODEL PREPARATION Future-year travel testing was performed iteratively and sequentially for two 2040 travel models: the Long-Range Plan scenario and the Master Plan scenario.
2040 LONG-RANGE PLAN SCENARIO In the Year 2040 Long-Range Plan scenario, DVRPC’s official 2040 municipal population and employment forecasts were added to the focused model to reflect the planning horizon’s growth and development. An approximate gain of 15,000 people and 11,000 jobs are forecasted in the county. Transportation improvements were also added to the base network corresponding with all mobility projects constructed in the county since September 2011, and the programmed (Transportation Improvement Program) and planned (Long-Range Plan) projects throughout the region that will be operational by 2040. Figure 13 (shown earlier, on page 18) displays the major projects within the county.
Following preparation, the 2040 Long-Range Plan scenario model was executed—translating the additional residents and jobs into revised travel demand and trips on the transportation network.
2040 MASTER PLAN SCENARIO This scenario builds upon DVRPC’s official 2040 Long-Range Plan scenario model.
Camden County and its consultant, Group Melvin Design, developed independent population and employment forecasts for its preferred set of locally important development centers as part of its Land Use Plan update. The revised projections take a different approach than the DVRPC projection methodology. In the Land Use Plan exercise, the community vision estimates what growth should look like, rather than predicting what the future is forecasted to look like based on past trends.
The resulting population (+7,100 residents) and employment (+1,400 jobs) estimates were then added to DVRPC’s official 2040 population and employment forecasts to produce the revised socioeconomic inputs for trip generation and assignment. All transportation improvements corresponding with the 2040 Long-Range Plan model were maintained. Following preparation, a preliminary 2040 Master Plan travel model was executed.
FINDINGS AND CONCLUSIONS Travel demand forecast modeling supplies the ability to aggregate network-wide performance statistics to assess county-wide travel trends. By way of comparison, 2040 modeled traffic volumes are on the order of six to seven percent higher than the 2011 model’s output.
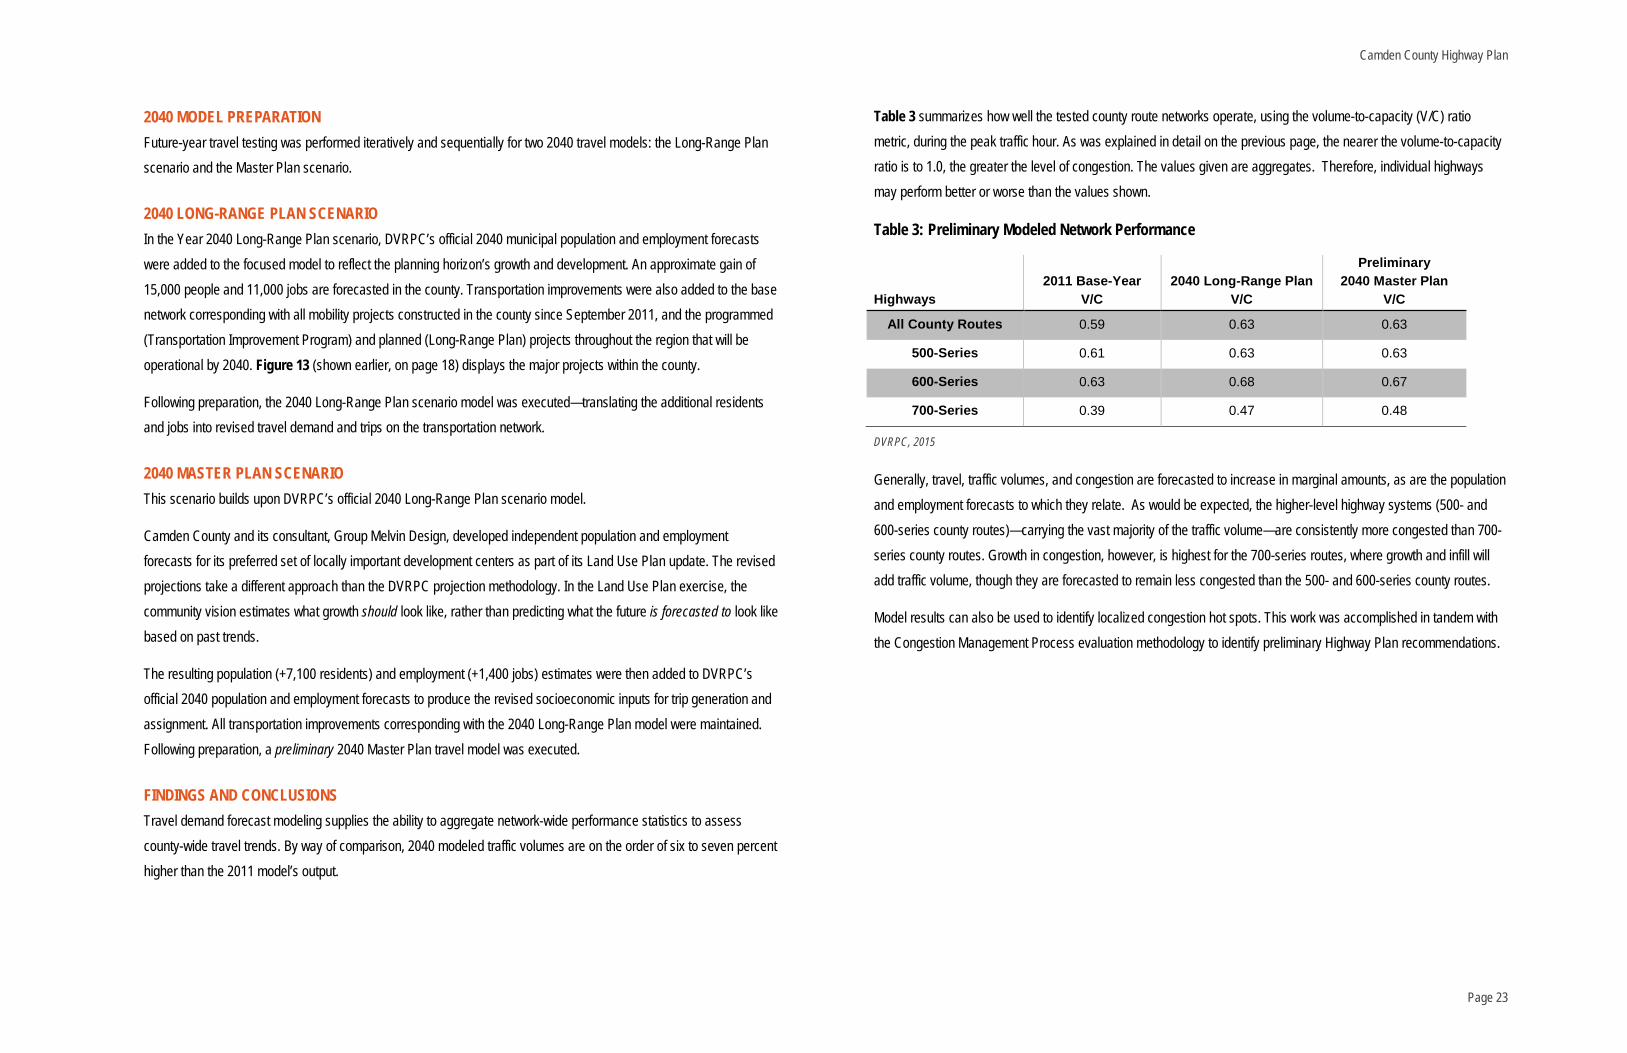
Table 3 summarizes how well the tested county route networks operate, using the volume-to-capacity (V/C) ratio metric, during the peak traffic hour. As was explained in detail on the previous page, the nearer the volume-to-capacity ratio is to 1.0, the greater the level of congestion. The values given are aggregates. Therefore, individual highways may perform better or worse than the values shown.
Table 3: Preliminary Modeled Network Performance
Highways
2011 Base-Year
V/C
2040 Long-Range Plan
V/C
Preliminary 2040 Master Plan
V/C
All County Routes 0.59 0.63 0.63
500-Series 0.61 0.63 0.63
600-Series 0.63 0.68 0.67
700-Series 0.39 0.47 0.48
DVRPC, 2015
Generally, travel, traffic volumes, and congestion are forecasted to increase in marginal amounts, as are the population and employment forecasts to which they relate. As would be expected, the higher-level highway systems (500- and 600-series county routes)—carrying the vast majority of the traffic volume—are consistently more congested than 700-series county routes. Growth in congestion, however, is highest for the 700-series routes, where growth and infill will add traffic volume, though they are forecasted to remain less congested than the 500- and 600-series county routes.
Model results can also be used to identify localized congestion hot spots. This work was accomplished in tandem with the Congestion Management Process evaluation methodology to identify preliminary Highway Plan recommendations.
Page 23


Camden County Highway Plan
Chapter 6: ASSESSMENT OF TRAFFIC CONDITIONS
Assessment of the highway system serving Camden County was performed in conformance with the methodologies contained in the DVRPC Congestion Management Process.11 The Congestion Management Process is required in air-quality nonattainment areas and is a mandated step in the process of obtaining state- and federal-aid transportation improvement funds. The Congestion Management Process identifies strategies and actions to reduce (first), manage (second), or accommodate (last) single-occupant vehicular travel.
THE CONGESTION MANAGEMENT PROCESS The Congestion Management Process evaluation methodology was used to screen conditions on all state-, authority- and county-owned and maintained highways within Camden County. The Congestion Management Process’s analytical framework is established in broad, overlapping travel corridors throughout the region. Camden County’s Congestion Management Process framework is represented in the following eight corridors (Figure 16, page 26):
1. NJ Corridor #2 – I-295, New Jersey Turnpike (S);
2. NJ Corridor #3 – Atlantic City Expressway/NJ 42;
3. NJ Corridor #5 – US 30;
4. NJ Corridor #6 – US 130;
5. NJ Corridor #10 – NJ 38;
6. NJ Corridor #11 – NJ 41, NJ 47, NJ 55;
7. NJ Corridor #12 – NJ 70; and
8. NJ Corridor #13 – NJ 73.
General improvement strategies are defined for subcorridors within them. Related subcorridor areas are shown on Figure 16a and Figure 16b (pages 27 and 28, respectively)
Within the analytical framework, existing and future transportation and land use characteristics are assessed via a systematic application of evaluation criteria. Individual criteria (listed next) are weighted and summed into a single score for the modeled highway segment.
11 Source: DVRPC 2012 Congestion Management Process (CMP) – Limiting Traffic Congestion and Achieving Regional Goals, DVRPC, May 2013, Publication No. 11042
1. Recurring Traffic Congestion – Locations with high peak-period volume/capacity ratios (≥ 0.85) currently and where growth in congestion is forecasted in the peak-period travel model.
2. Transit Need – Areas where transit service might succeed based on current and forecasted population and employment density, and train stations, as they concentrate people for efficient transit and carpooling.
3. Transportation Facilities – Major transit services, major highways, freight rail and freight facilities, and their connections.
4. Traffic Safety and Nonrecurring Congestion – Highway segments with twice the average crash rate of similar facilities and where crashes are likely to cause congestion problems.
5. Duration of Congestion – Roadways with longer than average peak-period congestion based on archived traffic operations data. (Note: The use of archived data has not been sufficiently developed in the 2012 Congestion Management Process for the lower-order highway system—many of which are county routes. A workable surrogate—double-weighting the traffic congestion parameter—replaced the duration-of-congestion parameter in the scoring methodology for this current study.)
6. Transportation Security – Activity centers (population, employment, and recreational) and key linkages (bridges, etc.) that are critical for potential evacuations.
7. Land Use Centers – Centers and existing or future development areas identified in DVRPC’s Long-Range Plan and the Camden County Land Use Plan.
8. Environmental Impact – Areas where transportation investments would have limited impacts to natural, human, and cultural settings.
Highway segments with Congestion Management Process-composite scores equaling or exceeding 6.0 are significant from a Congestion Management Process viewpoint and warrant attention. Additionally, the Congestion Management Process contains a ready program of actions for delivering that attention.12 These include land use and community planning strategies, multimodal transportation options to manage growth and travel, and combat congestion in the corridor. Implementing combinations of strategies is preferred—in steps that will aid travel, prolong investments, and improve air quality.
12 The Congestion Management Process offers over 100 congestion-fighting strategies appropriate to the region. In accordance with federal regulations, other means of solving congestion problems must be considered before using federal funds to build major new road capacity. When major new road capacity is appropriate, a set of supplemental multimodal strategies scaled to the size of the project must be incorporated. To view the appropriate strategies for each subcorridor, visit www.dvrpc.org/webmaps/CMP/.
Page 25

Camden County Highway Plan
Figure 16: Congestion Management Process (CMP) Corridors
DVRPC, 2015
Page 26

Camden County Highway Plan
Figure 16a: Subcorridor Areas for CMP Corridors 2, 3, 5, 6
DVRPC, 2015
Page 27

Camden County Highway Plan
Figure 16b: Subcorridor Areas for CMP Corridors 10, 11, 12, 13
DVRPC, 2015
Page 28

Camden County Highway Plan
CAMDEN COUNTY’S COUNTY ROUTE TURNBACKS:
Camden County directed DVRPC staff to pay particular attention to a set of county routes that are being considered for transfer of ownership from the county to the municipality. These included:
1. Camden County Route 612 (Browning Road) – between County Routes 630 and 561, in Collingswood;
2. Camden County Route 644 (Potter Street) – between County Routes 561 and 573, in Haddonfield Borough;
3. Camden County Route 644 (Haddonfield Road) – between NJ 70 and NJ 38, in Cherry Hill;
4. Camden County Route 646 (Breslin Avenue/Avondale Avenue) – between County Routes 647 and 551, in Haddon Township and Haddonfield Borough;
5. Camden County Route 651 (Congress Avenue) – between County Routes 743 and 650, in Oaklyn;
6. Camden County Route 696 (Park Avenue) – between County Routes 683 and 669, in Lindenwold;
7. Camden County Route 697 (Broadway) – between County Route 669 and US 30, in Laurel Springs; and
8. Camden County Route 698 (Lake Boulevard) – between County Routes 673 and 696, in Lindenwold.
DVRPC staff included the segments in the modeled network and subjected them to the Highway Plan’s analytical procedures as a matter of due diligence.
ANALYSES Sequential screening was performed to assess and winnow transportation information for 600 monitoring points throughout the county to a more useable set—those areas warranting transportation attention.
The procedure screened link-based outputs from the travel simulations and geographic data associated with the Congestion Management Process criteria and the other elements of the county’s Master Plan (i.e., Land Use, Bikeways & Multi-Use Trails, and Farmland Preservation), reducing the set to 153 segments. The eight candidate County Route Turnback segments were also maintained as a matter of due diligence.
Table 4 (pages 30 through 33) summarizes the screening methodology’s content and results for the county route network. Column headings, across the top of the table, provide an overall perspective of the screening process. The segments listed on the left side of the table include county route segments that meet or exceed one of the technical screening thresholds (described on page 34) and the eight candidate County Route Turnbacks.
Page 29

Camden County Highway Plan
Table 4: Summary of Camden County Route Transportation Analyses
Continued on next page
Page 30

Camden County Highway Plan
Table 4: Summary of Camden County Route Transportation Analyses (continued)
Continued on next page
Page 31

Camden County Highway Plan
Table 4: Summary of Camden County Route Transportation Analyses (continued)
Continued on next page
Page 32

Camden County Highway Plan
Table 4: Summary of Camden County Route Transportation Analyses (continued)
DVRPC, 2015
Page 33

Camden County Highway Plan
Technical Analysis Results Quantitative-traffic indicators within the Congestion Management Process’s methodology were isolated and considered independently for deeper analysis within the work. The technical parameters focus on safety and congestion factors, as these conditions are most often experienced and understood by the average driver. These included: segment safety (crash rates on the segment that meet or exceed twice the average for similar facilities in 2012), 2011 and 2040 congestion (peak-hour volume-to-capacity ratios ≥ 0.85), and top Congestion Management Process composite scores (i.e., scores ≥ 6.0). Individual county route segments are checked with ‘X’s in Table 4 where the technical-indicator threshold is satisfied.
The following figures supply visual context to the technical analysis results contained in Table 4.
Figure 17 (page 35) – 2011 travel modeling and 2012 traffic safety results on all highways (i.e., county routes, and state and authority highways). Links are color-coded where volume-to-capacity ratios equal or exceed 0.85, or have a minimum of two times the average crash rate.
Figure 18 (page 36) – Preliminary 2040 Master Plan travel modeling results on all highways. Links are color-coded where volume-to-capacity ratios equal or exceed 0.85.
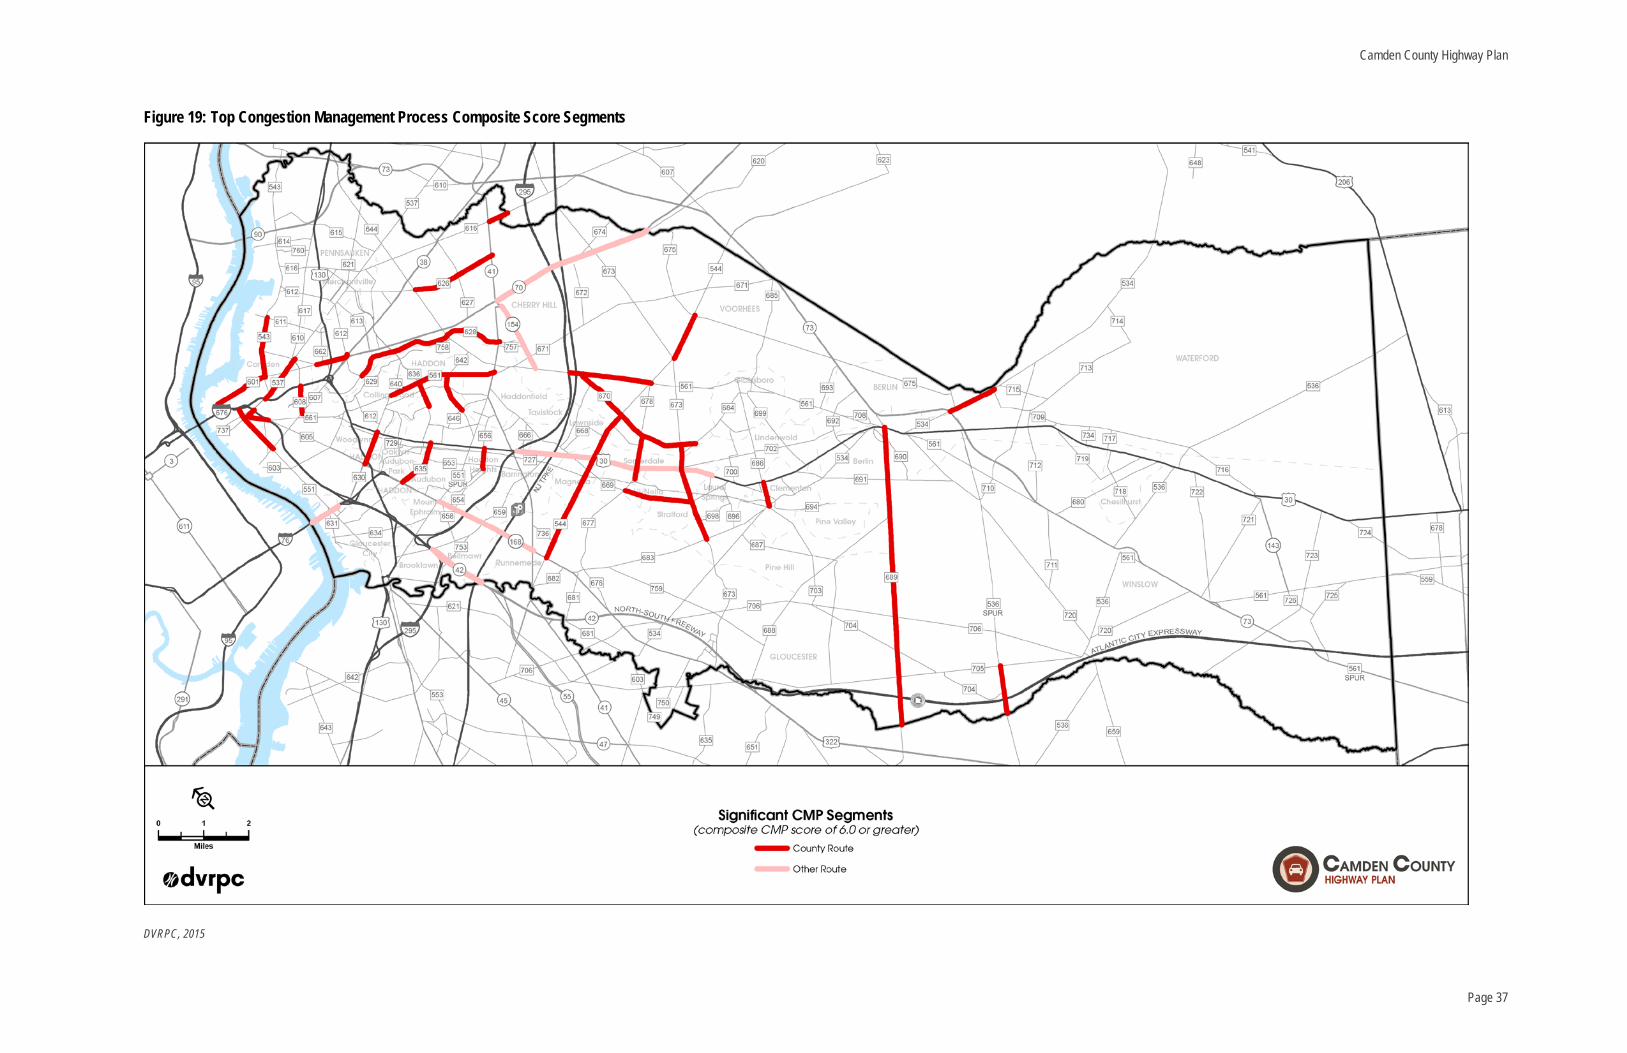
Figure 19 (page 37) – Top Congestion Management Process composite score results for all highways. (Note: this layer repeats in many of the following exhibits.) Segments with scores equaling or exceeding 6.0 are color-coded in pink or red.
– Pink segments are state- or authority-jurisdiction highways. The county should monitor and advocate for ameliorating treatments at these locations.
– Red segments are county routes. Treatments are recommended to be actively advanced and financed by the county. Priorities could be guided by the total Congestion Management Process composite score. (Composite scores have been added to the Transportation Asset Management Database).
Figure 20 (page 38) – The eight County Route Turnback candidates, color-coded for issues identified in the CMP evaluation methodology.
– Blue segments (4) indicate a traffic safety issue. Here, the crash rates are two or more times the average, or have been pre identified for eligibility within the Highway Safety Improvement Program. County Routes 612, 644 (between 70 and 38), 697, and 698 are the cases. Recommendation: examine a wider range and deeper set of crash data, perform a road safety audit, and identify and implement countermeasures before turning over the segment.
– Purple segments (1) indicate a congestion issue. Here, the 0.85 threshold is met/marginally exceeded in 2040 only. County Route 696 is the case
– Green segments (3) are clear of identifiable safety and congestion issues. County Routes 644 (between 561 and 573), 646, and 651 are the cases.
Congestion Management Process Corridors Top-rated county route segments are indicated with X’s in Table 4 relative to Congestion Management Process planning corridors (shown earlier on Figure 16, page 26). Congestion Management Process-endorsed improvement strategies correspond with subcorridors within them (refer to Figure 16a and Figure 16b shown earlier on pages 27 and 28, respectively). More information on the CMP’s corridor and subcorridor structure, and menu of strategies is available at www.dvrpc.org/webmaps/CMP/.
Incident Management Highway Network Key county route segments that are also designated as official detour routes to the regional highway network or as emergency evacuation routes are identified with ‘X’s in Table 4 for relevance to the region’s Intelligent Transportation Systems vision and its recommended levels for infrastructure deployment (refer to Figure 9, shown previously on page 13).13
Community Planning Considerations Other Camden County Master Plan elements are matched for consistency in this group of columns. ‘X’s in Table 4 are indicated where top-rated county route segments:
– Intersect DVRPC and county land use centers;
– Carry, or have been proposed to carry, on-road bicycling facilities14 (see Figure 21, page 39); or
– Serve, traverse, or abut protected lands, including public parks and preserved farmlands.15
Results were analyzed. DVRPC staff preliminarily identified mobility improvements pertaining to the county route network and the county Master Plan to account for collateral multimodal and land use opportunities; localized or systemic congestion deficiencies; current plans, programs, and ongoing studies; and existing infrastructure conditions. The preliminary recommendations were presented to county planning staff for decision making. County planning staff was able to remove or add projects to reflect the county’s goals. Next, the Final Year 2040 Master Plan simulation incorporating the approved projects was prepared. Details are reported in the following two chapters.
13 DVRPC will begin updating the 2009 Transportation Operations Master Plan in July 2014. Visit: www.dvrpc.org/Operations/ for more information. 14 Source: Camden County Bicycling & Multi-Use Trails Plan, DVRPC, January 2015, Publication No. 13036 15 Sources: DVRPC’s 2011 GIS files, and a 2013 inventory update for the Camden County Farmland Preservation Plan, DVRPC, January 2009, Publication No. 08029
Page 34

Camden County Highway Plan
Figure 17: Current Traffic Congestion and Traffic Safety – Segments of Concern
DVRPC, 2015
Page 35

Camden County Highway Plan
Figure 18: Year 2040 Traffic Congestion – Segments of Concern
DVRPC, 2015
Page 36
Camden County Highway Plan
Figure 19: Top Congestion Management Process Composite Score Segments
DVRPC, 2015
Page 37

Camden County Highway Plan
Figure 20: Candidate County Route Turnbacks
DVRPC, 2015
Page 38

Camden County Highway Plan
Figure 21: Bike Facilities on County Routes (Existing, Proposed, and Planned)
Source: Camden County Bicycling & Multi-Use Trails Plan, DVRPC, Draft, June 2014, Publication No. 13036 DVRPC, 2014 Source: Camden County Bicycling & Multi-Use Trails Plan, DVRPC, January 2015, Publication No. 13036 DVRPC, 2015
Page 39


Camden County Highway Plan
Chapter 7: RECOMMENDED IMPROVEMENT PROGRAM
Master Plan recommendations emanate from the analytical screening process of the Camden County Highway Plan, standing recommendations contained in recent, detailed traffic and transportation reports prepared in the county, and independent observations obtained through the course of the study.
Recommendations from the Highway Plan were developed in conformance with the DVRPC Congestion Management Process and established following approval by county staff. Final modeling for the Master Plan Scenario was conducted to derive future benefits.16 Program implementation assistance is supported with cost estimates, partnership information, and environmental screening.
Table 5 (pages 42 through 45) supplies an overview of the final improvement program as it relates to the county route network. Yellow-shaded rows in the table highlight the Highway Plan’s significant recommendations for improving mobility along the county route system. Recommendations for “Signal System” and “Arterial Management” appear throughout the table, and the recommendation for “Bus Streets” is made in a few circumstances.
The recommendation for Signal Systems is based on traffic signal density along the route. It makes sense to provide coordinated signal operations to foster traffic flow where traffic signals are numerous and closely spaced. The county’s principal highways are the priority network for implementing the computerized signal system. Arterial Management is cited where the county routes do double duty as detour and evacuation routes. Deploying more robust Intelligent Transportation System infrastructure, including closed-circuit television cameras and variable message signs, is recommended for integrated corridor management. (Visit: www.dvrpc.org/Operations/ for more information.) Bus Streets include county route segments that have more than three scheduled routes operating on the segment. In these areas, physical improvements are proposed to promote the presence and priority of transit vehicles and transit patrons, including corner bus-stop bulb-outs, shelters, benches, pedestrian-scale street lighting, and high-visibility crosswalks. Traffic signal systems are also recommended for these corridors.
Actions for the eight candidate County Route Turnbacks are included in the table. Blue-shaded rows (4) indicate Turnback candidates where a traffic-safety issue has been identified and further analyses and amelioration is recommended before turning the route over to another jurisdiction. Green-shaded rows (4) are county route segments that are free from identified traffic safety, or critical long-term congestion conditions, and are recommended for transfer of ownership.
16 Mobility improvements that are anticipated to be operational by 2040 were incorporated in the final modeling run. The GCL will not be operational by 2040.
Traffic personnel in the Burlington County Traffic Operations Center, in Mount Laurel, New Jersey, are able to monitor 282 intersections and adjust signal timing at 112 intersections to respond to or regulate traffic flow along their county route system. Similar traffic signal systems are recommended for the Camden County route network. (Photo: DVRPC)
Page 41

Camden County Highway Plan
Table 5: Camden County Route Mobility Recommendations
Continued on next page
Page 42

Camden County Highway Plan
Table 5: Camden County Route Mobility Recommendations (continued)
Continued on next page
Page 43

Camden County Highway Plan
Table 5: Camden County Route Mobility Recommendations (continued)
Continued on next page
Page 44

Camden County Highway Plan
Table 5: Camden County Route Mobility Recommendations (continued)
DVRPC, 2015
Page 45

Camden County Highway Plan
CONGESTION MANAGEMENT PROCESS STRATEGY COMPLIANCE Consistency with the Congestion Management Process is a prerequisite for obtaining and using federal-aid highway funds through the long-range planning and transportation improvement programming processes in the Delaware Valley. Therefore, DVRPC staff’s evaluation was conducted in agreement with the adopted Congestion Management Process’s order of priorities for identifying transportation projects and programs.
1. Maintain and modernize.
2. Manage demand.
3. Increase capacity of the existing multimodal system, limiting the addition of through-travel lanes.
4. Add new capacity where necessary, limiting the addition of new roads.
RECOMMENDATIONS Highway Plan recommendations are stratified for safety along the county route network and mobility throughout the county. Mobility improvements are divided into regional projects and county route improvements. Regional projects are included on the Transportation Improvement Program and in the Long-Range Plan; the bulk of these projects are improvements to state- and authority-owned transportation facilities. For these, the county acts as an advocate and monitors project development. Safety and mobility improvements to the county route network are the county’s direct responsibility to advance and implement.
Figure 22 (page 47) illustrates the findings of the study’s traffic safety analysis along the county route system (i.e., segments with twice, plus, the average crash rate) in relation to locations that are already eligible for safety improvement funding. Where there is overlap between the crash-rate parameter and improvement program eligibility, the county should act to establish a county-wide action plan to advance engineering studies, identify countermeasures (and installation costs), and ready an improvement program to correct the traffic safety deficiencies via the Highway Safety Improvement Program,17 or independently. Segment-level crash rates, computed in the Highway Plan, have been loaded into the Transportation Asset Management Database which can be used to establish implementation priorities.
Transportation projects in the current Transportation Improvement Program and the Long-Range Plan generally address regional-level facilities and not county-owned routes. Figure 23 (page 48) illustrates the interrelationship between the mobility and safety improvements included in the current parent documents and the top-rated county route segments.
17 The county is participating in the Highway Safety Improvement Program.
Finally, Figure 24 (page 49) illustrates the county-approved Highway Plan mobility recommendations. All locations are top-rated Congestion Management Process segments on the county route network. (Note: Improvement areas highlighted in yellow on the figure correspond with color-shaded rows in Table 5.)
The eight candidate County Route Turnback segments are color-coded on the figure as blue (4) and green (4) lines. Blue segments indicate that a traffic safety issue has been identified. For these, further analyses and amelioration is recommended before turning the route over to another jurisdiction. Green segments are free from crucial existing and long-term deficiency. Ownership of these routes can be transferred. One point of distinction concerns County Route 644. County Route 644 is a candidate Turnback in two locations: Potter Street, between County Route 561 and NJ 41, in Haddonfield; and Haddonfield Road, between NJ 70 and NJ 38, in Cherry Hill. Both segments are components of the Incident Management Highway Network—serving as detour routes for nearby state highways (Potter Street for NJ 154, and Haddonfield Road for NJ 70 and NJ 38). Regardless of ownership, those functional attributes should be maintained, and the segments should ultimately be integrated into the county-wide traffic signal system as a means of regulating normal peak-hour traffic operation and accommodating detoured traffic.
Page 46
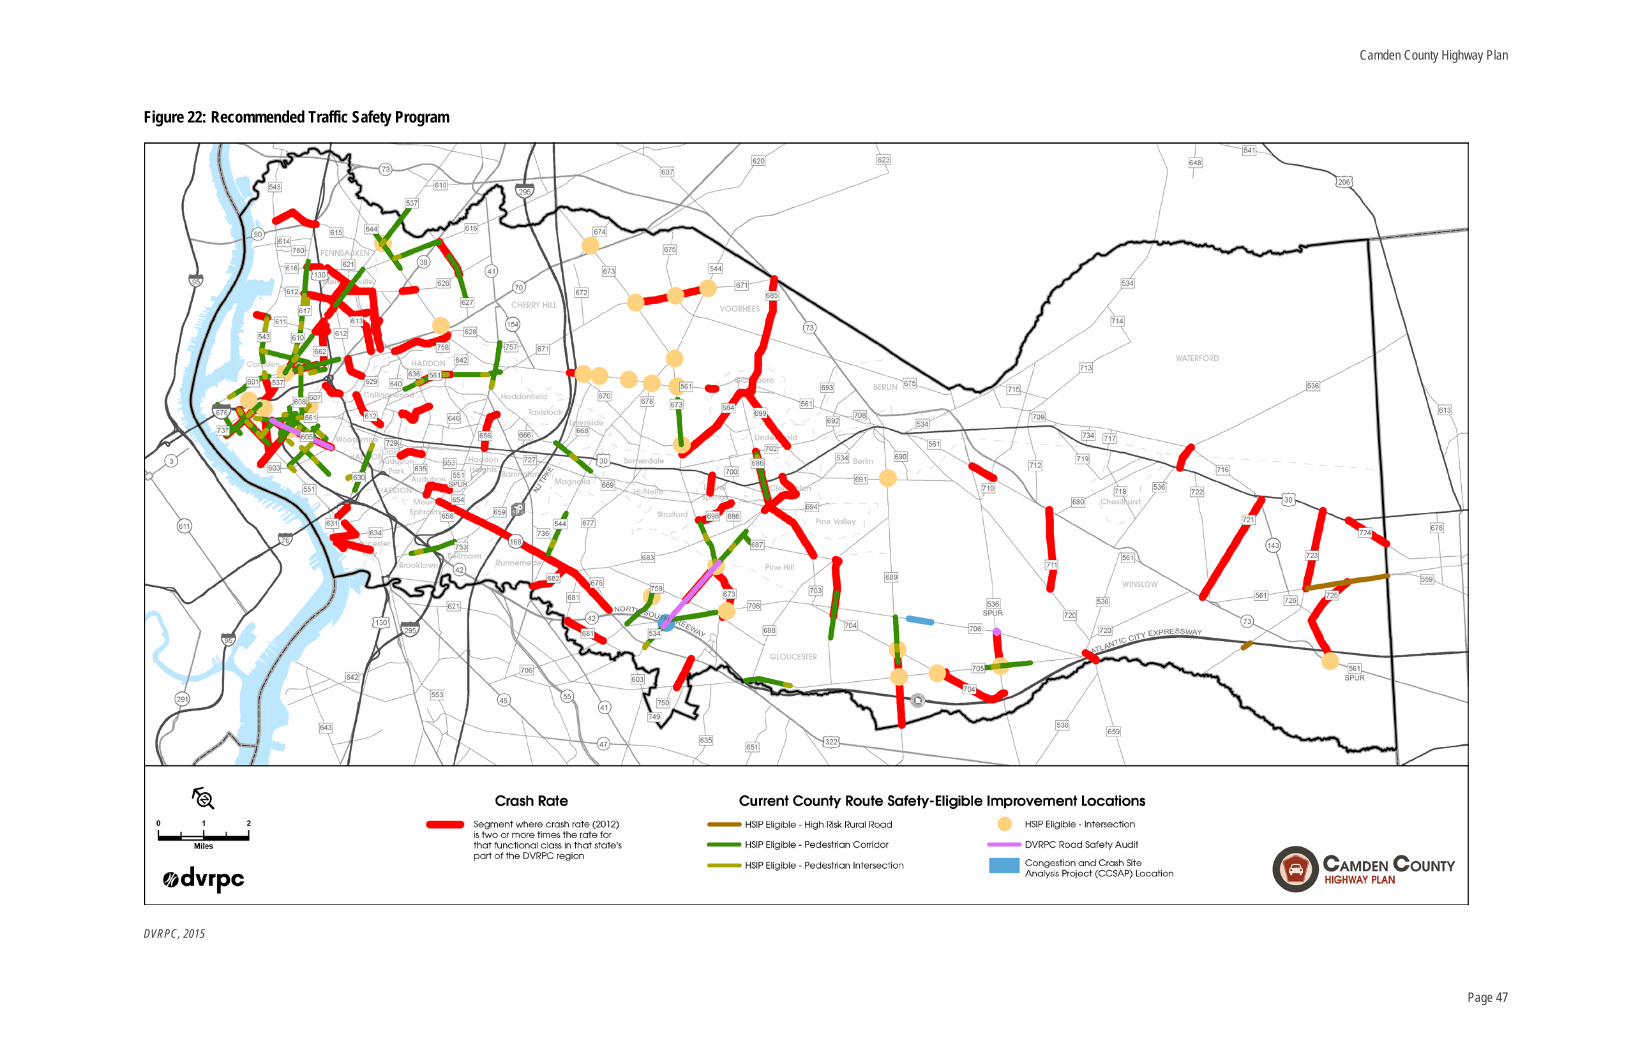
Camden County Highway Plan
Figure 22: Recommended Traffic Safety Program
DVRPC, 2015
Page 47

Camden County Highway Plan
Figure 23: Regional Mobility Improvement Program
DVRPC, 2015
Page 48

Camden County Highway Plan
Figure 24: County Route Mobility Improvement Recommendations
DVRPC, 2015
Page 49
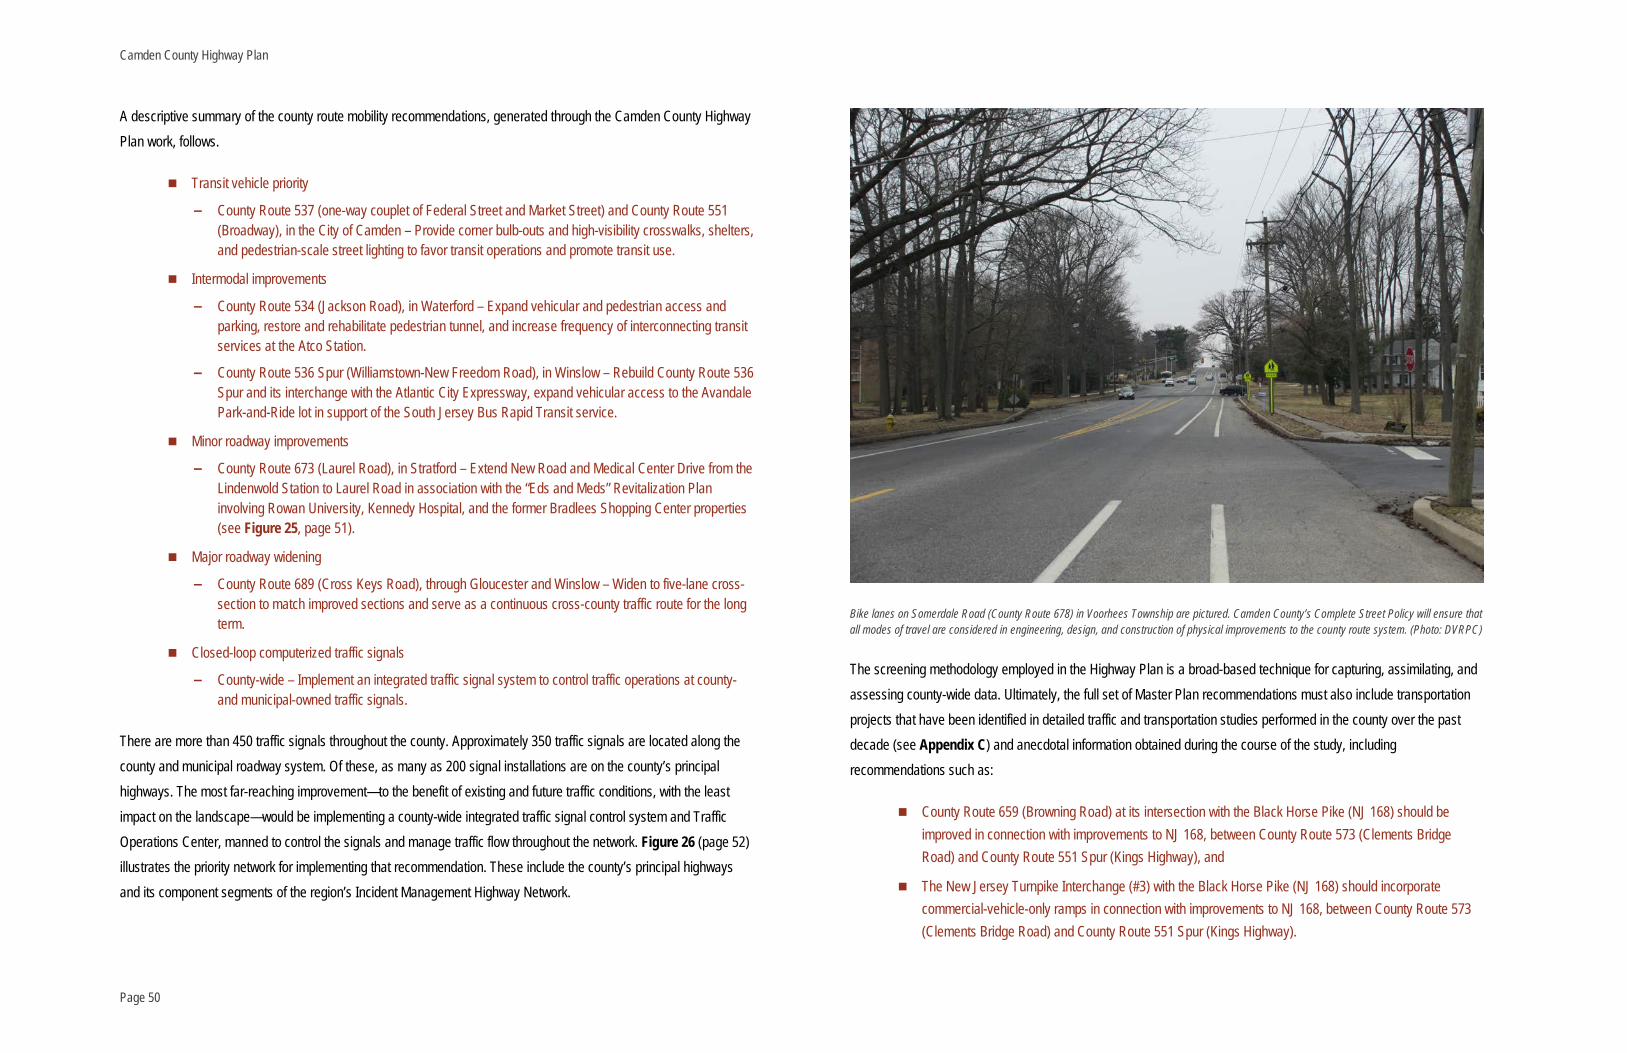
Camden County Highway Plan
A descriptive summary of the county route mobility recommendations, generated through the Camden County Highway Plan work, follows.
Transit vehicle priority
– County Route 537 (one-way couplet of Federal Street and Market Street) and County Route 551 (Broadway), in the City of Camden – Provide corner bulb-outs and high-visibility crosswalks, shelters, and pedestrian-scale street lighting to favor transit operations and promote transit use.
Intermodal improvements
– County Route 534 (Jackson Road), in Waterford – Expand vehicular and pedestrian access and parking, restore and rehabilitate pedestrian tunnel, and increase frequency of interconnecting transit services at the Atco Station.
– County Route 536 Spur (Williamstown-New Freedom Road), in Winslow – Rebuild County Route 536 Spur and its interchange with the Atlantic City Expressway, expand vehicular access to the Avandale Park-and-Ride lot in support of the South Jersey Bus Rapid Transit service.
Minor roadway improvements
– County Route 673 (Laurel Road), in Stratford – Extend New Road and Medical Center Drive from the Lindenwold Station to Laurel Road in association with the “Eds and Meds” Revitalization Plan involving Rowan University, Kennedy Hospital, and the former Bradlees Shopping Center properties (see Figure 25, page 51).
Major roadway widening
– County Route 689 (Cross Keys Road), through Gloucester and Winslow – Widen to five-lane cross-section to match improved sections and serve as a continuous cross-county traffic route for the long term.
Closed-loop computerized traffic signals
– County-wide – Implement an integrated traffic signal system to control traffic operations at county- and municipal-owned traffic signals.
There are more than 450 traffic signals throughout the county. Approximately 350 traffic signals are located along the county and municipal roadway system. Of these, as many as 200 signal installations are on the county’s principal highways. The most far-reaching improvement—to the benefit of existing and future traffic conditions, with the least impact on the landscape—would be implementing a county-wide integrated traffic signal control system and Traffic Operations Center, manned to control the signals and manage traffic flow throughout the network. Figure 26 (page 52) illustrates the priority network for implementing that recommendation. These include the county’s principal highways and its component segments of the region’s Incident Management Highway Network.
Bike lanes on Somerdale Road (County Route 678) in Voorhees Township are pictured. Camden County’s Complete Street Policy will ensure that all modes of travel are considered in engineering, design, and construction of physical improvements to the county route system. (Photo: DVRPC)
The screening methodology employed in the Highway Plan is a broad-based technique for capturing, assimilating, and assessing county-wide data. Ultimately, the full set of Master Plan recommendations must also include transportation projects that have been identified in detailed traffic and transportation studies performed in the county over the past decade (see Appendix C) and anecdotal information obtained during the course of the study, including recommendations such as:
County Route 659 (Browning Road) at its intersection with the Black Horse Pike (NJ 168) should be improved in connection with improvements to NJ 168, between County Route 573 (Clements Bridge Road) and County Route 551 Spur (Kings Highway), and
The New Jersey Turnpike Interchange (#3) with the Black Horse Pike (NJ 168) should incorporate commercial-vehicle-only ramps in connection with improvements to NJ 168, between County Route 573 (Clements Bridge Road) and County Route 551 Spur (Kings Highway).
Page 50

Camden County Highway Plan
Figure 25: Concept of the New Road/Medical Center Drive Extension (County Route 673 Relief Route)
DVRPC, 2015
Page 51

Camden County Highway Plan
Figure 26: Interconnected Traffic Signal System Priority Network
DVRPC, 2015
Page 52

Camden County Highway Plan
FINAL TRAVEL TESTING Travel simulations were conducted with the final improvements serving as inputs to the Year 2040 Master Plan model. Results for the county route segments are posted in Table 5 (shown previously on pages 42 through 45). An overall perspective of the benefit of the modeled Highway Plan recommendations is provided in Table 6.
Table 6: Final Modeled Network Performance
2011 Base Year 2040 Long-Range Plan 2040 Master Plan
Highways
V/C PM-peak Speed V/C
PM-peak Speed V/C
PM-peak Speed
All County Routes 0.59 27.8 0.63 27.3 0.64 28.0
500-Series 0.61 29.2 0.63 28.6 0.63 29.1
600-Series 0.63 26.3 0.68 25.8 0.69 26.7
700-Series 0.39 31.3 0.47 30.7 0.48 31.6
DVRPC, 2015
In summary, congestion will rise due to overall socioeconomic growth and consequent growth in travel. Enlisting a new performance measure—PM peak-period speeds—supplies a deeper view into the operating characteristics of the networks and changes between scenarios. Constructing the physical improvements and implementing a coordinated traffic signal system along the top-rated county route network as recommendations for the 2040 Master Plan will offset the demographic changes and deliver overall faster operating speeds.
IMPLEMENTATION Order-of-magnitude cost estimates for constructing or implementing the mobility improvements were prepared for budgeting and programming purposes and are included in Table 5. Priorities have not been assigned, as funding availability needs to be determined prior to budgeting and programming. It is recommended to concurrently implement improvements where mobility projects overlap with safety-deficient locations.
Study-produced data has been loaded into the Camden County Transportation Asset Management Database (prepared for this project) to assist in determining relative needs. For example, county staff might screen the database for Congestion Management Process-composite scores, 2012 crash rates, or current and future volume-to-capacity ratios, or AADTs, etc., for help in establishing priorities. Projects that do, or may, fit potential future categorical improvement programs can be structured using the inventory of Congestion Management Process subcorridors in the database.
To initiate support and partnerships in project development, cosponsoring agencies are identified in the last column of the table. To maximize funding opportunities, federal-aid eligibility of the county route network has been identified (see the last column of Table A-1, pages A-2 through A-11 in Appendix A). Finally, a high-level environmental assessment was prepared for the recommended physical improvements along the county route network (Appendix D). This was prepared to call out potential impacts to natural and human environments and to assist communication with regulatory agencies to improve project delivery.
Page 53


Camden County Highway Plan
Chapter 8: CONCLUSION
Transportation modeling and an endorsed screening methodology have been used to incorporate and assess county-wide transportation conditions for the Highway Plan. Final recommendations for the overall Camden County Master Plan incorporate regional transportation projects on the Transportation Improvement Program and Long-Range Plan, and match traffic safety deficiencies throughout the county with an active safety improvement program. Mobility projects have been identified for top-rated locations on the county route network to support the county’s updated Land Use Plan. They incorporate highway and community planning considerations, favor multimodal travel, and foster partnerships.
Transportation projects in the current Transportation Improvement Program and Long-Range Plan almost exclusively address regional-level transportation facilities, not county routes. Still, the county is recommended to advocate and monitor TIP and Plan progress so that the bulk of travel is efficiently served and the county route network protected.
The county is recommended to develop an action plan for improving traffic safety and mobility on the network that it is principally responsible for: the county route network. Engineering studies can be advanced for traffic-safety-deficient locations to pre-identify countermeasures that can be implemented through the federally aided Highway Safety Improvement Program first, or with county resources second.
Mobility recommendations for the county route system include site-specific physical improvements at locations warranting attention, which are not apparently precluded by neighborhood or environmental constraints. There are not many, and they are not cheap. At the same time, the county is reaching the limits of its growth potential and is envisioning a smart, more sustainable future—focusing growth within its developed landscapes. Of all the recommendations from the Highway Plan’s work, the county-wide interconnected and coordinated traffic signal system operational improvement is the smartest and farthest reaching.
Vigilance on the part of the county planning staff, and support from its planning partners and the wider community, will be required to implement the plan. The county is just one of many institutions influencing the path to the future. In such an environment, intergovernmental coordination will be necessary to achieve the vision of the overall Master Plan. Typically, the individual municipality and the development community have a more direct role in land use decisions. More often than not, federal and state agencies determine the direction and design of major transportation investments. Where possible, the county may lobby to integrate functionally or geographically related county route recommendations into the scopes of the regional projects, or be ready to partner with other stakeholders to finance the improvements.
Where the county can have a direct effect on the vision is through its ability to direct redevelopment and revitalization investments, and through its regulatory control governing access to and design of its county route network. The county has adopted a Complete Streets Policy. Initial considerations for improving the county route system must account for all modes of travel—not just cars. The Camden County Bicycling & Multi-Use Trails Plan will be a valuable resource for those evaluations. Additionally, the county’s Subdivision and Site Plan Procedures and Land Development Regulations requires developers to examine opportunities to build grids before granting access for new roads or driveways to the county route system. Interconnected circulation systems, serving adjacent neighborhoods or developments, can forestall congestion and roadway widening by maximizing the distribution of development traffic. Interconnected street networks also reduce trip lengths and can provide more suitable options for walking and bicycling.
Page 55


Camden County Highway Plan
Appendices: A: CAMDEN COUNTY HIGHWAY INVENTORY B: CAMDEN COUNTY BRIDGE INVENTORY C: OTHER TRAFFIC AND TRANSPORTATION STUDIES, AND RECOMMENDATIONS FOR THE CAMDEN COUNTY MASTER PLAN D: ENVIRONMENTAL SCREENING OF PHYSICAL IMPROVEMENTS


Camden County Highway Plan
Appendix A: CAMDEN COUNTY HIGHWAY INVENTORY
Selected characteristics of the county route network are inventoried on Table A-1 (see pages A-2 through A-10) to provide an overview of the system. Key among the fields is FHWA’s Highway Functional Classification—a federally designated and interconnected system of the nation’s most important highways. In 2014, NJDOT completed a comprehensive statewide evaluation of the functional classification system for the FHWA. That effort updated the pre-existing functional classification system for the results of the 2010 US Census, and transportation system changes that have taken place since 2000 (e.g., system connectivity, traffic volumes carried, and land use served, etc.). The outcome resulted in the network illustrated in Figure 7 (on page 11 in the main body of this report) and the classifications identified in Table A-1. All of the county’s routes are included in the FHWA Highway Functional Classification system.
MAP-21, the current federal surface transportation assistance act extends federal-aid for road and bridge improvements within that system (Table A-2, below). Most of the county’s roads are eligible for federal-aid highway funding assistance.
More information for the network, including relevant outputs from the current project, is contained in the database.
.
Table A-2: Federal Highway Administration (FHWA) Highway Functional Classification and Federal-Aid Funding Eligibility
FHWA Functional Classification (Code) Federal-Aid Funding Program
Interstate Highways (1) National Highway Performance Program (NHPP), Surface Transportation Program (STP), Surface Transportation Program – Urban Allocation (STU)
Other Freeways and Expressways (2) National Highway Performance Program (NHPP), Surface Transportation Program (STP), Surface Transportation Program – Urban Allocation (STU)
Other Principal Arterial Highways (3) National Highway Performance Program (NHPP), Surface Transportation Program (STP), Surface Transportation Program – Urban Allocation (STU)
Minor Arterial Highways (4) Surface Transportation Program (STP), Surface Transportation Program – Urban Allocation (STU)
Major Collector Highways (5) Surface Transportation Program (STP), Surface Transportation Program – Urban Allocation (STU)
Minor Collector Highways (6) None
Bridges on Minor Collector Highways (6) Bridges Off the Federal-Aid System (BOF)
Local Roads (7) None
Bridges on Local Roads (7) Bridges Off the Federal-Aid System (BOF)
Source: Moving Ahead for Progress in the 21st Century (MAP-21), effective October 1, 2012
DVRPC, 2015
Page A-1

Camden County Highway Plan
Table A-1: Inventory of Camden County’s Highways
Continued on next page
Page A-2

Camden County Highway Plan
Table A-1: Inventory of Camden County’s Highways (continued)
Continued on next page
Page A-3

Camden County Highway Plan
Table A-1: Inventory of Camden County’s Highways (continued)
Continued on next page
Page A-4
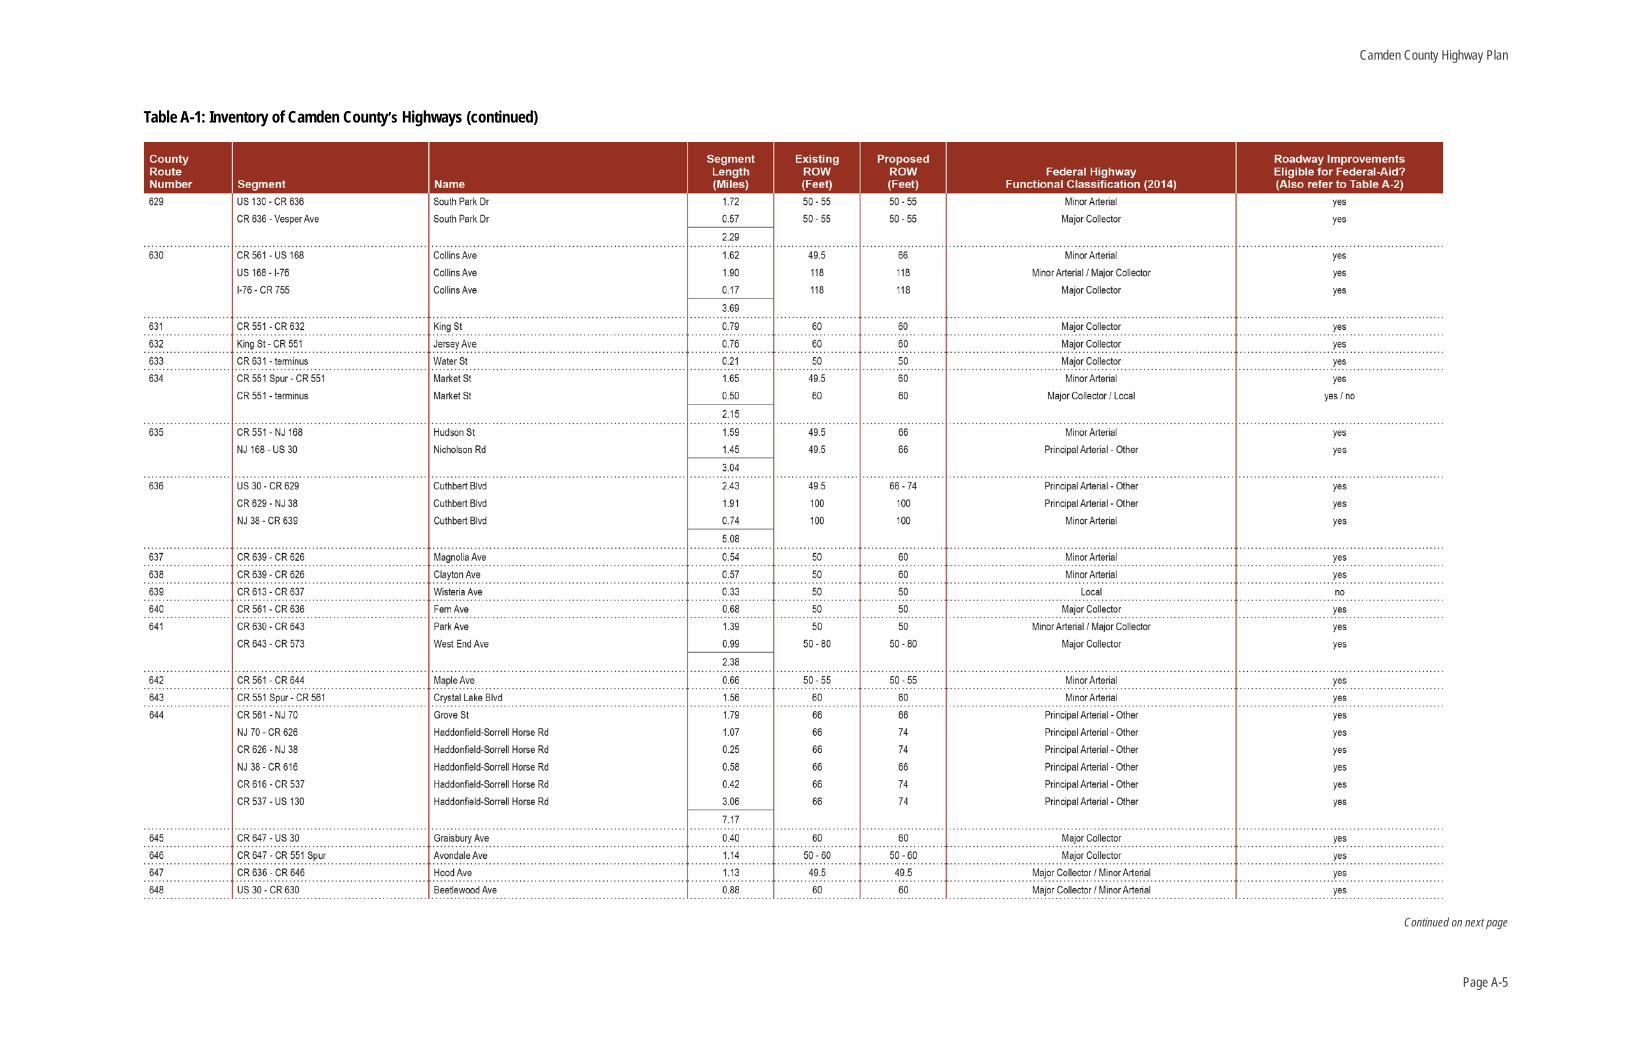
Camden County Highway Plan
Table A-1: Inventory of Camden County’s Highways (continued)
Continued on next page
Page A-5
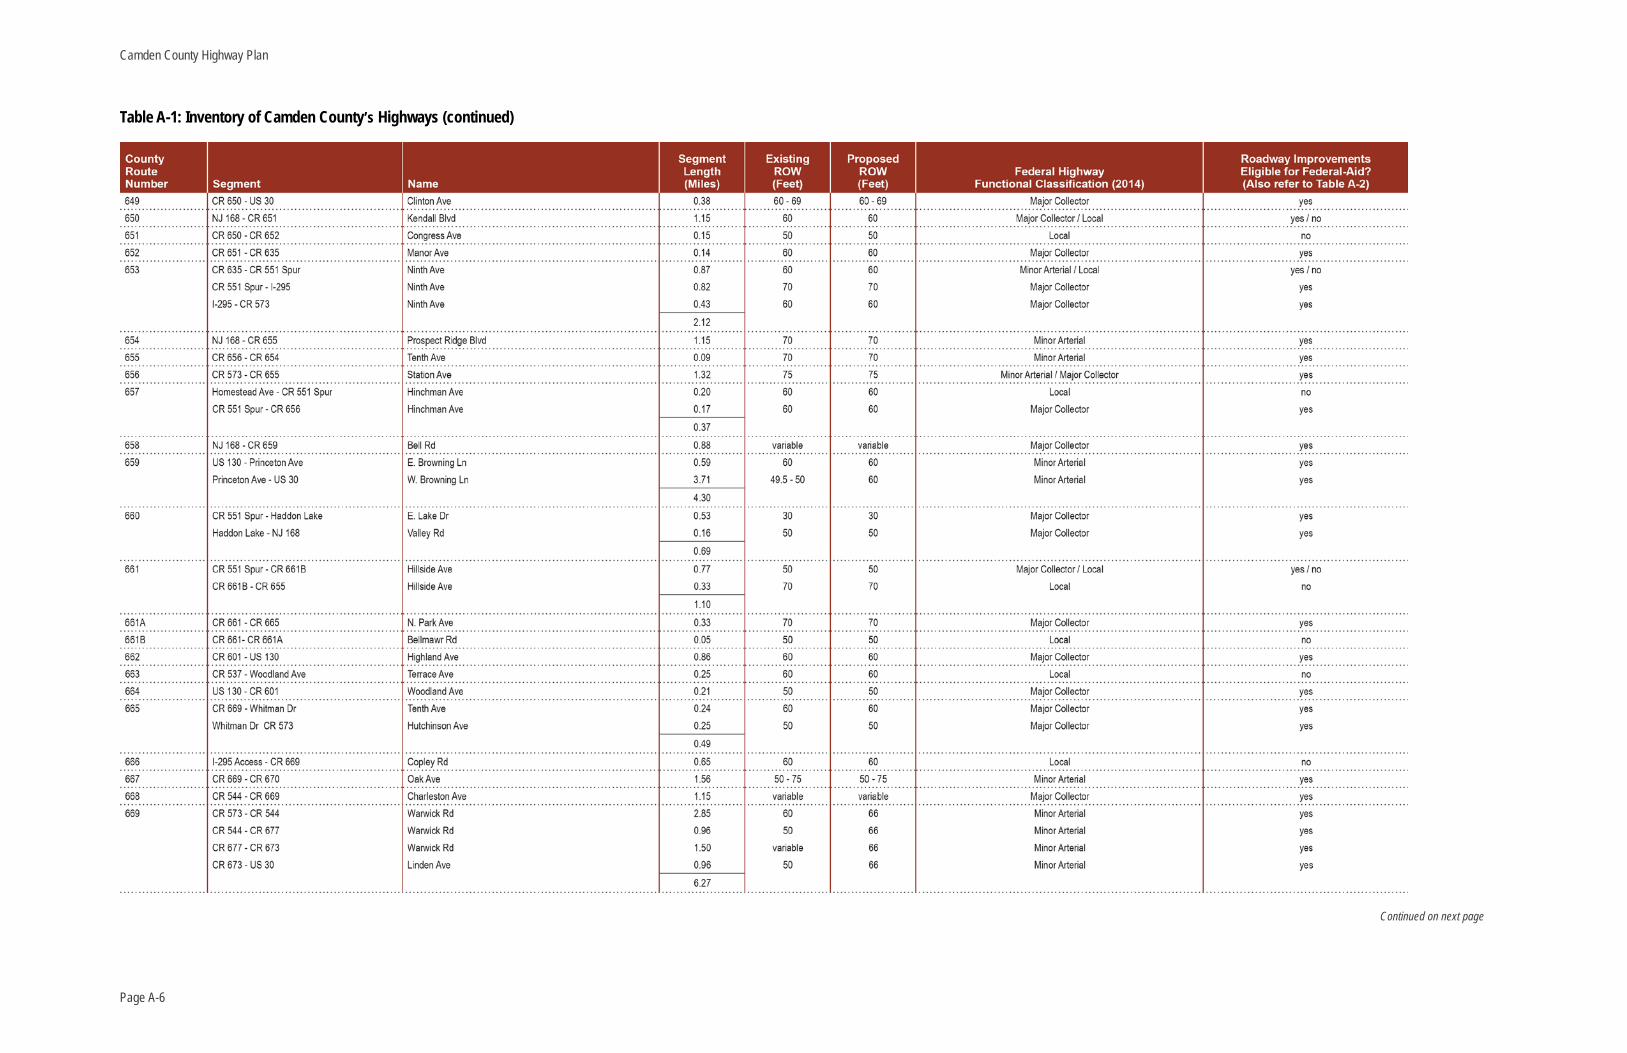
Camden County Highway Plan
Table A-1: Inventory of Camden County’s Highways (continued)
Continued on next page
Page A-6

Camden County Highway Plan
Table A-1: Inventory of Camden County’s Highways (continued)
Continued on next page
Page A-7

Camden County Highway Plan
Table A-1: Inventory of Camden County’s Highways (continued)
Continued on next page
Page A-8

Camden County Highway Plan
Table A-1: Inventory of Camden County’s Highways (continued)
Continued on next page
Page A-9

Camden County Highway Plan
Table A-1: Inventory of Camden County’s Highways (continued)
Sources: Camden County, and New Jersey Department of Transportation
DVRPC, 2015
Page A-10
Camden County Highway Plan
Appendix B: CAMDEN COUNTY BRIDGE INVENTORY
Camden County owns and maintains 155 bridges (Figure B-1, page B-2). Physical attributes of the bridges were obtained from the County, and are contained in Table B-1 (pages B-3 to B-6). Bridges that are 20-feet long and longer are eligible for federal funding18 for rehabilitation and replacement, and per federal requirements must be regularly inspected for structural and functional integrity. Bridges less than 20 feet should also be subjected to regular certified bridge inspections, and integrated into the county’s asset management program.
The available data was added to the project’s transportation asset management GIS database.
18 Also refer to Table A-2 (page A-1) for more information on federal highway and bridge funding programs and eligibility.
Page B-1

Camden County Highway Plan
Figure B-1: Location of Camden County’s Bridges
Source: Camden County
DVRPC, 2015
Page B-2

Camden County Highway Plan
Table B-1: Inventory of Camden County’s Bridges
Continued on next page
Page B-3

Camden County Highway Plan
Table B-1: Inventory of Camden County’s Bridges (continued)
Continued on next page
Page B-4

Camden County Highway Plan
Table B-1: Inventory of Camden County’s Bridges (continued)
Continued on next page
Page B-5

Camden County Highway Plan
Table B-1: Inventory of Camden County’s Bridges (continued)
Source: Camden County
DVRPC, 2015
Page B-6

Camden County Highway Plan
Appendix C: OTHER TRAFFIC AND TRANSPORTATION STUDIES, AND RECOMMENDATIONS FOR THE CAMDEN COUNTY MASTER PLAN
The screening methodology employed in the Highway Plan analyses is a broad-based technique for capturing, incorporating, and assessing county-wide data. Ultimately, the full set of Master Plan recommendations must also include transportation projects that have been identified in detailed traffic and transportation studies performed in the county. Table C-1 (page C-2) contains a list of pertinent studies performed over the past decade that contain local-level recommendations.
Page C-1

Camden County Highway Plan
Table C-1: Traffic and Transportation Studies in Camden County (2004 to 2015)
DVRPC, 2015
Title Author Date Published Bike/Ped Transit Highway Jurisdiction(s)
1Safe Routes to Transit: Pennsauken Transit Center, Lindenwold Station, and Princeton Junction Station [DVRPC Publication No. 14025] DVRPC February 2015 x Pennsauken Township; Lindenwold Borough, Somerdale Borough, Stratford Borough, Voorhees Township;
and West Windsor Township (Burlington County)
2 Transportation Improvements for the Church Road (CR 616) Corridor [DVRPC Publication No. 14012] DVRPC August 2014 x x Cherry Hill Township; and Maple Shade Township and Mount Laurel Township (Burlington County)
3 Pennsauken Transit Center: Impacts and Opportunities [DVRPC Publication No. 13051] DVRPC October 2013 x Pennsauken Township
4 Mt. Ephraim Avenue (CR 605) Pedestrian Road Safety Audit [DVRPC Publication No. 11035] DVRPC July 2013 x City of Camden
5 City of Camden Access Study [DVRPC Publication No. 12008] DVRPC December 2012 x City of Camden
6 Camden County Transit Expansion Framework Study [DVRPC Publication No. 12004] DVRPC January 2012 x City of Camden, Gloucester City
7Finding Space: Balancing Parking Needs and Urban Vitality in the City of Camden [DVRPC Publication No. 11030] DVRPC September 2011 x x City of Camden
8 Gloucester County Transportation Needs Study [DVRPC Publication No. 09059] DVRPC March 2011 x x x Gloucester County
9 NJ 73 Corridor Study [DVRPC Publication No. 09070] DVRPC June 2010 x Berlin Township, Berlin Borough, Cherry Hill Township, Voorhees Township
10 CR 534 Blackwood-Clementon Road, Road Safety Audit [DVRPC Publication No. 09022] DVRPC January 2010 x Gloucester Township
11 Lindenwold Transit Hub Study [DVRPC Publication No. 09068] DVRPC November 2009 x x x Lindenwold Borough, Somerdale Borough, Stratford Borough, Voorhees Township
12 The Central Camden County Bicycle Network Plan [DVRPC Publication No. 08073] DVRPC July 2009 x Berlin Borough, Berlin Township, Clementon Borough, Gibssboro Borough, Hi-Nella Borough, Laurel Springs Borough, Lindenwold Borough, Somerdale Borough, Stratford Borough, Voorhees Township
13 Camden County Bus Pullout Study [DVRPC Publication No. 08040] DVRPC January 2009 x Camden County
14 Regional Road Diet Analysis: A Feasibility Assessment [DVRPC Publication No. 08055] DVRPC January 2009 x Pennsauken Township
15 Taming Traffic: Context-Sensitive Solutions in the DVRPC Region [DVRPC Publication No. 08044] DVRPC January 2009 x Audubon Borough, Haddon Heights Borough, Barrington Borough, Lawnside Borough
16 Congestion & Crash Site Analysis Winslow Township [DVRPC Publication No. 08041] DVRPC January 2008 x Winslow Township
17Intersection Road Safety Audit - Williamstown Road & Erial Road, Winslow Township, Camden County [DVRPC Publication No. 08039] DVRPC January 2008 x Winslow Township
18 NJ 42 Corridor Study: A Plan of Action [DVRPC Publication No. 08046] DVRPC January 2008 x Gloucester Township, Winslow Township
19 Black Horse Pike: Making it Work [DVRPC Publication No. 06039] DVRPC October 2006 x Audubon Borough, Audubon Park Borough, City of Camden, Collingswood Borough
20 US 30 Corridor Study [DVRPC Publication No. 06036] DVRPC September 2006 x Chesilhurst Borough, Waterford Township, Winslow Township
21 NJ 70 Corridor Study [DVRPC Publication No. 06003] DVRPC November 2005 x Cherry Hill Township, Haddonfield Borough, Pennsauken Township
22 NJ 168 Corridor Study [DVRPC Publication No. 04042] DVRPC September 2004 x Camden and Gloucester Counties
23Intersection Study Report: Somerdale Road (CR 677), Old Black Horse Pike (CR 676) & Chews Landing Road (CR 683)
Remington and Vernick August 2004 x Gloucester Township
Content
Page C-2

Camden County Highway Plan
Appendix D: ENVIRONMENTAL SCREENING OF PHYSICAL IMPROVEMENTS
The Highway Plan’s analyses and recommendations relied on an analytical methodology that accounts for sensitive spaces and resident populations. The procedure is a broad-based one, useful for high-level screening and strategy development. In four cases, the final recommendations will involve physical expansion of the county’s highway network. These projects will likely have effects on the adjacent environment. Where they do, justification, mitigation, or alternatives may be necessary to obtain clearances from specific groups and agencies responsible for their care before constructing the project. On the following pages, two illustrations support each physical recommendation—natural features and human environments.
Where they exist, natural features include wetlands, protected open spaces (parks and farms), and floodplains. Caretakers for these sensitive areas include the New Jersey Department of Environmental Protection (NJDEP), the New Jersey State Pinelands Commission, Camden County, and the individual municipality.
Human environments include historic resources (districts and sites), cultural sites and services, municipal services, schools, hospitals, and places of worship. The screening also included DVRPC’s Indicators of Potential Disadvantage (IPD) environmental justice (EJ) technical analysis, which identifies population groups such as female head of household with child, non-Hispanic minority, Hispanic, carless households, impoverished, elderly 75 years and older, physically disabled, and limited English proficiency. DVRPC is responsible for identifying disadvantaged population groups as part of meeting Title VI nondiscrimination and EJ mandates and ensuring the fair treatment and meaningful involvement of all people in the planning process. (Visit: www.dvrpc.org/GetInvolved/TitleVI/ for more information.)
Historic sites in the county are regulated by the New Jersey Department of Environmental Protection, the New Jersey State Pinelands Commission, municipal jurisdictions, and often by special-interest citizen groups. Cultural sites within the proximity of the Atco Station are under the jurisdiction of the Pinelands Commission; otherwise, cultural and municipal services, schools, etc. are usually protected by the individual land owner.
The following figures were prepared for a closer perspective on the environmental resources that may be encountered with the county route expansion projects and the jurisdictions that may be involved in the review and approval process.
Atco Station Area - Provide direct vehicular and pedestrian access to the Atlantic City Rail Line’s Atco Station from County Route 534 (Jackson Road), in Waterford – to address nearby congestion by improving connections to NJTransit’s regional rail and bus services ($2 million for roadway and parking improvements).
– Figure D-1 (page D-2) – Natural Features near the Atco Station Access Improvement.
– Figure D-2 (page D-3) – Human Environments near the Atco Station Access Improvement.
Atlantic City Expressway Interchange/Avandale Park-and-Ride Lot Area - Rebuild County Route 536 Spur (Williamstown-New Freedom Road) and its interchange with the Atlantic City Expressway, in Winslow – to rectify existing congestion problems and accommodate the proposed South Jersey Bus Rapid Transit project ($10 million).
– Figure D-3 (page D-4) – Natural Features near the Atlantic City Expressway Interchange Improvement.
– Figure D-4 (page D-5) – Human Environments near the Atlantic City Expressway Interchange Improvement.
Lindenwold Station/Rowan University and Kennedy Hospital Revitalization Area - Extend New Road and Medical Center Drive, two local roadways, in association with the “Eds and Meds” Revitalization Area—involving Rowan University, Kennedy Hospital, and the former Bradlees Shopping Center properties—with two vehicular lanes, in Stratford Borough – to supply an alternate route to County Route 673 (Laurel Road) through the US 30 (White Horse Pike) and County Route 702 (Berlin Road) intersection, and increase accessibility to PATCO’s and NJTransit’s Lindenwold stations ($4 million for roadway improvements).
– Figure D-5 (page D-6) – Natural Features along the Medical Center Drive/New Road Extension Improvement.
– Figure D-6 (page D-7) – Human Environments along the Medical Center Drive/New Road Extension Improvement.
Cross Keys Road between US 30 and County Route 706 - Widen County Route 689 (Berlin-Cross Keys Road) to five vehicular lanes through Gloucester and Winslow townships – to reduce existing congestion and serve cross-county mobility for the long term ($20 million).
– Figure D-7 (page D-8) – Natural Features along the Cross Keys Road Widening Project.
– Figure D-8 (page D-9) – Human Environments along the Cross Keys Road Widening Project.
Page D-1

Camden County Highway Plan
Figure D-1: Natural Features Near the Atco Station Access Improvement
DVRPC, 2015
Page D-2

Camden County Highway Plan
Figure D-2: Human Environments Near the Atco Station Access Improvement
DVRPC, 2015
Page D-3

Camden County Highway Plan
Figure D-3: Natural Features Near the Atlantic City Expressway Interchange Improvement
DVRPC, 2015
Page D-4

Camden County Highway Plan
Figure D-4: Human Environments Near the Atlantic City Expressway Interchange Improvement
DVRPC, 2015
Page D-5

Camden County Highway Plan
Figure D-5: Natural Features Along the Medical Center Drive/New Road Extension Improvement
DVRPC, 2015
Page D-6

Camden County Highway Plan
Figure D-6: Human Environments Along the Medical Center Drive/New Road Extension Improvement
DVRPC, 2015
Page D-7

Camden County Highway Plan
Figure D-7: Natural Features Along the Cross Keys Road Widening Project
DVRPC, 2015
Page D-8

Camden County Highway Plan
Figure D-8: Human Environments along the Cross Keys Road Widening Project
DVRPC, 2015
Page D-9


Publication Title: Camden County Highway Plan
Publication Number: 14016
Date Published: March 2015
Geographic Area Covered: Camden County, New Jersey
Key Words: Master Plan, Traffic Safety, Traffic Congestion, Regional Travel Demand Forecast Modeling, VISUM, Growth Management, Congestion Management Process, Transportation Operations, Transportation Improvement Program, Highway Functional Classification, Transportation Asset Management
Abstract: The Camden County Highway Plan was prepared as an element to the update of the overall Camden County Master Plan. The Highway Plan sets the direction for highway infrastructure—and particularly its own county route network—to keep pace with changes expected by 2040. The Master Plan provides the authority for managing the change that will come. Seven significant physical/operational mobility improvement projects, totaling $78 million, were identified along the county route network as specific recommendations to the overall county Master Plan. Of these—the proposed county-wide interconnected and coordinated traffic signal system ($30 million) is the smartest and farthest reaching. The project was conducted alongside the development of the Land Use Plan element and integrated findings from the Bicycling & Multi-Use Trails Plan and Farmland Preservation Plan elements. The project also delivered a linked GIS-asset management database including updated inventories of county roads, bridges, and traffic signals, and relevant outputs from the planning study.
Staff Contact: Jerry Coyne
Manager, Transportation Studies Office of Transportation and Corridor Studies Delaware Valley Regional Planning Commission 190 N. Independence Mall West, 8th Floor Philadelphia, PA 19106-1520
Phone: (215) 238-2850 Fax: (215) 592-9125 Email: [email protected]
Web: www.dvrpc.org

190 N Independence Mall, West
Philadelphia, PA 19106
215-592-1800
www.dvrpc.org