remote sensing and photogrammetry society archaeology special interest group (rspsoc archaeology...
TRANSCRIPT

1
Remote Sensing and Photogrammetry Society Archaeology
Special Interest Group (RSPSoc Archaeology SIG)
Newsletter September 2016

2
Cover image
Dorchester Abbey, Oxfordshire
Dr Christopher Brooke, University of Nottingham
The cover image shows the interior west wall of Dorchester Abbey, Oxfordshire as a normalized
pseudocolour transform of a Contrast Contour Enhancing (CEI) image generated using a 20mW
He-Ne laser. The sinusoidal generated colour table relates to the original 8-bit grey-level values of
the raw image. The method ensures that an exact colour distribution is performed across the entire
tonal range, and all 256 values are plotted. The wall appears to the naked eye as a flat, uniform,
and featureless plastered surface.
A left-right (south-north) feature is revealed (shown as red, or higher level reflection values) above
the initial, lower plaster projection. This area is seen as a generally raised (or perhaps thicker) level
of plaster and is probably caused by an elevated level in the underlying fabric of the wall. Specific
anomalies are also revealed: elliptical areas of raised plaster, and a diagonal anomaly. The lower
horizontal band may be disregarded as a modern intrusion but the higher level band, shown within
the green/blue zone, is a true feature and may represent a building break, or seasonal halt.
The interpretation of this image, along with many others using similar ground-based remote
sensing methodology, reveals that the wall was probably constructed in a broadly single phase
between AD 1602-3, but that discrete anomalies exist that relate to its construction, perhaps
involving seasonal breaks in work and minor alterations during building.

3
Contents
Contents
Editors’ note ........................................................................................................................................... 4
A year with Historic England’s Geospatial Imaging team................................................................. 5
Li Sou, CIfA Specialist Placement in Geospatial Investigation Techniques .............................................
Using remote sensing in West African archaeology: challenges and prospects ............................. 10
Nadia Khalaf, Post Doctoral Research Associate, Durham University ....................................................
Using satellite imagery to record endangered archaeology ............................................................. 15
Louise Rayne and Robert Bewley, EAMENA ........................................................................................

4
Editors’ note
Dear all,
Welcome to the September 2016 edition of the RSPSoc Archaeology SIG newsletter! This year,
we have begun to increase the level of activity of the SIG. We will be producing two newsletters a
year and presenting research on remote sensing and archaeology at the annual RSPSoc conference,
this year in Nottingham (5th-8th September). Look out for more news in our email updates.
We’d like to take this opportunity to call for submissions of articles and notices of upcoming
events for the next newsletter, to be distributed in the spring of 2017. Articles should deal with
the subject of archaeology and remote sensing/photogrammetry and be a maximum of 1000 words
with up to 4 images. Please append your contact details. The deadline for submissions is Monday
30th January. Email articles and any queries to [email protected].
We are aiming to encourage the exchange of research between remote sensing specialists and
archaeologists. This newsletter demonstrates some current examples of this research, from SfM
photogrammetry undertaken at Carlisle Castle by Historic England’s Geospatial Imaging team to
mapping endangered archaeology in Africa.
Louise Rayne and Chris Brooke (SIG convenors and newsletter editors).

5
A year with Historic England’s Geospatial Imaging team
Li Sou, CIfA Specialist Placement in Geospatial Investigation Techniques
I started working with Historic England’s Geospatial Imaging team last November as a Specialist
Placement funded by the Chartered Institute for Archaeologists, having come from an
archaeological background. In this article, I’ll briefly outline the different research projects I have
been involved with, using laser scanning and Structure-from-Motion (SfM) photogrammetry, that
are soon to be released online as Historic England Research Reports.
Historic England’s Geospatial Imaging team are part of the organisation’s Research Group. The
team conducts its own survey work, in addition to advising and organising the procurement of
surveys, and have published metric survey specifications for cultural heritage (Andrews, Bedford
and Bryan 2015). They respond to survey requests from other Historic England departments, in
addition to English Heritage, as part of the companies’ shared service agreements. Through such
requests, three separate research projects developed to record and observe archaeological features
at Carlisle Castle, the market town of Leek, and medieval artefacts originating from Rievaulx
Abbey.
The Carvings of Carlisle Castle
Carlisle Castle, situated in Carlisle, Cumbria, was in use as a military base for 900 years, and
originated in the 12th century. Many renovations and additions to the castle complex were made
over time, and as such, a palimpsest of modifications can be found throughout many of the castle’s
structures. Reflecting these changes through time are the carvings and graffiti that are scattered
over the site. Prior to this project, many have never been officially recorded, and none of them
have been surveyed using modern laser scanning and SfM photogrammetric techniques. A well-
known but little-researched set of medieval carvings located in a room in the castle’s keep, known
as “The Prisoners’ Carvings”, in addition to the original oak door connecting to the room, were
recorded using a terrestrial laser scanner and DSLR photography for SfM photogrammetry.

6
The 3D data produced is currently being analysed to study the similarities in the form of the
carvings, which range from heraldic emblems, Christian symbols, battling knights, hunting animals
and other, more enigmatic etchings (figure 1). Additionally, a qualitative comparison between the
datasets is envisioned, with a focus on the oak door, which is strongly dark in colour and has a
high polish; two aspects that are known to negatively affect the quality of laser scan data and SfM
photogrammetry processing.
The 3D mesh analyses are currently on-going, with the final research report expected for
completion in autumn 2016.
Medieval Sculpture in Leek
Three scheduled ancient crosses situated in the market town of Leek, Staffordshire, have
previously been listed on the Heritage at Risk Register as they are under the continued threat of
weathering (figure 2). As a result, 3D models of the current condition of the crosses were requested
to produce a digital record of their condition to be archived with Historic England and
Staffordshire County Council HER.
Over the course of producing the 3D imagery using SfM photogrammetry, with control points
taken from laser scan data, some previously unmentioned carvings were noted on the market cross.
In addition, the 3D data enabled a runic inscription to be highlighted, which was carved onto the
lower end of one of the Saxon crosses. By virtually processing images of the inscription with
Reflectance Transformation Imaging, it was possible to outline the relief and depth of the runes,
providing an aid to deciphering them.
The research report for this project is complete and currently under review.
3D modelling artefacts from Rievaulx Abbey
The visitor centre and on-site museum at Rievaulx Abbey was re-designed and opened in spring
2016. Alongside this was a major transferral of artefacts held in English Heritage’s North Territory
Store in Helmsley, to be put on display. With the move of the physical artefacts away from the
Store, it was proposed to record a selection of them, with the intention of producing detailed 3D
photogrammetric models that may be used for a variety of archiving, educational, promotional
and research purposes. SfM processing of fragments of stonework was particularly successful
(figure 3), and the project is on-going, with aim for completion by the end of October 2016.

7
If you are interested in finding out more about these projects, please contact me at
[email protected]. I am keeping a blog about my archaeological and geospatial
imaging work at https://LiSouBlog.wordpress.com/, so please follow it online if you’d like to
know more.
For enquiries about the Geospatial Imaging team and their work, please contact Paul Bryan,
Geospatial Imaging Manager: [email protected].
Figure 1: Section of wall featuring medieval carvings, including a crowned leopard (centre right).
© Historic England

8
Figure 2: Still screenshots of textured 3D models of the remains of two Anglo-Saxon cross shafts
situated in St Edward the Confessor churchyard, featuring scrollwork motifs (left and centre), and
a third, later medieval market cross (right). Images not to scale.
© Historic England

9
Figure 3: still screenshot of the textured 3D model of a wall frieze fragment from Rievaulx Abbey,
depicting a tigress looking into a reflection of herself in a mirror.
© Historic England
Bibliography
Andrews, D., Bedford, J. and Bryan, P. 2015. Metric Survey Specifications for Cultural Heritage, Third
edition, Historic England, Swindon.

10
Using remote sensing in West African archaeology: challenges and prospects
Nadia Khalaf, Post Doctoral Research Associate, Durham University
Currently, the use of remote sensing to study archaeological sites in sub Saharan Africa is idle.
During the recent SAfA (Society for Africanist Archaeologists) biennial conference only one
session was dedicated to ‘spatial archaeometry’ and of the nine papers in this session, only two
discussed the use of earth observation as a tool to investigate archaeological sites in sub-Saharan
Africa. This is further iterated by Magnavita (2016) who argues that satellite imagery and airborne
surveys have been under exploited and will provide considerable benefits for field research in
Africa.
At SAfA I presented my recently completed doctoral research project which investigated the use
of satellite remote sensing as a tool for archaeologists analysing the landscape of the Niger River
Valley in the Republic of Benin. This area had not been studied archaeologically prior to the
European Research Council funded project Crossroads of Empires conducted at the Sainsbury
Research Unit, University of East Anglia. Originally, the research intended to identify
archaeological sites using Google Earth and high-resolution satellite imagery and ground truth
them with field walking, much how this technology is used in North Africa and the Middle East.
However, these sites are not easily identifiable from aerial imagery. Instead the Niger Valley Survey
Project (NVSP) was a systematic field walking program devised to record archaeological sites
where subsequent analysis with satellite imagery was undertaken. The NVSP revealed the locations
of over 300 archaeological sites, bringing the overall total in the area to over 800 (Fig. 1).
Two types of imagery were used to highlight the usefulness of remote sensing as a tool for
investigating archaeology in this region. The first was high resolution imagery purchased from
DigitalGlobe, and the second was free imagery available for download from the United States
Geological Service (USGS). The high resolution image was taken from the Quickbird-2 sensor and
was used to try and identify the 26 hectare settlement mound of Birnin Lafiya, which was being
excavated by the Crossroads of Empires project (see Haour et al., 2016 for further detail). Quickbird-2
multispectral imagery has four bands, plus a panchromatic band. The spatial resolution of the
image is 2.4m for the multispectral bands and 0.6m for the panchromatic band. When conducting
a standard visual inspection of the unprocessed image it was difficult to detect the parameters of
the site, therefore several algorithms were used to manipulate the image. Some processes had better
success than others. The most successful was panchromatic sharpening of the image which was

11
undertaken in an effort to reveal spectral differences in the earth’s surface by showing potential
earthworks and subsurface remains of archaeological sites (an approach developed successfully by
De Laet et al., 2007 and Masini and Lasaponara (2007)). The results of this process are shown in
Fig. 2. A slight spectral change can be seen where the archaeological site is located in the pan
sharpened image. This bodes well for the identification of more archaeological sites in the region.
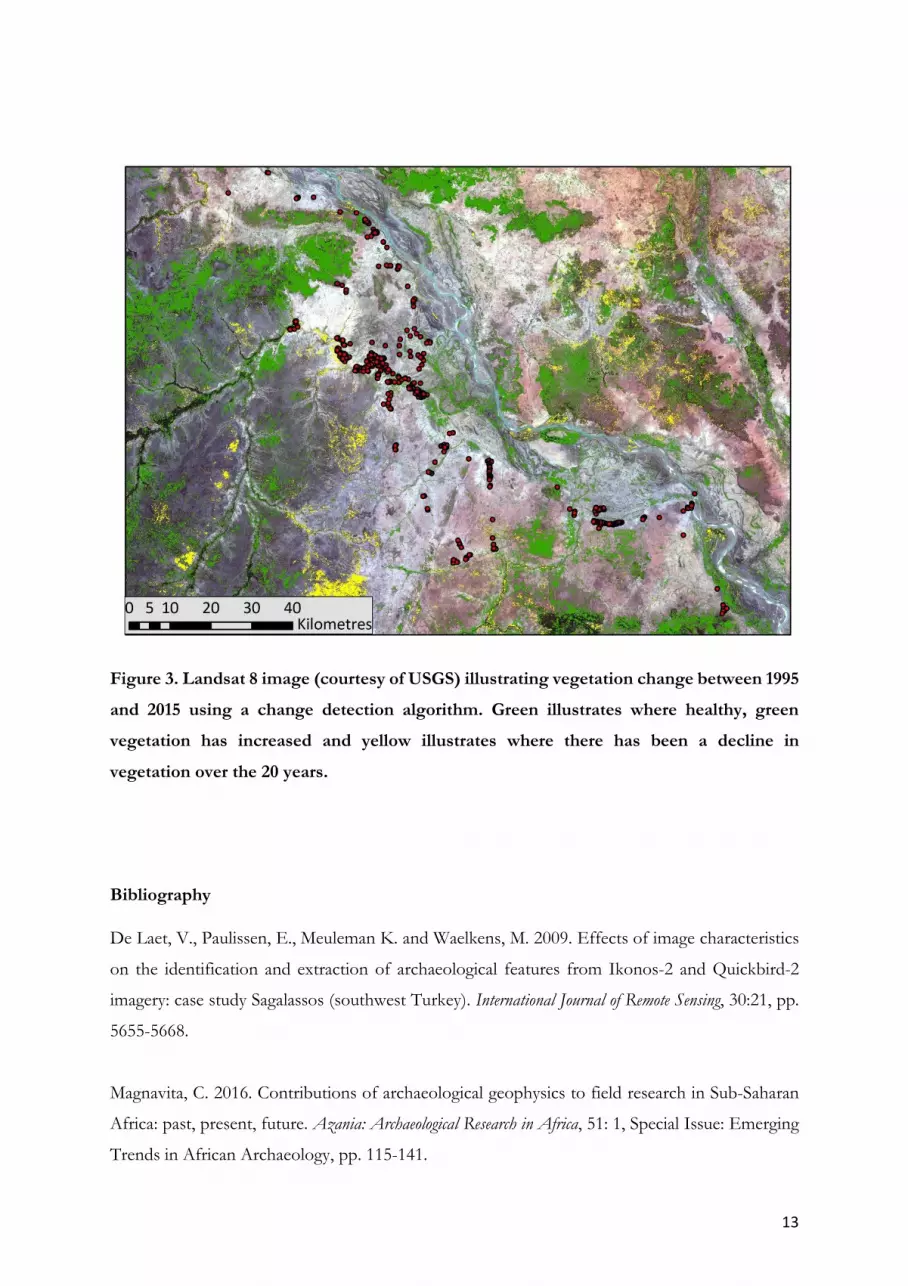
A free satellite image of the area was taken from the Landsat 8 multispectral sensor. This image
had a very different function to the high resolution image. Instead of site identification, the Landsat
8 data was used to consider erosion and destruction of the archaeological sites in the area. The
population in this region has doubled over the past 20 years and as a result, cultivation and
irrigation of the land has increased. These anthropogenic and environmental processes have
caused erosion and destruction of the sites in the region, which could be seen during the field
survey. Water and vegetation indices using Normalized Difference Water Index (NDWI) and
Normalised Difference Vegetation Index (NDVI) were calculated over a 20 year period between
1995 and 2015. The results of both analyses echoed the same outcome, and that was vegetation
and surface water had vastly increased over the past 20 years. The result of the NDVI is shown in
Fig. 3. The green areas illustrate the areas where the vegetation has increased from 1995 to 2015
and the yellow areas show decrease in vegetation. It is useful to see the areas where the vegetation
and surface water has increased in order to monitor sites that are at risk. For example where
increase in vegetation and surface water is rapid over a small period of time, then the site is more
likely at risk from destruction.
This short paper demonstrates the vast opportunities available to archaeologists in Africa by using
satellite remote sensing. Many surveys and excavations have been carried out in the region and
these can be easily monitored using readily available satellite imagery. Furthermore, there is
potential to use high resolution satellite imagery for site identification, if the location of known
sites is available.

12
Figure 1. Landsat 8 image showing all archaeological sites discovered during field walking
along the Niger River Valley in the Republic of Benin between 2011-2014.
Figure 2. Pan sharpened Quickbird-2 image of the site Birnin Lafiya, Republic of Benin.
Image on the left shows a digital elevation model (DEM) of the settlement mound and the
image of the right shows the slight spectral difference of the earth surface where the site
is located.
13
Figure 3. Landsat 8 image (courtesy of USGS) illustrating vegetation change between 1995
and 2015 using a change detection algorithm. Green illustrates where healthy, green
vegetation has increased and yellow illustrates where there has been a decline in
vegetation over the 20 years.
Bibliography
De Laet, V., Paulissen, E., Meuleman K. and Waelkens, M. 2009. Effects of image characteristics
on the identification and extraction of archaeological features from Ikonos-2 and Quickbird-2
imagery: case study Sagalassos (southwest Turkey). International Journal of Remote Sensing, 30:21, pp.
5655-5668.
Magnavita, C. 2016. Contributions of archaeological geophysics to field research in Sub-Saharan
Africa: past, present, future. Azania: Archaeological Research in Africa, 51: 1, Special Issue: Emerging
Trends in African Archaeology, pp. 115-141.

14
Haour, A., Nixon, S., N’Dah, D., Magnavita, C. and Livingstone Smith, A. 2016. The settlement
mound of Birnin Lafiya, Republic of Benin: new evidence from the eastern arc of the Niger River,
c. fourth to thirteenth centuries AD. Antiquity, 90:351, pp. 695-710.
Lasaponara, R. and Masini, N. 2007. Detection of archaeological crop marks by using satellite
Quickbird multispectral imagery. Journal of Archaeological Science, 34, pp. 214–221.

15
Using satellite imagery to record endangered archaeology
Louise Rayne and Robert Bewley, EAMENA
[email protected] and [email protected]
The Endangered Archaeology of the Middle East and North Africa (EAMENA) project
EAMENA is a joint project between the Universities of Leicester and Oxford, funded by the
Arcadia Fund, with the aim of documenting archaeological sites to protect those under the greatest
threat of destruction and damage throughout the Middle East and North Africa. Using a remote
sensing methodology to identify sites and the Arches software platform for recording them we are
building and updating a detailed database of sites that are threatened, damaged or already destroyed
(Figure 1). These data are being provided to people and organisations with the responsibility to
protect cultural heritage in the Middle East and North Africa. We are working in close
collaboration with all the relevant authorities.
Remote sensing methodology
We are undertaking image interpretation to identify archaeological sites using Google Earth, some
recent high-resolution satellite imagery and some historical aerial photographs and
decommissioned spy satellite images in conjunction with survey and excavation data, where
available. Sites are initially examined using Google Earth by specialists in the archaeology of the
Middle East and North Africa. The morphology, form, interpretation and state of preservation of
the sites are recorded in the EAMENA database, using standardised terminology. This allows
inexpensive and rapid recording of sites which are at risk, often allowing recent changes to be
measured and allowing archaeologists to target their fieldwork and cultural protection efforts.
Case studies
For specific areas, for example the Al-Jufra oases in Libya, a more in-depth analysis has been
undertaken using high-resolution satellite imagery, historic aerial photographs, decommissioned
spy satellite images and multispectral imagery. Located in the Sahara, the oases consist of three
central towns (Hun, Waddan and Sukna) with irrigated gardens. The expansion of agriculture in

16
al-Jufra was measured using Landsat images in order to assess its impact on archaeology. The
SAVI (Soil Adjusted Vegetation Index) images (Figure 2) show that agriculture has expanded
rapidly since the 1970s, from around 617 ha in 1975 to 10130 ha in 2016. It has directly impacted
on the preservation of archaeological sites, especially many ancient water management systems.
Modern urban expansion is one of the major causes of damage to archaeological sites in the region.
This is particularly noticeable around the Roman site of Cyrene in Libya. Aerial photographs dating
to 1949 and a declassified spy satellite image (KH7) from 1966 were orthorectified and compared
to a WorldView-3 image from 2015. The comparison shows that the town of Shahat has expanded
with the construction of new roads and buildings. This construction work has caused features
including rock-cut tombs (marked 4 on Figure 3) to be demolished, some of which can now only
be recorded from the older images.
The data so far
In 2015 and 2016, the first two years of the EAMENA project, significant progress was made (see
www.eamena.org). A database structure was designed which allowed recording of archaeological
sites and an assessment of the causes of damage. Records for over 90,000 sites have been created
so far in Egypt, Iraq, Iran, Jordan, Libya, Morocco, Saudi Arabia, Syria, and Yemen, representing
a wide range of sites (from prehistoric burials to twentieth century military installations). The
causes of damage include looting and the impact of conflict but also agriculture, dam building,
road construction and modern development.
Fieldwork was also undertaken by Leicester members of the project in several locations including
in the Wadi Draa, Morocco in November 2015. Here, an ancient city in the region was under
severe threat of destruction, but the project was able to aid and support the local archaeologists in
halting the ongoing damage. We are now working with the Ministry of Culture and the local
community to help secure more lasting protection and recognition of the remains.
We are now developing a strategy for the incorporation of archived historic imagery into our
database, with the recent addition of the work of Sir Aurel Stein in Transjordan in the 1930s (see
www.apaame.org). We have been involved in training, outreach and dissemination activities. These
included a successful training course for Libyan archaeologists held in Leicester in March 2016
(Figure 4). Since the start of the project other highlights have included the Protecting the Past
conference in Jordan, in September 2015, a day seminar at St John’s College, Oxford, and meetings
with key partners in Geneva, Atlanta and Washington DC. Reports to Departments of Antiquities

17
on specific sites and the impacts of known threats have been prepared for areas in Jordan, Libya
and Morocco. We are also continuing to establish contacts and partnerships with many
organisations in order to facilitate data acquisition and sharing, including satellite companies and
universities.
Our ongoing work includes further recording using satellite imagery and fieldwork, as well as
planning for future training courses and partnerships, and translation of the website and database
into Arabic. As we develop our database, we will be able to undertake more extensive analyses on
the extent and nature of the threats to the archaeology of the region as a whole. Access to the
database is available online, through a registration process on the website (www.eamena.org).
Archaeologists cannot expect to save every archaeological site from either damage or even
destruction but we do have a duty to record as much of the remains of past human activity as
possible. The Endangered Archaeology project is making a rapid documentation and assessment
of what exists in highly sensitive locations where the archaeological resource is very significant and
there is a good preservation. It is a race against time but with the availability of good quality
satellite imagery and other associated data we are able to make good progress.
Figure 1: EAMENA database so far.

18
Figure 2: Landsat 2 SAVI from 1975 and Landsat 8 SAVI from 2016 showing increase in cultivated
area.

19
Figure 3: Archaeological sites immediately outside the acropolis of Cyrene have been damaged,
and are at risk of further damage, by construction activities.

20
Figure 4: EAMENA training course held in Leicester in March 2016.
21
Remote Sensing and Photogrammetry Society Archaeology Special
Interest Group (RSPSoc Archaeology SIG)