relativistic particle identification by de/dx
TRANSCRIPT
RELATIVISTIC PARTICLE IDENTIFICATION BY dE/dx:
THE FRUITS OF EXPERIENCE WITH ISIS
W.W.M. Allison Department of Nuclear Physics, Oxford University, Oxford, UK.
The experience of ten years of studying dE/dx is summarised. First, a helpful, if qualitative, picture of the electromagnetic field of a relativistic particle passing through a medium is discussed. Second, the salient steps in a rigorous calculation of dE/dx are outlined. Results of calculations for a variety of gas- es and configurations are given and the weakness of the calculation is pointed out. In the third section the practical experience gained from the ISIS project is discussed. The systematic effects that have been over- come are listed and the status and successes achieved with ISIS1 and ISIS2 to date are described.
A Qualitative Picture of the Field of a Particle in aMedium
A charged particle passing through a medium carries with it a pulse of electromagnetic field. To simplify the picture we may ignore the vector nature of the field and pretend that we are working in two dimensions only - x in the direction of the particle velocity 1 and y transverse. The pulse is made up of a full spectrum of frequency components. Let us consider the component of frequency w and suppose that the phase velocity of e.m. waves of frequency w in the dispersive medium is u (w). This component will have a wave-vector k which must - satisfy:
$= u.
Furthermore, since the phase of the component is static as seen by an observer co-moving with the charged particle, the x-component of k must satisfy:
$= v- (or w = k.v) --
The transverse component of k is therefore given by
ky=;($- l+
There are two cases of interest.
YO = % ‘y’
The transverse range of the e.m. field expands with a factor B'y' as the Cerenkov threshold is approached. It is this expansion, normally referred to as the relativ- istic expansion but in reality only depending on the wave nature of the field, which is responsible for the 'relativistic rise' of the ionisation cross section for a particle moving in a medium.
Relativistic kinematics only enters through the limit v < c. There are then two cases of interest. First, below the principal absorption lines and in the optical region where the refractive index is greater than unity, u < c and the field expands as v is increas- ed and the Cerenkov threshold may be reached. Second, in the U.V. and X-ray regions where the refractive index is less than unity, u > c and, although the field starts to expand as v is increased, the Cerenkov threshold is beyond the limit v = c. The expansion therefore satur- ates with a maximum range
Expressed in terms of the refractive index n = E and
the familiar 8 = K and y = (1 - B*) -1
YO = %3[-$- + (l-n2)B2] -1
which is effectively reached already when 8 = n. This is the Fermi plateau region. The saturation is some- times called the density effect because its onset dep- ends on the density through n.
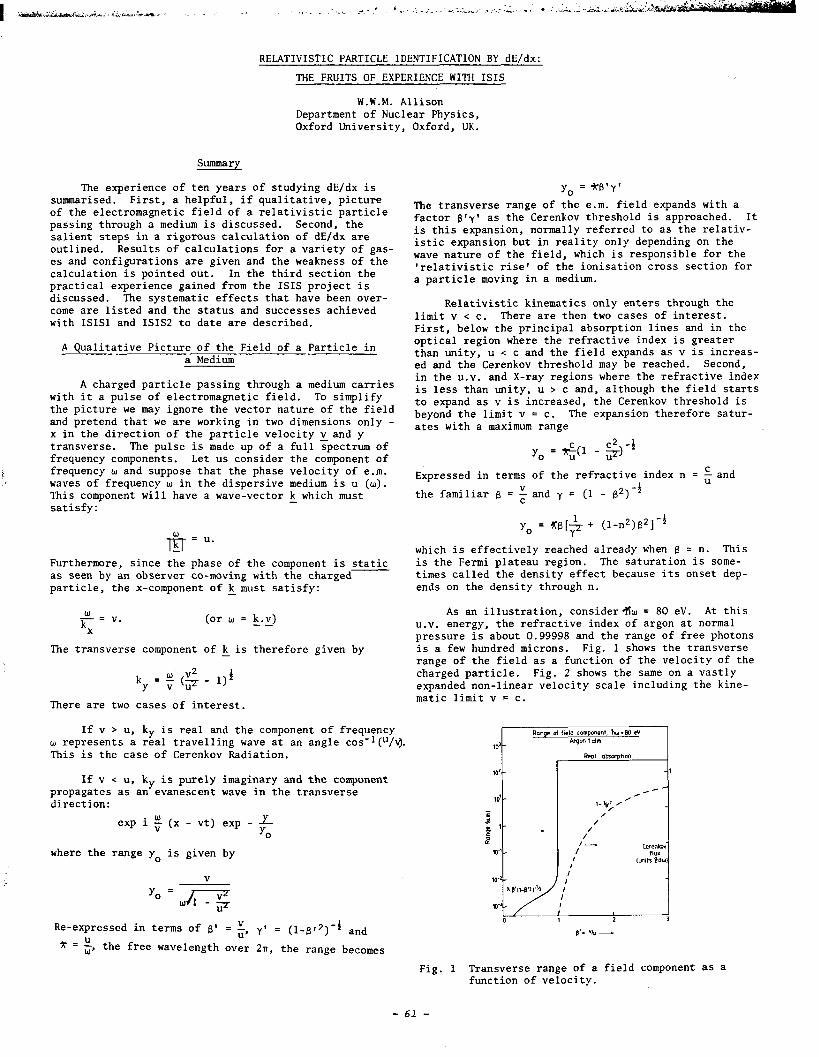
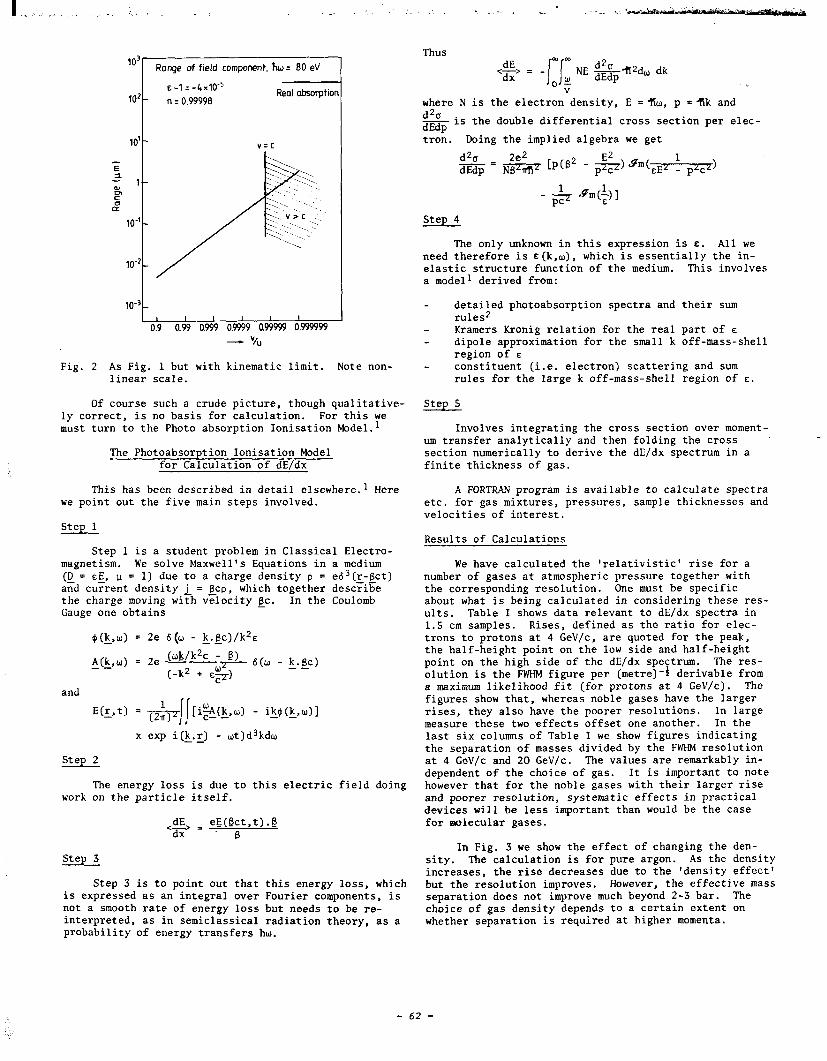
As an illustration, consider+% = 80 eV. At this U.V. energy, the refractive index of argon at normal pressure is about 0.99998 and the range of free photons is a few hundred microns. Fig. 1 shows the transverse range of the field as a function of the velocity of the charged particle. Fig. 2 shows the same on a vastly expanded non-linear velocity scale including the kine- matic limit v = c.
If v > u, ky is real and the component of frequency w represents a real travelling wave at an angle cos-l(u/*. This is the case of Cerenkov Radiation.
If v < u, ky is purely imaginary and the component propagates as an evanescent wave in the transverse direction:
exp i t (x - vt) exp - + 0
where the range y, is given by
Y. = h &lb5
Re-expressed in terms of B' = t, yt = (l-812)-4 and * = $ the free wavelength over 2n, the range becomes
Fig. 1 Transverse range of a field component as a function of velocity.
- 61 -
I ,, -. . ,
Rnnge of field component. hw= 80 eV ,I;
‘o-3l 0.9 0.99 0.999 0.9999 QW9W 0.999999
- v/u
Fig. 2 As Fig. 1 but with kinematic limit. Note non- linear scale.
Of course such a crude picture, though qualitative- ly correct, is no basis for calculation. For this we must turn to the Photo absorption Ionisation Mode1.l
The Photoabsorption Ionisation Model for Calculation of dE/dx
This has been described in detail elsewhere.’ Here we point out the five main steps involved.
1 Step
Step 1 is a student problem in Classical Electro- magnetism. We solve Maxwell’s Equations in a medium (g = EL, u = 1) due to a charge density p = es3(r-Bct) and current density i = cp, which together descFii5k the charge moving with velocity EC. In the Coulomb Gauge one obtains
$(k,w) = 2e 6(0 - k.Bc)/k*c --
A(k,w) = 2e bk/k*c - B) 6cw _ k Bcl --
(-k2 L
+ “$1 -*-
and
x exp i(k.r) - wt)d3kdw --
2 Step
The energy loss is due to this electric field doing work on the particle itself.
dE eE(Bct,t) .@ ‘g= .~ B
3 Step
Step 3 is to point out that this energy loss, which is expressed as an integral over Fourier components, is not a smooth rate of energy loss but needs to be re- interpreted, as in semiclassical radiation theory, as a probability of energy transfers hw.
Thus dE
z- = V
where N is the electron density, E = ?Iw, p = ?ik and d*o - is the double differential cross section per elec- dEdp tron. Doing the implied algebra we get
d% PE dEdp
Step 4
The only unknown in this expression is E. All we need therefore is E (k,w), which is essentially the in- elastic structure function of the medium. This involves a model1 derived from:
detailed photoabsorption spectra and their sum rules2 Kramers Kronig relation for the real part of L dipole approximation for the small k off-mass-shell region of E constituent (i.e. electron) scattering and sum rules for the large k off-mass-shell region of E.
Step 5
Involves integrating the cross section over moment- um transfer analytically and then folding the cross section numerically to derive the dE/dx spectrum in a finite thickness of gas.
A FORTRAN program is available to calculate spectra etc. for gas mixtures, pressures, sample thicknesses and velocities of interest.
Results of Calculations
We have calculated the ‘relativistic’ rise for a number of gases at atmospheric pressure together with the corresponding resolution. One must be specific about what is being calculated in considering these res- ults. Table I shows data relevant to dE/dx spectra in 1.5 cm samples. Rises, defined as the ratio for elec- trons to protons at 4 GeV/c, are quoted for the peak, the half-height point on the low side and half-height point on the high side of the dE/dx spectrum. The res- olution is the FWHM figure per (metre)-4 derivable from a maximum likelihood fit (for protons at 4 GeV/c). The figures show that, whereas noble gases have the larger rises, they also have the poorer resolutions. In large measure these two effects offset one another. In the last six columns of Table I we show figures indicating the separation of masses divided by the FWHM resolution at 4 GeV/c and 20 GeV/c. The values are remarkably in- dependent of the choice of gas. It is important to note however that for the noble gases with their larger rise and poorer resolution, systematic effects in practical devices will be less important than would be the case for molecular gases.
In Fig. 3 we show the effect of changing the den- sity. The calculation is for pure argon. As the density increases, the rise decreases due to the ‘density effect’ but the resolution improves. However, the effective mass separation does not improve much beyond 2-3 bar. The choice of gas density depends to a certain extent on whether separation is required at higher momenta.
- 62 -
:
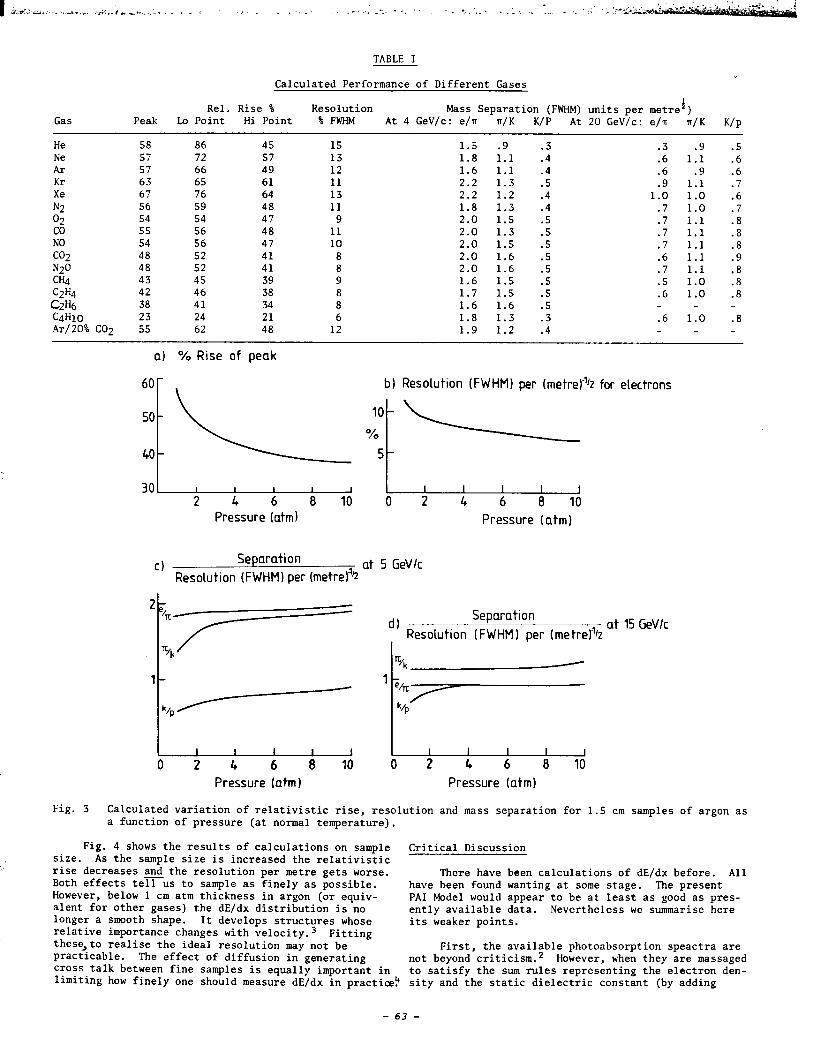
TABLE I
Calculated Performance of Different Gases
Gas Rel. Rise % Resolution Mass Separation (FNHM) units per metre')
Peak Lo Point Hi Point % FWHM At 4 GeV/c: e/n n/K K/P At 20 GeV/c: e/n n/K K/P
He Ne Ar Kr Xe N2 02 co NO CO2
2ly C2H4 C2H6 C4H10 Ar/20% CO2
58 86 45 15 1.5 .9 .3 57 72 57 13 1.8 1.1 .4 57 66 49 12 1.6 1.1 .4 63 65 61 11 2.2 1.3 .5 67 76 64 13 2.2 1.2 .4 56 59 48 11 1.8 1.3 .4 54 54 47 9 2.0 1.5 .5 55 56 48 11 2.0 1.3 .5 54 56 47 10 2.0 1.5 .5 48 52 41 8 2.0 1.6 .5 48 52 41 8 2.0 1.6 .5 43 45 39 9 1.6 1.5 .5 42 46 38 8 1.7 1.5 .5 38 41 34 8 1.6 1.6 .5 23 24 21 6 1.8 1.3 .3 55 62 48 12 1.9 1.2 .4
.3 .9 .5
.6 1.1 .6
.6 .9 .6
.9 1.1 .7 1.0 1.0 .6
.7 1.0 .7
.7 1.1 .8
.7 1.1 .8
.7 1.1 .8
.6 1.1 .9
.7 1.1 .8
.5 1.0 .8
.6 1.0 .8
.6 1.0 .8
a) % Rise of peak
b) Resolution (FWHMI per (metre)42 for electrons
2 4 6 8 10 0 2 4 6 8 10 Pressure (atm) Pressure (atm)
0 Separation
Resolution (FWHMI per (metrefh at 5 GeVlc
d) Separation
Resolution (FWHM) per (metreJ% at 15 GeVlc
1
I I 1 1 I 1 I I I I I
0 2 4 6 8 10 I 2 4 6 8 10 Pressure Iatm 1 Pressure (atm)
Fig. 3 Calculated variation of relativistic rise, resolution and mass separation for 1.5 cm samples of argon as a function of pressure (at normal temperature).
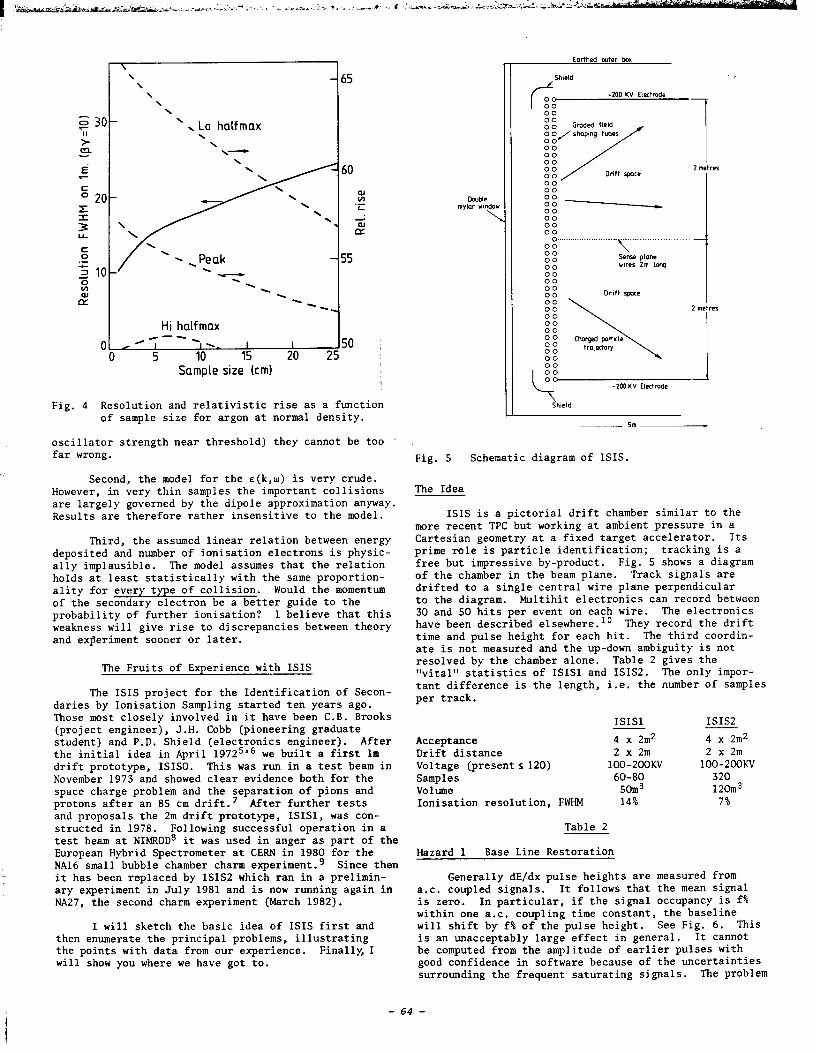
Fig. 4 shows the results of calculations on sample size. As the sample size is increased the relativistic rise decreases and the resolution per metre gets worse. Both effects texus to sample as finely as possible. However, below 1 cm atm thickness in argon (or equiv- alent for other gases) the dE/dx distribution is no longer a smooth shape. It develops structures whose relative importance changes with velocity.3 Fitting these,to realise the ideal resolution may not be practicable. The effect of diffusion in generating cross talk between fine samples is equally important in limiting how finely one should measure dE/dx in practice?
Critical Discussion
There have been calculations of dE/dx before. All have been found wanting at some stage. The present PA1 Model would appear to be at least as good as pres- ently available data. Nevertheless we summarise here its weaker points.
First, the available photoabsorption speactra are not beyond criticism.2 However, when they are massaged to satisfy the sum rules representing the electron den- sity and the static dielectric constant (by adding
- 63 -
’ , Lo halfmax \
Hi halfmax /----\ I I 50
5 IO 15 20 25 Sample size km)
Fig. 4 Resolution and relativistic rise as a function of sample size for argon at normal density.
oscillator strength near threshold) they cannot be too far wrong.
Second, the model for the c(k,W) is very crude. However, in very thin samples the important collisions are largely governed by the dipole approximation anyway. Results are therefore rather insensitive to the model.
Third, the assumed linear relation between energy deposited and number of ionisation electrons is physic- ally implausible. The model assumes that the relation holds at least statistically with the same proportion- ality for every type of collision. Would the momentum of the secondary electron be a better guide to the probability of further ionisation? I believe that this weakness will give rise to discrepancies between theory and experiment sooner or later.
The Fruits of Experience with ISIS
The ISIS project for the Identification of Secon- daries by Ionisation Sampling started ten years ago. Those most closely involved in it have been C.B. Brooks (project engineer), J.H. Cobb (pioneering graduate student) and P.D. Shield (electronics engineer). After the initial idea in April 19725'6 we built a first lm drift prototype, ISISO. This was run in a test beam in November 1973 and showed clear evidence both for the space charge problem and the separation of pions and protons after an 85 cm drift.7 After further tests and proposals the 2m drift prototype, ISISl, was con- structed in 1978. Following successful operation in a test beam at NIMRODB it was used in anger as part of the European Hybrid Spectrometer at CERN in 1980 for the NA16 small bubble chamber charm experiment.g Since then it has been replaced by ISIS2 which ran in a prelimin- ary experiment in July 1981 and is now running again in NA27, the second charm experiment (March 1982).
I will sketch the basic idea of ISIS first and then enumerate the principal problems, illustrating the points with data from our experience. Finally, I will show you where we have got to.
Earthed cuter bax
SheId
-200 KV Ektrnde
00 00 00 Gmded field
::
:: 0..
::
:: sense pbane r1rer 2m keg
00 00 ;: Draft spare
-2OOKV Eledmde
1 2 met i
2 me
I
~ 5m
Fig. 5 Schematic diagram of ISIS.
The Idea
ISIS is a pictorial drift chamber similar to the more recent TPC but working at ambient pressure in a Cartesian geometry at a fixed target accelerator. Its prime role is particle identification; tracking is a free but impressive by-product. Fig. 5 shows a diagram of the chamber in the beam plane. Track signals are drifted to a single central wire plane perpendicular to the diagram. Multihit electronics can record between 30 and 50 hits per event on each wire. The electronics have been described elsewhere.'O They record the drift time and pulse height for each hit. The third coordin- ate is not measured and the up-down ambiguity is not resolved by the chamber alone. Table 2 gives the "vital" statistics of ISIS1 and ISISZ. The only impor- tant difference is the length, i.e. the number of samples per track.
ISIS1 ISIS2 Acceptance 4 x 2m2 4 x 2m2 Drift distance 2 x 2m 2 x 2m Voltage (presents 120) loo-2ooKV loo-200KV Samples 60-80 320 Volume 5om3 12Om3 Ionisation resolution, FWHM 14% 7%
Table 2
Hazard 1 Base Line Restoration
Generally dE/dx pulse heights are measured from a.c. coupled signals. It follows that the mean signal is zero. In particular, if the signal occupancy is f% within one a.c. coupling time constant, the baseline will shift by f% of the pulse height. See Fig. 6. This is an unacceptably large effect in general. It cannot be computed from the amplitude of earlier pulses with good confidence in software because of the uncertainties surrounding the frequent saturating signals. The problem
- 64 -
cannot be solved with linear filters. There are two solutions. Either you digitise the background level between pulses and correct in the software or you feed- back the background signal level in the electronics it- self. We have chosen the latter method.lO Once this problem is solved one can achieve excellent rejection of low frequency hum or at least its linear consequen- ces.
r --- /
__________ ---__ _._.___________ njc U-i.,.
Fig. 6 a.c. coupled signals
Hazard 2 Pulse Shape
The impulse response of the gas amplifier has a l/t tai1.l’ Inverting this to provide optimal clipping without undershoot is a linear problem. In ISIS we do it with 3 passive filter time constants - 2 is probably enough.
Hazard 3 Shape-Independent Integration of Track Signals
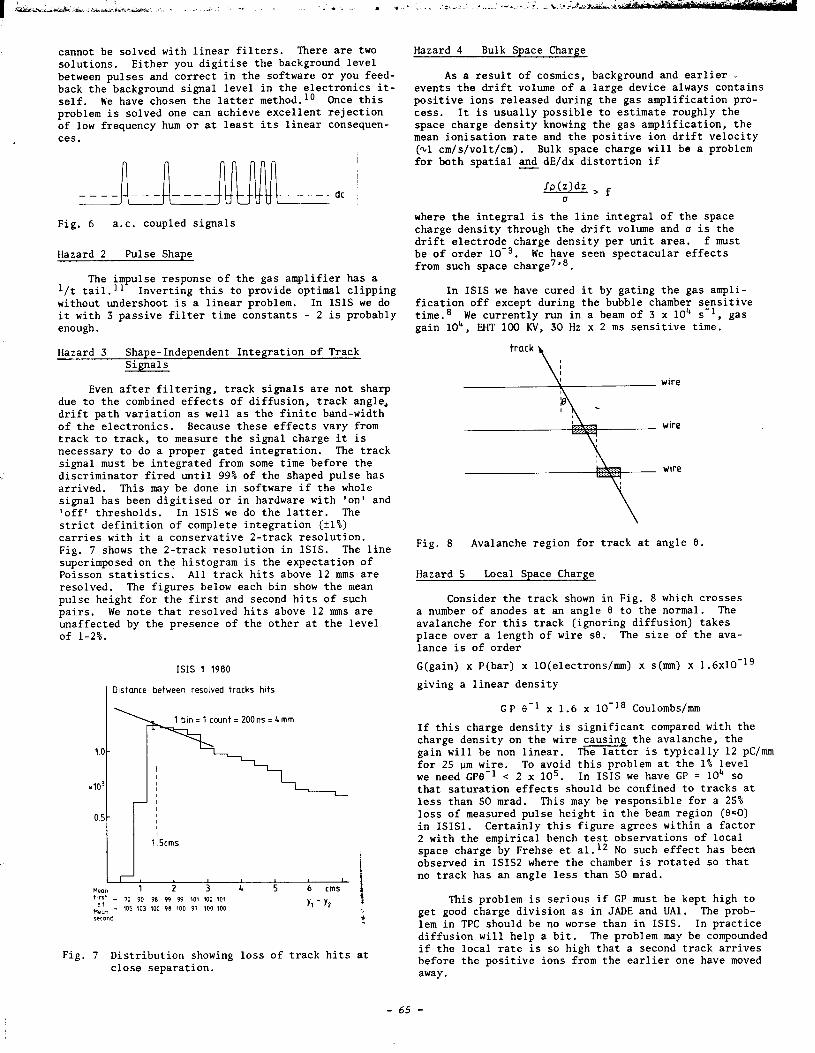
Even after filtering, track signals are not sharp due to the combined effects of diffusion, track angle, drift path variation as well as the finite band-width of the electronics. Because these effects vary from track to track, to measure the signal charge it is necessary to do a proper gated integration. The track signal must be integrated from some time before the discriminator fired until 99% of the shaped pulse has arrived. This may be done in software if the whole signal has been digitised or in hardware with ‘on’ and ‘off’ thresholds. In ISIS we do the latter. The strict definition of complete integration (21%) carries with it a conservative 2-track resolution. Fig. 7 shows the 2-track resolution in ISIS. The line superimposed on the histogram is the expectation of Poisson statistics. All track hits above 12 mms are resolved. The figures below each bin show the mean pulse height for the first and second hits of such pairs. We note that resolved hits above 12 mms are unaffected by the presence of the other at the level of l-2%.
ISIS 1 1980
Distance between resolved tracks hits
Fig. 7 Distribution showing loss of track hits at close separation.
Hazard 4 Bulk Space Charge
As a result of cosmics, background and earlier I events the drift volume of a large device always contains positive ions released during the gas amplification pro- cess. It is usually possible to estimate roughly the space charge density knowing the gas amplification, the mean ionisation rate and the positive ion drift velocity (Ql cm/ s/v01 t/cm) . Bulk space charge will be a problem for both spatial and dE/dx distortion if -
Jp(z)dz > f u
where the integral is the line integral of the space charge density through the drift volume and a is the drift electrode charge density per unit area. f must be of order 10w3. We have seen spectacular effects from such space charge7’8.
In ISIS we have cured it by gating the gas ampli- fication off except during the bubble chamber sensitive time. 8 We currently run in a beam of 3 x lo4 s-l, gas gain 104, EHT 100 KV, 30 Hz x 2 ms sensitive time.
wire
wire
Fig. 8 Avalanche region for track at angle 8.
Hazard 5 Local Space Charge
Consider the track shown in Fig. 8 which crosses a number of anodes at an angle 8 to the normal. The avalanche for this track (ignoring diffusion) takes place over a length of wire se. The size of the ava- lance is of order G(gain) x P(bar) x lO(electrons/mm) x s(mm) x 1.6x10-lg giving a linear density
GP 8-l x 1.6 x lo-l8 Coulombs/mm
If this charge density is significant compared with the charge density on the wire causing the avalanche, the gain will be non linear. The latter is typically 12 PC/mm for 25 pm wire. To avoid this problem at the 1% level we need GPB-l < 2 x 10⁵. In ISIS we have GP = IO4 so that saturation effects should be confined to tracks at less than 50 mrad. This may be responsible for a 25% loss of measured pulse height in the beam region (8=0) in ISISl. Certainly this figure agrees within a factor 2 with the empirical bench test observations of local space charge by Frehse et a1.12 No such effect has been observed in ISIS2 where the chamber is rotated so that no track has an angle less than 50 mrad.
This problem is serious if GP must be kept high to get good charge division as in JADE and UAl. The prob- lem in TPC should be no worse than in ISIS. In practice diffusion will help a bit. The problem may be compounded if the local rate is so high that a second track arrives before the positive ions from the earlier one have moved away.
Hazard 6 Calibration
In every event in ISIS there is both an electronic track fed to all preamps and a false trigger track that samples 'zero pulse height' background. These are mon- itored carefully. ~11 signals are corrected for gain and pedestal variations although the variation is now small enough that this is unnecessary.
Hazard 7 Cross Talk
Capacitative nearest neighbour cross talk is not serious,as shown by Monte Carlo simulation. Diffusion between neighbouring gas samples is potentially more serious. Because the dE/dx distribution is highly skew, cross talk can, not only change the shape of the spec- trum but actually shift the peak. This has not been observed yet. It issmall effect.
Long range coupling between many channels whether capacitative in the chamber or a technical problem in the electronics can be disastrous for the resolution.13 Coherent pick up has the same effect.
Hazard 8 Gas Purity
For long drift paths and accurate pulse heights the gas must be pure. This requires leak tight systems, purification and instrumentation to measure the oxygen concentration. In our experience at purities of 1 part per million and less the latter causes the most trouble. In ISIS2 we are able to measure the attenuation direct- ly by fitting the measured pulse heights on steep tracks. We assume that
an pi = Bn wi - ati
where pi is the measured signal, wi is a sample from a dE/dx distribution uncorrelated with ti where ti is the drift time. Moments accumulated for a track give a value of a. A thousand or so tracks give a distri- bution of attenuation factors a which enable the loss
factor to be determined with an error of order 1%. Our best performance so far is about 14% loss on 2 metres. We expect a significant improvement on this soon.
Ionisation Fitting
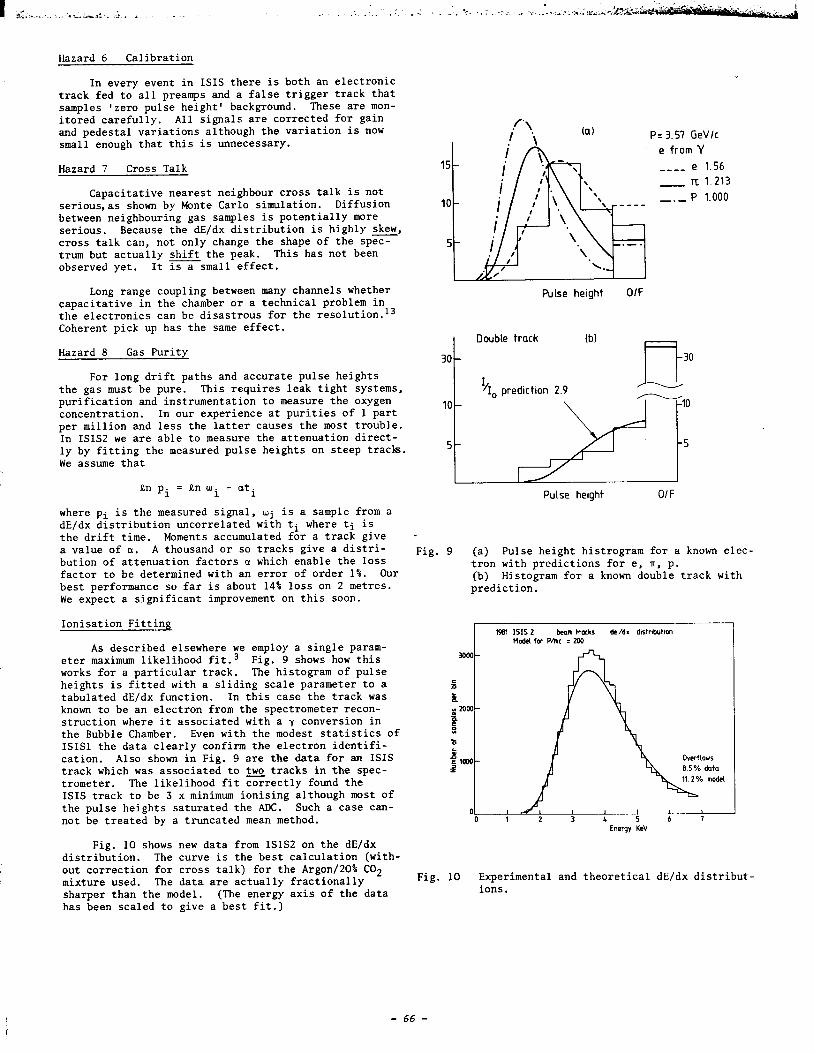
As described elsewhere we employ a single param- eter maximum likelihood fit.3 Fig. 9 shows how this works for a particular track. The histogram of pulse heights is fitted with a sliding scale parameter to a tabulated dE/dx function. In this case the track was known to be an electron from the spectrometer recon- struction where it associated with a y conversion in the Bubble Chamber. Even with the modest statistics of ISIS1 the data clearly confirm the electron identifi- cation. Also shown in Fig. 9 are the data for an ISIS track which was associated to two tracks in the spec- trometer. The likelihood fit correctly found the ISIS track to be 3 x minimum ionising although most of the pulse heights saturated the ADC. Such a case can- not be treated by a truncated mean method.
Fig. 10 shows new data from ISIS2 on the dE/dx distribution. The curve is the best calculation (with- out correction for cross talk) for the Argon/ZO% CO2 mixture used. The data are actually fractionally sharper than the model. (The energy axis of the data has been scaled to give a best fit.)
Pulse height O/F
P= 3.51 GeVlc e from Y
-___ e 1.56 - T[: 1.213 ___ P 1.000
Pulse height O/F
Fig. 9 (a) Pulse height histrogram for a known elec- tron with predictions for e, TI, p. (b) Histogram for a known double track with prediction.
1961 ISIS2 beom treks de/dx distnbution hdel for P/m< = 200
2 3 4 5 6 1 Energy KeV
Fig. 10 Experimental and theoretical dE/dx distribut- ions.
- 66 -

Particle Identification with ISIS1 in the NA16 Experiment
Fig. 11 shows the layout of the European Hybrid Spectrometer at CERN with ISIS1 downstream of the LEBC bubble chamber as run in 1980.gr14 Fits of ISIS1 tracks to the spectrometer gave residuals of 4 mms and 5 mrad RMS. Samples of electrons from y conversions in the bubble chamber and pions from K" decays in the bubble chamber were used to test the performance of ISIS. Fig. 12 shows the ratio of observed to expected ionisation for these tracks. The width of 18.6% FWHM is signifi- cantly worse than found previously8 and predicted (14%). The systematic discrepancy is due to various problems that have been cured in ISIS2 (see below). Nevertheless Fig. 13 shows clear separation of electrons and pions in the two cases.
Fig. 14 shows a real case of physics interest. The bubble chamber picture(reproduced here with some diffi- culty)contains a DoDo pair. The 6" decays to K+n+n-n-.
BC ISIS 1
EHS version I for NA16 June 1960
Fig. 11
to-
10 -
n I n. 0 0.5 1.0 1.5 20 2.5
Observed/expected msotion z
Fig. 12 Resolution of ISISl. Curve is 18.6% FWHM.
-3 , .
Fig. 14 A bubble chamber photograph from NA16 showing a D”6” event. The first decay is 4.2mm from the vertex.
82 Kinemat~tolly ldentlfied electrons 64 Klnemotically identified plans 30-: (al ISIS 1 30' ibl ISIS 1
l 1980 1980 . .
. . 8 *I
20: . 20- .
: . 1 l
X’htl l
x2 (n)
l
I
lo- .’ . :
l .
l . . . ). . . 6 1 4 c . . .‘.S’ l . ( . I * * :
0 10 20 30 0 10 20 30 X' (el X2 (el
Fig. 13 The chisquare for one degree of freedom for electron and pion mass assignments for tracks of known identity. The lines in the plots represent the two standard deviation limits.
- 67 -
The ionisation for the K+ track has a K* of 10.1 (1d.f) when interpreted at nTI+. The proper t ime is 4.5x10⁻¹³s. The D" decays as a 2 prong vee which does not point to production. The positive track has a momentum of 18 GeV/c and is associated with a shower of this energy in the EHS lead-glass y-detector. For this track the ISIS ionisation x2 are 3.4 and 0.07 for the n+ and e+ inter- pretation respectively. Although this analysis is pre- liminary, it is interesting as a first clear use of
relativistic dE/dx for physics and as a clear case of the infrequent semileptonic decay of a Do.
Particle Identification with ISIS2
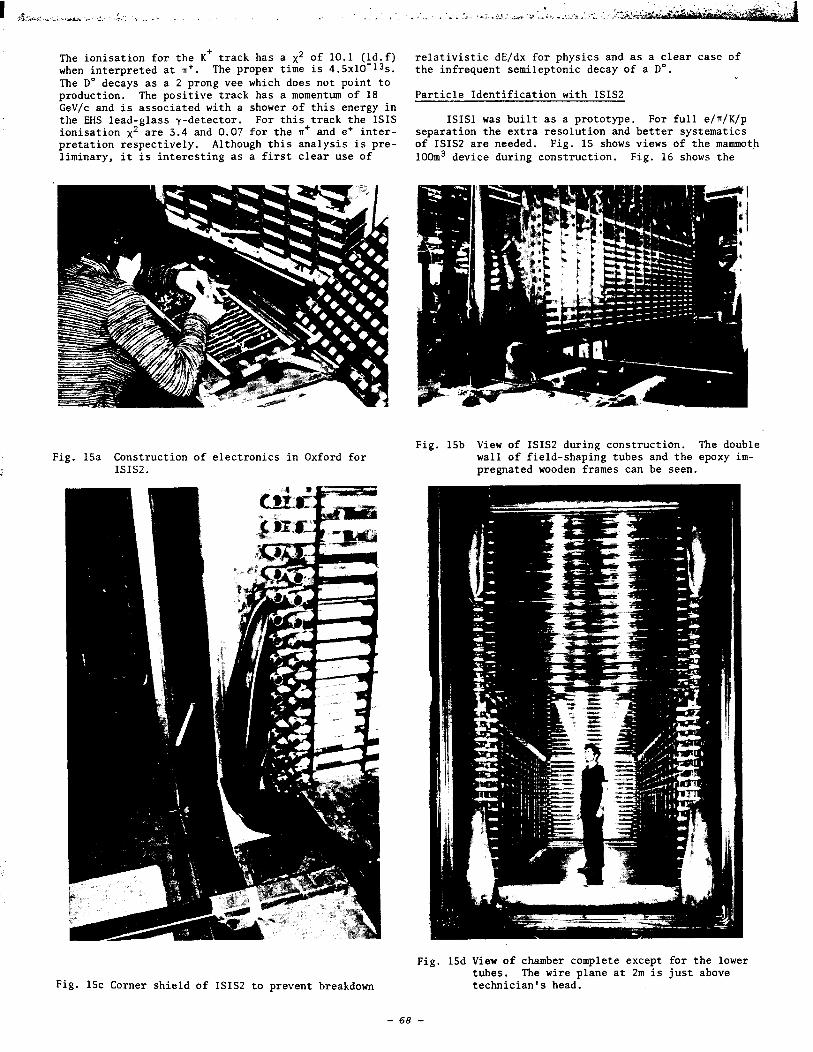
ISIS1 was built as a prototype. For full e/n/K/p separation the extra resolution and better systematics of ISIS2 are needed. Fig. 15 shows views of the mammoth 100m3 device during construction. Fig. 16 shows the
Fig. 15a Construction of electronics in Oxford for ISISZ.
Fig. 15b View of ISIS2 during construction. The double wall of field-shaping tubes and the epoxy im- pregnated wooden frames can be seen.
Fig. 15c Corner shield of ISIS2 to prevent breakdown
Fig. 15d View of chamber complete except for the lower tubes. The wire plane at 2m is just above technician's head.
- 68 -
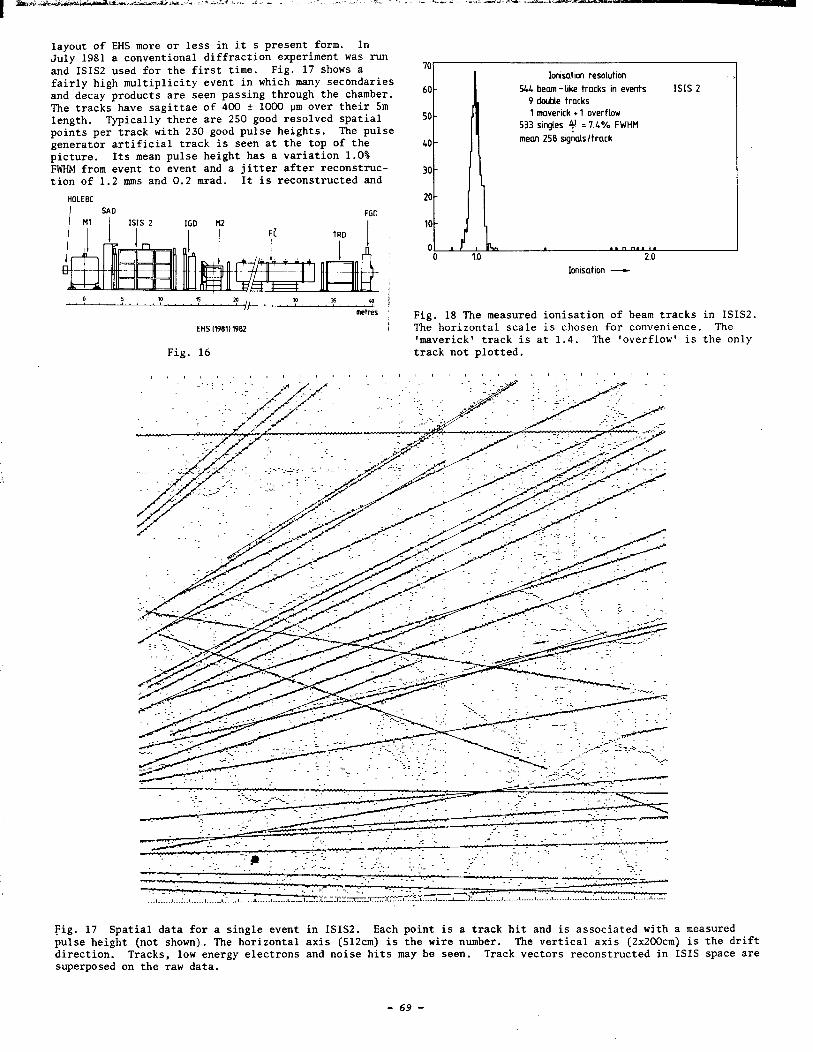
layout of EHS more or less in it s present form. In July 1981 a conventional diffraction experiment was run and ISIS2 used for the first time. Fig. 17 shows a fairly high multiplicity event in which many secondaries and decay products are seen passing through the chamber. The tracks have sagittae of 400 + 1000 urn over their 5m length. Typically there are 250 good resolved spatial points per track with 230 good pulse heights. The pulse generator artificial track is seen at the top of the picture. Its mean pulse height has a variation 1.0% FWHM from event to event and a jitter after reconstruc- tion of 1.2 mms and 0.2 mrad. It is reconstructed and
HOLEBC SAD FGO
Ml I ISIS 2 IGO HZ I
metres
EHSl198111982
Fig. 16
IV
60
50
40
30
20
10
0 k 0 1.0
ltisation resolution 544 beam - bke tracks in events
9 double tracks ISIS 2
1 maverick + 1 overflow 533 smgles y : 7.4% FWHM mean 258 signals/track
L 1. 2.0
Ionlsatlon -
Fig. 18 The measured ionisation of beam tracks in ISISZ. The horizontal scale is chosen for convenience. The 'maverick' track is at 1.4. The 'overflow' is the only track not plotted.
Fig. 17 Spatial data for a single event in ISISZ. Each point is a track hit and is associated with a measured pulse height (not shown). The horizontal axis (512cm) is the wire number. The vertical axis (2x2OOcm) is the drift direction. Tracks, low energy electrons and noise hits may be seen. Track vectors reconstructed in ISIS space are superposed on the raw data.
- 69 -
recognised by the software in 99.85 (Las)% of events.
Fig. 18 shows the ionisation of out-of-time beam tracks found within these events. These show a res- olution of 7.4% FWHM. There is no evidence of the sig- nificant gain variations found in the beam region in ISISl. This is attributed to better control of space charge effects. We expect that this resolution will be confirmed for other tracks although this analysis is not yet complete.
Conclusion
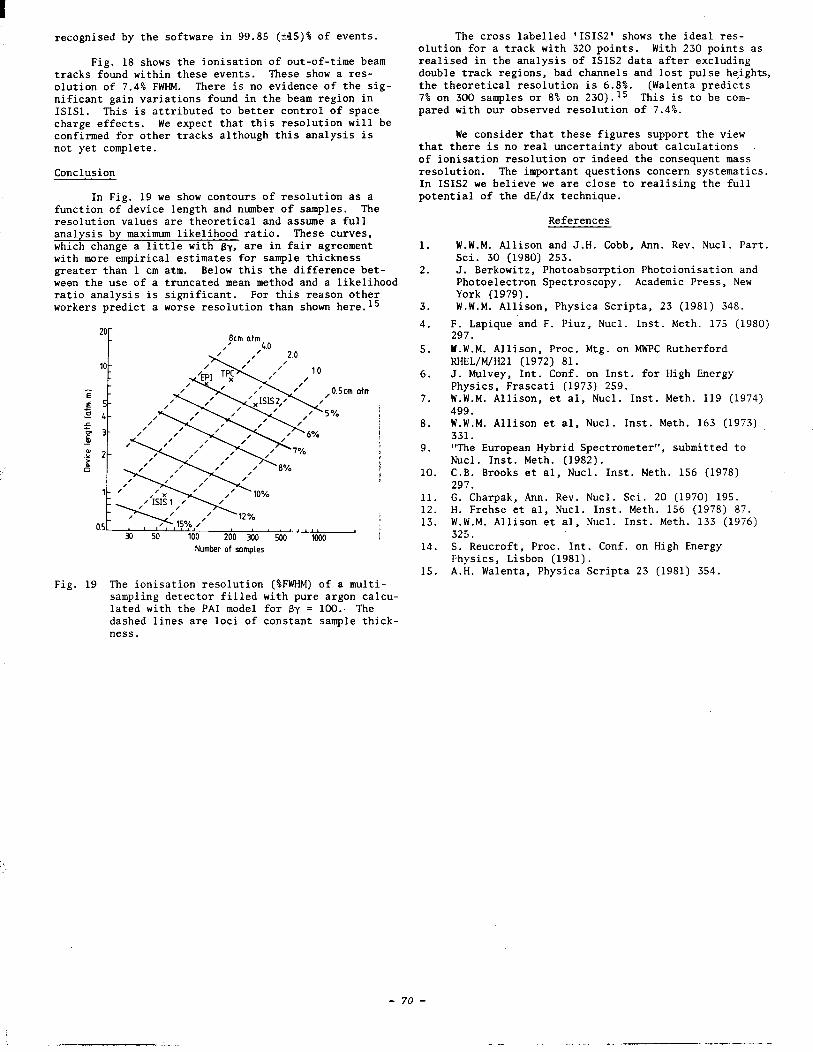
In Fig. 19 we show contours of resolution as a function of device length and number of samples. The resolution values are theoretical and assume a full analysis by maximum l ikelihood ratio. These curves, which change a little with By, are in fair agreement with more empirical estimates for sample thickness greater than 1 cm atm. Below this the difference bet- ween the use of a truncated mean method and a likelihood ratio analysis is significant. For this reason other workers predict a worse resolution than shown here.15
20-
10-
I
j
Number of samples
Fig. 19 The ionisation resolution (%FWHM) of a multi- sampling detector filled with pure argon calcu- lated with the PA1 model for By = 100.. The dashed lines are loci of constant sample thick- ness.
The cross labelled 'ISIS2' shows the ideal res- olution for a track with 320 points. With 230 points as realised in the analysis of ISIS2 data after excluding double track regions, bad channels and lost pulse he,ights, the theoretical resolution is 6.8%. (Walenta predicts 7% on 300 samples or 8% on 230).15 This is to be com- pared with our observed resolution of 7.4%.
We consider that these figures support the view that there is no real uncertainty about calculations of ionisation resolution or indeed the consequent mass resolution. The important questions concern systematics. In ISIS2 we believe we are close to realising the full potential of the dE/dx technique.
1.
2.
3. 4.
5.
6.
7.
8.
9.
10.
11. 12. 13.
14.
15.
References
W.W.M. Allison and J.H. Cobb, Ann. Rev. Nucl. Part. Sci. 30 (1980) 253. J. Berkowitz, Photoabsorption Photoionisation and Photoelectron Spectroscopy. Academic Press, New York (1979). W.W.M. Allison, Physica Scripta, 23 (1981) 348.
F. Lapique and F. Piuz, Nucl. Inst. Meth. 175 (1980) 297. Y.W.M. Allison, Proc. Mtg. on MWPC Rutherford RHEL/M/HZl (1972) 81. J. Mulvey, Int. Conf. on Inst. for High Energy Physics, Frascati (1973) 259. W.W.M. Allison, et al, Nucl. Inst. Meth. 119 (1974) 499. W.W.M. Allison et al, Nucl. Inst. Meth. 163 (1973) 331. "The European Hybrid Spectrometer", submitted to Nucl. Inst. Meth. (1982). C.B. Brooks et al, Nucl. Inst. Meth. 156 (1978) 297. G. Charpak, Ann. Rev. Nucl. Sci. 20 (1970) 195. H. Frehse et al, Nucl. Inst. Meth. 156 (1978) 87. W.W.M. Allison et al, Nucl. Inst. Meth. 133 (1976) 325. S. Reucroft, Proc. Int. Conf. on High Energy Fhysics, Lisbon (1981). A.H. Walenta, Physica Scripta 23 (1981) 354.
- 70 -