reinforcement and concrete bond: state determination along the development length
TRANSCRIPT

Reinforcement and Concrete Bond: State Determinationalong the Development LengthS. P. Tastani1 and S. J. Pantazopoulou, M.ASCE2
Abstract: The distribution of bond on the lateral surface of steel reinforcement embedded in concrete is explored through systematic solutionof the governingfield equations of the associatedmechanical problem. By separating the variables, the state of stress in the concrete surroundingthe bar is represented by coupling two independent solutions, each describing attenuation of bond stresses either in the longitudinal direction orin the radial direction of the cover, respectively. Kinematic considerations are used to couple longitudinal slip with the radial translation of thecover, whereas the corresponding stress components developing along the lateral bar surface over the anchorage (radial pressure and bondstress) are related through a frictional relationship. Using the derived solution, various experimentally documented trends and phenomena per-taining to the study of bond, as represented by the international experimental databank, are reproduced analytically and interpreted. These in-clude the processes of debonding and yield penetration and the sensitivity of the development capacity to important design variables such as therelated rib area, cover to bar diameter ratio, concrete strength, bar yield strength, bar hardening characteristics, and confinement. A model rep-resenting the envelope curve of the local bond-slip relationship suitable for analysis and simulation is presented and calibrated in the paper.DOI: 10.1061/(ASCE)ST.1943-541X.0000725. © 2013 American Society of Civil Engineers.
CE Database subject headings: Anchorages; Bonding; Slip; Pullout; Concrete.
Author keywords:Modeling; Anchorage; Local bond; Slip; Radial translation; Debonding; Yield penetration; Splitting; Pullout; Concretetension.
Introduction
Analytical models representing the state of bond along the lateralsurface of an embedded reinforcing bar are intended for inter-pretation and simulation/prediction of the behavior of structuralconcrete in a manner consistent with first principles. The use ofdetailed bond models is particularly relevant in the study of stressstates arising in lap splices, in the assessment of the rotation ca-pacity of RC members, and for evaluation of the tension stiffeningproperties of cracked concrete. Published models may be classi-fied as unidirectional (Tassios and Yannopoulos 1981; Filippouet al. 1983) and multidirectional (Cairns 1979; Tepfers 1979;Soroushian et al. 1991; DenUijl and Bigaj 1996; Cox andHerrmann1998; Lundgren 1999; Cox and Yu 2001), depending on whetherthey reproduce the attenuation of stress along the length of theanchorage or whether they also consider explicitly the state of stressin the surrounding cover. In either case, the basic principles of forceequilibrium and strain compatibility throughout the domain and atthe boundaries are a common point of reference for all availableapproaches, although in many cases, these are satisfied in anaverage or smeared sense, whereas in reality, they are validpointwise.
In this paper, a multidirectional model of bond is considered asa basis for the study of the associated mechanical problem and forinterpretation of the experimental evidence. The model comprisestwo separate components, namely:• A longitudinal component that, for a given input axial bar strain
ɛo at the loaded end, reproduces the attenuation of bar stressesalong an anchorage. This part of the model accounts for phenom-ena occurring along the anchorage length, such as debonding,yield penetration, and bond stress redistribution with progressiveanchorage failure.
• A transverse component that establishes the so-called local bondstrength that may be supported by the cover surrounding the barand accounts for contributions of passive or active confinementacting transversely on the anchorage. Cover splitting and fractureenergy release, as well as concrete plastification under excessiveconfinement, are the primary failure modes represented by thismodule.The two components of the model are coupled through frictional
and kinematic requirements that relate shear force and translation(longitudinal bar slip) with transverse pressure on the bar and con-crete radial displacement, respectively. Through this procedure,the various parameters known to affect bond strength are accountedfor in a manner consistent with experimental observation [suchas the apparent reduction of average bond strength with increasingdevelopment length, the influence of relative rib area and fractureenergy on bond resistance, and the process of yield penetration inyielding anchorages (Malvar et al. 2003)].
The rest of the paper presents a derivation of the model com-ponents and the relevant coupling relations, as well as corroborationwith experimental evidence through correlation of specific tests. Themodel’s ability to represent the established experimental trendsfor both steel and fiber-reinforced polymer (FRP) bars is evaluatedthrough correlation with tests and through parametric studies.
1Lecturer-Elect, Laboratory of Building Materials, Dept. of Civil Engi-neering, Democritus Univ. of Thrace, 67100 Xanthi, Greece (corre-sponding author). E-mail: [email protected]
2Professor, Dept. of Civil and Environmental Engineering, Univ. ofCyprus, 1678 Nicosia, Cyprus. E-mail: [email protected]
Note. This manuscript was submitted on January 19, 2012; approvedon September 6, 2012; published online on September 8, 2012. Discus-sion period open until February 1, 2014; separate discussions must besubmitted for individual papers. This paper is part of the Journal ofStructural Engineering, Vol. 139, No. 9, September 1, 2013. ©ASCE,ISSN 0733-9445/2013/9-1567–1581/$25.00.
JOURNAL OF STRUCTURAL ENGINEERING © ASCE / SEPTEMBER 2013 / 1567
J. Struct. Eng. 2013.139:1567-1581.
Dow
nloa
ded
from
asc
elib
rary
.org
by
UN
IVE
RSI
TY
OF
CY
PRU
S on
10/
21/1
3. C
opyr
ight
ASC
E. F
or p
erso
nal u
se o
nly;
all
righ
ts r
eser
ved.

Model Background: Longitudinal Component
In reducing bond strength values from the developed forcemeasuredin bond tests, it has been the established practice to assume a uniformbond stress distribution over the anchorage. The primary incon-sistency of this simplification is that the estimated bond strengthvalues decrease with increasing anchorage length, Lb. Furthermore,the assumption of constant bond stress over Lb implies a linearvariation of axial bar stress, which may only be acceptable if the barhas not yielded or debonded from the surrounding media. Theapproximation is nearly valid if the bonded length Lb is short [upto (3–7)Db, where Db is the bar diameter], so that formation ofexcessive shear deformation in the cover may be precluded. Butfor longer embedded lengths, the actual behavior deviates fromthe assumption of uniform bond stress distribution, particularly inthe case of high axial bar strain. From strain gauge readings along theanchorage length, it has been shown that the axial strain attenuationalong the bar is increasingly nonlinear with increasing load (Bakiset al. 1998;Benmokrane et al. 1996). For sufficiently large bar strainsat the critical section, a part of the bar near the loaded end is detachedfrom concrete, so that no bond stressmay develop over that segment.This is the region of debonding for elastic brittle bars (e.g., FRP bars)or the region of yield penetration for yieldingmetallic bars. Thus, theassumption that constant bond stress develops over the entire em-bedded length leads to a conservative estimate of the average bondstrength f aveb as compared with the maximum value fmax
b thatdevelops locally. The variable fmax
b is believed to represent a char-acteristic property of the interface between the bar and concretecover that depends on the cross-sectional properties of the an-chorage (such as the cover to bar diameter ratio, confining pres-sure, concrete fracture energy, and bar deformation profile) andis independent of the available anchorage length (Tastani andPantazopoulou 2006).
The basic equations that describe force transfer in the lengthwisedirection from the bar to the surrounding concrete through bond arederived from force equilibrium applied to an elementary bar segmentof length dx and from the compatibility between bar translation(slip), axial bar strain, ɛ, and concrete strain ɛc over dx, namely(Filippou et al. 1983; Tassios and Yannopoulos 1981)
df =dx ¼ 2ð4=DbÞfb ds=dx ¼ 2ðɛ2 ɛcÞ≅ 2ɛ (1)
where f 5 axial stress of the bar; fb 5 local bond stress; and s 5relative slip of the bar with respect to the surrounding concrete. Theterms in Eq. (1) are related through the bond-slip law, fb 5 fbðsÞ, andthe bar material stress-strain relationships, f 5 f ðɛÞ. The concretecontribution to relative slip, ɛc × dx, is neglected considering that theaverage concrete strain is an order of magnitude smaller than theaverage bar strain. Solution of Eq. (1) is possible through exactintegration, resulting in closed-form solutions for the state of stressand strain along the anchorage, through pertinent selection of simplemodels for the material laws (e.g., piecewise linear relations). Thisapproach has a clear advantage over the numerical solution alter-native in that it enables transparent insight into the role of the variousdesign parameters on the behavior of anchorages.
Solution of the Field Equations of Bond alonga Bar Anchorage
Solution of Eq. (1) requires that the general form of the constitutiverelations of the bar and the local bond-slip law are known (Fig. 1).The reinforcing bar stress-strain relationship is considered elasticwith brittle failure for FRP bars and elastoplastic with hardening forsteel reinforcement [Fig. 1(a)].
Without loss of generality, to facilitate derivation of closed-formsolutions, a linear elastic, perfectly plastic local bond-slip relation-ship with zero residual bond strength {i.e., f resb 5 0 for slip greaterthan su [Fig. 1(b)]} is adopted for an elastic bar; for the Case ivconsidered later regarding an elastoplastic bar after yielding, thesolution also requires a plateau of residual bond strength, f resb{i.e., f resb � 0 for slip greater than su [Fig. 1(b)]}. Note that this formalso most closely represents the experimentally obtained curvesfor bar force versus pullout slip from a series of tension pulloutexperiments conducted both on steel and on FRP bar anchorages(Tastani and Pantazopoulou 2006, 2010). Fig. 1(b) shows the in-terrelation between the assumed form of the local bond-slip law andthe corresponding average local bond-slip relationship deducedfrom test data: fmax
b is the characteristic bond strength, f aveb is theaverage bond strength (over the available anchorage length), sy isthe relative slip value at the end of the elastic bond region, and su isthe relative slip value at failure of the local bond mechanism. Theplateau in the local bond-slip law implies sustained bond strength.This feature is not always manifested in test data; to be measured,it requires redundancy in the anchorage (i.e., availability of longeranchorages to enable force redistribution before failure). In theassumed law, the end of the plateau is marked by abrupt loss of bondstrength to a residual value of f resb that represents the friction betweenthe concrete cylinder defined by the tips of the ribs and the remainingconcrete cover. (Thus, f resb is only assumed for ribbed steel bars andnot for FRP or smooth steel bars.)
Bond-Slip Distribution along the Anchorageof a Linear Elastic Bar
SolutionofEq. (1) for elastic bars is given in this section; this is validfor the ascending branch of the stress-strain law of steel bars,i.e., ɛ# ɛsy, and for the entire range of strains to failure for FRP bars,i.e., ɛ# ɛfu.
In Case (i), for the elastic part of the bond-slip law {i.e., whens# sy [Fig. 1(b)]}, bond stress is linearly related to slip: fb 5ðfmaxb =syÞ × s. Bar normal strain, slip, and bond stress distributions
over the available length of the anchorage [x ⊆ ð0, LbÞ] are given byEq. (2) [Fig. 2(a)]
ɛðxÞ ¼ ɛo12 e22vLb
�e2vx2 evx22vLb
�# ɛsy or ɛfu (2a)
sðxÞ ¼ ɛovð12 e22vLbÞ
�e2vx þ evx22vLb
�# sy (2b)
fbðxÞ ¼�fmaxb =sy
�× sðxÞ# fmax
b (2c)
wherev5 ½4fmaxb =ðE ×Db × syÞ�0:5. Thevariable ɛo is the bar axial strainat the loaded end of the anchorage, and E is the modulus of elasticity
Fig. 1. (a) Assumed stress-strain law of reinforcing bar; (b) interrela-tion between assumed local (gray envelope) andmeasured average localbond-slip law (black envelope)
1568 / JOURNAL OF STRUCTURAL ENGINEERING © ASCE / SEPTEMBER 2013
J. Struct. Eng. 2013.139:1567-1581.
Dow
nloa
ded
from
asc
elib
rary
.org
by
UN
IVE
RSI
TY
OF
CY
PRU
S on
10/
21/1
3. C
opyr
ight
ASC
E. F
or p
erso
nal u
se o
nly;
all
righ
ts r
eser
ved.

of the bar in the longitudinal direction. By substituting x5 Lb inEq. (2b), a nonzero slip value is obtained at the free end of theanchorage {i.e., sf 5 2ɛoe2vLb=½vð12 e22vLbÞ�� 0)} even undervery small loads. This finding is consistent with the experimentalobservation. At this state, the relation between the average bondstress (and not strength) f aveb measured from tests and the charac-teristic bond strength fmax
b is obtained from force equivalence of thetwo distributions [the assumed uniform distribution and the actualdistribution given by Eq. (2c)]
f aveb ¼ 1Lb
ðLb
0
fbðxÞdx ¼ ɛosyLbv2 fmax
b (3)
The bar axial strain at the loaded end, ɛo 5 ɛðiÞel , is the limit valuebeyond which the bond mechanism enters the state of plastification(i.e., yielding of bond) over a length lp while the bar remains elastic.Therefore, the variable ɛðiÞel is directly related to the slip magnitude syin Fig. 1 and may be calculated from Eq. (2b) after substitution ofsðx5 0Þ5 sy as follows:
ɛðiÞel ¼ syv12 e22vLb
1þ e22vLb(4)
In Case (ii), if the available bond length, Lb, is sufficient or iftransverse confinement acts normal to the contact surface, then thebar may sustain a strain value higher than ɛðiÞel . In that case, themaximum bond stress may reach the characteristic strength value,fmaxb , over a length of bond plastification, lp [Fig. 2(b)]. The completesolution of Eq. (1) over Lb (starting from the loaded end and pro-ceeding toward the end of the anchorage) comprises two segments asfollows.
For distributions of bar strain, slip, and bond stress over thelength lp (for 0# x# lp)
ɛðxÞ ¼ ɛo24 fmax
b
EDbx (5a)
sðxÞ ¼ sy þ 0:5�lp2 x
�hɛðxÞ þ ɛðiiÞel
i(5b)
fbðxÞ ¼ fmaxb (5c)
where ɛðiiÞel 5 reduced value of bar strain as compared with the ɛo atthe loaded end, now occurring at the end of the bond plastificationregion, lp
ɛðiiÞel ¼ ɛo24 fmax
b
EDblp (6)
For distributions of bar strain, slip, and bond stress over theremaining anchorage length, Lb 2 lp (for lp # x# Lb) {these areobtained from the elastic solution [Eq. (2)] upon substitution ofx2 lp and Lb 2 lp in lieu of x and Lb}
ɛðxÞ ¼ ɛðiiÞel
12 e22vðLb2lpÞ�e2vðx2lpÞ2 evðx2lpÞ22vðLb2lpÞ� (7a)
sðxÞ ¼ ɛðiiÞel
v 12 e22vðLb2lpÞ� ��e2vðx2lpÞ þ evðx2lpÞ22vðLb2lpÞ�
(7b)
fbðxÞ ¼�fmaxb =sy
�× sðxÞ# fmax
b (7c)
The length of plastification lp may be estimated if continuity ofstrain and slip are considered at x5 lp [by combining Eq. (5a) withEq. (7b) and after substitution of sðx5 lpÞ5 sy] as
lp ¼ Lb212v
ln
syvþ ɛðiiÞel
syv2 ɛðiiÞel
!(8)
In this case of bond plastification, Eq. (3) is rewritten to supplythe relationship between average and characteristic bond strength,f aveb and fmax
b , respectively, as
f aveb ¼ 1Lb
264ð
lp
0
fmaxb dxþ
ðLb
lp
fbðxÞdx
375 ¼ fmax
b
Lb
lp þ ɛðiiÞel
sy ×v2
!(9)
The end of bond plastification is followed by the onset ofdebonding, i.e., the end of the bar-concrete interaction. This phase ismarked by excessive relative slip. In Figs. 1 and 2, the parameter sucorresponds to the end of the plastic branch in the bond-slip law. Bysubstitution of sðx5 0Þ5 su in Eq. (5b), the critical bar strain ɛo,u at
Fig. 2. Elastic bar response while bond-slip law (a) remains elastic [case (i)] and (b) enters the plastification region [case (ii)]; (c) elastic bar responseand debonding failure after bond plastification [case (iii)]; (d) plastic bar response with bond plastification [case (iv)]
JOURNAL OF STRUCTURAL ENGINEERING © ASCE / SEPTEMBER 2013 / 1569
J. Struct. Eng. 2013.139:1567-1581.
Dow
nloa
ded
from
asc
elib
rary
.org
by
UN
IVE
RSI
TY
OF
CY
PRU
S on
10/
21/1
3. C
opyr
ight
ASC
E. F
or p
erso
nal u
se o
nly;
all
righ
ts r
eser
ved.
the loaded end, associated with the onset of debonding, is evaluatedas
ɛo,u ¼ 2su2 sy
lp2 ɛðiiÞel (10)
In Case (iii), debonding limits the load carried by the bar;i.e., once the debonding process begins, the bar cannot sustaina strain greater than ɛo,u [Eq. (10)]. While the bar is being pulled out,the strainmagnitude ɛo,u propagates in the anchorage over a length lr,referred to as the debonded length. This process is followed byexcessive increase of slip at the loaded end and by a commensuratereduction of the active anchorage length to Lb 2 lr . Using Eqs. (5)and (7) and by substitution of variables x, Lb, and lp with x2 lr,Lb 2 lr , and lp 2 lr, respectively, revised expressions for strain andslip distributions are obtained that describe the state of stress in theanchorage after debonding over a length lr [Fig. 2(c)]. Note that slipat the critical section is estimated from integration of strains overLb as follows:
sdeb ¼ su þ ɛo,ulr (11)
Regarding the bond stress distribution, it is noteworthy that atthis stage it tends toward a uniform distribution over the active an-chorage length, Lb 2 lr, with a stress intensity nearly equal to thecharacteristic value fmax
b while failure is anticipated, as there areno strength reserves in the anchorage [Fig. 2(c); Novidis andPantazopoulou 2005]. Note that debonding may occur even in thecase of elastic brittle anchorages (i.e., without an intervening lengthof bond plastification), as seen for example in the case of shortanchorage lengths, in which the available Lb does not suffice tosupport redistribution of bond stresses and propagation of debonding.
The expression for the length of bond plastification [seeEq. (11a)] is derived as follows: given ɛo,u at the entrance of theanchorage and assuming values for the sdeb, convergence is ac-complishedwhen continuity of strain and slip are satisfied at the kneepoints of the distributions [Fig. 2(c)]. Thus, for the calculation of thelp, the quadratic equation should be solved
lpð1, 2Þ ¼ ɛo,u6
ffiffiffiffiffiffiffiffiffiffiffiffiffiffiffiffiffiffiffiffiffiffiffiffiffiffiffiffiffiffiffiffiffiffiffiffiffiffiffiffiffiffiffiffiffiffiɛo, u22
8 fmaxb
EDb
�su2 sy
�s24
35 4 fmax
b
EDb
�(11a)
Physically acceptable value for lp is the result of Eq. (11) that alsosatisfies the requirement of lp 1 lr # Lb.
Bond-Slip Distribution along the Anchorageof an Elastoplastic Bar
Solution of Eq. (1) for an elastoplastic bar (steel reinforcement) isexplored only after yielding, because the preceding section fullydescribes the bar elastic behavior. The bar strain at the onset ofyielding is denoted by ɛsy, andEsh is the strain hardeningmodulus ofthe stress-strain relationship in the postyielding regime.
Case (iv), the last case examined in the present model, concernsyield penetration of the steel bar inside the anchorage with simul-taneous plastification of bond [Fig. 2(d)]. The length of yield pen-etration is now denoted by lr . In the segment (0, lr), the bond stressis equal to f resb . Also, the distribution of strains is linear, rangingfrom ɛðx5 0Þ5 ɛo at the loaded end to the value ɛðx5 lrÞ5 ɛsy atthe end of the yielding region. Slip at each point is obtained fromintegration of strains from the point considered to the end of theanchorage. A necessary requirement for this case to occur is strainɛo [in accordance with Eq. (4) of Case (i)] exceeding the limit valueof Eq. (12)
ɛo $ sy v12 e22vLb
1þ e22vLb(12)
The strain, slip, and bond stress expressions governing this problemin the three distinct regions are given as follows. Over the debondedlength lr (for 0# x# lr)
ɛðxÞ ¼ ɛo24 f resb
EshDbx (13)
sðxÞ ¼ su þ 0:5ðlr 2 xÞ�ɛðxÞ þ ɛsy
fb ¼ f resb (14)
Over the length lp where bond has exceeded the plasticity limit(for lr # x# lr 1 lp)
ɛðxÞ ¼ ɛsy 24 fmax
b
EsDbðx2 lrÞ (15)
sðxÞ ¼ sy þ 0:5�lr þ lp2 x
�hɛðxÞ þ ɛðivÞel
ifbðxÞ ¼ fmax
b (16)
Over the remaining bonded length Lb 2 lr 2 lp (for lr 1 lp # x# Lb)
ɛðxÞ ¼ ɛðivÞel
12 e22vðLb2lp2lrÞ��e2vðx2lp2lrÞ2 evðx2lp2lrÞ22vðLb2lp2lrÞ� (17)
sðxÞ ¼ ɛðivÞel
v 12 e22vðLb2lp2lrÞ� ���e2vðx2lp2lrÞ þ evðx2lp2lrÞ22vðLb2lp2lrÞ� (18)
Here, the relationship between average and characteristic bondstrength is
f aveb ¼ 1Lb
264ð
lr
0
f resb dxþðlrþlp
lr
fmaxb dxþ
ðLb
lrþlp
fbðxÞdx
375
¼ 1Lb
"lr f
resb þ fmax
b
lp þ ɛðivÞel
sy ×v2
!#(19)
In Eqs. (16)–(19), ɛðivÞel is the strain at x5 lr 1 lp, i.e., the point oftransition from elastic to plastic bond stress [Fig. 2(d)]; it is cal-culated from Eq. (15).
Thus, yield penetration occurs over the segment lr of the an-chorage where strain exceeds ɛsy; this phenomenon is accompaniedby a sudden increase of slip [Eq. (14)] with a commensurate re-duction of bond strength to f resb over the yielded bar length.
Model Background: Transverse Component
Based on experimental observation, bond strength, fmaxb , depends
on the amount of concrete cover, the bar surface profile, andthe presence of confinement along the anchorage (Tastani andPantazopoulou 2006, 2010). These are parameters that representthe conditions in the transverse direction of the anchorage throughthe cover thickness. In this section, the local bond strength valueis investigated using a simplified mechanical construct that considers
1570 / JOURNAL OF STRUCTURAL ENGINEERING © ASCE / SEPTEMBER 2013
J. Struct. Eng. 2013.139:1567-1581.
Dow
nloa
ded
from
asc
elib
rary
.org
by
UN
IVE
RSI
TY
OF
CY
PRU
S on
10/
21/1
3. C
opyr
ight
ASC
E. F
or p
erso
nal u
se o
nly;
all
righ
ts r
eser
ved.

the state of stress in the cover concrete and explores the interaction inthe radial direction between reinforcement and the surroundingconcrete. Note that the radial component of bond stress around a baris directly related to the tensile hoop stresses in the concrete. Whenthese exceed the tensile strength of concrete, radial splitting cracksdevelop through the cover thickness (Pantazopoulou and Papoulia2001).
To evaluate the deformation and stress state in the concretesurrounding a reinforcing bar, the familiar idealization of the coveras a thick cylinder with the interior radius equal to that of the baris used (Pantazopoulou and Papoulia 2001; Tepfers 1979). Note thatan important difference between the classical thick-cylinder model(Tepfers 1979) and displacement-controlled approach (Pantazopoulouand Papoulia 2001) is that, whereas the former solves for the state ofstress produced in the cover thickness by a uniform pressure actingon the internal boundary, the latter solves for the state of stressin the cover produced by a fixed radial displacement of the internalboundary. In this case, the pressure on the internal boundary is obtainedas an output of the model. The basic form of the model’s result is acharacteristic curve that relates radial stress and radial strain in the coverand a basic measure of the thick cylinder’s capacity to accommodatedisplacement of its inner boundary before failure. The displacement-controlled version of the thick cylinder cover model was originallydeveloped to interpret cover cracking and expansion owing to thebuildup of rust products on the bar surface (Pantazopoulou andPapoulia 2001). In the case of bar slip along an anchorage, thelongitudinal translation of the bar lugs causes outward displace-ment of the cover; hence, the kinematics of the two problems are thesame. Furthermore, the two phenomena (corrosion and the radialcomponent of bond) produce a similar state of stress in the cover,competing for the same reserve of resistance, as defined by thecharacteristic curve of the cover described previously.
In modeling the bond problem, the radial and longitudinal com-ponents of bond stress are linked through a frictional analogue. Thelimited number of tests reporting transverse strain or radial expansionof the cover are used here as a basis for model calibration and de-termination of the geometric relationship between radial translationsand longitudinal slip amount. This serves as a compatibility re-quirement enabling the establishment of a relationship between thelongitudinal and transverse model components in addition to thestatement of equilibrium (Malvar et al. 2003; Malvar 1992, 1995;Vecchio and DeRoo 1995).
Thick Cylinder Model of the Cover Cross Section
The equations that control the boundary value problem of a thickcylinder with internal radius Rb (bar radius) and external radius Cc,comprising an anisotropic nonlinear elastic material (i.e., a materialhaving different moduli of elasticity and Poisson’s ratios in the threeprincipal directions (z2 r2 u; Fig. S1) are summarized in a sup-plemental data file available online in the ASCE library.
Numerical Solution of the Boundary Value Problem
Given a radial displacement urjr5Rb of the inner boundary, Eq. (S5)is solved numerically to establish the depth of crack penetration(or crack front,Rcr) and the resulting radial pressure (srjr5Rb) appliedon the bar lateral surface (Pantazopoulou and Papoulia 2001). Theincremental solution uses simple uniaxial stress-strain models forconcrete in compression and tension to model material behavior inthe radial and the hoop directions. (These directions are also theprincipal stress and strain directions because of the geometric axi-symmetry of the problem.) The radial dimension of the thick ring isdiscretized in N1 1 equidistant nodes with N segments of constantlength h5 c=N, where c is the clear cover. The first node, i5 0, is atthe internal boundary, which is defined by the bar radius, and the lastnode is on the external boundary of the cover [Fig. S1(c)].
The radial pressure on the interior boundarysr,o [Eq. (S15)] maybe estimated either through the constitutive relations of the aniso-tropic elastic media [Eq. (S4)] or through equilibrium across a di-ametric plane of the thick cylinder idealization [denoted here as seq
r,o;Fig. 3(a)]. The latter approach is preferable after the formation ofradial cracks (nru 5 0 and nur � 0), as the interrelationship betweenthe sr and su terms breaks down beyond that point
Rbseqr,o ¼P
N
�su,i þ su,iþ1
�× h=20
seqr,o ¼ 1
2hRb
��su,o þ su,1
�þ �su,1 þ su,2�þ⋯þ �su,N21 þ su,N
�
wheresu,i ¼ 112 nru,inur,i
Eu,i
ur,iri
þ nur,iEr,iur,iþ12 ur,i21
2h
�(20)
The solving is performed incrementally: for the mth incrementin the amount of radial displacement uðmÞr,o , the nodal displacements
Fig. 3. Equilibrium of (a) radial and hoop stresses along a diametric plane of concrete cover and (b) radial and shear (bond) stresses along the bar axis;(c) bar translation and radial displacement representation [the picture shows the sliding plane formed in a direct tension pullout bond test that failed bysplitting; data from Tastani and Pantazopoulou (2010)]
JOURNAL OF STRUCTURAL ENGINEERING © ASCE / SEPTEMBER 2013 / 1571
J. Struct. Eng. 2013.139:1567-1581.
Dow
nloa
ded
from
asc
elib
rary
.org
by
UN
IVE
RSI
TY
OF
CY
PRU
S on
10/
21/1
3. C
opyr
ight
ASC
E. F
or p
erso
nal u
se o
nly;
all
righ
ts r
eser
ved.

[ur] and the associated stresses are calculated. For the next in-crement,m1 1, values for the secant moduliEr andEu are estimatedfrom the constitutive relations of concrete in principal compressionand tension (Fig. S2), using the state of strain estimated in the mthstep.
Effect of Confining Pressure sconf on the ExternalBoundary of the Thick Cylinder
When a constant normal pressure sconf , 0 is applied externally onthe lateral surface of the thick concrete cylinder (i.e., for i5N, it issrjr5Cc 5sconf ), the numerical solution of the problem is slightlymodified in terms of the governing Eqs. (S7), (S11), (S12), and(S14), whereas Eq. (20) is rewritten as
seqr,o ¼ 1
2hRb
��su,o þ su,1
�þ �su,1 þ su,2�þ⋯
þ �su,N21 þ su,N�
2rNRb
sconf (21)
Note that hoop stresses and strains (su and ɛu) are tensile andare responsible for the radial cracking of the cover, whereas theradial stresses and strains (sr and ɛr) are compressive. Coincidentdirections of principal stress and strain and homogenized crackingare assumed. (This corresponds to the assumption that the integral ofthe average hoop tensile strain ɛu at a radius r quantifies the cu-mulative width of all the discrete radial cracks at that level.) Thebehavior of concrete in compression is described as a function ofcompressive strain ɛc through the familiar parabolic compressionstress-strain relationship [Fig. S2(a)], with initial modulus of elas-ticity, Eco 5 2fck=ɛco, where fck is the uniaxial compressive strengthand ɛco is the strain at peak stress. The behavior of concrete in tensionis assumed linear elastic prior to cracking (ɛu # ɛcr 5 0:00015) withinitial elastic modulus Eco and tensile strength obtained either fromtests (cylinder splitting) or as fct 5 ð0:352 0:5Þ ffiffiffiffiffi
fckp
. After cracking,the stress versus smeared-strain relationship is defined by Comite ́Euro-International du Bet́on (1993) in terms of the fracture energyGf and the maximum aggregate size da. For a range of characteristiccompressive strength values, fck 5 252 35 MPa and da 5 25 mm,the strain values of Fig. S2(b) are estimated as ɛk 5 0:0003 andɛu 5 0:0017 (Pantazopoulou and Papoulia 2001).
Coupling of Longitudinal and Radial Componentsof the Bond Mechanism
The relationship between radial stress sr,o and the imposed radialdisplacement ur,o of the interior boundary of the thick cylinder is acharacteristic property of the thick cylinder. The radial displacementis imposed by the ribs on the inner boundary of the thick ring (whichis in contact with the bar surface) when the bar begins to slide in thelongitudinal direction in response to an applied axial load. Thus, thelongitudinal and transverse components of the bond mechanism arerelated through:• a frictional model for the stresses depicted in Fig. 3(b)
fmaxb ¼ 2m
psr,o þ fadh ¼ 2m
p
�sc þ sst þ sconf
�þ fadh (22)
• a geometric compatibility relationship for the longitudinal andradial translations shown in Fig. 3(c)
s ¼ ai × ur,o (23)
wherem5 coefficient of friction. The adhesion component of bond,fadh, is the shear capacity of the interfacial layer (estimated in therange of 1 MPa), which disintegrates for small values of slip (i.e., inexcess of 0.02mm), as the chemical links between concrete and steel
break down. The termssc andsst (Tastani and Pantazopoulou 2010)represent the contribution to the bond strength of the cover andtransverse stirrups along the length of the anchorage, respectively.The term sconf represents the contribution of any transverse com-pressive field restraining the anchorage. Also, s is the bar slip at theloaded end, and ur,o is the radial displacement of the cover’s interiorboundary (bar surface). The parameter ai in Eq. (23) is an arithmeticcoefficient that depends on the rib geometry and the stage of loading(ay for the yield state of bond and au for the end of bond plastifi-cation). Seeking a physical significance for ai, the kinematics ofradial translation of the cover necessary to accommodate longitu-dinal translation of the lugs are considered in Fig. 3(c). Accordingto experimental observation (Tastani and Pantazopoulou 2010),the effective angle, u, of the front of the rib is defined by a planeof sliding that forms between the tip of each rib and the base ofthe preceding one; based on the geometry, the outward translationneeded for this plane to displace forward by s is u5 s=tan u;therefore, ai 5 tan u5 sr=hr, where sr is the rib spacing and hr is therib height. Evidently, Eq. (23) breaks down for s. sr, because aninfinitesimal increase of the cover translation Dur,o enables un-inhibited slipping of the bar.
Another critical variable of themodel is the value of the coefficientof frictionm, which is comprised by such parameters as the confiningpressuresconf on the external boundary of the thick cylinder, slip, andrebar corrosion. The effects of sconf and s on m have been previouslyinvestigated by Tastani and Pantazopoulou (2010) based on exper-imental work with steel bars and published data from the literature(Malvar 1992); the main findings were as follows.• There is a limit in the value of the normal pressure on the bar, in
the range of 0:4fck , beyond which the coefficient mmax degradesfrom the value of 1.2 to 0.9; here, a linear degradation pattern isassumed up to a normal pressure of fck .
• By correlating the residual bond strength, f resb (associated withlarge slip, equal to the distance between successive ribs s5 sr),with the normal pressure, it was found that for high levels of slipand normal pressure values less than 0:6fck , the coefficient ofresidual friction takes on a minimum value, mres 5 0:45. Forhigher levels of pressure, the coefficient mres practically degen-erates, highlighting the change of failure mode from mixedsplitting-pullout to pullout of a smooth cylinder defined by thetips of the ribs along the anchorage and comprising the bar and theconcrete locked between successive ribs.
• The value of mmax decays almost linearly with increasing slipmagnitude beyond the limit su (plastification of bond with partialdebonding), tending to the minimum value as s approximates sr.To illustrate the significance of surface morphology on mmax,
previous tests conducted by Tastani and Pantazopoulou (2006) onglass fiber-reinforced polymer (GFRP) bars are considered in thissection, along with results from confined-bond tests conducted byMalvar (1995) on Db 5 19 mm GFRP bars with various surfaceroughness characteristics. [Specimens identified as B and D inMalvar (1995) have similar surface morphology with those inTastani and Pantazopoulou (2006).] Fig. 4 plots normalized valuesof the average bond strength against the applied normal pressure onthe bar surface. Themathematical equation depicted in Fig. 4 describesthe relation f aveb =fck 5 asr,o=fck 1 bwhere a5 0:5 and b5 0:05; notethat a5 2m=p [in accordance with Eq. (22)], and thus, the coefficientmmax is constant (i.e., 0.8) for a pressure level up to 0:8fck [range of theexperimentally applied pressure ð02 0:8Þfck].
Eq. (23) is calibrated with the test results of Malvar (1992, 1995)for steel and GFRP bars. Radial displacement of the externalboundary ur,N is reported in the tests as a function of slip (Fig. 5). Theradial displacement of the interior boundary, ur,o, is obtained fromur,N (defined by the user) considering the length change of the cover
1572 / JOURNAL OF STRUCTURAL ENGINEERING © ASCE / SEPTEMBER 2013
J. Struct. Eng. 2013.139:1567-1581.
Dow
nloa
ded
from
asc
elib
rary
.org
by
UN
IVE
RSI
TY
OF
CY
PRU
S on
10/
21/1
3. C
opyr
ight
ASC
E. F
or p
erso
nal u
se o
nly;
all
righ
ts r
eser
ved.

under the influence of confinement as ur,o 5 ur,N 1 cɛr , where ɛr isthe average radial compressive strain in the cover concrete, ap-proximated here as ɛr 5sr,o=Eco. Results obtained for the radialdisplacement ur,o of the interior boundary of the cover and longi-tudinal bar slip s are plotted in Fig. 5 for two limit states of bond(i.e., yield and ultimate). Generally, sustained slip and radial dis-placement of the inner boundary increase with the applied normalpressure. (This is more evident in the case of steel bars owing to thehigher ribs as comparedwith theGFRPbars.) The coefficient 1=ai inEq. (23) is defined by the slope of the average trend, shown in Fig. 5by the solid line, whereas the theoretical limit of sr=hr discussedearlier is shownby a dashed line. For bond at the onset of yielding,ay
is chosen as 20 and 30 for steel and GFRP bars, respectively, for theanalyses of the sectional model presented later. After bond plasti-fication, it appears that slip is independent of radial displacement(owing to the reduced resistance provided by the cover at that stageagainst sliding of the bar as compared with that of the elastic stage ofcover behavior); this point is associated with a radial translationapproximately equal to the rib height in the case of splitting failure,
Fig. 4. Experimental relationship between bond strength and normalpressure [data from Malvar (1995)]
Fig. 5. Correlation between radial displacement ur,o with slip s for the first attainment of strength (subscript y) and for the termination of the plasticbranch of bond (subscript u) for (a) steel bars [data from Malvar (1992)] and (b) GFRP bars [data from Malvar (1995)]
JOURNAL OF STRUCTURAL ENGINEERING © ASCE / SEPTEMBER 2013 / 1573
J. Struct. Eng. 2013.139:1567-1581.
Dow
nloa
ded
from
asc
elib
rary
.org
by
UN
IVE
RSI
TY
OF
CY
PRU
S on
10/
21/1
3. C
opyr
ight
ASC
E. F
or p
erso
nal u
se o
nly;
all
righ
ts r
eser
ved.

whereas in the case of pullout failure, because of the presence ofconfining pressure, the radial translation ismuch lower than hr (Fig. 6).
Coupling of the transverse with the longitudinal components ofthe model is possible if the limiting stress and displacement outputvalues (sr,o, fb, ur,o, and s) of the transverse model component aretaken to correspond to the loaded end of the active anchorage length.Thus, the section of reference recedes toward the end of the an-chorage as debonding propagates. Beyond that point and up to theend of the anchorage, the longitudinal component of the proposedbond model calculates distributions of stress, displacement, andstrain that are pointwise consistent with the field equations for bond.
In practical calculations for the interpretation of experimentalresults, the model is implemented as follows. Given the cover-bargeometry and hoop kinematic constraints on the outer boundary ofthe cover, the solution of the transverse component of the modelyields a characteristic curve that relates the radial bar pressure to theradial displacement of the inner boundary of the cover. For everylevel of bar radial pressure, the appropriate frictional coefficient ischosen, enabling estimation of the available bond strength fmax
b[fromEq. (22)]. The slip sy at the end of the elastic bond-slip region isin the range of 0:120:3 mm for high to normal relative rib areas.Next, with the bond-stress slip law thus defined and given thereinforcing-bar axial stress-strain law, the longitudinal problem issolved for any value of the bar axial strain at the loaded end of theanchorage (critical cross section). The results of this procedure arethe bond stress, slip, and axial strain distributions along the em-bedded length. Having determined the distribution of slip along theanchorage and in light of the derived kinematic relationship betweenslip and radial displacement, the depth of cover cracking is resolvedfor the corresponding magnitude of bar axial strain.
Experimental Corroboration of the Analytical Model
In this section, the proposed analytical model is calibrated using datafrom a detailed parametric experimental investigation conducted byTastani and Pantazopoulou (2006, 2010) on both steel and FRPreinforcing bars with the objective to assess values for the importantparameters characterizing the milestone points of the local bond-sliplaw [Fig. 1(b)]. An important feature of this experimental program isthat it was conducted using tension-pullout specimens, a specimenform designed to alleviate any spurious contributions to bond arisingfrom support conditions (Tastani and Pantazopoulou 2010). In thatsetup, concrete elongation is an order of magnitude smaller than therelative slip of the bar for both components measured in the tests.For this reason, the concrete contribution to slip was neglected.Parameters of the experimental program were bar material (GFRPand steel bars were considered), surface roughness (two types ofGFRP bars were studied: sand-coated bars, referred to here as CPPbars, and bars with helical lengthwise indentations, commerciallyknown as Asl bars), related rib area (steel bars having nominal fRratios equal to 0.065 and 0.15 were studied), and anchorage length(steel bars of 5Db and 12Db with Db 5 12 mm and FRP bars of 5Db
where Db was also a study variable).Of the 80 total specimens tested, only those specimen pairs that
were designed to illustrate the effect of each parameter on the re-sponse data are considered for model calibration in the followingfour sections. The geometric details and primary response indexes ofspecimens selected for further study are summarized inTables 1 and2.
Longitudinal Component: Correlation of Resultsfrom Glass Fiber-Reinforced Polymer Bar Tests
The calibrated variables of the model for this type of reinforcementare listed in Table 1. For the CPP bars having identical surface
pattern regardless of the bar size, the analysis yielded a constantvalue for the characteristic strength equal to fmax
b 5 11MPa for themeasured peak load and displacement values. This result is con-sistent with the assumption of a frictional model for bond strength,where the same frictional coefficient may be used for all the CPPbars. The characteristic values of slip in the local bond slip law[Fig. 1(b)] after calibration of the model with the experimental data,produced the following ranges of values: sy 5 0:2520:3mm andsu 5 0:342 0:42mm. In Fig. 6, the bond and slip distributions areillustrated for the two limit cases, namely, the casewhere bond entersthe zone of plastification (thin black lines) and the case where failureoccurs by debonding (thick black lines). Evidently, as debondingproceeds, bond stresses are redistributed over the active anchoragelength (i.e., over the residual bonded length), tending toward a uni-form distribution with a constant intensity equal to fmax
b [Fig. 6(a)].The experimental value for the slip variable su practically correspondsto the final stage of the process of bond failure where the anchoragehas exhausted its strength reserves and failure occurs in a brittlemanner. Note that the gray dashed lines refer to the average bondstrength values, f aveb , estimated from the experimental ultimate loaddivided by the initial contact area between the bar and concrete (overthe available length Lb). Fig. 6(b) presents the estimated slip distri-bution over Lb where three distinct regions are identified clearly fromthe change in the slope of sðxÞ, namely, the debonded region near theloaded end, followed by a length where plastification of bond hap-pens, with the remaining segment being the elastic part extending tothe free end of the anchorage.
Regarding the Asl bars, owing to the variable surface roughnesswith bar size, the model converges to two different characteristicstrengthvalues, as follows: fmaxb 5 10MPa for bar diametersDb 5 12:7or 15.88 mm and fmaxb 5 9MPa for bar diameter Db 5 19:05mm.The associated slip values are in the range sy 5 0:420:6mm andsu 5 0:4920:74mm (Table 1). The preceding analytical values cor-respond to a more compliant local bond-slip law than in the case ofthe CPP bars, a finding consistent with the experimental evidence.Figs. 6 (c and d) illustrate typical bond stress and slip distributionsfor Asl12np and Asl19np, where, upon the onset of debonding, thebond distribution coincides with the bond strength fmax
b .
Longitudinal Component: Correlation ofResults from Steel Bar Tests
Four characteristic example cases of steel anchorages are consideredformodel calibration (Table 2). Figs. 7 and 8 plot distributions of barstrain, slip, and bond stress along the anchorage. Two stages areidentified: the first corresponds to the plastic response of the bond-slip law (thin black line), whereas the second corresponds to the barresponse just before failure and after debonding has taken place(bold black line). The dashed gray line represents the experimentalresponse given in terms of average bond strength, f aveb , estimatedover the nominal anchorage length, Lb.
Subgroups hð1:1ÞMnpA and hð1:1ÞLnpA [Fig. 7(a)] had identicalparameters (rib height hr 5 1:1mm, no confinement, and the sameconcrete) apart from the anchorage length (LMb 5 60mm and LLb5 144mm, respectively). The model converged to a characteristicbond stress-slip law with milestone values fmax
b 5 10MPa andsy 5 0:2mm. The ultimate slip magnitude su is affected by thelonger Lb; thus, the model solution results in su 5 0:23mm and su5 0:33mm, respectively (Table 2). Note here that the experimentalvalue of s2 [Fig. 1(b) and Table 2] refers basically to the debondingslip, sdeb, and not to the termination of the plateau of the theoreticalbond stress-slip law, su. With a longer anchorage length in the caseof subgroup hð1:1ÞLnpA as compared with that of hð1:1ÞMnpA, bondis plastified over a longer segment of the bar: 122 mm for hð1:1ÞLnpA
1574 / JOURNAL OF STRUCTURAL ENGINEERING © ASCE / SEPTEMBER 2013
J. Struct. Eng. 2013.139:1567-1581.
Dow
nloa
ded
from
asc
elib
rary
.org
by
UN
IVE
RSI
TY
OF
CY
PRU
S on
10/
21/1
3. C
opyr
ight
ASC
E. F
or p
erso
nal u
se o
nly;
all
righ
ts r
eser
ved.
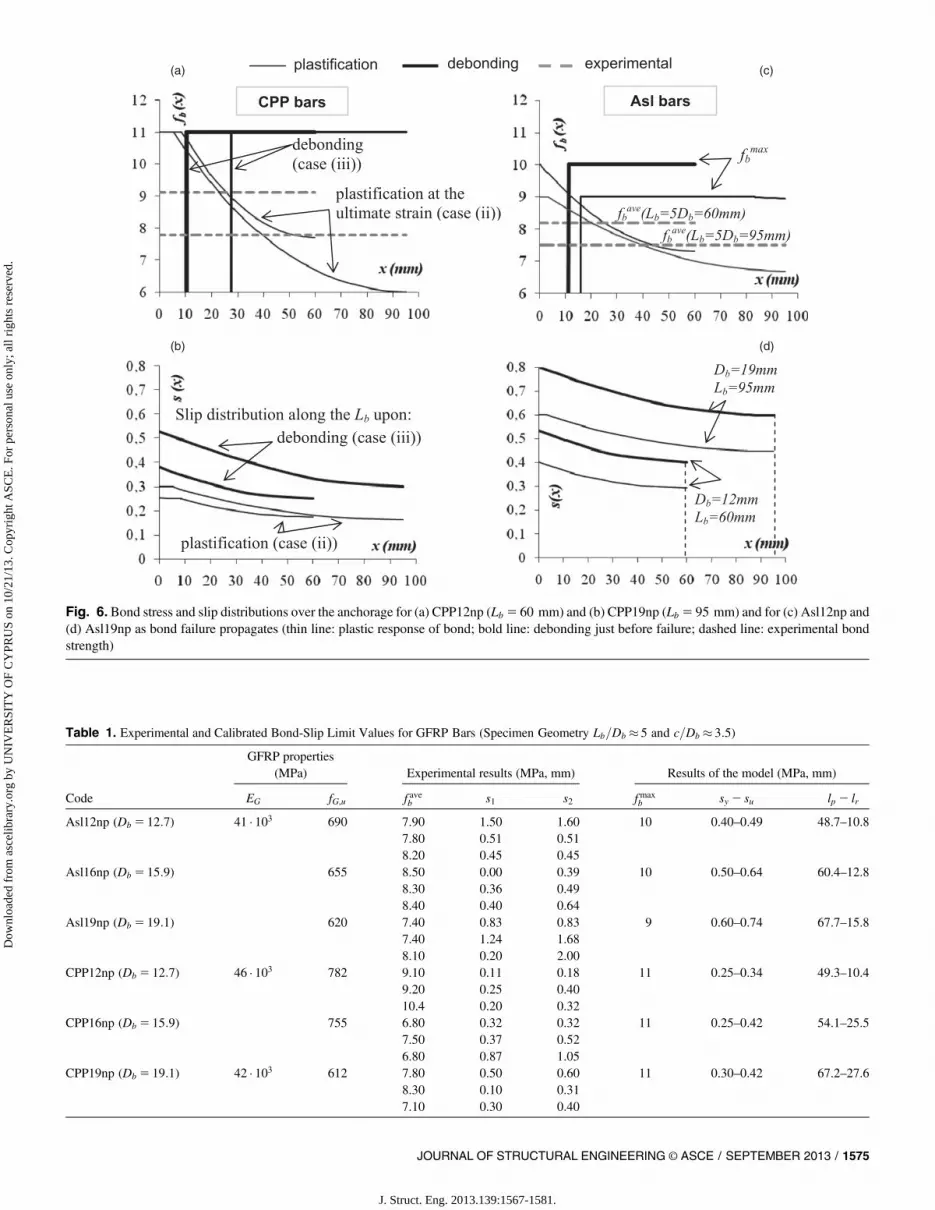
Fig. 6. Bond stress and slip distributions over the anchorage for (a) CPP12np (Lb 5 60 mm) and (b) CPP19np (Lb 5 95 mm) and for (c) Asl12np and(d) Asl19np as bond failure propagates (thin line: plastic response of bond; bold line: debonding just before failure; dashed line: experimental bondstrength)
Table 1. Experimental and Calibrated Bond-Slip Limit Values for GFRP Bars (Specimen Geometry Lb=Db � 5 and c=Db � 3:5)
Code
GFRP properties(MPa) Experimental results (MPa, mm) Results of the model (MPa, mm)
EG fG,u f aveb s1 s2 fmaxb sy 2 su lp 2 lr
Asl12np (Db 5 12:7) 41 × 103 690 7.90 1.50 1.60 10 0.40–0.49 48.7–10.87.80 0.51 0.518.20 0.45 0.45
Asl16np (Db 5 15:9) 655 8.50 0.00 0.39 10 0.50–0.64 60.4–12.88.30 0.36 0.498.40 0.40 0.64
Asl19np (Db 5 19:1) 620 7.40 0.83 0.83 9 0.60–0.74 67.7–15.87.40 1.24 1.688.10 0.20 2.00
CPP12np (Db 5 12:7) 46 × 103 782 9.10 0.11 0.18 11 0.25–0.34 49.3–10.49.20 0.25 0.4010.4 0.20 0.32
CPP16np (Db 5 15:9) 755 6.80 0.32 0.32 11 0.25–0.42 54.1–25.57.50 0.37 0.526.80 0.87 1.05
CPP19np (Db 5 19:1) 42 × 103 612 7.80 0.50 0.60 11 0.30–0.42 67.2–27.68.30 0.10 0.317.10 0.30 0.40
JOURNAL OF STRUCTURAL ENGINEERING © ASCE / SEPTEMBER 2013 / 1575
J. Struct. Eng. 2013.139:1567-1581.
Dow
nloa
ded
from
asc
elib
rary
.org
by
UN
IVE
RSI
TY
OF
CY
PRU
S on
10/
21/1
3. C
opyr
ight
ASC
E. F
or p
erso
nal u
se o
nly;
all
righ
ts r
eser
ved.
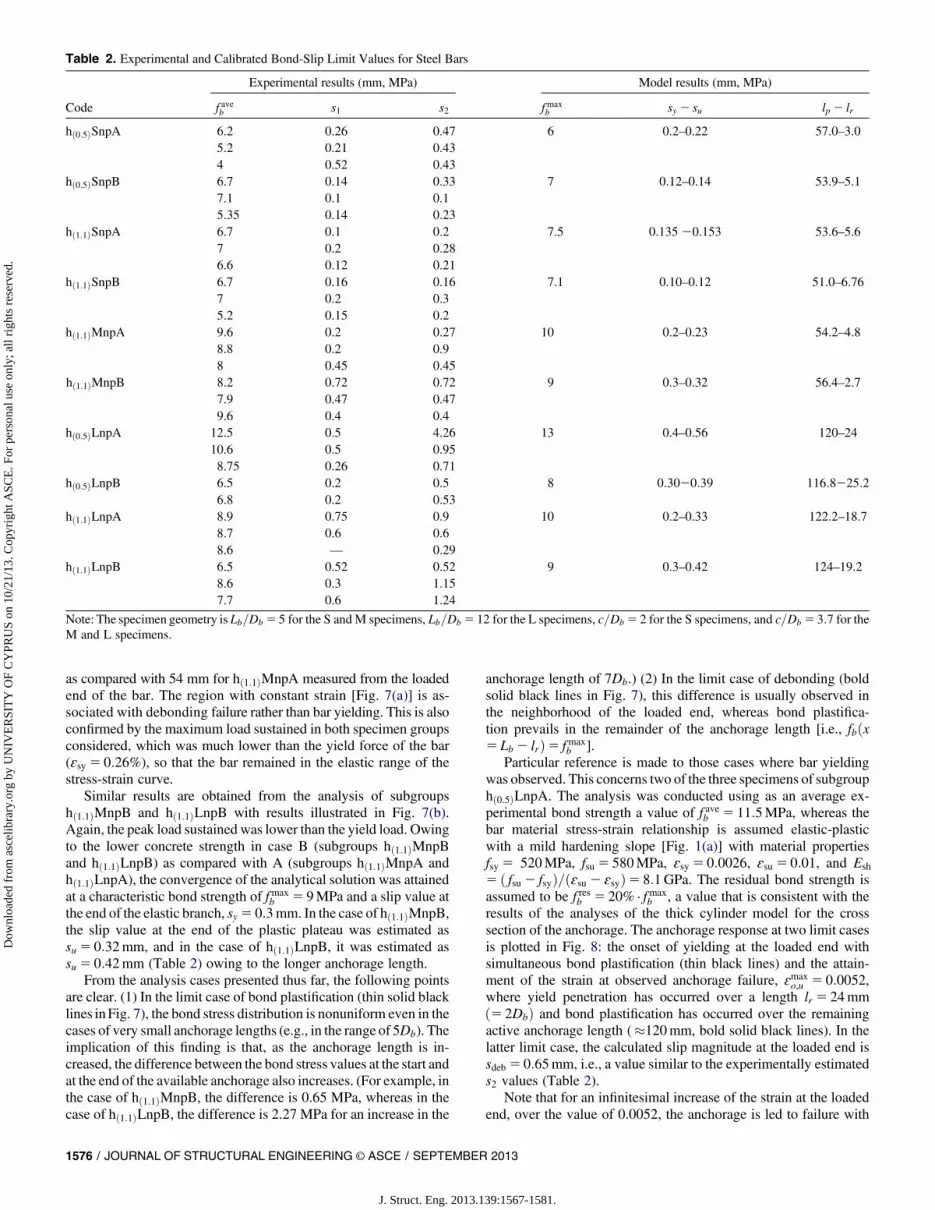
as compared with 54 mm for hð1:1ÞMnpA measured from the loadedend of the bar. The region with constant strain [Fig. 7(a)] is as-sociated with debonding failure rather than bar yielding. This is alsoconfirmed by the maximum load sustained in both specimen groupsconsidered, which was much lower than the yield force of the bar(ɛsy 5 0:26%), so that the bar remained in the elastic range of thestress-strain curve.
Similar results are obtained from the analysis of subgroupshð1:1ÞMnpB and hð1:1ÞLnpB with results illustrated in Fig. 7(b).Again, the peak load sustained was lower than the yield load. Owingto the lower concrete strength in case B (subgroups hð1:1ÞMnpBand hð1:1ÞLnpB) as compared with A (subgroups hð1:1ÞMnpA andhð1:1ÞLnpA), the convergence of the analytical solution was attainedat a characteristic bond strength of fmax
b 5 9MPa and a slip value atthe end of the elastic branch, sy 5 0:3mm. In the case of hð1:1ÞMnpB,the slip value at the end of the plastic plateau was estimated assu 5 0:32mm, and in the case of hð1:1ÞLnpB, it was estimated assu 5 0:42mm (Table 2) owing to the longer anchorage length.
From the analysis cases presented thus far, the following pointsare clear. (1) In the limit case of bond plastification (thin solid blacklines inFig. 7), the bond stress distribution is nonuniform even in thecases of very small anchorage lengths (e.g., in the range of 5Db). Theimplication of this finding is that, as the anchorage length is in-creased, the difference between the bond stress values at the start andat the end of the available anchorage also increases. (For example, inthe case of hð1:1ÞMnpB, the difference is 0.65 MPa, whereas in thecase of hð1:1ÞLnpB, the difference is 2.27 MPa for an increase in the
anchorage length of 7Db.) (2) In the limit case of debonding (boldsolid black lines in Fig. 7), this difference is usually observed inthe neighborhood of the loaded end, whereas bond plastifica-tion prevails in the remainder of the anchorage length [i.e., fbðx5 Lb 2 lrÞ5 fmax
b ].Particular reference is made to those cases where bar yielding
was observed. This concerns two of the three specimens of subgrouphð0:5ÞLnpA. The analysis was conducted using as an average ex-perimental bond strength a value of f aveb 5 11:5MPa, whereas thebar material stress-strain relationship is assumed elastic-plasticwith a mild hardening slope [Fig. 1(a)] with material propertiesfsy 5 520MPa, fsu 5 580MPa, ɛsy 5 0:0026, ɛsu 5 0:01, and Esh
5 ð fsu 2 fsyÞ=ðɛsu 2 ɛsyÞ5 8:1GPa. The residual bond strength isassumed to be f resb 5 20% × fmax
b , a value that is consistent with theresults of the analyses of the thick cylinder model for the crosssection of the anchorage. The anchorage response at two limit casesis plotted in Fig. 8: the onset of yielding at the loaded end withsimultaneous bond plastification (thin black lines) and the attain-ment of the strain at observed anchorage failure, ɛmax
o,u 5 0:0052,where yield penetration has occurred over a length lr 5 24mmð5 2DbÞ and bond plastification has occurred over the remainingactive anchorage length (�120mm, bold solid black lines). In thelatter limit case, the calculated slip magnitude at the loaded end issdeb 5 0:65mm, i.e., a value similar to the experimentally estimateds2 values (Table 2).
Note that for an infinitesimal increase of the strain at the loadedend, over the value of 0.0052, the anchorage is led to failure with
Table 2. Experimental and Calibrated Bond-Slip Limit Values for Steel Bars
Code
Experimental results (mm, MPa) Model results (mm, MPa)
f aveb s1 s2 fmaxb sy 2 su lp 2 lr
hð0:5ÞSnpA 6.2 0.26 0.47 6 0.2–0.22 57.0–3.05.2 0.21 0.434 0.52 0.43
hð0:5ÞSnpB 6.7 0.14 0.33 7 0.12–0.14 53.9–5.17.1 0.1 0.15.35 0.14 0.23
hð1:1ÞSnpA 6.7 0.1 0.2 7.5 0.135 20.153 53.6–5.67 0.2 0.286.6 0.12 0.21
hð1:1ÞSnpB 6.7 0.16 0.16 7.1 0.10–0.12 51.0–6.767 0.2 0.35.2 0.15 0.2
hð1:1ÞMnpA 9.6 0.2 0.27 10 0.2–0.23 54.2–4.88.8 0.2 0.98 0.45 0.45
hð1:1ÞMnpB 8.2 0.72 0.72 9 0.3–0.32 56.4–2.77.9 0.47 0.479.6 0.4 0.4
hð0:5ÞLnpA 12.5 0.5 4.26 13 0.4–0.56 120–2410.6 0.5 0.958.75 0.26 0.71
hð0:5ÞLnpB 6.5 0.2 0.5 8 0:3020:39 116:8225:26.8 0.2 0.53
hð1:1ÞLnpA 8.9 0.75 0.9 10 0.2–0.33 122.2–18.78.7 0.6 0.68.6 — 0.29
hð1:1ÞLnpB 6.5 0.52 0.52 9 0.3–0.42 124–19.28.6 0.3 1.157.7 0.6 1.24
Note: The specimen geometry is Lb=Db 5 5 for the S and M specimens, Lb=Db 5 12 for the L specimens, c=Db 5 2 for the S specimens, and c=Db 5 3:7 for theM and L specimens.
1576 / JOURNAL OF STRUCTURAL ENGINEERING © ASCE / SEPTEMBER 2013
J. Struct. Eng. 2013.139:1567-1581.
Dow
nloa
ded
from
asc
elib
rary
.org
by
UN
IVE
RSI
TY
OF
CY
PRU
S on
10/
21/1
3. C
opyr
ight
ASC
E. F
or p
erso
nal u
se o
nly;
all
righ
ts r
eser
ved.

a sudden loss of load owing to a collapse of the bond mechanism,because there are no strength reserves or possibility for redistribu-tion of bond stress. The ability to estimate the slip magnitude atthe critical section of the anchorage is significant in cases of yieldpenetration, because it determines the inelastic behavior of the struc-tural element. Slip in the plastic hinge region defines a component ofthe rotation capacity of themember, whereas bond stress distributionmay enable (or not) the development of strains well in excess ofthe yield strain at the critical section, thereby contributing to the in-elastic response of the structural element in the case where steeldevelops strain hardening. Yield penetration over lengths exceedingLb 5 12Db (as seen in the present case) has been also reported by
Bonacci (1994) and Bonacci and Marquez (1994), who noted thata small change in the anchorage length from 11Db to 12Db couldconvert the failure mode from combined slipping/pullout withoutyielding to yield penetration followed by pullout.
The influence of yield penetration on the anchorage behaviorprior to or at the attainment of failure is explored in Fig. 9. Con-sidering a steel bar with Db 5 14mm, ɛsy 5 0:0025, sy 5 0:3mm,and f resb 5 20% × fmax
b , the investigated parameters include (i) thesteelmodulus at hardeningEsh (5, 10, and 15%ofEs 5 200GPa) and(ii) the characteristic bond strength fmax
b (5 and 10 MPa). Fig. 9(a)plots the maximum estimated slip at the entrance of the anchor-age, sdeb, normalized with the characteristic slip, sy, of the assumed
Fig. 7. Distributions of bar strain, slip, and bond stress for specimen subgroups (a) hð1:1ÞMnpA and hð1:1ÞLnpA and (b) hð1:1ÞMnpB and hð1:1ÞLnpB
Fig. 8. Distributions of strain, slip, and bond stress for specimen hð0:5ÞLnpA where yield penetration has been observed before failure
JOURNAL OF STRUCTURAL ENGINEERING © ASCE / SEPTEMBER 2013 / 1577
J. Struct. Eng. 2013.139:1567-1581.
Dow
nloa
ded
from
asc
elib
rary
.org
by
UN
IVE
RSI
TY
OF
CY
PRU
S on
10/
21/1
3. C
opyr
ight
ASC
E. F
or p
erso
nal u
se o
nly;
all
righ
ts r
eser
ved.

bond-slip law against the normalized anchorage length Lb=Db. Eachset of curves begins at the point in the horizontal axis that corre-sponds to the minimum required, normalized, bonded lengthLb,min=Db 5 fsy=ð4fmax
b Þ (i.e., 25 for fmaxb 5 5MPa and 12.5 for
fmaxb 5 10MPa). Note the reverse effect of the bar strain hardeningmodulusEsh on themagnitude of the slip sdeb at the loaded end of theanchorage: the lower the modulus, the higher the accumulated slip.The practical significance of this result is that only a fraction of theavailable deformation of high–hardening modulus steel may beexploited [Fig. 9(b)] owing to the limited available fracture energy ofconcrete, which is an intrinsic property of the material quantified bythe area under the bond-slip law. This is also confirmed by the relationbetween anchorage deformation capacity and anchorage length[after solution of case (iv) at ultimate strain]: ɛo,u5ɛsy14f resb =ðDbEshÞ× ðLb2Lb,minÞ.
An important finding of the analysis is that the slip value at theend of the horizontal branch of the local bond-slip law, su, is not anintrinsic property of the bar-concrete interface (as the variables fmax
band sy are) but mainly depends on the anchorage geometry; it takesits maximum value for anchorage length greater than the minimumanchorage length, Lb,min, and when the strain level attains the an-chorage capacity ɛo,u. Thus, for bond strengths of 5 and 10MPa, thesu are 0.75 and 0.5 mm, respectively. Note also that, at this ultimatestate, the slip at the free end of the anchorage (defined in Fig. 2 as sf )approximates the characteristic value sy of the bond-slip law.
Fig. 9(c) depicts the relation between slip sdeb and the level ofstrain ɛo for a specific anchorage length (i.e., Lb 5 30Db . Lb,min);by doubling the bond strength (and the associated residual bondresistance), the strain capacity increases by threefold for the low-hardening steel [black lines in Fig. 9(c)], whereas this increment issmaller for the high-hardening steel [light gray lines in Fig. 9(c)].The practical significance of a slip–total strain relationship is in thedefinition of dependable rotation capacity in the assessment ofexisting structures. [An empirical relation for the strain developmentcapacity of existing anchorages is provided both in theASCE-SEI 41(Elwood et al. 2007) and Eurocode 8 (European Committee forStandardization 2005) guidelines for seismic assessment.]
Transverse Component: Correlation of Resultsfrom Steel Bar Tests
For the assessment of the cross-sectional model, the specimensubgroups hð1:1ÞSnpA and hð1:1ÞMnpA are comparatively evaluated(same rib height of 1.1 mm; specimens with the S identifier had
a clear cover of c5 24mm, whereas specimens identified with theletter M had c5 44mm).
Fig. 10(a) plots the radial pressure at the bar-cover interfaceresulting from applied radial displacement for each specimen groupseparately. The two estimations of sr,o obtained using Eq. (S15) [orEq. (20)] are not the same in the two groups because of the increaseof cover from 2Db to 3:7Db.
In estimating the bond stress through Eq. (22), the more conser-vative estimation of sr,o is used. Using Eqs. (22) and (23), the an-alytical relationship between bond stress and slip is obtained for thetwo specimens. [The relevant experimental average bond-slip curvesare also given for comparison in Fig. 10(b)]. Based on the maximumpressure developed in the cover [Fig. 10(a)], the coefficient of frictionwas set to mmaxðhð1:1ÞSnpAÞ5 1:2 and mmaxðhð1:1ÞMnpAÞ5 1:18.The values of bond stress and slip at the onset of failure obtained fromthe transverse bond model coincide with sufficient accuracy bothwith the experimental measurements and with the analytical valuesobtained from back-calculation using the longitudinal bond model(Table 2). For example, the average experimental bond strengthfor the subgroup hð1:1ÞSnpA was f aveb 5 6:8MPa with an analyticalcharacteristic value (longitudinal component) fmax
b 5 7:5MPa,whereas the sectional thick-cylinder model yielded a value of6.6 MPa. (The parameter ay was previously defined as 20.)Similarly, the experimental value of slip sustained at the attainmentof the average bond strength was sy 5 0:14mm (Table 2), and theestimated analytical value at the initiation of bond plastificationwas sy 5 0:13mm (Table 2), whereas the value obtained from thesectional model was sy 5 0:09mm. Test results for specimen sub-group hð1:1ÞMnpAwere as follows: f aveb 5 9:2MPa and sy 5 0:2mm.Bond strength calculated from the longitudinal component of theproposed model is fmax
b 5 10MPa, whereas the output of the trans-verse model is 9.8 MPa. The corresponding slips were sy 5 0:2mm(longitudinal model) and sy 5 0:18mm (transverse model).
Transverse Component: Correlation of Resultsfrom Glass Fiber-Reinforced Polymer Bar Tests
Fig. 11 illustrates the response of specimen subgroups Asl12np,Asl16np, andAsl19npwith the bar diameter being the study variableand the ratios of cover to bar diameter and anchorage length tobar diameter being kept the same between these subgroups (Tastaniand Pantazopoulou 2006). The frictional coefficient was set tommax 5 0:8, because in all cases, the inner pressure calculatedthrough Eqs. (S15) and (20) was below the limit of 0:8fck (as
Fig. 9. Effect of bond strength and steel hardening modulus on the postyield deformation of a straight anchorage: (a) normalized slip at the anchorageloaded end versus anchorage length; (b) ultimate strain versus anchorage length; (c) for a specific anchorage length, the slip spread for a strain rangebetween first yield and development capacity
1578 / JOURNAL OF STRUCTURAL ENGINEERING © ASCE / SEPTEMBER 2013
J. Struct. Eng. 2013.139:1567-1581.
Dow
nloa
ded
from
asc
elib
rary
.org
by
UN
IVE
RSI
TY
OF
CY
PRU
S on
10/
21/1
3. C
opyr
ight
ASC
E. F
or p
erso
nal u
se o
nly;
all
righ
ts r
eser
ved.

discussed earlier for the definition of the frictional coefficient),whereas the coefficient ay 5 30. Because of the difference betweenthe inner pressure values calculated through Eqs. (S15) and (20) [inmost of the cases around 3 MPa; Fig. 11(a)] as a result of the thickconcrete cover (. 3:5Db), the average values of the two alternativesare used here for the derivation of the bond stress. Again, the an-alytical quantities are similar to the experimental values aswell as thevalues obtained when bond strength is back-calculated from thesustained load using the longitudinal bond model (Table 1).
In general, it may be said that the cross-sectional model ap-proximates well the experimental behavior of the prototype tensionpullout specimen (Tastani and Pantazopoulou 2006, 2010) ac-cording to which, after the attainment of bond strength that occursalmost simultaneously with the end of the elastic branch, failureensues in a brittle fashion with a sudden drop of the load and sig-nificant pullout. The difficulty in recording the experimental radialdisplacement (or dilation) that the bar applies to the surroundingconcrete during pullout in the experimental phase of the investiga-tion is the reason why no such data are available, although thepresence of the geometric relationship is evident from the appear-ance of the test specimens [Fig. 3(c)].
Conclusions
To interpret the various aspects of experimentally documented bondbehavior, a detailed analytical model was developed in this paper.The complete model comprises two independent but mutually
complementary components: a sectional model and a longitudinalmodel, in complete analogy with the separation of variables used insolving partial differential equations. The sectional model idealizesthe state of stress in the concrete cover surrounding the bar using thethick-ring analogy and displacement control. Longitudinal bondstress is related to the radial pressure on the inner boundary of thering using a frictional relationship. The model reproduces the evo-lution of mixed pullout-splitting failures and enables a mechanics-based calculation of local bond strength from first principles. Thestate of stress lengthwise along the anchorage is resolved by thelongitudinal model, which represents the exact solution to the dif-ferential equation of bond, obtained through the assumption of a bi-linear local bond stress-slip law; properties for this law are obtainedthrough the sectional model. Apart from the frictional model to relatestresses, the twomodels are also related by the kinematics imposed bythe bar surface deformations as they slide through the concrete cover.
The solution in the longitudinal direction of the anchorage dis-tinguishes several phases such as plastification of the bond mecha-nism, partial debonding along the anchorage (for elastic bars), andyield penetration (for steel bars) as failure propagates from the loadedtoward the free end.Themodel is considered effective for interpretationof the observed trends of experimental bond studies reported in theliterature. Bond stress is generally nonuniform along the anchorage,rendering the local bond strength, fmaxb , always from first principles,greater than the averagebond strength, f aveb ,which is reported from testsas the ratio of the applied load to the bar contact surface.
It is important to note that the constitutive relationship for localbond stress versus slip, as described by theComite ́ Euro-International
Fig. 10. (a) Radial pressure–radial displacement plot (sr,o-ur,o) at the bar-cover interface; (b) bond stress–slip curve (fb-s) for specimens h(1.1)SnpAand h(1.1)MnpA
JOURNAL OF STRUCTURAL ENGINEERING © ASCE / SEPTEMBER 2013 / 1579
J. Struct. Eng. 2013.139:1567-1581.
Dow
nloa
ded
from
asc
elib
rary
.org
by
UN
IVE
RSI
TY
OF
CY
PRU
S on
10/
21/1
3. C
opyr
ight
ASC
E. F
or p
erso
nal u
se o
nly;
all
righ
ts r
eser
ved.

duBet́on (1993), was obtained frompullout tests on short-length steelbar anchorages. The results are as follows.• The experimental value of f aveb , obtained upon the assumption of
uniform distribution, generally does not coincide with the realsituation, as represented by the exact solution of the governingequation in the longitudinal direction, whereby the bond stressvalues at the opposite ends of the anchorage are at significantdiscrepancy.
• The experimental average bond strength f aveb is a more conser-vative measure as compared with the characteristic value fmax
b ,because it is estimated without considering that, near failure, theanchorage is partially debonded, a fact that reduces the activedevelopment length.
• The experimental slip value, s2, at the end of the plateau in thelocal bond-slip law [Fig. 1(b)], as shown through the analyticalinvestigation, corresponds to the measured slip at the onset ofdebonding, sdeb. The value of sdeb comprises partly the slip of thebonded length, su, and partly the bar extension that occurs overthe debonded part of the anchorage.Thus, it may be concluded that the proposed analytical model
mitigates some of the empiricism attached to experimentally derivedbond stress-slip laws. The model (longitudinal solution) is consideredparticularly valuable for the analysis of structural elements, because itcan reproduce phenomena such as bond plastification and yield pen-etration that precede failure and affect the members’ rotation capacity.
From the limited experimental data regarding the radial compo-nent of bond (stresses and strains), it is not possible to support thedevelopment of a generalized relationship to relate bar surface mor-phology, physicochemical properties of concrete (e.g., porosity), andthe resulting radial displacement that could be used as a basic input ofthe model beyond a very basic phenomenological treatment. All ofthese are reflected in the empirical coefficient ai, which depends on
the material, the rib profile of the bar, the applied external pressure,and the performance limit (quantified by the amount of slip).
Supplemental Data
The equations that control the boundary value problem of a thickcylinder and Figs. S1 and S2 are available online in the ASCELibrary (www.ascelibrary.org).
References
Bakis, C., Uppuluri, V., Nanni, A., and Boothby, T. (1998). “Analysis ofbonding mechanisms of smooth and lugged FRP rods embedded inconcrete.” Compos. Sci. Technol., 58(8), 1307–1319.
Benmokrane, B., Tighiouart, B., and Chaallal, O. (1996). “Bond strengthand load distribution of composite GFRP reinforcing bars in concrete.”ACI Mater. J., 93(3), 246–253.
Bonacci, J. (1994). “Bar yield penetration in monotonically loaded ancho-rages.” J. Struct. Eng., 120(3), 965–986.
Bonacci, J., and Marquez, J. (1994). “Tests of yielding anchorages undermonotonic loadings.” J. Struct. Eng., 120(3), 987–997.
Cairns, J. (1979). “An analysis of the ultimate strength of lapped joints ofcompression reinforcement.” Mag. Concr. Res., 31(106), 19–27.
Comite ́ Euro-International du Bet́on. (1993). CEB-FIP model code 1990:Design code, Thomas Telford, London.
Cox, J., and Herrmann, L. (1998). “Development of a plasticity bond modelfor steel reinforcement.” Mech. Cohes.-Frict. Mater., 3(2), 155–180.
Cox, J., and Yu, H. (2001). “Radial elastic stiffness associated with bondbetween steel bars and concrete.” ACI Struct. J., 98(1), 16–26.
Den Uijl, J., and Bigaj, A. (1996). “A bond model for ribbed bars on con-crete confinement.” HERON, 41(3), 201–226.
Elwood, K., et al. (2007). “Update to ASCE/SEI 41 concrete provisions.”Earthq. Spectra, 23(3), 493–523.
Fig. 11. (a) Radial pressure–radial displacement plots (sr,o-ur,o) at the bar-concrete interface for specimens Asl12np, Asl16np, and Asl19np;(b) comparison of bond stress–slip ( fb-s) plots for the three subgroups
1580 / JOURNAL OF STRUCTURAL ENGINEERING © ASCE / SEPTEMBER 2013
J. Struct. Eng. 2013.139:1567-1581.
Dow
nloa
ded
from
asc
elib
rary
.org
by
UN
IVE
RSI
TY
OF
CY
PRU
S on
10/
21/1
3. C
opyr
ight
ASC
E. F
or p
erso
nal u
se o
nly;
all
righ
ts r
eser
ved.

European Committee for Standardization. (2005). “Design of structures forearthquake resistance, part 3.” Eurocode 8, Brussels, Belgium.
Filippou, F., Popov, E., and Bertero, V. (1983). “Modeling of R/C joinsunder cyclic excitations.” J. Struct. Eng., 109(11), 2666–2684.
Lundgren, K. (1999). “Three-dimensional modelling of bond in reinforcedconcrete.” Ph.D. thesis, Dept. of Civil Engineering, Chalmers Univ. ofTechnology, Göteborg, Sweden.
Malvar, J. (1992). “Bond of reinforcement under controlled confinement.”ACI Mater. J., 89(6), 593–601.
Malvar, J. (1995). “Tensile and bond properties of GFRP reinforcing bars.”ACI Mater. J., 92(3), 276–285.
Malvar, L. J., Cox, J. V., and Cochran, B. K. (2003). “Bond between carbonfiber reinforced polymer bars and concrete. I: Experimental study.”J. Compos. Constr., 7(2), 154–163.
Novidis, D., and Pantazopoulou, S. J. (2005). “Experimental study of shortNSM – FRP bar anchorages.” ACI Special Publication, 230(SP230-23),391–410.
Pantazopoulou, S. J., and Papoulia, K. D. (2001). “Modeling cover-crackingdue to reinforcement corrosion in RC structures.” J. Eng. Mech., 127(4),342–351.
Soroushian, P., Obasaki, K., and Marikunte, S. (1991). “Analytical modelingof bonded bars under cyclic loads.” J. Struct. Eng., 117(1), 48–60.
Tassios, T. P., and Yannopoulos, P. J. (1981). “Analytical studies onreinforced concrete members under cyclic loading based on bond-sliprelationships.” ACI Mater. J., 78(3), 206–216.
Tastani, S. P., and Pantazopoulou, S. J. (2006). “Bond of G-FRP bars inconcrete: Experimental study and analytical interpretation.” J. Compos.Constr., 10(5), 381–391.
Tastani, S. P., and Pantazopoulou, S. J. (2010). “Direct tension pullout bondtest: Experimental results.” J. Struct. Eng., 136(6), 731–743.
Tepfers, R. (1979). “Cracking of concrete cover along anchored deformedreinforcing bars.” Mag. Concr. Res., 31(106), 3–12.
Vecchio, F., and DeRoo, A. (1995). “Smeared-crack modeling of concretetension splitting.” J. Eng. Mech., 121(6), 702–708.
JOURNAL OF STRUCTURAL ENGINEERING © ASCE / SEPTEMBER 2013 / 1581
J. Struct. Eng. 2013.139:1567-1581.
Dow
nloa
ded
from
asc
elib
rary
.org
by
UN
IVE
RSI
TY
OF
CY
PRU
S on
10/
21/1
3. C
opyr
ight
ASC
E. F
or p
erso
nal u
se o
nly;
all
righ
ts r
eser
ved.