regulation of brain anandamide by acute administration of ethanol
TRANSCRIPT
1
Regulation of brain anandamide
by acute administration of ethanol
Belen Ferrer* †, Francisco Javier Bermúdez-Silva*, Ainhoa Bilbao,* ‡,
Lily Alvarez-Jaimes#, Irene Sanchez-Vera*, Andrea Giuffrida†, Antonia Serrano* ,
Elena Baixeras*, Miguel Navarro‡, Loren H. Parsons#,
Daniele Piomelli† 2 and Fernando Rodríguez de Fonseca* ‡ 1
*Fundación IMABIS, Hospital Carlos Haya, Málaga 29010, SPAIN
†Department of Pharmacology, University of California, Irvine 92697-4625, USA
‡Departamento de Psicobiología, Universidad Complutense, Madrid 28224, SPAIN
#Molecular and Integrative Neuroscience Department. The Scripps Research Institution. La
Jolla, California, 92037 USA
(1) Fernando Rodríguez de Fonseca
Fundación IMABIS, Hospital Carlos Haya. Avenida Carlos Haya s/n. 7ª Planta.
Pabellón A
29010 Málaga. SPAIN. Fax 34-952646725
e-mail: [email protected]
(2) Authors for correspondence:
Daniele Piomelli
Department of Pharmacology, 360 MSRII, University of California, Irvine
California 92697-4625
Phone: (949) 824-6180, Fax: (949) 824-6305
E-mail: [email protected]
Running Title: Anandamide and acute ethanol
1
Biochemical Journal Immediate Publication. Published on 15 Feb 2007 as manuscript BJ20061898
© 2007 The Authors Journal compilation © 2007 Biochemical Society
2
ABSTRACT
The endogenous cannabinoid anandamide participates in the neuroadaptations
associated with chronic ethanol exposure. However, no studies describe the acute
actions of ethanol on anandamide production and degradation. In the present study we
investigated the time-course of the effects of the peripheral administration of ethanol
(4 gr/kg, i.p.) on the endogenous levels of anandamide in central and peripheral
tissues. Acute ethanol administration decreased anandamide in the cerebellum, the
hippocampus and the ventral striatum, as well as in plasma and adipose tissue. Parallel
decreases of a second acylethanolamide, palmithylethanolamide were observed in the
brain. Effects were observed 45-90 min after ethanol administration. In vivo studies
revealed that anandamide decreases were associated with a remarkable inhibition of
the release of both anadamide and glutamate release in the ventral striatum. There
were no changes in the expression and enzimatic activity of the main enzyme that
degradates anandamide, the fatty acid amidohydrolase. Acute ethanol did not change
neither the activity of n-acyltransferase, the enzyme that catalyzes the synthesis of the
anandamide precursor, nor the expression of NAPE-PLD, the enzyme that releases
anandamide from membrane phospholipid precursors. These results suggest that
receptor-mediated release of acylethanolamide is inhibited by the acute administration
of ethanol, and that this effect is not derived of increased fatty acid ethanolamide
degradation.
Keywords: Cannabinoid, Alcohol, Anandamide, rat, hippocampus, fatty acid
amidohydrolase
2
Biochemical Journal Immediate Publication. Published on 15 Feb 2007 as manuscript BJ20061898
© 2007 The Authors Journal compilation © 2007 Biochemical Society
3
Several research lines have established a role for both the endogenous cannabinoid
anandamide (AEA) and the cannabinoid CB1 receptor in ethanol dependence [1 - 3].
While administration of cannabinoid CB1 receptor agonists promotes ethanol intake
[4], the administration of a cannabinoid CB1 receptor antagonist decreases ethanol self
administration [5], especially in animals with a history of ethanol dependence [6] or in
alcohol preferring rat lines [7]. Following these findings, cannabinoid CB1 receptor
knockout mice were found to display decreased ethanol preference, a phenotype that
resembled that of wild-type littermates treated with a cannabinoid receptor antagonist
[3].
Molecular studies have shown that chronic ethanol administration is associated with
an increased formation of both AEA and its membrane precursor N-
arachidonylphosphatidylethanolamine [8]. Chronic alcohol exposure also resulted in
stimulation of 2-arachidonylglycerol, a second endocannabinoid [9]. Animal studies
also revealed that chronic exposure to ethanol downregulated cannabinoid CB1
receptors in the brain [10]. Finally, a recent gene screening study has identified the
cannabinoid CB1 receptor as one of the genes whose expression is permanently
affected by serial cycles of ethanol dependence and withdrawal [11]. These data
indicate a role for the endogenous cannabinoid system as a relevant contributor to
alcoholism. Human genetic studies support this experimental hypothesis since a
linkage between clinical forms of alcoholism and polymorphisms and/or mutations of
the genes encoding either the cannabinoid CB1 receptor [12, 13] or the fatty acid
amidohydrolase (FAAH) [14], the enzyme responsible for AEA inactivation [15] have
been described.
3
Biochemical Journal Immediate Publication. Published on 15 Feb 2007 as manuscript BJ20061898
© 2007 The Authors Journal compilation © 2007 Biochemical Society

4
Despite the extensive information on the effects of chronic exposure to alcohol, no
information is available on the acute effects of ethanol on AEA formation and
degradation. We addressed this issue by analyzing the time-course of the effects of
acute ethanol on AEA and the related mediator palmithylethanolamide (PEA)
formation in the brain. We selected three different brain areas characterized by the
sensitivity to ethanol effects: the ventral-striatum nucleus accumbens, where intrinsic
neurons and glutamate release are inhibited by ethanol [16, 17]; the dorsal
hippocampus, where ethanol inhibits acetylcholine release [18], as well as glutamate
release and glutamate-dependent depolarization [19 – 21]; and the cerebellum, where
ethanol modifies the firing pattern and the glutamate response of Purkinje neurons
[22]. These brain areas display relevant densities of cannabinoid CB1 receptors where
they participate on presynaptic control of neurotransmitter release [23 - 26]. We also
monitored the in vivo and in vitro actions of ethanol on the enzymatic activities of N-
acyltransferase (NAT) and FAAH, enzymes involved in AEA formation and
degradation [27, 28, 15], as well as the mRNA expression of the n-
acylphosphatidylethanolamide-specific phospholipase D, the recently cloned enzyme
that cleaves anandamide from its membrane precursor [29]. The results suggest that
acute administration of ethanol markedly inhibits in vivo formation of AEA and its
related endocannabinoid palmithylethanolamide in the rat brain and that this effect is
not dependent on the activity of FAAH or NAT enzymes.
4
Biochemical Journal Immediate Publication. Published on 15 Feb 2007 as manuscript BJ20061898
© 2007 The Authors Journal compilation © 2007 Biochemical Society
5
MATERIAL AND METHODS
Animals
Male Wistar rats (Charles River, Wilmington, MA and Barcelona, Spain), weighing
350 ± 50 g were housed individually with food and water available ad libitum.
Animals were kept in an standard 12 h light/dark photoperiod (Lights on 8:00 to 20:00
a.m). They were handled daily for a week before starting the experiments, and they
received i.p saline injections, once a day along the three days that preceeded the
experimental administration of ethanol. All animal procedures met the National
Institutes of Health guidelines for the care and use of laboratory animals, and the
European Communities directive 86/609/EEC regulating animal research.
Chemicals
Unlabeled anandamide (AEA) and palmithylethanolamide standards and [2H4]-labeled
anandamide palmithylethanolamide and were synthesized as described [30].1,2-
Di[14
C]palmityl-sn-glycerophosphocholine (108 mCi/mmol) was purchased from
Amersham Bioscences (Barcelona, Spain), and [1-3H] ethanolamine hydrochloride (60
Ci/mmol) was from American Radiolabeled Chemicals (St. Louis, MO).
Vehicle and ethanol administration: Blood and tissue sampling
Ethanol was dissolved in sterile saline (sodium chloride, 0.9% w/v) before i.p.
injection. Rats received either ethanol solution (15% w/v, 4, 2 or 0.75 gr/kg) or a
similar volume of a 0.9% saline solution (control group). In order to avoid potential
circadian variations on endocannabinoid levels, as previously described [31] all the
experiments took place between 9:00 to 13:00 a.m. during the light phase of the cycle.
5
Biochemical Journal Immediate Publication. Published on 15 Feb 2007 as manuscript BJ20061898
© 2007 The Authors Journal compilation © 2007 Biochemical Society
6
Since it has been described that restraint stress may affect brain anandamide levels in
specific brain areas [32], we first explore the potential effects of injection procedure
on the brain levels of this endocannabinoid. To this end, we analyzed whether a single
saline injection affected anandamide concentrations in the ventral striatum, cerebellum
and dorsal hippocampus. A group of injection-habituated animals was anesthetized
with methoxyflurane (Schering-Plough, Union, NJ) 0, 30 and 60 min after the
injection of 0.9% saline (1 ml/kg). The brains were collected after rapid decapitation
and immediately frozen in dry ice. Dissection of frozen brains was performed at –
10ºC. Brains were placed in acrylic rat brain matrices, and 2 mm thick slices were
obtained using brain matrix razor blades. The target brain region were collected using
a scalpel (cerebellum and dorsal hippocampus) or a sample corer (ventral striatum).
The ventral-striatum-accumbens, dorsal hippocampus and cerebellum were dissected
in 2 mm-thick frozen coronal cuts, corresponding to plates 9-13 (ventral striatum-
accumbens), 26-36 (dorsal hippocampus) and 56-65 (cerebellum) of the atlas of
Paxinos and Watson [33].
In order to evaluate the effects of ethanol on blood and brain endocannabinoid content,
two more experiments were performed. For blood and visceral sampling, a group of
animals was anesthetized with methoxyfluran 0, 45, 90 and 240 min after the injection
of ethanol. Blood (2 ml) was collected from the heart of the animal with a syringe
filled with 1 ml of Krebs-Tris buffer (in mM: NaCl 136, KCl 5, MgCl2 1.2, CaCl2 2.5,
glucose 10, Trizma base 20; pH 7.4). Blood samples were centrifuged in accuspin
tubes (Sigma, St. Louis, MO) and plasma layers used for monitoring plasma AEA as
described [30]. Samples were obtained from perirenal fat, liver and ileum and
immediately frozen in dry ice. A second group of animals were sacrificed following
the above described protocol 0, 45, 90 and 240 min after the injection of ethanol. The
6
Biochemical Journal Immediate Publication. Published on 15 Feb 2007 as manuscript BJ20061898
© 2007 The Authors Journal compilation © 2007 Biochemical Society

7
brains were collected and immediately frozen in dry ice. The ventral-striatum-
accumbens, dorsal hippocampus and cerebellum were dissected as described above.
Plasma ethanol levels
Plasma ethanol levels were measured enzymatically using a commercial kit (Sigma,
St. Lous, MO, USA). Assays were run following the manufacturer’s instructions.
High-performance liquid chromatography/mass spectrometry (HPLC/MS) analyses of
tissular contents of acylethanolamides
AEA and PEA were solvent-extracted from plasma, brain areas (accumbens, dorsal
hippocampus and cerebellum) and peripheral tissues (perirenal fat, liver and ileum),
fractionated by column chromatography and quantified by HPLC/MS with an isotope
dilution method [30, 34].
Real-time PCR for relative quantification of CB1, FAAH, NAPE-PLD and GAPDH
mRNA expression
Total RNA from ventral striatum-accumbens, hippocampus and cerebellum was
obtained using Trizol reagent (Gibco BRL Life Technologies, Baltimore, Maryland)
according to the manufacturer’s instructions. All RNA samples showed A260/280
ratios between 1.8 and 2.0. First strand synthesis from each sample was done using
random hexamer primer and M-MuLV reverse transcriptase (Roche Applied Science,
Indianapolis, USA) according to manufacturer’s instructions. Negative control
reactions omitted reverse transcriptase. Resulting cDNAs were used as the template
for real-time quantitative PCR, which was performed on the LightCycler instrument
(Roche) with the SYBR Green I detection format.
7
Biochemical Journal Immediate Publication. Published on 15 Feb 2007 as manuscript BJ20061898
© 2007 The Authors Journal compilation © 2007 Biochemical Society
8
The following primers were used (Accession numbers from NCBI database in
parenthesis): CB1 (NM_012784) forward: 5’-agacctcctctacgtgggctcg-3’, reverse: 5’-
gtacagcgatggccagctgctg-3’ (314 bp product); FAAH (U72497) forward: 5’-
gttacagagtggagagctgtc-3’, reverse: 5’-gagggttactgcagtcaaagc-3’ (344 bp product);
NAPE-PLD (AB112351) forward: 5’-ggagcttatgagccaaggtg-3’, reverse: 5’-
actctccgtgcttcaggatg-3’ (223 bp product); GAPDH forward, 5’-ggtgatgctggtgctgagta-
3’,GAPDH reverse, 5’-actgtggtcatgagcccttc-3’ (272 bp product). Endogenous control:
beta-glucoronidase (GUS, NM_017015) forward: 5’-tcctgtacaccacccctacc-3’, reverse
5’-gccatcctcatccagaagac-3’ (146 bp product). Primers were obtained from Proligo
(Proligo France SAS, Paris, France).
Quantification was carried out on the basis of standard curves run simultaneously than
samples [35]. CB1, FAAH, NAPE-PLD, GADPH and GUS standards were generated
by PCR-amplification from control samples. The PCR product was run in a 1%
agarose gel electrophoresis for checking the fragment size and the absence of other
contaminant fragments, quantified by 260 nm absorbance, and serially diluted to 10-5
pg/ l. Several 10-fold dilutions (10-1
-10-5
) were checked for optimal cycling on the
LightCycler and three of them were selected for standard curves taking in
consideration mRNA abundance. Each reaction was run in duplicate and contained 3
l of cDNA template, 3 mM Cl2Mg and 0.5 M of primers in a final reaction volume
of 20 l. Cycling parameters were 95ºC for 10 min to activate DNA polymerase, then
30-40 cycles of 95ºC for 10 s, annealing temperature for 10 s (CB1: 62ºC, FAAH:
41ºC, NAPE-PLD: 57ºC, GADPH: 66ºC; GUS: 61ºC ) and a final extension step of
72ºC for 16 s in which fluorescence was acquired. Melting curves analysis were
performed to ensure only a single product was amplified. Data for CB1, FAAH,
NAPE-PLD and GAPDH were normalized for expression of GUS.
8
Biochemical Journal Immediate Publication. Published on 15 Feb 2007 as manuscript BJ20061898
© 2007 The Authors Journal compilation © 2007 Biochemical Society

9
Preparation of rat tissue subcellular fractions.
Tissues were homogenized in 50 mM Tris buffer, pH 8, containing 0.32 M sucrose.
Homogenates were centrifuged first at 1000 × g (5 min), the pellet was then discarded
and the supernatant centrifuged at 45,000 × g (30 min). The pellets obtained were
solubilized at 0-4°C in Tris buffer. The protein content in the membrane fraction was
measured with the Bradford method. All tissue samples and membrane fractions were
stored at –70ºC until use.
Enzymatic determinations
We assayed membrane-bound FAAH activity using arachidonoyl-[1-3H]-ethanolamide
as a substrate, and measuring metabolized [3H]anandamide (as [
3H]ethanolamine) in
the aqueous phase after chloroform extraction, as described [35, 34]. Microsomal NAT
activity assays were performed using 1,2-Di[14
C]palmityl-sn-glycerophosphocholine
as substrate [36]. Both enzymatic assays were run under conditions that were linear in
time and protein concentration.
In vivo microdialysis of anandamide and glutamate
Drug-naïve male Wistar rats (n = 11; 300-350g; Charles River, Wilmington, MA
USA) were anesthetized (Isofluorane 1-2% vapor) and implanted with microdialysis
guide cannula (20-gauge, SciPro Inc., Sanborn NY, USA) aimed at the nucleus
accumbens shell (from Bregma: AP +1.6 mm, ML +/- 0.8 mm, and DV - 5.7 mm from
dura; [33,37]). Seven days of post-operative recovery period was allowed before
testing. On the day before microdialysis, animals were anesthetized (Isofluorane 1-2%
vapor) and a microdialysis probe (2 mm PES membrane, 15 kDA MW cutoff, SciPro
9
Biochemical Journal Immediate Publication. Published on 15 Feb 2007 as manuscript BJ20061898
© 2007 The Authors Journal compilation © 2007 Biochemical Society
10
Inc., Sanborn NY, USA) was inserted and secured to the previously implanted guide
cannula. Probes were perfused overnight with artificial cerebrospinal fluid (aCSF; 145
mM NaCl, 2.8 mM KCl, 1.2 mM MgCl2, 1.2 mM CaCl2, 5.4 mM D-glucose, 0.25 mM
ascorbic acid, pH 7.2-7.4) at a rate of 0.2 l/min. The following morning, the
perfusate was switched to an aCSF containing 30% (w/v) hydroxypropyl- -
cyclodextrin (HB- CD) and the flowrate was increased to 0.6 µl/min. Inclusion of
HB- CD in the perfusate provides a substantial increase in the dialysis recovery of
eCBs (similar to the findings by Walker and colleagues [38]). Following a 90 minute
equilibration period dialysate samples were collected at 10-minute intervals during a
40 minute baseline period, for 30 minutes following vehicle injection
(ethanol:emulphor:saline, 1:1:18; 1ml/kg) and finally for 120 minutes after ethanol
administration (0.75 or 2 g/kg, i.p.; delivered as 20% (w/v)). Dialysate samples were
frozen immediately following collection and stored at -80°C until analysis for eCB
content using liquid chromatography coupled with mass spectrometry (LC-MS) as
described below.
A second group of male Wistar rats (n = 5) were surgically implanted with
microdialysis guide cannulae aimed that the NAC for the analysis of ethanol-induced
alterations in interstitial glutamate (GLU) levels. The same protocol as described
above was followed with the exception that the dialysis perfusate did not contain HB-
CD (this additive is not necessary for the recovery of monoamines and amino acids)
and a faster perfusate flowrate was employed (1 µl/min) to allow sampling splitting for
the monoamine and amino acid analyses (see below).
10
Biochemical Journal Immediate Publication. Published on 15 Feb 2007 as manuscript BJ20061898
© 2007 The Authors Journal compilation © 2007 Biochemical Society
11
LC-MS Analysis of dialysate endocannabinoid content
Dialysate levels of AEA were determined using liquid chromatography coupled with
ESI mass spectrometry (LC-MS). 5 µl microdialysate aliquots were spiked with 5 µl
of 100 nM of (S)-(+)-arachidonyl-2’-hydroxy-1’-propylamide (S-2 methanandamide)
and loaded onto a pre-column (0.5 x 2.5 mm, Haisil HL C18 5µm; Higgins Analytical
Inc., Mountain View, CA) using a 30% MeOH (v/v) mobile phase delivered at 70
µl/min. Following a 2 min wash period, mobile phase flow through the precolumn
was reversed via a switching valve and the eCBs were delivered to a 0.3 x 50 mm
microbore analytical column (Haisil HL C18 3µm; Higgins Analytical Inc., Mountain
View, CA) using an isocratic mobile phase consisting of 70% MeOH (v/v) delivered at
5 µl/min. The analytical column eluent was delivered via a nanoelectrospray interface
into the mass spectrometer (Agilent 1100MSD) that was run in positive Selected Ion
Monitoring mode to maximize sensitivity. Similar to findings by others [30] we find
that sodium adducts of these molecules provide greater sensitivity than do their
protonated forms. The following mass/charge (m/z) ratios were used: AEA, 370.3
(M+1Na); S-2 methanandamide, 384.3 (M+1Na). External calibration curves were
constructed from a minimum of three standard concentrations (each run in duplicate)
and were generated daily. Under these conditions the limits of quantitation were
approximately 0.1 nM.
Analysis of dialysate glutamate
Microdialysis samples were split into two 5 µl aliquots for quantification of glutamate
content by capillary electrophoresis coupled with laser-induced fluorescence detection
(CE-LIF). Specific details on these analyses have been previously published [39].
11
Biochemical Journal Immediate Publication. Published on 15 Feb 2007 as manuscript BJ20061898
© 2007 The Authors Journal compilation © 2007 Biochemical Society
12
Statistics
Statistical significance was assessed by one-way ANOVA. Following a significant F
value, post hoc analysis (Student-Newman-Keuls) was performed. Calculations were
made using the BMDP statistical package.
RESULTS
Acute injection of saline does not affect brain anandamide levels
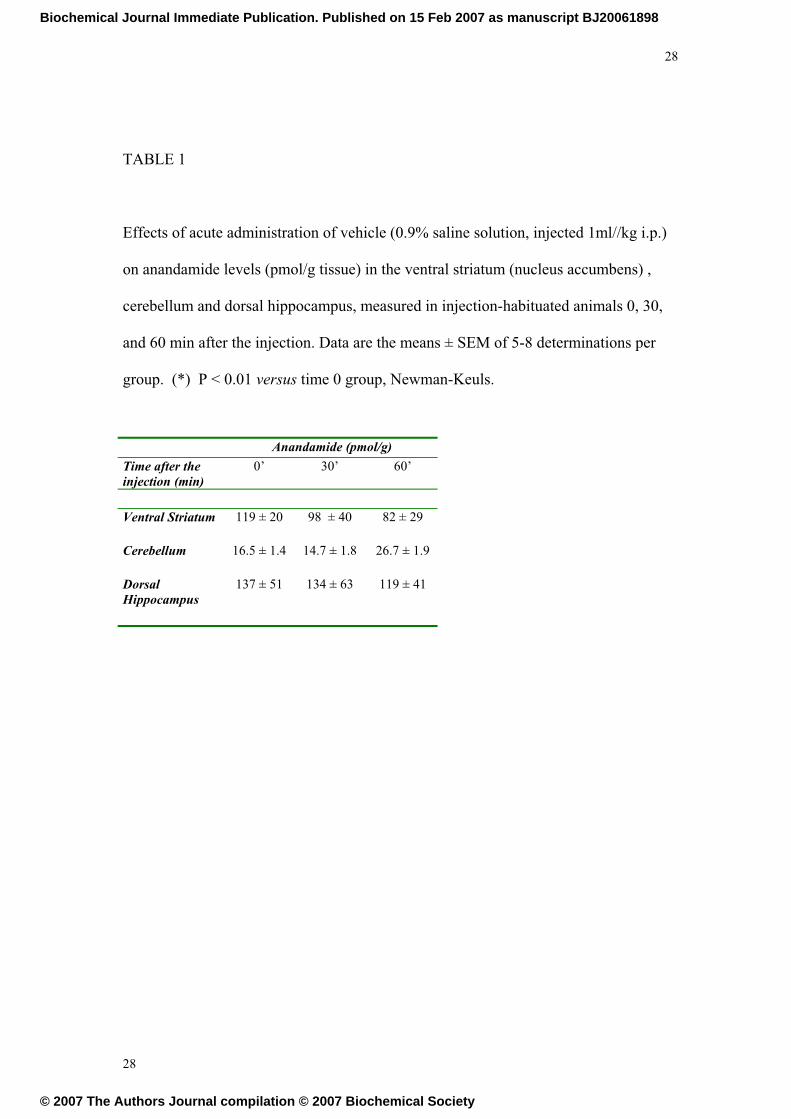
The acute injection of saline did not affect brain anandamide levels in the ventral
striatum, cerebellum or dorsal hippocampus, (See Table 1). Since saline injection in
habituated animals is a mild stressor, the lack of effects of this procedure on brain
endocannabinoid content is in agreement with previous reports [32] which described a
decrease in anandamide only after severe stress induced by restraint, and only in the
amygdala (and not in the cerebellum or the forebrain, including the nucleus
accumbens).
Acute ethanol decreases plasma anandamide levels
The acute i.p. administration of 4 gr/kg of ethanol led to a rapid rise in plasma ethanol
levels, which then remained stable for 4 hr after the administration (Fig 1A).
Clearance of plasma ethanol was evident 8 hr after the injection and was complete
within the first 24 hr. Plasma AEA levels were affected after acute ethanol exposure
(Fig 1B): AEA was not detectable in plasma 45 min after acute ethanol exposure,
returned to normal levels within the following 45 min, peaked at 4 hr and returned to
control levels at 8 hr (1.3 ± 0.6 pmol/ml, n = 8) and 24 hr (0.7 ± 0.5 pmol/ml, n = 8).
12
Biochemical Journal Immediate Publication. Published on 15 Feb 2007 as manuscript BJ20061898
© 2007 The Authors Journal compilation © 2007 Biochemical Society
13
In peripheral tissues, ethanol decreased AEA levels in perirenal fat, but resulted in a
marked increase in the small intestine and liver 90 min after the injection (Table 2).
Based on both the presence of stable ethanol levels and on the changes in plasma
AEA, we selected the time points of 0, 45, 90 and 240 min for the biochemical
analysis of both AEA and PEA and the enzymatic activities of FAAH and NAT in the
brain.
Acute ethanol decreases anandamide and palmithylethanolamide in the ventral
striatum, cerebellum and hippocampus
Acute injection of ethanol decreased AEA levels in the ventral striatum (Fig 2A),
cerebellum (Fig 2B) and hippocampus (Fig 2C). This effect was observed in all brain
areas 90 min after ethanol administration. In the hippocampus, the reduction of AEA
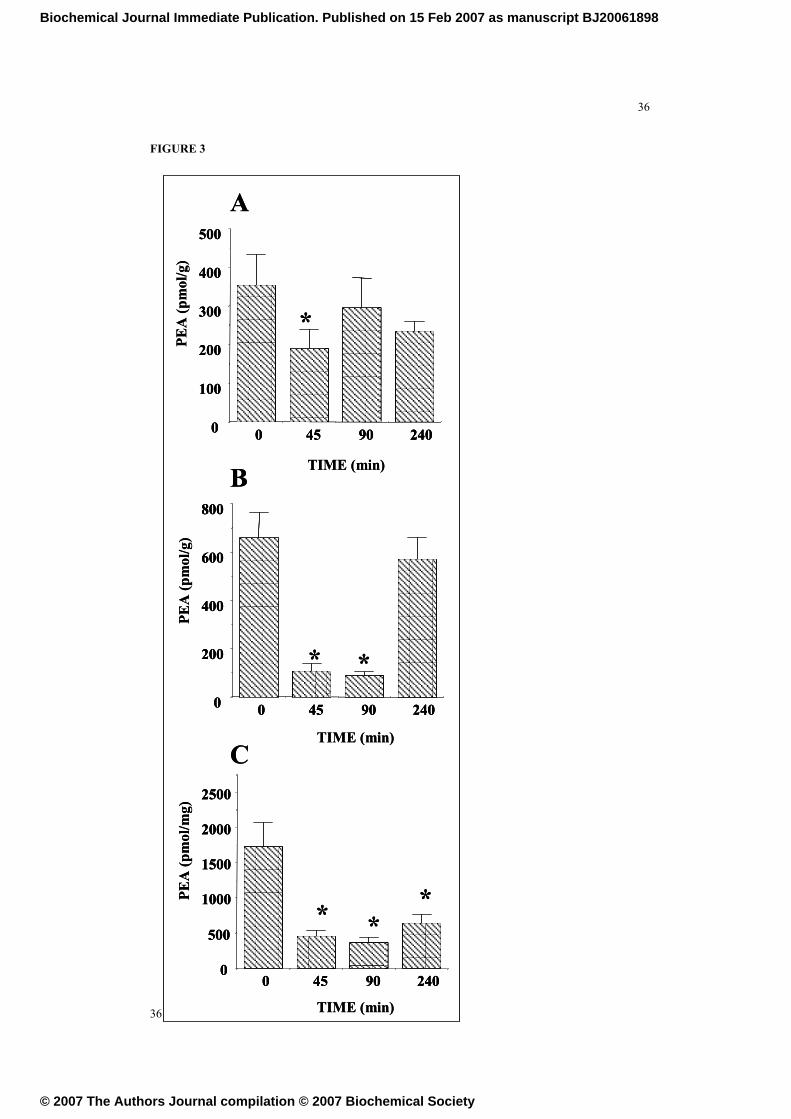
levels was observed at all time points. Similarly, ethanol decreased PEA in the ventral
striatum (Fig 3A) 45 min after its injection, the cerebellum at 45 and 90 min (Fig 3B)
and the hippocampus in all time points studied (Fig 3C).
Acute ethanol does not increase FAAH activity
In order to investigate whether the decrease on the levels of AEA and PEA observed
after acute ethanol might be derived of changes in the activity of the enzyme involved
in the degradation of these acylethanolamides - FAAH - , we tested its activity in
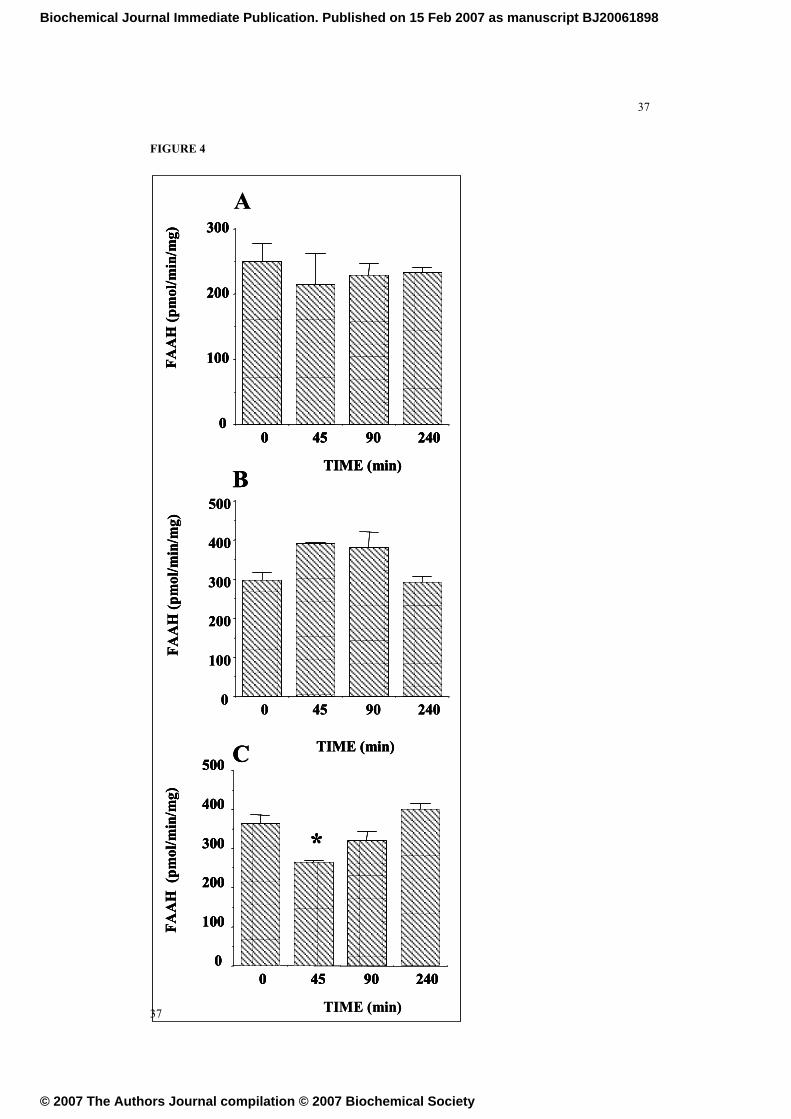
membrane fractions obtained from animals acutely exposed to ethanol. FAAH activity
was not affected by ethanol neither in membranes from ventral-striatum nor from
cerebellum (Figure 4A and 4B). However, FAAH activity was decreased 45 min after
alcohol administration in the hippocampus, normalizing thereafter. Additional studies
performed in vitro studies using cerebellar membranes indicated that FAAH activity
13
Biochemical Journal Immediate Publication. Published on 15 Feb 2007 as manuscript BJ20061898
© 2007 The Authors Journal compilation © 2007 Biochemical Society
14
was not affected by the presence of ethanol in the buffer at concentrations in the range
of those found in plasma after the acute administration of ethanol (10-9
to 10-2
M, data
not shown).
Acute ethanol does not afect the expression of CB,1 FAAH and NAPE-PLD mRNA in
the hippocampus and the cerebellum
Since we observed that ethanol decreased FAAH activity in the hippocampus, we
monitored the expression of FAAH mRNA as well as that of the n-acylphosphatidyl-
ethanolamide-specific phospholipase D, the recently cloned enzyme that cleaves
anandamide from its membrane precursor (Fig 5A to 5D). Any of the
endocannabinoid-related genes were affected by acute ethanol administrtion either at 2
or 12 hr after the injection. However, GADPH expression was clearly increased after
acute alcohol exposure. This pattern was observed also both in the hippocampus and in
the cerebellum. These results point against an activation of degradation as the main
origin of the ethanol-induced decrease of anandamide in the brain.
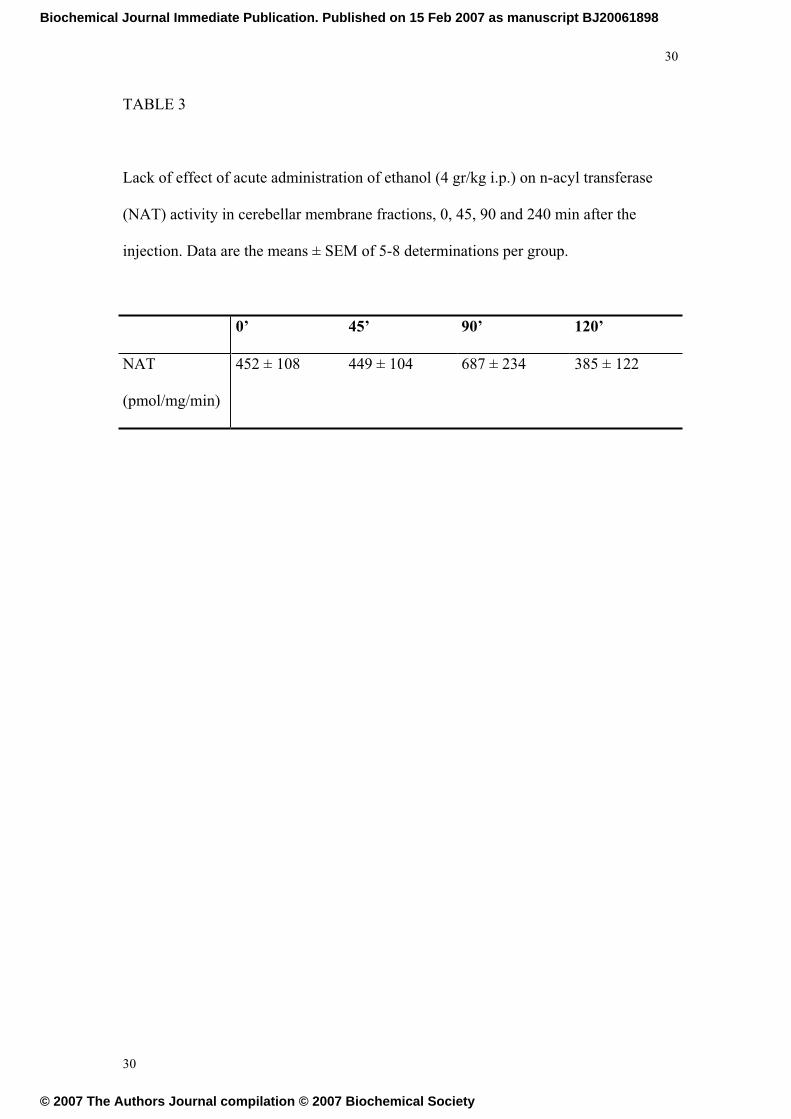
Acute ethanol does not affect NAT activity
The activity of the enzyme involved in the synthesis of the AEA precursor N-
arachydonoyl phosphatidyl ethanolamine - NAT - was not affected in cerebellar
membranes after acute i.p. administration of ethanol (Table 3). We could not measure
NAT activity on individual hippocampus because the technique may require pooling
of various samples in order to reach sufficient amount of protein.
14
Biochemical Journal Immediate Publication. Published on 15 Feb 2007 as manuscript BJ20061898
© 2007 The Authors Journal compilation © 2007 Biochemical Society
15
Acute ethanol decreases anandamide in the ventral striatum
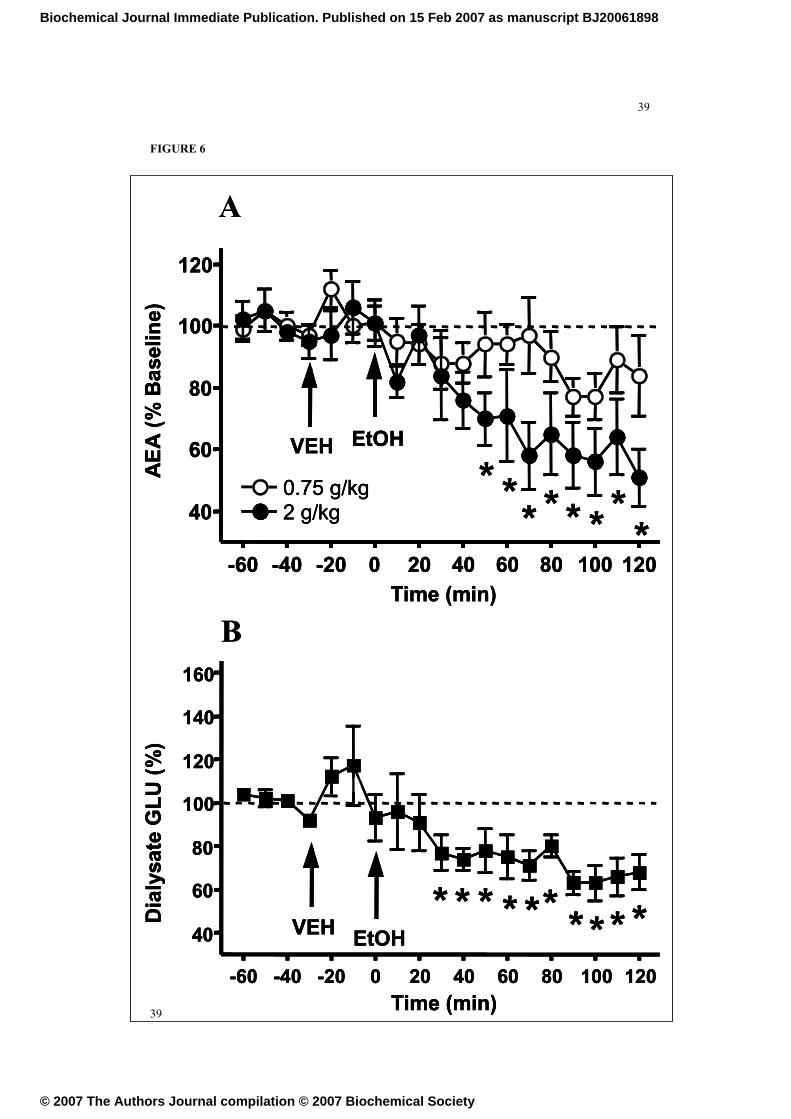
Baseline dialysate AEA concentrations were 2.03 ± 0.5 and 2.12 ± 1.1 nM for the 0.75
g/kg (n = 6) and 2.0 g/kg (n = 5) ethanol groups, respectively. Although vehicle
injection produced no significant alteration in dialysate AEA levels, intraperitoneal
ethanol administration led to a significant and dose-dependent decrease in dialysate
AEA concentrations (F(1,141) = 25.094, p < 0.001; see Figure 6A). Administration
of 0.75 g/kg ethanol produced a subtle and non-significant decrease in dialysate AEA
levels. However, injection of 2 g/kg ethanol produced a significant reduction in
dialysate AEA (F12, 52 = 2.621; p<0.001) which was evident within 40 minutes after
administration and persisted at approximately 60% of pre-ethanol baseline levels for
the remainder of the 120 minute post-ethanol sample collection period.
Acute ethanol decreases glutamate in the ventral striatum
Baseline dialysate glutamate levels in the same samples were 602 ± 21 nM.
Glutamate levels in the dialysate samples were significantly reduced following 2 g/kg
ethanol (F12,82 = 4.679; p<0.0001) which was evident within 30 minutes after
administration and persisted at approximately 70% of pre-ethanol baseline levels for
the remainder of the 120 minute post-ethanol sample collection period (Figure 6B).
15
Biochemical Journal Immediate Publication. Published on 15 Feb 2007 as manuscript BJ20061898
© 2007 The Authors Journal compilation © 2007 Biochemical Society
16
DISCUSSION
These results suggest, first, that acute exposure to ethanol affects AEA formation in
the brain and peripheral tissues and, second, that this effect is not dependent on
ethanol-induced activation of AEA degradation by FAAH. The effects on AEA were
replicated for a second acylethanolamide, PEA, that shares with AEA biochemical
pathways for synthesis or degradation, suggesting a common mechanism for the
decrease of both acylethanolamides. In vivo microdialysis experiments suggest that
the effect on AEA release might be dependent on the inhibitory actions of ethanol on
glutamate release, one of the main triggers for AEA formation
Ethanol induced a marked decrease in the formation of AEA in the brain, plasma and
adipose tissue, which was time-limited to the first 90 min of study (Fig 1 and 2).
Opposite effects were observed in the liver and, especially, in the small intestine,
where a marked increase in AEA release was also observed 90 min after ethanol
administration. These effects suggest the existence of tissue-selective endogenous
cannabinoid targets for ethanol. Increases in AEA levels in tissues may be dependent
either on changes in the synthesis of AEA precursor n-arachydonylphosphatidyl-
ethanolamide (NAPE), or on the cleavage of NAPEs species by receptor-activated
phospholipase D (PLD), or by blockade of FAAH-dependent enzymatic degradation
of AEA [28, 15, 27]. As there was no activation of FAAH by in vivo or in vitro
ethanol, and since initial observations indicate no changes in NAT activity (Table 2),
we propose that the decrease in AEA and PEA release observed may be dependent on
reduced receptor-activated NAPE-PLD activity, a major source for the release of
acylethanolamides [37, 39, 40]. Acute ethanol might operate then through the
16
Biochemical Journal Immediate Publication. Published on 15 Feb 2007 as manuscript BJ20061898
© 2007 The Authors Journal compilation © 2007 Biochemical Society
17
modulation of neurotransmitters capable of activate specific receptors coupled to
NAPE-PLD. This mechanism may not request a substantial modification of NAPE-
PLD production because the inhibition of the release of neurotransmitters will solely
result in reduced endocannabinoid production. Following this rationale, we observed
that the expression of this synthetic enzyme is not affected 2 hr after the administration
of ethanol, although further research is needed to clarify whether chronic
administration of alcohol might affect its expression and activity, leading to the
increased production of endocannabinoid described in animal models of alcoholism.
Several neurotransmitters may contribute to a decrease in PLD-mediated NAPE
breakdown and the subsequent lowering of AEA and PEA levels. First, acute ethanol
may decrease glutamate and acetylcholine-dependent PLD activation through its well-
described inhibitory effects on presynaptic release of these neurotransmitters [25,26].
In this regard, the microdialysis eperiments confirms this hypothesis, since we found
parallel decreases in extracellular levels of both, AEA and glutamate, in the ventral
striatum (Figure 6) after acute ethanol exposure. Chronic ethanol exposure will result
in the development of tolerance and ultimately to increased release of both transmitters
[41, 42], which will contribute to the enhanced AEA formation associated with
chronic ethanol exposure [2]. Second, ethanol may directly inhibit glutamate NMDA
and metabotropic receptors involved in PLD-dependent AEA release, leading to a
decrease in NAPE breakdown [19, 25, 39]. Although there is direct evidence that
ethanol might disrupt PLD dependent signaling, acting as a metabolic substrate that
shifts PLD activity to the production of the phospholipid phosphatidylethanol [43],
this hypothesis can not be used to explain the effects observed in the present study
since recent reports indicate that NAPE-PLD does not use ethanol as a substrate [29].
17
Biochemical Journal Immediate Publication. Published on 15 Feb 2007 as manuscript BJ20061898
© 2007 The Authors Journal compilation © 2007 Biochemical Society
18
An additional factor contributing to a decrease in anandamide formation might be the
stress response activated by acute ethanol exposure [44]. Since ethanol can markedly
increase the activity of the hypothalamus-pituitary-adrenal axis, the rise in
corticosterone might affect endocannabinoid production. However, and based on the
the fact that restraint , a severe form of experimental stress in rats, only reduced
anandamide formation in the amygdala, but not in other areas such as the nucleus
accumbens and cerebellum, the potential contribution of ethanol-induced stress to the
inhibition of acylethanolamides release may be of less importance than that originated
by ethanol-induced inhibition of both glutamate and acetylcholine release. Indeed, this
experimental hypothesis needs to be confirmed.
Finally, the effects observed were tissue-selective, indicating the existence of a
complex network of signals regulating endocannabinoid production. The fact that the
dorsal hippocampal area is more sensitive to the inhibitory effects of ethanol on AEA
and PEA formation may be dependent on the coexistence of a very important
glutamatergic and cholinergic innervation, two neurotransmitters that cooperatively
stimulate AEA release [40]. Indeed, all these mechanisms may interact together in a
tissue-selective fashion, in agreement with the proposed role for acylethanolamides as
local mediators. The local specificity of mechanisms regulating AEA formation is
supported by the activator role of ethanol in the small intestine. We have recently
reported that the small intestine produces large amounts of AEA in starved animals
[45]. The effects of acute ethanol on AEA production resemble those found after 18 h
of food deprivation, probably because ethanol may act as a functional hypoglycemiant
drug through its interference with glucose metabolism [46].
18
Biochemical Journal Immediate Publication. Published on 15 Feb 2007 as manuscript BJ20061898
© 2007 The Authors Journal compilation © 2007 Biochemical Society
19
All the effects on AEA and PEA formation in the brain described in the present study
were observed while substantial amounts of ethanol remained unmetabolized, as
reflected in its plasma levels (Fig 1A). Its rapid disappearance suggests a tight
regulation of acylethanolamide production, again in agreement with its role as a local
mediator of intercellular signaling. Inhibition of anandamide formation is regulated by
rapid homeostatic counterregulatory responses that, after repeated exposure to ethanol,
lead to an activation of NAT, an enhanced production of NAPEs (AEA and PEA
precursors) and an increased tissular release of AEA [8, 9, 2].
In summary, acute exposure to ethanol inhibits acylethanolamide production in the
brain through mechanisms that do not involve fatty acid amidohydrolase activity but
may be linked to neurotransmitter release. The relevance of this finding for the acute
effects of ethanol, and for the neuroadaptions associated with its chronic
administration will be further investigated.
ACKNOWLEDGEMENTS
This work has been supported by Plan Nacional Sobre Drogas (F.R.F.) and National
Institute on Drug Abuse (D.P., L.H.P.) and FIS 02/001, REDES G03/05, CO3/08,
MEC SAF 2004/07762 and and 5th
Framework Programme, grants QLRT-2000-01691
and QLRT-2001-01048 (M.N. and F.R.F.)
19
Biochemical Journal Immediate Publication. Published on 15 Feb 2007 as manuscript BJ20061898
© 2007 The Authors Journal compilation © 2007 Biochemical Society
20
REFERENCES
1. Hungund BL and Basavarajappa BS (2000) Are anandamide and cannabinoid
receptors involved in ethanol tolerance? A review of the evidence. Alcohol Alcohol.
35, 126-33.
2. Hungund BL, Basavarajappa BS, Vadasz C, Kunos G, Rodriguez de Fonseca F,
Colombo G, Serra S, Parsons L and Koob GF (2002) Ethanol, endocannabinoids, and
the cannabinoidergic signaling system. Alcohol Clin Exp Res. 26, 565-74.
3. Wang L, Liu J, Harvey-White J, Zimmer A and Kunos G. (2003) Endocannabinoid
signaling via cannabinoid receptor 1 is involved in ethanol preference and its age-
dependent decline in mice. Proc Natl Acad Sci U S A. 100, 1393-1398.
4. Colombo G, Serra S, Brunetti G, Gómez R, Melis S, Vacca G, Carai MM and Gessa
GL (2002) Stimulation of voluntary ethanol intake by cannabinoid receptor agonists in
ethanol-preferring sP rats. Psychopharmacology 159, 181-87.
5. Arnone M, Maruani J, Chaperon F, Thiebot MH, Poncelet M, Soubrie P and Le Fur
G (1997) Selective inhibition of sucrose and ethanol intake by SR 141716, an
antagonist of central cannabinoid (CB1) receptors. Psychopharmacology 13, 104-6.
6. Rodriguez de Fonseca F, Roberts AJ, Bilbao A, Koob GF and Navarro M (1999)
20
Biochemical Journal Immediate Publication. Published on 15 Feb 2007 as manuscript BJ20061898
© 2007 The Authors Journal compilation © 2007 Biochemical Society
21
Cannabinoid receptor antagonist SR141716A decreases operant ethanol self
administration in rats exposed to ethanol-vapor chambers. Zhongguo Yao Li Xue Bao.
120, 1109-14.
7. Cippitelli A, Bilbao A, Hansson AC, del Arco I, Sommer W, Heilig M, Massi M,
Bermudez-Silva FJ, Navarro M, Ciccocioppo R, and Rodriguez de Fonseca F (2005)
The European TARGALC Consortium. Cannabinoid CB1 receptor antagonism
reduces conditioned reinstatement of ethanol-seeking behavior in rats. Eur J Neurosci.
21, 2243-51.
8. Basavarajappa BS and Hungund BL (1999) Chronic ethanol increases the
cannabinoid receptor agonist anandamide and its precursor N-
arachidonoylphosphatidyl-ethanolamine in SK-N-SH cells. J Neurochem. 72, 522-8.
9. Basavarajappa BS, Saito M, Cooper TB and Hungund BL (2000) Stimulation of
cannabinoid receptor agonist 2-arachidonylglycerol by chronic ethanol and its
modulation by specific neuromodulators in cerebellar granule neurons. Biochim
Biophys Acta. 1535, 78-86.
10. Basavarajappa BS, Cooper TB and Hungund BL (1998) Chronic ethanol
administration down-regulates cannabinoid receptors in mouse brain synaptic plasma
membrane. Brain Res. 793, 212-8.
21
Biochemical Journal Immediate Publication. Published on 15 Feb 2007 as manuscript BJ20061898
© 2007 The Authors Journal compilation © 2007 Biochemical Society
22
11. Rimondini R, Arlinde C, Sommer W and Heilig M (2002) Long-lasting increase in
voluntary ethanol consumption and transcriptional regulation in the rat brain after
intermittent exposure to alcohol. FASEB J. 16, 27-35.
12. Comings DE, Muhleman D, Gade R, Johnson P, Verde R, Saucier G and
MacMurray J (1997) Cannabinoid receptor gene (CNR1): association with i.v. drug
use. Mol Psychiatry. 2, 161-8.
13. Schmidt LG, Samochowiec J, Finckh U, Fiszer-Piosik E, Horodnicki J, Wendel B,
Rommelspacher H and Hoehe MR (2002) Association of a CB1 cannabinoid receptor
gene (CNR1) polymorphism with severe alcohol dependence. Drug Alcohol Depend.
65, 221-4.
14. Sipe JC, Chiang K, Gerber AL, Beutler E and Cravatt BF.(2002) A missense
mutation in human fatty acid amide hydrolase associated with problem drug use. Proc
Natl Acad Sci U S 2002 99, 8394-9.
15. Cravatt BF, Giang DK, Mayfield SP, Boger DL, Lerner RA and Gilula NB. (1996)
Molecular characterization of an enzyme that degrades neuromodulatory fatty-acid
amides. Nature. 384, 83-7.
16. Criado JR, Lee RS, Berg GI and Henriksen SJ (1995) Sensitivity of nucleus
accumbens neurons in vivo to intoxicating doses of ethanol. Alcohol Clin Exp Res 19,
164-9.
22
Biochemical Journal Immediate Publication. Published on 15 Feb 2007 as manuscript BJ20061898
© 2007 The Authors Journal compilation © 2007 Biochemical Society

23
17. Yan Q, Reith MEA, Yan SG and Jobe PC (1998) Effects of systemic ethanol on
basal and stimulated glutamate releases in the nucleus accumbens of freely moving
sprague-dawley rats: a microsialysis study. Neurosci Lett. 258, 29-32.
18. Henn C, Loffelholz and Klein J (1998) Stimulatory and inhibitory effects of
ethanol on hippocampal acetylcholine release. Naunyn Schmiedebergs Arch
Pharmacol 357, 640-647.
19. Lovinger DM, White G and Weight FF (1989) Ethanol inhibits NMDA-activated
ion current in hippocampal neurons. Science 243, 1721-1724.
20. Martin D and Swartzwelder HS (1992) Ethanol inhibits release of excitatory
aminoacids from slices of hippocampal area CA1. Eur J Pharmacol 219, 469-472.
21. Moghadam B and Bolinao ML (1994) Biphasic effect of ethanol on extracellular
accumulation of glutamate in the hippocampus and the nucleus accumbens. Neurosci
Lett 178, 99-102.
22. Franklin CL and Gruol DL (1987) Acute ethanol alters the firing pattern and
glutamate response of cerebellar Purkinje neurons in culture. Brain Res 416, 205-18.
23. Herkenham M, Lynn AB, Johnson MR, Melvin LS, de Costa BR and Rice KC
(1991) Characterization and localization of cannabinoid receptors in rat brain: a
quantitative in vitro autoradiographic study. J Neurosci. 11, 563-83.
23
Biochemical Journal Immediate Publication. Published on 15 Feb 2007 as manuscript BJ20061898
© 2007 The Authors Journal compilation © 2007 Biochemical Society
24
24. Kreitzer AC, Carter AG and Regehr WG (2002) Inhibition of interneuron firing
extends the spread of endocannabinoid signaling in the cerebellum. Neuron. 34, 787-
96.
25. Maejima T, Hashimoto K, Yoshida T, Aiba A and Kano M (2001) Presynaptic
inhibition caused by retrograde signal from metabotropic glutamate to cannabinoid
receptors.Neuron 31, 463-75.
26. Wilson RI and Nicoll RA (2001) Endogenous cannabinoids mediate retrograde
signalling at hippocampal synapses. Nature 410, 588-92.
27. Di Marzo V, Fontana A, Cadas H, Schinelli S, Cimino G, Schwartz JC and
Piomelli D (1994) Formation and inactivation of endogenous cannabinoid anandamide
in central neurons. Nature. 372, 686-91.
28. Cadas H, Gaillet S, Beltramo M, Venance L and Piomelli D (1996) Biosynthesis of
an endogenous cannabinoid precursor in neurons and its control by calcium and
cAMP. J Neurosci 16, 3934-42.
29. Okamoto Y, Morishita J, Tsuboi K, Tonai T, and Ueda N (2004) Molecular
characterization of a phospholipase D generating anandamide and its congeners. J Biol
Chem 279, 5298-5305.
24
Biochemical Journal Immediate Publication. Published on 15 Feb 2007 as manuscript BJ20061898
© 2007 The Authors Journal compilation © 2007 Biochemical Society

25
30. Giuffrida A, Rodríguez de Fonseca F and Piomelli D (2000) Quantification of
bioactive acylethanolamides in rat plasma by electrospray mass spectrometry. Anal
Biochem 280, 87-93.
31. Valenti M, Vigano D, Casico MG, Rubino T, Steardo L, Parolaro D and Di Marzo
V. (2004) Differential diurnal variations of anandamide and 2-arachidonoyl-glycerol
levels in rat brain. Cell Mol Life Sci. 61, 945-950.
32. Patel S, Roelke CT, Rademacher DJ and Hillard CJ. (2005) Inhibition of restraint
stress-induced neural and behavioural activation by endogenous cannabinoid
signalling. Eur J Neurosci 21, 1057-1069.
33. Paxinos G and Watson C (1997) The rat brain in stereotaxic coordinates. Compact
Third Edition. San Diego, Academic Press.
34. Rodríguez de Fonseca F, Navarro M, Gómez R, Escuredo L, Nava F, Fu J,
Murillo-Rodríguez E, Giuffrida A, LoVerme J, Gaetani S, Kathuria S, Gall C and
Piomelli D (2001) An anorexic lipid mediator regulated by feeding. Nature 414, 209-
12.
35. Hansson AC, Bermudez-Silva FJ, Malinen H, Hyytia P, Sanchez-Vera I,
Rimondini R, Rodriguez de Fonseca F, Kunos G, Sommer WH, Heilig M. (2007)
Genetic impairment of frontocortical endocannabinoid degradation and high
alcohol preference.Neuropsychopharmacology. 32, 117-26.
25
Biochemical Journal Immediate Publication. Published on 15 Feb 2007 as manuscript BJ20061898
© 2007 The Authors Journal compilation © 2007 Biochemical Society

26
36. Cadas H, di Tomaso E and Piomelli D (1997) Occurrence and biosynthesis of
endogenous cannabinoid precursor, N-arachidonoyl phosphatidylethanolamine, in rat
brain. J Neurosci 17, 1226-42.
37. Giuffrida A, Parsons LH, Kerr TM, Rodriguez de Fonseca F, Navarro M and
Piomelli D (1999) Dopamine activation of endogenous cannabinoid signaling in dorsal
striatum. Nat Neurosci. 2, 358-63.
38. Walker JM, Huang SM, Strangman NM, Tsou K, Sanudo-Pena MC. (1999) Pain
modulation by release of the endogenous cannabinoid anandamide. Proc Natl Acad Sci
U S A. 96, 12198-203.
39. Hansen HS, Lauritzen L, Strand AM, Vinggaard AM, Frandsen A and Schousboe
A (1997) Characterization of glutamate-induced formation of N-acylphosphatidyl-
ethanolamine and N-acylethanolamine in cultured neocortical neurons. J Neurochem.
69, 753-761.
40. Stella N and Piomelli (2001) Receptor-dependent formation of endogenous
cannabinoids in cortical neurons. Eur J Pharmacol 425, 189-196.
41. Dahchour A and de Witte P (2000) Taurine blocks the glutamate increase in the
nucleus accumbens microdialysate of ethanol-dependent rats. Pharmacol Biochem
Behav 65, 345-350.
26
Biochemical Journal Immediate Publication. Published on 15 Feb 2007 as manuscript BJ20061898
© 2007 The Authors Journal compilation © 2007 Biochemical Society
27
42. Imperato A, Dazzi L, Carta G, Colombo G and Biggio G (1998) Rapid increase in
basal acetylcholine release in the hippocampus of freely moving rats induce by
withdrawal from long-term ethanol intoxication. Brain Res 784, 347-350.
43. Kötter K and Klein J (1999) Ethanol inhibits astroglial cell proliferation by
disruption of phospholipase D-mediated signaling. J Neurochem 73, 2517-2523.
44. Rivier C. (1993) Acute interactions between cytokines and alcohol on ACTH and
corticosterone secretion in the rat. Alcohol Clin Exp Res. 17, 946-950.
45. Gómez R, Navarro M, Ferrer B, Trigo JM, Bilbao A, del Arco I, Cippitelli A,
Nava F, Piomelli Dand Rodríguez de Fonseca F. (2002) A peripheral mechanism for
CB1 cannabinoid receptor-dependent modulation of feeding. J Neurosci 22, 9612-
9617.
46. Williams HE (1984) Alcoholic hypoglycemia and ketoacidosis. Med Clin North
Am 68, 33-8.
27
Biochemical Journal Immediate Publication. Published on 15 Feb 2007 as manuscript BJ20061898
© 2007 The Authors Journal compilation © 2007 Biochemical Society
28
TABLE 1
Effects of acute administration of vehicle (0.9% saline solution, injected 1ml//kg i.p.)
on anandamide levels (pmol/g tissue) in the ventral striatum (nucleus accumbens) ,
cerebellum and dorsal hippocampus, measured in injection-habituated animals 0, 30,
and 60 min after the injection. Data are the means ± SEM of 5-8 determinations per
group. (*) P < 0.01 versus time 0 group, Newman-Keuls.
Anandamide (pmol/g)
Time after the injection (min)
0’ 30’ 60’
Ventral Striatum 119 ± 20 98 ± 40 82 ± 29
Cerebellum 16.5 ± 1.4 14.7 ± 1.8 26.7 ± 1.9
Dorsal Hippocampus
137 ± 51 134 ± 63 119 ± 41
28
Biochemical Journal Immediate Publication. Published on 15 Feb 2007 as manuscript BJ20061898
© 2007 The Authors Journal compilation © 2007 Biochemical Society

29
TABLE 2
Effects of acute administration of ethanol (4 gr/kg i.p.) on anandamide (AEA) levels
(pmol/g tissue) in the perirenal fat, liver and small intestine, 0, 45, 90 and 240 min
after the injection. Data are the means ± SEM of 5-8 determinations per group. (*) P
< 0.01 versus time 0 group, Newman-Keuls.
0’ 45’ 90’ 240’
Fat 16.2 ± 1.7 11.9 ± 0.9 19.1 ± 1.2 6.4 ± 0.6 *
Liver 3.7 ± 1.8 3.7 ± 1.8 21.9 ± 3.7 * 4.8 ± 2.9
Small
intestine
33.9 ± 13.2 63.4 ± 23.5 285.1 ± 13.2 * 62.8 ± 12.8
29
Biochemical Journal Immediate Publication. Published on 15 Feb 2007 as manuscript BJ20061898
© 2007 The Authors Journal compilation © 2007 Biochemical Society
30
TABLE 3
Lack of effect of acute administration of ethanol (4 gr/kg i.p.) on n-acyl transferase
(NAT) activity in cerebellar membrane fractions, 0, 45, 90 and 240 min after the
injection. Data are the means ± SEM of 5-8 determinations per group.
0’ 45’ 90’ 120’
NAT
(pmol/mg/min)
452 ± 108 449 ± 104 687 ± 234 385 ± 122
30
Biochemical Journal Immediate Publication. Published on 15 Feb 2007 as manuscript BJ20061898
© 2007 The Authors Journal compilation © 2007 Biochemical Society

31
FIGURE LEGENDS
FIGURE 1
Time-course of the effects of the acute i.p. administration of ethanol (4 gr/kg) on A.
plasma levels of ethanol, B. plasma levels of anandamide. Data are the means ± SEM
of at least 5 determinations per group. (*) P < 0.01, versus time 0 group, Newman-
Keuls.
FIGURE 2
Time-course of the effects of the acute i.p. administration of ethanol (4 gr/kg) on
tissular levels of anandamide (AEA) in A. the ventral striatum-nucleus accumbens, B.
the cerebellum and C. the dorsal hippocampus. Data are the means ± SEM of at least 5
determinations per group. (*) P < 0.01, versus time 0 group, Newman-Keuls.
FIGURE 3
Time-course of the effects of the acute i.p. administration of ethanol (4 gr/kg) on
tissular levels of palmithylethanolamide (PEA) in A. the ventral striatum-nucleus
accumbens, B. the cerebellum and C. the dorsal hippocampus. Data are the means ±
SEM of at least 5 determinations per group. (*) P < 0.01, versus time 0 group,
Newman-Keuls.
FIGURE 4
Time-course of the effects of the acute i.p. administration of ethanol (4 gr/kg) on the
activity of fatty acid amidohydrolase in membranes from A. the ventral striatum-
nucleus accumbens, B. the cerebellum and C. the dorsal hippocampus. Data are the
31
Biochemical Journal Immediate Publication. Published on 15 Feb 2007 as manuscript BJ20061898
© 2007 The Authors Journal compilation © 2007 Biochemical Society
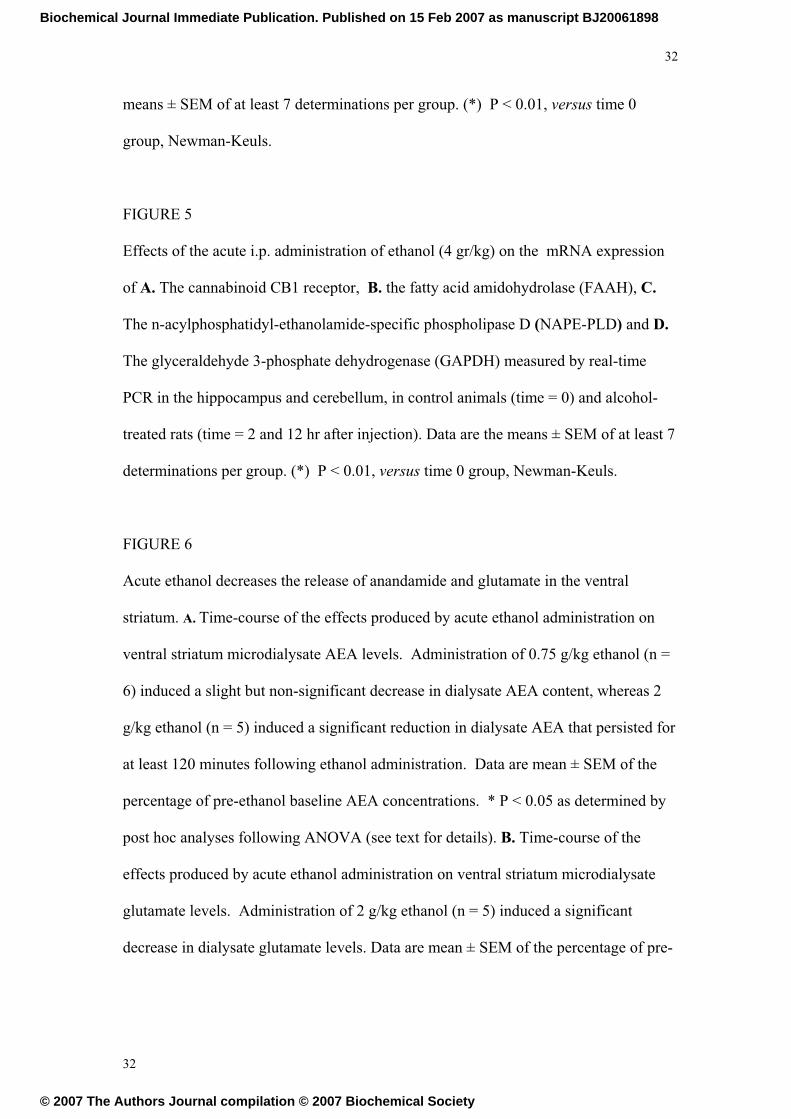
32
means ± SEM of at least 7 determinations per group. (*) P < 0.01, versus time 0
group, Newman-Keuls.
FIGURE 5
Effects of the acute i.p. administration of ethanol (4 gr/kg) on the mRNA expression
of A. The cannabinoid CB1 receptor, B. the fatty acid amidohydrolase (FAAH), C.
The n-acylphosphatidyl-ethanolamide-specific phospholipase D (NAPE-PLD) and D.
The glyceraldehyde 3-phosphate dehydrogenase (GAPDH) measured by real-time
PCR in the hippocampus and cerebellum, in control animals (time = 0) and alcohol-
treated rats (time = 2 and 12 hr after injection). Data are the means ± SEM of at least 7
determinations per group. (*) P < 0.01, versus time 0 group, Newman-Keuls.
FIGURE 6
Acute ethanol decreases the release of anandamide and glutamate in the ventral
striatum. A. Time-course of the effects produced by acute ethanol administration on
ventral striatum microdialysate AEA levels. Administration of 0.75 g/kg ethanol (n =
6) induced a slight but non-significant decrease in dialysate AEA content, whereas 2
g/kg ethanol (n = 5) induced a significant reduction in dialysate AEA that persisted for
at least 120 minutes following ethanol administration. Data are mean ± SEM of the
percentage of pre-ethanol baseline AEA concentrations. * P < 0.05 as determined by
post hoc analyses following ANOVA (see text for details). B. Time-course of the
effects produced by acute ethanol administration on ventral striatum microdialysate
glutamate levels. Administration of 2 g/kg ethanol (n = 5) induced a significant
decrease in dialysate glutamate levels. Data are mean ± SEM of the percentage of pre-
32
Biochemical Journal Immediate Publication. Published on 15 Feb 2007 as manuscript BJ20061898
© 2007 The Authors Journal compilation © 2007 Biochemical Society

33
ethanol baseline glutamate concentrations, respectively. * P < 0.05 as determined by
post hoc analyses following ANOVA (see text for details).
33
Biochemical Journal Immediate Publication. Published on 15 Feb 2007 as manuscript BJ20061898
© 2007 The Authors Journal compilation © 2007 Biochemical Society

34
FIGURE 1
0 45 90 240 480 14400
10
20
30
40
50
TIME (min)
PL
ASM
A E
TH
AN
OL
(m
M)
N.D. N.D.
0 45 90 2400
2
4
6
8
TIME (min)
PL
ASM
A A
NA
ND
AM
IDE
(pm
ol/m
l)
N.D.
A
B0 45 90 240 480 14400 45 90 240 480 1440
0
10
20
30
40
50
0
10
20
30
40
50
TIME (min)
PL
ASM
A E
TH
AN
OL
(m
M)
N.D. N.D.
0 45 90 240 45 90 24000
2
4
6
8
0
2
4
6
8
TIME (min)
PL
ASM
A A
NA
ND
AM
IDE
(pm
ol/m
l)
N.D.
A
B
34
Biochemical Journal Immediate Publication. Published on 15 Feb 2007 as manuscript BJ20061898
© 2007 The Authors Journal compilation © 2007 Biochemical Society

35
FIGURE 2
0 45 90 2400
5
10
15
20
TIME (min)
AN
AN
DA
MID
E (
pmol
/g)
*
0 45 90 2400
50
100
150
200
TIME (min)
AN
AN
DA
MID
E (
pmol
/g)
* **
C
0 45 90 2400
20
40
60
80
100
120
140
TIME (min)
AN
AN
DA
MID
E (
pmol
/g)
*
A
B
0 45 90 2400 45 90 2400
5
10
15
20
0
5
10
15
20
TIME (min)
AN
AN
DA
MID
E (
pmol
/g)
*
0 45 90 2400 45 90 2400
50
100
150
200
0
50
100
150
200
TIME (min)
AN
AN
DA
MID
E (
pmol
/g)
* **
C
0 45 90 2400 45 90 2400
20
40
60
80
100
120
140
0
20
40
60
80
100
120
140
TIME (min)
AN
AN
DA
MID
E (
pmol
/g)
*
A
B
35
Biochemical Journal Immediate Publication. Published on 15 Feb 2007 as manuscript BJ20061898
© 2007 The Authors Journal compilation © 2007 Biochemical Society
36
FIGURE 3
0 45 90 2400
500
1000
1500
2000
2500
TIME (min)
PE
A (
pmol
/mg)
* **
0 45 90 2400
100
200
300
400
500
TIME (min)
PE
A (
pmol
/g)
*
0 45 90 2400
200
400
600
800
TIME (min)
PE
A (
pmol
/g)
* *
A
B
C
0 45 90 240 45 90 24000
500
1000
1500
2000
2500
0
500
1000
1500
2000
2500
TIME (min)
PE
A (
pmol
/mg)
* **
0 45 90 2400 45 90 2400
100
200
300
400
500
0
100
200
300
400
500
TIME (min)
PE
A (
pmol
/g)
*
0 45 90 2400 45 90 2400
200
400
600
800
0
200
400
600
800
TIME (min)
PE
A (
pmol
/g)
* *
A
B
C
36
Biochemical Journal Immediate Publication. Published on 15 Feb 2007 as manuscript BJ20061898
© 2007 The Authors Journal compilation © 2007 Biochemical Society
37
FIGURE 4
0 45 90 2400
100
200
300
TIME (min)
FA
AH
(pm
ol/m
in/m
g)
0 45 90 2400
100
200
300
400
500
FA
AH
(pm
ol/m
in/m
g)
*
0 45 90 2400
100
200
300
400
500
TIME (min)
FA
AH
(pm
ol/m
in/m
g)
C
B
A
0 45 90 240
TIME (min)37
TIME (min)
0
100
200
300
TIME (min)
FA
AH
(pm
ol/m
in/m
g)
0 45 90 2400
100
200
300
400
500
FA
AH
(pm
ol/m
in/m
g)
*
0 45 90 2400
100
200
300
400
500
TIME (min)
FA
AH
(pm
ol/m
in/m
g)
C
B
0 45 90 2400 45 90 2400
100
200
300
0
100
200
300
TIME (min)
FA
AH
(pm
ol/m
in/m
g)
0 45 90 2400 45 90 2400
100
200
300
400
500
0
100
200
300
400
500
FA
AH
(pm
ol/m
in/m
g)
*
0 45 90 2400
100
200
300
400
500
TIME (min)
FA
AH
(pm
ol/m
in/m
g)
C
B
A
Biochemical Journal Immediate Publication. Published on 15 Feb 2007 as manuscript BJ20061898
© 2007 The Authors Journal compilation © 2007 Biochemical Society

38
FIGURE 5
0 2 12 0 2 120
100
200
TIME AFTER INJECTION (H)
RE
LA
TIV
E C
B1/
GU
S R
AT
IO
HIPPOCAMPUS CEREBELLUM
0 2 12 0 2 120
1000
2000
3000
TIME AFTER INJECTION (H)
RE
LA
TIV
E F
AA
H/G
US
RA
TIO
HIPPOCAMPUS CEREBELLUM
0 2 12 0 2 120
2
4
6
8
TIME AFTER INJECTION (H)
RE
LA
TIV
E N
AP
E-P
LD
/GU
S R
AT
IO
HIPPOCAMPUS CEREBELLUM
0 2 12 0 2 120
500
1000
1500
2000
2500
TIME AFTER INJECTION (H)
RE
LA
TIV
E G
AP
DH
/GU
S R
AT
IO
HIPPOCAMPUS CEREBELLUM
A B
C D
*
*
**
0 2 12 0 2 120
100
200
TIME AFTER INJECTION (H)
RE
LA
TIV
E C
B1/
GU
S R
AT
IO
HIPPOCAMPUS CEREBELLUM
0 2 12 0 2 120
1000
2000
3000
TIME AFTER INJECTION (H)
RE
LA
TIV
E F
AA
H/G
US
RA
TIO
HIPPOCAMPUS CEREBELLUM
0 2 12 0 2 120 2 12 0 2 120
100
200
0
100
200
TIME AFTER INJECTION (H)
RE
LA
TIV
E C
B1/
GU
S R
AT
IO
HIPPOCAMPUS CEREBELLUM
0 2 12 0 2 120 2 12 0 2 120
1000
2000
3000
0
1000
2000
3000
TIME AFTER INJECTION (H)
RE
LA
TIV
E F
AA
H/G
US
RA
TIO
HIPPOCAMPUS CEREBELLUM
0 2 12 0 2 120
2
4
6
8
TIME AFTER INJECTION (H)
RE
LA
TIV
E N
AP
E-P
LD
/GU
S R
AT
IO
HIPPOCAMPUS CEREBELLUM
0 2 12 0 2 120 2 12 0 2 120
2
4
6
8
0
2
4
6
8
TIME AFTER INJECTION (H)
RE
LA
TIV
E N
AP
E-P
LD
/GU
S R
AT
IO
HIPPOCAMPUS CEREBELLUM
0 2 12 0 2 120 2 12 0 2 120
500
1000
1500
2000
2500
0
500
1000
1500
2000
2500
TIME AFTER INJECTION (H)
RE
LA
TIV
E G
AP
DH
/GU
S R
AT
IO
HIPPOCAMPUS CEREBELLUM
A B
C D
*
*
**
38
Biochemical Journal Immediate Publication. Published on 15 Feb 2007 as manuscript BJ20061898
© 2007 The Authors Journal compilation © 2007 Biochemical Society
39
FIGURE 6
-60 -40 -20 0 20 40 60 80 100 120
40
60
80
100
120
140
160
EtOHVEHDia
lysa
teG
LU
(%
)
* * * * ** * * * *
NAC AEA
39Time (min)
-60 -40 -20 0 20 40 60 80 100 120
40
60
80
100
120
0.75 g/kg2 g/kg
EtOH
* ** * * * *
*
VEH
Time (min)
AE
A (
% B
asel
ine)
A
B
-60 -40 -20 0 20 40 60 80 100 120
40
60
80
100
120
140
160
EtOHVEHDia
lysa
teG
LU
(%
)
* * * * ** * * * *
Time (min)-60 -40 -20 0 20 40 60 80 100 120
40
60
80
100
120
140
160
EtOHVEHDia
lysa
teG
LU
(%
)
* * * * ** * * * *
NAC AEA
Time (min)
-60 -40 -20 0 20 40 60 80 100 120
40
60
80
100
120
0.75 g/kg2 g/kg
EtOH
* ** * * * *
*
VEH
Time (min)
AE
A (
% B
asel
ine)
-60 -40 -20 0 20 40 60 80 100 120
40
60
80
100
120
0.75 g/kg2 g/kg
EtOH
* ** * * * *
*
VEH
Time (min)
AE
A (
% B
asel
ine)
A
B
Biochemical Journal Immediate Publication. Published on 15 Feb 2007 as manuscript BJ20061898
© 2007 The Authors Journal compilation © 2007 Biochemical Society