ethanol modulates the neurovascular coupling
TRANSCRIPT

NeuroToxicology 34 (2013) 95–104
Ethanol modulates the neurovascular coupling
Michael Luchtmann a,*, Katja Jachau b,1, Daniela Adolf c,2, Friedrich-Wilhelm Rohl c,2, Sebastian Baecke c,2,Ralf Lutzkendorf c,2, Charles Muller c,2, Johannes Bernarding c,2
a Department of Neurosurgery, Otto-von-Guericke-University Magdeburg, Institute for Biometry and Medical Informatics, Otto-von-Guericke-University Magdeburg, Leipziger Str. 44,
39120 Magdeburg, Germanyb Institute for Forensic Medicine, Otto-von-Guericke-University Magdeburg, Leipziger Str. 44, 39120 Magdeburg, Germanyc Institute for Biometry and Medical Informatics, Otto-von-Guericke-University Magdeburg, Leipziger Str. 44, 39120 Magdeburg, Germany
A R T I C L E I N F O
Article history:
Received 6 September 2012
Accepted 29 October 2012
Available online 14 November 2012
Keywords:
Ethanol
BOLD
Neurovascular coupling
Hemodynamic response
Balloon model
Hemodynamic modeling
A B S T R A C T
Despite some evidence of the underlying molecular mechanisms the neuronal basis of ethanol-induced
effects on the neurovascular coupling that forms the BOLD (blood oxygenation level dependent) signal is
poorly understood. In a recent fMRI (functional magnetic resonance imaging) study monitoring ethanol-
induced changes of the BOLD signal a reduction of the amplitude and a prolongation of the BOLD signal
were observed. However, the BOLD signal is assumed to consist of a complex superposition of different
underlying signals. To gain insight how ethanol influences stimulus efficacy, oxygen extraction, transit
time and vessel-related parameters the fMRI time series from the sensori-motor and the visual cortex
were analyzed using the balloon model. The results show a region-dependent decrease of the stimulus
efficacy to trigger a post-stimulus neurovascular response as well as a prolongation of the transit time
through the venous compartment. Oxygen extraction, feedback mechanisms and other vessel-related
parameters were not affected. The results may be interpreted as follows: the overall mechanisms of the
neurovascular coupling are still acting well at the moderate ethanol level of about 0.8% (in particular the
vessel-related parts), but the potency to evoke a neurovascular response is already compromised most
obviously in the supplementary motor area responsible for complex synchronizing and planning
processes.
� 2012 Elsevier Inc. All rights reserved.
Contents lists available at SciVerse ScienceDirect
NeuroToxicology
1. Introduction
The influence of ethanol on the brain metabolism, particularlyon the neurovascular coupling, is still not fully understood. Avariety of physiological mechanisms are believed to be responsiblefor the manifold physiological effects in the brain. Over the last fewyears pharmacological magnetic resonance imaging (phMRI) hasbeen established as a powerful tool to observe pharmacologicaleffects of drugs on neuronal activity on human as well as onanimals (Honey and Bullmore, 2004; Matthews et al., 2006;Matthews, 2009; Steward et al., 2005). Thus, several groupsinvestigated alcohol-induced effects on the neuronal activity usingBOLD (blood oxygen level dependent) imaging techniques. Yoon et
* Corresponding author. Tel.: +49 391 6715534; fax: +49 391 6715544.
E-mail addresses: [email protected] (M. Luchtmann),
[email protected] (K. Jachau), [email protected] (D. Adolf),
[email protected] (F.-W. Rohl),
[email protected] (S. Baecke), [email protected]
(R. Lutzkendorf), [email protected] (C. Muller),
[email protected] (J. Bernarding).1 Tel.: +49 391 6715843; fax: +49 391 6715810.2 Tel.: +49 391 6713535; fax: +49 391 6713536.
0161-813X/$ – see front matter � 2012 Elsevier Inc. All rights reserved.
http://dx.doi.org/10.1016/j.neuro.2012.10.017
al. (2009) found region-dependent alterations of brain activationusing memory encoding tasks. Seifritz et al. (2000) reported aBOLD signal decrease in the primary auditory cortex between 12%and 27%, depending on the definition of region of interest for signalquantitation. In order to determine the contribution of thevasodilatating effects of ethanol to potential BOLD signal changesa model calculation was performed with the conclusion that BOLDimaging should be feasible if after moderate ethanol intake thecerebral vessels have still the capacity to react appropriately onincreased cerebral activity with a net increase large enough to bedetected by BOLD imaging techniques. Levin et al. (1998) foundthat the BOLD signal amplitude was significantly reduced up to33% in the visual cortex (VC) after ethanol application and photicstimulation. Other studies found more complex pattern of ethanolinduced activation changes, depending on the brain region and thetask (Calhoun et al., 2004a,b). Van Horn et al. (2006) examined theacute effects of alcohol in the context of goal-directed visuomotorperformance. Sripada et al. (2011) observed the impact of ethanolregarding to fear processing. Both groups found region-dependentalterations of neuronal activity.
The underlying functional magnetic resonance imaging (fMRI)technique is based on the well known BOLD effect that provides ahigh temporal and spatial resolution making it ideally suited to

M. Luchtmann et al. / NeuroToxicology 34 (2013) 95–10496
investigate drug-induced effects on brain activity (Tank et al.,1992). BOLD fMRI is based on indirect measures of changes inregional cerebral blood flow (rCBF), regional cerebral blood volume(rCBV) as well as from alterations in the relative amount ofdeoxygenated hemoglobin (Ogawa et al., 1990). While it is clearthat rCBF is tightly coupled to neuronal activation, the underlyingcoupling transduction mechanisms are still debated (Giove et al.,2003; Uludag et al., 2004). The neurogenic hypothesis proposes amechanism consisting of direct innervations of blood vessels byneurons or glial cells (Iadecola, 1998; Kuschinsky and Wahl, 1978).In comparison the metabolic hypothesis assumes that the rCBF ischanged by a release of diffusible coupling factors following theneuronal activation (Mraovitch et al., 1993; Villringer, 1997).Although the underlying physiological mechanisms are notentirely revealed, BOLD signal increases have been hypothesizedto result from increased rCBF, rCBV and changes of localconcentrations of deoxyhemoglobin (cerebral metabolic rate ofoxygen consumption – CMRO2). Furthermore it is well known thatthe increased rCBF following neuronal activity is much larger thanthe activity-induced extraction of oxygen from hemoglobin.Oxyhemoglobin and deoxyhemoglobin differ in the property togenerate an extraneous magnetic field when placed in an externalmagnetic field. The decrease of paramagnetic deoxyhemoglobinresults in greater local field homogeneities and leads to anincreased MRI signal (Buxton et al., 1998). Directly after the onsetof a neuronal activation the consumption of oxygen leads to ahigher concentration of deoxyhemoglobin, which reduces theBOLD signal, resulting in the initial dip. The following increasedrCBF and rCBV caused by neurovascular coupling lead to the above-mentioned decreased concentration of deoxyhemoglobin and thusto the typical positive BOLD response. After about 10 s followingshort stimulus oxygen consumption and rCBF return to their initiallevel. The decline of rCBF is slower. For a certain time the relativeamount of deoxyhemoglobin is increased by a higher bloodvolume, resulting in a BOLD signal undershoot. The shape of theBOLD response following stimulation appears to be similar acrossearly sensory and motor regions (Boynton et al., 1996; Josephs etal., 1997).
Thus, the measured BOLD signal is the sum of several signalsthat unfortunately cancel each other to a large extent. The effecthow the individual time courses of the single componentscontribute to the overall BOLD signal can be seen well bysimulating the curves with the balloon model (Buxton et al.,1998), which was later modified by other authors (Friston et al.,2000; Obata et al., 2004; Stephan et al., 2007; Uludag et al., 2009).Buxton et al. (1998) showed that the balloon model reproduceswell the experimental BOLD data, particularly the initial dip andthe post-stimulus undershoot. Friston et al. (2000) demonstratedthat the balloon model is sufficient in reproducing main non-linearities observed in evoked BOLD responses. Based on theexperimental work of Mandeville et al. (1999) the dynamics of theneurovascular coupling is modeled by a set of coupled non-lineardifferential equations describing the interaction between differentphysiological parameters such as neuronal activation, vesselproperties, rCBF/rCBV as well as the magnetic properties ofoxygenized and de-oxygenized hemoglobin that finally lead to theobservable fMRI signal. The balloon model is based on two mainphysiological assumptions: first, the post-capillary venous com-partment reacts to an increase of rCBF and rCBV like an inflatingballoon. Second, the oxygen extraction is tightly coupled with theregional cerebral blood flow (Stephan et al., 2007). Although theballoon model may be over-simplistic it nevertheless may serve asa guide to analyze potential underlying processes that coupleneuronal activity with vascular responses (Buxton, 2012).
However, only little is known how ethanol as one of the mostprominent vessel-active drug acts on the hemodynamic response.
Ethanol, which is assumed to interact with a variety of receptorsystems, causes local as well as global effects (Howes and Reid,1985; Mathew and Wilson, 1986; Stendel et al., 2006). Ethanol isalso known to change the cerebral metabolism and to directlycause cerebral vasodilatation (Nicoletti et al., 2008) as well asvasoconstriction (Gordon et al., 1995).
We used the balloon model implemented in SPM8 (Stephanet al., 2007) to analyze the fMRI time series of the sensori-motorcortex and the visual cortex before and after application ofmoderate doses of ethanol. However, the original balloon modelwas customized to BOLD signals at 1.5 T magnet field strength thatrequired adapting inherent field-dependent model parameters to3 T (Mildner et al., 2001; Uludag et al., 2009)
To validate the results a forward simulation how parameterschanges affect the BOLD-signal was performed. The analysis isbased on data of a previously published study (Luchtmann et al.,2010).
2. Materials and methods
2.1. Subjects
Fourteen healthy right-handed volunteers (7 male, 7 female,aged between 21 and 29 years) were observed in a test/re-testdesign before and after administration of ethanol. All participantsgave their written informed consent to the presented study thatwas approved by the Local Ethics Committee of the University ofMagdeburg in compliance with national legislation and the Code ofEthical Principles for Medical Research Involving Human Subjectsof the World Medical Association (Declaration of Helsinki). Allvolunteers were social drinkers and had experience with beveragescontaining high concentrations of alcohol. None of them had anyself-reported history of neurological disease, major psychiatricdisturbance, substance abuse, or medication usage.
2.2. Study protocol
Prior to the MRI examination the volunteers were asked torefrain from eating for 6 h and to refrain from drinking alcoholicbeverages for at least 24 h. Sobriety prior to the experiment hasbeen tested using a breath alcohol test device. All subjects wereobserved within an MRI scanner using BOLD imaging procedureswith identical tasks prior to and after ethanol application. Ethanol-induced effects were observed using a test/re-test design. The task-framework consisted of an identical set of on/off task before andafter the administration of ethanol. Therefore the time course ofthe BOLD signal measured under sober conditions served asbaseline for potential individual ethanol effect. Between the runsunder sober and alcoholic conditions all subjects had ingested abeverage containing pure ethanol mixed with 400 ml orange juice.The applied amount of ethanol to reach a blood alcoholconcentration of 1.0% (Co) was estimated using modified Wid-mark’s equation:
Co ¼a
p � r(1)
where p denotes the body weight in kg and r denotes the individualcorrection factor according to the equations developed by Seidlet al. (2000).
To estimate the blood alcohol concentration (BAC) the breathalcohol level (BAL) was repeatedly measured until the BAL reachedabout 0.8%. For the BAL measurement a legally certified breathalcohol test device (Draeger 7110 Evidential MK III, Germany) wasused. Additional blood samples were collected every 10 min. TheBAC based on blood samples was measured according to theguidelines for determining blood alcohol concentration for forensic

M. Luchtmann et al. / NeuroToxicology 34 (2013) 95–104 97
purposes by a dehydrogenase-based enzyme assay and a gaschromatography method (Aderjan et al., 2011).
It was assumed that the BAC reached its peak level at thebeginning of the second MRI session and decreases slowlythereafter. Thus, the BAC level should have been constant throughthe entire second MRI session.
A control group to test for placebo effects was not measured(Gensini et al., 2005). In contrast to many other placebo-controlled studies all tested participants were social drinkersand well experienced in consumption of alcoholic beverages.They knew the acute physiological effects of ethanol very well.In addition, some studies showed limited factors for the reliableuse of alcohol placebos. Thus, reliable blind placebo applicationmay only be possible when the achieved blood alcohol level isless than 0.4 % (Glautier et al., 1992; Hammersley et al., 1992;Martin et al., 1990).
2.3. Experimental setting
A visually paced paradigm was used to evoke hemodynamicresponses in the visual cortex (VC), the left and right primarymotor cortex (LMC, RMC) as well as in the supplementary motorarea (SMA). The visual stimulus consisted of a repeatedlypresented checkerboard, which inverts its colors using a frequencyof 8 Hz with duration of 1 s. The time between two consecutivestimuli was 19 s representing the rest condition. At this time allparticipants had to fixate a cross at the screen. This stimulationblock was repeated 30 times every MRI session. In addition, thevisual stimulus was the onset for a defined motor task comprisingthe successively touch of the fingers of both hands with theiropposing thumb, the so-called finger-tapping task.
The entire experimental paradigm was performed twice beforeand after the ethanol application. For the statistical data analysisthis resulted in 4 runs (2 runs for sober condition and 2 runs forethanol condition) each of the run containing 30 blocks of 20 sduration.
2.4. MR Imaging protocol
MR imaging was performed on a 3 T Magnetom Trio scanner(Siemens, Erlangen, Germany) using a usual 8-channel phasedarray head coil. The conventional anatomical datasets werecollected using a T1-weighted magnetization prepared rapid
gradient echo sequence (MPRAGE – field of view = 256 mm, matrixsize = 256 � 256, slices = 192, slice thickness = 1 mm).
To obtain functional datasets containing the individualhemodynamic responses a gradient echo EPI sequence withfollowing parameters was used: field of view (FoV) = 192 mm,Matrix size = 64 � 64 � 7 voxel, slice thickness = 6 mm, interslicegap = 25%, Flip angle = 458, repetition time (TR) = 500 ms, echotime (TE) = 30 ms, order of acquisition = interleaved.
2.5. Image processing and statistical analysis
The changes in neuronal activity were analyzed in a multi-stepprocedure using the common software packages SPM.3 All datawere preprocessed prior to the statistical analysis. All images weremotion corrected to minimize the variance caused by motionartifacts. Furthermore, to facilitate a comparison across all subjectsand to estimate group effects all functional datasets werenormalized into a stereotactic standard space using the MNI-template. Time drifts and high frequency noise were reduced usinga high-pass-filter (128 s) and the SPM built-in autoregressivemodel AR(1).
3 FIL – SPM8, http://www.fil.ion.ucl.ac.uk/spm.
A design matrix containing both, the sober and ethanolcondition, was modeled by convolving the stimulus duration of1 s with the standard SPM canonical HRF (hemodynamic responsefunction). To account for the variability in the hemodynamicresponse across the sober and ethanol condition the design matrixwas extended by the derivatives of the HRF, with respect to timeand dispersion. Inferences about cerebral activations were madeusing F- and t-contrasts (Friston et al., 1994, 1995; Worsley andFriston, 1995).
Finally, the hemodynamic parameters were estimated for eachregion and condition. Significantly activated clusters (family wiseerror, p < 0.001) of the above-mentioned regions VC, RMC, LMCand SMA served as regions of interest.
To investigate the underlying vascular und metabolic con-tributions of the ethanol-induced changes in BOLD signal theballoon model (Buxton et al., 1998), implemented und modifiedin SPM8 was used. The model parameters in SPM8 wereestimated for 1.5 T. Assuming, that two parameters (n0, theratio of the intra- to the extravascular signal, and r0, the slope ofthe relation between the intravascular relaxation rate R�2 intravasc
and oxygen saturation) should exhibit to first order a lineardependency from the B0 field we adapted these parameters in thesource code of SPM8 (spm_gx_hdm.m) prior to applying theballoon model analysis. Thus, these values were doubled ton0 = 80.6 s�1 and r0 = 50 s�1.
To test the parameters for significant changes a two-factorialanalysis of variance was used to reveal global influence ofethanol on any balloon model parameter. Here, a Huynh–Feldtcorrection was used for multiple adjustments. The explorativepost hoc analysis of all parameters across all regions andconditions was calculated using a two-tailed paired t-test(Bonferroni corrected).
2.6. Balloon model simulation
For estimating potential ethanol-induced changes of thecomponents determining neurovascular coupling, the balloonmodel (Buxton et al., 1998; Friston et al., 2000; Deneux andFaugeras, 2006; Stephan et al., 2007) provides a well-establishedmodel that gives insight into the interdependencies between theunderlying mechanisms and how changing them affects theresulting BOLD signal.
The balloon model describes an input-output model which ischaracterized by two state variables: output volume n(t) anddeoxyhemoglobin content q(t). The input to this system isrepresented by the blood inflow f(t). The BOLD signal is assumedto be a combination of many neurogenic and diffusive signalsubcomponents. For this, the model comprises a set of parametersthat exert influence on the dynamics of the hemodynamicresponse and thus on the temporal time course of the BOLDsignal. The parameter Se represents the relationship betweenneuronal activity and the resulting neuronal signal. This connec-tion was originally called neuronal efficacy and labeled as epsilon(Friston et al., 2000). However, this may lead to confusion with theparameter epsilon describing the ratio between intra- to extra-vascular signal, which was introduced in a newer version of SPM(Stephan et al., 2007). SPM8 also uses the expression stimulus
efficacy instead of neuronal efficacy in a more comprehensivecontext of coupled activated areas. For a separated analysis ofactivated regions as performed here both expressions shouldrepresent the same dependence between neuronal activation andinduced vascular flow signal. The according signal induces achange of the inflowing blood f(t). Signal decay describes the time-constant how this signal decreases when the neuronal inductionceases. The parameter feedback represents the time-constant forthe vessel-based autoregulatory mechanisms the counteract

Fig. 1. Schematic illustration of the balloon model (details are described in the main text).
4 Maple 11, Waterloo Maple, Inc., http://www.maplesoft.com.
M. Luchtmann et al. / NeuroToxicology 34 (2013) 95–10498
alterations of the blood flow. The transit time is the average timenecessary to traverse the venous compartment. The parameterexponent describes the stiffness of the flow-volume relationship ofthe venous balloon. Oxygen extraction is the resting net oxygenextraction fraction within the capillary bed. Finally, the dynamicsof the changes in hemoglobin oxygenation and the venous volumeare combined to yield the BOLD signal. The according weightingfactors however depend on additional parameters, most impor-tantly on the external magnetic field and thus subsequently on thesusceptibility effects between the intra- and extravascular signals.
The above dynamics are modeled by a set of coupled non-linearequations (Buxton et al., 1998; Mandeville et al., 1999; Fristonet al., 2000; Stephan et al., 2007).
The model (see Fig. 1) assumes that the neuronal activation u(t)triggers with a certain efficacy e a cascade of metabolicmechanisms that ultimately generate a signal s(t) that inducesfinally a change of the inflow fin(t) into the activated area:
sðtÞ ¼ d f in
dt(2)
Due to feedback mechanisms the increase of the flow-inducingsignal s(t) decays proportional to the signal itself (with a rate ts)and with a rate tf due to a negative feedback (the so-calledautoregulation) which is correlated to the induced flow fin(t):
dsðtÞdt¼ euðtÞ � sðtÞ
ts� f inðtÞ � 1
t f(3)
In the original balloon model the BOLD signal y(t) is composedby the contributions of the venous blood volume n(t) and theconcentration q(t) of de-oxyhemoglobine (dHB) weighted byconstants ki according to
yðtÞ ¼ V0ðk1ð1 � qðtÞÞ þ k2 1 � qðtÞnðtÞ
� �þ k3ð1 � nðtÞÞ (4)
The functions q(t) and n(t) are coupled to the inflow signalthrough
t0dnðtÞ
dt¼ f inðtÞ � f outðnðtÞÞ; f outðnðtÞÞ ¼ nðtÞ1=a (5)
t0dqðtÞ
dt¼ f inðtÞEð f inðtÞ; E0Þ
E0� f outðnðtÞÞqðtÞ
nðtÞ (6)
Eð f inðtÞ; E0Þ ¼ 1 � ð1 � E0Þ f inðtÞ (7)
The original parameters k1 = 7E0, k2 = 2, k3 = 2E0 � 0.2 wereadapted according to Stephan et al. (2007) to
k1 ¼ 4:3n0E0 TE;k2 ¼ er0E0 TE;k3 ¼ 1 � e;
(7a)
where TE is the echo time, n0 is the frequency offset at the outersurface of the magnetized vessel for fully deoxygenated blood, E0 isthe oxygen extraction at rest, e is the ratio of intra- to extravascularsignal, and r0 is the slope of the relation between the intravascularrelaxation rate and oxygen saturation.
The hemodynamic response functions were calculated accord-ing to the modified balloon model (Stephan et al., 2007). Thesystem of non-linear differential equations was implemented inMaple11.4 Simulation parameters according to the nomenclatureof Stephan et al. (2007) were: activation duration 1 s, amplitude ofneuronal activation 1.0, signal decay ts = 1.83 s, autoregulationtf = 1.85 s, transit time t0 = 2.2 s, oxygen extraction rate E0 = 0.48,Grubbs constant a = 0.45, V0 = 0.02, ratio of intravascular andextravascular signal e = 0.49. TE was set to 30 ms according to theexperimental setup.
3. Results
A mean BAC of 0.82 � 0.07% was measured across all fourteensubjects. No significant changes were detected during the entireexperiment under the ethanol condition.
The baseline and corresponding hemodynamic responses ofeach region were averaged across all subjects. No significantchanges were detected in the mean baseline after the ethanolapplication (p = 0.131).
3.1. General linear model using SPM8
The results of the random-effects analysis for the conditionssober and ethanol using SPM are shown in Figs. 2 and 3. Theparadigm reliably evoked the regions LMC, RMC, SMA and VCbefore as well as after ethanol digestion.
3.2. Analysis of balloon model parameters
Across all subjects, regions and conditions the hemodynamicBOLD parameters were estimated based on the modified balloon

Fig. 2. Results of the main effects of the random effects analysis using SPM. The activation-maps of the group-level analysis across all 14 subjects are shown. The observed
regions LMC, RMC, SMA and VC exhibit a significant BOLD-activity for the sober and the ethanol condition (p < 0.01, family wise error (FWE) corrected).
Table 1Results (p-values, Huynh–Feldt corrected) of the two-factorial analysis of variance
to discover global effects in the balloon parameter approximation.
Parameter Factor
Ethanol Region Ethanol �region
Stimulus efficacy 0.0013 <0.0001 0.0723
Signal decay 0.5357 <0.0001 0.8412
Feedback 0.8763 0.0004 0.3695
Transit time 0.0006 <0.0001 0.0707
Exponent 0.4394 <0.0001 0.6183
Extraction 0.5769 <0.0001 0.9555
M. Luchtmann et al. / NeuroToxicology 34 (2013) 95–104 99
model by Stephan et al. (2007) implemented in SPM8. Table 1shows the results of a two-factorial analysis of variance. Theparameters stimulus efficacy and transit time were significantlyinfluenced by the effect of ethanol. Region-dependent changeswere shown for all observed parameters but only the parameterstransit time and stimulus efficacy exhibit a trend to show differentethanol dependent influence across the explored regions.
Table 2 shows the results of the explorative-post hoc analysis ofthe balloon model parameter estimation. The parameter transit
time was significantly increased after ethanol consumption acrossall observed regions. The smallest increase was found in thesupplementary motor area, the largest in the visual cortex. Theparameter stimulus efficacy, however, showed an ethanol-induceddecrease across all observed regions. The mean decrease was byabout a third in left and right primary motor cortex and the visualcortex. The most significant reduction of the stimulus efficacy wasseen in the SMA. All analysis of all other parameters yielded nosignificant ethanol-induced effects.
3.3. Balloon model simulations
The interaction of the different parameters of the balloonmodel is complex and their effects may cancel each other.Therefore, different parameter combinations may account for asimilar BOLD signal. However, the model provides an apt basis forexamining the effect of the parameter changes. To verify howchanges in the parameters affect the BOLD signal the accordingsignals were simulated by independently varying the parameters(Fig. 4a and b). The reduction in neuronal activation leads to acorresponding reduction of the amplitude of the BOLD signal butdoes neither increase the full-width-at-half-maximum (FWHM)nor shift the post-stimulus undershoot toward positive values asobserved in the experiments. The increase in tf (autoregulation)increases both the amplitude and the FWHM while increasing
time-to-peak (TTP) only slightly. Increasing the transit time t0
prolongs TTP more clearly and additionally decreases theamplitude (Fig. 4b) albeit less than the reduction of the stimulusefficacy. A similar effect is seen by increasing the vessel stiffness(Grubbs constant a) but additionally a profound deepening of theinitial dip results. The signal was fairly insensitive to changes in r0
within the range of 20%.
4. Discussion
To our knowledge this is the first study to evaluate the impact ofethanol on the neurovascular coupling using the well-knownballoon model (Buxton et al., 1998).
Interestingly, only two of the parameters showed a significantchange after application of ethanol. All observed regions exhibiteda clear decrease of the stimulus efficacy. The two-factorial analysisof variance showed a trend toward region-dependent influence ofethanol on the stimulus efficacy. The differences in the reduction ofthe parameter stimulus efficacy across the observed regions maysupport the assumption that ethanol has a region dependentimpact on the neuronal activity (Van Horn et al., 2006). Compared
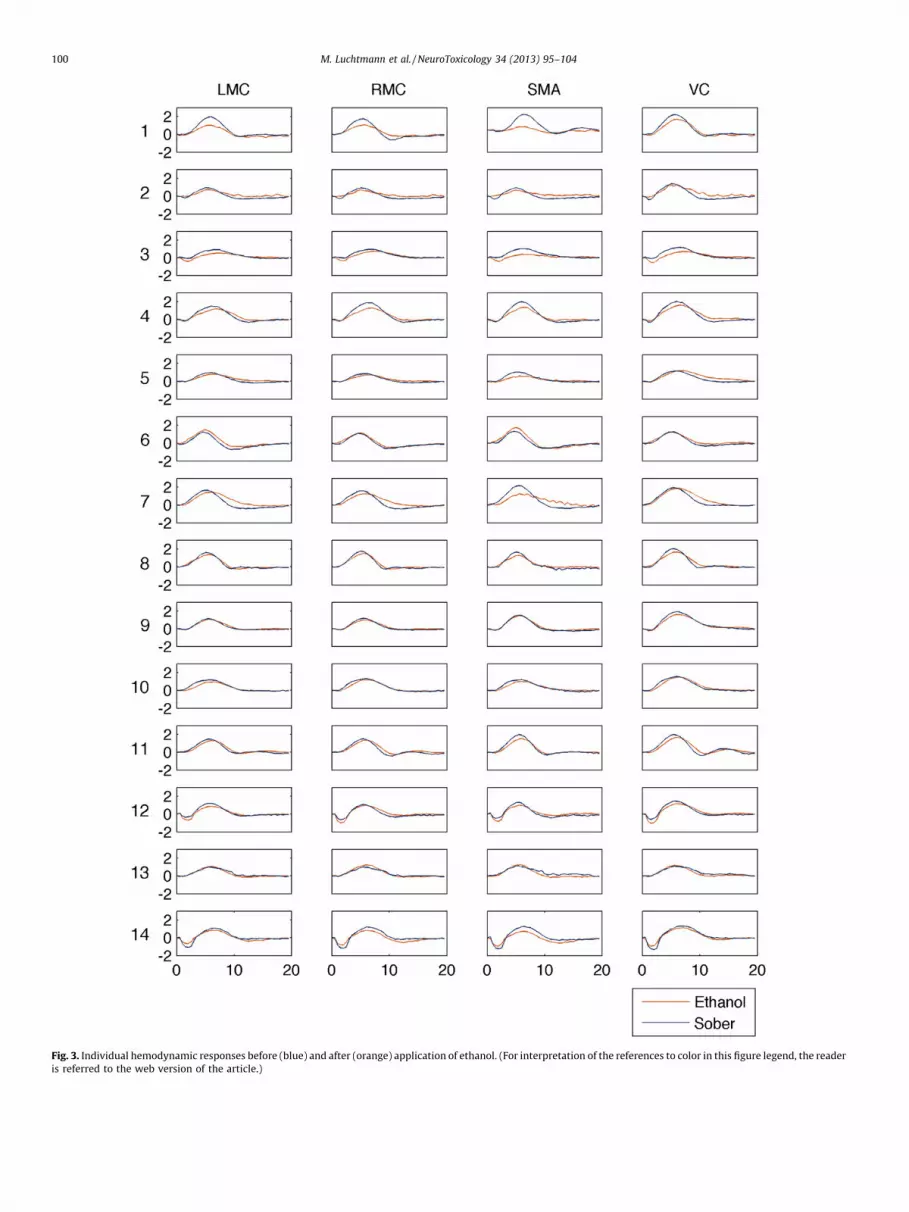
Fig. 3. Individual hemodynamic responses before (blue) and after (orange) application of ethanol. (For interpretation of the references to color in this figure legend, the reader
is referred to the web version of the article.)
M. Luchtmann et al. / NeuroToxicology 34 (2013) 95–104100

Table 2Results (Bonferroni corrected) of the explorative analysis of the balloon model hemodynamic parameter using a two-tailed paired t-test (significant results are depicted bold
face – signal decay [1/s], feedback [1/s], transit time [s], extraction [%]).
Sober Ethanol Difference Diff. % p-Value
Left motor cortex (LMC)
Stimulus efficacy 0.179 � 0.09 0.116 � 0.08 �0.063 � 0.06 �35.19 0.010Signal decay 0.702 � 0.46 0.704 � 0.46 0.002 � 0.07 0.28 0.999
Feedback 0.365 � 0.03 0.371 � 0.08 0.006 � 0.04 1.64 0.999
Transit time 1.205 � 0.23 1.432 � 0.19 0.227 � 0.20 18.84 0.002Exponent 0.326 � 0.01 0.326 � 0.01 0.000 � 0.01 0.00 0.999
Extraction 35.00 � 0.84 34.93 � 0.80 �0.07 � 3.86 �0.19 0.999
Right motor cortex (RMC)
Stimulus efficacy 0.191 � 0.07 0.130 � 0.08 �0.061 � 0.07 �31.94 0.014Signal decay 0.706 � 0.04 0.707 � 0.04 0.001 � 0.04 0.14 0.999
Feedback 0.362 � 0.03 0.369 � 0.02 0.007 � 0.04 1.93 0.999
Transit time 1.259 � 0.20 1.459 � 0.21 0.200 � 0.19 15.89 0.005Exponent 0.327 � 0.01 0.325 � 0.01 �0.002 � 0.01 �0.61 0.755
Extraction 35.27 � 0.88 35.07 � 0.70 �0.20 � 1.08 �0.57 0.999
Supplementary motor area (SMA)
Stimulus efficacy 0.155 � 0.06 0.086 � 0.05 �0.069 � 0.04 �44.52 0.001Signal decay 0.676 � 0.02 0.680 � 0.02 0.004 � 0.03 0.59 0.999
Feedback 0.383 � 0.02 0.385 � 0.01 0.002 � 0.02 0.52 0.999
Transit time 1.144 � 0.16 1.128 � 0.14 0.140 � 0.13 12.24 0.005Exponent 0.326 � 0.01 0.323 � 0.00 �0.003 � 0.01 �0.92 0.657
Extraction 34.80 � 0.77 34.60 � 0.74 �0.20 � 0.77 �0.58 0.999
Visual cortex (VC)
Stimulus efficacy 0.353 � 0.01 0.225 � 0.13 �0.129 � 0.16 �36.54 0.026Signal decay 0.720 � 0.06 0.736 � 0.07 0.016 � 0.08 2.22 0.999
Feedback 0.355 � 0.04 0.347 � 0.05 �0.008 � 0.05 �2.25 0.999
Transit time 1.390 � 0.39 1.665 � 0.76 0.275 � 0.29 19.78 0.011Exponent 0.332 � 0.01 0.331 � 0.01 �0.001 � 0.01 �0.30 0.999
Extraction 35.73 � 1.22 35.60 � 1.18 �0.13 � 1.19 �0.36 0.999
M. Luchtmann et al. / NeuroToxicology 34 (2013) 95–104 101
to the regions LMC, RMC and VC the SMA showed a highersusceptibility to ethanol. This result is consistent with theassumption that ethanol has an influence on specific cerebralreceptor systems (Allan et al., 1987; Allan and Harris, 1986; Davies,2003). Geyer et al. (1998) showed an increased density of GABAA
(gamma-aminobutyric acid) binding sites in the SMA that play animportant role in mediating ethanol induced effects. The binding ofethanol to GABAA receptors results in an inhibition of the neuronand may lead therefore to a decreased neuronal activity expressedin the balloon model as a decreased event density. The parametersignal decay reflects the transduction of neuronal activity intochanges in rCBF. At spatial scales of several millimeters it is likelythat rapidly diffusing molecules like nitric oxide mediate increasesin rCBF through the relaxation of smooth muscle cells in thearteriolar wall (Stephan et al., 2007). No significant changes of thisparameter were shown following the ethanol digestion. Theseresults may lead to the conclusion that ethanol does not alter thesensitivity for nitric oxide (NO). Mayhan et al. (1995) suggest thatacute exposure of cerebral arterioles to moderate doses ethanoldoes not alter the hemodynamic responses to nitric oxide. Todaand Ayajiki (2010) even showed an increased NO productionfollowing low dose application of ethanol. An increased NOproduction under the condition of an unchanged sensitivity fornitric oxide may lead to an increased cerebral blood flow, whichwas shown by recent studies of Rickenbacher et al. (2011). Theparameter feedback is a time-constant of cerebral autoregulatorymechanism. It represents the concept of cerebral vasodilatatingvessel properties in terms of blood flow constancy during perfusionpressure changes (Paulson et al., 1990). In no region significantchanges of the parameter feedback were found. These findingsimply that cerebral vessels possess robust mechanisms to preventethanol-induced impairment of autoregulatory mechanisms.These findings are in line with the results of another study. Thus,Blaha et al. (2003) observed the effects of acute alcoholintoxication on the dynamic cerebral autoregulation directly using
transcranial Doppler. It has been shown that the dynamic cerebralautoregulation was not significantly impaired by moderate dosesof ethanol across wide ranges of blood pressures (Blaha et al.,2003). Grubb et al. (1974) described the flow out of the venouscompartment that models the balloon-like capacity as a function ofblood volume. According to Mandeville et al. (1999) this outflow isstrongly characterized by Grubbs constant (see Table 2, parameterexponent). No ethanol-induced changes were found for theparameter exponent across all observed regions. Besides thestimulus efficacy only the transit time was significantly altered.As the transit time measures the time that a blood cell takes totransverse the venous compartment during stimulation theprolongation of the mean transit time indicates a slow down ofthe dynamics of the BOLD signal with respect to the flow changes.The results of the balloon-model-based analysis using SPM8 showthis significant increase of the transit time across all observedregions under ethanol condition. These results are inconsistentwith the findings of Blaha et al. (2003), who showed an increase ofthe cerebral blood flow velocity (CBFV) in the middle cerebralarteries (MCA) up to 8% following an ethanol application. Incontrast to the results of Blaha et al. (2003) an increase of theparameter transit time was found indicating a decreased CBFV. Atsimilar levels of BAC the differences of the changes of the CBFV maybe explained by methodical reasons. While the balloon model inthe present study considers the venous compartment of thecapillary bed Blaha et al. (2003) measured the CBF of arteries(MCA). The parameter extraction describes the resting net oxygenextraction of the capillary bed. The estimation of this parametershows a mean extraction fraction of about 35% for both the soberand the ethanol condition. Thus, the values were within the knownphysiological range between 20% and 50% (Friston et al., 2000). Thestatistical analysis of the alcohol-induced changes of the netresting oxygen extraction, described by the parameter extraction,exhibited no significant changes after the ethanol digestion.Assuming constant arterial oxygen saturation the results led to an

Fig. 4. Alteration of the BOLD signal as a function of changing the parameter of the
modified balloon model separately. The black curve represents a fit to a
representative BOLD signal of the present study. (a) Red curve = 20% reduction
in neuronal activation; blue curve = 20% increase in ts; green curve = 20% increase
in tf. (b) Red curve = 20% increase in t0; blue curve = 20% increase in e (ratio between
intravascular and extravascular signal); green curve = 20% increase in Grubbs
constant a. (For interpretation of the references to color in this figure legend, the
reader is referred to the web version of the article.)
M. Luchtmann et al. / NeuroToxicology 34 (2013) 95–104102
unchanged cerebral oxygen extraction ratio. These findings arecontrary to the observations of Zink et al. (1998a,b). They studiedthe effects of ethanol in a model of combined traumatic braininjury and hemorrhagic shock using iatrogenic brain injured pigs. Asignificant increase of the cerebral oxygen extraction ratio wasfound following the intragastric ethanol application. The followingmetabolic and structural alteration of the brain may explain thecontrary results. Thus, Ibayashi et al. (2000) observed in patientswith chronic ischemic stroke an increased oxygen extractionfraction indicating the brain to be in a metabolically ischemic stateor increased anaerobic glycolysis with oxygen. In contrast to thestudy conducted by Ibayashi et al. (2000) the participants of thepresent examination were clinically healthy. Therefore, a directcomparison is not useful.
The influence of ethanol on the brain metabolism, particularlyon the neurovascular coupling, is still not fully understood. Avariety of molecular mechanisms are believed to be responsible forthe manifold physiological effects in the brain. Some studies claimthat ethanol stimulates adenylate cyclase activity by modifying theregulatory G-protein–adenylate cyclase interaction to increase theproduction of activated enzymes. This action is supposed to beadditive with the effects of dopamine on adenylate cyclase(Hoffman and Tabakoff, 1990; Hoffman et al., 1984). Additionally,
ethanol leads to changes in adrenergic receptor systems in thebrain. In vitro it has been shown that ethanol decreases the affinityof the high-affinity state of the receptor for isoproterenol (Hoffmanet al., 1987; Valverius et al., 1987). In recent years GABAA receptorsoccupy a central role in mediating the effects of ethanol inmammalian brain. A large body of evidence is showing that GABAA
receptors are responsible for both the short and the long-termeffects of ethanol in the central nervous system (Davies, 2003). Thebinding of ethanol to the GABAA receptors increases the influx ofchloride ions through the cell membrane and leads to an inhibitionof new action potentials. Thus, the binding of GABAA receptoragonists results in an inhibition of the neuron. Allan et al. (1987)and Allan and Harris (1986) show the direct augmentation of thechloride ion influx of GABAA receptors after ethanol exposure. Thepresented results are consistent with the studies of Geyer et al.(1998). The regional distributions of GABAA binding sites wereanalyzed in the motor area of the macaque mesial frontal cortexacross the regions F1, F3 and F6. These regions are homologous tothe primary motor cortex (F1), the caudal (F3) and the rostral SMA(F6) in the human brain. It has been shown that the density ofGABAA receptors in the SMA is up to 35% higher compared to theprimary motor cortex. The results of our study imply that ethanolhas a stronger impact on the SMA than on the primary motor andvisual cortex. Thus, the presented results support the claim that theGABAA receptor has a central role in mediating the short-termeffects of ethanol.
4.1. Balloon model simulations
Forward simulations supported the results of the analysis.These showed, similar to results of Friston et al. (2000), thatisolated parameter changes affect the BOLD signal partly oppositewith regard to initial dip, time-to-peak, FWHM, and undershoot.However, these complex changes exhibit characteristic patterns.The isolated decrease of neuronal activity leads to a decreasedBOLD amplitude, which was also the first main result of theballoon-model analysis. Similarly, the prolongation of the transittime leads to a significant increase of the TTP. However, it has tobe kept in mind that the complex non-linear behavior of thedifferential equations may allow other solutions that arecharacterized by local minima in the model space. We alsoassumed that n0 and r0 scale linearly with the external magneticfield. This led to the same biophysiological constants used byMildner et al. (2001). However, in the SPM8 implementation k2
and k3 both contain the parameter e (ratio of intra- toextravascular signal) as a free fit parameter which renders thecomparison to the k2 and k3 in the formulation of Mildner et al.(2001) somewhat difficult.
Although the results of the analysis have to be interpretedtherefore with caution extended tests and comparisons of differentmodels (Deneux and Faugeras, 2006) showed that the model maybe used as a starting point for describing the mechanismsunderlying the BOLD signal. A recent review on modeling theBOLD signal was published by Buxton who discusses thelimitations of the balloon model and the development of moresophisticated models (Buxton, 2012) especially concerning theBOLD characteristics in higher fields (Uludag et al., 2009).
5. Conclusion
Examining the impact of drugs affecting the neuro-vascularcoupling such as ethanol leads to complex alterations of thehemodynamic response function, which depend on the corticalregion. Analysing the fMRI time series based on a set of non-lineardifferential equations based on the balloon model showed that themain effect was a reduction of the stimulus efficacy and a

M. Luchtmann et al. / NeuroToxicology 34 (2013) 95–104 103
prolongation of the transit time. One may therefore assume, that atthe moderate alcohol levels applied in this study the capability ofthe neurons to evoke a hemodynamic signal cascade is compro-mised. However, once initiated that chain of processes seems to berather intact as seen for the unchanged vessel and signal feedbackparameters. There is enough vascular reserve to lead to a vessel-based response albeit the transit time is somewhat reducedInstead. The analysis suggests that the main effect of ethanol maybe localized on the neuronal level or in the capability of theneurons to translate activation into another signal cascadeultimately leading to increased oxygen supply. Our results arein line with the assumption that inhibiting GABAA receptors play acrucial role in meditating ethanol-induced short-term effects.
However, a word of caution applies for using the model forBOLD signal changes. The finally detected fMRI signal is composedby several components that mutually cancel each other.Accordingly, the space of solutions has many possible parametercombinations therefore the priors used in fitting the curves haveto be chosen quite reasonably. But the obvious clear-cut changesas in the above analysis support strongly the interpretation thatthe model may give insight into underlying mechanisms. It wouldbe interesting to increase the dose of ethanol and to investigateother cortical areas that may be more sensitive to ethanol than themotor region.
Conflict of interest statement
The authors declare that there are no conflicts of interest.
References
Aderjan R, Daldrup T, Kaferstein H, Krause D, Mubßhoff F, Paul LD, et al. Guidelines fordetermining blood alcohol concentration (BAC) for forensic purposes – BAC guide-lines. Blutalkohol 2011;48(3):137–43.
Allan AM, Huidobro-Toro JP, Bleck V, Harris RA. Alcohol and the GABA receptor-chloride channel complex of brain. Alcohol Alcohol (Suppl. 1):1987;643–6.
Allan AM, Harris RA. Gamma-aminobutyric acid and alcohol actions: neurochemicalstudies of long sleep and short sleep mice. Life Sci 1986;39(21):2005–15.
Blaha M, Aaslid R, Douville CM, Correra R, Newell DW. Cerebral blood flow and dynamiccerebral autoregulation during ethanol intoxication and hypercapnia. J Clin Neu-rosci 2003;10(2):195–8.
Boynton GM, Engel SA, Glover GH, Heeger DJ. Linear systems analysis of functionalmagnetic resonance imaging in human V1. J Neurosci 1996;16(13):4207–21.
Buxton RB. Dynamic models of BOLD contrast. Neuroimage 2012;62(2):953–61.Buxton RB, Wong EC, Frank LR. Dynamics of blood flow and oxygenation changes
during brain activation: the balloon model. Magn Reson Med 1998;39(6):855–64.Calhoun VD, Pekar JJ, Pearlson GD. Alcohol intoxication effects on simulated driving:
exploring alcohol-dose effects on brain activation using functional MRI. Neurop-sychopharmacology 2004;29(11):2097–107.
Calhoun VD, Altschul D, McGinty V, Shih R, Scott D, Sears E, et al. Alcohol intoxicationeffects on visual perception: an fMRI study. Hum Brain Mapp 2004;21(1):15–25.
Davies M. The role of GABAA receptors in mediating the effects of alcohol in the centralnervous system. J Psychiatry Neurosci 2003;28(4):263–74.
Deneux T, Faugeras O. Using nonlinear models in fMRI data analysis: model selectionand activation detection. Neuroimage 2006;32(4):1669–89.
Friston KJ, Mechelli A, Turner R, Price CJ. Nonlinear responses in fMRI: the balloonmodel, volterra kernels, and other hemodynamics. Neuroimage 2000;12(4):466–77.
Friston KJ, Holmes AP, Poline J, Grasby PJ, Williams SCR, Frackowiak RSJ, et al. Analysisof fMRI time-series revisited. Neuroimage 1995;2(1):45–53.
Friston KJ, Holmes AP, Worsley KJ, Poline J, Frith CD, Frackowiak RSJ. Statisticalparametric maps in functional imaging: a general linear approach. Hum BrainMapp 1994;2(4):189–210.
Gensini GF, Conti AA, Conti A. Past and present of ‘‘what will please the lord’’: anupdated history of the concept of placebo. Minerva Med 2005;96(2):121–4.
Geyer S, Matelli M, Luppino G, Schleicher A, Jansen Y, Palomero-Gallagher N, et al.Receptor autoradiographic mapping of the mesial motor and premotor cortex ofthe macaque monkey. J Comp Neurol 1998;397(2):231–50.
Giove F, Mangia S, Bianciardi M, Garreffa G, Di Salle F, Morrone R, et al. The physiologyand metabolism of neuronal activation: in vivo studies by NMR and other methods.Magn Reson Imaging 2003;21(10):1283–93.
Glautier S, Remington B, Taylor C. Alcohol placebos: you can only fool some of thepeople some of the time [2]. Br J Addict 1992;87(10):1489.
Gordon EL, Nguyen T-. Ngai AC, Winn HR. Differential effects of alcohols on intracere-bral arterioles. Ethanol alone causes vasoconstriction. J Cereb Blood Flow Metab1995;15(3):532–8.
Grubb RL Jr, Raichle ME, Eichling JO, Ter Pogossian MM. The effects of changes in PaCO2
on cerebral blood volume, blood flow, and vascular mean transit time. Stroke1974;5(5):630–9.
Hammersley R, Finnigan F, Millar K. Alcohol placebos: you can only fool some of thepeople all of the time. Br J Addict 1992;87(10):1477–80.
Hoffman PL, Tabakoff B. Ethanol and guanine nucleotide binding proteins: a selectiveinteraction. FASEB J 1990;4(9):2612–22.
Hoffman PL, Valverius P, Kwast M, Tabakoff B. Comparison of the effects of ethanol onbeta-adrenergic receptors in heart and brain. Alcohol Alcohol (Suppl. 1):1987;749–54.
Hoffman PL, Luthin GR, Theodoropoulos D. Ethanol effects on striatal dopaminereceptor-coupled adenylate cyclase and on striatal opiate receptors. PharmacolBiochem Behav 1984;18(Suppl. 1):355–9.
Honey G, Bullmore E. Human pharmacological MRI. Trends Pharmacol Sci2004;25(7):366–74.
Howes LG, Reid JL. Decreased vascular responsiveness to noradrenaline followingregular ethanol consumption. Br J Clin Pharmacol 1985;20(6):669–74.
Iadecola C. Neurogenic control of the cerebral microcirculation: is dopamine mindingthe store? Nat Neurosci 1998;1(4):263–5.
Ibayashi S, Irie K, Kitayama J, Nagao T, Kitazono T, Fujishima M. Ischemic brainmetabolism in patients with chronic cerebrovascular disease: increased oxygenextraction fraction and cerebrospinal fluid lactate. J Stroke Cerebrovasc Dis2000;9(4):166–71.
Josephs O, Turner R, Friston K. Event-related fMRI. Hum Brain Mapp 1997;5(4):243–8.Kuschinsky W, Wahl M. Local chemical and neurogenic regulation of cerebral vascular
resistance. Physiol Rev 1978;58(3):656–89.Levin JM, Ross MH, Mendelson JH, Kaufman MJ, Lange N, Maas LC, et al. Reduction in
BOLD fMRI response to primary visual stimulation following alcohol ingestion.Psychiatr Res – Neuroimaging 1998;82(3):135–46.
Luchtmann M, Jachau K, Tempelmann C, Bernarding J. Alcohol induced region-depen-dent alterations of hemodynamic response: implications for the statistical inter-pretation of pharmacological fMRI studies. Exp Brain Res 2010;1–10.
Mandeville JB, Marota JJA, Ayata C, Zaharchuk G, Moskowitz MA, Rosen BR, et al.Evidence of a cerebrovascular postarteriole windkessel with delayed compliance. JCereb Blood Flow Metab 1999;19(6):679–89.
Martin CS, Earleywine M, Finn PR, Young RD. Some boundary conditions for effectiveuse of alcohol placebos. J Stud Alcohol 1990;51(6):500–5.
Mathew RJ, Wilson WH. Regional cerebral blood flow changes associated with ethanolintoxication. Stroke 1986;17(6):1156–9.
Matthews PM. Pharmacological applications of fMRI. Neuromethods 2009;41:751–67.Matthews PM, Honey GD, Bullmore ET. Applications of fMRI in translational medicine
and clinical practice. Nat Rev Neurosci 2006;7(9):732–44.Mayhan WG, Didion SP, Wei EP. Acute effects of ethanol on responses of cerebral
arterioles. Stroke 1995;26(11):2097–102.Mildner T, Norris DG, Schwarzbauer C, Wiggins CJ. A qualitative test of the balloon
model for BOLD-based MR signal changes at 3 T. Magn Reson Med 2001;46(5):891–9.
Mraovitch S, Calando Y, Onteniente B, Peschanski M, Seylaz J. Cerebrovascular andmetabolic uncoupling in the caudate-putamen following unilateral lesion of themesencephalic dopaminergic neurons in the rat. Neurosci Lett 1993;157(2):140–4.
Nicoletti P, Trevisani M, Manconi M, Gatti R, De Siena G, Zagli G, et al. Ethanol causesneurogenic vasodilation by TRPV1 activation and CGRP release in the trigemino-vascular system of the guinea pig. Cephalalgia 2008;28(1):9–17.
Obata T, Liu TT, Miller KL, Luh W-. Wong EC, Frank LR, et al. Discrepancies betweenBOLD and flow dynamics in primary and supplementary motor areas: applicationof the balloon model to the interpretation of BOLD transients. Neuroimage2004;21(1):144–53.
Ogawa S, Lee TM, Kay AR, Tank DW. Brain magnetic resonance imaging with contrastdependent on blood oxygenation. Proc Natl Acad Sci U S A 1990;87(24):9868–72.
Paulson OB, Strandgaard S, Edvinsson L. Cerebral autoregulation. Cerebrovasc BrainMetab Rev 1990;2(2):161–92.
Rickenbacher E, Greve DN, Azma S, Pfeuffer J, Marinkovic K. Effects of alcohol intoxi-cation and gender on cerebral perfusion: an arterial spin labeling study. Alcohol2011;45(8):725–37.
Seidl S, Jensen U, Alt A. The calculation of blood ethanol concentrations in males andfemales. Int J Legal Med 2000;114(1–2):71–7.
Seifritz E, Bilecen D, Hanggi D, Haselhorst R, Radu EW, Wetzel S, et al. Effect of ethanolon BOLD response to acoustic stimulation: implications for neuropharmacologicalfMRI. Psychiatr Res – Neuroimaging 2000;99(1):1–13.
Sripada CS, Angstadt M, McNamara P, King AC, Phan KL. Effects of alcohol on brainresponses to social signals of threat in humans. Neuroimage 2011;55(1):371–80.
Stephan KE, Weiskopf N, Drysdale PM, Robinson PA, Friston KJ. Comparing hemody-namic models with DCM. Neuroimage 2007;38(3):387–401.
Stendel R, Irnich B, al Hassan AA, Heidenreich J, Pietilae T. The influence of ethanol onblood flow velocity in major cerebral vessels. A prospective and controlled study.Alcohol 2006;38(3):139–46.
Steward CA, Marsden CA, Prior MJW, Morris PG, Shah YB. Methodological consider-ations in rat brain BOLD contrast pharmacological MRI. Psychopharmacology(Berl) 2005;180(4):687–704.
Toda N, Ayajiki K. Vascular actions of nitric oxide as affected by exposure to alcohol.Alcohol Alcohol 2010;45(4):347–55.
Tank DW, Ogawa S, Ugurbil K. Mapping the brain with MRI. Curr Biol 1992;2(10):525–8.
Uludag K, Dubowitz DJ, Yoder EJ, Restom K, Liu TT, Buxton RB. Coupling of cerebralblood flow and oxygen consumption during physiological activation and deacti-vation measured with fMRI. Neuroimage 2004;23(1):148–55.

M. Luchtmann et al. / NeuroToxicology 34 (2013) 95–104104
Uludag K, Muller-Bierl B, U?urbil K. An integrative model for neuronal activity-inducedsignal changes for gradient and spin echo functional imaging. Neuroimage2009;48(1):150–65.
Valverius P, Hoffman PL, Tabakoff B. Effect of ethanol on mouse cerebral cortical b-adrenergic receptors. Mol Pharmacol 1987;32(2):217–22.
Van HornJD,Yanos M, Schmitt PJ,Grafton ST. Alcohol-induced suppression of BOLD activityduring goal-directed visuomotor performance. Neuroimage 2006;31(3):1209–21.
Villringer A. Understanding functional neuroimaging methods based on neurovascularcoupling. Adv Exp Med Biol 1997;413:177–93.
Worsley KJ, Friston KJ. Analysis of fMRI time-series revisited – again. Neuroimage1995;2(3):173–81.
Yoon HW, Chung J, Oh J, Min H, Kim D, Cheon Y, et al. Differential activation of facememory encoding tasks in alcohol-dependent patients compared to healthy sub-jects: an fMRI study. Neurosci Lett 2009;450(3):311–6.
Zink BJ, Sheinberg MA, Wang X, Mertz M, Stern SA, Betz AL. Acute ethanol intoxicationin a model of traumatic brain injury with hemorrhagic shock: effects on earlyphysiological response. J Neurosurg 1998;89(6):983–90.
Zink BJ, Stern SA, Wang X, Chudnofsky CC. Effects of ethanol in an experimental modelof combined traumatic brain injury and hemorrhagic shock. Acad Emerg Med1998;5(1):9–17.