survey of us fuel ethanol plants
TRANSCRIPT

Bioresource Technology 100 (2009) 3277–3284
Contents lists available at ScienceDirect
Bioresource Technology
journal homepage: www.elsevier .com/locate /b ior tech
Survey of US fuel ethanol plants
J.A. Saunders a, K.A. Rosentrater b,*
a Department of Nutrition, Food Science, and Hospitality, South Dakota State University, Brookings, SD 57007, USAb North Central Agricultural Research Laboratory, USDA-ARS, 2923 Medary Ave., Brookings, SD 57006, USA
a r t i c l e i n f o
Article history:Received 5 May 2008Received in revised form 22 January 2009Accepted 22 January 2009Available online 16 March 2009
Keywords:Fuel ethanolSurveyCoproducts
0960-8524/$ - see front matter Published by Elsevierdoi:10.1016/j.biortech.2009.01.071
* Corresponding author. Tel.: +1 605 693 3241; faxE-mail address: [email protected] (K.A
a b s t r a c t
The ethanol industry is growing in response to increased consumer demands for fuel as well as therenewable fuel standard. Corn ethanol processing creates the following products: 1/3 ethanol, 1/3 distill-ers grains, and 1/3 carbon dioxide. As the production of ethanol increases so does the generation of itscoproducts, and viable uses continually need to be developed. A survey was mailed to operational US eth-anol plants to determine current practices. It inquired about processes, equipment used, end products,and desired future directions for coproducts. Results indicated that approximately one-third of plantmanagers surveyed expressed a willingness to alter current drying time and temperature if it could resultin a higher quality coproduct. Other managers indicated hesitation, based on lack of economic incentives,potential cost and return, and capital required. Respondents also reported the desire to use their coprod-ucts in some of the following products: fuels, extrusion, pellets, plastics, and human food applications.These results provide a snapshot of the industry, and indicate that operational changes to the current pro-duction of DDGS must be based upon the potential for positive economic returns.
Published by Elsevier Ltd.
1. Introduction
The increased demand for ethanol as a fuel source has amplifiedthe need to find valuable uses for coproducts of the process. Thus,ethanol processing and its co-derivatives are currently the sourceof many research investigations. At the beginning of 2008, theUnited States expected to produce approximately 7.2 billiongallons of fuel ethanol utilizing 134 manufacturing plants.Currently, another 77 plants are under construction or expansion,which will be able to produce an additional 6.2 billion gallons ofethanol. When all plants are operating, a total of 211 plants willproduce 13.4 billion gallons of ethanol annually (RFA, 2008).
Currently, coproducts such as distillers dried grains (DDG) anddistillers dried grains with solubles (DDGS) are predominatelyused to provide nutritional value to the diets of livestock. DDG isa good source of crude fiber (13%) and protein (27–30%), but islow in total carbohydrate (46%) (Miron et al., 2001; Al-Suwaieghet al., 2002; Davis et al., 1980). The nutritional content of DDGS,however, can vary more, containing 5–11% crude fiber, 27–34%protein, 5–6% starch, and 39–62% carbohydrates most of which isneutral detergent fiber (UMN, 2007; Belyea et al., 2004; Spiehset al., 2002; NRC, 1998, 1982). The high nutrient (especially proteinand energy) content allows these coproducts to be an excellentfeed for animal diets. It also appears that ethanol coproducts
Ltd.
: +1 605 693 5240.. Rosentrater).
may be viable ingredients for human foods (Rosentrater and Krish-nan, 2006; Saunders et al., 2008).
The purpose of this study was to survey US ethanol plant man-agers about current production practices. The survey was used toacquire information about processes, equipment used, end prod-ucts, and desired future directions for their coproducts. Responsesand suggestions offer a glimpse of current industry needs.
2. Methods
A contact list was obtained through the Renewable Fuels Asso-ciation website, which is freely accessible to the public (RFA, 2008).At the time of this study (early 2007), 111 ethanol biorefinerieswere available and operating at full capacity. Of those, 94 were in-cluded in the survey, while the remaining 17 plants were excludedfrom the survey because those plants’ primary feedstock was notcorn (i.e. barley, cheese whey, brewery waste, or sugars). An addi-tional 75 plants under construction and 8 plants under expansionwere also excluded from this survey as construction precludedcoproduct production.
Four main categories in the survey contained 15 questions: pro-cessing issues, potential food applications, future research, andnutritional information. The self-administered survey was deliv-ered through the US Postal Service and was designed to take nomore than 5–10 min to complete. Returned surveys contained noidentifying information unless the respondent voluntarily enclosedplant coproduct nutrition information. Respondents were also of-fered the opportunity to receive a final copy of this paper upon

3278 J.A. Saunders, K.A. Rosentrater / Bioresource Technology 100 (2009) 3277–3284
completion if desired, therefore voluntarily provided name, ad-dress, and/or email address as contact information. Assigning num-bers to surveys in the order returned maintained confidentiality(1–23). The survey was reviewed and approved by the SouthDakota State University Human Subjects Committee. It was deter-mined that this survey did not fall under the federal regulations forhuman subjects’ research. The original cover letter and survey toolare located in Appendices A and B, respectively. The survey wasmailed out (n = 94) in March of 2007 to ethanol biorefineries witha stamped, return envelope provided to facilitate participation. Allresponses identified were kept confidential, and only used for thepurpose of data analysis. Data was summarized using MicrosoftExcel (v.2003) to calculate mean values. To facilitate data analysis,a value of 1 or 0 was assigned to responses for questions whichrequired a ‘‘yes” or ‘‘no”, respectively.
3. Results and discussion
Data analysis was completed on a question-by-question basis,as some returned surveys were missing data (i.e. not all surveyswere completely filled out). No follow-up surveys were sent;therefore 23 out of 94 surveys were returned resulting in a re-sponse rate of 24.5%. Response rates of 30% from mail surveysare often considered ‘‘satisfactory” (Cooper and Schindler, 2003).
3.1. Processing Issues
3.1.1. Quantity generated (n = 23/23 responses)A wide variety of ethanol plants were surveyed, thus resulting
in a range of coproduct production rates. The minimum and max-imum amounts reported were 9200 and 390,000 tons per year,respectively. The average for the survey data was 131,205 tons
33%
51%
14%
2%
0
10
20
30
40
50
60
Res
pons
e (%
)
Rail Local Export Other
Fig. 1. Coproduct destination and transportation options currently used in industry(n = 23/23 responses). Note that rail denotes transportation for domestic DDGS use,whereas export denotes international shipment.
0
10
20
30
40
50
60
Res
pons
e (%
)
Little Variation Color Burned
Size of Grains
QtyProd
11%
51%
0%3%
0
Fig. 2. Typical variations noted in co
per year, while the median value was 74,000 tons per year;52.2% of respondents indicated coproduct production less than99,999 tons per year, 26.1% indicated between 100,000 and199,999 tons per year, and 21.7% indicated greater than 200,000tons per year. Coproduct generation values can indicate ethanolplant size and production capacities.
3.1.2. Coproduct destination (n = 23/23 responses)Fig. 1 shows the distribution of destination and transportation
method for coproducts among the following categories: ship by rail(for domestic use), export (i.e. international use), local animal feed,and other. Many survey respondents indicated more than one op-tion for coproduct use after ethanol production at their particularplant. These data revealed that use for local animal feed (51%)was the most popular use of these coproducts, thereby benefitinglocal and surrounding communities. Golden LYK mineral blockswere a method identified in the ‘‘other” category, as a novel usefor ethanol coproducts.
Rural economies are greatly benefiting from the ethanol indus-try in general, and coproducts in particular, as responses showedthat many local farmers utilize this feed material. But an increasingamount of coproducts are being transported greater distances forfinal use (Rosentrater, 2007).
3.1.3. Typical deviations in chemical and physical characteristics(n = 23/23 responses)
Plant managers then identified various chemical and physicalirregularities found in their coproducts. This information will allowresearchers to classify areas that are increasingly problematic, andcan be used to guide future research, that can ultimately benefitproduction practices. Fig. 2 categorizes the various deviationsamong US plants. The majority of respondents (51%) indicated thatlittle variation was typically found in their coproducts. Other re-ported variations included color, burned coproducts, size ofcoproducts, quantity produced, soluble (i.e. CDS, or syrup) concen-tration, protein, and moisture. Less common deviations identifiedin the ‘‘other” category indicated were oil content and sulfur levels.
The identification of coproduct deviations was valuable, asthese can be considered current weaknesses of the industry, or atleast areas that could benefit from improvement. The need for uni-formity in coproducts is great, as it impacts potential sales(Rosentrater and Krishnan, 2006). This is especially importantwhen pursing value-added uses for coproducts, as well as usingtheir use in animal feeds.
3.1.4. Dryer type (n = 23/23 responses)One particular element that can greatly impact coproduct qual-
ity is the drying process. Fig. 3 shows the distribution of dryertypes. An overwhelming 87.5% of ethanol plants surveyed utilized
. uced Protein Moisture Solubles Other
%
11%14%
3%6%
products (n = 23/23 responses).

4%
87.5%
0% 0%8.5%
0
10
20
30
40
50
60
70
80
90
100
Res
pons
e (%
)
Ring Flash Fluidized
Bed
OtherRotary
Fig. 3. Types of dryers used by ethanol plants (n = 23/23 responses).
Other 31%
No34.5%
Yes34.5%
Fig. 4. Plant manager willingness to alter coproduct drying temperature (n = 22/23responses).
Other 31%
Yes 31%
J.A. Saunders, K.A. Rosentrater / Bioresource Technology 100 (2009) 3277–3284 3279
rotary dryers. A few respondents indicated the use of more thanone dryer type. Other drying methods (identified by the respon-dents via the ‘‘other” open response category) included heat, nonatural gas burner, and coproducts that were not dried (i.e. nodryer used) – unfortunately, no additional explanation was pro-vided with the survey responses. Drying methods and equipmentplay key roles in coproduct quality. Even though the rotary typedryer is heavily used in industry, this does not necessarily meanthat it is the best type of dryer for all potential applications. Im-proved quality is necessary for future products, and dryer perfor-mance is an issue that should be examined more closely.
3.1.5. Typical drying times (n = 15/23 responses)It should be noted that the term ‘‘dry” is very dependent upon
each plant, and the moisture contents of the coproducts variedamong the plants; all moisture contents were below 14%, however.More about this will be discussed subsequently. Drying times werepooled and analyzed by frequency distribution (Table 1). Averagedrying time was 0.85 h, with a standard deviation of 0.48 h. Mostplants dried their coproducts less than one hour. If temperatureswere reduced and/or optimized, perhaps higher quality coproductscould result. The nutritional quality may vary depending on graintype and processing methods (Dawson et al., 1985). Excessiveexposure to heat can cause undesired Maillard browning withina material (Bertram, 1953). Coproducts need to be processed tofit consumer expectations. Drying time alone is not a good indica-tor of quality, as drying temperature also needs to be considered.
3.1.6. Plant manager willingness to alter drying time (n = 22/23responses)
Responses regarding changes to drying time were similar to theabove question, except some plant managers indicated hesitationto altering drying time. Fig. 5 shows the distribution of respon-dent’s answers. Thirty-one percent of respondents stated they
Table 1Typical drying times used by ethanol plants for coproduct production (n = 15/23responses).
Time (h) Number of responses
<1 101–2 22–24 3>24 0Total 15
would possibly alter drying time and reported the following re-sponses open-ended: ‘‘capital required and payback time frame”;‘‘cost and return on investment”; ‘‘would alter by 15 min”;
No 38%
Fig. 5. Plant manager willingness to alter coproduct drying time (n = 22/23responses).

71%
16.5%12.5%
0%0
10
20
30
40
50
60
70
80
Res
pons
e (%
)
Flat Silo Both Other
Fig. 6. Typical storage methods used in industry for coproducts (n = 22/23responses).
3280 J.A. Saunders, K.A. Rosentrater / Bioresource Technology 100 (2009) 3277–3284
‘‘depends on economic incentive”; ‘‘only would shorten requiredtime”; ‘‘depends on restriction of capacity”. Thirty-eight percentof respondents stated they would not be willing or be able tochange drying time. Lastly, 31% of respondents stated that ‘‘other”reasons that would influence their willingness to change includedprofitability.
3.1.7. Typical drying temperatures (n = 13/23 responses)Drying temperatures were analyzed in two different processing
locations: discharge and air temperatures. Frequency distributionsillustrate the reported discharge temperatures in Table 2, and airtemperatures in Table 3. Discharge temperature referred to thetemperature of coproducts at the completion of the drying period.Air temperature, on the other hand, referred to the temperature ofthe drying air in the dryer. Discharge temperatures were approxi-mately 90–100 �C, while air temperatures were on average, greaterthan 350 �C. The average discharge temperature was 99 �C with astandard deviation of 9 �C. Temperatures must be sufficient to uni-formly dry the coproducts, but not too high, as that could causeundesired browning and protein denaturation. In fact, producttemperatures as low as 50 �C have been shown to denature cornproteins (Weller et al., 1987; Wu et al., 1997). Lower dryingtemperatures would require the coproducts to be dried for longerperiods of time, and vice-versa. An optimization of drying temper-atures, along with appropriate drying times, may enhance coprod-uct quality; however, this is an area for future research by others.
3.1.8. Plant manager willingness to alter drying temperature(n = 22/23 responses)
One objective of this survey was to determine the level of will-ingness that each plant manager had in creating a higher qualitycoproduct. Fig. 4 shows the distribution of respondent’s answers.One-third of the respondents reported a potential willingness to al-ter current drying temperatures and gave the following open-ended question responses: ‘‘depends on what it takes to increasequality”; ‘‘cost vs. return on investment”; ‘‘depends on what qual-ity factors we are looking for”; ‘‘we do this currently”; ‘‘economicincentive”; ‘‘our goal is to manufacture consistent quality thereforeif this helps us meet our goals then we will do it”; ‘‘will increase by
Table 2Typical coproduct dryer discharge temperatures used by ethanol plants (n = 13/23responses).
Temperature (�C) Number of responses
80–90 290–100 6100–110 4>115 1Total 13
Table 3Typical drying temperatures used by ethanol plants for coproduct production (airtemperature) (n = 11/23 responses).
Temperature (�C) Number of Responses
200–250 0251–300 1301–350 1351–400 2401–450 2451–500 2501–550 3Total 11
another 50 �C”; ‘‘depends on restriction of capacity”. On the otherhand, one-third of respondents reported that they would not bewilling or be able to change drying temperature, the following re-sponses were received: ‘‘not possible”, ‘‘our plant shoots for 12.5%moisture”. Finally, 5% of respondents answered the ‘‘other”category, where they each indicated the desire for profitability.This insight should allow researchers to develop incentives neces-sary to motivate temperature changes to create higher qualitycoproducts, if indeed this type of modification could improvecoproduct quality. To some extent, cooperation is a necessityamong ethanol plants in order to correct weaknesses in the indus-try and create an increasingly uniform coproduct stream that isdesirable by end users.
3.1.9. Storage practices (n = 22/23 responses)Fig. 6 illustrates the division of storage facilities that are cur-
rently used for coproducts by the companies surveyed. The major-ity of ethanol plants (71%) utilized flat-type storage structures.Approximately 12.5% of ethanol plants reported the use of twotypes of storage methods for coproducts (flat and silo). The enor-mous amounts of flat storage are a function of the fact that themajority of plants are smaller. The larger plants, on the other hand,typically use silo storage to boost space utilization.
3.1.10. Curing time (n = 16/23 responses)Curing is a common practice, where materials are placed in
piles in flat storage buildings, which allows them to cool afterbeing dried. The average curing time for coproducts currently uti-lized in US ethanol plants was 0.93 days, with a standard deviationof 0.57 days. A range of 0–2 days was reported, which indicatedthat some plants do not use curing practices, but rather movecoproducts directly into storage or ship the DDGS directly.
3.2. Potential food applications
3.2.1. Food grade quality coproducts (n = 22/23 responses)Perhaps in the near future, coproducts can be integrated into
the human food supply. However, it is only currently used to feedlivestock. Of the ethanol plants surveyed, no plants reported toproduce human food grade coproducts. The majority of ethanolplants (63.5%) surveyed do not produce food grade distillers grains(Fig. 7). Many managers (32%) are unsure of the specific qualifica-tions required for a material to be classified as food grade. Thisinformation is extremely valuable, as it indicates the need forindustry education regarding the specifications that must be metin order to classify materials as food grade. This knowledge will al-low plant managers to decide if their plants can currently completethese requirements, or if additional equipment and/or training arenecessary, or even affordable.

Other0%
Not Sure32%
No63.5%
Yes4.5%
Fig. 7. Percentage of plants that currently produce food grade coproducts (n = 22/23 responses).
Table 4Individual open responses to future product applications for coproducts (n = 8/23).
Responses
Combustion as a fuel sourceConstruction/building materialsCorn oil to bio-diesel and corn oil marketsDevelop pet food, human food, and higher value marketsDGHP (high protein products)Extrusion aquacultureFertilizerFluid bed combustion to replace or reduce natural gas and for electrical usagePlastics and polymersPelletizingTo make pressboard, as glue is what holds the wood fibers together to make that
productUsed more in animal feeds or non-ruminant feed
J.A. Saunders, K.A. Rosentrater / Bioresource Technology 100 (2009) 3277–3284 3281
3.2.2. Plant manager willingness to create food grade coproducts(n = 21/23 responses)
Responses to this question indicated that the majority (62%) ofethanol plant managers would like to create a food gradecoproduct (Fig. 8). This modification could add value to the ethanolproduction process, and may economically benefit the plant andsurrounding communities. The remaining 38% of managers indi-cated that switching to a food grade coproduct might not be appro-priate or cost effective for their current plant situation. Issuesraised by managers when contemplating the potential to becomefood grade included the following responses: cost and payback;elimination of the use of antibiotics; switching from urea to a foodgrade nitrogen source; re-engineering dryers to make them fit forfood grade coproducts; prices and values; profitability; economicincentive; requirements to become food grade.
3.3. Future research
3.3.1. Potential product applications (n = 8/23)A summary of the respondents’ open suggestions for potential
uses for coproducts is listed in Table 4. All suggestions appeared
No38%
Yes62%
Already Food Grade
0%
Fig. 8. Plant manager willingness to alter processes in order to produce food gradecoproducts (n = 21/23 responses).
to be feasible; however, additional research will be needed formany of these ideas. Limited research has been done on value-added coproduct applications besides livestock feed and potentialhuman food ingredients. For example, a few studies have examinedusing ethanol coproducts as fertilizers (Erdem and Ok, 2002;Ramana et al., 2002a,b), biofillers in plastics (Tatara et al., 2007,2009), and substrates for bioenergy (Rosentrater et al., 2006).. Allof these options provide additional routes for coproduct utilization.
3.3.2. Issues limiting value and utilization (n = 14/23)Another objective of this study was to identify limitations (Ta-
ble 5) of coproduct production processes. Many important issuesand roadblocks were identified by the respondents hat need tobe addressed to help this industry move forward. These responsesare reflective of Rosentrater (2007) which discussed many similarthemes regarding the value and utilization of distillers grains, bothfrom the ethanol production standpoint, and from a livestock feed-ing perspective, including the large quantities of energy required toremove water coupled with the high cost of energy; moving DDGSto diverse and distant markets when there are fluctuations in sup-ply and demand; how to avoid mycotoxin contamination;
Table 5Individual open responses to current issues limiting the value of coproducts(n = 14/23).
Responses
Customs or knowledgeDDGS industry is/has been black-eyed because of all the plant-to-plant
differencesFarmer educationFat solublesFiber contentFiber restricting use in poultry and swineFlowabilityIf sulfur could come down modified, customers could use higher substitution
ratesLack of research for some livestock speciesMarkets for products to capture true value of coproductsNeed to develop a system in which we can all understand or at least recognize
these differences and how they impact feed attributesOur plant does almost 95% wet distillers grainOversupplyReputation of consistent quality and education of feedersSupply vs. demandSwine useTransportation costs getting higherWe will be gasifying the DDG for steam production and electricity production
and the remainder to investor feeders
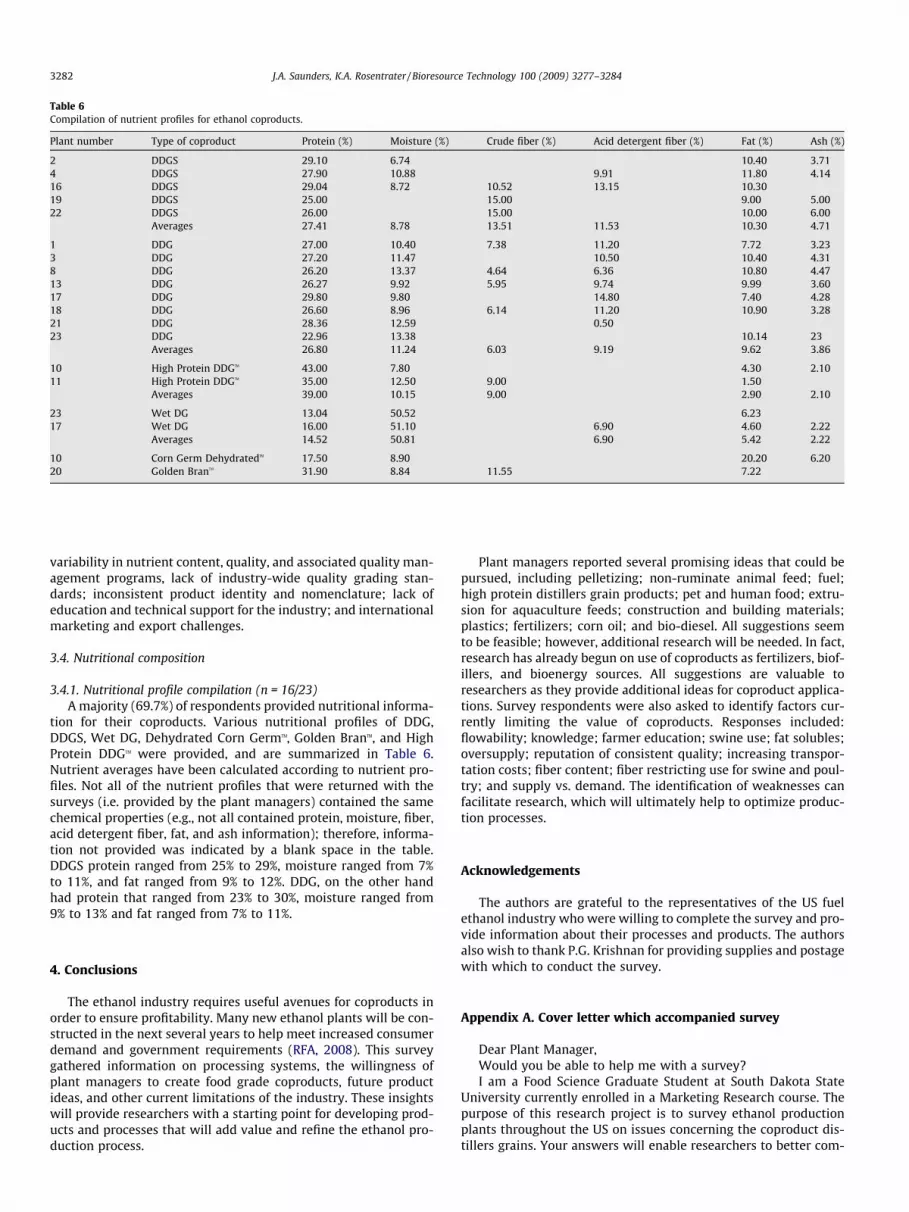
Table 6Compilation of nutrient profiles for ethanol coproducts.
Plant number Type of coproduct Protein (%) Moisture (%) Crude fiber (%) Acid detergent fiber (%) Fat (%) Ash (%)
2 DDGS 29.10 6.74 10.40 3.714 DDGS 27.90 10.88 9.91 11.80 4.1416 DDGS 29.04 8.72 10.52 13.15 10.3019 DDGS 25.00 15.00 9.00 5.0022 DDGS 26.00 15.00 10.00 6.00
Averages 27.41 8.78 13.51 11.53 10.30 4.71
1 DDG 27.00 10.40 7.38 11.20 7.72 3.233 DDG 27.20 11.47 10.50 10.40 4.318 DDG 26.20 13.37 4.64 6.36 10.80 4.4713 DDG 26.27 9.92 5.95 9.74 9.99 3.6017 DDG 29.80 9.80 14.80 7.40 4.2818 DDG 26.60 8.96 6.14 11.20 10.90 3.2821 DDG 28.36 12.59 0.5023 DDG 22.96 13.38 10.14 23
Averages 26.80 11.24 6.03 9.19 9.62 3.86
10 High Protein DDGTM 43.00 7.80 4.30 2.1011 High Protein DDGTM 35.00 12.50 9.00 1.50
Averages 39.00 10.15 9.00 2.90 2.10
23 Wet DG 13.04 50.52 6.2317 Wet DG 16.00 51.10 6.90 4.60 2.22
Averages 14.52 50.81 6.90 5.42 2.22
10 Corn Germ DehydratedTM 17.50 8.90 20.20 6.2020 Golden BranTM 31.90 8.84 11.55 7.22
3282 J.A. Saunders, K.A. Rosentrater / Bioresource Technology 100 (2009) 3277–3284
variability in nutrient content, quality, and associated quality man-agement programs, lack of industry-wide quality grading stan-dards; inconsistent product identity and nomenclature; lack ofeducation and technical support for the industry; and internationalmarketing and export challenges.
3.4. Nutritional composition
3.4.1. Nutritional profile compilation (n = 16/23)A majority (69.7%) of respondents provided nutritional informa-
tion for their coproducts. Various nutritional profiles of DDG,DDGS, Wet DG, Dehydrated Corn GermTM, Golden BranTM, and HighProtein DDGTM were provided, and are summarized in Table 6.Nutrient averages have been calculated according to nutrient pro-files. Not all of the nutrient profiles that were returned with thesurveys (i.e. provided by the plant managers) contained the samechemical properties (e.g., not all contained protein, moisture, fiber,acid detergent fiber, fat, and ash information); therefore, informa-tion not provided was indicated by a blank space in the table.DDGS protein ranged from 25% to 29%, moisture ranged from 7%to 11%, and fat ranged from 9% to 12%. DDG, on the other handhad protein that ranged from 23% to 30%, moisture ranged from9% to 13% and fat ranged from 7% to 11%.
4. Conclusions
The ethanol industry requires useful avenues for coproducts inorder to ensure profitability. Many new ethanol plants will be con-structed in the next several years to help meet increased consumerdemand and government requirements (RFA, 2008). This surveygathered information on processing systems, the willingness ofplant managers to create food grade coproducts, future productideas, and other current limitations of the industry. These insightswill provide researchers with a starting point for developing prod-ucts and processes that will add value and refine the ethanol pro-duction process.
Plant managers reported several promising ideas that could bepursued, including pelletizing; non-ruminate animal feed; fuel;high protein distillers grain products; pet and human food; extru-sion for aquaculture feeds; construction and building materials;plastics; fertilizers; corn oil; and bio-diesel. All suggestions seemto be feasible; however, additional research will be needed. In fact,research has already begun on use of coproducts as fertilizers, biof-illers, and bioenergy sources. All suggestions are valuable toresearchers as they provide additional ideas for coproduct applica-tions. Survey respondents were also asked to identify factors cur-rently limiting the value of coproducts. Responses included:flowability; knowledge; farmer education; swine use; fat solubles;oversupply; reputation of consistent quality; increasing transpor-tation costs; fiber content; fiber restricting use for swine and poul-try; and supply vs. demand. The identification of weaknesses canfacilitate research, which will ultimately help to optimize produc-tion processes.
Acknowledgements
The authors are grateful to the representatives of the US fuelethanol industry who were willing to complete the survey and pro-vide information about their processes and products. The authorsalso wish to thank P.G. Krishnan for providing supplies and postagewith which to conduct the survey.
Appendix A. Cover letter which accompanied survey
Dear Plant Manager,Would you be able to help me with a survey?I am a Food Science Graduate Student at South Dakota State
University currently enrolled in a Marketing Research course. Thepurpose of this research project is to survey ethanol productionplants throughout the US on issues concerning the coproduct dis-tillers grains. Your answers will enable researchers to better com-

J.A. Saunders, K.A. Rosentrater / Bioresource Technology 100 (2009) 3277–3284 3283
prehend the ethanol production process, this in turn can be used tohelp design more efficient methods for plants, and ultimately addmore value to the humble kernel of corn.
Your plant’s name was part of an inclusive list of ethanol plantsin the United States. Your answers are very important to the accu-racy of my research.
It will take only a few minutes to answer the simple questionson the enclosed questionnaire and to return it in the stamped replyenvelope.
Of course all answers will be confidential and will be usedonly in combination with all other returned questionnaireresults.
If you are interested in receiving a report on the findings of thisresearch, please write your name, address, or email address at thebottom of the questionnaire. I will be glad to send you a compli-mentary report when ready.
Please return the completed questionnaire by Monday, March26th 2007. Thank you for your help.
Appendix B. Survey instrument used to gather information
PROCESSING
1) Approximately how much distillers dried grains (DDG)/ distillers dried grains with solubles (DDGS) does your plant produce each year (in tons)? ______________________(please indicate)
2) What does your plant do with the DDG/DDGS produced? (please check all that apply) ____ Ship by rail ____ Local Animal Feed ____ Export ____ Other (please indicate)_______________________
3) What typical deviations do you find among DDG/DDGS batches? (please check all that apply)
____ There is little variation at my plant ____ Color (yellow, orange, browns, etc) ____ % Burned ____ Size of coproducts kernel ____ Quantity produced ____ Protein content ____ Moisture content ____ Soluble content ____ Other (please indicate)________________________
4) What type of DG dryer does your plant use? ____ Ring Dryer ____ Rotary Dryer ____ Flash Dryer ____ Fluidized Bed ____ Other (please indicate) _________________________
5) What is your plant’s typical drying time (in hours)? ______________ (please indicate)
6) What is your plant’s typical drying temperature (°C)? ______________ (please indicate)
7) Would your plant be willing to alter drying temperature to increase quality of DDG/DDGS ?
____ Yes ____ No ____ Other If Yes please indicate how much __________.
8) Would your plant be willing to alter drying time to increase quality of DDG/DDGS? ____ Yes ____ No ____ Other If Yes please indicate how much __________.
9) What type of storage does your plant currently use for DDG/DDGS? ____ Flat ____ Silo ____ Both ____ Other (please indicate)_____________________
10) How much time does your plant allow for curing time (cooling time) of DDG/DDGS (in days)? ________________ (please indicate)
POTENTIAL FOOD APPLICATIONS
11) Currently, is the DDG/DDGS produced by your plant of food grade quality (meaning it qualifies under government regulations for use in food products?
____ Yes ____ No ____ I’m not sure ____ Other
12) Would your plant be open to the idea of altering current manufacturing processes to create a food grade DDG/DDGS?
____ Our DG is already food grade ____ Yes ____ No If Yes, what changes would your plant be willing to make? ________________________
________________________________________________________________________
FUTURE RESEARCH
13) What potential product (food or non-food) applications would you like to see for DDG/DDGS? ________________________________________________________
________________________________________________________ (please specify)
14) What are the most important issues currently limiting the value and utilization of DDG/DDGS? _____________________________________________________
________________________________________(please indicate)
NUTRITIONAL
15) Please submit a typical nutritional profile for the DDG/DDGS produced by your plant on a separate sheet of paper.
Thank you for your participation. If you would like a copy of the final report utilizing these questionnaires results please provide the following information.
Name: Address: Email Address:
References
Al-Suwaiegh, S., Fanning, K.C., Grant, R.J., Milton, C.T., Klopfenstein, T.J., 2002.Utilization of distillers grains from the fermentation of sorghum or corn in dietsfor finishing beef and lactating dairy cattle. Journal of Animal Science 80 (4),1105–1111.
Belyea, R.L., Rausch, K.D., Tumbleson, M.E., 2004. Composition of corn and distillersdried grains with solubles from dry grind ethanol processing. BioresourceTechnology 94, 293–298.
Bertram, G.L., 1953. Studies on crust colour. I. The importance of the browningreaction in determining the crust colour of bread. Cereal Chemistry 30, 127–139.
Cooper, D.R., Schindler, P.S., 2003. Business Research Methods, eighth ed. McGraw-Hill, Irwin, Dubuque, IA. p. 342.
Davis, C.M., Hutjens, M., Berger, L., 1980. Should you consider distillers’ andbrewers’ byproducts? Hoards Dairyman 125 (7), 546–547.
Dawson, K.R., Newman, R.K., O’Palka, J.O., 1985. Effects of bleaching and defattingon barley distillers grains used in muffins. Cereal Research Communications 13(4), 387–391.
Erdem, N., Ok, S.S., 2002. Effect of brewery sludge amendments on some chemicalproperties of acid soil in pot experiments. Bioresource Technology 84, 271–273.
Miron, J., Yosef, E., Ben-Ghedalia, D., 2001. Composition and in vitro digestibility ofmonosaccharide constituents of selected byproduct feeds. Journal ofAgricultural and Food Chemistry 49 (5), 2322–2326.
NRC, 1982. United States – Canadian Tables of Feed Composition, third ed. NationalAcademy of Sciences, National Research Council, National Academy Press,Washington, DC.
NRC, 1998. Nutrient Requirements of Swine, 10th ed. National Academy of Sciences,National Research Council, National Academy Press, Washington, DC.
Ramana, S., Biswas, A.K., Kundu, S., Saha, J.K., Yadava, R.B.R., 2002a. Effect of distillereffluent on seed germination in some vegetable crops. Bioresource Technology82, 273–275.
Ramana, S., Biwas, A.K., Singh, A.B., 2002b. Effect of distillery effluents on somephysiological aspects in maize. Bioresource Technology 84, 295–297.
RFA, 2008. US Fuel Ethanol Industry Biorefineries and Production Capacity.Renewable Fuels Association, Washington, DC. <http://www.ethanolrfa.org/industry/locations/> (accessed 01.22.08.).
Rosentrater, K.A., 2007. Corn ethanol coproducts – some current constraints andpotential opportunities. International Sugar Journal 109 (1307), 1–12.
Rosentrater, K.A., Krishnan, P.G., 2006. Incorporating distillers grains in foodproducts. Cereal Foods World 51 (2), 52–60.

3284 J.A. Saunders, K.A. Rosentrater / Bioresource Technology 100 (2009) 3277–3284
Rosentrater, K.A., Hansen, C.L., Hall, H.R., 2006. Anaerobic digestion potential forethanol processing residues. Paper No. 066167. 2006 ASABE AnnualInternational Meeting, Portland, OR.
Saunders, J.A., Rosentrater, K.A., Krishnan, P.G., 2008. Potential bleaching techniquesfor corn distillers grains. Journal of Food Technology 6 (6), 242–252.
Spiehs, M.J., Whitney, M.H., Shurson, G.C., 2002. Nutrient database for distiller’sdried grains with solubles produced from new ethanol plants in Minnesota andSouth Dakota. Journal of Animal Science 80 (10), 2639–2645.
Tatara, R.A., Suraparaju, S., Rosentrater, K.A., 2007. Compression molding ofphenolic resin/corn-based DDGS blends. Journal of Polymers and theEnvironment 15 (2), 89–95.
Tatara, R.A., Rosentrater, K.A., Suraparaju, S., 2009. Design properties for molded,corn-based DDGS-filled phenolic resin composites. Industrial Crops andProducts 29 (1), 9–15.
UMN, 2007. The value and use of distillers dried grains with solubles (DDGS) inLivestock and Poultry Feeds. <http://www.ddgs.umn.edu> (accessed 01.22.08.).
Weller, C.L., Paulsen, M.R., Steinberg, M.P., 1987. Varietal, Harvest Moisture andDrying air Temperature Effects on quality factors affecting corn wet milling.Paper No. 87-6046. 1987 Summer Meeting of the American Society ofAgricultural Engineers, ASAE, St. Joseph, MI.
Wu, S., Myers, D.J., Johnson, L.A., 1997. Effects of maize hybrid and meal drying condi-tions on yield and quality of extracted zein. Cereal Chemistry 74 (3), 268–273.