platinum supported on nbru y o z as electrocatalyst for ethanol oxidation in acid and alkaline fuel...
TRANSCRIPT

rXXXX American Chemical Society A dx.doi.org/10.1021/jp109239c | J. Phys. Chem. C XXXX, XXX, 000–000
ARTICLE
pubs.acs.org/JPCC
Platinum Supported on NbRuyOz as Electrocatalyst for EthanolOxidation in Acid and Alkaline Fuel CellsDaniel A. Konopka,† Meng Li,‡ Kateryna Artyushkova,† Nebojsa Marinkovic,‡ Kotaro Sasaki,‡
Radoslav Adzic,‡ Timothy L. Ward,† and Plamen Atanassov*,†
†Chemical and Nuclear Engineering Department, University of New Mexico, Albuquerque, New Mexico 87131, United States‡Department of Chemistry, Brookhaven National Laboratory, Upton, New York 11973, United States
ABSTRACT: Platinum supported on a mixed metal oxide, NbRuyOz (8Nb:1Ru), wasevaluated as an electrocatalyst for the ethanol oxidation reaction (EOR) in 0.1 MHClO4 and 1MKOH. The support was synthesized from a liquid precursor solutionof metal chlorides that was aerosolized and thermally decomposed into a powder viathe spray pyrolysis (SP) process. Two samples were of primary interest: 30%Ptdeposited onto the support by dry impregnation and 60%Pt as part of the precursorsolution that underwent in situ SP Pt dispersion. TEM, SEM, and XRD were used toconfirmmorphology and deposition of Pt. XPS and XAS studies confirmed elementaldistribution and oxidation state of Pt catalyst. In situ IRRAS studies in 0.1 M HClO4
show that these electrocatalysts are capable of facilitating the complete oxidationpathway of EOR, involving scission of the C-C bond and CO oxidation.
1. INTRODUCTION
Ethanol has great potential for use as a fuel in polymerelectrolyte membrane fuel cells (PEMFC), with notable advan-tages over the most common alternatives, hydrogen and metha-nol. Established processes already exist in the United States andelsewhere for the attainment of ethanol from biorenewablesources.1 It has a relatively low toxicity compared to methanoland, unlike hydrogen, is easily stored as a liquid for stationary andmobile applications. The energy density is also attractive, at 8.1kWh/kg compared to 6.1 and 0.42 kWh/kg (including tankweight) for methanol and compressed hydrogen, respectively.2
The high energy density of ethanol can only be realized insidea fuel cell with complete oxidation of both carbon atoms, leading tothe formation of CO2. This requires that partially oxidized, double-carbon intermediate species remain bonded to the catalyst surfacelong enough for the scission of the C-C bond to occur. Conven-tional catalysts for PEMFCs include Pt/C and PtRu/C, but each ofthese electrocatalysts fail at achieving a high yield of CO or CO2.Much work has been spent designing Pt alloys, especially variationsof PtRu in which the ruthenium helps stabilize the Pt surface againstpoisoning by CO. However, this approach might not necessarily beconducive to C-C scission of multicarbon fuels.
Instead, efforts have been made toward the design of morecomplex, multicomponent materials, including mixed metaloxides.3 These have been investigated as supports or cocatalyststo enhance the ethanol oxidation activity of Pt. Variations ofPtSn/C catalysts have generally shown the highest reactionkinetics for EOR, but it remains unclear how effective such alloysare for the evolution of CO2. In any case, two primary ideas guidethe use of metal oxides as bifunctional catalysts. The first entailsan oxidation promotion cocatalytic effect, in which metal oxidesserve as an oxygen source in close proximity to noble metaladsorption sites, theoretically lowering the Ox diffusion energy
required to oxidize nearby intermediate species.4 In addition, useof metal oxides in multicomponent materials with or as supportsto noble catalyst nanoparticles can result in strong metal supportinteraction (SMSI).5-9 This involves electron exchange withintimate atomic neighbors, altering the d-electron state and,therefore, the adsorption potential of Pt surface atoms. Second-ary metal oxides can impose various strains that cause the Pt faceto deviate from the standard lattice structure spacing, modifyingthe local electron density at an adsorption site.10 Catalyticbehavior is also highly dependent upon the pH at the bindingsite surface, where metal and metal cations are subject tointeractions with the electrolyte. This affects both mechanismsof the bifunctional effect, where aqueous-based ligands occupyspace, provide oxygen, and alter the binding potential of themetal to additional adsorbates.11
Attempts have been made to incorporate niobium into mixedmetal oxide supports, primarily because of its stability againstcorrosion and also because of its potential as an oxygen promotioncocatalyst. In an aqueous electrolyte, Nb surface species always takethe form of an oxide, usually Nb(5),12,13 an electrically insulatingspecies. This is why it is usually necessary to include only smallamounts of niobia as a minor component dissolved into a moreconductivematerial. Themost common areTiNbxOy supports.
3,14,15
These often sacrifice surface area in favor of thermal treatmentsranging from 500 to 1000 �C to achieve crystalline products withreduced oxidation states, making them more conductive.
The design of a support material comprised primarily of niobiabecomes amore complex engineering problem. Platinum supportedon niobia has been used as a catalyst for various gas phase reactions,including the oxidation of CO and the dehydrogenation of much
Received: September 27, 2010Revised: January 6, 2011

B dx.doi.org/10.1021/jp109239c |J. Phys. Chem. C XXXX, XXX, 000–000
The Journal of Physical Chemistry C ARTICLE
larger organic molecules. Such catalysts typically involve loadings ofabout 2% Pt or less. At such small loadings, the catalytic activity canbe susceptible to a variety of conditions specific to a particularexperiment, making it difficult to infer generalizations about thebehavior of Pt/niobia.One commonobservation is the probability ofreduced NbOx subspecies existing on top of Pt nanoparticles,creating interfacial sites with unique catalytic behavior.5,16-19 Butbecause such subspecies are known to be unstable in aqueoussolutions, quickly oxidizing,20 it remains unclear how prevalentand impactful this effect would be on the behavior of Pt/niobiaelectrocatalysts with much higher loadings of 30-60% Pt.
Electrocatalysts containing niobia as a minor component havereceived recent attention for alcohol oxidation15,21 and oxygenreduction9,22 reactions. But the behavior of niobia as a primarycomponent supporting Pt for the electrocatalytic oxidation ofethanol has not been directly addressed. In this paper, we explorethe behavior of Pt/niobia using the NbRuyOz support describedelsewhere.23 Inclusion of a small amount of ruthenium (8Nb/1Ru) into a mesoporous, amorphous niobia matrix results in amore conductive material, making the support suitable forelectrochemical studies. Various methods of Pt deposition ontothis support are explored, as well as the EOR performance andrelative stability in acid and alkaline electrolyte.
2. EXPERIMENTAL SECTION
2.1. Synthesis. 2.1.1. Liquid Precursor Materials. H2PtCl6 3 6H2Oand NbCl5 powder were acquired from Sigma-Aldrich, RuCl3 fromFischer Scientific, and Pluronic-123 (nonionic triblock copolymer)from BASF. Ludox TM50 colloidal silica solution (aqueous, 20 nmsilica particles) was also obtained from Sigma-Aldrich.Pt-SP: 2.0 g of P123 block copolymer surfactant (BASF) were
dissolved in 22.0 g of ethanol (200 proof) by mixing for 30 min. Atotal of 1.1 g of NbCl5 was added to the solution and mixed untilthe solution changed from yellow to clear (5 min). To completelydissolve the rutheniumprecursor, it was necessary to firstmix 1.0 g ofH2O into the solution.Thiswas then followedby0.12 gofRuCl3 and1.2 g of H2PtCl6 3 6H2O. After stirring for 30 min, a black solutionwas obtained indicating that rutheniumwas well mixed into solution.Pt-DI: A similar process was followed, instead using 3.7 g of
NbCl5, 0.385 g of RuCl3, and 0 g of Pt precursor. All other stepsremained unchanged.Pt-TM: All conditions were identical to that of Pt-SP, except
that carbonaceous surfactant was not used. Instead, the materialwas templated with TM-50 silica spheres to achieve a highersurface area support.Pt-300 and Pt-650: The same conditions for Pt-SP were used
to achieve a sample with 6Pt/1Nb/1Ru/2O wt %. This samplewas then divided into halves. The two halves were separatelyheated to 300 and 650 �C for 3 h in 10% H2/N2.Pt-C: 30% platinum supported on XC-72 was obtained from
E-Tek and used as received.2.1.2. Spray Pyrolysis and Post-Treatment. All electrocatalyst
powders were synthesized using the spray pyrolysis apparatusdescribed elsewhere.23 The precursor solutions were forcedthrough an atomizer by a N2 carrier gas at 30 psi at a rate of1.5 SLM (standard liters per minute). This creates a stream ofliquid droplets suspended in the inert gas as an aerosol. Thestream was fed through a tube furnace at 220 �C, wherein dropletdehydration yielded particles. The particles underwent partialdecomposition of precursor metal chlorides into metal oxidesand were collected as a bulk powder on a porousmembrane filter.
Powders were collected from the filter and transferred to acrucible where they received varying post-treatments. Pt-DIreceived dropwise addition of 0.3 M H2SO4 until the entiretyof the powder was visually damp. Addition of excess acid solutionbefore postsynthesis thermal treatment was detrimental to theformation of a homogeneous, multicomponent matrix. Oncecompletely dry, the powder was placed inside a tube furnace with aflowing atmosphere of 10% H2/N2 and heated at a rate of 10 �C/min until reaching 400 �C where it was held for 4 h. During thistreatment, most of the P123 surfactant is thermally removed and theNbRuyOz particles reduced to a lower oxidation state. This alsoserved to activate the surface of Pt nanoparticles in samples initiallycontaining all three metals. Afterward, the mesoporous NbRuyOz
powder (Pt-DI) was placed inside a clear vial. A water/acetonesolution of H2PtCl6 3 6H2O was added dropwise. The powder wasallowed to dry completely between drops to facilitate penetrationinto the mesopores. Once a loading of 30 wt % Pt was achieved, thepowder was filter washed in H2O, and again placed in the furnaceand heated to 250 �C at a rate of 5 �C/min in 10%H2/N2 and heldfor 2 h to activate the Pt catalyst.Pt-SP and Pt-TM did not receive any dilute acid solution
before receiving the same heating treatment described for Pt-DI.After heating, Pt-TM was agitated in 5 M KOH solution for 4days to etch away the Si spheres. The sample was then filter-washed in H2O before drying in an oven at 70 �C overnight.2.2. Materials Characterization. 2.2.1. Surface Area Mea-
surements. A Quantachrome Autosorb-1 with N2 gas was usedto measure BET surface areas of all samples.2.2.2. SEM. Scanning electronmicroscopy (SEM) images were
acquired using a Hitachi S-5200 SEM equipped with EDS. Imagingdoes not require coating of nonconductive samples. Dry powderswere sparingly deposited onto the surface of conductive carbon tapeaffixed to a sample holder with two axes of tilt.2.2.3. TEM. High-resolution transmission electron micro-
graphs (TEM) were obtained on a JEOL 2010 running at 200kV. This microscope was equipped with an Oxford EDS unit.Small amounts of each sample were deposited as a dry powderonto a carbon film-backed copper TEM grid acquired from SPI.Grids were lightly air-blown to remove excess sample beforeentering the sample chamber.2.3. X-ray Studies. 2.3.1. XRD. Powdered samples were ana-
lyzed by X-ray diffraction (XRD) in the XRD Laboratory in theDepartment of Earth and Planetary Sciences at the University ofNew Mexico, using a Scintag Pad V diffractometer (Bragg-Brentano geometry) with DataScan 4 software (fromMDI, Inc.)for system automation and data collection. Cu KR radiation (40kV, 35 mA) was used with a Bicron Scintillation detector (with apyrolitic graphite curved crystal monochromator). Data wereanalyzed with Jade 8.0 Software (from MDI, Inc.) using theICDD (International Center for Diffraction Data) PDF4 data-base (rev. 2009) for phase identification.2.3.2. XPS. X-ray photoelectron spectroscopy (XPS) analysis
was performed on a Kratos Axis Ultra XPS with a monochro-matic Al KR source operated at 300 W. Au powder was includedwith each sample as a reference to account for shifts in peakbinding energies from their standard values due to charging. Dataanalysis and quantification was performed using CasaXPS soft-ware. A linear background subtraction was used for quantifica-tion of C1s and O 1s, and Shirley for quantification of Pt 4fspectra. Sensitivity factors provided by the manufacturer wereutilized. All the spectra were charge-referenced to Au 4f at 84 eV.A 70% Gaussian/30% Lorentzian line shape was used in the

C dx.doi.org/10.1021/jp109239c |J. Phys. Chem. C XXXX, XXX, 000–000
The Journal of Physical Chemistry C ARTICLE
curve-fit.We have chosen to use Ru 3d high (vs Ru 3p) resolutionspectra for discerning chemical speciation of Ru due to greaterRu 3d peak intensity and greater availability of reference in-formation. Even though C 1s and Ru 3d spectra are overlapped,calibrating spectra by Au 4f (and not C 1s) and constrainingseparation and intensity ratio between Ru 3d 5/2 to Ru 3d 3/2components allows accurate identification of species. The fol-lowing protocol has been employed for curve fitting: three peaksin Ru 3d 5/2 region (below 283 eV) were first included; threepeaks due to the same contributions into Ru 3d 3/2 regions wereconstrained at binding energy 4-4.2 eV higher than those in Ru3d 5/2, while area was constrained knowing the ratio of 3/2 to5/2 orbitals of Ru 3d; finally five peaks are used to curve fit therest of spectrum due to various carbon species, such as carbide,aliphatic carbon, and different types of C-O moieties.2.3.3. XAS. XASmeasurements were performed at Brookhaven
National Laboratory using beamline X18B at the NationalSynchrotron Light Source (NSLS). The powder samples wereuniformly spread on a Kapton tape and placed between incidentand transmission ion chambers for measurements in a transmis-sion mode. The absorption edges observed included Pt L3 at11564 eV, NbK at 18986 eV, and RuK at 22117 eV. Data analysiswas performed using Athena and Artemis software.2.4. Electrochemistry. 2.4.1. Cyclic Voltammetry and Ethanol
Oxidation. Cyclic voltammograms in Figures 11 and 13 wereacquired on a Pine model AFCBP1 potentiostat using a Pt gauzecounter electrode and Ag/AgCl and Hg/HgO reference electro-des. The potentials of these electrodes correspond toþ0.21 andþ0.92 V versus reversible hydrogen electrode (RHE) in 0.1 MHClO4 and 1 M KOH, respectively. In each case, a thin film ofcatalyst material was applied to a glassy carbon disk electrode andallowed to dry before testing in the electrochemical cell with80 mL of liquid electrolyte. Catalyst inks consisted of 1 mgcatalyst suspended in a mixture of 0.5 mL of DI water and 0.5 mLof isopropyl alcohol via mixing and sonication. For testing theethanol oxidation reaction, 200 proof ethyl alcohol was added tothe half cell using a pipet. The cell was then closed and allowed tocontinue purging with bubbling Ar gas for at least 5 min beforeproceeding.2.4.2. Infrared Reflection Adsorption Spectroscopy. In situ
Infrared Reflection Adsorption Spectroscopy (IRRAS) studieswere performed at room temperature with a Nicolet Nexus 670FT-IR spectrometer equipped with a MCT detector cooled withliquid nitrogen. An unpolarized light beamwas used. The spectralresolution was set to 8 cm-1 and 128 interferograms weretogether added to each spectrum. Spectra are given in absorbanceunits defined as A = -log(R/R0), where R and R0 represent thereflected IR intensities corresponding to the sample and refer-ence single beam spectrum, respectively. Following this defini-tion, a positive peak in the resulting spectrum represents aproduction of species, while a negative peak indicates a con-sumption of the reagent. The reference spectrumwas collected at0.05 V in the same solution with 0.1M ethanol and 0.1MHClO4.The working electrodes used in the IR study were prepared in asimilar way as that used in electrochemical tests. A total of 20 μLof ink was pipetted onto a polished gold electrode with adiameter of 8 mm to form a homogeneous catalyst layer. A ZnSehemisphere was used as the IR window, and the workingelectrodes used in this IR study, including 30%Pt/NbRuyOz
(Pt-DI) and 60%Pt/NbRuyOz (Pt-SP) electrocatalysts, werepressed against the IR window to create a thin solution layerwith a thickness of a few micrometers. The IR radiation from the
IR source passed through the ZnSe window with an incidentangle of 36�,24 passing through the thin solution layer, andreflecting off of the electrode surface. Pure Ar and dry air wereused to purge the electrolyte and spectrometer, respectively,reducing the spectral interference from CO2 as well as ambientwater vapor. All potentials given in this paper are relative to thereversible hydrogen electrode (RHE).2.4.3. Pt-Monolayer Deposition. Additional platinum was
deposited onto Pt-DI on a glassy carbon electrode in the absenceof atmospheric oxygen using the cation-adsorption-reduction-galvanic-displacement method25 inside a chamber purged withargon, described elsewhere.26 The electrode was immersed in asolution containingPb2þ stabilized at pH∼ 11. In this environment,Pb2þ cations only adsorb onto metallic or slightly oxidized surfaces,limited to existing Pt orRu/RuOx sites, while deposition onto niobiadoes not occur. The electrode was then immersed in a fresh, lead-free solution where previously adsorbed Pb2þ atoms were poten-tiostatically reduced to Pb0. The electrode was immersed in a thirdsolution containing Pt2þ, wherein Pb0 atoms were displaced by Ptatoms. The process is relatively fast and is self-terminating atapproximately one monolayer of coverage. The overall effect isthe restoration of the original Pt surface area free of any surfacedeactivating species related to the presence of oxygen. This sample,after a monolayer equivalent amount of Pt has been deposited, isreferred to as Pt-ML.
3. RESULTS AND DISCUSSION
3.1. Verification of Pt with ElectronMicroscopy. 3.1.1. 30%Pt/NbRuyOz (Pt-DI). SEM imaging was used to visually identifythe successful deposition of Pt nanoparticles on the NbRuyOz
support (Figure 1). The collection of secondary electrons (SE)shows a topographical image of the spherical support morphol-ogy and verifies the polydisperse nature of the powder, withparticle diameters ranging from 50 nm to 4 μm. A backscatteredelectron (BSE) detector is used to distinguish metals of differentatomic number. The brighter areas in Figure 1B,D represent theheavier element, Pt. A range of Pt particle sizes are visible, from 5nm nanoparticles (lower resolution limits of the microscope) to200 nm nanoparticle clusters.Pt nanoparticles 5-15 nm are visible on NbRuyOz particles of
size∼500 nm or less in diameter using TEM (Figure 1E). Largerniobia particles may also have these smaller Pt particles on theirsurfaces and inside of their pores, but particle depth and weakercontrast between Nb/Ru and Pt (all large in mass) obscure theirvisibility. Overall penetration of Pt into the mesopores is difficultto assess. However, EDS measurements confirm a Pt loading of30%, as well as the expected stoichiometry of the NbRuyOz
support (8Nb/1Ru), and the removal of chlorine. The surfacearea decreases from 167m2/g to 70 m2/g after the addition of Pt.3.1.2. 60%Pt/NbRuyOz (Pt-SP). TEM images verify the formation
of Pt nanoparticles from the NbRuyOz support (Figure 2). Im-mediately after spray pyrolysis, Pt nanoparticles of∼2 nm decoratethe support particles, while much of the Pt remains within theparticle bulk.The bottom SEM image in Figure 2 shows an instance of a
much larger support particle (∼1 μm or greater) with Pt nano-particles decorating the surface. Unlike the impregnated sample,there are no visible Pt nanoparticles greater than ∼20 nm(confirmed in TEM). The rough, visually distinct surface in thismicrograph is suggestive of the support’s mesoporous structuresimilar to that observed for other high surface area samples.

D dx.doi.org/10.1021/jp109239c |J. Phys. Chem. C XXXX, XXX, 000–000
The Journal of Physical Chemistry C ARTICLE
However, the BET surface area is reduced to 6 m2/g. This couldindicate that the mesopores of the support are largely obstructedby Pt nanoparticles.Overall, the formation of Pt nanoparticles using an inSitu SP
approach appears to yield much better Pt dispersion on NbRuyOz.The impregnated sample has much larger nanoparticles, whichimplies a greater ratio of bulk to surface Pt atoms and fewer in directcontact or within immediate proximity of the NbRuyOz support.3.2. X-ray Studies. 3.2.1. XRD of Pt Phase. The temperature
range to which Pt-SP and Pt-DI were exposed during synthesiswas 25-400 �C. This is 100 �C or more below the crystallizationtemperature of niobia, whereas platinum and any unabsorbedruthenium exhibit crystalline phases due to higher volatilities.6
Therefore, X-ray diffraction can reliably monitor the formation ofcrystalline catalyst phases within this temperature range withoutinterference from the support. XRD measurements were made
after each step in the synthesis process. Figure 3A shows that theNbRuyOz support is mostly amorphous immediately after spraypyrolysis. After acid-wet and thermal post-treatments someresidual features are present, possibly resulting from the forma-tion of hydrous and carbonaceous species from solution and thedecomposition of surfactant, respectively (B). We previouslyshowed that hydrous ruthenium can form quite easily.27 Thesefeatures disappear after Pt impregnation, shown for Pt-DI (C).This is likely because of the thorough filter-washing process.Sharp platinum reflections are evident due to the larger nano-particles observed in SEM. In each step, there is also evidence of aweakly resolved range of reflections possibly attributable toRuO2, RuO4, and RuCO4. This could suggest that any RuO2
or PtRu phases formed are small enough in size to be below thelimits of the detector, while most of the ruthenium remainswithin the niobia matrix as a homogeneous material.
Figure 1. SEM images showing large platinum nanoparticles in Pt-DI utilizing secondary electron (A,C) and backscattered electron (B,D) detectors.(E) TEM image of a particle showing some visible catalyst penetration into the mesoporous support interior. Overall, a range of Pt particle sizes arevisible, from 5 nm nanoparticles to 200 nm nanoparticles/clusters.

E dx.doi.org/10.1021/jp109239c |J. Phys. Chem. C XXXX, XXX, 000–000
The Journal of Physical Chemistry C ARTICLE
Two patterns are shown for the Pt-SP sample in Figure 4,taken after spray pyrolysis (A) and again after thermal reduction(B). Though this sample contains twice the amount of platinumdeposited on Pt-DI, the reflections are broader. This is consistent
with the smaller diameters of Pt nanoparticles observed in TEMand SEM. After thermal treatment, the reflections increase insharpness only slightly, while the residual peaks from 20�-35�become less coherent. The powder remains highly amorphous.3.2.2. XPS Speciation. XPS provides elemental and chemical
information from the sample’s surface to approximately 10 nmdepth. Taking into account the small size of Pt nanoparticles onour samples, XPS is likely yielding information about the surface aswell as the bulk composition. Table 1 shows the elementalcompositions of Pt-DI and Pt-SP. Approximately 15% of C ispresent in both samples as adventitious contamination as well asfrom use of ethanol as solvent during synthesis. Pt-SP has almosttwice asmuch Pt as the Pt-DI sample. A total of 30-35%niobium isdetected in both samples.The ability to discriminate between different chemical envi-
ronments, in addition to obtaining elemental compositions, isone of the primary advantages of XPS in the characterization ofheterogeneous catalysts. Figure 5 shows Ru 3d/C 1s and Pt 4fhigh resolution spectra from two samples and Table 2 showscorresponding spectral curve fit results. The Nb 3d spectrum(not shown) showed one symmetrical peak for both samples atbinding energy specific to Nb2O5.The Ru spectrum is overlapped with that of C 1s. A curve fit of
the Ru spectrum is discussed in details in the Experimental Section.Three peaks detected in Ru are due to RuO2 and organometallic Ru(denoted as Ru-OM in Table 2) in a Ru-(CxHy)z type of environ-ment. Slightly more RuO2 is present in the 30%Pt sample. Fivepeaks are used to curve fit the rest of the spectrum due to variouscarbon species, such as carbide, aliphatic carbon, and different typesof C-O moieties. There is slightly less carbide and more aliphaticcarbon for Pt-SP.Pt 4f spectra of both samples are very similar. Virtually iden-
tical speciation is detected. Approximately 60% of total Pt ismetallic, 30% as PtO and 10% as hydroxide. This distribution of
Figure 2. (A) TEM image of 60%Pt/NbRuyOz immediately after spraypyrolysis. The inset shows the presence of Pt nanoparticles 2 nm indiameter. (B) SEM image of the same material after post-treatment,showing come catalyst clustering on the porous support surface.
Figure 3. Pt-DI: (A) The NbRuyOz support is mostly amorphous afterspray pyrolysis. (B) There is some increase in ordered structure afterpost-treatment, possibly due to uptake of moisture/carbon species in theform of RuO2 (triangle), RuO4 (square), and RuCO4 (star). Thesefeatures mostly disappear after dry impregnation of Pt. (C) Pt peaks(circle) are distinct due to larger nanoparticles visible in SEM, shown onthe next slide.
Figure 4. Pt-SP: (A) Broad Pt peaks are visible and indicative ofnanoparticles in the amorphous niobia matrix after spray pyrolysis.(B) After calcination at 400 �C for 4hrs in 10%H2/N2. Both (A) and (B)show a range of low intensity peaks from 20 to 35 (2θ) associated withRuOx at various oxidations states and possibly also PtOx species.
Table 1. XPS Elemental Composition (wt %)
sample C 1s% Nb 3d % Ru 3d % Pt 4f % O 1s %
Pt-DI 13.0 36.3 5.8 18.6 26.2
Pt-SP 16.8 31.5 2.0 29.5 20.2

F dx.doi.org/10.1021/jp109239c |J. Phys. Chem. C XXXX, XXX, 000–000
The Journal of Physical Chemistry C ARTICLE
Pt types is very similar to that of Pt on XC72R.28 Guerrero et.al.18
showed that ∼40% of the platinum (nanoparticles) on niobia ismaintained as Pt2þ in a reducing atmosphere at high temperaturesnormally sufficient for Pt reduction to a metallic state. Interestingly,Ru, Pt and Nb are very similar for both samples, independent fromcarbon, which varies greatly between the two samples.3.2.3. XAS. Figure 6 shows XANES spectra of the Pt L3 edge
from nanoparticles prepared by dry impregnation using liquidprecursor (see section 2.1) and spray pyrolysis methods, togetherwith that from a Pt reference foil. It is interesting to note that thespray pyrolysis method produces a smaller white line than that ofthe Pt foil. The intensity of the white line is inversely propor-tional to the d-band occupancy. This result indicates that theelectron population in platinum of Pt-SP is higher than that of Ptbulk. One plausible explanation is that this may be due to defectsin NbRuyOz surface resulting in oxygen vacancies. It is knownthat in some oxides electrons are trapped inside the oxygenvacancies on the surface. Thus, they can donate electrons to Pt ifit is deposited on top of the oxygen vacancy.The lower white line observed for the spray pyrolysis method
suggests a decrease in Pt d-band vacancies, thereby leading to thehigher d-band center.29 As a consequence, molecule adsorptionon the Pt surface can be strengthened. Onemay consider that thesuppressed ethanol oxidation activity at potentials above 0.7 Vobserved for Pt on NbRuyOz substrates synthesized by spraypyrolysis is caused by poisoning due to the strong adsorption ofintermediates on the Pt surfaces.Figure 7 depicts Fourier transformed EXAFS spectra of the Pt
L3 edge from Pt nanoparticles prepared by dry impregnation
(Figure 7a), and spray pyrolysis (Figure 7b) methods. Theshoulder around 2 Å comes from oxygen contribution, so thatthe fitting was performed based on Pt-Pt and Pt-O paths. Thepresence of Pt-O bonds can be explained by formation due tothe surface oxidation of Pt deposits in air and/or oxygen fromNbRuyOz in which the Pt deposits are embedded. The coordina-tion numbers obtained from the fittings are 7.4 ( 1.2 for the
Figure 5. XPS Spectra of (A) Ru 3d/C 1s and (B) Pt 4f for Pt-DI, and (C) Ru 3d/C 1s and (D) Pt 4f for Pt-SP.
Table 2. Relative Elemental Moieties (at%)
sample carbide C-C C-O CdO COOH RuO2 Ru-OM Pt PtO Pt(OH)2 Nb2O5
BE, eV 284.4 285.1 286.2 287.3 288.9 280.5 281.5 282.8 71.3 72.0 73.1 207.4
Pt-DI 40.6 34.4 16.0 3.1 5.9 68.8 19.4 11.7 58.6 30.3 11.2 100.0
Pt-SP 27.8 41.2 19.6 6.5 4.8 58.2 26.2 15.6 58.4 28.2 13.3 100.0
Figure 6. XANES spectra of Pt L3 edge from Pt/NbRuyOz nanopar-ticles prepared by the dry impregnation from liquid precursor (blue) andspray pyrolysis (green) methods, together with that from a Pt referencefoil (red).

G dx.doi.org/10.1021/jp109239c |J. Phys. Chem. C XXXX, XXX, 000–000
The Journal of Physical Chemistry C ARTICLE
spray pyrolysis method and 10.2( 1.2 for the dry impregnationmethod; based on these coordination numbers we estimate thatthe average diameter of the Pt deposits by the spray pyrolysismethod is smaller (ca. 2 nm) than that of the dry impregnationmethod (ca. 4.5 nm).Figure 8 shows XANES spectra of the Nb K edge (Figure 8a)
and Ru K edge (Figure 8b) from the nanoparticles prepared bydry impregnation and spray pyrolysis methods, together withthose from respective reference foils. The XANES spectra of NbK edge (Figure 8a) are independent of the preparation methodsas both catalysts show almost identical spectra, indicating that theNb state remains Nb2O5. The XANES spectra of the Ru K edge(Figure 8b) for both catalysts are nearly identical and indicate anonmetallic state. This suggests that ruthenium is stable withinthe niobia matrix regardless of the depositionmethod and relatedpost-treatments of Pt catalyst.3.3. Electrochemical Surface Studies. 3.3.1. IRRAS. To identify
ethanol oxidation reaction (EOR) intermediates and products onniobia-supported platinum electrocatalysts, in situ IRRAS studieswere conducted on Pt-DI and Pt-SP. The recorded spectra on bothcatalysts are shown in Figure 9 and the frequencies and bandassignments are listed in Table 3. The IR spectra from these two
catalysts suggest ethanol undergoes both total oxidation and partialoxidation pathways. Carbon dioxide (CO2), acetic acid (CH3CO-OH), and acetaldehyde (CH3CHO) are the main EOR products.The positive-going peak near 2343 cm-1 is attributed to the asym-metric stretch vibration of CO2. This is the product of the ethanoltotal oxidation pathway and appears above 0.4 V on both catalysts.The band located around 1705 cm-1 can be assigned to the stretchvibration of the CdO bond, found in both acetaldehyde and aceticacid. Both spectra show the C-O stretching vibration of acetic acidat 1280 cm-1, indicating the formation ofCH3COOH.Thebands at1350 cm-1 and around 1396-1410 cm-1 are assigned to CH3 in-plane bending mode and OCO stretching of adsorbed acetate, res-pectively. The signals of these two bands are relatively weak, which isprobably due to a low product concentration. The band observed at933 cm-1 is assigned to C-C-O asymmetric stretching of acetal-dehyde. The strong band at 1598 cm-1 is the H-O-H deforma-tion of adsorbed water molecules. The CdO stretching mode ofadsorbed acetaldehyde and acetyl around 1620-1635 cm-1 cannotbe resolved because of the presence of the strong water band. TheC-H wagging vibration in CH3CHO at 1108 cm-1 overlaps withthe strong band at 1110 cm-1 from ClO4
-. The strong band for
Figure 7. (a) Fourier-transformed EXAFS spectra of Pt L3 edge fromPt/NbRuyOz nanoparticles prepared by spray pyrolysis method (blue),together with a fitted line (red) based on Pt-Pt and Pt-O paths. (b)Fourier-transformed EXAFS spectra of Pt L3 edge from Pt/NbRuyOz
nanoparticles prepared by the dry impregnation method (blue),together with a fitted line (red) based on Pt-Pt and Pt-O paths.
Figure 8. (a) XANES spectra of Nb K edge from Pt/NbRuyOz
nanoparticles prepared by the spray pyrolysis (blue) and dry impregna-tion from liquid precursor (green) methods, together with that from Nbreference foil (red). (b) XANES spectra of Ru K edge from Pt/NbRuyOz
nanoparticles prepared by the spray pyrolysis (blue) and dry impregna-tion from liquid precursor (green) methods, together with that from Rureference foil (red).

H dx.doi.org/10.1021/jp109239c |J. Phys. Chem. C XXXX, XXX, 000–000
The Journal of Physical Chemistry C ARTICLE
ClO4- ions is the consequence of its accumulation in the thin layer
cell to compensate for the increasingly positive electrode potential.Onemajor difference between these two spectra is the positive-going
band in 2030 cm-1, which is present in the spectra from Pt-DI butabsent from that of Pt-SP. The band is assigned to IR absorption bylinearly adsorbed CO, produced by dissociative adsorption ofethanol on the catalyst surface.Figure 10 shows the variation of band intensities of CO2
(2343 cm-1), CdO (1705 cm-1), and CO (2030 cm-1) againstthe applied potentials for both Pt-DI and Pt-SP samples. On bothcatalysts, the amount of total oxidation product, indicated by ICO2,and the amount of partial oxidation products, represented by ICdO,kept increasing with applied potential. From Figure 10a we can seeCOL intensity is increasing simultaneously with CO2 band intensity,indicating that theCOL formation rate is slower than its removal rate.
Figure 9. In situ IRRAS spectra recorded during ethanol oxidation on(A) 30%Pt/NbRuyOz (Pt-DI) and (B) 60%Pt/NbRuyOz (Pt-SP).
Table 3. In Situ IRRAS Spectra Band Assignments
wavenumber/cm-1 assignment
2343 CO2 asymmetric stretching42
2030 CO linear adsorption42
1705 CdO stretching of CH3CHO and CH3COOH
in solution42-44
∼1598 H-O-H deformation of adsorbed water45
1396-1410 O-C-O stretching of adsorbed acetate42,46,47
∼1350 CH3 in plane bending of adsorbed acetate48
1280 C-O stretching of CH3COOH in solution42,49,50
1368, 1108 CH3 symmetric deformation and C-H wagging
in CH3CHO51-53
1110 ClO4-
933 C-C-O asymmetric stretching54
Figure 10. IR band intensities of CO2, CdO, and COL during ethanoloxidation at different electrode potentials (data from Figure 9): (A) Pt-DI and (B) Pt-SP. (C) The ratio of CO2 band intensity to CdO bandintensity versus applied potentials.
I dx.doi.org/10.1021/jp109239c |J. Phys. Chem. C XXXX, XXX, 000–000
The Journal of Physical Chemistry C ARTICLE
On Pt-SP, COL formation was not obvious, which may suggest ahigher capability for CO removal. The oxide support could supplyoxygen containing species to oxidize blocking intermediate CO andpromote EOR based on the bifunctional effect. The interactionbetweenPt nanoparticles andniobia support could alter the electronicstructure of platinum and affect the reaction pathway according to theelectronic effect. Therefore, the difference might be the consequenceof a larger quantity of Pt-NbOx interfaces and a stronger synergisticeffect between Pt and NbRuyOz support in Pt-SP.One major challenge in ethanol electrocatalysis is the breaking
of the C-C bond to oxidize ethanol to CO2. To better comparethe selectivity of these two catalysts, we plotted the ratio betweenband intensity of CO2 (ICO2) and band intensity of CdO(ICdO) versus applied potential, and the results are shown inFigure 10. In the entire potential region, Pt-SP showed a higher(ICO2/ICdO) value than Pt-DI, indicating a stronger capabilityto split C-C bond in ethanol molecules and promote the totaloxidation pathway.The IR results suggest that there are parallel pathways of EOR
on both catalysts, while Pt-SP showed higher selectivity towardethanol total oxidation compared with Pt-DI. This could beexplained by a stronger synergy between Pt and NbRuyOz
support in Pt-SP.3.3.2. Reaction Kinetics. Mesoporous NbRuyOz as a support
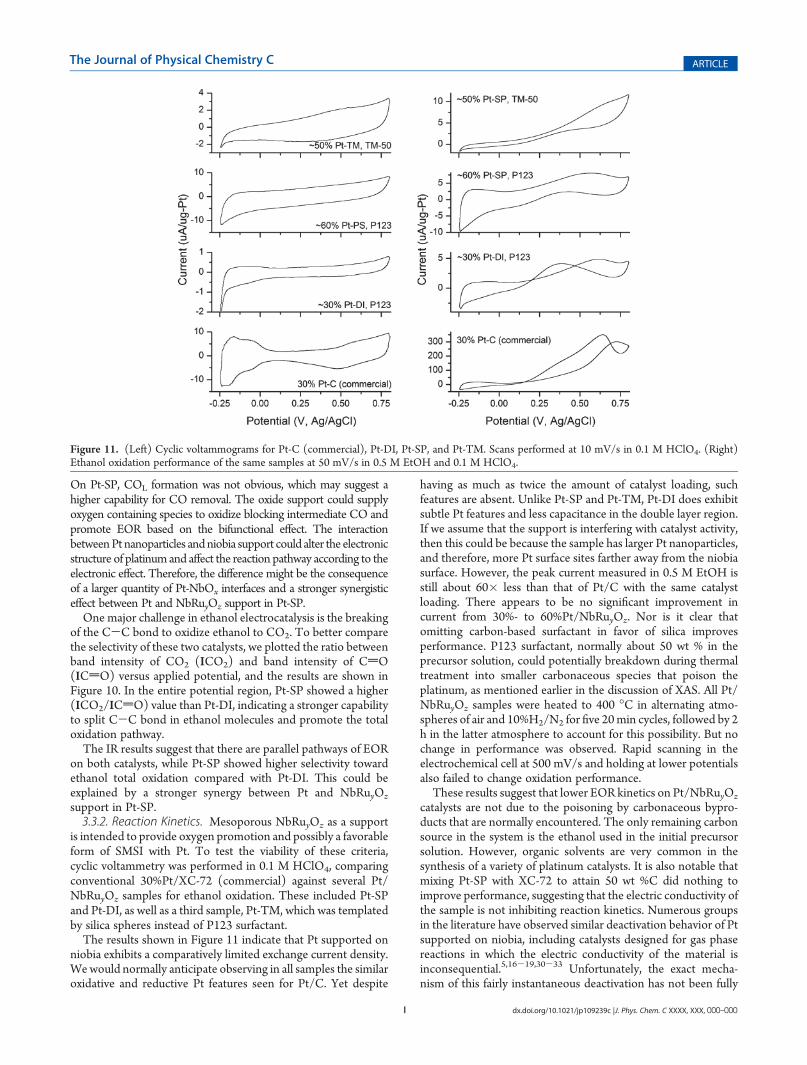
is intended to provide oxygen promotion and possibly a favorableform of SMSI with Pt. To test the viability of these criteria,cyclic voltammetry was performed in 0.1 M HClO4, comparingconventional 30%Pt/XC-72 (commercial) against several Pt/NbRuyOz samples for ethanol oxidation. These included Pt-SPand Pt-DI, as well as a third sample, Pt-TM, which was templatedby silica spheres instead of P123 surfactant.The results shown in Figure 11 indicate that Pt supported on
niobia exhibits a comparatively limited exchange current density.Wewould normally anticipate observing in all samples the similaroxidative and reductive Pt features seen for Pt/C. Yet despite
having as much as twice the amount of catalyst loading, suchfeatures are absent. Unlike Pt-SP and Pt-TM, Pt-DI does exhibitsubtle Pt features and less capacitance in the double layer region.If we assume that the support is interfering with catalyst activity,then this could be because the sample has larger Pt nanoparticles,and therefore, more Pt surface sites farther away from the niobiasurface. However, the peak current measured in 0.5 M EtOH isstill about 60� less than that of Pt/C with the same catalystloading. There appears to be no significant improvement incurrent from 30%- to 60%Pt/NbRuyOz. Nor is it clear thatomitting carbon-based surfactant in favor of silica improvesperformance. P123 surfactant, normally about 50 wt % in theprecursor solution, could potentially breakdown during thermaltreatment into smaller carbonaceous species that poison theplatinum, as mentioned earlier in the discussion of XAS. All Pt/NbRuyOz samples were heated to 400 �C in alternating atmo-spheres of air and 10%H2/N2 for five 20min cycles, followed by 2h in the latter atmosphere to account for this possibility. But nochange in performance was observed. Rapid scanning in theelectrochemical cell at 500 mV/s and holding at lower potentialsalso failed to change oxidation performance.These results suggest that lower EOR kinetics on Pt/NbRuyOz
catalysts are not due to the poisoning by carbonaceous bypro-ducts that are normally encountered. The only remaining carbonsource in the system is the ethanol used in the initial precursorsolution. However, organic solvents are very common in thesynthesis of a variety of platinum catalysts. It is also notable thatmixing Pt-SP with XC-72 to attain 50 wt %C did nothing toimprove performance, suggesting that the electric conductivity ofthe sample is not inhibiting reaction kinetics. Numerous groupsin the literature have observed similar deactivation behavior of Ptsupported on niobia, including catalysts designed for gas phasereactions in which the electric conductivity of the material isinconsequential.5,16-19,30-33 Unfortunately, the exact mecha-nism of this fairly instantaneous deactivation has not been fully
Figure 11. (Left) Cyclic voltammograms for Pt-C (commercial), Pt-DI, Pt-SP, and Pt-TM. Scans performed at 10 mV/s in 0.1 M HClO4. (Right)Ethanol oxidation performance of the same samples at 50 mV/s in 0.5 M EtOH and 0.1 M HClO4.

J dx.doi.org/10.1021/jp109239c |J. Phys. Chem. C XXXX, XXX, 000–000
The Journal of Physical Chemistry C ARTICLE
revealed, though theories have been put forth. The deactivation ismost likely related to the native oxide layer niobium formsregardless of the oxidation state of the bulk. The thickness ofthis layer is usually reported to be on the order of <1 to 6 nm,13,34
though this can vary significantly for niobium in various liquidelectrolyte.32 It is not immediately clear how an oxide layer of thistype would fully deactivate Pt nanoparticles 2-20 nm or more indiameter, especially after the reducing treatments employedabove. Studies on this topic utilizing chronopotentiostatic mea-surements and ex situ electron microscopy are currently inprogress.3.3.3. Pt-Monolayer Deposition on Pt-DI. Electrochemical
experiments were performed in 0.1 M HClO4 as well as 1 MKOH, a fresh electrode prepared for each. Before ethanol wasadded, some Pt features were visible in both aqueous media.Distinct oxidation regions generally appear to be more apparentin alkaline media. Changes are noticeable in the cyclic voltam-mograms after cationic deposition of Pt on Pt-DI (Figure 12A,Cand Table 4). In acid, the total charge density of the CV decreases
by 33%. Surface features of Pt hydride formation and oxidation(0-0.25 mV) as well as Pt-O reduction (1-0.5 V) remaincharacteristically broad even after deposition of additional Pt.This observation remains true at scan rates of 50 mV/s. In base,these features are immediately more distinct. Here, the overalldecrease in total charge density is only 7%, with most of the lossfrom the double layer region.Ethanol oxidation (0.5 M) studies reveal further differences in
the improvement of collected current. In particular, it is useful toexamine the changes in EOR performance before and after ionicPt deposition of forward (oxidizing) and reverse (reducing)sweeps independently of one another. Normally, it is preferableto compare the current of different catalysts at the same potential.In this study, attention is also given to shifts in the potential atwhich maximum EOR current is observed. Positive shifts areindicative of the reaction thermodynamics more similar to that ofa clean Pt surface.Characteristics of the data in Figure 12 are presented in
Table 4. There is a significant increase of 171 and 147% in the
Figure 12. Cyclic voltammograms of Pt-DI before and after secondary Pt-monolayer deposition: (A) 50mV/s in 1MKOH; (B) 10 mV/s in 1MKOHand 0.5 M EtOH; (C) 10 mV/s in 0.1 M HClO4; (D) 10 mV/s in 0.1 M HClO4 and 0.5 M EtOH.
Table 4. Ethanol (0.5 M) Oxidation Peak Properties (CV) before and after Secondary Pt Deposition on Pt-DI
forward sweep reverse sweep
sweep area (μC/cm2) peak center (V) max current (mA/cm2) sweep area (μC/cm2) peak center (V) max current (mA/cm2)
acid 30% Pt 0.168 0.744 0.378 0.173 0.603 0.417
32% Pt 0.374 0.728 1.027 0.350 0.625 1.030
Δ 121.9% -0.016 171.4% 102.2% 0.022 147.2%
base 30% Pt 0.170 0.638 0.538 0.097 0.587 0.316
32% Pt 0.214 0.615 0.661 0.108 0.586 0.324
Δ 26.5% -0.023 22.9% 11.5% -0.002 2.4%

K dx.doi.org/10.1021/jp109239c |J. Phys. Chem. C XXXX, XXX, 000–000
The Journal of Physical Chemistry C ARTICLE
total charge for EOR in acid of forward and reverse sweeps,respectively. In base, the total charge of the forward sweepimproves by a more modest 23%, while the change of the reversesweep is nearly negligible at 2.4%. In fact, the reverse peakdistinguishes itself by changing remarkably little. While theposition of peak centers of the forward sweeps in both mediadecreased by about 20 mV, and the peak center of the reversesweep increased by about the same amount, the behavior of thereverse sweep in base remains unaltered. This could indicate thatthe oxidizing sweep to higher potentials creates conditions thatlimit the Pt surface, possibly related to minor destabilization ofthe niobia support. This would be consistent with the observa-tion that overall improvement is significantly better in the lessoxidizing environment of 0.1 M HClO4. It also appears that Pt,which is both deposited and electrochemically tested in anenvironment purged of oxygen, can continuously recover Ptsurface sites at the lowest potentials of the cycle. Ultimately, theseresults also suggest that the presence of oxygen has a negativeimpact on the electrocatalytic activity of Pt/niobia. Although,because the electrode is still exposed to aqueous solution, theseresults are still subject to passivation reactions involving thedecomposition of H3O/H2O to form Nb-Ox or related species.3.3.4. Support Crystallization. To test the hypothesis of Pt
surface inhibition from instability of niobia in highly oxidizingenvironments, a fresh sample was prepared consisting of Ptnanoparticles (60%) in an amorphous matrix of 10% Nb, 10%Ru, and 20% O. A lower weight percent of niobium was used forseveral reasons. The suppression of H2 and OH activity ofplatinum supported on niobia has been shown to be quitedramatic, even for gas phase reactions, necessitating the use ofhigher ratios of catalyst to support to affect observable differencesin catalytic behavior. In addition, most studies in the literatureinvolving niobia as part of an electrocatalyst have employedthe metal oxide as a minor component.5,14,15 This is largelybecause of its relatively poor electric conductivity as Nb(V) andthe difficulty in maintaining the surface in a more greatly reducedphase in the presence of oxygen.12,23
Each plot in Figure 13 shows three sets of cyclic voltammo-grams. These include performance of the powder immediatelyafter spray pyrolysis and after thermal reduction at temperaturesof 300 (Pt-300) and 650 �C (Pt-650) in 10% H2/N2. The firstreduction at 300 �C is hot enough to thermally decompose anyremaining precursor complexes and activate the platinum. Thesecond reduction occurs roughly 100 �C higher than the crystal-lization temperature of niobia. While some limited sintering of Ptnanoparticles likely occurs, the primary difference between thesesamples is the crystalline niobia phase. The results are summa-rized in Table 5.After support crystallization, there is a substantial decrease of
74% in the total charge density of the voltammogram in acidmedia, nearly twice that of the same decrease in base. In acid, thetotal area of the forward sweep as well as the EOR peak center donot change even though the maximum current increases by 29%.This correlates with a proportional decrease in the hydrogenregion. The maximum current of the reverse sweep increases by79% and is roughly equal to the intensity of the forward sweep.Prior to support crystallization, this was not the case. Again, thiscould indicate that the support and related passivation reactionsare more greatly stabilized as a crystalline phase and interfere lesswith the Pt surface at or near potentials within the oxygen region.We see further suggestion of this behavior in base electrolyte,
in which there was a comparatively dramatic increase in totalcharge of forward and reverse sweeps of 145 and 169%, respec-tively. The peak centers of both sweeps shift 20-30 mV towardmore positive potentials. The dramatic improvement of mea-sured current in base compared to acid enforces the idea ofinhibited surface sites of Pt supported by niobia in the presenceof oxygen. Crystallization of the niobia support appears to greatlyenhance the availability of active Pt sites.This analysis assumes that Pt nanoparticles remain relatively
stable during the crystallization of niobia at 650 �C for 3 h. Thesintering behavior of Pt depends upon the nature of thesupport.14,35 It has also been shown that heating in an oxidizingatmosphere more greatly facilitates sintering on both carbon and
Figure 13. Cyclic voltammograms of Pt/NbRuyOz (wt % 60:10:10:20) after different heat treatments including immediately after spray pyrolysisheating to 300 and 650 �C in 10%H2/N2 for 4 h: (A) 50 mV/s in 1MKOH; (B) 50 mV/s in 1MKOH and 0.5M EtOH; (C) 10mV/s in 0.1MHClO4;(D) 50 mV/s in 0.1 M HClO4 and 0.5 M EtOH.

L dx.doi.org/10.1021/jp109239c |J. Phys. Chem. C XXXX, XXX, 000–000
The Journal of Physical Chemistry C ARTICLE
metal oxide supports.36-39We assume that changes in Pt particlesize are minimal in the reducing atmosphere employed.Orilall et al. observed relatively high mass activity for Pt and
Pt-Pb supported on crystalline mesoporous niobia-carboncomposites (samples contained roughly twice as much carbonwithin the support as those of this study) for the electro-oxidation of formic acid in 0.1 MH2SO4. Though no amorphoussupport was presented, it was shown that Pt/NbO2-C showedimproved current compared to Pt/Nb2O5-C. In the absence offormic acid, cyclic voltammograms for both Nb(IV) and Nb(V)yielded a highly charged double layer absent of Pt redox features.40
Niobia is a complex oxide with many forms, as demonstrated by themultiple polymorphs of Nb(IV) that the authors obtain by oxidizingand rereducing the same sample. The state of the bulk does notnecessarily represent the state of the surface. It is unclear how thenative oxide layer varies between the two, particularly in alkalineelectrolyte under various applied potentials. But the final stability ofthe niobia surface is likely highly variable, depending upon factorsincluding support crystallinity, as well as pH of the electrolyte.32 Andthough samples discussed here were heat treated in a reducingatmosphere of 10% H2/N2 at 400 �C, we previously showed thatthese conditions are not sufficient to reduce bulkNb2O5 toNbO2.
23
4. DISCUSSION
In situ IRRAS results have shown that evolution of CO2 fromethanol in 0.1 M HClO4 begins at lower potentials on Pt/NbRuyOz than on Pt/XC72. But it is not clear how much of thecurrent of each samplemeasured in the voltammogramsofFigure 13is the result of complete oxidation. Yang et al. asserted that there aretwo competing factors for overall catalytic activity of Pt. Any increasein the average size of Pt nanoparticles during heating wouldadversely affect the EOR performance of the material due to lowercatalyst surface area. But it has also been shown for a similar systemthat the oxidation of CO on Pt/Al2O3 is structure sensitive,improving with increasing Pt nanoparticle size.41
Our studies here have shown that smaller Pt nanoparticlessupported on amorphous niobia such as those in Pt-SP appear tobe more effective at splitting the C-C bond in acid electrolyte.This is probably due to a larger Pt-NbOx interfacial surface area.And unlike the larger Pt nanoparticles of Pt-DI, IRRAS spectrafor Pt-SP indicate an absence of CO, suggesting that oxidation toCO2 occurs very rapidly. This Pt nanoparticle size-dependentbehavior found by comparing Pt-SP and Pt-DI can also beextended to the comparison of Pt-300 and Pt-650. If there wassubstantially greater sintering of Pt on NbRuyOz at 650 �Ccompared to 300 �C, then the larger nanoparticles that wouldresult on Pt-650 should be more susceptible to CO poisoning
than those of Pt-300. Alternatively, the niobia support maystabilize Pt nanoparticles to some degree against sintering atthese temperatures. Unlike Pt/Al2O3 gas phase catalysis, C-Cscission and CO oxidation appear to be less sensitive to theextrinsic properties of Pt nanoparticles. Instead, intermediatespecies of EOR may bond more strongly to Pt-NbOx interfacialsites until scission and complete oxidation are achieved.
But the total current per mass measured from EOR isextremely low. Hobel et al. observed an irreversible 50% decreasein CO gas adsorption capacity for Pd/Nb2O5/Cu3Au(100)under UHV and ambient pressure after annealing above 27 �C.This was due to changes in the electronic structure as opposed tocatalyst sintering, which led the authors to conclude that themigration of Nb2O5 particles over Pd catalyst could not beresponsible for the suppressed activity.31 For 1%Pt/Nb2O5 gasphase catalysis, Guerrero et al. also observed a decrease in COadsorption capacity, but noted that it remains high in the absenceof H2. They surmised that O2 and H2 dissociative adsorptionremained unhindered in the presence of CO, hindering COadsorption and oxidation.18
All of these observations have significant implications for Pt/NbRuyOz in aqueous electrolyte where the local concentrationsof hydrogen and oxygen are much greater. Such selectiveadsorption behavior could inhibit the initial adsorption ofethanol or its partially oxidized subspecies. An additional factorunique to the electrocatalyst is the necessity for steady iontransport through the electrolyte. Under the active and selectivesurface conditions discussed, there is a greater potential for ionsto become adsorbed or neutralized before diffusing far from thepolarized double layer region.
5. CONCLUSIONS
Two samples of NbRuyOz catalyst support synthesized byspray pyrolysis were of primary interest in this study. Pt-DIsupported 30%Pt deposited by dry impregnation, while theother, Pt-SP, supported 60%Pt by nucleation-condensation toform Pt nanoparticles during pyrolysis. XAS results suggest Ptnanoparticle size distributions centered around 4 and 2 nm,respectively. Speciation of Pt is roughly identical between the two(XPS), while the d-band of Pt-SP contains additional electrons,possibly strengthening binding energy with adsorbates.
In situ IRRAS studies have shown that CO2 evolution duringEOR begins above an applied potential of 0.4 V (RHE) on Pt/NbRuyOz, about 0.37 V lower that Pt(111) alone.25 The smallerPt nanoparticles of Pt-SP appear to make it a more effectiveelectrocatalyst for C-C scission as well as CO oxidation. Theseresults indicate that niobia is a promising component of more
Table 5. Ethanol (0.5 M) Oxidation Peak Properties (CV) for Pt/NbRuyOz (wt % 60:10:10:20) before and after Heat Treatments
forward sweep reverse sweep
sweep area (uC/μg) peak center (V) max current (uA/μg) sweep area (uC/μg) peak center (V) max current (uA/μg)
acid SP 0.267 0.870 0.388 0.163 0.712 0.122
300 �C 16.324 0.950 32.315 13.100 0.762 22.874
650 �C 16.349 0.943 41.735 16.563 0.840 41.030
Δ 0.2% -0.007 29.2% 26.4% 0.078 79.4%
base SP 1.621 0.667 0.986 0.931 0.520 0.090
300 �C 25.216 0.693 21.314 5.135 0.539 4.721
650 �C 21.928 0.722 52.206 3.890 0.558 12.709
Δ -13.0% 0.029 144.9% -24.2% 0.019 169.2%

M dx.doi.org/10.1021/jp109239c |J. Phys. Chem. C XXXX, XXX, 000–000
The Journal of Physical Chemistry C ARTICLE
efficient electrocatalysts for EOR. But evenwith twice the loadingof Pt, these catalysts yielded about 60� smaller current exchangedensity during EOR than commercially available 30%Pt oncarbon, indicating that the surface of Pt supported on niobia issomehow inhibited. Deposition of monolayer amounts of freshPt onto existing Pt surfaces in Pt-DI and EOR-CV studiesshowed that much of the original Pt can be recovered in theabsence of atmospheric oxygen. But peak currents equivalent toPt/C are not achieved at any potential. Crystallization of theniobia support appears to decrease the overall charge density andimprove the EOR performance significantly in both 0.1 MHClO4 and 1 M KOH, suggesting that the niobia is somehowstabilized.
These studies appear to confirm the prevalence of Pt-NbOx
surface sites, in which ethanol and its subspecies are morestrongly bound than on Pt(111). This improves instances ofC-C scission before partially oxidized species desorb from thesurface. The niobia also appears to act as an oxygen promoter,facilitating CO oxidation to CO2. But the adsorption kinetics ofH2 and O2 species from electrolyte and atmosphere appear todominate available catalyst surface sites, blocking adsorption ofdouble and single carbon species and hindering the overall EORperformance. Polarization of the electrode may induce theexchange of hydrogen and oxygen to Pt from niobia directly.In this case, their adsorption onto Pt may partially proceedwithout the dissociation step. Such a process could explainlimited kinetics of EOR.
’AUTHOR INFORMATION
Corresponding Author*Phone: 505-277-2640. Fax: 505-277-5433. E-mail: [email protected].
’ACKNOWLEDGMENT
The authors acknowledge funding from the Department ofEnergy EPSCoR Implementation Program: “Materials for En-ergy Conversion,” #DE-PS02-08ER08-04.
’REFERENCES
(1) Christensen, C. H.; Jørgensen, B.; Rass-Hansen, J.; Egeblad, K.;Madsen, R.; Klitgaard, S. K.; Hansen, S. M.; Hansen, M. R.; Andersen,H. C.; Riisager, A. Angew. Chem., Int. Ed. 2006, 45, 4648–4651.(2) Lamy, C.; Belgsir, E. M.; Leger, J. M. J. Appl. Electrochem. 2001,
31, 799–809.(3) Antolini, E.; Gonzalez, E. R. Solid State Ionics 2009, 180, 746–763.(4) Antolini, E. J. Power Sources 2007, 170, 1–12.(5) Aranda, D. A. G.; Ramos, L. D.; Passos, F. B.; Schmal, M. Catal.
Today 1996, 28, 119–125.(6) Jaksic, J. M.; Krstajic, N. V.; Vracar, L. M.; Neophytides, S. G.;
Labou, D.; Falaras, P.; Jaksic, M.M. Electrochim. Acta 2007, 53, 349–361.(7) Chary, K. V. R.; Sri, K.; Venkat, P.; Rao, R.; Seetha, K.; Rao, R.;
Papadaki, M. J. Mol. Catal A: Chem. 2004, 223, 353–361.(8) Hu, F. P.; Chen, C. L.; Wang, Z. Y.; Wei, G. Y.; Shen, P. K.
Electrochim. Acta 2006, 52, 1087–1091.(9) Sasaki, K.; Zhang, L.; Adzic, R. R. Phys. Chem. Chem. Phys. 2008,
10, 159–167.(10) Adzic, R.; Zhang, J.; Sasaki, K.; Vukmirovic, M.; Shao, M.;
Wang, J.; Nilekar, A.; Mavrikakis, M.; Valerio, J.; Uribe, F. Top. Catal.2007, 46, 249–262.(11) Trasatti, S. Mater. Chem. Phys. 1987, 16, 157–174.(12) Bach, D.; Schneider, R.; Gerthsen, D.; Verbeeck, J.; Sigle, W.
Microsc. Microanal. 2009, 15, 505–523.
(13) Bach, D.; Schneider, R.; Gerthsen, D.Microsc. Microanal. 2009,15, 524–538.
(14) Chhina, H.; Campbell, S.; Kesler, O. J. Electrochem. Soc. 2009,156, 1232–1237.
(15) Garcia, B. L.; Fuentes, R.;Weidner, J.W. Electrochem. Solid StateLett. 2007, 10, B108–B110.
(16) Passos, F. B.; Aranda, D. A. G.; Schmal, M. Catal. Today 2000,57, 283–289.
(17) Passos, F. B.; Aranda, D. A. G.; Soares, R. R.; Schmal, M. Catal.Today 1998, 43, 3–9.
(18) Guerrero, S.; Miller, J. T.; Kropf, A. J.; Wolf, E. E. J. Catal. 2009,262, 102–110.
(19) Guerrero, S.; Miller, J.; Wolf, E. E. Appl. Catal., A 2007, 328,27–34.
(20) Vaskevich, A.; Rosenblum, M.; Gileadi, E. J. Electrochem. Soc.1995, 142, 1501–1508.
(21) Sasaki, K.; Adzic, R. R. J. Electrochem. Soc. 2008, 155, B180–B186.
(22) Park, K. W.; Seol, K. S. Electrochem. Commun. 2007, 9, 2256–2260.
(23) Konopka, D. A.; Pylypenko, S.; Atanassov, P.; Ward, T. L. ACSAppl. Mater. Interfaces 2009, 2, 86–95.
(24) Faguy, P. W.; Marinkovi, N. a. S. Appl. Spectrosc. 1996, 50,394–400.
(25) Kowal, A.; Li, M.; Shao, M.; Sasaki, K.; Vukmirovic, M. B.;Zhang, J.; Marinkovic, N. S.; Liu, P.; Frenkel, A. I.; Adzic, R. R. Nat.Mater. 2009, 8, 325–330.
(26) Ando, Y. J.; Sasaki, K.; Adzic, R. Electrochem. Commun. 2009,11, 1135–1138.
(27) Pylypenko, S.; Blizanac, B. B.; Olson, T. S.; Konopka, D.;Atanassov, P. ACS Appl. Mater. Interfaces 2009, 1, 604–611.
(28) Liang, Y.; Li, J.; Xu, Q.-c.; Hu, R.-z.; Lin, J.-d.; Liao, D.-w.J. Alloys Compd. 2008, 465, 296–304.
(29) Hammer, B.; Nørskov, J. K.; Bruce C. Gates, H. K. Theoreticalsurface science and catalysis—calculations and concepts. AdvancedCatalysis; Academic Press: New York, 2000; Vol. 45, pp 71-129.
(30) Serrano-ruiz, J. C.; Dumesic, J. A. Chemsuschem 2009, 2, 581–586.
(31) H€obel, F.; Bandara, A.; Freund, H.-j. Surf. Sci. 2006, 600, 963–970.
(32) Mickova, I.; Prusi, A.; Grcev, T.; Arsov, L. Croat. Chem. Acta2006, 79, 527–532.
(33) Marques, P.; Ribeiro, N. F. P.; Schmal, M.; Aranda, D. A. G.;Souza, M. M. V. M. J. Power Sources 2006, 158, 504–508.
(34) Arsova, I.; Prusi, A. J. Solid State Chem. 2003, 7, 217–222.(35) Wikander, K.; Ekstrom, H.; Palmqvist, A.; Lindberg, G. Electro-
chim. Acta 2007, 52, 6848–6855.(36) Adams, K. M.; Graham, G. W. Appl. Catal., B 2008, 80, 343–352.(37) Croy, J. R.; Mostafa, S.; Hickman, L.; Heinrich, H.; Cuenya,
B. R. Appl. Catal., A 2008, 350, 207–216.(38) Graham, G. W.; Jen, H. W.; Chun, W.; Sun, H. P.; Pan, X. Q.;
McCabe, R. W. Catal. Lett. 2004, 93, 129–134.(39) Wanke, S. E.; Flynn, P. C. Catal. Rev. 1975, 12, 93–135.(40) Orilall, M. C.; Matsumoto, F.; Zhou, Q.; Sai, H.; Abrunfa,
H. c. D.; DiSalvo, F. J.; Wiesner, U. J. Am. Chem. Soc. 2009, 131, 9389–9395.
(41) Yang, J.; Tschamber, V.; Habermacher, D.; Garin, F.; Gilot, P.Appl. Catal., B 2008, 83, 229–239.
(42) Socrates, G., Infrared Characteristic Group Frequencies; Wiley:New York, 1966.
(43) Xia, X. H.; Liess, H. D.; Iwasita, T. J. Electroanal. Chem. 1997,437, 233–240.
(44) Shao, M. H.; Adzic, R. R. J. Phys. Chem. B 2005, 109, 16563–16566.
(45) Ataka, K.-i.; Yotsuyanagi, T.; Osawa, M. J. Phys. Chem. 1996,100, 10664–10672.
(46) Shin, J.; Tornquist, W. J.; Korzeniewski, C.; Hoaglund, C. S.Surf. Sci. 1996, 364, 122.

N dx.doi.org/10.1021/jp109239c |J. Phys. Chem. C XXXX, XXX, 000–000
The Journal of Physical Chemistry C ARTICLE
(47) Rodes, A.; Pastor, E.; Iwasita, T. J. Electroanal. Chem. 1994,376, 109.(48) Gao, Q.; Hemminger, J. C. Surf. Sci. 1991, 248, 45–56.(49) Leung, L. W. H.; Weaver, M. J. Phys. Chem. 1988, 92, 4019–
4022.(50) Corrigan, D. S.; Krauskopf, E. K.; Rice, L. M.; Wieckowski, A.;
Weaver, M. J. J. Phys. Chem. 1988, 92, 1596–1601.(51) Lamy, C.; Rousseau, S.; Belgsir, E. M.; Coutanceau, C.; L�eger,
J. M. Electrochim. Acta 2004, 49, 3901–3908.(52) Iwasita, T.; Rasch, B.; Cattaneo, E.; Vielstich, W. Electrochim.
Acta 1989, 34, 1073–1079.(53) Wu, J. Modern Fourier Transform Infrared Spectroscopy Techni-
ques and their Applications; Scientific and Technical Document Publish-ing House: Bejing, 1994.(54) Gao, P.; Chang, S.-C.; Zhou, Z.; J. Weaver, M. J. Electroanal.
Chem. 1989, 272, 161–178.