h2 production from steam ethanol reforming
TRANSCRIPT

ALMA MATER STUDIORUM – Università di Bologna
FACOLTÀ DI CHIMICA INDUSTRIALE
Dipartimento di Chimica Industriale e dei Materiali
H2 PRODUCTION FROM STEAM
ETHANOL REFORMING (ESR)
Tesi di dottorato di ricerca in
CHIMICA INDUSTRIALE (Settore CHIM/04)
Presentata da
Dr. Irene BERSANI
Relatore Coordinatore
Dr. Francesco BASILE Prof. Fabrizio CAVANI
Correlatori
Prof. Giuseppe FORNASARI
Prof. Angelo VACCARI
ciclo XXIII
Anno 2011


ethanol
reforming
hydrotalcite
rhodium
pressure


Contents
1 Introduction 1
2 Literature review 3
2.1 Global view of renewable energy 3
2.1.1 Global energetic scenario 3
2.1.2 Renewable Energy Sources (RES) 6
2.1.3 H2 12
2.2 H2 relevance and applications 14
2.2.1 Ammonia synthesis 15
2.2.2 Methanol synthesis 16
2.2.3 Fischer-Tropsch synthesis 18
2.2.4 Dimethyl Ether synthesis 21
2.2.5 Direct Reduction of iron ore (DRI) 23
2.2.6 Hydrodesulfurization 24
2.2.7 Hydrodenitrogenation 25
2.2.8 Fuel cells 26
2.3 H2 production 32
2.3.1 Steam reforming process (SR) 33
2.3.2 Water gas shift reaction (WGS) 44
2.3.3 Partial oxidation (POx) 48
2.3.4 Autothermal reforming (ATR) 50
2.3.5 Catalytic partial oxidation (CPO) 51
2.4 Bioethanol steam reforming 55
2.4.1 Thermodynamic considerations 55
2.4.2 Reaction mechanism 67
2.4.3 Catalysts 81
2.4.4 Process Considerations 86
2.4.5 Alternative solutions 88

2.5 Catalysts obtained from hydrotalcite (HT) type precursor 91
3 Experimental 107
3.1 Catalysts preparation 107
3.1.1 Catalysts from hydrotalcite type precursors 107
3.1.2 Catalyst from CeZrO2 matrix 108
3.1.3 Foam catalysts 108
3.2 Catalysts characterization 109
3.2.1 X-Ray diffraction (XRD) analysis 109
3.2.2 Surface area and porosimetry analysis 110
3.2.3 Temperature programmed reduction (TPR) and oxidation (TPO)
analysis 110
3.2.4 Scanning and Transmission Electron Microscopy analysis 111
3.2.5 Infrared (IR) spectroscopy analysis 111
3.2.6 Other analysis 112
3.3 Laboratory plant 113
3.4 Preliminary/Blank tests 119
4 Results and discussion 123
4.1 Aim of work 123
4.2 Thermal decomposition of ethanol 125
4.2.1 Reactivity with INCOLOY 800HT reactor 125
4.2.2 Reactivity with quartz reactor 127
4.3 Choice of formulation 130
4.3.1 Rh-Ni catalyst: study of operative parameters 130
4.3.2 Rh catalysts: effect of a second metal 139
4.3.3 Rh catalysts: effect of the matrix 157
4.4 Preparation of foams with hydrotalcite 190
4.4.1 Preparation of stable slurries in organic solvent 190
4.4.2 Characterization of powder 191
4.4.3 Characterization of slurries 194

4.4.4 Viscosity (A2P2) 200
4.4.5 Preparation and characterization of foams 201
4.5 Under pressure conditions 203
4.5.1 Under P tests with pure EtOH 203
4.5.2 Under P tests with surfin EtOH 206
4.5.3 Foams tests and comparisons 207
4.5.4 Characterization of spent catalysts 210
5 Conclusions 215

Introduction
H2 production from steam ethanol reforming (ESR) 1
11 IInnttrroodduuccttiioonn
The global energy landscape is constantly and rapidly evolving in response to
advancing technologies, energy and environmental policies, and in recent years also
to an economic crisis that emphasized widely different growth dynamics among
different areas of the world. In the past decade, the prices of the key energy sources
have also shown a high level of instability, often not justified by the dynamics of
demand and supply fundamentals, but rather related to the speculative behaviour of
financial markets (1). To meet the challenges of energy security and climate change as
well as the growing energy needs of the developing world, a global energy technology
revolution is essential.
Renewable energy has already been recognized as playing a key role for a global
energy future, with a diversity of renewable energy sources which would vary
geographically. In addition energy sources as sunlight, wind and falling water are
generally considered renewable and therefore sustainable over the relatively long
term. Wastes and biomass fuels are also usually viewed as sustainable energy.
Biomass, wind and geothermal energy are commercially competitive and are making
relatively fast progress (2).
The potential role of hydrogen in the world’s future energy system has been analysed
in many assessments (3) and remains a topic of vigorous, ongoing debate (4).
Hydrogen is a “building block” product of remarkable industrial interest and it is
indicated as energy carrier of increasing relevance (5). Today, “hydrogen economy” is
high on the political agenda and on the priorities of agencies funding research.
Hydrogen is claimed to replace hydrocarbons and to provide a clean fuel with no
carbon emissions for use in stationary and mobile applications as well. Fuel cells will
play a key role for both applications.
Although hydrogen can be produced from a large variety of sources by using different
methods, up to now the most extensively used process is the steam reforming of
hydrocarbons. Biomass can be also used to produce H2 by thermochemical or
biological processes. Metabolic processing appears as an interesting alternative for
the treatment of wastes while generating H2 as product. Some other approaches for
hydrogen production from water or other hydrogen-containing materials such as
photodecomposition or thermochemical processes are also in development. Solar
photodecomposition of water still has many technical hurdles remaining that suggest
it is decades away from large scale, cost-effective implementation (6).
The conversion of hydrocarbons to hydrogen and syngas will play an important role in
the 21st century ranging from large gas to liquid plants and hydrogen plants for

Introduction
2 H2 production from steam ethanol reforming (ESR)
refineries to small units providing hydrogen for fuel cells. The choice of technology for
manufacture of syngas depends on the scale of operation (7).
Among the liquid H2 sources, C2H5OH is a good candidate for several reasons: (i)
ethanol is renewable and is becoming increasingly available; (ii) it is easy to transport,
biodegradable, and low in toxicity; (iii) it could be easily decomposed in the presence
of water to generate a hydrogen-rich mixture; and (iv) it is free from catalyst poisons
such as sulfur. Haryanto et al. observed that the ethanol conversion and H2
production varies greatly with the reaction conditions, the type of catalyst and the
method of catalyst preparation (8). The challenge is, therefore, to develop catalysts
exhibiting high stability and activity for ethanol steam reforming with high yields of
hydrogen and resistance to coke formation at relatively low temperature.

Literature review
H2 production from steam ethanol reforming (ESR) 3
22 LLiitteerraattuurree rreevviieeww
22..11 GGlloobbaall vviieeww ooff rreenneewwaabbllee eenneerrggyy
22..11..11 GGlloobbaall eenneerrggeettiicc sscceennaarriioo
It is not an exaggeration to say that the future of human prosperity hinges on finding a
way of supplying the world’s growing energy needs in a way that does not irreparably
harm the environment. Until recently, it looked as if we had plenty of time to meet
that challenge. No longer. Surging oil and gas prices have drawn attention to the
physical and political constraints on raising production - and the vital importance of
affordable supplies to the world economy. And the latest scientific evidence suggests
that the pace of climate change resulting from man-made emissions of greenhouse
gases - the bulk of which come from burning fossil fuels - is faster than predicted. The
urgent need for a veritable energy revolution, involving a wholesale global shift to
low-carbon technologies, is now widely recognised (9).
Climate change, coupled with concerns about high oil and energy prices, is driving a
global trend towards the increased use of renewable energy. Unlike fossil fuels which
are rapidly being depleted, renewable energy sources such as sunlight and wind are
naturally replenished and therefore sustainable. Indeed, it is the perceived notion of
sustainability that is driving governments around the world to introduce legislation
promoting the use of renewable energy (10).
Currently, only about 18% of the world’s energy demand is supplied from renewable
energy sources (9). However, there is great potential to increase this contribution.
Indeed, it has been estimated that the technical potential of renewable energy is more
than 18 times that of current global primary energy demand (11). This estimate,
however, does not allow for economic and environmental constraints and is therefore
somewhat misleading. Owing to constraints, such as economic competitiveness, the
potential that is likely to be realized in practice will be only a fraction of this value.
Despite this estimate, the International Energy Agency (IEA), the U.S. Energy
Information Administration (EIA) and British Petroleum (BP) previsions show that in
the future the world will see an ever-increasing role of fossil energy sources (9) (12)
(13). In its World Energy Outlook 2008, the IEA describes a reference scenario for
global energy demand and supply for fossil, nuclear and renewable primary energy
sources (9). The comparison of IEA data with them of EIA show very similar trends:
crude oil continue to be the most important energy source , followed by coal and

Literature review
4 H2 production from steam ethanol reforming (ESR)
natural gas. Nuclear and renewable energies will grow slightly, but the dominance of
fossil fuels remains unchanged (Fig. 2.1).
Fig. 2.1 World primary energy demand by fuel a)EIA, b)IEA (9) (12).
At the same time, although the developed world has accounted for the majority of
world energy use, the U.S. Energy Information Administration predicts that demand
for energy will increase by 70% from 2007 to 2035 in the world due to substantial
economic development with the concomitant increases in energy demand in terms of
electricity and fuels (Fig. 2.2 and Fig. 2.3)(12) (13)(14). The most rapid growth in
energy demand from 2007 to 2035 occurs in nations outside the Organization for
Economic Cooperation and Development (non OECD nations). Current OECD
member countries (as of March 2010) are the United States, Canada, Mexico, Austria,
Belgium, Czech Republic, Denmark, Finland, France, Germany, Greece, Hungary,
Iceland, Ireland, Italy, Luxembourg, the Netherlands, Norway, Poland, Portugal,
Slovakia, Spain, Sweden, Switzerland, Turkey, the United Kingdom, Japan, South
Korea, Australia, and New Zealand.
This increasing trend in demand of energy of non OECD countries it is due to the
necessity to improve standards of living but also to the increase of population, in fact
in non OECD nations population continues to increase (Fig. 2.3). At the global level,
the most fundamental relationship in energy economics remains robust: more people
with more income means that the production and consumption of energy will rise.
Fig. 2.2 World primary energy demand by region a)EIA, b)IEA (12) (14).
Qu
adri
llio
nB
tu
Mto
e
History Projections
Oil
CoalGas
Biomass
Nuclear
Hydro Other renewables
Qu
adri
llio
nB
tu

Literature review
H2 production from steam ethanol reforming (ESR) 5
Fig. 2.3 World incremental trends: population, energy and gross domestic products (GDP) (13).
Last World Energy Outlook 2010 predicts that differently from non OECD countries,
OECD nations show a decline in the demand of oil and coal and an increase of
investments in renewables sources. The use of renewable energy triples between
2008 and 2035, driven by the power sector where their share in electricity supply rises
from 19% in 2008 to 32% in 2035 ( Fig. 2.4 and Fig. 2.5). Renewables are entering the
mainstream, but long-term support is needed to boost their competitiveness(14).
Fig. 2.4 Incremental primary energy demand, 2008-2035 (14).

Literature review
6 H2 production from steam ethanol reforming (ESR)
Fig. 2.5 Renewable primary energy demand (14).
About 98% of carbon emissions result from fossil fuel combustion. Reducing use of
fossil fuels would considerably reduce the amount of carbon dioxide produced, as well
as reducing the levels of the pollutants. Indeed, much of the variation in cost
estimates to control carbon emissions revolves around the availability and cost of
carbon-free technologies and carbon-reducing technologies, such as energy efficiency
and energy conservation equipment. This can be achieved by either using less energy
altogether, or using alternative energy resources. Much of the current effort to control
such emissions focuses on advancing technologies that emit less carbon or no carbon
such as nuclear, hydrogen, solar, wind, geothermal or on using energy more
efficiently, and on developing innovative technologies and strategies to capture and
dispose of carbon dioxide emitted during fossil fuel combustion.
22..11..22 RReenneewwaabbllee EEnneerrggyy SSoouurrcceess ((RREESS))
Renewable energy has already been recognized as playing a key role for a global
energy future, with a diversity of renewable energy sources which would vary
geographically. In addition energy sources as sunlight, wind and falling water are
generally considered renewable and therefore sustainable over the relatively long
term. Wastes and biomass fuels are also usually viewed as sustainable energy.
Biomass, wind and geothermal energy are commercially competitive and are making
relatively fast progress (2).
Main renewable energy sources and their usage forms are given in Fig. 2.6.

Literature review
H2 production from steam ethanol reforming (ESR) 7
Fig. 2.6 Main renewable energy sources and their usage form (2).
Hydropower, geothermal, solar and wind can be a useful substitute for power and
heating generation, while biomass and biofuels, derived from biomass, appear to be
an attractive option respect fossil fuels, in particular if it is considered that oil reserve
will be finish in a brief period.
Biomass is an interesting alternative for three main reasons. First, it is a renewable
resource that could be sustainably developed in the future. Second, it appears to have
formidably positive environmental properties resulting in no net releases of carbon
dioxide (CO2) and very low sulfur content. Third, it appears to have significant
economic potential provided that fossil fuel prices increase in the future (15).
Mainly advantages of bio-fuels are the following: (a) bio-fuels are easily available from
common biomass sources; (b) they are represent a CO2 cycle in combustion; (c) bio-
fuels have a considerable environmentally friendly potential; (d) there are many
benefits the environment, economy and consumers in using bio-fuels; and (e) they are
biodegradable and contribute to sustainability (16).
22..11..22..11 BBiioommaassss
Biomass resources can be divided into two broad categories: natural and derived
materials. Biomass resources include wood and wood wastes, agricultural crops and
their waste by-products, municipal solid waste, animal wastes, waste from food
processing and aquatic plants and algae. Biomass resource can be subdivided into
three categories (17) (18):
Wastes. Agricultural production wastes, agricultural processing wastes, crop residues,
mill wood wastes, urban wood-wastes, urban organic wastes.
Forest products. Wood, logging residues, trees, shrubs and wood residues, sawdust,
bark, etc., from forest clearings.
Energy crops. Short rotation woody crops, herbaceous woody crops, grasses, starch
crops (corn, wheat and barley), sugar crops (cane and beet), oilseed crops (soya bean,
sunflower, safflower).

Literature review
8 H2 production from steam ethanol reforming (ESR)
The components of biomass include cellulose, hemicelluloses, lignin, extractives,
lipids, proteins, simple sugars, starches, water, HC, ash, and other compounds. Two
larger carbohydrate categories that have significant value are cellulose and hemi-
cellulose. The lignin fraction consists of non-sugar type molecules (19).Industrial
biomass can be grown from numerous types of plants, including miscanthus,
switchgrass, hemp, corn, poplar, willow, sorghum, sugarcane, (20)and a variety of tree
species, ranging from eucalyptus to oil palm.
There are three ways to use biomass. It can be burned to produce heat and electricity,
changed to gas-like fuels such as methane, hydrogen and carbon monoxide or
changed to a liquid fuel. When biomass is used directly in an energy application
without chemical processing then it is combusted. Conversion may be effected by
thermochemical, biological or chemical processes. These may be categorized as
follows: direct combustion, pyrolysis, gasification, liquefaction, supercritic fluid
extraction, anaerobic digestion, fermentation, acid hydrolysis, enzyme hydrolysis, and
esterification (21).
Fig. 2.7 Main biomass conversion processes (21).
22..11..22..11..11 PPyyrroollyyssiiss
It is thermo-chemical conversion process and is found to be best suited for conversion
of biomass to liquid fuel. Pyrolysis is thermal destruction of biomass in the absence of
air/ oxygen. Pyrolysis of biomass starts at 350-550 °C and goes up to 700 °C. This leads
to the production of useful liquid oil, gases and solid products. Different condition
leads to formation of products in different proportions (22). The physical conditions of
the pyrolysis of biomass, such as temperature, heating rate and residence time have
been shown to have a profound effect on the product yields and composition.
Slow pyrolysis. Biomass is pyrolysed at slow heating rates (5-7 °C/min). This leads to
less liquid and gaseous product and more of char production (22).

Literature review
H2 production from steam ethanol reforming (ESR) 9
Fast pyrolysis. Initially pyrolysis was done with slow heating rates. This in turn
produces more of char. The higher yield of desirable liquid product can be obtained by
fast pyrolysis. It involves rapid heating of biomass but not as fast as flash pyrolysis.
Heating rate is somewhere about 300 °C/min. Generally, fast pyrolysis is used to
obtain high-grade bio oil. Fast pyrolysis is successful with most of fluidized bed
reactors as it offers high heating rates, rapid de-volatilization, easy control, easy
product collection, etc. (23).
Flash pyrolysis. Flash pyrolysis is the process in which the reaction time is of only
several seconds or even less. The heating rate is very high. This requires special
reactor configuration in which biomass residence times are only of few seconds. Two
of appropriate designs are entrained flow reactor and the fluidized bed reactor. Flash
pyrolysis of any kind of biomass requires rapid heating and therefore the particle size
should be fairly small (24).
22..11..22..11..22 CCoommbbuussttiioonn
The biomass is directly burnt in the presence of air to convert chemical energy stored
in biomass into heat, mechanical power, or electricity, etc. It is possible to burn any
type of biomass but in practice combustion is feasible only for biomass with moisture
content of <50%. Combustion process has got many disadvantages. Biomass rarely
arises naturally in an acceptable form of burning. In most of the cases it requires some
pretreatment like drying, chopping, grinding, etc., which in turn is associated with
financial costs and energy expenditure (25) (26).
22..11..22..11..33 GGaassiiffiiccaattiioonn
Gasification is a form of pyrolysis, carried out at high temperatures (800-900 °C) in
order to optimize the gas production. The resulting gas, known as producer gas, is a
mixture of carbon monoxide, hydrogen and methane, together with carbon dioxide
and nitrogen. The gas is more versatile than the original solid biomass (usually wood
or charcoal): it can be burnt to produce process heat and steam, or used in gas
turbines to produce electricity (19).
22..11..22..22 BBiiooffuueellss
Biofuel is a renewable energy source produced from natural (biobased) materials,
which can be used as a substitute for petroleum fuels. The term biofuel is referred to
as solid (bio-char), liquid (ethanol, vegetable oil and biodiesel) or gaseous (biogas,
biosyngas and biohydrogen) fuels that are predominantly produced from biomass.
The most common biofuels, such as ethanol from corn, wheat or sugar beet and
biodiesel from oil seeds (rape in particular), are produced from classic food crops that
require high-quality agricultural land for growth. It is assumed that biodiesel is used as
a petroleum diesel replacement and that ethanol is used as a gasoline replacement
(27).

Literature review
10 H2 production from steam ethanol reforming (ESR)
Fig. 2.8 Resources of main liquid biofuels for automotives (21).
Ethanol can be used directly in cars designed to run on pure ethanol or blended with
gasoline to make ‘‘gasohol”. Anhydrous ethanol is required for blending with gasoline.
No engine modification is typically needed to use the blend. Ethanol can be used as an
octane- boosting, pollution-reducing additive in unleaded gasoline.
Most ethanol is currently being produced from sugar cane or corn. Yeast is used to
ferment sugars into ethanol. In the case of carbohydrates (such as corn), a
pretreatment step of converting carbohydrate into sugars is needed. Currently, the
corn ethanol industry uses either a dry-milling or a wet-milling process. Upon
fermentation, ethanol content is only about 10%, which requires a significant effort in
separation to produce the pure ethanol needed for fuel use. Distillation can
concentrate ethanol to just below the azeotropic concentration (95 mol%), after that,
specialized separations (molecular sieve, azeotropic distillation, lime drying) are
needed.
World production of ethanol from sugar
cane, maize and sugar beet increased
from less than 20 billion liters in 2000 to
over 40 billion liters in 2005. This
represents around 3% of global gasoline
use. Production is forecasted to almost
double again by 2010 (28).
Biodiesel is a synthetic diesel-like fuel
produced from vegetable oils, animal
fats or waste cooking oil. It can be used
directly as fuel, which requires some
engine modifications, or blended with
petroleum diesel and used in diesel
engines with few or no modifications. At
present, biodiesel accounts for less than
0.2% of the diesel consumed for
Fig. 2.9 World production of ethanol and biodiesel, 1980–2007 (22).

Literature review
H2 production from steam ethanol reforming (ESR) 11
transport(28). Biodiesel has become more attractive recently because of its
environmental benefits.
The cost of biodiesel, however, is the main obstacle to commercialization of the
product. With cooking oils used as raw material, the viability of a continuous
transesterification process and recovery of high quality glycerol as a biodiesel by-
product are primary options to be considered to lower the cost of biodiesel (29) (30).
The oil in the vegetable seeds is converted into biodiesel through oil extraction, oil
refining, and transesterification. The cost of biodiesel can be lowered by increasing
feedstock yields, developing novel technologies, and increasing economic return on
glycerol production by finding other uses for this by-product, which, at the moment,
due to oversupply is sold for little or no value.
Biofuels production costs can vary widely by feedstock, conversion process, scale of
production and region. On an energy basis, ethanol is currently more expensive to
produce than gasoline in all regions considered. Only ethanol produced in Brazil
comes close to competing with gasoline. Ethanol produced from corn in the US is
considerably more expensive than from sugar cane in Brazil, and ethanol from grain
and sugar beet in Europe is even more expensive (Fig. 2.10). These differences reflect
many factors, such as scale, process efficiency, feedstock costs, capital and labor
costs, co-product accounting, and the nature of the estimates(31).
Fig. 2.10 Estimated costs of biofuels compared with the price of oil (biofuels exclusive of taxes),(US cents/liter)(31).
For biofuels, the cost of feedstock (crops) is a major component of overall costs. Total
biofuel costs should also include a component representing the impact of biofuels
production on related markets, such as food. In particular, the cost of producing oil-
seed-derived biodiesel is dominated by the cost of the oil and by competition from
high-value uses like cooking (Fig. 2.10).
Trying to avoid competition with food a second generation of biofuels was taken in
exam for transport field. In general, second generation biofuels are produced from
cellulosic materials (lignocellulosic feedstocks). These raw material options may result
in the production of more fuel per unit of agricultural land used and require less

Literature review
12 H2 production from steam ethanol reforming (ESR)
chemical and energy input per production and harvesting resulting in a higher yield.
Such raw materials may be considered more sustainable and do not compete directly
with food. However, there can be competition for land use as well as competition
between the potential use of cellulosic materials for liquid biofuels and current use for
heat and power generation through combustion as solid biofuels.
At this point biofuels can be classified based on their production technologies: first-
generation biofuels; second generation biofuels; third generation biofuels; and fourth
generation biofuels. Classification of biofuels based on their generation technologies
is shown in Fig. 2.11. The first-generation biofuels appear unsustainable because of
the potential stress that their production places on food commodities. Second
generation biofuels need to build on the need for sustainable liquid fuels through
processing including pyrolysis and hydrothermal liquefaction (31).
Fig. 2.11 Classification of biofuels based on their generation technologies(31).
Also for bioethanol, with the current trend in ethanol use (Fig. 2.9), demand is likely to
increase significantly in the near future and starch or sugar-based ethanol production
has been blamed for the rise in the food prices. To satisfy current and future demands,
ethanol production from lignocellulosic biomass fermentation is a viable option that
does not compete with the food supply.
22..11..33 HH22
The potential role of hydrogen in the world’s future energy system has been analysed
in many assessments (3) and remains a topic of vigorous, ongoing debate (4).
Hydrogen is a “building block” product of remarkable industrial interest and it is
indicated as energy carrier of increasing relevance (5). Hydrogen is found naturally in
hydrogen-rich compounds; it cannot be extracted like natural gas or oil, but needs to
be released by applying energy. On the one hand, this represents a drawback because
the process requires the input of primary energy carriers like coal, natural gas or
biomass, of electricity or high temperatures.

Literature review
H2 production from steam ethanol reforming (ESR) 13
The advantage is that a wide range of
different feedstocks and energy sources
can be used for hydrogen production, in
particular from fossil fuels, biofuels by
thermochemical way and from water by
electrolytic way (32).
The interest on hydrogen-based energy
systems surged in response to the first
oil crisis and the growing concerns
about environmental issues. The
advantages are the hydrogen nearly
zero emissions, its potential role in
reducing greenhouse gases (improving
air quality), reducing climate changes
and the possibility of local production
on the basis of a variety of fuels (decreasing dependence on imported oil). In fact, the
high end-use efficiency in fuel cells and the possibility to produce hydrogen from non-
fossil sources or clean fossil fuels (fossil fuel combustion in combination with coke
capture and storage - CCS) could reduce greenhouse gas emissions from the energy
system(33).
Today, “hydrogen economy” is high on the political agenda and on the priorities of
agencies funding research. Hydrogen is claimed to replace hydrocarbons and to
provide a clean fuel with no carbon emissions for use in stationary and mobile
applications as well. Fuel cells will play a key role for both applications.
Fig. 2.12 Energy sources for hydrogen production and possible applications (30).

Literature review
14 H2 production from steam ethanol reforming (ESR)
22..22 HH22 rreelleevvaannccee aanndd aapppplliiccaattiioonnss
The development of hydrogen production technologies requires identification of
potential markets and the constraints associated with those markets.
For non-carbon-dioxide-emitting hydrogen production technologies (nuclear,
renewable, and fossil fuels with carbon dioxide sequestration), restrictions on carbon
dioxide emissions to the atmosphere are an important factor in the increasing
potential size of a future markets(34). Existing and potential hydrogen markets were
identified as follows(34):
Industrial. The two major industrial markets for hydrogen are fertilizer production as
ammonia, steel, methanol and H2 for cracking and hydrodesulphurization. All nitrate
fertilizers require hydrogen in their production processes. Some but not all steel
production processes require hydrogen. These are large-scale facilities that match
large-scale hydrogen production systems.
Vehicle. Transportation requirements can be met with different fuels (methanol,
dimethyl ether, Fischer-Tropsch fuels or gasoline, diesel, jet fuel and in the future H2
itself). Each fuel requires different amounts of hydrogen in the production process and
has different economics of scale.
Power. Hydrogen is a candidate for power production, particularly as a vector for
storage and use for production when necessary.
Commercial. Hydrogen is being considered for commercial applications in buildings
with the co-generation of power and heat.
With interest in its practical applications dating back almost 200 years, hydrogen
energy use is hardly a novel idea. What is new is the confluence of factors since the
mid-1990s that increase the attractiveness of hydrogen energy economy. Those
factors include persistent urban air pollution, demand for low or zero-emission
vehicles, the need to reduce foreign oil imports, carbon dioxide emissions and global
climate change, and the need to store renewable electricity supplies. These
considerations are not confined to a single nation or region, and make hydrogen a
virtually ideal energy carrier that is abundantly and equitably available to humanity
(35).

Literature review
H2 production from steam ethanol reforming (ESR) 15
22..22..11 AAmmmmoonniiaa ssyynntthheessiiss
Ammonia is used in various applications, such as textile processing, water purification,
and manufacturing explosives. The main part, however, is used as fertilizer(36).
Ammonia production consumes about half of the hydrogen produced today and it is
the primary chemical industry utilization of hydrogen. Ammonia is currently made
where there is inexpensive natural gas that provides economical hydrogen and
shipped to the costumer. The low cost of shipping ammonia favors very large
ammonia production plants with very large demands for hydrogen (34).
At the beginning of the 20th century, the use of nitrogenous fertilizers was already
well established. Haber and Bosch developed the direct synthesis of ammonia from
hydrogen and nitrogen (37).
The synthesis of ammonia from nitrogen and hydrogen is a clean reaction, in that it is
not complicated by the formation of byproducts, such as hydrazine, and the
thermodynamics are seemingly straightforward.
ΔH°700K = - 52.5 kJ/mol
1/2 N2 + 3/2 H2 NH3 ΔG°700K = + 27.4 kJ/mol
ΔS°700K = + 288 J/molK
The reaction is exothermic and is accompanied by a decrease in volume at constant
pressure. The value of the equilibrium constant (Kp) therefore increases as the
temperature is lowered, and the equilibrium ammonia concentration increases with
increasing pressure.
The formation of ammonia is favoured by operation at high pressure and low
temperature. The optimum pressure for economic operation with the available
catalysts has been in the range 150 - 350 bar. Normally, the advantages of the higher
equilibrium concentration of ammonia at very high pressure are more than offset by
the higher costs of both gas compression and additional plant capital.
The temperature at which the synthesis process is operated is determined by the
activity characteristics of the catalyst. Thermodynamically, low temperature is
advantageous, but for kinetic reasons high temperatures have to be used. The most
effective catalyst is clearly the one that will give the highest rate of conversion of
ammonia at the lowest temperature.
As the synthesis reaction proceeds, the heat of reaction causes the temperature to
rise down the bed, so making the specific rate of reaction faster. Since the equilibrium
becomes less favourable at higher temperatures, the rate of the reverse reaction is
progressively increased and the overall conversion becomes equilibrium-controlled.
Careful control of the temperature profile is therefore necessary for the equilibrium
balance to be obtained between the limit set by the thermodynamic equilibria, and by

Literature review
16 H2 production from steam ethanol reforming (ESR)
the kinetics of the catalyzed reactions in both forward (synthesis) and reverse
(ammonia decomposition) directions.
The main role of the ammonia catalyst is to dissociate the N2 bond. Under industrial
conditions, this is the rate-determining step (RDS) for NH3 synthesis on Ru, due to the
high bond energy. The dissociation takes place at defects and steps, rendering the
NH3 synthesis extremely structure sensitive(36).
All commercial ammonia synthesis catalysts are currently based on metallic iron
promoted with alkali (K), and various metal oxides, such as those of aluminium,
calcium or magnesium. The principal material used to make these catalysts is usually
magnetite (Fe3O4), with some of the components in the catalyst originating as
impurities in the magnetite. A typical catalyst contains approximately 0,8 % K2O, 2.0
% CaO, 0.3 % MgO, 2.5 % Al2O3 and 0.4 % SiO2, as well as traces of TiO2, ZrO2 and
V2O5. In developing the process to manufacture catalysts of this sort, it was
recognized that these minor components could have a large effect on the
performance of the final catalyst, since they may also interact with each other, giving
rise to both harmful and beneficial effects. In modern catalysts, these factors have
been taken onto account, resulting in optimized performance in terms of high activity
and long life.
22..22..22 MMeetthhaannooll ssyynntthheessiiss
Methanol is inside the top 10 produced molecules. Methanol has been a common
chemical feedstock for several important chemicals such as acetic acid, methyl ter-
butyl ether (MTBE), formaldehyde and chloromethane. Moreover, methanol being a
clean liquid fuel could provide convenient storage of energy for fuel cell applications,
particularly in transportation and mobile devices(38). In additions, over the last few
decades, methanol-to-hydrocarbons (MTHC) technologies, in particular methanol-to-
olefin (MTO) and methanol-to-gasoline (MTG), have been the focus for a large
number of researcher dealing with the upgrading of natural resources beneficial both
for the petrolchemistry and fuel industries (39) (40)(41).
The process to synthesize methanol from carbon monoxide and hydrogen was
introduced by BASF in 1923 and it was the second large-scale application of catalysis
(after ammonia synthesis) and high-pressure technology (100-300 bar) to the chemical
industry (37).
Like the ammonia process, methanol synthesis was dependent on the development of
an effective catalyst, but unlike the ammonia synthesis catalyst, the methanol
catalyst had to be selective as well as active.
The reactions involved in the methanol synthesis are:
(A) CO + 2 H2 CH3OH ΔH°298K = - 90.6 kJ/mol

Literature review
H2 production from steam ethanol reforming (ESR) 17
ΔG°298K = - 25.3 kJ/mol
(B) CO2 + 3 H2 CH3OH + H2O ΔH°298K = - 49.5 kJ/mol
ΔG°298K = + 3.3 kJ/mol
(C) CO + H2O CO2 + H2 ΔH°298K = - 41.2 kJ/mol
ΔG°298K = - 28.6 kJ/mol
Reaction (B) and (C) combined are equivalent to reaction (A), so that either, or both,
of the carbon oxides can be the starting point for methanol synthesis.
Reactions (A) - (C) are exothermic; reactions (A) and (B) are accompanied by a
decrease in volume. Hence, the value of the equilibrium constant decreases with
temperature and increases with pressure (Kp = pCH3OH / pCOp2H2). Thus, high
conversions to methanol, given a sufficiently active catalyst, will be obtained at high
pressures and low temperatures.
In addition to the synthesis of methanol, both carbon monoxide and carbon dioxide
can take part in other hydrogenation reactions, producing by-products such as
hydrocarbons, ethers and higher alcohols:
(D) CO + 3 H2 CH4 + H2O ΔH°298K = - 206.2 kJ/mol
ΔG°298K = - 142.2 kJ/mol
(E) 2 CO + 4 H2 CH3OCH3 + H2O ΔH°298K = - 204.8 kJ/mol
ΔG°298K = - 67.2 kJ/mol
(F) 2 CO + 4 H2 C2H5OH + H2O ΔH°298K = - 255.6 kJ/mol
ΔG°298K = - 122.6 kJ/mol
These reactions are much more exothermic than the methanol synthesis reactions
and methanol is thermodynamically less stable and less likely to be formed from
carbon monoxide and hydrogen than the other possible products, such as methane.
Which of the products is formed is controlled by kinetics factors; that is, by the
catalyst being selective in favouring a reaction path leading to the desired product.
The catalytic synthesis of methanol from syngas has been conventionally carried out
in two-phase reactors with the syngas and products in the vapour phase and the
catalyst as solid phase. The large exothermic heat of reaction in addition to the low
heat capacity of the vapour increases the potential for thermal runaway and damage
to the catalyst in the vapour phase, thus limiting the maximum operable reaction
temperature(42).
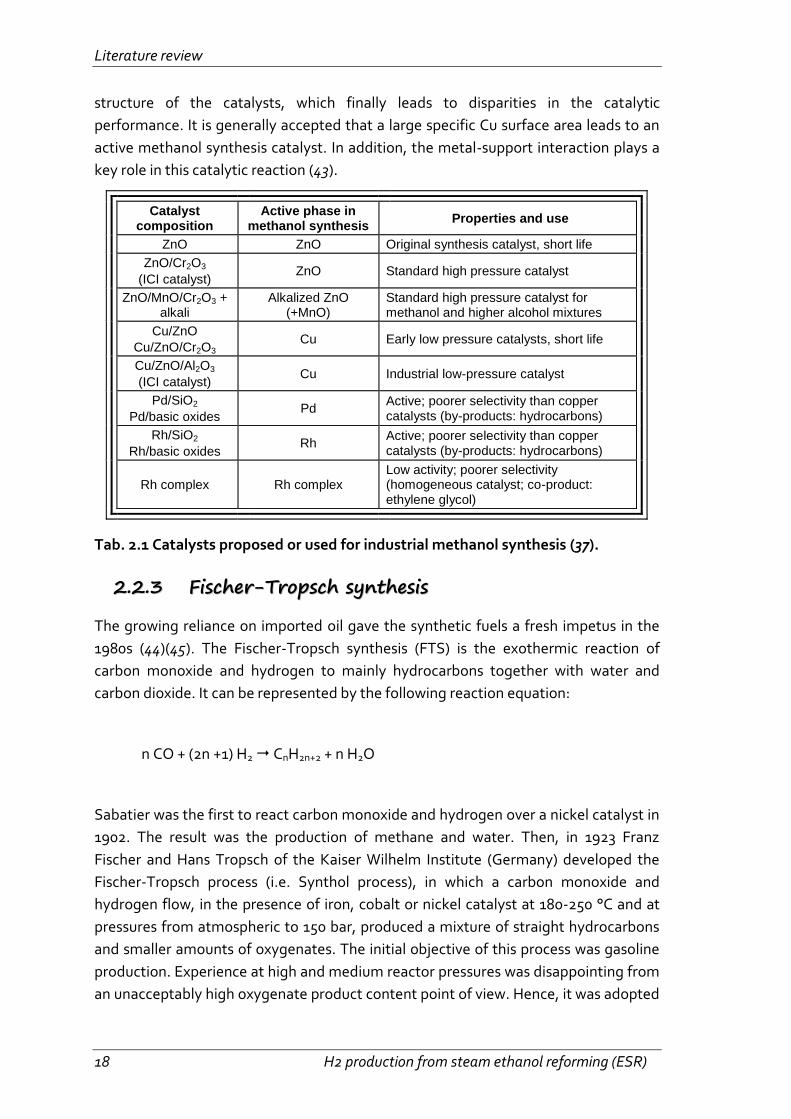
There are two class of catalysts studied and used for methanol synthesis: high-
pressure and low-pressure catalysts (Tab. 2.1). The difference in preparation methods,
synthesis conditions, and pre-treatment have a considerable influence on the
Literature review
18 H2 production from steam ethanol reforming (ESR)
structure of the catalysts, which finally leads to disparities in the catalytic
performance. It is generally accepted that a large specific Cu surface area leads to an
active methanol synthesis catalyst. In addition, the metal-support interaction plays a
key role in this catalytic reaction (43).
Tab. 2.1 Catalysts proposed or used for industrial methanol synthesis (37).
22..22..33 FFiisscchheerr--TTrrooppsscchh ssyynntthheessiiss
The growing reliance on imported oil gave the synthetic fuels a fresh impetus in the
1980s (44)(45). The Fischer-Tropsch synthesis (FTS) is the exothermic reaction of
carbon monoxide and hydrogen to mainly hydrocarbons together with water and
carbon dioxide. It can be represented by the following reaction equation:
n CO + (2n +1) H2 CnH2n+2 + n H2O
Sabatier was the first to react carbon monoxide and hydrogen over a nickel catalyst in
1902. The result was the production of methane and water. Then, in 1923 Franz
Fischer and Hans Tropsch of the Kaiser Wilhelm Institute (Germany) developed the
Fischer-Tropsch process (i.e. Synthol process), in which a carbon monoxide and
hydrogen flow, in the presence of iron, cobalt or nickel catalyst at 180-250 °C and at
pressures from atmospheric to 150 bar, produced a mixture of straight hydrocarbons
and smaller amounts of oxygenates. The initial objective of this process was gasoline
production. Experience at high and medium reactor pressures was disappointing from
an unacceptably high oxygenate product content point of view. Hence, it was adopted
Catalyst composition
Active phase in methanol synthesis
Properties and use
ZnO ZnO Original synthesis catalyst, short life
ZnO/Cr2O3
(ICI catalyst) ZnO Standard high pressure catalyst
ZnO/MnO/Cr2O3 + alkali
Alkalized ZnO (+MnO)
Standard high pressure catalyst for methanol and higher alcohol mixtures
Cu/ZnO
Cu/ZnO/Cr2O3 Cu Early low pressure catalysts, short life
Cu/ZnO/Al2O3
(ICI catalyst) Cu Industrial low-pressure catalyst
Pd/SiO2
Pd/basic oxides Pd
Active; poorer selectivity than copper catalysts (by-products: hydrocarbons)
Rh/SiO2
Rh/basic oxides Rh
Active; poorer selectivity than copper catalysts (by-products: hydrocarbons)
Rh complex Rh complex Low activity; poorer selectivity (homogeneous catalyst; co-product: ethylene glycol)

Literature review
H2 production from steam ethanol reforming (ESR) 19
an atmospheric reactor pressure. Cobalt became strongly favoured as catalytic
element, since iron was less active and deactivated rapidly at atmospheric pressure
synthesis operation, while nickel gave high methane selectivity and was affected by
its loss due to volatile nickel tetracarbonyls production (46) (47).
The best catalyst was found to be based on cobalt, supported on Kieselguhr with
thoria and magnesium oxide as promoters (100g Co / 5g ThO / 8g MgO / 200g
Kieselguhr).
In recent years, we assist to a second renewal of interest in the F-T process for
producing liquid hydrocarbons. This new interest centres on making synthetic fuels
from natural gas instead of coal.
The process of converting natural gas or coal into marketable liquid hydrocarbons
comprises three main elements: 1) synthesis gas production, 2) hydrocarbon synthesis
via the F-T conversion process, 3) products work-up.
As far as syngas production is concerned, other feedstocks such as coal, heavy residue
or shale oil can be used, but the process becomes less economical.
Sasol is the largest producer of synfuels and chemicals made by coal gasification
(Lurgi’s technology is employed). Besides coal plants, since 1993 Sasol has also
operated natural gas-based plants at Mossgas, South Africa, with a capacity of 44.000
BPD of fuels. The company is by far the most experienced player in the syngas-based
chemical business, as far as reactors design, catalytic formulations, process
technology are concerned.
Sasol has been opting for iron-based catalyst since 1955. Only in recent years the
advantages of cobalt based catalyst for use in slurry phase reactor have been
recognized.
For the preparation of Synthol catalyst, Sasol uses iron oxides: the suitable iron oxide
is fused together with the required chemical and structural promoters. The fused
ingots are milled to a specified particle size range (for optimum fluidization
properties). The catalyst is pre-reduced with H2 at about 400 °C and then loaded in
the F-T reactors. Because of the simplicity of the preparation and the low cost of the
row materials, the cost of Synthol catalyst is a minor part of the overall process (48).
Studies performed at Sasol on the commercial spray dried precipitated iron catalyst
and Co/Al2O3 slurry phase FTS catalyst, resulted in the following conclusions:
1. the cobalt does not show any significant water-gas-shift activity and no water
inhibition of the F-T reaction rate,
2. the cobalt catalyst is the preferred option if high per pass conversions are
required,

Literature review
20 H2 production from steam ethanol reforming (ESR)
3. desired stabilized intrinsic activity levels can be achieved with cobalt catalyst,
implying that extended slurry phase synthesis runs can be realized,
4. cobalt derived hydrocarbon product selectivities show greater sensitivity
towards process conditions (i.e. reactor pressure) than that of iron. Iron catalyst, on
the other hand, shows marked sensitivity towards chemical promotion. Indeed, the
geometric tailoring of pre-shaped support materials can be an optimization tool for
effecting increased wax selectivities with cobalt based catalyst, an approach also
suggested by others (Exxon, Shell).
The conversion of synthesis gas to hydrocarbons (Fischer-Tropsch synthesis) has been
widely studied and extensively described. A number of synthesis reactions can occur
and the whole are quite exothermic, ΔH = -170 kJ (C/atom):
Methanation: CO + 3 H2 CH4 + H2O
Paraffins: n CO + (2n + 1) H2 CnH2n+2 + n H2O
Olefins: n CO + 2n H2 CnH2n + n H2O
Alcohols: n CO + 2n H2 CnH2n+1OH + (n-1) H2O
Some other reactions, such as the water-gas shift or Boudouard reaction also occur:
WGS: CO + H2O CO2 + H2
Boudouard: 2 CO C(s) + CO2
The free energy changes (ΔG°) in the above reactions are such that the hydrocarbon
synthesis is normally favoured below about 400 °C. Over the temperature range of
200-400 °C, the formation of methane is favoured. However, since the
thermodynamic equilibrium is reached slowly in FT synthesis, it is possible to take
advantage of kinetic factors by using suitable catalysts, so that heavier hydrocarbons
or alcohols are produced in suitable quantity(45).
The production of hydrocarbons using traditional FT catalysts, such as Fe or Co, is
governed by chain growth or polymerization kinetics. The so-called “surface carbide”
mechanism is a plausible one for the interaction of CO and H2 with the catalytic
surface and the subsequent synthesis of hydrocarbons. Ample evidence shows that
this is the prevalent mode of activation of CO at elevated temperatures on the Group
VIII metal catalysts Fe, Co, Ni and Ru (44)(45). The model can be used as a starting
point for understanding the formation of various molecular species during FT
synthesis and also for examining hydrocarbon chain growth(45).
The nature of the product and the product distribution among the carbon numbers
will depend upon the catalyst surface, composition (H2/CO ratio) and the rate of flow
feed gas, reaction pressure and the temperature at which FT synthesis is performed.
The above parameters will affect the rate of hydrogen and CO dissociation,
hydrogenation, degree of polymerization and desorption of the product species(45).

Literature review
H2 production from steam ethanol reforming (ESR) 21
At low temperatures, the main primary products are linear 1-alkenes, alkanes,
alcohols and aldehydes. The linearity of the product is important for many of their
applications. It gives the waxes with high melting point and low viscosity.
The C9 to C15 olefins are ideal for the manufacture of biodegradable detergents. The
C10 to C18 cut is an excellent diesel fuel (with the high cetane number of 75 and zero
aromatics). On the other hand, the product linearity is a disadvantage for gasoline
production, since a high octane number requires branched alkane and aromatics.
Hence, the gasoline requires extensive isomerisation and aromatization.
At higher synthesis temperatures secondary reactions occur, i.e branched
hydrocarbons and aromatics are formed. In that way, the diesel cetane number
decreases, while the gasoline octane number increases. Olefins in the hydrocarbons
reach a maximum at C3 or C4 (up to 90 %), to then decrease continuously, the waxes
being essentially paraffinic (47).
22..22..44 DDiimmeetthhyyll EEtthheerr ssyynntthheessiiss
Dimethyl ether (DME) is an alternative fuel that could potentially replace petroleum-
based fuels(49). Dimethyl ether is the simplest ether (CH3OCH3). The physical
properties of DME are similar to those of liquefied petroleum gases (propane and
butane). It burns with a visible blue flame and is non-peroxide forming in the pure
state or in aerosol formulations. Unlike methane, DME does not require an odorant
because it has a sweet ether-like odour. It is a volatile organic compound, but is non-
carcinogenic, non-teratogenic, non-mutagenic and non-toxic(49).
Currently, the major usage of DME is as a propellant in the aerosols industry. In
addition, it can be used as a clean-burning fuel in diesel engines, as a household fuel
(LPG alternative) for heating and cooking, as a fuel for gas and turbines in power
generation, as a fuel for fuel cells, and as a chemical feedstock for higher ethers and
oxygenates (42)(50).
Traditionally, DME has been produced in a two steps process where syngas is first
converted to methanol, followed by methanol dehydration to dimethyl ether.
CO + 2 H2 CH3OH ΔH°298K = - 90.6 kJ/mol
CH3OH CH3OCH3 + H2O ΔH°298K = + 23.4 kJ/mol
H2O + CO H2 + CO2 ΔH°298K = - 41.2 kJ/mol
Net reaction:

Literature review
22 H2 production from steam ethanol reforming (ESR)
3 CO + 3 H2 CH3OCH3 + CO2 ΔH°298K = + 258.6 kJ/mol
Natural gas is not the only resource that can be used to generate syngas, coal and
biomass can also be used. Hence, DME production is not limited to one feedstock and
the price of DME synthesis process is directly related to the price of the feedstock.
New processes are being commercialized to produce DME in a single step via
autothermal reactors and slurry phase reactors.
DME can be introduced and exploited with existing technologies, and enable the
eventual implementation of advanced technologies, such as fuel cells. Because DME is
produced from natural gas, coal or biomass, it can increase the energy security by
displacing petroleum derived fuels.
The prominent advantages of DME as a fuel and energy carrier are(49):
1. DME, due to its high cetane number(51), can be used in the most efficient
engine technology currently produced. DME demonstrated lower NOx and SOx than
conventional diesel, is sootless (52).
2. Using exiting engine technology, DME produces the least amount of well-to-
wheel greenhouse gas emissions compared to FT diesel, FT naphtha, bio-diesel, bio-
naphtha, methanol, methane and ethanol.
3. Excluding natural gas, DME has the highest well-to-wheel efficiency of all non-
petroleum based fuels using conventional, hybrid and fuel processor fuel cell vehicle
technologies.
4. DME can be used as a residential fuel for heating and cooking.
5. On-board automotive fuel processors using methanol and DME exhibit the
lowest start-up energies and the lowest fuel processor volumes - correlating to higher
overall efficiencies as compared to ethanol, methane and gasoline fuel processor fuel
cell vehicles.
6. The infrastructure of DME is less cost intensive than that for hydrogen because
DME can use the existing LPG and natural gas infrastructures for transport and
storage.
Synthesis of DME from syngas in a single step is more favourable in thermodynamic
and economical (50)(51).
Single-stage DME synthesis in the vapour phase suffers from low per pass
conversions(44), due, in part, by the effects of high temperature on the catalysts. Gas-
phase DME synthesis processes, in general, suffer from the drawbacks of low
hydrogen and CO conversions per pass, along with low yield and selectivity of DME,
coupled with a high yield of carbon dioxide. These processes are typically expensive
due to high capital costs for reactors and heat exchangers, and high operating costs

Literature review
H2 production from steam ethanol reforming (ESR) 23
due to inefficient CO utilization and high recycle rates. Using an inert liquid as a heat
sink for highly exothermic reactions offers a number opportunities in syngas
processing. Heat generated by the exothermic reactions is readily accommodated by
the inert liquid medium. This enables the reaction to be run isothermally; minimizing
catalyst deactivation commonly associated with the more adiabatic gas phase
technologies(42).
The process is based on dual-catalytic synthesis in a single reactor stage, and based on
a combination of an equilibrium limited reaction (methanol synthesis) and an
equilibrium unlimited reaction (methanol dehydration). The methanol synthesis and
the water gas shift reaction take place over the co-precipitated Cu/Zn/Al2O3 catalyst
and the methanol dehydration takes place over γ- Al2O3 or zeolites catalysts
(50)(51)(52). Moreover, by varying the mass ratios of methanol synthesis catalyst, it is
possible to co-produce DME and methanol in any fixed proportion, from 5 % DME to
95 % DME(42).
22..22..55 DDiirreecctt RReedduuccttiioonn ooff iirroonn oorree ((DDRRII))
Direct reduction of iron ore is today's major process for generating metallic iron,
necessary in the iron and steel industry. World production of direct reduced iron (DRI)
has grown from near zero in 1970 to 45.1 Mt in 2002 (34) (53).
In the production processes for converting iron ores into iron and steel, carbon,
primarily in the form of coke, has been traditionally used to reduce the iron oxides to
iron metal. However, in the last several decades, there has been increasing production
of iron using the direct reduction iron (DRI) process. In 1998, about 4 % of the primary
iron in the world was produced by the DRI process with rapid growth in iron
production. In the DRI process, syngas (a mixture of hydrogen and carbon monoxide)
made from natural gas is used to reduce iron ores to iron. The major chemical
reactions are as follows:
Fe3O4 + CO 3 FeO + CO2
Fe3O4 + H2 3 FeO + H2O
FeO + CO Fe + CO2
FeO + H2 Fe + H2O
The DRI process has lower capital costs than alternative methods used to produce
iron, but requires a low-cost source of hydrogen. The primary market for DRI is to
provide a purified iron feed for electric arc furnaces (EAFs) that produce various steel
products. EAFs have lower capital costs than traditional steel mills and are
environmentally cleaner operations than blast furnaces. Over a third of the world's
steel production uses this process. It is predicted that by 2010 up to 45 % of the
world's steel may be made with EAFs. Historically, scrap metal has been the

Literature review
24 H2 production from steam ethanol reforming (ESR)
traditional feed for EAFs. However, there are two constraints: the availability of scrap
metal and the various difficult-to-remove impurities (copper, nickel, chrome,
molybdenum, etc.) that are present in the lower-grade scrap metal. Blending clean
DRI-process iron with scrap metal dilutes the impurities below the level that affect
product quality. Traditional steel-making processes using coke result in iron with a
high carbon content and various other impurities from the coke.
Iron production is potentially a significant existing market for hydrogen. If low-cost
hydrogen is available, the DRI process would replace other methods of iron
production. The economics of DRI relative to other processes (and the potential
demand for hydrogen) depend upon three factors.
Technological developments. The continuing improvements in EAF technology in
terms of reduced production costs and increased capabilities to produce higher-
quality steel have expanded the market share of this technology. That, in turn, creates
the demand for more high-purity iron by the DRI process as traditional sources of
scrap metal are exhausted.
Environmental protection. Traditional steel processes use coal and generate large
quantities of pollutants. Clean air requirements strongly affect the economics of these
competing processes.
Hydrogen costs. The process is used where there is low-cost natural gas for hydrogen
production near iron deposits.
22..22..66 HHyyddrrooddeessuullffuurriizzaattiioonn
Combustion of sulfur-containing compounds in fossil fuels emits sulfur oxides, which
can cause adverse effects on health, environment and economy.
Generally, removal of organic sulfur from fossil fuel is difficult, because sulfur can only
be detached from the organic molecule when certain chemical bonds are cleaved.
Breakage of such bonds requires high temperature and pressure. One of the current
technologies to reduce sulfur in middle distillate/diesel fuels such as gasoline or petrol,
jet fuel, kerosene, diesel fuel, and fuel oils, is known as hydrodesulphurization (HDS).
In HDS, the sulfur atom in sulfur compounds is reduced to H2S on CoMo/Al2O3 or
NiMo/Al2O3 catalyst in the presence of H2 gas. H2S is then catalytically air oxidized to
elemental sulfur(54).
Another important reason for removing sulfur from the naphtha streams within a
petroleum refinery is that sulfur, even in extremely low concentrations, poisons the
noble metal catalysts (platinum and rhenium) in the catalytic reforming units that are
subsequently used to upgrade the octane rating of the naphtha streams(54).
In an industrial hydrodesulfurization unit, such as in a refinery, the
hydrodesulphurization reaction takes place in a fixed-bed reactor at elevated

Literature review
H2 production from steam ethanol reforming (ESR) 25
temperatures ranging from 300 to 400 °C and elevated pressures ranging from 30 to
130 atmospheres of absolute pressure, typically in the presence of a catalyst
consisting of an alumina base impregnated with cobalt and molybdenum (usually
called a CoMo catalyst). Occasionally a combination of nickel and molybdenum (called
NiMo) is used, in addition to the CoMo catalyst, for specific difficult-to-treat feed
stocks such as those containing a high level of chemically bound nitrogen. To reach
lower concentration of sulfur (< 15 mg/kg) higher temperature and pressure are
required. Among the catalytic desulfurization processes, selective HDS processes like
SCANfining® and Prime G+® seem to be very efficient and are already in practice
world-wide. Indeed, both of these processes which are based on conventional
catalytic fixed-bed technology and need low cost investments, are by far the most
attractive for the industry(55).
Most metals catalyse HDS, but it is those at the middle of the transition metal series
that are most active. Ruthenium disulfide appears to be the single most active
catalyst, but binary combinations of cobalt and molybdenum are also highly
active(56). Aside from the basic cobalt-modified MoS2 catalyst, nickel and tungsten
are also used, depending on the nature of the feed. For example, Ni-W catalysts are
more effective for hydrodenitrification (HDN).
Metal sulfides are "supported" on materials with high surface areas. A typical support
for HDS catalyst is γ-alumina. The support allows the more expensive catalyst to be
more widely distributed, giving rise to a larger fraction of the MoS2 that is catalytically
active. The interaction between the support and the catalyst is an area of intense
interest, since the support is often not fully inert but participates in the catalysis.
22..22..77 HHyyddrrooddeenniittrrooggeennaattiioonn
Hydrodenitrogenation (HDN) occurs simultaneously with hydrodesulfurization (HDS),
hydrodeoxygenation (HDO), hydrogenation (HYD) and hydrodemetallization (HDM)
during hydroprocessing. Effects of these reactions upon each other are rather
complex. The extent of the mutual effects depends on the origin of feed, type of
catalyst, and operating conditions. The HDN has been the focus of attention because
nitrogen removal is required to attain the level of sulfur (S) required by fuel
specifications. If not removed, nitrogen (N)-compounds would inhibit HDS and other
reactions because of their preferential adsorption on catalytic sites (57). Nitrogen
removal is required to maintain NOx emissions below regulatory levels. Also, if
present, N-compounds affect the stability of fuels.
The Ni(Co)Mo(W)-based catalysts have been widely used for hydroprocessing of the
conventional feeds. However, the quality of crude oils has been changing with the
continuous increase in the processed volume of heavy crudes. The anticipated
changes in fuel specifications would require modifications of the reactors and

Literature review
26 H2 production from steam ethanol reforming (ESR)
operating conditions, particularly increased hydrogen pressure and longer contact
time, unless improvements in the performance of catalysts can be made. In this
regard, efforts have been made to increase the catalyst activity and selectivity.
Encouraging results have been obtained by combining catalysts with various
additives. Replacement of the most often used γ-Al2O3 with either more acidic
supports such as SiO2, zeolites, etc., or more neutral supports, such as carbon,
resulted in the improved catalyst performance. The efficiency of N removal can be
further increased by optimizing operating parameters (e.g., H2S/H2 ratio). The
research has progressed to the point that tailor-made catalysts, suitable for the HDN
of a particular feed can be designed (57). The process flow of hydrodenitrogenation is
the same as that for an HDS unit.
22..22..88 FFuueell cceellllss
The principle of the fuel cell was discovered by German scientist Christian Friedrich
Schönbein in 1838 and published in one of the scientific magazines of the time (58).
Based on this work, the first fuel cell was demonstrated by Welsh scientist and
barrister Sir William Robert Grove in the February 1839 edition of the Philosophical
Magazine and Journal of Science (59).
A fuel cell is defined as an electrochemical device in which the chemical energy stored
in a fuel is converted directly into electricity. Fuel cells operate without combusting
fuel and with few moving parts, and thus they are very attractive from both energy
and environmental standpoints (60). A fuel cell can be two or three times more
efficient than an internal combustion engine in converting fuel to electricity.
A fuel cell consists of an electrolyte
material, which is sandwiched between
two thin electrodes (porous anode and
cathode). Specifically a fuel cell consists
of an anode - to which a fuel,
commonly hydrogen, is supplied - and a
cathode - to which an oxidant,
commonly oxygen, is supplied. The
oxygen needed by a fuel cell is
generally supplied by feeding air. The
two electrodes of a fuel cell are
separated by an ion-conducting
electrolyte.
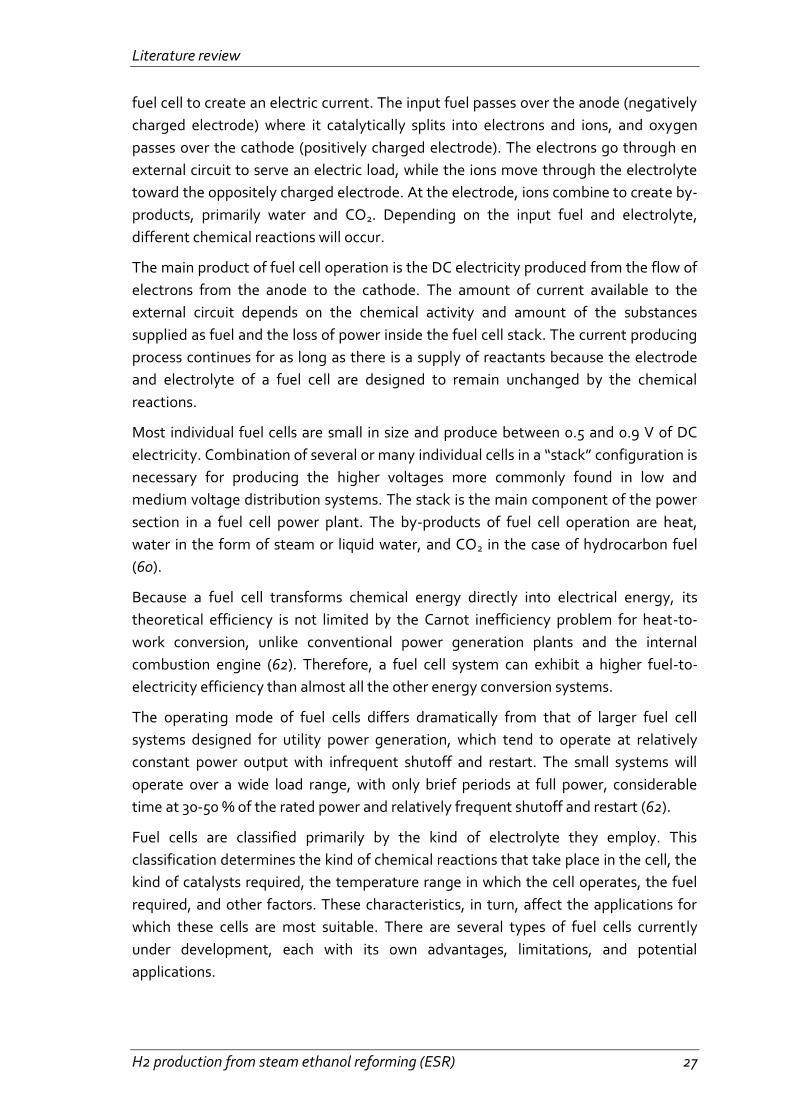
All fuel cells have the same basic
operating principle (Fig. 2.13) (61). An
input fuel is catalytically reacted (electrons removed from the fuel elements) in the
Fig. 2.13 Scheme of fuel cell (59).
Literature review
H2 production from steam ethanol reforming (ESR) 27
fuel cell to create an electric current. The input fuel passes over the anode (negatively
charged electrode) where it catalytically splits into electrons and ions, and oxygen
passes over the cathode (positively charged electrode). The electrons go through en
external circuit to serve an electric load, while the ions move through the electrolyte
toward the oppositely charged electrode. At the electrode, ions combine to create by-
products, primarily water and CO2. Depending on the input fuel and electrolyte,
different chemical reactions will occur.
The main product of fuel cell operation is the DC electricity produced from the flow of
electrons from the anode to the cathode. The amount of current available to the
external circuit depends on the chemical activity and amount of the substances
supplied as fuel and the loss of power inside the fuel cell stack. The current producing
process continues for as long as there is a supply of reactants because the electrode
and electrolyte of a fuel cell are designed to remain unchanged by the chemical
reactions.
Most individual fuel cells are small in size and produce between 0.5 and 0.9 V of DC
electricity. Combination of several or many individual cells in a “stack” configuration is
necessary for producing the higher voltages more commonly found in low and
medium voltage distribution systems. The stack is the main component of the power
section in a fuel cell power plant. The by-products of fuel cell operation are heat,
water in the form of steam or liquid water, and CO2 in the case of hydrocarbon fuel
(60).
Because a fuel cell transforms chemical energy directly into electrical energy, its
theoretical efficiency is not limited by the Carnot inefficiency problem for heat-to-
work conversion, unlike conventional power generation plants and the internal
combustion engine (62). Therefore, a fuel cell system can exhibit a higher fuel-to-
electricity efficiency than almost all the other energy conversion systems.
The operating mode of fuel cells differs dramatically from that of larger fuel cell
systems designed for utility power generation, which tend to operate at relatively
constant power output with infrequent shutoff and restart. The small systems will
operate over a wide load range, with only brief periods at full power, considerable
time at 30-50 % of the rated power and relatively frequent shutoff and restart (62).
Fuel cells are classified primarily by the kind of electrolyte they employ. This
classification determines the kind of chemical reactions that take place in the cell, the
kind of catalysts required, the temperature range in which the cell operates, the fuel
required, and other factors. These characteristics, in turn, affect the applications for
which these cells are most suitable. There are several types of fuel cells currently
under development, each with its own advantages, limitations, and potential
applications.

Literature review
28 H2 production from steam ethanol reforming (ESR)
Proton-Exchange Membrane Fuel Cell (PEMFC) - PEMFC uses a solid polymer
membrane as electrolyte. This membrane is an electronic insulator, but an excellent
conductor of protons (hydrogen cations). The ion-exchange membrane used is
fluorinated sulfonic acid polymer. The acid molecules are fixed to the polymer and
cannot leak out, but the protons on these acid groups are free to migrate through the
membrane. The solid electrolyte exhibits excellent resistance to gas crossover.
Typically, the anode and cathode catalysts consist of one or more precious metals,
particularly platinum supported on carbon. Because of the limitation on the
temperature imposed by the polymer and water balance, the operating temperature
of PEMFC is less than 120 °C, usually between 70 and 90 °C. The PEMFC technology is
primarily suited for residential/commercial (business) and transportation applications.
The use of a solid polymer electrolyte eliminates the corrosion and safety concerns
associated with liquid electrolyte fuel cells.
In addition to pure hydrogen, the PEMFC can also operate on reformed hydrocarbon
fuels without removal of the by-product CO2. However, the anode catalyst is sensitive
to CO, so the traces of carbon monoxide produced during the reforming process must
be converted to carbon dioxide by selective oxidation.
Water management is critical: the fuel cell must operate under conditions where the
by-product water does not evaporate faster than it is produced because the
membrane must be hydrated (60).
Phosphoric Acid Fuel Cell (PAFC) - The PAFC uses liquid, concentrated phosphoric acid
as the electrolyte. The phosphoric acid is usually contained in a Teflon bonded silicon
carbide matrix. The small pore structure of this matrix preferentially keeps the acid in
place through capillary action. Some acid may be entrained in the fuel or oxidant
streams and addition of acid may be required after many hours of operation.
Platinum supported on porous carbon is used on both anode and cathode sides of the
electrolyte. PAFC operates at 180-220 °C, typically around 200 °C, so PAFC plant also
produces heat for domestic hot water and space heating (60).
Alkaline Fuel Cell (AFC) - The AFC uses aqueous solution of potassium hydroxide (KOH)
as electrolyte, which is retained in a solid matrix (usually asbestos), and a wide range
of electro-catalysts can be used, including nickel, metal oxides, spinels and noble
metals electrode.
The operating range of temperatures can be higher than PAFC: they can work up to
250 °C by using concentrated KOH (85%), or at temperature lower than 120 °C by
using less concentrated KOH (35-50%).
The fuel supply is limited to hydrogen, CO is a poison and CO2 reacts with KOH to
form K2CO3, thus changing the electrolyte (60).

Literature review
H2 production from steam ethanol reforming (ESR) 29
Molten Carbonate Fuel Cell (MCFC) - the MCFC uses a molten carbonates salt mixture
as electrolyte. The composition of the electrolyte varies, but usually consist of lithium
carbonate and potassium carbonate (Li2CO3-K2CO3). At the operating temperature of
about 650 °C, the salt mixture is liquid and a good ionic conductor. The electrolyte is
suspended in a porous, insulating and chemically inert ceramic (LiAl2O) matrix. At the
high operating temperature, noble metals are not required for electrodes, nickel or its
alloy with chromium or aluminium can be used as anode, and nickel oxide as cathode.
The cell performance is sensitive to operating temperature; a change in cell
temperature from 650 to 600 °C results in a drop in cell voltage of almost 15 %. The
reduction in cell voltage is due to increase ionic and electrical resistance and a
reduction in electrode kinetics. The disadvantages of MCFC are that the electrolytes is
corrosive and mobile, and a source of CO2 is requires at the cathode to form the
carbonate ion (60).
Solid Oxide Fuel Cell (SOFC) - SOFC uses a ceramic, solid phase electrolyte, which
reduces corrosion considerations and eliminates the electrolyte management
problems associated with the liquid electrolyte fuel cells. To achieve adequate ionic
conductivity in such a ceramic, however, the system must operate at high
temperatures in the range of 650-1000 °C, typically 800-1000 °C in the current
technology. The preferred electrolytes material, dense yttria (Y2O3) - stabilized
zirconia (ZrO2), is an excellent conductor of negatively charged oxygen (oxide) ions at
high temperatures. The SOFC is a solid-state device and shares certain properties and
fabrication techniques with semiconductor devices.
The anode is typically a porous nickel-zirconia (Ni-ZrO2) cermet (ceramic-metal
composite) or cobalt zirconia (Co-ZrO2) cermet, while the cathode is typically
magnesium-doped lanthanum manganate or strontium-doped lanthanum manganate
(LaMnO3).
At the operating temperature, internal reforming of most hydrocarbon fuels should be
possible, and the waste heat from such a device would be easily utilized by
conventional thermal electricity generating plants to yield excellent fuel efficiency. On
the other hand, the high operating temperature has its own drawbacks due to the
demand and thermal stressing on the materials including the sealants and the longer
start up time. Because the electrolyte is solid, the cell can be cast into various shapes
such as tubular, planar, or monolithic. Operation up to 1000 °C allows more flexibility
in the choice of fuels and can produce better performance in combined-cycle
applications (60).
Direct Methanol Fuel Cells (DMFC) - Most fuel cells are powered by hydrogen, which
can be fed to the fuel cell system directly or can be generated within the fuel cell
system by reforming hydrogen-rich fuels such as methanol, ethanol, and hydrocarbon
fuels. Direct methanol fuel cells, however, are powered by pure methanol, which is
mixed with steam and fed directly to the fuel cell anode.

Literature review
30 H2 production from steam ethanol reforming (ESR)
Direct methanol fuel cells do not have many of the fuel storage problems typical of
some fuel cells because methanol has a higher energy density than hydrogen-though
less than gasoline or diesel fuel. Methanol is also easier to transport and supply to the
public using our current infrastructure because it is a liquid, like gasoline.
Direct methanol fuel cell technology is relatively new compared with that of fuel cells
powered by pure hydrogen, and DMFC research and development is roughly 3-4 years
behind that for other fuel cell types(63).
Direct Ethanol Fuel Cells (DEFC) - The use of ethanol as fuel shows some advantages as
30% higher energy density than methanol, the production from biomass fermentation
and the non toxicity. In this type of cell the anode catalysts has been identified in the
Pt-Sn-Rh system. Tin increases the activity of ethanol oxidation whereas rhodium
promotes the splitting of carbon-carbon bond. One of major problem is the
incomplete oxidation of ethanol to CO2. However the very good performance data
make DEFC very promising for applications in the low power range (4).
The general advantages of fuel cells are reflected by the following desirable
characteristic:
1. High energy conversion efficiency;
2. Extremely low emissions of pollutants;
3. Extremely low noise or acoustical pollutions;
4. Effective reduction of greenhouse gas (CO2) formation at the source compared
to low-efficiency devices;
5. Process simplicity for conversion of chemical energy to electrical energy (60).
Depending on the specific types of fuel cells, other advantages may include fuel
flexibility and existing infrastructure of hydrocarbon fuel supplies, co-generation
capability, modular design for mass production and relatively rapid load response.
Therefore, fuel cells have great potential to
penetrate into markets for both stationary
power plants (for industrial, commercial
and residential home applications) and
mobile power plants for transportation by
cars, buses, trucks, trains and ship, as well
as man-portable micro-generators (60) (Fig.
2.14) (64).
Unlike power plants that use combustion
technologies, fuel cells plants that generate
electricity and usable heat can be built in a
wide range of sizes - from 200 kW units
suitable for powering commercial buildings,
to 100 MW plants that can add base-load Fig. 2.14 Fuel cells technology (58).

Literature review
H2 production from steam ethanol reforming (ESR) 31
capacity to utility power plants (60).
The disadvantages or challenges to be overcome include the costs of fuel cells and
that the hydrogen fuel is not readily available and thus on-site or on-board H2
production via reforming is necessary. There are no readily and affordable ways for
on-board or on-site desulphurization of hydrocarbon fuels and this presents a
challenge for using hydrocarbon fuels. The efficiency of fuel processing affects the
over system efficiency (60).
For a conventional combustion system, a wide range of gaseous, liquid and solid fuels
may be used, while hydrogen, reformate (hydrogen rich gas from fuel reforming) and
methanol are the primary fuels available for current fuel cells (Fig. 2.15). The sulphur
compounds, in hydrocarbon fuels, poison the catalysts in the fuel processor and fuel
cells and must be removed. Syngas can be generated from reforming. Reformate can
be used as the fuel for high-temperature fuel cells such as SOCF and MCFC, for which
the solid or liquid or gaseous fuels need to be reformulated. Hydrogen is the real fuel
for low-temperature fuel cells such as PEMFC and PAFC, which can be obtained by
fuel reformulation on-site for stationary applications or on-board for automotive
applications. When natural gas or other hydrocarbon fuel is used in a PAFC system,
the reformate must be processed by water gas shift reaction. A PAFC can tolerate
about 1-2 % of CO. When used in a PEMFC, the product gas from WGS must be
further processed to reduce CO to < 10 ppm. Synthetic ultra-clean fuels can be made
by Fischer-Tropsch synthesis or methanol synthesis using the synthesis gas produced
from natural gas or from coal gasification, but the synthetic cleanness is obtained at
the expense of extra cost for the extra conversion and processing steps (60).
Fig. 2.15 The concept and the steps for fuel processing of gaseous, liquid and solid fuels for high and low temperature fuel cell applications (60).

Literature review
32 H2 production from steam ethanol reforming (ESR)
22..33 HH22 pprroodduuccttiioonn
Although hydrogen can be produced from a large variety of sources by using different
methods, up to now the most extensively used process is the steam reforming of
hydrocarbons. Biomass can be also used to produce H2 by thermochemical or
biological processes. Metabolic processing appears as an interesting alternative for
the treatment of wastes while generating H2 as product. Some other approaches for
hydrogen production from water or other hydrogen-containing materials such as
photodecomposition or thermochemical processes are also in development. Solar
photodecomposition of water still has many technical hurdles remaining that suggest
it is decades away from large scale, cost-effective implementation (6).
The conversion of hydrocarbons to hydrogen and syngas will play an important role in
the 21st century ranging from large gas to liquid plants and hydrogen plants for
refineries to small units providing hydrogen for fuel cells. The choice of technology for
manufacture of syngas depends on the scale of operation (7).
Fig. 2.16 Capital cost of a hydrogen plant as a function of capacity (6).
Currently, steam reforming of hydrocarbons (SR) especially steam methane reforming
(SMR) is the largest and generally the most economical way to make H2. Alternative
non-catalytic, industrial chemical approaches include partial oxidation (POX) of heavy
oil or coal. When electricity is available and relatively inexpensive, electrolysis of water
offers an alternative commercial approach (65)(66).
Industrially, two main reactions are important in the conversion of natural gas to
syngas (67) : steam reforming (SR) and non-catalytic partial oxidation (POX).
While most syngas is produced by steam reforming, two other process may be more
attractive, depending on factors such as H2:CO ratio, downstream use, product purity,
the presence of CO2, N2, H2O and CH4, plant capacity, feedstock availability, purity

Literature review
H2 production from steam ethanol reforming (ESR) 33
and cost, including O2. These processes are: autothermal catalytic reforming (ATR)
and catalytic partial oxidation (CPO).
The main processes are listed in :
Process Reactor Feedstock Temperature
(°C) Catalyst
Steam
Reforming
Heated reactor
of many types
Light
hydrocarbons 500-900
Ni/ceramic
support
Prereforming Adiabatic
reactors
Natural gas,
diesel 400-500 Ni/support
Water gas
shift
Adiabatic
reactors Syngas 230-500
Fe3O4,
Cu/ZnO/Al2O3
Autothermal
reforming
Brick-lined
reactor with
burner and
catalyst bed
Light
hydrocarbons -1050
Ni/ceramic
support
Catalytic
partial
oxidation
Monolithic
catalyst
reactor
Light
hydrocarbons,
diesel
-950 Rh/ceramic
support
Partial
oxidation
(gasification)
Brick-lined
reactor with
burner
Heavy
hydrocarbons,
coal, petcoke,
biomass
1300 None
Tab. 2.2 Characteristic of processes from hydrogen fossil fuels (4).
22..33..11 SStteeaamm rreeffoorrmmiinngg pprroocceessss ((SSRR))
In areas where natural gas is available in large quantities, interest is centred on steam
reforming of methane as hydrogen source (37). The process is more economic than
that based on coal. The hydrogen content of the hydrocarbon improved the yield of
hydrogen per unit of carbon in the feedstock compared with coal, and there were also
fewer unwanted by-products. The methane steam technology was pioneered in the
first quarter of 20th century by BASF who established the essential configuration of
the primary steam reformer.
The steam reforming reaction took place over catalyst in vertical tubes, which were
supported in parallel rows in a radiant furnace. The endothermic heat of reaction was
supplied by burning fuel in the furnace. The process was considerably improved by ICI,
who developed the fundamental engineering data for the design of the furnace,

Literature review
34 H2 production from steam ethanol reforming (ESR)
improved the catalyst formulation and introduced the desulphurization step using zinc
oxide. The catalyst tube have a typical diameter of 10 cm and a length of 10 m. They
are made of high-alloy steel to withstand the high tube wall temperatures and the
high thermal stresses. The reformer tubes are filled with catalyst which must show
high mechanical stability because of exposure to high temperatures and steam partial
pressures (68). In many situations when natural gas is not available , higher
hydrocarbons become the preferred feedstocks for the reforming process. Many
refineries benefit from flexibility in feedstock, taking advantage of the surplus of
various hydrocarbons streams in the refinery. The higher hydrocarbons are more
reactive (per carbon atom) than methane, except for aromatic molecules. This means
that liquid hydrocarbons in principle can be easily converted by steam reforming , but
in practice this is limited by the higher potential for poisoning by sulfur and the higher
risk of carbon formation (4).
Fig. 2.17 Typical process layout for a hydrogen plant based on advanced tubular steam reforming technology (6).
22..33..11..11 TThheerrmmooddyynnaammiicc ccoonnssiiddeerraattiioonnss
The objective of the catalytic steam reforming process is to extract the maximum
quantity of hydrogen/syngas held in water and in the hydrocarbon feedstock.
Thereafter the subsequent manipulation of the gas stream depends on the purpose
for which the gas is intended.
The reforming of natural gas utilizes two simple reversible reactions:
(A) reforming: CH4 + H2O CO + 3 H2O ΔH0 = + 206 kJ/mol
(B) water gas shift: CO + H2O CO2 + H2 ΔH0 = - 41 kJ/mol
The reforming reaction (A) is strongly endothermic, so the reaction is favoured by
high temperature as well as by low pressure, while the shift reaction (B) is exothermic

Literature review
H2 production from steam ethanol reforming (ESR) 35
and is favoured by low temperature but is largely unaffected by changes in pressure.
To minimize the overall efficiency (and hence economics) of the conversion of carbon
to carbon dioxide and the production of hydrogen, reformers are operated at relative
high temperature and pressure. This is followed by the shift process that, by using two
different catalysts, permits the shift reaction to be brought to equilibrium at as low
temperature as possible. It can be seen that with methane the stoichiometric
requirement for steam per carbon atom is 1.0. However, it has been demonstrated
that this is not reliable because all catalysts so far developed tend to promote carbon
formation under steam reforming conditions. These reactions can be suppressed by
using an excess of steam, with the results that the minimum ratio is in the region of
1.7. However, the reforming reaction itself is also promoted by an excess of steam and
hence some advantage is derived from this. In practice ratio of 3.0 - 3.5 are commonly
used, but in some cases, there can be economic attractions in using lower steams
ratios and there is a trend in this direction.
Fig. 2.18 Steam reforming reaction: equilibrium constant.

Literature review
36 H2 production from steam ethanol reforming (ESR)
Fig. 2.19 Variation of the reformated gas depending on: (a) outlet temperature; (b) outlet pressure; and (c) inlet S/C ratio.
The reforming of saturated naphthas of general formula CnH2n+2 is based on the
following reaction:
(C) CnH2n+2 + n H2O n CO + (2n + 1) H2
(D) CO + 3 H2O CH4 + H2O ΔH = - 206 kJ/mol
Reaction (C) is strongly endothermic, absorbing more heat than the following
methanation reaction (D) and shift reaction (B) evolve, thus making the overall
process normally an endothermic one.
Analogously to methane, the naphtha reforming reaction is favored by high
temperature and low pressure, while the shift reaction is inhibited by high
temperature but largely unaffected by pressure. The tendency towards carbon
formation on catalysts when stoichiometric ratios of carbon and steam are used is
greater with naphtha than with methane, and the minimum practical ratio is about
2.2. As with methane, the excess steam favors the reforming reaction, and in practice
steam/carbon ratios of 3.5 - 4.5 are common. At low steam/carbon ratio the
methanation reaction begins to dominate, and under certain conditions of pressure
and temperature can cause the overall reaction to be exothermic.

Literature review
H2 production from steam ethanol reforming (ESR) 37
22..33..11..22 KKiinneettiiccss aanndd rreeaaccttiioonn mmeecchhaanniissmm
The results of a number of studies on the kinetics of the methane steam reforming
have been published. There is general agreement that the reaction is first order in
methane, but there is less agreement with other kinetic parameters. In part, this is due
to the use of different catalysts and experimental conditions, but often it has resulted
from a lack of consideration of diffusion and heat transfer limitations. Thus, reported
activation energies are spread in a wide range of values due to different degrees of
diffusion limitation, and these can also cause misleading total pressure effect. Indeed,
with the relatively large catalyst particle sizes used in industrial steam reformers,
these effects results in very low effectiveness of the catalyst. Effectiveness factors (η)
may, depending on conditions, only be as high as 0.3 at the inlet region, and perhaps
as low as 0.01 at the exit. Because of this, apparent activity increases as the particle
size is made smaller, but the increased pressure drop, which arises across the
reformer, restricts the size of the catalyst that can be used in practice (37).
There has been some debate about the first formed products of the steam reforming
reactions, and it appears that the relative concentrations of carbon monoxide and
carbon dioxide leaving the catalyst surface depend on the efficiency of the catalyst in
the water gas shift reaction. With rhodium-based catalysts the CO/CO2 ratio of the
initially formed carbon oxides is relatively high (in keeping with poor shift activity),
whereas with nickel catalysts the amount of carbon monoxide is lower (37).
A wide variety of rate expressions for the steam reforming of methane have been
proposed. These models range in complexity from simple first order dependency on
methane, involving two parameters, to complex Langmuir–Hinshelwood models with
over ten parameters (69). It is generally agreed that the rate of methane reforming
has a first order dependency on methane. Furthermore, it is also agreed that the rate-
determining step in the reforming process is the formation of adsorbed carbon
species: CH4 + * - Metal site Cads - *+2 H2
This mechanism leads to the formulation of rate equations of the following form:
rCH4 = - k pCH4 p H2
In this equation, the value of is found to depend on temperature, having a value
close to -1 at low temperatures (< 700°C) and approaching 0 at high temperatures (>
700°C).
Kinetic rate expressions for the steam reforming of methane found in the literature
use the steady state approximation and take the form:
rCH4 = - k pCH4 x 1 -f (pH2O, pH2)
(1 + f (pCH4, pH2O, pH2, pCO, pCO2))
pCO p3H2
pCH4 pH2O K1
rCH4 = - k pCH4 x 1 -f (pH2O, pH2)
(1 + f (pCH4, pH2O, pH2, pCO, pCO2))
pCO p3H2
pCH4 pH2O K1

Literature review
38 H2 production from steam ethanol reforming (ESR)
22..33..11..33 CCaattaallyyssttss
The catalyst must promote the desired reaction and be as inactive as possible towards
unwanted side-reactions, particularly to the formation of carbon. The catalyst should
also be as resistant as possible to poisons (37).
The catalyst must be able to maintain its activity under the demanding process
conditions, necessary to promote the desired reaction (800-1000°C and 20-30 bar).
With impregnated catalysts, an important parameter in maintaining activity over
prolonged periods is the nature of the support material and its pore structure (37).
The catalyst must be strong enough to withstand the handling it receives; from
manufacture to charging into the reformer, as well as the stresses generated by the
process conditions and the thermal cycles arising from plant start-up and shutdown.
The catalyst also must be of a suitable physical shape to provide an appropriate
geometric surface area to give an acceptable activity per unit volume of packed bed
whilst possessing acceptably low-pressure drop characteristics. The support must not
be affected by water condensing on it, nor must it produce an unacceptable quantity
of dust and material carryover, which could foul heat exchangers and other catalysts
downstream (37).
For many years nickel has been recognized as the most suitable metal for steam
reforming of hydrocarbons, other metals can be used; for example cobalt platinum,
palladium, iridium, ruthenium and rhodium. Although some precious metals are
considerably more active per unit weight than nickel, nickel is much cheaper and
sufficiently active to enable suitable catalysts to be produce economically.
The reforming reaction takes place on the nickel surface, so the catalyst must be
manufactured in a form that produces the maximum stable nickel surface area
available to reactants. This is generally done by dispersing the nickel as small
crystallites on a refractory support, which must be sufficiently porous to allow access
by the gas to the nickel surface.
This is usually achieved by precipitating nickel as insoluble compound, from a soluble
salt, in the presence of a refractory support such as mixtures of aluminium oxide,
magnesium oxide, calcium oxide and calcium aluminate cement. Alternatively, the
nickel can be incorporated by impregnating a preformed catalyst support, such as
alumina or an aluminate, with a solution of a nickel salt which is subsequently
decomposed by heating to the oxide. Impregnated catalysts are generally stronger
than precipitated catalysts, and this is one of the reasons for their widespread use.
The activity of a steam reforming catalyst in service is closely related to the available
surface area of the nickel metal and the access the reactants have to it. Most
commercial natural gas catalysts are now of the impregnated type and give a
relatively high surface area when first reduced, but under normal reforming conditions

Literature review
H2 production from steam ethanol reforming (ESR) 39
the surface area falls as sintering of nickel crystallites occurs. The higher the
temperature is, the more rapidly the sintering proceeds.
Activity is a function of the overall nickel content. However, it has been demonstrated
that with both impregnated and precipitated catalyst there is an optimum beyond
which an increase in nickel content does not produce any further significant increase
in activity. Typically, these optima are approximately 20 % for precipitated and up
about 15 % for impregnated catalyst, but this depends on the nature and physical
properties of the actual support.
22..33..11..44 MMaaiinn pprroobblleemmss ffoorr rreeffoorrmmiinngg ccaattaallyyssttss
22..33..11..44..11 CCaarrbboonn ffoorrmmaattiioonn
Coking or the formation of carbonaceous deposits is an important side reaction in
many industrial processes. Very often, measures to eliminate or depress coke
formation are more decisive for the process layout than, for instance, the activity of
the catalyst (70).
Deactivation of supported metal catalysts by carbon or coke formation is a problem of
serious magnitude in steam reforming. Its causes are generally threefold:
1. fouling of the metal surface,
2. blockage of catalysts pores and voids,
3. actual physical disintegration of the catalyst support.
Carbon may chemisorb strongly, as a monolayer, or physically adsorb in multi-layers
and, in either case, block access of reactants to metal surface sites. Furthermore,
carbon may totally encapsulate a metal particle, and thereby completely deactivate
that particle, and plug micro- and macropores such that access of reactants is denied
to many crystallites inside this pores. Finally, in extreme cases, strong carbon
filaments may build-up in pores to the extent that they stress and fracture the support
material, ultimately causing disintegration of catalyst pellets and plugging of reactor
voids (71). Carbon accumulation can also cause spalling and pulverization of catalysts,
which can also lead to poor heat distribution (72).
Carbon is a product of CO disproportionation while coke is produced by
decomposition or condensation of hydrocarbon on metals. Nevertheless, coke forms
may vary from high molecular weight hydrocarbons such as condensed polyaromatics
to carbon such as graphite, depending upon the conditions under which the coke was
formed and aged (Fig. 2.20).

Literature review
40 H2 production from steam ethanol reforming (ESR)
Fig. 2.20 Formation, gasification and transformation of coke and carbons on metal surfaces from hydrocarbons (a = adsorbed, g = gaseous, s = solid).
Three different kinds of carbon or coke species are observed in steam reforming (Tab.
2.3):
1. whiskers like carbon formed at temperature greater than 450°C,
2. encapsulating hydrocarbon films formed by polymerization at less than 500°C,
3. pyrolytic carbon from cracking of hydrocarbon above 600°C.
CnHm (a) C (a) + H (a) + CHx(a) + C2Hy (a) + … + CnHz
C in Ni (carbon in solid solution) Cv (vermicular carbon)
C (a) C (s) (metal carbide)
C (s) CC (s) (amorphous and graphitic carbons)
CH4 (a) CH4 (g)
2 H (a) H2 (a) H2 (g)
CH4 (a) CH4 (g)
CHx
condensed high mol. Wt. HC (a) C, C, CC + H2 (g)
(coke) (carbon)
C2Hy + … + CnHz
4 H (a)
+ (4 – x) H (a)

Literature review
H2 production from steam ethanol reforming (ESR) 41
Whisker like Encapsulating film Pyrolytic carbon
Formation
Diffusion of C
through Ni crystal,
nucleation and
whisker growth
with Ni crystal at
top
Slow
polymeraization of
CnHm radicals on Ni
surface into
encapsulating film
Thermal cracking
of hydrocarbon.
Deposition of C
precursors on
catalyst
Temperature range > 450°C < 500°C > 600°C
Critical parameters
High temperature.
Low H2O/CnHm
No enhanced H2O
adsorption
Low activity
Aromatic feed
Low temperature
Low H2O/CnHm
Low H2/CnHm
Aromatic feed
High temperature
High void fraction
Low H2O/CnHm
High pressure
Acidity of catalyst
Tab. 2.3 Carbon species formed in steam reforming of hydrocarbons (72).
The rate at which carbon or coke is accumulated in a given reaction under given
conditions can vary significantly with catalyst structure, including metal type, metal
crystallite size, promoter, and catalyst support. For example, Co, Fe and Ni are active
above 350-400°C for filamentous carbon formation from CO and hydrocarbons.
Pt, Ru and Rh catalysts, on the other hand, while equally or more active than Ni, Co, or
Fe in steam reforming produce little or no coke or carbon. This is attributed to reduced
mobility and/or solubility of carbon in the noble metals, thus retarding the nucleation
process. Thus, it is not surprising that addition of noble metals to base metals retards
carbon formation; for example, addition of Pt in Ni lowers carbon deposition rate
during methanation, while addition of Cu to Ni substantially lowers carbon formation
in steam reforming.
Since carbon formation and gasification rates are influenced differently by
modifications in metal crystallite surface chemistry, which are in turn a function of
catalyst structure, oxide additive or oxide supports may be used to moderate the rate
of undesirable carbon or coke accumulation (71).
The high temperatures associated with steam reforming favour the formation of
carbon (73). Four reactions may be involved:
Thermal cracking or decomposition of methane:
CH4 C + 2 H2 H0298 = 75 kJ/mol
Thermal cracking or decomposition of hydrocarbons:
CnH2n+2 n C + (n+1) H2

Literature review
42 H2 production from steam ethanol reforming (ESR)
CO disproportionation (Boudouard):
2 CO C +CO2 H0298 = -172 kJ/mol
CO reduction:
CO + H2 C + H2O
Fig. 2.21 Boudouard reaction: equilibrium constant.
22..33..11..44..22 SSiinntteerriinngg
Nickel steam-reforming catalysts are subject to several deactivation mechanisms
including coking, poisoning, and sintering. Sintering is the reason for loss of activity
for many industrial catalyst systems.
Thermally induced deactivation of catalysts results from (71):
1. loss of catalytic surface area due to crystallite growth of the catalytic phase;
2. loss of support area due to support collapse and of catalytic surface area due to
pore collapse on crystallites of the active phase,
3. chemical transformations of catalytic phases to non-catalytic phases.
Sintering processes generally take place at high reaction temperatures (> 500°C) and
are generally accelerated by water vapour.
Sintering of heterogeneous catalysts is often referred to as the loss of catalytic surface
area due to growth of large particles at the expense of smaller particles. Sintering is
complex and may be influenced by many parameters such as sintering time,
temperature, chemical environment, catalyst composition and structure, and support
morphology. A good understanding of the sintering mechanism is necessary, both to
predict the extent of deactivation by sintering and to design catalysts that maintain a
high activity (74).

Literature review
H2 production from steam ethanol reforming (ESR) 43
Particle growth via sintering influences the resistance of the catalyst toward coking
and poisoning with sulfur. The coking limits are affected by the nickel particle size and
the nickel surface area determines the sulfur capacity of the catalyst. Furthermore,
the activity of a steam-reforming catalyst is related to the nickel surface area. To
model an industrial reformer with regard to activity and the effect of sulfur poisoning,
it is necessary to know the nickel surface area as a function of time, temperature, feed
gas composition, chemical composition including promoters, and extent of poisoning.
Several studies of sintering of Ni particles supported on a ceramic carrier are reported
in the literature. The most important parameters are the sintering temperature and
the composition of the gas over the catalyst. Increasing temperature and the presence
of steam accelerates the sintering process. High surface areas of the carrier, on the
other hand, increase the stability toward sintering.
Three mechanisms for the metal particle growth have been proposed:
1. particle migration, where entire crystallites migrate over the support followed
by coalescence;
2. Ostwald ripening (atom migration), where metal atoms emitted from one
crystallite migrate over the support and are captured by another crystallite;
3. vapour transport between particles (at high temperatures).
Fig. 2.22 Two conceptual models for crystallite growth due to sintering by (A) atomic migration or (B) crystallite migration (71).
Crystallite migration involves the migration of entire crystallites over the support
surface followed by collision and coalescence. Atomic migration involves detachment
of metal atoms from crystallites, migration of these atoms over the support surface
and ultimately, capture by large crystallites (71).
Sintering of the support may also occur. Single-phase oxide carriers sinter by one or
more of the following processes:
1. surface diffusion,
2. solid-state diffusion,
SUPPORT
AABB
METAL CRYSTALLITE
SUPPORT
AABB
METAL CRYSTALLITE

Literature review
44 H2 production from steam ethanol reforming (ESR)
3. evaporation/condensation of volatile atoms or molecules,
4. grain boundary diffusion,
5. phase transformation.
Additives and impurities affect the thermal properties of carriers by occupying defect
sites or forming new phases. Alkali metals, for example, accelerate sintering, while
calcium, barium, nickel and lanthanum oxides form thermally stable spinel phases
with alumina. Steam accelerates support sintering by forming mobile surface hydroxyl
groups that are subsequently volatilized at higher temperatures. Chlorine also
promotes sintering and grain growth in magnesia and titania during high temperature
calcination.
Dispersed metals, in supported metal catalysts, can also accelerate support sintering,
for example, dispersed nickel accelerates the loss of Al2O3 surface area in Ni/Al2O3
catalysts (71).
22..33..22 WWaatteerr ggaass sshhiifftt rreeaaccttiioonn ((WWGGSS))
The water gas shift reaction is moderately exothermic and hence its equilibrium
constant decreases with temperature and high conversions are favored by low
temperatures. The water gas shift reaction is:
CO + H2O CO2 + H2 ΔH = - 41.1 kJ/mol
The position of equilibrium is virtually unaffected by pressure. As expected, additions
of greater than stoichiometric quantities of steam improve conversion. Under
adiabatic conditions, conversion in a single bed of catalyst is thermodynamically
limited – as the reaction proceeds the heat of reaction increases the operating
temperature, and so restricts of the conversion are possible. Typical carbon monoxide
levels that are achieved at the exit with a single adiabatic bed of chromia-supported
iron-based shift catalyst in an ammonia plant are in the range 2-4 %, and because it is
necessary to operate these catalysts at high inlet temperatures (typically in the range
370-400°C) they are known as high temperature (HT) shift catalysts (37).
The thermodynamic equilibrium limitation on the reaction can be reduced by using
two or more beds of HT shift catalyst with inter-bed cooling and, perhaps, removal of
carbon dioxide between the stages. In this way, it was possible in the late 1950s to
decrease the thermodynamic limitation, and achieve carbon monoxide levels of less
than 1 % at the exit. The limitation on conversion was then catalyst activity.
When a single stage or two stages of HT shift were used, the final carbon monoxide
removal stage was generally absorption in copper liquor, although some plants used a
methanator, because of the simplicity of the process, and accepted the attendant
hydrogen loss. At this time, attempts were made to improve the carbon monoxide
conversion so that methanation could be used more economically as a means of

Literature review
H2 production from steam ethanol reforming (ESR) 45
removing the remaining traces of carbon oxides. This impetus led to the development
and introduction of copper-based shift catalysts in the early 1960s (37).
A significant improvement in the conversion of the carbon monoxide could then be
obtained with two-bed operation, with the second bed operating at the lowest
possible inlet temperature, which in practice was dictated by the dew-point (about
200°C). The conventional iron based catalysts are not sufficiently active for such low
temperature operation, but copper based water gas shift catalyst are, and when they
are used in the second bed, carbon monoxide exit concentrations as low as 0.1-0.3 %
can be achieved, which is an acceptable economic level for subsequent methanation.
These copper-based catalysts are known as low temperature (LT) shift catalysts.
In this arrangement, it is necessary to lower the temperature of around 200°C, which
is suitable for the inlet of the LT shift catalyst. Inter-bed cooling is usually achieved by
heat exchange, which, depending on the steam pressure levels in the plants, may be
used to heat boiler feed water or to raise steam. In some cases, the temperature may
also be trimmed by injecting either steam or condensate into the process gas. In such
plants, the life of the LT shift catalyst may be shortened because of physical damage
from entrained water droplets or because of the presence of catalyst poisons in the
water itself (37).
Fig. 2.23 Water gas shift reaction: equilibrium constant.
Numerous studies of the kinetics of the water gas shift reaction over iron
oxide/chromia catalysts have been reported and more than 20 different kinetic
equations have been proposed. Differences among authors have been especially
marked in their opinion of the reaction mechanism, and the effect of pressure on the
reaction rate. The reasons for this conflict have been attributed to the presence of
impurities in the gases used, to varying degrees of mass transfer limitation and to the
fact that kinetic measurements have been mostly obtained with integral rather than

Literature review
46 H2 production from steam ethanol reforming (ESR)
differential reactors, which were often only operating at or near atmospheric
pressure(37).
The importance of mass transfer effects in the reaction over a commercial catalyst
was assessed and the conclusions obtained were:
1. the activation energy in the absence of diffusion effects for the water gas shift
reaction over iron oxide / chromia catalyst is 121.8 kJ/mol,
2. the reaction over 5.4 x 3.6 mm pellets is not pore diffusion limited at
temperatures below 370°C and at pressure up to 31 bar. Over larger pellets, 8.5 x
10.5 mm, the reaction becomes diffusion limited at temperature above 350°C at 31
bar pressure.
Fewer publication have appeared on the mechanism and kinetics of the water gas
shift reaction over copper based catalysts than over high temperature iron based
catalysts, but similar types of kinetic expressions have been proposed. Indeed, the
pore diffusion limited version of the Langmuir-Hinshelwood equation for copper-
based shift catalysts is consistent with plant data and semi-technical scale results.
There is little doubt that the copper LT shift catalysts generally operate in a pore-
diffusion limited regime, although there is debate over the extent of this limitation on
typical industrial catalyst pellets. In addition, they are often self- guarding with
respect to poisons (sulphur and chlorine compounds). The pick-up of which is
evidently a very rapid process and may itself also be pore-diffusion limited.
The mechanism of the catalyzed shift reaction remains in dispute for copper and iron-
based catalysts. Briefly, two types of mechanism have been proposed - adsorptive and
regenerative.
In the former mechanism, reactants adsorb on the catalyst surface, where they react
to form surface intermediates such as formate, followed decomposition to products
and desorption from the surface.
In the regenerative mechanism, the surface undergoes successive oxidation and
reduction cycles by water and carbon monoxide, respectively, to form the
corresponding hydrogen and carbon dioxide products of the water gas shift reaction.
Dealing first with iron oxide/chromia catalysts, the adsorption mechanism has been
supported by tracer studies and apparent stoichiometric number analyses.
Unfortunately, however, the kinetics of the water gas shift reaction can equally well
be described either by the adsorptive mechanism or by the regenerative mechanism,
which was first proposed. Support for the regenerative mechanism is that the rate at
which water oxidized the magnetite surface and carbon monoxide reduces it,
corresponds to the rate of the water gas shift reaction. In an in situ gravimetric study
of oxygen removal from and incorporation into magnetite/chromia catalyst in CO2/CO

Literature review
H2 production from steam ethanol reforming (ESR) 47
and H2O/H2 gas mixtures at about 350°C further supported the regenerative
mechanism.
For the copper based LT shift catalysts the regenerative mechanism was rejected on
the basis that neither cupric nor cuprous oxide could be formed under reaction
conditions from copper metal and steam. An adsorptive mechanism with a surface
formate intermediate was proposed. However, an analysis of transient kinetics of the
shift reaction over a Cu/ZnO catalyst supports the regenerative mechanism. With both
Cu/ZnO/Al2O3 catalysts and unsupported polycrystalline copper catalysts, it was also
produced results consistent with the regenerative mechanism. The occurrence of the
four separate steps needed for both forward and reverse reaction shown in the
following equations (in which S is a vacant site) has been demonstrated on copper.
CO + O(a) CO2 + S
H2O + S H2 + O(a)
For oxygen coverage of half-monolayer or less there is no equilibrium limitation to the
second reaction, in contrast with the equivalent reaction forming cuprous oxide, so
that objection to regenerative mechanism is invalid for adsorbed oxygen formation.
Therefore, it seems likely that the water gas shift reaction proceeds by the same
regenerative mechanism on both Fe3O4/Cr2O3 and Cu/ZnO/Al2O3 catalysts.
The catalyst used for HT-WGS duty consists of magnetite crystallites stabilized with
the addition of a small amount of chromia, although fresh unreduced catalyst contains
hematite (Fe2O3) 90-95% with 5-10% Cr2O3.
Iron based catalysts are not very sensitive to poisoning by sulphur, which is commonly
present in feed gas derived from coal or fuel oil, and if the catalyst must be operated
under highly sulphiding conditions the deactivated effect can be compensated for by
increasing the volume of catalyst used.
Magnetite (Fe3O4) has good activity for the reaction at moderately high temperatures
and, provided the magnetite crystallites are stabilized by the addition of a refractory
oxide component such as chromia (Cr2O3), satisfactory long lives are obtained.
The formulation of LT shift catalyst is important in terms of selectivity and resistance
to poisoning, as well as activity. Selectivity is important because under LT shift
conditions methanation of both carbon monoxide and carbon dioxide is
thermodynamically very favourable:
CO + 3 H2 CH4 + H2O ΔH = - 206.2 kJ/mol
CO2 + 4 H2 CH4 + 2 H2O ΔH = - 164.9 kJ/mol
If these reactions take place to any extent, then valuable hydrogen would be
consumed; in addition, since they are very exothermic they could give rise to dramatic
and dangerously destructive rises in temperature.

Literature review
48 H2 production from steam ethanol reforming (ESR)
Copper based catalyst have good activity for the water gas shift reaction, and have no
methanation activity so they are well suited for use in water gas shift duties.
Alumina together with zinc oxide was a desirable support that could significantly
stabilize the copper crystallite against thermally induced sintering, and also enhanced
the strength of the catalyst and minimize shrinkage during reduction.
22..33..33 PPaarrttiiaall ooxxiiddaattiioonn ((PPOOxx))
The other major route to hydrogen is non-catalytic partial oxidation of fossil fuels,
often referred to as POX (or gasification). One key advantage of this approach is that
it accepts all kinds of hydrocarbon feeds. The thermal oxidation is run at 30-100 atm
with pure O2 using a special burner inside a refractory lined vessel at ~ 1300°C. The
general reaction is described by:
CxHy + x/2 O2 x CO + y/2 H2
There are several plants that produce hydrogen by the partial oxidation of
hydrocarbons. In the non-catalytic process, a mixture of oxygen and natural gas is pre-
heated, mixed and ignited in a burner. In the absence of catalyst, the reactor
temperature must be high enough to reach complete CH4 conversion. Combustion
products like CO2 and H2O are also formed to a certain extent. Subsequently,
endothermic reaction as steam reforming is also involved, which determine the outlet
temperature in the order of 1000-1200°C. At this stage, the gas composition is near
thermodynamic equilibrium. According to the stoichiometry of reaction the
consumption of O2 should be, in the absence of combustion products, approximately
0.5 O2/CH4. However, actual use requires O2/CH4 ratio of about 0.7. It appears that if
the reactor in principle is simple, the cost of an oxygen plant is considerable. One
advantage of this process is that it can work at high pressures, thereby saving costly
compressors. Some carbon is formed by the thermal cracking of methane and has to
be removed by washing. The outer reactor walls are cold being insulated on the inside.
Using this technology, Texaco and Shell commercialize this conversion process (67).
In non-catalytic partial oxidation process, steam is not used as a feed, but with higher
hydrocarbon feeds there can be a lot of coke as by-product. Since conditions are
maintained net reducing, no NOx or SOx are produced; however, if the feed contains
any sulfur compounds, H2S and COS are by-product which must be scrubbed. A clear
disadvantage is the need to have huge quantities of O2 available continuously, thus
requiring the substantial investment in an adjoining O2 plant (67).

Literature review
H2 production from steam ethanol reforming (ESR) 49
Fig. 2.24 Block diagram of the whole non catalytic partial-oxidation of methane.
Methane is reacted with O2 in a flame, then after desulphurization, the WGS reaction
is used to shift essentially all CO to H2, and CO2 is removed. If complete removal of
residual CO and CO2 is required, methanation on a Ni catalyst can reduce carbon
oxides to less than 10 ppm (Fig. 2.24) (67). Since CO is also a co-product, one has to
use high temperature water gas shift to convert CO with steam to H2. Additional unit
operations are required for gas purification (largely to remove H2S) and to remove
soot from the waste water. In addition, the CO2 can be removed by adsorption, and
final traces of CO destroyed by follow-up methanation. Thus POX operations can get
quite complex, and in comparison to SMR they are less energy efficient, while
eliminating more CO2 co-product (65).
In the Fig. 2.25 it is only shown part of the POX process, steam must also be generated
and the product CO/H2 must also be purified. A strong feature of POX technology
versus SMR is that the former is a very attractive process when dealing with the
increasing amounts of bottom-of-the-barrel feedstocks. It was estimated that the
thermal efficiency of a POX plant feed with heavy hydrocarbons to be ~ 70 % versus 81
% with SMR. Secondary reforming with added O2 is used in some operations
employing SR technologies, especially in connection for the high H2 demands of
ammonia synthesis. In the exothermic, secondary reforming, air is added to the
effluent of the primary reformer. The residual methane reacts with the air providing
heat for this CO producing reaction, and the unreacted N2 is used for NH3 synthesis
(65).
Fig. 2.25 Process flow diagram for POX (65).
Partial
oxidation
H2S
removal
CO
shift
CO2
removalmethanationFuelFuel
OO22 HH22SS COCO22
HH22
Partial
oxidation
H2S
removal
CO
shift
CO2
removalmethanationFuelFuel
OO22 HH22SS COCO22
HH22
Reactor
Oxygen
Steam
Hydrocarbon feed
Waste
heat
boiler
Quench
pipe
Carbon
slurry
separator
Cooler
scrubber
Carbon
recovery
Waste
water
High pressure
export steam
Syngas
Reactor
Oxygen
Steam
Hydrocarbon feed
Waste
heat
boiler
Quench
pipe
Carbon
slurry
separator
Cooler
scrubber
Carbon
recovery
Waste
water
High pressure
export steam
Syngas

Literature review
50 H2 production from steam ethanol reforming (ESR)
22..33..44 AAuuttootthheerrmmaall rreeffoorrmmiinngg ((AATTRR))
An alternative approach to POX and SMR is autothermal reforming (ATR), which is a
combination of both technologies.
This process was developed by Haldor Topsoe in the late 1950s with the aim of
performing reforming in a single reactor. In autothermal reforming, the energy for the
production of CO and H2 is produced by partial oxidation of the hydrocarbon
feedstock. Like POX, the feeds first react in a large refractory lined vessel with O2 for
non-catalytic combustion at 1200-1250°C. If the product H2 is intended for NH3
production, an air feed could be used.
The reformer basically consists of a ceramic lined tube and a fixed catalyst bed for
equilibration of the gas. The preheated streams (CH4 + H2O and H2O + O2) are mixed
in a burner placed at the top where the POX reactions take place. The final steam
reforming and equilibration take place in the catalyst bed below the burner. Typically,
the ATR operates at high temperatures ca. 1200-1300°C in the combustion zone and
950-1200°C in the catalytic zone. This results in a lower oxygen consumption (O2/CH4
= 0.55-0.60), however, with a certain amount of steam added to the feedstock to
eliminate carbon formation. Carbon and soot formation in the combustion zone is an
undesired reaction, which leads to carbon deposition on downstream tubes causing
equipment damage, pressures losses and heat transfer problems.
Fig. 2.26 Autothermal reformer.
Although the ATR was originally used to maximize H2 production in ammonia plants,
it can be applied in the production of CO rich gases. In all cases, the H2/CO ratio at the
outlet of the reactor can be precisely adjusted by varying the H2O/CH4 and/or O2/CH4
molar ratios in the feed.

Literature review
H2 production from steam ethanol reforming (ESR) 51
Since autothermal reforming uses less O2 than POX, the economics are less sensitive
to the price of O2 when O2 is cheap. It requires no external fuel while offering some
flexibility in feedstock.
22..33..55 CCaattaallyyttiicc ppaarrttiiaall ooxxiiddaattiioonn ((CCPPOO))
A new interesting process for conversion of methane into synthesis gas is catalytic
partial oxidation. In the 1940s, Prettre et al first reported the formation of synthesis
gas by the catalytic partial oxidation of CH4:
CH4 + 1/2 O2 CO + 2 H2 H0298 = - 36 kJ/mol
They used a Ni-containing catalyst. In contrast to steam reforming of methane,
methane partial oxidation is exothermic. However, the partial oxidation requires pure
oxygen, which is produced in expensive air separation units that are responsible for up
to 40% of the cost of a synthesis gas plant (in contrast, the steam reforming process
does not require pure oxygen) (75).
In the early 1990s, several papers (76) (77) (78) (79) (80)reported that one can reach CO
and H2 concentrations in excess of those expected at thermodynamic equilibrium by
operating the CH4 oxidation reaction at exceptionally high space velocities (GHSV =
52,000 ml (g catalyst)-1 h-1) in a fixed-bed reactor. The following catalysts were
employed: Ni/Yb2O3, Co/rare earth oxide, Co/MgO, and Ni/Al2O3.
According to the partial oxidation reaction, such a process yields the desired H2/CO
molar ratio of 2 required for methanol or Fischer-Tropsch synthesis. From
thermodynamic simulations, it is clear that the reaction is favored at T > 850°C in
excess of CH4, although both CO and H2 selectivities are modified by the formation of
CO2 and H2O in combustion reactions which are much more exothermic:
CH4 + 1.5 O2 CO + 2 H2O H0298 = - 519 kJ/mol
CH4 + 2 O2 CO2 + 2 H2O H0298 = - 802 kJ/mol
Since CPO reaction is slightly exothermic, a process based on this reaction would be
much more energy efficient than the energy intensive SMR process. In addition the
partial oxidation reaction is also much faster than the reforming reactions, suggesting
that a single stage process for syngas production would be an attractive alternative to
SMR and also results in smaller reactors and higher productivity.
The direct oxidation has not been developed at industrial scale, and it is difficult to
study because it involves co-feeding CH4/O2 mixtures and reaction close flammable or
even explosive conditions.
Local hot spot are usually formed which can irreversible damage the active catalyst.
Moreover the gas phase reactions in a high reducing atmosphere can led to carbon
and soot deposition over the catalyst surface.

Literature review
52 H2 production from steam ethanol reforming (ESR)
In the 1940s, Prettre et al. reported the formation of synthesis gas via the catalytic
partial oxidation of CH4 catalyzed by a 10 wt % refractory supported nickel, at
temperatures between 700 and 900°C. Thermodynamic equilibrium corresponding to
the catalyst bed exit temperature was achieved under all conditions investigated. In
1970, it was examined the effect of diffusion on methane partial oxidation catalyzed
by a single grain of Ni/mullite catalyst in the temperature range of 760 and 900°C and
examined the ignition and extinction characteristics of this catalyst. It was observed
that the nickel catalyst deactivated in an oxidative environment but could recover on
reduction. In 1984, Gavalas et al (81) investigated the effects of the calcination
temperature, pre-reduction, and feed ratio on the reaction of CH4/O2 mixtures
catalyzed by NiO/-Al2O3 at 570–800°C. However, under their experimental
conditions, the main products were CO2 and H2O. Since 1990, researchers have
continued to examine nickel-containing catalysts for the partial oxidation of methane,
and they also started to use noble metals as catalysts. In 1992, Hickman and Schmidt
(82) used platinum monoliths to achieve high selectivities to CO and H2 in the partial
oxidation of methane. During last 10 years, various noble metal catalysts have been
examined. Compared with the non-noble metal catalysts, the noble metals exhibit
high stability with excellent activities and selectivities. The major drawback of the
noble metal catalysts is their high cost, which restricts their potential use in industrial
processes.
The major problem encountered with non-noble metal catalysts as nickel and cobalt is
their relatively low stability. The main causes of the deactivation of the catalysts are
carbon deposition and metal sintering in the catalyst. Nevertheless, numerous
effective nickel-containing catalysts have been developed by incorporation in suitable
supports, such as La2O3, MgO, SrTiO3, and CeO2; effective promoters, including
La2O3, Li2O, and iron oxide; and novel preparation methods, such as a solid phase
crystallization method, a sol–gel method, and a citrate method(75). However, because
the high stabilities reported for these effective nickel-containing catalysts were based
on short-term tests (< 100 h), it is unclear how stable these catalysts will be in long
term tests (> 1000 h), which is the first step that any candidate catalyst for
commercialization must pass.
Mechanistic investigations of the partial oxidation are still challenging, because this
exothermic reaction is very fast and causes extremely high catalyst temperature rises,
so that the usual methods of investigation are unsuitable.
Two kinds of pathways have been suggested:
1. combustion-reforming pathway, in which CO2 and H2O are the primary
products, and CO and H2 are formed by their reactions with CH4,
2 pyrolysis or dissociative adsorption pathway, in which CO is the primary
product formed by the dissociation of methane, CH4 CHx + (2 – 1/2 x) H2;

Literature review
H2 production from steam ethanol reforming (ESR) 53
followed by the oxidation of carbon containing species to give CO without the pre-
formation of CO2.
For methane partial oxidation to syngas, the thermodynamic calculation results
suggest a high temperature is advantageous for high methane conversion and
selectivity to CO and H2. However, increasing the pressure in the reactor is
unfavourable for CH4 conversion and CO and H2 selectivity. The prediction of the CH4
conversion and product selectivity under specific conditions is shown in two-
dimensional forms (Fig. 2.27(a) and (b)) (83). Apparently, under 1 bar at 800°C,
theoretical CH4 conversion should be up to 90 %, and selectivities to CO and H2 are 97
%. At 8 bar and 800°C, CH4 conversion is only 70 %, and CO and H2 selectivities are
around 85 %.
Fig. 2.27 Thermodynamic equilibrium calculations at: (a) atmospheric pressure and (b) at 8 bar); (■) XCH4; (●) S[CO], (▲) S[CO2], (▼) S[H2] (83).
This process is likely to become more important in the future of methane conversion
due to the thermodynamic advantages this process has over steam reforming:
1. Partial oxidation is mildly exothermic, while steam reforming is highly
endothermic. Thus, a partial oxidation reactor would be more economical to heat.
In addition, it can be combined with endothermic reactions, such as steam
reforming or dry reforming with carbon dioxide to make these processes more
energy efficient.
2. The H2/CO ratio produced in stoichiometric partial oxidation is around 2, and
this ratio is ideal for downstream processes, in particular methanol and FT
synthesis. This avoids the need to reverse shift hydrogen, which is produced in
excess in steam reforming.
3. The product gases from methane partial oxidation can be extremely low in
carbon dioxide content, which must often be removed before synthesis gas can be
used downstream.
4. Partial oxidation technology avoids the need for large amounts of expensive
superheated steam. However, an oxygen separation plant, which is also costly, may

Literature review
54 H2 production from steam ethanol reforming (ESR)
be required in cases where nitrogen (from air) is undesirable in high-pressure
downstream processes.
Fig. 2.28 Thermodynamic representation of the partial oxidation of methane(83).

Literature review
H2 production from steam ethanol reforming (ESR) 55
22..44 BBiiooeetthhaannooll sstteeaamm rreeffoorrmmiinngg
22..44..11 TThheerrmmooddyynnaammiicc ccoonnssiiddeerraattiioonnss
The reaction of steam reforming of ethanol is, from a thermodynamic point of view,
feasible above 500 K ( G < 0 ). It is strongly endothermic and results in increase in
number of moles. Increasing the temperature and lowering the pressure favour
ethanol reforming.
Stoichiometrically the basic reaction scheme is:
C2H5OH + 3 H2O 2 CO2 + 6 H2 H°298 = 174 kJ/mol (1)
Other by-products such as CO and CH4 are also usually formed during reaction.
For what concern CO it is formed directly and indirectly by:
C2H5OH + H2O 2 CO + 4 H2 H°298 = 256 kJ/mol (2)
2 H2O + 2 CO 2 CO2 + 2 H2 H°298 = - 41 kJ/mol (3)
Fig. 2.29 Species distributions as a function of temperature at P= 1 atm, n (C2H5OH)=1 mol and n (H2O)=3 mol obtained from Gibbs free energy minimization (non stoichiometric thermodynamic approach) (84).
The difference between the reaction 1 and 2 is the water gas shift reaction; therefore
the amount of CO depends on the direction of the water gas shift that is a
consequence of reaction temperature and S/C.

Literature review
56 H2 production from steam ethanol reforming (ESR)
The amount of methane is due to both the reaction with hydrogen during the
hydrogenolisis of ethanol and the metanation reactions on CO and CO2 and
decomposition of ethanol.
C2H5OH + 2 H2 2 CH4 + H2O H°298 = - 157 kJ/mol (4)
CO + 3 H2 CH4 + H2O H°298 = - 206 kJ/mol (5)
CO2 + 4 H2 CH4 + 2 H2O H°298 = - 166 kJ/mol (6)
2 C2H5OH 3 CH4 + CO2 H°298 = - 74 kJ/mol (7)
C2H5OH CH4 + CO + H2 H°298 = 49 kJ/mol (8)
At low temperatures reactions methane is the favourite product as it observe from
Fig. 2.29.
Since the reaction system is very complex, the effect of operational parameters on the
equilibrium composition, based on either the stoichiometric or non stoichiometric
thermodynamic approach, can be investigated only using numerical methods.
In the non stoichiometric approach, the equilibrium composition of the system is
found by the direct minimization of the Gibbs free energy for a given set of species
without any specification of the possible reactions which might take place in the
system. On the other hand, in the stoichiometric approach, the system is described by
a set of stoichiometrically independent reactions (SIRs). The latter, however, are
typically chosen completely arbitrarily from a set of possible reactions. As a result,
efforts to study the system's response in terms of the arbitrarily chosen chemical
reactions can lead to erroneous conclusions.
The arbitrariness in the specification of a set of chemical reactions can, however, be
avoided. It appears that the basic equations of chemical thermodynamics can always
be transformed so as to be presented as a sum of contributions associated with a
special class of reactions, called response reactions (RERs), which have the remarkable
property of being unique, independent of the initial choice of the SIRs (85).
Fishtik et al. consider a set of reactions to investigate the effects of the process
variables on the production of hydrogen. They suppose that at equilibrium the
amounts of ethanol and acetaldehyde are negligibly small as compared with the
amounts of other species. This means that one may safely neglect the effect of those
RERs in which C2H5OH and CH3CHO are concomitantly involved. As a consequence
the analysis can be substantially simplified and the ethanol steam reforming can be
described by a set of eight RERs (84). The relative fractions of the ethanol reactions as
a function of temperature and amount of feed water are plotted in Fig. 2.30 and Fig.
2.31.

Literature review
H2 production from steam ethanol reforming (ESR) 57
Fig. 2.30 Relative fractions of RERs in which ethanol is involved as a function of temperature at P =1 atm, n (C2H5OH)=1 mol and n (H2O)=3 mol (84).
Thanks to this approach it is seen that at small amounts of water, both at low, reaction
(7), and high temperatures, reaction (8), the predominant reactions are the
decomposition of ethanol.
As the amount of water increases (Fig. 2.31), however, the steam reforming of ethanol
becomes the dominant reaction (84).
Fig. 2.31 Relative fractions of RERs in which ethanol is involved as a function of the initial amount of water at T =800 K, P= 1 atm, n (C2H5OH) = 1 mol (84).

Literature review
58 H2 production from steam ethanol reforming (ESR)
As for the set of reactions in which ethanol is involved, also for the set in which
hydrogen is involved it supposes that the contributions coming from those RERs in
which ethanol and acetaldehyde are involved are negligibly small. As a result, the
hydrogen sensitivity may be very accurately described simply by the set of four RERs.
Then the H2 yield depends on the temperature and the amount of water as it observes
in Fig. 2.32, Fig. 2.33,Fig. 2.34,Fig. 2.35.
At small temperatures and small amounts of water, the contribution of the WGSR is
small and an increase in temperature leads to an increase in the amount of H2. At
higher temperatures, the WGSR becomes dominant and the amount of hydrogen
decreases with increasing temperature.
Consequently the amount of hydrogen, as a function of temperature, can have a
maximum (84). After that the hydrogen molar flow decreases.(Fig. 2.33).
Water, CO2 and methane molar flows decrease with temperature while CO slightly
increases.
Fig. 2.32 Relative fractions of RERs in which hydrogen is involved as a function of temperature at P= 1 atm, n (C2H5OH)= n (H2O)=1 mol (84).

Literature review
H2 production from steam ethanol reforming (ESR) 59
Fig. 2.33 Effect of reactor temperature on equilibrium component molar flows for the steam reforming of ethanol (water/ethanol molar ratio, 4; pressure, 1 atm) (86).
Fig. 2.34 Relative fractions of RERs in which hydrogen is involved as a function of the initial amount of water at T= 800 K, P= 1atm, n (C2H5OH)=1 mol (84).

Literature review
60 H2 production from steam ethanol reforming (ESR)
Fig. 2.35 Effect of water/ethanol ratio on the equilibrium component molar flows. Pressure, 1 atm; temperature, 700 °C (86).
The addition of water increases the hydrogen production while reducing the methane
and CO molar flows. Although high water to ethanol molar ratios are favourable from
the thermodynamic point of view, the maximum water to ethanol ratio will be limited
by the energy cost of the system and the larger dimension required. A higher ratio will
represent a higher energy cost because of the extra steam generated (86).
The operating pressures impacts significantly over the equilibrium molar fractions of
the system. An increase in pressure can lead to a decrease in the amount of H2, in fact
reactions that give H2 imply an increase of number of moles (86). Going from 1 to 25
bar the [H2] decrease of a factor > 2.
On the other hand high pressures reduce the CO concentration in the reformer exit, as
it see in Fig. 2.36.

Literature review
H2 production from steam ethanol reforming (ESR) 61
Fig. 2.36 Effect of reactor pressure on equilibrium component molar flows. water/ethanol molar ratio, 4; temperature, 700 °C (86).
There are other reactions that could occur in the C2H5OH reforming process,
depending on the catalyst used and the reaction conditions: ethanol dehydrogenation
to acetaldehyde and ethanol dehydration to ethylene.
C2H5OH C2H4O + H2 H°298 = 68 kJ/mol (9)
C2H5OH C2H4 + H2O H°298 = 45 kJ/mol (10)
Acetaldehyde and ethylene are the main products working at very low contact time, in
fact these products were not detected while working at moderate and high contact
times (87).
The equilibrium constant of ethanol dehydrogenation, K1, and ethanol dehydration,
K2, at different temperatures are shown in Fig. 2.37. Both reactions are endothermic,
the equilibrium costant of ethanol dehydration K2 is larger than the equilibrium
costant of ethanol dehydrogenation K1 in the whole range of temperatures analyzed,
although K1 increases faster than K2 when temperature is increased.

Literature review
62 H2 production from steam ethanol reforming (ESR)
Fig. 2.37 Equilibrium constants at different temperatures (87).
Compare the ethanol conversion at different value of temperature and S/C it can be
see that the equilibrium conversion of ethanol is 0.96 at 423 K and S/C=0 and at T>500
K conversion is higher than 0.99 at all S/C analyzed. It means that, whatever r value is,
for T > 500K ethanol is not practically present in the equilibrium mixture (87).
The amount of C2H4O increases with the temperature, in the whole range. The
presence of water works against dehydrogenation and formation of C2H4O, because
the total mole number increases with S/C and, due to the stoichiometric, the
equilibrium is therefore shifted to products (Fig. 2.38) (87).
Fig. 2.38 Extent of reaction (9) vs. temperature at different S/C values (S/C = r and x1 = C2H4O) (87).
In a different way respect the trend of C2H4O, the amount of C2H4 as first increases
and then decreases with the temperature. This behaviour is a consequence of the
C2H5OH ⇄
C2H4 + H2OC2H5OH ⇄
C2H4O + H2

Literature review
H2 production from steam ethanol reforming (ESR) 63
competition between both reactions when the temperature increases. It must be
noted that C2H4 increases with temperature at low temperatures and when C2H4O
value is nearly zero. The effect of water on reaction (10) is explained by the
stoichiometry of the reaction (Fig. 2.39) (87).
Fig. 2.39 Extent of reaction (10) vs. temperature at different S/C values (S/C = r and x2 = C2H4) (87).
Then C2H4 is always higher than C2H4O, for all T and S/C values analyzed. Furthermore
ethanol, from a thermodynamic point of view, is preferentially consumed by the
dehydration reaction (10). It must be noted that the free energy of acetaldehyde is
lower than the free energy of ethylene in the range of temperature studied.
Nevertheless, the stability of water, the other product of reaction 10, explains the
preference of ethanol for this reaction. Only for T > 1200K and for high S/C values
reaction 9 would be favored (87).
Compared with the SR reactions, the ethanol dehydration and dehydrogenation
reactions are much faster, and acetaldehyde and ethylene may be considered
important intermediates in formation of H2, in fact they be reformed to:
C2H4O + H2O CH4 + CO2 + H2 (11)
C2H4 + H2O CH4 + CO + H2 (12)
C2H4 + 2 H2O CH4 + CO2 + 2H2 (13)
and acetaldehyde can be decarboxylated to:
C2H4O CH4 + CO (14)
At low S/C value the composition are CH4:CO:H2 = 1:1:1 , while at moderate S/C value
the composition are CH4:CO2:H2 = 1:1:2. In the first case CO is the primary product,
while in the second case CO2 is the primary product. The ratio CO/CO2. depends on
water gas shift equilibrium represented in Fig. 2.40.

Literature review
64 H2 production from steam ethanol reforming (ESR)
Fig. 2.40 Direct and inverse WGS regions (87).
The product distribution is showed in Fig. 2.41, Fig. 2.42 and Fig. 2.43, high
temperatures and S/C values favour hydrogen production; the tendency of methane is
exactly the opposite of that of hydrogen. In order to minimize CO formation, low
temperatures and high S/C are suitable (87).
Fig. 2.41 Moles of hydrogen per mole of ethanol fed in the equilibrium at different S/C values (S/C = r) (87).

Literature review
H2 production from steam ethanol reforming (ESR) 65
Fig. 2.42 Moles of carbon monoxide per mole of ethanol fed in the equilibrium at different S/C values(S/C = r) (87).
Fig. 2.43 Moles of methane per mole of ethanol fed in the equilibrium at different S/C values (S/C = r) (87).
Other possible byproducts are aceton and acetic acid.
C2H5OH + H2O CH3COOH + 2 H2 (15)
2 C2H5OH + H2O CH3COCH3 + CO2+ 4 H2 (16)
Acetone is obtained by the decomposition of ethanol, a reaction favoured when the
catalyst works at low temperatures (88).
The formation of coke on the surface of the catalyst is also not uncommon. Coke
formation may occur via the Boudouard reaction:
2 CO CO2 + C H°298 = −171.5 kJ/mol (17)
Another possible route for the formation of carbon is through ethylene:

Literature review
66 H2 production from steam ethanol reforming (ESR)
C2H4 polymers coke
Mas et al. have analysed the operation region where coke can be formed, the coke
formation is higher if S/C value is lower. If the ethanol steam reforming reactor works
in the region where coke formation is thermodynamically feasible, the use of acid
catalysts should be avoided (87).
Comas et al. have observed that carbon decreases when the water to ethanol ratio
and temperature increase, while the pressure effect depends on the operating
temperature (86).
Fig. 2.44 Range of conditions for carbon formation (87).
Fig. 2.45 Diagram of C(s) formation with regard to reactor temperature and water/ethanol ratio for different operating pressures (86).

Literature review
H2 production from steam ethanol reforming (ESR) 67
22..44..22 RReeaaccttiioonn mmeecchhaanniissmm
Several possible reactions can occur when the ethanol water mixture is in contact with
a catalyst at high temperature. The behaviour of each metal can be explained
considering its activity towards specific reactions involved in the reaction mechanism.
The knowledge of the reaction mechanism will be very important to design a catalyst
resistant to carbon poisoning that can be applied to produce high hydrogen yield and
to achieve the requirements demanded in fuel cells.
Then knowledge of the type of ethanol–metal interaction is therefore of prime
importance for a thorough understanding of the process.
At low temperatures ethanol could adsorb in two molecular forms on the surfaces of
the catalysts: in a form coordinated to the Lewis acid sites of the supports (1) and in a
hydrogen bridge bonded form through the OH groups of the supporting oxide (2) (89).
1) CH3CH2OH + Mn+(s) CH3CH2OH
Mn+(s)
2) CH3CH2OH + OH-(s) CH3CH2O-
(s) + H2O
Previous workers (90) (91) (92) (93) (94) (95)have examined the decomposition and
oxidation of ethanol on well-defined surfaces of transition metals in great detail. At
low temperature, ethanol adsorbs molecularly on Pt(lll)], Pd(lll), Cu(ll0), Cu(100),
Cu(410), Ag(ll0), Rh(lll) and Ni(lll).
However, at 300 K on the surfaces of clean nickel, rhodium, platinum and palladium
part of the ethanol decomposes to form ethoxy ligand (-OCH2CH3) (96).
CH3CH2OH(a) CH3CH2O-(a) + H(a)
The general trend of the ethanol decomposition on these surfaces except rhodium
reveals that the ethoxy species will sequentially decompose into acetaldehyde:
CH3CH2OH(a) CH3CH2O-(a) + H(a) CH3CHO(a) + 2H(a)
upon further heating (about 400-600 K) the C-C bond in the acetaldehyde breaks to
produce adsorbed H, CO and CHx species.
CH3CHO(a) CHx(a) + C(a) + O(a) + (4-x)H
The adsorbed CHx group then combines with hydrogen and desorbs as methane or
decomposes completely to carbon and hydrogen.
The one exception to this mechanism is on Rh (111) where the ethoxy species
dehydrogenates to form a cyclic intermediate (-OCH2CH2-), which then decomposes
into CO and hydrogen (96).

Literature review
68 H2 production from steam ethanol reforming (ESR)
In fact a suggest mechanism of steam reforming on Rh metal is:
CH3CH2OH CH3CH2O(a) + H(a)
CH3CH2O(a) (a)CH2-CH2O(a) + H(a)
(a)CH2-CH2O(a) CH4(g) + CO(g)
CH4(g) + H2O(a) C(a) + 4 H(a)
C(a) + O(a) CO
2H(a) H2(g)
The adsorbed ethoxide species forms an oxametallacycle intermediate, which favors
the C—C bond cleavage effectively. In addition, the reaction also proceeds through
the formation of acetaldehyde intermediate which undergoes C-C bond rupture (97).
During ethanol reforming it can be form also acetate species from acyl group:
CH3CHO(a) + OH(a) CH3COO(a) + H2
That is possible only if the catalyst is covered with adsorbed species, so the effect of
the support is dominated.
Then acetate species can decompose:
CH3COO(a) CH3(a) + CO2
The CH3 groups can react with surface OH species:
CH3(a) + OH(a) CO + 2H2
or in the presence of water:
2CH3(a) + 2H2O 2CO + 5H2
The acetaldehyde formed can also be decomposed to methane and carbon monoxide:
CH3CHO(a) CH4 + CO(a)
In the presence of water the steam reforming reaction may also occur:
CH4 + H2O CO + 3H2
Erdohelji et al. have studied the interaction ethanol-metal during steam ethanol
reforming on various metals like Pt, Pd, Ir, Rh and Ru with two different support (Al2O3
and CeO2). They have found that at 723 K with S/C=3 in all case the hydrogen
selectivity decreased but ethylene and acetaldehyde selectivity increased in time (98).
The highest changes it was observed on Pt/Al2O3 where the hydrogen selectivity was
near 100% in the first minutes of the reaction, but after 60 min it was only about 10%.
In contrast with this observation, on alumina supported Ru or Rh the selectivity
changes were only about 20%. Ethylene selectivity varied oppositely, on Pt/Al2O3 in
the first minutes ethylene formed only in traces but after one hour the C2H4 selectivity

Literature review
H2 production from steam ethanol reforming (ESR) 69
was more than 80%. Similar features were observed on CeO2 supported metals, in
these cases not only the ethylene but also the acetaldehyde selectivity increased in
time.
Fig. 2.46 Selectivity of H2 (A) and of ethylene (B) in the reaction of ethanol + water at 723 K on 1: 1% Pt/Al2O3; 2: 1%Pd/Al2O3; 3: 1%Ir/Al2O3; 4: 1%Rh/Al2O3; 5: 1% Ru/Al2O3 (98).
Fig. 2.47 Conversion (A), selectivity of H2 (B) and acetaldehyde (C) in the reaction

Literature review
70 H2 production from steam ethanol reforming (ESR)
of ethanol + water at 723 K on 1: 1% Pt/CeO2; 2: 1%Pd/CeO2; 3: 1% Ir/CeO2; 4: 1% Rh/CeO2; 5: 1% Ru/CeO2 (98).
Probably the decrease of H2 selectivity in the time on stream can be due to poisoning
of metal surface (the active surface site for the dehydrogenation of ethanol),
consequently the efficiency of the support comes to the forefront.
Besides IR measurements clearly have shown that at the reaction temperature only
acetate species are on the surface.
The TPD experiments have revealed that the high temperature desorption stage of
adsorbed ethanol depends on the metal. On Rh/Al2O3 the acetate species decompose
at the lowest temperature and this sample is claimed to have one of the highest
hydrogen selectivity.
On Pt/Al2O3 the situation is the opposite. They have stated that acetate is located
primarily on the support but these groups can poison the reaction. On the basis of
these observations they suppose that the acetate groups hindered the migration of
ethoxide to the metal, which may cause the decrease of hydrogen formation on the
metal sites (98).
At higher temperatures (823 and 923 K) the decay of hydrogen was significantly
reduced, moreover, at 923 K it could not even be observed.
A B C
Fig. 2.48 The product selectivity of ethanol + water reaction on 1% Pt/Al2O3 at 723 K (A), 823 K (B) and at 923 K (C). The ethanol/water ratio was 1/3 (96).
These results clearly show that at lower temperature the surfaces of the catalysts
change during the reaction and as a consequence of this process Pt sites are poisoned
(96).

Literature review
H2 production from steam ethanol reforming (ESR) 71
This trend is similar for Ir, Co and Ni supported on alumina. In fact at higher
temperature H2 selectivity is more stable then at 723 K.
A B
Fig. 2.49 Alteration of the concentrations of H2, CO, CH4 and CO2 with time-on-steam over the M/CeO2 catalysts. Experimental conditions: catalyst: 300 mg (40–60 mesh);H2O:EtOH = 3:1; GHSV = 6000 ml/gh; A) Ir/CeO2 and Ni/CeO2 catalysts at 450 °C, Co/CeO2 catalyst at 500 °C, B) Ir/CeO2 and Ni/CeO2 catalysts at 650 °C, Co/CeO2 catalyst at 700 °C (99).
The Ir/CeO2 catalyst showed rather stable catalytic performance for 300 h time-on-
stream without any deactivation. The strong interaction between Ir and CeO2
effectively prevented the sintering of the highly dispersed Ir particles and also greatly
facilitated coke gasification through the high oxygen storage-release capacity of ceria
(99).

Literature review
72 H2 production from steam ethanol reforming (ESR)
Srinivas et al. have studied ethanol steam reforming on NiO-CeO2-ZrO2 at different
composition at 823 K. Sample with Ce/Zr = 1 exhibited a very high catalytic activity
over a period of more than 500 h.
Zirconia incorporating in ceria retard the sintering of ceria crystallites because of it
facilitates the reduction of Ce4+ to Ce3+ and preserves the oxygen vacancies which are
the source of oxygen storage capacity in ceria based catalyst supports and it explains
the major stability.
Also the crystallite size of ceria has a strong influence on the metal dispersion of Ni-Rh
catalysts. The catalytic activity for ethanol conversion and H2 selectivity depends
strongly on Rh particle size and dispersion. The smaller the CeO2 crystallite size, the
higher the Rh metal dispersion and consequently the higher the catalytic activity for
ethanol conversion and H2 selectivity.
Adding Ni is claimed to improve the Rh metal dispersion and makes its particle size
smaller. These results suggest that Rh is the more active species involved in ethanol
reforming and that catalytic activity increases with increasing numbers of active Rh
species. Therefore Rh plays a major role in breaking C–C and C–H bonds; compared
with Rh, Ni is much less active for EtOH reforming, but the addition of Ni favors the
water–gas shift reaction, leading to increased conversion of CO to CO2 at 723-873
K(100).
The presence of a second metal, in addition to Rh, enhances the production of
hydrogen from ethanol. Sheng et al. have observed that while Rh is essential for an
efficient decomposition of ethanol its presence alone is not sufficient for making
hydrogen in reasonable quantities. In the presence of Pt the association reaction of
the two H(a) atoms is much faster (101).

Literature review
H2 production from steam ethanol reforming (ESR) 73
Fig. 2.50 Scheme of ethanol adsorption depends on metal (101).
Kugai et al. studied oxidative steam reforming of ethanol over a bimetallic Rh-Ni/CeO2
catalyst at low temperatures (<723 K) to produce a H2-rich gas. The presence of O2
enabled complete conversion of ethanol even at low temperatures (648 K) and
reduced the selectivity to CO (102). The temperature increases of part of the bed due
to combustion reaction has to be taken into account.
Frusteri et al. evaluated catalytic performance of MgO supported Pd, Rh, Ni, and Co
for hydrogen production by ethanol steam reforming. Rh/MgO showed the best
performance in terms of ethanol conversion and stability, while Ni/MgO exhibited the
highest hydrogen selectivity (>95%). Coke formation rate on Rh/MgO was very low as
MgO was basic. It was also found that the deactivation was mainly due to metal
sintering (103).
Depositing Rh on MgAl-based spinel oxide supports exhibited higher basicity,
compared with alumina-supported Rh, whereas the surface acidity was strongly
reduced, resulting in improved stability (104).
The kinetic of coke formation is not depending upon the support nature only, but also
from the nature of active metal. In particular, on Pd/MgO higher coke formation rate
respect to Ni/MgO were observed, while on Rh/Al2O3, in spite of the presence of
alumina coke forms with very low rate (105).
Fatsikostas and Verykios have studied Ni catalysts supported on Al2O3 or La2O3 and
they find that γ-Al2O3 seems to promote primarily the dehydration reaction of

Literature review
74 H2 production from steam ethanol reforming (ESR)
ethanol, probably via ethoxy or acetate species producing ethylene which leads to
polymeric carbonate species, at relatively low temperatures.
On the other hand, La2O3 seems to promote primarily the dehydrogenation reaction
and, to a smaller extent, the dehydration reaction. La2O3 in stabilizing the catalyst
activity by decorating the Ni particles with a thin film of lanthanum oxycarbonate
species, which acts as a cleaner of metallic surface of carbon deposits.
La2O2CO3 + C La2O3 + 2CO
At 923 K and S/C = 3, Ni/La2O3 catalyst resulted to be the most stable and active
system but hydrogen selectivity lower than 77% was obtained due to the formation of
appreciable amounts of CH3CHO and CH4 (105).
When both materials (γ-Al2O3 and La2O3) are used as catalyst carriers in the form of
mixed oxide, a combination of catalytic properties is observed. Thus, dehydration and
dehydrogenation reactions compete over a large temperature range. It should also be
noted that La2O3, a basic material, may be adsorbing on the acidic sites of γ-Al2O3,
thus reducing the dehydration activity of the latter.
Thus, in the La2O3-Al2O3 carrier, the dehydrogenation reaction competes favourably
with the dehydration reaction, although the surface area of Al2O3 is significantly
higher than that of La2O3 .
In the presence of nickel, the catalysts become significantly more active, and there is a
shift of conversion to lower temperatures. Pure nickel causes bond breaking of
ethanol in the following order: O–H, –CH2–, C–C, and –CH3. Therefore, it should be
assumed that the key reaction for catalysts tested at temperatures up to 300 °C is the
dehydrogenation of ethanol to surface adsorbed CH3CHOads. The following scheme
(106) seems to describe best the transformations of CH3CHOads at this temperature
range:
Fig. 2.51 CH3CHO decomposition pathway (106).
The addition of Cu to Ni catalyst improves the activity of the catalyst, in fact
Morgenstern and Fornango (107)showed that Cu-plated Raney nickel is an active and
stable catalyst for low temperature steam reforming of ethanol (523–573 K). and

Literature review
H2 production from steam ethanol reforming (ESR) 75
Luengo et al. reported ethanol reforming over Ni/Cu/Cr/Al2O3 catalyst at 573-823K and
suggested that the catalytic effect was more pronounced at lower temperatures (108)
Fierro et al. found that a Ni–Cu/SiO2 catalyst is more active and selective towards H2
production in bio-ethanol oxidative steam reforming than Ni/SiO2 which rapidly
deactivates due to coke formation. In previous studies, these researchers presented
optimization of oxidative reforming of ethanol over Ni–Cu/SiO2 (109).
Marino et al. reported that Cu/Ni/K/-Al2O3 catalyst exhibited acceptable activity,
stability and selectivity to hydrogen at 573 K. A reaction network that accounted for
the formation of acetic acid and diethyl ether during reaction was proposed (110):
C2H5OH + H2O C2H4O2 +2H2
2C2H5OH (C2H5)2O + H2O
In this system, Cu is the active agent and promotes fast ethanol dehydrogenation to
acetaldehyde, Ni promotes C-C bond rupture of acetaldehyde to produce CH4 and CO
and increases hydrogen selectivity while K neutralizes acidic sites of Al2O3, avoids
formation of products such as ethylene and diethyl ether and improves the general
performance of the catalyst.
The benefit of using of K doped catalyst to avoid the formation of carbon filaments
with Ni at tip is identified in the electronic enrichment of the active phase which
reflects both in depressing the Boudouard reaction and the hydrocarbon
decomposition activity which are considered the main responsible in the coke
formation during reforming reactions (111). As a consequence, the concentration of
carbon on metal Ni surface never reach high value and carbon diffusion trough Ni
particle is limited.
A B
Fig. 2.52 Effect of Ni loading on selectivity for catalyst with A) 3 wt% Cu and B) 6 wt % Cu.

Literature review
76 H2 production from steam ethanol reforming (ESR)
Marino et al. have reported the formation of CuNiAl hydrotalcite type compounds
during catalyst preparation. The addition of Ni favored the formation of these
compounds thereby suggesting metal-support interaction (112).
The increase in the calcination temperature of the precursors produces a strong
interaction between nickel and aluminium, decreasing nickel reducibility and the
selectivity to C1 compounds. Calcination of Cu-Ni precursors in the range of 673–1073
K produces a CuO segregated phase and/or a phase of copper called “surface spinel”.
The just reduced bimetallic precursors show the best catalytic performance and an
acceptable stability, similar to that of calcined precursors, for the ethanol steam
reforming reaction at 573 K (112).
A possible mechanism in absence of water over Cu-Ni catalysts is proposed by Marino
et al.:
CH3CH2OH + σ Cu CH3CH2OH*
CH3CH2OH* CH3CHO + H2 +σ Cu
CH3CH2OH +σ Ni CH3CH2OH**
CH3CH2OH** CH3CHO** + H2
CH3CHO** CH4 +CO + σ Ni
CH3CHO** CH3CHO + σ Ni
The behaviour of the CH3CHO as an intermediary product could be interpreted from
this mechanism, but the selectivity changes that they have observed in the presence
of water cannot be explained from the stated mechanism.
The dissociative adsorption of water through a redox mechanism has been widely
reported for several Cu/Zn/Al catalysts used in the WGS reaction (113). Taking into
account this background, they have postulated that the presence of water should give
an alternative pathway for the ethanol conversion:
CH3CH2OH + σ Cu CH3CH2OH*
H2O+ σ Cu H2O*
H2O* + σ Cu HO* +H*
HO* + σ Cu H* +O*
H* +H* H2 + 2 σ Cu
CH3CH2OH* +O* CH3CHO + H2O + 2 σ Cu
CH3CH2OH* +O* CH3COOH + H2 + 2 σ Cu
This additional mechanism should explain the increase of the hydrogen and
acetaldehyde selectivity (approximately 20%) observed in presence of water.

Literature review
H2 production from steam ethanol reforming (ESR) 77
Fig. 2.53 Selectivity as a function of S/C (R=S/C)
Fig. 2.54 Product distribution as a function of S/C (R=S/C)
Velu et al. have used Cu–Ni–Zn–Al mixed metal oxide catalysts in oxidative steam
reforming of bio-ethanol. They found that the dehydrogenation of ethanol to
acetaldehyde is favored by Cu-rich catalysts while the introduction of Ni leads to C—C
bond rupture producing CO, CO2 and CH4 (114).
Also Barroso et al. have studied catalysts base on Ni-Zn-Al, they have found that the
catalysts were very active and a complete conversion was obtained at 773 and 873 K.
The selectivity in H2 and CO is high (85%) (115).
Cavallaro and Freni (116) investigated steam reforming of ethanol over
CuO/ZnO/Al2O3 and found that the catalyst exhibited good activity with CO, CO2 and
H2 as the main products above 630 K. The steam reforming of ethanol over CuO/CeO2
to produce acetone and hydrogen has also been studied (117). The formation of
acetone could be described by following reaction:
2C2H5OH + H2O CH3COCH3 +CO2 +4H2 (25)
Amphlett et al. (118)suggested that CuO/ZnO, CuO/SiO2, CuO/Cr2O3 or CuO/NiO/SiO2
might prove promising for reforming of ethanol–water mixtures at 623–723 K.
Machado et al. (119) studied the performance of Cu/Nb2O5 and Cu/Nb2O5/Al2O3

Literature review
78 H2 production from steam ethanol reforming (ESR)
catalysts in ethanol steam reforming. The dispersion of Nb2O5 on Al2O3 improved
catalyst action.
Cobalt is another non noble metal catalyst under extensive investigation as supported
Co could break C-C bond. Haga et al. studied the catalytic properties of Co among
other metals and found that selectivity to H2 was in the order Co >Ni >Rh > Pt, Ru, Cu.
In another study, they found that the supports vastly influenced the properties of Co
catalysts. The formation of H2 decreased in the order: Co/Al2O3 > Co/ZrO2 > Co/MgO >
Co/SiO2 > Co/C (120).
The Co/Al2O3 catalyst exhibited a very high selectivity to H2 (67% at 673 K) by
suppressing methanation of CO and decomposition of ethanol. Similarly, Cavallaro et
al. found that Co/MgO is more resistant to coke formation than Co/Al2O3 at 923 K
(121).
Co/ZnO showed the best performance, in terms of activity, selectivity to H2 and
stability. Although Al2O3 inhibited cobalt reduction, ZnO promoted it. At 723 K the
Co/ZnO catalysts was able to convert C2H5OH completely with a H2 selectivity of 80%
or even 90% after 50 h time on stream.
Co/ZnO characteristics were influenced by the cobalt precursor and pretreatment.
The use of Co(CO)8 as precursor produced a highly stable catalyst that enabled the
production of CO-free H2 at low temperatures (623 K). with a C2H5OH conversion of
100% and a H2 selectivity of 73 %, with no C2 or C3 species produced, and only small
amounts of CH4 (122). The catalyst also did not produce any CO. The aforementioned
stoichiometry suggests that Co/ZnO catalyst promotes the C2H5OH steam reforming
reaction via the H2 and CO2 pathway.
However, Co/ZnO showed a considerable amount of carbon deposition after the
reaction.(123) This caused deactivation of the cobalt catalysts. The deactivation rate
was dependent on the support used and the temperature (122). The addition of 0.98
wt % of sodium to the Co/ZnO catalyst improved the catalytic performance, in terms
of the H2 yield and stability, compared to unpromoted catalyst (124).

Literature review
H2 production from steam ethanol reforming (ESR) 79
Fig. 2.55 Extent of cobalt reduction (%) () CO2, () H2 produced as a function of ethanol steam reforming temperature . H723 refers to data at 723 after hydrogen treatment at the same temperature. After that, and following 8h on stream, 723t data were obtained.
Kaddouri and Mazzocchia reported high catalytic activity of Co/SiO2 and Co/Al2O3 for
steam reforming of ethanol and concluded that the product distribution was
dependent on both the nature of the support and the method of catalyst preparation,
thereby suggesting metal–support interaction (125).
Batista et al. studied ethanol steam reforming over Co/Al2O3 and Co/SiO2. The
catalysts showed average conversion higher than 70% at 673 K. The metal loading
influenced ethanol conversion and product distribution (126).

Literature review
80 H2 production from steam ethanol reforming (ESR)
Different authors have observed significant benefits in performing steam reforming of
ethanol in the presence of oxygen, both in terms of activity and catalysts stability
(127). Oxygen contributes to oxidize carbon residues formed during reaction
maintaining free the metal active surface. The behaviour of Ni/MgO and Ni/CeO2
catalysts in reforming of bio-ethanol (Fig. 2.56) in the presence of steam (SR) and
oxygen (ATR) have shown the fundamental role exerted by oxygen which, further to
contribute to depress coke formation it enhances both catalyst activity and stability.
Fig. 2.56 EtOH conversion vs. reaction time on (A) Ni/CeO2 and (B) Ni/MgO catalysts. A comparison between SR and ATR conditions: TR = 923K.
In the steam reforming of ethanol at high temperature Rh based catalysts shows the
best performance both in terms of specific activity and catalyst stability. However, a
perplexity remains concerning the extremely high activity in methanation reaction,
which negatively reflects on the hydrogen productivity (CH4 selectivity higher than 5-
10%).

Literature review
H2 production from steam ethanol reforming (ESR) 81
Fig. 2.57. Steam reforming of bio-ethanol over Rh/MgO, Ni/MgO and Ni/CeO2 catalyst: coke formation rate in the absence and in the presence of oxygen in the reaction stream.
Pd resulted to be less active than Rh and in addition is not so active in methane
conversion and this negatively affects the hydrogen productivity (121).
Ru-containing catalysts supported on cordierite monolith has been recently proposed
for the hydrogen production by partial oxidation of ethanol (121). Catalyst seems to
be enough stable but too high selectivity to CH4, C2H4 and C2H6 were found.
22..44..33 CCaattaallyyssttss
The best catalyst for steam reforming of ethanol requires a surface capable of
breaking the carbon–carbon bond. There are at least two further requirements for the
catalyst: it must be capable of selectively oxidizing both carbon atoms to CO or CO2
and, in the case of hydrogen production, it must not be active (or must be relatively
inactive) for the oxidation of H2 to H2O.
Other requirement of the catalyst is the stability in the reaction conditions. In steam
reforming reaction, the two factors that largely govern the stability of the catalyst are
coke formation and metal sintering(97).
Different catalytic system have been studied in this reaction using different metals
and various supports(115).
Good catalysts for ethanol steam reforming are metals like Co, Ni, Rh, Ru, Pd, Ir and
Pt that promote the dehydrogenation to acetaldehyde and prevent the dehydration
to ethylene. At certain temperature decompose the organic substrate to C* and H*
(dissociative adsorption) getting close to thermodynamic equilibrium.
Rh is significantly more active and selective compared to Pt, Pd, but it has limited
water gas shift (WGS) activity (97). In comparison, Pt has relatively higher WGS
activity. Pt also has good thermal stability (97).
Ni is the catalyst of choice in hydrogenation and dehydrogenation reactions due to its
high activity and low cost. Ni-based catalysts have high steam reforming activity. Ni
has limited WGS activity. Ni possesses hydrogenation activity and hence it may help

Literature review
82 H2 production from steam ethanol reforming (ESR)
in combining adsorbed H atoms on the catalyst surface to form molecular hydrogen,
but it forms CH4 by metanation (97).
Cu has limited steam reforming activity, it is a good dehydrogenation catalyst. Cu has
high WGS activity (97).
Co-based catalysts have exhibited good performance for H2 production in steam
reforming of ethanol. However, supported Co catalysts are adversely affected by
metal sintering and surface Co oxidation and hence are not suitable for use at high
temperatures (97).
Ru is another versatile catalyst having high activity in steam reforming of
hydrocarbons.
So the activity order of metals is Rh > Pd > Ni = Pt. When ceria/zirconia was the
support ethylene formation was not observed and the order of activity at higher
temperature was Pt ≥ Rh > Pd. Aupretre et al. (128) studied the effect of both the
metal and the support in the steam reforming of bio-ethanol. They found that the
hydrogen yield on alumina-supported metal catalysts decreased in the following order
at 973 K: 9.7% Ni > 1% Rh > 0.5% Pd > 1% Pt > 9.1% Cu = 9.8% Zn > 0.67% Ru = 8.7%
Fe.
They concluded that the high activity of the metals in the ethanol steam reforming
and the poor efficiency in the water gas shift reaction (i.e. also for the reverse WGS
reaction) would give active and selective catalysts for ethanol reforming.
Liguras et al. also found that among the low-loaded catalysts, Rh was significantly
more active and selective towards hydrogen formation than Ru, Pt and Pd. The
catalytic performance of Rh and, particularly, Ru was greatly improved by the increase
of metal loading. It was shown that the catalytic activity and selectivity of highly
loaded Ru catalysts were comparable to those of Rh (129).

Literature review
H2 production from steam ethanol reforming (ESR) 83
Fig. 2.58 Effect of reaction temperature and metal load on the conversion of ethanol (A), and on the selectivities toward reaction products (B and C) obtained over the 1% Me/Al2O3 catalysts (Me = Pd, Ru, Pt, Rh) and the Al2O3 support.
Rh/MgO showed the best performance in the steam reforming of ethanol at 923 K in
terms of activity and stability. It was not so selective, however, towards hydrogen
formation (103). Kinetic measurements revealed large difference in metal specific
activities: Rh sites were 2.3, 3.7, and 5.8 times more active than Pd, Co and Ni sites,
respectively (97).

Literature review
84 H2 production from steam ethanol reforming (ESR)
Fig. 2.59 Ethanol conversion and product distribution at 923 K, (◊) CO2, () CO, (x) CH4, () CH3CHO, () C2H4.
Some studies imply that metals alone do not assist H2 production significantly. These
studies suggest that the performances of metal catalysts could be improved using
suitable supporting materials. The nature of the support also plays a key role in
determining the selectivity to H2 (97).
Al2O3 is commonly used as a support in the steam reforming reaction. However, it is
acidic and promotes dehydration of ethanol to ethylene, which in turn polymerizes to
form coke on the catalyst surface (97).
In contrast, MgO is basic. The highly active Rh catalysts seems no affect from the
support (Al2O3 or MgO) as far as coke formation is concerned. However, the Co
catalyst is more selective and stable when supported on MgO than on Al2O3 (97).

Literature review
H2 production from steam ethanol reforming (ESR) 85
ZnO also has basic characteristics. In addition, unlike -Al2O3 and MgO, it also has
redox properties. It promotes dehydrogenation to acetaldehyde. The redox properties
of ZnO then aid steam reforming . It is extremely selective to the steam reforming of
ethanol (97).
The catalytic performance and stability of Ni is claimed to be when supported on
La2O3, compared to Al2O3, YSZ and MgO. La2O3 does not possess any acidic sites and
promotes dehydrogenation to acetaldehyde.
CeO2 is also basic and has redox properties. It has oxygen storage capacity and hence
its presence improves resistance to coke deposition. It also promotes the action of
precious metals.CeO2 is active in the WGS reaction (97).
ZrO2 has both acidic and basic properties and is thermally stable. Addition of ZrO2 to
CeO2 significantly increases its oxygen storage action, redox properties and thermal
resistance.
The addition of alkali like Li, Na and K on Ni/MgO enhanced the catalyst stability
mainly by depressing Ni sintering and decreased the amount of coke.
On an acid support the presence of K neutralise acidic sites, therefore alkali avoid the
dehydration reactions that lead to products such as ethylene or diethyl ether (112).
Fig. 2.60 Elemental compounds that are studying as catalyst in ethanol reforming.

Literature review
86 H2 production from steam ethanol reforming (ESR)
22..44..44 PPrroocceessss CCoonnssiiddeerraattiioonnss
From process engineering point of view: (1) reforming should preferably be carried out
at low temperatures and atmospheric pressures to reduce the operating costs; (2) the
catalyst should provide high selectivity to H2 and inhibit CO formation, the formation
of by-products such as methane, acetaldehyde and diethyl ether should be minimum;
(3) the catalyst must resist coke formation which reduces the number of active sites
and hence the reaction rates; (4) the catalyst should not be poisoned by impurities
found in the ethanol–water mixtures formed during biomass ethanol source
fermentation; (5) the H2-rich mixture should be purified further to remove CO formed
during reaction if the PEMFC should be met.
Catalyst coking strongly depends on the reaction conditions and the properties of the
catalyst. Ethylene is a known coke precursor and carbon formation is primarily
attributed to its presence in the product stream. However, coke formation can be
prevented if ethanol is instead dehydrogenated to acetaldehyde, which has a very low
coking activity. Acetaldehyde thus formed can then be subjected to steam reforming.
The effectiveness of Cu in dehydrogenation reactions is no novelty. Freni et al. (130)
studied steam reforming of ethanol over Cu/SiO2 and found that at temperatures in
the range 573-723 K, ethanol conversion was 100% and acetaldehyde and H2 were the
major reaction products. Traces of methane and CO were also detected. Thus, they
concluded that at these temperatures, the ethanol dehydrogenation reaction is
predominant. At higher temperatures (>773 K), ethylene formation was observed and
the selectivity to ethylene increased with increasing temperatures thereby suggesting
that the dehydration reaction also takes place at such high temperatures. Nishiguchi
et al. (117) reported almost selective dehydrogenation of ethanol to acetaldehyde and
H2 over CuO and CuO/SiO2 in the range of temperatures 473-673 K. Steam reforming
of ethanol over CuO/CeO2 at 533K also led to the formation of acetaldehyde and
hydrogen. From the fore goings, it is clear that ethanol can be almost selectively
converted to acetaldehyde over Cu-based catalysts at low temperatures. Ni which has
high activity in steam reforming will then promote C-C bond rupture in acetaldehyde.
The steam reforming process could therefore be carried out in a two-layer fixed bed
catalytic reactor. A schematic diagram of this proposed process is shown in Fig. 2.61.
An ethanol–water mixture should be passed at 573-673K over the first layer made of
Cu-based catalyst thereby converting ethanol to acetaldehyde.
C2H5OH CH3CHO + H2
Ethylene formation can be prevented by working at such low temperatures thereby
reducing catalyst coking. Acetaldehyde thus formed may decompose to CH4 and CO
or may undergo steam reforming via the following reactions:
CH3CHO CH4 +CO
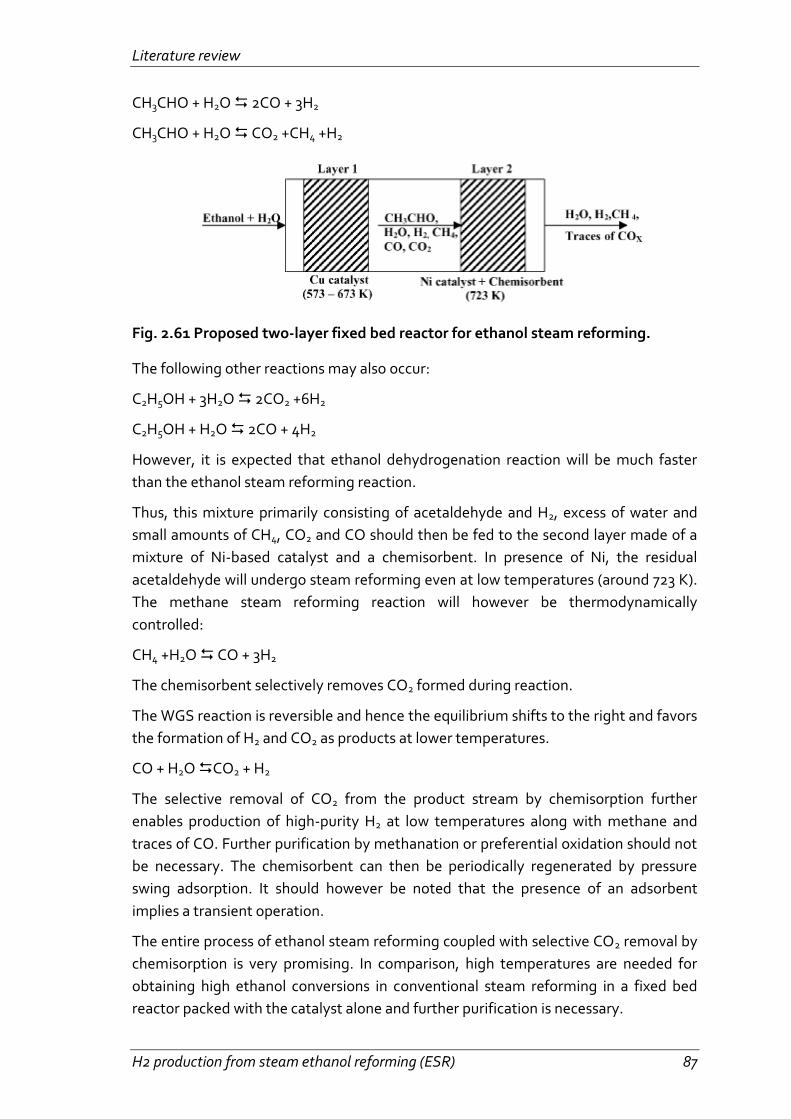
Literature review
H2 production from steam ethanol reforming (ESR) 87
CH3CHO + H2O 2CO + 3H2
CH3CHO + H2O CO2 +CH4 +H2
Fig. 2.61 Proposed two-layer fixed bed reactor for ethanol steam reforming.
The following other reactions may also occur:
C2H5OH + 3H2O 2CO2 +6H2
C2H5OH + H2O 2CO + 4H2
However, it is expected that ethanol dehydrogenation reaction will be much faster
than the ethanol steam reforming reaction.
Thus, this mixture primarily consisting of acetaldehyde and H2, excess of water and
small amounts of CH4, CO2 and CO should then be fed to the second layer made of a
mixture of Ni-based catalyst and a chemisorbent. In presence of Ni, the residual
acetaldehyde will undergo steam reforming even at low temperatures (around 723 K).
The methane steam reforming reaction will however be thermodynamically
controlled:
CH4 +H2O CO + 3H2
The chemisorbent selectively removes CO2 formed during reaction.
The WGS reaction is reversible and hence the equilibrium shifts to the right and favors
the formation of H2 and CO2 as products at lower temperatures.
CO + H2O CO2 + H2
The selective removal of CO2 from the product stream by chemisorption further
enables production of high-purity H2 at low temperatures along with methane and
traces of CO. Further purification by methanation or preferential oxidation should not
be necessary. The chemisorbent can then be periodically regenerated by pressure
swing adsorption. It should however be noted that the presence of an adsorbent
implies a transient operation.
The entire process of ethanol steam reforming coupled with selective CO2 removal by
chemisorption is very promising. In comparison, high temperatures are needed for
obtaining high ethanol conversions in conventional steam reforming in a fixed bed
reactor packed with the catalyst alone and further purification is necessary.

Literature review
88 H2 production from steam ethanol reforming (ESR)
22..44..55 AAlltteerrnnaattiivvee ssoolluuttiioonnss
One of the major problem in the steam reforming is the heat transfer boundary layers
both on the tube and furnace sides cause heat transfer to be rate limiting in these
systems. Possible solutions are autothermal reforming or a catalytic wall reactor.
22..44..55..11 AAuuttootthheerrmmaall rreeffoorrmmiinngg ooff eetthhaannooll
Steam reforming is an endothermic process in the absence of oxygen gas and requires
energy input to initiate reactions.
Alternatively, hydrogen can be obtained by partial oxidation of ethanol at a
temperature of about 773K according to the following reactions.
The addition of different quantities of oxygen (being = 1 the total oxidation
stoichiometric amount) can change the enthalpy of the reaction moving it endo to
exothermic reaction.
1)C2H5OH + H2O 2CO + 4H2 H°298 = 256 KJ/mol-1 = 02)
C2H5OH + 1/2O2 2CO + 3H2 H°298 = 57 KJ/mol-1 = 0.17
3) C2H5OH + O2 CO2 + CO + 3H2 H°298 = -226 KJ/mol-1 = 0.33
4) C2H5OH + 3/2O2 2CO2 + 3H2 H°298 = -509 KJ/mol-1 = 0.50
5) C2H5OH + 3O2 2CO2 + 3H2O H°298 = -1368 KJ/mol-1 = 1
It is to be noted that the 2:1 = ethanol : oxygen ratio is still endothermic.
However, hydrogen selectivity of ethanol partial oxidation is generally low. In order to
enhance hydrogen production, autothermal reforming can be applied. Autothermal
reforming, also called oxidative steam reforming, is a combination of ethanol
oxidation and steam reforming. The total reaction of autothermal reforming of
ethanol can be written as
C2H5OH + 2H2O + 1/2O2 2CO2 + 5H2 H°298 =−50 KJ/ mol
This reaction be described by reactions number plus twice WGS is indeed exothermic.
This reaction indicates that the autothermal reforming not only attains thermally
sustained operation, but also maximizes hydrogen production.

Literature review
H2 production from steam ethanol reforming (ESR) 89
Fig. 2.62 Effect of reactor temperature on equilibrium selectivities to the reaction products for the oxidative steam reforming of ethanol (O2/EtOH = 0.68 and H2O/EtOH = 1.6; pressure= 1 atm).
The ethanol conversion and hydrogen selectivity by autothermal reforming of ethanol
vary greatly with the type of catalyst, support and oxygen/ steam/ethanol molar
ratios. Autothermal reforming is advantageous as coke formation is greatly inhibited
by oxidation. Thus, long-term stable operation can be achieved.
Several studies have reported hydrogen production by autothermal reforming of
ethanol over Rh-Ce (131), Cu1−xNix ZnAl-mixed metal oxide (132), Pt/Al2O3 (133), Ni-Rh/
CeO2 (100), and Pd/ZnO (134) catalysts.
22..44..55..22 CCaattaallyyttiicc wwaallll rreeaaccttoorrss
Other possibility to solve the problem of heat transfer is to eliminate the heat transfer
boundary layers by coupling the combustion and reforming reactions catalytically on
the opposite sides of a thin wall. The catalytic wall reactor (CWR) increases the heat
transfer coefficient by 200 times when compared to a traditional steam reforming
reactor (135).
Finally, the flat plate CWR allows easy scaling because exothermic and endothermic
channels can be alternated to produce a desired amount of hydrogen. A flat plate
CWR where methane combustion is coupled to methane steam reforming followed by
water–gas shift has been demonstrated in Fig. 2.63.
Those catalytic wall reactors have had problems with material stability that limited
maximum temperatures to<800 °C .
Another configuration for a CWR is the concentric tube reactor, which has tested for
the homogeneous dehydration of ethane to ethylene (136).

Literature review
90 H2 production from steam ethanol reforming (ESR)
Fig. 2.63 Schematic diagrams of the flat plate configuration CWR (a) and extended CWR (b). The arrows show the direction of flow. The label ‘‘Endo’’ indicates the channel in which the ethanol–water mixture flows. The label ‘‘Exo’’ indicates the channel in which the combustion mixture flows. All channels were 5 cm wide and 8 cm long except for the extended channel in the extended CWR, which was 13 cm long. The channels were nominally 4 mm in height.

Literature review
H2 production from steam ethanol reforming (ESR) 91
22..55 CCaattaallyyssttss oobbttaaiinneedd ffrroomm hhyyddrroottaallcciittee
((HHTT)) ttyyppee pprreeccuurrssoorr
Anionic clays or layered double hydroxides (LDHs) are lamellar mixed hydroxides
with interlayer spaces containing exchangeable anions with general formula:
[M2+(1-x)M
3+x(OH)2]b+ (An-
b/n) mH2O
This class of compounds, also called hydrotalcite like compounds (HTlcs), are
relatively inexpensive to prepare in the laboratory scale (137). The most interesting
properties are the homogeneous cation distribution and the ion exchange capacity in
the precipitates. In addition, other important properties of the oxides obtained by
calcination are (138):
(1) high surface area,
(2) basic properties,
(3) formation of homogeneous mixture of oxides with very small crystal size, stable to
thermal treatments, which by reduction form small and thermally stable metal
crystallites,
(4) ‘‘memory effect’’, which allows the reconstruction, under mild conditions, of the
original hydrotalcite structure when contacting the product of the thermal treatment
with water solutions containing various anions.
Mg2+, Al3+ OH- CO32-
Fig. 2.64 Crystal structure of hydrotalcite-like precursor.
To understand the structure of these compounds, it is necessary to start from the
structure of brucite [Mg(OH)2], where octahedra of Mg2+ (6-fold coordinated to OH-)
share edges to form infinite sheets. These sheets are stacked on top of each other and

Literature review
92 H2 production from steam ethanol reforming (ESR)
are held together by hydrogen bonding (Fig. 2.65). When Mg2+ ions are substituted by
a trivalent ion having a suitable ionic radius (such as Al3+ for hydrotalcite compounds),
a positive charge is generated in the hydroxyl sheet. This net positive charge is
compensated by (CO3)2- anions, which lie in the interlayer region between the two
brucite-like sheets, In the free space of this interlayer the water of crystallization also
finds a place.
Fig. 2.65 Crystal structure of hydrotalcite-like precursor.
The hydrotalcite-derived catalysts (ex-HT), containing carbonates as interlayer
anions, have already been reported as effective catalysts in the production of
synthesis gas, using as active phase Ni, Rh and Ni/Rh. The characterization of these
catalysts has revealed that the structure is made of MgO type and spinel type phases
containing Rh and/or the Ni, which can be extracted to form rather stable metal
particles. High activity may be due to the highly dispersed Ni metal particles. Mg-Al
hydrotalcite precursor, in which a part of the Mg sites were substituted by Ni,
decomposed to Mg(Al)O mixed oxide still containing Ni2+ at the Mg2+ site. When the
mixed oxide was reduced, Ni2+ was reduced to Ni0, migrated to the surface, and
crystallized to form fine Ni metal particles on Mg(Al)O mixed oxide as the support
(Fig. 2.66). Takehira (138) observed that the crystal growths of both Ni metal and
MgAl2O4 spinel after CPO reaction for 560 h, no decline was observed in the activity
during the reaction under space velocity of 1.156 *104 mL h-1 g-cat-1. TEM observation
of the catalyst after the reaction for 560 h still showed finely dispersed Ni metal
particles together with those of large size. The H2 adsorption measurements still
showed a high value of 91.3 μmol g-cat-1, corresponding to a dispersion of 8.5 %.
Takehira (138) suggests that Ni species was continuously reduced to form fine Ni
metal particles during a long term of the reaction. Active metal species is
homogeneously distributed from the surface to the bulk of the catalyst particles and
therefore a large part of the metal species is still located inside of the particles and
cannot work as the active species.

Literature review
H2 production from steam ethanol reforming (ESR) 93
Fig. 2.66 Plausible mechanism of Ni metal crystallization from Mg(Al)O mixed oxide (138).
A general property of the ex-HT is that the amount and the nature of M(II) and M(III)
modified the ratio between MgO and spinel phases. The reducibility and stability of
the Ni catalysts (in which Ni is preferentially present in a solid solution with Mg), are
strongly affected by the Mg/Al/Ni ratio due to three main effects (139),(140):
(1) a low Mg content favors the formation of low active NiAl2O4,
(2) Ni-rich samples exhibit low Ni2+ reduction temperature, and fast deactivation due
to the presence of large Ni particles,
(3) a decrease in reducibility of the Ni2+ ions is observed for high Mg/Ni ratio, due to
the low concentration of Ni in the (Ni/Mg)O solid solution.
These effects limit the activity and stability of Ni containing catalysts that require new
formulation. The situation for Rh catalysts is still more complicated, since it is soluted
both in the spinel type and in the MgO type phases and the Mg/Al ratio affects the
distribution of Rh between the two phases. The presence of other elements can
change the correlation between Mg/Al ratio, spinel/MgO phase ratio and the Rh
distribution (141). In particular, the silicate can form with Mg or Al a specific phase,
which can also incorporate Rh and or Ni. Furthermore, the presence of nesosilicate
can improve thermal and mechanical resistance at high temperature.

Literature review
94 H2 production from steam ethanol reforming (ESR)
Fig. 2.67 Forsterite-type structure.
The insertion of silicates instead of carbonates as interlayer anion affects the derived
structure both before and after calcination (142). The silicates remain in the structure
forming a new phase characterized by mixed silicate with a forsterite type structure
(Fig. 2.67) having formula Mg2-xM2/3xSiO4 (M = Al, Rh), together with a MgO-type
structure, other reflections can be attributed to defective spinel type phase. The
calcined samples presented high surface area values (100 m2g-1) also after reaction,
confirming the high thermal and mechanical stability of the materials. These catalysts
presents higher CH4 conversion and CO and H2 selectivity with respect to that with the
same formulation, but obtained from an HT containing carbonates, in which the
spinel-type phase was present (143).

Literature review
H2 production from steam ethanol reforming (ESR) 95
BIBLIOGRAFY
1. Eni. World gas and oil review;, 2010.
2. Demirbas, A. Global renewable energy resources. Energy Sources Part A:
Recovery, Utilization and Environmental Effects 2006, 28, 779-792.
3. McDowall, W.; Eames, M. Forecasts, scenarios, visions, backcasts and roadmaps
to the hydrogen economy: A review of the hydrogen futures literature. Energy
policy 2006, 34, 1236-1250.
4. Stolten, D., Ed. Hydrogen and fuel cells.; Wiley-VCH, 2010.
5. Rostrup-Nielsen, J. R. Fuels and energy for the future: The role of catalysis.
Catalysis Reviews 2004, 46, 247-270.
6. Ferreira-Aparicio, P.; Benito, M. J.; Sanz, J. L. New trends in reforming
technologies: From hydrogen industrial plants to multifuel microreformers.
Catalysis Reviews 2005, 47, 491-491.
7. Rustrup-Nielsen, J. R. New aspects of syngas production and use. Catalysis Today
2000, 63, 159-164.
8. Haryanto, A.; Fernando, S.; Naveen Murali, N.; Adhikari, S. Current status of
hydrogen production techniques by steam reforming of ethanol: a review. Energy
& Fuels 2005, 19, 2098-2106.
9. World Energy Outlook 2008; International Energy Agency (IEA): Paris, 2008.
10. Martinot, E. Renewable 2007: global status report.; REN21 Renewable Energy
Policy Network, 2008.
11. Rogner, H. World energy assessment 2001.;, 2001.
12. International Energy Outlook 2010; US Energy Information Administration, 2010.
13. Energy Outlook 2030; British Petroleum: London, 2011.
14. World Energy Outlook 2010; International Energy Agency (IEA): London, 2010.
15. Cadenas, A.; Cabezudo, S. Biofuels as sustainable technologies: perspectives for
less developed countries. Technological Forecasting and Social Change 1998, 58,
83-103.
16. Puppan, D. Environmental evaluation of biofuels. Period Polytech Ser Soc Man Sci
2002, 10, 95-116.

Literature review
96 H2 production from steam ethanol reforming (ESR)
17. Demirbas, A. Biomass resource facilities and biomass conversion processing for
fuels and chemicals. Energy Conversion and Management 2001, 42, 1357–1378.
18. White, L. P.; Plasket, L. G. Biomass as fuel; Academic Press: New York, 1981.
19. Demirbas, A. Potential applications of renewable energy sources, biomass
combustion problems in boiler power systems and combustion related
environmental issues. Progress in Energy and Combustion Science 2005, 31, 171–
192.
20. Volk, T. A.; Abrahamson, L. P.; White, E. H.; Neuhauser, E.; Gray, E.; Demeter, C.;
Lindsey, C.; Jarnefeld, J.; Aneshansley, D. J.; Pellerin, R.; Edick, S. Developing a
Willow Biomass Crop Enterprise for Bioenergy and Bioproducts in the United
States. Proceedings of Bioenergy 2000 2000.
21. Demirbas, A. Progress and recent trends in biofuels. Progress in Energy and
Combustion Science 2007, 33, 1-18.
22. Goyal, H. B.; Seal, D.; Saxena, R. C. Bio-fuels from thermochemical conversion of
renewable resources: A review. Renewable and Sustainable Energy Reviews 2008,
12, 504–517.
23. Luo, Z.; Wang, S.; Liao, Y.; Zhou, J.; Gu, Y.; Cen, K. Research on biomass fast
pyrolysis for liquid fuel. Biomass Bioenergy 2004, 26, 455–462.
24. Gercel, H. F. Production and characterization of pyrolysis liquids from sunflower
pressed bagasse. Bioresource Technology 2002, 85, 113-117.
25. McKendry, P. Energy production from biomass (Part 2): overview of biomass.
Bioresource Technology 2002, 83, 37–46.
26. Bridgwater, A. V.; Peacocke, G. V. C. Fast pyrolysis process for biomass.
Renewable and Sustainable Energy Reviews 2000, 1-73, 4.
27. Demirbas, A. Political, economic and environmental impacts of biofuels: a
review. Applied Energy 2009, 86, S108–S117.
28. United-Nations. The emerging biofuels market: regulatory, trade and
development implications. United Nations conference on trade and development,
New York and Geneva, 2006.
29. Ma, F.; Hanna, M. A. Biodiesel production: a review. Bioresource Technology
1999, 70, 1-15.
30. Zhang, Y.; Dub, M. A.; McLean, D. D.; Kates, M. Biodiesel production from waste
cooking oil: 2. Economic assessment and sensitivity analysis. Bioresource
Technology 2003, 90, 229–240.

Literature review
H2 production from steam ethanol reforming (ESR) 97
31. Demirbas, A. Competitive liquid biofuels from biomass. Applied Energy 2011, 88,
17–28.
32. HHO-Hydrogen Energy Solutions. http://hho-hydrogen-energy.com/ (accessed
Jan 23, 2011).
33. van Ruijven, B.; van Vuuren, D. P.; de Vries, B. The potential role of hydrogen in
energy systems with and without climate policy. International Journal of
Hydrogen Energy 2007, 32, 1655-1672.
34. Forsberg, C. W. Future hydrogen markets for large-scale hydrogen production
systems. International Journal of Hydrogen Energy 2007, 32, 431-439.
35. Solomon, B. D.; Banerjee, A. A global survey of hydrogen energy research,
development and policy. Energy Policy 2006, 34, 781-792.
36. Hellman, A.; Honkala, K.; Remediakis, I. N.; Logadóttir, Á.; Carlsson, A.; Dahl, S.;
Christensen, C. H.; Nørskov, J. K. Insights into ammonia synthesis from first-
principles. Surface Science 2006, 600, 4264-4268.
37. Twigg, M. V. Catalyst Handbook, 2nd ed.; Wolf Publishing Ltd, 1989.
38. Liu, X.; Lu, G. Q.; Yan, Z.; Beltramini, J. Recent Advances in Catalysts for
Methanol Synthesis via Hydrogenation of CO and CO2.. Industrial and
Engineering Chemistry Research 2003, 42, 6518-6530.
39. Stöcker, M. Methanol-to-hydrocarbons: Catalytic materials and their behaviour.
Microporous and Mesoporous Materials 1999, 29, 3-48.
40. Keil, F. J. Methanol-to-hydrocarbons: Process technology. Microporous and
Mesoporous Materials 1999, 29, 49-66.
41. Choudary, T. V.; Goodman, D. W. Methane activation on Ni and Ru model
catalysts”. Journal of Molecular Catalysis A 2000, 163, 9-18.
42. Lee, S.; Sardesai, A. Liquid phase methanol and dimethyl ether synthesis from
syngas. Topics in Catalysis 2005, 32, 197-207.
43. Guo, Y.; Meyer-Zaika, W.; Muhler, M.; Vukojevic, S.; Epple, M. Cu/Zn/Al xerogels
and aerogels prepared by a sol-gel reaction as catalysts for methanol synthesis.
European Journal of Inorganic Chemistry 2006, 4774-4781.
44. Mills, G. A. Status and future opportunities for conversion of synthesis gas to
liquid fuels. Fuel 1994, 73, 1243-1279.
45. Rao, V. U. S.; Stiegel, G. J.; Cinquegrane, G. J.; Srivastava, R. D. Iron-based
catalysts for slurry-phase Fischer-Tropsch process: Technology review. Fuel

Literature review
98 H2 production from steam ethanol reforming (ESR)
Processing Technology 1992, 30, 83-107.
46. van de Loosdrecht, J. Preparation and Properties of Supported Fischer-Tropsch
Catalysts; Ph.D. thesis; Utrecht University: The Netherlands, 1995.
47. Morselli, S. Ph.D. thesis; Scuola Normale superiore di Pisa: Italy, 2001.
48. Dry, M. E. The Fischer-Tropsch Process-Commercial aspects. Catalysis Today
1990, 6, 183-206.
49. Semelsberger, T. A.; Borup, R. L.; Greene, H. L. Dimethyl ether (DME) as an
alternative fuel. Journal of Power Sources 2006, 156, 497-511.
50. Moradi, G. R.; Nosrati, S.; Yaripor, F. Effect of the hybrid catalysts preparation
method upon direct synthesis of dimethyl ether from synthesis gas. Catalysis
Communications 2007, 8, 598-606.
51. Fei, J.; Tang, X.; Huo, Z.; Lou, H.; Zheng, X. Effect of copper content on Cu-Mn-
Zn/zeolite-Y catalysts for the synthesis of dimethyl ether from syngas. Catalysis
Communications 2006, 7, 827- 831.
52. Sun, K.; Lu, W.; Qiu, F.; Liu, S.; Xu, X. Direct synthesis of DME over bifunctional
catalyst: Surface properties and catalytic performance. Applied Catalysis A 2003,
252, 243-249.
53. Parisi, D. R.; Laborde, M. A. Modeling of counter current moving bed gas-solid
reactor used in direct reduction of iron ore. Chemical Engineering Journal 2004,
104, 35-43.
54. Soleimania, M.; Bassi, A.; Margaritis, A. Biodesulfurization of refractory organic
sulfur compounds in fossil fuels.. Biotechnology Advances 2007, 25, 570-596.
55. Brunet, S.; Mey, D.; Pérot, G.; Bouchy, C.; Diehl, F. On the hydrodesulfurization
of FCC gasoline: a review. Applied Catalysis A 2005, 278, 143-172.
56. Chianelli, R. R.; Berhault, G.; Raybaud, P.; Kasztelan, S.; Hafner, J.; Toulhoat, H.
Periodic trends in hydrodesulfurization: in support of the Sabatier principle..
Applied Catalysis A 2002, 227, 83-96.
57. Grange, P. Catalytic hydrodesulfurization. Catalysis Reviews - Science and
Engineering 1980, 21, 135-181.
58. Wand, G. Fuel Cells History, part 1. Johnson Matthey plc 2008.
59. Grove, W. R. On Voltaic Series and the Combination of Gases by Platinum.
Philosophical Magazine and Journal of Science 1839, 14, 127-130.
60. Song, C. Fuel processing for low-temperature and high-temperature fuel cells:

Literature review
H2 production from steam ethanol reforming (ESR) 99
Challenges, and opportunities for sustainable development in the 21st century.
Catalysis Today 2002, 77, 17-49.
61. How fuel cells work.
http://www.ballard.com/About_Ballard/Resources/How_Fuel_Cells_Work.htm
(accessed Feb 4, 2011).
62. Krumpelt, M.; Krause, T. R.; Carter, J. D.; Kopasz, J. P.; Ahmed, S. Fuel processing
for fuel cell systems in transportation and portable power applications. Catalysis
Today 2002, 77, 3-16.
63. Fuel cells.
http://www1.eere.energy.gov/hydrogenandfuelcells/fuelcells/fc_types.html
(accessed Jan 23, 2011).
64. Research and Innovation-Fuel cells.
http://ec.europa.eu/research/rtdinfo/42/01/article_1317_en.html.
65. Armor, J. N. The multiple roles for catalysis in the production of H2. Applied
Catalysis A 1999, 176, 159-176.
66. Armor, J. N. Catalysis and the hydrogen economy. Catalysis letters 2005, 101,
131-135.
67. Peña, M. A.; Gómez, J. P.; Fierro, J. L. G. New catalytic routes for syngas and
hydrogen production. Applied Catalysis A 1996, 144, 7-57.
68. Rostrup-Nielsen, J. R. Handbook of Heterogeneus catalysys; Wiley-VCH, 2009; pp
1-24.
69. Jarosch, K.; El Solh, T.; de Lasa, H. I. Modelling the catalytic steam reforming of
methane: Discrimination between kinetic expressions using sequentially
designed experiments. Chemical Engineering Science 2002, 57, 3439-3451.
70. Rostrup-Nielsen, J. R. Industrial relevance of coking. Catalysis Today 1997, 37,
225-232.
71. Bartholomew, C. H. Mechanisms of catalyst deactivation. Applied Catalysis A
2001, 212, 17-60.
72. Bartholomew, C. H. Carbon decomposition in steam reforming and methanation.
Catalysis Reviews 1982, 24, 67-112.
73. Armor, J. N.; Martenak, D. J. Studying carbon formation at elevated pressure.
Applied Catalysis A 2001, 206, 231-236.
74. Sehested, J.; Gelten, J. A. P.; Remediakis, I. N.; Bengaard, H.; Norskov, J. K.

Literature review
100 H2 production from steam ethanol reforming (ESR)
Sintering of nickel steam-reforming catalysts: Effects of temperature and steam
and hydrogen pressures. Journal of Catalysis 2004, 223, 432-443.
75. Hu, Y. H.; Ruckenstein, E. Catalytic Conversion of Methane to Synthesis Gas by
Partial Oxidation and CO2 Reforming. Advances in Catalysis 2004, 48, 297-345.
76. Choudhary, V. R.; Rajput, A. M.; Prabhakar, B. Low temperature oxidative
conversion of methane to syngas over NiO-CaO catalyst. Catalysis Letters 1992,
15, 363-370.
77. Choudhary, V. R.; Rajput, A. M.; Prabhakar, B. Nonequilibrium Oxidative
Conversion of Methane to CO and H2 with High Selectivity and Productivity over
Ni/Al2O3 at Low Temperatures. Journal of Catalysis 1993, 139, 326-328.
78. Choudhary, V. R.; Rajput, A. M.; Rane, V. H. Low temperature oxidative
conversion of methane to synthesis gas over Co/rare earth oxide catalysts.
Catalysis Letters 1992, 16, 269-272.
79. Choudhary, V. R.; Rajput, A. M.; Rane, V. H. Low-temperature catalytic selective
partial oxidation of methane to CO and H2 over Ni/Yb2O3. Journal of Physical
Chemistry 1992, 96, 8686-8688.
80. Choudhary, V. R.; Sansare, S. D.; Mamman, A. S. Low-temperature selective
oxidation of methane to carbon monoxide and hydrogen over cobalt-MgO
catalysts. Applied Catalysis A 1992, 90, L1-L5.
81. Gavalas, G. R.; Phichitcul, C.; Voecks, G. E. Structure and activity of NiO α-Al203
and NiO ZrO2 calcined at high temperatures. II. Activity in the fuel-rich oxidation
of methane. Journal of Catalysis 1984, 88, 65-72.
82. Hickman, D. A.; Schmidt, L. D. Synthesis gas formation by direct oxidation of
methane over Pt monoliths. Journal of Catalysis 1992, 138, 267-282.
83. York, A. P. E.; Xiao, T.; Green, M. L. H. Brief overview of the partial oxidation of
methane to synthesis gas. Topics in Catalysis 2003, 22, 345-358.
84. Fishtik, I.; Alexander, A.; Datta, R.; Geana, D. Thermodynamic analysis of
hydrogen production by steam reforming of ethanol via response reactions.
International Journal of Hydrogen Energy 2000, 25, 31-45.
85. Fishtik, I.; Gutman, I.; I., N. Unnoticed identities in chemical thermodynamics.
Journal of the Chemical Society, Faraday Transactions 1995, 91, 1325-1331.
86. Comas, J.; Laborde, M.; Amadeo, N. Thermodynamic analysis of hydrogen
production from ethanol using CaO as a CO2 sorbent. Journal of Power Sources
2004, 138, 61-67.

Literature review
H2 production from steam ethanol reforming (ESR) 101
87. Mas, V.; Kipreos, R.; Amadeo, N.; Laborde, M. Thermodynamic analysis of
ethanol/water system with the stoichiometric method. International Journal of
Hydrogen Energy 2006, 31, 21-28.
88. Benito, M.; Sanz, J. L.; Isabel, R.; Padilla, R.; Arjona, R.; Daza, L. Bio-ethanol
steam reforming: Insights on the mechanism for hydrogen production. Journal of
Power Sources 2005, 151, 11-17.
89. Rasko, J.; Hancz, A.; Erdohelji, A. Surface species and gas phase products in
steam reforming of ethanol on TiO2 and Rh/TiO2. Applied Catalysis A 2004, 269,
13-25.
90. Sexton, B. A.; Rendulic, K. D.; Hughes, A. Z. Decomposition pathways of C1C4
alcohols adsorbed on platinum (111). Surface Science 1982, 121, 181-198.
91. Davis, J. L.; Barteau, M. A. Decarbonylation and decomposition pathways of
alcohol's on Pd(111). Surface Science 1987, 187, 388-406.
92. Davis, J. L.; Barteau, M. A. The influence of oxygen on the selectivity of alcohol
conversion on the Pd(111) surface. Surface Science 1988, 197, 123-152.
93. Houtman, C. J.; Barteau, M. A. Divergent pathways of acetaldehyde and ethanol
decarbonylation on the Rh(111) surface. Journal of Catalysis 1991, 130, 528-546.
94. Xu, J.; Zhang, X.; Zerobi, R.; Yoshihobu, J.; Xu, Z.; Yates, J. T. Surface Science
1991, 256, 288.
95. Gates, S. M.; Russell, J. N.; Yates, J. T. Bond activation sequence observed in the
chemisorption and surface reaction of ethanol on Ni(111). Surface Science 1986,
171, 111-134.
96. Cong, Y.; van Spaendonk, V.; Masel, R. I. Low temperature C-C bond scission
during ethanol decomposition on Pt(331). Surface Science 1997, 385, 246-258.
97. Vaidya, P. D.; Rodrigues, A. E. Insight into steam reforming of ethanol to produce
hydrogen for fuel cells. Chemical Engineering Journal 2006, 117, 39-49.
98. Erdohelyi, A.; Rasko, J.; Kecskes, T.; Totha, M.; Domok, M.; Baan, K. Hydrogen
formation in ethanol reforming on supported noble metal catalysts. Catalysis
Today 2006, 116, 367-376.
99. Zhang, B.; Tang, X.; Li, Y.; Cai, W.; Xu, Y.; Shen, W. Steam reforming of bio-
ethanol for the production of hydrogen over ceria-supported Co, Ir and Ni
catalysts. Catalysis Communications 2006, 233, 367-372.
100. Kugai, J.; Subramani, V.; Song, C.; Engelhard, M. H.; Chin, Y. H. Effects of
nanocrystalline CeO2 supports on the properties and performance of Ni-Rh

Literature review
102 H2 production from steam ethanol reforming (ESR)
bimetallic catalyst for oxidative steam reforming of ethanol. Journal of Catalysis
2006, 238, 430–440.
101. Sheng, P. Y.; Yee, A.; Bowmaker, G. A.; Idriss, H. H2 production from ethanol
over Rh-Pt/CeO2 catalysts: The role of Rh for the efficient dissociation of the
carbon-carbon bond. Journal of Catalysis 2002, 208, 393–403.
102. Kugai, J.; Velu, S.; Song, C. Low-temperature reforming of ethanol over CeO2-
supported Ni-Rh bimetallic catalysts for hydrogen production. Catalysis Letters
2005, 101, 255-264.
103. Frusteri, F.; Freni, S.; Spadaro, L.; Chiodo, V.; Bonura, G.; Donato, S. H2
production for MC fuel cell by steam reforming of ethanol over MgO supported
Pd, Rh, Ni and Co catalysts. Catalysis Communications 2004, 5, 611–615.
104. Aupretre, F.; Descorme, C.; Duprez, D.; Casanave, D.; Uzio, D. Ethanol steam
reforming over MgxNi1-xAl 2O3 spinel oxide-supported Rh catalysts. Journal of
Catalysis 2005, 233, 464–477.
105. Frusteri, F.; Freni, S. Bio-ethanol, a suitable fuel to produce hydrogen for a
molten carbonate fuel cell. Journal of Power Sources 2007, 173, 200-209.
106. Fatsikostas, A. N.; Verykios, X. E. Reaction network of steam reforming of
ethanol over Ni-based catalysts. Journal of Catalysis 2004, 225, 439–452.
107. Morgenstern, D. A.; Fornango, J. P. Low-temperature reforming of ethanol over
copper-plated raney nickel: A new route to sustainable hydrogen for
transportation. Energy and Fuels 2005, 19, 1708-1716.
108. Luengo, C. A.; Ciampi, G.; Cencig, M. O.; Steckelberg, C.; Laborde, M. A. A novel
catalyst system for ethanol gasification. International Journal of Hydrogen Energy
1992, 17, 677-681.
109. Fierro, V.; Akdim, O.; Mirodatos, C. On-board hydrogen production in a hybrid
electric vehicle by bio-ethanol oxidative steam reforming over Ni and noble
metal based catalysts. Green Chemistry 2003, 5, 20-24.
110. Marino, F.; Boveri, M.; Baronetti, G.; Laborde, M. Hydrogen production from
steam reforming of bioethanol using Cu/Ni/K/γ-Al2O3 catalysts. Effect of Ni.
International Journal of Hydrogen Energy 2001, 26, 665-668.
111. Frusteri, F.; Freni, S.; Chiodo, V.; Spadaro, L.; Bonura, G.; Cavallaro, S. Potassium
improved stability of Ni/MgO in the steam reforming of ethanol for the
production of hydrogen for MCFC. Journal of Power Source 2004, 132, 139–144.
112. Marino, F.; Baronetti, G.; Jobbagy, M.; Laborde, M. Cu-Ni-K/γ-Al2O3 supported

Literature review
H2 production from steam ethanol reforming (ESR) 103
catalysts for ethanol steam reforming: Formation of hydrotalcite-type
compounds as a result of metal-support interaction. Applied Catalysis A 2002,
238, 41-54.
113. Amadeo, N.; Laborde, M. Low temperature water gas shift reaction: catalyst,
kinetics and reactor. Trends in Chemical Engineering 1996, 3, 159–183.
114. Velu, S.; Satoh, N.; Gopinath, C. S.; Suzuki, K. Oxidative reforming of bio-ethanol
over CuNiZnAl mixed oxide catalysts for hydrogen production. Catalysis Letters
2002, 82, 145-152.
115. Barroso, M.; Gomez, M.; Arrua, L.; Abello, M. Hydrogen production by ethanol
reforming over NiZnAl catalysts. Applied Catalysis A 2006, 304, 116-123.
116. Cavallaro, S.; Freni, S. Ethanol steam reforming in a molten carbonate fuel cell. A
preliminary kinetic investigation. International Journal of Hydrogen Energy 1996,
21, 465-469.
117. Nishiguchi, T.; Matsumoto, T.; Kanai, H.; Utani, K.; Matsumura, Y.; Shen, W.-J.;
Imamura, S. Catalytic steam reforming of ethanol to produce hydrogen and
acetone. Applied Catalysis A 2005, 279, 273-277.
118. Amphlett, J. C.; Leclerc, S.; Mann, R. F.; Peppley, B. A.; Roberge, P. R. Fuel Cell
Hydrogen Production By Catalytic Ethanol-Steam Reforming. Proc. of the 33rd
Intersociety Energy Conversion Engineering Conference, Colorado Springs, CO.,
USA, 1998.
119. Machado, N. R. C. F.; Rizzo, R. C. P.; Peguin, R. P. S. Performance of catalysts
with Nb2O5 for hydrogen production from ethanol steam reforming. Maringa
2002, 24, 1637-1642.
120. Haga, F.; Nakajima, T.; Yamashita, K.; Mishima, S. Effect of crystallite size on the
catalysis of alumina-supported cobalt catalyst for steam reforming of ethanol.
Reaction Kinetics and Catalysis Letters 1998, 63, 253-259.
121. Cavallaro, S.; Mondello, N.; Freni, S. Hydrogen produced from ethanol for
internal reforming molten carbonate fuel cell. Journal of Power Sources 2001, 102,
198-204.
122. Llorca, J.; Homs, N.; Sales, J.; de la Piscina, P. R. Efficient production of hydrogen
over supported cobalt catalysts from ethanol steam reforming. Journal of
Catalysis 2002, 209, 306-317.
123. Llorca, J.; de la Piscina, P. R.; Dalmon, J.-A.; Sales, J.; Homs, N. Co-free hydrogen
from steam-reforming of bioethanol over ZnO-supported cobalt catalysts: Effect
of the metallic precursor. Applied Catalysis B 2003, 43, 355-369.

Literature review
104 H2 production from steam ethanol reforming (ESR)
124. Llorca, J.; Homs, N.; Sales, J.; Fierro, J.-L. G.; de la Piscina, P. R. Effect of sodium
addition on the performance of Co-ZnO-based catalysts for hydrogen production
from bioethanol. Journal of Catalysis 2004, 222, 470-480.
125. Kaddouri, A.; Mazzocchia, C. A study of the influence of the synthesis conditions
upon the catalytic properties of Co/SiO2 or Co/Al2O3 catalysts used for ethanol
steam reforming. Catalysis Communications 2004, 5, 339-345.
126. Batista, M. C.; Santos, R. K. S.; Assaf, E. M.; Assaf, J. M.; Ticianelli, E. A. High
efficiency steam reforming of ethanol by cobalt-based catalysts. Journal of Power
Sources 2004, 134, 27-32.
127. Fierro, V.; Klouz, V.; Akdim, O.; Mirodatos, C. Oxidative reforming of biomass
derived ethanol for hydrogen production in fuel cell applications. Catalysis Today
2002, 75, 141–144.
128. Aupretre, F.; Descorme, C.; Duprez, D. The multiple roles for catalysis in the
production of H2. Catalysis Communications 2002, 3, 263-267.
129. Liguras, D. K.; Kondarides, D. J.; Verykios, X. E. Production of hydrogen for fuel
cells by steam reforming of ethanol over supported noble metal catalysts.
Applied Catalysis B 2003, 43, 345-354.
130. Freni, S.; Mondello, N.; Cavallaro, S.; Cacciola, G.; Parmon, V. N.; Sobyanin, V. A.
Hydrogen production by steam reforming of ethanol: A two step process.
Reaction Kinetics and Catalysis Letters 2000, 71, 143-152.
131. Deluga, G. A.; Salge, J. R.; Schmidt, L. D.; Verykios, X. E. Renewable Hydrogen
from Ethanol by Autothermal Reforming. Science 2004, 303, 993-997.
132. Velu, S.; Suzuki, K.; Vijayaraj, M.; Barman, S.; Gopinath, C. S. In situ XPS
investigations of Cu1-xNixZnAl-mixed metal oxide catalysts used in the oxidative
steam reforming of bio-ethanol. Applied Catalysis B 2005, 55, 287–299.
133. Navarro, R. M.; Alvarez-Galvan, M. C.; Cruz Sanchez-Sanchez, M.; Rosa, F.;
Fierro, J. L. G. Production of hydrogen by oxidative reforming of ethanol over Pt
catalysts supported on Al2O3 modified with Ce and La. Applied Catalysis B 2005,
55, 229–241.
134. Casanovas, A.; Llorca, J.; Homs, N.; Fierro, J. L.; de la Piscina, P. R. Ethanol
reforming processes over ZnO-supported palladium catalysts: Effect of alloy
formation. Journal of Molecular Catalysis A 2006, 250, 44-49.
135. Venkataraman, K. Short contact time catalytic wall reactors; Ph.D. Thesis;
University of Minnesota: U.S.A., 2003.

Literature review
H2 production from steam ethanol reforming (ESR) 105
136. Wanat, E. C.; Venkataraman, K.; Schmidt, L. D. Steam reforming and water-gas
shift of ethanol on Rh and Rh-Ce catalysts in a catalytic wall reactor. Applied
Catalysis A 2004, 276, 155-162.
137. Trifirò, F.; Vaccari, A. In Comprehensive Supramolecular Chemistry; Atwood, J. L.,
Davies, J. E. D., MacNicol, D. D., Vögtle, F., Eds.; Pergamon Press: Oxford, 1996
Chapter 8,; Vol. 7, p 251.
138. Takehira, K. Highly Dispersed and Stable Supported Metal Catalysts Prepared by
Solid Phase Crystallization Method. Catalysis Surveys from Japan 2002, 6, 19-32.
139. Basile, F.; Basini, L.; D’Amore, M.; Fornasari, G.; Guarinoni, A.; Matteuzzi, D.; Del
Piero, G.; Trifirò, F.; Vaccari, A. Ni/Mg/Al anionic clay derived catalysts for the
catalytic partial oxidation of methane: residence time dependence of the
reactivity features. Journal of Catalysis 1998, 173, 247-256.
140. Basile, F.; Fornasari, G.; Poluzzi, E.; Vaccari, A. Catalytic partial oxidation and
CO2-reforming on Rh- and Ni-based catalysts obtained from hydrotalcite-type
precursors.. Applyed Clay Science 1998, 13, 329-345.
141. Basile, F.; Fornasari, G.; Rosetti, V.; Trifirò, F.; Vaccari, A. Effect of the Mg/Al ratio
of the hydrotalcite-type precursor on the dispersion and activity of Rh and Ru
catalysts for the partial oxidation of methane. Catalysis Today 2004, 91-92, 293-
297.
142. Albertazzi, S.; Arpentinier, P.; Basile, F.; Fornasari, G.; Gary, D.; Vaccari, A.
WO03099436 , 2003.
143. Arpentinier, P.; Basile, F.; Del Gallo, P.; Fornasari, G.; Gary, D.; Rosetti, V.;
Vaccari, A. Role of the hydrotalcite-type precursor on the properties of CPO
catalysts. Catalysis Today 2005, 99, 99.

Literature review
106 H2 production from steam ethanol reforming (ESR)

Experimental
H2 production from steam ethanol reforming (ESR) 107
33 EExxppeerriimmeennttaall
33..11 CCaattaallyyssttss pprreeppaarraattiioonn
Catalysts tests were carried out on different type of catalysts. First step was tested
bulk catalysts obtained from hydrotalcite type precursors with several amounts of
active metal. Then catalytic activity of bulk catalysts prepared in the laboratory of
Industrial Chemistry of Bologna were compared with a catalyst prepared by CTTC of
Limoges with same active metal but different matrix based on CeZrO2. Best bulk
catalyst formulation was chosen to coat on alumina foam prepared by CTTC of
Limoges.
33..11..11 CCaattaallyyssttss ffrroomm hhyyddrroottaallcciittee ttyyppee pprreeccuurrssoorrss
The hydrotalcite type precursors (HT) of general formula
[M2+(1-x)M
3+x(OH)2] (An-
x/n).mH2O
with M2+ = Ni2+ and Mg2+
M3+ = Rh3+, Al3+ and Fe3+
An- = SinO2n+12- (silicate) or CO3
2- (carbonate)
were synthesized in the laboratory using the following coprecipitation method:
1) Preparation of aqueous solution (1.5 M) of the nitrate of the metals:
» Mg(NO3)2 · 6H2O (99 %)
» Al(NO3)3 · 9H2O (98 %)
» Ni(NO3)2 · 6H2O (99 %)
» Rh(NO3)3 (10 % solution)
» Fe(NO3)3 · 9H2O (98 %)
2) Preparation of aqueous silicate or carbonate solution (in excess with respect to the
amount required by the stoichiometry)
» SiO2·NaOH 27%
» Na2CO3
3) The cation solution is dropped, under magnetic stirring, into the solution of
silicates, at constant temperature (50-60°C). The pH was maintained constant (10.5 ±

Experimental
108 H2 production from steam ethanol reforming (ESR)
0.1) by adding NaOH (3 M). Once the dropping was finished, the obtained dispersion
was maintained under magnetic stirring for 45 minutes (at 50-60°C and pH = 10.5).
4) The precipitate has been then separated from the mother liquor by filtration under
vacuum, washed with abundant hot water (60°C) and dried overnight at 70°C.
5) The dried precursor samples were grinded to obtain powder. The catalysts (ex-HT)
were obtained from the precursors by calcination at 900°C for 12 h (heating rate
10°C/min).
33..11..22 CCaattaallyysstt ffrroomm CCeeZZrrOO22 mmaattrriixx
The CeZrO2 catalyst was prepared by coprecipitation of nitrates of Rh, Ce and Zr. To
obtain the precipitation of all hydroxide species the pH was kept over 6.5 at 20°C by
adding drop by drop ammonia. During coprecipitation the slurry was stirring. Then the
precipitate was centrifugated and dryed at 70°C. After that the powder was calcined
at 700°C for three hours.
33..11..33 FFooaamm ccaattaallyyssttss
Alumina foams were processed by impregnation of polymeric sponge-like templates.
Slurries of highly pure α-Al2O3 modified and stabilized with organic additives, were
used to impregnate polyurethane foams. 10, 20 and 30 ppi (pore per inch) foams were
employed. Foams were totally impregnated with the slurry, and the slurry excess was
then removed to leave the porosity open. Impregnated foams were dried, and the
organics (PU foams, additives) were then pyrolysed at low heating rate. Finally the
remaining ceramic was sintered at high temperature (1).
Before to prepare slurries to coat the ceramic foams the calcined hydrotalcite was
milled by attrition with zirconia balls for 4 hours with the addition of dispersing agent
to obtain the average diameter of the grains close to 1 μm. After that the solvent and
dispersing agent were evaporated.
Catalysts slurries were prepared using a planetary ball-milling equipment. Catalysts
powder were dispersed in MEK-CH3CH2OH with adequate binders and dispersing
agents. A dip-coating process was used to coat the catalyst onto the surface of
alumina foams: foams were dipped once in the slurry, without controlling the
atmosphere. The catalyst coating thickness was controlled by the catalyst powder
loading in the slurry.

Experimental
H2 production from steam ethanol reforming (ESR) 109
33..22 CCaattaallyyssttss cchhaarraacctteerriizzaattiioonn
33..22..11 XX--RRaayy ddiiffffrraaccttiioonn ((XXRRDD)) aannaallyyssiiss
The XRD powder analyses were carried out using a Philips PW1050/81 diffractometer
equipped with a graphite monochromator in the diffracted beam and controlled by a
PW1710 unit (Cu Kα, λ = 0.15418 nm). A °2θ range from 5° to 80° was investigated at a
scanning speed of 70°/h.
Fig. 3.1 Scheme of the instrument for the X-ray diffraction analysis (2).
The analysis of the phases present in the patterns were analyzed using the Bragg’s
Law:
in order to calculate the d values to compare with those reported in the literature
[Powder Diffraction Files - Inorganic Phase, ICDD (International Centre for Diffraction
Data)]. In addition, the particle sizes are calculated using the Sherrer’s Law:

Experimental
110 H2 production from steam ethanol reforming (ESR)
33..22..22 SSuurrffaaccee aarreeaa aanndd ppoorroossiimmeettrryy aannaallyyssiiss
Specific surface area and porosimetry
analysis were carried out in a Micromeritics
ASAP 2020 instrument (Accelerated Surface
Area and Porosimetry System). This
instrument measures the adsorption and
desorption isothermal curve (at 77 K) by the
volume of adsorbed/desorbed N2, as a
function of relative pressure (via-multi-point
method).
BET analyses were performed for the
precursors of catalysts and for calcined
catalysts. The precursors were previously
degassed under a vacuum at 120 °C until a
pressure of 30 mmHg was reached and
maintained for 30 min. Calcined solids were
heated up to 150 °C until a pressure of 30
mmHg was reached, then kept 30 min at this temperature and finally heated up to 250
°C and maintained for 30 min.
Each analysis required about 0.3-0.5 g of catalyst sample.
33..22..33 TTeemmppeerraattuurree pprrooggrraammmmeedd rreedduuccttiioonn ((TTPPRR)) aanndd
ooxxiiddaattiioonn ((TTPPOO)) aannaallyyssiiss
The reduction and oxidation profiles have been measured using a ThermoQuest
Instrument TPD/R/O 1100 Catalytic Surface Analyzer. The analyses were carried out
loading 0.1 g of sample, using the following procedure:
- Pre-treatment : the sample was pre-treated under N2 (20 ml/min) from room
temperature to 150°C (temperature rate of 20°C/min) and hold for 30 minutes at
150°C.
- Reduction : after cooling until 100°C, the reduction analysis was carried out with 5 %
of H2 in Ar (20 ml/min) from 60 to 950°C (temperature rate of 10°C/min) and hold for
30 minutes at 950°C.
- Oxidation : after cooling until 60°C, the oxidation analysis was carried out with 5 %
of O2 in He (20 ml/min) from 60 to 950°C (temperature rate of 10°C/min) and hold for
30 minutes at 950°C.
The oxidation step was carried out after the reduction on fresh samples to evaluate
the reoxidation of the active metals, or after the pretreatment (coupled with
Fig. 3.2 Scheme of the instrument for the porosimetry analysis (2).

Experimental
H2 production from steam ethanol reforming (ESR) 111
quadrupole mass analyzer) on the used samples to evaluate possible carbon deposits
on the surface of the catalyst.
33..22..44 SSccaannnniinngg aanndd TTrraannssmmiissssiioonn EElleeccttrroonn MMiiccrroossccooppyy
aannaallyyssiiss
A high-resolution scanning electron microscope equipped with a Field-Emission Gun
FEG-SEM (JEOL-6700F), equipped with an EDS detector (PGT Spirit, Si(Li) diode
detector), was used to observe the microstructure of the surface and of the bulk of
alumina foam after coating. Samples were prepared by attaching the foam struts to
brass sample carriers with a silver paste.
Transmission Electron Microscopy (TEM, JEOL 2010), combined with Energy
Dispersive X-ray Spectrometry (EDS) was used to study rhodium particle size before
and after reaction. Before measurement every sample was reduced under H2.
Two different temperature of reduction were chosen to compare the effect of
reduction temperature on particle size and density. First temperature was 750 °C for
two hours while the second one was 1000 °C for four hours, for both temperature the
amount of H2 was 3 % in Argon and the flow of mixture was 30 ml/min.
33..22..55 IInnffrraarreedd ((IIRR)) ssppeeccttrroossccooppyy aannaallyyssiiss
For the IR spectroscopy characterization the powder was pressed in a thin self-
supported pellet, placed inside a gold hand-made envelope and located in the IR cell
(Fig. 3.3).
Fig. 3.3 Home made cells for IR measurements.
Before of each measurement the sample was reduced and then a further pre-
treatment was carried out. The pre-treatment of the reduced sample in the IR cell was
been as follows: heating up to 750 °C, reduction at 750 °C in H2 for 1 hour, outgassing

Experimental
112 H2 production from steam ethanol reforming (ESR)
at 650 °C for 2 hours, cooling down in inert atmosphere (Ar). The reduction treatment
was necessary to observe Rh0 species. The outgassing step at 650 °C for 2 hours was
necessary to avoid the chemisorption of CO.
After reduction treatment the sample was cooled down and IR spectra were collected
on a Bruker IFS 55 Equinox instrument equipped with an MCT cryodetector working
with 2 cm−1 resolution. The dosing of gas/vapours was carried out by connecting the IR
cell to a vacuum ramp, equipped with one Pirani vacuum gauge and one manometer.
During adsorption measurement, a set of spectra is recorded, where each spectrum
refers to a specific gas equilibrium pressure. In order to carry on a comparative semi-
quantitative characterization, the spectra are normalized with respect to the sample
amount, so that intensities of bands observed for different samples may be used to
evaluate the concentration of adsorbed species (and the concentration of adsorbing
sites).
33..22..66 OOtthheerr aannaallyyssiiss
The particle size distributions were determined using a laser diffraction granulometer
(Malvern Mastersizer 2000). The measurement was carried on a slurry of the powder
in water or in organic MEK/CH3CH2OH solution.
The powders density was measured by an Helium pycnometer (Micromeritics AccuPyc
1330).

Experimental
H2 production from steam ethanol reforming (ESR) 113
33..33 LLaabboorraattoorryy ppllaanntt
In order to study the bio-ethanol steam reforming reaction, a laboratory plant with a
fixed bed reactor was built (Fig. 3.4).
The plant can be divided in four zone: (1) ethanol and water feeds mixing and
preheating, (2) microreactor, (3) system of liquid condensation, and (4) system of
analysis.
The mix liquid of ethanol and water is fed by a HPLC pump and pre-heated at 200°C
before enter in the reactor. During diluted conditions, helium and the vapours of
ethanol and water are mixed before the head of reactor. During last test it was used
surfin ethanol which is bio-ethanol after a purification treatment.
Due to the hard reaction conditions, such as high temperature (600-800°C), pressure
(until 20 bar) and reducing atmosphere, the constituting material of the reactor
undergoes to severe restrictions. To avoid the break of the reactor in these conditions,
it was built in a special alloy material (Incoloy 800HT) constituted by chromium (20-
25%), nickel (30-35 %) and iron (40-45 %).
Inside the reactor (Fig. 3.5), along the axial direction a thermocouple shell is inserted,
in this fixed shell it is possible to move the cromel-alumel thermocouple (0.8 mm of
diameter) in the axial direction in order to measure the axial thermal profile during
reaction. The reactor is placed inside an electric oven.
The gas, going out from the reactor, is kept at 200°C until it is split in two flows: one is
kept at 200°C to analyze online all possible condensable products while the other
passes through a condenser that separates the condensable products from permanent
gas and through a trap containing a dehydrator agent (Drierite, CaSO4, 8 mesh,
containing an indicator) in order to remove any residual traces of water or ethanol.
Previously of the split of flows, a back pressure regulator is placed to maintain the
feed zone and the microreactor under the operative pressure conditions, while after
this control device the pressure is atmospheric, that is useful for the analysis.
All the products are then analyzed online using two gas-chromatograph equipments.
The first gas-chromatograph is a Perkin Elmer Instrument Clarus series equipped with
two TCD detectors and it is used both to separate O2, N2, CO, CH4 and CO2, using a
Carbosieve packed column and CO2, H2O, CH3CHO, CH3CH2OH, CH3COCH3 and
CH3COOH, using a HaySept P packed column [Isotherm at 120°C for 3 min, ramp
10°C/min until 200°C, cooling; carrier gas: He 20 ml/min].
The second gas-chromatograph is a Perkin Elmer Instrument Autosystem series, for
the hydrogen analysis using a similar Carbosieve packed column. The analysis was
carried out at 45°C using as carrier gas N2, (20 ml/min).

Experimental
114 H2 production from steam ethanol reforming (ESR)
Fig. 3.4 Laboratory plant for bio-ethanol steam reforming

Experimental
H2 production from steam ethanol reforming (ESR) 115
Fig. 3.5 Scheme of filling of reactor.
Before the catalytic reaction, the catalysts were activated by reduction in situ under
H2 flow at reduction temperature (800 °C) for 2 h. At the end of tests, the
water/ethanol flow was stopped and the catalyst was cooled under helium stream.
The catalytic tests were carried out in different reaction conditions. Here after it is
shown only a summary of values for every parameter because each table of conditions
will be show with results.
-P = atmospheric and 20 bar
-Toven = 300°C, 450°C, 600°C and 750°C
-S/ CH3CH2OH = H2O / CH3CH2OH = 5 ml/mol
-fD = He / (H2O / CH3CH2OH) = 9, 4, 1, 0
-Dp = 1.410 - 0.841 mm (granulometry of 14-20 mesh) and 0.590-0.420 mm
(granulometry of 30-40 mesh)
-Vcat = 1, 2, 4 and 6 ml.
Contact time is calculated respect real condition of temperature and pressure and it is
related to the volume of the catalyst. In order to compare contact time of foams with
pellets, it is considered contact time related to the weight of catalyst.
Ethanol and water conversion and products selectivities were calculated using the
following calculations:
quartz wool
quartz wool
flakes of quartz
mesh of catalyst
thermocouple
3
cm
flakes of quartz
16 c
m
Tout

Experimental
116 H2 production from steam ethanol reforming (ESR)

Experimental
H2 production from steam ethanol reforming (ESR) 117

Experimental
118 H2 production from steam ethanol reforming (ESR)

Experimental
H2 production from steam ethanol reforming (ESR) 119
33..44 PPrreelliimmiinnaarryy//BBllaannkk tteessttss
Before catalytic tests, the laboratory plant was subjected to preliminary activity tests
filling the reactor with three different “inert” materials, to chose what material show
less activity and it can be chose as inert filling. These blank tests were carried out at
different temperatures (250, 400, 550 and 700°C) and S/CH3CH2OH ratio (5 and 4
mol/mol).
At low temperature all materials show CH3CH2OH conversion less than 5 % but
increasing temperature alumina shows higher conversion and therefore worse results.
Quartz is the best choice as inert because, in particular at high temperatures, ethanol
conversion of quartz is lower than ethanol conversion of corundum and alumina (Fig.
3.6).
Fig. 3.6 CH3CH2OH conversion of three different filling.
An isothermal zone of 10 cm, was found at 20 cm from the oven entry (Fig. 3.7). The
catalytic bed was located in the isothermal zone.
0
20
40
60
80
100
250 400 550 700
%
T (°C)
CH3CH2OH Conversion
Quartz S/EtOH = 5 Corundum S/EtOH = 4 Alumina S/EtOH = 5

Experimental
120 H2 production from steam ethanol reforming (ESR)
Fig. 3.7 Thermal profile of the reactor inside(OVEN) and outside(HEAD) the oven.
0
100
200
300
400
500
600
700
800
900
1000
0 1 2 3 4 5 6 7 8 9 10 11 12 13 14 15 16 17 18 19 20 21 22 23 24 25 26 27 28 29 30 31 32 33 34 35 36 37 38 39 40 41 42 43 44 45 46 47 48 49 50
T (°C
)
Z (cm)
Thermal profile
250 300 350 400 450 500 550 600 650 700 750 800 850 900
flow
HEADOVEN

Experimental
H2 production from steam ethanol reforming (ESR) 121
BIBLIOGRAFY
1
.
Faure, R.; Basile, F.; Bersani, I.; Chartier, T.; Cuni, A.; Cornillac, M.; Del Gallo, P.;
Gary, D.; Rossignol, F.; Vaccari, A. Elaboration of ceramic foam-supported catalysts
for Ethanol Steam Reforming. International Workshop on Advanced Ceramics,
Limoges, 2008.
2
.
Geology-XRD Lab. http://www.utc.edu/Faculty/Jonathan-Mies/xrd/xrd.html
(accessed Feb 2, 2011).
3
.
Micromeritics - ASAP 2020, Surface Area & Porosimetry System.
http://www.globalspec.com/FeaturedProducts/Detail/Micromeritics/ASAP_2020_Su
rface_Area_Porosimetry_System/16063/0 (accessed Feb 10, 2011).

Experimental
122 H2 production from steam ethanol reforming (ESR)

Results and discussion
H2 production from steam ethanol reforming (ESR) 123
44 RReessuullttss aanndd ddiissccuussssiioonn
44..11 AAiimm ooff wwoorrkk
Aim of this work is the study of new process for hydrogen production using bioethanol
instead of methane in the steam reforming reaction.
Thermodynamic data indicate high temperature, over 700°C, and atmospheric
pressure as conditions to maximize hydrogen production with no methane presence.
On the other hand the feasibility of the process is influenced also from industrial
conditions that require pressure of 20 bar to operate in optimal economical conditions
and integration with the downstream processes. This compromise entails a deep
study on reaction conditions and on catalysts which have to show very high activity
and selectivity towards hydrogen at atmospheric pressure and very high stability
during tests at 20 bar for long time (one week).
The study on catalysts is focus on mixed oxide obtained after calcination of
hydrotalcites like compounds. This type of materials presents both redox and acid-
basic properties which could play a determinant role in the selectivities of products.
Moreover they show high surface area and very small crystal size of the mixed oxide
structure produced after calcination, after reduction it is possible to obtain small and
thermally stable metal crystallites.
Another important part of work, always about catalysts, is focus on the optimization
of coating of selected active phase between hydrotalcite on alumina foams. It was
decided to study foam coating because they show advantages respect pellets as less
pressure drops and higher geometrical area.
First part of study is dedicated to ethanol decomposition study to understand the
relevance of gas phase reactions and the effect of reactor wall versus quartz as reactor
material and the use of quartz as inert used to fill the reactor.
Afterward different tests were carried out with a reference catalyst which had shown
very good performances in methane steam reforming (1), always obtained from an
hydrotalcite, to study the effect of various parameters as temperature, steam to
ethanol ratio and contact time and choose conditions for catalysts discriminations.
Comparisons of different active phases are studied by decreasing contact times to
study deeply reaction mechanism, intermediates and by-products. These tests were
carried out only at temperature above 500 °C to maximize hydrogen selectivity and
therefore some elements which show interesting results in literature as cobalt
(2)(3)(4)(5)(6) are not taken in exam.

Results and discussion
124 H2 production from steam ethanol reforming (ESR)
Since in the ethanol steam reforming high relevance on selectivities is due to acid-
basic properties of the catalyst (7), also the effects of different type of matrix are
studied. Catalysts which exhibited best performances were selected to prepare the
slurry to coat on ceramic foams trying to obtain homogeneous and thin coating
without cracks.
Last part of the work is dedicated to select under pressure conditions that can
enhance lifetime of catalysts by minimize coke formation. Tests were carried out both
with pure and surfin ethanol. Activity, selectivity and stability of pellets and foams
catalysts were compared.

Results and discussion
H2 production from steam ethanol reforming (ESR) 125
44..22 TThheerrmmaall ddeeccoommppoossiittiioonn ooff eetthhaannooll
Thermal decomposition of ethanol can occurs in different zone of reactor:
1. empty space,
2. wall INCOLOY 800HT reactor,
3. “inert” material as quartz.
Each of these contributions was evaluated by means of specific tests and calculations.
44..22..11 RReeaaccttiivviittyy wwiitthh IINNCCOOLLOOYY 880000HHTT rreeaaccttoorr
Since from previous tests (experimental part) ethanol conversion results very low at
temperature lower than 500 °C, for the study on ethanol decomposition only tests at
high temperature were considered.
In particular two type of tests were carried out: tests with empty reactor and one test
with reactor filled of quartz. It is chosen quartz because it is the inert which shows the
lowest conversion of ethanol at high temperature and therefore the lowest
contribution to ethanol decomposition.
INCOLOY REACTOR
Filling Empty Empty Quartz
P (bar) 1 1 1
S/EtOH (mol/mol) 4 4 5
f D (mol/mol) 9 9 4,7
V empty (mL) 60 60 20
Toven (°C) 750 750 750
Tout (°C) 688 691 702
Conv. CH3CH2OH (%) 89,99 73,61 29,64
Conv. H2O (%) -0,05 -1,20 -0,78
Sel H2 (%) 45,39 42,84 47,70
Sel. CO (%) 21,24 19,38 0,00
Sel. CO2 (%) 1,32 0,69 1,25
Sel. CH4 (%) 8,80 8,41 0,00
Sel. CH2CH2 (%) 14,88 15,91 19,46
Sel. CH3CH3 (%) 1,98 2,82 0,00
Sel. CH3CHO (%) 51,81 52,80 79,30
Tab. 4.1 Reactivity of ethanol.
These data show that decreasing empty space in the reactor, a diminution of ethanol
conversion is observed with a CH3CHO/CH2CH2 ratio equal to 4. The contribution of

Results and discussion
126 H2 production from steam ethanol reforming (ESR)
gas phase is determinant, therefore as first approach it is possible to describe the
process considering a gas phase reaction which depending on concentration. The rate
law equations for a plug flow reactor in steady state are of first order is:
kmix = - ( 1+EtOHEtOH) ln ( 1-EtOH) - EtOHEtOH I order
In this way it is hypothesized that the most important contribution is due to empty
space. In fact the mix depends on only empty volume of the reactor, in the formula of
calculation of mix is not considered the volume of quartz. In addition also the costant
K for order zero is considered as a further confirmation that reaction occurs mainly in
gas phase.
To compare the contribution of empty space in the tests it is measured the fraction of
void when the reactor is filled of inert material. The total volume of the reactor is 60
mL, while the volume of quartz is 40 mL, therefore it is considered 20 mL empty space
with quartz tests. The volume of quartz in the reactor was measured in a cylinder. A
little amount of water was added in the cylinder, then the quartz loaded in the reactor
was put in the cylinder and the increase of volume of water was noted. The difference
of water volume is considered as the volume of the quartz.
Then it is calculated the contact time of mix and it is replaced mix, CEtOH0 and EtOH
with the right values inside the equation to calculate the costant K and to evaluate
which order describe better the system (K more similar).
Filling Empty Empty Quartz
Empty volume (mL) 60 60 20
EtOH std (mL/min) 7,2 14,4 19,1
H2O std (mL/min) 28,8 57,6 95,7
He std (mL/min) 324,0 648,0 539,7
EtOH r (mL/min) 15,5 25,9 42,3
H2O r (mL/min) 61,9 103,5 211,5
He r (mL/min) 696,6 1164,6 1193,1
EtOH 0,90 0,74 0,30
mix (s) 4,651 2,782 0,829
xEtOH 0,02 0,02 0,03
CEtOH0 0,000376 0,000451 0,000550
Tab. 4.2 Calculations of mix.
With:
EtOH std : stream of ethanol in standard conditions
H2O std : stream of water in standard conditions

Results and discussion
H2 production from steam ethanol reforming (ESR) 127
He std : stream of helium in standard conditions
EtOH r : stream of ethanol in reaction conditions
H2O r : stream of water in reaction conditions
He r : stream of helium in reaction conditions
mix = Vempty reactor / (EtOH r + H2O r + He r), calculated in reaction condition
xEtOH : molar fraction of ethanol
CEtOH0 = Pr * xEtOH / (R * Tr)
Pr : pressure of the reaction
Tr : temperature of the reaction
Empty
(4.65 s)
Empty
(2.78 s)
Quartz
(0.829 s)
k = ( - ( 1+EtOHEtOH) ln ( 1-EtOH) - EtOHEtOH) / mix I order 0,5086 0,4918 0,4378
Tab. 4.3 Calculations of K constant for different reaction order.
The K costant for the first order reaction is very similar for each tests, while is different
for the reaction order zero. Therefore the rate equation which describe better the
system is a reaction order one because the same equation, that of order one, solves
three different conditions with different data. Also Morgenstern et al.(8), Akande et
al. (9) and Vaidya et al. (10) found this order of reaction while Mas et al. found a
reaction order 0.75-0.8 (11).
These data allow to know the ethanol decomposition and conversion at different
contact time. In addition, the previous assumption that the contribution of quartz is
unimportant is confirmed. In fact in the formula of the rate equation it makes equal
the kmix as a f ( EtOH ) . If this equation is verified for the three different conditions
then all ethanol converted is due to fraction of void because in mix only empty space is
considered.
44..22..22 RReeaaccttiivviittyy wwiitthh qquuaarrttzz rreeaaccttoorr
To study the contribution of the reactor some tests were carried out using a quartz
reactor filling of quartz. When ethanol conversion is around 70 - 80% CH3CHO is close
to 50 % and in lower amounts than CH3CHO also CO and CH4 are observed due to
CH3CHO decomposition By decreasing contact time CO and CH4 decreases whereas
CH3CHO and CH2CH2 increases showing the typical trends of intermediates. As
observed previously when the amount of CO and CH4 is low the ratio between

Results and discussion
128 H2 production from steam ethanol reforming (ESR)
CH3CHO and CH2CH2 is close to 4. Therefore, considering a similar conversion, quartz
reactor shows similar intermediates selectivities to incoloy reactor.
QUARTZ REACTOR
Filling Quartz Quartz
mix (s) 2.46 0.513
P (bar) 1 1
S/CH3CH2OH (mol/mol) 5 5
f D (mol/mol) 4 4
V empty (mL) 20 20
Toven (°C) 750 750
Toven (°C) 695 695
Conv. CH3CH2OH (%) 74.46 20.66
Conv. H2O (%) -3.59 -0.92
Sel H2 (%) 26.66 23.85
Sel. CO (%) 13.01 3.68
Sel. CO2 (%) 0.26 0.00
Sel. CH4 (%) 10.85 3.02
Sel. CH2CH2 (%) 18.48 17.00
Sel. CH3CH3 (%) 1.19 0.49
Sel. CH3CHO (%) 56.22 75.81
Tab. 4.4 Reactivity of ethanol.
Fig. 4.1 Comparison of ethanol conversion versus residence time for two type of reactors and same filling.
0
10
20
30
40
50
60
70
80
90
100
0 0.5 1 1.5 2 2.5 3
EtO
H C
on
vers
ion
(%
)
Residence time (s)
incoloy_quartz
quartz_quartz

Results and discussion
H2 production from steam ethanol reforming (ESR) 129
Also data with reactor in quartz show a k constant very similar to previous one
calculated for incoloy tests. Therefore it seems that the decomposition occurs mainly
in the gas phase and it is not affected by reactor wall or quartz filling.
k = ( - ( 1+EtOHEtOH) ln ( 1-EtOH) - EtOHEtOH) / mix I order
INCOLOY REACTOR QUARTZ REACTOR
Empty
(4.65 s)
Empty
(2.78 s)
Quartz
(0.829 s)
Quartz
(2.46 s)
Quartz
(0.513 s)
I order 0.5086 0.4918 0.4378 0.5487 0.5598
Tab. 4.5 Calculations of K constant for different reaction order and different conditions.

Results and discussion
130 H2 production from steam ethanol reforming (ESR)
44..33 CChhooiiccee ooff ffoorrmmuullaattiioonn
44..33..11 RRhh--NNii ccaattaallyysstt:: ssttuuddyy ooff ooppeerraattiivvee ppaarraammeetteerrss
44..33..11..11 CChhaarraacctteerriizzaattiioonn ooff ffrreesshh ssaammppllee
First tests, with the aim to study the operative conditions, were carried out on a
calcined hydrotalcite based on rhodium and nickel (atomic ratio: Rh0.15Ni8Mg60Al31.85)
which had shown very good performances in methane steam reforming (1).
Calcined hydrotalcite with silicate as interlayer anions shows mainly the reflections of
the forsterite type phase (Mg2SiO4) and the MgO type phase, beside those phases a
defective spinel type phase (such as MgAl2O4) is also present (Fig. 4.2). Literature
indicates that Rh is soluted in the MgAl2O4 and MgO while Ni is preferentially present
in the MgO type phase (12) (13).
For what concern the textural properties of the catalyst obtained from hydrotalcite
precursor, the catalyst maintains high surface area (96.5 m2/g) also after calcination at
900°C for 12 h. The sample presents good pore volume and a monomodal distribution
of the pore width around 150 Å.
Fig. 4.2 XRD of fresh RNMA.
Inte
nsity (a.u
.)

Results and discussion
H2 production from steam ethanol reforming (ESR) 131
Fig. 4.3 BJH pore size distribution of fresh RNMA.
The fresh sample was analysed by TPR to study the reduction properties and evaluate
the suitable temperature for the in situ activation before the catalytic tests (Fig. 4.4).
The nickel is reduced in one single step at 830°C, the high temperature is clear
indication of the presence of Ni in a solid solution, while the presence of free NiO and
supported Ni can be excluded. The solid solution, as previously described, is mainly
constituted by (Mg/Ni)O with probably a minor contribution of Ni in the spinel phase
(12). Most likely the low rhodium content (0.26 wt %) cannot be detected or may be
overlapped by the main peak.
0
0.001
0.002
0.003
10 100 1000 10000
Po
re V
olu
me
(c
m³/
g·Å
)
Pore diameter (Å)

Results and discussion
132 H2 production from steam ethanol reforming (ESR)
Fig. 4.4 TPR of fresh RNMA.
44..33..11..22 AAccttiivviittyy
The tests were carried out changing the following reaction parameters:
P = 1 bar;
Toven = 300, 450, 600 and 750 °C;
S/CH3CH2OH = 5 and 4 mol/mol;
fD = He/(H2O+CH3CH2OH) = 9 mol/mol;
CT (calculated in standard conditions) = 1 and 0.5 s;
V = 6 mL;
Pellets size = 14-20 mesh.
As general trend it can be stated that the real temperature inside the reactor is about
50 °C less than that of the oven and it changes with residence time and therefore this
temperature is chosen as reference during description and discussion of results while,
Tout is specified and discussed to identify the specific temperature of the catalytic
tests because of it can change with residence time and conditions. Tests were carried
out starting from 250 °C and increasing temperature, for each temperature, except
250 °C, two contact times were tested and the same S/CH3CH2OH ratio was
maintained equal to 5. After that the catalyst was unloaded and a fresh sample was
loaded again to repeat tests with S/CH3CH2OH ratio equal to 4.
The evolution of the ethanol and water conversions and products selectivities is
presented in Fig. 4.5 as a function of temperature.
The high amount of catalyst influences positively ethanol conversion which is
complete also at 250 °C and water to ethanol 5 while water conversion is very low. The
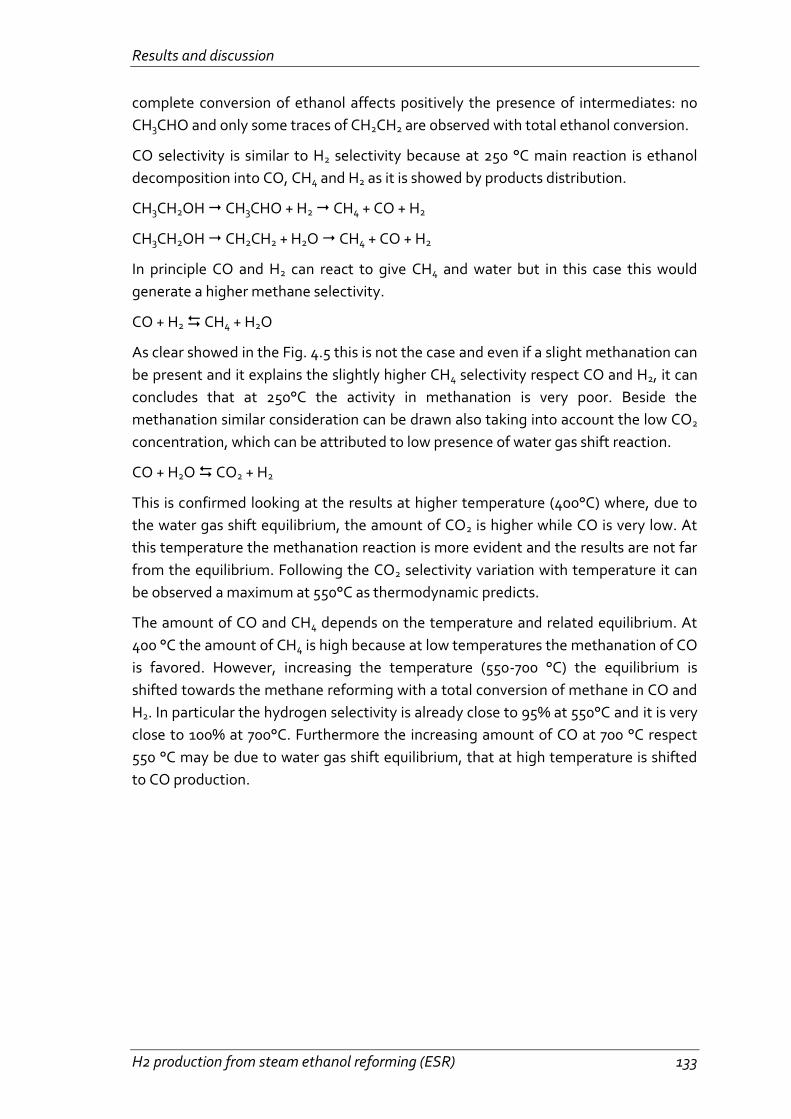
Results and discussion
H2 production from steam ethanol reforming (ESR) 133
complete conversion of ethanol affects positively the presence of intermediates: no
CH3CHO and only some traces of CH2CH2 are observed with total ethanol conversion.
CO selectivity is similar to H2 selectivity because at 250 °C main reaction is ethanol
decomposition into CO, CH4 and H2 as it is showed by products distribution.
CH3CH2OH CH3CHO + H2 CH4 + CO + H2
CH3CH2OH CH2CH2 + H2O CH4 + CO + H2
In principle CO and H2 can react to give CH4 and water but in this case this would
generate a higher methane selectivity.
CO + H2 CH4 + H2O
As clear showed in the Fig. 4.5 this is not the case and even if a slight methanation can
be present and it explains the slightly higher CH4 selectivity respect CO and H2, it can
concludes that at 250°C the activity in methanation is very poor. Beside the
methanation similar consideration can be drawn also taking into account the low CO2
concentration, which can be attributed to low presence of water gas shift reaction.
CO + H2O CO2 + H2
This is confirmed looking at the results at higher temperature (400°C) where, due to
the water gas shift equilibrium, the amount of CO2 is higher while CO is very low. At
this temperature the methanation reaction is more evident and the results are not far
from the equilibrium. Following the CO2 selectivity variation with temperature it can
be observed a maximum at 550°C as thermodynamic predicts.
The amount of CO and CH4 depends on the temperature and related equilibrium. At
400 °C the amount of CH4 is high because at low temperatures the methanation of CO
is favored. However, increasing the temperature (550-700 °C) the equilibrium is
shifted towards the methane reforming with a total conversion of methane in CO and
H2. In particular the hydrogen selectivity is already close to 95% at 550°C and it is very
close to 100% at 700°C. Furthermore the increasing amount of CO at 700 °C respect
550 °C may be due to water gas shift equilibrium, that at high temperature is shifted
to CO production.

Results and discussion
134 H2 production from steam ethanol reforming (ESR)
Fig. 4.5 Effect of T at CT = 1 s and S/CH3CH2OH = 5 mol/mol.
Fig. 4.6 Effect of T at CT = 1 s and S/CH3CH2OH = 4 mol/mol.
The effect of contact time and water to ethanol ratio are showed in Fig. 4.7 and Fig.
4.8.
The halving of contact time (0.5 s respect to 1 s) doesn’t influence products
distribution which presents very similar results, therefore it is possible to confirm and
conclude that even at 400 °C the system is close to thermodynamic equilibrium.
0
10
20
30
40
50
60
70
80
90
100
200 300 400 500 600 700 800
Se
l. (
%)
T (°C)
C C2H5OH S H2
S CO2
S CO
C H2O
S CH4
0
10
20
30
40
50
60
70
80
90
100
200 300 400 500 600 700 800
Se
l. (
%)
T (°C)
C C2H5OH
S H2
S CO2
S CO
C H2O
S CH4

Results and discussion
H2 production from steam ethanol reforming (ESR) 135
The comparison of the tests at different water/ethanol ratio is affected by the
equilibrium trends with an increase of hydrogen production by increasing of water to
ethanol ratio, while the CO and CH4 selectivities decrease. Results confirm these
trends: at 400 and 550°C higher H2 selectivity is obtained with water to ethanol equal
to 5 with respect to the tests at a ratio H2O/CH3CH2OH of 4. At high ratio, water gas
shift reaction and reforming are more favourite while methanation is less favourite
and therefore its contribution is lower than with water to ethanol equal to 4. At 700 °C
no differences are observed in H2 selectivity because it was calculated not considering
hydrogen linked in water as by-product, although considering the dry gas composition
it is evident that higher H2 amount is obtained with water to ethanol 5 (Tab. 4.6). A
further confirmation of this is the higher CO2 selectivity by increasing the ratio.
CT (s) 0.50 0.50 0.50 0.50 0.50 0.50
S/CH3CH2OH (mol/mol) 5 5 5 4 4 4
Toven (°C) 450 600 750 450 600 750
H2 (%) 60.85 73.71 73.63 56.88 72.24 72.10
CO (%) 0.82 7.39 13.71 1.03 9.61 17.76
CO2 (%) 19.43 17.22 12.66 17.55 14.05 10.14
CH4 (%) 18.90 1.68 0.00 24.55 4.10 0.00
Tab. 4.6 Dry gas composition at two different steam to ethanol ratio.
Fig. 4.7 Effect of CT at S/CH3CH2OH = 5 mol/mol.
0
10
20
30
40
50
60
70
80
90
100
SH
2
SC
O
SC
O2
SC
H4
SH
2
SC
O
SC
O2
SC
H4
SH
2
SC
O
SC
O2
SC
H4
%
1 s 0.5 s
700 C550 C400 C

Results and discussion
136 H2 production from steam ethanol reforming (ESR)
Fig. 4.8 Effect of S/CH3CH2OH at CT = 0.5 s.
44..33..11..33 CChhaarraacctteerriizzaattiioonn ooff ssppeenntt ssaammppllee
Two spent catalysts are named as:
RNMAs5 for the spent catalyst with steam to ethanol equal to 5 and
RNMAs4 for that one with steam to ethanol equal to 4.
Both catalysts show similar XRD pattern, with same phases Mg2SiO4, MgO and
MgAl2O4 furthermore Ni° phase is observed. Mg2SiO4 and MgAl2O4 phases appear
more defined but it is not possible the calculation of the particles dimension because
the reflections are not well resolved.
The steam to ethanol ratio influences coke presence: only RNMAs4 presents a broad
peak at 25 2θ which is probably due to amorphous coke as it was reported by
Hardiman et al.(14) (Fig. 4.9).
The values of specific surface area, pore volume and desorption pore widths of the
fresh and spent catalysts are reported in Tab. 4.7, while the pore size distributions are
showed in Fig. 4.10.
After the catalytic tests the surface area and pore volume are slightly lower respect to
the fresh sample and a shift of the maximum pore width is observed. This same trends
can be due to a slightly sintering of the catalysts.
0
10
20
30
40
50
60
70
80
90
100
SH
2
SC
O
SC
O2
SC
H4
SH
2
SC
O
SC
O2
SC
H4
SH
2
SC
O
SC
O2
SC
H4
%
5 4
700 C550 C400 C

Results and discussion
H2 production from steam ethanol reforming (ESR) 137
Fig. 4.9 XRD of fresh and spent RNMA.
RNMAf RNMAs5 RNMAs4
BET surface area m2g-1 96.54 94.95 93.96
t-plot micropore area m2g-1 11.59 13.61 14.79
BJH desorption cumulative volume of pores
cm3g-1 0.680 0.646 0.631
BJH desorption maximums pore widths
Å 148 27,35,165 35,169
Tab. 4.7 Surface area and pores volume and width of fresh and spent RNMA.
Fig. 4.10 BJH pore size distribution of fresh and spent RNMA.
0
0.001
0.002
0.003
10 100 1000 10000
Po
re V
olu
me
(c
m³/
g·Å
)
Pore diameter (Å)
RNMAf RNMAs5 RNMAs4
Inte
nsity (a.u
.)

Results and discussion
138 H2 production from steam ethanol reforming (ESR)
The oxidation profile of both spent RNMA show a peak at 310°C (Fig. 4.11), which is
assigned to free Ni. For both spent samples the value of the temperature of the
oxidation of free Ni is slightly higher than the fresh sample. As porosimetry data
suggest, a slightly sintering of the catalyst was occurred.
During this analyses the CO2 formation was monitored (Fig. 4.12). The CO2 formed at
about 200-300 °C may be due to carbonaceous deposits mainly in the form of
amorphous carbon, while the CO2 formed at about 550 °C may be due to oxidation of
filamentous form of carbon.
Fig. 4.11 TPO of fresh and spent RNMA.
Fig. 4.12 CO2 production and O2 consumption during TPO analyse.

Results and discussion
H2 production from steam ethanol reforming (ESR) 139
44..33..22 RRhh ccaattaallyyssttss:: eeffffeecctt ooff aa sseeccoonndd mmeettaall
After preliminary tests in which it was studied some trends as effect of temperature
and steam to ethanol ratio of a reference catalyst, it was chosen new reaction
conditions to study the effect of a second metal and at the mean time to maximize H2
selectivity. Furthermore, in consideration of the high activity shown by the RNMA
which are close to the thermodynamic equilibrium, the contact time of the new tests
was decreased in the attempt to discriminate the catalysts activity and selectivities.
The used catalysts formulation (as atomic ratio percentage) is summarized in the
following table:
RNMA R0075N4MA RMA R05MA RFMA
Mg 60 64 68 68 68
Al 31.85 31.925 31.85 31.45 15.85
Rh 0.15 0.075 0.15 0.55 0.15
Ni 8 4 / / /
Fe / / / / 16
anions silicates silicates silicates silicates silicates
Tab. 4.8 Compositions of catalysts.
44..33..22..11 CChhaarraacctteerriizzaattiioonn ooff ffrreesshh ccaattaallyyssttss
The RNMA catalyst described in the previous paragraph was compared with two
similar catalysts containing only Rh and Rh-Fe maintaining the same M2+/M3+ ratio, i.e.
replacing in the HT precursor preparation the Ni2+ with Mg2+ or the Al with Fe3+.
The comparison of rhodium hydrotalcite (RMAf) with that one with also nickel shows
more crystalline forsterite type phase (Mg2SiO4), preferentially combined with silicate
in the forsterite type phase with respect to the Ni2+ preferentially present as Ni/MgO
phase. Beside that rhodium hydrotalcite shows MgO type phase and spinel type
phase. The MgO type phase is also clearly visible in the Rh calcined hydrotalcite while
spinel type phase is overlapped to the mixed oxide and forsterite type phase.
Differently in the hydrotalcite in which part of aluminium was substituted by iron, XRD
patterns show broad reflections of mixed oxide and spinel type phase widely
overlapped, while as a side phase also forsterite is present. The high intensity of the
spinel type phase is due to the higher tendency of Fe to form spinel and to the higher
lattice factor (due to the high atomic number) of Fe whit respect to Al also present in
the spinel type phase. The broad peak are due to the possibility to have several type of

Results and discussion
140 H2 production from steam ethanol reforming (ESR)
spinel (MgFe2O4, MgAlFeO4) which are overlapped with the forsterite and the mixed
oxide phase (15).
It is not excluded that part of iron could be present as Fe2+ (16) (Fig. 4.13).
Also textural properties of calcined hydrotalcite are influenced by nickel presence:
catalysts RNMAf and R0075N4MAf show different volume of pore distributions, while
rhodium hydrotalcite both RMAf and R05MAf show two superimposable curves of
pore distributions. RMAf, R05MAf and R0075N4MAf show bimodal curve with huge
porosity at maximum of 98 Å for Rh-Ni sample and 120-130 Å for Rh sample and minor
porosity for all three samples at 36 Å (Fig. 4.14).
The insertion of iron changes type of curve: it shows a broad and an inhomogeneous
pore size distribution with two maxima at about 65 and 143 Å (Fig. 4.14).
Fig. 4.13 XRD of fresh catalysts.
BET surface
area (m2g-1)
t-plot
micropore
area (m2g-1)
BJH desorption
cumulative volume
of pores (cm3g-1)
BJH desorption
maximums
pore widths (Å)
RNMAf 96.54 11.59 0.680 148
R0075N4MAf 138.73 16.15 0.708 36, 98
RMAf 113.61 19.42 0.562 36, 129
R05MAf 114.79 20.03 0.556 36, 122
RFMAf 108.24 15.78 0.512 65, 143
Tab. 4.9 Surface area and pores volume and width of fresh catalysts.
Inte
nsity (a.u
.)

Results and discussion
H2 production from steam ethanol reforming (ESR) 141
Fig. 4.14 BJH pore size distribution of fresh catalysts.
The TPR analysis of R0075N4MAf is reported in Fig. 4.15. As for RNMAf nickel is
reduced in one single step at high temperature and also for this sample Ni is inserted
in the structure forming a solid solution. The temperature of reduction is slightly
higher than RNMAf (860°C vs 830 °C), higher amount of nickel is responsible of
sintering phenomena. The second TPR after oxidation confirms the profile of
temperature reduction.
The TPR analysis of RMAf and R05MAf are reported in Fig. 4.16. The TPR profiles
show an H2 consumption peak at 450 °C, together with smaller peaks at higher
temperatures. These reduction trends are characteristic of highly stabilized Rh3+
species inserted in the structure of mixed oxide phases (13).
The TPR analysis of RFMAf is reported in Fig. 4.15. The TPR of fresh catalyst shows
not well defined peaks, anyway three peaks are observed at 299, 559 and about 950
°C. The first peak at low temperature suggests a reduction of Rh in the spinel phase
assisted by the presence of a reducible cation such as Fe which decreases the
reduction temperature of Rh(III) to Rh° of 50°C. The broad peak with a maximum at
559°C are due to a combination of reduction peaks: the Fe is reduced from Fe(III)/Fe(II)
in the spinel structure with displacement of Fe in the B position of the AB2O4 phase
and/or the Fe reduction inserted in the spinel MgFeAlO4 into Mg1-xFexO.The peak at
950 °C corresponds to the reduction of Mg1-xFexO to metallic Fe0(15).
0
0.001
0.002
0.003
10 100 1000
Po
re V
olu
me
(c
m³/
g·Å
)
Pore diameter (Å)
RNMAf R0075N4MAf RMAf R05MAf RFMAf

Results and discussion
142 H2 production from steam ethanol reforming (ESR)
Fig. 4.15 TPR of R0075N4MAf (left) and RFMAf (right).
Fig. 4.16 TPR of RMAf (left) and R05MAf (right).
44..33..22..22 AAccttiivviittyy
The new reaction conditions can be summarized in:
P = 1 bar;
Toven = 600 and 750 °C;
S/CH3CH2OH = 5 mol/mol;
fD = He/(H2O+CH3CH2OH) = 4 mol/mol;
V = 1 mL;
Pellets size = 14-20 mesh
Conditions x 2x 4x 6x
CT (standard) (s) 0.333 0.167 0.083 0.056
CT (700°C) (s) 0.102 0.051 0.025 0.017
CT (550°C) (s) 0.121 0.060 0.030 0.020
Tab. 4.10 Contact time, calculated in standard conditions, at 750 and 600°C.
Rh-Ni catalysts were reduced at 800 °C, while Rh sample are reduced at 500 °C, for all
samples reduction time is 2 hours.
For each catalysts tests were started at 700 °C and high contact time, then it was
continued by decreasing contact time. Afterwards temperature was decreased to 550

Results and discussion
H2 production from steam ethanol reforming (ESR) 143
°C and same contact times were repeated at this temperature. In the figures
equilibrium values are inserted as empty symbols.
The RNMA performances are reported in Fig. 4.17. At 700 °C initial ethanol conversion
is total with H2 selectivity close to 100 % and no intermediates are observed. During
last condition, the presence of some traces of CH3CHO is observed with the slightly
decrease of ethanol conversion. This relationship is more evident at 550 °C when the
decrease of ethanol conversion is significant and the presence of CH3CHO is more
marked. Always at 700 °C, CH4 selectivity is close to zero as predicted by the
equilibrium data, by decreasing the contact time the CH4 selectivity increases both
due to kinetic and to thermodynamic reason since at low residence time the
temperature decreases due to the endotermicity of the reaction. The effect of the
thermodynamic is also visible on the water gas shift equilibrium for which lower
residence time leading to lower temperature, decrease of CO selectivity and increase
of CO2 selectivities. At high residence time tests carried out at 550 °C show values
close to thermodynamic equilibrium, with a CH4 selectivity close to 20%; also in this
case the decrease of contact time and the consequent decrease of temperature
determines an increase of CH4. Furthermore the presence of C2 intermediates can be
observed at low residence time and their increasing trend with residence time affects
also C1 products that decreases proportionally.
Fig. 4.17 Activity and selectivities of RNMA.
In the sample R0075N4MA the amount of active phase was halved but it is high
enough to obtain, at 700 °C, total ethanol conversion and H2 selectivity close to 100 %.
In both conditions at 700 and 550 °C, ethanol conversion is less active than previous
one and, in particular at 550 °C, a drop of ethanol conversion is observed. As it was
said before ethanol conversion affects gas phase distribution and therefore the
presence of intermediates as CH3CHO and CH2CH2 is observed when ethanol
conversion is not complete and only traces when it is complete.
At 700 °C, during high residence time tests, products distribution is quite close to
thermodynamic equilibrium, but the decreasing of contact time determines the
decrease of ethanol conversion, the presence of CH3CHO, the increase of CH4 due to
less reforming and decrease of CO2 selectivity due to less water gas shift. At 550 °C
0
10
20
30
40
50
60
70
80
90
100
0 0.03 0.06 0.09 0.12 0.15 0.18
%
CT (s)
C C2H5OHS H2
S CO2
S CH4
C H2O
S CO
S CH3CHO
700 C
0
10
20
30
40
50
60
70
80
90
100
0 0.03 0.06 0.09 0.12 0.15 0.18
%
CT (s)
C C2H5OH
S H2
S CO2
S CH4
C H2O
S CO
S CH3CHOS CH2CH2
550 C

Results and discussion
144 H2 production from steam ethanol reforming (ESR)
ethanol and water conversions significantly decreases with contact time. As
consequence an increase of intermediates and a drop in CO2 selectivity are observed.
Fig. 4.18 Activity and selectivities of R0075N4MA.
Catalyst with low amount of Rh (RMA) shows initially complete ethanol conversion,
but, differently from Rh-Ni series, gas phase distribution is far from thermodynamic
predictions. In detail, at 700 °C CO2 selectivity is lower than equilibrium, while CH4
selectivity is higher, therefore the decrease of active phase and the absence of Ni
affect negatively water gas shift and reforming reactions. At 550 °C ethanol
conversion is under 60 % and drops until 20 % in last condition, while water
conversion is negative (not present in figure) for all conditions. C1 selectivities are
lower than 10 % while significant amounts of CH3CHO and CH2CH2 are observed. In
particular CH2CH2 selectivity close to 40 % is accompanied by formation of same
amount of water due to dehydration reaction which explains negative water
conversion due to water formation instead of water consumption.
CH3CH2OH CH2CH2 + H2O
Furthermore, always at 550 °C, CH3COCH3 is observed during first tests. This by-
product can be due to aldolic condensation of two molecules of CH3CHO, the decrease
of contact time determines the decrease of CH3COCH3 and the increase of CH3CHO
confirming this mechanism.
2CH3CHO CH3COCH2CHO + O(s) CH3COCH2COO(s) + H(s) CH3COCH3 + CO2
Increasing the amount of Rh (R05MA) CO, CO2 and CH4 selectivities are close to
thermodynamic equilibrium with gas phase trends similar to Rh-Ni series. During tests
550 °C ethanol conversion drastically drops. Higher C1 selectivities than RMA is
obtained but also CH3COCH3 is detected.
0
10
20
30
40
50
60
70
80
90
100
0 0.03 0.06 0.09 0.12 0.15 0.18
%
CT (s)
C C2H5OH
S H2
S CO2
S CH4
C H2O
S CO
S CH3CHO
700 C
0
10
20
30
40
50
60
70
80
90
100
0 0.03 0.06 0.09 0.12 0.15 0.18
%
CT (s)
C C2H5OH
S H2
S CO2
S CH4
C H2O
S COS CH3CHO
S CH2CH2
550 C

Results and discussion
H2 production from steam ethanol reforming (ESR) 145
Fig. 4.19 Activity and selectivities of RMA.
Fig. 4.20 Activity and selectivities of R05MA.
RFMA is the most active catalyst in ethanol conversion since, even at 700 °C and low
contact time , shows total ethanol conversion. Despite that gas phase distribution
doesn’t reach thermodynamic predictions and H2 selectivity is close to 75 % rather
than 100 %. CH4 selectivity above and CO under equilibrium suggest that the catalyst
is less active in the CH4 reforming. Some traces of CH2CH2 are detected. At 550 °C
ethanol conversion is complete during first tests, even if it decreases by decreasing
contact time. As for all previous catalysts the decrease of ethanol conversion is
accompanied by increase of CH3CHO, CH2CH2 and CH3COCH3 selectivities.
Fig. 4.21 Activity and selectivities of RFMA.
44..33..22..33 CChhaarraacctteerriizzaattiioonn ooff ssppeenntt ssaammpplleess
Rh-Ni spent samples don’t show significant differences with fresh ones, except the
presence of coke (Fig. 4.22). Both spent samples present a large peak at 20-30° 2θ
which is probably due to amorphous coke as it was observed for the sample RNMAs4
0
10
20
30
40
50
60
70
80
90
100
0 0.03 0.06 0.09 0.12 0.15 0.18
%
CT (s)
C C2H5OH
S H2
S CO2
S CH4
C H2O
S CO
S CH3CHO
700 C
0
10
20
30
40
50
60
70
80
90
100
0 0.03 0.06 0.09 0.12 0.15 0.18
%
CT (s)
C C2H5OH
S H2
S CO2S CH4
S CO
S CH3CHO
S CH2CH2
S CH3COCH3
550 C
0
10
20
30
40
50
60
70
80
90
100
0 0.03 0.06 0.09 0.12 0.15 0.18
%
CT (s)
C C2H5OHS H2
S CO2
S CH4
C H2O
S CO
700 C
S CH3CHO
0
10
20
30
40
50
60
70
80
90
100
0 0.03 0.06 0.09 0.12 0.15 0.18
%
CT (s)
C C2H5OH
S H2
S CO2
S CH4C H2O
S CO
S CH3CHO
S CH2CH2
550 C
S CH3COCH3
0
10
20
30
40
50
60
70
80
90
100
0 0.03 0.06 0.09 0.12 0.15 0.18
%
CT (s)
C C2H5OH
S H2
S CO2
S CH4
C H2O
S CO
700 C
0
10
20
30
40
50
60
70
80
90
100
0 0.03 0.06 0.09 0.12 0.15 0.18
%
CT (s)
C C2H5OH
S H2
S CO2
S CH4
C H2O
S CO
S CH3CHO
S CH2CH2
S CH3COCH3
550 C

Results and discussion
146 H2 production from steam ethanol reforming (ESR)
(14). Furthermore the sample RNMAs shows a peak at 27° 2θ that could be assigned to
graphite.
As Rh-Ni, Rh samples show same phases that fresh ones and only for RMAs a low and
broad peak at 20-30° 2θ is observed. Also in this case it could be assigned to
amorphous coke while graphitic carbon is not present after reaction (Fig. 4.23).
The RFMAs sample shows the same phases than the fresh one, which are fosterite
type phase, MgO type phase and spinel type phase, the peaks of the present phases
appear more defined in the used one (Fig. 4.24).
Fig. 4.22 XRD of fresh and spent RNMA and R0075N4MA.
Fig. 4.23 XRD of fresh and spent RMA and R05MA.
Inte
nsity (a.u
.)In
ten
sity (a.u
.)

Results and discussion
H2 production from steam ethanol reforming (ESR) 147
Fig. 4.24 XRD of fresh and spent RFMA.
After catalytic tests the specific surface area and the micropore area of RNMAs are
higher than fresh one, instead of R0075N4MAs which shows a drop of both surface
area. For both samples pores volume is significantly lower than the fresh one (Tab.
4.11). These different trends could be due to a drastic decrease of mesoporosity in
both samples, as BJH pore size distributions show (Fig. 4.25), but in the RNMAs the
high surface area is correlated to microporosity while R0075N4MAs show low
microporosity and therefore low surface area. The increase of surface area and
microporosity confirm XRD data related to coke and graphite formation on the
catalyst.
Also RMAs shows a decrease of surface area and pores volume, but it is not so
pronounced as for Rh-Ni series, while R05MAs shows higher stability for what concern
textural property because surface area and pores volume are very similar to fresh
sample. The pore size distribution plots of Rh catalysts are quite similar to fresh ones,
two regions of porosity are observed in both fresh and used samples. For what
concern the maximum pores width for both spent samples a similar trend is observed:
the width of small pores remains constant while the width of large pores slightly
increases (Fig. 4.26).
After catalytic tests the specific surface area and pores volume of RFMAs are
significantly lower than those of fresh one. The pore size distribution plot of RFMAs is
quite different from fresh sample: fresh sample shows two region of porosity from 42
to 101 Å and from 101 to 402 Å, while the spent sample shows the first region at lower
width than that of the fresh one (32-40 Å) and the second large region between 40 and
400 Å (Fig. 4.27). The decrease of surface area and pores volume could be due to a
sintering of the catalyst.
The comparison of all pore size distribution plots shows that Rh catalysts are the most
stable while RNMAs shows the highest coke formation (Fig. 4.28).
Inte
nsity (a.u
.)

Results and discussion
148 H2 production from steam ethanol reforming (ESR)
BET surface
area (m2g-1)
t-plot
micropore
area (m2g-1)
BJH desorption
cumulative volume
of pores (cm3g-1)
BJH desorption
maximums
pore widths (Å)
RNMAf 96.54 11.59 0.680 148
RNMAs 158.19 33.72 0.196 39
R0075N4MAf 138.73 16.15 0.708 36, 98
R0075N4MAs 43.41 5.83 0.185 36,152
RMAf 113.61 19.42 0.562 36, 129
RMAs 85.65 4.70 0.452 36, 155
R05MAf 114.79 20.03 0.556 36, 122
R05MAs 113.15 3.39 0.553 36, 142
RFMAf 108.24 15.78 0.512 65, 143
RFMAs 77.44 0.00 0.393 36, 72, 142
Tab. 4.11 Surface area and pores volume and width of fresh and spent catalysts.
Fig. 4.25 BJH pore size distribution of fresh and spent RNMA and R0075N4MA.
0
0.002
0.004
0.006
0.008
10 100 1000
Po
re V
olu
me
(c
m³/
g·Å
)
Pore diameter (Å)
RNMAf R0075N4MAf RNMAs R0075N4MAs

Results and discussion
H2 production from steam ethanol reforming (ESR) 149
Fig. 4.26 BJH pore size distribution of fresh and spent RMA and R05MA.
Fig. 4.27 BJH pore size distribution of fresh and spent RFMA.
0
0.001
0.002
0.003
10 100 1000
Po
re V
olu
me
(c
m³/
g·Å
)
Pore diameter (Å)
RMAf R05MAf RMAs R05MAs
0
0.001
0.002
0.003
10 100 1000
Po
re V
olu
me
(c
m³/
g·Å
)
Pore diameter (Å)
RFMAf RFMAs

Results and discussion
150 H2 production from steam ethanol reforming (ESR)
Fig. 4.28 BJH pore size distribution of spent catalysts.
The oxidation profile of RNMAs shows many overlapped peaks in the range of 388 -
681 °C. All these negative peaks can be due to coke because MS analysis presents the
same trend of CO2 production in this range of temperature (Fig. 4.29). The high
temperature of oxidation suggests that coke formed during reaction is filamentous
coke. Peaks assigned to oxidation of nickel is not observed probably because it is
covered by the carbon oxidation peak.
TPO analyses after TPR of R0075N4MAf shows only one peak at 300 °C due to
oxidation of reduced nickel while the spent sample shows also two negative peaks at
higher temperature that are attributed to filamentous coke as CO2 trend of mass
analyses confirms.
Rh catalysts don’t show any peak of oxidation after reduction since the low amount of
rhodium inside the samples is difficult to be observed. Anyway spent samples show
similar TPO profile: two weak negative peaks, the first and higher in intensity at 489°C
with a corresponding CO2 MS peak that can be attributed to amorphous coke
oxidation while the second very weak TPO peak at 620 °C without a corresponding
CO2 peak.
TPO analysis after TPR of RFMAf shows two large overlapping peaks at low
temperature due to oxidation of iron because rhodium doesn’t exhibit oxidation
peaks. Spent sample shows very low intensity peaks due to amorphous carbon
oxidation at temperature of 460 °C, while at 620 °C only a very weak TPO peaks is
present.
0
0.002
0.004
0.006
0.008
10 100 1000
Po
re V
olu
me
(c
m³/
g·Å
)
Pore diameter (Å)
RNMAs R0075N4MAs RMAs R05MAs RFMAs

Results and discussion
H2 production from steam ethanol reforming (ESR) 151
Fig. 4.29 TPO of fresh and TPO, CO2 and O2 of spent RNMA.
Fig. 4.30 TPO of fresh and TPO, CO2 and O2 of spent R0075N4MA.

Results and discussion
152 H2 production from steam ethanol reforming (ESR)
Fig. 4.31 TPO of fresh and TPO, CO2 and O2 of spent RMA.
Fig. 4.32 TPO of fresh and TPO, CO2 and O2 of spent R05MA.

Results and discussion
H2 production from steam ethanol reforming (ESR) 153
Fig. 4.33 TPO of fresh and TPO, CO2 and O2 of spent RFMA.
Fig. 4.34 TPO of spent catalysts.

Results and discussion
154 H2 production from steam ethanol reforming (ESR)
Fig. 4.35 TPO of spent catalysts (detail).
44..33..22..44 CCoommppaarriissoonnss aanndd ccoonncclluussiioonnss
Three different catalysts were tested at different contact times and temperatures (700
and 550 °C).
At 700 °C all catalysts show very high ethanol conversion (Fig. 4.36), while at lower
temperature best conversion is obtained with RNMA catalyst. In all conditions the
highest H2 selectivity is observed with the catalysts containing Rh-Ni (Fig. 4.37), these
samples favour the break of C-C bond more than others (Fig. 4.40). By decreasing the
amount of active phase Rh-Ni series show coherent trends of selectivities: the
decrease of CO and CO2 is proportionally to decrease of ethanol conversion, while for
Rh series the decrease of active phase show a complete different trend giving
indication of a different active species or a structure sensitive reaction. Rh-Fe catalyst
shows higher amount of CH4 then all other catalysts both at 700 and 550 °C and
therefore this catalyst doesn’t favour methane reforming.
Unfortunately highest and more crystalline amount of coke is observed with RNMA
catalyst, while it is low with Rh and Rh-Fe samples. Also the drastic decrease of
surface area and the increase of microporosity are closely linked to a loss of
mesoporosity that is probably due to coke formation.
Considering high amount of coke of Rh-Ni samples and high amount of CH4 with Rh-
Fe sample it was chosen R05MA to continue the study and enhance the performances
of this catalyst.

Results and discussion
H2 production from steam ethanol reforming (ESR) 155
Fig. 4.36 Comparisons of gas phase distribution at 700 °C during 4x condition.
Fig. 4.37 Comparison of H2 selectivities at 550 °C.
0
10
20
30
40
50
60
70
80
90
100
XC
H3
CH
2O
H
XH
2O
SH
2
SC
O
SC
O2
SC
H4
SC
H2
CH
2
SC
H3
CH
3
SC
H3
CH
O
%
RNMA R0075N4MA R05MA RMA RFMA
700 C
00
10
20
30
40
50
60
70
80
90
100
00 10 20 30 40 50 60 70 80 90 100
S H
2 (
%)
C2H5OH Conv. (%)
RNMA R0075N4MA RMA R05MA RFMA

Results and discussion
156 H2 production from steam ethanol reforming (ESR)
Fig. 4.38 Comparison of CO+CO2 selectivities at 550 °C.
Fig. 4.39 Comparison of CH4 selectivities at 550 °C.
0
10
20
30
40
50
60
70
80
90
100
00 10 20 30 40 50 60 70 80 90 100
S C
O +
CO
2 (
%)
C2H5OH Conv. (%)
RNMA R0075N4MA RMA R05MA RFMA
00
10
20
30
40
50
60
70
80
90
100
00 10 20 30 40 50 60 70 80 90 100
S C
H4
(%
)
C2H5OH Conv. (%)
RNMA R0075N4MA RMA R05MA RFMA

Results and discussion
H2 production from steam ethanol reforming (ESR) 157
Fig. 4.40 Comparison of C2 selectivities at 550 °C.
44..33..33 RRhh ccaattaallyyssttss:: eeffffeecctt ooff tthhee mmaattrriixx
After the study of the active phase selection and in consideration that the Ni
containing catalysts show carbon formation, the interest was focused in improving
the Rh catalysts. The work started with the study of the matrix by changing the ratio
Mg/Al and the anion between layers in the preparation of hydrotalcites. Then a
catalyst prepared with RhCeZrO2, with Ce/Zr ratio equal to 75/25, was taken in exam
to compare its results with catalysts obtained by hydrotalcites. All catalysts contain 1
% wt of rhodium as noble metal to avoid problems related with the possibility to have
Rh trapped in the matrix even after reduction when using low Rh loading.
The composition of hydrotalcites is summarized in Tab. 4.12.
R055MAs R05M80As R043MAc R043M80Ac
Mg 68 80 68 80
Al 31.45 19.45 31.57 19.57
Rh 0.55 0. 5 0.43 0.43
anions silicates silicates carbonates carbonates
Tab. 4.12 Compositions of catalysts.
Since in previous conditions at 700 °C almost all catalysts show high ethanol
conversion, it was decided to decrease further the contact time to study catalytic
00
10
20
30
40
50
60
70
80
90
100
00 10 20 30 40 50 60 70 80 90 100
S C
2 +
C3
(%
)
C2H5OH Conv. (%)
RNMA R0075N4MA RMA R05MA RFMA

Results and discussion
158 H2 production from steam ethanol reforming (ESR)
performances in more drastic conditions far from the thermodynamic equilibrium.
Furthermore the pellets diameter was decreased to avoid inter and intradiffusional
problems.
44..33..33..11 CChhaarraacctteerriizzaattiioonn ooff ffrreesshh ccaattaallyyssttss
44..33..33..11..11 XX--RRaayy ddiiffffrraaccttiioonn ((XXRRDD)) aannaallyyssiiss
The PXRD patterns of the carbonate and silicate containing compounds are shown in
Fig. 4.41. The pattern of the HT carbonate sample (R043MAc) shows the characteristic
diffraction pattern of hydrotalcite-like compounds with sharp and intense diffraction
lines due to basal reflection lines and broad and less intense peaks related with non-
basal planes; the basal spacing is 7.6 Å (17).
The insertion of silicates (R055MAs), rather than carbonates, in the interlayer leads to
a solid with a lower crystalline structure and with a rather similar interlayer spacing.
Decreased crystallinity is observed not only perpendicular to the plane direction but
also within layers, as can be seen by the considerable reduction in the intensity of the
first reflection line and the poor resolution of the doublet (recorded in the 60–65° 2θ
range) due to the ((110) and (113)) diffraction planes (18).
Increasing the amount of magnesium, a shift of basal planes ((003), (006) and (009))
towards lower 2θ is observed both for carbonate and silicate sample (Fig. 4.41). The
lower amount of Al causes lower electronic charge of the layers and as consequence
the distance between the layers is higher. For Bragg law higher distance causes lower
2 to obtain the same result (18).
After calcination at 900 °C, a spinel-type phase and a rock-salt phase are obtained for
the HT carbonate sample (Fig. 4.43). In this catalyst, rhodium cations are well
dispersed into the MgO and spinel phases (13). On the other hand, by calcining the HT
silicate sample a more complex pattern is obtained. New diffraction peaks assigned to
a forsterite-like phase (Mg2SiO4) are indexed; conversely, no well-defined phase
containing Al (MgAl2O4) was detected, while the MgO phase is still present (Fig. 4.44).
Some reflection lines due to a spinel-type phase are observed in the diffraction
patterns; however, they are weak and broad and the first two reflections at 19 and 32°
2θ ascribed to (111) and (220) are not observed, thus suggesting the formation of a
defective spinel phase. It would appear that the presence of silicates which react with
MgO to form the forsterite phase affects and possibly delays the formation of the
spinel phase.
The diffraction patterns of the calcined catalysts (Fig. 4.43 and Fig. 4.44) show that by
increasing the Mg/Al, together with the expected increase in the intensity of the MgO
phase diffraction lines, the amount of spinel phase decreases. Moreover, the amount
and the crystallinity of the forsterite phase for the 80/20 is lower. It is worth noting
that by reducing the amount of trivalent cations, the charge excess of the hydroxyl

Results and discussion
H2 production from steam ethanol reforming (ESR) 159
layers decreases, as does the silicate content in the structure in order to balance it
(Fig. 4.42).
RCZO catalyst shows CeZrO2 phase and no reflections attributed Rh phase because of
the amount of metal is too low.
Fig. 4.41 XRD of HT samples.
Fig. 4.42 Amounts of different phases HT samples after calcination (Ex-HT).
70
52
46
12
30
48
30
48
36
60
R043M80Ac
R043MAc
R05M80As
R055MAs
MgO MgAl2O4 Mg2SiO4 MgO / MgAl2O4
2.3
1.1
1.5
0.2
Inte
nsity (a.u
.)

Results and discussion
160 H2 production from steam ethanol reforming (ESR)
Fig. 4.43 XRD of carbonates Ex-HTs: effect of Mg/Al ratio.
Fig. 4.44 XRD of silicates Ex-HTs: effect of Mg/Al ratio.
Fig. 4.45 XRD of fresh RCZO.
Inte
nsity (a.u
.)In
ten
sity (a.u
.)In
ten
sity (a.u
.)

Results and discussion
H2 production from steam ethanol reforming (ESR) 161
44..33..33..11..22 SSuurrffaaccee aarreeaa aanndd ppoorroossiimmeettrryy aannaallyyssiiss
The values of specific surface area pores volume and desorption pore widths of the
fresh catalysts are reported in Tab. 4.9, while the pore size distributions are shown in
Fig. 4.46 and Fig. 4.47.
The change from carbonate to silicate improves the values of surface area: silicates
samples show higher (about two times) surface area then carbonates.
By comparison with calcinated products, the surface area of hydrotalcites with silicate
is almost two times respect calcinated products, while in the carbonates, values of
hydrotalcites and calcinated are more similar even if the surface area of hydrotalcite
samples are slightly lower than calcined. The different trend between carbonates and
silicates can be due to different answer of the anions interlayers to thermal treatment.
For carbonates samples the increase of surface area is due to “cratering” mechanism
which occurs through the removal of CO2 and H2O and it is favourite at medium
temperature (400-600 °C) (19). Since these materials are stable against sinterization,
calcination at high temperature (900 °C) doesn’t decrease the surface area. On the
other hand, for silicate samples, first of all, since the anions located in the interlayer
are mainly polysilicates, the ‘‘cratering’’ mechanism would lead to a lesser increase of
the surface area (18).
The carbonate sample with large excess of magnesium (R043M80Ac) shows lower
value of surface area then common values reported in literature for carbonate
hydrotalcites. The large amount of magnesium can make hydrotalcite formation
difficult because the ratio Mg/Al 80/20 is the limit for stoichiometric hydrotalcites (18).
The RCZO catalyst shows both surface area and pores volume very lower than
hydrotalcites and hydrotalcites after calcination. This data are explained by the low
widths of pore close to 43 Å.

Results and discussion
162 H2 production from steam ethanol reforming (ESR)
BET surface
area (m2g-1)
t-plot
micropore
area (m2g-1)
BJH desorption
cumulative
volume of pores
(cm3g-1)
BJH desorption
maximums pore
widths (Å)
HT R043MAc 102.75
R043MAc 121.16 17.47 0.631 122
HT R043M80Ac 14.72
R043M80Ac 105.16 19.97 0.250 37 , 60 , 125
R05MAs 114.79 20.03 0.558 36 , 127
HT R055MAs 263.43
R055MAs 113.20 10.08 1.129 36 , 235
HT R05M80A 154.74
R05M80As 107.13 16.52 0.452 34 , 126
RCZO 53.08 3.19 0.122 43
Tab. 4.13 Surface area, pores volume and width of fresh catalysts.
Pore size distributions figures are referred only to Ex-HT samples.
The pore size distribution of carbonate samples (R043MAc, R043M80Ac and MAc) show some differences, the sample R043MAc shows mainly monomodal and quite broad pore distribution curve, while that one of R043M80A shows three different pore regions in the ranges [33 – 41], [41 – 106] and [106 – 151] Å.
Differently of carbonate samples, silicate samples show more stable porosimetry profiles: very large pore distribution curve with two regions of pores. The largest distribution is in the range [43 – 545] Å while the second lower region is in the range [33 – 43] Å.

Results and discussion
H2 production from steam ethanol reforming (ESR) 163
Fig. 4.46 BJH pore size distribution of fresh Ex-HTs.
Fig. 4.47 BJH pore size distribution of fresh RCZO.
44..33..33..11..33 TTeemmppeerraattuurree pprrooggrraammmmeedd rreedduuccttiioonn ((TTPPRR)) aanndd ooxxiiddaattiioonn
((TTPPOO)) aannaallyyssiiss
The TPR profiles for all catalysts show a H2 consumption peak at ca. 400 °C, together
with smaller peak at higher temperature (ca 850 °C). These reduction temperatures
are characteristic of highly stabilized Rh3+ species, which are inserted into the mixed
oxide phases.
0
0.001
0.002
0.003
0.004
10 100 1000 10000
Po
re V
olu
me
(c
m³/
g·Å
)
Pore Width (Å)
R055MAs R05M80As R043MAc R043M80Ac
0
0.001
0.002
0.003
0.004
0.005
10 100 1000 10000
Po
re V
olu
me
(c
m³/
g·Å
)
Pore Width (Å)
RCZO

Results and discussion
164 H2 production from steam ethanol reforming (ESR)
A TPO-TPR cycle was performed to study the stability of the metal particles under
oxidizing conditions. No relevant consumption of O2 is observed during TPO analyses
(flat line), while H2 consumption is observed in the second TPR run, but differently
from first TPR, it is observed only at high temperature.
By comparison of TPR analyses, the reduction of the silicate containing samples
occurs at lower temperature (394-414 °C) than the ones with carbonate (422 °C) as
interlayer anions. The comparison of the intensity shows that the R043MAc has the
area of the first peak lower than other samples while the second reduction peak
exhibits similar height and it is extended above 900 °C (maximum temperature of the
TPR) making difficult to calculate the area. Therefore, considering that all the samples
contain the same amount of rhodium, the degree of R043MAc reduced at low
temperature is less than other samples.
The TPR profile of RCZO shows 3 peaks of H2 consumption at ca. 160, 370 and 850 °C.
The low temperature of first peak is associated to rhodium free on the surface of
catalyst and it can attributed mainly to Rh2O3, while the others a higher temperature
are due to CeZrO2.TPR profile of CeZrO2 without rhodium shows two peaks at 600
and 850 °C which are associated with the reduction of the surface and the bulk. The
presence of rhodium determines a significant promotion in the reduction due to the
spillover of H2 onto the support, i.e. the reduction peaks at 600 °C shift to lower
temperatures at 350 °C. The oxidation profile of RCZO shows only one peak at 131 °C
which is attributed to CeZrO2 because it is present also in the TPO of CeZrO2 without
rhodium.
Fig. 4.48 TPR of R043MAc (left) and R043M80Ac (right).
Fig. 4.49 TPR of R055MAs (left) and R05M80As (right).

Results and discussion
H2 production from steam ethanol reforming (ESR) 165
Fig. 4.50 TPR of fresh Ex-HTs.
Fig. 4.51 TPR of RCZO.
44..33..33..11..44 SSccaannnniinngg aanndd TTrraannssmmiissssiioonn EElleeccttrroonn MMiiccrroossccooppyy aannaallyyssiiss
All three samples (R043MAc, R055MAs and R05M80As) show the typical lamellar
hexagonal structure of hydrotalcite compounds, except the sample R043M80Ac which
doesn’t show lamellar structure, but big particles with no defined shape and as a
consequence without porosity. These images explain the low surface area of this
sample, probably the ratio Mg/Al is too high to obtain a stable material and after XRD
could be occur a partial change of phase.
For samples with lamellar structure, particles size are about 100-200 nm. After
calcination the catalysts keep a porosity structure, but the structure is less defined
probably because photos are less clear.

Results and discussion
166 H2 production from steam ethanol reforming (ESR)
Fig. 4.52 HT R043MAc.
Fig. 4.53 Ex-HT R043MAc.
Fig. 4.54 HT R043M80Ac.

Results and discussion
H2 production from steam ethanol reforming (ESR) 167
Fig. 4.55 Ex-HT R043M80Ac.
Fig. 4.56 HT R055MAs.
Fig. 4.57 Ex-HT R055MAs.

Results and discussion
168 H2 production from steam ethanol reforming (ESR)
Fig. 4.58 HT R05M80As.
Fig. 4.59 Ex-HT R05M80As.
TEM analyses were carried on reduced samples. Two different temperature of
reduction were chosen to compare the effect of reduction temperature on particle
size and density. First temperature was 750 °C for two hours while the second one was
1000 °C for four hours, for both temperature the amount of H2 was 3 % in Argon and
the flow of mixture was 30 ml/min. In addition the catalyst R043MAc was reduced at
1000 °C for 30 minutes with the amount of H2 at 3 % in Argon and the flow of mixture
50 ml/min.
All the fresh catalysts reduced at 750 °C show nanosize particles with low differences
between the samples. Increasing temperature of reduction an increase of particle size
is observed, both R043MAc and R05M80As show an increase of particle size which is
about two times the value after reduction at 750 °C. In addition photos of samples
reduced at 1000 °C show higher amount of particles than those one reduced at 750 °C.
This is explained by TPR analyses: at higher temperature higher part of rhodium is
reduced therefore the total amount of rhodium increases.

Results and discussion
H2 production from steam ethanol reforming (ESR) 169
Dp (nm) R043MAc R043M80Ac R055MAs R05M80As
Fresh (750-2h) 1.4 1.1 1.0 1.1
Fresh (1000-4h) 2.6 / / 2.0
Fresh (1000-30’) 1.8 / / /
Tab. 4.14 Rhodium size of Ex-HT samples after different treatments.
a) b)
c) d)
Fig. 4.60 TEM of samples reduced at 750 °C for two hours: a) R043MAc, b) R043M80Ac, c) R055MAs and d) R05M80As.

Results and discussion
170 H2 production from steam ethanol reforming (ESR)
a) b)
Fig. 4.61 TEM of samples reduced at 1000 °C for four hours: a) R043MAc and b) R05M80As.
44..33..33..11..55 IInnffrraarreedd ssppeeccttrroossccooppyy ((IIRR)) aannaallyyssiiss
Probe molecules that were considered for IR analysis are CO and CO2 at 77K and CO at
room temperature (RT) to study the acid-base sites of samples which showed best
catalytic performances. Some measurements of adsorption with CO at 77K were
carried out on materials without rhodium to study the effect on rhodium on the
matrix. Before every test a thermal pre-treatment in vacuum was realized at three
different temperatures (100, 300 and 500 °C).
The Ex-HT carbonate Mg68Al32 (MAc) outgassed at 100 °C shows two bands in the
region of the CO stretching mode, one at 2180-2160 cm-1 and the other at 2150 cm-1,
which are due to CO molecules interacting with two different sites. The former band,
at higher frequencies, is due to CO interacting with coordinatively unsatured AlIV sites
(exposed octahedral Al ions) and with coordinatively unsatured Mg ions, which are
Lewis sites of medium acidic strength.
The latter band, at lower frequencies, may be ascribed to both CO interacting with Al-
OH species or to CO interacting with Mg ions which are less exposed (or less
coordinatively unsatured), i.e. weaker acidic Lewis sites, with respect to the former
Mg sites. Indeed this frequency is close to that observed for CO interacting with
pentacoordinated Mg2+ ions at the surface of MgO.
Upon increasing outgassing temperature, the intensity of the latter band decreases,
whereas that of the former band increases, revealing that dehydroxylation (and
possibly elimination of carbonates) yields the exposure of medium-strength acidic
Lewis sites. After outgassing at 500 °C only the band at 2180-2160 cm-1 is observed.
This band shifts from 2178 cm-1 to 2164 cm-1 upon increasing CO coverage: this
behaviour is ascribed to heterogeneity in CO adsorbing Lewis sites, where the
stronger ones (Al ions) responsible of the IR absorption at higher frequencies, are

Results and discussion
H2 production from steam ethanol reforming (ESR) 171
occupied at lower coverage. Ce0.75Z50.25O2 (CZO) shows only one band due to the CO
stretching mode at 2164 cm-1, shifting to 2155 cm-1 upon increasing coverage. Spectra
do not change for sample outgassed at increasing temperature. In this case, the
thermal treatment does not cause any significant surface modification. The band is
assigned to CO interacting with coordinatively unsatured Ce ions and possibly to CO
adsorbed through non-specific interactions.
Fig. 4.62 CO 77K of MAc after different pre-treatment at 100, 300 and 550 °C.
Fig. 4.63 CO 77K of CZO after different pre-treatment at 100, 300 and 550 °C.
For samples contain rhodium two reduction treatments are necessary to observe Rh0
species: the former needs to reduce rhodium in the sample, instead the second one,
since the sample was exposed to air before IR measurement, needs to reduce part of
rhodium which could be reoxidize. The second reduction is the same for all sample
and it was realized at 750 °C. IR spectra were recorded both in adsorption and in
desorption, so that two sets of spectra were obtained.
100°C 300°C 500°C
2250 2200 2150 2100 2050
Wavenumbers (cm -1 )
0.01 a.u.
2250 2200 2150 2100 2050
Wavenumbers (cm-1)
0.01 a.u.
2250 2200 2150 2100 2050
Wavenumbers (cm-1)
0.01 a.u.
100 °C 300°C 500°C
2250 2200 2150 2100 2050
Wavenumbers (cm-1)
0.1 a.u.
2250 2200 2150 2100 2050
Wavenumbers (cm-1)
0.2 a.u.
2250 2200 2150 2100 2050
Wavenumbers (cm-1)
0.2 a.u.

Results and discussion
172 H2 production from steam ethanol reforming (ESR)
When CO is adsorbed on metal particles, the electron back-donation from the metal
to the chemisorbed molecule decreases its stretching frequency with respect to the
unperturbed molecule. Thus, it can easily distinguish the bands of CO interacting with
acidic Lewis sites of the support (Al and Mg ions) which are explained before from
those of CO interacting with Rh0 sites on the surface of Rh particles.
First reduction of the sample R043MAc was carried out at 750 °C.
Considering the measurement at 77K, at low CO coverage a band at 2050 cm-1 was
observed, due to CO linearly chemisorbed on Rh0 sites of metal particles
(monocarbonyl species). At higher coverage the band shifts to 2060 cm-1 due to the
dipole coupling between adjacent chemisorbed CO molecules (Fig. 4.64). In the same
spectra, bands appear around 2200 cm-1, which were not observed during MAc
analysis (Fig. 4.62). These are ascribed to small amount of highly exposed Lewis sites
formed during the reduction and activation treatment.
Increasing temperature (RT) two bands are detected close to CO monocarbonyl at ca.
2033 and 2096 cm-1 (Fig. 4.65) that can be attributed to dicarbonyl species, in these
species rhodium is present as RhI. The presence of RhI is not common in literature
where it is described an instable specie, therefore it could be produced by oxidative
disruption of Rh-Rh bonds in small Rh0 crystallites under CO atmosphere (strong Rh-
CO bond) (20) (21). Furthermore analysis at RT shows some bands in the range of
1750-1200 that can be ascribed to carbonates formed by CO disproportion. The low
amount of carbonates observed upon reaction with CO is not due to a lower ability of
the surface for CO2 chemisorption because during CO2 chemisorption the intensity of
carbonates bands is higher Fig. 4.66.
Fig. 4.64 CO 77K of R043MAc reduced at 750 °C.
3800 3600 3400 2200 2000 1800 1600 1400 1200
Wavenumber (cm-1)
ex_HT_Rh red 750°C H2 raffredd pompaggio + Ar - invio CO
500
2250 2200 2150 2100 2050 2000 1950
Wavenumber (cm-1)
ex_HT_Rh red 750°C H2 raffredd pompaggio + Ar - invio CO
200

Results and discussion
H2 production from steam ethanol reforming (ESR) 173
Fig. 4.65 CO RT of R043MAc reduced at 750 °C.
Fig. 4.66 CO2 RT of R043MAc reduced at 750 °C.
The same measurements of adsorption and desorption are repeated for R043MAc
with first reduction carried out at 950 °C to study if the slight increase of particle size
could affect stretching of CO adsorption. At 77K only monocarbonyl is adsorbed at
2050 cm-1, the same frequency of previous experiment, while at RM bands related to
carbonates and dicarbonyl are detected although they show lower intensity (Fig. 4.67
and Fig. 4.68). Therefore the slight increase of particle size could affect mono-
dicarbonyl ratio even if nanosize crystallites confirm that dicarbonyl could be due to
break of Rh-Rh bond under CO atmosphere. As before, the presence of carbonates
seems related to the presence of dicarbonyl species. In addition, a very broad and low
in intensity band is observed at around 1900 cm-1 which could be attributed to bridged
carbonyl (Fig. 4.68).
3800 3600 3400 2200 2000 1800 1600 1400 1200
Wavenumber (cm-1)
ex_HT_Rh red 750°C H2 raffredd pompaggio + Ar - invio CO RT
500
2200 2000 1800
Wavenumber (cm-1)
3800 3600 3400 3200 2000 1500
Wavenumber (cm-1)
ExHT_Rh red 750°C H2 raffredd pompaggio + Ar - invio CO2
500

Results and discussion
174 H2 production from steam ethanol reforming (ESR)
Fig. 4.67 CO 77K (left) and CO RT (right) of R043MAc reduced at 950 °C.
Fig. 4.68 CO RT of R043MAc reduced at 950 °C (detail).
Rh silicate reduced at 750 °C shows a main band at 2047 cm-1, slightly lower than the
band previously associated to monocarbonyl: it can be an effect of different matrix
respect R043MAc. Furthermore a broad and low band at 1890 cm-1 is detected and
ascribed to bridged carbonyl. No dicarbonyl or carbonates are observed confirming
that the presence of the former specie affects the presence of the second one.
3800 3600 3400 2200 2000 1800 1600 1400 1200
Wavenumber (cm-1)
ex_HT_Rh950 red 750°C H2 raffredd pompaggio + Ar - invio CO 77K
500
3800 3600 3400 2200 2000 1800 1600 1400 1200
Wavenumber (cm-1)
ex_HT_Rh950 red 750°C H2 raffredd pompaggio + Ar - invio CO RT
500
2200 2000 1800
Wavenumber (cm-1)
2200 2000 1800
Wavenumber (cm-1)

Results and discussion
H2 production from steam ethanol reforming (ESR) 175
Fig. 4.69 CO RT of R5M80As reduced at 750 °C.
RCZO during adsorption at 77K shows typical band of linear CO chemisorbed at 2050
cm-1 as Ex-HTs. Despite of the low temperature two bands ascribed to CO dicarbonyl
and some bands at 1650-1200 cm-1 attributed to carbonates are observed therefore
this sample shows higher reactivity respect Ex-HTs. At RT bands related to dicarbonyl
are higher than that one relative to monocarbonyl, differently from Ex-HT samples
which show opposite trend. The comparison of CO2 chemisorption of RCZO and
R043MAc is reported in Fig. 4.72. Considering that higher is splitting Δν lower is the
basicity, RCZO shows the highest basicity.
Fig. 4.70 CO 77K (left) and CO RT (right) of RCZO reduced at 500 °C.
2200 2100 2000 1900 1800
Wavenumber (cm-1)
2200 2100 2000 1900 1800
Wavenumber (cm-1)
3800 3600 3400 2200 2000 1800 1600 1400 1200
Wavenumber (cm-1)
CeZr_Rh red 750°C H2 raffredd pompaggio + Ar - invio CO
500
3800 3600 3400 2200 2000 1800 1600 1400 1200
Wavenumber (cm-1)
CeZr_Rh red 750°C H2 raffredd pompaggio + Ar - invio CO RT
500
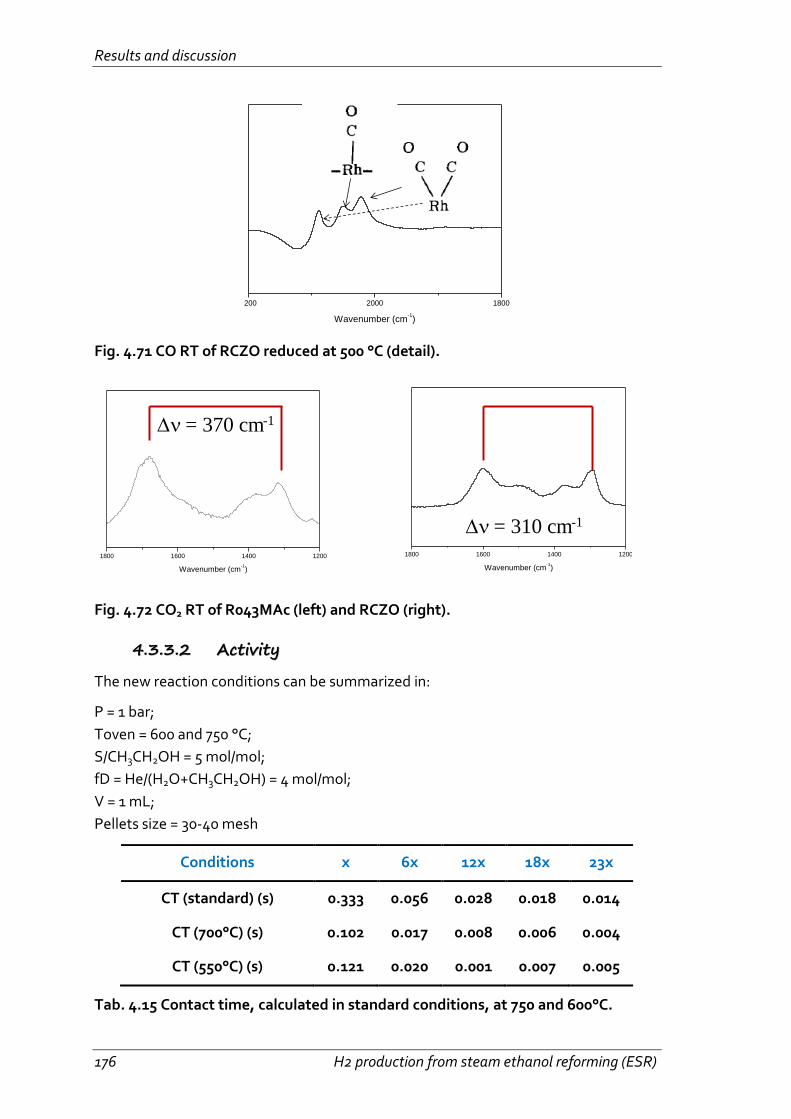
Results and discussion
176 H2 production from steam ethanol reforming (ESR)
Fig. 4.71 CO RT of RCZO reduced at 500 °C (detail).
Fig. 4.72 CO2 RT of R043MAc (left) and RCZO (right).
44..33..33..22 AAccttiivviittyy
The new reaction conditions can be summarized in:
P = 1 bar;
Toven = 600 and 750 °C;
S/CH3CH2OH = 5 mol/mol;
fD = He/(H2O+CH3CH2OH) = 4 mol/mol;
V = 1 mL;
Pellets size = 30-40 mesh
Conditions x 6x 12x 18x 23x
CT (standard) (s) 0.333 0.056 0.028 0.018 0.014
CT (700°C) (s) 0.102 0.017 0.008 0.006 0.004
CT (550°C) (s) 0.121 0.020 0.001 0.007 0.005
Tab. 4.15 Contact time, calculated in standard conditions, at 750 and 600°C.
2200 2000 1800
Wavenumber (cm-1)
1800 1600 1400 1200
Wavenumber (cm-1)
1800 1600 1400 1200
Wavenumber (cm-1)
Dn = 370 cm-1
Dn = 310 cm-1

Results and discussion
H2 production from steam ethanol reforming (ESR) 177
All catalysts were reduced at 750 °C for two hours. As in previous type of conditions
tests were carried out at 700 °C for five different contact times, then the temperature
was decreased at 550 °C and same type of tests were repeated. For these tests also
the weight of catalysts was reported because all catalysts contain same % wt of
rhodium and therefore it can be a further help to understand catalytic data.
Catalyst R043MAc R043M80Ac R055MAs R05M80As RCZO
Weight (g) 0.545 0.815 0.638 0.668 1.412
Tab. 4.16 Amounts of samples weighted for catalytic tests.
At 700 °C, the high reduction of contact time doesn’t affect significantly ethanol
conversion of Rh carbonates samples which continue to show high values above 80 %
although the temperature inside the bed is lower than first condition because higher
amounts of reagents increase the heat consumed by the endothermic reactions.
When ethanol conversion is complete gas phase distribution is close to
thermodynamic equilibrium for both catalysts, while when ethanol conversion is not
complete, intermediates are observed in small amounts (CH2CH2+CH3CHO < 6%) for
R043MAc. Rh with less magnesium (R043MAc) shows only CH2CH2 and CH3CHO
which are intermediates of reaction while R043M80Ac shows also CH3COCH3 and
some traces of CH3CH3 which are due respectively to aldolic condensation of CH3CHO
and hydrogenation of CH2CH2. As a confirm of previous assertion when CH3COCH3
selectivity decreases higher amount of CH3CHO is obtained.
The decrease of contact time and the temperature inside the bed determine, for
R043MAc, increasing trend of CH4 selectivity due to less reforming and a maximum in
CO2 selectivity trend due to water gas shift as confirmed by K of equilibrium
calculated. With R043M80Ac it is not possible observe the maximum of CO2 but only
a decreasing trend because the decrease of temperature inside the reactor is less
marked and the amount of intermediates and byproducts is higher.
At 550 °C the effect of contact time on ethanol and water conversions and gas phase
distributions is more evident. As for tests at higher temperature, the sample
R043M80Ac shows higher amount of intermediates and CH3COCH3. At increasing
amount of CH3CHO corresponds decreasing selectivities of CO and CH4 because
CH3CHO doesn’t decompose as mechanism of reaction explains.
The presence of CH3COCH3 with R043M80Ac and not with R043MAc seems suggest
that an high amount of MgO respect MgAl2O4 and therefore an high amount of strong
basic sites determines side reaction as aldolic condensation.

Results and discussion
178 H2 production from steam ethanol reforming (ESR)
Fig. 4.73 Activity and selectivities of R043MAc.
Fig. 4.74 Activity and selectivities of R043M80Ac.
Silicates samples show between them very different trends in activity and products
distributions: at 700 °C R055MAs shows the most evident decreasing trend of ethanol
conversion when R05M80As shows, also at very low contact time, total ethanol
conversion. As observed before the low ethanol conversion affects gas phase
distribution of R055MAs which presents not only intermediates but also CH3COCH3
and CH3CH3. In addition during initial tests CH4 selectivity is close to zero for all
catalysts except R055MAs which shows 5 %.
The insertion of higher amount of magnesium improves significantly catalytic
performance: ethanol conversion reaches 100 % in all conditions and no intermediates
or byproducts are observed. As for R043MAc the rapid decrease of catalytic bed
temperature due to decrease of contact times affects CO / CO2 and CO / CH4 ratios.
At 550 °C R055MAs shows gas phase composition far from thermodynamic data even
at high contact time. The high amount of CH4 decreases with decreasing contact time
due to the higher presence of CH3CHO , while CO has a maximum at intermediate
residence time. These trends seem to suggest that this catalyst is not active in
methane reforming differently from carbonates series and R05M80As sample.
0
10
20
30
40
50
60
70
80
90
100
1 10 100 1000
Se
l. (
%)
CT (ms)
S CO2
S CH4
S CO
S CH3CHO
700 C
S CH2CH2
S H2
C H2O
C CH3CH2OH
0
10
20
30
40
50
60
70
80
90
100
1 10 100 1000
Se
l. (
%)
CT (ms)
S CO2
S CH4
S CO
S H2
550 C
S CH3CHO
S CH2CH2
C CH3CH2OH
C H2O
0
10
20
30
40
50
60
70
80
90
100
1 10 100 1000
Se
l. (
%)
CT (ms)
S CO2
S CH4
S CO
S CH3CHO
700 C
S CH2CH2
S H2
S CH3COCH3
C CH3CH2OH
C H2O
0
10
20
30
40
50
60
70
80
90
100
1 10 100 1000
Se
l. (
%)
CT (ms)
S CO2
S CH4
S CO
S H2
550 C
S CH3CHO
S CH2CH2S CH3COCH3
C H2O
C CH3CH2OH

Results and discussion
H2 production from steam ethanol reforming (ESR) 179
Fig. 4.75 Activity and selectivities of R055MAs.
Fig. 4.76 Activity and selectivities of R05M80As.
At 700 °C ethanol conversion of RCZO is total and water conversion is kept rather
constant and high for all conditions although the temperature inside the reactor
decreases of about 25 °C or more as other catalysts. Despite of these data it has to be
noted that the amount of total Rh loaded is higher (two times that of the R05M80Aa)
due to high bulk density of the catalyst.
As in previous catalysts by decreasing contact time and temperature inside the bed,
CO selectivity decreases while CO2 and CH4 selectivity increase. These trends are due
to methane reforming reaction which occurs less at low contact time and temperature
and water gas shift which is more favourite as it is confirmed by the increase of K of
water gas shift consistent with the increase of the constant of equilibrium (22).
At 550 °C ethanol and water conversion decreases. In first condition, where CH3COCH3
is not detected the amount of CO2 is very high, and only CH4 and CO are observed. By
decreasing contact time CH3COCH3 is detected and CH4 decreased because part of
CH3CHO don’t decompose to CH4 and CO but give CH3COCH3. Only when CH3COCH3
doesn’t appear at low contact time CH4 increases again. CO trend is also affected by
water gas shift reaction, as a consequence the CO selectivity increase more quickly
only when CO2 decreases significantly.
0
10
20
30
40
50
60
70
80
90
100
1 10 100 1000
Se
l. (
%)
CT (ms)
S CO2
S CH4
S CO
S CH3CHO
700 C
S CH2CH2
S H2
C CH3CH2OH
C H2O
S CH3COCH30
10
20
30
40
50
60
70
80
90
100
1 10 100 1000
Se
l. (
%)
CT (ms)
S CO2
S CH4
S CO
S H2
550 C
S CH3CHO
S CH2CH2
C H2O
C CH3CH2OH
S CH3COCH3
0
10
20
30
40
50
60
70
80
90
100
1 10 100 1000
Se
l. (
%)
CT (ms)
S CO2
S CH4
S CO
700 C
S H2C CH3CH2OH
C H2O
0
10
20
30
40
50
60
70
80
90
100
1 10 100 1000
Se
l. (
%)
CT (ms)
S CO2
S CH4
S COS CH3CHO
550 C
S CH2CH2
S H2
C CH3CH2OH
C H2O

Results and discussion
180 H2 production from steam ethanol reforming (ESR)
Fig. 4.77 Activity and selectivities of RCZO.
44..33..33..33 CChhaarraacctteerriizzaattiioonn ooff ssppeenntt ccaattaallyyssttss
44..33..33..33..11 XX--RRaayy ddiiffffrraaccttiioonn ((XXRRDD)) aannaallyyssiiss
The calcined hydrotalcite samples shows the same phase distribution than the fresh
one. In the carbonate samples beside the previous phases is present one peak at 10°
2θ which is characteristic of hydrotalcite phase that can be formed during storage or
discharge. This behaviour is not observed in silicate sample, therefore the carbonate
seem to have higher tendency to restore the hydrotalcite structure (i.e. the
phenomena is known as memory effect) than silicate one.
No graphite or other amorphous coke were detected by XRD.
For what concern the XRD pattern of RCZO, spent sample is very similar to the XRD
pattern of fresh sample.
Fig. 4.78 XRD of fresh and spent R043MAc.
0
10
20
30
40
50
60
70
80
90
100
1 10 100 1000
Se
l. (
%)
CT (ms)
S CO2
S CH4
S CO
700 C
S H2 C CH3CH2OH
C H2O
0
10
20
30
40
50
60
70
80
90
100
1 10 100 1000
Se
l. (
%)
CT (ms)
S CO2
S CH4
S CO
S H2
550 C
S CH3CHO
S CH2CH2
S CH3COCH3
C CH3CH2OH
C H2O
Inte
nsity (a.u
.)

Results and discussion
H2 production from steam ethanol reforming (ESR) 181
Fig. 4.79 XRD of fresh and spent R043M80Ac.
Fig. 4.80 XRD of fresh and spent R055MAs.
Fig. 4.81 XRD of fresh and spent RCZO.
Inte
nsity (a.u
.)In
ten
sity (a.u
.)In
ten
sity (a.u
.)

Results and discussion
182 H2 production from steam ethanol reforming (ESR)
44..33..33..33..22 SSuurrffaaccee aarreeaa aanndd ppoorroossiimmeettrryy aannaallyyssiiss
After the catalytic tests the specific surface area and pore volume of spent samples based on carbonate are lower than those of fresh one, while in silicate sample the value of surface area is similar to fresh one; but the volume of the pore of spent samples is lower than fresh one. Carbonate samples show higher loss of surface area than silicate confirming the higher instability of these samples than silicates.
The pore size distribution plot of spent samples show for the sample R043M80Ac, R055MAs and RCZO an increase of volume for pore with lower width.
BET surface
area (m2g-1)
t-plot
micropore
area (m2g-1)
BJH desorption
cumulative
volume of pores
(cm3g-1)
BJH desorption
maximums pore
widths (Å)
R043MAcf 121.16 17.47 0.631 122
R043MAcs 77.12 2.12 0.428 73 , 172
R043M80Acf 105.16 19.97 0.250 37 , 60 , 125
R043M80Acs 71.01 8.05 0.160 35 , 45
R055MAsf 113.20 10.08 1.129 34 , 235
R055MAs 108.81 2.74 0.369 36 , 123
RCZOf 53.08 3.19 0.122 43
RCZOs 11.31 2.06 0.149 28
Tab. 4.17 Surface area, pores volume and width of spent catalysts.

Results and discussion
H2 production from steam ethanol reforming (ESR) 183
Fig. 4.82 BJH pore size distribution of spent Ex-HT.
Fig. 4.83 BJH pore size distribution of spent Ex-HTs carbonates.
Fig. 4.84 BJH pore size distribution of spent R055MAs and RCZO.
44..33..33..33..33 TTrraannssmmiissssiioonn EElleeccttrroonn MMiiccrroossccooppyy aannaallyyssiiss
The final calculated size of the particles was calculated considering about 20 particles.
In Tab. 4.18 was summarized all the values, while in Tab. 4.19 was calculated the
percentage of increase of particle size respect the fresh one.
0
0.002
0.004
0.006
0.008
10 100 1000 10000
Po
re V
olu
me
(c
m³/
g·Å
)
Pore Width (Å)
R055MAss R043M80Acs R043MAcs
0
0.001
0.002
0.003
10 100 1000 10000
Po
re V
olu
me
(c
m³/
g·Å
)
Pore Width (Å)
R043MAcf R043MAcs
0
0.002
0.004
0.006
0.008
10 100 1000 10000
Po
re V
olu
me
(c
m³/
g·Å
)
Pore Width (Å)
R043M80Acf R043M80Acs
0
0.001
0.002
0.003
10 100 1000 10000
Po
re V
olu
me
(c
m³/
g·Å
)
Pore Width (Å)
R055MAss R055MAsf
0
0.001
0.002
0.003
0.004
10 100 1000 10000
Po
re V
olu
me
(c
m³/
g·Å
)
Pore Width (Å)
RCZOf RCZOs

Results and discussion
184 H2 production from steam ethanol reforming (ESR)
Spent samples show different trend: rhodium carbonate (R043MAc), which shows
best performance, shows lower increase of particle size, while the other two
R043M80Ac and R055MAs show an increase of particle size two-three times respect
the sample reduced at 750 °C. These last two sample show an higher instability of
rhodium particle then R043MAc.
Dp (nm) R043MAc R043M80Ac R055MAs R05M80As
Fresh (750-2h) 1.4 1.1 1.0 1.1
Fresh (1000-4h) 2.6 / / 2.0
Fresh (1000-30’) 1.8 / / /
Spent (750) 1.9 3.3 2.6 /
Tab. 4.18 Rhodium size of Ex-HT samples after different treatments.
Dp (nm) %
R043MAc
%
R043M80Ac
%
R055MAs
%
R05M80As
Fresh (750-2h) 100 100 100 100
Fresh (1000-4h) 185 / / 181
Fresh (1000-30’) 128 / / /
Spent (750) 136 300 260 /
Tab. 4.19 Percentage of increase of rhodium size for Ex-HT samples after different treatments.

Results and discussion
H2 production from steam ethanol reforming (ESR) 185
a) b)
c)
Fig. 4.85 TEM of spent samples tested at 700 and 550 °C for one week: a) R043Mac, b) R043M80Ac and c)R055MAs.
44..33..33..44 CCoommppaarriissoonnss aanndd ccoonncclluussiioonnss
At 700°C and high contact time all catalysts show complete ethanol conversion, gas
phase distribution at thermodynamic equilibrium and H2 selectivity close to 99%,
except the sample R055MAs which is the catalyst less selective and it show H2
selectivity close to 90% due to high amount of CH4 (Fig. 4.86).
By decreasing contact time it is possible observing differences between catalysts:
RCZO and R05M80As are the most active and they don’t show intermediates or by-
products. RCZO shows higher CO2 selectivity than R05M80As which shows higher CH4
selectivity (Fig. 4.87). Carbonate samples show similar activity, but different
selectivities. The one with higher amount of Mg (R043M80Ac) and therefore higher
basicity shows higher amount of intermediates and as consequence lower H2
selectivity. R055MAs shows worse results in term of activity and selectivity: the lowest
ethanol conversion with the highest intermediates selectivities.

Results and discussion
186 H2 production from steam ethanol reforming (ESR)
At 550°C and high contact time all catalysts, except R055MAs, show ethanol
conversion close to 97%, while the value of R055MAs is 90%. Differently from tests at
700°C, RCZO and R043M80Ac, despite the high ethanol conversion, show traces of
intermediates and CH3COCH3, which is higher for RCZO. R043MAc and R05M80As
show very high H2 and CO2 selectivities and only traces of intermediates under 1 %.
No CH3COCH3 or CH3CH3 are observed.
By decreasing contact time R05M80As and R043MAc keep showing high CO and CO2
selectivities even ethanol conversion is low, on the contrary R043M80Ac and
R055MAs show higher ethanol conversion but also higher amount of CH3CHO.
Catalyst performances seem suggest that first group of catalysts favours more the
break of C-C bond and reforming reaction while second group favours mainly the
dehydrogenation of ethanol. RCZO shows a different and more complex trend. At
very high ethanol when the amount of intermediates is negligible, H2 selectivity,
considered as the sum of CO and CO2 selectivity to avoid H2 obtained by
decomposition, is high and similar to that one of first group of catalysts R043MAc and
R05M80As. By decreasing contact time the amount of CH3CHO follows same trend of
first group of catalyst (Fig. 4.90) but the presence of CH3COCH3 changes the profile
Fig. 4.91). Therefore this catalyst shows high ability to break C-C bond and favours
CH4 reforming but at the mean time is active versus aldolic condensation. IR
measurements allows to show that RCZO exhibits higher basicity then R043MAc and
highest reactivity to form carbonates species between R043MAc and R05M80As. This
strong basic sites and the high reactivity could explain the high amount of acetone
due to aldolic condensation.
0
10
20
30
40
50
60
70
80
90
100
0 20 40 60 80 100
S C
2 +
C3
(
%)
C2H5OH Conv. (%)
R055MAs R05M80As R043MAc R043M80Ac RCZO

Results and discussion
H2 production from steam ethanol reforming (ESR) 187
Catalytic results show similar trends for samples with close MgO/MgAl2O4 ratio
creating a relationship between high C1 selectivities and the ratio MgO/MgAl2O4. In
particular the right ratio should be included in 1.1-1.5 (Fig. 4.42).
Regarding catalytic performances both R043MAc and R05M80As can be consider
promising catalysts to study under pressure. Since hydrotalcite prepared with silicates
have shown more stable catalysts, i.e. no reconstruction and no high decrease of
surface area, R05M80As was chosen to continue the work under pressure.
Fig. 4.86 Comparisons of gas phase distribution at 700 °C during 6x condition.
Fig. 4.87 Comparisons of gas phase distribution at 700 °C during 23x condition.
0
20
40
60
80
100
X C
H3
CH
2O
H
X H
2O
S H
2
S C
O
S C
O2
S C
H4
S C
H2
CH
2
S C
H3
CH
3
S C
H3
CH
O
S C
H3
CO
CH
3
%
R055MAs R05M80As R043MAc R043M80Ac RCZO
700 C
0
20
40
60
80
100
X C
H3
CH
2O
H
X H
2O
S H
2
S C
O
S C
O2
S C
H4
S C
H2
CH
2
S C
H3
CH
3
S C
H3
CH
O
S C
H3
CO
CH
3
%
R055MAs R05M80As R043MAc R043M80Ac RCZO
700 C

Results and discussion
188 H2 production from steam ethanol reforming (ESR)
Fig. 4.88 Comparison of CO+CO2 selectivities at 550 °C.
Fig. 4.89 Comparison of CH4 selectivities at 550 °C.
0
10
20
30
40
50
60
70
80
90
100
0 20 40 60 80 100
S C
O +
CO
2
( %
)
C2H5OH Conv. (%)
R055MAs R05M80As R043MAc R043M80Ac RCZO
0
10
20
30
40
50
60
70
80
90
100
0 20 40 60 80 100
S C
H4
(%
)
C2H5OH Conv. (%)
R055MAs R05M80As R043MAc R043M80Ac RCZO

Results and discussion
H2 production from steam ethanol reforming (ESR) 189
Fig. 4.90 Comparison of CH3CHO selectivities at 550 °C.
Fig. 4.91 Comparison of C2+C3 selectivities at 550 °C.
0
10
20
30
40
50
60
70
80
90
100
0 20 40 60 80 100
S C
H3
CH
O ( %
)
C2H5OH Conv. (%)
R055MAs R05M80As R043MAc R043M80Ac RCZO
0
10
20
30
40
50
60
70
80
90
100
0 20 40 60 80 100
S C
2 +
C3
(
%)
C2H5OH Conv. (%)
R055MAs R05M80As R043MAc R043M80Ac RCZO

Results and discussion
190 H2 production from steam ethanol reforming (ESR)
44..44 PPrreeppaarraattiioonn ooff ffooaammss wwiitthh hhyyddrroottaallcciittee
This part of the study was focus on the preparation of stable slurries to coat on
ceramic (Al2O3) foams. Particular attention was dedicated to optimized the thickness
of active phase on foams to avoid cracks or inhomogeneous coatings.
The work could be divided in two parts:
1. preparation of stable slurries in organic solvent and
2. preparation and characterization of foams.
To prepare a stable slurry, it is necessary to adapt the surface chemistry of the powder
and the rheology of the slurry.
It requires the knowledge of basic data, such as:
- Granulometry
- Density for powder
- Conductibility
- Sedimentation ability for slurry
- Viscosity
44..44..11 PPrreeppaarraattiioonn ooff ssttaabbllee sslluurrrriieess iinn oorrggaanniicc ssoollvveenntt
44..44..11..11 PPrreeppaarraattiioonn ooff sslluurrrriieess ffoorr ppllaanneettaarryy mmiilllliinngg aanndd
aattttrriittiioonn mmiilllliinngg
Different slurries were prepared to observe the change of particles dimensions after
each treatment. Treatments of planetary milling was named P while attrition milling
treatments were named A. In planetary milling treatments the amount of catalyst
depends on catalyst property and it usually is close to 5-10 % vol. Differently in
attrition treatment there is 1/3 vol. of catalyst, 1/3 vol. of zirconia balls (Diam.) and 1/3
vol. of solvent. For all slurry the used solvent was a mix of MEK/EtOH = 3/2. After
attrition the slurries were heated at 450 °C for 12 hours at 1°C/min to evaporate
solvent and dispersing agent.
P1 : first planetary with 5 % vol of catalyst for 3 hours
A1 : first attrition for 4 hours
A1P1 : planetary with 5 % vol of catalyst after attrition
A2 : attrition with 6 % wt of dispersing agent respect to the weight of catalyst
A2P2 : planetary with 5 % vol of catalyst after attrition with dispersing agent and
binding agent

Results and discussion
H2 production from steam ethanol reforming (ESR) 191
44..44..22 CChhaarraacctteerriizzaattiioonn ooff ppoowwddeerr
44..44..22..11 LLaasseerr ddiiffffrraaccttiioonn ggrraannuulloommeettrriicc aannaallyysseess
The granulometry analyses were carried out on slurry prepared with raw powder
without treatments as attrition milling which decrease particles dimensions. The
effects of times of ultrasound (US) and times of planetary milling were studied.
44..44..22..11..11 EEffffeecctt ooff ddiiffffeerreenntt ttiimmeess UUSS ((HHTT aanndd EExx--HHTT))
Before US the size distribution of the powder is very large and three different
granulometries are observed.
After US the size distribution is more homogeneous even if it is still quite large.
After 2 minutes of US the granulometry is quite stable. It appears to bimodal with two
populations in the ranges [0.3 – 1] m and [1 – 16] m.
Fig. 4.92 Effect of time of US on granulometric analyse of HT.
Before US the size distribution of the powder is very large and three different
granulometries are observed as for HT.
After US the size distribution is more homogeneous even if it is still quite large. Two
regions of particle size are observed : the first between 0.4 and 31.7 m and the
second between 50 and 159 m.
Only after 3 minutes of US the granulometry is quite stable and only one population is
observed : [0.4 – 18] m.
0
1
2
3
4
5
6
7
8
0.1 1 10 100 1000
Siz
e d
istr
ibu
tio
n (vo
l %
)
Particle size (m)
HT_0
HT_1
HT_2
HT_3
HT_5

Results and discussion
192 H2 production from steam ethanol reforming (ESR)
Fig. 4.93 Effect of time of US on granulometric analyse of Ex-HT.
44..44..22..11..22 EEffffeecctt ooff ddiiffffeerreenntt ttiimmeess ppllaanneettaarryy mmiilllliinngg ((HHTT aanndd EExx--HHTT))
After 2 hours of planetary milling, large agglomerates are removed and two regions
are observed: [0.35 – 1] m and [1 -31] m.
The effect of planetary milling is almost similar to that of US in its ability to
deagglomerate the powder.
Fig. 4.94 Effect of time of planetary milling on granulometric analyse of HT (P1).
0
1
2
3
4
5
6
7
8
0.1 1 10 100 1000
Siz
e d
istr
ibu
tio
n (vo
l %
)
Particle size (m)
Ex-HT_0
Ex-HT_1
Ex-HT_2
Ex-HT_3
Ex-HT_5
0
1
2
3
4
5
6
0.1 1 10 100 1000
Siz
e d
istr
ibu
tio
n (vo
l %
)
Particle size (m)
HT_5
HT_15
HT_30
HT_60
HT_120
HT_180

Results and discussion
H2 production from steam ethanol reforming (ESR) 193
3 hours of planetary milling (P1) are not enough to break all the largest agglomerates.
In this case, without a dispersing agent, it is very difficult to get rid of agglomerates.
Fig. 4.95 Effect of time of planetary milling on granulometric analyse of Ex-HT (P1).
44..44..22..22 DDeennssiittyy
Density of both hydrotalcites and ex-hydrotalcites was measured by mean of He-
pycnometer at 20°C. The reported value is close to 2.00 g/mL for hydrotalcite and
close to 3.00 g/mL for samples calcined at 900°C for 12h.
HT density
(g/mL)
Ex-HT density
(g/mL)
R043MAc 1.84 2.90
R043M80Ac 1.96 3.01
R055MAs 2.08 3.03
R05M80As 1.89 2.97
Tab. 4.20 Density of HT and Ex-HT.
44..44..22..33 CCoonndduuccttiibbiilliittyy
Two slurries with 2% wt of samples were prepared to measure the conductibility of
both hydrotalcites and ex-hydrotalcites. The measure was carried out at 20 °C. The
conductibility of distilled water is very low (4-5 S) and it is necessary working with as
low as possible conductibility to know the real amount of powder in the slurry. Both
0
1
2
3
4
5
6
0.1 1 10 100 1000
Siz
e d
istr
ibu
tio
n (vo
l %
)
Particle size (m)
Ex-HT_30
Ex-HT_60
Ex-HT_120
Ex-HT_180

Results and discussion
194 H2 production from steam ethanol reforming (ESR)
before and after US, the ex-hydrotalcite shows lower value of conductibility then
hydrotalcite, therefore it was chosen to work on ex-hydrotalcite to have more stable
and reproducible slurries.
Conductibility (S) pH
HT R043MAc 143 8.2
Ex-HT R043MAc 82 9.3
HT R043MAc after US 194 8.8
Ex-HT R043MAc after US 115 9.9
Tab. 4.21 Conductibility and pH of HT and Ex-HT.
44..44..33 CChhaarraacctteerriizzaattiioonn ooff sslluurrrriieess
The granulometric analyses confirm that it is necessary a dispersing agent during
planetary milling trying to destroy bigger agglomerates. A sedimentation test was
carried out to know the better amount of dispersing agent to add to the slurry (P1).
In addition an attrition milling was carried out on the powder to decrease as big as
possible particles dimensions (A1).
44..44..33..11 SSeeddiimmeennttaattiioonn aabbiilliittyy aafftteerr ppllaanneettaarryy mmiilllliinngg ((PP11))
The obtained slurry after planetary milling was divided in five test tubes and in each
tube different amount of dispersing agent was added. In Tab. 4.22 the amount of
dispersing agent for each tube was summarized. The percentage is referred to the
weight of catalyst.
The Fig. 4.96 shows that the most compact sample is the fifth sample with 5% of
dispersing agent. Therefore during planetary milling 5% wt of dispersing agent was
added to the slurry.

Results and discussion
H2 production from steam ethanol reforming (ESR) 195
Nr samples Amount of dispersing agent
0 /
1 1 % wt of catalyst
2 2 % wt of catalyst
3 3 % wt of catalyst
4 4 % wt of catalyst
5 5 % wt of catalyst
Tab. 4.22 Amount of dispersing agent for sedimentation ability (P1).
Fig. 4.96 Sedimentation ability (P1).
44..44..33..22 LLaasseerr ddiiffffrraaccttiioonn ggrraannuulloommeettrriicc aannaallyysseess aafftteerr
aattttrriittiioonn mmiilllliinngg ((AA11))
After attrition milling three regions of particle size are observed: the first over 10 m,
the second at 4 m and the third lower than 1 m [0.3-1] m.
A different trend of size distribution is observed only after four hours of attrition
milling: this last condition doesn’t show the particles bigger than 10 m and it shows a
decrease of particles from 4 to 3 m.
After US the size distribution changes again: it observes a decrease of region with
particle size close to 4 m and an increase of region lower than 1 m because there is
a re-agglomeration of particles during the time between the end of attrition and the
granulometric analyse.
1 2 3 4 50

Results and discussion
196 H2 production from steam ethanol reforming (ESR)
Therefore during attrition milling it is necessary the addition of dispersing agent to
avoid the re-agglomeration of particles. Also for this case the amount of dispersing
agent is determinate by the sedimentation test.
Fig. 4.97 Effect of time of attrition milling on granulometric analyse of Ex-HT (A1).
Fig. 4.98 Effect of US after attrition milling on granulometric analyse of Ex-HT (A1).
0
2
4
6
8
10
12
0.1 1 10 100 1000
Siz
e d
istr
ibu
tio
n (vo
l %
)
Particle size (m)
Ex-HT_5
Ex-HT_15
Ex-HT_30
Ex-HT_60
Ex-HT_120
Ex-HT_180
Ex-HT_240
0
2
4
6
8
10
12
0.1 1 10 100 1000
Siz
e d
istr
ibu
tio
n (vo
l %
)
Particle size (m)
Ex-HT_240
Ex-HT_240_US

Results and discussion
H2 production from steam ethanol reforming (ESR) 197
44..44..33..33 SSeeddiimmeennttaattiioonn aabbiilliittyy aafftteerr aattttrriittiioonn mmiilllliinngg aanndd
ppllaanneettaarryy mmiilllliinngg ((AA11PP11))
After thermal treatment at 450 °C the attrited powder was used for planetary milling
(A1P1).
As before the obtained slurry after planetary milling was divided in five test tubes and
in each tube different amount of dispersing agent was added. In Tab. 4.23 the amount
of dispersing agent for each tube was summarized. The percentage is referred to the
weight of catalyst.
The Fig. 4.99 shows that the most compact sample with best separation between
powder and solvent is the third sample with 6% of dispersing agent. Therefore during
attrition milling 6% wt of dispersing agent was added to the slurry.
Nr samples Amount of dispersing agent
0 /
1 4 % wt of catalyst
2 5 % wt of catalyst
3 6 % wt of catalyst
4 7.5 % wt of catalyst
5 10 % wt of catalyst
Tab. 4.23 Amount of dispersing agent for sedimentation ability (A1P1).

Results and discussion
198 H2 production from steam ethanol reforming (ESR)
Fig. 4.99 Sedimentation ability (A1P1).
44..44..33..44 LLaasseerr ddiiffffrraaccttiioonn ggrraannuulloommeettrriicc aannaallyysseess aafftteerr
aattttrriittiioonn mmiilllliinngg wwiitthh ddiissppeerrssiinngg aaggeenntt ((AA22))
After attrition milling with 6% wt of dispersing agent two regions of particle size are
observed: the first shows the maximum at 1.1 m and it is between [1-7] m, while the
second is less defined and it is between [0.3-1] m. No different trend is observed
after three or four hours, therefore after three hours the distribution is stable.
The effect of dispersing agent is positive and a decrease of size distribution is
observed in Fig. 4.100.
After US the size distribution changes again: it observes a decrease of region with the
maximum of particle size close to 1.1 m and an increase of region lower than 1 m
because there is a re-agglomeration of particles during the time between the end of
attrition and the granulometric analyse.
0 1 2 3 4 5

Results and discussion
H2 production from steam ethanol reforming (ESR) 199
Fig. 4.100 Effect of dispersing agent after attrition milling on granulometric analyse of Ex-HT (A1 and A2).
Fig. 4.101 Effect of US after attrition milling on granulometric analyse of Ex-HT (A2).
0
2
4
6
8
10
12
0.1 1 10 100 1000
Siz
e d
istr
ibu
tio
n (vo
l %
)
Particle size (m)
Ex-HT_3h without disp agent
Ex-HT_4h without disp agent
Ex-HT_3h with disp agent
Ex-HT_4h with disp agent
0
1
2
3
4
5
6
7
8
9
10
0.1 1 10 100 1000
Siz
e d
istr
ibu
tio
n (vo
l %
)
Particle size (m)
Ex-HT 3h
Ex-HT 3h_10 US
Ex-HT 3h_20 US
Ex-HT 3h_30 US

Results and discussion
200 H2 production from steam ethanol reforming (ESR)
Fig. 4.102 Effect of US after attrition milling on granulometric analyse of Ex-HT (A2).
44..44..44 VViissccoossiittyy ((AA22PP22))
The measure of viscosity is very essential to determine the thickness of the coating on
foams. It was measured with a starting strength of 2 N/m^2 for both slurries with 5 %
wt and 7.5 % wt of catalyst. The two curves show a very similar trend because the
amount of dispersing agent is so high that the weight of catalyst doesn’t influence the
viscosity.
Fig. 4.103 Viscosity of the slurry versus shear rate.
0
2
4
6
8
10
12
0.1 1 10 100 1000
Siz
e d
istr
ibu
tio
n (vo
l %
)
Particle size (m)
Ex-HT 4h
Ex-HT 4h_30 US
0
0.001
0.002
0.003
0.004
0.005
0.006
0.007
0.008
0.009
0.01
0 200 400 600 800 1000 1200 1400
Vis
cosi
ty [P
a*s]
Shear rate [1/s]
Ex-HT_5
Ex-HT_7.5

Results and discussion
H2 production from steam ethanol reforming (ESR) 201
Fig. 4.104 Strength of the slurry versus shear rate.
44..44..55 PPrreeppaarraattiioonn aanndd cchhaarraacctteerriizzaattiioonn ooff ffooaammss
44..44..55..11 FFiinnaall rreecceeiipptt ooff pprreeppaarraattiioonn ooff sslluurrrryy
After all analyses, hereafter it is written the receipt of preparation of slurry based on
ex-hydrotalcite to coat foams.
a. Attrition milling with Ex-HT and 5 %wt of dispersing agent
b. Thermal treatment at 450 °C to evaporate dispersing agent
c. Planetary milling on the attrited powder (5 or 7.5 %wt of catalyst in MEK/EtOH 3/2) and 6 %wt of dispersing agent
d. Coatings of foams with 5 or 7.5 %wt of catalyst
e. Thermal treatment at 450 °C to evaporate dispersing agent
44..44..55..22 SSEEMM aannaallyysseess
The catalysts surface is observed by FEG-SEM (JEOL-6700F), equipped with an EDS
detector (PGT Spirit, Si(Li) diode detector) to analyse chemical compositions.
FEG-SEM photos were taken both for 5 and 7.5 % wt of catalyst considering different
zones to see the homogeneity and different samples to see the reproducibility. For
both percentages of catalyst the coating is homogeneous and similar for different
samples of same percentage; the thickness is close to 2-4 m. The coating is well
adherent and no zones with big cracks are evident. The similar coating both for 5 and
7.5 % wt of catalyst confirm the previous data regarding the viscosity.
0
0.2
0.4
0.6
0.8
1
1.2
1.4
1.6
1.8
2
0 200 400 600 800 1000 1200 1400
Stre
ngh
[N/m
^2]
Shear rate [1/s]
Ex-HT_5
Ex-HT_7.5

Results and discussion
202 H2 production from steam ethanol reforming (ESR)
44..44..55..22..11 SSEEMM pphhoottooss ooff ffooaammss wwiitthh 55 %% wwtt ooff ccaattaallyysstt
Fig. 4.105 SEM photos of Ex-HT coating (5 % wt) on alumina foam.
44..44..55..22..22 SSEEMM pphhoottooss ooff ffooaammss wwiitthh 77..55 %% wwtt ooff ccaattaallyysstt
Fig. 4.106 SEM photos of Ex-HT coating (7.5 % wt) on alumina foam.

Results and discussion
H2 production from steam ethanol reforming (ESR) 203
44..55 UUnnddeerr pprreessssuurree ccoonnddiittiioonnss
The study to select best under pressure conditions was carried out with the Ex-HT
Rh0.5Mg80Al19.5 with silicate (R05M80As) which showed best performances at
atmospheric pressure. First tests were carried out at 20 bar and 780 °C (real
temperature inside the bed) but very high amount of coke was observed before
catalytic bed, in the part with quartz due to cracking reaction and to the
polymerization of CH2CH2 present in a significant amount. Therefore under pressure
tests were carried out only with quartz to verify the optimal temperature in which
coke will not be formed. During the former part of work pure ethanol was used to
study the effect of contact time and temperature on catalytic performances, then,
after the optimization of reaction condition, surfin ethanol was used to study its effect
on activity and selectivities. Last part was dedicated to test foams coated of calcined
hydrotalcite under pressure of 20 bar with surfin ethanol.
44..55..11 UUnnddeerr PP tteessttss wwiitthh ppuurree EEttOOHH
44..55..11..11 UUnnddeerr PP tteessttss aatt 557700°°CC
Reaction conditions are summarized in the following table. Respect previous
conditions temperature at the end of catalytic bed was kept costant by changing the
temperature of the oven. In addition contact time related to the weight of catalyst
(CTw) is added in the table to compare the activity of pellets with foams because the
different geometry doesn’t permit an easy comparison if it considers the contact time
related to volume of the catalysts.
570,0,x 570,0,1.4x 570,0,2.3x
P (bar) 20 20 20
Toven (°C) 600 590 570
Tout (°C) 570 570 570
real CT (s) 1.4 1.0 0.60
real CTw* (s) 0.90 0.65 0.39
S/CH3CH2OH (mol/mol) 5 5 5
fD (mol/mol) 0 0 0
V cat (mL) 2 2 2
Pellets size (mesh) 14-20 14-20 14-20
Tab. 4.24 Under pressure conditions.

Results and discussion
204 H2 production from steam ethanol reforming (ESR)
During first condition ethanol conversion is total and the catalyst activity and
selectivities appear stable for 12 hours. It decides to decrease contact time to study
the effect of contact time on byproducts in under pressure conditions. Ethanol
conversion is total for first two conditions, while it decreases during last condition at
0.6 s. Even if the contact time is decreased of two times the C1 selectivities are very
similar because the system is close to thermodynamic equilibrium (Fig. 4.109).
All reactions which entail a decrease of number of mole are more favourite during
under pressure conditions respect at atmosphere pressure therefore methanation of
CO and hydrogenation of CH2CH2 are more favourite
It is interesting to observe that CH4 amount is slightly lower than equilibrium value
while H2 and CO2 are slightly higher. By decreasing contact time CH4 amount
continues to decrease both for less decomposition of CH3CHO but also for less
methanation of CO which, at 570 °C and 20 bar, is more favourite than reforming.
During last condition some traces of CH2CH2, CH3CH3 and CH3CHO were detected and
they are due, as for previous tests at atmospheric pressure, to a not complete ethanol
conversion.
The spent catalyst showed part of the sample black(R05M80AsB570) and part grey
(R05M80AsG570).
Fig. 4.107 Catalytic results (effect of time of stream).
0
10
20
30
40
50
60
70
80
90
100
0 3 6 9 12 15
%
Time (h)
R05M80As 570°C, 1.4s
Sel. CH4 Sel. CO Sel. H2 Sel. CO2

Results and discussion
H2 production from steam ethanol reforming (ESR) 205
Fig. 4.108 Catalytic results (effect of CT).
Fig. 4.109 Comparison of gas phase distribution considering dry gas.
44..55..11..22 UUnnddeerr PP tteessttss aatt 555500 aanndd 552200°°CC
Part of the used catalyst of previous tests showed black deposits probably due to coke
formation. A new load of catalyst with increased amount (4mL) was loaded, the
amount was increased to discriminate a trend of deactivation along the catalyst bed.
At the same time the temperature was decreased to study if it is possible to obtain
only C1 products at lower temperature due to the higher residence time and to avoid
coke formation by lowering the temperature.
0
10
20
30
40
50
60
70
80
90
100
0.0 0.3 0.6 0.9 1.2 1.5
%
CT (s)
R05M80As 570°C
Sel. CH4 Sel. CO Sel. H2 Sel. CO2 Conv. CH3CH2OH
0%
20%
40%
60%
80%
100%
equilibrium 570,0,x 570,0,1.38x 570,0,2.31x
38.50 38.10 38.20 38.77
23.40 24.95 24.68 24.40
35.90 34.96 35.08 34.31
CH4 (%) CO2 (%) CO (%) H2 (%)

Results and discussion
206 H2 production from steam ethanol reforming (ESR)
550,0,2.3x 520,0,2.3x
P (bar) 20 20
Toven (°C) 600 590
Tout (°C) 550 520
real CT (s) 1.2 1.3
real CTw (s) 0.40 0.41
S/CH3CH2OH (mol/mol) 5 5
fD (mol/mol) 0 0
V cat (mL) 4 4
Pellets size (mesh) 14-20 14-20
Tab. 4.25 Under pressure conditions.
Both at 550 and 520 °C catalytic activity and selectivities are very stable for a global
time of 30 hours. No intermediates or by-product as CH3CH3 are observed for both
conditions. The slight differences in selectivities of C1 products are due to difference
of temperature. Decreasing temperature shifts equilibrium towards higher amount of
CH4 and CO2 due to methanation and water gas shift reactions.
Since catalytic data appear very stable, after two days of tests for each temperature it
decided to change and use surfin ethanol.
Fig. 4.110 Catalytic results (effect of time of stream).
44..55..22 UUnnddeerr PP tteessttss wwiitthh ssuurrffiinn EEttOOHH
The conditions are the same of previous paragraph. Tests with surfin ethanol at 520 °C
were carried out after previous tests with pure ethanol. The Fig. 4.111 is related to first
tests with pure ethanol then with surfin. The catalyst was tested for two days and then
it was stopped and cooled down.
During all the tests the catalyst shows total ethanol conversion and no intermediates.
Only after the break, the sample shows traces of CH3CH3 and it decided to stop and
0
10
20
30
40
50
60
70
80
90
100
0 2 4 6 8 10 12 14 16 18
%
Time (h)
R05M80As 550 °C, 1.2s
Sel. CH4 Sel. CO Sel. H2 Sel. CO2
0
10
20
30
40
50
60
70
80
90
100
0 2 4 6 8 10 12 14 16 18
%
Time (h)
R05M80As 520 °C, 1.3s
Sel. CH4 Sel. CO Sel. H2 Sel. CO2

Results and discussion
H2 production from steam ethanol reforming (ESR) 207
download the reactor. Some coke is still present on the catalyst, but it is not possible
to identify a particular zone of catalytic bed in which is preferentially formed.
The amount of CH4 is lower than same condition with pure ethanol, confirming first
under pressure tests at 780 °C which show that presence of surfin ethanol enhances
reforming of CH4, probably because the amount of water is higher in surfin ethanol
than in pure ethanol.
Fig. 4.111 Catalytic results (effect of time of stream).
44..55..33 FFooaammss tteessttss aanndd ccoommppaarriissoonnss
Foams loaded in the reactor were 6, for a total weight of active phase of ca. 0.06 g.
Catalyst pellets pellets foam
Temperature (°C) 570 550 and 520 590
Volume of active phase (mL) 2 4 12
Weight of active phase (g) 1.30 2.65 0.06
Tab. 4.26 Summary of different conditions of pellets and foam catalysts.
Since the weight of rhodium is lower than that one presented in the pellets (Tab. 4.26)
the amount of flows were decreased and temperature was increased to obtain high
ethanol conversion and low amount of intermediates. Only the temperature at the
beginning of the catalytic bed was possible measured therefore it was considered as
temperature inside the reactor.
0
10
20
30
40
50
60
70
80
90
100
0 10 20 30 40 50 60 70
%
Time (h)
R05M80As 520 °C, 1.3s
Sel. CH4 Sel. CO Sel. H2 Sel. CO2
surfin break pure

Results and discussion
208 H2 production from steam ethanol reforming (ESR)
590,1,0.1x 590,0,0.3x
P (bar) 20 20
Toven (°C) 640 640
Tin (°C) 590 590
real CT (s) 26.8 27.2
real CTw (s) 0.14 0.14
S/CH3CH2OH (mol/mol) 5 5
fD (mol/mol) 1 0
V cat (mL) 12 12
Tab. 4.27 Under pressure conditions.
Also foams show total ethanol conversion and no presence of intermediates: this is
certainly due to very high contact time and temperature used. Foams show stable
results for more than 30 hours with a costant inlet temperature (Fig. 4.112).
The helium presence improves H2 selectivity because steam methane reforming is
favoured as lower CH4 selectivity confirms (Fig. 4.113). In diluted condition the partial
pressure of reagents is lower than in non diluted and with lower partial pressures a
reaction which involved an increase of number of mole, as methane reforming, is
more favourite.
Foams catalysts show very interesting catalytic performances with very high ethanol
and water conversions as pellets despite of the lower active phase. The high H2
selectivity of foams is attributed to high temperature used for tests which favours CH4
reforming. Foams catalysts can be consider as a promising alternative to pellets
catalysts because they show comparable activity, selectivity and stability with pellets.

Results and discussion
H2 production from steam ethanol reforming (ESR) 209
Fig. 4.112 Catalytic results (effect of time of stream) during 590,0,0.3x condition.
Fig. 4.113 Catalytic results (effect of dilution).
0
10
20
30
40
50
60
70
80
90
100
0 10 20 30 40
%
Time (h)
R05M80As FOAM 590 °C
Sel. CH4 Sel. CO Sel. H2 Sel. CO2
0
20
40
60
80
100
Co
nv.
CH
3C
H2O
H
Co
nv. H
2O
Sel. H
2
Sel. C
O
Sel. C
O2
Sel. C
H4
Sel. C
H2C
H2
Sel. C
H3C
H3
Sel. C
H3C
HO
Sel.
CH
3C
OC
H3
%
R05M80As FOAM 590,1,0.1x 590,0,0.3x

Results and discussion
210 H2 production from steam ethanol reforming (ESR)
Fig. 4.114 Comparison of different conditions: effect of temperature and contact time.
44..55..44 CChhaarraacctteerriizzaattiioonn ooff ssppeenntt ccaattaallyyssttss
Two spent catalysts are named as:
R05M80AsG570 for gray spent catalyst tested at 570 °C,
R05M80AsB570 for black spent catalyst tested at 570 °C,
R05M80AsG520 for gray spent catalyst tested at 520 °C and
R05M80AsB520 for black spent catalyst tested at 520 °C.
XRD diffraction of both black catalysts show same phases of fresh catalyst with more
defined reflections, in particular those related to the spinel. No reflections attributed
to amorphous or crystalline coke are observed.
After catalytic tests the specific surface area and pores volume of all samples are
lower than fresh one. Pores distribution of gray samples show a shift of the maximum
pore width that with previous observation seems suggest that sintering phenomena
occur into the catalysts. Black samples show higher surface area than gray ones and
common microporosity at around 35 Å which is absent in R05M80AsG570 and
R05M80AsG520. Last points are related to the presence of microporous coke on the
surface of catalysts.
0
20
40
60
80
100
Co
nv.
CH
3C
H2O
H
Co
nv. H
2O
Sel. H
2
Sel. C
O
Sel. C
O2
Sel. C
H4
%
R05M80AsF 590 R05M80As 570 1.4 R05M80As 550 1.2 R05M80As 520 1.3

Results and discussion
H2 production from steam ethanol reforming (ESR) 211
Fig. 4.115 XRD of fresh and spent R05M80As.
BET surface
area (m2g-1)
t-plot
micropore
area (m2g-1)
BJH desorption
cumulative
volume of pores
(cm3g-1)
BJH desorption
maximums pore
widths (Å)
R05M80Asf 107.13 16.52 0.452 34 , 127
R05M80AsG570 43.09 3.60 0.317 176
R05M80AsB570 63.37 1.63 0.279 37, 151
R05M80AsG520 64.67 0 0.402 176
R05M80AsB520 76.18 0 0.238 36 , 109
Tab. 4.28 Surface area and pores volume and width of fresh and spent R05M80As.
Inte
nsity (a.u
.)

Results and discussion
212 H2 production from steam ethanol reforming (ESR)
Fig. 4.116 BJH pore size distribution of fresh and spent R05M80As.
0
0.001
0.002
0.003
10 100 1000 10000
Po
re V
olu
me
(c
m³/
g·Å
)
Pore Width (Å)
R05M80Af
R05M80AsG570
R05M80AsG520
R05M80AsB570
R05M80AsB520

Results and discussion
H2 production from steam ethanol reforming (ESR) 213
BIBLIOGRAFY
1. Rosetti, V. Catalysts for H2 production; Ph.D. thesis; University of Bologna: Italy,
2007.
2. Haga, F.; Nakajima, T.; Yamashita, K.; Mishima, S. Effect of crystallite size on the
catalysis of alumina-supported cobalt catalyst for steam reforming of ethanol.
Reaction Kinetics and Catalysis Letters 1998, 63, 253-259.
3. Cavallaro, S.; Mondello, N.; Freni, S. Hydrogen produced from ethanol for internal
reforming molten carbonate fuel cell. Journal of Power Sources 2001, 102, 198-204.
4. Llorca, J.; Homs, N.; Sales, J.; Fierro, J.-L. G.; de la Piscina, P. R. Effect of sodium
addition on the performance of Co-ZnO-based catalysts for hydrogen production
from bioethanol. Journal of Catalysis 2004, 222, 470-480.
5. Llorca, J.; Homs, N.; Sales, J.; de la Piscina, P. R. Efficient production of hydrogen
over supported cobalt catalysts from ethanol steam reforming. Journal of Catalysis
2002, 209, 306-317.
6. Kaddouri, A.; Mazzocchia, C. A study of the influence of the synthesis conditions
upon the catalytic properties of Co/SiO2 or Co/Al2O3 catalysts used for ethanol
steam reforming. Catalysis Communications 2004, 5, 339-345.
7. Aupretre, F.; Descorme, C.; Duprez, D.; Casanave, D.; Uzio, D. Ethanol steam
reforming over MgxNi1-xAl 2O3 spinel oxide-supported Rh catalysts. Journal of
Catalysis 2005, 233, 464–477.
8. Morgenstern, D. A.; Fornango, J. P. Low-temperature reforming of ethanol over
copper-plated raney nickel: A new route to sustainable hydrogen for
transportation. Energy and Fuels 2005, 19, 1708-1716.
9. Akande, A.; Aboudheir, A.; Idem, R.; Delai, A. Kinetic modeling of hydrogen
production by the catalytic reforming of crude ethanol over a co-precipitated Ni -
Al2 O3 catalyst in a packed bed tubular reactor. International Journal of Hydrogen
Energy 2006, 31, 1707-1715.
10. Vaidya, P. D.; Rodrigues, A. E. Insight into steam reforming of ethanol to produce
hydrogen for fuel cells. Chemical Engineering Journal 2006, 117, 39-49.
11. Mas, V.; Baronetti, G.; Amadeo, N.; Laborde, M. Ethanol steam reforming using
Ni(II)-Al(III) layered double hydroxide as catalyst precursor Kinetic study. Chemical
Engineering Journal 2008, 138, 602–607.
12. Fornasari, G.; Gazzano, M.; Matteuzzi, D.; Trifiro`, F.; Vaccari, A. Structure and
reactivity of high-surface-area Ni/Mg/Al mixed oxides. Applyed Clay Science 1995,

Results and discussion
214 H2 production from steam ethanol reforming (ESR)
10, 69-82.
13. Basile, F.; Fornasari, G.; Gazzano, M.; Kiennemann, A.; Vaccari, A. Preparation and
characterisation of a stable Rh catalyst for the partial oxidation of methane.
Journal of Catalysis 2003, 217, 245–252.
14. Hardiman, K. M.; Cooper, C. G.; Adesina, A. A.; Lange, R. Post-mortem
characterization of coke-induced deactivated alumina-supported Co–Ni catalysts.
Chemical Engineering Science 2006, 61, 2565 – 2573.
15. Ge, X.; Li, M.; Shen, J. The Reduction of Mg`Fe`Oand Mg`Fe`Al`OComplex Oxides
Studied by Temperature-Programmed Reduction Combined with in Situ
Mossbauer Spectroscopy. Journal of Solid State Chemistry 2001, 161, 38-44.
16. Hadnadjev, M.; Vulic, T.; Marinkovic-Neducin, R.; Suchorski, Y.; Weiss, H. The iron
oxidation state in Mg–Al–Fe mixed oxides derived from layered double
hydroxides: An XPS study. Applied Surface Science 2008, 254 , 4297–4302.
17. Cavani, F.; Trifiro, F.; Vaccari, A. Hydrotalcite-type anionic clays: Preparation,
properties and applications. Catalysis Today 1991, 11, 173-301.
18. Albertazzi, S.; Basile, F.; Benito, P.; Del Gallo, P.; Fornasari, G.; Gary, D.; Rosetti,
V.; Vaccari, A. Effect of silicates on the structure of Ni-containing catalysts
obtained from hydrotalcite-type precursors. Catalysis Today 2007, 128, 258–263.
19. Reichle, W. T. Synthesis of anionic clay minerals (mixed metal hydroxides,
hydrotalcite). Solid State Ionics 1986, 22, 135-141.
20. Yates, J. T. J.; Duncan, T. M.; Vaughan, R. W. Infrared spectroscopic study of
activated surface processes: CO chemisorption on supported Rh. Journal of
Chemical Physics 1979, 71, 3908-3915.
21. Bergeret, G.; Gallezot, P.; Gelin, P.; Taarit, Y. B.; Lefebvre, F.; Naccache, C.;
Shannon, R. D. CO-Induced Disintegration of Rhodium aggregates supported in
zeolites: in situ synthesis of rhodium carbonyl clusters. Journal of Catalysis 1987,
104, 279-287.
22. Twigg, M. V. Catalyst Handbook, 2nd ed.; Wolf Publishing Ltd, 1989.

Results and discussion
H2 production from steam ethanol reforming (ESR) 215
55 CCoonncclluussiioonnss
Aim of this thesis was the study of new process for hydrogen production using
bioethanol instead of methane in the steam reforming reaction.
First part of work was dedicated to the study of ethanol decomposition at 700 °C to
understand the relevance of gas phase reactions and the reactivity of ethanol towards
incoloy reactor and quartz which was used as inert to fill the reactor. Highest
contribution to ethanol decomposition is mainly attributed to gas phase reaction with
a order of reaction close to one. Considering the high reactivity of ethanol even at low
temperature, quartz activity and selectivities at 700 °C can be considered negligible.
Operative conditions at atmospheric pressure were studied for a catalyst obtained
after calcination of hydrotalcites like compounds and based on rhodium-nickel as
active phase. This catalyst had shown very good performances in methane steam
reforming. The range of temperature took in exam was very wide between 250 °C
until 700 °C with two ratios of steam to ethanol (5 and 4). Rh-Ni catalyst shows high
activity even at 250 °C and gas phase distribution close to thermodynamic
equilibrium. Lower steam to ethanol affects negatively H2, CO and CO2 selectivities
and it determines higher deactivation of the catalyst therefore the work was
continued using water to ethanol equal to 5.
The study on catalysts was focus on mixed oxide obtained after calcination of
hydrotalcites like compounds. This type of materials presents both redox and acid-
basic properties which could play a determinant role in the selectivities of products.
Moreover they show high surface area and very small crystal size of the mixed oxide
structure produced after calcination, after reduction it is possible to obtain small and
thermally stable metal crystallites.
First step was consisted in the study of the effect of a second metal as nickel or iron
into a catalyst based on rhodium (ex-HT silicate Rh0.15Mg68Al31.85). Five samples with
different percentages of rhodium, nickel and iron was considered at two different
temperatures (700 and 550°C). At 550 °C, when ethanol conversion is far from 100 %,
is possible to observe some trends: Rh-Ni series show best results in H2 selectivity and
the lower amount of intermediates and by-products, whereas Rh shows the high
amount of intermediates which are related with the low ethanol conversion of this
sample. Rh-Fe exhibits low ability in reforming because of the high amount of CH4
observed. Despite of the high activity and H2 selectivity, Rh-Ni series shows the
highest amount of coke respect other catalysts while Rh-Fe the highest instability of
textural properties. Since Rh series show more stable samples it was decided to
improve the catalyst performances of ex-HT silicate Rh0.5Mg68Al31.5 by studying the
effects of different matrix.

Results and discussion
216 H2 production from steam ethanol reforming (ESR)
For this reason a deep characterization was carried out on five different samples with
same amount of rhodium (1% wt). Two of these catalysts were constituted by
silicates, as previous samples, but the ratio Mg/Al was changing (68/32 and 80/20),
while other two were prepared with carbonates always with two ratio Mg/Al. A fifth
catalyst was based on RhCeZrO2 (RCZO) with fixed ratio of Ce/Zr (75/25).
For catalysts obtained by calcination of hydrotalcite like phase the utilization of
silicates instead of carbonates changes type of phases inside the samples because not
only MgO and spinel are detected, as for carbonates, but also fosterite (Mg2SiO4) type
phase. In addition different ratio Mg/Al affects the ratio of MgO/MgAl2O4.
All ex-HTs samples show rhodium nanosize with higher density of particles in the
catalysts calcined at high temperature confirming TPR analyses that rhodium is well
stabilized inside the structure and during reduction high dispersion is obtained
without sintering of particles.
Most active catalysts are Rh silicate with higher amount of magnesium (R05M80As)
and RCZO. At 700 °C these two catalysts and Rh carbonate with less magnesium
(R043MAc) shows best H2 selectivity, whereas Rh carbonate with higher magnesium
(R043M80Ac) and Rh silicate with less magnesium (R055MAs) show high amount of
intermediates and by-products as CH3COCH3. At 600 °C the decrease of contact time
affects significantly ethanol conversion and therefore the amount of intermediates
increases. R043MAc and R05M80As show only intermediates as CH3CHO and CH2CH2,
while RCZO shows high amount of CH3COCH3 due to high basicity of the CeZeO2.
Catalytic results show similar trends for samples R043MAc and R05M80As with close
MgO/MgAl2O4 ratio creating a relationship between high C1 selectivities and the ratio
MgO/MgAl2O4. In particular the right ratio should be included in 1.1-1.5. Since
hydrotalcite prepared with silicates have shown more stable catalysts, i.e. no
reconstruction and no high decrease of surface area, R05M80As was chosen to test
under pressure.
Under pressure tests were carried out at 20 bar and temperature between 520-590 °C,
firstly with pure ethanol then with ethanol after a purification denominated surfin.
After optimization of contact time to avoid not complete ethanol conversion and/or
intermediates, catalytic performances are very close to thermodynamic equilibrium
with stable results for more than 60 hours.
Similar tests were carried out also on ceramic foams coated by R05M80As. Foams
catalysts show very interesting catalytic performances with complete ethanol
conversion and very high H2 selectivity despite the low amount of active phase respect
pellets. Foams catalysts can be consider as a promising alternative to pellets catalysts
because they show comparable activity, selectivity and stability with pellets.
The high performances obtained with foams is due to the optimization of coating of
ex-hydrotalcite on ceramics foams. Considering the high porosity of ex-hts samples it

Results and discussion
H2 production from steam ethanol reforming (ESR) 217
was necessary high amount of dispersing agent to obtain homogeneous and thin
coating without cracks.
This study touches different aspects of bioethanol reforming: thermodynamic trends;
synthesis, characterization, tests of active phase; best under pressure conditions and
preparation of foams with previously selected active phase trying to find best
solutions through catalyst and operative conditions optimization.


Acknoledgments
First of all, I would like to thank my tutor Francesco Basile to help me and find creative
solutions also during worse moments. I appreciated our discussions about data.
Special thanks go to Air Liquid, in particular to Daniel Gary and Pascal Del Gallo for
the financial support.
I would like to thank Fabrice Rossignol of SPCTS of Limoges and Barbara Onida of
Politecnico of Torino to give me the opportunity to delve to characterization study of
my catalysts.
A huge thanks to Patricia, my desk colleague, for all scientific and friendly support.
